-
UNITED STATES
SECURITIES AND EXCHANGE COMMISSION
Washington, D.C. 20549
FORM N-CSR
CERTIFIED SHAREHOLDER REPORT OF REGISTERED
MANAGEMENT INVESTMENT COMPANIES
| Investment Company Act file number | 811-08918 |
HC Capital Trust
(Exact name of Registrant as specified in charter)
Five Tower Bridge, 300 Barr Harbor Drive, 5th Floor, West Conshohocken, PA 19428
(Address of principal executive offices) (Zip code)
Citi Fund Services Ohio, Inc., 4400 Easton Commons, Suite 200, Columbus, OH 43219
(Name and address of agent for service)
| Registrant's telephone number, including area code: | 800-242-9596 |
| Date of fiscal year end: | June 30 |
| Date of reporting period: | June 30, 2023 |
Item 1. Reports to Stockholders.

Annual Report
The Value Equity Portfolio
The Growth Equity Portfolio
The Institutional U.S. Equity Portfolio
The Small Capitalization-Mid Capitalization Equity Portfolio
The ESG Growth Portfolio
The Catholic SRI Growth Portfolio
The International Equity Portfolio
The Institutional International Equity Portfolio
The Emerging Markets Portfolio
The Core Fixed Income Portfolio
The Corporate Opportunities Portfolio
The U.S. Government Fixed Income Securities Portfolio
The U.S. Corporate Fixed Income Securities Portfolio
The U.S. Mortgage/Asset Backed Fixed Income Securities Portfolio
The Short-Term Municipal Bond Portfolio
The Intermediate Term Municipal Bond Portfolio
June 30, 2023
HC CAPITAL TRUST | Annual Report |
June 30, 2023
Table of Contents
Management Discussion of Portfolio Performance | 1 |
Shareholder Letter | 35 |
Portfolios of Investments | 36 |
Statements of Assets and Liabilities | 263 |
Statements of Operations | 268 |
Statements of Changes in Net Assets | 273 |
Financial Highlights | 279 |
Notes to Financial Statements | 286 |
Report of Independent Registered Public Accounting Firm | 318 |
Additional Information | 320 |
Trustees and Officers | 332 |
Fiscal Year 2023 Summary
General Market
(Unaudited — June 30, 2023)
The Portfolios of the HC Capital Trust provide clients with diversified exposure to multiple asset classes (for both taxable and institutional investors). The Portfolios diversify, where appropriate, across multiple independent investment advisory organizations (“Specialist Managers”) and strategies. The Portfolios enable the construction of custom asset allocation portfolios that best meet clients’ overall investment policies and objectives. Depending upon the objective, each Portfolio will generally seek to deliver performance that exceeds, or is in-line with, the benchmark for the Portfolio as well as a peer universe of mutual funds with similar investment strategies.
The Fiscal Year had more than its share of headlines: four U.S. banks fell, alongside one in Europe; there was much angst about debt ceiling drama; anxiety spiked around geopolitical uncertainty; and central banks have signaled there’s more work to do to win the fight against inflation. Yet despite all this turmoil, the MSCI World Index Rose by 19.13%. The economy, propelled by strong job growth, better-than-expected corporate earnings and steady consumer spending, was impressively resilient.
The Fed and other Central Banks continued to raise interest rates throughout the year to combat inflation. In May, the Fed increased the Fed Funds target range to 5.00% - 5.25%, the highest in 17 years. It appears as though the Fed’s rate hikes are starting to have their desired effect. According to the Bureau of Labor Statistics, the Consumer Price Index rose in June by its lowest annual rate in more than two years, increasing 3%, from a year ago. Stripping out volatile food and energy prices, the core CPI rose 4.8% from a year ago, its lowest level since October 2021.
Equity markets rose on the prospect that the Fed might be able to engineer a soft landing. The S&P 500 increased by 19.59% for the Fiscal Year, compared to -10.62% last year. This is higher than the long-term average of 8.36%. Growth outperformed Value stocks as enthusiasm about the prospects for AI drove mega growth stocks higher. The Russell 1000® Growth Index rose by 27.11% compared to the Russell 1000® Value Index which rose 11.54% during the Fiscal Year. The MSCI EAFE Index and the MSCI Emerging Markets Index rose by 19.41% and 2.22% in U.S. Dollar terms, respectively, for the Fiscal Year. The fixed income markets were similarly impacted, as the Fed’s tightening triggered a major adjustment in yields. The U.S. 10-year Treasury yield rose from 3.01% to 3.86% over the year. The Bloomberg U.S. Aggregate Bond Index declined by -0.94% during the year.
1
Each of the Portfolios provided results consistent with their stated objectives over the fiscal year ended June 30, 2023. The performance of each Portfolio is listed in the table below and detailed summaries of the objectives, managers, and results are contained in the subsequent sections.
HC Capital Trust Portfolios | Fiscal Year | |||
The Value Equity Portfolio | 18.91 | % | ||
Russell 1000® Value Index1. | 11.54 | % | ||
MSCI USA Index2 | 19.57 | % | ||
The Growth Equity Portfolio | 21.14 | % | ||
Russell 1000® Growth Index1 | 27.11 | % | ||
MSCI USA Index2 | 19.57 | % | ||
The Institutional U.S. Equity Portfolio | 17.61 | % | ||
MSCI USA Index2 . | 19.57 | % | ||
The Small Capitalization-Mid Capitalization Equity Portfolio | 14.03 | % | ||
Russell 2000® Index1 . | 12.31 | % | ||
The ESG Growth Portfolio | 15.91 | % | ||
MSCI World Index3 | 19.13 | % | ||
The Catholic SRI Growth Portfolio . | 20.07 | % | ||
MSCI World Index3 | 19.13 | % | ||
The International Equity Portfolio | 19.01 | % | ||
MSCI EAFE Index4 | 19.41 | % | ||
The Institutional International Equity Portfolio . | 17.76 | % | ||
MSCI EAFE Index4 | 19.41 | % | ||
The Emerging Markets Portfolio | 1.63 | % | ||
MSCI EM Index5 | 2.22 | % | ||
The Core Fixed Income Portfolio . | -0.51 | % | ||
Bloomberg U.S. Aggregate Bond Index6 | -0.94 | % | ||
The Corporate Opportunities Portfolio | 7.16 | % | ||
Bloomberg U.S. High Yield Ba/B 2% Issuer Capped Index7 | 8.86 | % | ||
The U.S. Government Fixed Income Securities Portfolio | -0.76 | % | ||
Bloomberg U.S. Government Bond Index8 | -2.08 | % | ||
The U.S. Corporate Fixed Income Securities Portfolio | 2.19 | % | ||
Bloomberg U.S. Corporate Bond Index9 | 1.55 | % | ||
The U.S. Mortgage/Asset Backed Fixed Income Securities Portfolio | -1.18 | % | ||
Bloomberg U.S. Securitized Index10 | -1.50 | % | ||
The Short-Term Municipal Bond Portfolio | 1.19 | % | ||
ICE BofA Merrill Lynch 1-3 Year Municipal Index11 | 1.08 | % | ||
Bloomberg 1-3 Year Municipal Bond Index | 1.06 | % | ||
The Intermediate Term Municipal Bond Portfolio | 2.20 | % | ||
Bloomberg 3-10 Year Blend (2-12) Total Return Index Unhedged12 | 2.38 | % | ||
In reviewing the table above and the remainder of this report, note that past performance does not guarantee future results. The remainder of this report contains more specific details about the performance, strategy and managers in each of the Portfolios.
2
1 | Each of the Russell indices is a market cap-weighted index of common stocks domiciled in the U.S. Unlike the S&P 500 Stock Index however, the basket of securities included in the various Russell indices is reconstituted each year. The Russell 3000® Index is constructed by ranking U.S. common stocks from largest to smallest market capitalization, and including in the index the top 3,000 stocks. The largest 1,000 stocks become the Russell 1000® Index and the next 2,000 stocks are included in the Russell 2000® Index. The Russell 1000® Growth Index is designed to measure the performance of those companies included in the Russell 1000® Index that have relatively higher price-to-book ratios and higher forecasted growth values. The Russell 1000 Value® Index is designed to measure the performance of those companies included in the Russell 1000® Index that have relatively lower price-to- book ratios and lower forecasted growth values. |
2 | The MSCI USA Index is designed to measure the performance of the large and mid-cap segments of the U.S. market. With 627 constituents, the index covers approximately 85% of the free float-adjusted market capitalization in the U.S. |
3 | The MSCI World Index is a broad global equity benchmark that represents large and mid-cap equity performance across 23 developed markets countries. The index covers approximately 85% of the free float-adjusted market capitalization in each country and does not offer exposure to emerging markets. As of June 30, 2023, the MSCI World Index consisted of the following 23 development markets: Australia, Austria, Belgium, Canada, Denmark, Finland, France, Germany, Hong Kong, Ireland, Israel, Italy, Japan, Netherlands, New Zealand, Norway, Portugal, Singapore, Spain, Sweden, Switzerland, the United Kingdom and the United States. |
4 | The Morgan Stanley Capital International Europe, Australasia, and Far East Index (“MSCI EAFE Index”) is an unmanaged, free float-adjusted market capitalization index that is designed to measure the equity market performance of developed markets, excluding Canada and the United States. As of June 30, 2023, the MSCI EAFE Index consisted of the following 21 developed market country indices: Australia, Austria, Belgium, Denmark, Finland, France, Germany, Hong Kong, Ireland, Israel, Italy, Japan, Netherlands, New Zealand, Norway, Portugal, Singapore, Spain, Sweden, Switzerland and the United Kingdom. |
5 | The MSCI Emerging Markets Index (“MSCI EM Index”) is an unmanaged free float-adjusted market capitalization index that is designed to measure equity market performance of emerging markets. As of June 30, 2023, the MSCI EM Index consisted of the following 24 emerging market country indices: Brazil, Chile, China, Colombia, Czech Republic, Egypt, Greece, Hungary, India, Indonesia, Kuwait, Malaysia, Mexico, Peru, Philippines, Poland, Qatar, Saudi Arabia, South Africa, South Korea, Taiwan, Thailand, Turkey and United Arab Emirates. |
6 | The Bloomberg U.S. Aggregate Bond Index covers the USD-denominated, investment-grade, fixed-rate, taxable bond market of SEC-registered securities. |
7 | The Bloomberg U.S. High Yield Ba/B 2% Issuer Capped Index is designed to mirror the investable universe of the U.S. dollar denominated high yield debt market. |
8 | The Bloomberg U.S. Government Bond Index is a broad-based index that represents the general performance of U.S. Treasury and U.S. Government agency debt securities. The index includes U.S. dollar-denominated, fixed-rate, nominal U.S. Treasuries, and U.S. agency debentures. |
9 | The Bloomberg U.S. Corporate Bond Index measures the investment grade, fixed-rate, taxable corporate bond market. It includes USD- denominated securities publicly issued by U.S. and non-U.S. industrial, utility, and financial issuers. |
10 | The Bloomberg U.S. Securitized Index tracks the performance of mortgage-backed pass-through securities issued by Ginnie Mae, Fannie Mae and Freddie Mac, investment-grade bonds and asset-backed securities. |
11 | The ICE Bank of America (“BofA”) Merrill Lynch 1-3 Year Municipal Index is an equal-weighted index that tracks the total return performance of the domestic U.S. municipal market. The index consists of investment-grade, publicly traded, fixed-rate and coupon bearing municipal securities with a maturity of one to three years. |
12 | The Bloomberg 3-10 Year Blend (2-12) Total Return Index Unhedged is an index composed of bonds with maturities ranging between 2 and 12 years. |
13 | The Bloomberg 5-Year General Obligations Municipal Index is an unmanaged index generally representative of investment grade fixed-rate debt obligations issued by state and local government entities, with maturities of no more than six years. |
14 | The Bloomberg Managed Money Short/Intermediate Index is a rules-based and market-value weighted index that measures the performance of the publicly traded municipal bonds that cover the USD-denominated short/intermediate term tax-exempt bond market, including state and local general obligation bonds, revenue bonds, insured bonds, and pre-refunded bonds. |
3
The Value Equity Portfolio
(Unaudited)
The Value Equity Portfolio (the “Portfolio”) managed by Parametric Portfolio Associates, LLC (“Parametric”) returned 18.91% for the fiscal year compared to 11.54% for the Russell 1000® Value Index1 and 12.75% for the average manager in the Lipper2 universe of Large Cap Value Funds.3
The Portfolio outperformed its benchmark over the period. The tax-managed strategy run by Parametric focuses on minimizing taxable gains subject to a tracking error constraint relative to the broad US market (i.e., both value and growth stocks). This contributed to the outperformance during the period.
The Portfolio is able to diversify across multiple managers and strategies to ensure proper portfolio diversification, with the goal of providing superior long-term returns in as stable and consistent an after-tax manner as possible. As a result, it is expected that some managers and styles will be leading at times, while others are lagging and vice versa. The Portfolio expects to attribute some of its performance to this cyclicality of styles.
1 | The Russell 1000® Value Index measures the performance of those companies included in the Russell 1000® Index with lower price-to-book ratios and lower forecasted growth rates. This index is unmanaged, thus the index results do not reflect the impact of expenses associated with any investment in securities, such as brokerage commission or other transaction costs. Benchmark performance is shown for comparison purposes only, as it is not possible to invest directly in a securities index. |
2 | Lipper, Inc. is an independent statistical monitoring organization that compiles performance on mutual funds and further categorizes them by investment objective. |
3 | During the fiscal year, Echo Street Capital Management LLC, Frontier Capital Management Company, LLC and Mellon Investments Corporation were also under contract to manage the Portfolio but did not have assets allocated to them. |
4
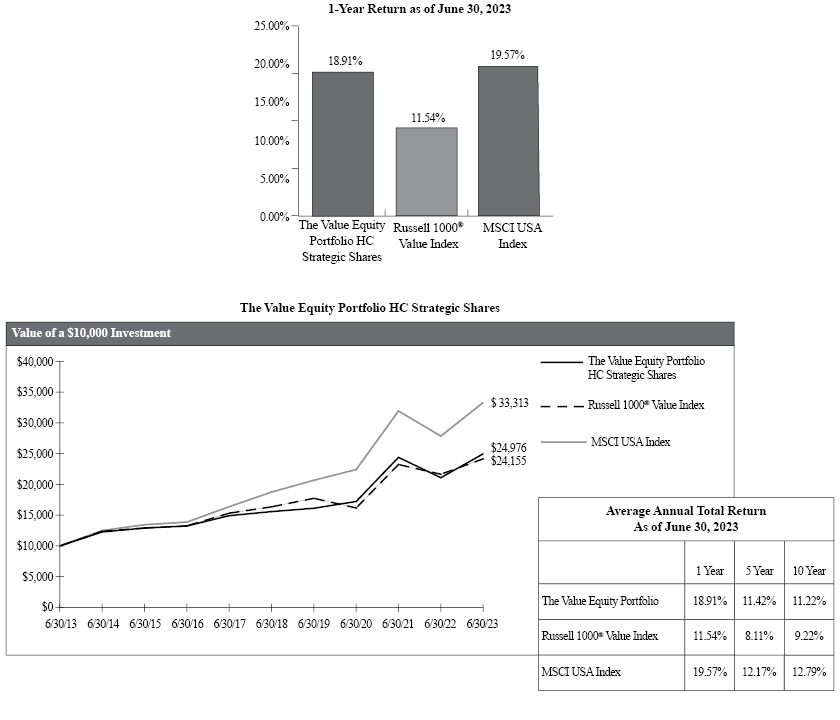
The chart represents historical performance of a hypothetical investment of $10,000 in The Value Equity Portfolio for the 10- year period ended 6/30/23 and represents the reinvestment of dividends and capital gains in the Portfolio.
Past performance does not guarantee future results. The performance data quoted represents past performance and current returns may be lower or higher. The investment return and principal value will fluctuate so that an investor’s shares, when redeemed, may be worth more or less than the original cost. To obtain performance information current to the most recent month end, please call (800) 242-9596.
The Portfolio’s performance above is compared to the Russell 1000® Value Index. The index is unmanaged and does not reflect the deduction of fees associated with a mutual fund, such as investment management and fund accounting fees, or the deduction of taxes. An investor cannot invest directly in an index. The performance of The Value Equity Portfolio reflects the deduction of fees for these value-added services, but does not reflect the deduction of taxes that a shareholder would pay on the Portfolio’s distributions or redemptions of the Portfolio’s shares.
Expense Ratio
HC Strategic Shares 0.22%
HC Advisors Shares 0.47%1
1 | HC Advisors Shares include Distribution Plan fees of 0.25% which are voluntarily waived by the Adviser. Such waiver is not reflected in the expense ratio shown. |
This information is included in the most current prospectus available to current and prospective shareholders of the Portfolio. Additional information pertaining to the June 30, 2023, expense ratios can be found in the financial highlights.
5
The Growth Equity Portfolio
(Unaudited)
The Growth Equity Portfolio (the “Portfolio”) managed by Jennison Associates, LLC (“Jennison”) and Parametric Portfolio Associates, LLC (“Parametric”) returned 21.14% for the fiscal year compared to 27.11% for the Russell 1000® Growth Index1 and 25.09% for the average manager in the Lipper2 universe of Large Cap Growth Funds.3
The Portfolio underperformed its benchmark over the period. The tax-managed strategy run by Parametric focuses on minimizing taxable gains subject to a tracking error constraint relative to the broad US market (i.e., both value and growth stocks). The tax management stock implementation drove the underperformance during the period.
Jennison outperformed the benchmark as its portfolio focuses on the highest growth segment of the market, which performed well over the period.
The Portfolio is diversified across multiple managers and strategies to ensure proper portfolio diversification, with the goal of providing superior long-term returns in as stable and consistent a manner as possible. As a result, it is expected that some managers and styles will be leading at times, while others are lagging and vice versa. The Portfolio expects to attribute some of its performance to this cyclicality of styles.
1 | The Russell 1000® Growth Index measures the performance of those companies included in the Russell 1000® Index with higher price-to-book ratios and higher forecasted growth rates. This index is unmanaged, thus the index results do not reflect the impact of expenses associated with any investment in securities, such as brokerage commission or other transaction costs. Benchmark performance is shown for comparison purposes only, as it is not possible to invest directly in a securities index. |
2 | Lipper, Inc. is an independent statistical monitoring organization that compiles performance on mutual funds and further categorizes them by investment objective. |
3 | During the fiscal year, Echo Street Capital Management LLC and Mellon Investments Corporation were also under contract to manage the Portfolio but did not have assets allocated to them. |
6

The chart represents historical performance of a hypothetical investment of $10,000 in The Growth Equity Portfolio for the 10-year period ended 6/30/23 and represents the reinvestment of dividends and capital gains in the Portfolio.
Past performance does not guarantee future results. The performance data quoted represents past performance and current returns may be lower or higher. The investment return and principal value will fluctuate so that an investor’s shares, when redeemed, may be worth more or less than the original cost. To obtain performance information current to the most recent month end, please call (800) 242-9596.
The Portfolio’s performance above is compared to the Russell 1000® Growth Index. The index is unmanaged and does not reflect the deduction of fees associated with a mutual fund, such as investment management and fund accounting fees, or the deduction of taxes. An investor cannot invest directly in an index. The performance of The Growth Equity Portfolio reflects the deduction of fees for these value-added services, but does not reflect the deduction of taxes that a shareholder would pay on the Portfolio’s distributions or redemptions of the Portfolio’s shares.
Expense Ratio
HC Strategic Shares 0.27%
HC Advisors Shares 0.52%1
1 | HC Advisors Shares include Distribution Plan fees of 0.25% which are voluntarily waived by the Adviser. Such waiver is not reflected in the expense ratio shown. |
This information is included in the most current prospectus available to current and prospective shareholders of the Portfolio. Additional information pertaining to the June 30, 2023, expense ratios can be found in the financial highlights.
7
The Institutional U.S. Equity Portfolio
(Unaudited)
The Institutional U.S. Equity Portfolio (the “Portfolio”) managed by Echo Street Capital Management LLC (“Echo Street”), Jennison Associates, LLC (“Jennison”), Mellon Investments Corporation (“Mellon”), Parametric Portfolio Associates, LLC and Wellington Management Company, LLP (“Wellington”) returned 17.61% for the fiscal year compared to 19.57% for the MSCI USA Index1 and 15.93% for the average manager in the Lipper2 universe of Multi-Cap Core Funds.3
The Portfolio underperformed the benchmark primarily due to the performance of Echo Street, Mellon, and Wellington. Echo Street lagged primarily due to security selection, while Mellon underperformed due to its bias towards low-volatility stocks. Wellington implements a public real estate strategy which, while in line with the real estate market, underperformed broad equity markets as severe rate rises caused REITs to lag.
The Portfolio is diversified across multiple managers and strategies to ensure proper portfolio diversification, with the goal of providing superior long-term returns in as stable and consistent a manner as possible. As a result, it is expected that some managers and styles will be leading at times, while others are lagging and vice versa. The Portfolio expects to attribute some of its performance to this cyclicality of styles.
1 | The MSCI USA Index is designed to measure the performance of the large and mid cap segments of the U.S. market. With 627 constituents, the index covers approximately 85% of the free float-adjusted market capitalization in the U.S. This index is unmanaged, thus the index results do not reflect the impact of expenses associated with any investment in securities, such as brokerage commission or other transaction costs. Benchmark performance is shown for comparison purposes only, as it is not possible to invest directly in a securities index. |
2 | Lipper, Inc. is an independent statistical monitoring organization that compiles performance on mutual funds and further categorizes them by investment objective. |
3 | During the fiscal year, Frontier Capital Management Company, LLC and Pacific Investment Management Company, LLC were also under contract to manage the Portfolio but did not have assets allocated to them. |
8
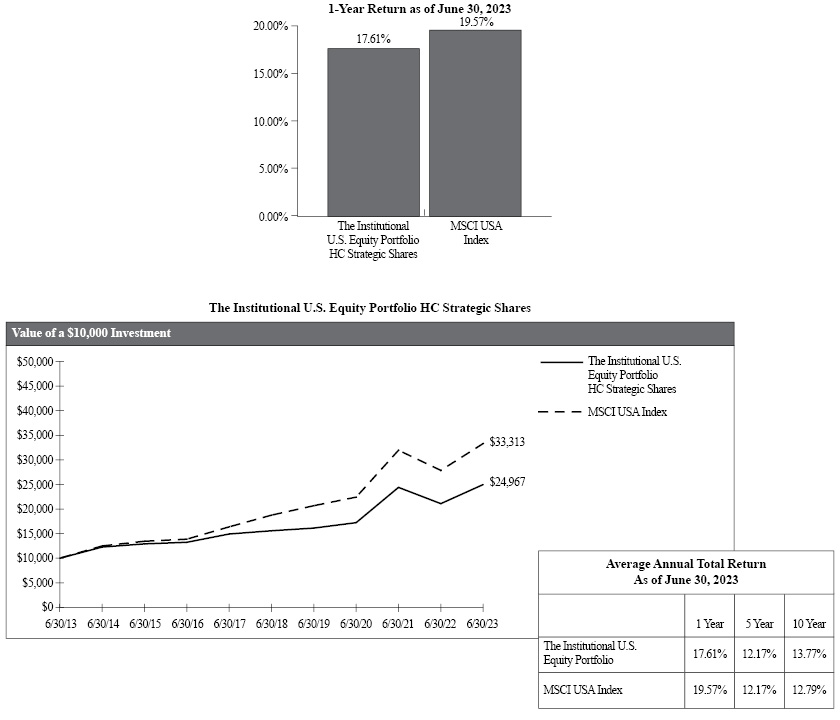
The chart represents historical performance of a hypothetical investment of $10,000 in The Institutional U.S. Equity Portfolio for the 10-year period ended 6/30/23 and represents the reinvestment of dividends and capital gains in the Portfolio.
Past performance does not guarantee future results. The performance data quoted represents past performance and current returns may be lower or higher. The investment return and principal value will fluctuate so that an investor’s shares, when redeemed, may be worth more or less than the original cost. To obtain performance information current to the most recent month end, please call (800) 242-9596.
The Portfolio’s performance above is compared to the MSCI USA Index. The index is unmanaged and does not reflect the deduction of fees associated with a mutual fund, such as investment management and fund accounting fees, or the deduction of taxes. An investor cannot invest directly in an index. The performance of The Institutional U.S. Equity Portfolio reflects the deduction of fees for these value-added services, but does not reflect the deduction of taxes that a shareholder would pay on the Portfolio’s distributions or redemptions of the Portfolio’s shares.
Expense Ratio
HC Strategic Shares 0.31%
HC Advisors Shares 0.56%1
1 | HC Advisors Shares include Distribution Plan fees of 0.25% which are voluntarily waived by the Adviser. Such waiver is not reflected in the expense ratio shown. |
This information is included in the most current prospectus available to current and prospective shareholders of the Portfolio. Additional information pertaining to the June 30, 2023, expense ratios can be found in the financial highlights.
9
The Small Capitalization-Mid Capitalization Equity Portfolio
(Unaudited)
The Small Capitalization-Mid Capitalization Equity Portfolio (the “Portfolio”) managed by Frontier Capital Management Company, LLC (“Frontier”) and Parametric Portfolio Associates, LLC (“Parametric”) returned 14.03% for the fiscal year compared to 12.31% for the Russell 2000® Index1 and 12.28% for the average manager in the Lipper2 universe of Small Cap Core Funds.3
The Portfolio outperformed its benchmark over the period. The tax-managed strategy run by Parametric focuses on minimizing taxable gains subject to a tracking error constraint. The tracking error generated by tax minimization contributed to before- tax outperformance during the period.
The Portfolio is diversified across multiple managers and strategies to ensure proper portfolio diversification, with the goal of providing superior long-term returns in as stable and consistent a manner as possible. As a result, it is expected that some managers and styles will be leading at times, while others are lagging and vice versa. The Portfolio expects to attribute some of its performance to this cyclicality of styles.
1 | The Russell 2000® Index measures the performance of smaller capitalization U.S. companies. The largest 1,000 stocks become the Russell 1000® Index and the next 2,000 stocks become the Russell 2000® Index. This index is unmanaged, thus the index results do not reflect the impact of expenses associated with any investment in securities, such as brokerage commission or other transaction costs. Benchmark performance is shown for comparison purposes only, as it is not possible to invest directly in a securities index. |
2 | Lipper, Inc. is an independent statistical monitoring organization that compiles performance on mutual funds and further categorizes them by investment objective. |
3 | During the fiscal year, Mellon Investments Corporation was also under contract to manage the Portfolio but did not have assets allocated to it. |
10

The chart represents historical performance of a hypothetical investment of $10,000 in The Small Capitalization–Mid Capitalization Equity Portfolio for the 10-year period ended 6/30/23 and represents the reinvestment of dividends and capital gains in the Portfolio.
Past performance does not guarantee future results. The performance data quoted represents past performance and current returns may be lower or higher. The investment return and principal value will fluctuate so that an investor’s shares, when redeemed, may be worth more or less than the original cost. To obtain performance information current to the most recent month end, please call (800) 242-9596.
The Portfolio’s performance above is compared to the Russell 2000® Index, which represents the performance of domestically traded common stocks of small to mid-sized companies. The index is unmanaged and does not reflect the deduction of fees associated with a mutual fund, such as investment management and fund accounting fees, or the deduction of taxes. An investor cannot invest directly in an index. The performance of The Small Capitalization-Mid Capitalization Equity Portfolio reflects the deduction of fees for these value-added services, but does not reflect the deduction of taxes that a shareholder would pay on the Portfolio’s distributions or redemptions of the Portfolio’s shares.
Expense Ratio
HC Strategic Shares 0.35%
HC Advisors Shares 0.60%1
1 | HC Advisors Shares include Distribution Plan fees of 0.25% which are voluntarily waived by the Adviser. Such waiver is not reflected in the expense ratio shown. |
This information is included in the most current prospectus available to current and prospective shareholders of the Portfolio. Additional information pertaining to the June 30, 2023, expense ratios can be found in the financial highlights.
11
The ESG Growth Portfolio
(Unaudited)
The ESG Growth Portfolio (the “Portfolio”) managed by Mellon Investments Corporation (“Mellon”), Parametric Portfolio Associates, LLC and RBC Global Asset Management (U.K.) Limited (“RBC GAM”) returned 15.91% for the fiscal year compared to 19.13% for the MSCI World Index.1, 2
The Portfolio’s underperformance can be attributed to the RBC GAM strategy. Its strategy was modestly overweight to financials and health care, which contributed to its underperformance over the period. Negative returns from within these sectors due to security selection performed in line with the strategy’s stated process. RBC GAM considers each potential investment on the strengths of its business model, opportunity to take market share, end market growth, and management & ESG practices. The Global screening strategy, which was run by Mellon, modestly underperformed.
The Portfolio is diversified across multiple managers and strategies to ensure proper portfolio diversification, with the goal of providing superior long-term returns in as stable and consistent a manner as possible. As a result, it is expected that some styles will be leading at times, while others are lagging and vice versa. The Portfolio expects to attribute some of its performance to this cyclicality of styles.
The Portfolio requires that the underlying managers integrate ESG criteria in their investment selection. Mellon uses third party ESG data to better understand the environmental, social and governance risks and opportunities when making investment decisions.
1 | The MSCI World Index is an unmanaged index that is designed to capture large and mid-cap representation across 23 developed markets countries. The Index covers approximately 85% of the free float-adjusted market capitalization in each of the following countries: Australia, Austria, Belgium, Canada, Denmark, Finland, France, Germany, Hong Kong, Ireland, Israel, Italy, Japan, Netherlands, New Zealand, Norway, Portugal, Singapore, Spain, Sweden, Switzerland, the United Kingdom and the United States. This index is unmanaged, thus the index results do not reflect the impact of expenses associated with any investment in securities, such as brokerage commission or other transaction costs. Benchmark performance is shown for comparison purposes only, as it is not possible to invest directly in a securities index. |
2 | During the fiscal year, Agincourt Capital Management, LLC was also under contract to manage the Portfolio but did not have assets allocated to it. |
12
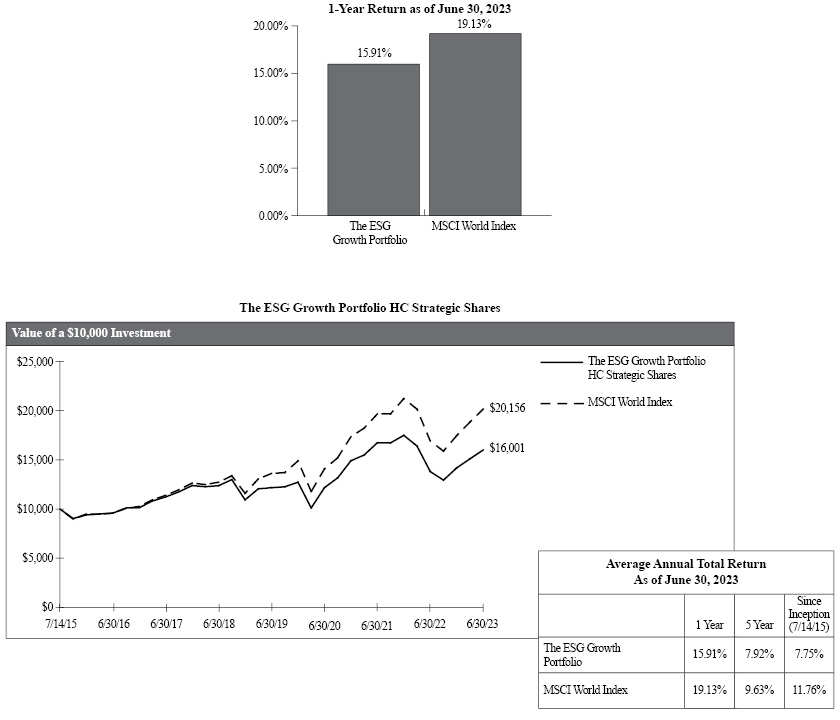
The chart represents historical performance of a hypothetical investment of $10,000 in The ESG Growth Portfolio from 7/14/15 to 6/30/23 and represents the reinvestment of dividends and capital gains in the Portfolio.
Past performance does not guarantee future results. The performance data quoted represents past performance and current returns may be lower or higher. The investment return and principal value will fluctuate so that an investor’s shares, when redeemed, may be worth more or less than the original cost. To obtain performance information current to the most recent month end, please call (800) 242-9596.
The Portfolio’s performance above is compared to the MCSI World Index is unmanaged and does not reflect the deduction of fees associated with a mutual fund, such as investment management and fund accounting fees, or the deduction of taxes. An investor cannot invest directly in an index. The performance of The ESG Growth Portfolio reflects the deduction of fees for these value-added services, but does not reflect the deduction of taxes that a shareholder would pay on the Portfolio’s distributions or redemptions of the Portfolio’s shares.
Expense Ratio
HC Strategic Shares 0.39%
HC Advisors Shares 0.64%1
1 | HC Advisors Shares include Distribution Plan fees of 0.25% which are voluntarily waived by the Adviser. Such waiver is not reflected in the expense ratio shown. |
This information is included in the most current prospectus available to current and prospective shareholders of the Portfolio. Additional information pertaining to the June 30, 2023, expense ratios can be found in the financial highlights.
13
The Catholic SRI Growth Portfolio
(Unaudited)
The Catholic SRI Growth Portfolio (the “Portfolio”) managed by Mellon Investments Corporation (“Mellon”) returned 20.07% for the fiscal year compared to 19.13% for the MSCI World Index.1, 2
The Portfolio’s outperformance can be attributed primarily to the screening that is required to adhere to Catholic values, which is managed by Mellon.
The Portfolio is diversified across securities to ensure proper portfolio diversification, with the goal of providing competitive long-term returns in as consistent a manner as possible. As a result, it is expected that some styles will be leading at times, while others are lagging and vice versa. The Portfolio expects to participate in this cyclicality of styles by maintaining market exposure comparable to MSCI World Index.
The Portfolio requires that the underlying managers integrate Catholic values in their investment selections, which includes negative screens. Mellon uses third party data to implement the negative screens in the Portfolio.
1 | The MSCI World Index is an unmanaged index that is designed to capture large and mid-cap representation across 23 developed markets countries. The Index covers approximately 85% of the free float-adjusted market capitalization in each of the following countries: Australia, Austria, Belgium, Canada, Denmark, Finland, France, Germany, Hong Kong, Ireland, Israel, Italy, Japan, Netherlands, New Zealand, Norway, Portugal, Singapore, Spain, Sweden, Switzerland, the United Kingdom and the United States. This index is unmanaged, thus the index results do not reflect the impact of expenses associated with any investment in securities, such as brokerage commission or other transaction costs. Benchmark performance is shown for comparison purposes only, as it is not possible to invest directly in a securities index. |
2 | During the fiscal year, Agincourt Capital Management, LLC and Parametric Portfolio Associates, LLC were also under contract to manage the Portfolio but did not have assets allocated to them. |
14
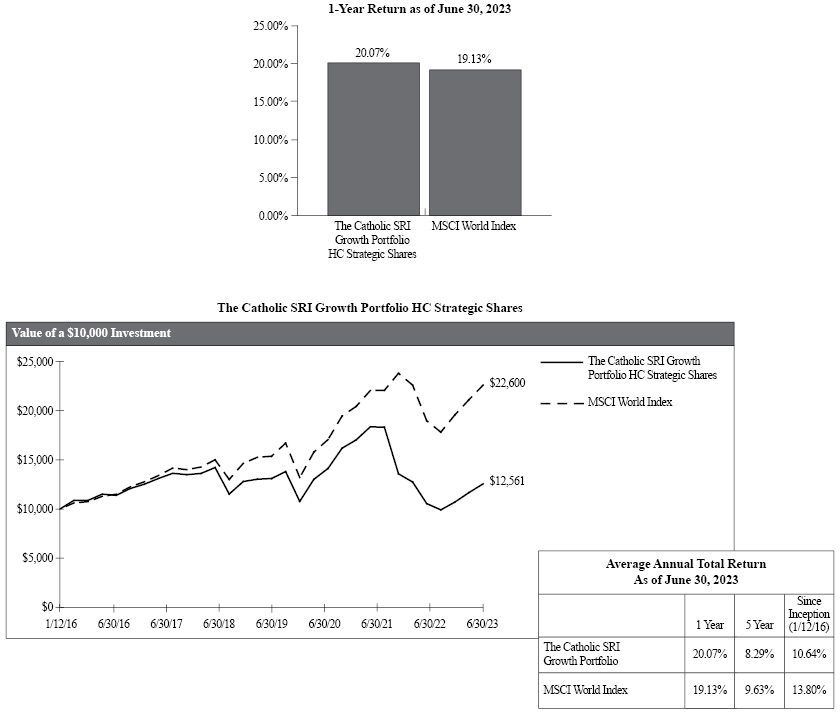
The chart represents historical performance of a hypothetical investment of $10,000 in The Catholic SRI Growth Portfolio from 1/12/16 to 6/30/23 and represents the reinvestment of dividends and capital gains in the Portfolio.
Past performance does not guarantee future results. The performance data quoted represents past performance and current returns may be lower or higher. The investment return and principal value will fluctuate so that an investor’s shares, when redeemed, may be worth more or less than the original cost. To obtain performance information current to the most recent month end, please call (800) 242-9596.
The Portfolio’s performance above is compared to the MCSI World Index is unmanaged and does not reflect the deduction of fees associated with a mutual fund, such as investment management and fund accounting fees, or the deduction of taxes. An investor cannot invest directly in an index. The performance of The Catholic SRI Growth Portfolio reflects the deduction of fees for these value-added services, but does not reflect the deduction of taxes that a shareholder would pay on the Portfolio’s distributions or redemptions of the Portfolio’s shares.
Expense Ratio
HC Strategic Shares 0.56%
HC Advisors Shares 0.81%1
1 | HC Advisors Shares include Distribution Plan fees of 0.25% which are voluntarily waived by the Adviser. Such waiver is not reflected in the expense ratio shown. |
This information is included in the most current prospectus available to current and prospective shareholders of the Portfolio. Additional information pertaining to the June 30, 2023, expense ratios can be found in the financial highlights.
15
The International Equity Portfolio
The Institutional International Equity Portfolio
(Unaudited)
The International Equity Portfolio (the “Portfolio”) managed by Parametric Portfolio Associates, LLC (“Parametric”) returned
19.01% for the fiscal year compared to 19.41% for the MSCI EAFE Index1 and 16.51% for the average manager in the Lipper2 universe of International Large-Cap Core Funds.3
The Portfolio underperformed the benchmark and outperformed the peer group. The tax-managed strategy run by Parametric focuses on minimizing taxable gains subject to a tracking error constraint. The tracking error generated by tax minimization detracted from before-tax performance during the period.
The Institutional International Equity Portfolio (the “Institutional Portfolio”) managed by City of London Investment Management Company, Limited (“City of London”), Mellon Investments Corporation (“Mellon”) and Parametric returned 17.76% for the fiscal year compared to 19.41% for the MSCI EAFE Index1 and 16.51% for the average manager in the Lipper2 universe of International Large-Cap Core Funds.3
The Institutional Portfolio underperformed its benchmark and outperformed its peer group. The majority of the assets are managed by Mellon and Parametric with a mandate to provide passive exposure to the benchmark index (MSCI EAFE Index). Parametric replicates the benchmark index using futures. This allows the Portfolio to have cash on hand to meet redemptions and invest opportunistically. City of London underperformed due to an unfavorable environment for its closed-end fund strategy that seeks portfolio appreciation derived from a top-down macro process, bottom-up stock picking, and a narrowing of the closed-end fund discount to net asset value.
The Portfolios are diversified across multiple managers and strategies to ensure proper portfolio diversification, with the goal of providing superior long-term returns in as stable and consistent a manner as possible. As a result, it is expected that some managers and styles will be leading at times, while others are lagging and vice versa. The Portfolio expects to attribute some of its performance to this cyclicality of styles.
1 | The Morgan Stanley Capital International Europe, Australasia, and Far East Index (“MSCI EAFE Index”) is a market value weighted index designed to measure the overall condition of developed overseas equities markets. This index is unmanaged, thus the index results do not reflect the impact of expenses associated with any investment in securities, such as brokerage commission or other transaction costs. Benchmark performance is shown for comparison purposes only, as it is not possible to invest directly in a securities index. |
2 | Lipper, Inc. is an independent statistical monitoring organization that compiles performance on mutual funds and further categorizes them by investment objective. |
3 | During the fiscal year, City of London Investment Management Company, Limited and Mellon Investments Corporation were under contract to manage the International Equity Portfolio but did not have assets allocated to them. Pacific Investment Management Company, LLC was also under contract to manage the Institutional Portfolio but did not have assets allocated to it. |
16
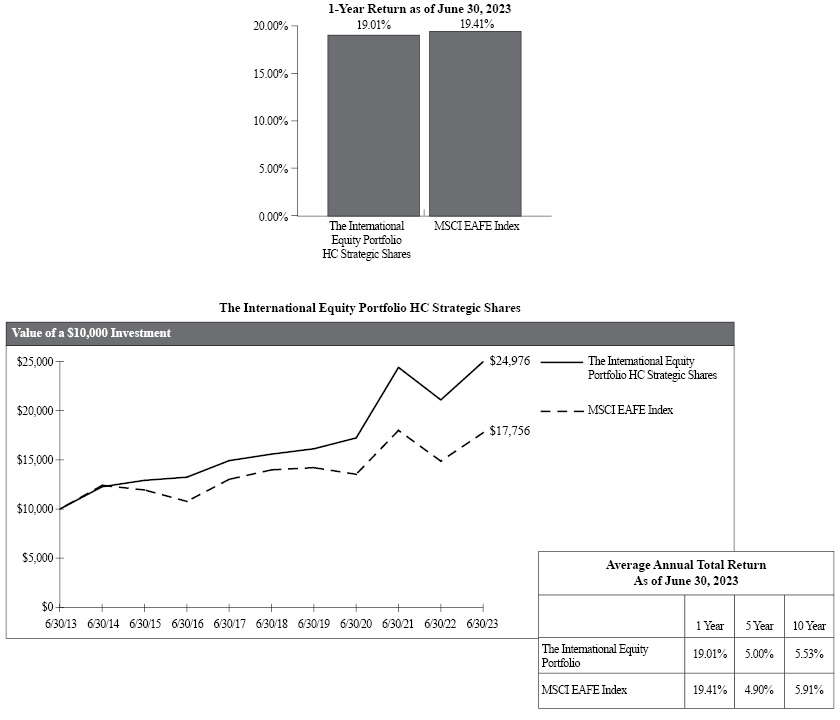
The chart represents historical performance of a hypothetical investment of $10,000 in The International Equity Portfolio for the 10-year period ended 6/30/23 and represents the reinvestment of dividends and capital gains in the Portfolio.
Past performance does not guarantee future results. The performance data quoted represents past performance and current returns may be lower or higher. The investment return and principal value will fluctuate so that an investor’s shares, when redeemed, may be worth more or less than the original cost. To obtain performance information current to the most recent month end, please call (800) 242-9596.
The Portfolio’s performance above is compared to the MSCI EAFE Index, which represents the performance of the major stock markets in those regions. The index is unmanaged and does not reflect the deduction of fees associated with a mutual fund, such as investment management and fund accounting fees, or the deduction of taxes. An investor cannot invest directly in an index. The performance of The International Equity Portfolio reflects the deduction of fees for these value-added services, but does not reflect the deduction of taxes that a shareholder would pay on the Portfolio’s distributions or redemptions of the Portfolio’s shares.
Expense Ratio
HC Strategic Shares 0.26%
HC Advisors Shares 0.51%1
17

The chart represents historical performance of a hypothetical investment of $10,000 in The Institutional International Equity Portfolio for the 10-year period ended 6/30/23 and represents the reinvestment of dividends and capital gains in the Portfolio.
Past performance does not guarantee future results. The performance data quoted represents past performance and current returns may be lower or higher. The investment return and principal value will fluctuate so that an investor’s shares, when redeemed, may be worth more or less than the original cost. To obtain performance information current to the most recent month end, please call (800) 242-9596.
The Portfolio’s performance above is compared to the MSCI EAFE Index, which represents the performance of the major stock markets in those regions. The index is unmanaged and does not reflect the deduction of fees associated with a mutual fund, such as investment management and fund accounting fees, or the deduction of taxes. An investor cannot invest directly in an index. The performance of The Institutional International Equity Portfolio reflects the deduction of fees for these value-added services, but does not reflect the deduction of taxes that a shareholder would pay on the Portfolio’s distributions or redemptions of the Portfolio’s shares.
Expense Ratio
HC Strategic Shares 0.44%
HC Advisors Shares 0.69%1
18
The Emerging Markets Portfolio
(Unaudited)
The Emerging Markets Portfolio (the “Portfolio”) managed by Mellon Investments Corporation (“Mellon”), Parametric Portfolio Associates, LLC (“Parametric”), RBC Global Asset Management (U.K.) Limited (“RBC GAM”) and XY Investments (HK) Limited (“XY Investments”) returned 1.63% for the fiscal year compared to 2.22% for the MSCI EM Index1 and 5.69% for the average manager in the Lipper2 universe of Emerging Markets Funds.3
For the fiscal year 2023, the Portfolio underperformed both the benchmark and the average manager in the industry universe. The underperformance was primarily due to the quantitative strategy run by XY Investments utilizing equity-based total return swaps. During the fiscal year, XY Investment’s style benchmark (MSCI China A Onshore Net Return Index USD) returned -19.71% compared to 2.22% for the MSCI EM Index.
The Portfolio provides broad access to international emerging markets equity. The Portfolio is managed with multiple managers to provide diversification of manager style as well as diversification of firm specific risks. Mellon’s strategy provides passive exposure to the MSCI EM Index. The Portfolio diversifies amongst a large number of names and across geographies and sectors. Parametric replicates benchmark index (MSCI Emerging Markets Index) using futures. This allows the Portfolio to have cash on hand to meet redemptions and invest opportunistically.
1 | The Morgan Stanley Capital International Emerging Markets Index (“MSCI EM Index”) is a free float-adjusted market capitalization index that is designed to measure equity market performance in the global emerging markets. As of June 30, 2023, the MSCI EM Index consisted of the following 24 emerging market country indices: Brazil, Chile, China, Colombia, Czech Republic, Egypt, Greece, Hungary, India, Indonesia, Kuwait, Malaysia, Mexico, Peru, Philippines, Poland, Qatar, Saudi Arabia, South Africa, South Korea, Taiwan, Thailand, Turkey and United Arab Emirates. This index is unmanaged, thus the index results do not reflect the impact of expenses associated with any investment in securities, such as brokerage commission or other transaction costs. Benchmark performance is shown for comparison purposes only as it is not possible to invest directly in a securities index. |
2 | Lipper, Inc. is an independent statistical monitoring organization that compiles performance on mutual funds and further categorizes them by investment objective. |
3 | During the fiscal year, City of London Investment Management Company, Limited was also under contract to manage the Portfolio but did not have assets allocated to it. |
19
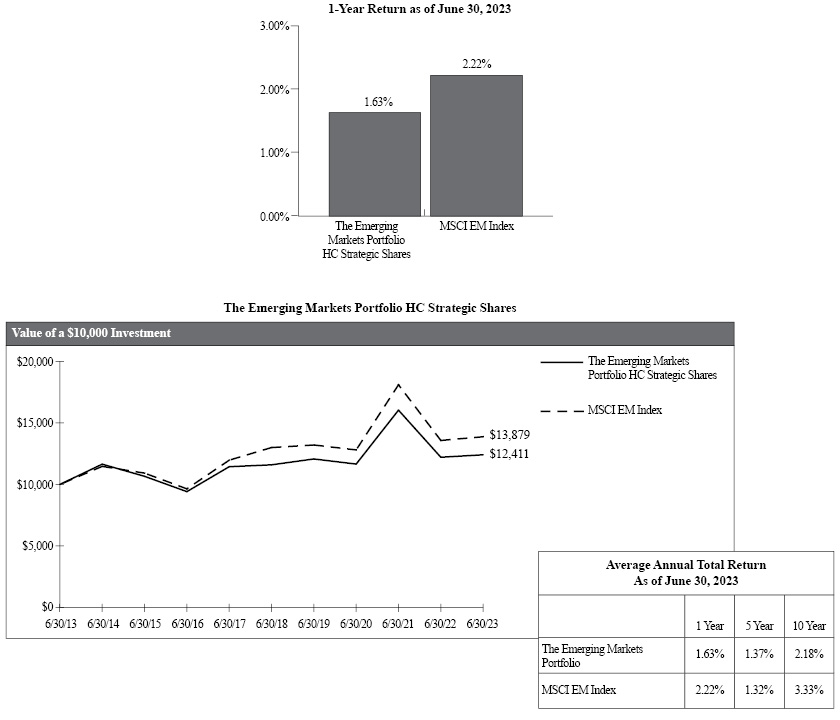
The chart represents historical performance of a hypothetical investment of $10,000 in The Emerging Markets Portfolio for the 10-year period ended 6/30/23 and represents the reinvestment of dividends and capital gains in the Portfolio.
Past performance does not guarantee future results. The performance data quoted represents past performance and current returns may be lower or higher. The investment return and principal value will fluctuate so that an investor’s shares, when redeemed, may be worth more or less than the original cost. To obtain performance information current to the most recent month end, please call (800) 242-9596.
The Portfolio’s performance above is compared to the MSCI EM Index, which represents the performance of the major stock markets in those regions. The index is unmanaged and does not reflect the deduction of fees associated with a mutual fund, such as investment management and fund accounting fees, or the deduction of taxes. An investor cannot invest directly in an index. The performance of The Emerging Markets Portfolio reflects the deduction of fees for these value-added services, but does not reflect the deduction of taxes that a shareholder would pay on the Portfolio’s distributions or redemptions of the Portfolio’s shares.
Expense Ratio
HC Strategic Shares 0.47%
HC Advisors Shares 0.72%1
1 | HC Advisors Shares include Distribution Plan fees of 0.25% which are voluntarily waived by the Adviser. Such waiver is not reflected in the expense ratio shown. |
This information is included in the most current prospectus available to current and prospective shareholders of the Portfolio. Additional information pertaining to the June 30, 2023, expense ratios can be found in the financial highlights.
20
The Core Fixed Income Portfolio
(Unaudited)
The Core Fixed Income Portfolio (the “Portfolio”) managed by Agincourt Capital Management, LLC (“Agincourt”) and Mellon Investments Corporation returned -0.51% for the fiscal year compared to -0.94% for the Bloomberg U.S. Aggregate Bond Index1 (“BarCap”) and -0.73% for the average fixed income manager in the Lipper2 universe of Core Bond Funds.3
The Portfolio outperformed the benchmark due to a shorter duration positioning relative to the Benchmark. As yields moved up, our shorter duration securities outperformed those with more duration. The Portfolio outperformed due to an allocation to a short duration strategy managed by Parametric. The U.S. bond market declined over the prior year as intermediate government rates rose from 2.88% to 4.15% (U.S. Government 5-year Note).
The Portfolio is allocated across the three major sectors of the BarCap Index: governments, credit, and asset-backed securities. The government and asset backed sectors are passively managed to provide performance in-line with their respective benchmarks. Actual results for the government and asset-backed portfolios may vary marginally from the underlying benchmarks because of cash flows and because for practical purposes, the portfolios hold a representative group of the securities in the benchmarks and do not seek to fully replicate all of the individual holdings. The credit portfolio has a bit more flexibility to vary from the index by avoiding credits that the manager feels have adverse price risk. The allocations across the three sectors will vary over time based upon the relative attractiveness of the sectors. In general, the Portfolio maintains aggregate characteristics – duration, weighted average yield-to-maturity, and average credit quality comparable to the benchmark.
1 | The Bloomberg U.S. Aggregate Bond Index includes more than 8,000 taxable government, investment-grade corporate and mortgage backed securities. This index is unmanaged, thus the index results do not reflect the impact of expenses associated with any investment in securities, such as brokerage commission or other transaction costs. Benchmark performance is shown for comparison purposes only, as it is not possible to invest directly in a securities index. |
2 | Lipper, Inc. is an independent statistical monitoring organization that compiles performance on mutual funds and further categorizes them by investment objective. |
3 | During the fiscal year, Pacific Investment Management Company, LLC and Parametric Portfolio Associates, LLC were also under contract to manage the Portfolio but did not have assets allocated to them. |
21

The chart represents historical performance of a hypothetical investment of $10,000 in The Core Fixed Income Portfolio for the 10-year period ended 6/30/23 and represents the reinvestment of dividends and capital gains in the Portfolio.
Past performance does not guarantee future results. The performance data quoted represents past performance and current returns may be lower or higher. The investment return and principal value will fluctuate so that an investor’s shares, when redeemed, may be worth more or less than the original cost. To obtain performance information current to the most recent month end, please call (800) 242-9596.
The Portfolio’s performance above is compared to the Bloomberg U.S. Aggregate Bond Index. The index is unmanaged and does not reflect the deduction of fees associated with a mutual fund, such as investment management and fund accounting fees, or the deduction of taxes. An investor cannot invest directly in an index. The performance of The Core Fixed Income Portfolio reflects the deduction of fees for these value-added services, but does not reflect the deduction of taxes that a shareholder would pay on the Portfolio’s distributions or redemptions of the Portfolio’s shares.
Expense Ratio
HC Strategic Shares 0.35%
HC Advisors Shares 0.60%1
1 | HC Advisors Shares include Distribution Plan fees of 0.25% which are voluntarily waived by the Adviser. Such waiver is not reflected in the expense ratio shown. |
This information is included in the most current prospectus available to current and prospective shareholders of the Portfolio. Additional information pertaining to the June 30, 2023, expense ratios can be found in the financial highlights.
22
The Corporate Opportunities Portfolio
(Unaudited)
The Corporate Opportunities Portfolio (the “Portfolio”) managed by Parametric Portfolio Associates, LLC (“Parametric”) returned 7.16% for the fiscal year compared to 8.86% for the Bloomberg U.S. High Yield Ba/B 2% Issuer Capped Index1 and 8.01% for the average manager in the Lipper2 universe of High Yield Funds.3
The Portfolio under-performed the benchmark and its peer group due to the Parametric futures strategy which seeks to replicate the risk profile of the benchmark. Parametric manages a portfolio of futures contracts that reflects the underlying risks of the asset class. In the fiscal year, high yield bonds dramatically outperformed the instruments chosen to replicate the risk exposure of the benchmark. The Adviser also directed the investment of a portion of the Portfolio’s assets in a portfolio of closed end funds managed by City of London. The City of London strategy underperformed the Portfolio’s benchmark due to a widening of the discounts among closed end funds.
The Portfolio is designed to provide investors with higher returns over time than traditional fixed income investments primarily through investment in a diversified portfolio of non-investment grade fixed income instruments. The Portfolio may also opportunistically invest in international bonds, convertible bonds, preferred stocks, treasury inflation bonds, loan participations and fixed and floating rate loans.
The Portfolio has flexibility to vary from the index by avoiding credits that the managers feel have adverse price risk.
1 | The Bloomberg U.S. High Yield Ba/B 2% Issuer Capped Index is a market capitalization-weighted index that measures fixed rate non- investment grade debt securities of U.S. and non-U.S. corporations. No single issuer accounts for more than 2% of market cap. The index is calculated on a total return basis. This index is unmanaged, thus the index results do not reflect the impact of expenses associated with any investment in securities, such as brokerage commission or other transaction costs. Benchmark performance is shown for comparison purposes only, as it is not possible to invest directly in a securities index. |
2 | Lipper, Inc. is an independent statistical monitoring organization that compiles performance on mutual funds and further categorizes them by investment objective. |
3 | During the fiscal year, City of London Investment Management Company, Limited, Fort Washington Investment Advisors, Inc., Mellon Investments Corporation, Pacific Investment Management Company, LLC and Western Asset Management Company, Ltd. were also under contract to manage the Portfolio but did not have assets allocated to them. |
23

The chart represents historical performance of a hypothetical investment of $10,000 in The Corporate Opportunities Portfolio for the 10-year period ended 6/30/23 and represents the reinvestment of dividends and capital gains in the Portfolio.
Past performance does not guarantee future results. The performance data quoted represents past performance and current returns may be lower or higher. The investment return and principal value will fluctuate so that an investor’s shares, when redeemed, may be worth more or less than the original cost. To obtain performance information current to the most recent month end, please call (800) 242-9596.
The Portfolio’s performance above is compared to the Bloomberg U.S. High Yield Ba/B 2% Issuer Capped Index. The index is unmanaged and does not reflect the deduction of fees associated with a mutual fund, such as investment management and fund accounting fees, or the deduction of taxes. An investor cannot invest directly in an index. The performance of The Corporate Opportunities Portfolio reflects the deduction of fees for these value-added services, but does not reflect the deduction of taxes that a shareholder would pay on the Portfolio’s distributions or redemptions of the Portfolio’s shares.
Expense Ratio
HC Strategic Shares 0.32%
HC Advisors Shares 0.57%1
1 | HC Advisors Shares include Distribution Plan fees of 0.25% which are voluntarily waived by the Adviser. Such waiver is not reflected in the expense ratio shown. |
This information is included in the most current prospectus available to current and prospective shareholders of the Portfolio. Additional information pertaining to the June 30, 2023, expense ratios can be found in the financial highlights.
24
The U.S. Government Fixed Income Securities Portfolio
(Unaudited)
The U.S. Government Fixed Income Securities Portfolio (the “Portfolio”) managed by Mellon Investments Corporation and Parametric Portfolio Associates, LLC returned -0.76% for the fiscal year compared to -2.08% for the Bloomberg U.S. Government Bond Index1 and -3.41% for the average fixed income manager in the Lipper2 universe of General U.S. Government Funds.
The Portfolio outperformed the benchmark due to a shorter duration positioning relative to the Benchmark. As yields moved up, our shorter duration securities outperformed those with more duration. The Portfolio is structured to perform similarly to the benchmark. As such it uses a sampling methodology to select a subset of the index universe that maintains aggregate characteristics – duration, weighted average yield-to-maturity, and average credit quality in-line with the benchmark. Since the Portfolio owns a subset of securities of the Index, there will necessarily be some tracking error.
The U.S. Government bond market posted weak performance for the fiscal year as the rates normalized higher as the Federal Reserve continued to raise the Fed Funds rate, pushing up long rates and concurrently pushing down prices (which move inversely to rates). The rise in global bond yields over the past year is consistent with stronger than expected inflation data and stronger growth.
1 | The Bloomberg U.S. Government Bond Index is a broad-based index that represents the general performance of U.S. Treasury and U.S. Government Agency debt securities. This index is unmanaged, thus the index results do not reflect the impact of expenses associated with any investment in securities, such as brokerage commission or other transaction costs. Benchmark performance is shown for comparison purposes only, as it is not possible to invest directly in a securities index. |
2 | Lipper, Inc. is an independent statistical monitoring organization that compiles performance on mutual funds and further categorizes them by investment objective. |
25

The chart represents historical performance of a hypothetical investment of $10,000 in The U.S. Government Fixed Income Securities Portfolio for the 10-year period ended 6/30/23 and represents the reinvestment of dividends and capital gains in the Portfolio.
Past performance does not guarantee future results. The performance data quoted represents past performance and current returns may be lower or higher. The investment return and principal value will fluctuate so that an investor’s shares, when redeemed, may be worth more or less than the original cost. To obtain performance information current to the most recent month end, please call (800) 242-9596.
The Portfolio’s performance above is compared to the Bloomberg U.S. Government Bond Index. The index is unmanaged and does not reflect the deduction of fees associated with a mutual fund, such as investment management and fund accounting fees, or the deduction of taxes. An investor cannot invest directly in an index. The performance of The U.S. Government Fixed Income Securities Portfolio reflects the deduction of fees for these value-added services, but does not reflect the deduction of taxes that a shareholder would pay on the Portfolio’s distributions or redemptions of the Portfolio’s shares.
Expense Ratio
HC Strategic Shares 0.22%
This information is included in the most current prospectus available to current and prospective shareholders of the Portfolio. Additional information pertaining to the June 30, 2023, expense ratios can be found in the financial highlights.
26
The U.S. Corporate Fixed Income Securities Portfolio
(Unaudited)
The U.S. Corporate Fixed Income Securities Portfolio (the “Portfolio”) managed by Agincourt Capital Management, LLC (“Agincourt”) and Parametric Portfolio Associates, LLC returned 2.19% for the fiscal year compared to 1.55% for the Bloomberg U.S. Corporate Bond Index1 and 0.95% for the average fixed income manager in the Lipper2 universe of Corporate Debt Funds BBB-Rated Funds.3 Agincourt modestly underperformed the benchmark by 11 basis points while maintaining duration, weighted average yield-to-maturity, and average credit quality in line with the benchmark. The Adviser also directed the investment of a portion of the into a shorter duration strategy managed by Parametric which was beneficial as rates rose and contributed to the outperformance.
1 | The Bloomberg U.S. Corporate Bond Index covers USD denominated, investment-grade, fixed-rate, taxable securities sold by industrial, utility and financial issuers. It includes publicly issued U.S. corporate and foreign debentures and secured notes that meet specified maturity, liquidity and quality requirements. Securities in the index roll up to the U.S. Credit and U.S. Aggregate indices. This index is unmanaged, thus the index results do not reflect the impact of expenses associated with any investment in securities, such as brokerage commission or other transaction costs. Benchmark performance is shown for comparison purposes only, as it is not possible to invest directly in a securities index. |
2 | Lipper, Inc. is an independent statistical monitoring organization that compiles performance on mutual funds and further categorizes them by investment objective. |
3 | During the fiscal year, Mellon Investments Corporation, Pacific Investment Management Company, LLC and Parametric Portfolio Associates, LLC were also under contract to manage the Portfolio but did not have assets allocated to them. |
27

The chart represents historical performance of a hypothetical investment of $10,000 in The U.S. Corporate Fixed Income Securities Portfolio for the 10-year period ended 6/30/23 and represents the reinvestment of dividends and capital gains in the Portfolio.
Past performance does not guarantee future results. The performance data quoted represents past performance and current returns may be lower or higher. The investment return and principal value will fluctuate so that an investor’s shares, when redeemed, may be worth more or less than the original cost. To obtain performance information current to the most recent month end, please call (800) 242-9596.
The Portfolio’s performance above is compared to the Bloomberg U.S. Corporate Bond Index. The index is unmanaged and does not reflect the deduction of fees associated with a mutual fund, such as investment management and fund accounting fees, or the deduction of taxes. An investor cannot invest directly in an index. The performance of The U.S. Corporate Fixed Income Securities Portfolio reflects the deduction of fees for these value-added services, but does not reflect the deduction of taxes that a shareholder would pay on the Portfolio’s distributions or redemptions of the Portfolio’s shares.
Expense Ratio
HC Strategic Shares 0.23%
This information is included in the most current prospectus available to current and prospective shareholders of the Portfolio. Additional information pertaining to the June 30, 2023, expense ratios can be found in the financial highlights.
28
The U.S. Mortgage/Asset Backed Fixed Income Securities Portfolio
(Unaudited)
The U.S. Mortgage/Asset Backed Fixed Income Securities Portfolio (the “Portfolio”) managed by Mellon Investments Corporation returned -1.18% for the fiscal year compared to -1.50% for the Bloomberg U.S. Securitized Index1 and -1.59% for the average fixed income manager in the Lipper2 universe of U.S. Mortgage Funds.3
The bond market posted negative performance for the fiscal year as rates rose from extremely low levels during the fiscal year. The rise in global bond yields over the past year is consistent with stronger inflation trends and stronger growth.
The Portfolio is structured to simulate the performance of the benchmark. As such the Portfolio maintains aggregate characteristics – duration, weighted average yield-to-maturity, and average credit quality in line with the benchmark. The Mellon securitized strategy performed in-line with the benchmark. The Portfolio’s outperformance was due to the Advisor’s decision to allocate a portion of the Portfolio’s assets to cash to shorten the Portfolio’s duration.
1 | The Bloomberg U.S. Securitized Index is an index that tracks the performance of mortgage-backed pass through securities issued by Ginnie Mae, Fannie Mae and Freddie Mac, investment-grade bonds and asset-backed securities. This index is unmanaged, thus the index results do not reflect the impact of expenses associated with any investment in securities, such as brokerage commission or other transaction costs. Benchmark performance is shown for comparison purposes only, as it is not possible to invest directly in a securities index. |
2 | Lipper, Inc. is an independent statistical monitoring organization that compiles performance on mutual funds and further categorizes them by investment objective. |
3 | During the fiscal year, Pacific Investment Management Company, LLC and Parametric Portfolio Associates, LLC were also under contract to manage the Portfolio but did not have assets allocated to them. |
29

The chart represents historical performance of a hypothetical investment of $10,000 in The U.S. Mortgage/Asset Backed Fixed Income Securities Portfolio for the 10-year period ended 6/30/23 and represents the reinvestment of dividends and capital gains in the Portfolio.
Past performance does not guarantee future results. The performance data quoted represents past performance and current returns may be lower or higher. The investment return and principal value will fluctuate so that an investor’s shares, when redeemed, may be worth more or less than the original cost. To obtain performance information current to the most recent month end, please call (800) 242-9596.
The Portfolio’s performance above is compared to the Bloomberg U.S. Securitized Index. The index is unmanaged and does not reflect the deduction of fees associated with a mutual fund, such as investment management and fund accounting fees, or the deduction of taxes. An investor cannot invest directly in an index. The performance of The U.S. Mortgage/Asset Backed Fixed Income Securities Portfolio reflects the deduction of fees for these value-added services, but does not reflect the deduction of taxes that a shareholder would pay on the Portfolio’s distributions or redemptions of the Portfolio’s shares.
Expense Ratio
HC Strategic Shares 0.26%
This information is included in the most current prospectus available to current and prospective shareholders of the Portfolio. Additional information pertaining to the June 30, 2023, expense ratios can be found in the financial highlights.
30
The Short-Term Municipal Bond Portfolio
(Unaudited)
The Short-Term Municipal Bond Portfolio (the “Portfolio”) managed by Breckinridge Capital Advisors, Inc. returned 1.19% for the fiscal year compared to 1.08% for the ICE BofA Merrill Lynch 1-3 Year Municipal Index1 and 1.68% for the average manager in the Lipper2 universe of Short Municipal Debt Funds.
The Portfolio outperformed its benchmark due to an intentional overweight to higher quality bonds than the benchmark.
1 | The ICE BofA Merrill Lynch 1-3 Year Municipal Index is an equal-weighted index that tracks the total return performance of the domestic U.S. municipal market. The index consists of investment grade, publicly traded, fixed-rate and coupon bearing municipal securities with a maturity of one to three years. This index is unmanaged, thus the index results do not reflect the impact of expenses associated with any investment in securities, such as brokerage commission or other transaction costs. Benchmark performance is shown for comparison purposes only, as it is not possible to invest directly in a securities index. |
2 | Lipper, Inc. is an independent statistical monitoring organization that organization compiles performance on mutual funds and further categorizes them by investment objective. |
31
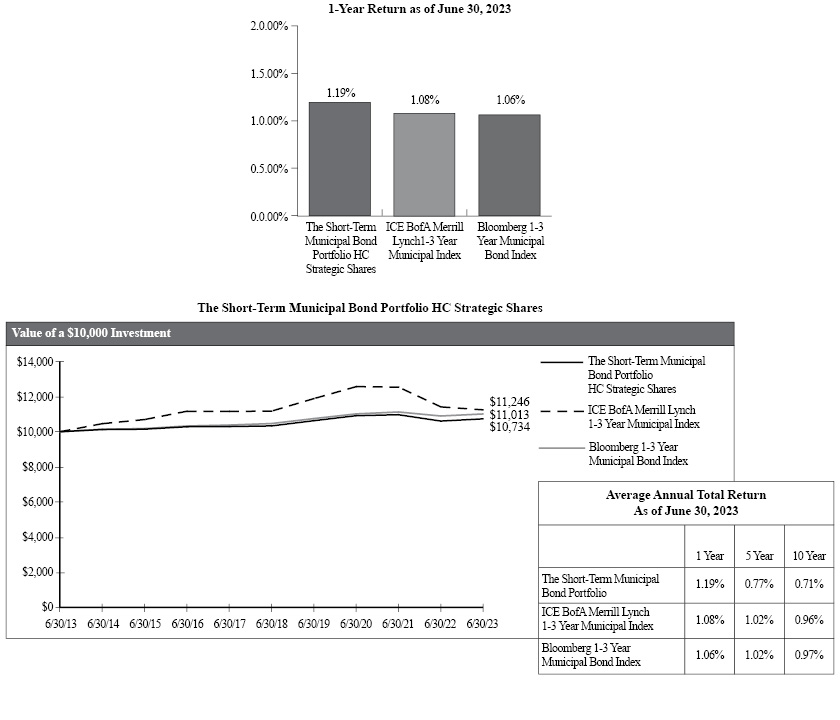
The chart represents historical performance of a hypothetical investment of $10,000 in The Short-Term Municipal Bond Portfolio for the 10-year period ended 6/30/23 and represents the reinvestment of dividends and capital gains in the Portfolio.
Past performance does not guarantee future results. The performance data quoted represents past performance and current returns may be lower or higher. The investment return and principal value will fluctuate so that an investor’s shares, when redeemed, may be worth more or less than the original cost. To obtain performance information current to the most recent month end, please call (800) 242-9596.
The Portfolio’s performance above is compared to the ICE BofA Merrill Lynch 1-3 Year Municipal Index. The index is unmanaged and does not reflect the deduction of fees associated with a mutual fund, such as investment management and fund accounting fees, or the deduction of taxes. An investor cannot invest directly in an index. The performance of The Short-Term Municipal Bond Portfolio reflects the deduction of fees for these value-added services, but does not reflect the deduction of taxes that a shareholder would pay on the Portfolio’s distributions or redemptions of the Portfolio’s shares.
Expense Ratio
HC Strategic Shares 0.28%
This information is included in the most current prospectus available to current and prospective shareholders of the Portfolio. Additional information pertaining to the June 30, 2023, expense ratios can be found in the financial highlights.
32
The Intermediate Term Municipal Bond Portfolio
(Unaudited)
The Intermediate Term Municipal Bond Portfolio managed by Insight North America LLC (“Insight”) returned 2.20% for the fiscal year compared to 2.38% for the Bloomberg 3-10 Year Blend (2-12) Total Return Index Unhedged1 and 2.62% for the average manager in the Lipper2 universe of Intermediate Municipal Debt Funds.3
The Insight strategy performed similarly to the benchmark during the twelve-month reporting period. An overweight to revenue bonds compared to general obligation bonds, and an underweight to higher rated issues were detractors contributing to the underperformance during the fiscal year.
1 | The Bloomberg 3-10 Year Blend (2-12) Total Return Index is an index composed of bonds with maturities ranging between 2 and 12 years. This index is unmanaged, thus the index results do not reflect the impact of expenses associated with any investment in securities, such as brokerage commission or other transaction costs. Benchmark performance is shown for comparison purposes only, as it is not possible to invest directly in a securities index. |
2 | Lipper, Inc. is an independent statistical monitoring organization that compiles performance on mutual funds and further categorizes them by investment objective. |
3 | During the fiscal year, Breckinridge Capital Advisors, Inc., City of London Investment Management Company, Limited and Parametric Portfolio Associates, LLC were also under contract to manage the Portfolio but did not have assets allocated to them. |
33

The chart represents historical performance of a hypothetical investment of $10,000 in The Intermediate Term Municipal Bond Portfolio for the 10-year period ended 6/30/23 and represents the reinvestment of dividends and capital gains in the Portfolio.
Past performance does not guarantee future results. The performance data quoted represents past performance and current returns may be lower or higher. The investment return and principal value will fluctuate so that an investor’s shares, when redeemed, may be worth more or less than the original cost. To obtain performance information current to the most recent month end, please call (800) 242-9596.
The Portfolio’s performance above is compared to the Bloomberg 3-10 Year Blend (2-12) Total Return Index Unhedged. The index is unmanaged and does not reflect the deduction of fees associated with a mutual fund, such as investment management and fund accounting fees, or the deduction of taxes. An investor cannot invest directly in an index. The performance of The Intermediate Term Municipal Bond Portfolio reflects the deduction of fees for these value-added services, but does not reflect the deduction of taxes that a shareholder would pay on the Portfolio’s distributions or redemptions of the Portfolio’s shares.
Expense Ratio
HC Strategic Shares 0.31%
HC Advisors Shares 0.56%1
1 | HC Advisors Shares include Distribution Plan fees of 0.25% which are voluntarily waived by the Adviser. Such waiver is not reflected in the expense ratio shown. |
This information is included in the most current prospectus available to current and prospective shareholders of the Portfolio. Additional information pertaining to the June 30, 2023, expense ratios can be found in the financial highlights.
34
Conclusion
The performance of the Portfolios for the fiscal year was consistent with our expectations. We are fully weighted to equities because, despite all the challenges companies have faced, earnings have been surprisingly resilient. Several factors contribute to this positive outlook: inflation has reached a two-year low, the economy and job market continue to show impressive strength, the Federal Reserve has temporarily halted its aggressive rate hike policy, the debt ceiling extension has been resolved and there have been no significant negative impacts from the regional bank failures earlier this year. Higher yields resulting from the Fed’s rate hikes also mean fixed-income investments are potentially more attractive than they’ve been in years, even if the Fed’s not yet done with its inflation fight.
However, It is too early to think the economy is in the clear from recession risks, and we are prepared for a possible further slowdown in the economy as we move into the second half of 2023. The crucial factor for the markets will be how severe this slowdown turns out to be should it materialize. Currently, stocks are not reflecting the likelihood of a significant economic downturn at current valuation levels.
We continue to seek to broaden the opportunity set of investment portfolios available to our clients for fulfilling their asset allocation and investment policy objectives. We also continue to maintain a comprehensive dual-track, investment management and compliance review and due diligence processes to identify, select, implement, monitor and manage the investment managers and investment strategies we employ within each Portfolio.
Finally, we are constantly seeking ways to improve our management of each Portfolio. We continue to explore new strategies that exploit more differentiated opportunities among factor-based investment styles. As ever, we appreciate your continued trust and confidence.
HC Capital Solutions
35
HC CAPITAL TRUST
The Value Equity Portfolio
Portfolio of Investments — June 30, 2023
Shares | Security Description | Value | ||||||
Common Stocks — 99.72% | ||||||||
Aerospace & Defense — 1.60% | ||||||||
| 3,065 | HEICO Corp. | $ | 542 | |||||
| 1,057 | L3Harris Technologies, Inc. | 207 | ||||||
| 5,411 | Lockheed Martin Corp. | 2,491 | ||||||
| 747 | Northrop Grumman Corp. | 340 | ||||||
| 18,437 | Raytheon Technologies Corp. | 1,806 | ||||||
| 6,782 | Spirit AeroSystems Holdings, Inc., Class - A | 198 | ||||||
| 5,412 | The Boeing Co.(a) | 1,143 | ||||||
| 4,420 | TransDigm Group, Inc. | 3,953 | ||||||
| 10,680 | ||||||||
Air Freight & Logistics — 0.66% | ||||||||
| 305 | Expeditors International of Washington, Inc. | 37 | ||||||
| 4,786 | FedEx Corp. | 1,186 | ||||||
| 1,886 | GXO Logistics, Inc.(a) | 118 | ||||||
| 16,845 | United Parcel Service, Inc., Class - B | 3,020 | ||||||
| 4,361 | ||||||||
Automobile Components — 1.85% | ||||||||
| 7,064 | General Motors Co. | 272 | ||||||
| 585 | Gentex Corp. | 17 | ||||||
| 12,500 | Lear Corp. | 1,794 | ||||||
| 37,134 | Tesla, Inc.(a) | 9,722 | ||||||
| 37,827 | The Goodyear Tire & Rubber Co.(a) | 517 | ||||||
| 12,322 | ||||||||
Banks — 3.41% | ||||||||
| 225,733 | Bank of America Corp. | 6,475 | ||||||
| 16,687 | Bank OZK | 670 | ||||||
| 16,009 | Citigroup, Inc. | 737 | ||||||
| 1,826 | Citizens Financial Group, Inc. | 48 | ||||||
| 5,616 | Columbia Banking System, Inc. | 114 | ||||||
| 15,989 | Comerica, Inc. | 677 | ||||||
| 656 | Commerce Bancshares, Inc. | 32 | ||||||
| 1,552 | Cullen/Frost Bankers, Inc. | 167 | ||||||
| 3,013 | East West Bancorp, Inc. | 159 | ||||||
| 13,076 | Fifth Third Bancorp | 343 | ||||||
| 591 | First Citizens BancShares, Inc., Class - A | 759 | ||||||
| 6,815 | First Hawaiian, Inc. | 123 | ||||||
| 41,225 | Huntington Bancshares, Inc. | 444 | ||||||
| 52,407 | JPMorgan Chase & Co. | 7,621 | ||||||
| 3,497 | M&T Bank Corp. | 433 | ||||||
| 42,174 | Synovus Financial Corp. | 1,276 | ||||||
| 8,270 | The PNC Financial Services Group, Inc. | 1,042 | ||||||
| 12,253 | Truist Financial Corp. | 372 | ||||||
| 14,195 | Wells Fargo & Co. | 606 | ||||||
| 16,779 | Western Alliance Bancorp | 612 | ||||||
| 22,710 | ||||||||
Beverages — 1.84% | ||||||||
| 4,600 | Brown-Forman Corp., Class - B | 307 | ||||||
| 2,846 | Constellation Brands, Inc., Class - A | 700 | ||||||
Shares | Security Description | Value | ||||||
Beverages (continued) | ||||||||
| 6,891 | Keurig Dr Pepper, Inc. | $ | 215 | |||||
| 9,060 | Monster Beverage Corp.(a) | 520 | ||||||
| 28,839 | PepsiCo, Inc. | 5,343 | ||||||
| 85,987 | The Coca-Cola Co. | 5,178 | ||||||
| 12,263 | ||||||||
Biotechnology — 2.30% | ||||||||
| 34,760 | AbbVie, Inc. | 4,684 | ||||||
| 2,223 | Alnylam Pharmaceuticals, Inc.(a) | 422 | ||||||
| 14,171 | Amgen, Inc. | 3,146 | ||||||
| 3,274 | Moderna, Inc.(a) | 398 | ||||||
| 8,247 | Seagen, Inc.(a) | 1,587 | ||||||
| 17,938 | United Therapeutics Corp.(a) | 3,960 | ||||||
| 3,143 | Vertex Pharmaceuticals, Inc.(a) | 1,106 | ||||||
| 15,303 | ||||||||
Broadline Retail — 3.17% | ||||||||
| 154,380 | Amazon.com, Inc.(a) | 20,125 | ||||||
| 15,760 | eBay, Inc. | 704 | ||||||
| 5,126 | Ollie’s Bargain Outlet Holdings, Inc.(a) | 297 | ||||||
| 21,126 | ||||||||
Building Products — 0.69% | ||||||||
| 10,045 | A.O. Smith Corp. | 731 | ||||||
| 21,311 | Carrier Global Corp. | 1,059 | ||||||
| 13,273 | Johnson Controls International PLC | 904 | ||||||
| 6,549 | Masco Corp. | 376 | ||||||
| 7,831 | Trane Technologies PLC | 1,498 | ||||||
| 4,568 | ||||||||
Capital Markets — 2.40% | ||||||||
| 4,496 | Affiliated Managers Group, Inc. | 674 | ||||||
| 2,506 | Ameriprise Financial, Inc. | 832 | ||||||
| 2,656 | Ares Management Corp., Class - A | 256 | ||||||
| 4,582 | BlackRock, Inc. | 3,166 | ||||||
| 1,669 | CME Group, Inc. | 309 | ||||||
| 7,651 | Coinbase Global, Inc., Class - A^(a) | 547 | ||||||
| 4,721 | Evercore, Inc. | 583 | ||||||
| 16,955 | Franklin Resources, Inc. | 453 | ||||||
| 2,293 | Interactive Brokers Group, Inc. | 190 | ||||||
| 3,061 | Intercontinental Exchange, Inc. | 346 | ||||||
| 9,972 | Invesco Ltd. | 168 | ||||||
| 17,093 | Jefferies Financial Group, Inc. | 567 | ||||||
| 9,493 | KKR & Co., Inc. | 532 | ||||||
| 20,369 | Morgan Stanley | 1,740 | ||||||
| 686 | Morningstar, Inc. | 135 | ||||||
| 1,887 | Nasdaq, Inc. | 94 | ||||||
| 269 | S&P Global, Inc. | 108 | ||||||
| 7,695 | State Street Corp. | 563 | ||||||
| 7,780 | T. Rowe Price Group, Inc. | 872 | ||||||
| 25,629 | The Charles Schwab Corp. | 1,453 | ||||||
| 7,506 | The Goldman Sachs Group, Inc. | 2,421 | ||||||
| 16,009 | ||||||||
See accompanying notes to financial statements.
36
HC CAPITAL TRUST
The Value Equity Portfolio
Portfolio of Investments (continued) — June 30, 2023
Shares | Security Description | Value | ||||||
Common Stocks (continued) | ||||||||
Chemicals — 1.56% | ||||||||
| 7,464 | Air Products & Chemicals, Inc. | $ | 2,235 | |||||
| 1,327 | Albemarle Corp. | 296 | ||||||
| 4,923 | Axalta Coating Systems Ltd.(a) | 162 | ||||||
| 1,640 | Celanese Corp. | 190 | ||||||
| 30,439 | CF Industries Holdings, Inc. | 2,113 | ||||||
| 9,311 | Corteva, Inc. | 534 | ||||||
| 9,217 | Dow, Inc. | 491 | ||||||
| 13,063 | DuPont de Nemours, Inc. | 933 | ||||||
| 1,288 | Linde PLC | 491 | ||||||
| 7,173 | LyondellBasell Industries N.V., Class - A | 659 | ||||||
| 24,876 | Olin Corp. | 1,278 | ||||||
| 6,716 | PPG Industries, Inc. | 996 | ||||||
| 10,378 | ||||||||
Commercial Services & Supplies — 1.36% | ||||||||
| 11,948 | Clean Harbors, Inc.(a) | 1,964 | ||||||
| 54,698 | Copart, Inc.(a) | 4,988 | ||||||
| 1,577 | RB Global, Inc. | 95 | ||||||
| 1,270 | Republic Services, Inc. | 195 | ||||||
| 2,747 | Stericycle, Inc.(a) | 128 | ||||||
| 9,682 | Waste Management, Inc. | 1,679 | ||||||
| 9,049 | ||||||||
Communications Equipment — 0.74% | ||||||||
| 90,637 | Cisco Systems, Inc. | 4,690 | ||||||
| 774 | Motorola Solutions, Inc. | 227 | ||||||
| 4,917 | ||||||||
Construction & Engineering — 0.12% | ||||||||
| 3,578 | AECOM | 303 | ||||||
| 841 | Arcosa, Inc. | 64 | ||||||
| 2,295 | Quanta Services, Inc. | 451 | ||||||
| 818 | ||||||||
Construction Materials — 0.18% | ||||||||
| 1,351 | Martin Marietta Materials, Inc. | 624 | ||||||
| 2,578 | Vulcan Materials Co. | 581 | ||||||
| 1,205 | ||||||||
Consumer Finance — 1.23% | ||||||||
| 20,855 | American Express Co. | 3,633 | ||||||
| 20,025 | Capital One Financial Corp. | 2,190 | ||||||
| 6,409 | Discover Financial Services | 749 | ||||||
| 14,450 | OneMain Holdings, Inc. | 631 | ||||||
| 117,583 | SoFi Technologies, Inc.(a) | 981 | ||||||
| 8,184 | ||||||||
Consumer Staples Distribution & Retail — 1.76% | ||||||||
| 3,254 | Casey’s General Stores, Inc. | 794 | ||||||
| 2,275 | Costco Wholesale Corp. | 1,225 | ||||||
| 952 | Dollar General Corp. | 162 | ||||||
| 4,169 | Dollar Tree, Inc.(a) | 598 | ||||||
Shares | Security Description | Value | ||||||
Consumer Staples Distribution & Retail (continued) | ||||||||
| 9,412 | Sysco Corp. | $ | 698 | |||||
| 17,745 | Target Corp. | 2,341 | ||||||
| 9,040 | The Kroger Co. | 425 | ||||||
| 34,781 | Walmart, Inc. | 5,466 | ||||||
| 11,709 | ||||||||
Containers & Packaging — 0.34% | ||||||||
| 262 | AptarGroup, Inc. | 30 | ||||||
| 27 | Avery Dennison Corp. | 5 | ||||||
| 22,939 | Ball Corp. | 1,335 | ||||||
| 10,608 | International Paper Co. | 337 | ||||||
| 2,050 | Packaging Corp. of America | 271 | ||||||
| 2,320 | Silgan Holdings, Inc. | 109 | ||||||
| 2,452 | Sonoco Products Co. | 145 | ||||||
| 2,232 | ||||||||
Distributors — 0.10% | ||||||||
| 3,827 | Genuine Parts Co. | 648 | ||||||
Diversified Consumer Services — 0.07% | ||||||||
| 7,498 | H&R Block, Inc. | 239 | ||||||
| 3,097 | Service Corp. International | 200 | ||||||
| 439 | ||||||||
Diversified REITs — 0.04% | ||||||||
| 1,385 | Federal Realty Investment Trust | 134 | ||||||
| 1,573 | WP Carey, Inc. | 106 | ||||||
| 240 | ||||||||
Diversified Telecommunication Services — 0.27% | ||||||||
| 4,671 | GCI Liberty, Inc.(c) | — | ||||||
| 48,780 | Verizon Communications, Inc. | 1,814 | ||||||
Electric Utilities — 1.51% | ||||||||
| 1,604 | Alliant Energy Corp. | 84 | ||||||
| 30,034 | American Electric Power Co., Inc. | 2,529 | ||||||
| 3,035 | Constellation Energy Corp. | 278 | ||||||
| 7,685 | Duke Energy Corp. | 690 | ||||||
| 1,914 | Edison International | 133 | ||||||
| 9,746 | Eversource Energy | 691 | ||||||
| 9,106 | Exelon Corp. | 371 | ||||||
| 3,311 | Hawaiian Electric Industries, Inc. | 120 | ||||||
| 35,480 | NextEra Energy, Inc. | 2,632 | ||||||
| 32,159 | The Southern Co. | 2,259 | ||||||
| 4,017 | Xcel Energy, Inc. | 250 | ||||||
| 10,037 | ||||||||
Electrical Equipment — 0.77% | ||||||||
| 3,350 | AMETEK, Inc. | 542 | ||||||
| 12,355 | Eaton Corp. PLC | 2,485 | ||||||
| 16,658 | Emerson Electric Co. | 1,506 | ||||||
| 3,984 | Regal Rexnord Corp. | 613 | ||||||
| 5,146 | ||||||||
See accompanying notes to financial statements.
37
HC CAPITAL TRUST
The Value Equity Portfolio
Portfolio of Investments (continued) — June 30, 2023
Shares | Security Description | Value | ||||||
Common Stocks (continued) | ||||||||
Electronic Equipment, Instruments & Components — 0.03% | ||||||||
| 1,050 | Keysight Technologies, Inc.(a) | $ | 176 | |||||
Energy Equipment & Services — 0.75% | ||||||||
| 26,930 | Halliburton Co. | 888 | ||||||
| 6,095 | Helmerich & Payne, Inc. | 216 | ||||||
| 153,313 | Patterson-UTI Energy, Inc. | 1,835 | ||||||
| 42,009 | Schlumberger N.V. | 2,064 | ||||||
| 5,003 | ||||||||
Entertainment — 0.94% | ||||||||
| 2,063 | Activision Blizzard, Inc.(a) | 174 | ||||||
| 14,871 | Liberty Media Corp. - Liberty Formula One, Class - C(a) | 1,119 | ||||||
| 4,935 | Netflix, Inc.(a) | 2,174 | ||||||
| 28,322 | The Walt Disney Co.(a) | 2,529 | ||||||
| 22,448 | Warner Bros. Discovery, Inc.(a) | 281 | ||||||
| 6,277 | ||||||||
Financial Services — 3.39% | ||||||||
| 8,213 | Apollo Global Management, Inc. | 631 | ||||||
| 23,433 | Berkshire Hathaway, Inc., Class - B(a) | 7,991 | ||||||
| 14,613 | Equitable Holdings, Inc. | 397 | ||||||
| 3,316 | Fiserv, Inc.(a) | 418 | ||||||
| 4,425 | Global Payments, Inc. | 436 | ||||||
| 18,311 | Mastercard, Inc., Class - A | 7,202 | ||||||
| 23,246 | Visa, Inc., Class - A | 5,520 | ||||||
| 43 | WEX, Inc.(a) | 8 | ||||||
| 22,603 | ||||||||
Food Products — 0.82% | ||||||||
| 13,782 | Archer-Daniels-Midland Co. | 1,040 | ||||||
| 3,437 | Campbell Soup Co. | 157 | ||||||
| 16,807 | Conagra Brands, Inc. | 567 | ||||||
| 5,689 | Flowers Foods, Inc. | 142 | ||||||
| 12,760 | General Mills, Inc. | 979 | ||||||
| 2,450 | Hormel Foods Corp. | 99 | ||||||
| 10,284 | Kellogg Co. | 693 | ||||||
| 9,502 | Mondelez International, Inc., Class - A | 693 | ||||||
| 1,277 | Post Holdings, Inc.(a) | 111 | ||||||
| 1,964 | The Hershey Co. | 490 | ||||||
| 13,887 | The Kraft Heinz Co. | 493 | ||||||
| 5,464 | ||||||||
Gas Utilities — 0.01% | ||||||||
| 808 | Atmos Energy Corp. | 94 | ||||||
Ground Transportation — 1.10% | ||||||||
| 4,011 | CSX Corp. | 137 | ||||||
| 2,655 | Knight-Swift Transportation Holdings, Inc. | 148 | ||||||
| 5,345 | Norfolk Southern Corp. | 1,212 | ||||||
| 1,462 | Old Dominion Freight Line, Inc. | 541 | ||||||
| 1,886 | RXO, Inc.(a) | 43 | ||||||
Shares | Security Description | Value | ||||||
Ground Transportation (continued) | ||||||||
| 7,527 | Ryder System, Inc. | $ | 638 | |||||
| 13,196 | Uber Technologies, Inc.(a) | 570 | ||||||
| 2,943 | U-Haul Holding Co. | 149 | ||||||
| 327 | U-Haul Holding Co. | 18 | ||||||
| 18,473 | Union Pacific Corp. | 3,779 | ||||||
| 1,886 | XPO, Inc.(a) | 111 | ||||||
| 7,346 | ||||||||
Health Care Equipment & Supplies — 2.35% | ||||||||
| 48,674 | Abbott Laboratories | 5,307 | ||||||
| 5,533 | Align Technology, Inc.(a) | 1,957 | ||||||
| 4,797 | Becton Dickinson & Co. | 1,266 | ||||||
| 5,314 | Dexcom, Inc.(a) | 683 | ||||||
| 9,953 | Edwards Lifesciences Corp.(a) | 939 | ||||||
| 1,648 | Enovis Corp.(a) | 106 | ||||||
| 2,648 | GE HealthCare Technologies, Inc. | 215 | ||||||
| 1,653 | IDEXX Laboratories, Inc.(a) | 830 | ||||||
| 2,647 | Intuitive Surgical, Inc.(a) | 905 | ||||||
| 28,708 | Medtronic PLC | 2,529 | ||||||
| 1,434 | Penumbra, Inc.(a) | 493 | ||||||
| 1,498 | STERIS PLC | 337 | ||||||
| 352 | Teleflex, Inc. | 85 | ||||||
| 15,652 | ||||||||
Health Care Providers & Services — 2.89% | ||||||||
| 3,127 | AmerisourceBergen Corp. | 602 | ||||||
| 24,101 | Centene Corp.(a) | 1,626 | ||||||
| 14,322 | CVS Health Corp. | 990 | ||||||
| 4,252 | Elevance Health, Inc. | 1,889 | ||||||
| 4,756 | HCA Healthcare, Inc. | 1,443 | ||||||
| 2,789 | Humana, Inc. | 1,247 | ||||||
| 2,131 | Laboratory Corporation of America Holdings | 514 | ||||||
| 4,072 | McKesson Corp. | 1,740 | ||||||
| 992 | Molina Healthcare, Inc.(a) | 299 | ||||||
| 2,928 | Quest Diagnostics, Inc. | 412 | ||||||
| 11,241 | The Cigna Group | 3,154 | ||||||
| 11,048 | UnitedHealth Group, Inc. | 5,310 | ||||||
| 19,226 | ||||||||
Health Care REITs — 0.07% | ||||||||
| 5,701 | Welltower, Inc. | 461 | ||||||
Health Care Technology — 0.42% | ||||||||
| 17,850 | Teladoc Health, Inc.(a) | 452 | ||||||
| 11,861 | Veeva Systems, Inc., Class - A(a) | 2,345 | ||||||
| 2,797 | ||||||||
Hotels, Restaurants & Leisure — 2.20% | ||||||||
| 3,359 | Airbnb, Inc., Class - A(a) | 430 | ||||||
| 7,828 | Caesars Entertainment, Inc.(a) | 399 | ||||||
| 2,249 | Darden Restaurants, Inc. | 376 | ||||||
| 23,594 | DraftKings, Inc.(a) | 627 | ||||||
| 148 | Hilton Worldwide Holdings, Inc. | 22 | ||||||
See accompanying notes to financial statements.
38
HC CAPITAL TRUST
The Value Equity Portfolio
Portfolio of Investments (continued) — June 30, 2023
Shares | Security Description | Value | ||||||
Common Stocks (continued) | ||||||||
Hotels, Restaurants & Leisure (continued) | ||||||||
| 3,826 | Hyatt Hotels Corp., Class - A | $ | 438 | |||||
| 1,434 | Marriott International, Inc., Class - A | 263 | ||||||
| 20,166 | McDonald’s Corp. | 6,019 | ||||||
| 51,410 | Norwegian Cruise Line Holdings Ltd.(a) | 1,119 | ||||||
| 16,947 | Royal Caribbean Cruises Ltd.(a) | 1,758 | ||||||
| 30,827 | Starbucks Corp. | 3,054 | ||||||
| 546 | Vail Resorts, Inc. | 137 | ||||||
| 14,642 | ||||||||
Household Durables — 0.52% | ||||||||
| 3,443 | D.R. Horton, Inc. | 419 | ||||||
| 3,121 | Garmin Ltd. | 325 | ||||||
| 3,252 | Leggett & Platt, Inc. | 96 | ||||||
| 6,964 | Lennar Corp., Class - A | 873 | ||||||
| 83 | Lennar Corp., Class - B | 9 | ||||||
| 4,132 | PulteGroup, Inc. | 321 | ||||||
| 17,676 | Toll Brothers, Inc. | 1,398 | ||||||
| 3,441 | ||||||||
Household Products — 1.62% | ||||||||
| 2,171 | Church & Dwight Co., Inc. | 218 | ||||||
| 16,240 | Kimberly-Clark Corp. | 2,242 | ||||||
| 1,218 | The Clorox Co. | 194 | ||||||
| 53,465 | The Procter & Gamble Co. | 8,112 | ||||||
| 10,766 | ||||||||
Industrial Conglomerates — 0.63% | ||||||||
| 7,946 | General Electric Co. | 873 | ||||||
| 16,050 | Honeywell International, Inc. | 3,330 | ||||||
| 4,203 | ||||||||
Industrial REITs — 0.61% | ||||||||
| 35,435 | Americold Realty Trust, Inc. | 1,145 | ||||||
| 20,968 | Prologis, Inc. | 2,571 | ||||||
| 6,543 | Rexford Industrial Realty, Inc. | 342 | ||||||
| 4,058 | ||||||||
Insurance — 1.88% | ||||||||
| 23,465 | Aflac, Inc. | 1,638 | ||||||
| 560 | Aon PLC, Class - A | 193 | ||||||
| 3,589 | Arthur J. Gallagher & Co. | 788 | ||||||
| 1,195 | Assurant, Inc. | 150 | ||||||
| 1,709 | Brown & Brown, Inc. | 118 | ||||||
| 3,252 | Cincinnati Financial Corp. | 316 | ||||||
| 52,976 | Fidelity National Financial, Inc. | 1,907 | ||||||
| 27,206 | Lincoln National Corp. | 701 | ||||||
| 2,577 | Marsh & McLennan Cos., Inc. | 485 | ||||||
| 26,353 | MetLife, Inc. | 1,490 | ||||||
| 7,077 | Old Republic International Corp. | 178 | ||||||
| 6,114 | Prudential Financial, Inc. | 539 | ||||||
| 2,797 | RenaissanceRe Holdings Ltd. | 522 | ||||||
| 26,534 | The Allstate Corp. | 2,894 | ||||||
Shares | Security Description | Value | ||||||
Insurance (continued) | ||||||||
| 2,945 | The Progressive Corp. | $ | 390 | |||||
| 3,246 | W.R. Berkley Corp. | 193 | ||||||
| 12,502 | ||||||||
Interactive Media & Services — 5.20% | ||||||||
| 125,340 | Alphabet, Inc., Class - A(a) | 15,003 | ||||||
| 91,660 | Alphabet, Inc., Class - C(a) | 11,088 | ||||||
| 7,722 | IAC, Inc.(a) | 485 | ||||||
| 7,149 | Match Group, Inc.(a) | 299 | ||||||
| 27,023 | Meta Platforms, Inc., Class - A(a) | 7,755 | ||||||
| 34,630 | ||||||||
IT Services — 1.07% | ||||||||
| 2,831 | Accenture PLC, Class - A | 874 | ||||||
| 3,168 | Akamai Technologies, Inc.(a) | 285 | ||||||
| 1,853 | Cognizant Technology Solutions Corp., Class - A | 121 | ||||||
| 8,471 | EPAM Systems, Inc.(a) | 1,903 | ||||||
| 13,957 | GoDaddy, Inc., Class - A(a) | 1,049 | ||||||
| 2,117 | International Business Machines Corp. | 283 | ||||||
| 13,322 | Okta, Inc.(a) | 924 | ||||||
| 4,262 | Snowflake, Inc., Class - A(a) | 750 | ||||||
| 4,247 | VeriSign, Inc.(a) | 960 | ||||||
| 7,149 | ||||||||
Leisure Products — 0.12% | ||||||||
| 1,780 | Brunswick Corp. | 154 | ||||||
| 1,159 | Hasbro, Inc. | 75 | ||||||
| 10,271 | Mattel, Inc.(a) | 201 | ||||||
| 3,276 | Polaris, Inc. | 396 | ||||||
| 826 | ||||||||
Life Sciences Tools & Services — 1.15% | ||||||||
| 4,371 | Agilent Technologies, Inc. | 526 | ||||||
| 398 | Bio-Rad Laboratories, Inc., Class - A(a) | 151 | ||||||
| 1,294 | Bruker Corp. | 96 | ||||||
| 438 | Charles River Laboratories International, Inc.(a) | 92 | ||||||
| 3,501 | Danaher Corp. | 840 | ||||||
| 710 | IQVIA Holdings, Inc.(a) | 160 | ||||||
| 2,796 | Mettler-Toledo International, Inc.(a) | 3,666 | ||||||
| 2,339 | QIAGEN N.V.(a) | 105 | ||||||
| 485 | Revvity, Inc. | 58 | ||||||
| 3,456 | Thermo Fisher Scientific, Inc. | 1,803 | ||||||
| 720 | Waters Corp.(a) | 192 | ||||||
| 7,689 | ||||||||
Machinery — 1.62% | ||||||||
| 11,054 | AGCO Corp. | 1,453 | ||||||
| 12,196 | Caterpillar, Inc. | 3,000 | ||||||
| 5,428 | Cummins, Inc. | 1,331 | ||||||
| 53 | Donaldson Co., Inc. | 3 | ||||||
| 4,752 | Dover Corp. | 702 | ||||||
| 1,648 | Esab Corp. | 110 | ||||||
| 28 | IDEX Corp. | 6 | ||||||
See accompanying notes to financial statements.
39
HC CAPITAL TRUST
The Value Equity Portfolio
Portfolio of Investments (continued) — June 30, 2023
Shares | Security Description | Value | ||||||
Common Stocks (continued) | ||||||||
Machinery (continued) | ||||||||
| 6,910 | Ingersoll Rand, Inc. | $ | 452 | |||||
| 1,442 | ITT, Inc. | 134 | ||||||
| 1,244 | Nordson Corp. | 309 | ||||||
| 17,062 | Oshkosh Corp. | 1,477 | ||||||
| 7,507 | Otis Worldwide Corp. | 668 | ||||||
| 1,693 | Parker-Hannifin Corp. | 660 | ||||||
| 2,490 | The Timken Co. | 228 | ||||||
| 1,711 | Westinghouse Air Brake Technologies Corp. | 188 | ||||||
| 485 | Xylem, Inc. | 55 | ||||||
| 10,776 | ||||||||
Media — 0.76% | ||||||||
| 84,982 | Comcast Corp., Class - A | 3,531 | ||||||
| 4,889 | Fox Corp., Class - A | 166 | ||||||
| 3,789 | Omnicom Group, Inc. | 361 | ||||||
| 28,352 | Paramount Global, Class - B | 451 | ||||||
| 14,641 | The Interpublic Group of Cos., Inc. | 565 | ||||||
| 5,074 | ||||||||
Metals & Mining — 0.35% | ||||||||
| 18,550 | Newmont Corp. | 791 | ||||||
| 8,225 | Nucor Corp. | 1,349 | ||||||
| 1,912 | Steel Dynamics, Inc. | 208 | ||||||
| 2,348 | ||||||||
Mortgage Real Estate Investment Trusts — 0.02% | ||||||||
| 15,165 | Rithm Capital Corp. | 142 | ||||||
Multi-Utilities — 0.70% | ||||||||
| 2,674 | Ameren Corp. | 218 | ||||||
| 1,937 | CMS Energy Corp. | 114 | ||||||
| 1,642 | Consolidated Edison, Inc. | 148 | ||||||
| 1,144 | Dominion Energy, Inc. | 59 | ||||||
| 1,043 | DTE Energy Co. | 115 | ||||||
| 72,854 | NiSource, Inc. | 1,994 | ||||||
| 5,865 | Public Service Enterprise Group, Inc. | 367 | ||||||
| 951 | Sempra Energy | 138 | ||||||
| 17,371 | WEC Energy Group, Inc. | 1,533 | ||||||
| 4,686 | ||||||||
Oil, Gas & Consumable Fuels — 3.24% | ||||||||
| 19,551 | Antero Midstream Corp. | 227 | ||||||
| 7,263 | Cheniere Energy, Inc. | 1,107 | ||||||
| 19,851 | Chevron Corp. | 3,124 | ||||||
| 5,077 | ConocoPhillips | 526 | ||||||
| 63,641 | Coterra Energy, Inc. | 1,610 | ||||||
| 30,851 | Devon Energy Corp. | 1,491 | ||||||
| 521 | DT Midstream, Inc. | 26 | ||||||
| 3,995 | EOG Resources, Inc. | 457 | ||||||
| 7,396 | EQT Corp. | 304 | ||||||
| 45,836 | Exxon Mobil Corp. | 4,917 | ||||||
| 16,993 | Hess Corp. | 2,310 | ||||||
Shares | Security Description | Value | ||||||
Oil, Gas & Consumable Fuels (continued) | ||||||||
| 11,538 | Marathon Petroleum Corp. | $ | 1,345 | |||||
| 26,124 | Occidental Petroleum Corp. | 1,536 | ||||||
| 6,401 | ONEOK, Inc. | 395 | ||||||
| 6,951 | Targa Resources Corp. | 529 | ||||||
| 41,203 | The Williams Cos., Inc. | 1,344 | ||||||
| 2,242 | Valero Energy Corp. | 263 | ||||||
| 2,011 | Vitesse Energy, Inc. | 45 | ||||||
| 21,556 | ||||||||
Paper & Forest Products — 0.01% | ||||||||
| 964 | Sylvamo Corp. | 39 | ||||||
Passenger Airlines — 0.20% | ||||||||
| 11,583 | Alaska Air Group, Inc.(a) | 616 | ||||||
| 28,157 | American Airlines Group, Inc.(a) | 505 | ||||||
| 2,097 | Copa Holdings SA, Class - A | 232 | ||||||
| 1,353 | ||||||||
Personal Care Products — 0.05% | ||||||||
| 1,700 | The Estee Lauder Cos., Inc. | 334 | ||||||
Pharmaceuticals — 4.38% | ||||||||
| 30,890 | Bristol-Myers Squibb Co. | 1,975 | ||||||
| 19,272 | Eli Lilly & Co. | 9,039 | ||||||
| 1,000 | Jazz Pharmaceuticals PLC(a) | 124 | ||||||
| 44,819 | Johnson & Johnson | 7,418 | ||||||
| 58,424 | Merck & Co., Inc. | 6,742 | ||||||
| 6,434 | Organon & Co. | 134 | ||||||
| 99,288 | Pfizer, Inc. | 3,642 | ||||||
| 8,046 | Viatris, Inc. | 80 | ||||||
| 29,154 | ||||||||
Professional Services — 1.33% | ||||||||
| 26,820 | CoStar Group, Inc.(a) | 2,387 | ||||||
| 1,081 | Equifax, Inc. | 254 | ||||||
| 717 | Jacobs Solutions, Inc. | 85 | ||||||
| 1,829 | Leidos Holdings, Inc. | 162 | ||||||
| 6,910 | Paychex, Inc. | 773 | ||||||
| 8,321 | Paycom Software, Inc. | 2,674 | ||||||
| 825 | Robert Half International, Inc. | 62 | ||||||
| 10,910 | Verisk Analytics, Inc. | 2,466 | ||||||
| 8,863 | ||||||||
Real Estate Management & Development — 0.12% | ||||||||
| 1,691 | CBRE Group, Inc., Class - A(a) | 136 | ||||||
| 2,009 | Jones Lang LaSalle, Inc.(a) | 313 | ||||||
| 4,563 | The Howard Hughes Corp.(a) | 361 | ||||||
| 810 | ||||||||
Residential REITs — 0.34% | ||||||||
| 3,688 | American Homes 4 Rent, Class - A | 131 | ||||||
| 7,024 | Camden Property Trust | 764 | ||||||
| 2,122 | Equity LifeStyle Properties, Inc. | 142 | ||||||
| 507 | Essex Property Trust, Inc. | 119 | ||||||
See accompanying notes to financial statements.
40
HC CAPITAL TRUST
The Value Equity Portfolio
Portfolio of Investments (continued) — June 30, 2023
Shares | Security Description | Value | ||||||
Common Stocks (continued) | ||||||||
Residential REITs (continued) | ||||||||
| 10,627 | Invitation Homes, Inc. | $ | 365 | |||||
| 2,029 | Mid-America Apartment Communities, Inc. | 308 | ||||||
| 1,913 | Sun Communities, Inc. | 250 | ||||||
| 4,609 | UDR, Inc. | 198 | ||||||
| 2,277 | ||||||||
Retail REITs — 0.33% | ||||||||
| 27,975 | Brixmor Property Group, Inc. | 615 | ||||||
| 19,572 | Realty Income Corp. | 1,171 | ||||||
| 35,601 | The Macerich Co. | 401 | ||||||
| 2,187 | ||||||||
Semiconductors & Semiconductor Equipment — 6.27% | ||||||||
| 11,746 | Advanced Micro Devices, Inc.(a) | 1,338 | ||||||
| 3,728 | Analog Devices, Inc. | 726 | ||||||
| 21,151 | Applied Materials, Inc. | 3,057 | ||||||
| 2,918 | Broadcom, Inc. | 2,531 | ||||||
| 7,850 | Enphase Energy, Inc.(a) | 1,315 | ||||||
| 63,964 | Intel Corp. | 2,139 | ||||||
| 3,090 | KLA Corp. | 1,499 | ||||||
| 1,129 | Lam Research Corp. | 726 | ||||||
| 6,026 | Marvell Technology, Inc. | 360 | ||||||
| 2,758 | Micron Technology, Inc. | 174 | ||||||
| 50,260 | NVIDIA Corp. | 21,262 | ||||||
| 7,270 | QUALCOMM, Inc. | 865 | ||||||
| 3,842 | Skyworks Solutions, Inc. | 425 | ||||||
| 23,905 | Texas Instruments, Inc. | 4,303 | ||||||
| 6,964 | Universal Display Corp. | 1,004 | ||||||
| 41,724 | ||||||||
Software — 11.03% | ||||||||
| 12,361 | Adobe, Inc.(a) | 6,044 | ||||||
| 10,190 | Autodesk, Inc.(a) | 2,085 | ||||||
| 512 | Dolby Laboratories, Inc., Class - A | 43 | ||||||
| 27,227 | Manhattan Associates, Inc.(a) | 5,442 | ||||||
| 139,124 | Microsoft Corp. | 47,377 | ||||||
| 56,988 | Oracle Corp. | 6,787 | ||||||
| 41 | Roper Technologies, Inc. | 20 | ||||||
| 3,137 | Salesforce, Inc.(a) | 663 | ||||||
| 8,243 | ServiceNow, Inc.(a) | 4,632 | ||||||
| 668 | Synopsys, Inc.(a) | 291 | ||||||
| 73,384 | ||||||||
Specialized REITs — 0.96% | ||||||||
| 5,297 | American Tower Corp. | 1,027 | ||||||
| 2,473 | Crown Castle, Inc. | 282 | ||||||
| 5,913 | CubeSmart | 264 | ||||||
| 9,861 | Digital Realty Trust, Inc. | 1,123 | ||||||
| 1,956 | Equinix, Inc. | 1,533 | ||||||
| 2,294 | Extra Space Storage, Inc. | 341 | ||||||
| 5,259 | Iron Mountain, Inc. | 299 | ||||||
Shares | Security Description | Value | ||||||
Specialized REITs (continued) | ||||||||
| 846 | Lamar Advertising Co., Class - A | $ | 84 | |||||
| 3,183 | Life Storage, Inc. | 423 | ||||||
| 2,688 | Public Storage | 785 | ||||||
| 8,362 | VICI Properties, Inc. | 263 | ||||||
| 6,424 | ||||||||
Specialty Retail — 2.41% | ||||||||
| 2,829 | AutoNation, Inc.(a) | 466 | ||||||
| 22 | AutoZone, Inc.(a) | 55 | ||||||
| 6,524 | Bath & Body Works, Inc. | 245 | ||||||
| 7,757 | Best Buy Co., Inc. | 636 | ||||||
| 4,609 | Dick’s Sporting Goods, Inc. | 609 | ||||||
| 923 | Five Below, Inc.(a) | 181 | ||||||
| 36,426 | Floor & Decor Holdings, Inc., Class - A(a) | 3,787 | ||||||
| 3,541 | Lowe’s Cos., Inc. | 799 | ||||||
| 7,287 | Penske Automotive Group, Inc. | 1,214 | ||||||
| 17,296 | The Home Depot, Inc. | 5,373 | ||||||
| 21,249 | The TJX Cos., Inc. | 1,802 | ||||||
| 2,059 | Tractor Supply Co. | 455 | ||||||
| 2,174 | Victoria’s Secret & Co.(a) | 38 | ||||||
| 3,016 | Williams-Sonoma, Inc. | 377 | ||||||
| 16,037 | ||||||||
Technology Hardware, Storage & Peripherals — 8.32% | ||||||||
| 271,276 | Apple, Inc. | 52,620 | ||||||
| 83,952 | HP, Inc. | 2,578 | ||||||
| 2,448 | NetApp, Inc. | 187 | ||||||
| 55,385 | ||||||||
Textiles, Apparel & Luxury Goods — 0.27% | ||||||||
| 6,619 | Capri Holdings Ltd.(a) | 238 | ||||||
| 9,230 | NIKE, Inc., Class - B | 1,018 | ||||||
| 1,533 | Ralph Lauren Corp. | 189 | ||||||
| 7,801 | Tapestry, Inc. | 334 | ||||||
| 1,779 | ||||||||
Tobacco — 0.34% | ||||||||
| 36,600 | Altria Group, Inc. | 1,658 | ||||||
| 6,325 | Philip Morris International, Inc. | 617 | ||||||
| 2,275 | ||||||||
Trading Companies & Distributors — 0.41% | ||||||||
| 13,428 | Fastenal Co. | 792 | ||||||
| 1,130 | Watsco, Inc. | 431 | ||||||
| 8,335 | WESCO International, Inc. | 1,493 | ||||||
| 2,716 | ||||||||
Water Utilities — 0.03% | ||||||||
| 1,178 | American Water Works Co., Inc. | 168 | ||||||
Wireless Telecommunication Services — 0.49% | ||||||||
| 23,667 | T-Mobile US, Inc.(a) | 3,287 | ||||||
Total Common Stocks | 663,941 | |||||||
See accompanying notes to financial statements.
41
HC CAPITAL TRUST
The Value Equity Portfolio
Portfolio of Investments (concluded) — June 30, 2023
Shares | Security Description | Value | ||||||
Investment Companies — 0.32% | ||||||||
| 560,476 | Federated Hermes Treasury Obligations Fund, Institutional Shares, 4.75%^^(b) | $ | 560 | |||||
| 1,559,905 | State Street Institutional Treasury Plus Money Market Fund, Trust Class, 4.97%(b) | 1,560 | ||||||
Total Investment Companies | 2,120 | |||||||
Total Investments (cost $286,046) — 100.04% | 666,061 | |||||||
Liabilities in excess of other assets — (0.04)% | (254 | ) | ||||||
Net Assets — 100.00% | $ | 665,807 | ||||||
^ | All or part of this security was on loan as of June 30, 2023. |
^^ | Purchased with cash collateral held from securities lending. The value of the collateral could include collateral held for securities that were sold on or before June 30, 2023. |
(a) | Represents non-income producing security. |
(b) | Annualized 7-day yield as of period-end. |
(c) | The security was valued using significant unobservable inputs as of June 30, 2023. |
REIT—Real Estate Investment Trust |
As of June 30, 2023, 100% of the Portfolio’s net assets were managed by Parametric Portfolio Associates, LLC. |
See accompanying notes to financial statements.
42
HC CAPITAL TRUST
The Growth Equity Portfolio
Portfolio of Investments — June 30, 2023
Shares | Security Description | Value | ||||||
Common Stocks — 99.79% | ||||||||
Aerospace & Defense — 0.83% | ||||||||
| 5,461 | General Dynamics Corp. | $ | 1,175 | |||||
| 391 | HEICO Corp. | 69 | ||||||
| 728 | HEICO Corp., Class - A | 102 | ||||||
| 4,826 | L3Harris Technologies, Inc. | 945 | ||||||
| 1,511 | Northrop Grumman Corp. | 689 | ||||||
| 33,522 | Raytheon Technologies Corp. | 3,284 | ||||||
| 475 | TransDigm Group, Inc. | 425 | ||||||
| 6,689 | ||||||||
Air Freight & Logistics — 0.09% | ||||||||
| 4,946 | Expeditors International of Washington, Inc. | 599 | ||||||
| 1,658 | GXO Logistics, Inc.(a) | 104 | ||||||
| 703 | ||||||||
Automobile Components — 2.20% | ||||||||
| 71,725 | Ford Motor Co. | 1,085 | ||||||
| 12,720 | Mobileye Global, Inc., Class - A^(a) | 489 | ||||||
| 77,833 | Rivian Automotive, Inc., Class - A(a) | 1,297 | ||||||
| 56,731 | Tesla, Inc.(a) | 14,850 | ||||||
| 17,721 | ||||||||
Automobiles — 0.19% | ||||||||
| 123,477 | Dr. Ing hc F Porsche AG, ADR | 1,532 | ||||||
Banks — 1.44% | ||||||||
| 10,612 | Bank of America Corp. | 304 | ||||||
| 13,206 | Bank OZK | 530 | ||||||
| 13,240 | Citizens Financial Group, Inc. | 345 | ||||||
| 40,559 | Comerica, Inc. | 1,718 | ||||||
| 1,150 | Cullen/Frost Bankers, Inc. | 124 | ||||||
| 29,928 | East West Bancorp, Inc. | 1,580 | ||||||
| 86,090 | First Horizon Corp. | 970 | ||||||
| 36,888 | Huntington Bancshares, Inc. | 398 | ||||||
| 23,824 | JPMorgan Chase & Co. | 3,466 | ||||||
| 106,556 | Regions Financial Corp. | 1,899 | ||||||
| 10,848 | Zions Bancorp NA | 291 | ||||||
| 11,625 | ||||||||
Beverages — 1.41% | ||||||||
| 7,236 | Brown-Forman Corp., Class - B | 483 | ||||||
| 17,862 | Monster Beverage Corp.(a) | 1,026 | ||||||
| 29,046 | PepsiCo, Inc. | 5,380 | ||||||
| 74,917 | The Coca-Cola Co. | 4,512 | ||||||
| 11,401 | ||||||||
Biotechnology — 1.56% | ||||||||
| 9,107 | Alnylam Pharmaceuticals, Inc.(a) | 1,730 | ||||||
| 15,151 | Amgen, Inc. | 3,365 | ||||||
| 19,253 | Moderna, Inc.(a) | 2,339 | ||||||
| 14,430 | Natera, Inc.(a) | 702 | ||||||
| 800 | Neurocrine Biosciences, Inc.(a) | 75 | ||||||
| 2,019 | Regeneron Pharmaceuticals, Inc.(a) | 1,451 | ||||||
Shares | Security Description | Value | ||||||
Biotechnology (continued) | ||||||||
| 1,014 | Seagen, Inc.(a) | $ | 195 | |||||
| 7,673 | Vertex Pharmaceuticals, Inc.(a) | 2,700 | ||||||
| 12,557 | ||||||||
Broadline Retail — 4.55% | ||||||||
| 255,200 | Amazon.com, Inc.(a) | 33,268 | ||||||
| 2,900 | MercadoLibre, Inc.(a) | 3,435 | ||||||
| 36,703 | ||||||||
Building Products — 0.25% | ||||||||
| 404 | Armstrong World Industries, Inc. | 30 | ||||||
| 17,452 | Carrier Global Corp. | 868 | ||||||
| 50,415 | Resideo Technologies, Inc.(a) | 890 | ||||||
| 1,218 | Trane Technologies PLC | 233 | ||||||
| 2,021 | ||||||||
Capital Markets — 2.40% | ||||||||
| 2,335 | Cboe Global Markets, Inc. | 322 | ||||||
| 6,242 | CME Group, Inc. | 1,157 | ||||||
| 1,203 | FactSet Research Systems, Inc. | 482 | ||||||
| 2,582 | Intercontinental Exchange, Inc. | 292 | ||||||
| 143,372 | Invesco Ltd. | 2,411 | ||||||
| 18,395 | Janus Henderson Group PLC | 501 | ||||||
| 713 | LPL Financial Holdings, Inc. | 155 | ||||||
| 349 | MarketAxess Holdings, Inc. | 91 | ||||||
| 3,942 | Moody’s Corp. | 1,370 | ||||||
| 31,488 | Morgan Stanley | 2,690 | ||||||
| 390 | Morningstar, Inc. | 76 | ||||||
| 838 | MSCI, Inc. | 393 | ||||||
| 36,398 | Robinhood Markets, Inc., Class - A(a) | 363 | ||||||
| 11,523 | S&P Global, Inc. | 4,620 | ||||||
| 2,032 | T. Rowe Price Group, Inc. | 228 | ||||||
| 16,324 | The Charles Schwab Corp. | 925 | ||||||
| 10,168 | The Goldman Sachs Group, Inc. | 3,279 | ||||||
| 19,355 | ||||||||
Chemicals — 1.57% | ||||||||
| 3,430 | Air Products & Chemicals, Inc. | 1,027 | ||||||
| 13,075 | CF Industries Holdings, Inc. | 908 | ||||||
| 30,407 | Ecolab, Inc. | 5,677 | ||||||
| 999 | FMC Corp. | 104 | ||||||
| 28,629 | LyondellBasell Industries N.V., Class - A | 2,629 | ||||||
| 19,809 | The Chemours Co. | 731 | ||||||
| 5,811 | The Scotts Miracle-Gro Co. | 364 | ||||||
| 4,752 | The Sherwin-Williams Co. | 1,262 | ||||||
| 12,702 | ||||||||
Commercial Services & Supplies — 0.31% | ||||||||
| 1,845 | Cintas Corp. | 917 | ||||||
| 13,304 | Copart, Inc.(a) | 1,214 | ||||||
| 2,752 | Waste Connections, Inc. | 393 | ||||||
| 2,524 | ||||||||
See accompanying notes to financial statements.
43
HC CAPITAL TRUST
The Growth Equity Portfolio
Portfolio of Investments (continued) — June 30, 2023
Shares | Security Description | Value | ||||||
Common Stocks (continued) | ||||||||
Communications Equipment — 0.77% | ||||||||
| 4,776 | Arista Networks, Inc.(a) | $ | 774 | |||||
| 101,754 | Cisco Systems, Inc. | 5,264 | ||||||
| 825 | F5, Inc.(a) | 121 | ||||||
| 153 | Motorola Solutions, Inc. | 45 | ||||||
| 6,204 | ||||||||
Construction & Engineering — 0.01% | ||||||||
| 374 | Quanta Services, Inc. | 73 | ||||||
Consumer Finance — 0.40% | ||||||||
| 5,215 | American Express Co. | 908 | ||||||
| 95 | Credit Acceptance Corp.(a) | 48 | ||||||
| 141,214 | SLM Corp. | 2,305 | ||||||
| 3,261 | ||||||||
Consumer Staples Distribution & Retail — 1.79% | ||||||||
| 16,376 | Costco Wholesale Corp. | 8,817 | ||||||
| 939 | Dollar General Corp. | 159 | ||||||
| 4,517 | Dollar Tree, Inc.(a) | 648 | ||||||
| 8,706 | Sysco Corp. | 646 | ||||||
| 1,413 | Walgreens Boots Alliance, Inc. | 40 | ||||||
| 26,416 | Walmart, Inc. | 4,152 | ||||||
| 14,462 | ||||||||
Containers & Packaging — 0.14% | ||||||||
| 1,280 | AptarGroup, Inc. | 148 | ||||||
| 747 | Avery Dennison Corp. | 128 | ||||||
| 841 | Packaging Corp. of America | 111 | ||||||
| 14,972 | Silgan Holdings, Inc. | 703 | ||||||
| 1,090 | ||||||||
Distributors — 0.08% | ||||||||
| 2,966 | Genuine Parts Co. | 502 | ||||||
| 381 | Pool Corp. | 143 | ||||||
| 645 | ||||||||
Diversified Consumer Services — 0.01% | ||||||||
| 1,727 | Service Corp. International | 112 | ||||||
Diversified Telecommunication Services — 0.05% | ||||||||
| 19,561 | Frontier Communications Parent, Inc.(a) | 365 | ||||||
| 4,099 | GCI Liberty, Inc.(c) | — | ||||||
| 365 | ||||||||
Electric Utilities — 0.80% | ||||||||
| 15,796 | Edison International | 1,097 | ||||||
| 60,365 | FirstEnergy Corp. | 2,347 | ||||||
| 23,487 | Hawaiian Electric Industries, Inc. | 850 | ||||||
| 4,256 | NextEra Energy, Inc. | 316 | ||||||
| 36,550 | NRG Energy, Inc. | 1,367 | ||||||
| 12,422 | OGE Energy Corp. | 446 | ||||||
| 6,423 | ||||||||
Electrical Equipment — 0.38% | ||||||||
| 5,157 | AMETEK, Inc. | 835 | ||||||
Shares | Security Description | Value | ||||||
Electrical Equipment (continued) | ||||||||
| 13,294 | Emerson Electric Co. | $ | 1,202 | |||||
| 1,210 | Hubbell, Inc. | 401 | ||||||
| 931 | Rockwell Automation, Inc. | 307 | ||||||
| 16,257 | Sunrun, Inc.(a) | 290 | ||||||
| 3,035 | ||||||||
Electronic Equipment, Instruments & Components — 0.15% | ||||||||
| 12,210 | Amphenol Corp., Class - A | 1,038 | ||||||
| 2,343 | Vontier Corp. | 75 | ||||||
| 376 | Zebra Technologies Corp.(a) | 111 | ||||||
| 1,224 | ||||||||
Entertainment — 0.68% | ||||||||
| 10,160 | Netflix, Inc.(a) | 4,476 | ||||||
| 8,578 | ROBLOX Corp., Class - A(a) | 346 | ||||||
| 9,543 | Roku, Inc.(a) | 610 | ||||||
| 248 | The Walt Disney Co.(a) | 22 | ||||||
| 5,454 | ||||||||
Financial Services — 5.52% | ||||||||
| 18,726 | Berkshire Hathaway, Inc., Class - B(a) | 6,385 | ||||||
| 34,972 | Equitable Holdings, Inc. | 950 | ||||||
| 756 | Fiserv, Inc.(a) | 95 | ||||||
| 1,270 | FleetCor Technologies, Inc.(a) | 319 | ||||||
| 7,975 | Global Payments, Inc. | 786 | ||||||
| 17,081 | Mastercard, Inc., Class - A | 6,718 | ||||||
| 34,688 | PayPal Holdings, Inc.(a) | 2,315 | ||||||
| 103,892 | Visa, Inc., Class - A | 24,671 | ||||||
| 31,527 | Voya Financial, Inc. | 2,261 | ||||||
| 44,500 | ||||||||
Food Products — 0.97% | ||||||||
| 70,463 | Conagra Brands, Inc. | 2,376 | ||||||
| 5,224 | Hormel Foods Corp. | 210 | ||||||
| 413 | Lamb Weston Holdings, Inc. | 47 | ||||||
| 5,092 | McCormick & Co., Inc./MD | 444 | ||||||
| 56,218 | Mondelez International, Inc., Class - A | 4,102 | ||||||
| 1,045 | The Hershey Co. | 261 | ||||||
| 2,332 | The J.M. Smucker Co. | 344 | ||||||
| 7,784 | ||||||||
Gas Utilities — 0.21% | ||||||||
| 33,223 | National Fuel Gas Co. | 1,706 | ||||||
Ground Transportation — 1.63% | ||||||||
| 124,263 | CSX Corp. | 4,237 | ||||||
| 1,274 | Landstar System, Inc. | 245 | ||||||
| 562 | Old Dominion Freight Line, Inc. | 208 | ||||||
| 70,316 | Uber Technologies, Inc.(a) | 3,036 | ||||||
| 916 | U-Haul Holding Co. | 51 | ||||||
| 8,244 | U-Haul Holding Co. | 418 | ||||||
| 24,231 | Union Pacific Corp. | 4,958 | ||||||
| 13,153 | ||||||||
See accompanying notes to financial statements.
44
HC CAPITAL TRUST
The Growth Equity Portfolio
Portfolio of Investments (continued) —June 30, 2023)
Shares | Security Description | Value | ||||||
Common Stocks (continued) | ||||||||
Health Care Equipment & Supplies — 2.59% | ||||||||
| 34,185 | Abbott Laboratories | $ | 3,726 | |||||
| 10,657 | Baxter International, Inc. | 486 | ||||||
| 4,799 | Becton Dickinson & Co. | 1,267 | ||||||
| 10,892 | Boston Scientific Corp.(a) | 589 | ||||||
| 15,756 | Dexcom, Inc.(a) | 2,025 | ||||||
| 15,477 | Edwards Lifesciences Corp.(a) | 1,460 | ||||||
| 1,344 | Embecta Corp. | 29 | ||||||
| 3,887 | GE HealthCare Technologies, Inc. | 316 | ||||||
| 2,690 | IDEXX Laboratories, Inc.(a) | 1,351 | ||||||
| 15,494 | Intuitive Surgical, Inc.(a) | 5,298 | ||||||
| 4,072 | ResMed, Inc. | 890 | ||||||
| 9,642 | Stryker Corp. | 2,942 | ||||||
| 3,346 | Zimmer Biomet Holdings, Inc. | 487 | ||||||
| 20,866 | ||||||||
Health Care Providers & Services — 2.70% | ||||||||
| 22,388 | Acadia Healthcare Co., Inc.(a) | 1,783 | ||||||
| 1,650 | Centene Corp.(a) | 111 | ||||||
| 22,394 | CVS Health Corp. | 1,548 | ||||||
| 5,215 | Elevance Health, Inc. | 2,317 | ||||||
| 3,283 | Henry Schein, Inc.(a) | 266 | ||||||
| 1,952 | Laboratory Corporation of America Holdings | 471 | ||||||
| 4,595 | McKesson Corp. | 1,963 | ||||||
| 2,799 | Quest Diagnostics, Inc. | 393 | ||||||
| 26,926 | UnitedHealth Group, Inc. | 12,943 | ||||||
| 21,795 | ||||||||
Health Care REITs — 0.28% | ||||||||
| 10,405 | Omega Healthcare Investors, Inc. | 319 | ||||||
| 40,605 | Ventas, Inc. | 1,920 | ||||||
| 2,239 | ||||||||
Health Care Technology — 0.06% | ||||||||
| 2,596 | Veeva Systems, Inc., Class - A(a) | 513 | ||||||
Hotels, Restaurants & Leisure — 2.33% | ||||||||
| 14,944 | Airbnb, Inc., Class - A(a) | 1,915 | ||||||
| 1,179 | Booking Holdings, Inc.(a) | 3,184 | ||||||
| 31,802 | Carnival Corp.(a) | 599 | ||||||
| 568 | Chipotle Mexican Grill, Inc.(a) | 1,215 | ||||||
| 1,046 | Choice Hotels International, Inc. | 123 | ||||||
| 9,159 | Marriott International, Inc., Class - A | 1,683 | ||||||
| 1,090 | McDonald’s Corp. | 325 | ||||||
| 98,020 | Starbucks Corp. | 9,709 | ||||||
| 310 | Vail Resorts, Inc. | 78 | ||||||
| 18,831 | ||||||||
Household Durables — 0.03% | ||||||||
| 2,470 | Garmin Ltd. | 258 | ||||||
Household Products — 1.10% | ||||||||
| 5,143 | Church & Dwight Co., Inc. | 515 | ||||||
| 9,514 | Colgate-Palmolive Co. | 733 | ||||||
Shares | Security Description | Value | ||||||
Household Products (continued) | ||||||||
| 7,129 | Kimberly-Clark Corp. | $ | 984 | |||||
| 2,554 | The Clorox Co. | 406 | ||||||
| 41,123 | The Procter & Gamble Co. | 6,241 | ||||||
| 8,879 | ||||||||
Independent Power and Renewable Electricity Producers — 0.17% | ||||||||
| 51,268 | Vistra Corp. | 1,346 | ||||||
Industrial Conglomerates — 0.42% | ||||||||
| 12,543 | 3M Co. | 1,255 | ||||||
| 11,662 | General Electric Co. | 1,281 | ||||||
| 4,278 | Honeywell International, Inc. | 888 | ||||||
| 3,424 | ||||||||
Insurance — 1.99% | ||||||||
| 9,715 | Aflac, Inc. | 678 | ||||||
| 7,992 | Aon PLC, Class - A | 2,759 | ||||||
| 1,155 | Arthur J. Gallagher & Co. | 254 | ||||||
| 16,505 | Axis Capital Holdings Ltd. | 888 | ||||||
| 11,297 | Chubb Ltd. | 2,175 | ||||||
| 171 | Erie Indemnity Co., Class - A | 36 | ||||||
| 43,476 | Lincoln National Corp. | 1,120 | ||||||
| 11,845 | Marsh & McLennan Cos., Inc. | 2,228 | ||||||
| 22,534 | Principal Financial Group, Inc. | 1,709 | ||||||
| 4,893 | Prudential Financial, Inc. | 432 | ||||||
| 7,591 | Reinsurance Group of America, Inc. | 1,053 | ||||||
| 5,565 | The Progressive Corp. | 737 | ||||||
| 6,974 | The Travelers Cos., Inc. | 1,211 | ||||||
| 15,794 | Unum Group | 753 | ||||||
| 16,033 | ||||||||
Interactive Media & Services — 5.66% | ||||||||
| 119,386 | Alphabet, Inc., Class - A(a) | 14,290 | ||||||
| 161,143 | Alphabet, Inc., Class - C(a) | 19,492 | ||||||
| 646 | IAC, Inc.(a) | 41 | ||||||
| 1,412 | Match Group, Inc.(a) | 59 | ||||||
| 41,101 | Meta Platforms, Inc., Class - A(a) | 11,796 | ||||||
| 45,678 | ||||||||
IT Services — 1.10% | ||||||||
| 12,354 | Accenture PLC, Class - A | 3,812 | ||||||
| 2,241 | Cognizant Technology Solutions Corp., Class - A | 146 | ||||||
| 3,516 | MongoDB, Inc.(a) | 1,445 | ||||||
| 18,740 | Okta, Inc.(a) | 1,300 | ||||||
| 12,281 | Snowflake, Inc., Class - A(a) | 2,161 | ||||||
| 8,864 | ||||||||
Leisure Products — 0.02% | ||||||||
| 1,422 | Polaris, Inc. | 172 | ||||||
Life Sciences Tools & Services — 1.22% | ||||||||
| 4,564 | Bio-Techne Corp. | 373 | ||||||
| 440 | Bruker Corp. | 33 | ||||||
| 11,718 | Danaher Corp. | 2,812 | ||||||
See accompanying notes to financial statements.
45
HC CAPITAL TRUST
The Growth Equity Portfolio
Portfolio of Investments (continued) — June 30, 2023
Shares | Security Description | Value | ||||||
Common Stocks (continued) | ||||||||
Life Sciences Tools & Services (continued) | ||||||||
| 758 | Mettler-Toledo International, Inc.(a) | $ | 994 | |||||
| 239 | Revvity, Inc. | 28 | ||||||
| 9,568 | Thermo Fisher Scientific, Inc. | 4,992 | ||||||
| 2,297 | Waters Corp.(a) | 612 | ||||||
| 9,844 | ||||||||
Machinery — 1.63% | ||||||||
| 9,555 | Caterpillar, Inc. | 2,351 | ||||||
| 4,840 | Deere & Co. | 1,961 | ||||||
| 3,369 | Dover Corp. | 497 | ||||||
| 5,857 | Fortive Corp. | 438 | ||||||
| 1,569 | Graco, Inc. | 135 | ||||||
| 2,179 | IDEX Corp. | 469 | ||||||
| 8,257 | Illinois Tool Works, Inc. | 2,066 | ||||||
| 6,973 | Ingersoll Rand, Inc. | 456 | ||||||
| 506 | Nordson Corp. | 126 | ||||||
| 8,726 | Otis Worldwide Corp. | 777 | ||||||
| 11,372 | The Middleby Corp.(a) | 1,681 | ||||||
| 927 | The Toro Co. | 94 | ||||||
| 14,765 | Westinghouse Air Brake Technologies Corp. | 1,619 | ||||||
| 4,438 | Xylem, Inc. | 500 | ||||||
| 13,170 | ||||||||
Media — 0.68% | ||||||||
| 242,458 | DISH Network Corp., Class - A(a) | 1,598 | ||||||
| 4,935 | Omnicom Group, Inc. | 470 | ||||||
| 105,145 | Paramount Global, Class - B | 1,672 | ||||||
| 17,241 | The Interpublic Group of Cos., Inc. | 665 | ||||||
| 13,683 | The Trade Desk, Inc., Class - A(a) | 1,057 | ||||||
| 5,462 | ||||||||
Metals & Mining — 0.04% | ||||||||
| 12,963 | United States Steel Corp. | 324 | ||||||
Mortgage Real Estate Investment Trusts — 0.26% | ||||||||
| 183,185 | Rithm Capital Corp. | 1,713 | ||||||
| 20,515 | Starwood Property Trust, Inc. | 398 | ||||||
| 2,111 | ||||||||
Multi-Utilities — 0.52% | ||||||||
| 84,210 | CenterPoint Energy, Inc. | 2,455 | ||||||
| 15,797 | DTE Energy Co. | 1,738 | ||||||
| 4,193 | ||||||||
Oil, Gas & Consumable Fuels — 2.92% | ||||||||
| 54,988 | Antero Midstream Corp. | 638 | ||||||
| 24,368 | ConocoPhillips | 2,525 | ||||||
| 79,339 | Devon Energy Corp. | 3,836 | ||||||
| 7,898 | DT Midstream, Inc. | 392 | ||||||
| 21,212 | EQT Corp. | 872 | ||||||
| 31,930 | Exxon Mobil Corp. | 3,424 | ||||||
| 114,575 | Marathon Oil Corp. | 2,638 | ||||||
Shares | Security Description | Value | ||||||
Oil, Gas & Consumable Fuels (continued) | ||||||||
| 13,944 | ONEOK, Inc. | $ | 861 | |||||
| 4,640 | Pioneer Natural Resources Co. | 961 | ||||||
| 95,111 | Range Resources Corp. | 2,796 | ||||||
| 28,597 | Targa Resources Corp. | 2,176 | ||||||
| 73,536 | The Williams Cos., Inc. | 2,399 | ||||||
| 23,518 | ||||||||
Passenger Airlines — 0.18% | ||||||||
| 10,129 | Alaska Air Group, Inc.(a) | 539 | ||||||
| 18,665 | Delta Air Lines, Inc.(a) | 887 | ||||||
| 1,426 | ||||||||
Personal Care Products — 0.42% | ||||||||
| 23,041 | L’Oreal SA, ADR | 2,151 | ||||||
| 6,209 | The Estee Lauder Cos., Inc. | 1,219 | ||||||
| 3,370 | ||||||||
Pharmaceuticals — 4.68% | ||||||||
| 33,606 | AstraZeneca PLC, ADR | 2,405 | ||||||
| 32,406 | Eli Lilly & Co. | 15,197 | ||||||
| 31,287 | Johnson & Johnson | 5,179 | ||||||
| 55,581 | Merck & Co., Inc. | 6,413 | ||||||
| 46,272 | Novo Nordisk A/S, ADR | 7,489 | ||||||
| 5,558 | Organon & Co. | 116 | ||||||
| 11,882 | Viatris, Inc. | 119 | ||||||
| 4,740 | Zoetis, Inc. | 816 | ||||||
| 37,734 | ||||||||
Professional Services — 2.11% | ||||||||
| 120,103 | Adyen N.V., ADR(a) | 2,077 | ||||||
| 57,727 | Automatic Data Processing, Inc. | 12,688 | ||||||
| 2,371 | Broadridge Financial Solutions, Inc. | 393 | ||||||
| 3,010 | CoStar Group, Inc.(a) | 268 | ||||||
| 2,353 | Equifax, Inc. | 554 | ||||||
| 1,598 | Jack Henry & Associates, Inc. | 267 | ||||||
| 1,391 | SS&C Technologies Holdings, Inc. | 84 | ||||||
| 2,931 | Verisk Analytics, Inc. | 662 | ||||||
| 16,993 | ||||||||
Real Estate Management & Development — 0.01% | ||||||||
| 1,272 | CBRE Group, Inc., Class - A(a) | 103 | ||||||
Residential REITs — 0.01% | ||||||||
| 1,608 | Equity LifeStyle Properties, Inc. | 108 | ||||||
Retail REITs — 0.09% | ||||||||
| 52,271 | SITE Centers Corp. | 691 | ||||||
Semiconductors & Semiconductor Equipment — 7.51% | ||||||||
| 121,355 | Advanced Micro Devices, Inc.(a) | 13,824 | ||||||
| 8,866 | Analog Devices, Inc. | 1,727 | ||||||
| 6,209 | Applied Materials, Inc. | 897 | ||||||
| 2,254 | ASML Holding N.V., NYS | 1,634 | ||||||
| 8,693 | Broadcom, Inc. | 7,541 | ||||||
| 4,234 | First Solar, Inc.(a) | 805 | ||||||
See accompanying notes to financial statements.
46
HC CAPITAL TRUST
The Growth Equity Portfolio
Portfolio of Investments (continued) — June 30, 2023
Shares | Security Description | Value | ||||||
Common Stocks (continued) | ||||||||
Semiconductors & Semiconductor Equipment (continued) | ||||||||
| 63,448 | Intel Corp. | $ | 2,122 | |||||
| 1,378 | KLA Corp. | 668 | ||||||
| 1,153 | Lam Research Corp. | 741 | ||||||
| 28,189 | Marvell Technology, Inc. | 1,685 | ||||||
| 3,708 | Microchip Technology, Inc. | 332 | ||||||
| 20,662 | Micron Technology, Inc. | 1,304 | ||||||
| 55,312 | NVIDIA Corp. | 23,397 | ||||||
| 3,257 | ON Semiconductor Corp.(a) | 308 | ||||||
| 30,091 | QUALCOMM, Inc. | 3,582 | ||||||
| 60,567 | ||||||||
Software — 12.99% | ||||||||
| 12,173 | Adobe, Inc.(a) | 5,952 | ||||||
| 1,974 | ANSYS, Inc.(a) | 652 | ||||||
| 908 | Atlassian Corp., Class - A(a) | 152 | ||||||
| 8,057 | Cadence Design Systems, Inc.(a) | 1,890 | ||||||
| 8,581 | Crowdstrike Holdings, Inc., Class - A(a) | 1,260 | ||||||
| 6,515 | Fortinet, Inc.(a) | 492 | ||||||
| 5,422 | Intuit, Inc. | 2,484 | ||||||
| 190,517 | Microsoft Corp. | 64,879 | ||||||
| 63,347 | Oracle Corp. | 7,544 | ||||||
| 1,131 | Palo Alto Networks, Inc.(a) | 289 | ||||||
| 2,476 | Roper Technologies, Inc. | 1,190 | ||||||
| 73,299 | Salesforce, Inc.(a) | 15,485 | ||||||
| 3,662 | ServiceNow, Inc.(a) | 2,058 | ||||||
| 151 | Synopsys, Inc.(a) | 66 | ||||||
| 1,628 | VMware, Inc., Class - A(a) | 234 | ||||||
| 566 | Workday, Inc., Class - A(a) | 128 | ||||||
| 104,755 | ||||||||
Specialized REITs — 1.79% | ||||||||
| 9,920 | American Tower Corp. | 1,924 | ||||||
| 16,012 | Equinix, Inc. | 12,552 | ||||||
| 14,476 | ||||||||
Specialty Retail — 3.36% | ||||||||
| 854 | Advance Auto Parts, Inc. | 60 | ||||||
| 597 | AutoZone, Inc.(a) | 1,489 | ||||||
| 5,882 | Best Buy Co., Inc. | 482 | ||||||
| 376 | Burlington Stores, Inc.(a) | 59 | ||||||
| 41,191 | Lowe’s Cos., Inc. | 9,297 | ||||||
| 3,982 | O’Reilly Automotive, Inc.(a) | 3,804 | ||||||
| 9,045 | Ross Stores, Inc. | 1,014 | ||||||
| 10,308 | The Home Depot, Inc. | 3,202 | ||||||
| 66,781 | The TJX Cos., Inc. | 5,662 | ||||||
| 1,256 | Tractor Supply Co. | 278 | ||||||
| 3,810 | Ulta Beauty, Inc.(a) | 1,793 | ||||||
| 27,140 | ||||||||
Shares | Security Description | Value | ||||||
Technology Hardware, Storage & Peripherals — 8.01% | ||||||||
| 333,258 | Apple, Inc. | $ | 64,641 | |||||
Textiles, Apparel & Luxury Goods — 1.80% | ||||||||
| 960 | Kontoor Brands, Inc. | 40 | ||||||
| 10,941 | Lululemon Athletica, Inc.(a) | 4,141 | ||||||
| 24,331 | LVMH Moet Hennessy Louis Vuitton SE, ADR | 4,596 | ||||||
| 51,001 | NIKE, Inc., Class - B | 5,629 | ||||||
| 4,000 | V.F. Corp. | 76 | ||||||
| 14,482 | ||||||||
Tobacco — 0.21% | ||||||||
| 17,508 | Philip Morris International, Inc. | 1,709 | ||||||
Trading Companies & Distributors — 0.34% | ||||||||
| 23,095 | Air Lease Corp. | 967 | ||||||
| 14,448 | Fastenal Co. | 852 | ||||||
| 1,221 | W.W. Grainger, Inc. | 963 | ||||||
| 2,782 | ||||||||
Wireless Telecommunication Services — 0.17% | ||||||||
| 9,742 | T-Mobile US, Inc.(a) | 1,353 | ||||||
Total Common Stocks | 804,874 | |||||||
Investment Companies — 0.13% | ||||||||
| 484,792 | Federated Hermes Treasury Obligations Fund, Institutional Shares, 4.75%^^(b) | 485 | ||||||
| 584,020 | State Street Institutional Treasury Plus Money Market Fund, Trust Class, 4.97%(b) | 584 | ||||||
Total Investment Companies | 1,069 | |||||||
Total Investments (cost $241,521) — 99.92% | 805,943 | |||||||
Other assets in excess of liabilities — 0.08% | 637 | |||||||
Net Assets — 100.00% | $ | 806,580 | ||||||
^ | All or part of this security was on loan as of June 30, 2023. |
^^ | Purchased with cash collateral held from securities lending. The value of the collateral could include collateral held for securities that were sold on or before June 30, 2023. |
(a) | Represents non-income producing security. |
(b) | Annualized 7-day yield as of period-end. |
(c) | The security was valued using significant unobservable inputs as of June 30, 2023. |
ADR—American Depositary Receipt |
REIT—Real Estate Investment Trust |
See accompanying notes to financial statements.
47
HC CAPITAL TRUST
The Growth Equity Portfolio
Portfolio of Investments (concluded) — June 30, 2023
The following table reflects the percentage of total net assets of the Portfolio attributable to each Specialist Manager as of June 30, 2023.
The Growth Equity Portfolio | Jennison | Parametric | Total |
Common Stocks | 23.54% | 76.25% | 99.79% |
Investment Companies | 0.06% | 0.07% | 0.13% |
Other Assets (Liabilities) | — | 0.08% | 0.08% |
Total Net Assets | 23.60% | 76.40% | 100.00% |
Amounts designated as “—” indicate the Specialist Manager did not manage any holdings in that category.
See accompanying notes to financial statements.
48
HC CAPITAL TRUST
The Institutional U.S. Equity Portfolio
Portfolio of Investments — June 30, 2023
Shares | Security Description | Value | ||||||
Common Stocks — 92.17% | ||||||||
Aerospace & Defense — 1.31% | ||||||||
| 2,311 | Axon Enterprise, Inc.(a) | $ | 451 | |||||
| 692 | BWX Technologies, Inc. | 50 | ||||||
| 290 | Curtiss-Wright Corp. | 53 | ||||||
| 11,893 | General Dynamics Corp. | 2,558 | ||||||
| 1,585 | HEICO Corp. | 280 | ||||||
| 2,690 | HEICO Corp., Class - A | 378 | ||||||
| 636 | Hexcel Corp. | 48 | ||||||
| 13,628 | Howmet Aerospace, Inc. | 675 | ||||||
| 5,963 | Huntington Ingalls Industries, Inc. | 1,357 | ||||||
| 11,836 | L3Harris Technologies, Inc. | 2,317 | ||||||
| 10,198 | Lockheed Martin Corp. | 4,695 | ||||||
| 373 | Mercury Systems, Inc.(a) | 13 | ||||||
| 7,511 | Northrop Grumman Corp. | 3,424 | ||||||
| 54,477 | Raytheon Technologies Corp. | 5,337 | ||||||
| 791 | Spirit AeroSystems Holdings, Inc., Class - A | 23 | ||||||
| 7,235 | Textron, Inc. | 489 | ||||||
| 19,447 | The Boeing Co.(a) | 4,108 | ||||||
| 6,773 | TransDigm Group, Inc. | 6,057 | ||||||
| 440 | Woodward, Inc. | 52 | ||||||
| 32,365 | ||||||||
Air Freight & Logistics — 0.36% | ||||||||
| 10,427 | C.H. Robinson Worldwide, Inc. | 984 | ||||||
| 8,859 | Expeditors International of Washington, Inc. | 1,074 | ||||||
| 8,142 | FedEx Corp. | 2,018 | ||||||
| 884 | GXO Logistics, Inc.(a) | 56 | ||||||
| 26,001 | United Parcel Service, Inc., Class - B | 4,659 | ||||||
| 8,791 | ||||||||
Automobile Components — 1.74% | ||||||||
| 9,303 | Aptiv PLC(a) | 949 | ||||||
| 7,963 | BorgWarner, Inc. | 390 | ||||||
| 134,793 | Ford Motor Co. | 2,039 | ||||||
| 47,799 | General Motors Co. | 1,843 | ||||||
| 1,782 | Gentex Corp. | 52 | ||||||
| 1,020 | Harley-Davidson, Inc. | 36 | ||||||
| 1,938 | Lear Corp. | 278 | ||||||
| 29,796 | Lucid Group, Inc.(a) | 206 | ||||||
| 6,533 | Mobileye Global, Inc., Class - A^(a) | 251 | ||||||
| 1,955 | QuantumScape Corp.(a) | 16 | ||||||
| 20,790 | Rivian Automotive, Inc., Class - A(a) | 347 | ||||||
| 139,149 | Tesla, Inc.(a) | 36,424 | ||||||
| 392 | Thor Industries, Inc. | 41 | ||||||
| 42,872 | ||||||||
Automobiles — 0.03% | ||||||||
| 63,215 | Dr. Ing hc F Porsche AG, ADR | 784 | ||||||
Banks — 1.62% | ||||||||
| 246,410 | Bank of America Corp. | 7,071 | ||||||
| 848 | Bank OZK | 34 | ||||||
Shares | Security Description | Value | ||||||
Banks (continued) | ||||||||
| 220 | BOK Financial Corp. | $ | 18 | |||||
| 66,774 | Citigroup, Inc. | 3,075 | ||||||
| 16,111 | Citizens Financial Group, Inc. | 420 | ||||||
| 1,570 | Columbia Banking System, Inc. | 32 | ||||||
| 991 | Comerica, Inc. | 42 | ||||||
| 862 | Commerce Bancshares, Inc. | 42 | ||||||
| 442 | Cullen/Frost Bankers, Inc. | 48 | ||||||
| 1,073 | East West Bancorp, Inc. | 57 | ||||||
| 22,997 | Fifth Third Bancorp | 602 | ||||||
| 362 | First Citizens BancShares, Inc., Class - A | 465 | ||||||
| 969 | First Hawaiian, Inc. | 17 | ||||||
| 19,480 | First Horizon Corp. | 219 | ||||||
| 2,714 | FNB Corp. | 31 | ||||||
| 49,331 | Huntington Bancshares, Inc. | 531 | ||||||
| 101,754 | JPMorgan Chase & Co. | 14,799 | ||||||
| 30,661 | KeyCorp | 283 | ||||||
| 5,719 | M&T Bank Corp. | 708 | ||||||
| 5,373 | New York Community Bancorp, Inc. | 60 | ||||||
| 17,436 | NU Holdings Ltd., Class - A(a) | 138 | ||||||
| 568 | Pinnacle Financial Partners, Inc. | 32 | ||||||
| 534 | Popular, Inc. | 32 | ||||||
| 664 | Prosperity Bancshares, Inc. | 38 | ||||||
| 32,093 | Regions Financial Corp. | 572 | ||||||
| 1,092 | Synovus Financial Corp. | 33 | ||||||
| 13,687 | The PNC Financial Services Group, Inc. | 1,724 | ||||||
| 45,562 | Truist Financial Corp. | 1,382 | ||||||
| 52,570 | U.S. Bancorp | 1,737 | ||||||
| 5,701 | Webster Financial Corp. | 215 | ||||||
| 129,997 | Wells Fargo & Co. | 5,548 | ||||||
| 802 | Western Alliance Bancorp | 29 | ||||||
| 454 | Wintrust Financial Corp. | 33 | ||||||
| 1,117 | Zions Bancorp NA | 30 | ||||||
| 40,097 | ||||||||
Beverages — 1.38% | ||||||||
| 345 | Brown-Forman Corp., Class - A | 23 | ||||||
| 21,620 | Brown-Forman Corp., Class - B | 1,444 | ||||||
| 411 | Celsius Holdings, Inc.(a) | 61 | ||||||
| 8,767 | Constellation Brands, Inc., Class - A | 2,157 | ||||||
| 39,108 | Fomento Economico Mexicano SAB de CV, ADR | 4,336 | ||||||
| 63,233 | Keurig Dr Pepper, Inc. | 1,977 | ||||||
| 20,340 | Molson Coors Beverage Co., Class - B | 1,339 | ||||||
| 66,905 | Monster Beverage Corp.(a) | 3,842 | ||||||
| 52,376 | PepsiCo, Inc. | 9,702 | ||||||
| 72 | The Boston Beer Co., Inc., Class - A(a) | 22 | ||||||
| 154,297 | The Coca-Cola Co. | 9,293 | ||||||
| 34,196 | ||||||||
See accompanying notes to financial statements.
49
HC CAPITAL TRUST
The Institutional U.S. Equity Portfolio
Portfolio of Investments (continued) — June 30, 2023
Shares | Security Description | Value | ||||||
Common Stocks (continued) | ||||||||
Biotechnology — 1.56% | ||||||||
| 68,147 | AbbVie, Inc. | $ | 9,181 | |||||
| 4,861 | Alnylam Pharmaceuticals, Inc.(a) | 924 | ||||||
| 22,815 | Amgen, Inc. | 5,065 | ||||||
| 753 | Apellis Pharmaceuticals, Inc.(a) | 69 | ||||||
| 6,590 | Biogen, Inc.(a) | 1,877 | ||||||
| 12,473 | BioMarin Pharmaceutical, Inc.(a) | 1,081 | ||||||
| 6,296 | Exact Sciences Corp.(a) | 592 | ||||||
| 2,426 | Exelixis, Inc.(a) | 46 | ||||||
| 56,002 | Gilead Sciences, Inc. | 4,316 | ||||||
| 7,459 | Horizon Therapeutics PLC(a) | 767 | ||||||
| 18,161 | Incyte Corp.(a) | 1,130 | ||||||
| 1,071 | Ionis Pharmaceuticals, Inc.(a) | 44 | ||||||
| 269 | Karuna Therapeutics, Inc.(a) | 58 | ||||||
| 338 | Mirati Therapeutics, Inc.(a) | 12 | ||||||
| 11,314 | Moderna, Inc.(a) | 1,375 | ||||||
| 782 | Natera, Inc.(a) | 38 | ||||||
| 12,110 | Neurocrine Biosciences, Inc.(a) | 1,142 | ||||||
| 4,786 | Regeneron Pharmaceuticals, Inc.(a) | 3,439 | ||||||
| 1,843 | Roivant Sciences Ltd.(a) | 19 | ||||||
| 676 | Sarepta Therapeutics, Inc.(a) | 77 | ||||||
| 4,814 | Seagen, Inc.(a) | 927 | ||||||
| 506 | Ultragenyx Pharmaceutical, Inc.(a) | 23 | ||||||
| 6,204 | United Therapeutics Corp.(a) | 1,370 | ||||||
| 14,001 | Vertex Pharmaceuticals, Inc.(a) | 4,927 | ||||||
| 38,499 | ||||||||
Broadline Retail — 2.57% | ||||||||
| 44,975 | Alibaba Group Holding Ltd., ADR(a) | 3,749 | ||||||
| 394,104 | Amazon.com, Inc.(a) | 51,376 | ||||||
| 8,281 | Coupang, Inc.(a) | 144 | ||||||
| 18,388 | eBay, Inc. | 822 | ||||||
| 4,195 | Etsy, Inc.(a) | 355 | ||||||
| 834 | Kohl’s Corp. | 19 | ||||||
| 2,044 | Macy’s, Inc. | 33 | ||||||
| 5,757 | MercadoLibre, Inc.(a) | 6,819 | ||||||
| 848 | Nordstrom, Inc. | 17 | ||||||
| 473 | Ollie’s Bargain Outlet Holdings, Inc.(a) | 27 | ||||||
| 63,361 | ||||||||
Building Products — 0.33% | ||||||||
| 4,275 | A.O. Smith Corp. | 311 | ||||||
| 472 | Advanced Drainage Systems, Inc. | 54 | ||||||
| 2,965 | Allegion PLC | 356 | ||||||
| 344 | Armstrong World Industries, Inc. | 25 | ||||||
| 4,654 | Builders FirstSource, Inc.(a) | 633 | ||||||
| 2,287 | Carlisle Cos., Inc. | 587 | ||||||
| 28,637 | Carrier Global Corp. | 1,423 | ||||||
| 4,308 | Fortune Brands Innovations, Inc. | 310 | ||||||
| 834 | Hayward Holdings, Inc.(a) | 11 | ||||||
| 23,580 | Johnson Controls International PLC | 1,607 | ||||||
Shares | Security Description | Value | ||||||
Building Products (continued) | ||||||||
| 1,095 | Lennox International, Inc. | $ | 357 | |||||
| 7,910 | Masco Corp. | 454 | ||||||
| 3,225 | Owens Corning | 420 | ||||||
| 941 | The AZEK Co., Inc.(a) | 29 | ||||||
| 7,851 | Trane Technologies PLC | 1,501 | ||||||
| 835 | Trex Co., Inc.(a) | 55 | ||||||
| 8,133 | ||||||||
Capital Markets — 2.56% | ||||||||
| 269 | Affiliated Managers Group, Inc. | 40 | ||||||
| 3,611 | Ameriprise Financial, Inc. | 1,199 | ||||||
| 5,636 | Ares Management Corp., Class - A | 543 | ||||||
| 5,182 | BlackRock, Inc., Class - A | 3,581 | ||||||
| 24,233 | Blackstone, Inc., Class - A | 2,253 | ||||||
| 3,200 | Blue Owl Capital, Inc. | 37 | ||||||
| 10,455 | Cboe Global Markets, Inc. | 1,443 | ||||||
| 32,203 | CME Group, Inc. | 5,967 | ||||||
| 5,508 | Coinbase Global, Inc., Class - A^(a) | 394 | ||||||
| 277 | Evercore, Inc. | 34 | ||||||
| 8,935 | FactSet Research Systems, Inc. | 3,580 | ||||||
| 10,801 | Franklin Resources, Inc. | 289 | ||||||
| 375 | Houlihan Lokey, Inc. | 37 | ||||||
| 754 | Interactive Brokers Group, Inc., Class - A | 63 | ||||||
| 23,449 | Intercontinental Exchange, Inc. | 2,652 | ||||||
| 12,738 | Invesco Ltd. | 215 | ||||||
| 1,031 | Janus Henderson Group PLC | 28 | ||||||
| 1,500 | Jefferies Financial Group, Inc. | 50 | ||||||
| 21,009 | KKR & Co., Inc. | 1,176 | ||||||
| 826 | Lazard Ltd., Class - A | 26 | ||||||
| 2,728 | LPL Financial Holdings, Inc. | 593 | ||||||
| 2,474 | MarketAxess Holdings, Inc. | 647 | ||||||
| 20,120 | Moody’s Corp. | 6,994 | ||||||
| 42,651 | Morgan Stanley | 3,643 | ||||||
| 189 | Morningstar, Inc. | 37 | ||||||
| 2,731 | MSCI, Inc. | 1,281 | ||||||
| 16,151 | Nasdaq, Inc. | 806 | ||||||
| 7,204 | Northern Trust Corp. | 535 | ||||||
| 7,114 | Raymond James Financial, Inc. | 738 | ||||||
| 5,016 | Robinhood Markets, Inc., Class - A(a) | 50 | ||||||
| 31,430 | S&P Global, Inc. | 12,600 | ||||||
| 6,150 | SEI Investments Co. | 367 | ||||||
| 11,524 | State Street Corp. | 844 | ||||||
| 775 | Stifel Financial Corp. | 46 | ||||||
| 7,662 | T. Rowe Price Group, Inc. | 858 | ||||||
| 27,490 | The Bank of New York Mellon Corp. | 1,224 | ||||||
| 7,249 | The Carlyle Group, Inc. | 231 | ||||||
| 51,412 | The Charles Schwab Corp. | 2,914 | ||||||
| 13,619 | The Goldman Sachs Group, Inc. | 4,393 | ||||||
| 484 | TPG, Inc. | 14 | ||||||
| 10,701 | Tradeweb Markets, Inc., Class - A | 733 | ||||||
See accompanying notes to financial statements.
50
HC CAPITAL TRUST
The Institutional U.S. Equity Portfolio
Portfolio of Investments (continued) — June 30, 2023
Shares | Security Description | Value | ||||||
Common Stocks (continued) | ||||||||
Capital Markets (continued) | ||||||||
| 715 | Virtu Financial, Inc., Class - A | $ | 12 | |||||
| 2,509 | XP, Inc.(a) | 59 | ||||||
| 63,226 | ||||||||
Chemicals — 1.76% | ||||||||
| 9,596 | Air Products & Chemicals, Inc. | 2,875 | ||||||
| 4,026 | Albemarle Corp. | 898 | ||||||
| 384 | Ashland, Inc. | 33 | ||||||
| 1,675 | Axalta Coating Systems Ltd.(a) | 55 | ||||||
| 3,563 | Celanese Corp., Series A | 412 | ||||||
| 16,350 | CF Industries Holdings, Inc. | 1,134 | ||||||
| 35,798 | Corteva, Inc. | 2,051 | ||||||
| 24,285 | Dow, Inc. | 1,294 | ||||||
| 15,760 | DuPont de Nemours, Inc. | 1,126 | ||||||
| 4,211 | Eastman Chemical Co. | 353 | ||||||
| 8,737 | Ecolab, Inc. | 1,632 | ||||||
| 1,710 | Element Solutions, Inc. | 33 | ||||||
| 8,332 | FMC Corp. | 870 | ||||||
| 11,599 | Ginkgo Bioworks Holdings, Inc.(a) | 22 | ||||||
| 1,319 | Huntsman Corp. | 36 | ||||||
| 10,169 | International Flavors & Fragrances, Inc. | 809 | ||||||
| 61,899 | Linde PLC | 23,586 | ||||||
| 8,915 | LyondellBasell Industries N.V., Class - A | 819 | ||||||
| 43 | NewMarket Corp. | 17 | ||||||
| 975 | Olin Corp. | 50 | ||||||
| 8,071 | PPG Industries, Inc. | 1,197 | ||||||
| 7,010 | RPM International, Inc. | 629 | ||||||
| 1,117 | The Chemours Co. | 41 | ||||||
| 11,383 | The Mosaic Co. | 399 | ||||||
| 306 | The Scotts Miracle-Gro Co. | 19 | ||||||
| 10,503 | The Sherwin-Williams Co. | 2,789 | ||||||
| 1,354 | Westlake Corp. | 162 | ||||||
| 43,341 | ||||||||
Commercial Services & Supplies — 0.52% | ||||||||
| 3,106 | Cintas Corp. | 1,544 | ||||||
| 387 | Clean Harbors, Inc.(a) | 64 | ||||||
| 27,994 | Copart, Inc.(a) | 2,554 | ||||||
| 472 | Driven Brands Holdings, Inc.(a) | 13 | ||||||
| 280 | MSA Safety, Inc. | 49 | ||||||
| 1,372 | RB Global, Inc. | 82 | ||||||
| 13,406 | Republic Services, Inc. | 2,053 | ||||||
| 25,945 | Rollins, Inc. | 1,111 | ||||||
| 695 | Stericycle, Inc.(a) | 32 | ||||||
| 399 | Tetra Tech, Inc. | 65 | ||||||
| 13,069 | Waste Connections, Inc. | 1,868 | ||||||
| 19,509 | Waste Management, Inc. | 3,383 | ||||||
| 12,818 | ||||||||
Shares | Security Description | Value | ||||||
Communications Equipment — 0.48% | ||||||||
| 8,864 | Arista Networks, Inc.(a) | $ | 1,436 | |||||
| 1,117 | Ciena Corp.(a) | 47 | ||||||
| 148,437 | Cisco Systems, Inc. | 7,681 | ||||||
| 2,172 | F5, Inc.(a) | 318 | ||||||
| 15,444 | Juniper Networks, Inc. | 484 | ||||||
| 517 | Lumentum Holdings, Inc.(a) | 29 | ||||||
| 6,329 | Motorola Solutions, Inc. | 1,856 | ||||||
| 31 | Ubiquiti, Inc. | 5 | ||||||
| 551 | Viasat, Inc.(a) | 23 | ||||||
| 11,879 | ||||||||
Construction & Engineering — 0.46% | ||||||||
| 4,472 | AECOM | 379 | ||||||
| 175,639 | API Group Corp.(a) | 4,788 | ||||||
| 354 | EMCOR Group, Inc. | 65 | ||||||
| 462 | MasTec, Inc.(a) | 55 | ||||||
| 1,532 | MDU Resources Group, Inc. | 32 | ||||||
| 4,963 | Quanta Services, Inc. | 975 | ||||||
| 159 | Valmont Industries, Inc. | 46 | ||||||
| 105,924 | WillScot Mobile Mini Holdings Corp.(a) | 5,062 | ||||||
| 11,402 | ||||||||
Construction Materials — 0.08% | ||||||||
| 271 | Eagle Materials, Inc. | 51 | ||||||
| 2,178 | Martin Marietta Materials, Inc. | 1,006 | ||||||
| 4,564 | Vulcan Materials Co. | 1,028 | ||||||
| 2,085 | ||||||||
Consumer Finance — 0.31% | ||||||||
| 9,239 | Ally Financial, Inc. | 249 | �� | |||||
| 24,067 | American Express Co. | 4,193 | ||||||
| 13,098 | Capital One Financial Corp. | 1,432 | ||||||
| 50 | Credit Acceptance Corp.(a) | 25 | ||||||
| 8,855 | Discover Financial Services | 1,035 | ||||||
| 870 | OneMain Holdings, Inc. | 38 | ||||||
| 1,816 | SLM Corp. | 30 | ||||||
| 6,931 | SoFi Technologies, Inc.(a) | 58 | ||||||
| 15,241 | Synchrony Financial | 517 | ||||||
| 7,577 | ||||||||
Consumer Staples Distribution & Retail — 1.24% | ||||||||
| 9,961 | Albertsons Cos., Inc., Class - A | 218 | ||||||
| 1,016 | BJ’s Wholesale Club Holdings, Inc., Class - C(a) | 64 | ||||||
| 281 | Casey’s General Stores, Inc. | 69 | ||||||
| 19,945 | Costco Wholesale Corp. | 10,740 | ||||||
| 11,743 | Dollar General Corp. | 1,993 | ||||||
| 11,840 | Dollar Tree, Inc.(a) | 1,698 | ||||||
| 669 | Grocery Outlet Holding Corp.(a) | 20 | ||||||
| 1,153 | Performance Food Group Co.(a) | 69 | ||||||
| 17,434 | Sysco Corp. | 1,294 | ||||||
| 15,796 | Target Corp. | 2,084 | ||||||
| 46,381 | The Kroger Co. | 2,180 | ||||||
See accompanying notes to financial statements.
51
HC CAPITAL TRUST
The Institutional U.S. Equity Portfolio
Portfolio of Investments (continued) — June 30, 2023
Shares | Security Description | Value | ||||||
Common Stocks (continued) | ||||||||
Consumer Staples Distribution & Retail (continued) | ||||||||
| 1,712 | US Foods Holding Corp.(a) | $ | 75 | |||||
| 39,953 | Walgreens Boots Alliance, Inc. | 1,138 | ||||||
| 57,804 | Walmart, Inc. | 9,085 | ||||||
| 30,727 | ||||||||
Containers & Packaging — 0.39% | ||||||||
| 8,313 | Amcor PLC | 83 | ||||||
| 80,772 | Amcor PLC | 806 | ||||||
| 497 | AptarGroup, Inc. | 58 | ||||||
| 1,131 | Ardagh Metal Packaging SA | 4 | ||||||
| 2,794 | Avery Dennison Corp. | 480 | ||||||
| 16,919 | Ball Corp. | 985 | ||||||
| 922 | Berry Global Group, Inc. | 59 | ||||||
| 53,120 | Crown Holdings, Inc. | 4,615 | ||||||
| 2,319 | Graphic Packaging Holding Co. | 56 | ||||||
| 21,387 | International Paper Co. | 680 | ||||||
| 7,827 | Packaging Corp. of America | 1,034 | ||||||
| 9,128 | Sealed Air Corp. | 365 | ||||||
| 638 | Silgan Holdings, Inc. | 30 | ||||||
| 738 | Sonoco Products Co. | 44 | ||||||
| 8,294 | Westrock Co. | 241 | ||||||
| 9,540 | ||||||||
Distributors — 0.26% | ||||||||
| 8,012 | Genuine Parts Co. | 1,356 | ||||||
| 9,164 | LKQ Corp. | 534 | ||||||
| 12,155 | Pool Corp. | 4,554 | ||||||
| 6,444 | ||||||||
Diversified Consumer Services — 0.01% | ||||||||
| 1,585 | ADT, Inc. | 10 | ||||||
| 436 | Bright Horizons Family Solutions, Inc.(a) | 40 | ||||||
| 232 | Grand Canyon Education, Inc.(a) | 24 | ||||||
| 1,154 | H&R Block, Inc. | 37 | ||||||
| 605 | Mister Car Wash, Inc.(a) | 6 | ||||||
| 1,134 | Service Corp. International | 73 | ||||||
| 190 | ||||||||
Diversified REITs — 0.11% | ||||||||
| 204,056 | Empire State Realty Trust, Inc. | 1,528 | ||||||
| 609 | Federal Realty Investment Trust | 59 | ||||||
| 18,312 | WP Carey, Inc. | 1,237 | ||||||
| 2,824 | ||||||||
Diversified Telecommunication Services — 0.49% | ||||||||
| 302,005 | AT&T, Inc. | 4,817 | ||||||
| 1,857 | Frontier Communications Parent, Inc.(a) | 35 | ||||||
| 942 | Iridium Communications, Inc. | 59 | ||||||
| 13,886 | Liberty Global PLC, Class - A(a) | 234 | ||||||
| 19,138 | Liberty Global PLC, Class - C(a) | 340 | ||||||
| 174,610 | Verizon Communications, Inc. | 6,493 | ||||||
| 11,978 | ||||||||
Shares | Security Description | Value | ||||||
Electric Utilities — 1.57% | ||||||||
| 27,002 | Alliant Energy Corp. | $ | 1,417 | |||||
| 29,097 | American Electric Power Co., Inc. | 2,451 | ||||||
| 538 | Avangrid, Inc. | 20 | ||||||
| 60,734 | Constellation Energy Corp. | 5,560 | ||||||
| 37,787 | Duke Energy Corp. | 3,391 | ||||||
| 24,757 | Edison International | 1,719 | ||||||
| 16,383 | Entergy Corp. | 1,595 | ||||||
| 24,312 | Evergy, Inc. | 1,420 | ||||||
| 24,829 | Eversource Energy | 1,761 | ||||||
| 53,443 | Exelon Corp. | 2,178 | ||||||
| 43,946 | FirstEnergy Corp. | 1,708 | ||||||
| 825 | Hawaiian Electric Industries, Inc. | 30 | ||||||
| 382 | IDACORP, Inc. | 39 | ||||||
| 78,181 | NextEra Energy, Inc. | 5,801 | ||||||
| 15,741 | NRG Energy, Inc. | 589 | ||||||
| 1,514 | OGE Energy Corp. | 54 | ||||||
| 96,565 | PG&E Corp.(a) | 1,668 | ||||||
| 856 | Pinnacle West Capital Corp. | 70 | ||||||
| 56,132 | PPL Corp. | 1,486 | ||||||
| 51,903 | The Southern Co. | 3,646 | ||||||
| 33,494 | Xcel Energy, Inc. | 2,082 | ||||||
| 38,685 | ||||||||
Electrical Equipment — 0.63% | ||||||||
| 243 | Acuity Brands, Inc. | 40 | ||||||
| 9,409 | AMETEK, Inc. | 1,523 | ||||||
| 1,919 | ChargePoint Holdings, Inc.(a) | 17 | ||||||
| 13,821 | Eaton Corp. PLC | 2,779 | ||||||
| 19,599 | Emerson Electric Co. | 1,772 | ||||||
| 2,123 | Generac Holdings, Inc.(a) | 316 | ||||||
| 2,789 | Hubbell, Inc. | 925 | ||||||
| 1,253 | nVent Electric PLC | 65 | ||||||
| 3,939 | Plug Power, Inc.(a) | 41 | ||||||
| 494 | Regal Rexnord Corp. | 76 | ||||||
| 3,942 | Rockwell Automation, Inc. | 1,299 | ||||||
| 4,983 | Sensata Technologies Holding PLC | 225 | ||||||
| 1,580 | Sunrun, Inc.(a) | 28 | ||||||
| 261,773 | Vertiv Holdings Co. | 6,483 | ||||||
| 15,589 | ||||||||
Electronic Equipment, Instruments & Components — 0.45% | ||||||||
| 20,334 | Amphenol Corp., Class - A | 1,726 | ||||||
| 1,878 | Arrow Electronics, Inc.(a) | 269 | ||||||
| 690 | Avnet, Inc. | 35 | ||||||
| 4,641 | CDW Corp. | 851 | ||||||
| 5,809 | Cognex Corp. | 326 | ||||||
| 900 | Coherent Corp.(a) | 46 | ||||||
| 27,282 | Corning, Inc. | 956 | ||||||
| 94,416 | Halma PLC | 2,731 | ||||||
| 226 | IPG Photonics Corp.(a) | 31 | ||||||
See accompanying notes to financial statements.
52
HC CAPITAL TRUST
The Institutional U.S. Equity Portfolio
Portfolio of Investments (continued) — June 30, 2023
Shares | Security Description | Value | ||||||
Common Stocks (continued) | ||||||||
Electronic Equipment, Instruments & Components (continued) | ||||||||
| 987 | Jabil, Inc. | $ | 107 | |||||
| 6,107 | Keysight Technologies, Inc.(a) | 1,023 | ||||||
| 183 | Littelfuse, Inc. | 53 | ||||||
| 992 | National Instruments Corp. | 57 | ||||||
| 314 | TD SYNNEX Corp. | 30 | ||||||
| 8,466 | TE Connectivity Ltd. | 1,187 | ||||||
| 1,630 | Teledyne Technologies, Inc.(a) | 670 | ||||||
| 8,437 | Trimble, Inc.(a) | 447 | ||||||
| 1,197 | Vontier Corp. | 39 | ||||||
| 1,797 | Zebra Technologies Corp.(a) | 532 | ||||||
| 11,116 | ||||||||
Energy Equipment & Services — 0.19% | ||||||||
| 38,066 | Baker Hughes Co. | 1,203 | ||||||
| 30,972 | Halliburton Co. | 1,022 | ||||||
| 2,968 | NOV, Inc. | 48 | ||||||
| 48,771 | Schlumberger N.V. | 2,395 | ||||||
| 3,316 | TechnipFMC PLC(a) | 55 | ||||||
| 4,723 | ||||||||
Entertainment — 1.32% | ||||||||
| 25,830 | Activision Blizzard, Inc.(a) | 2,177 | ||||||
| 3,920 | AMC Entertainment Holdings, Inc.(a) | 17 | ||||||
| 16,686 | Electronic Arts, Inc. | 2,165 | ||||||
| 159 | Liberty Media Corp. - Liberty Formula One, Class - A(a) | 11 | ||||||
| 10,604 | Liberty Media Corp. - Liberty Formula One, Class - C(a) | 798 | ||||||
| 5,655 | Live Nation Entertainment, Inc.(a) | 515 | ||||||
| 141 | Madison Square Garden Sports Corp. | 27 | ||||||
| 30,262 | Netflix, Inc.(a) | 13,329 | ||||||
| 178 | Playtika Holding Corp.(a) | 2 | ||||||
| 19,418 | ROBLOX Corp., Class - A(a) | 783 | ||||||
| 4,361 | Roku, Inc.(a) | 279 | ||||||
| 28,609 | Spotify Technology SA(a) | 4,594 | ||||||
| 8,556 | Take-Two Interactive Software, Inc.(a) | 1,260 | ||||||
| 62,709 | The Walt Disney Co.(a) | 5,598 | ||||||
| 78,560 | Warner Bros. Discovery, Inc.(a) | 985 | ||||||
| 326 | World Wrestling Entertainment, Inc., Class - A | 35 | ||||||
| 32,575 | ||||||||
Financial Services — 4.74% | ||||||||
| 1,678 | Affirm Holdings, Inc.(a) | 26 | ||||||
| 77,515 | Apollo Global Management, Inc. | 5,954 | ||||||
| 50,622 | Berkshire Hathaway, Inc., Class - B(a) | 17,262 | ||||||
| 59,363 | Block, Inc.(a) | 3,952 | ||||||
| 608 | Corebridge Financial, Inc. | 11 | ||||||
| 12,725 | Equitable Holdings, Inc. | 345 | ||||||
| 358 | Euronet Worldwide, Inc.(a) | 42 | ||||||
| 91,896 | Fidelity National Information Services, Inc. | 5,027 | ||||||
Shares | Security Description | Value | ||||||
Financial Services (continued) | ||||||||
| 106,441 | Fiserv, Inc.(a) | $ | 13,427 | |||||
| 2,375 | FleetCor Technologies, Inc.(a) | 596 | ||||||
| 25,968 | Global Payments, Inc. | 2,558 | ||||||
| 90,737 | Marqeta, Inc., Class - A(a) | 442 | ||||||
| 60,184 | Mastercard, Inc., Class - A | 23,670 | ||||||
| 2,240 | MGIC Investment Corp. | 35 | ||||||
| 100,852 | PayPal Holdings, Inc.(a) | 6,730 | ||||||
| 860 | Rocket Cos., Inc., Class - A(a) | 8 | ||||||
| 383 | Shift4 Payments, Inc., Class - A(a) | 26 | ||||||
| 380 | TFS Financial Corp. | 5 | ||||||
| 2,823 | The Western Union Co. | 33 | ||||||
| 125,540 | Toast, Inc., Class - A(a) | 2,833 | ||||||
| 703 | UWM Holdings Corp. | 4 | ||||||
| 142,854 | Visa, Inc., Class - A | 33,926 | ||||||
| 738 | Voya Financial, Inc. | 53 | ||||||
| 330 | WEX, Inc.(a) | 60 | ||||||
| 117,025 | ||||||||
Food Products — 1.25% | ||||||||
| 28,363 | Archer-Daniels-Midland Co. | 2,144 | ||||||
| 12,857 | Bunge Ltd. | 1,213 | ||||||
| 28,626 | Campbell Soup Co. | 1,309 | ||||||
| 46,993 | Conagra Brands, Inc. | 1,584 | ||||||
| 5,475 | Darling Ingredients, Inc.(a) | 349 | ||||||
| 1,421 | Flowers Foods, Inc. | 35 | ||||||
| 345 | Freshpet, Inc.(a) | 23 | ||||||
| 32,787 | General Mills, Inc. | 2,515 | ||||||
| 39,079 | Hormel Foods Corp. | 1,571 | ||||||
| 497 | Ingredion, Inc. | 53 | ||||||
| 25,732 | Kellogg Co. | 1,734 | ||||||
| 44,058 | Lamb Weston Holdings, Inc. | 5,066 | ||||||
| 19,948 | McCormick & Co., Inc./MD | 1,740 | ||||||
| 59,123 | Mondelez International, Inc., Class - A | 4,312 | ||||||
| 353 | Pilgrim’s Pride Corp.(a) | 8 | ||||||
| 409 | Post Holdings, Inc.(a) | 35 | ||||||
| 2 | Seaboard Corp. | 7 | ||||||
| 9,125 | The Hershey Co. | 2,278 | ||||||
| 11,082 | The J.M. Smucker Co. | 1,636 | ||||||
| 54,746 | The Kraft Heinz Co. | 1,944 | ||||||
| 27,409 | Tyson Foods, Inc., Class - A | 1,399 | ||||||
| 30,955 | ||||||||
Gas Utilities — 0.09% | ||||||||
| 13,588 | Atmos Energy Corp. | 1,581 | ||||||
| 665 | National Fuel Gas Co. | 34 | ||||||
| 24,426 | UGI Corp. | 659 | ||||||
| 2,274 | ||||||||
Ground Transportation — 1.17% | ||||||||
| 154 | Avis Budget Group, Inc.(a) | 35 | ||||||
| 32,441 | Canadian Pacific Kansas City Ltd. | 2,621 | ||||||
See accompanying notes to financial statements.
53
HC CAPITAL TRUST
The Institutional U.S. Equity Portfolio
Portfolio of Investments (continued) — June 30, 2023
Shares | Security Description | Value | ||||||
Common Stocks (continued) | ||||||||
Ground Transportation (continued) | ||||||||
| 201,367 | CSX Corp. | $ | 6,866 | |||||
| 1,015 | Hertz Global Holdings, Inc.(a) | 19 | ||||||
| 4,432 | JB Hunt Transport Services, Inc. | 802 | ||||||
| 14,908 | Knight-Swift Transportation Holdings, Inc. | 829 | ||||||
| 271 | Landstar System, Inc. | 52 | ||||||
| 2,316 | Lyft, Inc., Class - A(a) | 22 | ||||||
| 9,311 | Norfolk Southern Corp. | 2,112 | ||||||
| 3,393 | Old Dominion Freight Line, Inc. | 1,255 | ||||||
| 346 | Ryder System, Inc. | 29 | ||||||
| 201 | Saia, Inc.(a) | 69 | ||||||
| 410 | Schneider National, Inc., Class - B | 12 | ||||||
| 213,562 | Uber Technologies, Inc.(a) | 9,218 | ||||||
| 68 | U-Haul Holding Co. | 4 | ||||||
| 3,134 | U-Haul Holding Co. | 159 | ||||||
| 23,624 | Union Pacific Corp. | 4,834 | ||||||
| 860 | XPO, Inc.(a) | 51 | ||||||
| 28,989 | ||||||||
Health Care Equipment & Supplies — 2.13% | ||||||||
| 65,604 | Abbott Laboratories | 7,152 | ||||||
| 2,511 | Align Technology, Inc.(a) | 888 | ||||||
| 39,365 | Baxter International, Inc. | 1,794 | ||||||
| 13,970 | Becton Dickinson & Co. | 3,688 | ||||||
| 57,146 | Boston Scientific Corp.(a) | 3,091 | ||||||
| 12,243 | DENTSPLY SIRONA, Inc. | 490 | ||||||
| 21,745 | Dexcom, Inc.(a) | 2,795 | ||||||
| 20,769 | Edwards Lifesciences Corp.(a) | 1,959 | ||||||
| 384 | Enovis Corp.(a) | 25 | ||||||
| 1,234 | Envista Holdings Corp.(a) | 42 | ||||||
| 13,963 | GE HealthCare Technologies, Inc. | 1,134 | ||||||
| 585 | Globus Medical, Inc.(a) | 35 | ||||||
| 17,637 | Hologic, Inc.(a) | 1,428 | ||||||
| 153 | ICU Medical, Inc.(a) | 27 | ||||||
| 10,205 | IDEXX Laboratories, Inc.(a) | 5,125 | ||||||
| 217 | Inspire Medical Systems, Inc.(a) | 70 | ||||||
| 12,327 | Insulet Corp.(a) | 3,555 | ||||||
| 549 | Integra LifeSciences Holdings Corp.(a) | 23 | ||||||
| 15,565 | Intuitive Surgical, Inc.(a) | 5,322 | ||||||
| 1,649 | Masimo Corp.(a) | 271 | ||||||
| 53,018 | Medtronic PLC | 4,671 | ||||||
| 3,097 | Novocure Ltd.(a) | 129 | ||||||
| 270 | Penumbra, Inc.(a) | 93 | ||||||
| 403 | QuidelOrtho Corp.(a) | 33 | ||||||
| 6,900 | ResMed, Inc. | 1,507 | ||||||
| 274 | Shockwave Medical, Inc.(a) | 78 | ||||||
| 4,818 | STERIS PLC | 1,085 | ||||||
| 11,816 | Stryker Corp. | 3,605 | ||||||
| 484 | Tandem Diabetes Care, Inc.(a) | 12 | ||||||
| 2,285 | Teleflex, Inc. | 553 | ||||||
Shares | Security Description | Value | ||||||
Health Care Equipment & Supplies (continued) | ||||||||
| 1,692 | The Cooper Cos., Inc. | $ | 648 | |||||
| 9,054 | Zimmer Biomet Holdings, Inc. | 1,318 | ||||||
| 52,646 | ||||||||
Health Care Providers & Services — 2.51% | ||||||||
| 675 | Acadia Healthcare Co., Inc.(a) | 54 | ||||||
| 1,974 | agilon health, Inc.(a) | 34 | ||||||
| 243 | Amedisys, Inc.(a) | 22 | ||||||
| 11,402 | AmerisourceBergen Corp. | 2,194 | ||||||
| 18,750 | Cardinal Health, Inc. | 1,773 | ||||||
| 31,260 | Centene Corp.(a) | 2,108 | ||||||
| 111 | Chemed Corp. | 60 | ||||||
| 56,954 | CVS Health Corp. | 3,938 | ||||||
| 11,007 | DaVita, Inc.(a) | 1,105 | ||||||
| 9,902 | Elevance Health, Inc. | 4,399 | ||||||
| 743 | Encompass Health Corp. | 50 | ||||||
| 10,333 | HCA Healthcare, Inc. | 3,135 | ||||||
| 12,776 | Henry Schein, Inc.(a) | 1,037 | ||||||
| 6,162 | Humana, Inc. | 2,756 | ||||||
| 6,357 | Laboratory Corporation of America Holdings | 1,534 | ||||||
| 7,079 | McKesson Corp. | 3,026 | ||||||
| 4,500 | Molina Healthcare, Inc.(a) | 1,356 | ||||||
| 893 | Premier, Inc., Class - A | 25 | ||||||
| 11,967 | Quest Diagnostics, Inc. | 1,682 | ||||||
| 1,155 | R1 RCM, Inc.(a) | 21 | ||||||
| 762 | Tenet Healthcare Corp.(a) | 62 | ||||||
| 13,133 | The Cigna Group | 3,686 | ||||||
| 57,138 | UnitedHealth Group, Inc. | 27,462 | ||||||
| 2,168 | Universal Health Services, Inc., Class - B | 342 | ||||||
| 61,861 | ||||||||
Health Care REITs — 0.47% | ||||||||
| 83,833 | CareTrust REIT, Inc. | 1,665 | ||||||
| 49,757 | Healthcare Realty Trust, Inc. | 938 | ||||||
| 36,103 | Healthpeak Properties, Inc. | 725 | ||||||
| 31,705 | Medical Properties Trust, Inc. | 294 | ||||||
| 1,782 | Omega Healthcare Investors, Inc. | 55 | ||||||
| 64,571 | Ventas, Inc. | 3,053 | ||||||
| 61,248 | Welltower, Inc. | 4,954 | ||||||
| 11,684 | ||||||||
Health Care Technology — 0.19% | ||||||||
| 881 | Certara, Inc.(a) | 16 | ||||||
| 848 | Doximity, Inc., Class - A(a) | 29 | ||||||
| 1,218 | Teladoc Health, Inc.(a) | 31 | ||||||
| 23,787 | Veeva Systems, Inc., Class - A(a) | 4,703 | ||||||
| 4,779 | ||||||||
Hotel & Resort REITs — 0.07% | ||||||||
| 23,979 | Host Hotels & Resorts, Inc. | 403 | ||||||
| 1,690 | Park Hotels & Resorts, Inc. | 22 | ||||||
| 15,140 | Ryman Hospitality Properties, Inc. | 1,407 | ||||||
| 1,832 | ||||||||
See accompanying notes to financial statements.
54
HC CAPITAL TRUST
The Institutional U.S. Equity Portfolio
Portfolio of Investments (continued) — June 30, 2023
Shares | Security Description | Value | ||||||
Common Stocks (continued) | ||||||||
Hotels, Restaurants & Leisure — 2.25% | ||||||||
| 21,800 | Airbnb, Inc., Class - A(a) | $ | 2,794 | |||||
| 8,358 | Aramark | 360 | ||||||
| 1,300 | Booking Holdings, Inc.(a) | 3,511 | ||||||
| 555 | Boyd Gaming Corp. | 39 | ||||||
| 7,642 | Caesars Entertainment, Inc.(a) | 389 | ||||||
| 35,286 | Carnival Corp.(a) | 664 | ||||||
| 3,177 | Chipotle Mexican Grill, Inc.(a) | 6,796 | ||||||
| 17,717 | Choice Hotels International, Inc. | 2,082 | ||||||
| 541 | Churchill Downs, Inc. | 75 | ||||||
| 4,118 | Darden Restaurants, Inc. | 688 | ||||||
| 4,043 | Domino’s Pizza, Inc. | 1,362 | ||||||
| 8,951 | DoorDash, Inc., Class - A(a) | 684 | ||||||
| 3,159 | DraftKings, Inc.(a) | 84 | ||||||
| 48,178 | Expedia Group, Inc.(a) | 5,270 | ||||||
| 9,054 | Hilton Worldwide Holdings, Inc. | 1,318 | ||||||
| 10,784 | Hyatt Hotels Corp., Class - A | 1,236 | ||||||
| 11,710 | Las Vegas Sands Corp.(a) | 680 | ||||||
| 12,527 | Marriott International, Inc., Class - A | 2,300 | ||||||
| 284 | Marriott Vacations Worldwide Corp. | 35 | ||||||
| 28,357 | McDonald’s Corp. | 8,461 | ||||||
| 10,402 | MGM Resorts International | 457 | ||||||
| 3,172 | Norwegian Cruise Line Holdings Ltd.(a) | 69 | ||||||
| 1,172 | Penn Entertainment, Inc.(a) | 28 | ||||||
| 58,213 | Planet Fitness, Inc., Class - A(a) | 3,926 | ||||||
| 7,917 | Royal Caribbean Cruises Ltd.(a) | 822 | ||||||
| 39,281 | Starbucks Corp. | 3,891 | ||||||
| 505 | Texas Roadhouse, Inc. | 57 | ||||||
| 1,293 | The Wendy’s Co. | 28 | ||||||
| 560 | Travel + Leisure Co. | 23 | ||||||
| 1,333 | Vail Resorts, Inc. | 336 | ||||||
| 226 | Wingstop, Inc. | 45 | ||||||
| 635 | Wyndham Hotels & Resorts, Inc. | 44 | ||||||
| 47,614 | Wynn Resorts Ltd. | 5,028 | ||||||
| 14,828 | Yum! Brands, Inc. | 2,054 | ||||||
| 55,636 | ||||||||
Household Durables — 0.67% | ||||||||
| 61,822 | D.R. Horton, Inc. | 7,523 | ||||||
| 5,265 | Garmin Ltd. | 549 | ||||||
| 1,009 | Leggett & Platt, Inc. | 30 | ||||||
| 11,402 | Lennar Corp., Class - A | 1,429 | ||||||
| 112 | Lennar Corp., Class - B | 13 | ||||||
| 16,091 | Meritage Homes Corp. | 2,289 | ||||||
| 1,890 | Mohawk Industries, Inc.(a) | 195 | ||||||
| 2,863 | Newell Brands, Inc. | 25 | ||||||
| 109 | NVR, Inc.(a) | 692 | ||||||
| 7,545 | PulteGroup, Inc. | 586 | ||||||
| 1,261 | Tempur Sealy International, Inc. | 51 | ||||||
Shares | Security Description | Value | ||||||
Household Durables (continued) | ||||||||
| 836 | Toll Brothers, Inc. | $ | 66 | |||||
| 242 | TopBuild Corp.(a) | 64 | ||||||
| 80,685 | Tri Pointe Homes, Inc.(a) | 2,651 | ||||||
| 1,855 | Whirlpool Corp. | 276 | ||||||
| 16,439 | ||||||||
Household Products — 0.93% | ||||||||
| 20,150 | Church & Dwight Co., Inc. | 2,020 | ||||||
| 40,946 | Colgate-Palmolive Co. | 3,154 | ||||||
| 19,485 | Kimberly-Clark Corp. | 2,690 | ||||||
| 412 | Reynolds Consumer Products, Inc. | 12 | ||||||
| 302 | Spectrum Brands Holdings, Inc. | 24 | ||||||
| 11,048 | The Clorox Co. | 1,757 | ||||||
| 87,981 | The Procter & Gamble Co. | 13,350 | ||||||
| 23,007 | ||||||||
Independent Power and Renewable Electricity Producers — 0.05% | ||||||||
| 968 | Brookfield Renewable Corp., Class - A | 31 | ||||||
| 261 | Clearway Energy, Inc., Class - A | 7 | ||||||
| 618 | Clearway Energy, Inc., Class - C | 18 | ||||||
| 22,305 | The AES Corp. | 462 | ||||||
| 29,886 | Vistra Corp. | 784 | ||||||
| 1,302 | ||||||||
Industrial Conglomerates — 0.65% | ||||||||
| 25,745 | 3M Co. | 2,577 | ||||||
| 76,320 | General Electric Co. | 8,384 | ||||||
| 24,053 | Honeywell International, Inc. | 4,991 | ||||||
| 15,952 | ||||||||
Industrial REITs — 0.64% | ||||||||
| 2,038 | Americold Realty Trust, Inc. | 66 | ||||||
| 14,549 | EastGroup Properties, Inc. | 2,525 | ||||||
| 999 | First Industrial Realty Trust, Inc. | 53 | ||||||
| 54,996 | Plymouth Industrial REIT, Inc. | 1,266 | ||||||
| 95,452 | Prologis, Inc. | 11,706 | ||||||
| 1,483 | Rexford Industrial Realty, Inc. | 77 | ||||||
| 1,356 | STAG Industrial, Inc. | 49 | ||||||
| 15,742 | ||||||||
Insurance — 2.41% | ||||||||
| 27,588 | Aflac, Inc. | 1,926 | ||||||
| 4,860 | American Financial Group, Inc. | 577 | ||||||
| 25,175 | American International Group, Inc. | 1,448 | ||||||
| 8,776 | Aon PLC, Class - A | 3,029 | ||||||
| 19,720 | Arch Capital Group Ltd.(a) | 1,476 | ||||||
| 27,372 | Arthur J. Gallagher & Co. | 6,011 | ||||||
| 7,182 | Assurant, Inc. | 903 | ||||||
| 437 | Assured Guaranty Ltd. | 24 | ||||||
| 590 | Axis Capital Holdings Ltd. | 32 | ||||||
| 514 | Brighthouse Financial, Inc.(a) | 24 | ||||||
| 12,066 | Brown & Brown, Inc. | 830 | ||||||
See accompanying notes to financial statements.
55
HC CAPITAL TRUST
The Institutional U.S. Equity Portfolio
Portfolio of Investments (continued) — June 30, 2023
Shares | Security Description | Value | ||||||
Common Stocks (continued) | ||||||||
Insurance (continued) | ||||||||
| 17,722 | Chubb Ltd. | $ | 3,413 | |||||
| 7,283 | Cincinnati Financial Corp. | 709 | ||||||
| 207 | CNA Financial Corp. | 8 | ||||||
| 4,221 | Erie Indemnity Co., Class - A | 886 | ||||||
| 3,297 | Everest Re Group Ltd. | 1,127 | ||||||
| 8,828 | Fidelity National Financial, Inc. | 318 | ||||||
| 765 | First American Financial Corp. | 44 | ||||||
| 6,377 | Globe Life, Inc. | 699 | ||||||
| 482 | Kemper Corp. | 23 | ||||||
| 165 | Kinsale Capital Group, Inc. | 62 | ||||||
| 1,287 | Lincoln National Corp. | 33 | ||||||
| 12,307 | Loews Corp. | 731 | ||||||
| 2,992 | Markel Group, Inc.(a) | 4,139 | ||||||
| 65,032 | Marsh & McLennan Cos., Inc. | 12,232 | ||||||
| 22,500 | MetLife, Inc. | 1,271 | ||||||
| 2,054 | Old Republic International Corp. | 52 | ||||||
| 278 | Primerica, Inc. | 55 | ||||||
| 8,222 | Principal Financial Group, Inc. | 623 | ||||||
| 12,593 | Prudential Financial, Inc. | 1,111 | ||||||
| 507 | Reinsurance Group of America, Inc. | 70 | ||||||
| 374 | RenaissanceRe Holdings Ltd. | 70 | ||||||
| 304 | RLI Corp. | 41 | ||||||
| 692 | Ryan Specialty Holdings, Inc.(a) | 31 | ||||||
| 15,635 | The Allstate Corp. | 1,705 | ||||||
| 268 | The Hanover Insurance Group, Inc. | 30 | ||||||
| 17,103 | The Hartford Financial Services Group, Inc. | 1,232 | ||||||
| 26,975 | The Progressive Corp. | 3,570 | ||||||
| 12,391 | The Travelers Cos., Inc. | 2,152 | ||||||
| 1,503 | Unum Group | 72 | ||||||
| 19,807 | W.R. Berkley Corp. | 1,180 | ||||||
| 19 | White Mountains Insurance Group Ltd. | 26 | ||||||
| 23,312 | Willis Towers Watson PLC | 5,491 | ||||||
| 59,486 | ||||||||
Interactive Media & Services — 4.18% | ||||||||
| 296,708 | Alphabet, Inc., Class - A(a) | 35,516 | �� | |||||
| 203,436 | Alphabet, Inc., Class - C(a) | 24,609 | ||||||
| 472,808 | Auto Trader Group PLC | 3,671 | ||||||
| 583 | IAC, Inc.(a) | 37 | ||||||
| 9,540 | Match Group, Inc.(a) | 399 | ||||||
| 101,371 | Meta Platforms, Inc., Class - A(a) | 29,091 | ||||||
| 201,206 | Pinterest, Inc., Class - A(a) | 5,501 | ||||||
| 60,738 | Scout24 SE | 3,848 | ||||||
| 27,944 | Snap, Inc., Class - A(a) | 331 | ||||||
| 775 | TripAdvisor, Inc.(a) | 13 | ||||||
| 9,983 | ZoomInfo Technologies, Inc.(a) | 254 | ||||||
| 103,270 | ||||||||
Shares | Security Description | Value | ||||||
IT Services — 1.21% | ||||||||
| 21,676 | Accenture PLC, Class - A | $ | 6,688 | |||||
| 12,246 | Akamai Technologies, Inc.(a) | 1,101 | ||||||
| 901 | Amdocs Ltd. | 89 | ||||||
| 9,657 | Cloudflare, Inc., Class - A(a) | 631 | ||||||
| 17,466 | Cognizant Technology Solutions Corp., Class - A | 1,141 | ||||||
| 1,745 | DXC Technology Co.(a) | 47 | ||||||
| 1,959 | EPAM Systems, Inc.(a) | 440 | ||||||
| 2,697 | Gartner, Inc.(a) | 945 | ||||||
| 309 | Globant SA(a) | 56 | ||||||
| 60,526 | GoDaddy, Inc., Class - A(a) | 4,547 | ||||||
| 38,139 | International Business Machines Corp. | 5,103 | ||||||
| 1,550 | Kyndryl Holdings, Inc.(a) | 21 | ||||||
| 4,172 | MongoDB, Inc.(a) | 1,714 | ||||||
| 5,149 | Okta, Inc.(a) | 358 | ||||||
| 15,588 | Snowflake, Inc., Class - A(a) | 2,743 | ||||||
| 6,246 | Twilio, Inc., Class - A(a) | 397 | ||||||
| 16,545 | VeriSign, Inc.(a) | 3,738 | ||||||
| 29,759 | ||||||||
Leisure Products — 0.03% | ||||||||
| 548 | Brunswick Corp. | 47 | ||||||
| 7,193 | Hasbro, Inc. | 467 | ||||||
| 2,666 | Mattel, Inc.(a) | 52 | ||||||
| 2,337 | Peloton Interactive, Inc., Class - A(a) | 18 | ||||||
| 417 | Polaris, Inc. | 50 | ||||||
| 654 | YETI Holdings, Inc.(a) | 25 | ||||||
| 659 | ||||||||
Life Sciences Tools & Services — 2.33% | ||||||||
| 698 | 10X Genomics, Inc., Class - A(a) | 39 | ||||||
| 54,280 | Agilent Technologies, Inc. | 6,527 | ||||||
| 22,511 | Avantor, Inc.(a) | 463 | ||||||
| 518 | Azenta, Inc.(a) | 24 | ||||||
| 717 | Bio-Rad Laboratories, Inc., Class - A(a) | 271 | ||||||
| 5,244 | Bio-Techne Corp. | 428 | ||||||
| 813 | Bruker Corp. | 60 | ||||||
| 1,818 | Charles River Laboratories International, Inc.(a) | 382 | ||||||
| 51,186 | Danaher Corp. | 12,286 | ||||||
| 40,264 | Eurofins Scientific SE | 2,558 | ||||||
| 616 | ICON PLC(a) | 154 | ||||||
| 5,420 | Illumina, Inc.(a) | 1,017 | ||||||
| 27,125 | IQVIA Holdings, Inc.(a) | 6,097 | ||||||
| 833 | Maravai LifeSciences Holdings, Inc., Class - A(a) | 10 | ||||||
| 176 | Medpace Holdings, Inc.(a) | 42 | ||||||
| 3,477 | Mettler-Toledo International, Inc.(a) | 4,560 | ||||||
| 1,720 | QIAGEN N.V.(a) | 77 | ||||||
| 1,823 | Repligen Corp.(a) | 258 | ||||||
| 27,518 | Revvity, Inc. | 3,269 | ||||||
| 13,422 | Sartorius Stedim Biotech | 3,352 | ||||||
See accompanying notes to financial statements.
56
HC CAPITAL TRUST
The Institutional U.S. Equity Portfolio
Portfolio of Investments (continued) — June 30, 2023
Shares | Security Description | Value | ||||||
Common Stocks (continued) | ||||||||
Life Sciences Tools & Services (continued) | ||||||||
| 750 | Sotera Health Co.(a) | $ | 14 | |||||
| 777 | Syneos Health, Inc.(a) | 33 | ||||||
| 26,810 | Thermo Fisher Scientific, Inc. | 13,989 | ||||||
| 2,520 | Waters Corp.(a) | 671 | ||||||
| 2,549 | West Pharmaceutical Services, Inc. | 975 | ||||||
| 57,556 | ||||||||
Machinery — 1.26% | ||||||||
| 471 | AGCO Corp. | 62 | ||||||
| 699 | Allison Transmission Holdings, Inc. | 39 | ||||||
| 19,253 | Caterpillar, Inc. | 4,738 | ||||||
| 7,386 | CNH Industrial N.V. | 106 | ||||||
| 357 | Crane Co. | 32 | ||||||
| 357 | Crane NXT Co. | 20 | ||||||
| 6,625 | Cummins, Inc. | 1,624 | ||||||
| 10,488 | Deere & Co. | 4,251 | ||||||
| 921 | Donaldson Co., Inc. | 58 | ||||||
| 4,741 | Dover Corp. | 700 | ||||||
| 430 | Esab Corp. | 29 | ||||||
| 987 | Flowserve Corp. | 37 | ||||||
| 12,419 | Fortive Corp. | 929 | ||||||
| 912 | Gates Industrial Corp. PLC(a) | 12 | ||||||
| 8,027 | Graco, Inc. | 694 | ||||||
| 15,505 | IDEX Corp. | 3,337 | ||||||
| 11,813 | Illinois Tool Works, Inc. | 2,955 | ||||||
| 13,915 | Ingersoll Rand, Inc. | 909 | ||||||
| 633 | ITT, Inc. | 59 | ||||||
| 425 | Lincoln Electric Holdings, Inc. | 84 | ||||||
| 1,793 | Nordson Corp. | 445 | ||||||
| 498 | Oshkosh Corp. | 43 | ||||||
| 18,497 | Otis Worldwide Corp. | 1,646 | ||||||
| 25,585 | PACCAR, Inc. | 2,140 | ||||||
| 4,398 | Parker-Hannifin Corp. | 1,716 | ||||||
| 5,480 | Pentair PLC | 354 | ||||||
| 214 | RBC Bearings, Inc.(a) | 47 | ||||||
| 3,495 | Snap-on, Inc. | 1,007 | ||||||
| 5,441 | Stanley Black & Decker, Inc. | 509 | ||||||
| 406 | The Middleby Corp.(a) | 60 | ||||||
| 464 | The Timken Co. | 42 | ||||||
| 8,451 | The Toro Co. | 859 | ||||||
| 6,065 | Westinghouse Air Brake Technologies Corp. | 665 | ||||||
| 8,187 | Xylem, Inc. | 922 | ||||||
| 31,130 | ||||||||
Marine Transportation — 0.00% | ||||||||
| 453 | Kirby Corp.(a) | 35 | ||||||
Media — 0.83% | ||||||||
| 44 | Cable One, Inc. | 29 | ||||||
| 4,682 | Charter Communications, Inc., Class - A(a) | 1,720 | ||||||
Shares | Security Description | Value | ||||||
Media (continued) | ||||||||
| 252,043 | Comcast Corp., Class - A | $ | 10,471 | |||||
| 1,900 | DISH Network Corp., Class - A(a) | 13 | ||||||
| 31,106 | Fox Corp., Class - A | 1,058 | ||||||
| 24,948 | Fox Corp., Class - B | 796 | ||||||
| 132 | Liberty Broadband Corp., Class - A(a) | 11 | ||||||
| 7,850 | Liberty Broadband Corp., Class - C(a) | 628 | ||||||
| 10,872 | Liberty Media Corp. - Liberty SiriusXM, Class - A(a) | 357 | ||||||
| 14,096 | Liberty Media Corp. - Liberty SiriusXM, Class - C(a) | 461 | ||||||
| 12,414 | News Corp., Class - A | 242 | ||||||
| 897 | News Corp., Class - B | 18 | ||||||
| 258 | Nexstar Media Group, Inc., Class - A | 43 | ||||||
| 11,079 | Omnicom Group, Inc. | 1,054 | ||||||
| 70 | Paramount Global, Class - A | 1 | ||||||
| 17,106 | Paramount Global, Class - B | 273 | ||||||
| 213,618 | Sirius XM Holdings, Inc. ^^ | 968 | ||||||
| 13,398 | The Interpublic Group of Cos., Inc. | 517 | ||||||
| 1,232 | The New York Times Co., Class - A | 49 | ||||||
| 22,219 | The Trade Desk, Inc., Class - A(a) | 1,715 | ||||||
| 20,424 | ||||||||
Metals & Mining — 0.48% | ||||||||
| 5,729 | Alcoa Corp. | 195 | ||||||
| 16,957 | Cleveland-Cliffs, Inc.(a) | 284 | ||||||
| 159,061 | Freeport-McMoRan, Inc. | 6,364 | ||||||
| 785 | MP Materials Corp.(a) | 18 | ||||||
| 49,814 | Newmont Corp. | 2,125 | ||||||
| 8,643 | Nucor Corp. | 1,417 | ||||||
| 2,665 | Reliance Steel & Aluminum Co. | 723 | ||||||
| 497 | Royal Gold, Inc. | 57 | ||||||
| 648 | Southern Copper Corp. | 46 | ||||||
| 1,562 | SSR Mining, Inc. | 22 | ||||||
| 5,659 | Steel Dynamics, Inc. | 616 | ||||||
| 1,703 | United States Steel Corp. | 43 | ||||||
| 11,910 | ||||||||
Mortgage Real Estate Investment Trusts — 0.03% | ||||||||
| 4,327 | AGNC Investment Corp. | 44 | ||||||
| 31,342 | Annaly Capital Management, Inc. | 627 | ||||||
| 3,639 | Rithm Capital Corp. | 34 | ||||||
| 2,215 | Starwood Property Trust, Inc. | 43 | ||||||
| 748 | ||||||||
Multi-Utilities — 0.88% | ||||||||
| 20,757 | Ameren Corp. | 1,696 | ||||||
| 50,223 | CenterPoint Energy, Inc. | 1,464 | ||||||
| 52,846 | CMS Energy Corp. | 3,105 | ||||||
| 23,286 | Consolidated Edison, Inc. | 2,105 | ||||||
| 48,441 | Dominion Energy, Inc. | 2,508 | ||||||
| 15,635 | DTE Energy Co. | 1,720 | ||||||
See accompanying notes to financial statements.
57
HC CAPITAL TRUST
The Institutional U.S. Equity Portfolio
Portfolio of Investments (continued) — June 30, 2023
Shares | Security Description | Value | ||||||
Common Stocks (continued) | ||||||||
Multi-Utilities (continued) | ||||||||
| 48,953 | NiSource, Inc. | $ | 1,339 | |||||
| 30,957 | Public Service Enterprise Group, Inc. | 1,938 | ||||||
| 16,543 | Sempra Energy | 2,409 | ||||||
| 38,162 | WEC Energy Group, Inc. | 3,367 | ||||||
| 21,651 | ||||||||
Office REITs — 0.08% | ||||||||
| 8,103 | Alexandria Real Estate Equities, Inc. | 920 | ||||||
| 5,436 | Boston Properties, Inc. | 313 | ||||||
| 26,611 | Corporate Office Properties Trust | 631 | ||||||
| 1,145 | Cousins Properties, Inc. | 26 | ||||||
| 788 | Highwoods Properties, Inc. | 19 | ||||||
| 881 | Kilroy Realty Corp. | 27 | ||||||
| 1,338 | Vornado Realty Trust | 24 | ||||||
| 1,960 | ||||||||
Oil, Gas & Consumable Fuels — 2.28% | ||||||||
| 2,550 | Antero Midstream Corp. | 30 | ||||||
| 2,151 | Antero Resources Corp.(a) | 50 | ||||||
| 10,401 | APA Corp. | 355 | ||||||
| 12,832 | Cheniere Energy, Inc. | 1,954 | ||||||
| 9,962 | Chesapeake Energy Corp. | 834 | ||||||
| 65,462 | Chevron Corp. | 10,301 | ||||||
| 43,415 | ConocoPhillips | 4,498 | ||||||
| 56,015 | Coterra Energy, Inc. | 1,417 | ||||||
| 22,342 | Devon Energy Corp. | 1,080 | ||||||
| 5,923 | Diamondback Energy, Inc. | 778 | ||||||
| 735 | DT Midstream, Inc. | 36 | ||||||
| 20,165 | EOG Resources, Inc. | 2,308 | ||||||
| 15,959 | EQT Corp. | 657 | ||||||
| 145,467 | Exxon Mobil Corp. | 15,602 | ||||||
| 9,494 | Hess Corp. | 1,291 | ||||||
| 4,911 | HF Sinclair Corp. | 219 | ||||||
| 108,286 | Kinder Morgan, Inc. | 1,864 | ||||||
| 21,807 | Marathon Oil Corp. | 502 | ||||||
| 15,153 | Marathon Petroleum Corp. | 1,767 | ||||||
| 418 | New Fortress Energy, Inc. | 11 | ||||||
| 24,496 | Occidental Petroleum Corp. | 1,440 | ||||||
| 15,343 | ONEOK, Inc. | 947 | ||||||
| 8,307 | Ovintiv, Inc. | 316 | ||||||
| 666 | PDC Energy, Inc. | 47 | ||||||
| 18,344 | Phillips 66 | 1,749 | ||||||
| 8,013 | Pioneer Natural Resources Co. | 1,660 | ||||||
| 1,786 | Range Resources Corp. | 53 | ||||||
| 8,345 | Southwestern Energy Co.(a) | 50 | ||||||
| 7,440 | Targa Resources Corp. | 567 | ||||||
| 208 | Texas Pacific Land Corp. | 274 | ||||||
| 65,635 | The Williams Cos., Inc. | 2,142 | ||||||
| 13,522 | Valero Energy Corp. | 1,586 | ||||||
| 56,385 | ||||||||
Shares | Security Description | Value | ||||||
Paper & Forest Products — 0.00% | ||||||||
| 485 | Louisiana-Pacific Corp. | $ | 36 | |||||
Passenger Airlines — 0.04% | ||||||||
| 949 | Alaska Air Group, Inc.(a) | 50 | ||||||
| 4,899 | American Airlines Group, Inc.(a) | 88 | ||||||
| 9,435 | Delta Air Lines, Inc.(a) | 449 | ||||||
| 8,726 | Southwest Airlines Co. | 316 | ||||||
| 2,474 | United Airlines Holdings, Inc.(a) | 136 | ||||||
| 1,039 | ||||||||
Personal Care Products — 0.11% | ||||||||
| 2,665 | Coty, Inc., Class - A(a) | 33 | ||||||
| 11,800 | L’Oreal SA, ADR | 1,101 | ||||||
| 943 | Olaplex Holdings, Inc.(a) | 4 | ||||||
| 7,940 | The Estee Lauder Cos., Inc. | 1,559 | ||||||
| 2,697 | ||||||||
Pharmaceuticals — 2.73% | ||||||||
| 17,260 | AstraZeneca PLC, ADR | 1,235 | ||||||
| 88,619 | Bristol-Myers Squibb Co. | 5,668 | ||||||
| 6,264 | Catalent, Inc.(a) | 272 | ||||||
| 3,702 | Elanco Animal Health, Inc.(a) | 37 | ||||||
| 36,945 | Eli Lilly & Co. | 17,327 | ||||||
| 7,337 | Jazz Pharmaceuticals PLC(a) | 909 | ||||||
| 96,349 | Johnson & Johnson | 15,948 | ||||||
| 97,145 | Merck & Co., Inc. | 11,209 | ||||||
| 11,163 | Novo Nordisk A/S, ADR | 1,807 | ||||||
| 1,927 | Organon & Co. | 40 | ||||||
| 1,019 | Perrigo Co. PLC | 35 | ||||||
| 222,812 | Pfizer, Inc. | 8,173 | ||||||
| 33,088 | Royalty Pharma PLC, Class - A | 1,017 | ||||||
| 80,369 | Viatris, Inc. | 801 | ||||||
| 16,686 | Zoetis, Inc. | 2,873 | ||||||
| 67,351 | ||||||||
Professional Services — 2.04% | ||||||||
| 1,504 | Adyen N.V.(a) | 2,604 | ||||||
| 61,391 | Adyen N.V., ADR(a) | 1,061 | ||||||
| 15,135 | Automatic Data Processing, Inc. | 3,327 | ||||||
| 14,361 | Booz Allen Hamilton Holding Corp. | 1,603 | ||||||
| 5,579 | Broadridge Financial Solutions, Inc. | 925 | ||||||
| 171 | CACI International, Inc., Class - A(a) | 58 | ||||||
| 94,554 | Ceridian HCM Holding, Inc.(a) | 6,333 | ||||||
| 12,499 | Clarivate PLC(a) | 119 | ||||||
| 322 | Concentrix Corp. | 26 | ||||||
| 63,164 | CoStar Group, Inc.(a) | 5,621 | ||||||
| 1,907 | Dun & Bradstreet Holdings, Inc. | 22 | ||||||
| 4,219 | Equifax, Inc. | 993 | ||||||
| 256 | FTI Consulting, Inc.(a) | 49 | ||||||
| 1,353 | Genpact Ltd. | 51 | ||||||
| 7,422 | Jack Henry & Associates, Inc. | 1,242 | ||||||
| 5,388 | Jacobs Solutions, Inc. | 641 | ||||||
See accompanying notes to financial statements.
58
HC CAPITAL TRUST
The Institutional U.S. Equity Portfolio
Portfolio of Investments (continued) — June 30, 2023
Shares | Security Description | Value | ||||||
Common Stocks (continued) | ||||||||
Professional Services (continued) | ||||||||
| 68,156 | KBR, Inc. | $ | 4,434 | |||||
| 16,443 | Leidos Holdings, Inc. | 1,455 | ||||||
| 381 | ManpowerGroup, Inc. | 30 | ||||||
| 11,128 | Paychex, Inc. | 1,245 | ||||||
| 24,033 | Paycom Software, Inc. | 7,719 | ||||||
| 461 | Paycor HCM, Inc.(a) | 11 | ||||||
| 18,005 | Paylocity Holding Corp.(a) | 3,322 | ||||||
| 3,588 | Robert Half International, Inc. | 270 | ||||||
| 417 | Science Applications International Corp. | 47 | ||||||
| 7,649 | SS&C Technologies Holdings, Inc. | 464 | ||||||
| 64,298 | TransUnion | 5,036 | ||||||
| 6,866 | Verisk Analytics, Inc., Class - A | 1,552 | ||||||
| 50,260 | ||||||||
Real Estate Management & Development — 0.29% | ||||||||
| 18,446 | CBRE Group, Inc., Class - A(a) | 1,489 | ||||||
| 26,811 | Corp. Inmobiliaria Vesta Sab de CV, ADR(a) | 864 | ||||||
| 362 | Jones Lang LaSalle, Inc.(a) | 56 | ||||||
| 254 | The Howard Hughes Corp.(a) | 20 | ||||||
| 427 | Zillow Group, Inc., Class - A(a) | 21 | ||||||
| 92,314 | Zillow Group, Inc., Class - C(a) | 4,640 | ||||||
| 7,090 | ||||||||
Residential REITs — 1.61% | ||||||||
| 170,691 | American Homes 4 Rent, Class - A | 6,051 | ||||||
| 22,520 | Apartment Income REIT Corp. | 813 | ||||||
| 53,463 | AvalonBay Communities, Inc. | 10,120 | ||||||
| 10,079 | Camden Property Trust | 1,098 | ||||||
| 14,993 | Equity LifeStyle Properties, Inc. | 1,003 | ||||||
| 50,144 | Equity Residential | 3,307 | ||||||
| 4,299 | Essex Property Trust, Inc. | 1,007 | ||||||
| 40,391 | Independence Realty Trust, Inc. | 736 | ||||||
| 101,792 | Invitation Homes, Inc. | 3,501 | ||||||
| 8,255 | Mid-America Apartment Communities, Inc. | 1,253 | ||||||
| 45,311 | Sun Communities, Inc. | 5,911 | ||||||
| 83,455 | UDR, Inc. | 3,586 | ||||||
| 79,626 | Veris Residential, Inc.(a) | 1,278 | ||||||
| 39,664 | ||||||||
Retail REITs — 0.55% | ||||||||
| 23,215 | Agree Realty Corp. | 1,518 | ||||||
| 107,940 | Brixmor Property Group, Inc. | 2,375 | ||||||
| 43,612 | Getty Realty Corp. | 1,475 | ||||||
| 20,577 | Kimco Realty Corp. | 405 | ||||||
| 1,373 | NNN REIT, Inc. | 59 | ||||||
| 36,411 | Phillips Edison & Co., Inc. | 1,241 | ||||||
| 35,300 | Realty Income Corp. | 2,111 | ||||||
| 5,660 | Regency Centers Corp. | 349 | ||||||
| 24,622 | Simon Property Group, Inc. | 2,843 | ||||||
| 1,055 | Spirit Realty Capital, Inc. | 42 | ||||||
Shares | Security Description | Value | ||||||
Retail REITs (continued) | ||||||||
| 55,247 | Tanger Factory Outlet Centers, Inc. | $ | 1,219 | |||||
| 13,637 | ||||||||
Semiconductors & Semiconductor Equipment — 5.74% | ||||||||
| 121,805 | Advanced Micro Devices, Inc.(a) | 13,875 | ||||||
| 503 | Allegro MicroSystems, Inc.(a) | 23 | ||||||
| 38,907 | Analog Devices, Inc. | 7,580 | ||||||
| 61,805 | Applied Materials, Inc. | 8,933 | ||||||
| 5,375 | ASML Holding N.V., NYS | 3,895 | ||||||
| 16,982 | Broadcom, Inc. | 14,732 | ||||||
| 416 | Cirrus Logic, Inc.(a) | 34 | ||||||
| 4,656 | Enphase Energy, Inc.(a) | 779 | ||||||
| 5,101 | Entegris, Inc. | 566 | ||||||
| 3,611 | First Solar, Inc.(a) | 686 | ||||||
| 592 | GLOBALFOUNDRIES, Inc.(a) | 38 | ||||||
| 143,170 | Intel Corp. | 4,788 | ||||||
| 4,743 | KLA Corp. | 2,300 | ||||||
| 4,625 | Lam Research Corp. | 2,974 | ||||||
| 4,873 | Lattice Semiconductor Corp.(a) | 468 | ||||||
| 29,364 | Marvell Technology, Inc. | 1,755 | ||||||
| 18,722 | Microchip Technology, Inc. | 1,677 | ||||||
| 44,230 | Micron Technology, Inc. | 2,791 | ||||||
| 501 | MKS Instruments, Inc. | 54 | ||||||
| 1,545 | Monolithic Power Systems, Inc. | 834 | ||||||
| 125,154 | NVIDIA Corp. | 52,945 | ||||||
| 6,949 | NXP Semiconductors N.V. | 1,422 | ||||||
| 14,805 | ON Semiconductor Corp.(a) | 1,400 | ||||||
| 3,503 | Qorvo, Inc.(a) | 357 | ||||||
| 38,269 | QUALCOMM, Inc. | 4,555 | ||||||
| 5,607 | Skyworks Solutions, Inc. | 620 | ||||||
| 1,492 | SolarEdge Technologies, Inc.(a) | 401 | ||||||
| 46,381 | Taiwan Semiconductor Manufacturing Co. Ltd., ADR | 4,681 | ||||||
| 5,487 | Teradyne, Inc. | 611 | ||||||
| 31,320 | Texas Instruments, Inc. | 5,638 | ||||||
| 353 | Universal Display Corp. | 51 | ||||||
| 4,074 | Wolfspeed, Inc.(a) | 227 | ||||||
| 141,690 | ||||||||
Software — 11.11% | ||||||||
| 32,568 | Adobe, Inc.(a) | 15,926 | ||||||
| 455 | Alteryx, Inc., Class - A(a) | 21 | ||||||
| 13,761 | ANSYS, Inc.(a) | 4,545 | ||||||
| 33,964 | Appfolio, Inc., Class - A(a) | 5,847 | ||||||
| 1,660 | AppLovin Corp., Class - A(a) | 43 | ||||||
| 918 | Aspen Technology, Inc.(a) | 154 | ||||||
| 5,110 | Atlassian Corp., Class - A(a) | 858 | ||||||
| 7,371 | Autodesk, Inc.(a) | 1,508 | ||||||
| 7,197 | Bentley Systems, Inc., Class - B | 391 | ||||||
| 3,448 | BILL Holdings, Inc.(a) | 403 | ||||||
| 20,848 | Black Knight, Inc.(a) | 1,245 | ||||||
See accompanying notes to financial statements.
59
HC CAPITAL TRUST
The Institutional U.S. Equity Portfolio
Portfolio of Investments (continued) — June 30, 2023
Shares | Security Description | Value | ||||||
Common Stocks (continued) | ||||||||
Software (continued) | ||||||||
| 13,490 | Cadence Design Systems, Inc.(a) | $ | 3,163 | |||||
| 1,519 | CCC Intelligent Solutions Holdings, Inc.(a) | 17 | ||||||
| 1,398 | Confluent, Inc., Class - A(a) | 49 | ||||||
| 11,952 | Crowdstrike Holdings, Inc., Class - A(a) | 1,756 | ||||||
| 56,963 | Dassault Systemes SE | 2,524 | ||||||
| 8,725 | Datadog, Inc., Class - A(a) | 858 | ||||||
| 7,183 | DocuSign, Inc.(a) | 367 | ||||||
| 449 | Dolby Laboratories, Inc., Class - A | 38 | ||||||
| 849 | DoubleVerify Holdings, Inc.(a) | 33 | ||||||
| 8,947 | Dropbox, Inc., Class - A(a) | 239 | ||||||
| 7,352 | Dynatrace, Inc.(a) | 378 | ||||||
| 587 | Elastic N.V.(a) | 38 | ||||||
| 851 | Fair Isaac Corp.(a) | 689 | ||||||
| 73,618 | Five9, Inc.(a) | 6,070 | ||||||
| 22,796 | Fortinet, Inc.(a) | 1,723 | ||||||
| 63,655 | Gen Digital, Inc. | 1,181 | ||||||
| 369 | Gitlab, Inc., Class - A(a) | 19 | ||||||
| 622 | Guidewire Software, Inc.(a) | 47 | ||||||
| 701 | HashiCorp, Inc., Class - A(a) | 18 | ||||||
| 1,601 | HubSpot, Inc.(a) | 852 | ||||||
| 279 | Informatica, Inc., Class - A(a) | 5 | ||||||
| 19,040 | Intuit, Inc. | 8,724 | ||||||
| 23,927 | Kinaxis, Inc.(a) | 3,419 | ||||||
| 471 | Manhattan Associates, Inc.(a) | 94 | ||||||
| 350,388 | Microsoft Corp. | 119,320 | ||||||
| 102,767 | Money Forward, Inc. | 4,098 | ||||||
| 528 | nCino, Inc.(a) | 16 | ||||||
| 974 | NCR Corp.(a) | 25 | ||||||
| 404 | New Relic, Inc.(a) | 26 | ||||||
| 1,742 | Nutanix, Inc., Class - A(a) | 49 | ||||||
| 100,548 | Oracle Corp. | 11,975 | ||||||
| 62,262 | Palantir Technologies, Inc., Class - A(a) | 954 | ||||||
| 30,939 | Palo Alto Networks, Inc.(a) | 7,906 | ||||||
| 314 | Pegasystems, Inc. | 15 | ||||||
| 47,144 | Procore Technologies, Inc.(a) | 3,068 | ||||||
| 3,768 | PTC, Inc.(a) | 536 | ||||||
| 646 | RingCentral, Inc., Class - A(a) | 21 | ||||||
| 11,532 | Roper Technologies, Inc. | 5,544 | ||||||
| 62,673 | Salesforce, Inc.(a) | 13,241 | ||||||
| 1,448 | SentinelOne, Inc., Class - A(a) | 22 | ||||||
| 17,451 | ServiceNow, Inc.(a) | 9,806 | ||||||
| 964 | Smartsheet, Inc., Class - A(a) | 37 | ||||||
| 5,323 | Splunk, Inc.(a) | 565 | ||||||
| 5,224 | Synopsys, Inc.(a) | 2,274 | ||||||
| 776 | Teradata Corp.(a) | 41 | ||||||
| 34,796 | The Descartes Systems Group, Inc.(a) | 2,788 | ||||||
| 929,184 | The Sage Group PLC | 10,913 | ||||||
| 13,889 | Tyler Technologies, Inc.(a) | 5,784 | ||||||
Shares | Security Description | Value | ||||||
Software (continued) | ||||||||
| 13,299 | UiPath, Inc., Class - A(a) | $ | 220 | |||||
| 8,469 | Unity Software, Inc.(a) | 367 | ||||||
| 7,926 | VMware, Inc., Class - A(a) | 1,139 | ||||||
| 28,377 | Workday, Inc., Class - A(a) | 6,410 | ||||||
| 40,874 | Xero Ltd.(a) | 3,274 | ||||||
| 8,344 | Zoom Video Communications, Inc., Class - A(a) | 567 | ||||||
| 3,053 | Zscaler, Inc.(a) | 446 | ||||||
| 274,689 | ||||||||
Specialized REITs — 1.78% | ||||||||
| 28,203 | American Tower Corp. | 5,470 | ||||||
| 20,302 | Crown Castle, Inc. | 2,313 | ||||||
| 41,624 | CubeSmart | 1,859 | ||||||
| 19,087 | Digital Realty Trust, Inc. | 2,173 | ||||||
| 18,432 | EPR Properties | 862 | ||||||
| 17,857 | Equinix, Inc. | 14,000 | ||||||
| 7,735 | Extra Space Storage, Inc. | 1,152 | ||||||
| 20,035 | Gaming and Leisure Properties, Inc. | 970 | ||||||
| 42,788 | Iron Mountain, Inc. | 2,431 | ||||||
| 656 | Lamar Advertising Co., Class - A | 65 | ||||||
| 6,048 | Life Storage, Inc. | 804 | ||||||
| 603 | National Storage Affiliates Trust | 21 | ||||||
| 19,127 | Public Storage | 5,583 | ||||||
| 1,105 | Rayonier, Inc. | 35 | ||||||
| 6,352 | SBA Communications Corp. | 1,472 | ||||||
| 121,214 | VICI Properties, Inc. | 3,809 | ||||||
| 25,819 | Weyerhaeuser Co. | 866 | ||||||
| 43,885 | ||||||||
Specialty Retail — 1.58% | ||||||||
| 5,529 | Advance Auto Parts, Inc. | 389 | ||||||
| 230 | AutoNation, Inc.(a) | 38 | ||||||
| 974 | AutoZone, Inc.(a) | 2,429 | ||||||
| 7,383 | Bath & Body Works, Inc. | 277 | ||||||
| 6,776 | Best Buy Co., Inc. | 556 | ||||||
| 2,201 | Burlington Stores, Inc.(a) | 347 | ||||||
| 5,455 | CarMax, Inc.(a) | 456 | ||||||
| 2,444 | Chewy, Inc., Class - A(a) | 96 | ||||||
| 2,206 | Dick’s Sporting Goods, Inc. | 292 | ||||||
| 414 | Five Below, Inc.(a) | 81 | ||||||
| 783 | Floor & Decor Holdings, Inc., Class - A(a) | 81 | ||||||
| 2,036 | GameStop Corp., Class - A(a) | 49 | ||||||
| 206 | Lithia Motors, Inc., Class - A | 63 | ||||||
| 20,968 | Lowe’s Cos., Inc. | 4,733 | ||||||
| 149 | Murphy USA, Inc. | 46 | ||||||
| 4,108 | O’Reilly Automotive, Inc.(a) | 3,923 | ||||||
| 152 | Penske Automotive Group, Inc. | 25 | ||||||
| 610 | Petco Health & Wellness Co., Inc.(a) | 5 | ||||||
| 123 | Restoration Hardware Co.(a) | 41 | ||||||
| 11,690 | Ross Stores, Inc. | 1,311 | ||||||
| 1,475 | The Gap, Inc. | 13 | ||||||
See accompanying notes to financial statements.
60
HC CAPITAL TRUST
The Institutional U.S. Equity Portfolio
Portfolio of Investments (continued) — June 30, 2023
Shares | Security Description | Value | ||||||
Common Stocks (continued) | ||||||||
Specialty Retail (continued) | ||||||||
| 38,522 | The Home Depot, Inc. | $ | 11,966 | |||||
| 104,331 | The TJX Cos., Inc. | 8,847 | ||||||
| 6,065 | Tractor Supply Co. | 1,341 | ||||||
| 3,025 | Ulta Beauty, Inc.(a) | 1,423 | ||||||
| 1,302 | Valvoline, Inc. | 49 | ||||||
| 615 | Victoria’s Secret & Co.(a) | 11 | ||||||
| 598 | Wayfair, Inc., Class - A(a) | 39 | ||||||
| 503 | Williams-Sonoma, Inc. | 63 | ||||||
| 38,990 | ||||||||
Technology Hardware, Storage & Peripherals — 5.03% | ||||||||
| 622,632 | Apple, Inc. | 120,773 | ||||||
| 7,176 | Dell Technologies, Inc., Class - C | 388 | ||||||
| 44,421 | Hewlett Packard Enterprise Co. | 746 | ||||||
| 30,252 | HP, Inc. | 929 | ||||||
| 7,544 | NetApp, Inc. | 576 | ||||||
| 2,163 | Pure Storage, Inc., Class - A(a) | 80 | ||||||
| 5,214 | Seagate Technology Holdings PLC | 323 | ||||||
| 10,619 | Western Digital Corp.(a) | 402 | ||||||
| 124,217 | ||||||||
Textiles, Apparel & Luxury Goods — 0.49% | ||||||||
| 930 | Capri Holdings Ltd.(a) | 33 | ||||||
| 283 | Carter’s, Inc. | 21 | ||||||
| 273 | Columbia Sportswear Co. | 21 | ||||||
| 459 | Crocs, Inc.(a) | 52 | ||||||
| 878 | Deckers Outdoor Corp.(a) | 464 | ||||||
| 8,298 | Lululemon Athletica, Inc.(a) | 3,141 | ||||||
| 12,495 | LVMH Moet Hennessy Louis Vuitton SE, ADR | 2,359 | ||||||
| 50,034 | NIKE, Inc., Class - B | 5,521 | ||||||
| 478 | PVH Corp. | 41 | ||||||
| 307 | Ralph Lauren Corp. | 38 | ||||||
| 1,015 | Skechers USA, Inc., Class - A(a) | 53 | ||||||
| 1,791 | Tapestry, Inc. | 77 | ||||||
| 1,429 | Under Armour, Inc., Class - A(a) | 10 | ||||||
| 1,440 | Under Armour, Inc., Class - C(a) | 10 | ||||||
| 12,203 | V.F. Corp. | 233 | ||||||
| 12,074 | ||||||||
Tobacco — 0.41% | ||||||||
| 84,173 | Altria Group, Inc. | 3,813 | ||||||
| 64,233 | Philip Morris International, Inc. | 6,270 | ||||||
| 10,083 | ||||||||
Trading Companies & Distributors — 0.69% | ||||||||
| 68,617 | AerCap Holdings N.V.(a) | 4,359 | ||||||
| 788 | Air Lease Corp. | 33 | ||||||
| 640 | Core & Main, Inc., Class - A(a) | 20 | ||||||
| 53,921 | Fastenal Co. | 3,181 | ||||||
| 37,582 | Ferguson PLC | 5,912 | ||||||
| 350 | MSC Industrial Direct Co., Inc. | 33 | ||||||
Shares | Security Description | Value | ||||||
Trading Companies & Distributors (continued) | ||||||||
| 337 | SiteOne Landscape Supply, Inc.(a) | $ | 56 | |||||
| 2,375 | United Rentals, Inc. | 1,058 | ||||||
| 1,172 | Univar Solutions, Inc.(a) | 42 | ||||||
| 2,327 | W.W. Grainger, Inc. | 1,835 | ||||||
| 1,120 | Watsco, Inc. | 427 | ||||||
| 338 | WESCO International, Inc. | 61 | ||||||
| 17,017 | ||||||||
Water Utilities — 0.11% | ||||||||
| 12,145 | American Water Works Co., Inc. | 1,733 | ||||||
| 27,506 | Essential Utilities, Inc. | 1,098 | ||||||
| 2,831 | ||||||||
Wireless Telecommunication Services — 0.32% | ||||||||
| 57,335 | T-Mobile US, Inc.(a) | 7,964 | ||||||
Total Common Stocks | 2,276,127 | |||||||
Contingent Right — 0.00% | ||||||||
Biotechnology — 0.00% | ||||||||
| 14 | Oncternal Therapeutics, Inc. CVR, 12/31/49(a)(b)(c) | — | ||||||
Total Contingent Right | — | |||||||
Exchange-Traded Funds — 4.11% | ||||||||
| 1,573,200 | Invesco S&P 500 Low Volatility ETF | 98,813 | ||||||
| 5,115 | iShares Russell 1000 ETF | 1,247 | ||||||
| 3,015 | SPDR S&P 500 ETF Trust | 1,336 | ||||||
Total Exchange-Traded Funds | 101,396 | |||||||
Investment Companies — 2.95% | ||||||||
| 1,274,261 | Federated Hermes Treasury Obligations Fund, Institutional Shares, 4.75%^^(d) | 1,274 | ||||||
| 71,693,109 | State Street Institutional Treasury Plus Money Market Fund, Trust Class, 4.97%(d) | 71,693 | ||||||
Total Investment Companies | 72,967 | |||||||
Total Investments (cost $1,683,402) — 99.23% | 2,450,490 | |||||||
Other assets in excess of liabilities — 0.77% | 18,911 | |||||||
Net Assets — 100.00% | $ | 2,469,401 | ||||||
Amounts designated as “—” are $0 or have been rounded to $0.
^ | All or part of this security was on loan as of June 30, 2023. |
^^ | Purchased with cash collateral held from securities lending. The value of the collateral could include collateral held for securities that were sold on or before June 30, 2023. |
(a) | Represents non-income producing security. |
(b) | Represents a security purchased under Rule 144A or Section 4(2) and is exempt from registration under the Securities Act of 1933, as amended, or is otherwise restricted to resale. Certain of these securities may be resold in transactions exempt from registration, normally to qualified institutional buyers. These securities have been deemed liquid by the Specialist Manager. |
(c) | Security was valued using significant unobservable inputs as of June 30, 2023. |
See accompanying notes to financial statements.
61
HC CAPITAL TRUST
The Institutional U.S. Equity Portfolio
Portfolio of Investments (concluded) — June 30, 2023
(d) | Annualized 7-day yield as of period-end. |
ADR—American Depositary Receipt |
ETF—Exchange-Traded Fund |
REIT—Real Estate Investment Trust |
The following table reflects the percentage of total net assets of the Portfolio attributable to each Specialist Manager as of June 30, 2023.
The Institutional U.S. Equity Portfolio | Echo Street | Jennison | Mellon | Parametric | Wellington | HC | RhumbLine | Total |
Common Stocks | 12.06% | 3.95% | 60.88% | — | 2.69% | — | 12.59% | 92.17% |
Contingent Right | — | — | 0.00% | — | — | — | — | 0.00% |
Exchange-Traded Funds | 0.06% | — | — | 4.00% | — | — | 0.05% | 4.11% |
Investment Companies | — | 0.01% | 0.05% | 2.86% | 0.02% | — | 0.01% | 2.95% |
Other Assets (Liabilities) | 0.04% | — | 0.28% | 0.41% | — | 0.02% | 0.02% | 0.77% |
Total Net Assets | 12.16% | 3.96% | 61.21% | 7.27% | 2.71% | 0.02% | 12.67% | 100.00% |
Amounts designated as “—” indicate the Specialist Manager did not manage any holdings in that category.
The following table reflects the open derivative positions held by the Portfolio as of June 30, 2023.
Futures Contracts Purchased*
Description | Number of | Expiration | Notional | Value and | ||||||||||||
E-Mini S&P 500 Future | 593 | 9/15/23 | $ | 133,077 | $ | 4,243 | ||||||||||
Russell 2000 Mini Index Future | 24 | 9/15/23 | 2,284 | 17 | ||||||||||||
| $ | 135,361 | $ | 4,260 | |||||||||||||
Total Unrealized Appreciation | $ | 4,260 | ||||||||||||||
Total Unrealized Depreciation | — | |||||||||||||||
Total Net Unrealized Appreciation/(Depreciation) | $ | 4,260 | ||||||||||||||
* | Cash has been pledged as collateral for futures contracts held by the Portfolio. |
See accompanying notes to financial statements.
62
HC CAPITAL TRUST
The Small Capitalization-Mid Capitalization Equity Portfolio
Portfolio of Investments — June 30, 2023
Shares | Security Description | Value | ||||||
Common Stocks — 98.83% | ||||||||
Aerospace & Defense — 0.74% | ||||||||
| 347 | AAR Corp.(a) | $ | 20 | |||||
| 89 | Aerojet Rocketdyne Holdings, Inc.(a) | 5 | ||||||
| 176 | AeroVironment, Inc.(a) | 18 | ||||||
| 700 | Curtiss-Wright Corp. | 129 | ||||||
| 9,052 | Kratos Defense & Security Solutions, Inc.(a) | 129 | ||||||
| 64 | Moog, Inc., Class - A | 7 | ||||||
| 4,770 | Triumph Group, Inc.(a) | 59 | ||||||
| 1,254 | V2X, Inc.(a) | 62 | ||||||
| 32,159 | Virgin Galactic Holdings, Inc.^(a) | 125 | ||||||
| 554 | ||||||||
Air Freight & Logistics — 0.06% | ||||||||
| 586 | Hub Group, Inc., Class - A(a) | 47 | ||||||
Automobile Components — 1.64% | ||||||||
| 1,571 | Adient PLC(a) | 60 | ||||||
| 2,008 | American Axle & Manufacturing Holdings, Inc.(a) | 17 | ||||||
| 25,347 | Dana, Inc. | 431 | ||||||
| 554 | Dorman Products, Inc. | 44 | ||||||
| 739 | Gentherm, Inc.(a) | 42 | ||||||
| 10,286 | Modine Manufacturing Co.(a) | 340 | ||||||
| 930 | Patrick Industries, Inc. | 74 | ||||||
| 817 | Stoneridge, Inc.(a) | 15 | ||||||
| 1,818 | The Goodyear Tire & Rubber Co.(a) | 25 | ||||||
| 872 | Visteon Corp.(a) | 125 | ||||||
| 522 | Winnebago Industries, Inc. | 35 | ||||||
| 290 | XPEL, Inc.(a) | 24 | ||||||
| 1,232 | ||||||||
Banks — 7.68% | ||||||||
| 1,715 | Ameris Bancorp | 59 | ||||||
| 1,712 | Axos Financial, Inc.(a) | 68 | ||||||
| 813 | Banc of California, Inc. | 9 | ||||||
| 1,048 | BancFirst Corp. | 96 | ||||||
| 6,654 | BankUnited, Inc. | 143 | ||||||
| 1,471 | Bankwell Financial Group, Inc. | 36 | ||||||
| 1,823 | Banner Corp. | 80 | ||||||
| 2,204 | BCB Bancorp, Inc. | 26 | ||||||
| 4,171 | Berkshire Hills Bancorp, Inc. | 86 | ||||||
| 418 | Byline Bancorp, Inc. | 8 | ||||||
| 5,139 | Cadence Bank | 101 | ||||||
| 2,951 | Cathay General Bancorp | 95 | ||||||
| 1,054 | Central Valley Community Bancorp | 16 | ||||||
| 3,735 | Columbia Banking System, Inc. | 76 | ||||||
| 3,488 | Columbia Financial, Inc.(a) | 60 | ||||||
| 2,630 | ConnectOne Bancorp, Inc. | 44 | ||||||
| 777 | Cullen/Frost Bankers, Inc. | 84 | ||||||
| 9,064 | CVB Financial Corp. | 120 | ||||||
| 2,962 | Eastern Bankshares, Inc. | 36 | ||||||
Shares | Security Description | Value | ||||||
Banks (continued) | ||||||||
| 738 | Enterprise Financial Services Corp. | $ | 29 | |||||
| 5,725 | FB Financial Corp. | 161 | ||||||
| 952 | First Bancorp | 28 | ||||||
| 24,739 | First Bancorp | 302 | ||||||
| 2,341 | First Bank | 24 | ||||||
| 4,298 | First Busey Corp. | 86 | ||||||
| 14,222 | First Commonwealth Financial Corp. | 180 | ||||||
| 3,478 | First Financial Bancorp | 71 | ||||||
| 5,034 | First Horizon Corp. | 57 | ||||||
| 6,998 | First Merchants Corp. | 198 | ||||||
| 6,458 | Fulton Financial Corp. | 77 | ||||||
| 3,205 | Hancock Whitney Corp. | 123 | ||||||
| 868 | Hilltop Holdings, Inc. | 27 | ||||||
| 24,005 | HomeStreet, Inc. | 142 | ||||||
| 4,173 | Hope Bancorp, Inc. | 35 | ||||||
| 3,570 | Independent Bank Corp. | 159 | ||||||
| 1,662 | Independent Bank Group, Inc. | 57 | ||||||
| 129 | International Bancshares Corp. | 6 | ||||||
| 441 | Lakeland Financial Corp. | 21 | ||||||
| 2,021 | Live Oak Bancshares, Inc. | 53 | ||||||
| 1,295 | Midland States Bancorp, Inc. | 26 | ||||||
| 907 | National Bank Holdings Corp., Class - A | 26 | ||||||
| 468 | NBT Bancorp, Inc. | 15 | ||||||
| 2,678 | New York Community Bancorp, Inc. | 30 | ||||||
| 1,622 | Northrim BanCorp, Inc. | 64 | ||||||
| 3,649 | OFG Bancorp | 95 | ||||||
| 2,194 | Old Second Bancorp, Inc. | 29 | ||||||
| 1,149 | Orrstown Financial Services, Inc. | 22 | ||||||
| 2,911 | Pacific Premier Bancorp, Inc. | 60 | ||||||
| 780 | Park National Corp. | 80 | ||||||
| 155 | Pathward Financial, Inc. | 7 | ||||||
| 3,037 | Peoples Bancorp, Inc. | 81 | ||||||
| 1,889 | Pinnacle Financial Partners, Inc. | 107 | ||||||
| 4,394 | Popular, Inc. | 266 | ||||||
| 3,750 | Provident Bancorp, Inc. | 31 | ||||||
| 3,124 | Provident Financial Services, Inc. | 51 | ||||||
| 6,048 | Sandy Spring Bancorp, Inc. | 137 | ||||||
| 990 | ServisFirst Bancshares, Inc. | 41 | ||||||
| 3,067 | Stellar Bancorp, Inc. | 70 | ||||||
| 3,405 | Sterling Bancorp, Inc.(a) | 19 | ||||||
| 1,311 | Stock Yards Bancorp, Inc. | 59 | ||||||
| 510 | Texas Capital Bancshares, Inc.(a) | 26 | ||||||
| 19,123 | The Bancorp, Inc.(a) | 625 | ||||||
| 2,444 | The Bank of N.T. Butterfield & Son Ltd. | 67 | ||||||
| 3,235 | Towne Bank | 75 | ||||||
| 2,880 | TriCo Bancshares | 96 | ||||||
| 240 | Triumph Financial, Inc.(a) | 15 | ||||||
| 5,375 | Trustmark Corp. | 114 | ||||||
| 2,275 | United Bankshares, Inc. | 67 | ||||||
See accompanying notes to financial statements.
63
HC CAPITAL TRUST
The Small Capitalization-Mid Capitalization Equity Portfolio
Portfolio of Investments (continued) — June 30, 2023
Shares | Security Description | Value | ||||||
Common Stocks (continued) | ||||||||
Banks (continued) | ||||||||
| 3,391 | United Community Banks, Inc. | $ | 85 | |||||
| 2,879 | Veritex Holdings, Inc. | 52 | ||||||
| 2,812 | WesBanco, Inc. | 72 | ||||||
| 623 | Western New England Bancorp, Inc. | 4 | ||||||
| 963 | Wintrust Financial Corp. | 70 | ||||||
| 247 | WSFS Financial Corp. | 9 | ||||||
| 5,772 | ||||||||
Beverages — 0.38% | ||||||||
| 816 | Celsius Holdings, Inc.(a) | 122 | ||||||
| 10,160 | Primo Water Corp. | 127 | ||||||
| 341 | The Vita Coco Co., Inc.(a) | 9 | ||||||
| 12,707 | Vintage Wine Estates, Inc.(a) | 11 | ||||||
| 3,519 | Zevia PBC, Class - A(a) | 15 | ||||||
| 284 | ||||||||
Biotechnology — 6.60% | ||||||||
| 15,327 | 4D Molecular Therapeutics, Inc.(a) | 277 | ||||||
| 2,314 | Aadi Bioscience, Inc.(a) | 16 | ||||||
| 3,641 | Acumen Pharmaceuticals, Inc.(a) | 18 | ||||||
| 564 | AnaptysBio, Inc.(a) | 11 | ||||||
| 1,323 | Anavex Life Sciences Corp.(a) | 11 | ||||||
| 3,852 | Annexon, Inc.(a) | 14 | ||||||
| 468 | Apellis Pharmaceuticals, Inc.(a) | 43 | ||||||
| 450 | Arcellx, Inc.(a) | 14 | ||||||
| 3,850 | Arcus Biosciences, Inc.(a) | 78 | ||||||
| 1,118 | Arrowhead Pharmaceuticals, Inc.(a) | 40 | ||||||
| 7,589 | ARS Pharmaceuticals, Inc.(a) | 51 | ||||||
| 943 | Avid Bioservices, Inc.(a) | 13 | ||||||
| 2,354 | Beam Therapeutics, Inc.(a) | 75 | ||||||
| 11,191 | BioAtla, Inc.(a) | 34 | ||||||
| 2,743 | BioCryst Pharmaceuticals, Inc.(a) | 19 | ||||||
| 421 | Biohaven Ltd.(a) | 10 | ||||||
| 2,087 | PDL BioPharma, Inc.(a) | 5 | ||||||
| 2,914 | Bioxcel Therapeutics, Inc.(a) | 19 | ||||||
| 18,086 | Bridgebio Pharma, Inc.(a) | 311 | ||||||
| 3,013 | Catalyst Pharmaceuticals, Inc.(a) | 40 | ||||||
| 5,325 | Celldex Therapeutics, Inc.(a) | 181 | ||||||
| 166 | Cerevel Therapeutics Holdings, Inc.(a) | 5 | ||||||
| 842 | Chinook Therapeutics, Inc.(a) | 32 | ||||||
| 16,043 | Cogent Biosciences, Inc.(a) | 190 | ||||||
| 746 | Crinetics Pharmaceuticals, Inc.(a) | 13 | ||||||
| 467 | Cytokinetics, Inc.(a) | 15 | ||||||
| 5,831 | Dynavax Technologies Corp.(a) | 75 | ||||||
| 7,978 | EQRx, Inc.(a) | 15 | ||||||
| 1,612 | Gritstone bio, Inc.(a) | 3 | ||||||
| 4,978 | Halozyme Therapeutics, Inc.(a) | 180 | ||||||
| 653 | Horizon Therapeutics PLC(a) | 67 | ||||||
| 5,265 | ImmunityBio, Inc.(a) | 15 | ||||||
| 3,251 | ImmunoGen, Inc.(a) | 61 | ||||||
Shares | Security Description | Value | ||||||
Biotechnology (continued) | ||||||||
| 928 | Intellia Therapeutics, Inc.(a) | $ | 38 | |||||
| 3,035 | Iovance Biotherapeutics, Inc.(a) | 21 | ||||||
| 4,245 | Ironwood Pharmaceuticals, Inc.(a) | 45 | ||||||
| 86 | Karuna Therapeutics, Inc.(a) | 19 | ||||||
| 15,799 | Kezar Life Sciences, Inc.(a) | 39 | ||||||
| 442 | Kiniksa Pharmaceuticals Ltd., Class - A(a) | 6 | ||||||
| 9,721 | Kronos Bio, Inc.(a) | 17 | ||||||
| 388 | Krystal Biotech, Inc.(a) | 46 | ||||||
| 1,009 | Kura Oncology, Inc.(a) | 11 | ||||||
| 7,491 | Kymera Therapeutics, Inc.(a) | 172 | ||||||
| 12,224 | Lexicon Pharmaceuticals, Inc.(a) | 28 | ||||||
| 45,403 | MacroGenics, Inc.(a) | 243 | ||||||
| 2,208 | Madrigal Pharmaceuticals, Inc.(a) | 511 | ||||||
| 4,216 | MannKind Corp.(a) | 17 | ||||||
| 1,120 | Mirum Pharmaceuticals, Inc.(a) | 29 | ||||||
| 1,986 | Myriad Genetics, Inc.(a) | 46 | ||||||
| 432 | Natera, Inc.(a) | 21 | ||||||
| 612 | Nuvalent, Inc., Class - A(a) | 26 | ||||||
| 6,995 | Olema Pharmaceuticals, Inc.(a) | 63 | ||||||
| 1,456 | Prime Medicine, Inc.(a) | 21 | ||||||
| 962 | Protagonist Therapeutics, Inc.(a) | 27 | ||||||
| 2,729 | Prothena Corp. PLC(a) | 186 | ||||||
| 142 | PTC Therapeutics, Inc.(a) | 6 | ||||||
| 322 | RAPT Therapeutics, Inc.(a) | 6 | ||||||
| 2,329 | Recursion Pharmaceuticals, Inc., Class - A(a) | 17 | ||||||
| 961 | Replimune Group, Inc.(a) | 22 | ||||||
| 845 | Rocket Pharmaceuticals, Inc.(a) | 17 | ||||||
| 4,339 | SpringWorks Therapeutics, Inc.(a) | 114 | ||||||
| 19,747 | Sutro Biopharma, Inc.(a) | 92 | ||||||
| 2,137 | Syndax Pharmaceuticals, Inc.(a) | 45 | ||||||
| 4,673 | Travere Therapeutics, Inc.(a) | 72 | ||||||
| 4,621 | Twist Bioscience Corp.(a) | 95 | ||||||
| 604 | United Therapeutics Corp.(a) | 133 | ||||||
| 3,598 | Vaxcyte, Inc.(a) | 180 | ||||||
| 2,225 | Veracyte, Inc.(a) | 57 | ||||||
| 1,839 | Vericel Corp.(a) | 69 | ||||||
| 1,042 | Verve Therapeutics, Inc.(a) | 20 | ||||||
| 16,422 | Viking Therapeutics, Inc.(a) | 266 | ||||||
| 589 | Vir Biotechnology, Inc.(a) | 14 | ||||||
| 861 | Viridian Therapeutics, Inc.(a) | 20 | ||||||
| 854 | Xencor, Inc.(a) | 21 | ||||||
| 1,004 | XOMA Corp.(a) | 19 | ||||||
| 14,136 | Y-mAbs Therapeutics, Inc.(a) | 96 | ||||||
| 4,964 | ||||||||
Broadline Retail — 0.34% | ||||||||
| 331 | Etsy, Inc.(a) | 28 | ||||||
| 15,740 | Groupon, Inc.^(a) | 93 | ||||||
| 8,527 | Macy’s, Inc. | 137 | ||||||
| 258 | ||||||||
See accompanying notes to financial statements.
64
HC CAPITAL TRUST
The Small Capitalization-Mid Capitalization Equity Portfolio
Portfolio of Investments (continued) — June 30, 2023
Shares | Security Description | Value | ||||||
Common Stocks (continued) | ||||||||
Building Products — 1.69% | ||||||||
| 1,948 | Apogee Enterprises, Inc. | $ | 92 | |||||
| 763 | AZZ, Inc. | 33 | ||||||
| 3,077 | Builders FirstSource, Inc.(a) | 418 | ||||||
| 354 | CSW Industrials, Inc. | 59 | ||||||
| 441 | Gibraltar Industries, Inc.(a) | 28 | ||||||
| 1,230 | Griffon Corp. | 50 | ||||||
| 443 | Insteel Industries, Inc. | 14 | ||||||
| 841 | Masonite International Corp.(a) | 86 | ||||||
| 3,356 | Trex Co., Inc.(a) | 220 | ||||||
| 2,155 | UFP Industries, Inc. | 209 | ||||||
| 2,342 | Zurn Elkay Water Solutions Corp. | 63 | ||||||
| 1,272 | ||||||||
Capital Markets — 2.08% | ||||||||
| 1,338 | Artisan Partners Asset Management, Inc., Class - A | 53 | ||||||
| 646 | B. Riley Financial, Inc. | 30 | ||||||
| 13,347 | BGC Partners, Inc., Class - A | 59 | ||||||
| 1,179 | Brightsphere Investment Group, Inc. | 25 | ||||||
| 979 | Cohen & Steers, Inc. | 57 | ||||||
| 1,749 | Evercore, Inc. | 216 | ||||||
| 3,056 | Federated Hermes, Inc. | 110 | ||||||
| 1,301 | Focus Financial Partners, Inc., Class - A(a) | 68 | ||||||
| 184 | Hamilton Lane, Inc., Class - A | 15 | ||||||
| 75 | Houlihan Lokey, Inc. | 7 | ||||||
| 1,623 | LPL Financial Holdings, Inc. | 353 | ||||||
| 128 | Moelis & Co., Class - A | 6 | ||||||
| 242 | Piper Sandler Cos. | 31 | ||||||
| 437 | PJT Partners, Inc., Class - A | 30 | ||||||
| 2,112 | Raymond James Financial, Inc. | 219 | ||||||
| 1,512 | Stifel Financial Corp. | 90 | ||||||
| 411 | StoneX Group, Inc.(a) | 34 | ||||||
| 2,045 | Victory Capital Holdings, Inc., Class - A | 64 | ||||||
| 157 | Virtus Investment Partners, Inc. | 31 | ||||||
| 9,720 | WisdomTree, Inc. | 67 | ||||||
| 1,565 | ||||||||
Chemicals — 1.70% | ||||||||
| 828 | Avient Corp. | 34 | ||||||
| 695 | Balchem Corp. | 94 | ||||||
| 48 | Cabot Corp. | 3 | ||||||
| 3,052 | FMC Corp. | 318 | ||||||
| 603 | Hawkins, Inc. | 29 | ||||||
| 158 | Huntsman Corp. | 4 | ||||||
| 1,166 | Ingevity Corp.(a) | 68 | ||||||
| 1,018 | Innospec, Inc. | 102 | ||||||
| 1,628 | Kronos Worldwide, Inc. | 14 | ||||||
| 8,091 | Livent Corp.(a) | 222 | ||||||
| 617 | Minerals Technologies, Inc. | 36 | ||||||
Shares | Security Description | Value | ||||||
Chemicals (continued) | ||||||||
| 129 | NewMarket Corp. | $ | 52 | |||||
| 1,544 | Orion SA | 33 | ||||||
| 2,288 | PureCycle Technologies, Inc.(a) | 24 | ||||||
| 898 | Sensient Technologies Corp. | 64 | ||||||
| 1,566 | Stepan Co. | 150 | ||||||
| 2,355 | Tronox Holdings PLC | 30 | ||||||
| 1,277 | ||||||||
Commercial Services & Supplies — 0.83% | ||||||||
| 1,375 | ABM Industries, Inc. | 59 | ||||||
| 2,262 | Brady Corp., Class - A | 108 | ||||||
| 1,307 | Casella Waste Systems, Inc.(a) | 117 | ||||||
| 1,360 | CoreCivic, Inc.(a) | 13 | ||||||
| 9,174 | Healthcare Services Group, Inc. | 136 | ||||||
| 3,253 | HNI Corp. | 92 | ||||||
| 1,358 | Montrose Environmental Group, Inc.(a) | 57 | ||||||
| 5,037 | Quad/Graphics, Inc.(a) | 19 | ||||||
| 142 | SP Plus Corp.(a) | 6 | ||||||
| 1,472 | The GEO Group, Inc.(a) | 11 | ||||||
| 39 | UniFirst Corp. | 6 | ||||||
| 48 | VSE Corp. | 3 | ||||||
| 627 | ||||||||
Communications Equipment — 0.34% | ||||||||
| 4,200 | ADTRAN Holdings, Inc. | 44 | ||||||
| 835 | Calix, Inc.(a) | 42 | ||||||
| 673 | Clearfield, Inc.(a) | 32 | ||||||
| 573 | Digi International, Inc.(a) | 23 | ||||||
| 22,262 | DZS, Inc.(a) | 87 | ||||||
| 964 | Harmonic, Inc.(a) | 16 | ||||||
| 1,545 | KVH Industries, Inc.(a) | 14 | ||||||
| 258 | ||||||||
Construction & Engineering — 2.01% | ||||||||
| 4,051 | AECOM | 343 | ||||||
| 1,546 | Ameresco, Inc., Class - A(a) | 75 | ||||||
| 1,585 | Dycom Industries, Inc.(a) | 180 | ||||||
| 1,160 | EMCOR Group, Inc. | 214 | ||||||
| 2,153 | Fluor Corp.(a) | 64 | ||||||
| 3,323 | Granite Construction, Inc. | 132 | ||||||
| 2,960 | MasTec, Inc.(a) | 350 | ||||||
| 117 | MYR Group, Inc.(a) | 16 | ||||||
| 2,938 | WillScot Mobile Mini Holdings Corp.(a) | 140 | ||||||
| 1,514 | ||||||||
Construction Materials — 0.66% | ||||||||
| 1,759 | Eagle Materials, Inc. | 327 | ||||||
| 4,373 | Summit Materials, Inc., Class - A(a) | 166 | ||||||
| 493 | ||||||||
Consumer Finance — 0.28% | ||||||||
| 465 | Bread Financial Holdings, Inc. | 15 | ||||||
| 2,878 | Consumer Portfolio Services, Inc.(a) | 34 | ||||||
See accompanying notes to financial statements.
65
HC CAPITAL TRUST
The Small Capitalization-Mid Capitalization Equity Portfolio
Portfolio of Investments (continued) — June 30, 2023
Shares | Security Description | Value | ||||||
Common Stocks (continued) | ||||||||
Consumer Finance (continued) | ||||||||
| 288 | Encore Capital Group, Inc.(a) | $ | 14 | |||||
| 2,149 | Green Dot Corp., Class - A(a) | 40 | ||||||
| 3,434 | LendingClub Corp.(a) | 33 | ||||||
| 875 | Navient Corp. | 16 | ||||||
| 351 | Nelnet, Inc., Class - A | 34 | ||||||
| 1,196 | PRA Group, Inc.(a) | 27 | ||||||
| 213 | ||||||||
Consumer Staples Distribution & Retail — 0.86% | ||||||||
| 2,670 | BJ’s Wholesale Club Holdings, Inc.(a) | 167 | ||||||
| 205 | Casey’s General Stores, Inc. | 50 | ||||||
| 1,513 | Ingles Markets, Inc., Class - A | 125 | ||||||
| 828 | Performance Food Group Co.(a) | 50 | ||||||
| 202 | PriceSmart, Inc. | 15 | ||||||
| 7,375 | Rite Aid Corp.(a) | 11 | ||||||
| 1,063 | SpartanNash Co. | 24 | ||||||
| 1,208 | The Andersons, Inc. | 56 | ||||||
| 3,462 | United Natural Foods, Inc.(a) | 68 | ||||||
| 1,275 | Weis Markets, Inc. | 82 | ||||||
| 648 | ||||||||
Containers & Packaging — 0.32% | ||||||||
| 693 | AptarGroup, Inc. | 81 | ||||||
| 2,133 | Graphic Packaging Holding Co. | 51 | ||||||
| 3,245 | Myers Industries, Inc. | 63 | ||||||
| 1,581 | TriMas Corp. | 43 | ||||||
| 238 | ||||||||
Diversified Consumer Services — 0.76% | ||||||||
| 3,247 | Adtalem Global Education, Inc.(a) | 112 | ||||||
| 4,561 | Coursera, Inc.(a) | 59 | ||||||
| 2,190 | OneSpaWorld Holdings Ltd.(a) | 26 | ||||||
| 17,039 | Perdoceo Education Corp.(a) | 210 | ||||||
| 2,069 | Strategic Education, Inc. | 140 | ||||||
| 457 | Stride, Inc.(a) | 17 | ||||||
| 782 | Universal Technical Institute, Inc.(a) | 5 | ||||||
| 569 | ||||||||
Diversified REITs — 0.29% | ||||||||
| 6,541 | Alexander & Baldwin, Inc. | 122 | ||||||
| 4,784 | American Assets Trust, Inc. | 92 | ||||||
| 264 | Essential Properties Realty Trust, Inc. | 6 | ||||||
| 220 | ||||||||
Diversified Telecommunication Services — 0.50% | ||||||||
| 3,094 | IDT Corp.(a) | 80 | ||||||
| 429 | Iridium Communications, Inc. | 27 | ||||||
| 19,781 | Liberty Latin America Ltd., Class - C(a) | 170 | ||||||
| 6,575 | Radius Global Infrastructure, Inc., Class - A(a) | 98 | ||||||
| 375 | ||||||||
Shares | Security Description | Value | ||||||
Electric Utilities — 0.67% | ||||||||
| 1,876 | ALLETE, Inc. | $ | 109 | |||||
| 3,048 | Genie Energy Ltd., Class - B | 43 | ||||||
| 3,096 | MGE Energy, Inc. | 244 | ||||||
| 528 | Otter Tail Corp. | 42 | ||||||
| 185 | PNM Resources, Inc. | 8 | ||||||
| 464 | Portland General Electric Co. | 22 | ||||||
| 5,418 | Via Renewables, Inc. | 38 | ||||||
| 506 | ||||||||
Electrical Equipment — 1.37% | ||||||||
| 8,245 | Array Technologies, Inc.(a) | 187 | ||||||
| 326 | Beam Global(a) | 3 | ||||||
| 1,099 | Bloom Energy Corp., Class - A(a) | 18 | ||||||
| 2,360 | EnerSys | 257 | ||||||
| 7,897 | Enovix Corp.^(a) | 142 | ||||||
| 6,019 | GrafTech International Ltd. | 30 | ||||||
| 395 | NEXTracker, Inc., Class - A(a) | 16 | ||||||
| 1,604 | Plug Power, Inc.(a) | 17 | ||||||
| 522 | Regal Rexnord Corp. | 80 | ||||||
| 6,744 | Shoals Technologies Group, Inc., Class - A(a) | 172 | ||||||
| 3,516 | SunPower Corp.(a) | 34 | ||||||
| 3,233 | Sunrun, Inc.(a) | 58 | ||||||
| 294 | Vicor Corp.(a) | 16 | ||||||
| 1,030 | ||||||||
Electronic Equipment, Instruments & Components — 3.03% | ||||||||
| 809 | Advanced Energy Industries, Inc. | 90 | ||||||
| 1,155 | Arlo Technologies, Inc.(a) | 13 | ||||||
| 521 | Badger Meter, Inc. | 77 | ||||||
| 544 | Belden, Inc. | 52 | ||||||
| 824 | ePlus, Inc.(a) | 46 | ||||||
| 2,761 | Fabrinet(a) | 359 | ||||||
| 18,320 | Flex Ltd.(a) | 507 | ||||||
| 1,005 | Insight Enterprises, Inc.(a) | 147 | ||||||
| 548 | IPG Photonics Corp.(a) | 74 | ||||||
| 5,296 | Iteris, Inc.(a) | 21 | ||||||
| 5,586 | Jabil, Inc. | 604 | ||||||
| 414 | Kimball Electronics, Inc.(a) | 11 | ||||||
| 368 | Littelfuse, Inc. | 107 | ||||||
| 1,326 | Methode Electronics, Inc. | 44 | ||||||
| 111 | Novanta, Inc.(a) | 20 | ||||||
| 1,841 | PC Connection, Inc. | 83 | ||||||
| 51 | Plexus Corp.(a) | 5 | ||||||
| 86 | Sanmina Corp.(a) | 5 | ||||||
| 34 | TD SYNNEX Corp. | 3 | ||||||
| 801 | TTM Technologies, Inc.(a) | 11 | ||||||
| 2,279 | ||||||||
Energy Equipment & Services — 1.89% | ||||||||
| 7,609 | Archrock, Inc. | 78 | ||||||
| 1,233 | Bristow Group, Inc.(a) | 35 | ||||||
See accompanying notes to financial statements.
66
HC CAPITAL TRUST
The Small Capitalization-Mid Capitalization Equity Portfolio
Portfolio of Investments (continued) — June 30, 2023
Shares | Security Description | Value | ||||||
Common Stocks (continued) | ||||||||
Energy Equipment & Services (continued) | ||||||||
| 460 | Cactus, Inc., Class - A | $ | 19 | |||||
| 4,798 | ChampionX Corp. | 149 | ||||||
| 13,231 | Diamond Offshore Drilling, Inc.(a) | 189 | ||||||
| 12,375 | Expro Group Holdings N.V.(a) | 220 | ||||||
| 655 | Helmerich & Payne, Inc. | 23 | ||||||
| 5,195 | Liberty Energy, Inc. | 69 | ||||||
| 1,228 | Nabors Industries Ltd.(a) | 114 | ||||||
| 9,331 | NexTier Oilfield Solutions, Inc.(a) | 83 | ||||||
| 1,775 | Oceaneering International, Inc.(a) | 33 | ||||||
| 9,817 | Patterson-UTI Energy, Inc. | 118 | ||||||
| 1,982 | ProFrac Holding Corp., Class - A(a) | 22 | ||||||
| 2,633 | ProPetro Holding Corp.(a) | 22 | ||||||
| 2,189 | Solaris Oilfield Infrastructure, Inc., Class - A | 18 | ||||||
| 4,093 | Tidewater, Inc.(a) | 228 | ||||||
| 1,420 | ||||||||
Entertainment — 0.24% | ||||||||
| 682 | Cinemark Holdings, Inc.(a) | 11 | ||||||
| 1,640 | Liberty Media Corp. - Liberty Braves, Class - A(a) | 67 | ||||||
| 2,567 | Liberty Media Corp. - Liberty Braves, Class - C(a) | 102 | ||||||
| 180 | ||||||||
Financial Services — 1.24% | ||||||||
| 23,967 | AvidXchange Holdings, Inc.(a) | 250 | ||||||
| 5,826 | Cannae Holdings, Inc.(a) | 118 | ||||||
| 2,141 | EVERTEC, Inc. | 79 | ||||||
| 47 | Federal Agricultural Mortgage Corp., Class - C | 7 | ||||||
| 27,335 | Finance of America Cos., Inc., Class - A(a) | 52 | ||||||
| 2,400 | Flywire Corp.(a) | 74 | ||||||
| 228 | MGIC Investment Corp. | 4 | ||||||
| 1,030 | Mr Cooper Group, Inc.(a) | 52 | ||||||
| 10,990 | Paymentus Holdings, Inc., Class - A(a) | 116 | ||||||
| 2,840 | Payoneer Global, Inc.(a) | 14 | ||||||
| 871 | PennyMac Financial Services, Inc. | 61 | ||||||
| 496 | Remitly Global, Inc.(a) | 9 | ||||||
| 928 | Walker & Dunlop, Inc. | 73 | ||||||
| 155 | WEX, Inc.(a) | 28 | ||||||
| 937 | ||||||||
Food Products — 1.30% | ||||||||
| 6,441 | B&G Foods, Inc. | 90 | ||||||
| 1,587 | Darling Ingredients, Inc.(a) | 101 | ||||||
| 675 | Fresh Del Monte Produce, Inc. | 17 | ||||||
| 365 | Freshpet, Inc.(a) | 24 | ||||||
| 682 | J & J Snack Foods Corp. | 108 | ||||||
| 2,078 | John B. Sanfilippo & Son, Inc. | 243 | ||||||
| 5,504 | Sovos Brands, Inc.(a) | 108 | ||||||
| 2,782 | The Hain Celestial Group, Inc.(a) | 35 | ||||||
Shares | Security Description | Value | ||||||
Food Products (continued) | ||||||||
| 1,116 | The Simply Good Foods Co.(a) | $ | 41 | |||||
| 1,580 | Tootsie Roll Industries, Inc. | 56 | ||||||
| 786 | TreeHouse Foods, Inc.(a) | 40 | ||||||
| 6,994 | Utz Brands, Inc. | 114 | ||||||
| 977 | ||||||||
Gas Utilities — 0.74% | ||||||||
| 1,728 | Chesapeake Utilities Corp. | 206 | ||||||
| 812 | New Jersey Resources Corp. | 38 | ||||||
| 4,551 | Northwest Natural Holding Co. | 196 | ||||||
| 963 | Spire, Inc. | 61 | ||||||
| 2,134 | UGI Corp. | 58 | ||||||
| 559 | ||||||||
Ground Transportation — 0.74% | ||||||||
| 168 | ArcBest Corp. | 17 | ||||||
| 119 | Avis Budget Group, Inc.(a) | 27 | ||||||
| 4,344 | Knight-Swift Transportation Holdings, Inc. | 241 | ||||||
| 412 | P.A.M. Transportation Services, Inc. | 11 | ||||||
| 752 | Saia, Inc.(a) | 258 | ||||||
| 3,453 | Yellow Corp.(a) | 2 | ||||||
| 556 | ||||||||
Health Care Equipment & Supplies — 4.42% | ||||||||
| 334 | AtriCure, Inc.(a) | 16 | ||||||
| 1,077 | Axonics, Inc.(a) | 54 | ||||||
| 42 | CONMED Corp. | 6 | ||||||
| 799 | CVRx, Inc.(a) | 12 | ||||||
| 693 | Embecta Corp. | 15 | ||||||
| 698 | Glaukos Corp.(a) | 50 | ||||||
| 140 | Globus Medical, Inc.(a) | 8 | ||||||
| 434 | Haemonetics Corp.(a) | 37 | ||||||
| 883 | Inspire Medical Systems, Inc.(a) | 287 | ||||||
| 1,147 | Insulet Corp.(a) | 331 | ||||||
| 479 | Integer Holdings Corp.(a) | 42 | ||||||
| 933 | iRhythm Technologies, Inc.(a) | 97 | ||||||
| 511 | Lantheus Holdings, Inc.(a) | 43 | ||||||
| 211 | LeMaitre Vascular, Inc. | 14 | ||||||
| 158 | LENSAR, Inc.(a) | 1 | ||||||
| 4,151 | Merit Medical Systems, Inc.(a) | 347 | ||||||
| 4,046 | Neogen Corp.(a) | 88 | ||||||
| 1,347 | Omnicell, Inc.(a) | 99 | ||||||
| 49,211 | OraSure Technologies, Inc.(a) | 247 | ||||||
| 2,756 | Orthofix Medical, Inc.(a) | 50 | ||||||
| 209 | OrthoPediatrics Corp.(a) | 9 | ||||||
| 3,026 | Paragon 28, Inc.(a) | 54 | ||||||
| 417 | PROCEPT BioRobotics Corp.(a) | 15 | ||||||
| 362 | Shockwave Medical, Inc.(a) | 103 | ||||||
| 492 | SI-BONE, Inc.(a) | 13 | ||||||
| 1,272 | STAAR Surgical Co.(a) | 67 | ||||||
| 19,385 | Tactile Systems Technology, Inc.(a) | 483 | ||||||
| 1,621 | Tandem Diabetes Care, Inc.(a) | 40 | ||||||
See accompanying notes to financial statements.
67
HC CAPITAL TRUST
The Small Capitalization-Mid Capitalization Equity Portfolio
Portfolio of Investments (continued) — June 30, 2023
Shares | Security Description | Value | ||||||
Common Stocks (continued) | ||||||||
Health Care Equipment & Supplies (continued) | ||||||||
| 1,363 | The Cooper Cos., Inc. | $ | 524 | |||||
| 391 | TransMedics Group, Inc.(a) | 33 | ||||||
| 2,165 | Treace Medical Concepts, Inc.(a) | 55 | ||||||
| 7,594 | Zimvie, Inc.(a) | 85 | ||||||
| 3,325 | ||||||||
Health Care Providers & Services — 2.28% | ||||||||
| 3,094 | Acadia Healthcare Co., Inc.(a) | 245 | ||||||
| 2,048 | Addus HomeCare Corp.(a) | 190 | ||||||
| 1,458 | Agiliti, Inc.(a) | 24 | ||||||
| 3,055 | Alignment Healthcare, Inc.(a) | 18 | ||||||
| 590 | AMN Healthcare Services, Inc.(a) | 64 | ||||||
| 3,253 | Apollo Medical Holdings, Inc.(a) | 103 | ||||||
| 13 | Chemed Corp. | 7 | ||||||
| 153 | CorVel Corp.(a) | 30 | ||||||
| 47 | Encompass Health Corp. | 3 | ||||||
| 23 | Enhabit, Inc.(a) | 0 | ||||||
| 2,258 | Fulgent Genetics, Inc.(a) | 84 | ||||||
| 14,120 | LifeStance Health Group, Inc.(a) | 129 | ||||||
| 42 | Molina Healthcare, Inc.(a) | 13 | ||||||
| 1,126 | National HealthCare Corp. | 70 | ||||||
| 18,701 | OPKO Health, Inc.(a) | 41 | ||||||
| 495 | Option Care Health, Inc.(a) | 16 | ||||||
| 4,974 | Owens & Minor, Inc.(a) | 95 | ||||||
| 3,683 | Patterson Cos., Inc. | 122 | ||||||
| 1,055 | Pediatrix Medical Group, Inc.(a) | 15 | ||||||
| 2,950 | RadNet, Inc.(a) | 96 | ||||||
| 1,380 | Select Medical Holdings Corp. | 44 | ||||||
| 435 | Surgery Partners, Inc.(a) | 20 | ||||||
| 2,414 | Tenet Healthcare Corp.(a) | 196 | ||||||
| 222 | The Ensign Group, Inc. | 21 | ||||||
| 578 | US Physical Therapy, Inc. | 70 | ||||||
| 1,716 | ||||||||
Health Care REITs — 0.76% | ||||||||
| 9,184 | CareTrust REIT, Inc. | 183 | ||||||
| 1,131 | Community Healthcare Trust, Inc. | 37 | ||||||
| 6,912 | Global Medical REIT, Inc. | 63 | ||||||
| 5,278 | LTC Properties, Inc. | 174 | ||||||
| 763 | National Health Investors, Inc. | 40 | ||||||
| 6,550 | Sabra Health Care REIT, Inc. | 77 | ||||||
| 574 | ||||||||
Health Care Technology — 1.13% | ||||||||
| 1,328 | Evolent Health, Inc., Class - A(a) | 40 | ||||||
| 11,734 | Multiplan Corp.(a) | 25 | ||||||
| 2,703 | NextGen Healthcare, Inc.(a) | 44 | ||||||
| 6,440 | Phreesia, Inc.(a) | 200 | ||||||
| 9,828 | Schrodinger, Inc.(a) | 490 | ||||||
| 1,092 | Simulations Plus, Inc. | 47 | ||||||
| 846 | ||||||||
Shares | Security Description | Value | ||||||
Hotel & Resort REITs — 0.75% | ||||||||
| 8,128 | Ashford Hospitality Trust, Inc.(a) | $ | 30 | |||||
| 4,816 | Chatham Lodging Trust | 45 | ||||||
| 9,262 | DiamondRock Hospitality Co. | 74 | ||||||
| 6,232 | Hersha Hospitality Trust, Class - A | 38 | ||||||
| 1,144 | Pebblebrook Hotel Trust | 16 | ||||||
| 6,433 | RLJ Lodging Trust | 66 | ||||||
| 1,766 | Ryman Hospitality Properties, Inc. | 164 | ||||||
| 7,641 | Summit Hotel Properties, Inc. | 50 | ||||||
| 1,660 | Sunstone Hotel Investors, Inc. | 17 | ||||||
| 5,240 | Xenia Hotels & Resorts, Inc. | 65 | ||||||
| 565 | ||||||||
Hotels, Restaurants & Leisure — 2.47% | ||||||||
| 162 | BJ’s Restaurants, Inc.(a) | 5 | ||||||
| 805 | Bloomin’ Brands, Inc. | 22 | ||||||
| 5,300 | Boyd Gaming Corp. | 367 | ||||||
| 363 | Caesars Entertainment, Inc.(a) | 19 | ||||||
| 398 | Chuy’s Holdings, Inc.(a) | 16 | ||||||
| 1,221 | Dave & Buster’s Entertainment, Inc.(a) | 54 | ||||||
| 1,018 | Dine Brands Global, Inc. | 59 | ||||||
| 7,017 | Fiesta Restaurant Group, Inc.(a) | 56 | ||||||
| 2,169 | First Watch Restaurant Group, Inc.(a) | 37 | ||||||
| 428 | Golden Entertainment, Inc.(a) | 18 | ||||||
| 1,218 | Hilton Grand Vacations, Inc.(a) | 55 | ||||||
| 181 | Jack in the Box, Inc. | 18 | ||||||
| 6,830 | Krispy Kreme, Inc. | 101 | ||||||
| 999 | Light & Wonder, Inc.(a) | 69 | ||||||
| 5,491 | Lindblad Expeditions Holdings, Inc.(a) | 60 | ||||||
| 21,348 | Noodles & Co.(a) | 72 | ||||||
| 731 | Papa John’s International, Inc. | 54 | ||||||
| 3,005 | Planet Fitness, Inc., Class - A(a) | 202 | ||||||
| 3,075 | PlayAGS, Inc.(a) | 17 | ||||||
| 3,161 | Red Rock Resorts, Inc., Class - A | 148 | ||||||
| 1,371 | Sweetgreen, Inc., Class - A(a) | 18 | ||||||
| 581 | Texas Roadhouse, Inc. | 65 | ||||||
| 1,684 | The Cheesecake Factory, Inc. | 58 | ||||||
| 145 | Vail Resorts, Inc. | 37 | ||||||
| 1,153 | Wingstop, Inc. | 230 | ||||||
| 1,857 | ||||||||
Household Durables — 1.86% | ||||||||
| 1,563 | Century Communities, Inc. | 120 | ||||||
| 4,095 | Dream Finders Homes, Inc., Class - A(a) | 101 | ||||||
| 972 | GoPro, Inc., Class - A(a) | 4 | ||||||
| 4,688 | Green Brick Partners, Inc.(a) | 265 | ||||||
| 891 | Hamilton Beach Brands Holding Co., Class - A | 9 | ||||||
| 163 | Helen of Troy Ltd.(a) | 18 | ||||||
| 370 | Installed Building Products, Inc. | 52 | ||||||
| 1,092 | iRobot Corp.(a) | 49 | ||||||
| 748 | LGI Homes, Inc.(a) | 101 | ||||||
| 2,390 | M/I Homes, Inc.(a) | 208 | ||||||
See accompanying notes to financial statements.
68
HC CAPITAL TRUST
The Small Capitalization-Mid Capitalization Equity Portfolio
Portfolio of Investments (continued) — June 30, 2023
Shares | Security Description | Value | ||||||
Common Stocks (continued) | ||||||||
Household Durables (continued) | ||||||||
| 937 | MDC Holdings, Inc. | $ | 44 | |||||
| 1,111 | Meritage Homes Corp. | 158 | ||||||
| 147 | Skyline Champion Corp.(a) | 10 | ||||||
| 3,058 | Sonos, Inc.(a) | 50 | ||||||
| 584 | The Lovesac Co.(a) | 16 | ||||||
| 428 | TopBuild Corp.(a) | 114 | ||||||
| 2,166 | Tri Pointe Homes, Inc.(a) | 71 | ||||||
| 554 | VOXX International Corp.(a) | 7 | ||||||
| 1,397 | ||||||||
Household Products — 0.24% | ||||||||
| 1,992 | Central Garden & Pet Co.(a) | 78 | ||||||
| 1,246 | Central Garden & Pet Co., Class - A(a) | 45 | ||||||
| 1,019 | Oil-Dri Corp. of America | 60 | ||||||
| 183 | ||||||||
Independent Power and Renewable Electricity Producers — 0.18% | ||||||||
| 1,499 | Clearway Energy, Inc., Class - C | 43 | ||||||
| 373 | Ormat Technologies, Inc. | 30 | ||||||
| 3,622 | Sunnova Energy International, Inc.(a) | 66 | ||||||
| 139 | ||||||||
Industrial REITs — 0.59% | ||||||||
| 1,133 | EastGroup Properties, Inc. | 198 | ||||||
| 1,744 | Innovative Industrial Properties, Inc. | 127 | ||||||
| 1,990 | LXP Industrial Trust | 19 | ||||||
| 2,707 | STAG Industrial, Inc. | 97 | ||||||
| 441 | ||||||||
Insurance — 2.48% | ||||||||
| 689 | Ambac Financial Group, Inc.(a) | 10 | ||||||
| 2,133 | American Equity Investment Life Holding Co. | 111 | ||||||
| 192 | BRP Group, Inc., Class - A(a) | 5 | ||||||
| 3,379 | CNO Financial Group, Inc. | 80 | ||||||
| 658 | Enstar Group Ltd.(a) | 161 | ||||||
| 875 | Everest Re Group Ltd. | 298 | ||||||
| 4,612 | Goosehead Insurance, Inc., Class - A(a) | 290 | ||||||
| 1,277 | Horace Mann Educators Corp. | 38 | ||||||
| 655 | Kinsale Capital Group, Inc. | 245 | ||||||
| 475 | Palomar Holdings, Inc.(a) | 28 | ||||||
| 2,483 | ProAssurance Corp. | 37 | ||||||
| 66 | RLI Corp. | 9 | ||||||
| 3,554 | Root, Inc., Class - A(a) | 32 | ||||||
| 1,404 | Selective Insurance Group, Inc. | 135 | ||||||
| 3,408 | Stewart Information Services Corp. | 140 | ||||||
| 4,197 | W.R. Berkley Corp. | 250 | ||||||
| 1,869 | ||||||||
Interactive Media & Services — 0.65% | ||||||||
| 1,568 | Bumble, Inc., Class - A(a) | 26 | ||||||
| 758 | Cargurus, Inc.(a) | 17 | ||||||
Shares | Security Description | Value | ||||||
Interactive Media & Services (continued) | ||||||||
| 8,509 | DHI Group, Inc.(a) | $ | 33 | |||||
| 1,359 | Shutterstock, Inc. | 66 | ||||||
| 18,443 | TrueCar, Inc.(a) | 42 | ||||||
| 6,760 | Yelp, Inc.(a) | 245 | ||||||
| 53 | Ziff Davis, Inc.(a) | 4 | ||||||
| 3,027 | ZipRecruiter, Inc.(a) | 54 | ||||||
| 487 | ||||||||
IT Services — 0.12% | ||||||||
| 7,289 | Brightcove, Inc.(a) | 29 | ||||||
| 915 | Fastly, Inc., Class - A(a) | 14 | ||||||
| 529 | Perficient, Inc.(a) | 45 | ||||||
| 135 | The Hackett Group, Inc. | 3 | ||||||
| 91 | ||||||||
Leisure Products — 0.34% | ||||||||
| 324 | American Outdoor Brands, Inc.(a) | 3 | ||||||
| 77 | Johnson Outdoors, Inc., Class - A | 5 | ||||||
| 313 | Malibu Boats, Inc., Class - A(a) | 18 | ||||||
| 356 | MasterCraft Boat Holdings, Inc.(a) | 11 | ||||||
| 4,682 | Mattel, Inc.(a) | 91 | ||||||
| 1,298 | Smith & Wesson Brands, Inc. | 17 | ||||||
| 925 | Topgolf Callaway Brands Corp.(a) | 18 | ||||||
| 1,299 | Vista Outdoor, Inc.(a) | 36 | ||||||
| 1,461 | YETI Holdings, Inc.(a) | 57 | ||||||
| 256 | ||||||||
Life Sciences Tools & Services — 0.95% | ||||||||
| 1,719 | Adaptive Biotechnologies Corp.(a) | 12 | ||||||
| 75 | Azenta, Inc.(a) | 4 | ||||||
| 325 | BioLife Solutions, Inc.(a) | 7 | ||||||
| 102 | Bruker Corp. | 8 | ||||||
| 3,546 | Cytek Biosciences, Inc.(a) | 30 | ||||||
| 11,408 | Inotiv, Inc.(a) | 54 | ||||||
| 599 | Medpace Holdings, Inc.(a) | 144 | ||||||
| 29,118 | Pacific Biosciences of California, Inc.(a) | 386 | ||||||
| 493 | Repligen Corp.(a) | 70 | ||||||
| 715 | ||||||||
Machinery — 3.45% | ||||||||
| 68 | Albany International Corp. | 6 | ||||||
| 1,637 | Astec Industries, Inc. | 74 | ||||||
| 1,248 | Chart Industries, Inc.(a) | 199 | ||||||
| 1,644 | Columbus McKinnon Corp. | 67 | ||||||
| 1,387 | Energy Recovery, Inc.(a) | 39 | ||||||
| 1,328 | ESCO Technologies, Inc. | 138 | ||||||
| 1,773 | Federal Signal Corp. | 114 | ||||||
| 141 | Franklin Electric Co., Inc. | 15 | ||||||
| 2,085 | Greenbrier Cos., Inc. | 90 | ||||||
| 1,011 | Helios Technologies, Inc. | 67 | ||||||
| 3,968 | Hillenbrand, Inc. | 203 | ||||||
| 332 | IDEX Corp. | 71 | ||||||
See accompanying notes to financial statements.
69
HC CAPITAL TRUST
The Small Capitalization-Mid Capitalization Equity Portfolio
Portfolio of Investments (continued) — June 30, 2023
Shares | Security Description | Value | ||||||
Common Stocks (continued) | ||||||||
Machinery (continued) | ||||||||
| 1,076 | ITT, Inc. | $ | 100 | |||||
| 819 | John Bean Technologies Corp. | 99 | ||||||
| 217 | Kadant, Inc. | 48 | ||||||
| 939 | Kornit Digital Ltd.(a) | 28 | ||||||
| 771 | Lincoln Electric Holdings, Inc. | 153 | ||||||
| 118 | Mueller Industries, Inc. | 10 | ||||||
| 16,478 | Mueller Water Products, Inc., Class - A | 267 | ||||||
| 47 | Oshkosh Corp. | 4 | ||||||
| 4,768 | Proto Labs, Inc.(a) | 167 | ||||||
| 21 | RBC Bearings, Inc.(a) | 5 | ||||||
| 1,356 | SPX Technologies, Inc.(a) | 115 | ||||||
| 948 | Standex International Corp. | 134 | ||||||
| 2,819 | Tennant Co. | 229 | ||||||
| 2,067 | Terex Corp. | 124 | ||||||
| 1,198 | Trinity Industries, Inc. | 31 | ||||||
| 2,597 | ||||||||
Marine Transportation — 0.54% | ||||||||
| 16,292 | Costamare, Inc. | 158 | ||||||
| 2,101 | Kirby Corp.(a) | 161 | ||||||
| 1,166 | Matson, Inc. | 91 | ||||||
| 410 | ||||||||
Media — 1.11% | ||||||||
| 8,492 | Advantage Solutions, Inc.(a) | 20 | ||||||
| 23,868 | Cardlytics, Inc.(a) | 151 | ||||||
| 15,050 | Integral Ad Science Holding Corp.(a) | 270 | ||||||
| 710 | John Wiley & Sons, Inc., Class - A | 24 | ||||||
| 19,029 | Magnite, Inc.(a) | 260 | ||||||
| 1,827 | Scholastic Corp. | 71 | ||||||
| 2,249 | TEGNA, Inc. | 37 | ||||||
| 833 | ||||||||
Metals & Mining — 2.07% | ||||||||
| 1,382 | Alcoa Corp. | 47 | ||||||
| 17,681 | ATI, Inc.(a) | 782 | ||||||
| 1,962 | Carpenter Technology Corp. | 110 | ||||||
| 1,648 | Compass Minerals International, Inc. | 56 | ||||||
| 759 | Haynes International, Inc. | 39 | ||||||
| 9,750 | Hecla Mining Co. | 50 | ||||||
| 1,022 | Ivanhoe Electric, Inc.(a) | 13 | ||||||
| 191 | Materion Corp. | 22 | ||||||
| 806 | Piedmont Lithium, Inc.(a) | 47 | ||||||
| 2,916 | Ryerson Holding Corp. | 126 | ||||||
| 5,772 | TimkenSteel Corp.(a) | 125 | ||||||
| 365 | United States Steel Corp. | 9 | ||||||
| 137 | Warrior Met Coal, Inc. | 5 | ||||||
| 1,868 | Worthington Industries, Inc. | 130 | ||||||
| 1,561 | ||||||||
Shares | Security Description | Value | ||||||
Mortgage Real Estate Investment Trusts — 1.47% | ||||||||
| 17,446 | Arbor Realty Trust, Inc.^ | $ | 258 | |||||
| 4,822 | Arlington Asset Investment Corp., Class - A(a) | 22 | ||||||
| 20,250 | ARMOUR Residential REIT, Inc. | 108 | ||||||
| 7,810 | BrightSpire Capital, Inc. | 53 | ||||||
| 15,923 | Chimera Investment Corp. | 92 | ||||||
| 11,938 | Claros Mortgage Trust, Inc. | 135 | ||||||
| 1,873 | Hannon Armstrong Sustainable Infrastructure Capital, Inc. | 47 | ||||||
| 1,597 | MFA Financial, Inc. | 18 | ||||||
| 14,159 | PennyMac Mortgage Investment Trust | 191 | ||||||
| 16,185 | Ready Capital Corp. | 183 | ||||||
| 1,107 | ||||||||
Multi-Utilities — 0.21% | ||||||||
| 367 | Avista Corp. | 14 | ||||||
| 839 | NorthWestern Corp. | 48 | ||||||
| 1,964 | Unitil Corp. | 100 | ||||||
| 162 | ||||||||
Office REITs — 0.35% | ||||||||
| 2,446 | Corporate Office Properties Trust | 58 | ||||||
| 10,075 | Easterly Government Properties, Inc. | 146 | ||||||
| 2,891 | Equity Commonwealth | 59 | ||||||
| 263 | ||||||||
Oil, Gas & Consumable Fuels — 4.43% | ||||||||
| 3,497 | Antero Resources Corp.(a) | 81 | ||||||
| 1,094 | Arch Resources, Inc. | 123 | ||||||
| 21,728 | Baytex Energy Corp.(a) | 71 | ||||||
| 8,761 | Berry Corp. | 60 | ||||||
| 2,300 | California Resources Corp. | 104 | ||||||
| 3,626 | Callon Petroleum Co.(a) | 127 | ||||||
| 543 | Civitas Resources, Inc. | 38 | ||||||
| 5,265 | Clean Energy Fuels Corp.(a) | 26 | ||||||
| 8,222 | CNX Resources Corp.(a) | 146 | ||||||
| 9,016 | Comstock Resources, Inc. | 105 | ||||||
| 2,431 | CONSOL Energy, Inc. | 165 | ||||||
| 5,132 | Delek US Holdings, Inc. | 123 | ||||||
| 2,880 | DHT Holdings, Inc. | 25 | ||||||
| 8,623 | Earthstone Energy, Inc., Class - A(a) | 123 | ||||||
| 24,166 | Energy Fuels, Inc.(a) | 151 | ||||||
| 2,568 | Evolution Petroleum Corp. | 21 | ||||||
| 2,312 | Golar LNG Ltd. | 47 | ||||||
| 1,636 | Green Plains, Inc.(a) | 53 | ||||||
| 2,159 | Gulfport Energy Corp.(a) | 227 | ||||||
| 635 | International Seaways, Inc. | 24 | ||||||
| 4,980 | Kinetik Holdings, Inc. | 175 | ||||||
| 20,751 | Kosmos Energy Ltd.(a) | 124 | ||||||
| 268 | Matador Resources Co. | 14 | ||||||
| 21,248 | Navigator Holdings Ltd.(a) | 275 | ||||||
| 2,578 | Nordic American Tankers Ltd. | 9 | ||||||
See accompanying notes to financial statements.
70
HC CAPITAL TRUST
The Small Capitalization-Mid Capitalization Equity Portfolio
Portfolio of Investments (continued) — June 30, 2023
Shares | Security Description | Value | ||||||
Common Stocks (continued) | ||||||||
Oil, Gas & Consumable Fuels (continued) | ||||||||
| 3,747 | Ovintiv, Inc. | $ | 143 | |||||
| 592 | Par Pacific Holdings, Inc.(a) | 16 | ||||||
| 291 | PDC Energy, Inc. | 21 | ||||||
| 1,094 | Peabody Energy Corp. | 24 | ||||||
| 2,500 | Permian Resources Corp. | 27 | ||||||
| 2,186 | Range Resources Corp. | 64 | ||||||
| 156 | REX American Resources Corp.(a) | 5 | ||||||
| 588 | Scorpio Tankers, Inc. | 28 | ||||||
| 11,093 | SFL Corp. Ltd. | 103 | ||||||
| 4,362 | Sitio Royalties Corp., Class - A | 115 | ||||||
| 419 | SM Energy Co. | 13 | ||||||
| 30,524 | Southwestern Energy Co.(a) | 183 | ||||||
| 1,128 | Talos Energy, Inc.(a) | 16 | ||||||
| 16,036 | Uranium Energy Corp.(a) | 55 | ||||||
| 450 | Vital Energy, Inc.(a) | 20 | ||||||
| 3,016 | World Kinect Corp. | 62 | ||||||
| 3,332 | ||||||||
Paper & Forest Products — 0.10% | ||||||||
| 16,519 | Glatfelter Corp. | 50 | ||||||
| 716 | Sylvamo Corp. | 29 | ||||||
| 79 | ||||||||
Passenger Airlines — 0.84% | ||||||||
| 2,185 | Allegiant Travel Co.(a) | 276 | ||||||
| 24,579 | Controladora Vuela Cia de Aviacion SAB de CV, ADR(a) | 343 | ||||||
| 817 | Spirit Airlines, Inc. | 14 | ||||||
| 633 | ||||||||
Personal Care Products — 0.79% | ||||||||
| 3,023 | e.l.f. Beauty, Inc.(a) | 346 | ||||||
| 2,135 | Herbalife Ltd.(a) | 28 | ||||||
| 853 | Inter Parfums, Inc. | 115 | ||||||
| 596 | Medifast, Inc. | 55 | ||||||
| 756 | USANA Health Sciences, Inc.(a) | 48 | ||||||
| 592 | ||||||||
Pharmaceuticals — 1.80% | ||||||||
| 5,164 | Amphastar Pharmaceuticals, Inc.(a) | 297 | ||||||
| 7,009 | Amylyx Pharmaceuticals, Inc.(a) | 151 | ||||||
| 166 | ANI Pharmaceuticals, Inc.(a) | 9 | ||||||
| 3,858 | Arvinas, Inc.(a) | 96 | ||||||
| 32,150 | Athira Pharma, Inc.(a) | 95 | ||||||
| 166 | Axsome Therapeutics, Inc.(a) | 12 | ||||||
| 6,689 | Cara Therapeutics, Inc.(a) | 19 | ||||||
| 1,428 | Cassava Sciences, Inc.^(a) | 35 | ||||||
| 376 | Corcept Therapeutics, Inc.(a) | 8 | ||||||
| 1,414 | DICE Therapeutics, Inc.(a) | 66 | ||||||
| 2,328 | Harmony Biosciences Holdings, Inc.(a) | 82 | ||||||
| 1,228 | Harrow Health, Inc.(a) | 23 | ||||||
Shares | Security Description | Value | ||||||
Pharmaceuticals (continued) | ||||||||
| 711 | Intra-Cellular Therapies, Inc.(a) | $ | 45 | |||||
| 771 | Ligand Pharmaceuticals, Inc.(a) | 56 | ||||||
| 1,160 | Ocular Therapeutix, Inc.(a) | 6 | ||||||
| 2,423 | Pacira BioSciences, Inc.(a) | 97 | ||||||
| 15,971 | Paratek Pharmaceuticals, Inc.(a) | 35 | ||||||
| 3,964 | Pliant Therapeutics, Inc.(a) | 72 | ||||||
| 1,583 | Prestige Consumer Healthcare, Inc.(a) | 94 | ||||||
| 1,709 | Supernus Pharmaceuticals, Inc.(a) | 51 | ||||||
| 850 | Zevra Therapeutics, Inc.^(a) | 4 | ||||||
| 1,353 | ||||||||
Professional Services — 2.61% | ||||||||
| 917 | ASGN, Inc.(a) | 69 | ||||||
| 3,150 | Asure Software, Inc.(a) | 38 | ||||||
| 62 | Booz Allen Hamilton Holding Corp. | 7 | ||||||
| 20 | CACI International, Inc., Class - A(a) | 7 | ||||||
| 1,815 | CBIZ, Inc.(a) | 97 | ||||||
| 34 | Concentrix Corp. | 3 | ||||||
| 10,305 | Conduent, Inc.(a) | 35 | ||||||
| 3,772 | CSG Systems International, Inc. | 199 | ||||||
| 514 | ExlService Holdings, Inc.(a) | 78 | ||||||
| 217 | Huron Consulting Group, Inc.(a) | 18 | ||||||
| 373 | ICF International, Inc. | 46 | ||||||
| 35 | Insperity, Inc. | 4 | ||||||
| 254 | Jack Henry & Associates, Inc. | 43 | ||||||
| 8,993 | KBR, Inc. | 585 | ||||||
| 594 | Kelly Services, Inc., Class - A | 10 | ||||||
| 2,004 | Kforce, Inc. | 126 | ||||||
| 1,998 | Korn Ferry | 99 | ||||||
| 1,668 | Legalzoom.com, Inc.(a) | 20 | ||||||
| 979 | Maximus, Inc. | 83 | ||||||
| 9,154 | Mistras Group, Inc.(a) | 71 | ||||||
| 1,129 | NV5 Global, Inc.(a) | 125 | ||||||
| 1,018 | Science Applications International Corp. | 115 | ||||||
| 1,183 | Sterling Check Corp.(a) | 15 | ||||||
| 428 | TTEC Holdings, Inc. | 14 | ||||||
| 1,649 | Upwork, Inc.(a) | 15 | ||||||
| 2,286 | Verra Mobility Corp.(a) | 45 | ||||||
| 1,967 | ||||||||
Real Estate Management & Development — 0.77% | ||||||||
| 683 | BBX Capital, Inc.(a) | 5 | ||||||
| 19,492 | Compass, Inc., Class - A(a) | 68 | ||||||
| 4,937 | Cushman & Wakefield PLC(a) | 40 | ||||||
| 2,814 | DigitalBridge Group, Inc. | 41 | ||||||
| 14,871 | eXp World Holdings, Inc. | 302 | ||||||
| 2,492 | Marcus & Millichap, Inc. | 79 | ||||||
| 6,938 | Newmark Group, Inc., Class - A | 43 | ||||||
| 578 | ||||||||
Residential REITs — 0.72% | ||||||||
| 468 | Centerspace | 29 | ||||||
See accompanying notes to financial statements.
71
HC CAPITAL TRUST
The Small Capitalization-Mid Capitalization Equity Portfolio
Portfolio of Investments (continued) — June 30, 2023
Shares | Security Description | Value | ||||||
Common Stocks (continued) | ||||||||
Residential REITs (continued) | ||||||||
| 14,013 | Clipper Realty, Inc. | $ | 79 | |||||
| 9,054 | Elme Communities | 149 | ||||||
| 2,757 | Independence Realty Trust, Inc. | 50 | ||||||
| 3,934 | NexPoint Residential Trust, Inc. | 179 | ||||||
| 3,365 | Veris Residential, Inc.(a) | 54 | ||||||
| 540 | ||||||||
Retail REITs — 1.83% | ||||||||
| 2,894 | Acadia Realty Trust | 42 | ||||||
| 6,119 | Getty Realty Corp. | 207 | ||||||
| 4,895 | InvenTrust Properties Corp. | 113 | ||||||
| 3,897 | Kite Realty Group Trust | 87 | ||||||
| 9,255 | NETSTREIT Corp. | 165 | ||||||
| 13,908 | Retail Opportunity Investments Corp. | 188 | ||||||
| 6,561 | SITE Centers Corp. | 87 | ||||||
| 11,883 | Tanger Factory Outlet Centers, Inc. | 262 | ||||||
| 7,560 | The Macerich Co. | 85 | ||||||
| 9,261 | Urban Edge Properties | 143 | ||||||
| 1,379 | ||||||||
Semiconductors & Semiconductor Equipment — 3.26% | ||||||||
| 485 | Alpha & Omega Semiconductor Ltd.(a) | 16 | ||||||
| 3,622 | Amkor Technology, Inc. | 108 | ||||||
| 3,803 | Atomera, Inc.^(a) | 33 | ||||||
| 3,010 | AXT, Inc.(a) | 10 | ||||||
| 55 | Cirrus Logic, Inc.(a) | 4 | ||||||
| 1,496 | Credo Technology Group Holding Ltd.(a) | 26 | ||||||
| 169 | Diodes, Inc.(a) | 16 | ||||||
| 3,557 | FormFactor, Inc.(a) | 122 | ||||||
| 403 | Ichor Holdings Ltd.(a) | 15 | ||||||
| 188 | Impinj, Inc.(a) | 17 | ||||||
| 1,091 | Lattice Semiconductor Corp.(a) | 105 | ||||||
| 9,557 | MACOM Technology Solutions Holdings, Inc.(a) | 627 | ||||||
| 2,797 | MaxLinear, Inc.(a) | 88 | ||||||
| 624 | MKS Instruments, Inc. | 67 | ||||||
| 631 | Onto Innovation, Inc.(a) | 73 | ||||||
| 629 | Photronics, Inc.(a) | 16 | ||||||
| 2,203 | Power Integrations, Inc. | 209 | ||||||
| 2,745 | Qorvo, Inc.(a) | 280 | ||||||
| 2,076 | Semtech Corp.(a) | 53 | ||||||
| 1,083 | Silicon Laboratories, Inc.(a) | 171 | ||||||
| 185 | SiTime Corp.(a) | 22 | ||||||
| 683 | SkyWater Technology, Inc.(a) | 6 | ||||||
| 799 | Synaptics, Inc.(a) | 68 | ||||||
| 1,918 | Ultra Clean Holdings, Inc.(a) | 74 | ||||||
| 1,179 | Universal Display Corp. | 170 | ||||||
| 2,283 | Veeco Instruments, Inc.(a) | 59 | ||||||
| 2,455 | ||||||||
Shares | Security Description | Value | ||||||
Software — 4.96% | ||||||||
| 3,490 | A10 Networks, Inc. | $ | 51 | |||||
| 410 | Agilysys, Inc.(a) | 28 | ||||||
| 416 | Alarm.com Holdings, Inc.(a) | 21 | ||||||
| 1,591 | Alkami Technology, Inc.(a) | 26 | ||||||
| 829 | Altair Engineering, Inc., Class - A(a) | 63 | ||||||
| 343 | Alteryx, Inc., Class - A(a) | 16 | ||||||
| 289 | Appfolio, Inc., Class - A(a) | 50 | ||||||
| 4,688 | Appian Corp., Class - A(a) | 223 | ||||||
| 101 | BlackLine, Inc.(a) | 5 | ||||||
| 1,089 | Box, Inc., Class - A(a) | 32 | ||||||
| 442 | Cerence, Inc.(a) | 13 | ||||||
| 624 | Clear Secure, Inc., Class - A | 14 | ||||||
| 574 | CommVault Systems, Inc.(a) | 42 | ||||||
| 1,007 | CoreCard Corp.(a) | 26 | ||||||
| 356 | Couchbase, Inc.(a) | 6 | ||||||
| 313 | Digimarc Corp.(a) | 9 | ||||||
| 1,721 | Digital Turbine, Inc.(a) | 16 | ||||||
| 34 | Dolby Laboratories, Inc., Class - A | 3 | ||||||
| 8,738 | E2open Parent Holdings, Inc.(a) | 49 | ||||||
| 1,243 | Everbridge, Inc.(a) | 33 | ||||||
| 3,738 | EverCommerce, Inc.(a) | 44 | ||||||
| 846 | Guidewire Software, Inc.(a) | 64 | ||||||
| 3,676 | InterDigital, Inc. | 356 | ||||||
| 1,284 | LiveRamp Holdings, Inc.(a) | 37 | ||||||
| 5,806 | Marathon Digital Holdings, Inc.^(a) | 80 | ||||||
| 2,965 | MeridianLink, Inc.(a) | 62 | ||||||
| 722 | MicroStrategy, Inc.(a) | 247 | ||||||
| 6,215 | Model N, Inc.(a) | 220 | ||||||
| 16,199 | N-able, Inc.(a) | 233 | ||||||
| 55,831 | NextNav, Inc.^(a) | 164 | ||||||
| 647 | PowerSchool Holdings, Inc.(a) | 12 | ||||||
| 674 | Progress Software Corp. | 39 | ||||||
| 5,413 | PROS Holdings, Inc.(a) | 167 | ||||||
| 868 | PTC, Inc.(a) | 124 | ||||||
| 680 | Qualys, Inc.(a) | 88 | ||||||
| 11,757 | Riot Platforms, Inc.(a) | 139 | ||||||
| 3,998 | Sapiens International Corp. N.V. | 106 | ||||||
| 311 | Sprout Social, Inc., Class - A(a) | 14 | ||||||
| 831 | SPS Commerce, Inc.(a) | 160 | ||||||
| 781 | Tenable Holdings, Inc.(a) | 34 | ||||||
| 979 | Verint Systems, Inc.(a) | 34 | ||||||
| 5,545 | Veritone, Inc.(a) | 22 | ||||||
| 3,774 | Viant Technology, Inc., Class - A(a) | 17 | ||||||
| 18,867 | Weave Communications, Inc.(a) | 210 | ||||||
| 1,438 | Workiva, Inc.(a) | 146 | ||||||
| 21,286 | Zeta Global Holdings Corp., Class - A(a) | 182 | ||||||
| 3,727 | ||||||||
Specialized REITs — 0.26% | ||||||||
| 681 | Farmland Partners, Inc. | 8 | ||||||
See accompanying notes to financial statements.
72
HC CAPITAL TRUST
The Small Capitalization-Mid Capitalization Equity Portfolio
Portfolio of Investments (continued) — June 30, 2023
Shares | Security Description | Value | ||||||
Common Stocks (continued) | ||||||||
Specialized REITs (continued) | ||||||||
| 2,615 | Four Corners Property Trust, Inc. | $ | 66 | |||||
| 1,574 | National Storage Affiliates Trust | 55 | ||||||
| 1,185 | PotlatchDeltic Corp. | 63 | ||||||
| 192 | ||||||||
Specialty Retail — 2.66% | ||||||||
| 1,447 | American Eagle Outfitters, Inc. | 17 | ||||||
| 520 | Asbury Automotive Group, Inc.(a) | 125 | ||||||
| 7,464 | Big 5 Sporting Goods Corp. | 68 | ||||||
| 3,328 | Boot Barn Holdings, Inc.(a) | 282 | ||||||
| 790 | Camping World Holdings, Inc., Class - A | 24 | ||||||
| 1,006 | Citi Trends, Inc.(a) | 18 | ||||||
| 1,779 | Floor & Decor Holdings, Inc., Class - A(a) | 185 | ||||||
| 1,682 | Franchise Group, Inc.^ | 48 | ||||||
| 1,806 | Genesco, Inc.(a) | 45 | ||||||
| 72 | Group 1 Automotive, Inc. | 19 | ||||||
| 1,362 | Guess?, Inc. | 26 | ||||||
| 607 | Lands’ End, Inc.(a) | 5 | ||||||
| 334 | Lithia Motors, Inc. | 102 | ||||||
| 324 | Murphy USA, Inc. | 101 | ||||||
| 53 | Penske Automotive Group, Inc. | 9 | ||||||
| 12,041 | Rent the Runway, Inc., Class - A^(a) | 24 | ||||||
| 231 | Restoration Hardware Co.(a) | 76 | ||||||
| 8,507 | RumbleON, Inc., Class - B^(a) | 105 | ||||||
| 4,562 | Sally Beauty Holdings, Inc.(a) | 56 | ||||||
| 708 | Shoe Carnival, Inc. | 17 | ||||||
| 158 | Signet Jewelers Ltd. | 10 | ||||||
| 845 | Sonic Automotive, Inc., Class - A | 40 | ||||||
| 7,426 | Sportsman’s Warehouse Holdings, Inc.(a) | 42 | ||||||
| 468 | The Aaron’s Co., Inc. | 7 | ||||||
| 5,179 | The Buckle, Inc. | 179 | ||||||
| 6,679 | The Cato Corp., Class - A | 54 | ||||||
| 1,633 | The ODP Corp.(a) | 76 | ||||||
| 10,683 | Tile Shop Holdings, Inc.(a) | 59 | ||||||
| 5,911 | Upbound Group, Inc. | 184 | ||||||
| 2,003 | ||||||||
Technology Hardware, Storage & Peripherals — 0.45% | ||||||||
| 1,912 | Avid Technology, Inc.(a) | 49 | ||||||
| 3,289 | Corsair Gaming, Inc.(a) | 58 | ||||||
| 455 | Super Micro Computer, Inc.(a) | 113 | ||||||
| 10,262 | Turtle Beach Corp.(a) | 120 | ||||||
| 340 | ||||||||
Textiles, Apparel & Luxury Goods — 0.80% | ||||||||
| 47 | Columbia Sportswear Co. | 4 | ||||||
| 1,065 | Crocs, Inc.(a) | 120 | ||||||
| 30,652 | Fossil Group, Inc.(a) | 79 | ||||||
| 792 | G-III Apparel Group Ltd.(a) | 15 | ||||||
| 2,897 | Kontoor Brands, Inc. | 122 | ||||||
| 1,965 | Oxford Industries, Inc. | 193 | ||||||
Shares | Security Description | Value | ||||||
Textiles, Apparel & Luxury Goods (continued) | ||||||||
| 412 | Steven Madden Ltd. | $ | 13 | |||||
| 6,690 | Unifi, Inc.(a) | 54 | ||||||
| 600 | ||||||||
Tobacco — 0.29% | ||||||||
| 3,615 | Universal Corp. | 181 | ||||||
| 2,760 | Vector Group Ltd. | 35 | ||||||
| 216 | ||||||||
Trading Companies & Distributors — 1.83% | ||||||||
| 63 | Applied Industrial Technologies, Inc. | 9 | ||||||
| 5,077 | Beacon Roofing Supply, Inc.(a) | 421 | ||||||
| 563 | Boise Cascade Co. | 51 | ||||||
| 4,627 | Custom Truck One Source, Inc.(a) | 31 | ||||||
| 200 | DXP Enterprises, Inc.(a) | 7 | ||||||
| 192 | GMS, Inc.(a) | 13 | ||||||
| 1,021 | Herc Holdings, Inc. | 140 | ||||||
| 749 | McGrath RentCorp | 69 | ||||||
| 22,328 | MRC Global, Inc.(a) | 225 | ||||||
| 1,578 | Rush Enterprises, Inc., Class - A | 96 | ||||||
| 548 | SiteOne Landscape Supply, Inc.(a) | 92 | ||||||
| 3,875 | Textainer Group Holdings Ltd. | 153 | ||||||
| 295 | Veritiv Corp. | 37 | ||||||
| 166 | WESCO International, Inc. | 30 | ||||||
| 1,374 | ||||||||
Water Utilities — 0.83% | ||||||||
| 161 | American States Water Co. | 14 | ||||||
| 1,709 | Cadiz, Inc.(a) | 7 | ||||||
| 2,265 | California Water Service Group | 117 | ||||||
| 602 | Global Water Resources, Inc. | 8 | ||||||
| 2,418 | Middlesex Water Co. | 195 | ||||||
| 2,918 | SJW Group | 205 | ||||||
| 1,877 | The York Water Co. | 77 | ||||||
| 623 | ||||||||
Wireless Telecommunication Services — 0.20% | ||||||||
| 3,024 | Gogo, Inc.(a) | 51 | ||||||
| 2,631 | Shenandoah Telecommunications Co. | 51 | ||||||
| 5,820 | Telephone and Data Systems, Inc. | 48 | ||||||
| 150 | ||||||||
Total Common Stocks | 74,351 | |||||||
Contingent Rights — 0.07% | ||||||||
Biotechnology — 0.00% | ||||||||
| 1 | Tobira Therapeutics, Inc. CVR, 12/31/18(a)(b) | — | ||||||
Health Care Equipment & Supplies — 0.00% | ||||||||
| 56 | ABIOMED, Inc. CVR, 01/02/26(a) | — | ||||||
Health Care Providers & Services — 0.00% | ||||||||
| 5,589 | Xeris BioPharma Hold CVR, 10/06/49(a) | 1 | ||||||
Metals & Mining — 0.07% | ||||||||
| 108,208 | Pan American Silver Corp. CVR, 12/31/49(a) | 55 | ||||||
Total Contingent Rights | 56 | |||||||
See accompanying notes to financial statements.
73
HC CAPITAL TRUST
The Small Capitalization-Mid Capitalization Equity Portfolio
Portfolio of Investments (concluded) — June 30, 2023
Shares | Security Description | Value | ||||||
Investment Companies — 2.42% | ||||||||
| 1,086,084 | Federated Hermes Treasury Obligations Fund, Institutional Shares, 4.75%^^(c) | $ | 1,086 | |||||
| 734,440 | State Street Institutional Treasury Plus Money Market Fund, Trust Class, 4.97%(c) | 730 | ||||||
Total Investment Companies | 1,816 | |||||||
Total Investments (cost $43,300) — 101.32% | 76,223 | |||||||
Liabilities in excess of other assets — (1.32)% | (990 | ) | ||||||
Net Assets — 100.00% | $ | 75,233 | ||||||
Amounts designated as “—” are $0 or have been rounded to $0.
^ | All or part of this security was on loan as of June 30, 2023. |
^^ | Purchased with cash collateral held from securities lending. The value of the collateral could include collateral held for securities that were sold on or before June 30, 2023. |
(a) | Represents non-income producing security. |
(b) | Security was valued using significant unobservable inputs as of June 30, 2023. |
(c) | Annualized 7-day yield as of period-end. |
ADR—American Depositary Receipt |
REIT—Real Estate Investment Trust |
As of June 30, 2023, 100% of the Portfolio’s net assets were managed by Parametric Portfolio Associates, LLC. |
The following table reflects the open derivative positions held by the Portfolio as of June 30, 2023.
Futures Contracts Purchased*
Description | Number of | Expiration | Notional | Value and | ||||||||||||
Russell 2000 Mini Index Future | 3 | 9/15/23 | $ | 286 | $ | 3 | ||||||||||
| $ | 286 | $ | 3 | |||||||||||||
Total Unrealized Appreciation | $ | 3 | ||||||||||||||
Total Unrealized Depreciation | — | |||||||||||||||
Total Net Unrealized Appreciation/(Depreciation) | $ | 3 | ||||||||||||||
* | Cash has been pledged as collateral for futures contracts held by the Portfolio. |
See accompanying notes to financial statements.
74
HC CAPITAL TRUST
The ESG Growth Portfolio
Portfolio of Investments — June 30, 2023
Shares | Security Description | Value | ||||||
Common Stocks — 99.15% | ||||||||
Australia — 1.67% | ||||||||
| 693 | Ampol Ltd. (Oil, Gas & Consumable Fuels) | $ | 14 | |||||
| 7,235 | ANZ Group Holdings Ltd. (Banks) | 115 | ||||||
| 2,941 | APA Group (Gas Utilities) | 19 | ||||||
| 1,433 | Aristocrat Leisure Ltd. (Hotels, Restaurants & Leisure) | 37 | ||||||
| 485 | ASX Ltd. (Capital Markets) | 20 | ||||||
| 4,501 | Aurizon Holdings Ltd. (Ground Transportation) | 12 | ||||||
| 12,319 | BHP Group Ltd. (Metals & Mining) | 371 | ||||||
| 1,230 | BlueScope Steel Ltd. (Metals & Mining) | 17 | ||||||
| 3,525 | Brambles Ltd. (Commercial Services & Supplies) | 34 | ||||||
| 165 | Cochlear Ltd. (Health Care Equipment & Supplies) | 25 | ||||||
| 3,429 | Coles Group Ltd. (Consumer Staples Distribution & Retail) | 42 | ||||||
| 4,131 | Commonwealth Bank of Australia (Banks) | 277 | ||||||
| 1,360 | Computershare Ltd. (Professional Services) | 21 | ||||||
| 1,155 | CSL Ltd. (Biotechnology) | 214 | ||||||
| 2,615 | Dexus (Diversified REITs) | 14 | ||||||
| 504 | EBOS Group Ltd. (Health Care Providers & Services) | 11 | ||||||
| 3,057 | Endeavour Group Ltd. (Consumer Staples Distribution & Retail) | 13 | ||||||
| 4,206 | Fortescue Metals Group Ltd. (Metals & Mining) | 62 | ||||||
| 4,174 | Goodman Group (Industrial REITs) | 56 | ||||||
| 478 | IDP Education Ltd. (Diversified Consumer Services) | 7 | ||||||
| 1,340 | IGO Ltd. (Metals & Mining) | 14 | ||||||
| 5,779 | Insurance Australia Group Ltd. (Insurance) | 22 | ||||||
| 1,593 | Lendlease Corp. Ltd. (Real Estate Management & Development)(a) | 8 | ||||||
| 863 | Macquarie Group Ltd. (Capital Markets) | 103 | ||||||
| 7,667 | Medibank Pvt. Ltd. (Insurance) | 18 | ||||||
| 419 | Mineral Resources Ltd. (Metals & Mining) | 20 | ||||||
| 9,646 | Mirvac Group (Diversified REITs) | 15 | ||||||
| 7,556 | National Australia Bank Ltd. (Banks) | 133 | ||||||
| 2,021 | Newcrest Mining Ltd. (Metals & Mining) | 36 | ||||||
| 2,645 | Northern Star Resources Ltd. (Metals & Mining) | 22 | ||||||
| 927 | Orica Ltd. (Chemicals) | 9 | ||||||
| 4,121 | Origin Energy Ltd. (Electric Utilities) | 23 | ||||||
| 5,503 | Pilbara Minerals Ltd. (Metals & Mining) | 18 | ||||||
| 2,446 | Qantas Airways Ltd. (Passenger Airlines)(b) | 10 | ||||||
| 3,741 | QBE Insurance Group Ltd. (Insurance) | 39 | ||||||
| 427 | Ramsay Health Care Ltd. (Health Care Providers & Services) | 16 | ||||||
| 112 | REA Group Ltd. (Interactive Media & Services) | 11 | ||||||
| 687 | Reece Ltd. (Trading Companies & Distributors) | 9 | ||||||
| 914 | Rio Tinto Ltd. (Metals & Mining) | 70 | ||||||
Shares | Security Description | Value | ||||||
Australia (continued) | ||||||||
| 7,479 | Santos Ltd. (Oil, Gas & Consumable Fuels)(a) | $ | 37 | |||||
| 12,339 | Scentre Group (Retail REITs) | 22 | ||||||
| 923 | SEEK Ltd. (Interactive Media & Services) | 13 | ||||||
| 1,187 | Sonic Healthcare Ltd. (Health Care Providers & Services) | 28 | ||||||
| 11,701 | South32 Ltd. (Metals & Mining) | 29 | ||||||
| 5,512 | Stockland (Diversified REITs) | 15 | ||||||
| 3,312 | Suncorp Group Ltd. (Insurance) | 30 | ||||||
| 10,531 | Telstra Group Ltd. (Diversified Telecommunication Services) | 30 | ||||||
| 5,218 | The GPT Group (Diversified REITs) | 14 | ||||||
| 5,667 | The Lottery Corp. Ltd. (Hotels, Restaurants & Leisure) | 19 | ||||||
| 6,949 | Transurban Group (Transportation Infrastructure) | 66 | ||||||
| 2,004 | Treasury Wine Estates Ltd. (Beverages) | 15 | ||||||
| 8,881 | Vicinity Ltd. (Diversified REITs)(a) | 11 | ||||||
| 528 | Washington H Soul Pattinson & Co. Ltd. (Oil, Gas & Consumable Fuels) | 11 | ||||||
| 2,750 | Wesfarmers Ltd. (Broadline Retail) | 91 | ||||||
| 8,317 | Westpac Banking Corp. (Banks) | 118 | ||||||
| 358 | WiseTech Global Ltd. (Software) | 19 | ||||||
| 4,614 | Woodside Energy Group Ltd. (Oil, Gas & Consumable Fuels) | 107 | ||||||
| 3,057 | Woolworths Group Ltd. (Consumer Staples Distribution & Retail) | 81 | ||||||
| 2,733 | ||||||||
Austria — 0.04% | ||||||||
| 836 | Erste Group Bank AG (Banks)(a) | 29 | ||||||
| 383 | OMV AG (Oil, Gas & Consumable Fuels) | 16 | ||||||
| 160 | Verbund AG (Electric Utilities) | 13 | ||||||
| 246 | voestalpine AG (Metals & Mining) | 9 | ||||||
| 67 | ||||||||
Belgium — 0.86% | ||||||||
| 444 | Ageas SA/N.V. (Insurance) | 18 | ||||||
| 21,879 | Anheuser-Busch InBev SA/N.V. (Beverages) | 1,241 | ||||||
| 58 | D’ieteren Group (Distributors) | 10 | ||||||
| 67 | Elia Group SA/N.V. (Electric Utilities)(a) | 9 | ||||||
| 217 | Groupe Bruxelles Lambert N.V. (Financial Services) | 17 | ||||||
| 634 | KBC Group N.V. (Banks) | 44 | ||||||
| 31 | Sofina SA (Financial Services) | 6 | ||||||
| 183 | Solvay SA, Class - A (Chemicals) | 20 | ||||||
| 321 | UCB SA (Pharmaceuticals) | 28 | ||||||
| 491 | Umicore SA (Chemicals)(a) | 14 | ||||||
| 360 | Warehouses De Pauw CVA (Industrial REITs) | 10 | ||||||
| 1,417 | ||||||||
Bermuda — 0.06% | ||||||||
| 887 | Arch Capital Group Ltd. (Insurance)(b) | 66 | ||||||
See accompanying notes to financial statements.
75
HC CAPITAL TRUST
The ESG Growth Portfolio
Portfolio of Investments (continued) — June 30, 2023
Shares | Security Description | Value | ||||||
Common Stocks (continued) | ||||||||
Bermuda (continued) | ||||||||
| 98 | Everest Re Group Ltd. (Insurance) | $ | 34 | |||||
| 100 | ||||||||
Canada — 3.02% | ||||||||
| 1,240 | Agnico Eagle Mines Ltd. (Metals & Mining) | 62 | ||||||
| 400 | Air Canada (Passenger Airlines)(a)(b) | 8 | ||||||
| 1,126 | Algonquin Power & Utilities Corp. (Multi-Utilities) | 9 | ||||||
| 1,863 | Alimentation Couche-Tard, Inc. (Consumer Staples Distribution & Retail) | 96 | ||||||
| 800 | AltaGas Ltd. (Gas Utilities) | 14 | ||||||
| 1,804 | ARC Resources Ltd. (Oil, Gas & Consumable Fuels) | 24 | ||||||
| 1,617 | Bank of Montreal (Banks) | 146 | ||||||
| 4,364 | Barrick Gold Corp. (Metals & Mining) | 74 | ||||||
| 200 | BCE, Inc. (Diversified Telecommunication Services) | 9 | ||||||
| 861 | Brookfield Asset Management Ltd., Class - A (Capital Markets) | 28 | ||||||
| 3,443 | Brookfield Corp. (Capital Markets) | 116 | ||||||
| 92 | BRP, Inc. (Leisure Products) | 8 | ||||||
| 800 | CAE, Inc. (Aerospace & Defense)(b) | 18 | ||||||
| 996 | Cameco Corp. (Oil, Gas & Consumable Fuels) | 31 | ||||||
| 200 | Canadian Apartment Properties REIT (Residential REITs)(a) | 8 | ||||||
| 2,200 | Canadian Imperial Bank of Commerce (Banks) | 94 | ||||||
| 1,353 | Canadian National Railway Co. (Ground Transportation) | 164 | ||||||
| 2,726 | Canadian Natural Resources Ltd. (Oil, Gas & Consumable Fuels) | 153 | ||||||
| 2,256 | Canadian Pacific Kansas City Ltd. (Ground Transportation) | 182 | ||||||
| 143 | Canadian Tire Corp. Ltd., Class - A (Broadline Retail) | 20 | ||||||
| 300 | Canadian Utilities Ltd., Class - A (Multi-Utilities) | 8 | ||||||
| 299 | CCL Industries, Inc. (Containers & Packaging)(a) | 15 | ||||||
| 3,493 | Cenovus Energy, Inc. (Oil, Gas & Consumable Fuels) | 59 | ||||||
| 500 | CGI, Inc. (IT Services)(b) | 53 | ||||||
| 49 | Constellation Software, Inc. (Software) | 102 | ||||||
| 700 | Dollarama, Inc. (Broadline Retail) | 47 | ||||||
| 850 | Element Fleet Management Corp. (Financial Services)(a) | 13 | ||||||
| 600 | Emera, Inc. (Electric Utilities) | 25 | ||||||
| 400 | Empire Co. Ltd. (Consumer Staples Distribution & Retail) | 11 | ||||||
| 4,900 | Enbridge, Inc. (Oil, Gas & Consumable Fuels) | 182 | ||||||
Shares | Security Description | Value | ||||||
Canada (continued) | ||||||||
| 19,836 | First Quantum Minerals Ltd. (Metals & Mining) | $ | 470 | |||||
| 100 | FirstService Corp. (Real Estate Management & Development) | 15 | ||||||
| 1,100 | Fortis, Inc. (Electric Utilities) | 47 | ||||||
| 458 | Franco-Nevada Corp. (Metals & Mining) | 65 | ||||||
| 144 | George Weston Ltd. (Consumer Staples Distribution & Retail) | 17 | ||||||
| 500 | Gildan Activewear, Inc. (Textiles, Apparel & Luxury Goods) | 16 | ||||||
| 600 | Great-West Lifeco, Inc. (Insurance) | 17 | ||||||
| 800 | Hydro One Ltd. (Electric Utilities)(a) | 23 | ||||||
| 300 | iA Financial Corp., Inc. (Insurance) | 20 | ||||||
| 200 | IGM Financial, Inc. (Capital Markets) | 6 | ||||||
| 537 | Imperial Oil Ltd. (Oil, Gas & Consumable Fuels) | 27 | ||||||
| 419 | Intact Financial Corp. (Insurance) | 65 | ||||||
| 956 | Ivanhoe Mines Ltd. (Metals & Mining)(b) | 9 | ||||||
| 600 | Keyera Corp. (Oil, Gas & Consumable Fuels) | 14 | ||||||
| 3,200 | Kinross Gold Corp. (Metals & Mining) | 15 | ||||||
| 400 | Loblaw Cos. Ltd. (Consumer Staples Distribution & Retail) | 37 | ||||||
| 281 | Lululemon Athletica, Inc. (Textiles, Apparel & Luxury Goods)(b) | 106 | ||||||
| 1,400 | Lundin Mining Corp. (Metals & Mining)(a) | 11 | ||||||
| 700 | Magna International, Inc. (Automobile Components) | 40 | ||||||
| 4,249 | Manulife Financial Corp. (Insurance) | 80 | ||||||
| 600 | Metro, Inc. (Consumer Staples Distribution & Retail) | 34 | ||||||
| 800 | National Bank of Canada (Banks) | 60 | ||||||
| 500 | Northland Power, Inc. (Independent Power and Renewable Electricity Producers) | 10 | ||||||
| 1,237 | Nutrien Ltd. (Chemicals) | 73 | ||||||
| 150 | Nuvei Corp. (Financial Services)(b) | 4 | ||||||
| 200 | Onex Corp. (Financial Services) | 11 | ||||||
| 700 | Open Text Corp. (Software)(a) | 29 | ||||||
| 990 | Pan American Silver Corp. (Metals & Mining) | 14 | ||||||
| 400 | Parkland Corp. (Oil, Gas & Consumable Fuels)(a) | 10 | ||||||
| 1,400 | Pembina Pipeline Corp. (Oil, Gas & Consumable Fuels) | 44 | ||||||
| 1,350 | Power Corp. of Canada (Insurance) | 36 | ||||||
| 500 | Quebecor, Inc., Class - B (Media) | 12 | ||||||
| 387 | RB Global, Inc. (Commercial Services & Supplies) | 23 | ||||||
| 700 | Restaurant Brands International, Inc. (Hotels, Restaurants & Leisure) | 54 | ||||||
| 300 | RioCan Real Estate Investment Trust (Diversified REITs)(a) | 4 | ||||||
| 900 | Rogers Communications, Inc., Class - B (Wireless Telecommunication Services) | 41 | ||||||
See accompanying notes to financial statements.
76
HC CAPITAL TRUST
The ESG Growth Portfolio
Portfolio of Investments (continued) — June 30, 2023)
Shares | Security Description | Value | ||||||
Common Stocks (continued) | ||||||||
Canada (continued) | ||||||||
| 3,380 | Royal Bank of Canada (Banks) | $ | 324 | |||||
| 691 | Saputo, Inc. (Food Products)(a) | 15 | ||||||
| 2,858 | Shopify, Inc., Class - A (IT Services)(b) | 186 | ||||||
| 1,400 | Sun Life Financial, Inc. (Insurance) | 73 | ||||||
| 3,289 | Suncor Energy, Inc. (Oil, Gas & Consumable Fuels) | 96 | ||||||
| 2,399 | TC Energy Corp. (Oil, Gas & Consumable Fuels) | 97 | ||||||
| 1,135 | Teck Resources Ltd., Class - B (Metals & Mining) | 48 | ||||||
| 1,000 | TELUS Corp. (Diversified Telecommunication Services) | 19 | ||||||
| 213 | TFI International, Inc. (Ground Transportation) | 24 | ||||||
| 2,896 | The Bank of Nova Scotia (Banks) | 145 | ||||||
| 192 | The Descartes Systems Group, Inc. (Software)(b) | 15 | ||||||
| 4,436 | The Toronto-Dominion Bank (Banks) | 276 | ||||||
| 385 | Thomson Reuters Corp. (Professional Services) | 52 | ||||||
| 500 | TMX Group Ltd. (Capital Markets) | 11 | ||||||
| 200 | Toromont Industries Ltd. (Trading Companies & Distributors) | 16 | ||||||
| 737 | Tourmaline Oil Corp. (Oil, Gas & Consumable Fuels) | 35 | ||||||
| 620 | Waste Connections, Inc. (Commercial Services & Supplies) | 89 | ||||||
| 136 | West Fraser Timber Co. Ltd. (Paper & Forest Products) | 12 | ||||||
| 1,100 | Wheaton Precious Metals Corp. (Metals & Mining) | 48 | ||||||
| 300 | WSP Global, Inc. (Construction & Engineering) | 40 | ||||||
| 4,959 | ||||||||
Cayman Islands — 0.01% | ||||||||
| 6,000 | Sands China Ltd. (Hotels, Restaurants & Leisure)(b) | 21 | ||||||
Chile — 0.01% | ||||||||
| 961 | Antofagasta PLC (Metals & Mining) | 18 | ||||||
Denmark — 0.70% | ||||||||
| 8 | A.P. Moller - Maersk A/S, Class - A (Marine Transportation) | 14 | ||||||
| 11 | A.P. Moller - Maersk A/S, Class - B (Marine Transportation) | 19 | ||||||
| 251 | Carlsberg A/S, Class - B (Beverages) | 40 | ||||||
| 263 | Chr Hansen Holding A/S (Chemicals)(a) | 18 | ||||||
| 302 | Coloplast A/S, Class - B (Health Care Equipment & Supplies) | 38 | ||||||
| 1,609 | Danske Bank A/S (Banks)(b) | 39 | ||||||
| 292 | Demant A/S (Health Care Equipment & Supplies)(b) | 12 | ||||||
| 432 | DSV A/S (Air Freight & Logistics) | 91 | ||||||
| 165 | Genmab A/S (Biotechnology)(a)(b) | 63 | ||||||
Shares | Security Description | Value | ||||||
Denmark (continued) | ||||||||
| 3,994 | Novo Nordisk A/S, Class - B (Pharmaceuticals) | $ | 646 | |||||
| 501 | Novozymes A/S, Class - B (Chemicals) | 23 | ||||||
| 457 | Orsted A/S (Electric Utilities)(a) | 43 | ||||||
| 245 | Pandora A/S (Textiles, Apparel & Luxury Goods) | 22 | ||||||
| 18 | ROCKWOOL A/S, Class - B (Building Products) | 5 | ||||||
| 810 | Tryg A/S (Insurance)(a) | 18 | ||||||
| 2,458 | Vestas Wind Systems A/S (Electrical Equipment)(b) | 65 | ||||||
| 1,156 | ||||||||
Finland — 0.25% | ||||||||
| 360 | Elisa Oyj (Diversified Telecommunication Services) | 19 | ||||||
| 1,122 | Fortum Oyj (Electric Utilities) | 15 | ||||||
| 684 | Kesko Oyj, Class - B (Consumer Staples Distribution & Retail) | 13 | ||||||
| 864 | Kone Oyj, Class - B (Machinery) | 45 | ||||||
| 1,552 | Metso Oyj (Machinery)(a) | 19 | ||||||
| 1,074 | Neste Oyj (Oil, Gas & Consumable Fuels) | 41 | ||||||
| 13,185 | Nokia Oyj (Communications Equipment) | 55 | ||||||
| 7,421 | Nordea Bank Abp (Banks) | 82 | ||||||
| 243 | Orion Oyj, Class - B (Pharmaceuticals) | 10 | ||||||
| 1,090 | Sampo Oyj, A Shares (Insurance) | 49 | ||||||
| 1,360 | Stora Enso Oyj, Registered Shares (Paper & Forest Products) | 16 | ||||||
| 1,356 | UPM-Kymmene Oyj (Paper & Forest Products) | 40 | ||||||
| 1,231 | Wartsila Oyj Abp (Machinery) | 14 | ||||||
| 418 | ||||||||
France — 3.61% | ||||||||
| 434 | Accor SA (Hotels, Restaurants & Leisure) | 16 | ||||||
| 91 | Aeroports de Paris (Transportation Infrastructure) | 13 | ||||||
| 1,269 | Air Liquide SA (Chemicals) | 228 | ||||||
| 1,431 | Airbus SE (Aerospace & Defense) | 207 | ||||||
| 826 | Alstom SA (Machinery) | 25 | ||||||
| 152 | Amundi SA (Capital Markets) | 9 | ||||||
| 151 | Arkema SA (Chemicals) | 14 | ||||||
| 4,245 | AXA SA (Insurance) | 125 | ||||||
| 104 | BioMerieux (Health Care Equipment & Supplies) | 11 | ||||||
| 2,734 | BNP Paribas SA (Banks) | 173 | ||||||
| 566 | Bouygues SA (Construction & Engineering) | 19 | ||||||
| 727 | Bureau Veritas SA (Professional Services)(a) | 20 | ||||||
| 403 | Capgemini SE (IT Services) | 76 | ||||||
| 1,562 | Carrefour SA (Consumer Staples Distribution & Retail)(a) | 30 | ||||||
| 1,237 | Cie de Saint-Gobain (Building Products) | 75 | ||||||
| 1,612 | Cie Generale des Etablissements Michelin SCA (Automobile Components) | 48 | ||||||
| 124 | Covivio SA (Diversified REITs) | 6 | ||||||
| 2,961 | Credit Agricole SA (Banks) | 35 | ||||||
See accompanying notes to financial statements.
77
HC CAPITAL TRUST
The ESG Growth Portfolio
Portfolio of Investments (continued) — June 30, 2023
Shares | Security Description | Value | ||||||
Common Stocks (continued) | ||||||||
France (continued) | ||||||||
| 1,592 | Danone SA (Food Products) | $ | 98 | |||||
| 1,520 | Dassault Systemes SE (Software) | 67 | ||||||
| 640 | Edenred (Financial Services) | 43 | ||||||
| 195 | Eiffage SA (Construction & Engineering)(a) | 20 | ||||||
| 4,212 | Engie SA (Multi-Utilities) | 70 | ||||||
| 720 | EssilorLuxottica SA (Health Care Equipment & Supplies) | 136 | ||||||
| 78 | Eurazeo SE (Financial Services) | 5 | ||||||
| 116 | Gecina SA (Office REITs)(a) | 12 | ||||||
| 828 | Getlink SE (Transportation Infrastructure) | 14 | ||||||
| 77 | Hermes International (Textiles, Apparel & Luxury Goods) | 167 | ||||||
| 89 | Ipsen SA (Pharmaceuticals) | 11 | ||||||
| 184 | Kering SA (Textiles, Apparel & Luxury Goods) | 102 | ||||||
| 568 | Klepierre SA (Retail REITs) | 14 | ||||||
| 256 | La Francaise des Jeux SAEM (Hotels, Restaurants & Leisure) | 10 | ||||||
| 606 | Legrand SA (Electrical Equipment) | 60 | ||||||
| 583 | L’Oreal SA (Personal Care Products) | 272 | ||||||
| 1,325 | LVMH Moet Hennessy Louis Vuitton SE (Textiles, Apparel & Luxury Goods) | 1,249 | ||||||
| 4,724 | Orange SA (Diversified Telecommunication Services)(a) | 55 | ||||||
| 508 | Pernod Ricard SA (Beverages) | 112 | ||||||
| 528 | Publicis Groupe SA (Media) | 42 | ||||||
| 49 | Remy Cointreau SA (Beverages) | 8 | ||||||
| 440 | Renault SA (Automobile Components) | 19 | ||||||
| 5,832 | Safran SA (Aerospace & Defense) | 915 | ||||||
| 2,749 | Sanofi (Pharmaceuticals) | 296 | ||||||
| 70 | Sartorius Stedim Biotech (Life Sciences Tools & Services) | 17 | ||||||
| 1,313 | Schneider Electric SE (Electrical Equipment)(a) | 239 | ||||||
| 55 | SEB SA (Household Durables) | 6 | ||||||
| 1,666 | Societe Generale SA (Banks) | 43 | ||||||
| 224 | Sodexo SA (Hotels, Restaurants & Leisure) | 25 | ||||||
| 149 | Teleperformance (Professional Services) | 25 | ||||||
| 270 | Thales SA (Aerospace & Defense) | 40 | ||||||
| 5,670 | TotalEnergies SE (Oil, Gas & Consumable Fuels) | 325 | ||||||
| 305 | Unibail-Rodamco-Westfield (Retail REITs)(b) | 16 | ||||||
| 595 | Valeo (Automobile Components) | 13 | ||||||
| 1,599 | Veolia Environnement SA (Multi-Utilities) | 51 | ||||||
| 1,264 | Vinci SA (Construction & Engineering) | 147 | ||||||
| 1,744 | Vivendi SE (Media) | 16 | ||||||
| 71 | Wendel SE (Financial Services) | 7 | ||||||
| 558 | Worldline SA (Financial Services)(b) | 20 | ||||||
| 5,917 | ||||||||
Germany — 2.33% | ||||||||
| 375 | adidas AG (Textiles, Apparel & Luxury Goods) | 73 | ||||||
Shares | Security Description | Value | ||||||
Germany (continued) | ||||||||
| 980 | Allianz SE, Registered Shares (Insurance) | $ | 228 | |||||
| 2,115 | BASF SE (Chemicals) | 103 | ||||||
| 2,390 | Bayer AG, Registered Shares (Pharmaceuticals) | 132 | ||||||
| 809 | Bayerische Motoren Werke AG (Automobile Components) | 100 | ||||||
| 121 | Bayerische Motoren Werke AG, Preference Shares (Automobiles) | 14 | ||||||
| 177 | Bechtle AG (IT Services) | 7 | ||||||
| 255 | Beiersdorf AG (Personal Care Products) | 34 | ||||||
| 400 | Brenntag SE (Trading Companies & Distributors) | 31 | ||||||
| 99 | Carl Zeiss Meditec AG, Class - BR (Health Care Equipment & Supplies) | 11 | ||||||
| 2,210 | Commerzbank AG (Banks) | 24 | ||||||
| 279 | Continental AG (Automobile Components) | 21 | ||||||
| 494 | Covestro AG (Chemicals)(b) | 26 | ||||||
| 1,041 | Daimler Truck Holding AG (Machinery) | 38 | ||||||
| 405 | Delivery Hero SE (Hotels, Restaurants & Leisure)(b) | 18 | ||||||
| 4,346 | Deutsche Bank AG, Registered Shares (Capital Markets) | 46 | ||||||
| 464 | Deutsche Boerse AG (Capital Markets) | 86 | ||||||
| 1,458 | Deutsche Lufthansa AG, Registered Shares (Passenger Airlines)(a)(b) | 15 | ||||||
| 7,840 | Deutsche Telekom AG (Diversified Telecommunication Services)(a) | 171 | ||||||
| 16,982 | DHL Group (Air Freight & Logistics) | 829 | ||||||
| 244 | Dr. Ing. h.c. F. Porsche AG, Preference Shares (Automobiles) | 30 | ||||||
| 5,467 | E.ON SE (Multi-Utilities) | 70 | ||||||
| 515 | Evonik Industries AG (Chemicals) | 10 | ||||||
| 500 | Fresenius Medical Care AG & Co. KGaA (Health Care Providers & Services) | 24 | ||||||
| 1,062 | Fresenius SE & Co. KGaA (Health Care Providers & Services) | 29 | ||||||
| 419 | GEA Group AG (Machinery) | 18 | ||||||
| 153 | Hannover Rueck SE (Insurance) | 32 | ||||||
| 370 | Heidelberg Materials AG (Construction Materials) | 30 | ||||||
| 423 | HelloFresh SE (Consumer Staples Distribution & Retail)(b) | 10 | ||||||
| 263 | Henkel AG & Co. KGaA (Household Products) | 19 | ||||||
| 390 | Henkel AG & Co. KGaA, Preference Shares (Household Products) | 31 | ||||||
| 3,171 | Infineon Technologies AG (Semiconductors & Semiconductor Equipment)(a) | 131 | ||||||
| 186 | Knorr-Bremse AG (Machinery) | 14 | ||||||
| 193 | LEG Immobilien SE (Real Estate Management & Development) | 11 | ||||||
See accompanying notes to financial statements.
78
HC CAPITAL TRUST
The ESG Growth Portfolio
Portfolio of Investments (continued) — June 30, 2023
Shares | Security Description | Value | ||||||
Common Stocks (continued) | ||||||||
Germany (continued) | ||||||||
| 2,034 | Mercedes-Benz Group AG (Automobile Components) | $ | 164 | |||||
| 314 | Merck KGaA (Pharmaceuticals) | 52 | ||||||
| 130 | MTU Aero Engines AG (Aerospace & Defense) | 34 | ||||||
| 339 | Muenchener Rueckversicherungs-Gesellschaft AG in Muenchen, Registered Shares (Insurance) | 127 | ||||||
| 126 | Nemetschek SE (Software) | 9 | ||||||
| 239 | Puma SE (Textiles, Apparel & Luxury Goods)(a) | 14 | ||||||
| 11 | Rational AG (Machinery) | 8 | ||||||
| 105 | Rheinmetall AG (Aerospace & Defense) | 29 | ||||||
| 1,593 | RWE AG (Independent Power and Renewable Electricity Producers) | 69 | ||||||
| 2,550 | SAP SE (Software) | 348 | ||||||
| 65 | Sartorius AG, Preference Shares (Life Sciences Tools & Services) | 23 | ||||||
| 221 | Scout24 SE (Interactive Media & Services) | 14 | ||||||
| 1,831 | Siemens AG, Registered Shares (Industrial Conglomerates) | 305 | ||||||
| 1,194 | Siemens Energy AG (Electrical Equipment)(a)(b) | 21 | ||||||
| 674 | Siemens Healthineers AG (Health Care Equipment & Supplies) | 38 | ||||||
| 326 | Symrise AG (Chemicals)(a) | 34 | ||||||
| 107 | Talanx AG (Insurance) | 6 | ||||||
| 847 | Telefonica Deutschland Holding AG (Diversified Telecommunication Services) | 2 | ||||||
| 1,772 | Vonovia SE (Real Estate Management & Development) | 35 | ||||||
| 48 | Wacker Chemie AG (Chemicals) | 7 | ||||||
| 543 | Zalando SE (Specialty Retail)(b) | 16 | ||||||
| 3,821 | ||||||||
Hong Kong — 1.07% | ||||||||
| 105,624 | AIA Group Ltd. (Insurance) | 1,073 | ||||||
| 7,000 | BOC Hong Kong Holdings Ltd. (Banks) | 21 | ||||||
| 4,200 | Budweiser Brewing Co. APAC Ltd. (Beverages) | 11 | ||||||
| 5,000 | CK Asset Holdings Ltd. (Real Estate Management & Development) | 28 | ||||||
| 6,000 | CK Hutchison Holdings Ltd. (Industrial Conglomerates) | 37 | ||||||
| 1,500 | CK Infrastructure Holdings Ltd. (Electric Utilities) | 8 | ||||||
| 4,000 | CLP Holdings Ltd. (Electric Utilities) | 31 | ||||||
| 4,200 | ESR Group Ltd. (Real Estate Management & Development) | 7 | ||||||
| 128 | Futu Holdings Ltd., ADR (Capital Markets)(b) | 5 | ||||||
| 5,000 | Galaxy Entertainment Group Ltd. (Hotels, Restaurants & Leisure)(b) | 32 | ||||||
Shares | Security Description | Value | ||||||
Hong Kong (continued) | ||||||||
| 5,000 | Hang Lung Properties Ltd. (Real Estate Management & Development) | $ | 8 | |||||
| 2,000 | Hang Seng Bank Ltd. (Banks) | 29 | ||||||
| 4,000 | Henderson Land Development Co. Ltd. (Real Estate Management & Development) | 12 | ||||||
| 11,000 | HKT Trust & HKT Ltd. (Diversified Telecommunication Services)(a) | 13 | ||||||
| 20,665 | Hong Kong & China Gas Co. Ltd. (Gas Utilities) | 18 | ||||||
| 2,949 | Hong Kong Exchanges & Clearing Ltd. (Capital Markets) | 112 | ||||||
| 2,400 | Hongkong Land Holdings Ltd. (Real Estate Management & Development) | 9 | ||||||
| 6,211 | Link REIT (Retail REITs) | 35 | ||||||
| 4,000 | MTR Corp. Ltd. (Ground Transportation) | 18 | ||||||
| 4,000 | New World Development Co. Ltd. (Real Estate Management & Development) | 10 | ||||||
| 3,500 | Power Assets Holdings Ltd. (Electric Utilities) | 18 | ||||||
| 6,528 | Prudential PLC (Insurance) | 92 | ||||||
| 8,518 | Sino Land Co. Ltd. (Real Estate Management & Development) | 10 | ||||||
| 3,500 | Sun Hung Kai Properties Ltd. (Real Estate Management & Development) | 44 | ||||||
| 1,000 | Swire Pacific Ltd., Class - A (Real Estate Management & Development) | 8 | ||||||
| 3,000 | Swire Properties Ltd. (Real Estate Management & Development) | 7 | ||||||
| 3,500 | Techtronic Industries Co. Ltd. (Machinery) | 38 | ||||||
| 18,450 | WH Group Ltd. (Food Products) | 10 | ||||||
| 4,000 | Wharf Real Estate Investment Co. Ltd. (Real Estate Management & Development) | 20 | ||||||
| 1,764 | ||||||||
Ireland (Republic of) — 1.15% | ||||||||
| 1,528 | Accenture PLC, Class - A (IT Services) | 472 | ||||||
| 322 | AerCap Holdings N.V. (Trading Companies & Distributors)(b) | 20 | ||||||
| 2,864 | AIB Group PLC (Banks) | 12 | ||||||
| 234 | Allegion PLC (Building Products) | 28 | ||||||
| 651 | Aptiv PLC (Automobile Components)(b) | 66 | ||||||
| 2,330 | Bank of Ireland Group PLC (Banks) | 22 | ||||||
| 1,767 | CRH PLC (Construction Materials)(a) | 97 | ||||||
| 235 | DCC PLC (Industrial Conglomerates)(a) | 13 | ||||||
| 2,241 | Experian PLC (Professional Services) | 86 | ||||||
| 417 | Flutter Entertainment PLC (Hotels, Restaurants & Leisure)(b) | 84 | ||||||
| 1,037 | James Hardie Industries PLC (Construction Materials) | 28 | ||||||
| 5,381 | Kerry Group PLC, Class - A (Food Products)(a) | 526 | ||||||
| 384 | Kingspan Group PLC (Building Products) | 26 | ||||||
| 3,182 | Medtronic PLC (Health Care Equipment & Supplies) | 280 | ||||||
See accompanying notes to financial statements.
79
HC CAPITAL TRUST
The ESG Growth Portfolio
Portfolio of Investments (continued) — June 30, 2023
Shares | Security Description | Value | ||||||
Common Stocks (continued) | ||||||||
Ireland (Republic of) (continued) | ||||||||
| 540 | Smurfit Kappa Group PLC (Containers & Packaging)(a) | $ | 18 | |||||
| 579 | Trane Technologies PLC (Building Products) | 111 | ||||||
| 1,889 | ||||||||
Israel — 0.16% | ||||||||
| 101 | Azrieli Group Ltd. (Real Estate Management & Development) | 6 | ||||||
| 3,082 | Bank Hapoalim BM (Banks) | 25 | ||||||
| 3,920 | Bank Leumi Le-Israel BM (Banks) | 29 | ||||||
| 214 | Check Point Software Technologies Ltd. (Software)(b) | 27 | ||||||
| 88 | CyberArk Software Ltd. (Software)(b) | 14 | ||||||
| 60 | Elbit Systems Ltd. (Aerospace & Defense) | 13 | ||||||
| 1,724 | ICL Group Ltd. (Chemicals) | 9 | ||||||
| 1 | Isracard Ltd. (Consumer Finance) | — | ||||||
| 3,213 | Israel Discount Bank Ltd., Class - A (Banks) | 16 | ||||||
| 304 | Mizrahi Tefahot Bank Ltd. (Banks) | 10 | ||||||
| 155 | Nice Ltd. (Software)(b) | 32 | ||||||
| 145 | SolarEdge Technologies, Inc. (Semiconductors & Semiconductor Equipment)(b) | 39 | ||||||
| 2,798 | Teva Pharmaceutical Industries Ltd., ADR (Pharmaceuticals)(b) | 21 | ||||||
| 268 | Tower Semiconductor Ltd. (Semiconductors & Semiconductor Equipment)(b) | 10 | ||||||
| 136 | Wix.com Ltd. (IT Services)(b) | 11 | ||||||
| 262 | ||||||||
Italy — 0.49% | ||||||||
| 266 | Amplifon SpA (Health Care Providers & Services) | 10 | ||||||
| 2,395 | Assicurazioni Generali SpA (Insurance) | 49 | ||||||
| 1,427 | Davide Campari-Milano N.V., Class - M (Beverages) | 20 | ||||||
| 54 | DiaSorin SpA (Health Care Equipment & Supplies) | 6 | ||||||
| 19,818 | Enel SpA (Electric Utilities)(a) | 133 | ||||||
| 5,359 | Eni SpA (Oil, Gas & Consumable Fuels) | 77 | ||||||
| 298 | Ferrari N.V. (Automobiles) | 97 | ||||||
| 1,425 | FinecoBank Banca Fineco SpA (Banks) | 19 | ||||||
| 1,050 | Infrastrutture Wireless Italiane SpA (Diversified Telecommunication Services)(a) | 14 | ||||||
| 39,570 | Intesa Sanpaolo SpA (Banks)(a) | 104 | ||||||
| 1,412 | Mediobanca Banca di Credito Finanziario SpA (Banks) | 17 | ||||||
| 450 | Moncler SpA (Textiles, Apparel & Luxury Goods) | 31 | ||||||
| 1,124 | Nexi SpA (Professional Services)(b) | 9 | ||||||
Shares | Security Description | Value | ||||||
Italy (continued) | ||||||||
| 1,363 | Poste Italiane SpA (Insurance) | $ | 15 | |||||
| 676 | Prysmian SpA (Electrical Equipment) | 28 | ||||||
| 257 | Recordati Industria Chimica e Farmaceutica SpA (Pharmaceuticals) | 12 | ||||||
| 5,318 | Snam SpA (Gas Utilities) | 28 | ||||||
| 25,056 | Telecom Italia SpA/Milano (Diversified Telecommunication Services)(b) | 7 | ||||||
| 3,462 | Terna - Rete Elettrica Nazionale (Electric Utilities) | 30 | ||||||
| 4,557 | UniCredit SpA (Banks) | 105 | ||||||
| 811 | ||||||||
Japan — 5.16% | ||||||||
| 400 | Advantest Corp. (Semiconductors & Semiconductor Equipment)(a) | 54 | ||||||
| 1,600 | Aeon Co. Ltd. (Consumer Staples Distribution & Retail) | 33 | ||||||
| 500 | AGC, Inc. (Building Products) | 18 | ||||||
| 400 | Aisin Corp. (Automobile Components) | 12 | ||||||
| 1,100 | Ajinomoto Co., Inc. (Food Products) | 44 | ||||||
| 300 | ANA Holdings, Inc. (Passenger Airlines)(a)(b) | 7 | ||||||
| 1,100 | Asahi Group Holdings Ltd. (Beverages)(a) | 43 | ||||||
| 500 | Asahi Intecc Co. Ltd. (Health Care Equipment & Supplies) | 10 | ||||||
| 3,200 | Asahi Kasei Corp. (Chemicals) | 22 | ||||||
| 4,500 | Astellas Pharma, Inc. (Pharmaceuticals) | 67 | ||||||
| 300 | Azbil Corp. (Electronic Equipment, Instruments & Components) | 9 | ||||||
| 300 | BayCurrent Consulting, Inc. (Professional Services) | 11 | ||||||
| 1,300 | Bridgestone Corp. (Automobile Components) | 53 | ||||||
| 500 | Brother Industries Ltd. (Technology Hardware, Storage & Peripherals) | 7 | ||||||
| 2,400 | Canon, Inc. (Technology Hardware, Storage & Peripherals) | 63 | ||||||
| 400 | Capcom Co. Ltd. (Entertainment) | 16 | ||||||
| 400 | Central Japan Railway Co. (Ground Transportation) | 50 | ||||||
| 1,600 | Chubu Electric Power Co., Inc. (Electric Utilities) | 20 | ||||||
| 1,600 | Chugai Pharmaceutical Co. Ltd. (Pharmaceuticals) | 46 | ||||||
| 2,800 | Concordia Financial Group Ltd. (Banks) | 11 | ||||||
| 1,100 | CyberAgent, Inc. (Media) | 8 | ||||||
| 600 | Dai Nippon Printing Co. Ltd. (Commercial Services & Supplies) | 17 | ||||||
| 600 | Daifuku Co. Ltd. (Machinery) | 12 | ||||||
| 2,100 | Dai-ichi Life Holdings, Inc. (Insurance) | 40 | ||||||
| 4,500 | Daiichi Sankyo Co. Ltd. (Pharmaceuticals) | 144 | ||||||
| 600 | Daikin Industries Ltd. (Building Products) | 123 | ||||||
See accompanying notes to financial statements.
80
HC CAPITAL TRUST
The ESG Growth Portfolio
Portfolio of Investments (continued) — June 30, 2023
Shares | Security Description | Value | ||||||
Common Stocks (continued) | ||||||||
Japan (continued) | ||||||||
| 100 | Daito Trust Construction Co. Ltd. (Real Estate Management & Development) | $ | 10 | |||||
| 1,300 | Daiwa House Industry Co. Ltd. (Real Estate Management & Development) | 34 | ||||||
| 5 | Daiwa House REIT Investment Corp. (Diversified REITs) | 10 | ||||||
| 3,800 | Daiwa Securities Group, Inc. (Capital Markets) | 20 | ||||||
| 1,100 | Denso Corp. (Automobile Components) | 74 | ||||||
| 500 | Dentsu Group, Inc. (Media) | 16 | ||||||
| 200 | Disco Corp. (Semiconductors & Semiconductor Equipment) | 32 | ||||||
| 700 | East Japan Railway Co. (Ground Transportation) | 39 | ||||||
| 600 | Eisai Co. Ltd. (Pharmaceuticals) | 41 | ||||||
| 7,800 | ENEOS Holdings, Inc. (Oil, Gas & Consumable Fuels) | 27 | ||||||
| 2,400 | FANUC Corp. (Machinery) | 84 | ||||||
| 400 | Fast Retailing Co. Ltd. (Specialty Retail) | 103 | ||||||
| 300 | Fuji Electric Co. Ltd. (Electrical Equipment) | 13 | ||||||
| 900 | FUJIFILM Holdings Corp. (Technology Hardware, Storage & Peripherals) | 54 | ||||||
| 400 | Fujitsu Ltd. (IT Services)(a) | 52 | ||||||
| 15 | GLP J-Reit (Industrial REITs)(a) | 15 | ||||||
| 100 | GMO Payment Gateway, Inc. (Financial Services) | 8 | ||||||
| 600 | Hakuhodo DY Holdings, Inc. (Media) | 6 | ||||||
| 300 | Hamamatsu Photonics KK (Electronic Equipment, Instruments & Components) | 15 | ||||||
| 600 | Hankyu Hanshin Holdings, Inc. (Ground Transportation) | 20 | ||||||
| 100 | Hirose Electric Co. Ltd. (Electronic Equipment, Instruments & Components) | 13 | ||||||
| 300 | Hitachi Construction Machinery Co. Ltd. (Machinery) | 8 | ||||||
| 2,300 | Hitachi Ltd. (Industrial Conglomerates) | 144 | ||||||
| 3,700 | Honda Motor Co. Ltd. (Automobile Components) | 112 | ||||||
| 200 | Hoshizaki Corp. (Machinery) | 7 | ||||||
| 900 | Hoya Corp. (Health Care Equipment & Supplies) | 108 | ||||||
| 800 | Hulic Co. Ltd. (Real Estate Management & Development)(a) | 7 | ||||||
| 300 | Ibiden Co. Ltd. (Electronic Equipment, Instruments & Components) | 17 | ||||||
| 500 | Idemitsu Kosan Co. Ltd. (Oil, Gas & Consumable Fuels)(a) | 10 | ||||||
| 400 | Iida Group Holdings Co. Ltd. (Household Durables) | 7 | ||||||
| 2,500 | Inpex Corp. (Oil, Gas & Consumable Fuels) | 27 | ||||||
| 1,500 | Isuzu Motors Ltd. (Automobile Components) | 18 | ||||||
Shares | Security Description | Value | ||||||
Japan (continued) | ||||||||
| 2,900 | ITOCHU Corp. (Trading Companies & Distributors) | $ | 115 | |||||
| 200 | Itochu Techno-Solutions Corp. (IT Services) | 5 | ||||||
| 400 | Japan Airlines Co. Ltd. (Passenger Airlines)(a) | 9 | ||||||
| 1,300 | Japan Exchange Group, Inc. (Capital Markets) | 23 | ||||||
| 18 | Japan Metropolitan Fund Invest (Retail REITs) | 12 | ||||||
| 3,100 | Japan Post Bank Co. Ltd. (Banks)(a) | 24 | ||||||
| 5,300 | Japan Post Holdings Co. Ltd. (Insurance)(a) | 38 | ||||||
| 500 | Japan Post Insurance Co. Ltd. (Insurance)(a) | 8 | ||||||
| 3 | Japan Real Estate Investment Corp. (Office REITs) | 11 | ||||||
| 900 | JFE Holdings, Inc. (Metals & Mining) | 13 | ||||||
| 500 | JSR Corp. (Chemicals) | 14 | ||||||
| 1,100 | Kajima Corp. (Construction & Engineering) | 17 | ||||||
| 1,100 | Kao Corp. (Personal Care Products) | 40 | ||||||
| 300 | Kawasaki Kisen Kaisha Ltd. (Marine Transportation) | 7 | ||||||
| 3,700 | KDDI Corp. (Wireless Telecommunication Services) | 114 | ||||||
| 300 | Keio Corp. (Ground Transportation) | 9 | ||||||
| 300 | Keisei Electric Railway Co. Ltd. (Ground Transportation) | 12 | ||||||
| 500 | Keyence Corp. (Electronic Equipment, Instruments & Components) | 239 | ||||||
| 200 | Kikkoman Corp. (Food Products) | 11 | ||||||
| 400 | Kintetsu Group Holdings Co. Ltd. (Ground Transportation) | 14 | ||||||
| 1,800 | Kirin Holdings Co. Ltd. (Beverages) | 26 | ||||||
| 100 | Kobayashi Pharmaceutical Co. Ltd. (Personal Care Products) | 5 | ||||||
| 300 | Kobe Bussan Co. Ltd. (Consumer Staples Distribution & Retail) | 8 | ||||||
| 500 | Koito Manufacturing Co. Ltd. (Automobile Components) | 9 | ||||||
| 2,100 | Komatsu Ltd. (Machinery) | 57 | ||||||
| 200 | Konami Group Corp. (Entertainment) | 10 | ||||||
| 100 | Kose Corp. (Personal Care Products) | 10 | ||||||
| 2,600 | Kubota Corp. (Machinery) | 38 | ||||||
| 200 | Kurita Water Industries Ltd. (Machinery) | 8 | ||||||
| 800 | Kyocera Corp. (Electronic Equipment, Instruments & Components) | 43 | ||||||
| 700 | Kyowa Kirin Co. Ltd. (Pharmaceuticals) | 13 | ||||||
| 700 | Lixil Corp. (Building Products) | 9 | ||||||
| 500 | Makita Corp. (Machinery) | 14 | ||||||
| 3,900 | Marubeni Corp. (Trading Companies & Distributors) | 66 | ||||||
| 300 | MatsukiyoCocokara & Co. (Consumer Staples Distribution & Retail) | 17 | ||||||
| 1,500 | Mazda Motor Corp. (Automobile Components) | 14 | ||||||
See accompanying notes to financial statements.
81
HC CAPITAL TRUST
The ESG Growth Portfolio
Portfolio of Investments (continued) — June 30, 2023
Shares | Security Description | Value | ||||||
Common Stocks (continued) | ||||||||
Japan (continued) | ||||||||
| 200 | McDonald’s Holdings Co. Japan Ltd. (Hotels, Restaurants & Leisure) | $ | 8 | |||||
| 600 | MEIJI Holdings Co. Ltd. (Food Products) | 13 | ||||||
| 900 | MINEBEA MITSUMI, Inc. (Machinery) | 17 | ||||||
| 8,615 | MISUMI Group, Inc. (Machinery) | 174 | ||||||
| 3,200 | Mitsubishi Chemical Group Corp. (Chemicals) | 19 | ||||||
| 3,000 | Mitsubishi Corp. (Trading Companies & Distributors) | 146 | ||||||
| 4,400 | Mitsubishi Electric Corp. (Electrical Equipment) | 62 | ||||||
| 3,000 | Mitsubishi Estate Co. Ltd. (Real Estate Management & Development) | 36 | ||||||
| 1,800 | Mitsubishi HC Capital, Inc. (Financial Services) | 11 | ||||||
| 800 | Mitsubishi Heavy Industries Ltd. (Machinery) | 37 | ||||||
| 27,900 | Mitsubishi UFJ Financial Group, Inc. (Banks) | 207 | ||||||
| 3,200 | Mitsui & Co. Ltd. (Trading Companies & Distributors) | 121 | ||||||
| 400 | Mitsui Chemicals, Inc. (Chemicals) | 12 | ||||||
| 2,300 | Mitsui Fudosan Co. Ltd. (Real Estate Management & Development) | 46 | ||||||
| 600 | Mitsui O.S.K. Lines Ltd. (Marine Transportation) | 14 | ||||||
| 5,840 | Mizuho Financial Group, Inc. (Banks) | 89 | ||||||
| 600 | MonotaRO Co. Ltd. (Trading Companies & Distributors) | 8 | ||||||
| 1,100 | MS&AD Insurance Group Holdings, Inc. (Insurance) | 39 | ||||||
| 1,400 | Murata Manufacturing Co. Ltd. (Electronic Equipment, Instruments & Components) | 80 | ||||||
| 600 | NEC Corp. (IT Services) | 29 | ||||||
| 700 | Nexon Co. Ltd. (Entertainment) | 13 | ||||||
| 600 | NGK Insulators Ltd. (Machinery) | 7 | ||||||
| 1,000 | NIDEC Corp. (Electrical Equipment) | 55 | ||||||
| 2,600 | Nintendo Co. Ltd. (Entertainment) | 119 | ||||||
| 4 | Nippon Building Fund, Inc. (Diversified REITs) | 16 | ||||||
| 200 | NIPPON EXPRESS HOLDINGS, INC. (Air Freight & Logistics) | 11 | ||||||
| 2,100 | Nippon Paint Holdings Co. Ltd. (Chemicals)(a) | 17 | ||||||
| 5 | Nippon Prologis REIT, Inc. (Industrial REITs)(a) | 10 | ||||||
| 200 | Nippon Sanso Holdings Corp. (Chemicals) | 4 | ||||||
| 100 | Nippon Shinyaku Co. Ltd. (Pharmaceuticals) | 4 | ||||||
| 2,000 | Nippon Steel Corp. (Metals & Mining)(a) | 42 | ||||||
| 67,500 | Nippon Telegraph & Telephone Corp. (Diversified Telecommunication Services) | 80 | ||||||
| 1,200 | Nippon Yusen KK (Marine Transportation) | 27 | ||||||
| 300 | Nissan Chemical Corp. (Chemicals) | 13 | ||||||
| 5,700 | Nissan Motor Co. Ltd. (Automobile Components) | 23 | ||||||
| 500 | Nisshin Seifun Group, Inc. (Food Products) | 6 | ||||||
Shares | Security Description | Value | ||||||
Japan (continued) | ||||||||
| 200 | Nissin Foods Holdings Co. Ltd. (Food Products)(a) | $ | 17 | |||||
| 200 | Nitori Holdings Co. Ltd. (Specialty Retail) | 22 | ||||||
| 300 | Nitto Denko Corp. (Chemicals) | 22 | ||||||
| 7,500 | Nomura Holdings, Inc. (Capital Markets) | 29 | ||||||
| 400 | Nomura Real Estate Holdings, Inc. (Real Estate Management & Development) | 10 | ||||||
| 11 | Nomura Real Estate Master Fund, Inc. (Diversified REITs) | 13 | ||||||
| 800 | Nomura Research Institute Ltd. (IT Services) | 22 | ||||||
| 1,600 | NTT Data Group Corp. (IT Services) | 22 | ||||||
| 1,500 | Obayashi Corp. (Construction & Engineering) | 13 | ||||||
| 200 | Obic Co. Ltd. (IT Services) | 32 | ||||||
| 700 | Odakyu Electric Railway Co. Ltd. (Ground Transportation) | �� | 9 | |||||
| 2,400 | Oji Holdings Corp. (Paper & Forest Products) | 9 | ||||||
| 3,000 | Olympus Corp. (Health Care Equipment & Supplies) | 47 | ||||||
| 500 | Omron Corp. (Electronic Equipment, Instruments & Components) | 31 | ||||||
| 900 | Ono Pharmaceutical Co. Ltd. (Pharmaceuticals) | 16 | ||||||
| 200 | Open House Group Co. Ltd. (Household Durables)(a) | 7 | ||||||
| 100 | Oracle Corp. Japan (Software) | 7 | ||||||
| 2,700 | Oriental Land Co. Ltd. (Hotels, Restaurants & Leisure) | 105 | ||||||
| 2,700 | ORIX Corp. (Financial Services) | 49 | ||||||
| 1,000 | Osaka Gas Co. Ltd. (Gas Utilities) | 15 | ||||||
| 300 | Otsuka Corp. (IT Services) | 12 | ||||||
| 1,000 | Otsuka Holdings Co. Ltd. (Pharmaceuticals) | 37 | ||||||
| 700 | Pan Pacific International Holdings Corp. (Broadline Retail) | 13 | ||||||
| 5,000 | Panasonic Holdings Corp. (Household Durables) | 61 | ||||||
| 500 | Persol Holdings Co. Ltd. (Professional Services)(a) | 9 | ||||||
| 2,200 | Rakuten Group, Inc. (Broadline Retail)(a) | 8 | ||||||
| 3,400 | Recruit Holdings Co. Ltd. (Professional Services) | 109 | ||||||
| 3,200 | Renesas Electronics Corp. (Semiconductors & Semiconductor Equipment)(a)(b) | 60 | ||||||
| 5,200 | Resona Holdings, Inc. (Banks) | 25 | ||||||
| 1,600 | Ricoh Co. Ltd. (Technology Hardware, Storage & Peripherals) | 14 | ||||||
| 200 | Rohm Co. Ltd. (Semiconductors & Semiconductor Equipment) | 19 | ||||||
| 600 | SBI Holdings, Inc. (Capital Markets) | 12 | ||||||
| 300 | SCSK Corp. (IT Services) | 5 | ||||||
See accompanying notes to financial statements.
82
HC CAPITAL TRUST
The ESG Growth Portfolio
Portfolio of Investments (continued) — June 30, 2023
Shares | Security Description | Value | ||||||
Common Stocks (continued) | ||||||||
Japan (continued) | ||||||||
| 500 | Secom Co. Ltd. (Commercial Services & Supplies) | $ | 34 | |||||
| 600 | Seiko Epson Corp. (Technology Hardware, Storage & Peripherals) | 9 | ||||||
| 1,000 | Sekisui Chemical Co. Ltd. (Household Durables) | 14 | ||||||
| 1,600 | Sekisui House Ltd. (Household Durables) | 32 | ||||||
| 1,800 | Seven & i Holdings Co. Ltd. (Consumer Staples Distribution & Retail) | 78 | ||||||
| 800 | SG Holdings Co. Ltd. (Air Freight & Logistics) | 11 | ||||||
| 500 | Sharp Corp. (Household Durables)(a) | 3 | ||||||
| 500 | Shimadzu Corp. (Electronic Equipment, Instruments & Components) | 15 | ||||||
| 200 | Shimano, Inc. (Leisure Products) | 33 | ||||||
| 1,400 | Shimizu Corp. (Construction & Engineering) | 9 | ||||||
| 4,500 | Shin-Etsu Chemical Co. Ltd. (Chemicals) | 151 | ||||||
| 600 | Shionogi & Co. Ltd. (Pharmaceuticals) | 25 | ||||||
| 1,000 | Shiseido Co. Ltd. (Personal Care Products) | 45 | ||||||
| 1,000 | Shizuoka Financial Group, Inc. (Banks) | 7 | ||||||
| 100 | SMC Corp. (Machinery) | 56 | ||||||
| 6,900 | SoftBank Corp. (Wireless Telecommunication Services) | 74 | ||||||
| 2,500 | SoftBank Group Corp. (Wireless Telecommunication Services) | 118 | ||||||
| 800 | Sompo Holdings, Inc. (Insurance) | 36 | ||||||
| 3,100 | Sony Group Corp. (Household Durables) | 281 | ||||||
| 200 | Square Enix Holdings Co. Ltd. (Entertainment) | 9 | ||||||
| 1,500 | Subaru Corp. (Automobile Components) | 28 | ||||||
| 800 | SUMCO Corp. (Semiconductors & Semiconductor Equipment)(a) | 11 | ||||||
| 3,600 | Sumitomo Chemical Co. Ltd. (Chemicals) | 11 | ||||||
| 2,700 | Sumitomo Corp. (Trading Companies & Distributors) | 57 | ||||||
| 1,900 | Sumitomo Electric Industries Ltd. (Automobile Components) | 23 | ||||||
| 600 | Sumitomo Metal Mining Co. Ltd. (Metals & Mining) | 19 | ||||||
| 3,200 | Sumitomo Mitsui Financial Group, Inc. (Banks) | 138 | ||||||
| 800 | Sumitomo Mitsui Trust Holdings, Inc. (Banks) | 28 | ||||||
| 700 | Sumitomo Realty & Development Co. Ltd. (Real Estate Management & Development) | 17 | ||||||
| 300 | Suntory Beverage & Food Ltd. (Beverages) | 11 | ||||||
| 900 | Suzuki Motor Corp. (Automobile Components) | 33 | ||||||
| 400 | Sysmex Corp. (Health Care Equipment & Supplies) | 27 | ||||||
| 1,300 | T&D Holdings, Inc. (Insurance) | 19 | ||||||
| 500 | Taisei Corp. (Construction & Engineering) | 17 | ||||||
Shares | Security Description | Value | ||||||
Japan (continued) | ||||||||
| 3,800 | Takeda Pharmaceutical Co. Ltd. (Pharmaceuticals) | 119 | ||||||
| 900 | TDK Corp. (Electronic Equipment, Instruments & Components) | 35 | ||||||
| 1,600 | Terumo Corp. (Health Care Equipment & Supplies) | 51 | ||||||
| 1,200 | The Chiba Bank Ltd. (Banks) | 7 | ||||||
| 1,800 | The Kansai Electric Power Co., Inc. (Electric Utilities) | 23 | ||||||
| 500 | TIS, Inc. (IT Services) | 13 | ||||||
| 500 | Tobu Railway Co. Ltd. (Ground Transportation) | 13 | ||||||
| 300 | Toho Co. Ltd. (Entertainment) | 11 | ||||||
| 4,200 | Tokio Marine Holdings, Inc. (Insurance) | 97 | ||||||
| 1,100 | Tokyo Electron Ltd. (Semiconductors & Semiconductor Equipment) | 159 | ||||||
| 1,000 | Tokyo Gas Co. Ltd. (Gas Utilities) | 22 | ||||||
| 1,300 | Tokyu Corp. (Ground Transportation) | 16 | ||||||
| 600 | TOPPAN, Inc. (Commercial Services & Supplies) | 13 | ||||||
| 3,400 | Toray Industries, Inc. (Chemicals) | 19 | ||||||
| 1,000 | Toshiba Corp. (Industrial Conglomerates) | 31 | ||||||
| 600 | Tosoh Corp. (Chemicals) | 7 | ||||||
| 300 | TOTO Ltd. (Building Products) | 9 | ||||||
| 300 | Toyota Industries Corp. (Machinery) | 21 | ||||||
| 25,600 | Toyota Motor Corp. (Automobile Components) | 412 | ||||||
| 500 | Toyota Tsusho Corp. (Trading Companies & Distributors) | 25 | ||||||
| 300 | Trend Micro, Inc. (Software) | 15 | ||||||
| 1,000 | Unicharm Corp. (Household Products) | 37 | ||||||
| 500 | USS Co. Ltd. (Specialty Retail) | 8 | ||||||
| 200 | Welcia Holdings Co. Ltd. (Consumer Staples Distribution & Retail) | 4 | ||||||
| 500 | West Japan Railway Co. (Ground Transportation)(a) | 21 | ||||||
| 300 | Yakult Honsha Co. Ltd. (Food Products) | 19 | ||||||
| 300 | Yamaha Corp. (Leisure Products) | 12 | ||||||
| 800 | Yamaha Motor Co. Ltd. (Automobile Components) | 23 | ||||||
| 800 | Yamato Holdings Co. Ltd. (Air Freight & Logistics) | 15 | ||||||
| 600 | Yaskawa Electric Corp. (Machinery) | 28 | ||||||
| 600 | Yokogawa Electric Corp. (Electronic Equipment, Instruments & Components) | 11 | ||||||
| 6,700 | Z Holdings Corp. (Interactive Media & Services) | 16 | ||||||
| 300 | ZOZO, Inc. (Specialty Retail)(a) | 6 | ||||||
| 8,466 | ||||||||
Jersey — 0.01% | ||||||||
| 218 | Novocure Ltd. (Health Care Equipment & Supplies)(b) | 9 | ||||||
See accompanying notes to financial statements.
83
HC CAPITAL TRUST
The ESG Growth Portfolio
Portfolio of Investments (continued) — June 30, 2023
Shares | Security Description | Value | ||||||
Common Stocks (continued) | ||||||||
Luxembourg — 0.20% | ||||||||
| 1,143 | ArcelorMittal SA (Metals & Mining) | $ | 31 | |||||
| 4,395 | Eurofins Scientific SE (Life Sciences Tools & Services) | 279 | ||||||
| 1,138 | Tenaris SA (Energy Equipment & Services) | 17 | ||||||
| 327 | ||||||||
Netherlands — 1.50% | ||||||||
| 1,034 | ABN AMRO Bank N.V. (Banks) | 16 | ||||||
| 321 | Adyen N.V. (Professional Services)(a)(b) | 555 | ||||||
| 4,651 | Aegon N.V. (Insurance) | 24 | ||||||
| 461 | Akzo Nobel N.V. (Chemicals) | 38 | ||||||
| 134 | Argenx SE (Biotechnology)(b) | 52 | ||||||
| 110 | ASM International N.V. (Semiconductors & Semiconductor Equipment) | 47 | ||||||
| 977 | ASML Holding N.V. (Semiconductors & Semiconductor Equipment)(a) | 708 | ||||||
| 214 | Euronext N.V. (Capital Markets) | 15 | ||||||
| 274 | EXOR N.V. (Financial Services) | 24 | ||||||
| 1,208 | Ferrovial SE (Construction & Engineering)(b) | 38 | ||||||
| 247 | Heineken Holding N.V. (Beverages) | 21 | ||||||
| 600 | Heineken N.V. (Beverages) | 62 | ||||||
| 131 | IMCD N.V. (Trading Companies & Distributors)(a) | 19 | ||||||
| 8,816 | ING Groep N.V. (Banks) | 119 | ||||||
| 175 | JDE Peet’s N.V. (Food Products)(a) | 5 | ||||||
| 431 | Just Eat Takeaway.com N.V. (Hotels, Restaurants & Leisure)(b) | 7 | ||||||
| 2,291 | Koninklijke Ahold Delhaize N.V. (Consumer Staples Distribution & Retail) | 78 | ||||||
| 8,278 | Koninklijke KPN N.V. (Diversified Telecommunication Services) | 30 | ||||||
| 2,100 | Koninklijke Philips N.V. (Health Care Equipment & Supplies)(b) | 45 | ||||||
| 734 | NN Group N.V. (Insurance) | 27 | ||||||
| 619 | NXP Semiconductors N.V. (Semiconductors & Semiconductor Equipment) | 127 | ||||||
| 248 | OCI N.V. (Chemicals)(a) | 6 | ||||||
| 1,951 | Prosus N.V. (Broadline Retail)(a) | 143 | ||||||
| 568 | QIAGEN N.V. (Life Sciences Tools & Services)(b) | 26 | ||||||
| 276 | Randstad N.V. (Professional Services) | 15 | ||||||
| 5,198 | Stellantis N.V. (Automobile Components) | 91 | ||||||
| 2,015 | Universal Music Group N.V. (Entertainment) | 45 | ||||||
| 601 | Wolters Kluwer N.V. (Professional Services) | 76 | ||||||
| 2,459 | ||||||||
New Zealand — 0.06% | ||||||||
| 2,680 | Auckland International Airport Ltd. (Transportation Infrastructure)(b) | 14 | ||||||
Shares | Security Description | Value | ||||||
New Zealand (continued) | ||||||||
| 1,455 | Fisher & Paykel Healthcare Corp. Ltd. (Health Care Equipment & Supplies) | $ | 22 | |||||
| 1,764 | Mercury NZ Ltd. (Electric Utilities) | 7 | ||||||
| 2,860 | Meridian Energy Ltd. (Independent Power and Renewable Electricity Producers) | 10 | ||||||
| 5,100 | Spark New Zealand Ltd. (Diversified Telecommunication Services) | 16 | ||||||
| 332 | Xero Ltd. (Software)(b) | 26 | ||||||
| 95 | ||||||||
Norway — 0.54% | ||||||||
| 571 | Adevinta ASA (Interactive Media & Services)(b) | 4 | ||||||
| 763 | Aker BP ASA (Oil, Gas & Consumable Fuels) | 18 | ||||||
| 2,403 | DNB Bank ASA (Banks) | 45 | ||||||
| 24,414 | Equinor ASA (Oil, Gas & Consumable Fuels) | 712 | ||||||
| 485 | Gjensidige Forsikring ASA (Insurance) | 8 | ||||||
| 217 | Kongsberg Gruppen ASA (Aerospace & Defense) | 10 | ||||||
| 1,094 | Mowi ASA (Food Products)(a) | 17 | ||||||
| 3,388 | Norsk Hydro ASA (Metals & Mining) | 20 | ||||||
| 1,866 | Orkla ASA (Food Products) | 13 | ||||||
| 134 | Salmar ASA (Food Products) | 5 | ||||||
| 1,828 | Telenor ASA (Diversified Telecommunication Services) | 19 | ||||||
| 438 | Yara International ASA (Chemicals) | 15 | ||||||
| 886 | ||||||||
Portugal — 0.04% | ||||||||
| 6,973 | EDP - Energias de Portugal SA (Electric Utilities) | 33 | ||||||
| 1,241 | Galp Energia SGPS SA, B Shares (Oil, Gas & Consumable Fuels)(a) | 15 | ||||||
| 752 | Jeronimo Martins SGPS SA (Consumer Staples Distribution & Retail)(a) | 21 | ||||||
| 69 | ||||||||
Singapore — 0.29% | ||||||||
| 8,441 | CapitaLand Ascendas REIT (Industrial REITs) | 17 | ||||||
| 12,356 | CapitaLand Integrated Commercial Trust (Retail REITs) | 18 | ||||||
| 6,700 | CapitaLand Investment Ltd. (Real Estate Management & Development) | 16 | ||||||
| 1,000 | City Developments Ltd. (Real Estate Management & Development) | 5 | ||||||
| 4,361 | DBS Group Holdings Ltd. (Banks) | 102 | ||||||
| 15,700 | Genting Singapore Ltd. (Hotels, Restaurants & Leisure) | 11 | ||||||
| 3,553 | Grab Holdings Ltd. (Ground Transportation)(b) | 12 | ||||||
| 300 | Jardine Cycle & Carriage Ltd. (Industrial Conglomerates) | 8 | ||||||
| 4,100 | Keppel Corp. Ltd. (Industrial Conglomerates) | 20 | ||||||
See accompanying notes to financial statements.
84
HC CAPITAL TRUST
The ESG Growth Portfolio
Portfolio of Investments (continued) — June 30, 2023
Shares | Security Description | Value | ||||||
Common Stocks (continued) | ||||||||
Singapore (continued) | ||||||||
| 6,014 | Mapletree Logistics Trust (Industrial REITs) | $ | 7 | |||||
| 5,600 | Mapletree Pan Asia Commercial Trust (Retail REITs) | 7 | ||||||
| 8,090 | Oversea-Chinese Banking Corp. Ltd. (Banks) | 74 | ||||||
| 136,048 | Seatrium Ltd. (Machinery)(b) | 13 | ||||||
| 2,700 | Singapore Airlines Ltd. (Passenger Airlines)(a) | 14 | ||||||
| 2,000 | Singapore Exchange Ltd. (Capital Markets) | 14 | ||||||
| 4,100 | Singapore Technologies Engineering Ltd. (Aerospace & Defense) | 11 | ||||||
| 20,700 | Singapore Telecommunications Ltd. (Diversified Telecommunication Services) | 38 | ||||||
| 3,200 | United Overseas Bank Ltd. (Banks) | 66 | ||||||
| 1,000 | UOL Group Ltd. (Real Estate Management & Development) | 5 | ||||||
| 700 | Venture Corp. Ltd. (Electronic Equipment, Instruments & Components) | 8 | ||||||
| 5,000 | Wilmar International Ltd. (Food Products) | 14 | ||||||
| 480 | ||||||||
Spain — 0.58% | ||||||||
| 54 | Acciona SA (Electric Utilities) | 9 | ||||||
| 356 | ACS Actividades de Construccion y Servicios SA (Construction & Engineering) | 13 | ||||||
| 171 | Aena SME SA (Transportation Infrastructure) | 28 | ||||||
| 1,097 | Amadeus IT Group SA (Professional Services)(b) | 84 | ||||||
| 14,134 | Banco Bilbao Vizcaya Argentaria SA (Banks) | 109 | ||||||
| 38,969 | Banco Santander SA (Banks)(a) | 144 | ||||||
| 10,550 | CaixaBank SA (Banks) | 44 | ||||||
| 1,388 | Cellnex Telecom SA (Diversified Telecommunication Services)(a) | 56 | ||||||
| 262 | Corp. ACCIONA Energias Renovables SA (Independent Power and Renewable Electricity Producers) | 9 | ||||||
| 712 | EDP Renovaveis SA (Independent Power and Renewable Electricity Producers) | 14 | ||||||
| 585 | Enagas SA (Gas Utilities)(a) | 11 | ||||||
| 802 | Endesa SA (Electric Utilities) | 17 | ||||||
| 756 | Grifols SA (Biotechnology)(b) | 10 | ||||||
| 14,069 | Iberdrola SA (Electric Utilities) | 183 | ||||||
| 2,716 | Industria de Diseno Textil SA (Specialty Retail) | 105 | ||||||
| 262 | Naturgy Energy Group SA (Gas Utilities) | 8 | ||||||
| 1,081 | Redeia Corp. SA (Electric Utilities) | 18 | ||||||
| 2,994 | Repsol SA (Oil, Gas & Consumable Fuels) | 44 | ||||||
| 11,840 | Telefonica SA (Diversified Telecommunication Services) | 48 | ||||||
| 954 | ||||||||
Sweden — 0.70% | ||||||||
| 779 | Alfa Laval AB (Machinery) | 28 | ||||||
| 2,440 | Assa Abloy AB, Class - B (Building Products) | 59 | ||||||
Shares | Security Description | Value | ||||||
Sweden (continued) | ||||||||
| 6,496 | Atlas Copco AB, Class - A (Machinery) | $ | 94 | |||||
| 3,956 | Atlas Copco AB, Class - B (Machinery) | 49 | ||||||
| 820 | Beijer Ref AB (Trading Companies & Distributors) | 10 | ||||||
| 666 | Boliden AB (Metals & Mining) | 19 | ||||||
| 1,497 | Embracer Group AB (Entertainment)(b) | 4 | ||||||
| 1,637 | Epiroc AB, Class - A (Machinery) | 31 | ||||||
| 1,066 | Epiroc AB, Class - B (Machinery) | 17 | ||||||
| 721 | EQT AB (Capital Markets) | 14 | ||||||
| 1,541 | Essity AB, Class - B (Household Products) | 41 | ||||||
| 446 | Evolution AB (Hotels, Restaurants & Leisure) | 57 | ||||||
| 1,608 | Fastighets AB Balder, Class - B (Real Estate Management & Development)(b) | 6 | ||||||
| 571 | Getinge AB, Class - B (Health Care Equipment & Supplies) | 10 | ||||||
| 1,501 | H & M Hennes & Mauritz AB, Class - B (Specialty Retail) | 26 | ||||||
| 4,840 | Hexagon AB, Class - B (Electronic Equipment, Instruments & Components) | 60 | ||||||
| 172 | Holmen AB, Class - B (Paper & Forest Products) | 6 | ||||||
| 854 | Husqvarna AB, Class - B (Machinery) | 8 | ||||||
| 282 | Industrivarden AB, Class - A (Financial Services)(a) | 8 | ||||||
| 451 | Industrivarden AB, Class - C (Financial Services) | 12 | ||||||
| 508 | Indutrade AB (Machinery) | 11 | ||||||
| 321 | Investment AB Latour, Class - B (Industrial Conglomerates) | 6 | ||||||
| 978 | Investor AB, Class - A (Financial Services) | 20 | ||||||
| 4,272 | Investor AB, Class - B (Financial Services) | 85 | ||||||
| 569 | Kinnevik AB, Class - B (Financial Services)(b) | 8 | ||||||
| 169 | L E Lundbergforetagen AB, Class - B (Financial Services) | 7 | ||||||
| 580 | Lifco AB, Class - B (Industrial Conglomerates) | 13 | ||||||
| 3,390 | Nibe Industrier AB, Class - B (Building Products) | 32 | ||||||
| 196 | Saab AB, Class - B (Aerospace & Defense) | 11 | ||||||
| 352 | Sagax AB, Class - B (Real Estate Management & Development) | 7 | ||||||
| 2,611 | Sandvik AB (Machinery) | 51 | ||||||
| 974 | Securitas AB, Class - B (Commercial Services & Supplies) | 8 | ||||||
| 4,127 | Skandinaviska Enskilda Banken AB, Class - A (Banks) | 46 | ||||||
| 933 | Skanska AB, Class - B (Construction & Engineering) | 13 | ||||||
| 888 | SKF AB, Class - B (Machinery) | 15 | ||||||
| 1,426 | Svenska Cellulosa AB SCA, Class - B (Paper & Forest Products) | 18 | ||||||
| 3,569 | Svenska Handelsbanken AB, Class - A (Banks) | 30 | ||||||
See accompanying notes to financial statements.
85
HC CAPITAL TRUST
The ESG Growth Portfolio
Portfolio of Investments (continued) — June 30, 2023
Shares | Security Description | Value | ||||||
Common Stocks (continued) | ||||||||
Sweden (continued) | ||||||||
| 2,226 | Swedbank AB, Class - A (Banks) | $ | 38 | |||||
| 409 | Swedish Orphan Biovitrum AB (Biotechnology)(b) | 8 | ||||||
| 1,442 | Tele2 AB, Class - B (Wireless Telecommunication Services) | 12 | ||||||
| 7,063 | Telefonaktiebolaget LM Ericsson, Class - B (Communications Equipment) | 38 | ||||||
| 6,801 | Telia Co. AB (Diversified Telecommunication Services)(a) | 15 | ||||||
| 648 | Volvo AB, Class - A (Machinery) | 14 | ||||||
| 3,442 | Volvo AB, Class - B (Machinery) | 71 | ||||||
| 1,383 | Volvo Car AB, Class - B (Automobile Components)(b) | 6 | ||||||
| 1,142 | ||||||||
Switzerland — 3.12% | ||||||||
| 3,880 | ABB Ltd., Registered Shares (Electrical Equipment) | 153 | ||||||
| 371 | Adecco Group AG (Professional Services)(a) | 12 | ||||||
| 1,226 | Alcon, Inc. (Health Care Equipment & Supplies) | 102 | ||||||
| 75 | Bachem Holding AG (Life Sciences Tools & Services) | 7 | ||||||
| 117 | Baloise Holding AG, Registered Shares (Insurance) | 17 | ||||||
| 65 | Banque Cantonale Vaudoise, Registered Shares (Banks) | 7 | ||||||
| 8 | Barry Callebaut AG, Registered Shares (Food Products)(a) | 15 | ||||||
| 50 | BKW AG (Electric Utilities) | 9 | ||||||
| 4 | Chocoladefabriken Lindt & Spruengli AG, Class - PC (Food Products) | 50 | ||||||
| 1,007 | Chubb Ltd. (Insurance) | 194 | ||||||
| 1,267 | Cie Financiere Richemont SA, Registered Shares (Textiles, Apparel & Luxury Goods) | 215 | ||||||
| 541 | Clariant AG, Registered Shares (Chemicals) | 8 | ||||||
| 520 | Coca-Cola HBC AG (Beverages) | 16 | ||||||
| 426 | DSM-Firmenich AG (Chemicals)(b) | 46 | ||||||
| 214 | Dufry AG, Registered Shares (Specialty Retail)(a)(b) | 10 | ||||||
| 14 | EMS-Chemie Holding AG (Chemicals) | 11 | ||||||
| 361 | Garmin Ltd. (Household Durables) | 38 | ||||||
| 90 | Geberit AG, Registered Shares (Building Products) | 47 | ||||||
| 22 | Givaudan SA, Registered Shares (Chemicals) | 73 | ||||||
| 25,768 | Glencore PLC (Metals & Mining)(a) | 146 | ||||||
| 86 | Helvetia Holding AG, Registered Shares (Insurance) | 12 | ||||||
| 1,325 | Holcim AG, Registered Shares (Construction Materials)(a) | 89 | ||||||
Shares | Security Description | Value | ||||||
Switzerland (continued) | ||||||||
| 559 | Julius Baer Group Ltd. (Capital Markets) | $ | 35 | |||||
| 137 | Kuehne + Nagel International AG, Registered Shares (Marine Transportation) | 41 | ||||||
| 392 | Logitech International SA, Registered Shares (Technology Hardware, Storage & Peripherals) | 23 | ||||||
| 181 | Lonza Group AG, Registered Shares (Life Sciences Tools & Services)(a) | 108 | ||||||
| 6,668 | Nestle SA, Registered Shares (Food Products) | 802 | ||||||
| 4,981 | Novartis AG, Registered Shares (Pharmaceuticals) | 502 | ||||||
| 53 | Partners Group Holding AG (Capital Markets) | 50 | ||||||
| 4,350 | Roche Holding AG (Pharmaceuticals) | 1,329 | ||||||
| 75 | Roche Holding AG (Pharmaceuticals) | 25 | ||||||
| 102 | Schindler Holding AG (Machinery) | 24 | ||||||
| 50 | Schindler Holding AG, Registered Shares (Machinery) | 11 | ||||||
| 375 | SGS SA, Registered Shares (Professional Services)(a) | 35 | ||||||
| 717 | SIG Group AG (Containers & Packaging)(a) | 20 | ||||||
| 345 | Sika AG, Registered Shares (Chemicals)(a) | 99 | ||||||
| 139 | Sonova Holding AG (Health Care Equipment & Supplies)(a) | 37 | ||||||
| 1,666 | STMicroelectronics N.V. (Semiconductors & Semiconductor Equipment) | 83 | ||||||
| 260 | Straumann Holding AG, Registered Shares (Health Care Equipment & Supplies) | 42 | ||||||
| 77 | Swiss Life Holding AG (Insurance) | 45 | ||||||
| 190 | Swiss Prime Site AG, Registered Shares (Real Estate Management & Development) | 17 | ||||||
| 749 | Swiss Re AG (Insurance) | 75 | ||||||
| 66 | Swisscom AG, Registered Shares (Diversified Telecommunication Services) | 41 | ||||||
| 164 | Temenos AG, Registered Shares (Software) | 13 | ||||||
| 67 | The Swatch Group AG (Textiles, Apparel & Luxury Goods) | 20 | ||||||
| 108 | The Swatch Group AG (Textiles, Apparel & Luxury Goods) | 6 | ||||||
| 7,753 | UBS Group AG (Capital Markets) | 157 | ||||||
| 65 | VAT Group AG (Machinery) | 27 | ||||||
| 366 | Zurich Insurance Group AG (Insurance) | 174 | ||||||
| 5,118 | ||||||||
Taiwan — 0.52% | ||||||||
| 8,383 | Taiwan Semiconductor Manufacturing Co. Ltd., ADR (Semiconductors & Semiconductor Equipment) | 846 | ||||||
See accompanying notes to financial statements.
86
HC CAPITAL TRUST
The ESG Growth Portfolio
Portfolio of Investments (continued) — June 30, 2023
Shares | Security Description | Value | ||||||
Common Stocks (continued) | ||||||||
United Arab Emirates — 0.00% | ||||||||
| 339 | NMC Health PLC (Health Care Providers & Services)(b)(c) | $ | — | |||||
United Kingdom — 4.05% | ||||||||
| 2,438 | 3i Group PLC (Capital Markets) | 60 | ||||||
| 5,849 | abrdn PLC (Capital Markets) | 16 | ||||||
| 496 | Admiral Group PLC (Insurance) | 13 | ||||||
| 3,739 | Amcor PLC (Containers & Packaging) | 37 | ||||||
| 3,061 | Anglo American PLC (Metals & Mining) | 87 | ||||||
| 1,093 | Ashtead Group PLC (Trading Companies & Distributors) | 76 | ||||||
| 902 | Associated British Foods PLC (Food Products) | 23 | ||||||
| 3,722 | AstraZeneca PLC (Pharmaceuticals)(a) | 533 | ||||||
| 2,623 | Auto Trader Group PLC (Interactive Media & Services)(a) | 20 | ||||||
| 6,745 | Aviva PLC (Insurance) | 34 | ||||||
| 7,610 | BAE Systems PLC (Aerospace & Defense) | 90 | ||||||
| 37,550 | Barclays PLC (Banks)(a) | 73 | ||||||
| 2,421 | Barratt Developments PLC (Household Durables)(a) | 13 | ||||||
| 178 | Berkeley Group Holdings PLC (Household Durables) | 9 | ||||||
| 42,413 | BP PLC (Oil, Gas & Consumable Fuels) | 247 | ||||||
| 17,011 | BT Group PLC (Diversified Telecommunication Services) | 26 | ||||||
| 886 | Bunzl PLC (Trading Companies & Distributors) | 34 | ||||||
| 1,017 | Burberry Group PLC (Textiles, Apparel & Luxury Goods)(a) | 27 | ||||||
| 14,048 | Centrica PLC (Multi-Utilities)(a) | 22 | ||||||
| 861 | Clarivate PLC (Professional Services)(b) | 8 | ||||||
| 2,515 | CNH Industrial N.V. (Machinery) | 36 | ||||||
| 530 | Coca-Cola Europacific Partners PLC (Beverages) | 34 | ||||||
| 4,285 | Compass Group PLC (Hotels, Restaurants & Leisure) | 120 | ||||||
| 4,220 | Croda International PLC (Chemicals)(a) | 302 | ||||||
| 5,525 | Diageo PLC (Beverages) | 237 | ||||||
| 466 | Endeavour Mining PLC (Metals & Mining) | 11 | ||||||
| 1,361 | Entain PLC (Hotels, Restaurants & Leisure)(a) | 22 | ||||||
| 486 | Ferguson PLC (Trading Companies & Distributors) | 77 | ||||||
| 9,783 | GSK PLC (Pharmaceuticals) | 173 | ||||||
| 12,545 | Haleon PLC (Personal Care Products) | 51 | ||||||
| 950 | Halma PLC (Electronic Equipment, Instruments & Components) | 27 | ||||||
| 823 | Hargreaves Lansdown PLC (Capital Markets) | 9 | ||||||
| 223 | Hikma Pharmaceuticals PLC (Pharmaceuticals)(a) | 5 | ||||||
| 48,478 | HSBC Holdings PLC (Banks) | 384 | ||||||
| 3,731 | Informa PLC (Media) | 34 | ||||||
Shares | Security Description | Value | ||||||
United Kingdom (continued) | ||||||||
| 8,793 | InterContinental Hotels Group PLC (Hotels, Restaurants & Leisure) | $ | 609 | |||||
| 405 | Intertek Group PLC (Professional Services) | 22 | ||||||
| 4,095 | J Sainsbury PLC (Consumer Staples Distribution & Retail) | 14 | ||||||
| 6,250 | JD Sports Fashion PLC (Specialty Retail) | 12 | ||||||
| 474 | Johnson Matthey PLC (Chemicals) | 11 | ||||||
| 5,168 | Kingfisher PLC (Specialty Retail) | 15 | ||||||
| 1,659 | Land Securities Group PLC (Diversified REITs) | 12 | ||||||
| 193,708 | Legal & General Group PLC (Insurance) | 561 | ||||||
| 439 | Liberty Global PLC, Class - A (Diversified Telecommunication Services)(b) | 7 | ||||||
| 718 | Liberty Global PLC, Class - C (Diversified Telecommunication Services)(b) | 13 | ||||||
| 157,812 | Lloyds Banking Group PLC (Banks) | 87 | ||||||
| 977 | London Stock Exchange Group PLC (Capital Markets) | 104 | ||||||
| 6,041 | M&G PLC (Financial Services) | 15 | ||||||
| 1,214 | Mondi PLC (Paper & Forest Products) | 19 | ||||||
| �� | 8,973 | National Grid PLC (Multi-Utilities) | 119 | |||||
| 13,116 | NatWest Group PLC (Banks)(a) | 40 | ||||||
| 278 | Next PLC (Broadline Retail) | 24 | ||||||
| 1,178 | Ocado Group PLC (Consumer Staples Distribution & Retail)(a)(b) | 9 | ||||||
| 1,722 | Pearson PLC (Diversified Consumer Services) | 18 | ||||||
| 406 | Pentair PLC (Machinery) | 26 | ||||||
| 795 | Persimmon PLC (Household Durables) | 10 | ||||||
| 2,089 | Phoenix Group Holdings PLC (Insurance) | 14 | ||||||
| 1,729 | Reckitt Benckiser Group PLC (Household Products) | 130 | ||||||
| 4,485 | RELX PLC (Professional Services) | 150 | ||||||
| 5,582 | Rentokil Initial PLC (Commercial Services & Supplies) | 44 | ||||||
| 2,735 | Rio Tinto PLC (Metals & Mining) | 174 | ||||||
| 20,995 | Rolls-Royce Holdings PLC (Aerospace & Defense)(b) | 40 | ||||||
| 1,911 | Schroders PLC (Capital Markets) | 11 | ||||||
| 3,088 | Segro PLC (Diversified REITs) | 28 | ||||||
| 626 | Severn Trent PLC (Water Utilities)(a) | 20 | ||||||
| 16,564 | Shell PLC (Oil, Gas & Consumable Fuels) | 494 | ||||||
| 2,223 | Smith & Nephew PLC (Health Care Equipment & Supplies) | 36 | ||||||
| 939 | Smiths Group PLC (Industrial Conglomerates) | 20 | ||||||
| 184 | Spirax-Sarco Engineering PLC (Machinery) | 24 | ||||||
| 2,627 | SSE PLC (Electric Utilities) | 62 | ||||||
| 1,240 | St. James’s Place PLC (Capital Markets) | 17 | ||||||
| 5,927 | Standard Chartered PLC (Banks) | 52 | ||||||
| 7,703 | Taylor Wimpey PLC (Household Durables)(a) | 10 | ||||||
See accompanying notes to financial statements.
87
HC CAPITAL TRUST
The ESG Growth Portfolio
Portfolio of Investments (continued) — June 30, 2023
Shares | Security Description | Value | ||||||
Common Stocks (continued) | ||||||||
United Kingdom (continued) | ||||||||
| 18,103 | Tesco PLC (Consumer Staples Distribution & Retail) | $ | 57 | |||||
| 2,489 | The British Land Co. PLC (Diversified REITs) | 10 | ||||||
| 2,722 | The Sage Group PLC (Software) | 32 | ||||||
| 6,029 | Unilever PLC (Personal Care Products) | 314 | ||||||
| 1,702 | United Utilities Group PLC (Water Utilities) | 21 | ||||||
| 53,281 | Vodafone Group PLC (Wireless Telecommunication Services) | 50 | ||||||
| 468 | Whitbread PLC (Hotels, Restaurants & Leisure) | 20 | ||||||
| 275 | Willis Towers Watson PLC (Insurance) | 65 | ||||||
| 2,653 | WPP PLC (Media) | 28 | ||||||
| 6,640 | ||||||||
United States — 66.87% | ||||||||
| 1,315 | 3M Co. (Industrial Conglomerates) | 132 | ||||||
| 352 | A.O. Smith Corp. (Building Products) | 26 | ||||||
| 4,239 | Abbott Laboratories (Health Care Equipment & Supplies) | 462 | ||||||
| 4,240 | AbbVie, Inc. (Biotechnology) | 571 | ||||||
| 1,811 | Activision Blizzard, Inc. (Entertainment)(b) | 153 | ||||||
| 1,115 | Adobe, Inc. (Software)(b) | 545 | ||||||
| 64 | Advance Auto Parts, Inc. (Specialty Retail) | 4 | ||||||
| 3,897 | Advanced Micro Devices, Inc. (Semiconductors & Semiconductor Equipment)(b) | 444 | ||||||
| 269 | AECOM (Construction & Engineering) | 23 | ||||||
| 1,458 | Aflac, Inc. (Insurance) | 102 | ||||||
| 698 | Agilent Technologies, Inc. (Life Sciences Tools & Services) | 84 | ||||||
| 547 | Air Products & Chemicals, Inc. (Chemicals) | 164 | ||||||
| 1,006 | Airbnb, Inc., Class - A (Hotels, Restaurants & Leisure)(b) | 129 | ||||||
| 339 | Akamai Technologies, Inc. (IT Services)(b) | 30 | ||||||
| 292 | Albemarle Corp. (Chemicals) | 65 | ||||||
| 612 | Albertsons Cos., Inc., Class - A (Consumer Staples Distribution & Retail) | 13 | ||||||
| 433 | Alcoa Corp. (Metals & Mining) | 15 | ||||||
| 406 | Alexandria Real Estate Equities, Inc. (Office REITs) | 46 | ||||||
| 181 | Align Technology, Inc. (Health Care Equipment & Supplies)(b) | 64 | ||||||
| 624 | Alliant Energy Corp. (Electric Utilities) | 33 | ||||||
| 662 | Ally Financial, Inc. (Consumer Finance) | 18 | ||||||
| 293 | Alnylam Pharmaceuticals, Inc. (Biotechnology)(b) | 56 | ||||||
| 23,473 | Alphabet, Inc., Class - A (Interactive Media & Services)(b) | 2,809 | ||||||
| 12,927 | Alphabet, Inc., Class - C (Interactive Media & Services)(b) | 1,564 | ||||||
Shares | Security Description | Value | ||||||
United States (continued) | ||||||||
| 31,671 | Amazon.com, Inc. (Broadline Retail)(b) | $ | 4,128 | |||||
| 628 | Ameren Corp. (Multi-Utilities) | 51 | ||||||
| 1,229 | American Electric Power Co., Inc. (Electric Utilities) | 103 | ||||||
| 1,547 | American Express Co. (Consumer Finance) | 269 | ||||||
| 749 | American Homes 4 Rent, Class - A (Residential REITs) | 27 | ||||||
| 1,798 | American International Group, Inc. (Insurance) | 103 | ||||||
| 1,137 | American Tower Corp. (Specialized REITs) | 221 | ||||||
| 3,726 | American Water Works Co., Inc. (Water Utilities) | 532 | ||||||
| 262 | Ameriprise Financial, Inc. (Capital Markets) | 87 | ||||||
| 409 | AmerisourceBergen Corp. (Health Care Providers & Services) | 79 | ||||||
| 524 | AMETEK, Inc. (Electrical Equipment) | 85 | ||||||
| 1,280 | Amgen, Inc. (Biotechnology) | 284 | ||||||
| 1,444 | Amphenol Corp., Class - A (Electronic Equipment, Instruments & Components) | 123 | ||||||
| 1,225 | Analog Devices, Inc. (Semiconductors & Semiconductor Equipment) | 239 | ||||||
| 1,005 | Annaly Capital Management, Inc. (Mortgage Real Estate Investment Trusts) | 20 | ||||||
| 215 | ANSYS, Inc. (Software)(b) | 71 | ||||||
| 497 | Aon PLC, Class - A (Insurance) | 172 | ||||||
| 827 | APA Corp. (Oil, Gas & Consumable Fuels) | 28 | ||||||
| 970 | Apollo Global Management, Inc. (Financial Services) | 75 | ||||||
| 38,254 | Apple, Inc. (Technology Hardware, Storage & Peripherals) | 7,419 | ||||||
| 2,054 | Applied Materials, Inc. (Semiconductors & Semiconductor Equipment) | 297 | ||||||
| 597 | Aramark (Hotels, Restaurants & Leisure) | 26 | ||||||
| 1,364 | Archer-Daniels-Midland Co. (Food Products) | 103 | ||||||
| 358 | Ares Management Corp., Class - A (Capital Markets) | 34 | ||||||
| 637 | Arista Networks, Inc. (Communications Equipment)(b) | 103 | ||||||
| 133 | Arrow Electronics, Inc. (Electronic Equipment, Instruments & Components)(b) | 19 | ||||||
| 527 | Arthur J. Gallagher & Co. (Insurance) | 116 | ||||||
| 70 | Aspen Technology, Inc. (Software)(b) | 12 | ||||||
| 147 | Assurant, Inc. (Insurance) | 18 | ||||||
| 17,062 | AT&T, Inc. (Diversified Telecommunication Services) | 272 | ||||||
| 367 | Atlassian Corp., Class - A (Software)(b) | 62 | ||||||
| 304 | Atmos Energy Corp. (Gas Utilities) | 35 | ||||||
| 533 | Autodesk, Inc. (Software)(b) | 109 | ||||||
| 1,018 | Automatic Data Processing, Inc. (Professional Services) | 224 | ||||||
See accompanying notes to financial statements.
88
HC CAPITAL TRUST
The ESG Growth Portfolio
Portfolio of Investments (continued) — June 30, 2023
Shares | Security Description | Value | ||||||
Common Stocks (continued) | ||||||||
United States (continued) | ||||||||
| 465 | AutoZone, Inc. (Specialty Retail)(b) | $ | 1,160 | |||||
| 311 | AvalonBay Communities, Inc. (Residential REITs) | 59 | ||||||
| 1,515 | Avantor, Inc. (Life Sciences Tools & Services)(b) | 31 | ||||||
| 211 | Avery Dennison Corp. (Containers & Packaging) | 36 | ||||||
| 163 | Axon Enterprise, Inc. (Aerospace & Defense)(b) | 32 | ||||||
| 2,477 | Baker Hughes Co. (Energy Equipment & Services) | 78 | ||||||
| 709 | Ball Corp. (Containers & Packaging) | 41 | ||||||
| 17,386 | Bank of America Corp. (Banks) | 499 | ||||||
| 530 | Bath & Body Works, Inc. (Specialty Retail) | 20 | ||||||
| 1,224 | Baxter International, Inc. (Health Care Equipment & Supplies) | 56 | ||||||
| 691 | Becton Dickinson & Co. (Health Care Equipment & Supplies) | 182 | ||||||
| 564 | Bentley Systems, Inc., Class - B (Software) | 31 | ||||||
| 3,141 | Berkshire Hathaway, Inc., Class - B (Financial Services)(b) | 1,071 | ||||||
| 474 | Best Buy Co., Inc. (Specialty Retail) | 39 | ||||||
| 229 | BILL Holdings, Inc. (Software)(b) | 27 | ||||||
| 344 | Biogen, Inc. (Biotechnology)(b) | 98 | ||||||
| 458 | BioMarin Pharmaceutical, Inc. (Biotechnology)(b) | 40 | ||||||
| 47 | Bio-Rad Laboratories, Inc., Class - A (Life Sciences Tools & Services)(b) | 18 | ||||||
| 348 | Bio-Techne Corp. (Life Sciences Tools & Services) | 28 | ||||||
| 378 | Black Knight, Inc. (Software)(b) | 23 | ||||||
| 359 | BlackRock, Inc., Class - A (Capital Markets) | 248 | ||||||
| 7,590 | Blackstone, Inc., Class - A (Capital Markets) | 705 | ||||||
| 1,332 | Block, Inc. (Financial Services)(b) | 89 | ||||||
| 92 | Booking Holdings, Inc. (Hotels, Restaurants & Leisure)(b) | 248 | ||||||
| 292 | Booz Allen Hamilton Holding Corp. (Professional Services) | 33 | ||||||
| 595 | BorgWarner, Inc. (Automobile Components) | 29 | ||||||
| 362 | Boston Properties, Inc. (Office REITs) | 21 | ||||||
| 3,476 | Boston Scientific Corp. (Health Care Equipment & Supplies)(b) | 188 | ||||||
| 5,069 | Bristol-Myers Squibb Co. (Pharmaceuticals) | 324 | ||||||
| 1,011 | Broadcom, Inc. (Semiconductors & Semiconductor Equipment) | 877 | ||||||
| 292 | Broadridge Financial Solutions, Inc. (Professional Services) | 48 | ||||||
| 300 | Brookfield Renewable Corp., Class - A (Independent Power and Renewable Electricity Producers)(a) | 9 | ||||||
| 611 | Brown & Brown, Inc. (Insurance) | 42 | ||||||
Shares | Security Description | Value | ||||||
United States (continued) | ||||||||
| 787 | Brown-Forman Corp., Class - B (Beverages) | $ | 53 | |||||
| 336 | Builders FirstSource, Inc. (Building Products)(b) | 46 | ||||||
| 373 | Bunge Ltd. (Food Products) | 35 | ||||||
| 169 | Burlington Stores, Inc. (Specialty Retail)(b) | 27 | ||||||
| 289 | C.H. Robinson Worldwide, Inc. (Air Freight & Logistics) | 27 | ||||||
| 646 | Cadence Design Systems, Inc. (Software)(b) | 151 | ||||||
| 509 | Caesars Entertainment, Inc. (Hotels, Restaurants & Leisure)(b) | 26 | ||||||
| 252 | Camden Property Trust (Residential REITs) | 27 | ||||||
| 404 | Campbell Soup Co. (Food Products) | 18 | ||||||
| 908 | Capital One Financial Corp. (Consumer Finance) | 99 | ||||||
| 656 | Cardinal Health, Inc. (Health Care Providers & Services) | 62 | ||||||
| 132 | Carlisle Cos., Inc. (Building Products) | 34 | ||||||
| 332 | CarMax, Inc. (Specialty Retail)(b) | 28 | ||||||
| 1,986 | Carrier Global Corp. (Building Products) | 99 | ||||||
| 431 | Catalent, Inc. (Pharmaceuticals)(b) | 19 | ||||||
| 1,251 | Caterpillar, Inc. (Machinery) | 308 | ||||||
| 283 | Cboe Global Markets, Inc. (Capital Markets) | 39 | ||||||
| 780 | CBRE Group, Inc., Class - A (Real Estate Management & Development)(b) | 63 | ||||||
| 338 | CDW Corp. (Electronic Equipment, Instruments & Components) | 62 | ||||||
| 280 | Celanese Corp., Series A (Chemicals) | 32 | ||||||
| 1,364 | Centene Corp. (Health Care Providers & Services)(b) | 92 | ||||||
| 1,460 | CenterPoint Energy, Inc. (Multi-Utilities) | 43 | ||||||
| 325 | Ceridian HCM Holding, Inc. (Professional Services)(b) | 22 | ||||||
| 472 | CF Industries Holdings, Inc. (Chemicals) | 33 | ||||||
| 122 | Charles River Laboratories International, Inc. (Life Sciences Tools & Services)(b) | 26 | ||||||
| 234 | Charter Communications, Inc., Class - A (Media)(b) | 86 | ||||||
| 578 | Cheniere Energy, Inc. (Oil, Gas & Consumable Fuels) | 88 | ||||||
| 269 | Chesapeake Energy Corp. (Oil, Gas & Consumable Fuels) | 23 | ||||||
| 4,362 | Chevron Corp. (Oil, Gas & Consumable Fuels) | 686 | ||||||
| 232 | Chewy, Inc., Class - A (Specialty Retail)(b) | 9 | ||||||
| 67 | Chipotle Mexican Grill, Inc. (Hotels, Restaurants & Leisure)(b) | 143 | ||||||
| 557 | Church & Dwight Co., Inc. (Household Products) | 56 | ||||||
| 361 | Cincinnati Financial Corp. (Insurance) | 35 | ||||||
| 224 | Cintas Corp. (Commercial Services & Supplies) | 111 | ||||||
| 9,928 | Cisco Systems, Inc. (Communications Equipment) | 514 | ||||||
See accompanying notes to financial statements.
89
HC CAPITAL TRUST
The ESG Growth Portfolio
Portfolio of Investments (continued) — June 30, 2023
Shares | Security Description | Value | ||||||
Common Stocks (continued) | ||||||||
United States (continued) | ||||||||
| 4,626 | Citigroup, Inc. (Banks) | $ | 213 | |||||
| 1,159 | Citizens Financial Group, Inc. (Banks) | 30 | ||||||
| 1,262 | Cleveland-Cliffs, Inc. (Metals & Mining)(b) | 21 | ||||||
| 631 | Cloudflare, Inc., Class - A (IT Services)(b) | 41 | ||||||
| 873 | CME Group, Inc. (Capital Markets) | 162 | ||||||
| 724 | CMS Energy Corp. (Multi-Utilities) | 43 | ||||||
| 430 | Cognex Corp. (Electronic Equipment, Instruments & Components) | 24 | ||||||
| 1,227 | Cognizant Technology Solutions Corp., Class - A (IT Services) | 80 | ||||||
| 405 | Coinbase Global, Inc., Class - A (Capital Markets)(b) | 29 | ||||||
| 1,908 | Colgate-Palmolive Co. (Household Products) | 147 | ||||||
| 10,191 | Comcast Corp., Class - A (Media) | 423 | ||||||
| 1,241 | Conagra Brands, Inc. (Food Products) | 42 | ||||||
| 2,916 | ConocoPhillips (Oil, Gas & Consumable Fuels) | 302 | ||||||
| 826 | Consolidated Edison, Inc. (Multi-Utilities) | 75 | ||||||
| 379 | Constellation Brands, Inc., Class - A (Beverages) | 93 | ||||||
| 790 | Constellation Energy Corp. (Electric Utilities) | 72 | ||||||
| 1,068 | Copart, Inc. (Commercial Services & Supplies)(b) | 97 | ||||||
| 1,975 | Corning, Inc. (Electronic Equipment, Instruments & Components) | 69 | ||||||
| 1,710 | Corteva, Inc. (Chemicals) | 98 | ||||||
| 1,001 | CoStar Group, Inc. (Professional Services)(b) | 89 | ||||||
| 1,081 | Costco Wholesale Corp. (Consumer Staples Distribution & Retail) | 582 | ||||||
| 1,862 | Coterra Energy, Inc. (Oil, Gas & Consumable Fuels) | 47 | ||||||
| 547 | Crowdstrike Holdings, Inc., Class - A (Software)(b) | 80 | ||||||
| 1,010 | Crown Castle, Inc. (Specialized REITs) | 115 | ||||||
| 278 | Crown Holdings, Inc. (Containers & Packaging) | 24 | ||||||
| 22,421 | CSX Corp. (Ground Transportation) | 764 | ||||||
| 356 | Cummins, Inc. (Machinery) | 87 | ||||||
| 3,075 | CVS Health Corp. (Health Care Providers & Services) | 213 | ||||||
| 740 | D.R. Horton, Inc. (Household Durables) | 90 | ||||||
| 1,662 | Danaher Corp. (Life Sciences Tools & Services) | 399 | ||||||
| 271 | Darden Restaurants, Inc. (Hotels, Restaurants & Leisure) | 45 | ||||||
| 387 | Darling Ingredients, Inc. (Food Products)(b) | 25 | ||||||
| 591 | Datadog, Inc., Class - A (Software)(b) | 58 | ||||||
| 119 | DaVita, Inc. (Health Care Providers & Services)(b) | 12 | ||||||
| 63 | Deckers Outdoor Corp. (Textiles, Apparel & Luxury Goods)(b) | 33 | ||||||
| 683 | Deere & Co. (Machinery) | 277 | ||||||
Shares | Security Description | Value | ||||||
United States (continued) | ||||||||
| 569 | Dell Technologies, Inc., Class - C (Technology Hardware, Storage & Peripherals) | $ | 31 | |||||
| 418 | Delta Air Lines, Inc. (Passenger Airlines)(b) | 20 | ||||||
| 561 | DENTSPLY SIRONA, Inc. (Health Care Equipment & Supplies) | 22 | ||||||
| 1,569 | Devon Energy Corp. (Oil, Gas & Consumable Fuels) | 76 | ||||||
| 944 | Dexcom, Inc. (Health Care Equipment & Supplies)(b) | 121 | ||||||
| 412 | Diamondback Energy, Inc. (Oil, Gas & Consumable Fuels) | 54 | ||||||
| 146 | Dick’s Sporting Goods, Inc. (Specialty Retail) | 19 | ||||||
| 713 | Digital Realty Trust, Inc. (Specialized REITs) | 81 | ||||||
| 661 | Discover Financial Services (Consumer Finance) | 77 | ||||||
| 466 | DocuSign, Inc. (Software)(b) | 24 | ||||||
| 506 | Dollar General Corp. (Consumer Staples Distribution & Retail) | 86 | ||||||
| 529 | Dollar Tree, Inc. (Consumer Staples Distribution & Retail)(b) | 76 | ||||||
| 1,925 | Dominion Energy, Inc. (Multi-Utilities) | 100 | ||||||
| 84 | Domino’s Pizza, Inc. (Hotels, Restaurants & Leisure) | 28 | ||||||
| 597 | DoorDash, Inc., Class - A (Hotels, Restaurants & Leisure)(b) | 46 | ||||||
| 350 | Dover Corp. (Machinery) | 52 | ||||||
| 1,691 | Dow, Inc. (Chemicals) | 90 | ||||||
| 766 | Dropbox, Inc., Class - A (Software)(b) | 20 | ||||||
| 490 | DTE Energy Co. (Multi-Utilities) | 54 | ||||||
| 1,889 | Duke Energy Corp. (Electric Utilities) | 170 | ||||||
| 1,161 | DuPont de Nemours, Inc. (Chemicals) | 83 | ||||||
| 571 | Dynatrace, Inc. (Software)(b) | 29 | ||||||
| 304 | Eastman Chemical Co. (Chemicals) | 25 | ||||||
| 971 | Eaton Corp. PLC (Electrical Equipment) | 195 | ||||||
| 1,287 | eBay, Inc. (Broadline Retail) | 58 | ||||||
| 624 | Ecolab, Inc. (Chemicals) | 116 | ||||||
| 915 | Edison International (Electric Utilities) | 64 | ||||||
| 1,437 | Edwards Lifesciences Corp. (Health Care Equipment & Supplies)(b) | 136 | ||||||
| 647 | Electronic Arts, Inc. (Entertainment) | 84 | ||||||
| 566 | Elevance Health, Inc. (Health Care Providers & Services) | 251 | ||||||
| 1,955 | Eli Lilly & Co. (Pharmaceuticals) | 917 | ||||||
| 1,382 | Emerson Electric Co. (Electrical Equipment) | 125 | ||||||
| 326 | Enphase Energy, Inc. (Semiconductors & Semiconductor Equipment)(b) | 55 | ||||||
| 378 | Entegris, Inc. (Semiconductors & Semiconductor Equipment) | 42 | ||||||
| 508 | Entergy Corp. (Electric Utilities) | 49 | ||||||
See accompanying notes to financial statements.
90
HC CAPITAL TRUST
The ESG Growth Portfolio
Portfolio of Investments (continued) — June 30, 2023
Shares | Security Description | Value | ||||||
Common Stocks (continued) | ||||||||
United States (continued) | ||||||||
| 8,712 | EOG Resources, Inc. (Oil, Gas & Consumable Fuels) | $ | 997 | |||||
| 139 | EPAM Systems, Inc. (IT Services)(b) | 31 | ||||||
| 788 | EQT Corp. (Oil, Gas & Consumable Fuels) | 32 | ||||||
| 296 | Equifax, Inc. (Professional Services) | 70 | ||||||
| 221 | Equinix, Inc. (Specialized REITs) | 173 | ||||||
| 940 | Equitable Holdings, Inc. (Financial Services) | 26 | ||||||
| 431 | Equity LifeStyle Properties, Inc. (Residential REITs) | 29 | ||||||
| 881 | Equity Residential (Residential REITs) | 58 | ||||||
| 545 | Essential Utilities, Inc. (Water Utilities) | 22 | ||||||
| 158 | Essex Property Trust, Inc. (Residential REITs) | 37 | ||||||
| 309 | Etsy, Inc. (Broadline Retail)(b) | 26 | ||||||
| 581 | Evergy, Inc. (Electric Utilities) | 34 | ||||||
| 842 | Eversource Energy (Electric Utilities) | 60 | ||||||
| 409 | Exact Sciences Corp. (Biotechnology)(b) | 38 | ||||||
| 2,388 | Exelon Corp. (Electric Utilities) | 97 | ||||||
| 380 | Expeditors International of Washington, Inc. (Air Freight & Logistics) | 46 | ||||||
| 327 | Extra Space Storage, Inc. (Specialized REITs) | 49 | ||||||
| 9,827 | Exxon Mobil Corp. (Oil, Gas & Consumable Fuels) | 1,054 | ||||||
| 153 | F5, Inc. (Communications Equipment)(b) | 22 | ||||||
| 96 | FactSet Research Systems, Inc. (Capital Markets) | 38 | ||||||
| 61 | Fair Isaac Corp. (Software)(b) | 49 | ||||||
| 1,398 | Fastenal Co. (Trading Companies & Distributors) | 82 | ||||||
| 579 | FedEx Corp. (Air Freight & Logistics) | 144 | ||||||
| 676 | Fidelity National Financial, Inc. (Insurance) | 24 | ||||||
| 1,386 | Fidelity National Information Services, Inc. (Financial Services) | 76 | ||||||
| 1,665 | Fifth Third Bancorp (Banks) | 44 | ||||||
| 23 | First Citizens BancShares, Inc., Class - A (Banks) | 30 | ||||||
| 1,274 | First Horizon Corp. (Banks) | 14 | ||||||
| 227 | First Solar, Inc. (Semiconductors & Semiconductor Equipment)(b) | 43 | ||||||
| 1,263 | FirstEnergy Corp. (Electric Utilities) | 49 | ||||||
| 1,512 | Fiserv, Inc. (Financial Services)(b) | 191 | ||||||
| 162 | FleetCor Technologies, Inc. (Financial Services)(b) | 41 | ||||||
| 331 | FMC Corp. (Chemicals) | 35 | ||||||
| 9,539 | Ford Motor Co. (Automobile Components) | 144 | ||||||
| 1,580 | Fortinet, Inc. (Software)(b) | 119 | ||||||
| 16,654 | Fortive Corp. (Machinery) | 1,246 | ||||||
| 336 | Fortune Brands Innovations, Inc. (Building Products) | 24 | ||||||
| 832 | Fox Corp., Class - A (Media) | 28 | ||||||
| 244 | Fox Corp., Class - B (Media) | 8 | ||||||
Shares | Security Description | Value | ||||||
United States (continued) | ||||||||
| 748 | Franklin Resources, Inc. (Capital Markets) | $ | 20 | |||||
| 3,494 | Freeport-McMoRan, Inc. (Metals & Mining) | 140 | ||||||
| 188 | Gartner, Inc. (IT Services)(b) | 66 | ||||||
| 892 | GE HealthCare Technologies, Inc. (Health Care Equipment & Supplies) | 72 | ||||||
| 1,470 | Gen Digital, Inc. (Software) | 27 | ||||||
| 153 | Generac Holdings, Inc. (Electrical Equipment)(b) | 23 | ||||||
| 572 | General Dynamics Corp. (Aerospace & Defense) | 123 | ||||||
| 2,612 | General Electric Co. (Industrial Conglomerates) | 287 | ||||||
| 1,429 | General Mills, Inc. (Food Products) | 110 | ||||||
| 3,457 | General Motors Co. (Automobile Components) | 133 | ||||||
| 334 | Genuine Parts Co. (Distributors) | 57 | ||||||
| 2,970 | Gilead Sciences, Inc. (Biotechnology) | 229 | ||||||
| 652 | Global Payments, Inc. (Financial Services) | 64 | ||||||
| 328 | GoDaddy, Inc., Class - A (IT Services)(b) | 25 | ||||||
| 409 | Graco, Inc. (Machinery) | 35 | ||||||
| 2,151 | Halliburton Co. (Energy Equipment & Services) | 71 | ||||||
| 328 | Hasbro, Inc. (Leisure Products) | 21 | ||||||
| 2,113 | HCA Healthcare, Inc. (Health Care Providers & Services) | 642 | ||||||
| 1,356 | Healthpeak Properties, Inc. (Health Care REITs) | 27 | ||||||
| 100 | HEICO Corp. (Aerospace & Defense) | 18 | ||||||
| 183 | HEICO Corp., Class - A (Aerospace & Defense) | 26 | ||||||
| 282 | Henry Schein, Inc. (Health Care Providers & Services)(b) | 23 | ||||||
| 651 | Hess Corp. (Oil, Gas & Consumable Fuels) | 89 | ||||||
| 3,301 | Hewlett Packard Enterprise Co. (Technology Hardware, Storage & Peripherals) | 55 | ||||||
| 373 | HF Sinclair Corp. (Oil, Gas & Consumable Fuels) | 17 | ||||||
| 626 | Hilton Worldwide Holdings, Inc. (Hotels, Restaurants & Leisure) | 91 | ||||||
| 613 | Hologic, Inc. (Health Care Equipment & Supplies)(b) | 50 | ||||||
| 1,628 | Honeywell International, Inc. (Industrial Conglomerates) | 338 | ||||||
| 540 | Horizon Therapeutics PLC (Biotechnology)(b) | 56 | ||||||
| 749 | Hormel Foods Corp. (Food Products) | 30 | ||||||
| 1,807 | Host Hotels & Resorts, Inc. (Hotel & Resort REITs) | 30 | ||||||
| 810 | Howmet Aerospace, Inc. (Aerospace & Defense) | 40 | ||||||
| 2,130 | HP, Inc. (Technology Hardware, Storage & Peripherals) | 65 | ||||||
| 118 | Hubbell, Inc. (Electrical Equipment) | 39 | ||||||
| 117 | HubSpot, Inc. (Software)(b) | 62 | ||||||
| 305 | Humana, Inc. (Health Care Providers & Services) | 136 | ||||||
| 3,515 | Huntington Bancshares, Inc. (Banks) | 38 | ||||||
See accompanying notes to financial statements.
91
HC CAPITAL TRUST
The ESG Growth Portfolio
Portfolio of Investments (continued) — June 30, 2023
Shares | Security Description | Value | ||||||
Common Stocks (continued) | ||||||||
United States (continued) | ||||||||
| 72 | Huntington Ingalls Industries, Inc. (Aerospace & Defense) | $ | 16 | |||||
| 114 | Hyatt Hotels Corp., Class - A (Hotels, Restaurants & Leisure) | 13 | ||||||
| 185 | IDEX Corp. (Machinery) | 40 | ||||||
| 207 | IDEXX Laboratories, Inc. (Health Care Equipment & Supplies)(b) | 104 | ||||||
| 727 | Illinois Tool Works, Inc. (Machinery) | 182 | ||||||
| 379 | Illumina, Inc. (Life Sciences Tools & Services)(b) | 71 | ||||||
| 455 | Incyte Corp. (Biotechnology)(b) | 28 | ||||||
| 891 | Ingersoll Rand, Inc. (Machinery) | 58 | ||||||
| 156 | Insulet Corp. (Health Care Equipment & Supplies)(b) | 45 | ||||||
| 10,039 | Intel Corp. (Semiconductors & Semiconductor Equipment) | 336 | ||||||
| 1,375 | Intercontinental Exchange, Inc. (Capital Markets) | 155 | ||||||
| 2,167 | International Business Machines Corp. (IT Services) | 290 | ||||||
| 626 | International Flavors & Fragrances, Inc. (Chemicals) | 50 | ||||||
| 685 | International Paper Co. (Containers & Packaging) | 22 | ||||||
| 681 | Intuit, Inc. (Software) | 312 | ||||||
| 841 | Intuitive Surgical, Inc. (Health Care Equipment & Supplies)(b) | 288 | ||||||
| 902 | Invesco Ltd. (Capital Markets) | 15 | ||||||
| 1,502 | Invitation Homes, Inc. (Residential REITs) | 52 | ||||||
| 468 | IQVIA Holdings, Inc. (Life Sciences Tools & Services)(b) | 105 | ||||||
| 722 | Iron Mountain, Inc. (Specialized REITs) | 41 | ||||||
| 157 | Jack Henry & Associates, Inc. (Professional Services) | 26 | ||||||
| 299 | Jacobs Solutions, Inc. (Professional Services) | 36 | ||||||
| 152 | Jazz Pharmaceuticals PLC (Pharmaceuticals)(b) | 19 | ||||||
| 214 | JB Hunt Transport Services, Inc. (Ground Transportation) | 39 | ||||||
| 6,277 | Johnson & Johnson (Pharmaceuticals) | 1,039 | ||||||
| 1,645 | Johnson Controls International PLC (Building Products) | 112 | ||||||
| 7,064 | JPMorgan Chase & Co. (Banks) | 1,027 | ||||||
| 661 | Juniper Networks, Inc. (Communications Equipment) | 21 | ||||||
| 641 | Kellogg Co. (Food Products) | 43 | ||||||
| 2,144 | Keurig Dr Pepper, Inc. (Beverages) | 67 | ||||||
| 2,368 | KeyCorp (Banks) | 22 | ||||||
| 447 | Keysight Technologies, Inc. (Electronic Equipment, Instruments & Components)(b) | 75 | ||||||
Shares | Security Description | Value | ||||||
United States (continued) | ||||||||
| 827 | Kimberly-Clark Corp. (Household Products) | $ | 114 | |||||
| 1,515 | Kimco Realty Corp. (Retail REITs) | 30 | ||||||
| 4,978 | Kinder Morgan, Inc. (Oil, Gas & Consumable Fuels) | 86 | ||||||
| 1,480 | KKR & Co., Inc. (Capital Markets) | 83 | ||||||
| 339 | KLA Corp. (Semiconductors & Semiconductor Equipment) | 164 | ||||||
| 384 | Knight-Swift Transportation Holdings, Inc. (Ground Transportation) | 21 | ||||||
| 467 | L3Harris Technologies, Inc. (Aerospace & Defense) | 91 | ||||||
| 203 | Laboratory Corporation of America Holdings (Health Care Providers & Services) | 49 | ||||||
| 321 | Lam Research Corp. (Semiconductors & Semiconductor Equipment) | 206 | ||||||
| 336 | Lamb Weston Holdings, Inc. (Food Products) | 39 | ||||||
| 882 | Las Vegas Sands Corp. (Hotels, Restaurants & Leisure)(b) | 51 | ||||||
| 333 | Lattice Semiconductor Corp. (Semiconductors & Semiconductor Equipment)(b) | 32 | ||||||
| 147 | Lear Corp. (Automobile Components) | 21 | ||||||
| 264 | Leidos Holdings, Inc. (Professional Services) | 23 | ||||||
| 585 | Lennar Corp., Class - A (Household Durables) | 73 | ||||||
| 87 | Lennox International, Inc. (Building Products) | 28 | ||||||
| 296 | Liberty Broadband Corp., Class - C (Media)(b) | 24 | ||||||
| 427 | Liberty Media Corp. - Liberty Formula One, Class - C (Entertainment)(b) | 32 | ||||||
| 1,186 | Linde PLC (Chemicals) | 452 | ||||||
| 382 | Live Nation Entertainment, Inc. (Entertainment)(b) | 35 | ||||||
| 612 | LKQ Corp. (Distributors) | 36 | ||||||
| 553 | Lockheed Martin Corp. (Aerospace & Defense) | 255 | ||||||
| 490 | Loews Corp. (Insurance) | 29 | ||||||
| 1,430 | Lowe’s Cos., Inc. (Specialty Retail) | 323 | ||||||
| 198 | LPL Financial Holdings, Inc. (Capital Markets) | 43 | ||||||
| 1,926 | Lucid Group, Inc. (Automobile Components)(b) | 13 | ||||||
| 576 | LyondellBasell Industries N.V., Class - A (Chemicals) | 53 | ||||||
| 420 | M&T Bank Corp. (Banks) | 52 | ||||||
| 1,663 | Marathon Oil Corp. (Oil, Gas & Consumable Fuels) | 38 | ||||||
| 1,057 | Marathon Petroleum Corp. (Oil, Gas & Consumable Fuels) | 123 | ||||||
| 1,865 | MarketAxess Holdings, Inc. (Capital Markets) | 487 | ||||||
| 634 | Marriott International, Inc., Class - A (Hotels, Restaurants & Leisure) | 116 | ||||||
| 1,178 | Marsh & McLennan Cos., Inc. (Insurance) | 222 | ||||||
| 159 | Martin Marietta Materials, Inc. (Construction Materials) | 73 | ||||||
See accompanying notes to financial statements.
92
HC CAPITAL TRUST
The ESG Growth Portfolio
Portfolio of Investments (continued) — June 30, 2023
Shares | Security Description | Value | ||||||
Common Stocks (continued) | ||||||||
United States (continued) | ||||||||
| 2,071 | Marvell Technology, Inc. (Semiconductors & Semiconductor Equipment) | $ | 124 | |||||
| 619 | Masco Corp. (Building Products) | 36 | ||||||
| 87 | Masimo Corp. (Health Care Equipment & Supplies)(b) | 14 | ||||||
| 2,049 | Mastercard, Inc., Class - A (Financial Services) | 806 | ||||||
| 667 | Match Group, Inc. (Interactive Media & Services)(b) | 28 | ||||||
| 630 | McCormick & Co., Inc./MD (Food Products) | 55 | ||||||
| 1,762 | McDonald’s Corp. (Hotels, Restaurants & Leisure) | 526 | ||||||
| 332 | McKesson Corp. (Health Care Providers & Services) | 142 | ||||||
| 6,171 | Merck & Co., Inc. (Pharmaceuticals) | 712 | ||||||
| 1,657 | MetLife, Inc. (Insurance) | 94 | ||||||
| 53 | Mettler-Toledo International, Inc. (Life Sciences Tools & Services)(b) | 70 | ||||||
| 760 | MGM Resorts International (Hotels, Restaurants & Leisure) | 33 | ||||||
| 1,314 | Microchip Technology, Inc. (Semiconductors & Semiconductor Equipment) | 118 | ||||||
| 6,562 | Micron Technology, Inc. (Semiconductors & Semiconductor Equipment) | 414 | ||||||
| 23,233 | Microsoft Corp. (Software) | 7,909 | ||||||
| 260 | Mid-America Apartment Communities, Inc. (Residential REITs) | 39 | ||||||
| 806 | Moderna, Inc. (Biotechnology)(b) | 98 | ||||||
| 144 | Mohawk Industries, Inc. (Household Durables)(b) | 15 | ||||||
| 139 | Molina Healthcare, Inc. (Health Care Providers & Services)(b) | 42 | ||||||
| 479 | Molson Coors Beverage Co., Class - B (Beverages) | 32 | ||||||
| 3,325 | Mondelez International, Inc., Class - A (Food Products) | 243 | ||||||
| 163 | MongoDB, Inc. (IT Services)(b) | 67 | ||||||
| 113 | Monolithic Power Systems, Inc. (Semiconductors & Semiconductor Equipment) | 61 | ||||||
| 1,878 | Monster Beverage Corp. (Beverages)(b) | 108 | ||||||
| 410 | Moody’s Corp. (Capital Markets) | 143 | ||||||
| 11,921 | Morgan Stanley (Capital Markets) | 1,018 | ||||||
| 409 | Motorola Solutions, Inc. (Communications Equipment) | 120 | ||||||
| 816 | Nasdaq, Inc. (Capital Markets) | 41 | ||||||
Shares | Security Description | Value | ||||||
United States (continued) | ||||||||
| 485 | NetApp, Inc. (Technology Hardware, Storage & Peripherals) | $ | 37 | |||||
| 2,166 | Netflix, Inc. (Entertainment)(b) | 955 | ||||||
| 236 | Neurocrine Biosciences, Inc. (Biotechnology)(b) | 22 | ||||||
| 1,855 | Newmont Corp. (Metals & Mining) | 79 | ||||||
| 898 | News Corp., Class - A (Media) | 18 | ||||||
| 4,923 | NextEra Energy, Inc. (Electric Utilities) | 365 | ||||||
| 2,985 | NIKE, Inc., Class - B (Textiles, Apparel & Luxury Goods) | 329 | ||||||
| 943 | NiSource, Inc. (Multi-Utilities) | 26 | ||||||
| 128 | Nordson Corp. (Machinery) | 32 | ||||||
| 557 | Norfolk Southern Corp. (Ground Transportation) | 126 | ||||||
| 484 | Northern Trust Corp. (Capital Markets) | 36 | ||||||
| 343 | Northrop Grumman Corp. (Aerospace & Defense) | 156 | ||||||
| 595 | Nucor Corp. (Metals & Mining) | 98 | ||||||
| 7,845 | NVIDIA Corp. (Semiconductors & Semiconductor Equipment) | 3,318 | ||||||
| 8 | NVR, Inc. (Household Durables)(b) | 51 | ||||||
| 1,746 | Occidental Petroleum Corp. (Oil, Gas & Consumable Fuels) | 103 | ||||||
| 377 | Okta, Inc. (IT Services)(b) | 26 | ||||||
| 234 | Old Dominion Freight Line, Inc. (Ground Transportation) | 87 | ||||||
| 457 | Omnicom Group, Inc. (Media) | 43 | ||||||
| 1,010 | ON Semiconductor Corp. (Semiconductors & Semiconductor Equipment)(b) | 96 | ||||||
| 1,109 | ONEOK, Inc. (Oil, Gas & Consumable Fuels) | 68 | ||||||
| 3,911 | Oracle Corp. (Software) | 466 | ||||||
| 149 | O’Reilly Automotive, Inc. (Specialty Retail)(b) | 142 | ||||||
| 1,007 | Otis Worldwide Corp. (Machinery) | 90 | ||||||
| 576 | Ovintiv, Inc. (Oil, Gas & Consumable Fuels) | 22 | ||||||
| 250 | Owens Corning (Building Products) | 33 | ||||||
| 1,254 | PACCAR, Inc. (Machinery) | 105 | ||||||
| 243 | Packaging Corp. of America (Containers & Packaging) | 32 | ||||||
| 729 | Palo Alto Networks, Inc. (Software)(b) | 186 | ||||||
| 1,090 | Paramount Global, Class - B (Media) | 17 | ||||||
| 311 | Parker-Hannifin Corp. (Machinery) | 121 | ||||||
| 790 | Paychex, Inc. (Professional Services) | 88 | ||||||
| 127 | Paycom Software, Inc. (Professional Services) | 41 | ||||||
| 99 | Paylocity Holding Corp. (Professional Services)(b) | 18 | ||||||
| 2,607 | PayPal Holdings, Inc. (Financial Services)(b) | 174 | ||||||
| 9,228 | PepsiCo, Inc. (Beverages) | 1,709 | ||||||
| 13,674 | Pfizer, Inc. (Pharmaceuticals) | 502 | ||||||
| 4,370 | PG&E Corp. (Electric Utilities)(b) | 76 | ||||||
| 1,088 | Phillips 66 (Oil, Gas & Consumable Fuels) | 104 | ||||||
See accompanying notes to financial statements.
93
HC CAPITAL TRUST
The ESG Growth Portfolio
Portfolio of Investments (continued) — June 30, 2023
Shares | Security Description | Value | ||||||
Common Stocks (continued) | ||||||||
United States (continued) | ||||||||
| 1,381 | Pinterest, Inc., Class - A (Interactive Media & Services)(b) | $ | 38 | |||||
| 565 | Pioneer Natural Resources Co. (Oil, Gas & Consumable Fuels) | 117 | ||||||
| 98 | Pool Corp. (Distributors) | 37 | ||||||
| 569 | PPG Industries, Inc. (Chemicals) | 84 | ||||||
| 1,723 | PPL Corp. (Electric Utilities) | 46 | ||||||
| 579 | Principal Financial Group, Inc. (Insurance) | 44 | ||||||
| 2,254 | Prologis, Inc. (Industrial REITs) | 276 | ||||||
| 885 | Prudential Financial, Inc. (Insurance) | 78 | ||||||
| 276 | PTC, Inc. (Software)(b) | 39 | ||||||
| 1,236 | Public Service Enterprise Group, Inc. (Multi-Utilities) | 77 | ||||||
| 387 | Public Storage (Specialized REITs) | 113 | ||||||
| 496 | PulteGroup, Inc. (Household Durables) | 39 | ||||||
| 209 | Qorvo, Inc. (Semiconductors & Semiconductor Equipment)(b) | 21 | ||||||
| 2,692 | QUALCOMM, Inc. (Semiconductors & Semiconductor Equipment) | 320 | ||||||
| 350 | Quanta Services, Inc. (Construction & Engineering) | 69 | ||||||
| 282 | Quest Diagnostics, Inc. (Health Care Providers & Services) | 40 | ||||||
| 471 | Raymond James Financial, Inc. (Capital Markets) | 49 | ||||||
| 3,552 | Raytheon Technologies Corp. (Aerospace & Defense) | 348 | ||||||
| 1,654 | Realty Income Corp. (Retail REITs) | 99 | ||||||
| 393 | Regency Centers Corp. (Retail REITs) | 24 | ||||||
| 260 | Regeneron Pharmaceuticals, Inc. (Biotechnology)(b) | 187 | ||||||
| 2,436 | Regions Financial Corp. (Banks) | 43 | ||||||
| 151 | Reliance Steel & Aluminum Co. (Metals & Mining) | 41 | ||||||
| 124 | Repligen Corp. (Life Sciences Tools & Services)(b) | 18 | ||||||
| 540 | Republic Services, Inc. (Commercial Services & Supplies) | 83 | ||||||
| 354 | ResMed, Inc. (Health Care Equipment & Supplies) | 77 | ||||||
| 280 | Revvity, Inc. (Life Sciences Tools & Services) | 33 | ||||||
| 1,588 | Rivian Automotive, Inc., Class - A (Automobile Components)(b) | 26 | ||||||
| 298 | Robert Half International, Inc. (Professional Services) | 22 | ||||||
| 1,031 | ROBLOX Corp., Class - A (Entertainment)(b) | 42 | ||||||
| 282 | Rockwell Automation, Inc. (Electrical Equipment) | 93 | ||||||
Shares | Security Description | Value | ||||||
United States (continued) | ||||||||
| 288 | Roku, Inc. (Entertainment)(b) | $ | 18 | |||||
| 602 | Rollins, Inc. (Commercial Services & Supplies) | 26 | ||||||
| 254 | Roper Technologies, Inc. (Software) | 122 | ||||||
| 862 | Ross Stores, Inc. (Specialty Retail) | 97 | ||||||
| 579 | Royal Caribbean Cruises Ltd. (Hotels, Restaurants & Leisure)(b) | 60 | ||||||
| 830 | Royalty Pharma PLC, Class - A (Pharmaceuticals) | 26 | ||||||
| 327 | RPM International, Inc. (Chemicals) | 29 | ||||||
| 796 | S&P Global, Inc. (Capital Markets) | 319 | ||||||
| 5,840 | Salesforce, Inc. (Software)(b) | 1,233 | ||||||
| 253 | SBA Communications Corp. (Specialized REITs) | 59 | ||||||
| 3,424 | Schlumberger N.V. (Energy Equipment & Services) | 168 | ||||||
| 480 | Seagate Technology Holdings PLC (Technology Hardware, Storage & Peripherals) | 30 | ||||||
| 325 | Seagen, Inc. (Biotechnology)(b) | 63 | ||||||
| 371 | Sealed Air Corp. (Containers & Packaging) | 15 | ||||||
| 766 | Sempra Energy (Multi-Utilities) | 112 | ||||||
| 377 | Sensata Technologies Holding PLC (Electrical Equipment) | 17 | ||||||
| 496 | ServiceNow, Inc. (Software)(b) | 279 | ||||||
| 815 | Simon Property Group, Inc. (Retail REITs) | 94 | ||||||
| 1,436 | Sirius XM Holdings, Inc. (Media) | 7 | ||||||
| 402 | Skyworks Solutions, Inc. (Semiconductors & Semiconductor Equipment) | 44 | ||||||
| 2,657 | Snap, Inc., Class - A (Interactive Media & Services)(b) | 31 | ||||||
| 132 | Snap-on, Inc. (Machinery) | 38 | ||||||
| 639 | Snowflake, Inc., Class - A (IT Services)(b) | 112 | ||||||
| 410 | Southwest Airlines Co. (Passenger Airlines) | 15 | ||||||
| 394 | Splunk, Inc. (Software)(b) | 42 | ||||||
| 388 | Stanley Black & Decker, Inc. (Machinery) | 36 | ||||||
| 2,775 | Starbucks Corp. (Hotels, Restaurants & Leisure) | 275 | ||||||
| 856 | State Street Corp. (Capital Markets) | 63 | ||||||
| 370 | Steel Dynamics, Inc. (Metals & Mining) | 40 | ||||||
| 243 | STERIS PLC (Health Care Equipment & Supplies) | 55 | ||||||
| 832 | Stryker Corp. (Health Care Equipment & Supplies) | 254 | ||||||
| 289 | Sun Communities, Inc. (Residential REITs) | 38 | ||||||
| 1,121 | Synchrony Financial (Consumer Finance) | 38 | ||||||
| 371 | Synopsys, Inc. (Software)(b) | 162 | ||||||
| 1,248 | Sysco Corp. (Consumer Staples Distribution & Retail) | 93 | ||||||
| 548 | T. Rowe Price Group, Inc. (Capital Markets) | 61 | ||||||
| 434 | Take-Two Interactive Software, Inc. (Entertainment)(b) | 64 | ||||||
See accompanying notes to financial statements.
94
HC CAPITAL TRUST
The ESG Growth Portfolio
Portfolio of Investments (continued) — June 30, 2023
Shares | Security Description | Value | ||||||
Common Stocks (continued) | ||||||||
United States (continued) | ||||||||
| 560 | Targa Resources Corp. (Oil, Gas & Consumable Fuels) | $ | 43 | |||||
| 1,120 | Target Corp. (Consumer Staples Distribution & Retail) | 148 | ||||||
| 708 | TE Connectivity Ltd. (Electronic Equipment, Instruments & Components) | 99 | ||||||
| 112 | Teledyne Technologies, Inc. (Electronic Equipment, Instruments & Components)(b) | 46 | ||||||
| 118 | Teleflex, Inc. (Health Care Equipment & Supplies) | 29 | ||||||
| 356 | Teradyne, Inc. (Semiconductors & Semiconductor Equipment) | 40 | ||||||
| 6,900 | Tesla, Inc. (Automobile Components)(b) | 1,805 | ||||||
| 2,203 | Texas Instruments, Inc. (Semiconductors & Semiconductor Equipment) | 397 | ||||||
| 538 | Textron, Inc. (Aerospace & Defense) | 36 | ||||||
| 1,676 | The AES Corp. (Independent Power and Renewable Electricity Producers) | 35 | ||||||
| 632 | The Allstate Corp. (Insurance) | 69 | ||||||
| 1,892 | The Bank of New York Mellon Corp. (Capital Markets) | 84 | ||||||
| 1,390 | The Boeing Co. (Aerospace & Defense)(b) | 294 | ||||||
| 450 | The Carlyle Group, Inc. (Capital Markets) | 14 | ||||||
| 3,658 | The Charles Schwab Corp. (Capital Markets) | 207 | ||||||
| 716 | The Cigna Group (Health Care Providers & Services) | 201 | ||||||
| 277 | The Clorox Co. (Household Products) | 44 | ||||||
| 9,928 | The Coca-Cola Co. (Beverages) | 598 | ||||||
| 126 | The Cooper Cos., Inc. (Health Care Equipment & Supplies) | 48 | ||||||
| 3,649 | The Estee Lauder Cos., Inc. (Personal Care Products) | 716 | ||||||
| 808 | The Goldman Sachs Group, Inc. (Capital Markets) | 261 | ||||||
| 758 | The Hartford Financial Services Group, Inc. (Insurance) | 55 | ||||||
| 358 | The Hershey Co. (Food Products) | 89 | ||||||
| 2,446 | The Home Depot, Inc. (Specialty Retail) | 760 | ||||||
| 935 | The Interpublic Group of Cos., Inc. (Media) | 36 | ||||||
| 272 | The J.M. Smucker Co. (Food Products) | 40 | ||||||
| 1,776 | The Kraft Heinz Co. (Food Products) | 63 | ||||||
| 1,590 | The Kroger Co. (Consumer Staples Distribution & Retail) | 75 | ||||||
| 692 | The Mosaic Co. (Chemicals) | 24 | ||||||
| 938 | The PNC Financial Services Group, Inc. (Banks) | 118 | ||||||
| 5,710 | The Procter & Gamble Co. (Household Products) | 866 | ||||||
| 1,421 | The Progressive Corp. (Insurance) | 188 | ||||||
| 612 | The Sherwin-Williams Co. (Chemicals) | 162 | ||||||
Shares | Security Description | Value | ||||||
United States (continued) | ||||||||
| 2,642 | The Southern Co. (Electric Utilities) | $ | 186 | |||||
| 2,823 | The TJX Cos., Inc. (Specialty Retail) | 239 | ||||||
| 240 | The Toro Co. (Machinery) | 24 | ||||||
| 1,083 | The Trade Desk, Inc., Class - A (Media)(b) | 84 | ||||||
| 540 | The Travelers Cos., Inc. (Insurance) | 94 | ||||||
| 4,432 | The Walt Disney Co. (Entertainment)(b) | 396 | ||||||
| 2,892 | The Williams Cos., Inc. (Oil, Gas & Consumable Fuels) | 94 | ||||||
| 2,732 | Thermo Fisher Scientific, Inc. (Life Sciences Tools & Services) | 1,425 | ||||||
| 8,275 | T-Mobile US, Inc. (Wireless Telecommunication Services)(b) | 1,150 | ||||||
| 623 | Toast, Inc., Class - A (Financial Services)(b) | 14 | ||||||
| 280 | Tractor Supply Co. (Specialty Retail) | 62 | ||||||
| 239 | Tradeweb Markets, Inc., Class - A (Capital Markets) | 16 | ||||||
| 129 | TransDigm Group, Inc. (Aerospace & Defense) | 115 | ||||||
| 480 | TransUnion (Professional Services) | 38 | ||||||
| 628 | Trimble, Inc. (Electronic Equipment, Instruments & Components)(b) | 33 | ||||||
| 3,214 | Truist Financial Corp. (Banks) | 98 | ||||||
| 396 | Twilio, Inc., Class - A (IT Services)(b) | 25 | ||||||
| 99 | Tyler Technologies, Inc. (Software)(b) | 41 | ||||||
| 641 | Tyson Foods, Inc., Class - A (Food Products) | 33 | ||||||
| 3,668 | U.S. Bancorp (Banks) | 121 | ||||||
| 4,421 | Uber Technologies, Inc. (Ground Transportation)(b) | 191 | ||||||
| 748 | UDR, Inc. (Residential REITs) | 32 | ||||||
| 502 | UGI Corp. (Gas Utilities) | 14 | ||||||
| 198 | U-Haul Holding Co. (Ground Transportation) | 10 | ||||||
| 127 | Ulta Beauty, Inc. (Specialty Retail)(b) | 60 | ||||||
| 1,485 | Union Pacific Corp. (Ground Transportation) | 304 | ||||||
| 1,752 | United Parcel Service, Inc., Class - B (Air Freight & Logistics) | 314 | ||||||
| 172 | United Rentals, Inc. (Trading Companies & Distributors) | 77 | ||||||
| 102 | United Therapeutics Corp. (Biotechnology)(b) | 23 | ||||||
| 5,303 | UnitedHealth Group, Inc. (Health Care Providers & Services) | 2,549 | ||||||
| 562 | Unity Software, Inc. (Software)(b) | 24 | ||||||
| 797 | V.F. Corp. (Textiles, Apparel & Luxury Goods) | 15 | ||||||
| 98 | Vail Resorts, Inc. (Hotels, Restaurants & Leisure) | 25 | ||||||
| 885 | Valero Energy Corp. (Oil, Gas & Consumable Fuels) | 104 | ||||||
| 333 | Veeva Systems, Inc., Class - A (Health Care Technology)(b) | 66 | ||||||
| 976 | Ventas, Inc. (Health Care REITs) | 46 | ||||||
| 244 | VeriSign, Inc. (IT Services)(b) | 55 | ||||||
See accompanying notes to financial statements.
95
HC CAPITAL TRUST
The ESG Growth Portfolio
Portfolio of Investments (continued) — June 30, 2023
Shares | Security Description | Value | ||||||
Common Stocks (continued) | ||||||||
United States (continued) | ||||||||
| 353 | Verisk Analytics, Inc., Class - A (Professional Services) | $ | 80 | |||||
| 10,161 | Verizon Communications, Inc. (Diversified Telecommunication Services) | 378 | ||||||
| 633 | Vertex Pharmaceuticals, Inc. (Biotechnology)(b) | 223 | ||||||
| 3,079 | Viatris, Inc. (Pharmaceuticals) | 31 | ||||||
| 2,341 | VICI Properties, Inc. (Specialized REITs) | 74 | ||||||
| 8,613 | Visa, Inc., Class - A (Financial Services) | 2,046 | ||||||
| 837 | Vistra Corp. (Independent Power and Renewable Electricity Producers) | 22 | ||||||
| 576 | VMware, Inc., Class - A (Software)(b) | 83 | ||||||
| 338 | Vulcan Materials Co. (Construction Materials) | 76 | ||||||
| 550 | W.R. Berkley Corp. (Insurance) | 33 | ||||||
| 109 | W.W. Grainger, Inc. (Trading Companies & Distributors) | 86 | ||||||
| 1,782 | Walgreens Boots Alliance, Inc. (Consumer Staples Distribution & Retail) | 51 | ||||||
| 3,591 | Walmart, Inc. (Consumer Staples Distribution & Retail) | 564 | ||||||
| 5,726 | Warner Bros. Discovery, Inc. (Entertainment)(b) | 72 | ||||||
| 977 | Waste Management, Inc. (Commercial Services & Supplies) | 169 | ||||||
| 148 | Waters Corp. (Life Sciences Tools & Services)(b) | 39 | ||||||
| 80 | Watsco, Inc. (Trading Companies & Distributors) | 31 | ||||||
| 383 | Webster Financial Corp. (Banks) | 14 | ||||||
| 793 | WEC Energy Group, Inc. (Multi-Utilities) | 70 | ||||||
| 9,109 | Wells Fargo & Co. (Banks) | 389 | ||||||
| 1,218 | Welltower, Inc. (Health Care REITs) | 99 | ||||||
| 180 | West Pharmaceutical Services, Inc. (Life Sciences Tools & Services) | 69 | ||||||
| 736 | Western Digital Corp. (Technology Hardware, Storage & Peripherals)(b) | 28 | ||||||
| 377 | Westinghouse Air Brake Technologies Corp. (Machinery) | 41 | ||||||
| 121 | Westlake Corp. (Chemicals) | 14 | ||||||
| 649 | Westrock Co. (Containers & Packaging) | 19 | ||||||
| 1,723 | Weyerhaeuser Co. (Specialized REITs) | 58 | ||||||
| 104 | Whirlpool Corp. (Household Durables) | 15 | ||||||
| 298 | Wolfspeed, Inc. (Semiconductors & Semiconductor Equipment)(b) | 17 | ||||||
| 495 | Workday, Inc., Class - A (Software)(b) | 112 | ||||||
| 467 | WP Carey, Inc. (Diversified REITs) | 32 | ||||||
| 260 | Wynn Resorts Ltd. (Hotels, Restaurants & Leisure) | 27 | ||||||
| 1,316 | Xcel Energy, Inc. (Electric Utilities) | 82 | ||||||
| 559 | Xylem, Inc. (Machinery) | 63 | ||||||
| 687 | Yum! Brands, Inc. (Hotels, Restaurants & Leisure) | 95 | ||||||
Shares | Security Description | Value | ||||||
United States (continued) | ||||||||
| 127 | Zebra Technologies Corp. (Electronic Equipment, Instruments & Components)(b) | $ | 38 | |||||
| 384 | Zillow Group, Inc., Class - C (Real Estate Management & Development)(b) | 19 | ||||||
| 508 | Zimmer Biomet Holdings, Inc. (Health Care Equipment & Supplies) | 74 | ||||||
| 1,118 | Zoetis, Inc. (Pharmaceuticals) | 193 | ||||||
| 577 | Zoom Video Communications, Inc., Class - A (Software)(b) | 39 | ||||||
| 548 | ZoomInfo Technologies, Inc. (Interactive Media & Services)(b) | 14 | ||||||
| 199 | Zscaler, Inc. (Software)(b) | 29 | ||||||
| 109,756 | ||||||||
Uruguay — 0.08% | ||||||||
| 106 | MercadoLibre, Inc. (Broadline Retail)(b) | 126 | ||||||
Total Common Stocks | 162,726 | |||||||
Investment Company — 0.36% | ||||||||
| 586,741 | State Street Institutional Treasury Plus Money Market Fund, Trust Class, 4.97%(d) | 587 | ||||||
Total Investment Company | 587 | |||||||
Total Investments (cost $119,308) — 99.51% | 163,313 | |||||||
Other assets in excess of liabilities — 0.49% | 804 | |||||||
Net Assets — 100.00% | $ | 164,117 | ||||||
Amounts designated as “—” are $0 or have been rounded to $0.
(a) | Represents a security purchased under Rule 144A or Section 4(2) and is exempt from registration under the Securities Act of 1933, as amended, or is otherwise restricted to resale. Certain of these securities may be resold in transactions exempt from registration, normally to qualified institutional buyers. These securities have been deemed liquid by the Specialist Manager. |
(b) | Represents non-income producing security. |
(c) | Security was valued using significant unobservable inputs as of June 30, 2023. |
(d) | Annualized 7-day yield as of period-end. |
ADR—American Depositary Receipt |
REIT—Real Estate Investment Trust |
See accompanying notes to financial statements.
96
HC CAPITAL TRUST
The ESG Growth Portfolio
Portfolio of Investments (concluded) — June 30, 2023
The following table reflects the percentage of total net assets of the Portfolio attributable to each Specialist Manager as of June 30, 2023.
The ESG Growth Portfolio | Mellon | Parametric | RBC Global | Total |
Common Stocks | 81.69% | — | 17.46% | 99.15% |
Investment Company | 0.06% | 0.30% | — | 0.36% |
Other Assets (Liabilities) | 0.24% | 0.07% | 0.18% | 0.49% |
Total Net Assets | 81.99% | 0.37% | 17.64% | 100.00% |
Amounts designated as “—” indicate the Specialist Manager did not manage any holdings in that category.
The following table reflects the open derivative positions held by the Portfolio as of June 30, 2023.
Futures Contracts Purchased*
Description | Number of | Expiration | Notional | Value and | ||||||||||||
E-Mini S&P 500 Future | 1 | 9/15/23 | $ | 224 | $ | 4 | ||||||||||
MSCI EAFE Index Future | 2 | 9/15/23 | 216 | 1 | ||||||||||||
| $ | 440 | $ | 5 | |||||||||||||
Total Unrealized Appreciation | $ | 5 | ||||||||||||||
Total Unrealized Depreciation | — | |||||||||||||||
Total Net Unrealized Appreciation/(Depreciation) | $ | 5 | ||||||||||||||
* | Cash has been pledged as collateral for futures contracts held by the Portfolio. |
See accompanying notes to financial statements.
97
HC CAPITAL TRUST
The Catholic SRI Growth Portfolio
Portfolio of Investments — June 30, 2023
Shares | Security Description | Value | ||||||
Common Stocks — 99.60% | ||||||||
Australia — 2.04% | ||||||||
| 168 | Ampol Ltd. (Oil, Gas & Consumable Fuels) | $ | 3 | |||||
| 1,701 | ANZ Group Holdings Ltd. (Banks) | 27 | ||||||
| 606 | APA Group (Gas Utilities) | 4 | ||||||
| 361 | Aristocrat Leisure Ltd. (Hotels, Restaurants & Leisure) | 9 | ||||||
| 125 | ASX Ltd. (Capital Markets) | 5 | ||||||
| 1,354 | Aurizon Holdings Ltd. (Ground Transportation) | 4 | ||||||
| 2,923 | BHP Group Ltd. (Metals & Mining) | 87 | ||||||
| 248 | BlueScope Steel Ltd. (Metals & Mining) | 3 | ||||||
| 785 | Brambles Ltd. (Commercial Services & Supplies) | 8 | ||||||
| 41 | Cochlear Ltd. (Health Care Equipment & Supplies) | 6 | ||||||
| 780 | Coles Group Ltd. (Consumer Staples Distribution & Retail) | 10 | ||||||
| 967 | Commonwealth Bank of Australia (Banks) | 64 | ||||||
| 306 | Computershare Ltd. (Professional Services) | 5 | ||||||
| 551 | Dexus (Diversified REITs) | 3 | ||||||
| 102 | EBOS Group Ltd. (Health Care Providers & Services) | 2 | ||||||
| 980 | Endeavour Group Ltd. (Consumer Staples Distribution & Retail) | 4 | ||||||
| 982 | Fortescue Metals Group Ltd. (Metals & Mining) | 15 | ||||||
| 976 | Goodman Group (Industrial REITs) | 13 | ||||||
| 115 | IDP Education Ltd. (Diversified Consumer Services) | 2 | ||||||
| 356 | IGO Ltd. (Metals & Mining) | 4 | ||||||
| 1,294 | Insurance Australia Group Ltd. (Insurance) | 5 | ||||||
| 364 | Lendlease Corp. Ltd. (Real Estate Management & Development)(a) | 2 | ||||||
| 209 | Macquarie Group Ltd. (Capital Markets) | 25 | ||||||
| 1,579 | Medibank Pvt. Ltd. (Insurance) | 4 | ||||||
| 96 | Mineral Resources Ltd. (Metals & Mining) | 5 | ||||||
| 2,016 | Mirvac Group (Diversified REITs) | 3 | ||||||
| 1,788 | National Australia Bank Ltd. (Banks) | 31 | ||||||
| 499 | Newcrest Mining Ltd. (Metals & Mining) | 9 | ||||||
| 709 | Northern Star Resources Ltd. (Metals & Mining) | 6 | ||||||
| 315 | Orica Ltd. (Chemicals) | 3 | ||||||
| 902 | Origin Energy Ltd. (Electric Utilities) | 5 | ||||||
| 1,631 | Pilbara Minerals Ltd. (Metals & Mining) | 5 | ||||||
| 503 | Qantas Airways Ltd. (Passenger Airlines)(b) | 2 | ||||||
| 889 | QBE Insurance Group Ltd. (Insurance) | 9 | ||||||
| 29 | REA Group Ltd. (Interactive Media & Services) | 3 | ||||||
| 114 | Reece Ltd. (Trading Companies & Distributors) | 1 | ||||||
| 236 | Rio Tinto Ltd. (Metals & Mining) | 18 | ||||||
| 2,011 | Santos Ltd. (Oil, Gas & Consumable Fuels)(a) | 10 | ||||||
| 3,327 | Scentre Group (Retail REITs) | 6 | ||||||
| 244 | SEEK Ltd. (Interactive Media & Services) | 4 | ||||||
Shares | Security Description | Value | ||||||
Australia (continued) | ||||||||
| 239 | Sonic Healthcare Ltd. (Health Care Providers & Services) | $ | 6 | |||||
| 2,852 | South32 Ltd. (Metals & Mining) | 7 | ||||||
| 1,290 | Stockland (Diversified REITs) | 3 | ||||||
| 658 | Suncorp Group Ltd. (Insurance) | 6 | ||||||
| 2,120 | Telstra Group Ltd. (Diversified Telecommunication Services) | 6 | ||||||
| 912 | The GPT Group (Diversified REITs) | 3 | ||||||
| 1,446 | The Lottery Corp. Ltd. (Hotels, Restaurants & Leisure) | 5 | ||||||
| 1,743 | Transurban Group (Transportation Infrastructure) | 17 | ||||||
| 413 | Treasury Wine Estates Ltd. (Beverages) | 3 | ||||||
| 2,104 | Vicinity Ltd. (Diversified REITs)(a) | 3 | ||||||
| 117 | Washington H Soul Pattinson & Co. Ltd. (Oil, Gas & Consumable Fuels) | 2 | ||||||
| 683 | Wesfarmers Ltd. (Broadline Retail) | 23 | ||||||
| 1,998 | Westpac Banking Corp. (Banks) | 28 | ||||||
| 84 | WiseTech Global Ltd. (Software) | 5 | ||||||
| 1,080 | Woodside Energy Group Ltd. (Oil, Gas & Consumable Fuels) | 25 | ||||||
| 685 | Woolworths Group Ltd. (Consumer Staples Distribution & Retail) | 18 | ||||||
| 594 | ||||||||
Austria — 0.05% | ||||||||
| 183 | Erste Group Bank AG (Banks)(a) | 6 | ||||||
| 74 | OMV AG (Oil, Gas & Consumable Fuels) | 3 | ||||||
| 47 | Verbund AG (Electric Utilities) | 4 | ||||||
| 57 | voestalpine AG (Metals & Mining) | 2 | ||||||
| 15 | ||||||||
Belgium — 0.24% | ||||||||
| 91 | Ageas SA/N.V. (Insurance) | 4 | ||||||
| 508 | Anheuser-Busch InBev SA/N.V. (Beverages) | 29 | ||||||
| 16 | D’ieteren Group (Distributors) | 3 | ||||||
| 17 | Elia Group SA/N.V. (Electric Utilities)(a) | 2 | ||||||
| 51 | Groupe Bruxelles Lambert N.V. (Financial Services) | 4 | ||||||
| 149 | KBC Group N.V. (Banks) | 10 | ||||||
| 9 | Sofina SA (Financial Services) | 2 | ||||||
| 48 | Solvay SA, Class - A (Chemicals) | 5 | ||||||
| 67 | UCB SA (Pharmaceuticals) | 6 | ||||||
| 108 | Umicore SA (Chemicals)(a) | 3 | ||||||
| 108 | Warehouses De Pauw CVA (Industrial REITs) | 3 | ||||||
| 71 | ||||||||
Bermuda — 0.09% | ||||||||
| 222 | Arch Capital Group Ltd. (Insurance)(b) | 17 | ||||||
| 24 | Everest Re Group Ltd. (Insurance) | 8 | ||||||
| 25 | ||||||||
See accompanying notes to financial statements.
98
HC CAPITAL TRUST
The Catholic SRI Growth Portfolio
Portfolio of Investments (continued) — June 30, 2023
Shares | Security Description | Value | ||||||
Common Stocks (continued) | ||||||||
Canada — 3.75% | ||||||||
| 267 | Agnico Eagle Mines Ltd. (Metals & Mining) | $ | 13 | |||||
| 100 | Air Canada (Passenger Airlines)(a)(b) | 2 | ||||||
| 343 | Algonquin Power & Utilities Corp. (Multi-Utilities) | 3 | ||||||
| 448 | Alimentation Couche-Tard, Inc. (Consumer Staples Distribution & Retail) | 23 | ||||||
| 144 | AltaGas Ltd. (Gas Utilities) | 3 | ||||||
| 353 | ARC Resources Ltd. (Oil, Gas & Consumable Fuels) | 5 | ||||||
| 410 | Bank of Montreal (Banks) | 37 | ||||||
| 992 | Barrick Gold Corp. (Metals & Mining) | 17 | ||||||
| 39 | BCE, Inc. (Diversified Telecommunication Services) | 2 | ||||||
| 196 | Brookfield Asset Management Ltd., Class - A (Capital Markets) | 6 | ||||||
| 839 | Brookfield Corp. (Capital Markets) | 28 | ||||||
| 22 | BRP, Inc. (Leisure Products) | 2 | ||||||
| 263 | Cameco Corp. (Oil, Gas & Consumable Fuels) | 8 | ||||||
| 46 | Canadian Apartment Properties REIT (Residential REITs)(a) | 2 | ||||||
| 515 | Canadian Imperial Bank of Commerce (Banks) | 22 | ||||||
| 325 | Canadian National Railway Co. (Ground Transportation) | 39 | ||||||
| 643 | Canadian Natural Resources Ltd. (Oil, Gas & Consumable Fuels) | 36 | ||||||
| 534 | Canadian Pacific Kansas City Ltd. (Ground Transportation) | 43 | ||||||
| 31 | Canadian Tire Corp. Ltd., Class - A (Broadline Retail) | 4 | ||||||
| 110 | Canadian Utilities Ltd., Class - A (Multi-Utilities) | 3 | ||||||
| 81 | CCL Industries, Inc. (Containers & Packaging)(a) | 4 | ||||||
| 864 | Cenovus Energy, Inc. (Oil, Gas & Consumable Fuels) | 15 | ||||||
| 127 | CGI, Inc. (IT Services)(b) | 13 | ||||||
| 12 | Constellation Software, Inc. (Software) | 25 | ||||||
| 171 | Dollarama, Inc. (Broadline Retail) | 12 | ||||||
| 204 | Element Fleet Management Corp. (Financial Services)(a) | 3 | ||||||
| 151 | Emera, Inc. (Electric Utilities) | 6 | ||||||
| 85 | Empire Co. Ltd. (Consumer Staples Distribution & Retail) | 2 | ||||||
| 1,173 | Enbridge, Inc. (Oil, Gas & Consumable Fuels) | 44 | ||||||
| 12 | Fairfax Financial Holdings Ltd. (Insurance) | 9 | ||||||
| 346 | First Quantum Minerals Ltd. (Metals & Mining) | 8 | ||||||
| 20 | FirstService Corp. (Real Estate Management & Development) | 3 | ||||||
Shares | Security Description | Value | ||||||
Canada (continued) | ||||||||
| 277 | Fortis, Inc. (Electric Utilities) | $ | 12 | |||||
| 114 | Franco-Nevada Corp. (Metals & Mining) | 16 | ||||||
| 40 | George Weston Ltd. (Consumer Staples Distribution & Retail) | 5 | ||||||
| 127 | GFL Environmental, Inc. (Commercial Services & Supplies) | 5 | ||||||
| 97 | Gildan Activewear, Inc. (Textiles, Apparel & Luxury Goods) | 3 | ||||||
| 174 | Great-West Lifeco, Inc. (Insurance) | 5 | ||||||
| 166 | Hydro One Ltd. (Electric Utilities)(a) | 5 | ||||||
| 53 | iA Financial Corp., Inc. (Insurance) | 4 | ||||||
| 50 | IGM Financial, Inc. (Capital Markets) | 2 | ||||||
| 120 | Imperial Oil Ltd. (Oil, Gas & Consumable Fuels) | 6 | ||||||
| 100 | Intact Financial Corp. (Insurance) | 15 | ||||||
| 339 | Ivanhoe Mines Ltd. (Metals & Mining)(b) | 3 | ||||||
| 121 | Keyera Corp. (Oil, Gas & Consumable Fuels) | 3 | ||||||
| 776 | Kinross Gold Corp. (Metals & Mining) | 4 | ||||||
| 87 | Loblaw Cos. Ltd. (Consumer Staples Distribution & Retail) | 8 | ||||||
| 66 | Lululemon Athletica, Inc. (Textiles, Apparel & Luxury Goods)(b) | 25 | ||||||
| 340 | Lundin Mining Corp. (Metals & Mining)(a) | 3 | ||||||
| 150 | Magna International, Inc. (Automobile Components) | 8 | ||||||
| 1,075 | Manulife Financial Corp. (Insurance) | 20 | ||||||
| 127 | Metro, Inc. (Consumer Staples Distribution & Retail) | 7 | ||||||
| 201 | National Bank of Canada (Banks) | 15 | ||||||
| 118 | Northland Power, Inc. (Independent Power and Renewable Electricity Producers) | 2 | ||||||
| 283 | Nutrien Ltd. (Chemicals) | 17 | ||||||
| 31 | Nuvei Corp. (Financial Services)(b) | 1 | ||||||
| 42 | Onex Corp. (Financial Services) | 2 | ||||||
| 151 | Open Text Corp. (Software)(a) | 6 | ||||||
| 198 | Pan American Silver Corp. (Metals & Mining) | 3 | ||||||
| 80 | Parkland Corp. (Oil, Gas & Consumable Fuels)(a) | 2 | ||||||
| 333 | Pembina Pipeline Corp. (Oil, Gas & Consumable Fuels) | 10 | ||||||
| 328 | Power Corp. of Canada (Insurance) | 9 | ||||||
| 78 | Quebecor, Inc., Class - B (Media) | 2 | ||||||
| 115 | RB Global, Inc. (Commercial Services & Supplies) | 7 | ||||||
| 169 | Restaurant Brands International, Inc. (Hotels, Restaurants & Leisure) | 13 | ||||||
| 72 | RioCan Real Estate Investment Trust (Diversified REITs)(a) | 1 | ||||||
| 210 | Rogers Communications, Inc., Class - B (Wireless Telecommunication Services) | 10 | ||||||
See accompanying notes to financial statements.
99
HC CAPITAL TRUST
The Catholic SRI Growth Portfolio
Portfolio of Investments (continued) — June 30, 2023
Shares | Security Description | Value | ||||||
Common Stocks (continued) | ||||||||
Canada (continued) | ||||||||
| 804 | Royal Bank of Canada (Banks) | $ | 78 | |||||
| 141 | Saputo, Inc. (Food Products)(a) | 3 | ||||||
| 686 | Shopify, Inc., Class - A (IT Services)(b) | 44 | ||||||
| 349 | Sun Life Financial, Inc. (Insurance) | 18 | ||||||
| 775 | Suncor Energy, Inc. (Oil, Gas & Consumable Fuels) | 23 | ||||||
| 601 | TC Energy Corp. (Oil, Gas & Consumable Fuels) | 24 | ||||||
| 258 | Teck Resources Ltd., Class - B (Metals & Mining) | 11 | ||||||
| 291 | TELUS Corp. (Diversified Telecommunication Services) | 6 | ||||||
| 43 | TFI International, Inc. (Ground Transportation) | 5 | ||||||
| 688 | The Bank of Nova Scotia (Banks) | 34 | ||||||
| 42 | The Descartes Systems Group, Inc. (Software)(b) | 3 | ||||||
| 1,059 | The Toronto-Dominion Bank (Banks) | 66 | ||||||
| 97 | Thomson Reuters Corp. (Professional Services) | 13 | ||||||
| 140 | TMX Group Ltd. (Capital Markets) | 3 | ||||||
| 47 | Toromont Industries Ltd. (Trading Companies & Distributors) | 4 | ||||||
| 177 | Tourmaline Oil Corp. (Oil, Gas & Consumable Fuels) | 8 | ||||||
| 155 | Waste Connections, Inc. (Commercial Services & Supplies) | 22 | ||||||
| 37 | West Fraser Timber Co. Ltd. (Paper & Forest Products) | 3 | ||||||
| 271 | Wheaton Precious Metals Corp. (Metals & Mining) | 12 | ||||||
| 73 | WSP Global, Inc. (Construction & Engineering) | 10 | ||||||
| 1,091 | ||||||||
Cayman Islands — 0.01% | ||||||||
| 1,200 | Sands China Ltd. (Hotels, Restaurants & Leisure)(b) | 4 | ||||||
Chile — 0.02% | ||||||||
| 254 | Antofagasta PLC (Metals & Mining) | 5 | ||||||
Denmark — 0.37% | ||||||||
| 2 | A.P. Moller - Maersk A/S, Class - A (Marine Transportation) | 3 | ||||||
| 3 | A.P. Moller - Maersk A/S, Class - B (Marine Transportation) | 5 | ||||||
| 54 | Carlsberg A/S, Class - B (Beverages) | 9 | ||||||
| 55 | Chr Hansen Holding A/S (Chemicals)(a) | 4 | ||||||
| 73 | Coloplast A/S, Class - B (Health Care Equipment & Supplies) | 9 | ||||||
| 370 | Danske Bank A/S (Banks)(b) | 9 | ||||||
| 51 | Demant A/S (Health Care Equipment & Supplies)(b) | 2 | ||||||
| 110 | DSV A/S (Air Freight & Logistics) | 24 | ||||||
| 130 | Novozymes A/S, Class - B (Chemicals) | 6 | ||||||
Shares | Security Description | Value | ||||||
| �� | Denmark (continued) | |||||||
| 114 | Orsted A/S (Electric Utilities)(a) | $ | 11 | |||||
| 50 | Pandora A/S (Textiles, Apparel & Luxury Goods) | 4 | ||||||
| 5 | ROCKWOOL A/S, Class - B (Building Products) | 1 | ||||||
| 192 | Tryg A/S (Insurance)(a) | 4 | ||||||
| 605 | Vestas Wind Systems A/S (Electrical Equipment)(b) | 17 | ||||||
| 108 | ||||||||
Finland — 0.32% | ||||||||
| 73 | Elisa Oyj (Diversified Telecommunication Services) | 4 | ||||||
| 234 | Fortum Oyj (Electric Utilities) | 3 | ||||||
| 138 | Kesko Oyj, Class - B (Consumer Staples Distribution & Retail) | 3 | ||||||
| 202 | Kone Oyj, Class - B (Machinery) | 11 | ||||||
| 372 | Metso Oyj (Machinery)(a) | 4 | ||||||
| 249 | Neste Oyj (Oil, Gas & Consumable Fuels) | 10 | ||||||
| 3,035 | Nokia Oyj (Communications Equipment) | 13 | ||||||
| 1,868 | Nordea Bank Abp (Banks) | 20 | ||||||
| 254 | Sampo Oyj, A Shares (Insurance) | 11 | ||||||
| 299 | Stora Enso Oyj, Registered Shares (Paper & Forest Products) | 3 | ||||||
| 314 | UPM-Kymmene Oyj (Paper & Forest Products) | 9 | ||||||
| 235 | Wartsila Oyj Abp (Machinery) | 3 | ||||||
| 94 | ||||||||
France — 3.15% | ||||||||
| 84 | Accor SA (Hotels, Restaurants & Leisure) | 3 | ||||||
| 16 | Aeroports de Paris (Transportation Infrastructure) | 2 | ||||||
| 300 | Air Liquide SA (Chemicals) | 54 | ||||||
| 199 | Alstom SA (Machinery) | 6 | ||||||
| 30 | Amundi SA (Capital Markets) | 2 | ||||||
| 31 | Arkema SA (Chemicals) | 3 | ||||||
| 1,071 | AXA SA (Insurance) | 32 | ||||||
| 22 | BioMerieux (Health Care Equipment & Supplies) | 2 | ||||||
| 638 | BNP Paribas SA (Banks) | 40 | ||||||
| 481 | Bollore SE (Entertainment) | 3 | ||||||
| 119 | Bouygues SA (Construction & Engineering) | 4 | ||||||
| 163 | Bureau Veritas SA (Professional Services)(a) | 4 | ||||||
| 97 | Capgemini SE (IT Services) | 18 | ||||||
| 320 | Carrefour SA (Consumer Staples Distribution & Retail)(a) | 6 | ||||||
| 301 | Cie de Saint-Gobain (Building Products) | 18 | ||||||
| 387 | Cie Generale des Etablissements Michelin SCA (Automobile Components) | 11 | ||||||
| 27 | Covivio SA (Diversified REITs) | 1 | ||||||
| 642 | Credit Agricole SA (Banks) | 8 | ||||||
| 365 | Danone SA (Food Products) | 22 | ||||||
| 379 | Dassault Systemes SE (Software) | 17 | ||||||
| 153 | Edenred (Financial Services) | 10 | ||||||
| 43 | Eiffage SA (Construction & Engineering)(a) | 4 | ||||||
See accompanying notes to financial statements.
100
HC CAPITAL TRUST
The Catholic SRI Growth Portfolio
Portfolio of Investments (continued) — June 30, 2023
Shares | Security Description | Value | ||||||
Common Stocks (continued) | ||||||||
France (continued) | ||||||||
| 1,038 | Engie SA (Multi-Utilities) | $ | 17 | |||||
| 172 | EssilorLuxottica SA (Health Care Equipment & Supplies)^ | 32 | ||||||
| 23 | Eurazeo SE (Financial Services) | 2 | ||||||
| 23 | Gecina SA (Office REITs)(a) | 2 | ||||||
| 218 | Getlink SE (Transportation Infrastructure) | 4 | ||||||
| 18 | Hermes International (Textiles, Apparel & Luxury Goods) | 39 | ||||||
| 17 | Ipsen SA (Pharmaceuticals) | 2 | ||||||
| 44 | Kering SA (Textiles, Apparel & Luxury Goods) | 24 | ||||||
| 138 | Klepierre SA (Retail REITs) | 3 | ||||||
| 59 | La Francaise des Jeux SAEM (Hotels, Restaurants & Leisure) | 2 | ||||||
| 162 | Legrand SA (Electrical Equipment) | 16 | ||||||
| 139 | L’Oreal SA (Personal Care Products) | 66 | ||||||
| 160 | LVMH Moet Hennessy Louis Vuitton SE (Textiles, Apparel & Luxury Goods) | 152 | ||||||
| 1,041 | Orange SA (Diversified Telecommunication Services)(a) | 12 | ||||||
| 118 | Pernod Ricard SA (Beverages) | 26 | ||||||
| 136 | Publicis Groupe SA (Media) | 11 | ||||||
| 17 | Remy Cointreau SA (Beverages) | 3 | ||||||
| 99 | Renault SA (Automobile Components) | 4 | ||||||
| 316 | Schneider Electric SE (Electrical Equipment)(a) | 57 | ||||||
| 16 | SEB SA (Household Durables) | 2 | ||||||
| 426 | Societe Generale SA (Banks) | 11 | ||||||
| 54 | Sodexo SA (Hotels, Restaurants & Leisure) | 6 | ||||||
| 35 | Teleperformance (Professional Services) | 6 | ||||||
| 1,356 | TotalEnergies SE (Oil, Gas & Consumable Fuels) | 79 | ||||||
| 66 | Unibail-Rodamco-Westfield (Retail REITs)(b) | 3 | ||||||
| 119 | Valeo (Automobile Components) | 3 | ||||||
| 401 | Veolia Environnement SA (Multi-Utilities) | 13 | ||||||
| 311 | Vinci SA (Construction & Engineering) | 36 | ||||||
| 387 | Vivendi SE (Media) | 4 | ||||||
| 15 | Wendel SE (Financial Services) | 2 | ||||||
| 148 | Worldline SA (Financial Services)(b) | 5 | ||||||
| 914 | ||||||||
Germany — 2.12% | ||||||||
| 95 | adidas AG (Textiles, Apparel & Luxury Goods) | 18 | ||||||
| 234 | Allianz SE, Registered Shares (Insurance) | 54 | ||||||
| 514 | BASF SE (Chemicals) | 25 | ||||||
| 183 | Bayerische Motoren Werke AG (Automobile Components) | 23 | ||||||
| 34 | Bayerische Motoren Werke AG, Preference Shares (Automobiles) | 4 | ||||||
| 45 | Bechtle AG (IT Services) | 2 | ||||||
| 95 | Brenntag SE (Trading Companies & Distributors) | 7 | ||||||
Shares | Security Description | Value | ||||||
Germany (continued) | ||||||||
| 23 | Carl Zeiss Meditec AG, Class - BR (Health Care Equipment & Supplies) | $ | 2 | |||||
| 558 | Commerzbank AG (Banks) | 6 | ||||||
| 57 | Continental AG (Automobile Components) | 4 | ||||||
| 123 | Covestro AG (Chemicals)(b) | 6 | ||||||
| 273 | Daimler Truck Holding AG (Machinery) | 10 | ||||||
| 111 | Delivery Hero SE (Hotels, Restaurants & Leisure)(b) | 5 | ||||||
| 1,160 | Deutsche Bank AG, Registered Shares (Capital Markets) | 12 | ||||||
| 108 | Deutsche Boerse AG (Capital Markets) | 20 | ||||||
| 304 | Deutsche Lufthansa AG, Registered Shares (Passenger Airlines)(a)(b) | 3 | ||||||
| 1,864 | Deutsche Telekom AG (Diversified Telecommunication Services)(a) | 41 | ||||||
| 588 | DHL Group (Air Freight & Logistics) | 29 | ||||||
| 71 | Dr. Ing. h.c. F. Porsche AG, Preference Shares (Automobiles) | 9 | ||||||
| 1,300 | E.ON SE (Multi-Utilities) | 17 | ||||||
| 105 | Evonik Industries AG (Chemicals) | 2 | ||||||
| 108 | Fresenius Medical Care AG & Co. KGaA (Health Care Providers & Services) | 5 | ||||||
| 110 | GEA Group AG (Machinery) | 5 | ||||||
| 37 | Hannover Rueck SE (Insurance) | 8 | ||||||
| 76 | Heidelberg Materials AG (Construction Materials) | 6 | ||||||
| 88 | HelloFresh SE (Consumer Staples Distribution & Retail)(b) | 2 | ||||||
| 70 | Henkel AG & Co. KGaA (Household Products) | 5 | ||||||
| 101 | Henkel AG & Co. KGaA, Preference Shares (Household Products) | 8 | ||||||
| 748 | Infineon Technologies AG (Semiconductors & Semiconductor Equipment)(a) | 31 | ||||||
| 41 | Knorr-Bremse AG (Machinery) | 3 | ||||||
| 41 | LEG Immobilien SE (Real Estate Management & Development) | 2 | ||||||
| 491 | Mercedes-Benz Group AG (Automobile Components) | 40 | ||||||
| 34 | MTU Aero Engines AG (Aerospace & Defense) | 9 | ||||||
| 81 | Muenchener Rueckversicherungs-Gesellschaft AG in Muenchen, Registered Shares (Insurance) | 30 | ||||||
| 35 | Nemetschek SE (Software) | 3 | ||||||
| 79 | Porsche Automobil Holding SE, Preference Shares (Automobile Components)(b) | 5 | ||||||
| 61 | Puma SE (Textiles, Apparel & Luxury Goods)(a) | 4 | ||||||
| 3 | Rational AG (Machinery) | 2 | ||||||
See accompanying notes to financial statements.
101
HC CAPITAL TRUST
The Catholic SRI Growth Portfolio
Portfolio of Investments (continued) — June 30, 2023
Shares | Security Description | Value | ||||||
Common Stocks (continued) | ||||||||
Germany (continued) | ||||||||
| 366 | RWE AG (Independent Power and Renewable Electricity Producers) | $ | 16 | |||||
| 598 | SAP SE (Software) | 83 | ||||||
| 49 | Scout24 SE (Interactive Media & Services) | 3 | ||||||
| 305 | Siemens Energy AG (Electrical Equipment)(a)(b) | 5 | ||||||
| 81 | Symrise AG (Chemicals)(a) | 8 | ||||||
| 30 | Talanx AG (Insurance) | 2 | ||||||
| 627 | Telefonica Deutschland Holding AG (Diversified Telecommunication Services) | 2 | ||||||
| 16 | Volkswagen AG (Automobiles) | 3 | ||||||
| 117 | Volkswagen AG, Preference Shares (Automobile Components) | 16 | ||||||
| 423 | Vonovia SE (Real Estate Management & Development) | 8 | ||||||
| 10 | Wacker Chemie AG (Chemicals) | 1 | ||||||
| 121 | Zalando SE (Specialty Retail)(b) | 3 | ||||||
| 617 | ||||||||
Hong Kong — 0.84% | ||||||||
| 6,892 | AIA Group Ltd. (Insurance) | 69 | ||||||
| 2,000 | BOC Hong Kong Holdings Ltd. (Banks) | 6 | ||||||
| 700 | Budweiser Brewing Co. APAC Ltd. (Beverages) | 2 | ||||||
| 1,000 | CK Asset Holdings Ltd. (Real Estate Management & Development) | 6 | ||||||
| 1,500 | CK Hutchison Holdings Ltd. (Industrial Conglomerates) | 9 | ||||||
| 500 | CK Infrastructure Holdings Ltd. (Electric Utilities) | 3 | ||||||
| 1,000 | CLP Holdings Ltd. (Electric Utilities) | 8 | ||||||
| 1,000 | ESR Group Ltd. (Real Estate Management & Development) | 2 | ||||||
| 18 | Futu Holdings Ltd., ADR (Capital Markets)(b) | 1 | ||||||
| 1,000 | Galaxy Entertainment Group Ltd. (Hotels, Restaurants & Leisure)(b) | 6 | ||||||
| 1,000 | Hang Lung Properties Ltd. (Real Estate Management & Development) | 2 | ||||||
| 400 | Hang Seng Bank Ltd. (Banks) | 6 | ||||||
| 1,000 | Henderson Land Development Co. Ltd. (Real Estate Management & Development) | 3 | ||||||
| 2,000 | HKT Trust & HKT Ltd. (Diversified Telecommunication Services)(a) | 2 | ||||||
| 5,985 | Hong Kong & China Gas Co. Ltd. (Gas Utilities) | 5 | ||||||
| 723 | Hong Kong Exchanges & Clearing Ltd. (Capital Markets) | 26 | ||||||
| 700 | Hongkong Land Holdings Ltd. (Real Estate Management & Development) | 3 | ||||||
| 100 | Jardine Matheson Holdings Ltd. (Industrial Conglomerates) | 5 | ||||||
| 1,566 | Link REIT (Retail REITs) | 9 | ||||||
Shares | Security Description | Value | ||||||
Hong Kong (continued) | ||||||||
| 1,000 | MTR Corp. Ltd. (Ground Transportation) | $ | 5 | |||||
| 1,250 | New World Development Co. Ltd. (Real Estate Management & Development) | 3 | ||||||
| 779 | Power Assets Holdings Ltd. (Electric Utilities) | 4 | ||||||
| 1,636 | Prudential PLC (Insurance) | 22 | ||||||
| 2,129 | Sino Land Co. Ltd. (Real Estate Management & Development) | 3 | ||||||
| 1,000 | SITC International Holdings Co. Ltd. (Marine Transportation) | 2 | ||||||
| 1,000 | Sun Hung Kai Properties Ltd. (Real Estate Management & Development) | 13 | ||||||
| 139 | Swire Pacific Ltd., Class - A (Real Estate Management & Development) | 1 | ||||||
| 600 | Swire Properties Ltd. (Real Estate Management & Development) | 1 | ||||||
| 757 | Techtronic Industries Co. Ltd. (Machinery) | 8 | ||||||
| 4,728 | WH Group Ltd. (Food Products) | 3 | ||||||
| 1,000 | Wharf Real Estate Investment Co. Ltd. (Real Estate Management & Development) | 5 | ||||||
| 1,000 | Xinyi Glass Holdings Ltd. (Building Products) | 2 | ||||||
| 245 | ||||||||
Ireland (Republic of) — 1.11% | ||||||||
| 364 | Accenture PLC, Class - A (IT Services) | 111 | ||||||
| 19 | AerCap Holdings N.V. (Trading Companies & Distributors)(b) | 1 | ||||||
| 73 | AerCap Holdings N.V. (Trading Companies & Distributors)(b) | 5 | ||||||
| 612 | AIB Group PLC (Banks) | 3 | ||||||
| 50 | Allegion PLC (Building Products) | 6 | ||||||
| 162 | Aptiv PLC (Automobile Components)(b) | 17 | ||||||
| 599 | Bank of Ireland Group PLC (Banks) | 6 | ||||||
| 418 | CRH PLC (Construction Materials)(a) | 23 | ||||||
| 550 | Experian PLC (Professional Services) | 21 | ||||||
| 100 | Flutter Entertainment PLC (Hotels, Restaurants & Leisure)(b) | 20 | ||||||
| 234 | James Hardie Industries PLC (Construction Materials) | 6 | ||||||
| 83 | Kingspan Group PLC (Building Products) | 6 | ||||||
| 774 | Medtronic PLC (Health Care Equipment & Supplies) | 68 | ||||||
| 130 | Smurfit Kappa Group PLC (Containers & Packaging)(a) | 4 | ||||||
| 134 | Trane Technologies PLC (Building Products) | 26 | ||||||
| 323 | ||||||||
Israel — 0.20% | ||||||||
| 44 | Azrieli Group Ltd. (Real Estate Management & Development) | 2 | ||||||
| 672 | Bank Hapoalim BM (Banks) | 6 | ||||||
| 842 | Bank Leumi Le-Israel BM (Banks) | 6 | ||||||
See accompanying notes to financial statements.
102
HC CAPITAL TRUST
The Catholic SRI Growth Portfolio
Portfolio of Investments (continued) — June 30, 2023
Shares | Security Description | Value | ||||||
Common Stocks (continued) | ||||||||
Israel (continued) | ||||||||
| 56 | Check Point Software Technologies Ltd. (Software)(b) | $ | 7 | |||||
| 23 | CyberArk Software Ltd. (Software)(b) | 4 | ||||||
| 362 | ICL Group Ltd. (Chemicals) | 2 | ||||||
| — | Isracard Ltd. (Consumer Finance) | — | ||||||
| 596 | Israel Discount Bank Ltd., Class - A (Banks) | 3 | ||||||
| 97 | Mizrahi Tefahot Bank Ltd. (Banks) | 3 | ||||||
| 13 | Monday.com Ltd. (Software)(b) | 2 | ||||||
| 40 | Nice Ltd. (Software)(b) | 8 | ||||||
| 33 | SolarEdge Technologies, Inc. (Semiconductors & Semiconductor Equipment)(b) | 10 | ||||||
| 55 | Tower Semiconductor Ltd. (Semiconductors & Semiconductor Equipment)(b) | 2 | ||||||
| 28 | Wix.com Ltd. (IT Services)(b) | 2 | ||||||
| 57 | ||||||||
Italy — 0.67% | ||||||||
| 62 | Amplifon SpA (Health Care Providers & Services) | 2 | ||||||
| 615 | Assicurazioni Generali SpA (Insurance) | 13 | ||||||
| 265 | Davide Campari-Milano N.V., Class - M (Beverages) | 4 | ||||||
| 13 | DiaSorin SpA (Health Care Equipment & Supplies) | 1 | ||||||
| 4,695 | Enel SpA (Electric Utilities)(a) | 31 | ||||||
| 1,314 | Eni SpA (Oil, Gas & Consumable Fuels) | 19 | ||||||
| 73 | Ferrari N.V. (Automobiles) | 24 | ||||||
| 344 | FinecoBank Banca Fineco SpA (Banks) | 5 | ||||||
| 208 | Infrastrutture Wireless Italiane SpA (Diversified Telecommunication Services)(a) | 3 | ||||||
| 9,464 | Intesa Sanpaolo SpA (Banks)(a) | 24 | ||||||
| 318 | Mediobanca Banca di Credito Finanziario SpA (Banks) | 4 | ||||||
| 123 | Moncler SpA (Textiles, Apparel & Luxury Goods) | 9 | ||||||
| 360 | Nexi SpA (Professional Services)(b) | 3 | ||||||
| 367 | Poste Italiane SpA (Insurance) | 4 | ||||||
| 133 | Prysmian SpA (Electrical Equipment) | 6 | ||||||
| 49 | Recordati Industria Chimica e Farmaceutica SpA (Pharmaceuticals) | 2 | ||||||
| 1,265 | Snam SpA (Gas Utilities) | 7 | ||||||
| 4,827 | Telecom Italia SpA/Milano (Diversified Telecommunication Services)(b) | 1 | ||||||
| 946 | Terna - Rete Elettrica Nazionale (Electric Utilities) | 8 | ||||||
| 1,054 | UniCredit SpA (Banks) | 24 | ||||||
| 194 | ||||||||
Shares | Security Description | Value | ||||||
Japan — 6.21% | ||||||||
| 100 | Advantest Corp. (Semiconductors & Semiconductor Equipment)(a) | $ | 13 | |||||
| 400 | Aeon Co. Ltd. (Consumer Staples Distribution & Retail) | 8 | ||||||
| 100 | AGC, Inc. (Building Products) | 4 | ||||||
| 100 | Aisin Corp. (Automobile Components) | 3 | ||||||
| 100 | ANA Holdings, Inc. (Passenger Airlines)(a)(b) | 2 | ||||||
| 100 | Asahi Intecc Co. Ltd. (Health Care Equipment & Supplies) | 2 | ||||||
| 800 | Asahi Kasei Corp. (Chemicals) | 5 | ||||||
| 100 | Azbil Corp. (Electronic Equipment, Instruments & Components) | 3 | ||||||
| 300 | Bandai Namco Holdings, Inc. (Leisure Products) | 7 | ||||||
| 100 | BayCurrent Consulting, Inc. (Professional Services) | 4 | ||||||
| 333 | Bridgestone Corp. (Automobile Components) | 14 | ||||||
| 200 | Brother Industries Ltd. (Technology Hardware, Storage & Peripherals) | 3 | ||||||
| 600 | Canon, Inc. (Technology Hardware, Storage & Peripherals) | 16 | ||||||
| 100 | Capcom Co. Ltd. (Entertainment) | 4 | ||||||
| 100 | Central Japan Railway Co. (Ground Transportation) | 13 | ||||||
| 400 | Chubu Electric Power Co., Inc. (Electric Utilities) | 5 | ||||||
| 900 | Concordia Financial Group Ltd. (Banks) | 4 | ||||||
| 300 | CyberAgent, Inc. (Media) | 2 | ||||||
| 100 | Dai Nippon Printing Co. Ltd. (Commercial Services & Supplies) | 3 | ||||||
| 190 | Daifuku Co. Ltd. (Machinery) | 4 | ||||||
| 586 | Dai-ichi Life Holdings, Inc. (Insurance) | 11 | ||||||
| 120 | Daikin Industries Ltd. (Building Products) | 25 | ||||||
| 300 | Daiwa House Industry Co. Ltd. (Real Estate Management & Development) | 8 | ||||||
| 1 | Daiwa House REIT Investment Corp. (Diversified REITs) | 2 | ||||||
| 900 | Daiwa Securities Group, Inc. (Capital Markets) | 5 | ||||||
| 256 | Denso Corp. (Automobile Components) | 17 | ||||||
| 100 | Dentsu Group, Inc. (Media) | 3 | ||||||
| 105 | Disco Corp. (Semiconductors & Semiconductor Equipment) | 17 | ||||||
| 200 | East Japan Railway Co. (Ground Transportation) | 11 | ||||||
| 1,700 | ENEOS Holdings, Inc. (Oil, Gas & Consumable Fuels) | 6 | ||||||
| 545 | FANUC Corp. (Machinery) | 19 | ||||||
| 100 | Fast Retailing Co. Ltd. (Specialty Retail) | 26 | ||||||
| 100 | Fuji Electric Co. Ltd. (Electrical Equipment) | 4 | ||||||
| 200 | FUJIFILM Holdings Corp. (Technology Hardware, Storage & Peripherals) | 12 | ||||||
See accompanying notes to financial statements.
103
HC CAPITAL TRUST
The Catholic SRI Growth Portfolio
Portfolio of Investments (continued) — June 30, 2023
Shares | Security Description | Value | ||||||
Common Stocks (continued) | ||||||||
Japan (continued) | ||||||||
| 152 | Fujitsu Ltd. (IT Services)(a) | $ | 20 | |||||
| 3 | GLP J-Reit (Industrial REITs)(a) | 3 | ||||||
| 100 | Hakuhodo DY Holdings, Inc. (Media) | 1 | ||||||
| 100 | Hamamatsu Photonics KK (Electronic Equipment, Instruments & Components) | 5 | ||||||
| 100 | Hankyu Hanshin Holdings, Inc. (Ground Transportation) | 3 | ||||||
| 27 | Hikari Tsushin, Inc. (Specialty Retail) | 4 | ||||||
| 42 | Hirose Electric Co. Ltd. (Electronic Equipment, Instruments & Components) | 6 | ||||||
| 100 | Hitachi Construction Machinery Co. Ltd. (Machinery) | 3 | ||||||
| 900 | Honda Motor Co. Ltd. (Automobile Components) | 27 | ||||||
| 100 | Hoshizaki Corp. (Machinery) | 4 | ||||||
| 200 | Hoya Corp. (Health Care Equipment & Supplies) | 24 | ||||||
| 200 | Hulic Co. Ltd. (Real Estate Management & Development)(a) | 2 | ||||||
| 100 | Ibiden Co. Ltd. (Electronic Equipment, Instruments & Components) | 6 | ||||||
| 152 | Idemitsu Kosan Co. Ltd. (Oil, Gas & Consumable Fuels)(a) | 3 | ||||||
| 100 | Iida Group Holdings Co. Ltd. (Household Durables) | 2 | ||||||
| 600 | Inpex Corp. (Oil, Gas & Consumable Fuels) | 7 | ||||||
| 300 | Isuzu Motors Ltd. (Automobile Components) | 4 | ||||||
| 700 | ITOCHU Corp. (Trading Companies & Distributors) | 28 | ||||||
| 100 | Itochu Techno-Solutions Corp. (IT Services) | 3 | ||||||
| 48 | Japan Airlines Co. Ltd. (Passenger Airlines)(a) | 1 | ||||||
| 300 | Japan Exchange Group, Inc. (Capital Markets) | 5 | ||||||
| 4 | Japan Metropolitan Fund Invest (Retail REITs) | 3 | ||||||
| 800 | Japan Post Bank Co. Ltd. (Banks)(a) | 6 | ||||||
| 1,400 | Japan Post Holdings Co. Ltd. (Insurance)(a) | 10 | ||||||
| 100 | Japan Post Insurance Co. Ltd. (Insurance)(a) | 2 | ||||||
| 1 | Japan Real Estate Investment Corp. (Office REITs) | 4 | ||||||
| 300 | JFE Holdings, Inc. (Metals & Mining) | 4 | ||||||
| 200 | Kajima Corp. (Construction & Engineering) | 3 | ||||||
| 227 | Kao Corp. (Personal Care Products) | 8 | ||||||
| 100 | Kawasaki Kisen Kaisha Ltd. (Marine Transportation) | 2 | ||||||
| 874 | KDDI Corp. (Wireless Telecommunication Services) | 27 | ||||||
| 32 | Keio Corp. (Ground Transportation) | 1 | ||||||
| 100 | Keisei Electric Railway Co. Ltd. (Ground Transportation) | 4 | ||||||
| 134 | Keyence Corp. (Electronic Equipment, Instruments & Components) | 63 | ||||||
Shares | Security Description | Value | ||||||
Japan (continued) | ||||||||
| 100 | Kikkoman Corp. (Food Products) | $ | 6 | |||||
| 100 | Kintetsu Group Holdings Co. Ltd. (Ground Transportation) | 3 | ||||||
| 500 | Kirin Holdings Co. Ltd. (Beverages) | 7 | ||||||
| 100 | Kobe Bussan Co. Ltd. (Consumer Staples Distribution & Retail) | 3 | ||||||
| 100 | Koei Tecmo Holdings Co. Ltd. (Entertainment) | 2 | ||||||
| 168 | Koito Manufacturing Co. Ltd. (Automobile Components) | 3 | ||||||
| 500 | Komatsu Ltd. (Machinery) | 14 | ||||||
| 100 | Konami Group Corp. (Entertainment) | 5 | ||||||
| 43 | Kose Corp. (Personal Care Products) | 4 | ||||||
| 600 | Kubota Corp. (Machinery) | 9 | ||||||
| 100 | Kurita Water Industries Ltd. (Machinery) | 4 | ||||||
| 200 | Kyocera Corp. (Electronic Equipment, Instruments & Components) | 11 | ||||||
| 200 | Kyowa Kirin Co. Ltd. (Pharmaceuticals) | 4 | ||||||
| 200 | Lixil Corp. (Building Products) | 3 | ||||||
| 300 | M3, Inc. (Health Care Technology) | 7 | ||||||
| 100 | Makita Corp. (Machinery) | 3 | ||||||
| 900 | Marubeni Corp. (Trading Companies & Distributors) | 15 | ||||||
| 100 | MatsukiyoCocokara & Co. (Consumer Staples Distribution & Retail) | 6 | ||||||
| 300 | Mazda Motor Corp. (Automobile Components) | 3 | ||||||
| 200 | MINEBEA MITSUMI, Inc. (Machinery) | 4 | ||||||
| 200 | MISUMI Group, Inc. (Machinery) | 4 | ||||||
| 700 | Mitsubishi Corp. (Trading Companies & Distributors) | 34 | ||||||
| 1,100 | Mitsubishi Electric Corp. (Electrical Equipment) | 16 | ||||||
| 700 | Mitsubishi Estate Co. Ltd. (Real Estate Management & Development) | 8 | ||||||
| 500 | Mitsubishi HC Capital, Inc. (Financial Services) | 3 | ||||||
| 200 | Mitsubishi Heavy Industries Ltd. (Machinery) | 9 | ||||||
| 6,779 | Mitsubishi UFJ Financial Group, Inc. (Banks) | 49 | ||||||
| 800 | Mitsui & Co. Ltd. (Trading Companies & Distributors) | 30 | ||||||
| 100 | Mitsui Chemicals, Inc. (Chemicals) | 3 | ||||||
| 500 | Mitsui Fudosan Co. Ltd. (Real Estate Management & Development) | 10 | ||||||
| 200 | Mitsui O.S.K. Lines Ltd. (Marine Transportation) | 5 | ||||||
| 1,410 | Mizuho Financial Group, Inc. (Banks) | 22 | ||||||
| 200 | MonotaRO Co. Ltd. (Trading Companies & Distributors) | 3 | ||||||
| 230 | MS&AD Insurance Group Holdings, Inc. (Insurance) | 8 | ||||||
| 337 | Murata Manufacturing Co. Ltd. (Electronic Equipment, Instruments & Components) | 19 | ||||||
See accompanying notes to financial statements.
104
HC CAPITAL TRUST
The Catholic SRI Growth Portfolio
Portfolio of Investments (continued) — June 30, 2023
Shares | Security Description | Value | ||||||
Common Stocks (continued) | ||||||||
Japan (continued) | ||||||||
| 130 | NEC Corp. (IT Services) | $ | 6 | |||||
| 200 | Nexon Co. Ltd. (Entertainment) | 4 | ||||||
| 100 | NGK Insulators Ltd. (Machinery) | 1 | ||||||
| 200 | NIDEC Corp. (Electrical Equipment) | 11 | ||||||
| 650 | Nintendo Co. Ltd. (Entertainment) | 30 | ||||||
| 1 | Nippon Building Fund, Inc. (Diversified REITs) | 4 | ||||||
| 600 | Nippon Paint Holdings Co. Ltd. (Chemicals)(a) | 5 | ||||||
| 1 | Nippon Prologis REIT, Inc. (Industrial REITs)(a) | 2 | ||||||
| 100 | Nippon Sanso Holdings Corp. (Chemicals) | 2 | ||||||
| 500 | Nippon Steel Corp. (Metals & Mining)(a) | 10 | ||||||
| 16,550 | Nippon Telegraph & Telephone Corp. (Diversified Telecommunication Services) | 20 | ||||||
| 300 | Nippon Yusen KK (Marine Transportation) | 7 | ||||||
| 1,300 | Nissan Motor Co. Ltd. (Automobile Components) | 5 | ||||||
| 154 | Nisshin Seifun Group, Inc. (Food Products) | 2 | ||||||
| 100 | Nitto Denko Corp. (Chemicals) | 7 | ||||||
| 1,500 | Nomura Holdings, Inc. (Capital Markets) | 6 | ||||||
| 100 | Nomura Real Estate Holdings, Inc. (Real Estate Management & Development) | 2 | ||||||
| 3 | Nomura Real Estate Master Fund, Inc. (Diversified REITs) | 3 | ||||||
| 235 | Nomura Research Institute Ltd. (IT Services) | 6 | ||||||
| 400 | NTT Data Group Corp. (IT Services) | 6 | ||||||
| 400 | Obayashi Corp. (Construction & Engineering) | 3 | ||||||
| 200 | Odakyu Electric Railway Co. Ltd. (Ground Transportation) | 3 | ||||||
| 500 | Oji Holdings Corp. (Paper & Forest Products) | 2 | ||||||
| 700 | Olympus Corp. (Health Care Equipment & Supplies) | 11 | ||||||
| 147 | Omron Corp. (Electronic Equipment, Instruments & Components) | 9 | ||||||
| 49 | Oracle Corp. Japan (Software) | 4 | ||||||
| 600 | Oriental Land Co. Ltd. (Hotels, Restaurants & Leisure) | 23 | ||||||
| 700 | ORIX Corp. (Financial Services) | 13 | ||||||
| 200 | Osaka Gas Co. Ltd. (Gas Utilities) | 3 | ||||||
| 34 | Otsuka Corp. (IT Services) | 1 | ||||||
| 168 | Pan Pacific International Holdings Corp. (Broadline Retail) | 3 | ||||||
| 1,300 | Panasonic Holdings Corp. (Household Durables) | 16 | ||||||
| 100 | Persol Holdings Co. Ltd. (Professional Services)(a) | 2 | ||||||
| 500 | Rakuten Group, Inc. (Broadline Retail)(a) | 2 | ||||||
| 800 | Recruit Holdings Co. Ltd. (Professional Services) | 26 | ||||||
| 700 | Renesas Electronics Corp. (Semiconductors & Semiconductor Equipment)(a)(b) | 13 | ||||||
Shares | Security Description | Value | ||||||
Japan (continued) | ||||||||
| 1,300 | Resona Holdings, Inc. (Banks) | $ | 6 | |||||
| 400 | Ricoh Co. Ltd. (Technology Hardware, Storage & Peripherals) | 3 | ||||||
| 21 | Rohm Co. Ltd. (Semiconductors & Semiconductor Equipment) | 2 | ||||||
| 100 | SBI Holdings, Inc. (Capital Markets) | 2 | ||||||
| 100 | SCSK Corp. (IT Services) | 2 | ||||||
| 100 | Secom Co. Ltd. (Commercial Services & Supplies) | 7 | ||||||
| 200 | Seiko Epson Corp. (Technology Hardware, Storage & Peripherals) | 3 | ||||||
| 200 | Sekisui Chemical Co. Ltd. (Household Durables) | 3 | ||||||
| 400 | Sekisui House Ltd. (Household Durables) | 8 | ||||||
| 467 | Seven & i Holdings Co. Ltd. (Consumer Staples Distribution & Retail) | 20 | ||||||
| 200 | SG Holdings Co. Ltd. (Air Freight & Logistics) | 3 | ||||||
| 300 | Sharp Corp. (Household Durables)(a) | 2 | ||||||
| 300 | Shimizu Corp. (Construction & Engineering) | 2 | ||||||
| 1,100 | Shin-Etsu Chemical Co. Ltd. (Chemicals) | 36 | ||||||
| 400 | Shizuoka Financial Group, Inc. (Banks) | 3 | ||||||
| 1,700 | SoftBank Corp. (Wireless Telecommunication Services) | 18 | ||||||
| 618 | SoftBank Group Corp. (Wireless Telecommunication Services) | 29 | ||||||
| 200 | Sompo Holdings, Inc. (Insurance) | 9 | ||||||
| 700 | Sony Group Corp. (Household Durables) | 62 | ||||||
| 100 | Square Enix Holdings Co. Ltd. (Entertainment) | 5 | ||||||
| 400 | Subaru Corp. (Automobile Components) | 8 | ||||||
| 200 | SUMCO Corp. (Semiconductors & Semiconductor Equipment)(a) | 3 | ||||||
| 700 | Sumitomo Corp. (Trading Companies & Distributors) | 15 | ||||||
| 400 | Sumitomo Electric Industries Ltd. (Automobile Components) | 5 | ||||||
| 100 | Sumitomo Metal Mining Co. Ltd. (Metals & Mining) | 3 | ||||||
| 800 | Sumitomo Mitsui Financial Group, Inc. (Banks) | 33 | ||||||
| 223 | Sumitomo Mitsui Trust Holdings, Inc. (Banks) | 8 | ||||||
| 200 | Sumitomo Realty & Development Co. Ltd. (Real Estate Management & Development) | 5 | ||||||
| 100 | Suntory Beverage & Food Ltd. (Beverages) | 4 | ||||||
| 200 | Suzuki Motor Corp. (Automobile Components) | 7 | ||||||
| 300 | T&D Holdings, Inc. (Insurance) | 4 | ||||||
| 100 | Taisei Corp. (Construction & Engineering) | 3 | ||||||
| 200 | TDK Corp. (Electronic Equipment, Instruments & Components) | 8 | ||||||
| 400 | Terumo Corp. (Health Care Equipment & Supplies) | 13 | ||||||
See accompanying notes to financial statements.
105
HC CAPITAL TRUST
The Catholic SRI Growth Portfolio
Portfolio of Investments (continued) — June 30, 2023
Shares | Security Description | Value | ||||||
Common Stocks (continued) | ||||||||
Japan (continued) | ||||||||
| 400 | The Chiba Bank Ltd. (Banks) | $ | 2 | |||||
| 400 | The Kansai Electric Power Co., Inc. (Electric Utilities) | 5 | ||||||
| 100 | TIS, Inc. (IT Services) | 3 | ||||||
| 145 | Tobu Railway Co. Ltd. (Ground Transportation) | 4 | ||||||
| 45 | Toho Co. Ltd. (Entertainment) | 2 | ||||||
| 1,093 | Tokio Marine Holdings, Inc. (Insurance) | 25 | ||||||
| 900 | Tokyo Electric Power Co. Holdings, Inc. (Electric Utilities)(b) | 3 | ||||||
| 300 | Tokyo Electron Ltd. (Semiconductors & Semiconductor Equipment) | 42 | ||||||
| 200 | Tokyo Gas Co. Ltd. (Gas Utilities) | 4 | ||||||
| 300 | Tokyu Corp. (Ground Transportation) | 4 | ||||||
| 100 | TOPPAN, Inc. (Commercial Services & Supplies) | 2 | ||||||
| 800 | Toray Industries, Inc. (Chemicals) | 4 | ||||||
| 200 | Toshiba Corp. (Industrial Conglomerates) | 6 | ||||||
| 100 | Tosoh Corp. (Chemicals) | 1 | ||||||
| 100 | TOTO Ltd. (Building Products) | 3 | ||||||
| 100 | Toyota Industries Corp. (Machinery) | 7 | ||||||
| 6,150 | Toyota Motor Corp. (Automobile Components) | 98 | ||||||
| 100 | Trend Micro, Inc. (Software) | 5 | ||||||
| 200 | Unicharm Corp. (Household Products) | 7 | ||||||
| 100 | USS Co. Ltd. (Specialty Retail) | 2 | ||||||
| 100 | Welcia Holdings Co. Ltd. (Consumer Staples Distribution & Retail) | 2 | ||||||
| 100 | Yakult Honsha Co. Ltd. (Food Products) | 6 | ||||||
| 100 | Yamaha Corp. (Leisure Products) | 4 | ||||||
| 200 | Yamaha Motor Co. Ltd. (Automobile Components) | 6 | ||||||
| 200 | Yamato Holdings Co. Ltd. (Air Freight & Logistics) | 4 | ||||||
| 100 | Yaskawa Electric Corp. (Machinery) | 5 | ||||||
| 100 | Yokogawa Electric Corp. (Electronic Equipment, Instruments & Components) | 2 | ||||||
| 1,500 | Z Holdings Corp. (Interactive Media & Services) | 4 | ||||||
| 100 | ZOZO, Inc. (Specialty Retail)(a) | 2 | ||||||
| 1,803 | ||||||||
Jersey — 0.01% | ||||||||
| 61 | Novocure Ltd. (Health Care Equipment & Supplies)(b) | 3 | ||||||
Luxembourg — 0.04% | ||||||||
| 325 | ArcelorMittal SA (Metals & Mining) | 9 | ||||||
| 259 | Tenaris SA (Energy Equipment & Services) | 4 | ||||||
| 13 | ||||||||
Netherlands — 1.62% | ||||||||
| 224 | ABN AMRO Bank N.V. (Banks) | 3 | ||||||
Shares | Security Description | Value | ||||||
Netherlands (continued) | ||||||||
| 13 | Adyen N.V. (Professional Services)(a)(b) | $ | 23 | |||||
| 893 | Aegon N.V. (Insurance) | 5 | ||||||
| 91 | Akzo Nobel N.V. (Chemicals) | 7 | ||||||
| 31 | Argenx SE (Biotechnology)(b) | 12 | ||||||
| 28 | ASM International N.V. (Semiconductors & Semiconductor Equipment) | 12 | ||||||
| 232 | ASML Holding N.V. (Semiconductors & Semiconductor Equipment)(a) | 167 | ||||||
| 44 | Euronext N.V. (Capital Markets) | 3 | ||||||
| 62 | EXOR N.V. (Financial Services) | 6 | ||||||
| 303 | Ferrovial SE (Construction & Engineering)(b) | 10 | ||||||
| 71 | Heineken Holding N.V. (Beverages) | 6 | ||||||
| 151 | Heineken N.V. (Beverages) | 16 | ||||||
| 31 | IMCD N.V. (Trading Companies & Distributors)(a) | 4 | ||||||
| 2,137 | ING Groep N.V. (Banks) | 29 | ||||||
| 59 | JDE Peet’s N.V. (Food Products)(a) | 2 | ||||||
| 103 | Just Eat Takeaway.com N.V. (Hotels, Restaurants & Leisure)(b) | 2 | ||||||
| 585 | Koninklijke Ahold Delhaize N.V. (Consumer Staples Distribution & Retail) | 20 | ||||||
| 1,770 | Koninklijke KPN N.V. (Diversified Telecommunication Services) | 6 | ||||||
| 515 | Koninklijke Philips N.V. (Health Care Equipment & Supplies)(b) | 11 | ||||||
| 152 | NN Group N.V. (Insurance) | 6 | ||||||
| 148 | NXP Semiconductors N.V. (Semiconductors & Semiconductor Equipment) | 30 | ||||||
| 51 | OCI N.V. (Chemicals)(a) | 1 | ||||||
| 460 | Prosus N.V. (Broadline Retail)(a) | 34 | ||||||
| 79 | Randstad N.V. (Professional Services) | 4 | ||||||
| 1,276 | Stellantis N.V. (Automobile Components) | 22 | ||||||
| 433 | Universal Music Group N.V. (Entertainment) | 10 | ||||||
| 148 | Wolters Kluwer N.V. (Professional Services) | 19 | ||||||
| 470 | ||||||||
New Zealand — 0.08% | ||||||||
| 657 | Auckland International Airport Ltd. (Transportation Infrastructure)(b) | 3 | ||||||
| 304 | Fisher & Paykel Healthcare Corp. Ltd. (Health Care Equipment & Supplies) | 5 | ||||||
| 634 | Mercury NZ Ltd. (Electric Utilities) | 3 | ||||||
| 828 | Meridian Energy Ltd. (Independent Power and Renewable Electricity Producers) | 3 | ||||||
| 1,066 | Spark New Zealand Ltd. (Diversified Telecommunication Services) | 3 | ||||||
| 89 | Xero Ltd. (Software)(b) | 7 | ||||||
| 24 | ||||||||
See accompanying notes to financial statements.
106
HC CAPITAL TRUST
The Catholic SRI Growth Portfolio
Portfolio of Investments (continued) — June 30, 2023
Shares | Security Description | Value | ||||||
Common Stocks (continued) | ||||||||
Norway — 0.19% | ||||||||
| 161 | Adevinta ASA (Interactive Media & Services)(b) | $ | 1 | |||||
| 197 | Aker BP ASA (Oil, Gas & Consumable Fuels) | 5 | ||||||
| 533 | DNB Bank ASA (Banks) | 10 | ||||||
| 562 | Equinor ASA (Oil, Gas & Consumable Fuels) | 16 | ||||||
| 121 | Gjensidige Forsikring ASA (Insurance) | 2 | ||||||
| 220 | Mowi ASA (Food Products)(a) | 3 | ||||||
| 873 | Norsk Hydro ASA (Metals & Mining) | 5 | ||||||
| 382 | Orkla ASA (Food Products) | 3 | ||||||
| 33 | Salmar ASA (Food Products) | 1 | ||||||
| 373 | Telenor ASA (Diversified Telecommunication Services) | 4 | ||||||
| 111 | Yara International ASA (Chemicals) | 4 | ||||||
| 54 | ||||||||
Portugal — 0.06% | ||||||||
| 1,828 | EDP - Energias de Portugal SA (Electric Utilities) | 10 | ||||||
| 282 | Galp Energia SGPS SA, B Shares (Oil, Gas & Consumable Fuels)(a) | 3 | ||||||
| 157 | Jeronimo Martins SGPS SA (Consumer Staples Distribution & Retail)(a) | 4 | ||||||
| 17 | ||||||||
Singapore — 0.43% | ||||||||
| 2,350 | CapitaLand Ascendas REIT (Industrial REITs) | 5 | ||||||
| 2,740 | CapitaLand Integrated Commercial Trust (Retail REITs) | 4 | ||||||
| 1,500 | CapitaLand Investment Ltd. (Real Estate Management & Development) | 4 | ||||||
| 400 | City Developments Ltd. (Real Estate Management & Development) | 2 | ||||||
| 1,024 | DBS Group Holdings Ltd. (Banks) | 23 | ||||||
| 3,300 | Genting Singapore Ltd. (Hotels, Restaurants & Leisure) | 2 | ||||||
| 888 | Grab Holdings Ltd. (Ground Transportation)(b) | 3 | ||||||
| 100 | Jardine Cycle & Carriage Ltd. (Industrial Conglomerates) | 3 | ||||||
| 1,000 | Keppel Corp. Ltd. (Industrial Conglomerates) | 5 | ||||||
| 1,659 | Mapletree Logistics Trust (Industrial REITs) | 2 | ||||||
| 1,200 | Mapletree Pan Asia Commercial Trust (Retail REITs) | 1 | ||||||
| 2,135 | Oversea-Chinese Banking Corp. Ltd. (Banks) | 19 | ||||||
| 212 | Sea Ltd., ADR (Entertainment)(b) | 12 | ||||||
| 19,085 | Seatrium Ltd. (Machinery)(b) | 2 | ||||||
| 900 | Singapore Airlines Ltd. (Passenger Airlines)(a) | 5 | ||||||
| 500 | Singapore Exchange Ltd. (Capital Markets) | 4 | ||||||
| 5,100 | Singapore Telecommunications Ltd. (Diversified Telecommunication Services) | 9 | ||||||
| 700 | United Overseas Bank Ltd. (Banks) | 15 | ||||||
Shares | Security Description | Value | ||||||
Singapore (continued) | ||||||||
| 300 | UOL Group Ltd. (Real Estate Management & Development) | $ | 1 | |||||
| 100 | Venture Corp. Ltd. (Electronic Equipment, Instruments & Components) | 1 | ||||||
| 900 | Wilmar International Ltd. (Food Products) | 3 | ||||||
| 125 | ||||||||
Spain — 0.79% | ||||||||
| 18 | Acciona SA (Electric Utilities) | 3 | ||||||
| 137 | ACS Actividades de Construccion y Servicios SA (Construction & Engineering) | 5 | ||||||
| 38 | Aena SME SA (Transportation Infrastructure) | 6 | ||||||
| 261 | Amadeus IT Group SA (Professional Services)(b) | 20 | ||||||
| 3,526 | Banco Bilbao Vizcaya Argentaria SA (Banks) | 27 | ||||||
| 9,547 | Banco Santander SA (Banks)(a) | 35 | ||||||
| 2,355 | CaixaBank SA (Banks) | 10 | ||||||
| 321 | Cellnex Telecom SA (Diversified Telecommunication Services)(a) | 13 | ||||||
| 33 | Corp. ACCIONA Energias Renovables SA (Independent Power and Renewable Electricity Producers) | 1 | ||||||
| 152 | EDP Renovaveis SA (Independent Power and Renewable Electricity Producers) | 3 | ||||||
| 121 | Enagas SA (Gas Utilities)(a) | 2 | ||||||
| 153 | Endesa SA (Electric Utilities) | 3 | ||||||
| 203 | Grifols SA (Biotechnology)(b) | 3 | ||||||
| 3,350 | Iberdrola SA (Electric Utilities) | 44 | ||||||
| 641 | Industria de Diseno Textil SA (Specialty Retail) | 25 | ||||||
| 70 | Naturgy Energy Group SA (Gas Utilities) | 2 | ||||||
| 223 | Redeia Corp. SA (Electric Utilities) | 4 | ||||||
| 763 | Repsol SA (Oil, Gas & Consumable Fuels) | 11 | ||||||
| 2,938 | Telefonica SA (Diversified Telecommunication Services) | 12 | ||||||
| 229 | ||||||||
Sweden — 0.93% | ||||||||
| 156 | Alfa Laval AB (Machinery) | 6 | ||||||
| 624 | Assa Abloy AB, Class - B (Building Products) | 15 | ||||||
| 1,596 | Atlas Copco AB, Class - A (Machinery) | 22 | ||||||
| 914 | Atlas Copco AB, Class - B (Machinery) | 11 | ||||||
| 225 | Beijer Ref AB (Trading Companies & Distributors) | 3 | ||||||
| 165 | Boliden AB (Metals & Mining) | 5 | ||||||
| 367 | Embracer Group AB (Entertainment)(b) | 1 | ||||||
| 348 | Epiroc AB, Class - A (Machinery) | 7 | ||||||
| 289 | Epiroc AB, Class - B (Machinery) | 5 | ||||||
| 195 | EQT AB (Capital Markets) | 4 | ||||||
| 365 | Essity AB, Class - B (Household Products) | 10 | ||||||
| 104 | Evolution AB (Hotels, Restaurants & Leisure) | 13 | ||||||
| 306 | Fastighets AB Balder, Class - B (Real Estate Management & Development)(b) | 1 | ||||||
See accompanying notes to financial statements.
107
HC CAPITAL TRUST
The Catholic SRI Growth Portfolio
Portfolio of Investments (continued) — June 30, 2023
Shares | Security Description | Value | ||||||
Common Stocks (continued) | ||||||||
Sweden (continued) | ||||||||
| 120 | Getinge AB, Class - B (Health Care Equipment & Supplies) | $ | 2 | |||||
| 377 | H & M Hennes & Mauritz AB, Class - B (Specialty Retail) | 6 | ||||||
| 1,114 | Hexagon AB, Class - B (Electronic Equipment, Instruments & Components) | 14 | ||||||
| 74 | Holmen AB, Class - B (Paper & Forest Products) | 3 | ||||||
| 214 | Husqvarna AB, Class - B (Machinery) | 2 | ||||||
| 144 | Industrivarden AB, Class - A (Financial Services)(a) | 4 | ||||||
| 20 | Industrivarden AB, Class - C (Financial Services) | 1 | ||||||
| 155 | Indutrade AB (Machinery) | 3 | ||||||
| 81 | Investment AB Latour, Class - B (Industrial Conglomerates) | 2 | ||||||
| 278 | Investor AB, Class - A (Financial Services) | 6 | ||||||
| 963 | Investor AB, Class - B (Financial Services) | 19 | ||||||
| 181 | Kinnevik AB, Class - B (Financial Services)(b) | 3 | ||||||
| 50 | L E Lundbergforetagen AB, Class - B (Financial Services) | 2 | ||||||
| 127 | Lifco AB, Class - B (Industrial Conglomerates) | 3 | ||||||
| 848 | Nibe Industrier AB, Class - B (Building Products) | 8 | ||||||
| 95 | Sagax AB, Class - B (Real Estate Management & Development) | 2 | ||||||
| 651 | Sandvik AB (Machinery) | 13 | ||||||
| 280 | Securitas AB, Class - B (Commercial Services & Supplies) | 2 | ||||||
| 956 | Skandinaviska Enskilda Banken AB, Class - A (Banks) | 11 | ||||||
| 234 | Skanska AB, Class - B (Construction & Engineering) | 3 | ||||||
| 191 | SKF AB, Class - B (Machinery) | 3 | ||||||
| 403 | Svenska Cellulosa AB SCA, Class - B (Paper & Forest Products) | 5 | ||||||
| 873 | Svenska Handelsbanken AB, Class - A (Banks) | 7 | ||||||
| 476 | Swedbank AB, Class - A (Banks) | 8 | ||||||
| 264 | Tele2 AB, Class - B (Wireless Telecommunication Services) | 2 | ||||||
| 1,729 | Telefonaktiebolaget LM Ericsson, Class - B (Communications Equipment) | 9 | ||||||
| 1,249 | Telia Co. AB (Diversified Telecommunication Services)(a) | 3 | ||||||
| 207 | Volvo AB, Class - A (Machinery) | 4 | ||||||
| 803 | Volvo AB, Class - B (Machinery) | 17 | ||||||
| 325 | Volvo Car AB, Class - B (Automobile Components)(b) | 1 | ||||||
| 271 | ||||||||
Shares | Security Description | Value | ||||||
Switzerland — 2.59% | ||||||||
| 916 | ABB Ltd., Registered Shares (Electrical Equipment) | $ | 36 | |||||
| 82 | Adecco Group AG (Professional Services)(a) | 3 | ||||||
| 286 | Alcon, Inc. (Health Care Equipment & Supplies) | 24 | ||||||
| 24 | Baloise Holding AG, Registered Shares (Insurance) | 4 | ||||||
| 16 | Banque Cantonale Vaudoise, Registered Shares (Banks) | 2 | ||||||
| 2 | Barry Callebaut AG, Registered Shares (Food Products)(a) | 4 | ||||||
| 14 | BKW AG (Electric Utilities) | 2 | ||||||
| 1 | Chocoladefabriken Lindt & Spruengli AG, Class - PC (Food Products) | 13 | ||||||
| 241 | Chubb Ltd. (Insurance) | 46 | ||||||
| 304 | Cie Financiere Richemont SA, Registered Shares (Textiles, Apparel & Luxury Goods) | 53 | ||||||
| 100 | Clariant AG, Registered Shares (Chemicals) | 1 | ||||||
| 114 | Coca-Cola HBC AG (Beverages) | 3 | ||||||
| 103 | DSM-Firmenich AG (Chemicals)(b) | 11 | ||||||
| 66 | Dufry AG, Registered Shares (Specialty Retail)(a)(b) | 3 | ||||||
| 5 | EMS-Chemie Holding AG (Chemicals) | 4 | ||||||
| 96 | Garmin Ltd. (Household Durables) | 10 | ||||||
| 22 | Geberit AG, Registered Shares (Building Products) | 12 | ||||||
| 5 | Givaudan SA, Registered Shares (Chemicals) | 17 | ||||||
| 6,070 | Glencore PLC (Metals & Mining)(a) | 34 | ||||||
| 23 | Helvetia Holding AG, Registered Shares (Insurance) | 3 | ||||||
| 317 | Holcim AG, Registered Shares (Construction Materials)(a) | 21 | ||||||
| 119 | Julius Baer Group Ltd. (Capital Markets) | 8 | ||||||
| 32 | Kuehne + Nagel International AG, Registered Shares (Marine Transportation) | 9 | ||||||
| 96 | Logitech International SA, Registered Shares (Technology Hardware, Storage & Peripherals) | 6 | ||||||
| 1,581 | Nestle SA, Registered Shares (Food Products) | 191 | ||||||
| 14 | Partners Group Holding AG (Capital Markets) | 13 | ||||||
| 18 | Schindler Holding AG (Machinery) | 4 | ||||||
| 19 | Schindler Holding AG, Registered Shares (Machinery) | 4 | ||||||
| 88 | SGS SA, Registered Shares (Professional Services)(a) | 8 | ||||||
| 197 | SIG Group AG (Containers & Packaging)(a) | 5 | ||||||
| 87 | Sika AG, Registered Shares (Chemicals)(a) | 25 | ||||||
| 32 | Sonova Holding AG (Health Care Equipment & Supplies)(a) | 9 | ||||||
See accompanying notes to financial statements.
108
HC CAPITAL TRUST
The Catholic SRI Growth Portfolio
Portfolio of Investments (continued) — June 30, 2023
Shares | Security Description | Value | ||||||
Common Stocks (continued) | ||||||||
Switzerland (continued) | ||||||||
| 404 | STMicroelectronics N.V. (Semiconductors & Semiconductor Equipment) | $ | 20 | |||||
| 67 | Straumann Holding AG, Registered Shares (Health Care Equipment & Supplies) | 11 | ||||||
| 16 | Swiss Life Holding AG (Insurance) | 9 | ||||||
| 51 | Swiss Prime Site AG, Registered Shares (Real Estate Management & Development) | 4 | ||||||
| 171 | Swiss Re AG (Insurance) | 17 | ||||||
| 15 | Swisscom AG, Registered Shares (Diversified Telecommunication Services) | 9 | ||||||
| 35 | Temenos AG, Registered Shares (Software) | 3 | ||||||
| 15 | The Swatch Group AG (Textiles, Apparel & Luxury Goods) | 4 | ||||||
| 39 | The Swatch Group AG (Textiles, Apparel & Luxury Goods) | 2 | ||||||
| 1,914 | UBS Group AG (Capital Markets) | 39 | ||||||
| 14 | VAT Group AG (Machinery) | 6 | ||||||
| 87 | Zurich Insurance Group AG (Insurance) | 41 | ||||||
| 753 | ||||||||
United Arab Emirates — 0.00% | ||||||||
| 118 | NMC Health PLC (Health Care Providers & Services)(b)(c) | — | ||||||
United Kingdom — 3.52% | ||||||||
| 582 | 3i Group PLC (Capital Markets) | 14 | ||||||
| 1,208 | abrdn PLC (Capital Markets) | 3 | ||||||
| 108 | Admiral Group PLC (Insurance) | 3 | ||||||
| 898 | Amcor PLC (Containers & Packaging) | 9 | ||||||
| 721 | Anglo American PLC (Metals & Mining) | 21 | ||||||
| 254 | Ashtead Group PLC (Trading Companies & Distributors) | 18 | ||||||
| 190 | Associated British Foods PLC (Food Products) | 5 | ||||||
| 483 | Auto Trader Group PLC (Interactive Media & Services)(a) | 4 | ||||||
| 1,441 | Aviva PLC (Insurance) | 7 | ||||||
| 9,144 | Barclays PLC (Banks)(a) | 18 | ||||||
| 693 | Barratt Developments PLC (Household Durables)(a) | 4 | ||||||
| 79 | Berkeley Group Holdings PLC (Household Durables) | 4 | ||||||
| 10,200 | BP PLC (Oil, Gas & Consumable Fuels) | 59 | ||||||
| 4,281 | BT Group PLC (Diversified Telecommunication Services) | 7 | ||||||
| 210 | Bunzl PLC (Trading Companies & Distributors) | 8 | ||||||
| 214 | Burberry Group PLC (Textiles, Apparel & Luxury Goods)(a) | 6 | ||||||
| 3,522 | Centrica PLC (Multi-Utilities)(a) | 6 | ||||||
| 182 | Clarivate PLC (Professional Services)(b) | 2 | ||||||
Shares | Security Description | Value | ||||||
United Kingdom (continued) | ||||||||
| 632 | CNH Industrial N.V. (Machinery) | $ | 9 | |||||
| 128 | Coca-Cola Europacific Partners PLC (Beverages) | 8 | ||||||
| 1,030 | Compass Group PLC (Hotels, Restaurants & Leisure) | 29 | ||||||
| 86 | Croda International PLC (Chemicals)(a) | 6 | ||||||
| 1,287 | Diageo PLC (Beverages) | 55 | ||||||
| 132 | Endeavour Mining PLC (Metals & Mining) | 3 | ||||||
| 367 | Entain PLC (Hotels, Restaurants & Leisure)(a) | 6 | ||||||
| 12 | Ferguson PLC (Trading Companies & Distributors) | 2 | ||||||
| 107 | Ferguson PLC (Trading Companies & Distributors) | 17 | ||||||
| 2,958 | Haleon PLC (Personal Care Products) | 12 | ||||||
| 214 | Halma PLC (Electronic Equipment, Instruments & Components) | 6 | ||||||
| 176 | Hargreaves Lansdown PLC (Capital Markets) | 2 | ||||||
| 11,522 | HSBC Holdings PLC (Banks) | 90 | ||||||
| 810 | Informa PLC (Media) | 7 | ||||||
| 96 | InterContinental Hotels Group PLC (Hotels, Restaurants & Leisure) | 7 | ||||||
| 103 | Intertek Group PLC (Professional Services) | 6 | ||||||
| 842 | J Sainsbury PLC (Consumer Staples Distribution & Retail) | 3 | ||||||
| 1,475 | JD Sports Fashion PLC (Specialty Retail) | 3 | ||||||
| 83 | Johnson Matthey PLC (Chemicals) | 2 | ||||||
| 1,028 | Kingfisher PLC (Specialty Retail) | 3 | ||||||
| 371 | Land Securities Group PLC (Diversified REITs) | 3 | ||||||
| 3,513 | Legal & General Group PLC (Insurance) | 10 | ||||||
| 142 | Liberty Global PLC, Class - A (Diversified Telecommunication Services)(b) | 2 | ||||||
| 148 | Liberty Global PLC, Class - C (Diversified Telecommunication Services)(b) | 3 | ||||||
| 37,703 | Lloyds Banking Group PLC (Banks) | 21 | ||||||
| 236 | London Stock Exchange Group PLC (Capital Markets) | 25 | ||||||
| 1,248 | M&G PLC (Financial Services) | 3 | ||||||
| 267 | Mondi PLC (Paper & Forest Products) | 4 | ||||||
| 2,123 | National Grid PLC (Multi-Utilities) | 28 | ||||||
| 3,179 | NatWest Group PLC (Banks)(a) | 10 | ||||||
| 71 | Next PLC (Broadline Retail) | 6 | ||||||
| 363 | Ocado Group PLC (Consumer Staples Distribution & Retail)(a)(b) | 3 | ||||||
| 399 | Pearson PLC (Diversified Consumer Services) | 4 | ||||||
| 93 | Pentair PLC (Machinery) | 6 | ||||||
| 224 | Persimmon PLC (Household Durables) | 3 | ||||||
| 381 | Phoenix Group Holdings PLC (Insurance) | 3 | ||||||
| 1,096 | RELX PLC (Professional Services) | 37 | ||||||
| 1,488 | Rentokil Initial PLC (Commercial Services & Supplies) | 12 | ||||||
See accompanying notes to financial statements.
109
HC CAPITAL TRUST
The Catholic SRI Growth Portfolio
Portfolio of Investments (continued) — June 30, 2023
Shares | Security Description | Value | ||||||
Common Stocks (continued) | ||||||||
United Kingdom (continued) | ||||||||
| 626 | Rio Tinto PLC (Metals & Mining) | $ | 40 | |||||
| 400 | Schroders PLC (Capital Markets) | 2 | ||||||
| 744 | Segro PLC (Diversified REITs) | 7 | ||||||
| 163 | Severn Trent PLC (Water Utilities)(a) | 5 | ||||||
| 3,949 | Shell PLC (Oil, Gas & Consumable Fuels) | 117 | ||||||
| 544 | Smith & Nephew PLC (Health Care Equipment & Supplies) | 9 | ||||||
| 219 | Smiths Group PLC (Industrial Conglomerates) | 5 | ||||||
| 48 | Spirax-Sarco Engineering PLC (Machinery) | 6 | ||||||
| 624 | SSE PLC (Electric Utilities) | 15 | ||||||
| 360 | St. James’s Place PLC (Capital Markets) | 5 | ||||||
| 1,373 | Standard Chartered PLC (Banks) | 12 | ||||||
| 1,778 | Taylor Wimpey PLC (Household Durables)(a) | 2 | ||||||
| 4,044 | Tesco PLC (Consumer Staples Distribution & Retail) | 13 | ||||||
| 623 | The British Land Co. PLC (Diversified REITs) | 2 | ||||||
| 545 | The Sage Group PLC (Software) | 6 | ||||||
| 1,452 | Unilever PLC (Personal Care Products) | 75 | ||||||
| 340 | United Utilities Group PLC (Water Utilities) | 4 | ||||||
| 13,027 | Vodafone Group PLC (Wireless Telecommunication Services) | 12 | ||||||
| 107 | Whitbread PLC (Hotels, Restaurants & Leisure) | 5 | ||||||
| 64 | Willis Towers Watson PLC (Insurance) | 15 | ||||||
| 409 | Wise PLC, Class - A (Professional Services)(b) | 3 | ||||||
| 616 | WPP PLC (Media) | 6 | ||||||
| 1,023 | ||||||||
United States — 68.04% | ||||||||
| 319 | 3M Co. (Industrial Conglomerates) | 32 | ||||||
| 72 | A.O. Smith Corp. (Building Products) | 5 | ||||||
| 435 | Activision Blizzard, Inc. (Entertainment)(b) | 37 | ||||||
| 265 | Adobe, Inc. (Software)(b) | 130 | ||||||
| 28 | Advance Auto Parts, Inc. (Specialty Retail) | 2 | ||||||
| 929 | Advanced Micro Devices, Inc. (Semiconductors & Semiconductor Equipment)(b) | 106 | ||||||
| 74 | AECOM (Construction & Engineering) | 6 | ||||||
| 339 | Aflac, Inc. (Insurance) | 24 | ||||||
| 176 | Agilent Technologies, Inc. (Life Sciences Tools & Services) | 21 | ||||||
| 128 | Air Products & Chemicals, Inc. (Chemicals) | 38 | ||||||
| 237 | Airbnb, Inc., Class - A (Hotels, Restaurants & Leisure)(b) | 30 | ||||||
| 86 | Akamai Technologies, Inc. (IT Services)(b) | 8 | ||||||
| 70 | Albemarle Corp. (Chemicals) | 16 | ||||||
| 163 | Albertsons Cos., Inc., Class - A (Consumer Staples Distribution & Retail) | 4 | ||||||
| 121 | Alcoa Corp. (Metals & Mining) | 4 | ||||||
Shares | Security Description | Value | ||||||
United States (continued) | ||||||||
| 95 | Alexandria Real Estate Equities, Inc. (Office REITs) | $ | 11 | |||||
| 41 | Align Technology, Inc. (Health Care Equipment & Supplies)(b) | 14 | ||||||
| 159 | Alliant Energy Corp. (Electric Utilities) | 8 | ||||||
| 174 | Ally Financial, Inc. (Consumer Finance) | 5 | ||||||
| 69 | Alnylam Pharmaceuticals, Inc. (Biotechnology)(b) | 13 | ||||||
| 3,436 | Alphabet, Inc., Class - A (Interactive Media & Services)(b) | 410 | ||||||
| 3,111 | Alphabet, Inc., Class - C (Interactive Media & Services)(b) | 375 | ||||||
| 5,338 | Amazon.com, Inc. (Broadline Retail)(b) | 695 | ||||||
| 147 | Ameren Corp. (Multi-Utilities) | 12 | ||||||
| 299 | American Electric Power Co., Inc. (Electric Utilities) | 25 | ||||||
| 366 | American Express Co. (Consumer Finance) | 64 | ||||||
| 45 | American Financial Group, Inc. (Insurance) | 5 | ||||||
| 203 | American Homes 4 Rent, Class - A (Residential REITs) | 7 | ||||||
| 425 | American International Group, Inc. (Insurance) | 24 | ||||||
| 271 | American Tower Corp. (Specialized REITs) | 53 | ||||||
| 112 | American Water Works Co., Inc. (Water Utilities) | 16 | ||||||
| 60 | Ameriprise Financial, Inc. (Capital Markets) | 20 | ||||||
| 98 | AmerisourceBergen Corp. (Health Care Providers & Services) | 19 | ||||||
| 133 | AMETEK, Inc. (Electrical Equipment) | 22 | ||||||
| 329 | Amphenol Corp., Class - A (Electronic Equipment, Instruments & Components) | 28 | ||||||
| 289 | Analog Devices, Inc. (Semiconductors & Semiconductor Equipment) | 56 | ||||||
| 259 | Annaly Capital Management, Inc. (Mortgage Real Estate Investment Trusts) | 5 | ||||||
| 51 | ANSYS, Inc. (Software)(b) | 17 | ||||||
| 119 | Aon PLC, Class - A (Insurance) | 41 | ||||||
| 174 | APA Corp. (Oil, Gas & Consumable Fuels) | 6 | ||||||
| 226 | Apollo Global Management, Inc. (Financial Services) | 17 | ||||||
| 9,145 | Apple, Inc. (Technology Hardware, Storage & Peripherals) | 1,773 | ||||||
| 485 | Applied Materials, Inc. (Semiconductors & Semiconductor Equipment) | 70 | ||||||
| 150 | Aramark (Hotels, Restaurants & Leisure) | 6 | ||||||
| 316 | Archer-Daniels-Midland Co. (Food Products) | 24 | ||||||
| 84 | Ares Management Corp., Class - A (Capital Markets) | 8 | ||||||
| 148 | Arista Networks, Inc. (Communications Equipment)(b) | 24 | ||||||
See accompanying notes to financial statements.
110
HC CAPITAL TRUST
The Catholic SRI Growth Portfolio
Portfolio of Investments (continued) — June 30, 2023
Shares | Security Description | Value | ||||||
Common Stocks (continued) | ||||||||
United States (continued) | ||||||||
| 33 | Arrow Electronics, Inc. (Electronic Equipment, Instruments & Components)(b) | $ | 5 | |||||
| 120 | Arthur J. Gallagher & Co. (Insurance) | 26 | ||||||
| 15 | Aspen Technology, Inc. (Software)(b) | 3 | ||||||
| 30 | Assurant, Inc. (Insurance) | 4 | ||||||
| 4,135 | AT&T, Inc. (Diversified Telecommunication Services) | 66 | ||||||
| 90 | Atlassian Corp., Class - A (Software)(b) | 15 | ||||||
| 88 | Atmos Energy Corp. (Gas Utilities) | 10 | ||||||
| 123 | Autodesk, Inc. (Software)(b) | 25 | ||||||
| 241 | Automatic Data Processing, Inc. (Professional Services) | 53 | ||||||
| 11 | AutoZone, Inc. (Specialty Retail)(b) | 27 | ||||||
| 77 | AvalonBay Communities, Inc. (Residential REITs) | 15 | ||||||
| 415 | Avantor, Inc. (Life Sciences Tools & Services)(b) | 9 | ||||||
| 48 | Avery Dennison Corp. (Containers & Packaging) | 8 | ||||||
| 39 | Axon Enterprise, Inc. (Aerospace & Defense)(b) | 8 | ||||||
| 597 | Baker Hughes Co. (Energy Equipment & Services) | 19 | ||||||
| 169 | Ball Corp. (Containers & Packaging) | 10 | ||||||
| 4,161 | Bank of America Corp. (Banks) | 119 | ||||||
| 141 | Bath & Body Works, Inc. (Specialty Retail) | 5 | ||||||
| 276 | Baxter International, Inc. (Health Care Equipment & Supplies) | 13 | ||||||
| 120 | Bentley Systems, Inc., Class - B (Software) | 7 | ||||||
| 750 | Berkshire Hathaway, Inc., Class - B (Financial Services)(b) | 256 | ||||||
| 121 | Best Buy Co., Inc. (Specialty Retail) | 10 | ||||||
| 59 | BILL Holdings, Inc. (Software)(b) | 7 | ||||||
| 104 | BioMarin Pharmaceutical, Inc. (Biotechnology)(b) | 9 | ||||||
| 80 | Bio-Techne Corp. (Life Sciences Tools & Services) | 7 | ||||||
| 85 | Black Knight, Inc. (Software)(b) | 5 | ||||||
| 86 | BlackRock, Inc., Class - A (Capital Markets) | 59 | ||||||
| 405 | Blackstone, Inc., Class - A (Capital Markets) | 38 | ||||||
| 315 | Block, Inc. (Financial Services)(b) | 21 | ||||||
| 22 | Booking Holdings, Inc. (Hotels, Restaurants & Leisure)(b) | 59 | ||||||
| 71 | Booz Allen Hamilton Holding Corp. (Professional Services) | 8 | ||||||
| 123 | BorgWarner, Inc. (Automobile Components) | 6 | ||||||
| 93 | Boston Properties, Inc. (Office REITs) | 5 | ||||||
| 832 | Boston Scientific Corp. (Health Care Equipment & Supplies)(b) | 45 | ||||||
| 241 | Broadcom, Inc. (Semiconductors & Semiconductor Equipment) | 209 | ||||||
Shares | Security Description | Value | ||||||
United States (continued) | ||||||||
| 69 | Broadridge Financial Solutions, Inc. (Professional Services) | $ | 11 | |||||
| 63 | Brookfield Renewable Corp., Class - A (Independent Power and Renewable Electricity Producers)(a) | 2 | ||||||
| 145 | Brown & Brown, Inc. (Insurance) | 10 | ||||||
| 178 | Brown-Forman Corp., Class - B (Beverages) | 12 | ||||||
| 82 | Builders FirstSource, Inc. (Building Products)(b) | 11 | ||||||
| 85 | Bunge Ltd. (Food Products) | 8 | ||||||
| 35 | Burlington Stores, Inc. (Specialty Retail)(b) | 6 | ||||||
| 69 | C.H. Robinson Worldwide, Inc. (Air Freight & Logistics) | 7 | ||||||
| 157 | Cadence Design Systems, Inc. (Software)(b) | 37 | ||||||
| 129 | Caesars Entertainment, Inc. (Hotels, Restaurants & Leisure)(b) | 7 | ||||||
| 61 | Camden Property Trust (Residential REITs) | 7 | ||||||
| 101 | Campbell Soup Co. (Food Products) | 5 | ||||||
| 220 | Capital One Financial Corp. (Consumer Finance) | 24 | ||||||
| 148 | Cardinal Health, Inc. (Health Care Providers & Services) | 14 | ||||||
| 31 | Carlisle Cos., Inc. (Building Products) | 8 | ||||||
| 85 | CarMax, Inc. (Specialty Retail)(b) | 7 | ||||||
| 556 | Carnival Corp. (Hotels, Restaurants & Leisure)(b) | 10 | ||||||
| 487 | Carrier Global Corp. (Building Products) | 24 | ||||||
| 300 | Caterpillar, Inc. (Machinery) | 74 | ||||||
| 58 | Cboe Global Markets, Inc. (Capital Markets) | 8 | ||||||
| 184 | CBRE Group, Inc., Class - A (Real Estate Management & Development)(b) | 15 | ||||||
| 81 | CDW Corp. (Electronic Equipment, Instruments & Components) | 15 | ||||||
| 57 | Celanese Corp., Series A (Chemicals) | 7 | ||||||
| 368 | CenterPoint Energy, Inc. (Multi-Utilities) | 11 | ||||||
| 74 | Ceridian HCM Holding, Inc. (Professional Services)(b) | 5 | ||||||
| 112 | CF Industries Holdings, Inc. (Chemicals) | 8 | ||||||
| 57 | Charter Communications, Inc., Class - A (Media)(b) | 21 | ||||||
| 141 | Cheniere Energy, Inc. (Oil, Gas & Consumable Fuels) | 21 | ||||||
| 57 | Chesapeake Energy Corp. (Oil, Gas & Consumable Fuels) | 5 | ||||||
| 1,040 | Chevron Corp. (Oil, Gas & Consumable Fuels) | 164 | ||||||
| 57 | Chewy, Inc., Class - A (Specialty Retail)(b) | 2 | ||||||
| 16 | Chipotle Mexican Grill, Inc. (Hotels, Restaurants & Leisure)(b) | 34 | ||||||
| 90 | Cincinnati Financial Corp. (Insurance) | 9 | ||||||
| 53 | Cintas Corp. (Commercial Services & Supplies) | 26 | ||||||
See accompanying notes to financial statements.
111
HC CAPITAL TRUST
The Catholic SRI Growth Portfolio
Portfolio of Investments (continued) — June 30, 2023
Shares | Security Description | Value | ||||||
Common Stocks (continued) | ||||||||
United States (continued) | ||||||||
| 2,349 | Cisco Systems, Inc. (Communications Equipment) | $ | 122 | |||||
| 1,126 | Citigroup, Inc. (Banks) | 52 | ||||||
| 296 | Citizens Financial Group, Inc. (Banks) | 8 | ||||||
| 328 | Cleveland-Cliffs, Inc. (Metals & Mining)(b) | 5 | ||||||
| 155 | Cloudflare, Inc., Class - A (IT Services)(b) | 10 | ||||||
| 207 | CME Group, Inc. (Capital Markets) | 38 | ||||||
| 159 | CMS Energy Corp. (Multi-Utilities) | 9 | ||||||
| 90 | Cognex Corp. (Electronic Equipment, Instruments & Components) | 5 | ||||||
| 302 | Cognizant Technology Solutions Corp., Class - A (IT Services) | 20 | ||||||
| 105 | Coinbase Global, Inc., Class - A (Capital Markets)(b) | 8 | ||||||
| 452 | Colgate-Palmolive Co. (Household Products) | 35 | ||||||
| 2,431 | Comcast Corp., Class - A (Media) | 101 | ||||||
| 284 | Conagra Brands, Inc. (Food Products) | 10 | ||||||
| 700 | ConocoPhillips (Oil, Gas & Consumable Fuels) | 73 | ||||||
| 193 | Consolidated Edison, Inc. (Multi-Utilities) | 17 | ||||||
| 94 | Constellation Brands, Inc., Class - A (Beverages) | 23 | ||||||
| 186 | Constellation Energy Corp. (Electric Utilities) | 17 | ||||||
| 242 | Copart, Inc. (Commercial Services & Supplies)(b) | 22 | ||||||
| 407 | Corteva, Inc. (Chemicals) | 23 | ||||||
| 234 | CoStar Group, Inc. (Professional Services)(b) | 21 | ||||||
| 256 | Costco Wholesale Corp. (Consumer Staples Distribution & Retail) | 138 | ||||||
| 424 | Coterra Energy, Inc. (Oil, Gas & Consumable Fuels) | 11 | ||||||
| 127 | Crowdstrike Holdings, Inc., Class - A (Software)(b) | 19 | ||||||
| 249 | Crown Castle, Inc. (Specialized REITs) | 28 | ||||||
| 62 | Crown Holdings, Inc. (Containers & Packaging) | 5 | ||||||
| 1,178 | CSX Corp. (Ground Transportation) | 40 | ||||||
| 85 | Cummins, Inc. (Machinery) | 21 | ||||||
| 745 | CVS Health Corp. (Health Care Providers & Services) | 52 | ||||||
| 180 | D.R. Horton, Inc. (Household Durables) | 22 | ||||||
| 70 | Darden Restaurants, Inc. (Hotels, Restaurants & Leisure) | 12 | ||||||
| 86 | Darling Ingredients, Inc. (Food Products)(b) | 5 | ||||||
| 145 | Datadog, Inc., Class - A (Software)(b) | 14 | ||||||
| 30 | DaVita, Inc. (Health Care Providers & Services)(b) | 3 | ||||||
| 16 | Deckers Outdoor Corp. (Textiles, Apparel & Luxury Goods)(b) | 8 | ||||||
| 162 | Deere & Co. (Machinery) | 66 | ||||||
Shares | Security Description | Value | ||||||
United States (continued) | ||||||||
| 144 | Dell Technologies, Inc., Class - C (Technology Hardware, Storage & Peripherals) | $ | 8 | |||||
| 108 | Delta Air Lines, Inc. (Passenger Airlines)(b) | 5 | ||||||
| 109 | DENTSPLY SIRONA, Inc. (Health Care Equipment & Supplies) | 4 | ||||||
| 378 | Devon Energy Corp. (Oil, Gas & Consumable Fuels) | 18 | ||||||
| 222 | Dexcom, Inc. (Health Care Equipment & Supplies)(b) | 29 | ||||||
| 102 | Diamondback Energy, Inc. (Oil, Gas & Consumable Fuels) | 13 | ||||||
| 38 | Dick’s Sporting Goods, Inc. (Specialty Retail) | 5 | ||||||
| 167 | Digital Realty Trust, Inc. (Specialized REITs) | 19 | ||||||
| 153 | Discover Financial Services (Consumer Finance) | 18 | ||||||
| 108 | DocuSign, Inc. (Software)(b) | 6 | ||||||
| 129 | Dollar General Corp. (Consumer Staples Distribution & Retail) | 22 | ||||||
| 127 | Dollar Tree, Inc. (Consumer Staples Distribution & Retail)(b) | 18 | ||||||
| 492 | Dominion Energy, Inc. (Multi-Utilities) | 25 | ||||||
| 22 | Domino’s Pizza, Inc. (Hotels, Restaurants & Leisure) | 7 | ||||||
| 148 | DoorDash, Inc., Class - A (Hotels, Restaurants & Leisure)(b) | 11 | ||||||
| 89 | Dover Corp. (Machinery) | 13 | ||||||
| 406 | Dow, Inc. (Chemicals) | 22 | ||||||
| 162 | Dropbox, Inc., Class - A (Software)(b) | 4 | ||||||
| 123 | DTE Energy Co. (Multi-Utilities) | 14 | ||||||
| 445 | Duke Energy Corp. (Electric Utilities) | 40 | ||||||
| 267 | DuPont de Nemours, Inc. (Chemicals) | 19 | ||||||
| 130 | Dynatrace, Inc. (Software)(b) | 7 | ||||||
| 70 | Eastman Chemical Co. (Chemicals) | 6 | ||||||
| 232 | Eaton Corp. PLC (Electrical Equipment) | 47 | ||||||
| 300 | eBay, Inc. (Broadline Retail) | 13 | ||||||
| 146 | Ecolab, Inc. (Chemicals) | 27 | ||||||
| 216 | Edison International (Electric Utilities) | 15 | ||||||
| 352 | Edwards Lifesciences Corp. (Health Care Equipment & Supplies)(b) | 33 | ||||||
| 158 | Electronic Arts, Inc. (Entertainment) | 20 | ||||||
| 137 | Elevance Health, Inc. (Health Care Providers & Services) | 61 | ||||||
| 334 | Emerson Electric Co. (Electrical Equipment) | 30 | ||||||
| 81 | Enphase Energy, Inc. (Semiconductors & Semiconductor Equipment)(b) | 14 | ||||||
| 84 | Entegris, Inc. (Semiconductors & Semiconductor Equipment) | 9 | ||||||
| 118 | Entergy Corp. (Electric Utilities) | 11 | ||||||
See accompanying notes to financial statements.
112
HC CAPITAL TRUST
The Catholic SRI Growth Portfolio
Portfolio of Investments (continued) — June 30, 2023
Shares | Security Description | Value | ||||||
Common Stocks (continued) | ||||||||
United States (continued) | ||||||||
| 337 | EOG Resources, Inc. (Oil, Gas & Consumable Fuels) | $ | 39 | |||||
| 34 | EPAM Systems, Inc. (IT Services)(b) | 8 | ||||||
| 207 | EQT Corp. (Oil, Gas & Consumable Fuels) | 9 | ||||||
| 74 | Equifax, Inc. (Professional Services) | 17 | ||||||
| 54 | Equinix, Inc. (Specialized REITs) | 42 | ||||||
| 225 | Equitable Holdings, Inc. (Financial Services) | 6 | ||||||
| 100 | Equity LifeStyle Properties, Inc. (Residential REITs) | 7 | ||||||
| 202 | Equity Residential (Residential REITs) | 13 | ||||||
| 15 | Erie Indemnity Co., Class - A (Insurance) | 3 | ||||||
| 147 | Essential Utilities, Inc. (Water Utilities) | 6 | ||||||
| 39 | Essex Property Trust, Inc. (Residential REITs) | 9 | ||||||
| 75 | Etsy, Inc. (Broadline Retail)(b) | 6 | ||||||
| 139 | Evergy, Inc. (Electric Utilities) | 8 | ||||||
| 194 | Eversource Energy (Electric Utilities) | 14 | ||||||
| 107 | Exact Sciences Corp. (Biotechnology)(b) | 10 | ||||||
| 567 | Exelon Corp. (Electric Utilities) | 23 | ||||||
| 83 | Expedia Group, Inc. (Hotels, Restaurants & Leisure)(b) | 9 | ||||||
| 88 | Expeditors International of Washington, Inc. (Air Freight & Logistics) | 11 | ||||||
| 78 | Extra Space Storage, Inc. (Specialized REITs) | 12 | ||||||
| 2,347 | Exxon Mobil Corp. (Oil, Gas & Consumable Fuels) | 252 | ||||||
| 33 | F5, Inc. (Communications Equipment)(b) | 5 | ||||||
| 23 | FactSet Research Systems, Inc. (Capital Markets) | 9 | ||||||
| 14 | Fair Isaac Corp. (Software)(b) | 11 | ||||||
| 327 | Fastenal Co. (Trading Companies & Distributors) | 19 | ||||||
| 138 | FedEx Corp. (Air Freight & Logistics) | 34 | ||||||
| 142 | Fidelity National Financial, Inc. (Insurance) | 5 | ||||||
| 353 | Fidelity National Information Services, Inc. (Financial Services) | 19 | ||||||
| 420 | Fifth Third Bancorp (Banks) | 11 | ||||||
| 6 | First Citizens BancShares, Inc., Class - A (Banks) | 8 | ||||||
| 343 | First Horizon Corp. (Banks) | 4 | ||||||
| 57 | First Solar, Inc. (Semiconductors & Semiconductor Equipment)(b) | 11 | ||||||
| 315 | FirstEnergy Corp. (Electric Utilities) | 12 | ||||||
| 354 | Fiserv, Inc. (Financial Services)(b) | 45 | ||||||
| 41 | FleetCor Technologies, Inc. (Financial Services)(b) | 10 | ||||||
| 77 | FMC Corp. (Chemicals) | 8 | ||||||
| 2,272 | Ford Motor Co. (Automobile Components) | 34 | ||||||
| 382 | Fortinet, Inc. (Software)(b) | 29 | ||||||
| 200 | Fortive Corp. (Machinery) | 15 | ||||||
Shares | Security Description | Value | ||||||
United States (continued) | ||||||||
| 90 | Fortune Brands Innovations, Inc. (Building Products) | $ | 6 | |||||
| 153 | Fox Corp., Class - A (Media) | 5 | ||||||
| 105 | Fox Corp., Class - B (Media) | 3 | ||||||
| 199 | Franklin Resources, Inc. (Capital Markets) | 5 | ||||||
| 822 | Freeport-McMoRan, Inc. (Metals & Mining) | 33 | ||||||
| 145 | Gaming and Leisure Properties, Inc. (Specialized REITs) | 7 | ||||||
| 47 | Gartner, Inc. (IT Services)(b) | 16 | ||||||
| 218 | GE HealthCare Technologies, Inc. (Health Care Equipment & Supplies) | 18 | ||||||
| 357 | Gen Digital, Inc. (Software) | 7 | ||||||
| 33 | Generac Holdings, Inc. (Electrical Equipment)(b) | 5 | ||||||
| 340 | General Mills, Inc. (Food Products) | 26 | ||||||
| 797 | General Motors Co. (Automobile Components) | 31 | ||||||
| 85 | Genuine Parts Co. (Distributors) | 14 | ||||||
| 154 | Global Payments, Inc. (Financial Services) | 15 | ||||||
| 49 | Globe Life, Inc. (Insurance) | 5 | ||||||
| 87 | GoDaddy, Inc., Class - A (IT Services)(b) | 7 | ||||||
| 105 | Graco, Inc. (Machinery) | 9 | ||||||
| 538 | Halliburton Co. (Energy Equipment & Services) | 18 | ||||||
| 69 | Hasbro, Inc. (Leisure Products) | 4 | ||||||
| 121 | HCA Healthcare, Inc. (Health Care Providers & Services) | 37 | ||||||
| 234 | Healthcare Realty Trust, Inc. (Health Care REITs) | 4 | ||||||
| 342 | Healthpeak Properties, Inc. (Health Care REITs) | 7 | ||||||
| 31 | HEICO Corp. (Aerospace & Defense) | 5 | ||||||
| 39 | HEICO Corp., Class - A (Aerospace & Defense) | 5 | ||||||
| 72 | Henry Schein, Inc. (Health Care Providers & Services)(b) | 6 | ||||||
| 158 | Hess Corp. (Oil, Gas & Consumable Fuels) | 21 | ||||||
| 768 | Hewlett Packard Enterprise Co. (Technology Hardware, Storage & Peripherals) | 13 | ||||||
| 90 | HF Sinclair Corp. (Oil, Gas & Consumable Fuels) | 4 | ||||||
| 157 | Hilton Worldwide Holdings, Inc. (Hotels, Restaurants & Leisure) | 23 | ||||||
| 150 | Hologic, Inc. (Health Care Equipment & Supplies)(b) | 12 | ||||||
| 126 | Horizon Therapeutics PLC (Biotechnology)(b) | 13 | ||||||
| 187 | Hormel Foods Corp. (Food Products) | 8 | ||||||
| 376 | Host Hotels & Resorts, Inc. (Hotel & Resort REITs) | 6 | ||||||
| 202 | Howmet Aerospace, Inc. (Aerospace & Defense) | 10 | ||||||
| 521 | HP, Inc. (Technology Hardware, Storage & Peripherals) | 16 | ||||||
| 33 | Hubbell, Inc. (Electrical Equipment) | 11 | ||||||
See accompanying notes to financial statements.
113
HC CAPITAL TRUST
The Catholic SRI Growth Portfolio
Portfolio of Investments (continued) — June 30, 2023
Shares | Security Description | Value | ||||||
Common Stocks (continued) | ||||||||
United States (continued) | ||||||||
| 27 | HubSpot, Inc. (Software)(b) | $ | 14 | |||||
| 73 | Humana, Inc. (Health Care Providers & Services) | 33 | ||||||
| 891 | Huntington Bancshares, Inc. (Banks) | 10 | ||||||
| 32 | Hyatt Hotels Corp., Class - A (Hotels, Restaurants & Leisure) | 4 | ||||||
| 45 | IDEX Corp. (Machinery) | 10 | ||||||
| 48 | IDEXX Laboratories, Inc. (Health Care Equipment & Supplies)(b) | 24 | ||||||
| 179 | Illinois Tool Works, Inc. (Machinery) | 45 | ||||||
| 114 | Incyte Corp. (Biotechnology)(b) | 7 | ||||||
| 243 | Ingersoll Rand, Inc. (Machinery) | 16 | ||||||
| 40 | Insulet Corp. (Health Care Equipment & Supplies)(b) | 12 | ||||||
| 2,423 | Intel Corp. (Semiconductors & Semiconductor Equipment) | 81 | ||||||
| 324 | Intercontinental Exchange, Inc. (Capital Markets) | 37 | ||||||
| 527 | International Business Machines Corp. (IT Services) | 71 | ||||||
| 155 | International Flavors & Fragrances, Inc. (Chemicals) | 12 | ||||||
| 201 | International Paper Co. (Containers & Packaging) | 6 | ||||||
| 162 | Intuit, Inc. (Software) | 74 | ||||||
| 203 | Intuitive Surgical, Inc. (Health Care Equipment & Supplies)(b) | 69 | ||||||
| 187 | Invesco Ltd. (Capital Markets) | 3 | ||||||
| 349 | Invitation Homes, Inc. (Residential REITs) | 12 | ||||||
| 111 | IQVIA Holdings, Inc. (Life Sciences Tools & Services)(b) | 25 | ||||||
| 165 | Iron Mountain, Inc. (Specialized REITs) | 9 | ||||||
| 39 | Jack Henry & Associates, Inc. (Professional Services) | 7 | ||||||
| 78 | Jacobs Solutions, Inc. (Professional Services) | 9 | ||||||
| 40 | Jazz Pharmaceuticals PLC (Pharmaceuticals)(b) | 5 | ||||||
| 50 | JB Hunt Transport Services, Inc. (Ground Transportation) | 9 | ||||||
| 397 | Johnson Controls International PLC (Building Products) | 27 | ||||||
| 1,695 | JPMorgan Chase & Co. (Banks) | 247 | ||||||
| 165 | Juniper Networks, Inc. (Communications Equipment) | 5 | ||||||
| 155 | Kellogg Co. (Food Products) | 10 | ||||||
| 531 | Keurig Dr Pepper, Inc. (Beverages) | 17 | ||||||
| 555 | KeyCorp (Banks) | 5 | ||||||
| 102 | Keysight Technologies, Inc. (Electronic Equipment, Instruments & Components)(b) | 17 | ||||||
| 192 | Kimberly-Clark Corp. (Household Products) | 27 | ||||||
| 399 | Kimco Realty Corp. (Retail REITs) | 8 | ||||||
Shares | Security Description | Value | ||||||
United States (continued) | ||||||||
| 1,135 | Kinder Morgan, Inc. (Oil, Gas & Consumable Fuels) | $ | 20 | |||||
| 334 | KKR & Co., Inc. (Capital Markets) | 19 | ||||||
| 79 | KLA Corp. (Semiconductors & Semiconductor Equipment) | 38 | ||||||
| 81 | Knight-Swift Transportation Holdings, Inc. (Ground Transportation) | 5 | ||||||
| 54 | Laboratory Corporation of America Holdings (Health Care Providers & Services) | 13 | ||||||
| 77 | Lam Research Corp. (Semiconductors & Semiconductor Equipment) | 50 | ||||||
| 80 | Lamb Weston Holdings, Inc. (Food Products) | 9 | ||||||
| 206 | Las Vegas Sands Corp. (Hotels, Restaurants & Leisure)(b) | 12 | ||||||
| 75 | Lattice Semiconductor Corp. (Semiconductors & Semiconductor Equipment)(b) | 7 | ||||||
| 35 | Lear Corp. (Automobile Components) | 5 | ||||||
| 147 | Lennar Corp., Class - A (Household Durables) | 18 | ||||||
| 19 | Lennox International, Inc. (Building Products) | 6 | ||||||
| 72 | Liberty Broadband Corp., Class - C (Media)(b) | 6 | ||||||
| 114 | Liberty Media Corp. - Liberty Formula One, Class - C (Entertainment)(b) | 9 | ||||||
| 117 | Liberty Media Corp. - Liberty SiriusXM, Class - C (Media)(b) | 4 | ||||||
| 285 | Linde PLC (Chemicals) | 109 | ||||||
| 93 | Live Nation Entertainment, Inc. (Entertainment)(b) | 8 | ||||||
| 152 | LKQ Corp. (Distributors) | 9 | ||||||
| 102 | Loews Corp. (Insurance) | 6 | ||||||
| 348 | Lowe’s Cos., Inc. (Specialty Retail) | 79 | ||||||
| 44 | LPL Financial Holdings, Inc. (Capital Markets) | 10 | ||||||
| 483 | Lucid Group, Inc. (Automobile Components)(b) | 3 | ||||||
| 147 | LyondellBasell Industries N.V., Class - A (Chemicals) | 13 | ||||||
| 95 | M&T Bank Corp. (Banks) | 12 | ||||||
| 351 | Marathon Oil Corp. (Oil, Gas & Consumable Fuels) | 8 | ||||||
| 256 | Marathon Petroleum Corp. (Oil, Gas & Consumable Fuels) | 30 | ||||||
| 8 | Markel Group, Inc. (Insurance)(b) | 11 | ||||||
| 20 | MarketAxess Holdings, Inc. (Capital Markets) | 5 | ||||||
| 151 | Marriott International, Inc., Class - A (Hotels, Restaurants & Leisure) | 28 | ||||||
| 283 | Marsh & McLennan Cos., Inc. (Insurance) | 53 | ||||||
| 35 | Martin Marietta Materials, Inc. (Construction Materials) | 16 | ||||||
| 487 | Marvell Technology, Inc. (Semiconductors & Semiconductor Equipment) | 29 | ||||||
See accompanying notes to financial statements.
114
HC CAPITAL TRUST
The Catholic SRI Growth Portfolio
Portfolio of Investments (continued) — June 30, 2023
Shares | Security Description | Value | ||||||
Common Stocks (continued) | ||||||||
United States (continued) | ||||||||
| 131 | Masco Corp. (Building Products) | $ | 8 | |||||
| 29 | Masimo Corp. (Health Care Equipment & Supplies)(b) | 5 | ||||||
| 492 | Mastercard, Inc., Class - A (Financial Services) | 194 | ||||||
| 179 | Match Group, Inc. (Interactive Media & Services)(b) | 7 | ||||||
| 145 | McCormick & Co., Inc./MD (Food Products) | 13 | ||||||
| 424 | McDonald’s Corp. (Hotels, Restaurants & Leisure) | 127 | ||||||
| 79 | McKesson Corp. (Health Care Providers & Services) | 34 | ||||||
| 1,280 | Meta Platforms, Inc., Class - A (Interactive Media & Services)(b) | 366 | ||||||
| 382 | MetLife, Inc. (Insurance) | 22 | ||||||
| 13 | Mettler-Toledo International, Inc. (Life Sciences Tools & Services)(b) | 17 | ||||||
| 194 | MGM Resorts International (Hotels, Restaurants & Leisure) | 9 | ||||||
| 312 | Microchip Technology, Inc. (Semiconductors & Semiconductor Equipment) | 28 | ||||||
| 632 | Micron Technology, Inc. (Semiconductors & Semiconductor Equipment) | 40 | ||||||
| 4,086 | Microsoft Corp. (Software) | 1,390 | ||||||
| 66 | Mid-America Apartment Communities, Inc. (Residential REITs) | 10 | ||||||
| 30 | Mohawk Industries, Inc. (Household Durables)(b) | 3 | ||||||
| 35 | Molina Healthcare, Inc. (Health Care Providers & Services)(b) | 11 | ||||||
| 103 | Molson Coors Beverage Co., Class - B (Beverages) | 7 | ||||||
| 793 | Mondelez International, Inc., Class - A (Food Products) | 58 | ||||||
| 41 | MongoDB, Inc. (IT Services)(b) | 17 | ||||||
| 26 | Monolithic Power Systems, Inc. (Semiconductors & Semiconductor Equipment) | 14 | ||||||
| 446 | Monster Beverage Corp. (Beverages)(b) | 26 | ||||||
| 95 | Moody’s Corp. (Capital Markets) | 33 | ||||||
| 729 | Morgan Stanley (Capital Markets) | 62 | ||||||
| 95 | Motorola Solutions, Inc. (Communications Equipment) | 28 | ||||||
| 46 | MSCI, Inc. (Capital Markets) | 22 | ||||||
| 197 | Nasdaq, Inc. (Capital Markets) | 10 | ||||||
| 118 | NetApp, Inc. (Technology Hardware, Storage & Peripherals) | 9 | ||||||
Shares | Security Description | Value | ||||||
United States (continued) | ||||||||
| 257 | Netflix, Inc. (Entertainment)(b) | $ | 113 | |||||
| 59 | Neurocrine Biosciences, Inc. (Biotechnology)(b) | 6 | ||||||
| 475 | Newmont Corp. (Metals & Mining) | 20 | ||||||
| 235 | News Corp., Class - A (Media) | 5 | ||||||
| 1,174 | NextEra Energy, Inc. (Electric Utilities) | 87 | ||||||
| 713 | NIKE, Inc., Class - B (Textiles, Apparel & Luxury Goods) | 79 | ||||||
| 229 | NiSource, Inc. (Multi-Utilities) | 6 | ||||||
| 29 | Nordson Corp. (Machinery) | 7 | ||||||
| 131 | Norfolk Southern Corp. (Ground Transportation) | 30 | ||||||
| 120 | Northern Trust Corp. (Capital Markets) | 9 | ||||||
| 124 | NRG Energy, Inc. (Electric Utilities) | 5 | ||||||
| 148 | Nucor Corp. (Metals & Mining) | 24 | ||||||
| 1,428 | NVIDIA Corp. (Semiconductors & Semiconductor Equipment) | 603 | ||||||
| 2 | NVR, Inc. (Household Durables)(b) | 13 | ||||||
| 411 | Occidental Petroleum Corp. (Oil, Gas & Consumable Fuels) | 24 | ||||||
| 92 | Okta, Inc. (IT Services)(b) | 6 | ||||||
| 59 | Old Dominion Freight Line, Inc. (Ground Transportation) | 22 | ||||||
| 124 | Omnicom Group, Inc. (Media) | 12 | ||||||
| 245 | ON Semiconductor Corp. (Semiconductors & Semiconductor Equipment)(b) | 23 | ||||||
| 269 | ONEOK, Inc. (Oil, Gas & Consumable Fuels) | 17 | ||||||
| 934 | Oracle Corp. (Software) | 111 | ||||||
| 36 | O’Reilly Automotive, Inc. (Specialty Retail)(b) | 34 | ||||||
| 240 | Otis Worldwide Corp. (Machinery) | 21 | ||||||
| 126 | Ovintiv, Inc. (Oil, Gas & Consumable Fuels) | 5 | ||||||
| 54 | Owens Corning (Building Products) | 7 | ||||||
| 297 | PACCAR, Inc. (Machinery) | 25 | ||||||
| 48 | Packaging Corp. of America (Containers & Packaging) | 6 | ||||||
| 1,031 | Palantir Technologies, Inc., Class - A (Software)(b) | 16 | ||||||
| 173 | Palo Alto Networks, Inc. (Software)(b) | 44 | ||||||
| 291 | Paramount Global, Class - B (Media) | 5 | ||||||
| 74 | Parker-Hannifin Corp. (Machinery) | 29 | ||||||
| 183 | Paychex, Inc. (Professional Services) | 20 | ||||||
| 30 | Paycom Software, Inc. (Professional Services) | 10 | ||||||
| 22 | Paylocity Holding Corp. (Professional Services)(b) | 4 | ||||||
| 618 | PayPal Holdings, Inc. (Financial Services)(b) | 41 | ||||||
| 797 | PepsiCo, Inc. (Beverages) | 148 | ||||||
| 1,066 | PG&E Corp. (Electric Utilities)(b) | 18 | ||||||
| 261 | Phillips 66 (Oil, Gas & Consumable Fuels) | 25 | ||||||
| 344 | Pinterest, Inc., Class - A (Interactive Media & Services)(b) | 9 | ||||||
See accompanying notes to financial statements.
115
HC CAPITAL TRUST
The Catholic SRI Growth Portfolio
Portfolio of Investments (continued) — June 30, 2023
Shares | Security Description | Value | ||||||
Common Stocks (continued) | ||||||||
United States (continued) | ||||||||
| 134 | Pioneer Natural Resources Co. (Oil, Gas & Consumable Fuels) | $ | 28 | |||||
| 21 | Pool Corp. (Distributors) | 8 | ||||||
| 133 | PPG Industries, Inc. (Chemicals) | 20 | ||||||
| 451 | PPL Corp. (Electric Utilities) | 12 | ||||||
| 134 | Principal Financial Group, Inc. (Insurance) | 10 | ||||||
| 531 | Prologis, Inc. (Industrial REITs) | 65 | ||||||
| 205 | Prudential Financial, Inc. (Insurance) | 18 | ||||||
| 68 | PTC, Inc. (Software)(b) | 10 | ||||||
| 288 | Public Service Enterprise Group, Inc. (Multi-Utilities) | 18 | ||||||
| 91 | Public Storage (Specialized REITs) | 27 | ||||||
| 131 | PulteGroup, Inc. (Household Durables) | 10 | ||||||
| 54 | Qorvo, Inc. (Semiconductors & Semiconductor Equipment)(b) | 6 | ||||||
| 642 | QUALCOMM, Inc. (Semiconductors & Semiconductor Equipment) | 76 | ||||||
| 86 | Quanta Services, Inc. (Construction & Engineering) | 17 | ||||||
| 62 | Quest Diagnostics, Inc. (Health Care Providers & Services) | 9 | ||||||
| 114 | Raymond James Financial, Inc. (Capital Markets) | 12 | ||||||
| 376 | Realty Income Corp. (Retail REITs) | 22 | ||||||
| 83 | Regency Centers Corp. (Retail REITs) | 5 | ||||||
| 559 | Regions Financial Corp. (Banks) | 10 | ||||||
| 31 | Reliance Steel & Aluminum Co. (Metals & Mining) | 8 | ||||||
| 29 | Repligen Corp. (Life Sciences Tools & Services)(b) | 4 | ||||||
| 127 | Republic Services, Inc. (Commercial Services & Supplies) | 19 | ||||||
| 88 | ResMed, Inc. (Health Care Equipment & Supplies) | 19 | ||||||
| 408 | Rivian Automotive, Inc., Class - A (Automobile Components)(b) | 7 | ||||||
| 59 | Robert Half International, Inc. (Professional Services) | 4 | ||||||
| 255 | ROBLOX Corp., Class - A (Entertainment)(b) | 10 | ||||||
| 65 | Rockwell Automation, Inc. (Electrical Equipment) | 21 | ||||||
| 62 | Roku, Inc. (Entertainment)(b) | 4 | ||||||
| 149 | Rollins, Inc. (Commercial Services & Supplies) | 6 | ||||||
| 60 | Roper Technologies, Inc. (Software) | 29 | ||||||
| 200 | Ross Stores, Inc. (Specialty Retail) | 22 | ||||||
| 136 | Royal Caribbean Cruises Ltd. (Hotels, Restaurants & Leisure)(b) | 14 | ||||||
| 207 | Royalty Pharma PLC, Class - A (Pharmaceuticals) | 6 | ||||||
Shares | Security Description | Value | ||||||
United States (continued) | ||||||||
| 79 | RPM International, Inc. (Chemicals) | $ | 7 | |||||
| 190 | S&P Global, Inc. (Capital Markets) | 76 | ||||||
| 578 | Salesforce, Inc. (Software)(b) | 122 | ||||||
| 61 | SBA Communications Corp. (Specialized REITs) | 14 | ||||||
| 812 | Schlumberger N.V. (Energy Equipment & Services) | 40 | ||||||
| 99 | Seagate Technology Holdings PLC (Technology Hardware, Storage & Peripherals) | 6 | ||||||
| 81 | Seagen, Inc. (Biotechnology)(b) | 16 | ||||||
| 75 | Sealed Air Corp. (Containers & Packaging) | 3 | ||||||
| 64 | SEI Investments Co. (Capital Markets) | 4 | ||||||
| 186 | Sempra Energy (Multi-Utilities) | 27 | ||||||
| 95 | Sensata Technologies Holding PLC (Electrical Equipment) | 4 | ||||||
| 117 | ServiceNow, Inc. (Software)(b) | 66 | ||||||
| 187 | Simon Property Group, Inc. (Retail REITs) | 22 | ||||||
| 400 | Sirius XM Holdings, Inc. (Media)^ | 2 | ||||||
| 94 | Skyworks Solutions, Inc. (Semiconductors & Semiconductor Equipment) | 10 | ||||||
| 568 | Snap, Inc., Class - A (Interactive Media & Services)(b) | 7 | ||||||
| 33 | Snap-on, Inc. (Machinery) | 10 | ||||||
| 150 | Snowflake, Inc., Class - A (IT Services)(b) | 26 | ||||||
| 105 | Southwest Airlines Co. (Passenger Airlines) | 4 | ||||||
| 97 | Splunk, Inc. (Software)(b) | 10 | ||||||
| 122 | SS&C Technologies Holdings, Inc. (Professional Services) | 7 | ||||||
| 91 | Stanley Black & Decker, Inc. (Machinery) | 9 | ||||||
| 671 | Starbucks Corp. (Hotels, Restaurants & Leisure) | 66 | ||||||
| 195 | State Street Corp. (Capital Markets) | 14 | ||||||
| 93 | Steel Dynamics, Inc. (Metals & Mining) | 10 | ||||||
| 59 | STERIS PLC (Health Care Equipment & Supplies) | 13 | ||||||
| 199 | Stryker Corp. (Health Care Equipment & Supplies) | 61 | ||||||
| 76 | Sun Communities, Inc. (Residential REITs) | 10 | ||||||
| 256 | Synchrony Financial (Consumer Finance) | 9 | ||||||
| 88 | Synopsys, Inc. (Software)(b) | 38 | ||||||
| 302 | Sysco Corp. (Consumer Staples Distribution & Retail) | 22 | ||||||
| 129 | T. Rowe Price Group, Inc. (Capital Markets) | 14 | ||||||
| 95 | Take-Two Interactive Software, Inc. (Entertainment)(b) | 14 | ||||||
| 133 | Targa Resources Corp. (Oil, Gas & Consumable Fuels) | 10 | ||||||
| 265 | Target Corp. (Consumer Staples Distribution & Retail) | 35 | ||||||
See accompanying notes to financial statements.
116
HC CAPITAL TRUST
The Catholic SRI Growth Portfolio
Portfolio of Investments (continued) — June 30, 2023
Shares | Security Description | Value | ||||||
Common Stocks (continued) | ||||||||
United States (continued) | ||||||||
| 177 | TE Connectivity Ltd. (Electronic Equipment, Instruments & Components) | $ | 25 | |||||
| 29 | Teledyne Technologies, Inc. (Electronic Equipment, Instruments & Components)(b) | 12 | ||||||
| 30 | Teleflex, Inc. (Health Care Equipment & Supplies) | 7 | ||||||
| 94 | Teradyne, Inc. (Semiconductors & Semiconductor Equipment) | 10 | ||||||
| 1,649 | Tesla, Inc. (Automobile Components)(b) | 431 | ||||||
| 517 | Texas Instruments, Inc. (Semiconductors & Semiconductor Equipment) | 93 | ||||||
| 4 | Texas Pacific Land Corp. (Oil, Gas & Consumable Fuels) | 5 | ||||||
| 364 | The AES Corp. (Independent Power and Renewable Electricity Producers) | 8 | ||||||
| 151 | The Allstate Corp. (Insurance) | 16 | ||||||
| 462 | The Bank of New York Mellon Corp. (Capital Markets) | 21 | ||||||
| 130 | The Carlyle Group, Inc. (Capital Markets) | 4 | ||||||
| 861 | The Charles Schwab Corp. (Capital Markets) | 49 | ||||||
| 173 | The Cigna Group (Health Care Providers & Services) | 49 | ||||||
| 73 | The Clorox Co. (Household Products) | 12 | ||||||
| 2,378 | The Coca-Cola Co. (Beverages) | 143 | ||||||
| 137 | The Estee Lauder Cos., Inc. (Personal Care Products) | 27 | ||||||
| 194 | The Goldman Sachs Group, Inc. (Capital Markets) | 63 | ||||||
| 188 | The Hartford Financial Services Group, Inc. (Insurance) | 14 | ||||||
| 87 | The Hershey Co. (Food Products) | 22 | ||||||
| 588 | The Home Depot, Inc. (Specialty Retail) | 183 | ||||||
| 236 | The Interpublic Group of Cos., Inc. (Media) | 9 | ||||||
| 64 | The J.M. Smucker Co. (Food Products) | 9 | ||||||
| 450 | The Kraft Heinz Co. (Food Products) | 16 | ||||||
| 386 | The Kroger Co. (Consumer Staples Distribution & Retail) | 18 | ||||||
| 186 | The Mosaic Co. (Chemicals) | 7 | ||||||
| 230 | The PNC Financial Services Group, Inc. (Banks) | 29 | ||||||
| 343 | The Progressive Corp. (Insurance) | 45 | ||||||
| 144 | The Sherwin-Williams Co. (Chemicals) | 38 | ||||||
| 634 | The Southern Co. (Electric Utilities) | 45 | ||||||
| 669 | The TJX Cos., Inc. (Specialty Retail) | 57 | ||||||
| 62 | The Toro Co. (Machinery) | 6 | ||||||
| 255 | The Trade Desk, Inc., Class - A (Media)(b) | 20 | ||||||
| 135 | The Travelers Cos., Inc. (Insurance) | 23 | ||||||
| 1,054 | The Walt Disney Co. (Entertainment)(b) | 94 | ||||||
| 691 | The Williams Cos., Inc. (Oil, Gas & Consumable Fuels) | 23 | ||||||
Shares | Security Description | Value | ||||||
United States (continued) | ||||||||
| 351 | T-Mobile US, Inc. (Wireless Telecommunication Services)(b) | $ | 49 | |||||
| 200 | Toast, Inc., Class - A (Financial Services)(b) | 5 | ||||||
| 66 | Tractor Supply Co. (Specialty Retail) | 15 | ||||||
| 57 | Tradeweb Markets, Inc., Class - A (Capital Markets) | 4 | ||||||
| 32 | TransDigm Group, Inc. (Aerospace & Defense) | 29 | ||||||
| 116 | TransUnion (Professional Services) | 9 | ||||||
| 143 | Trimble, Inc. (Electronic Equipment, Instruments & Components)(b) | 8 | ||||||
| 788 | Truist Financial Corp. (Banks) | 24 | ||||||
| 108 | Twilio, Inc., Class - A (IT Services)(b) | 7 | ||||||
| 23 | Tyler Technologies, Inc. (Software)(b) | 10 | ||||||
| 173 | Tyson Foods, Inc., Class - A (Food Products) | 9 | ||||||
| 888 | U.S. Bancorp (Banks) | 29 | ||||||
| 1,045 | Uber Technologies, Inc. (Ground Transportation)(b) | 45 | ||||||
| 188 | UDR, Inc. (Residential REITs) | 8 | ||||||
| 110 | UGI Corp. (Gas Utilities) | 3 | ||||||
| 45 | U-Haul Holding Co. (Ground Transportation) | 2 | ||||||
| 240 | UiPath, Inc., Class - A (Software)(b) | 4 | ||||||
| 30 | Ulta Beauty, Inc. (Specialty Retail)(b) | 14 | ||||||
| 353 | Union Pacific Corp. (Ground Transportation) | 72 | ||||||
| 417 | United Parcel Service, Inc., Class - B (Air Freight & Logistics) | 75 | ||||||
| 39 | United Rentals, Inc. (Trading Companies & Distributors) | 17 | ||||||
| 27 | United Therapeutics Corp. (Biotechnology)(b) | 6 | ||||||
| 541 | UnitedHealth Group, Inc. (Health Care Providers & Services) | 259 | ||||||
| 142 | Unity Software, Inc. (Software)(b) | 6 | ||||||
| 34 | Universal Health Services, Inc., Class - B (Health Care Providers & Services) | 5 | ||||||
| 208 | V.F. Corp. (Textiles, Apparel & Luxury Goods) | 4 | ||||||
| 25 | Vail Resorts, Inc. (Hotels, Restaurants & Leisure) | 6 | ||||||
| 214 | Valero Energy Corp. (Oil, Gas & Consumable Fuels) | 25 | ||||||
| 85 | Veeva Systems, Inc., Class - A (Health Care Technology)(b) | 17 | ||||||
| 229 | Ventas, Inc. (Health Care REITs) | 11 | ||||||
| 54 | VeriSign, Inc. (IT Services)(b) | 12 | ||||||
| 83 | Verisk Analytics, Inc., Class - A (Professional Services) | 19 | ||||||
| 2,426 | Verizon Communications, Inc. (Diversified Telecommunication Services) | 90 | ||||||
| 595 | VICI Properties, Inc. (Specialized REITs) | 19 | ||||||
| 939 | Visa, Inc., Class - A (Financial Services) | 223 | ||||||
| 181 | Vistra Corp. (Independent Power and Renewable Electricity Producers) | 5 | ||||||
See accompanying notes to financial statements.
117
HC CAPITAL TRUST
The Catholic SRI Growth Portfolio
Portfolio of Investments (concluded) — June 30, 2023
Shares | Security Description | Value | ||||||
Common Stocks (continued) | ||||||||
United States (continued) | ||||||||
| 139 | VMware, Inc., Class - A (Software)(b) | $ | 20 | |||||
| 75 | Vulcan Materials Co. (Construction Materials) | 17 | ||||||
| 125 | W.R. Berkley Corp. (Insurance) | 7 | ||||||
| 26 | W.W. Grainger, Inc. (Trading Companies & Distributors) | 21 | ||||||
| 415 | Walgreens Boots Alliance, Inc. (Consumer Staples Distribution & Retail) | 12 | ||||||
| 856 | Walmart, Inc. (Consumer Staples Distribution & Retail) | 135 | ||||||
| 1,360 | Warner Bros. Discovery, Inc. (Entertainment)(b) | 17 | ||||||
| 233 | Waste Management, Inc. (Commercial Services & Supplies) | 40 | ||||||
| 36 | Waters Corp. (Life Sciences Tools & Services)(b) | 10 | ||||||
| 20 | Watsco, Inc. (Trading Companies & Distributors) | 8 | ||||||
| 93 | Webster Financial Corp. (Banks) | 4 | ||||||
| 181 | WEC Energy Group, Inc. (Multi-Utilities) | 16 | ||||||
| 2,179 | Wells Fargo & Co. (Banks) | 93 | ||||||
| 287 | Welltower, Inc. (Health Care REITs) | 23 | ||||||
| 44 | West Pharmaceutical Services, Inc. (Life Sciences Tools & Services) | 17 | ||||||
| 166 | Western Digital Corp. (Technology Hardware, Storage & Peripherals)(b) | 6 | ||||||
| 108 | Westinghouse Air Brake Technologies Corp. (Machinery) | 12 | ||||||
| 19 | Westlake Corp. (Chemicals) | 2 | ||||||
| 137 | Westrock Co. (Containers & Packaging) | 4 | ||||||
| 418 | Weyerhaeuser Co. (Specialized REITs) | 14 | ||||||
| 31 | Whirlpool Corp. (Household Durables) | 5 | ||||||
| 66 | Wolfspeed, Inc. (Semiconductors & Semiconductor Equipment)(b) | 4 | ||||||
| 119 | Workday, Inc., Class - A (Software)(b) | 27 | ||||||
| 123 | WP Carey, Inc. (Diversified REITs) | 8 | ||||||
| 55 | Wynn Resorts Ltd. (Hotels, Restaurants & Leisure) | 6 | ||||||
| 314 | Xcel Energy, Inc. (Electric Utilities) | 20 | ||||||
| 138 | Xylem, Inc. (Machinery) | 16 | ||||||
| 164 | Yum! Brands, Inc. (Hotels, Restaurants & Leisure) | 23 | ||||||
| 30 | Zebra Technologies Corp. (Electronic Equipment, Instruments & Components)(b) | 9 | ||||||
| 80 | Zillow Group, Inc., Class - C (Real Estate Management & Development)(b) | 4 | ||||||
| 116 | Zimmer Biomet Holdings, Inc. (Health Care Equipment & Supplies) | 17 | ||||||
| 269 | Zoetis, Inc. (Pharmaceuticals) | 46 | ||||||
| 129 | Zoom Video Communications, Inc., Class - A (Software)(b) | 9 | ||||||
Shares | Security Description | Value | ||||||
United States (continued) | ||||||||
| 144 | ZoomInfo Technologies, Inc. (Interactive Media & Services)(b) | $ | 4 | |||||
| 54 | Zscaler, Inc. (Software)(b) | 8 | ||||||
| 19,768 | ||||||||
Uruguay — 0.11% | ||||||||
| 26 | MercadoLibre, Inc. (Broadline Retail)(b) | 31 | ||||||
Total Common Stocks | 28,941 | |||||||
Investment Companies — 0.08% | ||||||||
| 2,361 | Federated Hermes Treasury Obligations Fund, Institutional Shares, 4.75%^^(d) | 2 | ||||||
| 20,053 | State Street Institutional Treasury Plus Money Market Fund, Trust Class, 4.97%(d) | 20 | ||||||
Total Investment Companies | 22 | |||||||
Total Investments (cost $19,357) — 99.68% | 28,963 | |||||||
Other assets in excess of liabilities — 0.32% | 93 | |||||||
Net Assets — 100.00% | $ | 29,056 | ||||||
Amounts designated as “—” are $0 or have been rounded to $0.
^ | All or part of this security was on loan as of June 30, 2023. |
^^ | Purchased with cash collateral held from securities lending. The value of the collateral could include collateral held for securities that were sold on or before June 30, 2023. |
(a) | Represents a security purchased under Rule 144A or Section 4(2) and is exempt from registration under the Securities Act of 1933, as amended, or is otherwise restricted to resale. Certain of these securities may be resold in transactions exempt from registration, normally to qualified institutional buyers. These securities have been deemed liquid by the Specialist Manager. |
(b) | Represents non-income producing security. |
(c) | Security was valued using significant unobservable inputs as of June 30, 2023. |
(d) | Annualized 7-day yield as of period-end. |
ADR—American Depositary Receipt |
REIT—Real Estate Investment Trust |
As of June 30, 2023, 100% of the Portfolio’s net assets were managed by Mellon Investments Corporation. |
See accompanying notes to financial statements.
118
HC CAPITAL TRUST
The International Equity Portfolio
Portfolio of Investments — June 30, 2023
Shares | Security Description | Value | ||||||
Common Stocks — 96.38% | ||||||||
Australia — 5.96% | ||||||||
| 15,521 | Ampol Ltd. (Oil, Gas & Consumable Fuels) | $ | 310 | |||||
| 193,458 | ANZ Group Holdings Ltd. (Banks) | 3,062 | ||||||
| 35,958 | APA Group (Gas Utilities) | 233 | ||||||
| 21,823 | Aristocrat Leisure Ltd. (Hotels, Restaurants & Leisure) | 564 | ||||||
| 82,839 | Bendigo & Adelaide Bank Ltd. (Banks) | 474 | ||||||
| 85,014 | BHP Group Ltd. (Metals & Mining) | 2,537 | ||||||
| 74,353 | BHP Group Ltd. (Metals & Mining) | 2,235 | ||||||
| 43,919 | Commonwealth Bank of Australia (Banks) | 2,940 | ||||||
| 3,480 | CSL Ltd. (Biotechnology) | 644 | ||||||
| 48,346 | Endeavour Group Ltd. (Consumer Staples Distribution & Retail) | 203 | ||||||
| 53,824 | Fortescue Metals Group Ltd. (Metals & Mining) | 799 | ||||||
| 68,557 | Goodman Group (Industrial REITs) | 921 | ||||||
| 19,437 | Lendlease Corp. Ltd. (Real Estate Management & Development)(a) | 101 | ||||||
| 7,899 | Macquarie Group Ltd. (Capital Markets) | 940 | ||||||
| 162,138 | Medibank Pvt. Ltd. (Insurance) | 381 | ||||||
| 206,900 | National Australia Bank Ltd. (Banks) | 3,638 | ||||||
| 41,245 | Qantas Airways Ltd. (Passenger Airlines)(b) | 171 | ||||||
| 55,092 | QBE Insurance Group Ltd. (Insurance) | 575 | ||||||
| 16,336 | Rio Tinto Ltd. (Metals & Mining) | 1,251 | ||||||
| 150,128 | Santos Ltd. (Oil, Gas & Consumable Fuels)(a) | 751 | ||||||
| 205,252 | Scentre Group (Retail REITs) | 363 | ||||||
| 90,538 | Stockland (Diversified REITs) | 243 | ||||||
| 18,427 | Suncorp Group Ltd. (Insurance) | 166 | ||||||
| 562,458 | Tabcorp Holdings Ltd. (Hotels, Restaurants & Leisure) | 417 | ||||||
| 562,458 | The Lottery Corp. Ltd. (Hotels, Restaurants & Leisure) | 1,928 | ||||||
| 44,996 | Treasury Wine Estates Ltd. (Beverages) | 337 | ||||||
| 63,839 | Wesfarmers Ltd. (Broadline Retail) | 2,104 | ||||||
| 224,539 | Westpac Banking Corp. (Banks) | 3,196 | ||||||
| 28,099 | Woodside Energy Group Ltd. (Oil, Gas & Consumable Fuels) | 650 | ||||||
| 35,740 | Worley Ltd. (Energy Equipment & Services) | 377 | ||||||
| 32,511 | ||||||||
Austria — 0.19% | ||||||||
| 23,927 | Erste Group Bank AG (Banks)(a) | 840 | ||||||
| 4,792 | OMV AG (Oil, Gas & Consumable Fuels) | 203 | ||||||
| 1,043 | ||||||||
Belgium — 0.51% | ||||||||
| 40,660 | Anheuser-Busch InBev SA/N.V. (Beverages) | 2,305 | ||||||
| 3,608 | Elia Group SA/N.V. (Electric Utilities)(a) | 458 | ||||||
| 2,763 | ||||||||
Canada — 10.41% | ||||||||
| 3,637 | Agnico Eagle Mines Ltd. (Metals & Mining) | 182 | ||||||
| 30,089 | Air Canada (Passenger Airlines)(a)(b) | 568 | ||||||
Shares | Security Description | Value | ||||||
Canada (continued) | ||||||||
| 166,444 | Algonquin Power & Utilities Corp. (Multi-Utilities) | $ | 1,376 | |||||
| 50,883 | Alimentation Couche-Tard, Inc. (Consumer Staples Distribution & Retail) | 2,609 | ||||||
| 8,987 | AltaGas Ltd. (Gas Utilities) | 161 | ||||||
| 45,514 | Bank of Montreal (Banks) | 4,111 | ||||||
| 10,168 | CAE, Inc. (Aerospace & Defense)(b) | 228 | ||||||
| 31,854 | Cameco Corp. (Oil, Gas & Consumable Fuels) | 998 | ||||||
| 4,917 | Canadian National Railway Co. (Ground Transportation) | 595 | ||||||
| 55,707 | Canadian Natural Resources Ltd. (Oil, Gas & Consumable Fuels) | 3,132 | ||||||
| 3,130 | Canadian Pacific Kansas City Ltd. (Ground Transportation) | 253 | ||||||
| 11,085 | Canadian Tire Corp. Ltd., Class - A (Broadline Retail) | 1,516 | ||||||
| 4,454 | Canadian Utilities Ltd., Class - A (Multi-Utilities) | 115 | ||||||
| 3,259 | CCL Industries, Inc., Class - B (Containers & Packaging)(a) | 160 | ||||||
| 125,033 | Cenovus Energy, Inc. (Oil, Gas & Consumable Fuels) | 2,124 | ||||||
| 835 | Constellation Software, Inc. (Software) | 1,730 | ||||||
| 11,192 | Dollarama, Inc. (Broadline Retail) | 758 | ||||||
| 77,385 | Enbridge, Inc. (Oil, Gas & Consumable Fuels) | 2,877 | ||||||
| 1,023 | Fairfax Financial Holdings Ltd. (Insurance) | 766 | ||||||
| 10,649 | First Capital Real Estate Investment Trust (Retail REITs) | 118 | ||||||
| 17,917 | First Quantum Minerals Ltd. (Metals & Mining) | 424 | ||||||
| 7,691 | Franco-Nevada Corp. (Metals & Mining) | 1,096 | ||||||
| 24,142 | GFL Environmental, Inc. (Commercial Services & Supplies) | 937 | ||||||
| 64,358 | Great-West Lifeco, Inc. (Insurance) | 1,869 | ||||||
| 27,914 | H&R Real Estate Investment Trust (Diversified REITs) | 216 | ||||||
| 12,464 | Hydro One Ltd. (Electric Utilities)(a) | 356 | ||||||
| 5,430 | Intact Financial Corp. (Insurance) | 838 | ||||||
| 56,358 | Keyera Corp. (Oil, Gas & Consumable Fuels) | 1,300 | ||||||
| 2,505 | Lumine Group, Inc. (Software)(b) | 34 | ||||||
| 36,396 | Magna International, Inc. (Automobile Components) | 2,055 | ||||||
| 8,370 | Manulife Financial Corp. (Insurance) | 158 | ||||||
| 15,818 | Methanex Corp. (Chemicals) | 654 | ||||||
| 18,402 | National Bank of Canada (Banks) | 1,371 | ||||||
| 3,339 | Nutrien Ltd. (Chemicals) | 197 | ||||||
| 1,984 | Onex Corp. (Financial Services) | 110 | ||||||
| 7,732 | Pembina Pipeline Corp. (Oil, Gas & Consumable Fuels) | 243 | ||||||
| 66,482 | Power Corp. of Canada (Insurance) | 1,790 | ||||||
| 6,978 | Primaris Real Estate Investment Trust (Retail REITs) | 71 | ||||||
See accompanying notes to financial statements.
119
HC CAPITAL TRUST
The International Equity Portfolio
Portfolio of Investments (continued) — June 30, 2023
Shares | Security Description | Value | ||||||
Common Stocks (continued) | ||||||||
Canada (continued) | ||||||||
| 4,162 | RB Global, Inc. (Commercial Services & Supplies) | $ | 250 | |||||
| 1,726 | Restaurant Brands International, Inc. (Hotels, Restaurants & Leisure) | 134 | ||||||
| 67,963 | RioCan Real Estate Investment Trust (Diversified REITs)(a) | 989 | ||||||
| 2,933 | Rogers Communications, Inc., Class - B (Wireless Telecommunication Services) | 134 | ||||||
| 13,879 | Royal Bank of Canada (Banks) | 1,326 | ||||||
| 52,851 | Shopify, Inc., Class - A (IT Services)(b) | 3,416 | ||||||
| 7,087 | SmartCentres Real Estate Investment Trust (Retail REITs) | 130 | ||||||
| 52,951 | Sun Life Financial, Inc. (Insurance) | 2,761 | ||||||
| 5,745 | Suncor Energy, Inc. (Oil, Gas & Consumable Fuels) | 169 | ||||||
| 18,439 | Teck Resources Ltd., Class - B (Metals & Mining) | 776 | ||||||
| 72,937 | TELUS Corp. (Diversified Telecommunication Services) | 1,420 | ||||||
| 36,696 | The Bank of Nova Scotia (Banks) | 1,836 | ||||||
| 19,231 | The Toronto-Dominion Bank (Banks) | 1,192 | ||||||
| 21,648 | Thomson Reuters Corp. (Professional Services) | 2,923 | ||||||
| 28,308 | Wheaton Precious Metals Corp. (Metals & Mining) | 1,224 | ||||||
| 56,776 | ||||||||
Denmark — 2.88% | ||||||||
| 5,336 | DSV A/S (Air Freight & Logistics) | 1,121 | ||||||
| 8,761 | Genmab A/S (Biotechnology)(a)(b) | 3,321 | ||||||
| 69,725 | Novo Nordisk A/S, Class - B (Pharmaceuticals) | 11,264 | ||||||
| 15,706 | ||||||||
Finland — 1.04% | ||||||||
| 4,331 | Elisa Oyj (Diversified Telecommunication Services) | 231 | ||||||
| 8,545 | Fortum Oyj (Electric Utilities) | 114 | ||||||
| 8,315 | Kesko Oyj, Class - B (Consumer Staples Distribution & Retail) | 157 | ||||||
| 231,473 | Nokia Oyj (Communications Equipment) | 970 | ||||||
| 278,699 | Nordea Bank Abp (Banks) | 3,037 | ||||||
| 3,545 | Orion Oyj, Class - B (Pharmaceuticals) | 147 | ||||||
| 4,385 | Sampo Oyj, A Shares (Insurance) | 197 | ||||||
| 44,232 | Stora Enso Oyj, Registered Shares (Paper & Forest Products) | 513 | ||||||
| 10,204 | UPM-Kymmene Oyj (Paper & Forest Products) | 304 | ||||||
| 5,670 | ||||||||
France — 10.65% | ||||||||
| 2,427 | Aeroports de Paris (Transportation Infrastructure) | 349 | ||||||
| 34,180 | Air Liquide SA (Chemicals) | 6,128 | ||||||
Shares | Security Description | Value | ||||||
France (continued) | ||||||||
| 23,149 | Airbus SE (Aerospace & Defense) | $ | 3,347 | |||||
| 47,723 | AXA SA (Insurance) | 1,410 | ||||||
| 1,813 | BioMerieux (Health Care Equipment & Supplies) | 190 | ||||||
| 64,169 | BNP Paribas SA (Banks) | 4,049 | ||||||
| 4,957 | Bouygues SA (Construction & Engineering) | 167 | ||||||
| 1,044 | Capgemini SE (IT Services) | 198 | ||||||
| 7,205 | Carrefour SA (Consumer Staples Distribution & Retail)(a) | 137 | ||||||
| 3,697 | Cie de Saint-Gobain (Building Products) | 225 | ||||||
| 99,973 | Credit Agricole SA (Banks) | 1,187 | ||||||
| 19,644 | Dassault Systemes SE (Software) | 870 | ||||||
| 1,749 | Eiffage SA (Construction & Engineering)(a) | 183 | ||||||
| 25,532 | Engie SA (Multi-Utilities) | 425 | ||||||
| 18,607 | EssilorLuxottica SA (Health Care Equipment & Supplies) | 3,508 | ||||||
| 2,933 | Eurazeo SE (Financial Services) | 206 | ||||||
| 1,743 | Euroapi SA (Pharmaceuticals)(b) | 20 | ||||||
| 1,233 | Gecina SA (Office REITs)(a) | 132 | ||||||
| 2,454 | Hermes International (Textiles, Apparel & Luxury Goods) | 5,334 | ||||||
| 10,625 | L’Oreal SA (Personal Care Products) | 4,956 | ||||||
| 5,480 | LVMH Moet Hennessy Louis Vuitton SE (Textiles, Apparel & Luxury Goods) | 5,167 | ||||||
| 8,063 | Pernod Ricard SA (Beverages) | 1,782 | ||||||
| 8,075 | Publicis Groupe SA (Media) | 648 | ||||||
| 7,261 | Renault SA (Automobile Components) | 306 | ||||||
| 40,107 | Sanofi (Pharmaceuticals) | 4,317 | ||||||
| 34,976 | Schneider Electric SE (Electrical Equipment)(a) | 6,353 | ||||||
| 112,087 | Societe Generale SA (Banks) | 2,915 | ||||||
| 4,176 | Thales SA (Aerospace & Defense) | 626 | ||||||
| 32,412 | TotalEnergies SE (Oil, Gas & Consumable Fuels) | 1,860 | ||||||
| 7,086 | Unibail-Rodamco-Westfield (Retail REITs)(b) | 374 | ||||||
| 15,933 | Veolia Environnement SA (Multi-Utilities) | 504 | ||||||
| 1,976 | Wendel SE (Financial Services) | 203 | ||||||
| 58,076 | ||||||||
Germany — 7.40% | ||||||||
| 13,053 | adidas AG (Textiles, Apparel & Luxury Goods) | 2,534 | ||||||
| 10,077 | Allianz SE, Registered Shares (Insurance) | 2,347 | ||||||
| 1,793 | Bayerische Motoren Werke AG (Automobile Components) | 221 | ||||||
| 1,065 | Beiersdorf AG (Personal Care Products) | 141 | ||||||
| 1,341 | Carl Zeiss Meditec AG, Class - BR (Health Care Equipment & Supplies) | 145 | ||||||
| 33,975 | Commerzbank AG (Banks) | 377 | ||||||
| 2,692 | Covestro AG (Chemicals)(b) | 140 | ||||||
| 1,439 | Daimler Truck Holding AG (Machinery) | 52 | ||||||
| 5,231 | Delivery Hero SE (Hotels, Restaurants & Leisure)(b) | 231 | ||||||
See accompanying notes to financial statements.
120
HC CAPITAL TRUST
The International Equity Portfolio
Portfolio of Investments (continued) — June 30, 2023
Shares | Security Description | Value | ||||||
Common Stocks (continued) | ||||||||
Germany (continued) | ||||||||
| 113,622 | Deutsche Bank AG, Registered Shares (Capital Markets) | $ | 1,194 | |||||
| 21,575 | Deutsche Boerse AG (Capital Markets) | 3,983 | ||||||
| 128,506 | Deutsche Telekom AG (Diversified Telecommunication Services)(a) | 2,804 | ||||||
| 88,039 | DHL Group (Air Freight & Logistics) | 4,301 | ||||||
| 7,498 | Fraport AG Frankfurt Airport Services Worldwide (Transportation Infrastructure)(b) | 400 | ||||||
| 6,983 | GEA Group AG (Machinery) | 292 | ||||||
| 1,115 | Hannover Rueck SE (Insurance) | 237 | ||||||
| 3,464 | Henkel AG & Co. KGaA (Household Products) | 244 | ||||||
| 82,230 | Infineon Technologies AG (Semiconductors & Semiconductor Equipment)(a) | 3,386 | ||||||
| 1,793 | MTU Aero Engines AG (Aerospace & Defense) | 465 | ||||||
| 2,540 | Muenchener Rueckversicherungs-Gesellschaft AG in Muenchen, Registered Shares (Insurance) | 953 | ||||||
| 4,661 | Porsche Automobil Holding SE, Preference Shares (Automobile Components)(b) | 281 | ||||||
| 20,979 | RWE AG (Independent Power and Renewable Electricity Producers) | 914 | ||||||
| 42,196 | SAP SE (Software) | 5,763 | ||||||
| 2,330 | Sartorius AG, Preference Shares (Life Sciences Tools & Services) | 807 | ||||||
| 30,321 | Siemens AG, Registered Shares (Industrial Conglomerates) | 5,054 | ||||||
| 5,796 | Siemens Healthineers AG (Health Care Equipment & Supplies) | 328 | ||||||
| 10,266 | Symrise AG (Chemicals)(a) | 1,076 | ||||||
| 12,574 | Volkswagen AG, Preference Shares (Automobile Components) | 1,691 | ||||||
| 40,361 | ||||||||
Hong Kong — 2.08% | ||||||||
| 483,480 | AIA Group Ltd. (Insurance) | 4,911 | ||||||
| 75,055 | BOC Hong Kong Holdings Ltd. (Banks) | 230 | ||||||
| 63,400 | Budweiser Brewing Co. APAC Ltd. (Beverages) | 164 | ||||||
| 334,000 | China Common Rich Renewable Energy Investment Ltd. (Independent Power and Renewable Electricity Producers)(b)(c) | — | ||||||
| 98,500 | CK Asset Holdings Ltd. (Real Estate Management & Development) | 547 | ||||||
| 14,500 | CLP Holdings Ltd. (Electric Utilities) | 113 | ||||||
| 61,600 | ESR Group Ltd. (Real Estate Management & Development) | 106 | ||||||
| 73,000 | Galaxy Entertainment Group Ltd. (Hotels, Restaurants & Leisure)(b) | 465 | ||||||
Shares | Security Description | Value | ||||||
Hong Kong (continued) | ||||||||
| 15,506 | Hang Seng Bank Ltd. (Banks) | $ | 221 | |||||
| 20,900 | Hong Kong Exchanges & Clearing Ltd. (Capital Markets) | 792 | ||||||
| 335,900 | Hongkong Land Holdings Ltd. (Real Estate Management & Development) | 1,313 | ||||||
| 9,100 | Jardine Matheson Holdings Ltd. (Industrial Conglomerates) | 461 | ||||||
| 59,417 | Link REIT (Retail REITs) | 331 | ||||||
| 14,472 | Pacific Century Premium Developments Ltd. (Real Estate Management & Development)(b) | 1 | ||||||
| 121,391 | PCCW Ltd. (Diversified Telecommunication Services) | 63 | ||||||
| 59,768 | Prudential PLC (Insurance) | 844 | ||||||
| 24,000 | Swire Pacific Ltd., Class - A (Real Estate Management & Development) | 184 | ||||||
| 52,000 | Techtronic Industries Co. Ltd. (Machinery) | 569 | ||||||
| 11,315 | ||||||||
Ireland (Republic of) — 1.23% | ||||||||
| 8,728 | AerCap Holdings N.V. (Trading Companies & Distributors)(b) | 554 | ||||||
| 332,317 | Bank of Ireland Group PLC (Banks) | 3,172 | ||||||
| 24,053 | CRH PLC (Construction Materials)(a) | 1,327 | ||||||
| 30,741 | Experian PLC (Professional Services) | 1,180 | ||||||
| 16,821 | James Hardie Industries PLC (Construction Materials) | 449 | ||||||
| 6,682 | ||||||||
Israel — 0.52% | ||||||||
| 862 | CyberArk Software Ltd. (Software)(b) | 135 | ||||||
| 11,201 | Nice Ltd., ADR (Software)(b) | 2,312 | ||||||
| 1,765 | Nice Ltd. (Software)(b) | 364 | ||||||
| 2,811 | ||||||||
Italy — 1.47% | ||||||||
| 3,755 | Amplifon SpA (Health Care Providers & Services) | 138 | ||||||
| 69,888 | Assicurazioni Generali SpA (Insurance) | 1,421 | ||||||
| 47,935 | Enel SpA (Electric Utilities)(a) | 323 | ||||||
| 1,561 | Ferrari N.V. (Automobiles) | 510 | ||||||
| 157,139 | Intesa Sanpaolo SpA (Banks)(a) | 412 | ||||||
| 7,820 | Iveco Group N.V. (Machinery)(b) | 71 | ||||||
| 187,061 | Mediobanca Banca di Credito Finanziario SpA (Banks) | 2,239 | ||||||
| 7,356 | Moncler SpA (Textiles, Apparel & Luxury Goods) | 509 | ||||||
| 10,481 | Poste Italiane SpA (Insurance) | 114 | ||||||
| 110,979 | Snam SpA (Gas Utilities) | 580 | ||||||
| 201,736 | Terna - Rete Elettrica Nazionale (Electric Utilities) | 1,720 | ||||||
| 8,037 | ||||||||
See accompanying notes to financial statements.
121
HC CAPITAL TRUST
The International Equity Portfolio
Portfolio of Investments (continued) — June 30, 2023
Shares | Security Description | Value | ||||||
Common Stocks (continued) | ||||||||
Japan — 19.14% | ||||||||
| 2,900 | Advantest Corp. (Semiconductors & Semiconductor Equipment)(a) | $ | 391 | |||||
| 19,900 | Aeon Co. Ltd. (Consumer Staples Distribution & Retail) | 408 | ||||||
| 6,845 | AGC, Inc. (Building Products) | 246 | ||||||
| 4,500 | Aisin Corp. (Automobile Components) | 139 | ||||||
| 27,300 | Ajinomoto Co., Inc. (Food Products) | 1,088 | ||||||
| 15,300 | Amada Co. Ltd. (Machinery) | 151 | ||||||
| 5,100 | ANA Holdings, Inc. (Passenger Airlines)(a)(b) | 121 | ||||||
| 16,500 | Asahi Group Holdings Ltd. (Beverages)(a) | 640 | ||||||
| 5,900 | Asahi Intecc Co. Ltd. (Health Care Equipment & Supplies) | 116 | ||||||
| 103,600 | Astellas Pharma, Inc. (Pharmaceuticals) | 1,543 | ||||||
| 3,900 | Azbil Corp. (Electronic Equipment, Instruments & Components) | 123 | ||||||
| 80,100 | Bandai Namco Holdings, Inc. (Leisure Products) | 1,855 | ||||||
| 15,200 | Bridgestone Corp. (Automobile Components) | 625 | ||||||
| 38,300 | Canon, Inc. (Technology Hardware, Storage & Peripherals) | 1,007 | ||||||
| 4,300 | Capcom Co. Ltd. (Entertainment) | 170 | ||||||
| 900 | Central Japan Railway Co. (Ground Transportation) | 113 | ||||||
| 11,800 | Chubu Electric Power Co., Inc. (Electric Utilities) | 144 | ||||||
| 363,700 | Concordia Financial Group Ltd. (Banks) | 1,422 | ||||||
| 13,388 | Dai Nippon Printing Co. Ltd. (Commercial Services & Supplies) | 380 | ||||||
| 58,800 | Daifuku Co. Ltd. (Machinery) | 1,211 | ||||||
| 40,900 | Dai-ichi Life Holdings, Inc. (Insurance) | 778 | ||||||
| 24,200 | Daiichi Sankyo Co. Ltd. (Pharmaceuticals) | 769 | ||||||
| 14,400 | Daikin Industries Ltd. (Building Products) | 2,951 | ||||||
| 1,979 | Daito Trust Construction Co. Ltd. (Real Estate Management & Development) | 201 | ||||||
| 15,550 | Daiwa House Industry Co. Ltd. (Real Estate Management & Development) | 411 | ||||||
| 3,000 | Denso Corp. (Automobile Components) | 202 | ||||||
| 4,800 | Dentsu Group, Inc. (Media) | 158 | ||||||
| 7,700 | Eisai Co. Ltd. (Pharmaceuticals) | 522 | ||||||
| 30,000 | ENEOS Holdings, Inc. (Oil, Gas & Consumable Fuels) | 103 | ||||||
| 3,100 | FANUC Corp. (Machinery) | 109 | ||||||
| 2,400 | Fast Retailing Co. Ltd. (Specialty Retail) | 616 | ||||||
| 3,900 | Fuji Electric Co. Ltd. (Electrical Equipment) | 172 | ||||||
| 8,400 | FUJIFILM Holdings Corp. (Technology Hardware, Storage & Peripherals) | 501 | ||||||
| 10,900 | Fujitsu Ltd. (IT Services)(a) | 1,412 | ||||||
| 1,900 | GMO Payment Gateway, Inc. (Financial Services) | 149 | ||||||
Shares | Security Description | Value | ||||||
Japan (continued) | ||||||||
| 11,800 | Hakuhodo DY Holdings, Inc. (Media) | $ | 125 | |||||
| 37,100 | Hitachi Ltd. (Industrial Conglomerates) | 2,307 | ||||||
| 16,100 | Honda Motor Co. Ltd. (Automobile Components) | 488 | ||||||
| 3,600 | Hoshizaki Corp. (Machinery) | 129 | ||||||
| 25,800 | Hoya Corp. (Health Care Equipment & Supplies) | 3,088 | ||||||
| 8,800 | Iida Group Holdings Co. Ltd. (Household Durables) | 149 | ||||||
| 39,100 | Inpex Corp. (Oil, Gas & Consumable Fuels) | 430 | ||||||
| 22,100 | Isetan Mitsukoshi Holdings Ltd. (Broadline Retail) | 225 | ||||||
| 21,000 | Isuzu Motors Ltd. (Automobile Components) | 255 | ||||||
| 100,617 | ITOCHU Corp. (Trading Companies & Distributors) | 3,996 | ||||||
| 24,200 | Japan Airlines Co. Ltd. (Passenger Airlines)(a) | 525 | ||||||
| 70,600 | Japan Exchange Group, Inc. (Capital Markets) | 1,236 | ||||||
| 8,300 | Japan Post Insurance Co. Ltd. (Insurance)(a) | 125 | ||||||
| 5,554 | JSR Corp. (Chemicals) | 160 | ||||||
| 14,100 | Kao Corp. (Personal Care Products) | 512 | ||||||
| 9,200 | Kawasaki Heavy Industries Ltd. (Machinery) | 236 | ||||||
| 101,200 | KDDI Corp. (Wireless Telecommunication Services) | 3,125 | ||||||
| 33,900 | Keio Corp. (Ground Transportation) | 1,066 | ||||||
| 6,500 | Keyence Corp. (Electronic Equipment, Instruments & Components) | 3,089 | ||||||
| 4,400 | Kikkoman Corp. (Food Products) | 251 | ||||||
| 4,500 | Kobe Bussan Co. Ltd. (Consumer Staples Distribution & Retail) | 117 | ||||||
| 6,300 | Koito Manufacturing Co. Ltd. (Automobile Components) | 114 | ||||||
| 8,145 | Komatsu Ltd. (Machinery) | 220 | ||||||
| 12,300 | Kose Corp. (Personal Care Products) | 1,183 | ||||||
| 6,000 | Lasertec Corp. (Semiconductors & Semiconductor Equipment) | 907 | ||||||
| 22,200 | Makita Corp. (Machinery) | 628 | ||||||
| 63,300 | Marubeni Corp. (Trading Companies & Distributors) | 1,079 | ||||||
| 43,300 | Mazda Motor Corp. (Automobile Components) | 419 | ||||||
| 6,700 | MEIJI Holdings Co. Ltd. (Food Products) | 150 | ||||||
| 57,145 | Mitsubishi Corp. (Trading Companies & Distributors) | 2,763 | ||||||
| 34,200 | Mitsubishi Estate Co. Ltd. (Real Estate Management & Development) | 406 | ||||||
| 9,700 | Mitsubishi Heavy Industries Ltd. (Machinery) | 453 | ||||||
| 432,200 | Mitsubishi UFJ Financial Group, Inc. (Banks) | 3,185 | ||||||
| 131,788 | Mitsui & Co. Ltd. (Trading Companies & Distributors) | 4,987 | ||||||
| 36,100 | Mitsui Fudosan Co. Ltd. (Real Estate Management & Development) | 720 | ||||||
| 20,600 | Mitsui O.S.K. Lines Ltd. (Marine Transportation) | 496 | ||||||
See accompanying notes to financial statements.
122
HC CAPITAL TRUST
The International Equity Portfolio
Portfolio of Investments (continued) — June 30, 2023
Shares | Security Description | Value | ||||||
Common Stocks (continued) | ||||||||
Japan (continued) | ||||||||
| 47,200 | Murata Manufacturing Co. Ltd. (Electronic Equipment, Instruments & Components) | $ | 2,711 | |||||
| 14,700 | NEC Corp. (IT Services) | 713 | ||||||
| 20,600 | Nexon Co. Ltd. (Entertainment) | 395 | ||||||
| 14,100 | Nihon M&A Center Holdings, Inc. (Professional Services) | 108 | ||||||
| 19,200 | Nikon Corp. (Household Durables) | 249 | ||||||
| 2,800 | NIPPON EXPRESS HOLDINGS, INC. (Air Freight & Logistics) | 158 | ||||||
| 56 | Nippon Prologis REIT, Inc. (Industrial REITs)(a) | 113 | ||||||
| 6,300 | Nippon Sanso Holdings Corp. (Chemicals) | 137 | ||||||
| 30,800 | Nippon Steel Corp. (Metals & Mining)(a) | 645 | ||||||
| 910,000 | Nippon Telegraph & Telephone Corp. (Diversified Telecommunication Services) | 1,077 | ||||||
| 15,400 | Nippon Yusen KK (Marine Transportation) | 342 | ||||||
| 3,800 | Nissan Chemical Corp. (Chemicals) | 164 | ||||||
| 70,600 | Nissan Motor Co. Ltd. (Automobile Components) | 290 | ||||||
| 8,800 | Nisshin Seifun Group, Inc. (Food Products) | 109 | ||||||
| 4,600 | Nomura Real Estate Holdings, Inc. (Real Estate Management & Development) | 109 | ||||||
| 129 | Nomura Real Estate Master Fund, Inc. (Diversified REITs) | 149 | ||||||
| 17,800 | Nomura Research Institute Ltd. (IT Services) | 492 | ||||||
| 2,400 | Obic Co. Ltd. (IT Services) | 385 | ||||||
| 89,200 | Odakyu Electric Railway Co. Ltd. (Ground Transportation) | 1,195 | ||||||
| 10,400 | Omron Corp. (Electronic Equipment, Instruments & Components) | 639 | ||||||
| 2,900 | Oriental Land Co. Ltd. (Hotels, Restaurants & Leisure) | 113 | ||||||
| 10,800 | ORIX Corp. (Financial Services) | 197 | ||||||
| 8,900 | Osaka Gas Co. Ltd. (Gas Utilities) | 136 | ||||||
| 29,200 | Otsuka Holdings Co. Ltd. (Pharmaceuticals) | 1,071 | ||||||
| 12,700 | Pan Pacific International Holdings Corp. (Broadline Retail) | 227 | ||||||
| 156,600 | Panasonic Holdings Corp. (Household Durables) | 1,920 | ||||||
| 43,800 | Recruit Holdings Co. Ltd. (Professional Services) | 1,398 | ||||||
| 5,600 | Rohm Co. Ltd. (Semiconductors & Semiconductor Equipment) | 531 | ||||||
| 20,900 | SBI Holdings, Inc. (Capital Markets) | 403 | ||||||
| 35,552 | Sekisui House Ltd. (Household Durables) | 718 | ||||||
| 2,400 | Seven & i Holdings Co. Ltd. (Consumer Staples Distribution & Retail) | 104 | ||||||
| 46,500 | Shin-Etsu Chemical Co. Ltd. (Chemicals) | 1,554 | ||||||
| 5,600 | Shiseido Co. Ltd. (Personal Care Products) | 254 | ||||||
Shares | Security Description | Value | ||||||
Japan (continued) | ||||||||
| 200 | SMC Corp. (Machinery) | $ | 111 | |||||
| 12,800 | Sompo Holdings, Inc. (Insurance) | 574 | ||||||
| 30,600 | Sony Group Corp. (Household Durables) | 2,763 | ||||||
| 23,900 | Subaru Corp. (Automobile Components) | 450 | ||||||
| 14,148 | Sumitomo Mitsui Financial Group, Inc. (Banks) | 606 | ||||||
| 4,800 | Sumitomo Realty & Development Co. Ltd. (Real Estate Management & Development) | 119 | ||||||
| 4,600 | Suntory Beverage & Food Ltd. (Beverages) | 167 | ||||||
| 3,000 | Suzuki Motor Corp. (Automobile Components) | 109 | ||||||
| 1,600 | Sysmex Corp. (Health Care Equipment & Supplies) | 110 | ||||||
| 8,500 | T&D Holdings, Inc. (Insurance) | 125 | ||||||
| 25,000 | Takeda Pharmaceutical Co. Ltd. (Pharmaceuticals) | 786 | ||||||
| 19,600 | Terumo Corp. (Health Care Equipment & Supplies) | 624 | ||||||
| 2,900 | The Bank of Kyoto Ltd. (Banks) | 145 | ||||||
| 22,400 | The Chiba Bank Ltd. (Banks) | 136 | ||||||
| 29,700 | Tokio Marine Holdings, Inc. (Insurance) | 685 | ||||||
| 80,800 | Tokyo Electric Power Co. Holdings, Inc. (Electric Utilities)(b) | 296 | ||||||
| 26,400 | Tokyo Electron Ltd. (Semiconductors & Semiconductor Equipment) | 3,802 | ||||||
| 25,700 | Tokyu Fudosan Holdings Corp. (Real Estate Management & Development) | 147 | ||||||
| 52,600 | Toray Industries, Inc. (Chemicals) | 293 | ||||||
| 14,700 | Toshiba Corp. (Industrial Conglomerates) | 461 | ||||||
| 21,600 | Toyota Industries Corp. (Machinery) | 1,548 | ||||||
| 485,000 | Toyota Motor Corp. (Automobile Components) | 7,795 | ||||||
| 6,770 | Toyota Tsusho Corp. (Trading Companies & Distributors) | 338 | ||||||
| 6,427 | Trend Micro, Inc. (Software) | 311 | ||||||
| 46,400 | Unicharm Corp. (Household Products) | 1,726 | ||||||
| 4,900 | Welcia Holdings Co. Ltd. (Consumer Staples Distribution & Retail) | 102 | ||||||
| 7,700 | West Japan Railway Co. (Ground Transportation)(a) | 320 | ||||||
| 1,700 | Yakult Honsha Co. Ltd. (Food Products) | 108 | ||||||
| 8,700 | Yamato Holdings Co. Ltd. (Air Freight & Logistics) | 158 | ||||||
| 72,900 | Z Holdings Corp. (Interactive Media & Services) | 176 | ||||||
| 5,700 | ZOZO, Inc. (Specialty Retail)(a) | 118 | ||||||
| 104,306 | ||||||||
Luxembourg — 0.40% | ||||||||
| 27,423 | ArcelorMittal SA (Metals & Mining) | 748 | ||||||
| 96,377 | Tenaris SA (Energy Equipment & Services) | 1,442 | ||||||
| 2,190 | ||||||||
See accompanying notes to financial statements.
123
HC CAPITAL TRUST
The International Equity Portfolio
Portfolio of Investments (continued) — June 30, 2023
Shares | Security Description | Value | ||||||
Common Stocks (continued) | ||||||||
Netherlands — 4.31% | ||||||||
| 57,506 | ABN AMRO Bank N.V. (Banks) | $ | 894 | |||||
| 722 | Adyen N.V. (Professional Services)(a)(b) | 1,250 | ||||||
| 73,595 | Aegon N.V. (Insurance) | 374 | ||||||
| 29,390 | Akzo Nobel N.V. (Chemicals) | 2,402 | ||||||
| 728 | Argenx SE (Biotechnology)(b) | 284 | ||||||
| 12,374 | ASML Holding N.V. (Semiconductors & Semiconductor Equipment)(a) | 8,974 | ||||||
| 4,144 | EXOR N.V. (Financial Services) | 370 | ||||||
| 5,408 | Heineken N.V. (Beverages) | 556 | ||||||
| 14,622 | ING Groep N.V. (Banks) | 197 | ||||||
| 61,918 | Koninklijke Ahold Delhaize N.V. (Consumer Staples Distribution & Retail) | 2,111 | ||||||
| 35,844 | Prosus N.V. (Broadline Retail)(a) | 2,625 | ||||||
| 87,671 | Stellantis N.V. (Automobile Components) | 1,541 | ||||||
| 1,552 | Topicus.com, Inc. (Software)(b) | 127 | ||||||
| 15,791 | Universal Music Group N.V. (Entertainment) | 351 | ||||||
| 11,488 | Wolters Kluwer N.V. (Professional Services) | 1,459 | ||||||
| 23,515 | ||||||||
New Zealand — 0.14% | ||||||||
| 58,346 | Auckland International Airport Ltd. (Transportation Infrastructure)(b) | 307 | ||||||
| 38,532 | Mercury NZ Ltd. (Electric Utilities) | 154 | ||||||
| 31,188 | Meridian Energy Ltd. (Independent Power and Renewable Electricity Producers) | 107 | ||||||
| 57,025 | Spark New Zealand Ltd. (Diversified Telecommunication Services) | 178 | ||||||
| 746 | ||||||||
Norway — 0.75% | ||||||||
| 33,939 | DNB Bank ASA (Banks) | 635 | ||||||
| 105,375 | Equinor ASA (Oil, Gas & Consumable Fuels) | 3,069 | ||||||
| 24,244 | Mowi ASA (Food Products)(a) | 385 | ||||||
| 4,089 | ||||||||
Portugal — 0.34% | ||||||||
| 384,375 | EDP - Energias de Portugal SA (Electric Utilities) | 1,879 | ||||||
Singapore — 0.96% | ||||||||
| 232,772 | CapitaLand Ascendas REIT (Industrial REITs) | 470 | ||||||
| 3,306 | CapitaLand Ascott Trust (Hotel & Resort REITs) | 3 | ||||||
| 175,970 | CapitaLand Integrated Commercial Trust (Retail REITs) | 249 | ||||||
| 58,000 | CapitaLand Investment Ltd. (Real Estate Management & Development) | 143 | ||||||
| 57,800 | DBS Group Holdings Ltd. (Banks) | 1,350 | ||||||
| 14,500 | Oversea-Chinese Banking Corp. Ltd. (Banks) | 132 | ||||||
| 15,479 | Sea Ltd., ADR (Entertainment)(b) | 898 | ||||||
| 58,700 | Singapore Airlines Ltd. (Passenger Airlines)(a) | 311 | ||||||
| 18,700 | Singapore Exchange Ltd. (Capital Markets) | 133 | ||||||
Shares | Security Description | Value | ||||||
Singapore (continued) | ||||||||
| 67,900 | Singapore Telecommunications Ltd. (Diversified Telecommunication Services) | $ | 126 | |||||
| 6,600 | United Overseas Bank Ltd. (Banks) | 137 | ||||||
| 457,800 | Wilmar International Ltd. (Food Products) | 1,290 | ||||||
| 5,242 | ||||||||
South Africa — 0.01% | ||||||||
| 4,663 | Thungela Resources Ltd. (Oil, Gas & Consumable Fuels) | 36 | ||||||
South Korea — 0.19% | ||||||||
| 18,906 | Samsung Electronics Co. Ltd. (Technology Hardware, Storage & Peripherals) | 1,041 | ||||||
Spain — 2.02% | ||||||||
| 4,202 | ACS Actividades de Construccion y Servicios SA (Construction & Engineering) | 148 | ||||||
| 1,451 | Aena SME SA (Transportation Infrastructure) | 235 | ||||||
| 10,177 | Amadeus IT Group SA (Professional Services)(b) | 775 | ||||||
| 620,640 | Banco Bilbao Vizcaya Argentaria SA (Banks) | 4,767 | ||||||
| 28,433 | Bankinter SA (Banks) | 175 | ||||||
| 62,673 | CaixaBank SA (Banks) | 260 | ||||||
| 7,137 | Cellnex Telecom SA (Diversified Telecommunication Services)(a) | 288 | ||||||
| 13,218 | Enagas SA (Gas Utilities)(a) | 260 | ||||||
| 239,581 | Iberdrola SA (Electric Utilities) | 3,128 | ||||||
| 11,872 | Naturgy Energy Group SA (Gas Utilities) | 354 | ||||||
| 12,354 | Redeia Corp. SA (Electric Utilities) | 208 | ||||||
| 17,963 | Repsol SA (Oil, Gas & Consumable Fuels) | 261 | ||||||
| 38,882 | Telefonica SA (Diversified Telecommunication Services) | 158 | ||||||
| 11,017 | ||||||||
Sweden — 1.70% | ||||||||
| 1,283 | Alleima AB (Metals & Mining) | 6 | ||||||
| 35,074 | Assa Abloy AB, Class - B (Building Products) | 843 | ||||||
| 90,968 | Atlas Copco AB, Class - A (Machinery) | 1,314 | ||||||
| 59,272 | Atlas Copco AB, Class - B (Machinery) | 739 | ||||||
| 2,603 | Evolution AB (Hotels, Restaurants & Leisure) | 330 | ||||||
| 7,388 | Kinnevik AB, Class - B (Financial Services)(b) | 103 | ||||||
| 19,212 | L E Lundbergforetagen AB, Class - B (Financial Services) | 818 | ||||||
| 50,521 | Nibe Industrier AB, Class - B (Building Products) | 481 | ||||||
| 5,141 | Sagax AB, Class - B (Real Estate Management & Development) | 102 | ||||||
| 11,977 | Securitas AB, Class - B (Commercial Services & Supplies) | 98 | ||||||
| 51,934 | Skandinaviska Enskilda Banken AB, Class - A (Banks) | 575 | ||||||
| 32,522 | Swedbank AB, Class - A (Banks) | 549 | ||||||
See accompanying notes to financial statements.
124
HC CAPITAL TRUST
The International Equity Portfolio
Portfolio of Investments (continued) — June 30, 2023
Shares | Security Description | Value | ||||||
Common Stocks (continued) | ||||||||
Sweden (continued) | ||||||||
| 24,479 | Tele2 AB, B shares (Wireless Telecommunication Services) | $ | 203 | |||||
| 293,363 | Telia Co. AB (Diversified Telecommunication Services)(a) | 644 | ||||||
| 117,701 | Volvo AB, Class - B (Machinery) | 2,436 | ||||||
| 9,241 | ||||||||
Switzerland — 9.68% | ||||||||
| 135,931 | ABB Ltd., Registered Shares (Electrical Equipment) | 5,349 | ||||||
| 6,796 | Accelleron Industries AG (Electrical Equipment) | 163 | ||||||
| 8,475 | Alcon, Inc. (Health Care Equipment & Supplies) | 703 | ||||||
| 1,838 | Baloise Holding AG, Registered Shares (Insurance) | 270 | ||||||
| 44 | Chocoladefabriken Lindt & Spruengli AG, Class - PC (Food Products) | 553 | ||||||
| 19,821 | Cie Financiere Richemont SA, Registered Shares (Textiles, Apparel & Luxury Goods) | 3,368 | ||||||
| 13,970 | Coca-Cola HBC AG (Beverages) | 417 | ||||||
| 15,440 | DSM-Firmenich AG (Chemicals)(b) | 1,661 | ||||||
| 761 | EMS-Chemie Holding AG (Chemicals) | 577 | ||||||
| 387,007 | Glencore PLC (Metals & Mining)(a) | 2,194 | ||||||
| 5,080 | Kuehne + Nagel International AG, Registered Shares (Marine Transportation) | 1,505 | ||||||
| 4,844 | Logitech International SA, Registered Shares (Technology Hardware, Storage & Peripherals) | 289 | ||||||
| 4,467 | Lonza Group AG, Registered Shares (Life Sciences Tools & Services)(a) | 2,671 | ||||||
| 8,432 | Medacta Group SA (Health Care Equipment & Supplies) | 1,149 | ||||||
| 89,927 | Nestle SA, Registered Shares (Food Products) | 10,821 | ||||||
| 69,317 | Novartis AG, Registered Shares (Pharmaceuticals) | 6,990 | ||||||
| 441 | Partners Group Holding AG (Capital Markets) | 416 | ||||||
| 22,333 | Roche Holding AG (Pharmaceuticals) | 6,824 | ||||||
| 2,775 | SGS SA, Registered Shares (Professional Services)(a) | 263 | ||||||
| 491 | Sonova Holding AG (Health Care Equipment & Supplies)(a) | 131 | ||||||
| 1,212 | Swisscom AG, Registered Shares (Diversified Telecommunication Services) | 757 | ||||||
| 1,098 | The Swatch Group AG (Textiles, Apparel & Luxury Goods) | 321 | ||||||
| 191,523 | UBS Group AG (Capital Markets) | 3,883 | ||||||
| 3,139 | Zurich Insurance Group AG (Insurance) | 1,494 | ||||||
| 52,769 | ||||||||
Shares | Security Description | Value | ||||||
United Kingdom — 11.82% | ||||||||
| 38,163 | 3i Group PLC (Capital Markets) | $ | 946 | |||||
| 5,633 | Admiral Group PLC (Insurance) | 149 | ||||||
| 46,639 | Anglo American PLC (Metals & Mining) | 1,328 | ||||||
| 17,119 | Ashtead Group PLC (Trading Companies & Distributors) | 1,187 | ||||||
| 53,176 | AstraZeneca PLC (Pharmaceuticals)(a) | 7,621 | ||||||
| 31,506 | Auto Trader Group PLC (Interactive Media & Services)(a) | 245 | ||||||
| 221,258 | Aviva PLC (Insurance) | 1,113 | ||||||
| 121,738 | BAE Systems PLC (Aerospace & Defense) | 1,435 | ||||||
| 274,792 | Barclays PLC (Banks)(a) | 537 | ||||||
| 176,340 | BP PLC (Oil, Gas & Consumable Fuels) | 1,027 | ||||||
| 61,473 | British American Tobacco PLC (Tobacco) | 2,042 | ||||||
| 12,788 | Bunzl PLC (Trading Companies & Distributors) | 487 | ||||||
| 44,208 | Burberry Group PLC (Textiles, Apparel & Luxury Goods)(a) | 1,193 | ||||||
| 425,346 | Centrica PLC (Multi-Utilities)(a) | 671 | ||||||
| 39,102 | CNH Industrial N.V. (Machinery) | 564 | ||||||
| 10,781 | Coca-Cola Europacific Partners PLC (Beverages) | 695 | ||||||
| 68,973 | Compass Group PLC (Hotels, Restaurants & Leisure) | 1,931 | ||||||
| 40,786 | Diageo PLC (Beverages) | 1,753 | ||||||
| 38,064 | Entain PLC (Hotels, Restaurants & Leisure)(a) | 615 | ||||||
| 981 | Ferguson PLC (Trading Companies & Distributors) | 155 | ||||||
| 48,581 | GSK PLC (Pharmaceuticals) | 861 | ||||||
| 176,859 | Haleon PLC (Personal Care Products) | 726 | ||||||
| 259,830 | HSBC Holdings PLC (Banks) | 2,057 | ||||||
| 98,505 | Imperial Brands PLC (Tobacco) | 2,180 | ||||||
| 278,038 | Informa PLC (Media) | 2,567 | ||||||
| 6,566 | InterContinental Hotels Group PLC (Hotels, Restaurants & Leisure) | 454 | ||||||
| 480,645 | J Sainsbury PLC (Consumer Staples Distribution & Retail) | 1,643 | ||||||
| 118,900 | Kingfisher PLC (Specialty Retail) | 350 | ||||||
| 26,793 | Land Securities Group PLC (Diversified REITs) | 196 | ||||||
| 152,198 | Legal & General Group PLC (Insurance) | 441 | ||||||
| 10,034 | London Stock Exchange Group PLC (Capital Markets) | 1,068 | ||||||
| 197,696 | M&G PLC (Financial Services) | 481 | ||||||
| 14,782 | Mondi PLC (Paper & Forest Products) | 225 | ||||||
| 137,511 | National Grid PLC (Multi-Utilities) | 1,823 | ||||||
| 4,989 | Next PLC (Broadline Retail) | 437 | ||||||
| 16,942 | Pearson PLC (Diversified Consumer Services) | 178 | ||||||
| 43,427 | Persimmon PLC (Household Durables) | 566 | ||||||
| 5,331 | Reckitt Benckiser Group PLC (Household Products) | 401 | ||||||
| 56,944 | RELX PLC (Professional Services) | 1,899 | ||||||
| 66,751 | Rio Tinto PLC (Metals & Mining) | 4,240 | ||||||
See accompanying notes to financial statements.
125
HC CAPITAL TRUST
The International Equity Portfolio
Portfolio of Investments (continued) — June 30, 2023
Shares | Security Description | Value | ||||||
Common Stocks (continued) | ||||||||
United Kingdom (continued) | ||||||||
| 36,817 | Segro PLC (Diversified REITs) | $ | 336 | |||||
| 8,382 | Severn Trent PLC (Water Utilities)(a) | 273 | ||||||
| 298,341 | Shell PLC (Oil, Gas & Consumable Fuels) | 8,898 | ||||||
| 12,142 | Smiths Group PLC (Industrial Conglomerates) | 254 | ||||||
| 44,660 | SSE PLC (Electric Utilities) | 1,047 | ||||||
| 9,471 | St. James’s Place PLC (Capital Markets) | 131 | ||||||
| 33,934 | The Sage Group PLC (Software) | 399 | ||||||
| 18,373 | The Weir Group PLC (Machinery) | 410 | ||||||
| 55,598 | Unilever PLC (Personal Care Products) | 2,895 | ||||||
| 10,568 | United Utilities Group PLC (Water Utilities) | 129 | ||||||
| 4,958 | Whitbread PLC (Hotels, Restaurants & Leisure) | 213 | ||||||
| 88,265 | WPP PLC (Media) | 925 | ||||||
| 64,397 | ||||||||
United States — 0.58% | ||||||||
| 8,324 | Linde PLC (Chemicals) | 3,174 | ||||||
Total Common Stocks | 525,393 | |||||||
Investment Company — 1.75% | ||||||||
| 9,566,522 | State Street Institutional Treasury Plus Money Market Fund, Trust Class, 4.97%(d) | 9,567 | ||||||
Total Investment Company | 9,567 | |||||||
Shares | Security Description | Value | ||||||
Purchased Options on Futures — 0.00% | ||||||||
Total Purchased Options on Futures | $ | 15 | ||||||
Total Investments (cost $321,243) — 98.13% | 534,975 | |||||||
Other assets in excess of liabilities — 1.87% | 10,182 | |||||||
Net Assets — 100.00% | $ | 545,157 | ||||||
Amounts designated as “—” are $0 or have been rounded to $0.
(a) | Represents a security purchased under Rule 144A or Section 4(2) and is exempt from registration under the Securities Act of 1933, as amended, or is otherwise restricted to resale. Certain of these securities may be resold in transactions exempt from registration, normally to qualified institutional buyers. These securities have been deemed liquid by the Specialist Manager. |
(b) | Represents non-income producing security. |
(c) | Security was valued using significant unobservable inputs as of June 30, 2023. |
(d) | Annualized 7-day yield as of period-end. |
ADR—American Depositary Receipt |
REIT—Real Estate Investment Trust |
As of June 30, 2023, 100% of the Portfolio’s net assets were managed by Parametric Portfolio Associates, LLC. |
The following table reflects the open derivative positions held by the Portfolio as of June 30, 2023.
Futures Contracts Purchased*
Description | Number of | Expiration | Notional | Value and | ||||||||||||
MSCI EAFE Index Future | 125 | 9/15/23 | $ | 13,472 | $ | 67 | ||||||||||
| $ | 13,472 | $ | 67 | |||||||||||||
Futures Contracts Sold*
Description | Number of | Expiration | Notional | Value and | ||||||||||||
E-Mini S&P 500 Future | 3 | 9/15/23 | $ | 673 | $ | (22 | ) | |||||||||
| $ | 673 | $ | (22 | ) | ||||||||||||
Total Unrealized Appreciation | $ | 67 | ||||||||||||||
Total Unrealized Depreciation | (22 | ) | ||||||||||||||
Total Net Unrealized Appreciation/(Depreciation) | $ | 45 | ||||||||||||||
* | Cash has been pledged as collateral for futures contracts held by the Portfolio. |
See accompanying notes to financial statements.
126
HC CAPITAL TRUST
The International Equity Portfolio
Portfolio of Investments (continued) — June 30, 2023
Options on Futures Contracts
Exchange-traded options on futures contacts written as of June 30, 2023 were as follows:
Description | Put/Call | Number of | Notional | Exercise | Expiration | Value | ||||||||||||||||||
E-Mini S&P 500 Future Option | Put | 2 | $ | 433 | $ | 4,330.00 | 7/14/23 | $ | — | |||||||||||||||
E-Mini S&P 500 Future Option | Put | 2 | 435 | 4,350.00 | 7/14/23 | (1 | ) | |||||||||||||||||
E-Mini S&P 500 Future Option | Put | 4 | 790 | 3,950.00 | 7/21/23 | — | ||||||||||||||||||
E-Mini S&P 500 Future Option | Put | 2 | 428 | 4,275.00 | 7/21/23 | (1 | ) | |||||||||||||||||
E-Mini S&P 500 Future Option | Put | 4 | 780 | 3,900.00 | 7/21/23 | — | ||||||||||||||||||
E-Mini S&P 500 Future Option | Put | 2 | 368 | 3,680.00 | 7/21/23 | — | ||||||||||||||||||
E-Mini S&P 500 Future Option | Put | 2 | 365 | 3,650.00 | 7/21/23 | — | ||||||||||||||||||
E-Mini S&P 500 Future Option | Put | 2 | 378 | 3,780.00 | 7/21/23 | — | ||||||||||||||||||
E-Mini S&P 500 Future Option | Put | 2 | 380 | 3,800.00 | 7/21/23 | — | ||||||||||||||||||
E-Mini S&P 500 Future Option | Put | 2 | 381 | 3,810.00 | 7/21/23 | — | ||||||||||||||||||
E-Mini S&P 500 Future Option | Put | 2 | 387 | 3,870.00 | 7/21/23 | — | ||||||||||||||||||
E-Mini S&P 500 Future Option | Put | 2 | 378 | 3,775.00 | 7/21/23 | — | ||||||||||||||||||
E-Mini S&P 500 Future Option | Put | 2 | 400 | 4,000.00 | 7/31/23 | — | ||||||||||||||||||
E-Mini S&P 500 Future Option | Put | 4 | 820 | 4,100.00 | 7/31/23 | (1 | ) | |||||||||||||||||
E-Mini S&P 500 Future Option | Put | 4 | 842 | 4,210.00 | 7/31/23 | (2 | ) | |||||||||||||||||
E-Mini S&P 500 Future Option | Put | 2 | 423 | 4,230.00 | 7/31/23 | (1 | ) | |||||||||||||||||
E-Mini S&P 500 Future Option | Put | 2 | 383 | 3,830.00 | 7/31/23 | — | ||||||||||||||||||
E-Mini S&P 500 Future Option | Put | 4 | 776 | 3,880.00 | 7/31/23 | — | ||||||||||||||||||
E-Mini S&P 500 Future Option | Put | 2 | 380 | 3,800.00 | 7/31/23 | — | ||||||||||||||||||
E-Mini S&P 500 Future Option | Put | 2 | 393 | 3,930.00 | 7/31/23 | — | ||||||||||||||||||
E-Mini S&P 500 Future Option | Put | 2 | 373 | 3,725.00 | 7/31/23 | — | ||||||||||||||||||
E-Mini S&P 500 Future Option | Put | 4 | 855 | 4,275.00 | 7/31/23 | (2 | ) | |||||||||||||||||
E-Mini S&P 500 Future Option | Put | 4 | 860 | 4,300.00 | 7/31/23 | (3 | ) | |||||||||||||||||
E-Mini S&P 500 Future Option | Put | 2 | 390 | 3,900.00 | 7/31/23 | — | ||||||||||||||||||
E-Mini S&P 500 Future Option | Put | 2 | 394 | 3,940.00 | 8/18/23 | (1 | ) | |||||||||||||||||
E-Mini S&P 500 Future Option | Put | 6 | 1,179 | 3,930.00 | 8/18/23 | (2 | ) | |||||||||||||||||
E-Mini S&P 500 Future Option | Put | 2 | 400 | 4,000.00 | 8/18/23 | (1 | ) | |||||||||||||||||
E-Mini S&P 500 Future Option | Put | 2 | 408 | 4,080.00 | 8/18/23 | (1 | ) | |||||||||||||||||
E-Mini S&P 500 Future Option | Put | 2 | 408 | 4,075.00 | 8/18/23 | (1 | ) | |||||||||||||||||
E-Mini S&P 500 Future Option | Put | 2 | 409 | 4,090.00 | 8/18/23 | (1 | ) | |||||||||||||||||
E-Mini S&P 500 Future Option | Put | 2 | 393 | 3,925.00 | 8/18/23 | (1 | ) | |||||||||||||||||
E-Mini S&P 500 Future Option | Put | 4 | 832 | 4,160.00 | 8/18/23 | (3 | ) | |||||||||||||||||
E-Mini S&P 500 Future Option | Put | 2 | 380 | 3,800.00 | 8/18/23 | (1 | ) | |||||||||||||||||
E-Mini S&P 500 Future Option | Put | 4 | 822 | 4,110.00 | 8/31/23 | (4 | ) | |||||||||||||||||
E-Mini S&P 500 Future Option | Put | 4 | 805 | 4,025.00 | 8/31/23 | (3 | ) | |||||||||||||||||
E-Mini S&P 500 Future Option | Put | 4 | 810 | 4,050.00 | 8/31/23 | (3 | ) | |||||||||||||||||
E-Mini S&P 500 Future Option | Put | 2 | 405 | 4,050.00 | 9/15/23 | (2 | ) | |||||||||||||||||
E-Mini S&P 500 Future Option | Put | 2 | 408 | 4,075.00 | 9/15/23 | (2 | ) | |||||||||||||||||
| $ | (37 | ) | ||||||||||||||||||||||
See accompanying notes to financial statements.
127
HC CAPITAL TRUST
The International Equity Portfolio
Portfolio of Investments (concluded) — June 30, 2023
Exchanged-traded options on futures contacts purchased as of June 30, 2023 were as follows:
Description | Put/Call | Number of | Notional | Exercise | Expiration | Value | ||||||||||||||||||
E-Mini S&P 500 Future Option | Call | 4 | $ | 913 | $ | 4,570.00 | 7/21/23 | $ | 3 | |||||||||||||||
E-Mini S&P 500 Future Option | Put | 2 | 428 | 4,275.00 | 7/14/23 | — | ||||||||||||||||||
E-Mini S&P 500 Future Option | Put | 2 | 400 | 4,000.00 | 7/21/23 | — | ||||||||||||||||||
E-Mini S&P 500 Future Option | Put | 2 | 413 | 4,125.00 | 7/21/23 | — | ||||||||||||||||||
E-Mini S&P 500 Future Option | Put | 2 | 425 | 4,250.00 | 7/21/23 | — | ||||||||||||||||||
E-Mini S&P 500 Future Option | Put | 2 | 415 | 4,150.00 | 7/21/23 | — | ||||||||||||||||||
E-Mini S&P 500 Future Option | Put | 2 | 410 | 4,100.00 | 7/21/23 | — | ||||||||||||||||||
E-Mini S&P 500 Future Option | Put | 2 | 439 | 4,400.00 | 7/31/23 | 3 | ||||||||||||||||||
E-Mini S&P 500 Future Option | Put | 2 | 438 | 4,375.00 | 7/31/23 | 2 | ||||||||||||||||||
E-Mini S&P 500 Future Option | Put | 2 | 435 | 4,350.00 | 7/31/23 | 2 | ||||||||||||||||||
E-Mini S&P 500 Future Option | Put | 2 | 425 | 4,250.00 | 7/31/23 | 1 | ||||||||||||||||||
E-Mini S&P 500 Future Option | Put | 2 | 433 | 4,325.00 | 8/18/23 | 4 | ||||||||||||||||||
| $ | 15 | |||||||||||||||||||||||
See accompanying notes to financial statements.
128
HC CAPITAL TRUST
The Institutional International Equity Portfolio
Portfolio of Investments — June 30, 2023
Shares | Security Description | Value | ||||||
Common Stocks — 56.35% | ||||||||
Australia — 3.52% | ||||||||
| 7,050 | Ampol Ltd. (Oil, Gas & Consumable Fuels) | $ | 141 | |||||
| 63,472 | ANZ Group Holdings Ltd. (Banks) | 1,005 | ||||||
| 57,316 | APA Group (Gas Utilities) | 370 | ||||||
| 12,428 | Aristocrat Leisure Ltd. (Hotels, Restaurants & Leisure) | 321 | ||||||
| 7,699 | ASX Ltd. (Capital Markets) | 324 | ||||||
| 82,782 | Aurizon Holdings Ltd. (Ground Transportation) | 217 | ||||||
| 107,383 | BHP Group Ltd. (Metals & Mining) | 3,227 | ||||||
| 9,452 | BlueScope Steel Ltd. (Metals & Mining) | 130 | ||||||
| 47,697 | Brambles Ltd. (Commercial Services & Supplies) | 459 | ||||||
| 2,107 | Cochlear Ltd. (Health Care Equipment & Supplies) | 323 | ||||||
| 49,186 | Coles Group Ltd. (Consumer Staples Distribution & Retail) | 604 | ||||||
| 35,682 | Commonwealth Bank of Australia (Banks) | 2,388 | ||||||
| 18,145 | Computershare Ltd. (Professional Services) | 283 | ||||||
| 10,855 | CSL Ltd. (Biotechnology) | 2,009 | ||||||
| 45,614 | Dexus (Diversified REITs) | 237 | ||||||
| 3,158 | EBOS Group Ltd. (Health Care Providers & Services) | 71 | ||||||
| 85,815 | Endeavour Group Ltd. (Consumer Staples Distribution & Retail) | 361 | ||||||
| 35,442 | Fortescue Metals Group Ltd. (Metals & Mining) | 526 | ||||||
| 40,259 | Goodman Group (Industrial REITs) | 541 | ||||||
| 5,294 | IDP Education Ltd. (Diversified Consumer Services) | 78 | ||||||
| 14,776 | IGO Ltd. (Metals & Mining) | 151 | ||||||
| 78,769 | Insurance Australia Group Ltd. (Insurance) | 300 | ||||||
| 19,982 | Lendlease Corp. Ltd. (Real Estate Management & Development)(a) | 104 | ||||||
| 7,770 | Macquarie Group Ltd. (Capital Markets) | 924 | ||||||
| 151,360 | Medibank Pvt. Ltd. (Insurance) | 355 | ||||||
| 3,696 | Mineral Resources Ltd. (Metals & Mining) | 177 | ||||||
| 85,546 | Mirvac Group (Diversified REITs) | 129 | ||||||
| 65,983 | National Australia Bank Ltd. (Banks) | 1,160 | ||||||
| 32,004 | Newcrest Mining Ltd. (Metals & Mining) | 571 | ||||||
| 45,268 | Northern Star Resources Ltd. (Metals & Mining) | 369 | ||||||
| 9,744 | Orica Ltd. (Chemicals) | 97 | ||||||
| 37,296 | Origin Energy Ltd. (Electric Utilities) | 210 | ||||||
| 58,369 | Pilbara Minerals Ltd. (Metals & Mining) | 192 | ||||||
| 20,036 | Qantas Airways Ltd. (Passenger Airlines)(b) | 83 | ||||||
| 31,074 | QBE Insurance Group Ltd. (Insurance) | 324 | ||||||
| 7,710 | Ramsay Health Care Ltd. (Health Care Providers & Services) | 289 | ||||||
| 1,150 | REA Group Ltd. (Interactive Media & Services) | 110 | ||||||
| 4,902 | Reece Ltd. (Trading Companies & Distributors) | 61 | ||||||
| 7,769 | Rio Tinto Ltd. (Metals & Mining) | 595 | ||||||
Shares | Security Description | Value | ||||||
Australia (continued) | ||||||||
| 69,772 | Santos Ltd. (Oil, Gas & Consumable Fuels)(a) | $ | 349 | |||||
| 112,940 | Scentre Group (Retail REITs) | 200 | ||||||
| 7,306 | SEEK Ltd. (Interactive Media & Services) | 107 | ||||||
| 16,699 | Sonic Healthcare Ltd. (Health Care Providers & Services) | 397 | ||||||
| 96,004 | South32 Ltd. (Metals & Mining) | 242 | ||||||
| 52,015 | Stockland (Diversified REITs) | 140 | ||||||
| 26,178 | Suncorp Group Ltd. (Insurance) | 235 | ||||||
| 159,510 | Telstra Group Ltd. (Diversified Telecommunication Services) | 457 | ||||||
| 56,406 | The GPT Group (Diversified REITs) | 156 | ||||||
| 48,201 | The Lottery Corp. Ltd. (Hotels, Restaurants & Leisure) | 165 | ||||||
| 79,839 | Transurban Group (Transportation Infrastructure) | 760 | ||||||
| 30,752 | Treasury Wine Estates Ltd. (Beverages) | 231 | ||||||
| 83,889 | Vicinity Ltd. (Diversified REITs)(a) | 103 | ||||||
| 7,274 | Washington H Soul Pattinson & Co. Ltd. (Oil, Gas & Consumable Fuels) | 155 | ||||||
| 26,188 | Wesfarmers Ltd. (Broadline Retail) | 863 | ||||||
| 74,159 | Westpac Banking Corp. (Banks) | 1,056 | ||||||
| 3,486 | WiseTech Global Ltd. (Software) | 187 | ||||||
| 40,168 | Woodside Energy Group Ltd. (Oil, Gas & Consumable Fuels) | 929 | ||||||
| 33,200 | Woolworths Group Ltd. (Consumer Staples Distribution & Retail) | 880 | ||||||
| 27,428 | ||||||||
Austria — 0.08% | ||||||||
| 7,182 | Erste Group Bank AG (Banks)(a) | 252 | ||||||
| 3,193 | OMV AG (Oil, Gas & Consumable Fuels) | 136 | ||||||
| 1,476 | Verbund AG (Electric Utilities) | 118 | ||||||
| 2,516 | voestalpine AG (Metals & Mining) | 90 | ||||||
| 596 | ||||||||
Belgium — 0.38% | ||||||||
| 3,275 | Ageas SA/N.V. (Insurance) | 133 | ||||||
| 18,357 | Anheuser-Busch InBev SA/N.V. (Beverages) | 1,041 | ||||||
| 487 | D’ieteren Group (Distributors) | 86 | ||||||
| 1,806 | Elia Group SA/N.V. (Electric Utilities)(a) | 229 | ||||||
| 2,046 | Groupe Bruxelles Lambert N.V. (Financial Services) | 161 | ||||||
| 5,235 | KBC Group N.V. (Banks) | 365 | ||||||
| 518 | Sofina SA (Financial Services) | 107 | ||||||
| 1,525 | Solvay SA, Class - A (Chemicals) | 171 | ||||||
| 3,744 | UCB SA (Pharmaceuticals) | 332 | ||||||
| 4,241 | Umicore SA (Chemicals)(a) | 119 | ||||||
| 7,645 | Warehouses De Pauw CVA (Industrial REITs) | 210 | ||||||
| 2,954 | ||||||||
Canada — 1.13% | ||||||||
| 2,256 | Agnico Eagle Mines Ltd. (Metals & Mining) | 113 | ||||||
See accompanying notes to financial statements.
129
HC CAPITAL TRUST
The Institutional International Equity Portfolio
Portfolio of Investments (continued) — June 30, 2023
Shares | Security Description | Value | ||||||
Common Stocks (continued) | ||||||||
Canada (continued) | ||||||||
| 19,035 | Algonquin Power & Utilities Corp. (Multi-Utilities) | $ | 157 | |||||
| 1,715 | Alimentation Couche-Tard, Inc. (Consumer Staples Distribution & Retail) | 88 | ||||||
| 8,807 | Barrick Gold Corp. (Metals & Mining) | 149 | ||||||
| 4,370 | BCE, Inc. (Diversified Telecommunication Services) | 199 | ||||||
| 2,500 | Canadian Apartment Properties REIT (Residential REITs)(a) | 96 | ||||||
| 677 | Canadian Imperial Bank of Commerce (Banks) | 29 | ||||||
| 13,934 | Canadian Natural Resources Ltd. (Oil, Gas & Consumable Fuels) | 784 | ||||||
| 9,673 | Canadian Pacific Kansas City Ltd. (Ground Transportation) | 782 | ||||||
| 7,211 | Canadian Utilities Ltd., Class - A (Multi-Utilities) | 187 | ||||||
| 1,429 | CCL Industries, Inc., Class - B (Containers & Packaging)(a) | 70 | ||||||
| 770 | CGI, Inc. (IT Services)(b) | 81 | ||||||
| 18 | Constellation Software, Inc. (Software) | 37 | ||||||
| 2,185 | Dollarama, Inc. (Broadline Retail) | 148 | ||||||
| 5,414 | Emera, Inc. (Electric Utilities) | 223 | ||||||
| 9,460 | Empire Co. Ltd., Class - A (Consumer Staples Distribution & Retail) | 269 | ||||||
| 150 | Fairfax Financial Holdings Ltd. (Insurance) | 112 | ||||||
| 447 | FirstService Corp. (Real Estate Management & Development) | 69 | ||||||
| 5,317 | Fortis, Inc. (Electric Utilities) | 229 | ||||||
| 942 | Franco-Nevada Corp. (Metals & Mining) | 134 | ||||||
| 1,824 | George Weston Ltd. (Consumer Staples Distribution & Retail) | 216 | ||||||
| 3,561 | Great-West Lifeco, Inc. (Insurance) | 103 | ||||||
| 8,993 | Hydro One Ltd. (Electric Utilities)(a) | 257 | ||||||
| 1,248 | Intact Financial Corp. (Insurance) | 193 | ||||||
| 2,975 | Loblaw Cos. Ltd. (Consumer Staples Distribution & Retail) | 272 | ||||||
| 4,463 | Metro, Inc. (Consumer Staples Distribution & Retail) | 252 | ||||||
| 8,775 | Northland Power, Inc. (Independent Power and Renewable Electricity Producers) | 183 | ||||||
| 12,624 | Nutrien Ltd. (Chemicals) | 746 | ||||||
| 1,929 | Power Corp. of Canada (Insurance) | 52 | ||||||
| 7,880 | Quebecor, Inc., Class - B (Media) | 194 | ||||||
| 18,071 | RB Global, Inc. (Commercial Services & Supplies) | 1,085 | ||||||
| 1,684 | Restaurant Brands International, Inc. (Hotels, Restaurants & Leisure) | 131 | ||||||
| 4,651 | Rogers Communications, Inc., Class - B (Wireless Telecommunication Services) | 212 | ||||||
Shares | Security Description | Value | ||||||
Canada (continued) | ||||||||
| 561 | Royal Bank of Canada (Banks) | $ | 54 | |||||
| 5,752 | Saputo, Inc. (Food Products)(a) | 129 | ||||||
| 6,891 | TELUS Corp. (Diversified Telecommunication Services) | 134 | ||||||
| 1,503 | The Descartes Systems Group, Inc. (Software)(b) | 120 | ||||||
| 1,695 | Thomson Reuters Corp. (Professional Services) | 229 | ||||||
| 8,305 | TMX Group Ltd. (Capital Markets) | 187 | ||||||
| 529 | Toromont Industries Ltd. (Trading Companies & Distributors) | 43 | ||||||
| 1,188 | Wheaton Precious Metals Corp. (Metals & Mining) | 51 | ||||||
| 8,799 | ||||||||
Cayman Islands — 0.02% | ||||||||
| 53,060 | Sands China Ltd. (Hotels, Restaurants & Leisure)(b) | 182 | ||||||
Chile — 0.02% | ||||||||
| 8,529 | Antofagasta PLC (Metals & Mining) | 159 | ||||||
Denmark — 1.68% | ||||||||
| 121 | A.P. Moller - Maersk A/S, Class - A (Marine Transportation) | 211 | ||||||
| 109 | A.P. Moller - Maersk A/S, Class - B (Marine Transportation) | 192 | ||||||
| 4,196 | Carlsberg A/S, Class - B (Beverages) | 672 | ||||||
| 2,287 | Chr Hansen Holding A/S (Chemicals)(a) | 159 | ||||||
| 4,146 | Coloplast A/S, Class - B (Health Care Equipment & Supplies) | 519 | ||||||
| 34,341 | Danske Bank A/S (Banks)(b) | 837 | ||||||
| 1,998 | Demant A/S (Health Care Equipment & Supplies)(b) | 85 | ||||||
| 3,918 | DSV A/S (Air Freight & Logistics) | 822 | ||||||
| 1,405 | Genmab A/S (Biotechnology)(a)(b) | 533 | ||||||
| 39,692 | Novo Nordisk A/S, Class - B (Pharmaceuticals) | 6,412 | ||||||
| 7,198 | Novozymes A/S, Class - B (Chemicals) | 336 | ||||||
| 4,387 | Orsted A/S (Electric Utilities)(a) | 416 | ||||||
| 1,973 | Pandora A/S (Textiles, Apparel & Luxury Goods) | 176 | ||||||
| 193 | ROCKWOOL A/S, Class - B (Building Products) | 50 | ||||||
| 19,466 | Tryg A/S (Insurance)(a) | 422 | ||||||
| 47,012 | Vestas Wind Systems A/S (Electrical Equipment)(b) | 1,250 | ||||||
| 13,092 | ||||||||
Finland — 0.73% | ||||||||
| 5,503 | Elisa Oyj (Diversified Telecommunication Services) | 294 | ||||||
| 9,629 | Fortum Oyj (Electric Utilities) | 129 | ||||||
| 10,446 | Kesko Oyj, Class - B (Consumer Staples Distribution & Retail) | 196 | ||||||
| 8,284 | Kone Oyj, Class - B (Machinery) | 433 | ||||||
| 13,507 | Metso Oyj (Machinery)(a) | 163 | ||||||
See accompanying notes to financial statements.
130
HC CAPITAL TRUST
The Institutional International Equity Portfolio
Portfolio of Investments (continued) — June 30, 2023
Shares | Security Description | Value | ||||||
Common Stocks (continued) | ||||||||
Finland (continued) | ||||||||
| 8,854 | Neste Oyj (Oil, Gas & Consumable Fuels) | $ | 341 | |||||
| 113,258 | Nokia Oyj (Communications Equipment) | 474 | ||||||
| 152,209 | Nordea Bank Abp (Banks) | 1,657 | ||||||
| 4,677 | Orion Oyj, Class - B (Pharmaceuticals) | 194 | ||||||
| 26,570 | Sampo Oyj, A Shares (Insurance) | 1,194 | ||||||
| 12,295 | Stora Enso Oyj, Registered Shares (Paper & Forest Products) | 143 | ||||||
| 11,171 | UPM-Kymmene Oyj (Paper & Forest Products) | 333 | ||||||
| 10,263 | Wartsila Oyj Abp (Machinery) | 116 | ||||||
| 5,667 | ||||||||
France — 6.46% | ||||||||
| 3,706 | Accor SA (Hotels, Restaurants & Leisure) | 138 | ||||||
| 582 | Aeroports de Paris (Transportation Infrastructure) | 84 | ||||||
| 12,134 | Air Liquide SA (Chemicals) | 2,176 | ||||||
| 12,528 | Airbus SE (Aerospace & Defense) | 1,811 | ||||||
| 6,933 | Alstom SA (Machinery) | 207 | ||||||
| 1,326 | Amundi SA (Capital Markets) | 78 | ||||||
| 1,288 | Arkema SA (Chemicals) | 121 | ||||||
| 39,368 | AXA SA (Insurance) | 1,163 | ||||||
| 4,471 | BioMerieux (Health Care Equipment & Supplies) | 469 | ||||||
| 23,477 | BNP Paribas SA (Banks) | 1,481 | ||||||
| 36,196 | Bollore SE (Entertainment) | 226 | ||||||
| 7,738 | Bouygues SA (Construction & Engineering) | 260 | ||||||
| 11,603 | Bureau Veritas SA (Professional Services)(a) | 318 | ||||||
| 3,493 | Capgemini SE (IT Services) | 661 | ||||||
| 29,565 | Carrefour SA (Consumer Staples Distribution & Retail)(a) | 560 | ||||||
| 10,255 | Cie de Saint-Gobain (Building Products) | 624 | ||||||
| 14,199 | Cie Generale des Etablissements Michelin SCA (Automobile Components) | 420 | ||||||
| 1,112 | Covivio SA (Diversified REITs) | 53 | ||||||
| 26,240 | Credit Agricole SA (Banks) | 312 | ||||||
| 17,715 | Danone SA (Food Products) | 1,085 | ||||||
| 1,566 | Dassault Aviation SA (Aerospace & Defense)(a) | 314 | ||||||
| 18,330 | Dassault Systemes SE (Software) | 812 | ||||||
| 7,365 | Edenred (Financial Services) | 493 | ||||||
| 1,723 | Eiffage SA (Construction & Engineering)(a) | 180 | ||||||
| 42,523 | Engie SA (Multi-Utilities) | 709 | ||||||
| 10,189 | EssilorLuxottica SA (Health Care Equipment & Supplies)^ | 1,922 | ||||||
| 945 | Eurazeo SE (Financial Services) | 67 | ||||||
| 1,760 | Gecina SA (Office REITs)(a) | 188 | ||||||
| 14,389 | Getlink SE (Transportation Infrastructure) | 245 | ||||||
| 674 | Hermes International (Textiles, Apparel & Luxury Goods) | 1,465 | ||||||
| 3,397 | Ipsen SA (Pharmaceuticals) | 408 | ||||||
| 1,567 | Kering SA (Textiles, Apparel & Luxury Goods) | 865 | ||||||
Shares | Security Description | Value | ||||||
France (continued) | ||||||||
| 4,664 | Klepierre SA (Retail REITs) | $ | 116 | |||||
| 9,655 | La Francaise des Jeux SAEM (Hotels, Restaurants & Leisure) | 380 | ||||||
| 6,114 | Legrand SA (Electrical Equipment) | 607 | ||||||
| 6,968 | L’Oreal SA (Personal Care Products) | 3,250 | ||||||
| 6,671 | LVMH Moet Hennessy Louis Vuitton SE (Textiles, Apparel & Luxury Goods) | 6,289 | ||||||
| 71,636 | Orange SA (Diversified Telecommunication Services)(a) | 837 | ||||||
| 8,428 | Pernod Ricard SA (Beverages) | 1,862 | ||||||
| 4,903 | Publicis Groupe SA (Media)^ | 393 | ||||||
| 1,894 | Remy Cointreau SA (Beverages) | 304 | ||||||
| 4,148 | Renault SA (Automobile Components) | 175 | ||||||
| 7,224 | Safran SA (Aerospace & Defense) | 1,132 | ||||||
| 34,680 | Sanofi (Pharmaceuticals) | 3,732 | ||||||
| 1,651 | Sartorius Stedim Biotech (Life Sciences Tools & Services) | 413 | ||||||
| 16,039 | Schneider Electric SE (Electrical Equipment)(a) | 2,914 | ||||||
| 2,423 | SEB SA (Household Durables) | 251 | ||||||
| 15,282 | Societe Generale SA (Banks) | 397 | ||||||
| 1,826 | Sodexo SA (Hotels, Restaurants & Leisure) | 201 | ||||||
| 2,686 | Teleperformance (Professional Services) | 451 | ||||||
| 3,737 | Thales SA (Aerospace & Defense) | 560 | ||||||
| 63,749 | TotalEnergies SE (Oil, Gas & Consumable Fuels) | 3,659 | ||||||
| 2,557 | Unibail-Rodamco-Westfield (Retail REITs)(b) | 135 | ||||||
| 4,470 | Valeo (Automobile Components) | 96 | ||||||
| 14,381 | Veolia Environnement SA (Multi-Utilities) | 455 | ||||||
| 11,264 | Vinci SA (Construction & Engineering) | 1,309 | ||||||
| 40,737 | Vivendi SE (Media) | 374 | ||||||
| 577 | Wendel SE (Financial Services) | 59 | ||||||
| 4,959 | Worldline SA (Financial Services)(b) | 182 | ||||||
| 50,448 | ||||||||
Germany — 4.63% | ||||||||
| 7,791 | adidas AG (Textiles, Apparel & Luxury Goods) | 1,512 | ||||||
| 8,523 | Allianz SE, Registered Shares (Insurance) | 1,986 | ||||||
| 19,223 | BASF SE (Chemicals) | 934 | ||||||
| 22,163 | Bayer AG, Registered Shares (Pharmaceuticals) | 1,227 | ||||||
| 7,017 | Bayerische Motoren Werke AG (Automobile Components) | 863 | ||||||
| 1,288 | Bayerische Motoren Werke AG, Preference Shares (Automobiles) | 147 | ||||||
| 1,776 | Bechtle AG (IT Services) | 71 | ||||||
| 4,142 | Beiersdorf AG (Personal Care Products) | 548 | ||||||
| 3,679 | Brenntag SE (Trading Companies & Distributors) | 287 | ||||||
| 1,239 | Carl Zeiss Meditec AG, Class - BR (Health Care Equipment & Supplies) | 134 | ||||||
| 22,191 | Commerzbank AG (Banks) | 246 | ||||||
| 2,385 | Continental AG (Automobile Components) | 180 | ||||||
See accompanying notes to financial statements.
131
HC CAPITAL TRUST
The Institutional International Equity Portfolio
Portfolio of Investments (continued) — June 30, 2023
Shares | Security Description | Value | ||||||
Common Stocks (continued) | ||||||||
Germany (continued) | ||||||||
| 4,145 | Covestro AG (Chemicals)(b) | $ | 216 | |||||
| 10,374 | Daimler Truck Holding AG (Machinery) | 374 | ||||||
| 3,686 | Delivery Hero SE (Hotels, Restaurants & Leisure)(b) | 163 | ||||||
| 43,256 | Deutsche Bank AG, Registered Shares (Capital Markets) | 455 | ||||||
| 5,416 | Deutsche Boerse AG (Capital Markets) | 999 | ||||||
| 12,041 | Deutsche Lufthansa AG, Registered Shares (Passenger Airlines)(a)(b) | 123 | ||||||
| 77,469 | Deutsche Telekom AG (Diversified Telecommunication Services)(a) | 1,690 | ||||||
| 21,270 | DHL Group (Air Freight & Logistics) | 1,039 | ||||||
| 2,383 | Dr. Ing. h.c. F. Porsche AG, Preference Shares (Automobiles) | 296 | ||||||
| 60,571 | E.ON SE (Multi-Utilities) | 773 | ||||||
| 4,094 | Evonik Industries AG (Chemicals) | 78 | ||||||
| 9,713 | Fresenius Medical Care AG & Co. KGaA (Health Care Providers & Services) | 464 | ||||||
| 12,157 | Fresenius SE & Co. KGaA (Health Care Providers & Services) | 338 | ||||||
| 4,475 | GEA Group AG (Machinery) | 188 | ||||||
| 1,630 | Hannover Rueck SE (Insurance) | 346 | ||||||
| 3,140 | Heidelberg Materials AG (Construction Materials) | 258 | ||||||
| 3,213 | HelloFresh SE (Consumer Staples Distribution & Retail)(b) | 79 | ||||||
| 5,282 | Henkel AG & Co. KGaA (Household Products) | 372 | ||||||
| 3,729 | Henkel AG & Co. KGaA, Preference Shares (Household Products) | 298 | ||||||
| 49,194 | Infineon Technologies AG (Semiconductors & Semiconductor Equipment)(a) | 2,025 | ||||||
| 2,985 | Knorr-Bremse AG (Machinery) | 228 | ||||||
| 5,508 | LEG Immobilien SE (Real Estate Management & Development) | 318 | ||||||
| 18,108 | Mercedes-Benz Group AG (Automobile Components) | 1,457 | ||||||
| 3,519 | Merck KGaA (Pharmaceuticals) | 583 | ||||||
| 1,118 | MTU Aero Engines AG (Aerospace & Defense) | 290 | ||||||
| 2,968 | Muenchener Rueckversicherungs-Gesellschaft AG in Muenchen, Registered Shares (Insurance) | 1,114 | ||||||
| 1,125 | Nemetschek SE (Software) | 84 | ||||||
| 3,320 | Porsche Automobil Holding SE, Preference Shares (Automobile Components)(b) | 200 | ||||||
| 2,289 | Puma SE (Textiles, Apparel & Luxury Goods)(a) | 138 | ||||||
| 111 | Rational AG (Machinery) | 80 | ||||||
Shares | Security Description | Value | ||||||
Germany (continued) | ||||||||
| 1,538 | Rheinmetall AG (Aerospace & Defense) | $ | 421 | |||||
| 34,853 | RWE AG (Independent Power and Renewable Electricity Producers) | 1,518 | ||||||
| 28,153 | SAP SE (Software) | 3,846 | ||||||
| 933 | Sartorius AG, Preference Shares (Life Sciences Tools & Services) | 323 | ||||||
| 4,586 | Scout24 SE (Interactive Media & Services) | 290 | ||||||
| 20,865 | Siemens AG, Registered Shares (Industrial Conglomerates) | 3,479 | ||||||
| 10,874 | Siemens Energy AG (Electrical Equipment)(a)(b) | 192 | ||||||
| 8,709 | Siemens Healthineers AG (Health Care Equipment & Supplies) | 494 | ||||||
| 5,367 | Symrise AG (Chemicals)(a) | 562 | ||||||
| 1,331 | Talanx AG (Insurance) | 76 | ||||||
| 102,785 | Telefonica Deutschland Holding AG (Diversified Telecommunication Services) | 290 | ||||||
| 7,884 | United Internet AG (Diversified Telecommunication Services)(a) | 111 | ||||||
| 640 | Volkswagen AG (Automobiles) | 107 | ||||||
| 4,332 | Volkswagen AG, Preference Shares (Automobile Components) | 582 | ||||||
| 19,440 | Vonovia SE (Real Estate Management & Development) | 380 | ||||||
| 383 | Wacker Chemie AG (Chemicals) | 53 | ||||||
| 4,614 | Zalando SE (Specialty Retail)(b) | 133 | ||||||
| 36,058 | ||||||||
Hong Kong — 1.49% | ||||||||
| 322,518 | AIA Group Ltd. (Insurance) | 3,275 | ||||||
| 91,195 | BOC Hong Kong Holdings Ltd. (Banks) | 279 | ||||||
| 33,800 | Budweiser Brewing Co. APAC Ltd. (Beverages) | 87 | ||||||
| 588,000 | China Common Rich Renewable Energy Investment Ltd. (Independent Power and Renewable Electricity Producers)(b)(c) | — | ||||||
| 41,200 | CK Asset Holdings Ltd. (Real Estate Management & Development) | 229 | ||||||
| 56,410 | CK Hutchison Holdings Ltd. (Industrial Conglomerates) | 344 | ||||||
| 31,500 | CK Infrastructure Holdings Ltd. (Electric Utilities) | 167 | ||||||
| 54,719 | CLP Holdings Ltd. (Electric Utilities) | 427 | ||||||
| 94,200 | ESR Group Ltd. (Real Estate Management & Development) | 162 | ||||||
| 1,293 | Futu Holdings Ltd., ADR (Capital Markets)(b) | 51 | ||||||
| 46,000 | Galaxy Entertainment Group Ltd. (Hotels, Restaurants & Leisure)(b) | 293 | ||||||
| 42,720 | Hang Lung Properties Ltd. (Real Estate Management & Development) | 66 | ||||||
| 20,439 | Hang Seng Bank Ltd. (Banks) | 292 | ||||||
| 28,845 | Henderson Land Development Co. Ltd. (Real Estate Management & Development) | 86 | ||||||
See accompanying notes to financial statements.
132
HC CAPITAL TRUST
The Institutional International Equity Portfolio
Portfolio of Investments (continued) — June 30, 2023
Shares | Security Description | Value | ||||||
Common Stocks (continued) | ||||||||
Hong Kong (continued) | ||||||||
| 187,550 | HKT Trust & HKT Ltd. (Diversified Telecommunication Services)(a) | $ | 219 | |||||
| 352,247 | Hong Kong & China Gas Co. Ltd. (Gas Utilities) | 305 | ||||||
| 25,500 | Hong Kong Exchanges & Clearing Ltd. (Capital Markets) | 966 | ||||||
| 41,240 | Hongkong Land Holdings Ltd. (Real Estate Management & Development) | 161 | ||||||
| 5,700 | Jardine Matheson Holdings Ltd. (Industrial Conglomerates) | 289 | ||||||
| 63,134 | Link REIT (Retail REITs) | 352 | ||||||
| 53,500 | MTR Corp. Ltd. (Ground Transportation) | 246 | ||||||
| 31,310 | New World Development Co. Ltd. (Real Estate Management & Development) | 77 | ||||||
| 52,868 | Power Assets Holdings Ltd. (Electric Utilities) | 278 | ||||||
| 111,990 | Prudential PLC (Insurance) | 1,582 | ||||||
| 101,328 | Sino Land Co. Ltd. (Real Estate Management & Development) | 125 | ||||||
| 29,000 | SITC International Holdings Co. Ltd. (Marine Transportation) | 53 | ||||||
| 30,360 | Sun Hung Kai Properties Ltd. (Real Estate Management & Development) | 384 | ||||||
| 9,430 | Swire Pacific Ltd., Class - A (Real Estate Management & Development) | 72 | ||||||
| 25,400 | Swire Properties Ltd. (Real Estate Management & Development) | 63 | ||||||
| 29,000 | Techtronic Industries Co. Ltd. (Machinery) | 317 | ||||||
| 180,856 | WH Group Ltd. (Food Products) | 96 | ||||||
| 36,000 | Wharf Real Estate Investment Co. Ltd. (Real Estate Management & Development) | 181 | ||||||
| 39,000 | Xinyi Glass Holdings Ltd. (Building Products) | 61 | ||||||
| 11,585 | ||||||||
Ireland (Republic of) — 0.88% | ||||||||
| 3,452 | AerCap Holdings N.V. (Trading Companies & Distributors)(b) | 219 | ||||||
| 28,249 | AIB Group PLC (Banks) | 119 | ||||||
| 22,252 | Bank of Ireland Group PLC (Banks) | 212 | ||||||
| 31,841 | CRH PLC (Construction Materials)(a) | 1,757 | ||||||
| 3,399 | DCC PLC (Industrial Conglomerates)(a) | 190 | ||||||
| 45,267 | Experian PLC (Professional Services) | 1,738 | ||||||
| 3,757 | Flutter Entertainment PLC (Hotels, Restaurants & Leisure)(b) | 756 | ||||||
| 9,216 | James Hardie Industries PLC (Construction Materials) | 246 | ||||||
| 3,334 | Kerry Group PLC, Class - A (Food Products)(a) | 325 | ||||||
| 3,205 | Kingspan Group PLC (Building Products) | 213 | ||||||
| 7,789 | Ryanair Holdings PLC, ADR (Passenger Airlines)(b) | 861 | ||||||
Shares | Security Description | Value | ||||||
Ireland (Republic of) (continued) | ||||||||
| 5,626 | Smurfit Kappa Group PLC (Containers & Packaging)(a) | $ | 188 | |||||
| 6,824 | ||||||||
Israel — 0.30% | ||||||||
| 1,400 | Azrieli Group Ltd. (Real Estate Management & Development) | 79 | ||||||
| 26,580 | Bank Hapoalim BM (Banks) | 219 | ||||||
| 32,264 | Bank Leumi Le-Israel BM (Banks) | 242 | ||||||
| 52,946 | Bezeq The Israeli Telecommunication Corp. Ltd. (Diversified Telecommunication Services) | 65 | ||||||
| 2,179 | Check Point Software Technologies Ltd. (Software)(b) | 274 | ||||||
| 852 | CyberArk Software Ltd. (Software)(b) | 133 | ||||||
| 1,005 | Elbit Systems Ltd. (Aerospace & Defense) | 211 | ||||||
| 24,014 | ICL Group Ltd. (Chemicals) | 132 | ||||||
| 1 | Isracard Ltd. (Consumer Finance) | — | ||||||
| 25,890 | Israel Discount Bank Ltd., Class - A (Banks) | 129 | ||||||
| 3,229 | Mizrahi Tefahot Bank Ltd. (Banks) | 108 | ||||||
| 401 | Monday.com Ltd. (Software)(b) | 69 | ||||||
| 1,330 | Nice Ltd. (Software)(b) | 273 | ||||||
| 23,245 | Teva Pharmaceutical Industries Ltd., ADR (Pharmaceuticals)(b) | 175 | ||||||
| 1,170 | The First International Bank Of Israel Ltd. (Banks) | 46 | ||||||
| 2,287 | Tower Semiconductor Ltd. (Semiconductors & Semiconductor Equipment)(b) | 85 | ||||||
| 1,198 | Wix.com Ltd. (IT Services)(b) | 94 | ||||||
| 2,334 | ||||||||
Italy — 1.59% | ||||||||
| 4,860 | Amplifon SpA (Health Care Providers & Services) | 178 | ||||||
| 23,833 | Assicurazioni Generali SpA (Insurance) | 485 | ||||||
| 78,646 | Davide Campari-Milano N.V., Class - M (Beverages) | 1,090 | ||||||
| 2,439 | DiaSorin SpA (Health Care Equipment & Supplies) | 254 | ||||||
| 171,886 | Enel SpA (Electric Utilities)(a) | 1,160 | ||||||
| 48,773 | Eni SpA (Oil, Gas & Consumable Fuels) | 702 | ||||||
| 2,682 | Ferrari N.V. (Automobiles) | 872 | ||||||
| 2,917 | Ferrari N.V. (Automobiles) | 953 | ||||||
| 12,577 | FinecoBank Banca Fineco SpA (Banks) | 169 | ||||||
| 22,282 | Infrastrutture Wireless Italiane SpA (Diversified Telecommunication Services)(a) | 294 | ||||||
| 636,657 | Intesa Sanpaolo SpA (Banks)(a) | 1,669 | ||||||
| 12,205 | Mediobanca Banca di Credito Finanziario SpA (Banks) | 146 | ||||||
See accompanying notes to financial statements.
133
HC CAPITAL TRUST
The Institutional International Equity Portfolio
Portfolio of Investments (continued) — June 30, 2023
Shares | Security Description | Value | ||||||
Common Stocks (continued) | ||||||||
Italy (continued) | ||||||||
| 15,446 | Moncler SpA (Textiles, Apparel & Luxury Goods) | $ | 1,068 | |||||
| 11,607 | Nexi SpA (Professional Services)(b) | 91 | ||||||
| 11,327 | Poste Italiane SpA (Insurance) | 123 | ||||||
| 6,299 | Prysmian SpA (Electrical Equipment) | 263 | ||||||
| 4,745 | Recordati Industria Chimica e Farmaceutica SpA (Pharmaceuticals) | 227 | ||||||
| 69,573 | Snam SpA (Gas Utilities) | 363 | ||||||
| 216,022 | Telecom Italia SpA/Milano (Diversified Telecommunication Services)(b) | 61 | ||||||
| 49,447 | Terna - Rete Elettrica Nazionale (Electric Utilities) | 421 | ||||||
| 78,696 | UniCredit SpA (Banks) | 1,831 | ||||||
| 12,420 | ||||||||
Japan — 11.13% | ||||||||
| 4,000 | Advantest Corp. (Semiconductors & Semiconductor Equipment)(a) | 539 | ||||||
| 18,300 | Aeon Co. Ltd. (Consumer Staples Distribution & Retail) | 375 | ||||||
| 4,165 | AGC, Inc. (Building Products)^ | 150 | ||||||
| 3,200 | Aisin Corp. (Automobile Components) | 99 | ||||||
| 13,300 | Ajinomoto Co., Inc. (Food Products) | 529 | ||||||
| 5,000 | ANA Holdings, Inc. (Passenger Airlines)(a)(b) | 119 | ||||||
| 10,100 | Asahi Group Holdings Ltd. (Beverages)^(a) | 392 | ||||||
| 4,700 | Asahi Intecc Co. Ltd. (Health Care Equipment & Supplies) | 93 | ||||||
| 25,710 | Asahi Kasei Corp. (Chemicals) | 174 | ||||||
| 43,690 | Astellas Pharma, Inc. (Pharmaceuticals) | 651 | ||||||
| 2,500 | Azbil Corp. (Electronic Equipment, Instruments & Components) | 79 | ||||||
| 12,900 | Bandai Namco Holdings, Inc. (Leisure Products) | 299 | ||||||
| 2,600 | BayCurrent Consulting, Inc. (Professional Services) | 98 | ||||||
| 11,960 | Bridgestone Corp. (Automobile Components)^ | 491 | ||||||
| 5,100 | Brother Industries Ltd. (Technology Hardware, Storage & Peripherals) | 75 | ||||||
| 22,947 | Canon, Inc. (Technology Hardware, Storage & Peripherals)^ | 604 | ||||||
| 7,000 | Capcom Co. Ltd. (Entertainment) | 278 | ||||||
| 3,700 | Central Japan Railway Co. (Ground Transportation) | 463 | ||||||
| 26,800 | Chubu Electric Power Co., Inc. (Electric Utilities) | 327 | ||||||
| 15,800 | Chugai Pharmaceutical Co. Ltd. (Pharmaceuticals) | 450 | ||||||
| 23,600 | Concordia Financial Group Ltd. (Banks) | 92 | ||||||
| 9,300 | CyberAgent, Inc. (Media) | 68 | ||||||
Shares | Security Description | Value | ||||||
Japan (continued) | ||||||||
| 4,439 | Dai Nippon Printing Co. Ltd. (Commercial Services & Supplies) | $ | 126 | |||||
| 6,600 | Daifuku Co. Ltd. (Machinery) | 136 | ||||||
| 20,500 | Dai-ichi Life Holdings, Inc. (Insurance) | 390 | ||||||
| 39,200 | Daiichi Sankyo Co. Ltd. (Pharmaceuticals) | 1,246 | ||||||
| 5,600 | Daikin Industries Ltd. (Building Products) | 1,148 | ||||||
| 2,047 | Daito Trust Construction Co. Ltd. (Real Estate Management & Development) | 207 | ||||||
| 12,530 | Daiwa House Industry Co. Ltd. (Real Estate Management & Development) | 331 | ||||||
| 123 | Daiwa House REIT Investment Corp. (Diversified REITs) | 235 | ||||||
| 38,300 | Daiwa Securities Group, Inc. (Capital Markets) | 197 | ||||||
| 9,100 | Denso Corp. (Automobile Components) | 614 | ||||||
| 4,270 | Dentsu Group, Inc. (Media) | 140 | ||||||
| 2,000 | Disco Corp. (Semiconductors & Semiconductor Equipment) | 317 | ||||||
| 7,900 | East Japan Railway Co. (Ground Transportation) | 438 | ||||||
| 7,100 | Eisai Co. Ltd. (Pharmaceuticals) | 481 | ||||||
| 93,878 | ENEOS Holdings, Inc. (Oil, Gas & Consumable Fuels) | 322 | ||||||
| 20,400 | FANUC Corp. (Machinery) | 716 | ||||||
| 3,700 | Fast Retailing Co. Ltd. (Specialty Retail) | 949 | ||||||
| 2,500 | Fuji Electric Co. Ltd. (Electrical Equipment) | 110 | ||||||
| 8,610 | FUJIFILM Holdings Corp. (Technology Hardware, Storage & Peripherals) | 513 | ||||||
| 3,650 | Fujitsu Ltd. (IT Services)(a) | 473 | ||||||
| 245 | GLP J-Reit (Industrial REITs)(a) | 242 | ||||||
| 900 | GMO Payment Gateway, Inc. (Financial Services) | 71 | ||||||
| 5,100 | Hakuhodo DY Holdings, Inc. (Media) | 54 | ||||||
| 3,000 | Hamamatsu Photonics KK (Electronic Equipment, Instruments & Components) | 147 | ||||||
| 5,900 | Hankyu Hanshin Holdings, Inc. (Ground Transportation) | 195 | ||||||
| 900 | Hikari Tsushin, Inc. (Specialty Retail) | 129 | ||||||
| 580 | Hirose Electric Co. Ltd. (Electronic Equipment, Instruments & Components) | 77 | ||||||
| 2,200 | Hitachi Construction Machinery Co. Ltd. (Machinery) | 62 | ||||||
| 20,280 | Hitachi Ltd. (Industrial Conglomerates) | 1,261 | ||||||
| 32,754 | Honda Motor Co. Ltd. (Automobile Components) | 992 | ||||||
| 2,400 | Hoshizaki Corp. (Machinery) | 86 | ||||||
| 7,600 | Hoya Corp. (Health Care Equipment & Supplies) | 910 | ||||||
| 8,300 | Hulic Co. Ltd. (Real Estate Management & Development)(a) | 71 | ||||||
| 2,400 | Ibiden Co. Ltd. (Electronic Equipment, Instruments & Components) | 137 | ||||||
See accompanying notes to financial statements.
134
HC CAPITAL TRUST
The Institutional International Equity Portfolio
Portfolio of Investments (continued) — June 30, 2023
Shares | Security Description | Value | ||||||
Common Stocks (continued) | ||||||||
Japan (continued) | ||||||||
| 10,359 | Idemitsu Kosan Co. Ltd. (Oil, Gas & Consumable Fuels)(a) | $ | 207 | |||||
| 3,100 | Iida Group Holdings Co. Ltd. (Household Durables) | 52 | ||||||
| 21,500 | Inpex Corp. (Oil, Gas & Consumable Fuels) | 236 | ||||||
| 11,770 | Isuzu Motors Ltd. (Automobile Components) | 143 | ||||||
| 25,158 | ITOCHU Corp. (Trading Companies & Distributors) | 999 | ||||||
| 7,200 | Itochu Techno-Solutions Corp. (IT Services) | 182 | ||||||
| 3,100 | Japan Airlines Co. Ltd. (Passenger Airlines)(a) | 67 | ||||||
| 10,200 | Japan Exchange Group, Inc. (Capital Markets) | 179 | ||||||
| 298 | Japan Metropolitan Fund Invest (Retail REITs) | 199 | ||||||
| 48,900 | Japan Post Bank Co. Ltd. (Banks)(a) | 381 | ||||||
| 62,060 | Japan Post Holdings Co. Ltd. (Insurance)(a) | 446 | ||||||
| 6,800 | Japan Post Insurance Co. Ltd. (Insurance)(a) | 103 | ||||||
| 70 | Japan Real Estate Investment Corp. (Office REITs) | 267 | ||||||
| 31,927 | Japan Tobacco, Inc. (Tobacco)^ | 699 | ||||||
| 10,700 | JFE Holdings, Inc. (Metals & Mining) | 153 | ||||||
| 3,833 | JSR Corp. (Chemicals) | 110 | ||||||
| 12,700 | Kajima Corp. (Construction & Engineering) | 192 | ||||||
| 13,600 | Kao Corp. (Personal Care Products)^ | 494 | ||||||
| 2,900 | Kawasaki Kisen Kaisha Ltd. (Marine Transportation) | 71 | ||||||
| 36,500 | KDDI Corp. (Wireless Telecommunication Services) | 1,127 | ||||||
| 3,700 | Keio Corp. (Ground Transportation) | 116 | ||||||
| 2,800 | Keisei Electric Railway Co. Ltd. (Ground Transportation) | 116 | ||||||
| 5,800 | Keyence Corp. (Electronic Equipment, Instruments & Components) | 2,757 | ||||||
| 3,000 | Kikkoman Corp. (Food Products) | 171 | ||||||
| 6,000 | Kintetsu Group Holdings Co. Ltd. (Ground Transportation) | 208 | ||||||
| 25,210 | Kirin Holdings Co. Ltd. (Beverages)^ | 368 | ||||||
| 3,500 | Kobayashi Pharmaceutical Co. Ltd. (Personal Care Products) | 190 | ||||||
| 7,800 | Kobe Bussan Co. Ltd. (Consumer Staples Distribution & Retail) | 202 | ||||||
| 7,920 | Koei Tecmo Holdings Co. Ltd. (Entertainment) | 137 | ||||||
| 4,500 | Koito Manufacturing Co. Ltd. (Automobile Components) | 82 | ||||||
| 19,390 | Komatsu Ltd. (Machinery) | 525 | ||||||
| 2,000 | Konami Group Corp. (Entertainment) | 105 | ||||||
| 700 | Kose Corp. (Personal Care Products) | 67 | ||||||
| 21,200 | Kubota Corp. (Machinery) | 310 | ||||||
| 2,300 | Kurita Water Industries Ltd. (Machinery) | 88 | ||||||
Shares | Security Description | Value | ||||||
Japan (continued) | ||||||||
| 6,720 | Kyocera Corp. (Electronic Equipment, Instruments & Components) | $ | 365 | |||||
| 10,200 | Kyowa Kirin Co. Ltd. (Pharmaceuticals) | 189 | ||||||
| 1,600 | Lasertec Corp. (Semiconductors & Semiconductor Equipment) | 242 | ||||||
| 6,245 | Lixil Corp. (Building Products) | 79 | ||||||
| 9,100 | M3, Inc. (Health Care Technology) | 198 | ||||||
| 4,500 | Makita Corp. (Machinery) | 127 | ||||||
| 32,371 | Marubeni Corp. (Trading Companies & Distributors) | 552 | ||||||
| 4,400 | MatsukiyoCocokara & Co. (Consumer Staples Distribution & Retail) | 247 | ||||||
| 12,350 | Mazda Motor Corp. (Automobile Components) | 119 | ||||||
| 6,100 | McDonald’s Holdings Co. Japan Ltd. (Hotels, Restaurants & Leisure) | 237 | ||||||
| 11,800 | MEIJI Holdings Co. Ltd. (Food Products) | 263 | ||||||
| 7,300 | MINEBEA MITSUMI, Inc. (Machinery) | 138 | ||||||
| 5,800 | MISUMI Group, Inc. (Machinery) | 117 | ||||||
| 27,710 | Mitsubishi Chemical Group Corp. (Chemicals) | 167 | ||||||
| 26,240 | Mitsubishi Corp. (Trading Companies & Distributors) | 1,269 | ||||||
| 40,490 | Mitsubishi Electric Corp. (Electrical Equipment) | 572 | ||||||
| 28,000 | Mitsubishi Estate Co. Ltd. (Real Estate Management & Development) | 332 | ||||||
| 23,800 | Mitsubishi HC Capital, Inc. (Financial Services) | 141 | ||||||
| 6,697 | Mitsubishi Heavy Industries Ltd. (Machinery) | 313 | ||||||
| 241,282 | Mitsubishi UFJ Financial Group, Inc. (Banks) | 1,780 | ||||||
| 27,866 | Mitsui & Co. Ltd. (Trading Companies & Distributors) | 1,055 | ||||||
| 3,950 | Mitsui Chemicals, Inc. (Chemicals) | 116 | ||||||
| 19,000 | Mitsui Fudosan Co. Ltd. (Real Estate Management & Development) | 379 | ||||||
| 7,100 | Mitsui O.S.K. Lines Ltd. (Marine Transportation) | 171 | ||||||
| 55,552 | Mizuho Financial Group, Inc. (Banks) | 849 | ||||||
| 12,000 | MonotaRO Co. Ltd. (Trading Companies & Distributors) | 153 | ||||||
| 10,900 | MS&AD Insurance Group Holdings, Inc. (Insurance) | 386 | ||||||
| 12,200 | Murata Manufacturing Co. Ltd. (Electronic Equipment, Instruments & Components) | 701 | ||||||
| 5,930 | NEC Corp. (IT Services) | 288 | ||||||
| 13,500 | Nexon Co. Ltd. (Entertainment) | 259 | ||||||
| 5,200 | NGK Insulators Ltd. (Machinery) | 62 | ||||||
| 9,400 | NIDEC Corp. (Electrical Equipment) | 518 | ||||||
| 25,100 | Nintendo Co. Ltd. (Entertainment) | 1,144 | ||||||
| 75 | Nippon Building Fund, Inc. (Diversified REITs)^ | 295 | ||||||
| 1,500 | NIPPON EXPRESS HOLDINGS, INC. (Air Freight & Logistics)^ | 85 | ||||||
See accompanying notes to financial statements.
135
HC CAPITAL TRUST
The Institutional International Equity Portfolio
Portfolio of Investments (continued) — June 30, 2023
Shares | Security Description | Value | ||||||
Common Stocks (continued) | ||||||||
Japan (continued) | ||||||||
| 19,900 | Nippon Paint Holdings Co. Ltd. (Chemicals)(a) | $ | 165 | |||||
| 121 | Nippon Prologis REIT, Inc. (Industrial REITs)(a) | 243 | ||||||
| 3,800 | Nippon Sanso Holdings Corp. (Chemicals) | 83 | ||||||
| 3,100 | Nippon Shinyaku Co. Ltd. (Pharmaceuticals) | 127 | ||||||
| 16,900 | Nippon Steel Corp. (Metals & Mining)(a) | 354 | ||||||
| 751,000 | Nippon Telegraph & Telephone Corp. (Diversified Telecommunication Services) | 889 | ||||||
| 10,000 | Nippon Yusen KK (Marine Transportation)^ | 222 | ||||||
| 2,500 | Nissan Chemical Corp. (Chemicals) | 108 | ||||||
| 50,300 | Nissan Motor Co. Ltd. (Automobile Components) | 206 | ||||||
| 15,600 | Nisshin Seifun Group, Inc. (Food Products) | 193 | ||||||
| 3,100 | Nissin Foods Holdings Co. Ltd. (Food Products)(a) | 256 | ||||||
| 2,800 | Nitori Holdings Co. Ltd. (Specialty Retail) | 315 | ||||||
| 3,160 | Nitto Denko Corp. (Chemicals) | 235 | ||||||
| 74,000 | Nomura Holdings, Inc. (Capital Markets) | 282 | ||||||
| 2,600 | Nomura Real Estate Holdings, Inc. (Real Estate Management & Development) | 62 | ||||||
| 229 | Nomura Real Estate Master Fund, Inc. (Diversified REITs) | 264 | ||||||
| 11,720 | Nomura Research Institute Ltd. (IT Services) | 324 | ||||||
| 12,900 | NTT Data Group Corp. (IT Services) | 181 | ||||||
| 18,300 | Obayashi Corp. (Construction & Engineering) | 158 | ||||||
| 2,200 | Obic Co. Ltd. (IT Services) | 353 | ||||||
| 9,700 | Odakyu Electric Railway Co. Ltd. (Ground Transportation) | 130 | ||||||
| 38,700 | Oji Holdings Corp. (Paper & Forest Products) | 145 | ||||||
| 25,600 | Olympus Corp. (Health Care Equipment & Supplies) | 405 | ||||||
| 3,800 | Omron Corp. (Electronic Equipment, Instruments & Components) | 233 | ||||||
| 14,700 | Ono Pharmaceutical Co. Ltd. (Pharmaceuticals) | 265 | ||||||
| 1,600 | Open House Group Co. Ltd. (Household Durables)(a) | 58 | ||||||
| 2,300 | Oracle Corp. Japan (Software) | 172 | ||||||
| 25,300 | Oriental Land Co. Ltd. (Hotels, Restaurants & Leisure) | 987 | ||||||
| 25,000 | ORIX Corp. (Financial Services) | 456 | ||||||
| 17,445 | Osaka Gas Co. Ltd. (Gas Utilities) | 268 | ||||||
| 5,500 | Otsuka Corp. (IT Services) | 214 | ||||||
| 10,100 | Otsuka Holdings Co. Ltd. (Pharmaceuticals) | 371 | ||||||
| 13,500 | Pan Pacific International Holdings Corp. (Broadline Retail) | 242 | ||||||
| 46,200 | Panasonic Holdings Corp. (Household Durables) | 567 | ||||||
| 3,800 | Persol Holdings Co. Ltd. (Professional Services)(a) | 69 | ||||||
| 31,600 | Rakuten Group, Inc. (Broadline Retail)(a) | 110 | ||||||
Shares | Security Description | Value | ||||||
Japan (continued) | ||||||||
| 30,600 | Recruit Holdings Co. Ltd. (Professional Services) | $ | 977 | |||||
| 26,700 | Renesas Electronics Corp. (Semiconductors & Semiconductor Equipment)(a)(b) | 504 | ||||||
| 53,885 | Resona Holdings, Inc. (Banks) | 258 | ||||||
| 11,200 | Ricoh Co. Ltd. (Technology Hardware, Storage & Peripherals) | 95 | ||||||
| 1,870 | Rohm Co. Ltd. (Semiconductors & Semiconductor Equipment) | 177 | ||||||
| 5,300 | SBI Holdings, Inc. (Capital Markets) | 102 | ||||||
| 7,100 | SCSK Corp. (IT Services) | 112 | ||||||
| 6,400 | Secom Co. Ltd. (Commercial Services & Supplies) | 433 | ||||||
| 6,069 | Seiko Epson Corp. (Technology Hardware, Storage & Peripherals) | 95 | ||||||
| 7,300 | Sekisui Chemical Co. Ltd. (Household Durables) | 105 | ||||||
| 15,725 | Sekisui House Ltd. (Household Durables) | 318 | ||||||
| 17,630 | Seven & i Holdings Co. Ltd. (Consumer Staples Distribution & Retail) | 762 | ||||||
| 12,400 | SG Holdings Co. Ltd. (Air Freight & Logistics) | 176 | ||||||
| 4,900 | Sharp Corp. (Household Durables)(a) | 27 | ||||||
| 5,100 | Shimadzu Corp. (Electronic Equipment, Instruments & Components) | 158 | ||||||
| 1,600 | Shimano, Inc. (Leisure Products) | 268 | ||||||
| 17,200 | Shimizu Corp. (Construction & Engineering) | 109 | ||||||
| 38,725 | Shin-Etsu Chemical Co. Ltd. (Chemicals) | 1,295 | ||||||
| 7,900 | Shionogi & Co. Ltd. (Pharmaceuticals) | 333 | ||||||
| 8,400 | Shiseido Co. Ltd. (Personal Care Products) | 381 | ||||||
| 24,100 | Shizuoka Financial Group, Inc. (Banks) | 174 | ||||||
| 1,300 | SMC Corp. (Machinery) | 723 | ||||||
| 74,554 | SoftBank Corp. (Wireless Telecommunication Services) | 797 | ||||||
| 21,600 | SoftBank Group Corp. (Wireless Telecommunication Services) | 1,019 | ||||||
| 7,760 | Sompo Holdings, Inc. (Insurance) | 348 | ||||||
| 35,000 | Sony Group Corp. (Household Durables) | 3,160 | ||||||
| 4,300 | Square Enix Holdings Co. Ltd. (Entertainment) | 200 | ||||||
| 13,254 | Subaru Corp. (Automobile Components) | 250 | ||||||
| 7,600 | SUMCO Corp. (Semiconductors & Semiconductor Equipment)^(a) | 108 | ||||||
| 32,260 | Sumitomo Chemical Co. Ltd. (Chemicals) | 98 | ||||||
| 23,540 | Sumitomo Corp. (Trading Companies & Distributors) | 499 | ||||||
| 14,720 | Sumitomo Electric Industries Ltd. (Automobile Components) | 180 | ||||||
| 5,100 | Sumitomo Metal Mining Co. Ltd. (Metals & Mining) | 165 | ||||||
| 46,003 | Sumitomo Mitsui Financial Group, Inc. (Banks) | 1,971 | ||||||
See accompanying notes to financial statements.
136
HC CAPITAL TRUST
The Institutional International Equity Portfolio
Portfolio of Investments (continued) — June 30, 2023
Shares | Security Description | Value | ||||||
Common Stocks (continued) | ||||||||
Japan (continued) | ||||||||
| 8,500 | Sumitomo Mitsui Trust Holdings, Inc. (Banks) | $ | 302 | |||||
| 6,200 | Sumitomo Realty & Development Co. Ltd. (Real Estate Management & Development) | 154 | ||||||
| 6,300 | Suntory Beverage & Food Ltd. (Beverages) | 229 | ||||||
| 7,700 | Suzuki Motor Corp. (Automobile Components) | 279 | ||||||
| 3,500 | Sysmex Corp. (Health Care Equipment & Supplies) | 240 | ||||||
| 11,500 | T&D Holdings, Inc. (Insurance) | 169 | ||||||
| 5,650 | Taisei Corp. (Construction & Engineering) | 198 | ||||||
| 37,745 | Takeda Pharmaceutical Co. Ltd. (Pharmaceuticals) | 1,186 | ||||||
| 8,100 | TDK Corp. (Electronic Equipment, Instruments & Components) | 316 | ||||||
| 14,100 | Terumo Corp. (Health Care Equipment & Supplies) | 449 | ||||||
| 11,500 | The Chiba Bank Ltd. (Banks) | 70 | ||||||
| 29,410 | The Kansai Electric Power Co., Inc. (Electric Utilities) | 369 | ||||||
| 6,300 | TIS, Inc. (IT Services) | 158 | ||||||
| 7,000 | Tobu Railway Co. Ltd. (Ground Transportation) | 187 | ||||||
| 4,100 | Toho Co. Ltd. (Entertainment) | 156 | ||||||
| 39,720 | Tokio Marine Holdings, Inc. (Insurance) | 916 | ||||||
| 54,500 | Tokyo Electric Power Co. Holdings, Inc. (Electric Utilities)(b) | 199 | ||||||
| 9,580 | Tokyo Electron Ltd. (Semiconductors & Semiconductor Equipment) | 1,381 | ||||||
| 15,700 | Tokyo Gas Co. Ltd. (Gas Utilities) | 342 | ||||||
| 11,500 | Tokyu Corp. (Ground Transportation) | 139 | ||||||
| 5,700 | TOPPAN, Inc. (Commercial Services & Supplies) | 123 | ||||||
| 30,100 | Toray Industries, Inc. (Chemicals) | 168 | ||||||
| 12,400 | Toshiba Corp. (Industrial Conglomerates) | 389 | ||||||
| 5,600 | Tosoh Corp. (Chemicals) | 66 | ||||||
| 2,800 | TOTO Ltd. (Building Products) | 85 | ||||||
| 3,200 | Toyota Industries Corp. (Machinery) | 229 | ||||||
| 224,800 | Toyota Motor Corp. (Automobile Components) | 3,614 | ||||||
| 4,600 | Toyota Tsusho Corp. (Trading Companies & Distributors) | 230 | ||||||
| 5,600 | Trend Micro, Inc. (Software) | 271 | ||||||
| 12,100 | Unicharm Corp. (Household Products) | 450 | ||||||
| 8,100 | USS Co. Ltd. (Specialty Retail) | 135 | ||||||
| 9,600 | Welcia Holdings Co. Ltd. (Consumer Staples Distribution & Retail) | 200 | ||||||
| 6,200 | West Japan Railway Co. (Ground Transportation)(a) | 258 | ||||||
| 4,800 | Yakult Honsha Co. Ltd. (Food Products) | 303 | ||||||
| 3,000 | Yamaha Corp. (Leisure Products) | 116 | ||||||
Shares | Security Description | Value | ||||||
Japan (continued) | ||||||||
| 6,100 | Yamaha Motor Co. Ltd. (Automobile Components) | $ | 175 | |||||
| 13,100 | Yamato Holdings Co. Ltd. (Air Freight & Logistics) | 237 | ||||||
| 5,200 | Yaskawa Electric Corp. (Machinery) | 240 | ||||||
| 4,900 | Yokogawa Electric Corp. (Electronic Equipment, Instruments & Components) | 91 | ||||||
| 57,900 | Z Holdings Corp. (Interactive Media & Services) | 140 | ||||||
| 7,100 | ZOZO, Inc. (Specialty Retail)(a) | 147 | ||||||
| 86,820 | ||||||||
Luxembourg — 0.23% | ||||||||
| 40,739 | ArcelorMittal SA (Metals & Mining) | 1,111 | ||||||
| 8,282 | Eurofins Scientific SE (Life Sciences Tools & Services) | 527 | ||||||
| 10,238 | Tenaris SA (Energy Equipment & Services) | 153 | ||||||
| 1,791 | ||||||||
Netherlands — 2.99% | ||||||||
| 12,428 | ABN AMRO Bank N.V. (Banks) | 194 | ||||||
| 963 | Adyen N.V. (Professional Services)(a)(b) | 1,667 | ||||||
| 38,737 | Aegon N.V. (Insurance) | 197 | ||||||
| 4,196 | Akzo Nobel N.V. (Chemicals) | 343 | ||||||
| 1,348 | Argenx SE (Biotechnology)(b) | 526 | ||||||
| 981 | ASM International N.V. (Semiconductors & Semiconductor Equipment) | 416 | ||||||
| 9,753 | ASML Holding N.V. (Semiconductors & Semiconductor Equipment)(a) | 7,073 | ||||||
| 6,080 | Euronext N.V. (Capital Markets) | 414 | ||||||
| 2,231 | EXOR N.V. (Financial Services) | 199 | ||||||
| 10,784 | Ferrovial SE (Construction & Engineering)(b) | 341 | ||||||
| 4,479 | Heineken Holding N.V. (Beverages) | 390 | ||||||
| 14,336 | Heineken N.V. (Beverages) | 1,474 | ||||||
| 1,169 | IMCD N.V. (Trading Companies & Distributors)(a) | 168 | ||||||
| 77,994 | ING Groep N.V. (Banks) | 1,051 | ||||||
| 14,220 | JDE Peet’s N.V. (Food Products)(a) | 423 | ||||||
| 3,961 | Just Eat Takeaway.com N.V. (Hotels, Restaurants & Leisure)(b) | 61 | ||||||
| 29,345 | Koninklijke Ahold Delhaize N.V. (Consumer Staples Distribution & Retail) | 1,001 | ||||||
| 160,923 | Koninklijke KPN N.V. (Diversified Telecommunication Services) | 574 | ||||||
| 19,444 | Koninklijke Philips N.V. (Health Care Equipment & Supplies)(b) | 421 | ||||||
| 9,335 | NN Group N.V. (Insurance) | 345 | ||||||
| 8,885 | OCI N.V. (Chemicals)(a) | 214 | ||||||
| 16,980 | Prosus N.V. (Broadline Retail)(a) | 1,243 | ||||||
| 11,494 | QIAGEN N.V. (Life Sciences Tools & Services)(b) | 517 | ||||||
| 2,592 | Randstad N.V. (Professional Services) | 137 | ||||||
See accompanying notes to financial statements.
137
HC CAPITAL TRUST
The Institutional International Equity Portfolio
Portfolio of Investments (continued) — June 30, 2023
Shares | Security Description | Value | ||||||
Common Stocks (continued) | ||||||||
Netherlands (continued) | ||||||||
| 47,699 | Stellantis N.V. (Automobile Components) | $ | 839 | |||||
| 48,804 | Stellantis N.V. (Automobiles) | 856 | ||||||
| 17,214 | Universal Music Group N.V. (Entertainment) | 382 | ||||||
| 14,195 | Wolters Kluwer N.V. (Professional Services) | 1,801 | ||||||
| 23,267 | ||||||||
New Zealand — 0.11% | ||||||||
| 25,333 | Auckland International Airport Ltd. (Transportation Infrastructure)(b) | 133 | ||||||
| 12,606 | Fisher & Paykel Healthcare Corp. Ltd. (Health Care Equipment & Supplies) | 190 | ||||||
| 14,981 | Mercury NZ Ltd. (Electric Utilities) | 60 | ||||||
| 27,865 | Meridian Energy Ltd. (Independent Power and Renewable Electricity Producers) | 96 | ||||||
| 40,576 | Spark New Zealand Ltd. (Diversified Telecommunication Services) | 127 | ||||||
| 3,015 | Xero Ltd. (Software)(b) | 241 | ||||||
| 847 | ||||||||
Norway — 0.51% | ||||||||
| 12,363 | Adevinta ASA (Interactive Media & Services)(b) | 82 | ||||||
| 6,851 | Aker BP ASA (Oil, Gas & Consumable Fuels) | 161 | ||||||
| 64,614 | DNB Bank ASA (Banks) | 1,209 | ||||||
| 48,593 | Equinor ASA (Oil, Gas & Consumable Fuels) | 1,416 | ||||||
| 7,992 | Gjensidige Forsikring ASA (Insurance) | 128 | ||||||
| 1,922 | Kongsberg Gruppen ASA (Aerospace & Defense) | 87 | ||||||
| 8,969 | Mowi ASA (Food Products)(a) | 142 | ||||||
| 27,809 | Norsk Hydro ASA (Metals & Mining) | 166 | ||||||
| 30,490 | Orkla ASA (Food Products) | 219 | ||||||
| 1,417 | Salmar ASA (Food Products) | 57 | ||||||
| 21,384 | Telenor ASA (Diversified Telecommunication Services) | 217 | ||||||
| 3,344 | Yara International ASA (Chemicals) | 118 | ||||||
| 4,002 | ||||||||
Portugal — 0.08% | ||||||||
| 61,298 | EDP - Energias de Portugal SA (Electric Utilities) | 300 | ||||||
| 10,867 | Galp Energia SGPS SA (Oil, Gas & Consumable Fuels)(a) | 127 | ||||||
| 5,749 | Jeronimo Martins SGPS SA (Consumer Staples Distribution & Retail)(a) | 158 | ||||||
| 585 | ||||||||
Singapore — 0.68% | ||||||||
| 108,938 | CapitaLand Ascendas REIT (Industrial REITs) | 219 | ||||||
| 115,024 | CapitaLand Integrated Commercial Trust (Retail REITs) | 163 | ||||||
| 67,900 | CapitaLand Investment Ltd. (Real Estate Management & Development) | 167 | ||||||
Shares | Security Description | Value | ||||||
Singapore (continued) | ||||||||
| 10,900 | City Developments Ltd. (Real Estate Management & Development) | $ | 54 | |||||
| 37,931 | DBS Group Holdings Ltd. (Banks) | 887 | ||||||
| 132,400 | Genting Singapore Ltd. (Hotels, Restaurants & Leisure) | 92 | ||||||
| 39,246 | Grab Holdings Ltd. (Ground Transportation)(b) | 135 | ||||||
| 3,900 | Jardine Cycle & Carriage Ltd. (Industrial Conglomerates) | 100 | ||||||
| 31,600 | Keppel Corp. Ltd. (Industrial Conglomerates) | 157 | ||||||
| 161,090 | Mapletree Logistics Trust (Industrial REITs) | 194 | ||||||
| 51,100 | Mapletree Pan Asia Commercial Trust (Retail REITs) | 61 | ||||||
| 70,837 | Oversea-Chinese Banking Corp. Ltd. (Banks) | 646 | ||||||
| 7,729 | Sea Ltd., ADR (Entertainment)(b) | 449 | ||||||
| 920,887 | Seatrium Ltd. (Machinery)(b) | 85 | ||||||
| 26,700 | Singapore Airlines Ltd. (Passenger Airlines)(a) | 141 | ||||||
| 34,900 | Singapore Exchange Ltd. (Capital Markets) | 249 | ||||||
| 66,800 | Singapore Technologies Engineering Ltd. (Aerospace & Defense) | 183 | ||||||
| 201,640 | Singapore Telecommunications Ltd. (Diversified Telecommunication Services) | 373 | ||||||
| 26,600 | United Overseas Bank Ltd. (Banks) | 552 | ||||||
| 10,100 | UOL Group Ltd. (Real Estate Management & Development) | 48 | ||||||
| 14,900 | Venture Corp. Ltd. (Electronic Equipment, Instruments & Components) | 163 | ||||||
| 63,600 | Wilmar International Ltd. (Food Products) | 179 | ||||||
| 5,297 | ||||||||
South Korea — 0.12% | ||||||||
| 648 | Samsung Electronics Co. Ltd., GDR (Technology Hardware, Storage & Peripherals) | 898 | ||||||
Spain — 1.35% | ||||||||
| 693 | Acciona SA (Electric Utilities) | 118 | ||||||
| 4,537 | ACS Actividades de Construccion y Servicios SA (Construction & Engineering) | 160 | ||||||
| 1,626 | Aena SME SA (Transportation Infrastructure) | 263 | ||||||
| 20,308 | Amadeus IT Group SA (Professional Services)(b) | 1,546 | ||||||
| 126,206 | Banco Bilbao Vizcaya Argentaria SA (Banks) | 970 | ||||||
| 351,496 | Banco Santander SA (Banks)(a) | 1,301 | ||||||
| 92,787 | CaixaBank SA (Banks) | 384 | ||||||
| 17,953 | Cellnex Telecom SA (Diversified Telecommunication Services)(a) | 725 | ||||||
| 6,223 | Corp. ACCIONA Energias Renovables SA (Independent Power and Renewable Electricity Producers) | 208 | ||||||
| 5,363 | EDP Renovaveis SA (Independent Power and Renewable Electricity Producers) | 107 | ||||||
| 14,785 | Enagas SA (Gas Utilities)(a) | 290 | ||||||
See accompanying notes to financial statements.
138
HC CAPITAL TRUST
The Institutional International Equity Portfolio
Portfolio of Investments (continued) — June 30, 2023
Shares | Security Description | Value | ||||||
Common Stocks (continued) | ||||||||
Spain (continued) | ||||||||
| 11,745 | Endesa SA (Electric Utilities) | $ | 253 | |||||
| 18,109 | Grifols SA (Biotechnology)(b) | 232 | ||||||
| 129,841 | Iberdrola SA (Electric Utilities) | 1,696 | ||||||
| 23,114 | Industria de Diseno Textil SA (Specialty Retail) | 896 | ||||||
| 4,978 | Naturgy Energy Group SA (Gas Utilities) | 148 | ||||||
| 21,150 | Redeia Corp. SA (Electric Utilities) | 356 | ||||||
| 28,828 | Repsol SA (Oil, Gas & Consumable Fuels) | 419 | ||||||
| 108,785 | Telefonica SA (Diversified Telecommunication Services) | 442 | ||||||
| 10,514 | ||||||||
Sweden — 1.56% | ||||||||
| 6,011 | Alfa Laval AB (Machinery) | 219 | ||||||
| 20,977 | Assa Abloy AB, Class - B (Building Products) | 504 | ||||||
| 56,217 | Atlas Copco AB, Class - A (Machinery) | 811 | ||||||
| 32,668 | Atlas Copco AB, Class - B (Machinery) | 407 | ||||||
| 8,995 | Autoliv, Inc. (Automobile Components) | 764 | ||||||
| 8,154 | Beijer Ref AB (Trading Companies & Distributors) | 104 | ||||||
| 6,741 | Boliden AB (Metals & Mining) | 196 | ||||||
| 3,950 | Electrolux AB, Class - B (Household Durables) | 54 | ||||||
| 24,628 | Embracer Group AB (Entertainment)(b) | 61 | ||||||
| 13,793 | Epiroc AB, Class - A (Machinery) | 261 | ||||||
| 8,455 | Epiroc AB, Class - B (Machinery) | 137 | ||||||
| 7,094 | EQT AB (Capital Markets) | 137 | ||||||
| 18,212 | Essity AB, Class - B (Household Products) | 486 | ||||||
| 3,905 | Evolution AB (Hotels, Restaurants & Leisure) | 495 | ||||||
| 13,679 | Fastighets AB Balder, Class - B (Real Estate Management & Development)(b) | 50 | ||||||
| 8,431 | Getinge AB, Class - B (Health Care Equipment & Supplies) | 148 | ||||||
| 15,159 | H & M Hennes & Mauritz AB, Class - B (Specialty Retail) | 261 | ||||||
| 43,619 | Hexagon AB, Class - B (Electronic Equipment, Instruments & Components) | 537 | ||||||
| 5,224 | Holmen AB, Class - B (Paper & Forest Products) | 188 | ||||||
| 9,097 | Husqvarna AB, Class - B (Machinery) | 83 | ||||||
| 2,827 | Industrivarden AB, Class - A (Financial Services)(a) | 78 | ||||||
| 3,339 | Industrivarden AB, Class - C (Financial Services) | 92 | ||||||
| 5,924 | Indutrade AB (Machinery) | 134 | ||||||
| 3,210 | Investment AB Latour, Class - B (Industrial Conglomerates) | 64 | ||||||
| 10,361 | Investor AB, Class - A (Financial Services) | 207 | ||||||
| 36,364 | Investor AB, Class - B (Financial Services) | 727 | ||||||
| 4,359 | Kinnevik AB, Class - B (Financial Services)(b) | 60 | ||||||
| 2,267 | L E Lundbergforetagen AB, Class - B (Financial Services) | 96 | ||||||
| 4,621 | Lifco AB, Class - B (Industrial Conglomerates) | 101 | ||||||
Shares | Security Description | Value | ||||||
Sweden (continued) | ||||||||
| 31,718 | Nibe Industrier AB, Class - B (Building Products) | $ | 302 | |||||
| 1,682 | Saab AB, Class - B (Aerospace & Defense) | 91 | ||||||
| 3,731 | Sagax AB, Class - B (Real Estate Management & Development) | 74 | ||||||
| 22,315 | Sandvik AB (Machinery) | 436 | ||||||
| 19,054 | Securitas AB, Class - B (Commercial Services & Supplies) | 157 | ||||||
| 37,901 | Skandinaviska Enskilda Banken AB, Class - A (Banks) | 419 | ||||||
| 7,376 | Skanska AB, Class - B (Construction & Engineering) | 104 | ||||||
| 7,765 | SKF AB, Class - B (Machinery) | 135 | ||||||
| 20,930 | Svenska Cellulosa AB SCA, Class - B (Paper & Forest Products) | 268 | ||||||
| 43,647 | Svenska Handelsbanken AB, Class - A (Banks) | 366 | ||||||
| 24,283 | Swedbank AB, Class - A (Banks) | 410 | ||||||
| 9,737 | Swedish Orphan Biovitrum AB (Biotechnology)(b) | 191 | ||||||
| 25,851 | Tele2 AB, Class - B (Wireless Telecommunication Services) | 214 | ||||||
| 80,620 | Telefonaktiebolaget LM Ericsson, Class - B (Communications Equipment) | 438 | ||||||
| 112,832 | Telia Co. AB (Diversified Telecommunication Services)(a) | 248 | ||||||
| 4,341 | Volvo AB, Class - A (Machinery) | 93 | ||||||
| 32,071 | Volvo AB, Class - B (Machinery) | 664 | ||||||
| 12,919 | Volvo Car AB, Class - B (Automobile Components)(b) | 51 | ||||||
| 12,123 | ||||||||
Switzerland — 6.23% | ||||||||
| 33,297 | ABB Ltd., Registered Shares (Electrical Equipment) | 1,310 | ||||||
| 3,469 | Adecco Group AG (Professional Services)(a) | 114 | ||||||
| 20,414 | Alcon, Inc. (Health Care Equipment & Supplies) | 1,694 | ||||||
| 720 | Bachem Holding AG (Life Sciences Tools & Services) | 63 | ||||||
| 2,985 | Baloise Holding AG, Registered Shares (Insurance) | 439 | ||||||
| 5,690 | Banque Cantonale Vaudoise, Registered Shares (Banks) | 601 | ||||||
| 273 | Barry Callebaut AG, Registered Shares (Food Products)(a) | 528 | ||||||
| 2,653 | BKW AG (Electric Utilities) | 469 | ||||||
| 5 | Chocoladefabriken Lindt & Spruengli AG (Food Products) | 620 | ||||||
| 23 | Chocoladefabriken Lindt & Spruengli AG, Class - PC (Food Products) | 289 | ||||||
See accompanying notes to financial statements.
139
HC CAPITAL TRUST
The Institutional International Equity Portfolio
Portfolio of Investments (continued) — June 30, 2023
Shares | Security Description | Value | ||||||
Common Stocks (continued) | ||||||||
Switzerland (continued) | ||||||||
| 15,553 | Cie Financiere Richemont SA, Registered Shares (Textiles, Apparel & Luxury Goods) | $ | 2,643 | |||||
| 4,678 | Clariant AG, Registered Shares (Chemicals) | 68 | ||||||
| 4,692 | Coca-Cola HBC AG (Beverages) | 140 | ||||||
| 3,789 | Koninklijke DSM NV (Chemicals)(b) | 408 | ||||||
| 2,088 | Dufry AG, Registered Shares (Specialty Retail)(a)(b) | 95 | ||||||
| 140 | EMS-Chemie Holding AG (Chemicals) | 106 | ||||||
| 751 | Geberit AG, Registered Shares (Building Products) | 394 | ||||||
| 239 | Givaudan SA, Registered Shares (Chemicals) | 793 | ||||||
| 370,228 | Glencore PLC (Metals & Mining)(a) | 2,099 | ||||||
| 780 | Helvetia Holding AG, Registered Shares (Insurance) | 106 | ||||||
| 12,428 | Holcim AG (Construction Materials)(a) | 838 | ||||||
| 4,475 | Julius Baer Group Ltd. (Capital Markets) | 282 | ||||||
| 1,505 | Kuehne + Nagel International AG, Registered Shares (Marine Transportation) | 446 | ||||||
| 3,586 | Logitech International SA, Registered Shares (Technology Hardware, Storage & Peripherals) | 214 | ||||||
| 2,785 | Lonza Group AG, Registered Shares (Life Sciences Tools & Services)(a) | 1,665 | ||||||
| 67,301 | Nestle SA, Registered Shares (Food Products) | 8,097 | ||||||
| 53,647 | Novartis AG, Registered Shares (Pharmaceuticals) | 5,410 | ||||||
| 475 | Partners Group Holding AG (Capital Markets) | 448 | ||||||
| 3,528 | Roche Holding AG (Pharmaceuticals) | 1,159 | ||||||
| 14,883 | Roche Holding AG (Pharmaceuticals) | 4,548 | ||||||
| 883 | Schindler Holding AG (Machinery) | 207 | ||||||
| 888 | Schindler Holding AG, Registered Shares (Machinery) | 200 | ||||||
| 5,674 | SGS SA, Registered Shares (Professional Services)(a) | 537 | ||||||
| 16,777 | SIG Group AG (Containers & Packaging)(a) | 464 | ||||||
| 5,870 | Sika AG, Registered Shares (Chemicals)(a) | 1,682 | ||||||
| 1,088 | Sonova Holding AG (Health Care Equipment & Supplies)(a) | 290 | ||||||
| 32,910 | STMicroelectronics N.V. (Semiconductors & Semiconductor Equipment) | 1,641 | ||||||
| 2,336 | Straumann Holding AG, Registered Shares (Health Care Equipment & Supplies) | 380 | ||||||
| 645 | Swiss Life Holding AG (Insurance) | 378 | ||||||
| 6,651 | Swiss Prime Site AG, Registered Shares (Real Estate Management & Development) | 578 | ||||||
| 7,655 | Swiss Re AG (Insurance) | 771 | ||||||
Shares | Security Description | Value | ||||||
Switzerland (continued) | ||||||||
| 1,315 | Swisscom AG, Registered Shares (Diversified Telecommunication Services) | $ | 821 | |||||
| 1,379 | Temenos AG, Registered Shares (Software) | 110 | ||||||
| 1,141 | The Swatch Group AG (Textiles, Apparel & Luxury Goods) | 63 | ||||||
| 598 | The Swatch Group AG (Textiles, Apparel & Luxury Goods) | 175 | ||||||
| 110,472 | UBS Group AG (Capital Markets) | 2,240 | ||||||
| 557 | VAT Group AG (Machinery) | 231 | ||||||
| 3,693 | Zurich Insurance Group AG (Insurance) | 1,757 | ||||||
| 48,611 | ||||||||
Taiwan — 0.12% | ||||||||
| 9,173 | Taiwan Semiconductor Manufacturing Co. Ltd., ADR (Semiconductors & Semiconductor Equipment) | 926 | ||||||
United Kingdom — 8.21% | ||||||||
| 20,370 | 3i Group PLC (Capital Markets) | 505 | ||||||
| 42,449 | abrdn PLC (Capital Markets) | 118 | ||||||
| 14,509 | Admiral Group PLC (Insurance) | 384 | ||||||
| 26,928 | Anglo American PLC (Metals & Mining) | 767 | ||||||
| 22,427 | Ashtead Group PLC (Trading Companies & Distributors) | 1,555 | ||||||
| 7,323 | Associated British Foods PLC (Food Products) | 185 | ||||||
| 39,562 | AstraZeneca PLC (Pharmaceuticals)(a) | 5,672 | ||||||
| 45,693 | Auto Trader Group PLC (Interactive Media & Services)(a) | 355 | ||||||
| 58,667 | Aviva PLC (Insurance) | 295 | ||||||
| 148,536 | BAE Systems PLC (Aerospace & Defense) | 1,751 | ||||||
| 738,838 | Barclays PLC (Banks)(a) | 1,443 | ||||||
| 20,601 | Barratt Developments PLC (Household Durables)(a) | 108 | ||||||
| 3,372 | Berkeley Group Holdings PLC (Household Durables) | 168 | ||||||
| 504,820 | BP PLC (Oil, Gas & Consumable Fuels) | 2,939 | ||||||
| 48,779 | British American Tobacco PLC (Tobacco) | 1,620 | ||||||
| 163,302 | BT Group PLC (Diversified Telecommunication Services) | 254 | ||||||
| 14,160 | Bunzl PLC (Trading Companies & Distributors) | 539 | ||||||
| 8,054 | Burberry Group PLC (Textiles, Apparel & Luxury Goods)(a) | 217 | ||||||
| 119,463 | Centrica PLC (Multi-Utilities)(a) | 188 | ||||||
| 21,417 | CNH Industrial N.V. (Machinery) | 309 | ||||||
| 5,788 | Coca-Cola Europacific Partners PLC (Beverages) | 373 | ||||||
| 65,807 | Compass Group PLC (Hotels, Restaurants & Leisure) | 1,842 | ||||||
| 5,852 | Croda International PLC (Chemicals)(a) | 418 | ||||||
| 67,034 | Diageo PLC (Beverages) | 2,882 | ||||||
| 3,900 | Endeavour Mining PLC (Metals & Mining) | 94 | ||||||
| 13,508 | Entain PLC (Hotels, Restaurants & Leisure)(a) | 218 | ||||||
See accompanying notes to financial statements.
140
HC CAPITAL TRUST
The Institutional International Equity Portfolio
Portfolio of Investments (continued) — June 30, 2023
Shares | Security Description | Value | ||||||
Common Stocks (continued) | ||||||||
United Kingdom (continued) | ||||||||
| 140,499 | GSK PLC (Pharmaceuticals) | $ | 2,489 | |||||
| 106,300 | Haleon PLC (Personal Care Products) | 436 | ||||||
| 11,553 | Halma PLC (Electronic Equipment, Instruments & Components) | 334 | ||||||
| 12,076 | Hargreaves Lansdown PLC (Capital Markets) | 125 | ||||||
| 14,801 | Hikma Pharmaceuticals PLC (Pharmaceuticals)(a) | 356 | ||||||
| 422,221 | HSBC Holdings PLC (Banks) | 3,344 | ||||||
| 23,234 | Imperial Brands PLC (Tobacco) | 514 | ||||||
| 29,827 | Informa PLC (Media) | 275 | ||||||
| 3,670 | InterContinental Hotels Group PLC (Hotels, Restaurants & Leisure) | 254 | ||||||
| 6,430 | Intertek Group PLC (Professional Services) | 348 | ||||||
| 132,744 | J Sainsbury PLC (Consumer Staples Distribution & Retail) | 453 | ||||||
| 56,070 | JD Sports Fashion PLC (Specialty Retail) | 104 | ||||||
| 3,970 | Johnson Matthey PLC (Chemicals) | 88 | ||||||
| 100,633 | Kingfisher PLC (Specialty Retail) | 297 | ||||||
| 14,172 | Land Securities Group PLC (Diversified REITs) | 104 | ||||||
| 125,009 | Legal & General Group PLC (Insurance) | 362 | ||||||
| 1,408,093 | Lloyds Banking Group PLC (Banks) | 780 | ||||||
| 19,433 | London Stock Exchange Group PLC (Capital Markets) | 2,068 | ||||||
| 46,682 | M&G PLC (Financial Services) | 114 | ||||||
| 10,527 | Mondi PLC (Paper & Forest Products) | 161 | ||||||
| 100,545 | National Grid PLC (Multi-Utilities) | 1,333 | ||||||
| 358,830 | NatWest Group PLC (Banks)(a) | 1,096 | ||||||
| 2,685 | Next PLC (Broadline Retail) | 235 | ||||||
| 35,575 | Ocado Group PLC (Consumer Staples Distribution & Retail)(a)(b) | 258 | ||||||
| 29,225 | Pearson PLC (Diversified Consumer Services) | 306 | ||||||
| 6,326 | Persimmon PLC (Household Durables) | 82 | ||||||
| 16,260 | Phoenix Group Holdings PLC (Insurance) | 110 | ||||||
| 19,764 | Reckitt Benckiser Group PLC (Household Products) | 1,485 | ||||||
| 70,366 | RELX PLC (Professional Services) | 2,347 | ||||||
| 88,467 | Rentokil Initial PLC (Commercial Services & Supplies) | 691 | ||||||
| 36,634 | Rio Tinto PLC (Metals & Mining) | 2,327 | ||||||
| 180,355 | Rolls-Royce Holdings PLC (Aerospace & Defense)(b) | 347 | ||||||
| 19,339 | Schroders PLC (Capital Markets) | 108 | ||||||
| 55,886 | Segro PLC (Diversified REITs) | 509 | ||||||
| 14,824 | Severn Trent PLC (Water Utilities)(a) | 483 | ||||||
| 171,186 | Shell PLC (Oil, Gas & Consumable Fuels) | 5,107 | ||||||
| 18,860 | Smith & Nephew PLC (Health Care Equipment & Supplies) | 304 | ||||||
| 7,389 | Smiths Group PLC (Industrial Conglomerates) | 155 | ||||||
Shares | Security Description | Value | ||||||
United Kingdom (continued) | ||||||||
| 2,829 | Spirax-Sarco Engineering PLC (Machinery) | $ | 373 | |||||
| 30,366 | SSE PLC (Electric Utilities) | 712 | ||||||
| 11,795 | St. James’s Place PLC (Capital Markets) | 163 | ||||||
| 51,497 | Standard Chartered PLC (Banks) | 448 | ||||||
| 76,573 | Taylor Wimpey PLC (Household Durables)(a) | 100 | ||||||
| 242,238 | Tesco PLC (Consumer Staples Distribution & Retail) | 764 | ||||||
| 19,092 | The British Land Co. PLC (Diversified REITs) | 74 | ||||||
| 44,682 | The Sage Group PLC (Software) | 525 | ||||||
| 74,560 | Unilever PLC (Personal Care Products) | 3,882 | ||||||
| 38,006 | United Utilities Group PLC (Water Utilities) | 465 | ||||||
| 559,234 | Vodafone Group PLC (Wireless Telecommunication Services) | 527 | ||||||
| 4,370 | Whitbread PLC (Hotels, Restaurants & Leisure) | 188 | ||||||
| 12,917 | Wise PLC, Class - A (Professional Services)(b) | 108 | ||||||
| 22,414 | WPP PLC (Media) | 235 | ||||||
| 64,052 | ||||||||
United States — 0.12% | ||||||||
| 3,085 | Brookfield Renewable Corp., Class - A (Independent Power and Renewable Electricity Producers)(a) | 97 | ||||||
| 2,131 | Linde PLC (Chemicals) | 812 | ||||||
| 909 | ||||||||
Total Common Stocks | 439,188 | |||||||
Investment Companies — 41.25% | ||||||||
| 979,176 | Aberdeen New Dawn Investment Trust PLC | 3,171 | ||||||
| 281,229 | Aberforth Smaller Companies Trust PLC | 4,408 | ||||||
| 516,982 | Abrdn UK Smaller Cos Growth Trust PLC | 2,720 | ||||||
| 52,256 | Argo Investments Ltd. | 305 | ||||||
| 149,766 | ASA Gold and Precious Metals Ltd. | 2,227 | ||||||
| 131,617 | Australian Foundation Investment Co. Ltd. | 620 | ||||||
| 1,614,892 | AVI Japan Opportunity Trust PLC | 2,423 | ||||||
| 2,187,263 | Baillie Gifford European Growth Trust PLC | 2,620 | ||||||
| 1,011,152 | Baillie Gifford UK Growth Trust PLC | 2,110 | ||||||
| 309,756 | Bellevue Healthcare Trust PLC | 602 | ||||||
| 12,000 | BlackRock Greater Europe Investment Trust PLC | 82 | ||||||
| 293,580 | BlackRock Health Sciences Term Trust | 4,821 | ||||||
| 529,465 | BlackRock Innovation and Growth Term Trust | 4,156 | ||||||
| 61,202 | BlackRock Resources & Commodities Strategy Trust | 555 | ||||||
| 183,848 | BlackRock Science and Technology Term Trust | 3,329 | ||||||
| 39,539 | CBRE Global Real Estate Income Fund | 207 | ||||||
| 641,155 | CC Japan Income & Growth Trust PLC | 1,351 | ||||||
| 578,229 | European Opportunities Trust PLC | 5,700 | ||||||
| 420,050 | Federated Hermes Treasury Obligations Fund, Institutional Shares, 4.75%^^(d) | 420 | ||||||
| 415,147 | Fidelity Emerging Markets Ltd. | 3,097 | ||||||
See accompanying notes to financial statements.
141
HC CAPITAL TRUST
The Institutional International Equity Portfolio
Portfolio of Investments (continued) — June 30, 2023
Shares | Security Description | Value | ||||||
Investment Companies (continued) | ||||||||
| 779,353 | Fidelity European Trust PLC | $ | 3,416 | |||||
| 1,499,221 | Fidelity Japan Trust PLC | 3,259 | ||||||
| 1,012,300 | Fidelity Special Values PLC | 3,355 | ||||||
| 2,118,994 | Henderson European Focus Trust PLC | 4,264 | ||||||
| 1,628,376 | Henderson EuroTrust PLC | 2,810 | ||||||
| 799,221 | Japan Smaller Capitalization Fund, Inc. | 5,754 | ||||||
| 1,616,619 | JPMorgan European Discovery Trust PLC | 7,987 | ||||||
| 7,332,712 | JPMorgan European Growth & Income PLC | 8,598 | ||||||
| 579,234 | JPMorgan Japan Small Cap Growth & Income PLC | 2,298 | ||||||
| 1,081,724 | JPMorgan Japanese Investment Trust PLC | 6,727 | ||||||
| 206,603 | JPMorgan US Smaller Cos. Investment Trust PLC | 987 | ||||||
| 1,670,107 | Mercantile Investment Trust PLC | 4,129 | ||||||
| 165,010 | Morgan Stanley China A Share Fund, Inc. | 2,097 | ||||||
| 633,490 | Neuberger Berman Energy Infrastructure and Income Fund, Inc. | 4,358 | ||||||
| 508,103 | Neuberger Berman Next Generation Connectivity Fund, Inc. | 5,543 | ||||||
| 784,267 | Oakley Capital Investments Ltd. | 4,377 | ||||||
| 2,038,104 | Polar Capital Global Financials Trust PLC | 3,572 | ||||||
| 194,800 | Polar Capital Global Healthcare Trust PLC | 820 | ||||||
| 2,396,500 | Regal Asian Investments Ltd.^ | 3,336 | ||||||
| 2,692,880 | Schroder Japan Trust PLC | 7,657 | ||||||
| 10,089,219 | Schroders Capital Global Innovation Trust | 1,608 | ||||||
| 219,097 | Smithson Investment Trust PLC | 3,899 | ||||||
| 151,285,973 | State Street Institutional Treasury Plus Money Market Fund, Trust Class, 4.97%(d) | 151,286 | ||||||
| 1,104,841 | Strategic Equity Capital PLC | 4,335 | ||||||
| 1,151,235 | Temple Bar Investment Trust PLC | 3,247 | ||||||
| 2,366,780 | Templeton Emerging Markets Investment Trust PLC | 4,407 | ||||||
| 325,445 | The Baillie Gifford Japan Trust PLC | 3,214 | ||||||
| 612,191 | The Edinburgh Investment Trust PLC | 4,980 | ||||||
Shares | Security Description | Value | ||||||
Investment Companies (continued) | ||||||||
| 2,125,905 | The European Smaller Cos. | $ | 4,169 | |||||
| 214,427 | The Monks Investment Trust PLC | 2,699 | ||||||
| 229,330 | The New Germany Fund, Inc. | 2,059 | ||||||
| 1,051,296 | WAM Global Ltd. | 1,302 | ||||||
| 100,815 | Worldwide Healthcare Trust PLC/Fund | 4,050 | ||||||
Total Investment Companies | 321,523 | |||||||
Purchased Options on Futures — 0.02% | ||||||||
Total Purchased Options on Futures | 124 | |||||||
Total Investments (cost $664,997) — 97.62% | 760,835 | |||||||
Other assets in excess of liabilities — 2.38% | 18,543 | |||||||
Net Assets — 100.00% | $ | 779,378 | ||||||
Amounts designated as “—” are $0 or have been rounded to $0.
^ | All or part of this security was on loan as of June 30, 2023. |
^^ | Purchased with cash collateral held from securities lending. The value of the collateral could include collateral held for securities that were sold on or before June 30, 2023. |
(a) | Represents a security purchased under Rule 144A or Section 4(2) and is exempt from registration under the Securities Act of 1933, as amended, or is otherwise restricted to resale. Certain of these securities may be resold in transactions exempt from registration, normally to qualified institutional buyers. These securities have been deemed liquid by the Specialist Manager. |
(b) | Represents non-income producing security. |
(c) | Security was valued using significant unobservable inputs as of June 30, 2023. |
(d) | Annualized 7-day yield as of period-end. |
ADR—American Depositary Receipt |
GDR—Global Depositary Receipt |
REIT—Real Estate Investment Trust |
See accompanying notes to financial statements.
142
HC CAPITAL TRUST
The Institutional International Equity Portfolio
Portfolio of Investments (continued) — June 30, 2023
The following table reflects the percentage of total net assets of the Portfolio attributable to each Specialist Manager as of June 30, 2023.
The Institutional International Equity Portfolio | City of London | Mellon | Parametric | HC Capital | Total |
Common Stocks | — | 56.35% | — | — | 56.35% |
Investment Companies | 21.95% | 0.07% | 19.22% | 0.01% | 41.25% |
Purchased Options on Futures | — | — | 0.02% | — | 0.02% |
Other Assets (Liabilities) | 0.07% | 0.41% | 1.41% | 0.49% | 2.38% |
Total Net Assets | 22.02% | 56.83% | 20.65% | 0.50% | 100.00% |
Amounts designated as “—” indicate the Specialist Manager did not manage any holdings in that category.
The following table reflects the open derivative positions held by the Portfolio as of June 30, 2023.
Futures Contracts Purchased*
Description | Number of | Expiration Date | Notional | Value and | ||||||||||||
MSCI EAFE Index Future | 1,547 | 9/15/23 | $ | 166,728 | $ | 1,366 | ||||||||||
| $ | 166,728 | $ | 1,366 | |||||||||||||
Futures Contracts Sold*
Description | Number of | Expiration Date | Notional | Value and | ||||||||||||
E-Mini S&P 500 Future | 29 | 9/15/23 | $ | 6,508 | $ | (207 | ) | |||||||||
| $ | 6,508 | $ | (207 | ) | ||||||||||||
Total Unrealized Appreciation | $ | 1,366 | ||||||||||||||
Total Unrealized Depreciation | (207 | ) | ||||||||||||||
Total Net Unrealized Appreciation/(Depreciation) | $ | 1,159 | ||||||||||||||
* | Cash has been pledged as collateral for futures contracts held by the Portfolio. |
See accompanying notes to financial statements.
143
HC CAPITAL TRUST
The Institutional International Equity Portfolio
Portfolio of Investments (continued) — June 30, 2023
Options on Futures Contracts
Exchange-traded options on futures contacts written as of June 30, 2023 were as follows:
Description | Put/Call | Number of | Notional | Exercise | Expiration | Value | ||||||||||||||||||
E-Mini S&P 500 Future Option | Put | 17 | $ | 3,681 | $ | 4,330.00 | 7/14/23 | $ | (4 | ) | ||||||||||||||
E-Mini S&P 500 Future Option | Put | 17 | 3,698 | 4,350.00 | 7/14/23 | (4 | ) | |||||||||||||||||
E-Mini S&P 500 Future Option | Put | 18 | 3,402 | 3,780.00 | 7/21/23 | (1 | ) | |||||||||||||||||
E-Mini S&P 500 Future Option | Put | 17 | 3,128 | 3,680.00 | 7/21/23 | (1 | ) | |||||||||||||||||
E-Mini S&P 500 Future Option | Put | 19 | 3,468 | 3,650.00 | 7/21/23 | (1 | ) | |||||||||||||||||
E-Mini S&P 500 Future Option | Put | 17 | 3,209 | 3,775.00 | 7/21/23 | (1 | ) | |||||||||||||||||
E-Mini S&P 500 Future Option | Put | 16 | 3,040 | 3,800.00 | 7/21/23 | (1 | ) | |||||||||||||||||
E-Mini S&P 500 Future Option | Put | 16 | 3,048 | 3,810.00 | 7/21/23 | (1 | ) | |||||||||||||||||
E-Mini S&P 500 Future Option | Put | 15 | 2,903 | 3,870.00 | 7/21/23 | (1 | ) | |||||||||||||||||
E-Mini S&P 500 Future Option | Put | 36 | 7,020 | 3,900.00 | 7/21/23 | (3 | ) | |||||||||||||||||
E-Mini S&P 500 Future Option | Put | 30 | 5,925 | 3,950.00 | 7/21/23 | (3 | ) | |||||||||||||||||
E-Mini S&P 500 Future Option | Put | 18 | 3,848 | 4,275.00 | 7/21/23 | (5 | ) | |||||||||||||||||
E-Mini S&P 500 Future Option | Put | 16 | 3,064 | 3,830.00 | 7/31/23 | (2 | ) | |||||||||||||||||
E-Mini S&P 500 Future Option | Put | 18 | 3,600 | 4,000.00 | 7/31/23 | (3 | ) | |||||||||||||||||
E-Mini S&P 500 Future Option | Put | 17 | 3,166 | 3,725.00 | 7/31/23 | (1 | ) | |||||||||||||||||
E-Mini S&P 500 Future Option | Put | 30 | 6,150 | 4,100.00 | 7/31/23 | (7 | ) | |||||||||||||||||
E-Mini S&P 500 Future Option | Put | 32 | 6,736 | 4,210.00 | 7/31/23 | (12 | ) | |||||||||||||||||
E-Mini S&P 500 Future Option | Put | 15 | 3,173 | 4,230.00 | 7/31/23 | (7 | ) | |||||||||||||||||
E-Mini S&P 500 Future Option | Put | 16 | 3,040 | 3,800.00 | 7/31/23 | (2 | ) | |||||||||||||||||
E-Mini S&P 500 Future Option | Put | 34 | 7,309 | 4,300.00 | 7/31/23 | (23 | ) | |||||||||||||||||
E-Mini S&P 500 Future Option | Put | 26 | 5,044 | 3,880.00 | 7/31/23 | (3 | ) | |||||||||||||||||
E-Mini S&P 500 Future Option | Put | 36 | 7,694 | 4,275.00 | 7/31/23 | (21 | ) | |||||||||||||||||
E-Mini S&P 500 Future Option | Put | 14 | 2,751 | 3,930.00 | 7/31/23 | (2 | ) | |||||||||||||||||
E-Mini S&P 500 Future Option | Put | 15 | 2,925 | 3,900.00 | 7/31/23 | (2 | ) | |||||||||||||||||
E-Mini S&P 500 Future Option | Put | 14 | 2,660 | 3,800.00 | 8/18/23 | (3 | ) | |||||||||||||||||
E-Mini S&P 500 Future Option | Put | 16 | 3,140 | 3,925.00 | 8/18/23 | (5 | ) | |||||||||||||||||
E-Mini S&P 500 Future Option | Put | 54 | 10,610 | 3,930.00 | 8/18/23 | (18 | ) | |||||||||||||||||
E-Mini S&P 500 Future Option | Put | 16 | 3,152 | 3,940.00 | 8/18/23 | (5 | ) | |||||||||||||||||
E-Mini S&P 500 Future Option | Put | 18 | 3,600 | 4,000.00 | 8/18/23 | (7 | ) | |||||||||||||||||
E-Mini S&P 500 Future Option | Put | 15 | 3,068 | 4,090.00 | 8/18/23 | (8 | ) | |||||||||||||||||
E-Mini S&P 500 Future Option | Put | 18 | 3,672 | 4,080.00 | 8/18/23 | (10 | ) | |||||||||||||||||
E-Mini S&P 500 Future Option | Put | 30 | 6,240 | 4,160.00 | 8/18/23 | (21 | ) | |||||||||||||||||
E-Mini S&P 500 Future Option | Put | 16 | 3,260 | 4,075.00 | 8/18/23 | (8 | ) | |||||||||||||||||
E-Mini S&P 500 Future Option | Put | 30 | 6,075 | 4,050.00 | 8/31/23 | (21 | ) | |||||||||||||||||
E-Mini S&P 500 Future Option | Put | 36 | 7,397 | 4,110.00 | 8/31/23 | (31 | ) | |||||||||||||||||
E-Mini S&P 500 Future Option | Put | 35 | 7,044 | 4,025.00 | 8/31/23 | (24 | ) | |||||||||||||||||
E-Mini S&P 500 Future Option | Put | 18 | 3,645 | 4,050.00 | 9/15/23 | (18 | ) | |||||||||||||||||
E-Mini S&P 500 Future Option | Put | 18 | 3,668 | 4,075.00 | 9/15/23 | (20 | ) | |||||||||||||||||
| $ | (310 | ) | ||||||||||||||||||||||
See accompanying notes to financial statements.
144
HC CAPITAL TRUST
The Institutional International Equity Portfolio
Portfolio of Investments (concluded) — June 30, 2023
Exchanged-traded options on futures contacts purchased as of June 30, 2023 were as follows:
Description | Put/Call | Number of | Notional | Exercise | Expiration | Value | ||||||||||||||||||
E-Mini S&P 500 Future Option | Call | 36 | $ | 8,225 | $ | 4,570.00 | 7/21/23 | $ | 23 | |||||||||||||||
E-Mini S&P 500 Future Option | Put | 15 | 3,206 | 4,275.00 | 7/14/23 | 2 | ||||||||||||||||||
E-Mini S&P 500 Future Option | Put | 18 | 3,713 | 4,125.00 | 7/21/23 | 2 | ||||||||||||||||||
E-Mini S&P 500 Future Option | Put | 18 | 3,825 | 4,250.00 | 7/21/23 | 4 | ||||||||||||||||||
E-Mini S&P 500 Future Option | Put | 15 | 3,113 | 4,150.00 | 7/21/23 | 2 | ||||||||||||||||||
E-Mini S&P 500 Future Option | Put | 18 | 3,690 | 4,100.00 | 7/21/23 | 2 | ||||||||||||||||||
E-Mini S&P 500 Future Option | Put | 18 | 3,600 | 4,000.00 | 7/21/23 | 2 | ||||||||||||||||||
E-Mini S&P 500 Future Option | Put | 17 | 3,740 | 4,400.00 | 7/31/23 | 23 | ||||||||||||||||||
E-Mini S&P 500 Future Option | Put | 18 | 3,937 | 4,375.00 | 7/31/23 | 20 | ||||||||||||||||||
E-Mini S&P 500 Future Option | Put | 16 | 3,480 | 4,350.00 | 7/31/23 | 15 | ||||||||||||||||||
E-Mini S&P 500 Future Option | Put | 15 | 3,188 | 4,250.00 | 7/31/23 | 7 | ||||||||||||||||||
E-Mini S&P 500 Future Option | Put | 15 | 3,244 | 4,325.00 | 8/18/23 | 22 | ||||||||||||||||||
| $ | 124 | |||||||||||||||||||||||
See accompanying notes to financial statements.
145
HC CAPITAL TRUST
The Emerging Markets Portfolio
Portfolio of Investments — June 30, 2023
Shares | Security Description | Value | ||||||
Common Stocks — 85.44% | ||||||||
Brazil — 4.54% | ||||||||
| 575,300 | Ambev SA (Beverages) | $ | 1,852 | |||||
| 407,700 | B3 SA - Brasil Bolsa Balcao (Capital Markets) | 1,244 | ||||||
| 230,432 | Banco Bradesco SA (Banks) | 705 | ||||||
| 675,688 | Banco Bradesco SA, Preference Shares (Banks)(a) | 2,322 | ||||||
| 51,816 | Banco do Brasil SA (Banks) | 535 | ||||||
| 266,125 | BB Seguridade Participacoes SA (Insurance) | 1,710 | ||||||
| 78,478 | Centrais Eletricas Brasileiras SA (Electric Utilities) | 652 | ||||||
| 444,892 | Cia Energetica de Minas Gerais, Preference Shares (Electric Utilities) | 1,195 | ||||||
| 98,100 | Cia Siderurgica Nacional SA (Metals & Mining) | 249 | ||||||
| 25,620 | Gerdau SA, Preference Shares (Metals & Mining) | 134 | ||||||
| 390,736 | Itau Unibanco Holding SA, Preference Shares (Banks) | 2,319 | ||||||
| 64,365 | JBS S/A (Food Products) | 235 | ||||||
| 144,200 | Klabin SA (Containers & Packaging) | 656 | ||||||
| 103,765 | Localiza Rent a Car SA (Ground Transportation) | 1,485 | ||||||
| 153,824 | Lojas Renner SA (Specialty Retail) | 643 | ||||||
| 462,500 | Magazine Luiza SA (Broadline Retail)(b) | 326 | ||||||
| 97,849 | Natura & Co. Holding SA (Personal Care Products)(a)(b) | 342 | ||||||
| 759,748 | Petroleo Brasileiro SA (Oil, Gas & Consumable Fuels) | 5,252 | ||||||
| 32,857 | Petroleo Brasileiro SA, Preference Shares (Oil, Gas & Consumable Fuels) | 203 | ||||||
| 76,997 | PRIO SA (Oil, Gas & Consumable Fuels)(a)(b) | 596 | ||||||
| 223,600 | Raia Drogasil SA (Consumer Staples Distribution & Retail) | 1,382 | ||||||
| 108,800 | Rumo SA (Ground Transportation)(a) | 504 | ||||||
| 41,400 | Suzano SA (Paper & Forest Products) | 382 | ||||||
| 203,702 | TIM SA (Wireless Telecommunication Services) | 622 | ||||||
| 257,720 | Vale SA (Metals & Mining) | 3,456 | ||||||
| 366,300 | WEG SA (Electrical Equipment) | 2,888 | ||||||
| 31,889 | ||||||||
Chile — 0.59% | ||||||||
| 20,438 | Banco de Credito e Inversiones SA (Banks) | 625 | ||||||
| 293,158 | Empresas CMPC SA (Paper & Forest Products) | 561 | ||||||
| 9,904,113 | Enel Americas SA (Electric Utilities)(b) | 1,323 | ||||||
| 7,027,795 | Enel Chile SA (Electric Utilities) | 457 | ||||||
| 47,236 | Falabella SA (Broadline Retail) | 114 | ||||||
| 14,183 | Sociedad Quimica y Minera de Chile SA, Preference Shares (Chemicals) | 1,034 | ||||||
| 4,114 | ||||||||
China — 22.50% | ||||||||
| 77,365 | 360 Security Technology, Inc., Class - A (Software)(b) | 134 | ||||||
Shares | Security Description | Value | ||||||
China (continued) | ||||||||
| 14,000 | AAC Technologies Holdings, Inc. (Electronic Equipment, Instruments & Components) | $ | 33 | |||||
| 2,150,000 | Agricultural Bank of China Ltd., H Shares (Banks) | 847 | ||||||
| 75,400 | Air China Ltd., Class - A (Passenger Airlines)(b) | 86 | ||||||
| 700,000 | Air China Ltd., H Shares (Passenger Airlines)(b) | 500 | ||||||
| 1,439,418 | Alibaba Group Holding Ltd. (Broadline Retail)(b) | 14,984 | ||||||
| 314,000 | Aluminum Corp of China Ltd., H Shares (Metals & Mining) | 136 | ||||||
| 155,700 | Aluminum Corp. of China Ltd., Class - A (Metals & Mining) | 118 | ||||||
| 6,300 | Anjoy Foods Group Co. Ltd., Class - A (Food Products) | 128 | ||||||
| 111,000 | ANTA Sports Products Ltd. (Textiles, Apparel & Luxury Goods) | 1,141 | ||||||
| 5,814 | Autohome, Inc., ADR (Interactive Media & Services) | 170 | ||||||
| 193,426 | Baidu, Inc. (Interactive Media & Services)(b) | 3,299 | ||||||
| 5,524,100 | Bank of China Ltd., H Shares (Banks) | 2,218 | ||||||
| 1,399,000 | Bank of Communications Co. Ltd., H Shares (Banks) | 928 | ||||||
| 281,350 | Beijing Dabeinong Technology Group Co. Ltd., Class - A (Food Products) | 256 | ||||||
| 314,423 | Beijing Shiji Information Technology Co. Ltd., Class - A (Software)(b) | 608 | ||||||
| 9,449 | Bilibili, Inc., ADR (Entertainment)(b) | 143 | ||||||
| 21,000 | BYD Co. Ltd. (Automobile Components)(a) | 673 | ||||||
| 85,553 | BYD Co. Ltd., Class - A (Automobiles) | 3,052 | ||||||
| 115,500 | BYD Electronic International Co. Ltd. (Communications Equipment) | 351 | ||||||
| 60,100 | Chengxin Lithium Group Co. Ltd., Class - A (Chemicals) | 264 | ||||||
| 432,000 | China Cinda Asset Management Co. Ltd., H Shares (Capital Markets)(a) | 43 | ||||||
| 134,900 | China Communications Services Corp. Ltd., H Shares (Construction & Engineering) | 67 | ||||||
| 545,000 | China Conch Venture Holdings Ltd. (Construction & Engineering) | 712 | ||||||
| 9,196,350 | China Construction Bank Corp., H Shares (Banks) | �� | 5,954 | |||||
| 1,641,000 | China Everbright Bank Co. Ltd., H Shares (Banks) | 472 | ||||||
| 38,000 | China Evergrande Group (Real Estate Management & Development)(b) | 8 | ||||||
| 110,000 | China Feihe Ltd. (Food Products) | 61 | ||||||
| 69,200 | China Galaxy Securities Co. Ltd., Class - A (Capital Markets) | 111 | ||||||
See accompanying notes to financial statements.
146
HC CAPITAL TRUST
The Emerging Markets Portfolio
Portfolio of Investments (continued) — June 30, 2023
Shares | Security Description | Value | ||||||
Common Stocks (continued) | ||||||||
China (continued) | ||||||||
| 174,000 | China Galaxy Securities Co. Ltd., H Shares (Capital Markets) | $ | 93 | |||||
| 53,600 | China International Capital Corp. Ltd., Class - A (Capital Markets) | 262 | ||||||
| 50,800 | China International Capital Corp. Ltd., H Shares (Capital Markets) | 90 | ||||||
| 1,115,000 | China Life Insurance Co. Ltd., H Shares (Insurance) | 1,867 | ||||||
| 108,200 | China Literature Ltd. (Entertainment)(a)(b) | 456 | ||||||
| 217,000 | China Longyuan Power Group Corp. Ltd., H Shares (Independent Power and Renewable Electricity Producers) | 224 | ||||||
| 77,800 | China Merchants Bank Co. Ltd., Class - A (Banks) | 352 | ||||||
| 521,000 | China Merchants Bank Co. Ltd., H Shares (Banks) | 2,376 | ||||||
| 560,000 | China National Building Material Co. Ltd., H Shares (Construction Materials)(a) | 346 | ||||||
| 80,850 | China Northern Rare Earth Group High-Tech Co. Ltd., Class - A (Metals & Mining) | 268 | ||||||
| 584,800 | China Petroleum & Chemical Corp., Class - A (Oil, Gas & Consumable Fuels) | 513 | ||||||
| 1,643,400 | China Petroleum & Chemical Corp., H Shares (Oil, Gas & Consumable Fuels) | 966 | ||||||
| 697,500 | China Shenhua Energy Co. Ltd., H Shares (Oil, Gas & Consumable Fuels) | 2,138 | ||||||
| 846,000 | China Southern Airlines Co. Ltd., H Shares (Passenger Airlines)(b) | 479 | ||||||
| 29,100 | China Tourism Group Duty Free Corp. Ltd., Class - A (Specialty Retail) | 444 | ||||||
| 5,316,000 | China Tower Corp. Ltd., H Shares (Diversified Telecommunication Services) | 592 | ||||||
| 304,900 | China Vanke Co. Ltd., H Shares (Real Estate Management & Development)(a) | 411 | ||||||
| 12,400 | Chongqing Brewery Co. Ltd., Class - A (Beverages) | 157 | ||||||
| 51,000 | Chongqing Changan Automobile Co. Ltd., Class - A (Automobiles) | 91 | ||||||
| 55,650 | Chongqing Zhifei Biological Products Co. Ltd., Class - A (Biotechnology) | 340 | ||||||
| 189,765 | CITIC Securities Co. Ltd., Class - A (Capital Markets) | 518 | ||||||
| 83,000 | CITIC Securities Co. Ltd., H Shares (Capital Markets) | 151 | ||||||
| 285,000 | CMOC Group Ltd., H Shares (Metals & Mining) | 150 | ||||||
| 23,040 | Contemporary Amperex Technology Co. Ltd., Class - A (Electrical Equipment) | 728 | ||||||
| 482,430 | COSCO SHIPPING Holdings Co. Ltd., Class - A (Marine Transportation) | 626 | ||||||
Shares | Security Description | Value | ||||||
China (continued) | ||||||||
| 124,800 | COSCO SHIPPING Holdings Co. Ltd., H Shares (Marine Transportation) | $ | 113 | |||||
| 1,222,000 | Country Garden Holdings Co. Ltd. (Real Estate Management & Development)^(b) | 249 | ||||||
| 195,678 | Country Garden Services Holdings Co. Ltd. (Real Estate Management & Development) | 254 | ||||||
| 118,100 | CSC Financial Co. Ltd., Class - A (Capital Markets) | 395 | ||||||
| 288,000 | CSPC Pharmaceutical Group Ltd. (Pharmaceuticals)(a) | 251 | ||||||
| 121,600 | Daan Gene Co. Ltd., Class - A (Biotechnology) | 167 | ||||||
| 4,307 | Daqo New Energy Corp., ADR (Semiconductors & Semiconductor Equipment)(b) | 171 | ||||||
| 73,400 | Dongfang Electric Corp. Ltd., Class - A (Electrical Equipment) | 189 | ||||||
| 202,590 | East Money Information Co. Ltd., Class - A (Capital Markets) | 398 | ||||||
| 117,200 | ENN Energy Holdings Ltd. (Gas Utilities) | 1,466 | ||||||
| 55,623 | Eve Energy Co. Ltd., Class - A (Electrical Equipment) | 465 | ||||||
| 85,400 | Fangda Carbon New Material Co. Ltd., Class - A (Electrical Equipment)(b) | 73 | ||||||
| 450,300 | Focus Media Information Technology Co. Ltd., Class - A (Media) | 422 | ||||||
| 114,360 | Foshan Haitian Flavouring & Food Co. Ltd., Class - A (Food Products) | 739 | ||||||
| 67,000 | Fosun International Ltd. (Industrial Conglomerates) | 46 | ||||||
| 25,400 | Fujian Sunner Development Co. Ltd., Class - A (Food Products) | 67 | ||||||
| 83,704 | GDS Holdings Ltd., Class - A (IT Services)(b) | 115 | ||||||
| 110,000 | Genscript Biotech Corp. (Life Sciences Tools & Services)(a)(b) | 249 | ||||||
| 112,200 | GF Securities Co. Ltd., Class - A (Capital Markets) | 228 | ||||||
| 85,000 | GF Securities Co. Ltd., H Shares (Capital Markets) | 118 | ||||||
| 2,400 | Ginlong Technologies Co. Ltd., Class - A (Electrical Equipment)(b) | 35 | ||||||
| 276,500 | Great Wall Motor Co. Ltd. (Automobile Components) | 318 | ||||||
| 37,800 | Gree Electric Appliances, Inc. of Zhuhai, Class - A (Household Durables) | 190 | ||||||
| 157,000 | Guanghui Energy Co. Ltd., Class - A (Oil, Gas & Consumable Fuels) | 149 | ||||||
| 598,000 | Guangzhou Automobile Group Co. Ltd., H Shares (Automobile Components) | 358 | ||||||
See accompanying notes to financial statements.
147
HC CAPITAL TRUST
The Emerging Markets Portfolio
Portfolio of Investments (continued) — June 30, 2023
Shares | Security Description | Value | ||||||
Common Stocks (continued) | ||||||||
China (continued) | ||||||||
| 12,766 | H World Group Ltd., ADR (Hotels, Restaurants & Leisure)(b) | $ | 495 | |||||
| 46,000 | Haidilao International Holding Ltd. (Hotels, Restaurants & Leisure) | 102 | ||||||
| 111,100 | Haier Smart Home Co. Ltd., Class - A (Household Durables) | 360 | ||||||
| 211,800 | Haier Smart Home Co. Ltd., H Shares (Household Durables) | 668 | ||||||
| 100 | Haitong Securities Co. Ltd., Class - A (Capital Markets) | — | ||||||
| 88,400 | Haitong Securities Co. Ltd., H Shares (Capital Markets) | 54 | ||||||
| 160,500 | Hengan International Group Co. Ltd. (Personal Care Products) | 677 | ||||||
| 45,000 | Hengli Petrochemical Co. Ltd., Class - A (Chemicals)(b) | 89 | ||||||
| 25,900 | Hithink RoyalFlush Information Network Co. Ltd., Class - A (Capital Markets) | 627 | ||||||
| 137,000 | Hua Hong Semiconductor Ltd. (Semiconductors & Semiconductor Equipment)(a)(b) | 451 | ||||||
| 25,200 | Huadong Medicine Co. Ltd., Class - A (Health Care Providers & Services) | 151 | ||||||
| 100 | Huatai Securities Co. Ltd., Class - A (Capital Markets) | — | ||||||
| 59,000 | Huatai Securities Co. Ltd., H Shares (Capital Markets) | 73 | ||||||
| 89,400 | Iflytek Co. Ltd., Class - A (Software)(b) | 838 | ||||||
| 6,214,440 | Industrial & Commercial Bank of China Ltd., H Shares (Banks) | 3,321 | ||||||
| 222,200 | Inner Mongolia BaoTou Steel Union Co. Ltd., Class - A (Metals & Mining)(b) | 55 | ||||||
| 79,000 | Innovent Biologics, Inc. (Biotechnology)(b) | 300 | ||||||
| 23,184 | Inspur Electronic Information Industry Co. Ltd., Class - A (Technology Hardware, Storage & Peripherals) | 155 | ||||||
| 22,650 | iQIYI, Inc., ADR (Entertainment)(b) | 121 | ||||||
| 84,050 | JD Health International, Inc. (Consumer Staples Distribution & Retail)(b) | 534 | ||||||
| 212,557 | JD.com, Inc. (Broadline Retail) | 3,625 | ||||||
| 1,180,000 | Jiangsu Expressway Co. Ltd., H Shares (Transportation Infrastructure) | 1,088 | ||||||
| 31 | Jiangsu Hengrui Pharmaceuticals Co. Ltd., Class - A (Pharmaceuticals) | — | ||||||
| 3,640 | Joinn Laboratories China Co. Ltd., Class - A (Life Sciences Tools & Services) | 21 | ||||||
| 14,100 | Juewei Food Co. Ltd., Class - A (Food Products) | 72 | ||||||
Shares | Security Description | Value | ||||||
China (continued) | ||||||||
| 54,155 | KE Holdings, Inc., ADR (Real Estate Management & Development)(b) | $ | 804 | |||||
| 421,000 | Kingdee International Software Group Co. Ltd. (Software)(b) | 565 | ||||||
| 62,000 | Kingsoft Corp. Ltd. (Entertainment)(a) | 245 | ||||||
| 168,800 | Kuaishou Technology, Class - W (Media)(b) | 1,160 | ||||||
| 5,400 | Kweichow Moutai Co. Ltd., Class - A (Beverages) | 1,259 | ||||||
| 124,000 | Lenovo Group Ltd. (Technology Hardware, Storage & Peripherals) | 130 | ||||||
| 46,500 | Lens Technology Co. Ltd., Class - A (Electronic Equipment, Instruments & Components) | 75 | ||||||
| 101,414 | Li Auto, Inc., Class - A (Automobiles)(b) | 1,756 | ||||||
| 289,500 | Li Ning Co. Ltd. (Textiles, Apparel & Luxury Goods) | 1,563 | ||||||
| 131,819 | Luxshare Precision Industry Co. Ltd., Class - A (Electronic Equipment, Instruments & Components) | 592 | ||||||
| 218,160 | Meinian Onehealth Healthcare Holdings Co. Ltd., Class - A (Health Care Providers & Services)(b) | 214 | ||||||
| 442,428 | Meituan, Class - W (Hotels, Restaurants & Leisure)(b) | 6,937 | ||||||
| 59,000 | Microport Scientific Corp. (Health Care Equipment & Supplies)(b) | 107 | ||||||
| 7,280 | Muyuan Foods Co. Ltd., Class - A (Food Products)(b) | 42 | ||||||
| 214,500 | NetEase, Inc. (Entertainment) | 4,155 | ||||||
| 20,200 | New China Life Insurance Co. Ltd., Class - A (Insurance) | 102 | ||||||
| 171,200 | New China Life Insurance Co. Ltd., H Shares (Insurance) | 452 | ||||||
| 109,800 | New Oriental Education & Technology Group, Inc. (Diversified Consumer Services)(b) | 433 | ||||||
| 121,605 | NIO, Inc., ADR (Automobiles)(b) | 1,178 | ||||||
| 23,520 | Ovctek China, Inc., Class - A (Health Care Equipment & Supplies) | 98 | ||||||
| 111,600 | Perfect World Co. Ltd., Class - A (Entertainment) | 260 | ||||||
| 456,300 | PetroChina Co. Ltd., Class - A (Oil, Gas & Consumable Fuels) | 470 | ||||||
| 1,264,000 | PetroChina Co. Ltd., H Shares (Oil, Gas & Consumable Fuels) | 878 | ||||||
| 27,000 | Pharmaron Beijing Co. Ltd., H Shares (Life Sciences Tools & Services)(b) | 84 | ||||||
| 962,517 | Ping An Insurance Group Co. of China Ltd. (Insurance) | 6,148 | ||||||
See accompanying notes to financial statements.
148
HC CAPITAL TRUST
The Emerging Markets Portfolio
Portfolio of Investments (continued) — June 30, 2023
Shares | Security Description | Value | ||||||
Common Stocks (continued) | ||||||||
China (continued) | ||||||||
| 345,600 | Rongsheng Petrochemical Co. Ltd., Class - A (Chemicals) | $ | 555 | |||||
| 45,700 | SAIC Motor Corp. Ltd., Class - A (Automobiles) | 89 | ||||||
| 16,300 | Seres Group Co. Ltd., Class - A (Automobiles)(b) | 83 | ||||||
| 120,299 | Shandong Buchang Pharmaceuticals Co. Ltd., Class - A (Pharmaceuticals) | 341 | ||||||
| 136,100 | Shanghai Electric Group Co. Ltd., Class - A (Electrical Equipment)(b) | 86 | ||||||
| 9,000 | Shanghai Junshi Biosciences Co. Ltd., Class - A (Biotechnology)(b) | 48 | ||||||
| 921,300 | Shanghai Pharmaceuticals Holding Co. Ltd., H Shares (Health Care Providers & Services) | 1,829 | ||||||
| 6,090 | Shanghai Putailai New Energy Technology Co. Ltd., Class - A (Chemicals) | 32 | ||||||
| 82,200 | Shanxi Meijin Energy Co. Ltd., Class - A (Metals & Mining)(b) | 86 | ||||||
| 57,920 | Shenzhen Kangtai Biological Products Co. Ltd., Class - A (Biotechnology)(b) | 203 | ||||||
| 99,700 | Shenzhou International Group Holdings Ltd. (Textiles, Apparel & Luxury Goods)(a) | 958 | ||||||
| 26,100 | Sichuan Kelun Pharmaceutical Co. Ltd., Class - A (Pharmaceuticals) | 107 | ||||||
| 18,700 | Sichuan New Energy Power Co. Ltd., Class - A (Trading Companies & Distributors)(b) | 37 | ||||||
| 50,000 | Silergy Corp. (Semiconductors & Semiconductor Equipment) | 623 | ||||||
| 169,000 | Smoore International Holdings Ltd. (Tobacco) | 172 | ||||||
| 233,617 | Songcheng Performance Development Co. Ltd., Class - A (Hotels, Restaurants & Leisure) | 400 | ||||||
| 5,000 | StarPower Semiconductor Ltd., Class - A (Semiconductors & Semiconductor Equipment) | 149 | ||||||
| 170,427 | Sunny Optical Technology Group Co. Ltd. (Electronic Equipment, Instruments & Components) | 1,709 | ||||||
| 30,900 | Suzhou Dongshan Precision Manufacturing Co. Ltd., Class - A (Electronic Equipment, Instruments & Components)(b) | 110 | ||||||
| 13,568 | Suzhou Maxwell Technologies Co. Ltd., Class - A (Electrical Equipment) | 317 | ||||||
| 45,497 | TAL Education Group, ADR (Diversified Consumer Services)(b) | 271 | ||||||
| 572,886 | Tencent Holdings Ltd. (Interactive Media & Services)(a) | 24,291 | ||||||
Shares | Security Description | Value | ||||||
China (continued) | ||||||||
| 55,429 | Tencent Music Entertainment Group, ADR (Entertainment)(b) | $ | 409 | |||||
| 221,558 | Toly Bread Co. Ltd., Class - A (Food Products) | 309 | ||||||
| 8,400 | Trip.com Group Ltd. (Hotels, Restaurants & Leisure)(b) | 293 | ||||||
| 30,940 | Unisplendour Corp. Ltd., Class - A (Electronic Equipment, Instruments & Components) | 136 | ||||||
| 40,691 | Vipshop Holdings Ltd., ADR (Broadline Retail)(b) | 671 | ||||||
| 81,675 | Walvax Biotechnology Co. Ltd., Class - A (Biotechnology) | 298 | ||||||
| 8,500 | Weibo Corp., ADR (Interactive Media & Services) | 111 | ||||||
| 50,500 | Weichai Power Co. Ltd., Class - A (Machinery) | 87 | ||||||
| 54,000 | Weichai Power Co. Ltd., H Shares (Machinery) | 79 | ||||||
| 44,260 | Wens Foodstuffs Group Co. Ltd., Class - A (Food Products) | 112 | ||||||
| 134,279 | Wuhan Guide Infrared Co. Ltd., Class - A (Electronic Equipment, Instruments & Components) | 144 | ||||||
| 34,100 | Wuliangye Yibin Co. Ltd., Class - A (Beverages) | 770 | ||||||
| 30,360 | WUS Printed Circuit Kunshan Co. Ltd., Class - A (Electronic Equipment, Instruments & Components) | 88 | ||||||
| 27,200 | WuXi AppTec Co. Ltd., Class - A (Life Sciences Tools & Services) | 234 | ||||||
| 30,340 | WuXi AppTec Co. Ltd., H Shares (Life Sciences Tools & Services) | 243 | ||||||
| 323,500 | Wuxi Biologics Cayman, Inc. (Life Sciences Tools & Services)(b) | 1,555 | ||||||
| 1,203,000 | Xiaomi Corp., Class - W (Technology Hardware, Storage & Peripherals)(a)(b) | 1,654 | ||||||
| 51,700 | Xinjiang Goldwind Science & Technology Co. Ltd., Class - A (Electrical Equipment) | 76 | ||||||
| 468,481 | Xinyi Solar Holdings Ltd. (Semiconductors & Semiconductor Equipment) | 544 | ||||||
| 151,564 | XPeng, Inc., A Shares (Automobiles)(b) | 1,007 | ||||||
| 366,000 | Yadea Group Holdings Ltd. (Automobile Components)(a) | 835 | ||||||
| 20,600 | Yankuang Energy Group Co. Ltd., Class - A (Oil, Gas & Consumable Fuels) | 85 | ||||||
| 146,000 | Yankuang Energy Group Co. Ltd., H Shares (Oil, Gas & Consumable Fuels) | 419 | ||||||
| 60,970 | Yealink Network Technology Corp. Ltd., Class - A (Communications Equipment) | 295 | ||||||
| 61,000 | Yihai International Holding Ltd. (Food Products) | 131 | ||||||
See accompanying notes to financial statements.
149
HC CAPITAL TRUST
The Emerging Markets Portfolio
Portfolio of Investments (continued) — June 30, 2023
Shares | Security Description | Value | ||||||
Common Stocks (continued) | ||||||||
China (continued) | ||||||||
| 76,440 | Yintai Gold Co. Ltd., Class - A (Metals & Mining) | $ | 124 | |||||
| 124,076 | Yonyou Network Technology Co. Ltd., Class - A (Software) | 351 | ||||||
| 2,900 | Youngy Co. Ltd., Class - A (Metals & Mining) | 27 | ||||||
| 78,444 | Yum China Holdings, Inc. (Hotels, Restaurants & Leisure) | 4,432 | ||||||
| 27,030 | Yunda Holding Co. Ltd., Class - A (Air Freight & Logistics) | 36 | ||||||
| 10,800 | Yunnan Energy New Material Co. Ltd., Class - A (Chemicals) | 144 | ||||||
| 23,900 | Zhangzhou Pientzehuang Pharmaceutical Co. Ltd., Class - A (Pharmaceuticals) | 944 | ||||||
| 51,400 | Zhejiang Century Huatong Group Co. Ltd., Class - A (Entertainment)(b) | 54 | ||||||
| 13,440 | Zhejiang Dingli Machinery Co. Ltd., Class - A (Machinery)(b) | 104 | ||||||
| 1,094,000 | Zhejiang Expressway Co. Ltd., H Shares (Transportation Infrastructure) | 832 | ||||||
| 8,200 | Zhejiang Supor Co. Ltd., Class - A (Household Durables) | 57 | ||||||
| 75,900 | Zheshang Securities Co. Ltd., Class - A (Capital Markets) | 103 | ||||||
| 29,200 | ZhongAn Online P&C Insurance Co. Ltd., H Shares (Insurance)(b) | 80 | ||||||
| 15,300 | Zhongji Innolight Co. Ltd., Class - A (Communications Equipment) | 311 | ||||||
| 63,500 | Zhongsheng Group Holdings Ltd. (Specialty Retail) | 244 | ||||||
| 770,300 | Zijin Mining Group Co. Ltd., Class - A (Metals & Mining) | 1,211 | ||||||
| 218,000 | Zijin Mining Group Co. Ltd., H Shares (Metals & Mining) | 323 | ||||||
| 325,100 | Zoomlion Heavy Industry Science and Technology Co. Ltd., Class - A (Machinery) | 302 | ||||||
| 169,800 | ZTE Corp., Class - A (Communications Equipment) | 1,066 | ||||||
| 183,800 | ZTE Corp., H Shares (Communications Equipment) | 739 | ||||||
| 27,491 | ZTO Express Cayman, Inc., ADR (Air Freight & Logistics) | 689 | ||||||
| 158,198 | ||||||||
Cyprus — 0.00% | ||||||||
| 7,712 | TCS Group Holding PLC, GDR (Banks)(b)(c) | — | ||||||
Czech Republic — 0.10% | ||||||||
| 190,434 | Moneta Money Bank A/S (Banks)(a) | 698 | ||||||
Shares | Security Description | Value | ||||||
Egypt — 0.07% | ||||||||
| 294,053 | Commercial International Bank Egypt SAE (Banks) | $ | 488 | |||||
Greece — 0.30% | ||||||||
| 51,559 | Alpha Services and Holdings SA (Banks) | 84 | ||||||
| 116,923 | Hellenic Telecommunications Organization SA (Diversified Telecommunication Services) | 2,005 | ||||||
| 2,089 | ||||||||
Hong Kong — 1.71% | ||||||||
| 348,000 | Alibaba Health Information Technology Ltd. (Consumer Staples Distribution & Retail)(a)(b) | 211 | ||||||
| 1,039,733 | Beijing Enterprises Water Group Ltd. (Water Utilities)(a) | 247 | ||||||
| 712,182 | China Everbright Environment Group Ltd. (Commercial Services & Supplies) | 282 | ||||||
| 1,674,121 | China Jinmao Holdings Group Ltd. (Real Estate Management & Development) | 247 | ||||||
| 126,000 | China Mengniu Dairy Co. Ltd. (Food Products)(a) | 476 | ||||||
| 432,500 | China Overseas Land & Investment Ltd. (Real Estate Management & Development) | 946 | ||||||
| 102,000 | China Resources Beer Holdings Co. Ltd. (Beverages) | 674 | ||||||
| 748,000 | China Resources Cement Holdings Ltd. (Construction Materials)(a) | 309 | ||||||
| 879,761 | China Resources Land Ltd. (Real Estate Management & Development) | 3,744 | ||||||
| 696,143 | China Resources Power Holdings Co. Ltd. (Independent Power and Renewable Electricity Producers) | 1,577 | ||||||
| 276,000 | China Ruyi Holdings Ltd. (Entertainment)(b) | 65 | ||||||
| 112,000 | China State Construction International Holdings Ltd. (Construction & Engineering) | 128 | ||||||
| 79,400 | China Taiping Insurance Holdings Co. Ltd. (Insurance)(a) | 83 | ||||||
| 1,172,000 | Far East Horizon Ltd. (Financial Services) | 930 | ||||||
| 1,132,000 | GCL Technology Holdings Ltd. (Semiconductors & Semiconductor Equipment) | 263 | ||||||
| 536,000 | Geely Automobile Holdings Ltd. (Automobiles)(a) | 658 | ||||||
| 122,500 | Kingboard Holdings Ltd. (Electronic Equipment, Instruments & Components) | 335 | ||||||
| 332,000 | Kingboard Laminates Holdings Ltd. (Electronic Equipment, Instruments & Components)(a) | 313 | ||||||
| 735,000 | Sino Biopharmaceutical Ltd. (Pharmaceuticals)(a) | 321 | ||||||
See accompanying notes to financial statements.
150
HC CAPITAL TRUST
The Emerging Markets Portfolio
Portfolio of Investments (continued) — June 30, 2023
Shares | Security Description | Value | ||||||
Common Stocks (continued) | ||||||||
Hong Kong (continued) | ||||||||
| 209,600 | Yuexiu Property Co. Ltd. (Real Estate Management & Development) | $ | 244 | |||||
| 12,053 | ||||||||
Hungary — 0.35% | ||||||||
| 62,779 | MOL Hungarian Oil & Gas PLC (Oil, Gas & Consumable Fuels) | 550 | ||||||
| 15,740 | OTP Bank Nyrt (Banks) | 560 | ||||||
| 54,565 | Richter Gedeon Nyrt (Pharmaceuticals) | 1,349 | ||||||
| 2,459 | ||||||||
India — 12.06% | ||||||||
| 9,293 | Adani Enterprises Ltd. (Trading Companies & Distributors) | 271 | ||||||
| 54,236 | Adani Green Energy Ltd. (Independent Power and Renewable Electricity Producers)(b) | 625 | ||||||
| 203,324 | Adani Ports & Special Economic Zone Ltd. (Transportation Infrastructure) | 1,837 | ||||||
| 96,565 | Adani Power Ltd. (Independent Power and Renewable Electricity Producers)(b) | 295 | ||||||
| 319,100 | Ambuja Cements Ltd. (Construction Materials) | 1,661 | ||||||
| 8,752 | Apollo Hospitals Enterprise Ltd. (Health Care Providers & Services) | 545 | ||||||
| 25,951 | Asian Paints Ltd. (Chemicals) | 1,066 | ||||||
| 34,614 | Aurobindo Pharma Ltd. (Pharmaceuticals)(a) | 307 | ||||||
| 56,857 | Avenue Supermarts Ltd. (Consumer Staples Distribution & Retail)(a)(b) | 2,702 | ||||||
| 293,439 | Axis Bank Ltd. (Banks)(a) | 3,541 | ||||||
| 17,379 | Bajaj Auto Ltd. (Automobile Components) | 996 | ||||||
| 38,477 | Bajaj Finance Ltd. (Consumer Finance)(a) | 3,370 | ||||||
| 77,010 | Bajaj Finserv Ltd. (Financial Services) | 1,438 | ||||||
| 216,368 | Bharat Petroleum Corp. Ltd. (Oil, Gas & Consumable Fuels)(a) | 963 | ||||||
| 8,699 | Bharti Airtel Ltd. (Wireless Telecommunication Services)(a) | 93 | ||||||
| 8,842,285 | Chennai Super Kings Cricket Ltd. (Entertainment)(b)(c) | — | ||||||
| 13,450 | Cholamandalam Investment and Finance Co. Ltd. (Consumer Finance)(a) | 188 | ||||||
| 722,710 | Coal India Ltd. (Oil, Gas & Consumable Fuels)(a) | 2,039 | ||||||
| 63,256 | Dr. Reddy’s Laboratories Ltd., ADR (Pharmaceuticals) | 3,992 | ||||||
| 12,020 | Eicher Motors Ltd. (Automobiles)(a) | 526 | ||||||
| 478,101 | GAIL India Ltd. (Gas Utilities) | 613 | ||||||
| 161,026 | HCL Technologies Ltd. (IT Services) | 2,341 | ||||||
| 46,133 | Hindustan Unilever Ltd. (Personal Care Products)(a) | 1,508 | ||||||
Shares | Security Description | Value | ||||||
India (continued) | ||||||||
| 187,917 | Housing Development Finance Corp. Ltd. (Financial Services)(a) | $ | 6,484 | |||||
| 570,938 | ICICI Bank Ltd. (Banks)(a) | 6,538 | ||||||
| 233,876 | Infosys Ltd. (IT Services) | 3,810 | ||||||
| 17,988 | InterGlobe Aviation Ltd. (Passenger Airlines)(a)(b) | 577 | ||||||
| 611,134 | ITC Ltd. (Tobacco)(a) | 3,370 | ||||||
| 29,227 | Kotak Mahindra Bank Ltd. (Banks)(a) | 659 | ||||||
| 5,988 | Larsen & Toubro Ltd. (Construction & Engineering)(a) | 181 | ||||||
| 14,318 | Mahindra & Mahindra Ltd. (Automobile Components) | 254 | ||||||
| 2,948 | Maruti Suzuki India Ltd. (Automobiles) | 353 | ||||||
| 543,033 | NTPC Ltd. (Independent Power and Renewable Electricity Producers)(a) | 1,254 | ||||||
| 231,740 | Oil & Natural Gas Corp. Ltd. (Oil, Gas & Consumable Fuels)(a) | 454 | ||||||
| 31,703 | Pidilite Industries Ltd. (Chemicals) | 1,006 | ||||||
| 296,119 | Reliance Industries Ltd. (Oil, Gas & Consumable Fuels) | 9,232 | ||||||
| 30,301 | SBI Life Insurance Co. Ltd. (Insurance) | 483 | ||||||
| 5,875 | Shree Cement Ltd. (Construction Materials)(a) | 1,713 | ||||||
| 234,732 | State Bank of India (Banks)(a) | 1,644 | ||||||
| 66,808 | Tata Consultancy Services Ltd. (IT Services)(a) | 2,700 | ||||||
| 191,775 | Tata Motors Ltd. (Automobile Components)(b) | 1,398 | ||||||
| 1,867,110 | Tata Steel Ltd. (Metals & Mining) | 2,558 | ||||||
| 38,639 | Titan Co. Ltd. (Textiles, Apparel & Luxury Goods) | 1,439 | ||||||
| 12,941 | Trent Ltd. (Specialty Retail) | 279 | ||||||
| 22,694 | UltraTech Cement Ltd. (Construction Materials) | 2,298 | ||||||
| 222,144 | United Spirits Ltd. (Beverages)(b) | 2,476 | ||||||
| 172,397 | Vedanta Ltd. (Metals & Mining) | 587 | ||||||
| 363,041 | Wipro Ltd. (IT Services)(a) | 1,728 | ||||||
| 1,074,947 | Yes Bank Ltd. (Banks)(a)(b) | 213 | ||||||
| 171,365 | Zomato Ltd. (Hotels, Restaurants & Leisure)(a)(b) | 157 | ||||||
| 84,762 | ||||||||
Indonesia — 2.03% | ||||||||
| 360,200 | Aneka Tambang Tbk (Metals & Mining) | 47 | ||||||
| 2,110,400 | PT Astra International Tbk (Automobile Components) | 957 | ||||||
| 6,557,985 | PT Bank Central Asia Tbk (Banks) | 4,022 | ||||||
| 5,393,700 | PT Bank Rakyat Indonesia Persero Tbk (Banks) | 1,970 | ||||||
| 833,271 | PT Barito Pacific Tbk (Chemicals) | 42 | ||||||
| 1,875,600 | PT Charoen Pokphand Indonesia Tbk (Food Products)(b) | 659 | ||||||
| 345,000 | PT Indah Kiat Pulp & Paper Tbk (Paper & Forest Products) | 196 | ||||||
| 2,093,700 | PT Indofood Sukses Makmur Tbk (Food Products) | 1,027 | ||||||
See accompanying notes to financial statements.
151
HC CAPITAL TRUST
The Emerging Markets Portfolio
Portfolio of Investments (continued) — June 30, 2023
Shares | Security Description | Value | ||||||
Common Stocks (continued) | ||||||||
Indonesia (continued) | ||||||||
| 20,119,435 | PT Kalbe Farma Tbk (Pharmaceuticals) | $ | 2,753 | |||||
| 237,400 | PT Merdeka Copper Gold Tbk (Metals & Mining)(a)(b) | 49 | ||||||
| 621,400 | PT Semen Indonesia Persero Tbk (Construction Materials) | 253 | ||||||
| 7,476,650 | PT Telkom Indonesia Persero Tbk (Diversified Telecommunication Services)(a) | 2,001 | ||||||
| 206,100 | PT United Tractors Tbk (Oil, Gas & Consumable Fuels) | 320 | ||||||
| 14,296 | ||||||||
Ireland (Republic of) — 0.49% | ||||||||
| 49,735 | PDD Holdings, Inc., ADR (Broadline Retail)(b) | 3,439 | ||||||
Kuwait — 0.27% | ||||||||
| 346,467 | Boubyan Bank KSCP (Banks) | 724 | ||||||
| 469,648 | Kuwait Finance House KSCP (Banks) | 1,145 | ||||||
| 1,869 | ||||||||
Malaysia — 1.64% | ||||||||
| 241,900 | AMMB Holdings Berhad (Banks) | 188 | ||||||
| 60,200 | CELCOMDIGI Berhad (Wireless Telecommunication Services) | 53 | ||||||
| 1,488,900 | Dialog Group Berhad (Energy Equipment & Services) | 659 | ||||||
| 1,093,800 | IHH Healthcare Berhad (Health Care Providers & Services) | 1,382 | ||||||
| 1,283,100 | IOI Corp. Berhad (Food Products) | 1,028 | ||||||
| 378,796 | Malayan Banking Berhad (Banks) | 701 | ||||||
| 1,418,300 | Malaysia Airports Holdings Berhad (Transportation Infrastructure) | 2,093 | ||||||
| 581,500 | Maxis Berhad (Wireless Telecommunication Services)(a) | 512 | ||||||
| 15,300 | Petronas Gas Berhad (Gas Utilities) | 55 | ||||||
| 1,200,200 | Press Metal Aluminium Holdings Berhad (Metals & Mining)(a) | 1,212 | ||||||
| 1,142,400 | Public Bank Berhad (Banks) | 944 | ||||||
| 1,262,600 | QL Resources Berhad (Food Products) | 1,451 | ||||||
| 558,900 | Sime Darby Berhad (Industrial Conglomerates) | 246 | ||||||
| 1,028,100 | Sime Darby Plantation Berhad (Food Products) | 916 | ||||||
| 685,700 | Top Glove Corp. Berhad (Health Care Equipment & Supplies)(b) | 119 | ||||||
| 11,559 | ||||||||
Mexico — 2.91% | ||||||||
| 2,594,800 | America Movil SAB de CV, Class - B (Wireless Telecommunication Services)(b) | 2,820 | ||||||
| 1,050,300 | Cemex SAB de CV (Construction Materials)(b) | 743 | ||||||
| 138,800 | Coca-Cola Femsa SAB de CV (Beverages) | 1,160 | ||||||
| 156,300 | Fibra Uno Administracion SA de CV (Diversified REITs)(a) | 228 | ||||||
Shares | Security Description | Value | ||||||
Mexico (continued) | ||||||||
| 475,040 | Fomento Economico Mexicano SAB de CV (Beverages) | $ | 5,260 | |||||
| 57,155 | Grupo Aeroportuario del Sureste SAB de CV, Class - B (Transportation Infrastructure) | 1,594 | ||||||
| 363,500 | Grupo Bimbo SAB de CV, Class - A (Food Products) | 1,947 | ||||||
| 195,000 | Grupo Financiero Banorte SAB de CV, Class - O (Banks) | 1,609 | ||||||
| 544,645 | Grupo Mexico SAB de CV, Class - B (Metals & Mining) | 2,623 | ||||||
| 255,700 | Grupo Televisa SAB (Media) | 263 | ||||||
| 576,600 | Kimberly-Clark de Mexico SAB de CV, Class - A (Household Products) | 1,283 | ||||||
| 439,825 | Orbia Advance Corp SAB de CV (Chemicals) | 948 | ||||||
| 20,478 | ||||||||
Peru — 0.40% | ||||||||
| 109,508 | Cia de Minas Buenaventura SAA, ADR (Metals & Mining) | 805 | ||||||
| 13,465 | Credicorp Ltd. (Banks) | 1,988 | ||||||
| 2,793 | ||||||||
Philippines — 0.93% | ||||||||
| 1,181,140 | Aboitiz Equity Ventures, Inc. (Industrial Conglomerates)(a) | 1,165 | ||||||
| 1,797,673 | Metropolitan Bank & Trust Co. (Banks) | 1,819 | ||||||
| 17,765 | PLDT, Inc. (Wireless Telecommunication Services) | 421 | ||||||
| 187,693 | SM Investments Corp. (Industrial Conglomerates) | 3,157 | ||||||
| 6,562 | ||||||||
Poland — 0.42% | ||||||||
| 97,123 | Bank Polska Kasa Opieki SA (Banks)(a) | 2,650 | ||||||
| 3,287 | CD Projekt SA (Entertainment) | 125 | ||||||
| 3,670 | KGHM Polska Miedz SA (Metals & Mining) | 102 | ||||||
| 4,503 | Powszechny Zaklad Ubezpieczen SA (Insurance)(a) | 44 | ||||||
| 2,921 | ||||||||
Qatar — 0.79% | ||||||||
| 46,759 | Industries Qatar QSC (Industrial Conglomerates) | 146 | ||||||
| 962,524 | Masraf Al Rayan QSC (Banks) | 682 | ||||||
| 370,757 | Mesaieed Petrochemical Holding Co. (Chemicals) | 196 | ||||||
| 121,012 | Qatar Fuel QSC (Oil, Gas & Consumable Fuels) | 569 | ||||||
| 55,762 | Qatar International Islamic Bank QSC (Banks) | 154 | ||||||
| 187,807 | Qatar Islamic Bank SAQ (Banks) | 919 | ||||||
| 508,820 | Qatar National Bank QPSC (Banks) | 2,165 | ||||||
| 459,841 | The Commercial Bank PSQC (Banks) | 738 | ||||||
| 5,569 | ||||||||
See accompanying notes to financial statements.
152
HC CAPITAL TRUST
The Emerging Markets Portfolio
Portfolio of Investments (continued) — June 30, 2023
Shares | Security Description | Value | ||||||
Common Stocks (continued) | ||||||||
Russia — 0.00% | ||||||||
| 877,850 | Gazprom PJSC (Oil, Gas & Consumable Fuels)(c) | $ | — | |||||
| 280,855 | Gazprom PJSC, ADR (Oil, Gas & Consumable Fuels)(b)(c) | — | ||||||
| 32,986 | LUKOIL PJSC (Oil, Gas & Consumable Fuels)(c) | — | ||||||
| 23,471 | LUKOIL PJSC, ADR (Oil, Gas & Consumable Fuels)(b)(c) | — | ||||||
| 102,050 | Novatek PJSC (Oil, Gas & Consumable Fuels)(c) | — | ||||||
| 38,369 | Polymetal International PLC (Metals & Mining)(b)(c) | — | ||||||
| 3,734 | Polyus PJSC (Metals & Mining)(b)(c) | — | ||||||
| 357,956 | Sberbank of Russia PJSC (Banks)(b)(c) | — | ||||||
| 113,164 | Severstal PAO, GDR (Metals & Mining)(b)(c) | — | ||||||
| 125,880 | Tatneft PJSC (Oil, Gas & Consumable Fuels)(c) | — | ||||||
| 766,486 | The Moscow Exchange (Capital Markets)(b)(c) | — | ||||||
| 814,600,000 | VTB Bank PJSC (Banks)(b)(c) | — | ||||||
| 31,318 | Yandex N.V., Class - A (Interactive Media & Services)(b)(c) | — | ||||||
| — | ||||||||
Saudi Arabia — 3.91% | ||||||||
| 159,310 | Al Rajhi Bank (Banks) | 3,119 | ||||||
| 4,497 | Almarai Co. JSC (Food Products) | 73 | ||||||
| 77,181 | Banque Saudi Fransi (Banks) | 862 | ||||||
| 21,193 | Bupa Arabia for Cooperative Insurance Co. (Insurance) | 1,049 | ||||||
| 382,830 | Dar Al Arkan Real Estate Development Co. (Real Estate Management & Development)(b) | 1,581 | ||||||
| 1,354 | Dr. Sulaiman Al Habib Medical Services Group Co. (Health Care Providers & Services) | 104 | ||||||
| 33,159 | Elm Co. (IT Services) | 5,165 | ||||||
| 224,771 | Emaar Economic City (Real Estate Management & Development)(b) | 563 | ||||||
| 17,324 | Mobile Telecommunications Co. Saudi Arabia (Wireless Telecommunication Services)(b) | 65 | ||||||
| 172,781 | Riyad Bank (Banks) | 1,560 | ||||||
| 59,797 | SABIC Agri-Nutrients Co. (Chemicals) | 2,077 | ||||||
| 46,591 | Sahara International Petrochemical Co. (Chemicals) | 465 | ||||||
| 295,023 | Saudi Arabian Mining Co. (Metals & Mining)(b) | 3,334 | ||||||
| 71,146 | Saudi Awwal Bank (Banks)(a) | 724 | ||||||
| 62,760 | Saudi Basic Industries Corp. (Chemicals) | 1,486 | ||||||
| 72,167 | Saudi Industrial Investment Group (Chemicals) | 515 | ||||||
| 110,340 | Saudi Kayan Petrochemical Co. (Chemicals)(b) | 408 | ||||||
| 6,543 | Saudi Tadawul Group Holding Co. (Capital Markets) | 329 | ||||||
Shares | Security Description | Value | ||||||
Saudi Arabia (continued) | ||||||||
| 121,265 | Saudi Telecom Co. (Diversified Telecommunication Services)(a) | $ | 1,414 | |||||
| 221,316 | The Saudi National Bank (Banks) | 2,183 | ||||||
| 37,378 | The Savola Group (Food Products) | 416 | ||||||
| 27,492 | ||||||||
Singapore — 0.01% | ||||||||
| 1,500 | JOYY, Inc., ADR (Interactive Media & Services) | 46 | ||||||
South Africa — 2.83% | ||||||||
| 43,142 | Absa Group Ltd. (Banks) | 385 | ||||||
| 7,411 | Anglo American Platinum Ltd. (Metals & Mining) | 335 | ||||||
| 59,086 | AngloGold Ashanti Ltd. (Metals & Mining) | 1,251 | ||||||
| 11,124 | Aspen Pharmacare Holdings Ltd. (Pharmaceuticals) | 109 | ||||||
| 61,875 | Bid Corp. Ltd. (Consumer Staples Distribution & Retail) | 1,359 | ||||||
| 6,145 | Capitec Bank Holdings Ltd. (Banks) | 512 | ||||||
| 229,901 | Discovery Ltd. (Insurance)(a)(b) | 1,782 | ||||||
| 583,993 | FirstRand Ltd. (Financial Services) | 2,129 | ||||||
| 57,103 | Gold Fields Ltd. (Metals & Mining)(a) | 794 | ||||||
| 399,656 | Growthpoint Properties Ltd. (Diversified REITs)(a) | 248 | ||||||
| 48,655 | Impala Platinum Holdings Ltd. (Metals & Mining) | 324 | ||||||
| 32,304 | Mr. Price Group Ltd. (Specialty Retail) | 247 | ||||||
| 270,984 | MTN Group Ltd. (Wireless Telecommunication Services) | 1,992 | ||||||
| 79,012 | MultiChoice Group (Media) | 401 | ||||||
| 19,542 | Naspers Ltd., Class - N (Broadline Retail) | 3,532 | ||||||
| 20,893 | Nedbank Group Ltd. (Banks)(a) | 254 | ||||||
| 144,156 | Old Mutual Ltd. (Insurance) | 93 | ||||||
| 15,002 | Remgro Ltd. (Financial Services) | 117 | ||||||
| 34,236 | Sanlam Ltd. (Insurance)(a) | 106 | ||||||
| 54,300 | Sasol Ltd. (Chemicals) | 673 | ||||||
| 9,822 | Shoprite Holdings Ltd. (Consumer Staples Distribution & Retail) | 118 | ||||||
| 455,387 | Sibanye Stillwater Ltd. (Metals & Mining) | 703 | ||||||
| 198,044 | Standard Bank Group Ltd. (Banks) | 1,871 | ||||||
| 31,869 | The Bidvest Group Ltd. (Industrial Conglomerates) | 443 | ||||||
| 22,743 | Woolworths Holdings Ltd. (Broadline Retail)(a) | 86 | ||||||
| 19,864 | ||||||||
South Korea — 10.44% | ||||||||
| 2,121 | Amorepacific Corp. (Personal Care Products) | 158 | ||||||
| 7,593 | Celltrion Healthcare Co. Ltd. (Health Care Providers & Services)(a) | 380 | ||||||
| 13,082 | Celltrion, Inc. (Biotechnology)(a) | 1,527 | ||||||
| 2,884 | CJ CheilJedang Corp. (Food Products) | 591 | ||||||
See accompanying notes to financial statements.
153
HC CAPITAL TRUST
The Emerging Markets Portfolio
Portfolio of Investments (continued) — June 30, 2023
Shares | Security Description | Value | ||||||
Common Stocks (continued) | ||||||||
South Korea (continued) | ||||||||
| 22,426 | Coway Co. Ltd. (Household Durables) | $ | 749 | |||||
| 10,846 | DB Insurance Co. Ltd. (Insurance)(a) | 616 | ||||||
| 42,563 | Doosan Enerbility Co. Ltd. (Electrical Equipment)(a)(b) | 588 | ||||||
| 10,961 | E-MART, Inc. (Consumer Staples Distribution & Retail) | 642 | ||||||
| 1,990 | GS Holdings Corp. (Industrial Conglomerates) | 55 | ||||||
| 25,499 | Hana Financial Group, Inc. (Banks) | 761 | ||||||
| 2,925 | Hankook Tire & Technology Co. Ltd. (Automobile Components) | 77 | ||||||
| 25,998 | Hanon Systems (Automobile Components) | 181 | ||||||
| 9,376 | HD Korea Shipbuilding & Offshore Engineering Co. Ltd. (Machinery)(b) | 834 | ||||||
| 8,788 | HLB, Inc. (Health Care Equipment & Supplies)(b) | 218 | ||||||
| 16,423 | HMM Co. Ltd. (Marine Transportation) | 236 | ||||||
| 5,698 | Hotel Shilla Co. Ltd. (Specialty Retail) | 319 | ||||||
| 20,595 | Hyundai Engineering & Construction Co. Ltd. (Construction & Engineering) | 599 | ||||||
| 8,869 | Hyundai Mobis Co. Ltd. (Automobile Components) | 1,570 | ||||||
| 8,958 | Hyundai Motor Co. (Automobile Components) | 1,409 | ||||||
| 6,687 | Hyundai Motor Co., Preference Shares (Automobiles) | 553 | ||||||
| 11,127 | Hyundai Motor Co., Series 2, Preference Shares (Automobiles) | 929 | ||||||
| 11,325 | Industrial Bank of Korea (Banks) | 89 | ||||||
| 28,976 | Kakao Corp. (Interactive Media & Services) | 1,088 | ||||||
| 16,639 | KakaoBank Corp. (Banks) | 302 | ||||||
| 61,371 | Kangwon Land, Inc. (Hotels, Restaurants & Leisure) | 813 | ||||||
| 37,692 | KB Financial Group, Inc. (Banks)(a) | 1,368 | ||||||
| 34,438 | Kia Corp. (Automobile Components) | 2,320 | ||||||
| 77,662 | Korea Electric Power Corp. (Electric Utilities)(b) | 1,216 | ||||||
| 5,017 | Krafton, Inc. (Entertainment)(b) | 747 | ||||||
| 35,580 | KT&G Corp. (Tobacco)(a) | 2,235 | ||||||
| 7,095 | Kumho Petrochemical Co. Ltd. (Chemicals) | 717 | ||||||
| 488 | L&F Co. Ltd. (Electronic Equipment, Instruments & Components) | 91 | ||||||
| 4,203 | LG Chem Ltd. (Chemicals) | 2,140 | ||||||
| 1,665 | LG Chem Ltd., Preference Shares (Chemicals) | 447 | ||||||
| 25,780 | LG Display Co. Ltd. (Electronic Equipment, Instruments & Components)(b) | 310 | ||||||
| 1,407 | LG Electronics, Inc. (Household Durables) | 136 | ||||||
| 2,766 | LG Energy Solution Ltd. (Electrical Equipment)(b) | 1,166 | ||||||
| 1,179 | LG H&H Co. Ltd. (Personal Care Products) | 412 | ||||||
Shares | Security Description | Value | ||||||
South Korea (continued) | ||||||||
| 2,237 | LG Innotek Co. Ltd. (Electronic Equipment, Instruments & Components) | $ | 530 | |||||
| 65,000 | Mirae Asset Securities Co. Ltd. (Capital Markets) | 359 | ||||||
| 11,210 | NAVER Corp. (Interactive Media & Services) | 1,569 | ||||||
| 138,644 | Pan Ocean Co. Ltd. (Marine Transportation) | 548 | ||||||
| 7,647 | Pearl Abyss Corp. (Entertainment)(b) | 308 | ||||||
| 6,387 | POSCO Future M Co. Ltd. (Construction Materials) | 1,723 | ||||||
| 6,030 | POSCO Holdings, Inc. (Metals & Mining) | 1,785 | ||||||
| 2,836 | Samsung Biologics Co. Ltd. (Life Sciences Tools & Services)(b) | 1,606 | ||||||
| 9,149 | Samsung Electro-Mechanics Co. Ltd. (Electronic Equipment, Instruments & Components) | 1,010 | ||||||
| 368,770 | Samsung Electronics Co. Ltd. (Technology Hardware, Storage & Peripherals) | 20,307 | ||||||
| 57,211 | Samsung Electronics Co. Ltd., Preference Shares (Technology Hardware, Storage & Peripherals) | 2,596 | ||||||
| 54,624 | Samsung Engineering Co. Ltd. (Construction & Engineering)(a)(b) | 1,178 | ||||||
| 7,638 | Samsung Fire & Marine Insurance Co. Ltd. (Insurance) | 1,333 | ||||||
| 4,007 | Samsung SDI Co. Ltd. (Electronic Equipment, Instruments & Components) | 2,046 | ||||||
| 60,008 | Shinhan Financial Group Co. Ltd. (Banks) | 1,551 | ||||||
| 45,837 | SK Hynix, Inc. (Semiconductors & Semiconductor Equipment) | 4,029 | ||||||
| 433 | SK IE Technology Co. Ltd. (Chemicals)(b) | 32 | ||||||
| 9,186 | SK Innovation Co. Ltd. (Oil, Gas & Consumable Fuels)^(b) | 1,114 | ||||||
| 18,697 | SK Square Co. Ltd. (Semiconductors & Semiconductor Equipment)(b) | 632 | ||||||
| 57,981 | Woori Financial Group, Inc. (Banks) | 521 | ||||||
| 73,366 | ||||||||
Taiwan — 13.05% | ||||||||
| 55,904 | Airtac International Group (Machinery) | 1,848 | ||||||
| 495,672 | ASE Technology Holding Co. Ltd. (Semiconductors & Semiconductor Equipment) | 1,763 | ||||||
| 745,971 | Asia Cement Corp. (Construction Materials) | 1,065 | ||||||
| 116,000 | Asustek Computer, Inc. (Technology Hardware, Storage & Peripherals) | 1,175 | ||||||
| 110,000 | Catcher Technology Co. Ltd. (Technology Hardware, Storage & Peripherals) | 621 | ||||||
| 1,021,000 | Cheng Shin Rubber Industry Co. Ltd. (Automobile Components) | 1,319 | ||||||
See accompanying notes to financial statements.
154
HC CAPITAL TRUST
The Emerging Markets Portfolio
Portfolio of Investments (continued) — June 30, 2023
Shares | Security Description | Value | ||||||
Common Stocks (continued) | ||||||||
Taiwan (continued) | ||||||||
| 4,428,000 | China Development Financial Holding Corp. (Insurance) | $ | 1,765 | |||||
| 280,000 | Chunghwa Telecom Co. Ltd. (Diversified Telecommunication Services) | 1,049 | ||||||
| 1,248,000 | Compal Electronics, Inc. (Technology Hardware, Storage & Peripherals) | 1,174 | ||||||
| 174,000 | Delta Electronics, Inc. (Electronic Equipment, Instruments & Components) | 1,929 | ||||||
| 14,000 | E Ink Holdings, Inc. (Electronic Equipment, Instruments & Components) | 102 | ||||||
| 63,000 | Eclat Textile Co. Ltd. (Textiles, Apparel & Luxury Goods) | 1,013 | ||||||
| 12,000 | eMemory Technology, Inc. (Semiconductors & Semiconductor Equipment) | 859 | ||||||
| 94,000 | Evergreen Marine Corp. Taiwan Ltd. (Marine Transportation) | 283 | ||||||
| 649,000 | Far EasTone Telecommunications Co. Ltd. (Wireless Telecommunication Services) | 1,639 | ||||||
| 748,342 | Fubon Financial Holding Co. Ltd. (Insurance) | 1,465 | ||||||
| 55,000 | Globalwafers Co. Ltd. (Semiconductors & Semiconductor Equipment) | 883 | ||||||
| 946,000 | Hon Hai Precision Industry Co. Ltd. (Electronic Equipment, Instruments & Components) | 3,440 | ||||||
| 986,450 | Innolux Corp. (Electronic Equipment, Instruments & Components) | 486 | ||||||
| 1,082,000 | Inventec Corp. (Technology Hardware, Storage & Peripherals) | 1,505 | ||||||
| 15,000 | Largan Precision Co. Ltd. (Electronic Equipment, Instruments & Components) | 1,029 | ||||||
| 720,554 | Lite-On Technology Corp. (Technology Hardware, Storage & Peripherals) | 2,400 | ||||||
| 84,962 | MediaTek, Inc. (Semiconductors & Semiconductor Equipment) | 1,881 | ||||||
| 2,775,163 | Mega Financial Holding Co. Ltd. (Banks) | 3,407 | ||||||
| 28,000 | Nan Ya Printed Circuit Board Corp. (Electronic Equipment, Instruments & Components) | 239 | ||||||
| 185,000 | Nanya Technology Corp. (Semiconductors & Semiconductor Equipment)(a) | 422 | ||||||
| 78,000 | Novatek Microelectronics Corp. (Semiconductors & Semiconductor Equipment) | 1,071 | ||||||
| 680,000 | Pegatron Corp. (Technology Hardware, Storage & Peripherals) | 1,638 | ||||||
| 436,620 | Pou Chen Corp. (Textiles, Apparel & Luxury Goods) | 443 | ||||||
Shares | Security Description | Value | ||||||
Taiwan (continued) | ||||||||
| 425,000 | Quanta Computer, Inc. (Technology Hardware, Storage & Peripherals) | $ | 2,076 | |||||
| 863,232 | Ruentex Development Co. Ltd. (Real Estate Management & Development) | 1,000 | ||||||
| 782,900 | Synnex Technology International Corp. (Electronic Equipment, Instruments & Components) | 1,461 | ||||||
| 1,259,110 | Taiwan Cement Corp. (Construction Materials) | 1,541 | ||||||
| 276,000 | Taiwan Mobile Co. Ltd. (Wireless Telecommunication Services) | 848 | ||||||
| 2,106,000 | Taiwan Semiconductor Manufacturing Co. Ltd. (Semiconductors & Semiconductor Equipment) | 38,912 | ||||||
| 470,369 | The Shanghai Commercial & Savings Bank Ltd. (Banks) | 686 | ||||||
| 163,000 | Unimicron Technology Corp. (Electronic Equipment, Instruments & Components) | 927 | ||||||
| 500,000 | United Microelectronics Corp. (Semiconductors & Semiconductor Equipment) | 786 | ||||||
| 81,000 | Win Semiconductors Corp. (Semiconductors & Semiconductor Equipment) | 429 | ||||||
| 546,000 | Winbond Electronics Corp. (Semiconductors & Semiconductor Equipment) | 483 | ||||||
| 638,400 | WPG Holdings Ltd. (Electronic Equipment, Instruments & Components) | 1,123 | ||||||
| 43,775 | Yageo Corp. (Electronic Equipment, Instruments & Components) | 694 | ||||||
| 241,000 | Yang Ming Marine Transport Corp. (Marine Transportation) | 490 | ||||||
| 3,274,864 | Yuanta Financial Holding Co. Ltd. (Financial Services) | 2,436 | ||||||
| 91,805 | ||||||||
Thailand — 1.73% | ||||||||
| 264,700 | Advanced Info Service PCL, Class - F (Wireless Telecommunication Services) | 1,600 | ||||||
| 379,300 | Airports of Thailand PCL (Transportation Infrastructure)(b) | 771 | ||||||
| 691,100 | Berli Jucker PCL (Consumer Staples Distribution & Retail) | 679 | ||||||
| 728,100 | BTS Group Holdings PCL (Ground Transportation) | 153 | ||||||
| 171,633 | Central Retail Corp. PCL (Broadline Retail) | 189 | ||||||
| 455,000 | Delta Electronics Thailand PCL - NVDR (Electronic Equipment, Instruments & Components) | 1,185 | ||||||
See accompanying notes to financial statements.
155
HC CAPITAL TRUST
The Emerging Markets Portfolio
Portfolio of Investments (continued) — June 30, 2023
Shares | Security Description | Value | ||||||
Common Stocks (continued) | ||||||||
Thailand (continued) | ||||||||
| 688,700 | Energy Absolute PCL (Independent Power and Renewable Electricity Producers) | $ | 1,109 | |||||
| 1,418,800 | Gulf Energy Development PCL (Independent Power and Renewable Electricity Producers) | 1,875 | ||||||
| 89,800 | Indorama Ventures PCL - NVDR (Chemicals) | 87 | ||||||
| 1,724,700 | Krung Thai Bank PCL, Class - F (Banks) | 945 | ||||||
| 682,900 | Minor International PCL (Hotels, Restaurants & Leisure) | 661 | ||||||
| 93,800 | Muangthai Capital PCL (Consumer Finance) | 104 | ||||||
| 272,575 | PTT Exploration & Production PCL, Class - F (Oil, Gas & Consumable Fuels) | 1,155 | ||||||
| 429,142 | PTT Global Chemical PCL, Class - F (Chemicals) | 452 | ||||||
| 361,600 | SCB X PCL - NVDR (Banks) | 1,089 | ||||||
| 98,100 | Thai Oil PCL (Oil, Gas & Consumable Fuels) | 123 | ||||||
| 12,177 | ||||||||
Turkey — 0.36% | ||||||||
| 435,775 | Aselsan Elektronik Sanayi Ve Ticaret A/S (Aerospace & Defense) | 916 | ||||||
| 39,242 | BIM Birlesik Magazalar A/S (Consumer Staples Distribution & Retail) | 258 | ||||||
| 266,822 | Eregli Demir ve Celik Fabrikalari TAS (Metals & Mining)(b) | 379 | ||||||
| 1 | Kardemir Karabuk Demir Celik Sanayi ve Ticaret A/S (Metals & Mining) | — | ||||||
| 131,853 | Sasa Polyester Sanayi A/S (Chemicals)(b) | 289 | ||||||
| 482,245 | Turkcell Iletisim Hizmetleri A/S (Wireless Telecommunication Services) | 674 | ||||||
| 2,516 | ||||||||
United Arab Emirates — 0.74% | ||||||||
| 443,740 | Abu Dhabi Commercial Bank PJSC (Banks) | 980 | ||||||
| 775,182 | Dubai Islamic Bank PJSC (Banks) | 1,159 | ||||||
| 163,297 | Emirates Telecommunications Group Co. PJSC (Diversified Telecommunication Services) | 1,002 | ||||||
| 517,479 | First Abu Dhabi Bank PJSC (Banks) | 1,929 | ||||||
| 154,208 | Multiply Group PJSC (Industrial Conglomerates)(b) | 134 | ||||||
| 5,204 | ||||||||
Shares | Security Description | Value | ||||||
United States — 0.27% | ||||||||
| 52,000 | BeiGene Ltd. (Biotechnology)(b) | $ | 713 | |||||
| 5,000 | Parade Technologies Ltd. (Semiconductors & Semiconductor Equipment) | 173 | ||||||
| 14,307 | Southern Copper Corp. (Metals & Mining) | 1,027 | ||||||
| 1,913 | ||||||||
Total Common Stocks | 600,619 | |||||||
Investment Companies — 14.10% | ||||||||
| 99,074,485 | State Street Institutional Treasury Plus Money Market Fund, Trust Class, 4.97%(d) | 99,074 | ||||||
Total Investment Companies | 99,074 | |||||||
Purchased Options on Futures — 0.01% | ||||||||
Total Purchased Options on Futures | 47 | |||||||
Total Investments (cost $662,973) — 99.55% | 699,740 | |||||||
Other assets in excess of liabilities — 0.45% | 3,128 | |||||||
Net Assets — 100.00% | $ | 702,868 | ||||||
Amounts designated as “—” are $0 or have been rounded to $0.
^ | All or part of this security was on loan as of June 30, 2023. |
(a) | Represents a security purchased under Rule 144A or Section 4(2) and is exempt from registration under the Securities Act of 1933, as amended, or is otherwise restricted to resale. Certain of these securities may be resold in transactions exempt from registration, normally to qualified institutional buyers. These securities have been deemed liquid by the Specialist Manager. |
(b) | Represents non-income producing security. |
(c) | Security was valued using significant unobservable inputs as of June 30, 2023. |
(d) | Annualized 7-day yield as of period-end. |
ADR—American Depositary Receipt |
GDR—Global Depositary Receipt |
NVDR—Non-Voting Depository Receipt |
REIT—Real Estate Investment Trust |
See accompanying notes to financial statements.
156
HC CAPITAL TRUST
The Emerging Markets Portfolio
Portfolio of Investments (continued) — June 30, 2023
The following table reflects the percentage of total net assets of the Portfolio attributable to each Specialist Manager as of June 30, 2023.
The Emerging Markets Portfolio | Mellon | Parametric | XY | Total |
Common Stocks | 85.44% | — | — | 85.44% |
Investment Companies | 0.37% | 6.26% | 7.47% | 14.10% |
Purchased Options on Futures | — | 0.01% | — | 0.01% |
Other Assets (Liabilities) | 0.34% | 0.41% | -0.30% | 0.45% |
Total Net Assets | 86.15% | 6.68% | 7.17% | 100.00% |
Amounts designated as “—” indicate the Specialist Manager did not manage any holdings in that category.
The following table reflects the open derivative positions held by the Portfolio as of June 30, 2023.
Futures Contracts Purchased*
Description | Number of | Expiration Date | Notional | Value and | ||||||||||||
MSCI Emerging Markets Index Future | 1,071 | 9/15/23 | $ | 53,438 | $ | (603 | ) | |||||||||
| $ | 53,438 | $ | (603 | ) | ||||||||||||
The following table reflects the open derivative positions held by the Portfolio as of June 30, 2023.
Futures Contracts Sold*
Description | Number of | Expiration Date | Notional | Value and | ||||||||||||
E-Mini S&P 500 Future | 7 | 9/15/23 | $ | 1,571 | $ | (50 | ) | |||||||||
| $ | 1,571 | $ | (50 | ) | ||||||||||||
Total Unrealized Appreciation | $ | — | ||||||||||||||
Total Unrealized Depreciation | (653 | ) | ||||||||||||||
Total Net Unrealized Appreciation/(Depreciation) | $ | (653 | ) | |||||||||||||
* | Cash has been pledged as collateral for futures contracts held by the Portfolio. |
See accompanying notes to financial statements.
157
HC CAPITAL TRUST
The Emerging Markets Portfolio
Portfolio of Investments (continued) — June 30, 2023
Options on Futures Contracts
Exchange-traded options on futures contacts written as of June 30, 2023 were as follows:
Description | Put/Call | Number of | Notional | Exercise | Expiration | Value | ||||||||||||||||||
E-Mini S&P 500 Future Option | Put | 6 | $ | 1,305 | $ | 4,350.00 | 7/14/23 | $ | (2 | ) | ||||||||||||||
E-Mini S&P 500 Future Option | Put | 6 | 1,299 | 4,330.00 | 7/14/23 | (1 | ) | |||||||||||||||||
E-Mini S&P 500 Future Option | Put | 10 | 1,950 | 3,900.00 | 7/21/23 | (1 | ) | |||||||||||||||||
E-Mini S&P 500 Future Option | Put | 16 | 3,159 | 3,950.00 | 7/21/23 | (1 | ) | |||||||||||||||||
E-Mini S&P 500 Future Option | Put | 5 | 913 | 3,650.00 | 7/21/23 | — | ||||||||||||||||||
E-Mini S&P 500 Future Option | Put | 5 | 1,069 | 4,275.00 | 7/21/23 | (1 | ) | |||||||||||||||||
E-Mini S&P 500 Future Option | Put | 6 | 1,133 | 3,775.00 | 7/21/23 | — | ||||||||||||||||||
E-Mini S&P 500 Future Option | Put | 5 | 945 | 3,780.00 | 7/21/23 | — | ||||||||||||||||||
E-Mini S&P 500 Future Option | Put | 7 | 1,330 | 3,800.00 | 7/21/23 | — | ||||||||||||||||||
E-Mini S&P 500 Future Option | Put | 7 | 1,334 | 3,810.00 | 7/21/23 | — | ||||||||||||||||||
E-Mini S&P 500 Future Option | Put | 6 | 1,104 | 3,680.00 | 7/21/23 | — | ||||||||||||||||||
E-Mini S&P 500 Future Option | Put | 8 | 1,548 | 3,870.00 | 7/21/23 | (1 | ) | |||||||||||||||||
E-Mini S&P 500 Future Option | Put | 8 | 1,560 | 3,900.00 | 7/31/23 | (1 | ) | |||||||||||||||||
E-Mini S&P 500 Future Option | Put | 10 | 2,138 | 4,275.00 | 7/31/23 | (6 | ) | |||||||||||||||||
E-Mini S&P 500 Future Option | Put | 12 | 2,580 | 4,300.00 | 7/31/23 | (8 | ) | |||||||||||||||||
E-Mini S&P 500 Future Option | Put | 9 | 1,769 | 3,930.00 | 7/31/23 | (1 | ) | |||||||||||||||||
E-Mini S&P 500 Future Option | Put | 20 | 3,879 | 3,880.00 | 7/31/23 | (2 | ) | |||||||||||||||||
E-Mini S&P 500 Future Option | Put | 7 | 1,341 | 3,830.00 | 7/31/23 | (1 | ) | |||||||||||||||||
E-Mini S&P 500 Future Option | Put | 6 | 1,118 | 3,725.00 | 7/31/23 | (1 | ) | |||||||||||||||||
E-Mini S&P 500 Future Option | Put | 8 | 1,692 | 4,230.00 | 7/31/23 | (4 | ) | |||||||||||||||||
E-Mini S&P 500 Future Option | Put | 14 | 2,947 | 4,210.00 | 7/31/23 | (5 | ) | |||||||||||||||||
E-Mini S&P 500 Future Option | Put | 7 | 1,330 | 3,800.00 | 7/31/23 | (1 | ) | |||||||||||||||||
E-Mini S&P 500 Future Option | Put | 16 | 3,279 | 4,100.00 | 7/31/23 | (4 | ) | |||||||||||||||||
E-Mini S&P 500 Future Option | Put | 5 | 1,000 | 4,000.00 | 7/31/23 | (1 | ) | |||||||||||||||||
E-Mini S&P 500 Future Option | Put | 7 | 1,400 | 4,000.00 | 8/18/23 | (3 | ) | |||||||||||||||||
E-Mini S&P 500 Future Option | Put | 7 | 1,379 | 3,940.00 | 8/18/23 | (2 | ) | |||||||||||||||||
E-Mini S&P 500 Future Option | Put | 15 | 2,948 | 3,930.00 | 8/18/23 | (5 | ) | |||||||||||||||||
E-Mini S&P 500 Future Option | Put | 7 | 1,374 | 3,925.00 | 8/18/23 | (2 | ) | |||||||||||||||||
E-Mini S&P 500 Future Option | Put | 6 | 1,224 | 4,080.00 | 8/18/23 | (3 | ) | |||||||||||||||||
E-Mini S&P 500 Future Option | Put | 9 | 1,710 | 3,800.00 | 8/18/23 | (2 | ) | |||||||||||||||||
E-Mini S&P 500 Future Option | Put | 16 | 3,327 | 4,160.00 | 8/18/23 | (12 | ) | |||||||||||||||||
E-Mini S&P 500 Future Option | Put | 7 | 1,426 | 4,075.00 | 8/18/23 | (4 | ) | |||||||||||||||||
E-Mini S&P 500 Future Option | Put | 8 | 1,636 | 4,090.00 | 8/18/23 | (4 | ) | |||||||||||||||||
E-Mini S&P 500 Future Option | Put | 10 | 2,055 | 4,110.00 | 8/31/23 | (9 | ) | |||||||||||||||||
E-Mini S&P 500 Future Option | Put | 16 | 3,239 | 4,050.00 | 8/31/23 | (12 | ) | |||||||||||||||||
E-Mini S&P 500 Future Option | Put | 11 | 2,214 | 4,025.00 | 8/31/23 | (7 | ) | |||||||||||||||||
E-Mini S&P 500 Future Option | Put | 6 | 1,223 | 4,075.00 | 9/15/23 | (7 | ) | |||||||||||||||||
E-Mini S&P 500 Future Option | Put | 7 | 1,418 | 4,050.00 | 9/15/23 | (7 | ) | |||||||||||||||||
| $ | (121 | ) | ||||||||||||||||||||||
See accompanying notes to financial statements.
158
HC CAPITAL TRUST
The Emerging Markets Portfolio
Portfolio of Investments (continued) — June 30, 2023
Exchanged-traded options on futures contacts purchased as of June 30, 2023 were as follows:
Description | Put/Call | Number of | Notional | Exercise | Expiration | Value | ||||||||||||||||||
E-Mini S&P 500 Future Option | Call | 10 | $ | 2,284 | $ | 4,570.00 | 7/21/23 | $ | 6 | |||||||||||||||
E-Mini S&P 500 Future Option | Put | 8 | 1,710 | 4,275.00 | 7/14/23 | 1 | ||||||||||||||||||
E-Mini S&P 500 Future Option | Put | 5 | 1,063 | 4,250.00 | 7/21/23 | 1 | ||||||||||||||||||
E-Mini S&P 500 Future Option | Put | 8 | 1,660 | 4,150.00 | 7/21/23 | 1 | ||||||||||||||||||
E-Mini S&P 500 Future Option | Put | 5 | 1,025 | 4,100.00 | 7/21/23 | 1 | ||||||||||||||||||
E-Mini S&P 500 Future Option | Put | 7 | 1,400 | 4,000.00 | 7/21/23 | 1 | ||||||||||||||||||
E-Mini S&P 500 Future Option | Put | 6 | 1,238 | 4,125.00 | 7/21/23 | 1 | ||||||||||||||||||
E-Mini S&P 500 Future Option | Put | 7 | 1,523 | 4,350.00 | 7/31/23 | 6 | ||||||||||||||||||
E-Mini S&P 500 Future Option | Put | 8 | 1,700 | 4,250.00 | 7/31/23 | 4 | ||||||||||||||||||
E-Mini S&P 500 Future Option | Put | 6 | 1,320 | 4,400.00 | 7/31/23 | 8 | ||||||||||||||||||
E-Mini S&P 500 Future Option | Put | 5 | 1,094 | 4,375.00 | 7/31/23 | 6 | ||||||||||||||||||
E-Mini S&P 500 Future Option | Put | 8 | 1,729 | 4,325.00 | 8/18/23 | 11 | ||||||||||||||||||
| $ | 47 | |||||||||||||||||||||||
Total Return Swap Agreements | |||||||||||||||||||||||||||||||||
Pay/ | Financing | Description | Counterparty | Expiration | Payment | Notional | Value | Upfront | Unrealized | ||||||||||||||||||||||||
Receive | 0.57% | 37 Interactive Entertainment Network Technology Group Co. Ltd. A-shares | Morgan Stanley | 2/5/24 | At Maturity | $ | 158 | $ | 14 | $ | — | $ | 14 | ||||||||||||||||||||
Receive | 0.57% | Advanced Micro-Fabrication Equipment, Inc. China A-shares | Morgan Stanley | 2/5/24 | At Maturity | 239 | (25 | ) | — | (25 | ) | ||||||||||||||||||||||
Receive | 0.57% | Agricultural Bank of China Ltd. A-shares | Morgan Stanley | 2/5/24 | At Maturity | 123 | (2 | ) | — | (2 | ) | ||||||||||||||||||||||
Receive | 0.57% | Aier Eye Hospital Group Co. Ltd. A-shares | Morgan Stanley | 2/5/24 | At Maturity | 16 | (1 | ) | — | (1 | ) | ||||||||||||||||||||||
Receive | 0.57% | Anhui Gujing Distillery Co. Ltd. A-shares | Morgan Stanley | 2/5/24 | At Maturity | 263 | (20 | ) | — | (20 | ) | ||||||||||||||||||||||
Receive | 0.57% | Anhui Kouzi Distillery Co. Ltd. A-shares | Morgan Stanley | 2/5/24 | At Maturity | 2 | — | — | — | ||||||||||||||||||||||||
Receive | 0.57% | Anhui Province Natural Gas Development Co. Ltd. A-shares | Morgan Stanley | 2/5/24 | At Maturity | 3 | — | — | — | ||||||||||||||||||||||||
Receive | 0.57% | Anhui Xinhua Media Co. Ltd. A-shares | Morgan Stanley | 2/5/24 | At Maturity | 8 | — | — | — | ||||||||||||||||||||||||
Receive | 0.57% | Anhui Yingjia Distillery Co. Ltd. A-shares | Morgan Stanley | 2/5/24 | At Maturity | 1 | — | — | — | ||||||||||||||||||||||||
Receive | 0.57% | Anji Foodstuff Co. Ltd. A-shares | Morgan Stanley | 2/5/24 | At Maturity | 11 | — | — | — | ||||||||||||||||||||||||
Receive | 0.57% | Anjoy Foods Group Co. Ltd. A-shares | Morgan Stanley | 2/5/24 | At Maturity | 2 | — | — | — | ||||||||||||||||||||||||
Receive | 0.57% | Anker Innovations Technology Co. Ltd. A-shares | Morgan Stanley | 2/5/24 | At Maturity | 83 | 3 | — | 3 | ||||||||||||||||||||||||
Receive | 0.57% | Anshan Senyuan Road & Bridge Co. Ltd. A-shares | Morgan Stanley | 2/5/24 | At Maturity | 105 | (1 | ) | — | (1 | ) | ||||||||||||||||||||||
Receive | 0.57% | Aofu Environmental Technology Co. Ltd. A-shares | Morgan Stanley | 2/5/24 | At Maturity | 136 | 2 | — | 2 | ||||||||||||||||||||||||
See accompanying notes to financial statements.
159
HC CAPITAL TRUST
The Emerging Markets Portfolio
Portfolio of Investments (continued) — June 30, 2023
Total Return Swap Agreements | |||||||||||||||||||||||||||||||||
Pay/ | Financing | Description | Counterparty | Expiration | Payment | Notional | Value | Upfront | Unrealized | ||||||||||||||||||||||||
Receive | 0.57% | Arcsoft Corp. Ltd. A-shares | Morgan Stanley | 2/5/24 | At Maturity | $ | 13 | $ | — | $ | — | $ | — | ||||||||||||||||||||
Receive | 0.57% | Asymchem Laboratories Tianjin Co. Ltd. A-shares | Morgan Stanley | 2/5/24 | At Maturity | 36 | (3 | ) | — | (3 | ) | ||||||||||||||||||||||
Receive | 0.57% | Autel Intelligent Technology Corp. Ltd. A-shares | Morgan Stanley | 2/5/24 | At Maturity | 2 | — | — | — | ||||||||||||||||||||||||
Receive | 0.57% | Avary Holding Shenzhen Co. Ltd. A-shares | Morgan Stanley | 2/5/24 | At Maturity | 172 | (3 | ) | — | (3 | ) | ||||||||||||||||||||||
Receive | 0.57% | Avcon Information Technology Co. Ltd. A-shares | Morgan Stanley | 2/5/24 | At Maturity | 145 | (1 | ) | — | (1 | ) | ||||||||||||||||||||||
Receive | 0.57% | Bank of China Ltd. A-shares | Morgan Stanley | 2/5/24 | At Maturity | 96 | (3 | ) | — | (3 | ) | ||||||||||||||||||||||
Receive | 0.57% | Bank of Communications Co. Ltd. A-shares | Morgan Stanley | 2/5/24 | At Maturity | 99 | (3 | ) | — | (3 | ) | ||||||||||||||||||||||
Receive | 0.57% | Bank of Hangzhou Co. Ltd. A-shares | Morgan Stanley | 2/5/24 | At Maturity | 464 | (31 | ) | — | (31 | ) | ||||||||||||||||||||||
Receive | 0.57% | Bank of Jiangsu Co. Ltd. A-shares | Morgan Stanley | 2/5/24 | At Maturity | 1,855 | (89 | ) | — | (89 | ) | ||||||||||||||||||||||
Receive | 0.57% | Bank of Nanjing Co. Ltd. A-shares | Morgan Stanley | 2/5/24 | At Maturity | 306 | (9 | ) | — | (9 | ) | ||||||||||||||||||||||
Receive | 0.57% | Baoxiniao Holding Co. Ltd. A-shares | Morgan Stanley | 2/5/24 | At Maturity | 3 | — | — | — | ||||||||||||||||||||||||
Receive | 0.57% | Beijing Jingneng Thermal Co. Ltd. A-shares | Morgan Stanley | 2/5/24 | At Maturity | 67 | 2 | — | 2 | ||||||||||||||||||||||||
Receive | 0.57% | Beijing Kingsoft Office Software, Inc. A-shares | Morgan Stanley | 2/5/24 | At Maturity | 209 | 20 | — | 20 | ||||||||||||||||||||||||
Receive | 0.57% | Beijing Lier High-temperature Materials Co. Ltd. A-shares | Morgan Stanley | 2/5/24 | At Maturity | 2 | — | — | — | ||||||||||||||||||||||||
Receive | 0.57% | Beijing Tongrentang Co. Ltd. A-shares | Morgan Stanley | 2/5/24 | At Maturity | 71 | (2 | ) | — | (2 | ) | ||||||||||||||||||||||
Receive | 0.57% | Beijing Tongyizhong New Material Technology Corp. A-shares | Morgan Stanley | 2/5/24 | At Maturity | 137 | 4 | — | 4 | ||||||||||||||||||||||||
Receive | 0.57% | Beijing Trust&Far Technology Co. Ltd. A-shares | Morgan Stanley | 2/5/24 | At Maturity | 12 | — | — | — | ||||||||||||||||||||||||
Receive | 0.57% | But one Information Corp. Xi an A-shares | Morgan Stanley | 2/5/24 | At Maturity | 423 | (7 | ) | — | (7 | ) | ||||||||||||||||||||||
Receive | 0.57% | BYBON Group Co. Ltd. A-shares | Morgan Stanley | 2/5/24 | At Maturity | 169 | 2 | — | 2 | ||||||||||||||||||||||||
Receive | 0.57% | BYD Co. Ltd. A-shares | Morgan Stanley | 2/5/24 | At Maturity | 612 | (12 | ) | — | (12 | ) | ||||||||||||||||||||||
Receive | 0.57% | By-health Co. Ltd. A-shares | Morgan Stanley | 2/5/24 | At Maturity | 406 | (7 | ) | — | (7 | ) | ||||||||||||||||||||||
Receive | 0.57% | CareRay Digital Medical Technology Co. Ltd. A-shares | Morgan Stanley | 2/5/24 | At Maturity | 6 | — | — | — | ||||||||||||||||||||||||
Receive | 0.57% | CGN Power Co. Ltd. A-shares | Morgan Stanley | 2/5/24 | At Maturity | 35 | — | — | — | ||||||||||||||||||||||||
See accompanying notes to financial statements.
160
HC CAPITAL TRUST
The Emerging Markets Portfolio
Portfolio of Investments (continued) — June 30, 2023
Total Return Swap Agreements | |||||||||||||||||||||||||||||||||
Pay/ | Financing | Description | Counterparty | Expiration | Payment | Notional | Value | Upfront | Unrealized | ||||||||||||||||||||||||
Receive | 0.57% | Changchun Eurasia Group Co. Ltd. A-shares | Morgan Stanley | 2/5/24 | At Maturity | $ | 12 | $ | — | $ | — | $ | — | ||||||||||||||||||||
Receive | 0.57% | Changjiang Securities Co. Ltd. A-shares | Morgan Stanley | 2/5/24 | At Maturity | 7 | — | — | — | ||||||||||||||||||||||||
Receive | 0.57% | Changsha DIALINE New Material Sci & Tech Co. Ltd. A-shares | Morgan Stanley | 2/5/24 | At Maturity | 11 | 1 | — | 1 | ||||||||||||||||||||||||
Receive | 0.57% | Chaozhou Three-Circle Group Co. Ltd. A-shares | Morgan Stanley | 2/5/24 | At Maturity | 130 | (3 | ) | — | (3 | ) | ||||||||||||||||||||||
Receive | 0.57% | China CITIC Bank Corp. Ltd. A-shares | Morgan Stanley | 2/5/24 | At Maturity | 3 | — | — | — | ||||||||||||||||||||||||
Receive | 0.57% | China Everbright Bank Co. Ltd. A-shares | Morgan Stanley | 2/5/24 | At Maturity | 123 | (4 | ) | — | (4 | ) | ||||||||||||||||||||||
Receive | 0.57% | China Merchants Bank Co. Ltd. A-shares | Morgan Stanley | 2/5/24 | At Maturity | 632 | (62 | ) | — | (62 | ) | ||||||||||||||||||||||
Receive | 0.57% | China Merchants Securities Co. Ltd. A-shares | Morgan Stanley | 2/5/24 | At Maturity | 519 | (52 | ) | — | (52 | ) | ||||||||||||||||||||||
Receive | 0.57% | China Minsheng Banking Corp. Ltd. A-shares | Morgan Stanley | 2/5/24 | At Maturity | 291 | (17 | ) | — | (17 | ) | ||||||||||||||||||||||
Receive | 0.57% | China National Nuclear Power Co. Ltd. A-shares | Morgan Stanley | 2/5/24 | At Maturity | 48 | — | — | — | ||||||||||||||||||||||||
Receive | 0.57% | China Pacific Insurance Group Co. Ltd. A-shares | Morgan Stanley | 2/5/24 | At Maturity | 408 | (61 | ) | — | (61 | ) | ||||||||||||||||||||||
Receive | 0.57% | China Petroleum & Chemical Corp. A-shares | Morgan Stanley | 2/5/24 | At Maturity | 376 | (15 | ) | — | (15 | ) | ||||||||||||||||||||||
Receive | 0.57% | China Railway Group Ltd. A-shares | Morgan Stanley | 2/5/24 | At Maturity | 337 | (18 | ) | — | (18 | ) | ||||||||||||||||||||||
Receive | 0.57% | China Resources Sanjiu Medical & Pharmaceutical Co. Ltd. A-shares | Morgan Stanley | 2/5/24 | At Maturity | 44 | — | — | — | ||||||||||||||||||||||||
Receive | 0.57% | China State Construction Engineering Corp. Ltd. A-shares | Morgan Stanley | 2/5/24 | At Maturity | 938 | (90 | ) | — | (90 | ) | ||||||||||||||||||||||
Receive | 0.57% | China Tourism Group Duty Free Corp. Ltd. A-shares | Morgan Stanley | 2/5/24 | At Maturity | 29 | (4 | ) | — | (4 | ) | ||||||||||||||||||||||
Receive | 0.57% | China TransInfo Technology Co. Ltd. A-shares | Morgan Stanley | 2/5/24 | At Maturity | 6 | — | — | — | ||||||||||||||||||||||||
Receive | 0.57% | China United Network Communications Ltd. A-shares | Morgan Stanley | 2/5/24 | At Maturity | 663 | (38 | ) | — | (38 | ) | ||||||||||||||||||||||
Receive | 0.57% | China Yangtze Power Co. Ltd. A-shares | Morgan Stanley | 2/5/24 | At Maturity | 40 | — | — | — | ||||||||||||||||||||||||
Receive | 0.57% | China Zhenhua Group Science & Technology Co. Ltd. A-shares | Morgan Stanley | 2/5/24 | At Maturity | 146 | 11 | — | 11 | ||||||||||||||||||||||||
Receive | 0.57% | China Zheshang Bank Co. Ltd. A-shares | Morgan Stanley | 2/5/24 | At Maturity | 148 | (18 | ) | — | (18 | ) | ||||||||||||||||||||||
Receive | 0.57% | Chinese Universe Publishing and Media Group Co. Ltd. A-shares | Morgan Stanley | 2/5/24 | At Maturity | 8 | — | — | — | ||||||||||||||||||||||||
Receive | 0.57% | Chongqing Baiya Sanitary Products Co. Ltd. A-shares | Morgan Stanley | 2/5/24 | At Maturity | 1 | — | — | — | ||||||||||||||||||||||||
See accompanying notes to financial statements.
161
HC CAPITAL TRUST
The Emerging Markets Portfolio
Portfolio of Investments (continued) — June 30, 2023
Total Return Swap Agreements | |||||||||||||||||||||||||||||||||
Pay/ | Financing | Description | Counterparty | Expiration | Payment | Notional | Value | Upfront | Unrealized | ||||||||||||||||||||||||
Receive | 0.57% | Chongqing Changan Automobile Co. Ltd. A-shares | Morgan Stanley | 2/5/24 | At Maturity | $ | 29 | $ | 1 | $ | — | $ | 1 | ||||||||||||||||||||
Receive | 0.57% | Cisen Pharmaceutical Co. Ltd. A-shares | Morgan Stanley | 2/5/24 | At Maturity | 135 | (5 | ) | — | (5 | ) | ||||||||||||||||||||||
Receive | 0.57% | Citic Pacific Special Steel Group Co. Ltd. A-shares | Morgan Stanley | 2/5/24 | At Maturity | 3 | — | — | — | ||||||||||||||||||||||||
Receive | 0.57% | CITIC Securities Co. Ltd. A-shares | Morgan Stanley | 2/5/24 | At Maturity | 485 | (19 | ) | — | (19 | ) | ||||||||||||||||||||||
Receive | 0.57% | Contemporary Amperex Technology Co. Ltd. A-shares | Morgan Stanley | 2/5/24 | At Maturity | 1,545 | (148 | ) | — | (148 | ) | ||||||||||||||||||||||
Receive | 0.57% | COSCo. SHIPPING Energy Transportation Co. Ltd. A-shares | Morgan Stanley | 2/5/24 | At Maturity | 8 | — | — | — | ||||||||||||||||||||||||
Receive | 0.57% | Daqin Railway Co. Ltd. A-shares | Morgan Stanley | 2/5/24 | At Maturity | 4 | — | — | — | ||||||||||||||||||||||||
Receive | 0.57% | Dongguan Yiheda Automation Co. Ltd. A-shares | Morgan Stanley | 2/5/24 | At Maturity | 95 | 1 | — | 1 | ||||||||||||||||||||||||
Receive | 0.57% | Eastroc Beverage Group Co. Ltd. A-shares | Morgan Stanley | 2/5/24 | At Maturity | 3 | — | — | — | ||||||||||||||||||||||||
Receive | 0.57% | Edan Instruments, Inc. A-shares | Morgan Stanley | 2/5/24 | At Maturity | 164 | (8 | ) | — | (8 | ) | ||||||||||||||||||||||
Receive | 0.57% | Elite Color Environmental Resources Science & Technology Co. Ltd. A-shares | Morgan Stanley | 2/5/24 | At Maturity | 419 | 11 | — | 11 | ||||||||||||||||||||||||
Receive | 0.57% | ENN Natural Gas Co. Ltd. A-shares | Morgan Stanley | 2/5/24 | At Maturity | 6 | — | — | — | ||||||||||||||||||||||||
Receive | 0.57% | Eve Energy Co. Ltd. A-shares | Morgan Stanley | 2/5/24 | At Maturity | 203 | (15 | ) | — | (15 | ) | ||||||||||||||||||||||
Receive | 0.57% | Fibocom Wireless, Inc. A-shares | Morgan Stanley | 2/5/24 | At Maturity | 135 | (6 | ) | — | (6 | ) | ||||||||||||||||||||||
Receive | 0.57% | Flying Technology Co. Ltd. A-shares | Morgan Stanley | 2/5/24 | At Maturity | 167 | 5 | — | 5 | ||||||||||||||||||||||||
Receive | 0.57% | Focus Media Information Technology Co. Ltd. A-shares | Morgan Stanley | 2/5/24 | At Maturity | 396 | (10 | ) | — | (10 | ) | ||||||||||||||||||||||
Receive | 0.57% | Foxconn Industrial Internet Co. Ltd. A-shares | Morgan Stanley | 2/5/24 | At Maturity | 105 | 32 | — | 32 | ||||||||||||||||||||||||
Receive | 0.57% | Fuda Alloy Materials Co. Ltd. A-shares | Morgan Stanley | 2/5/24 | At Maturity | 185 | 4 | — | 4 | ||||||||||||||||||||||||
Receive | 0.57% | Fujian Fynex Textile Science & Technology Co. Ltd. A-shares | Morgan Stanley | 2/5/24 | At Maturity | 14 | — | — | — | ||||||||||||||||||||||||
Receive | 0.57% | Fujian Sanmu Group Co. A-shares | Morgan Stanley | 2/5/24 | At Maturity | 26 | — | — | — | ||||||||||||||||||||||||
Receive | 0.57% | Fuyao Glass Industry Group Co. Ltd. A-shares | Morgan Stanley | 2/5/24 | At Maturity | 106 | 3 | — | 3 | ||||||||||||||||||||||||
Receive | 0.57% | GAD Environmental Technology Co. Ltd. A-shares | Morgan Stanley | 2/5/24 | At Maturity | 86 | (1 | ) | — | (1 | ) | ||||||||||||||||||||||
Receive | 0.57% | Glodon Co. Ltd. A-shares | Morgan Stanley | 2/5/24 | At Maturity | 125 | (40 | ) | — | (40 | ) | ||||||||||||||||||||||
See accompanying notes to financial statements.
162
HC CAPITAL TRUST
The Emerging Markets Portfolio
Portfolio of Investments (continued) — June 30, 2023
Total Return Swap Agreements | |||||||||||||||||||||||||||||||||
Pay/ | Financing | Description | Counterparty | Expiration | Payment | Notional | Value | Upfront | Unrealized | ||||||||||||||||||||||||
Receive | 0.57% | Goldcup Electric Apparatus Co. Ltd. A-shares | Morgan Stanley | 2/5/24 | At Maturity | $ | 27 | $ | 1 | $ | — | $ | 1 | ||||||||||||||||||||
Receive | 0.57% | Gongniu Group Co. Ltd. A-shares | Morgan Stanley | 2/5/24 | At Maturity | 4 | — | — | — | ||||||||||||||||||||||||
Receive | 0.57% | GoodWe Technologies Co. Ltd. A-shares | Morgan Stanley | 2/5/24 | At Maturity | 91 | (8 | ) | — | (8 | ) | ||||||||||||||||||||||
Receive | 0.57% | Greenland Holdings Corp. Ltd. A-shares | Morgan Stanley | 2/5/24 | At Maturity | 2 | — | — | — | ||||||||||||||||||||||||
Receive | 0.57% | GRG Banking Equipment Co. Ltd. A-shares | Morgan Stanley | 2/5/24 | At Maturity | 215 | (10 | ) | — | (10 | ) | ||||||||||||||||||||||
Receive | 0.57% | GSP Automotive Group Wenzhou Co. Ltd. A-shares | Morgan Stanley | 2/5/24 | At Maturity | 10 | — | — | — | ||||||||||||||||||||||||
Receive | 0.57% | Guangdong Fenghua Advanced Technology Holding Co. Ltd. A-shares | Morgan Stanley | 2/5/24 | At Maturity | 5 | — | — | — | ||||||||||||||||||||||||
Receive | 0.57% | GuangDong GenSho Logistics Co. Ltd. A-shares | Morgan Stanley | 2/5/24 | At Maturity | 3 | — | — | — | ||||||||||||||||||||||||
Receive | 0.57% | Guangdong Nedfon Air System Co. Ltd. A-shares | Morgan Stanley | 2/5/24 | At Maturity | 81 | 3 | — | 3 | ||||||||||||||||||||||||
Receive | 0.57% | Guangdong Tianan New Material Co. Ltd. A-shares | Morgan Stanley | 2/5/24 | At Maturity | 672 | 39 | — | 39 | ||||||||||||||||||||||||
Receive | 0.57% | Guangdong Topstrong Living Innovation & Integration Co. Ltd. A-shares | Morgan Stanley | 2/5/24 | At Maturity | 185 | 12 | — | 12 | ||||||||||||||||||||||||
Receive | 0.57% | Guanghui Energy Co. Ltd. A-shares | Morgan Stanley | 2/5/24 | At Maturity | 274 | (43 | ) | — | (43 | ) | ||||||||||||||||||||||
Receive | 0.57% | Guangzhou Baiyun Electric Equipment Co. Ltd. A-shares | Morgan Stanley | 2/5/24 | At Maturity | 2 | — | — | — | ||||||||||||||||||||||||
Receive | 0.57% | Guangzhou Baiyunshan Pharmaceutical Holdings Co. Ltd. A-shares | Morgan Stanley | 2/5/24 | At Maturity | 1 | — | — | — | ||||||||||||||||||||||||
Receive | 0.57% | Guilin Seamild Foods Co. Ltd. A-shares | Morgan Stanley | 2/5/24 | At Maturity | 74 | (4 | ) | — | (4 | ) | ||||||||||||||||||||||
Receive | 0.57% | Guosen Securities Co. Ltd. A-shares | Morgan Stanley | 2/5/24 | At Maturity | 232 | (13 | ) | — | (13 | ) | ||||||||||||||||||||||
Receive | 0.57% | Guotai Junan Securities Co. Ltd. A-shares | Morgan Stanley | 2/5/24 | At Maturity | 680 | (63 | ) | — | (63 | ) | ||||||||||||||||||||||
Receive | 0.57% | Haier Smart Home Co. Ltd. A-shares | Morgan Stanley | 2/5/24 | At Maturity | 256 | 1 | — | 1 | ||||||||||||||||||||||||
Receive | 0.57% | Haitong Securities Co. Ltd. A-shares | Morgan Stanley | 2/5/24 | At Maturity | 3 | — | — | — | ||||||||||||||||||||||||
Receive | 0.57% | Hangzhou Bio-Sincerity Pharma-Tech Co. Ltd. A-shares | Morgan Stanley | 2/5/24 | At Maturity | 1 | — | — | — | ||||||||||||||||||||||||
Receive | 0.57% | Hangzhou Hopechart IoT Technology Co. Ltd. A-shares | Morgan Stanley | 2/5/24 | At Maturity | 32 | 3 | — | 3 | ||||||||||||||||||||||||
Receive | 0.57% | Hangzhou IECHO Science & Technology Co. Ltd. A-shares | Morgan Stanley | 2/5/24 | At Maturity | 69 | 3 | — | 3 | ||||||||||||||||||||||||
Receive | 0.57% | Hangzhou Sunrise Technology Co. Ltd. A-shares | Morgan Stanley | 2/5/24 | At Maturity | 1 | — | — | — | ||||||||||||||||||||||||
See accompanying notes to financial statements.
163
HC CAPITAL TRUST
The Emerging Markets Portfolio
Portfolio of Investments (continued) — June 30, 2023
Total Return Swap Agreements | |||||||||||||||||||||||||||||||||
Pay/ | Financing | Description | Counterparty | Expiration | Payment | Notional | Value | Upfront | Unrealized | ||||||||||||||||||||||||
Receive | 0.57% | Hangzhou Tigermed Consulting Co. Ltd. A-shares | Morgan Stanley | 2/5/24 | At Maturity | $ | 1 | $ | — | $ | — | $ | — | ||||||||||||||||||||
Receive | 0.57% | Hangzhou XZB Tech Co. Ltd. A-shares | Morgan Stanley | 2/5/24 | At Maturity | 5 | — | — | — | ||||||||||||||||||||||||
Receive | 0.57% | Hangzhou Yitong New Materials Co. Ltd. A-shares | Morgan Stanley | 2/5/24 | At Maturity | 2 | — | — | — | ||||||||||||||||||||||||
Receive | 0.57% | Harbin Xinguang Optic-Electronics Technology Co. Ltd. A-shares | Morgan Stanley | 2/5/24 | At Maturity | 34 | — | — | — | ||||||||||||||||||||||||
Receive | 0.57% | Hefei Department Store Group Co. Ltd. A-shares | Morgan Stanley | 2/5/24 | At Maturity | 49 | — | — | — | ||||||||||||||||||||||||
Receive | 0.57% | Henan Lingrui Pharmaceutical Co. A-shares | Morgan Stanley | 2/5/24 | At Maturity | 166 | (7 | ) | — | (7 | ) | ||||||||||||||||||||||
Receive | 0.57% | Henan Thinker Automatic Equipment Co. Ltd. A-shares | Morgan Stanley | 2/5/24 | At Maturity | 134 | (6 | ) | — | (6 | ) | ||||||||||||||||||||||
Receive | 0.57% | Hengtong Optic-electric Co. Ltd. A-shares | Morgan Stanley | 2/5/24 | At Maturity | 32 | (1 | ) | — | (1 | ) | ||||||||||||||||||||||
Receive | 0.57% | Hisense Visual Technology Co. Ltd. A-shares | Morgan Stanley | 2/5/24 | At Maturity | 60 | 5 | — | 5 | ||||||||||||||||||||||||
Receive | 0.57% | Hithink RoyalFlush Information Network Co. Ltd. A-shares | Morgan Stanley | 2/5/24 | At Maturity | 132 | 3 | — | 3 | ||||||||||||||||||||||||
Receive | 0.57% | Hongfa Technology Co. Ltd. A-shares | Morgan Stanley | 2/5/24 | At Maturity | 47 | 2 | — | 2 | ||||||||||||||||||||||||
Receive | 0.57% | Huadong Medicine Co. Ltd. A-shares | Morgan Stanley | 2/5/24 | At Maturity | 4 | — | — | — | ||||||||||||||||||||||||
Receive | 0.57% | Huaibei Mining Holdings Co. Ltd. A-shares | Morgan Stanley | 2/5/24 | At Maturity | 174 | (27 | ) | — | (27 | ) | ||||||||||||||||||||||
Receive | 0.57% | Huaneng Power International, Inc. A-shares | Morgan Stanley | 2/5/24 | At Maturity | 133 | (11 | ) | — | (11 | ) | ||||||||||||||||||||||
Receive | 0.57% | Huatai Securities Co. Ltd. A-shares | Morgan Stanley | 2/5/24 | At Maturity | 760 | (37 | ) | — | (37 | ) | ||||||||||||||||||||||
Receive | 0.57% | Huaxia Bank Co. Ltd. A-shares | Morgan Stanley | 2/5/24 | At Maturity | 77 | — | — | — | ||||||||||||||||||||||||
Receive | 0.57% | Huayu Automotive Systems Co. Ltd. A-shares | Morgan Stanley | 2/5/24 | At Maturity | 6 | — | — | — | ||||||||||||||||||||||||
Receive | 0.57% | Hubei Forbon Technology Co. Ltd. A-shares | Morgan Stanley | 2/5/24 | At Maturity | 125 | 1 | — | 1 | ||||||||||||||||||||||||
Receive | 0.57% | Hubei Huitian New Materials Co. Ltd. A-shares | Morgan Stanley | 2/5/24 | At Maturity | 3 | — | — | — | ||||||||||||||||||||||||
Receive | 0.57% | Hubei Jumpcan Pharmaceutical Co. Ltd. A-shares | Morgan Stanley | 2/5/24 | At Maturity | 91 | (2 | ) | — | (2 | ) | ||||||||||||||||||||||
Receive | 0.57% | Hubei Shuanghuan Science and Technology Stock Co. Ltd. A-shares | Morgan Stanley | 2/5/24 | At Maturity | 83 | 2 | — | 2 | ||||||||||||||||||||||||
Receive | 0.57% | Hunan Investment Group Co. Ltd. A-shares | Morgan Stanley | 2/5/24 | At Maturity | 165 | 3 | — | 3 | ||||||||||||||||||||||||
Receive | 0.57% | Hundsun Technologies, Inc. A-shares | Morgan Stanley | 2/5/24 | At Maturity | 258 | (36 | ) | — | (36 | ) | ||||||||||||||||||||||
See accompanying notes to financial statements.
164
HC CAPITAL TRUST
The Emerging Markets Portfolio
Portfolio of Investments (continued) — June 30, 2023
Total Return Swap Agreements | |||||||||||||||||||||||||||||||||
Pay/ | Financing | Description | Counterparty | Expiration | Payment | Notional | Value | Upfront | Unrealized | ||||||||||||||||||||||||
Receive | 0.57% | Hwatsing Technology Co. Ltd. A-shares | Morgan Stanley | 2/5/24 | At Maturity | $ | 86 | $ | 6 | $ | — | $ | 6 | ||||||||||||||||||||
Receive | 0.57% | Iflytek Co. Ltd. A-shares | Morgan Stanley | 2/5/24 | At Maturity | 117 | 2 | — | 2 | ||||||||||||||||||||||||
Receive | 0.57% | Imeik Technology Development Co. Ltd. A-shares | Morgan Stanley | 2/5/24 | At Maturity | 275 | (29 | ) | — | (29 | ) | ||||||||||||||||||||||
Receive | 0.57% | Industrial Bank Co. Ltd. A-shares | Morgan Stanley | 2/5/24 | At Maturity | 177 | (14 | ) | — | (14 | ) | ||||||||||||||||||||||
Receive | 0.57% | Industrial Securities Co. Ltd. A-shares | Morgan Stanley | 2/5/24 | At Maturity | 2 | — | — | — | ||||||||||||||||||||||||
Receive | 0.57% | Inner Mongolia Yili Industrial Group Co. Ltd. A-shares | Morgan Stanley | 2/5/24 | At Maturity | 601 | (40 | ) | — | (40 | ) | ||||||||||||||||||||||
Receive | 0.57% | Jiangsu Changbao Steeltube Co. Ltd. A-shares | Morgan Stanley | 2/5/24 | At Maturity | 4 | — | — | — | ||||||||||||||||||||||||
Receive | 0.57% | Jiangsu Chinagreen Biological Technology Co. Ltd. A-shares | Morgan Stanley | 2/5/24 | At Maturity | 119 | 2 | — | 2 | ||||||||||||||||||||||||
Receive | 0.57% | Jiangsu Financial Leasing Co. Ltd. A-shares | Morgan Stanley | 2/5/24 | At Maturity | 21 | (2 | ) | — | (2 | ) | ||||||||||||||||||||||
Receive | 0.57% | Jiangsu Hengrui Pharmaceuticals Co. Ltd. A-shares | Morgan Stanley | 2/5/24 | At Maturity | 380 | (5 | ) | — | (5 | ) | ||||||||||||||||||||||
Receive | 0.57% | Jiangsu Huaxin New Material Co. Ltd. A-shares | Morgan Stanley | 2/5/24 | At Maturity | 457 | 24 | — | 24 | ||||||||||||||||||||||||
Receive | 0.57% | Jiangsu Jingyuan Environmental Protection Co. Ltd. A-shares | Morgan Stanley | 2/5/24 | At Maturity | 476 | 6 | — | 6 | ||||||||||||||||||||||||
Receive | 0.57% | Jiangsu King’s Luck Brewery JSC Ltd. A-shares | Morgan Stanley | 2/5/24 | At Maturity | 499 | (52 | ) | — | (52 | ) | ||||||||||||||||||||||
Receive | 0.57% | Jiangsu Maixinlin Aviation Science and Technology Corp. A-shares | Morgan Stanley | 2/5/24 | At Maturity | 243 | 17 | — | 17 | ||||||||||||||||||||||||
Receive | 0.57% | Jiangsu Pacific Quartz Co. Ltd. A-shares | Morgan Stanley | 2/5/24 | At Maturity | 128 | 7 | — | 7 | ||||||||||||||||||||||||
Receive | 0.57% | Jiangsu Phoenix Publishing & Media Corp. Ltd. A-shares | Morgan Stanley | 2/5/24 | At Maturity | 10 | — | — | — | ||||||||||||||||||||||||
Receive | 0.57% | Jiangsu Xiehe Electronic Co. Ltd. A-shares | Morgan Stanley | 2/5/24 | At Maturity | 17 | — | — | — | ||||||||||||||||||||||||
Receive | 0.57% | Jiangsu Yanghe Brewery Joint-Stock Co. Ltd. A-shares | Morgan Stanley | 2/5/24 | At Maturity | 52 | (4 | ) | — | (4 | ) | ||||||||||||||||||||||
Receive | 0.57% | Jiangsu Yuyue Medical Equipment & Supply Co. Ltd. A-shares | Morgan Stanley | 2/5/24 | At Maturity | 259 | 13 | — | 13 | ||||||||||||||||||||||||
Receive | 0.57% | JiangSu Zhenjiang New Energy Equipment Co. Ltd. A-shares | Morgan Stanley | 2/5/24 | At Maturity | 5 | — | — | — | ||||||||||||||||||||||||
Receive | 0.57% | Jilin Jian Yisheng Pharmaceutical Co. Ltd. A-shares | Morgan Stanley | 2/5/24 | At Maturity | — | — | — | — | ||||||||||||||||||||||||
Receive | 0.57% | Jilin OLED Material Tech Co. Ltd. A-shares | Morgan Stanley | 2/5/24 | At Maturity | 13 | — | — | — | ||||||||||||||||||||||||
Receive | 0.57% | Jinhua Chunguang Technology Co. Ltd. A-shares | Morgan Stanley | 2/5/24 | At Maturity | 64 | 6 | — | 6 | ||||||||||||||||||||||||
See accompanying notes to financial statements.
165
HC CAPITAL TRUST
The Emerging Markets Portfolio
Portfolio of Investments (continued) — June 30, 2023
Total Return Swap Agreements | |||||||||||||||||||||||||||||||||
Pay/ | Financing | Description | Counterparty | Expiration | Payment | Notional | Value | Upfront | Unrealized | ||||||||||||||||||||||||
Receive | 0.57% | Jinpu Landscape Architecture Co. Ltd. A-shares | Morgan Stanley | 2/5/24 | At Maturity | $ | 234 | $ | (1 | ) | $ | — | $ | (1 | ) | ||||||||||||||||||
Receive | 0.57% | Jinsanjiang Zhaoqing Silicon Material Co. Ltd. A-shares | Morgan Stanley | 2/5/24 | At Maturity | 9 | — | — | — | ||||||||||||||||||||||||
Receive | 0.57% | Kehua Data Co. Ltd. A-shares | Morgan Stanley | 2/5/24 | At Maturity | 23 | — | — | — | ||||||||||||||||||||||||
Receive | 0.57% | Kehua Holdings Co. Ltd. A-shares | Morgan Stanley | 2/5/24 | At Maturity | 70 | (1 | ) | — | (1 | ) | ||||||||||||||||||||||
Receive | 0.57% | Keysino Separation Technology, Inc. A-shares | Morgan Stanley | 2/5/24 | At Maturity | 292 | 8 | — | 8 | ||||||||||||||||||||||||
Receive | 0.57% | Kingfore Energy Group Co. Ltd. A-shares | Morgan Stanley | 2/5/24 | At Maturity | 7 | — | — | — | ||||||||||||||||||||||||
Receive | 0.57% | Kingnet Network Co. Ltd. A-shares | Morgan Stanley | 2/5/24 | At Maturity | 47 | (1 | ) | — | (1 | ) | ||||||||||||||||||||||
Receive | 0.57% | Kunlun Tech Co. Ltd. A-shares | Morgan Stanley | 2/5/24 | At Maturity | 59 | (16 | ) | — | (16 | ) | ||||||||||||||||||||||
Receive | 0.57% | Kweichow Moutai Co. Ltd. A-shares | Morgan Stanley | 2/5/24 | At Maturity | 2,225 | (719 | ) | — | (719 | ) | ||||||||||||||||||||||
Receive | 0.57% | Lao Feng Xiang Co. Ltd. A-shares | Morgan Stanley | 2/5/24 | At Maturity | 15 | 1 | — | 1 | ||||||||||||||||||||||||
Receive | 0.57% | Leo Group Co. Ltd. A-shares | Morgan Stanley | 2/5/24 | At Maturity | 82 | (6 | ) | — | (6 | ) | ||||||||||||||||||||||
Receive | 0.57% | Lepu Medical Technology Beijing Co. Ltd. A-shares | Morgan Stanley | 2/5/24 | At Maturity | 30 | — | — | — | ||||||||||||||||||||||||
Receive | 0.57% | Liaoning Kelong Fine Chemical Co. Ltd. A-shares | Morgan Stanley | 2/5/24 | At Maturity | 5 | — | — | — | ||||||||||||||||||||||||
Receive | 0.57% | Lingyi iTech Guangdong Co. A-shares | Morgan Stanley | 2/5/24 | At Maturity | 286 | 14 | — | 14 | ||||||||||||||||||||||||
Receive | 0.57% | Liuzhou Iron & Steel Co. Ltd. A-shares | Morgan Stanley | 2/5/24 | At Maturity | 13 | — | — | — | ||||||||||||||||||||||||
Receive | 0.57% | LONGi Green Energy Technology Co. Ltd. A-shares | Morgan Stanley | 2/5/24 | At Maturity | 482 | (60 | ) | — | (60 | ) | ||||||||||||||||||||||
Receive | 0.57% | Lutian Machinery Co. Ltd. A-shares | Morgan Stanley | 2/5/24 | At Maturity | 46 | 2 | — | 2 | ||||||||||||||||||||||||
Receive | 0.57% | Luxshare Precision Industry Co. Ltd. A-shares | Morgan Stanley | 2/5/24 | At Maturity | 287 | 39 | — | 39 | ||||||||||||||||||||||||
Receive | 0.57% | Luzhou Laojiao Co. Ltd. A-shares | Morgan Stanley | 2/5/24 | At Maturity | 687 | (64 | ) | — | (64 | ) | ||||||||||||||||||||||
Receive | 0.57% | Mango Excellent Media Co. Ltd. A-shares | Morgan Stanley | 2/5/24 | At Maturity | 14 | — | — | — | ||||||||||||||||||||||||
Receive | 0.57% | Maxvision Technology Corp. A-shares | Morgan Stanley | 2/5/24 | At Maturity | 6 | — | — | — | ||||||||||||||||||||||||
Receive | 0.57% | Metallurgical Corp. of China Ltd. A-shares | Morgan Stanley | 2/5/24 | At Maturity | 647 | (26 | ) | — | (26 | ) | ||||||||||||||||||||||
Receive | 0.57% | Midea Group Co. Ltd. A-shares | Morgan Stanley | 2/5/24 | At Maturity | 780 | 29 | — | 29 | ||||||||||||||||||||||||
See accompanying notes to financial statements.
166
HC CAPITAL TRUST
The Emerging Markets Portfolio
Portfolio of Investments (continued) — June 30, 2023
Total Return Swap Agreements | |||||||||||||||||||||||||||||||||
Pay/ | Financing | Description | Counterparty | Expiration | Payment | Notional | Value | Upfront | Unrealized | ||||||||||||||||||||||||
Receive | 0.57% | Mudanjiang Hengfeng Paper Co. Ltd. A-shares | Morgan Stanley | 2/5/24 | At Maturity | $ | 158 | $ | 2 | $ | — | $ | 2 | ||||||||||||||||||||
Receive | 0.57% | Muyuan Foods Co. Ltd. A-shares | Morgan Stanley | 2/5/24 | At Maturity | 30 | — | — | — | ||||||||||||||||||||||||
Receive | 0.57% | Nacity Property Service Co. Ltd. A-shares | Morgan Stanley | 2/5/24 | At Maturity | 136 | (9 | ) | — | (9 | ) | ||||||||||||||||||||||
Receive | 0.57% | Nanhua Instruments Co. Ltd. A-shares | Morgan Stanley | 2/5/24 | At Maturity | 111 | 6 | — | 6 | ||||||||||||||||||||||||
Receive | 0.57% | Nanjing Wondux Environmental Protection Technology Corp. Ltd. A-shares | Morgan Stanley | 2/5/24 | At Maturity | 16 | — | — | — | ||||||||||||||||||||||||
Receive | 0.57% | NAURA Technology Group Co. Ltd. A-shares | Morgan Stanley | 2/5/24 | At Maturity | 207 | 8 | — | 8 | ||||||||||||||||||||||||
Receive | 0.57% | New Trend International Logis-Tech Co. Ltd. A-shares | Morgan Stanley | 2/5/24 | At Maturity | 73 | 5 | — | 5 | ||||||||||||||||||||||||
Receive | 0.57% | Newland Digital Technology Co. Ltd. A-shares | Morgan Stanley | 2/5/24 | At Maturity | 84 | 2 | — | 2 | ||||||||||||||||||||||||
Receive | 0.57% | Ningbo Bohui Chemical Technology Co. Ltd. A-shares | Morgan Stanley | 2/5/24 | At Maturity | 416 | (7 | ) | — | (7 | ) | ||||||||||||||||||||||
Receive | 0.57% | Ningbo Deye Technology Co. Ltd. A-shares | Morgan Stanley | 2/5/24 | At Maturity | 121 | 10 | — | 10 | ||||||||||||||||||||||||
Receive | 0.57% | Ningbo Sanxing Medical Electric Co. Ltd. A-shares | Morgan Stanley | 2/5/24 | At Maturity | 72 | — | — | — | ||||||||||||||||||||||||
Receive | 0.57% | Ningbo Tuopu Group Co. Ltd. A-shares | Morgan Stanley | 2/5/24 | At Maturity | 3 | — | — | — | ||||||||||||||||||||||||
Receive | 0.57% | Offshore Oil Engineering Co. Ltd. A-shares | Morgan Stanley | 2/5/24 | At Maturity | 320 | (10 | ) | — | (10 | ) | ||||||||||||||||||||||
Receive | 0.57% | Perfect World Co. Ltd./China A-shares | Morgan Stanley | 2/5/24 | At Maturity | 2 | — | — | — | ||||||||||||||||||||||||
Receive | 0.57% | PetroChina Co. Ltd. A-shares | Morgan Stanley | 2/5/24 | At Maturity | 266 | (11 | ) | — | (11 | ) | ||||||||||||||||||||||
Receive | 0.57% | Pharmaron Beijing Co. Ltd. A-shares | Morgan Stanley | 2/5/24 | At Maturity | 45 | (3 | ) | — | (3 | ) | ||||||||||||||||||||||
Receive | 0.57% | Piesat Information Technology Co. Ltd. A-shares | Morgan Stanley | 2/5/24 | At Maturity | 2 | — | — | — | ||||||||||||||||||||||||
Receive | 0.57% | Ping An Bank Co. Ltd. A-shares | Morgan Stanley | 2/5/24 | At Maturity | 72 | (4 | ) | — | (4 | ) | ||||||||||||||||||||||
Receive | 0.57% | Ping An Insurance Group Co. of China Ltd. A-shares | Morgan Stanley | 2/5/24 | At Maturity | 897 | (60 | ) | — | (60 | ) | ||||||||||||||||||||||
Receive | 0.57% | Piotech, Inc. A-shares | Morgan Stanley | 2/5/24 | At Maturity | 34 | 1 | — | 1 | ||||||||||||||||||||||||
Receive | 0.57% | Poly Developments and Holdings Group Co. Ltd. A-shares | Morgan Stanley | 2/5/24 | At Maturity | 206 | (9 | ) | — | (9 | ) | ||||||||||||||||||||||
Receive | 0.57% | Postal Savings Bank of China Co. Ltd. A-shares | Morgan Stanley | 2/5/24 | At Maturity | 7 | — | — | — | ||||||||||||||||||||||||
Receive | 0.57% | Power Construction Corp. of China Ltd. A-shares | Morgan Stanley | 2/5/24 | At Maturity | 39 | — | — | — | ||||||||||||||||||||||||
See accompanying notes to financial statements.
167
HC CAPITAL TRUST
The Emerging Markets Portfolio
Portfolio of Investments (continued) — June 30, 2023
Total Return Swap Agreements | |||||||||||||||||||||||||||||||||
Pay/ | Financing | Description | Counterparty | Expiration | Payment | Notional | Value | Upfront | Unrealized | ||||||||||||||||||||||||
Receive | 0.57% | Pylon Technologies Co. Ltd. A-shares | Morgan Stanley | 2/5/24 | At Maturity | $ | 131 | $ | — | $ | — | $ | — | ||||||||||||||||||||
Receive | 0.57% | Qianhe Condiment and Food Co. Ltd. A-shares | Morgan Stanley | 2/5/24 | At Maturity | 65 | (2 | ) | — | (2 | ) | ||||||||||||||||||||||
Receive | 0.57% | Qingdao Citymedia Co. Ltd. A-shares | Morgan Stanley | 2/5/24 | At Maturity | 200 | (8 | ) | — | (8 | ) | ||||||||||||||||||||||
Receive | 0.57% | Qingdao Gaoce Technology Co. Ltd. A-shares | Morgan Stanley | 2/5/24 | At Maturity | 49 | 9 | — | 9 | ||||||||||||||||||||||||
Receive | 0.57% | Qingdao Weflo Valve Co. Ltd. A-shares | Morgan Stanley | 2/5/24 | At Maturity | 45 | 2 | — | 2 | ||||||||||||||||||||||||
Receive | 0.57% | Raytron Technology Co. Ltd. A-shares | Morgan Stanley | 2/5/24 | At Maturity | 507 | (36 | ) | — | (36 | ) | ||||||||||||||||||||||
Receive | 0.57% | Sany Heavy Industry Co. Ltd. A-shares | Morgan Stanley | 2/5/24 | At Maturity | 219 | (1 | ) | — | (1 | ) | ||||||||||||||||||||||
Receive | 0.57% | SDIC Power Holdings Co. Ltd. A-shares | Morgan Stanley | 2/5/24 | At Maturity | 61 | — | — | — | ||||||||||||||||||||||||
Receive | 0.57% | Shaanxi Coal Industry Co. Ltd. A-shares | Morgan Stanley | 2/5/24 | At Maturity | 277 | (4 | ) | — | (4 | ) | ||||||||||||||||||||||
Receive | 0.57% | Shahe Industrial Co. Ltd. A-shares | Morgan Stanley | 2/5/24 | At Maturity | 11 | — | — | — | ||||||||||||||||||||||||
Receive | 0.57% | Shandong Donghong Pipe Industry Co. Ltd. A-shares | Morgan Stanley | 2/5/24 | At Maturity | 3 | — | — | — | ||||||||||||||||||||||||
Receive | 0.57% | Shandong Hongyu Agricultural Machinery Co. Ltd. A-shares | Morgan Stanley | 2/5/24 | At Maturity | 34 | 2 | — | 2 | ||||||||||||||||||||||||
Receive | 0.57% | Shandong Huifa Foodstuff Co. Ltd. A-shares | Morgan Stanley | 2/5/24 | At Maturity | 64 | 1 | — | 1 | ||||||||||||||||||||||||
Receive | 0.57% | Shandong Kehui Power Automation Co. Ltd. A-shares | Morgan Stanley | 2/5/24 | At Maturity | 69 | 2 | — | 2 | ||||||||||||||||||||||||
Receive | 0.57% | Shanghai Carthane Co. Ltd. A-shares | Morgan Stanley | 2/5/24 | At Maturity | 37 | 1 | — | 1 | ||||||||||||||||||||||||
Receive | 0.57% | Shanghai CEO Environmental Protection Technology Co. Ltd. A-shares | Morgan Stanley | 2/5/24 | At Maturity | 2 | — | — | — | ||||||||||||||||||||||||
Receive | 0.57% | Shanghai Chuangli Group Co. Ltd. A-shares | Morgan Stanley | 2/5/24 | At Maturity | 151 | 3 | — | 3 | ||||||||||||||||||||||||
Receive | 0.57% | Shanghai Friendess Electronic Technology Corp. Ltd. A-shares | Morgan Stanley | 2/5/24 | At Maturity | 56 | (4 | ) | — | (4 | ) | ||||||||||||||||||||||
Receive | 0.57% | Shanghai Hanbell Precise Machinery Co. Ltd. A-shares | Morgan Stanley | 2/5/24 | At Maturity | 3 | — | — | — | ||||||||||||||||||||||||
Receive | 0.57% | Shanghai Jiaoda Onlly Co. Ltd. A-shares | Morgan Stanley | 2/5/24 | At Maturity | 12 | (3 | ) | — | (3 | ) | ||||||||||||||||||||||
Receive | 0.57% | Shanghai Pharmaceuticals Holding Co. Ltd. A-shares | Morgan Stanley | 2/5/24 | At Maturity | 273 | 3 | — | 3 | ||||||||||||||||||||||||
Receive | 0.57% | Shanghai Putailai New Energy Technology Co. Ltd. A-shares | Morgan Stanley | 2/5/24 | At Maturity | 11 | 1 | — | 1 | ||||||||||||||||||||||||
Receive | 0.57% | Shanghai Tunnel Engineering Co. Ltd. A-shares | Morgan Stanley | 2/5/24 | At Maturity | 12 | — | — | — | ||||||||||||||||||||||||
See accompanying notes to financial statements.
168
HC CAPITAL TRUST
The Emerging Markets Portfolio
Portfolio of Investments (continued) — June 30, 2023
Total Return Swap Agreements | |||||||||||||||||||||||||||||||||
Pay/ | Financing | Description | Counterparty | Expiration | Payment | Notional | Value | Upfront | Unrealized | ||||||||||||||||||||||||
Receive | 0.57% | Shanghai Xintonglian Packaging Co. Ltd. A-shares | Morgan Stanley | 2/5/24 | At Maturity | $ | 21 | $ | — | $ | — | $ | — | ||||||||||||||||||||
Receive | 0.57% | Shanxi Lu’an Environmental Energy Development Co. Ltd. A-shares | Morgan Stanley | 2/5/24 | At Maturity | 245 | (5 | ) | — | (5 | ) | ||||||||||||||||||||||
Receive | 0.57% | Shanxi Xinghuacun Fen Wine Factory Co. Ltd. A-shares | Morgan Stanley | 2/5/24 | At Maturity | 299 | (26 | ) | — | (26 | ) | ||||||||||||||||||||||
Receive | 0.57% | Shareate Tools Ltd. A-shares | Morgan Stanley | 2/5/24 | At Maturity | 3 | — | — | — | ||||||||||||||||||||||||
Receive | 0.57% | Shede Spirits Co. Ltd. A-shares | Morgan Stanley | 2/5/24 | At Maturity | 2 | — | — | — | ||||||||||||||||||||||||
Receive | 0.57% | Shenergy Co. Ltd. A-shares | Morgan Stanley | 2/5/24 | At Maturity | 28 | 1 | — | 1 | ||||||||||||||||||||||||
Receive | 0.57% | Shenzhen Absen Optoelectronic Co. Ltd. A-shares | Morgan Stanley | 2/5/24 | At Maturity | 1 | — | — | — | ||||||||||||||||||||||||
Receive | 0.57% | Shenzhen Huijie Group Co. Ltd. A-shares | Morgan Stanley | 2/5/24 | At Maturity | 5 | — | — | — | ||||||||||||||||||||||||
Receive | 0.57% | Shenzhen Inovance Technology Co. Ltd. A-shares | Morgan Stanley | 2/5/24 | At Maturity | 140 | 5 | — | 5 | ||||||||||||||||||||||||
Receive | 0.57% | Shenzhen Kstar Science And Technology Co. Ltd. A-shares | Morgan Stanley | 2/5/24 | At Maturity | 39 | (1 | ) | — | (1 | ) | ||||||||||||||||||||||
Receive | 0.57% | Shenzhen Laibao Hi-tech Co. Ltd. A-shares | Morgan Stanley | 2/5/24 | At Maturity | 4 | — | — | — | ||||||||||||||||||||||||
Receive | 0.57% | Shenzhen Mindray Bio-Medical Electronics Co. Ltd. A-shares | Morgan Stanley | 2/5/24 | At Maturity | 928 | (70 | ) | — | (70 | ) | ||||||||||||||||||||||
Receive | 0.57% | Shenzhen Sinovatio Technology Co. Ltd. A-shares | Morgan Stanley | 2/5/24 | At Maturity | 7 | — | — | — | ||||||||||||||||||||||||
Receive | 0.57% | Shenzhen Sosen Electronics Co. Ltd. A-shares | Morgan Stanley | 2/5/24 | At Maturity | 2 | — | — | — | ||||||||||||||||||||||||
Receive | 0.57% | Shenzhen Sunway Communication Co. Ltd. A-shares | Morgan Stanley | 2/5/24 | At Maturity | 64 | (1 | ) | — | (1 | ) | ||||||||||||||||||||||
Receive | 0.57% | Shenzhen Topband Co. Ltd. A-shares | Morgan Stanley | 2/5/24 | At Maturity | 33 | 4 | — | 4 | ||||||||||||||||||||||||
Receive | 0.57% | Shenzhen Transsion Holdings Co. Ltd. A-shares | Morgan Stanley | 2/5/24 | At Maturity | 62 | 5 | — | 5 | ||||||||||||||||||||||||
Receive | 0.57% | Shenzhen Xunjiexing Technology Corp. Ltd. A-shares | Morgan Stanley | 2/5/24 | At Maturity | 1 | — | — | — | ||||||||||||||||||||||||
Receive | 0.57% | Shijiazhuang Kelin Electric Co. Ltd. A-shares | Morgan Stanley | 2/5/24 | At Maturity | 6 | 1 | — | 1 | ||||||||||||||||||||||||
Receive | 0.57% | Sichuan Dowell Science and Technology, Inc. A-shares | Morgan Stanley | 2/5/24 | At Maturity | 233 | 6 | — | 6 | ||||||||||||||||||||||||
Receive | 0.57% | Sichuan Fulin Transportation Group Co. Ltd. A-shares | Morgan Stanley | 2/5/24 | At Maturity | 19 | 1 | — | 1 | ||||||||||||||||||||||||
Receive | 0.57% | Sichuan Kelun Pharmaceutical Co. Ltd. A-shares | Morgan Stanley | 2/5/24 | At Maturity | 387 | (27 | ) | — | (27 | ) | ||||||||||||||||||||||
Receive | 0.57% | Sichuan Road and Bridge Group Co. Ltd. A-shares | Morgan Stanley | 2/5/24 | At Maturity | 48 | (3 | ) | — | (3 | ) | ||||||||||||||||||||||
See accompanying notes to financial statements.
169
HC CAPITAL TRUST
The Emerging Markets Portfolio
Portfolio of Investments (continued) — June 30, 2023
Total Return Swap Agreements | |||||||||||||||||||||||||||||||||
Pay/ | Financing | Description | Counterparty | Expiration | Payment | Notional | Value | Upfront | Unrealized | ||||||||||||||||||||||||
Receive | 0.57% | Sinolink Securities Co. Ltd. A-shares | Morgan Stanley | 2/5/24 | At Maturity | $ | 4 | $ | — | $ | — | $ | — | ||||||||||||||||||||
Receive | 0.57% | Sinoma International Engineering Co. A-shares | Morgan Stanley | 2/5/24 | At Maturity | 20 | 1 | — | 1 | ||||||||||||||||||||||||
Receive | 0.57% | Sinomine Resource Group Co. Ltd. A-shares | Morgan Stanley | 2/5/24 | At Maturity | 128 | (12 | ) | — | (12 | ) | ||||||||||||||||||||||
Receive | 0.57% | Sinosun Technology Co. Ltd. A-shares | Morgan Stanley | 2/5/24 | At Maturity | 3 | — | — | — | ||||||||||||||||||||||||
Receive | 0.57% | StarPower Semiconductor Ltd. A-shares | Morgan Stanley | 2/5/24 | At Maturity | 11 | — | — | — | ||||||||||||||||||||||||
Receive | 0.57% | State Grid Yingda Co. Ltd. A-shares | Morgan Stanley | 2/5/24 | At Maturity | 17 | — | — | — | ||||||||||||||||||||||||
Receive | 0.57% | Sunflower Pharmaceutical Group Co. Ltd. A-shares | Morgan Stanley | 2/5/24 | At Maturity | 179 | (20 | ) | — | (20 | ) | ||||||||||||||||||||||
Receive | 0.57% | Sungrow Power Supply Co. Ltd. A-shares | Morgan Stanley | 2/5/24 | At Maturity | 307 | 16 | — | 16 | ||||||||||||||||||||||||
Receive | 0.57% | Sunny Loan Top Co. Ltd. A-shares | Morgan Stanley | 2/5/24 | At Maturity | 81 | 2 | — | 2 | ||||||||||||||||||||||||
Receive | 0.57% | Suzhou Dongshan Precision Manufacturing Co. Ltd. A-shares | Morgan Stanley | 2/5/24 | At Maturity | 159 | (1 | ) | — | (1 | ) | ||||||||||||||||||||||
Receive | 0.57% | Suzhou Secote Precision Electronic Co. Ltd. A-shares | Morgan Stanley | 2/5/24 | At Maturity | 61 | 4 | — | 4 | ||||||||||||||||||||||||
Receive | 0.57% | Tande Co. Ltd. A-shares | Morgan Stanley | 2/5/24 | At Maturity | 1 | — | — | — | ||||||||||||||||||||||||
Receive | 0.57% | Tasly Pharmaceutical Group Co. Ltd. A-shares | Morgan Stanley | 2/5/24 | At Maturity | 2 | — | — | — | ||||||||||||||||||||||||
Receive | 0.57% | TBEA Co. Ltd. A-shares | Morgan Stanley | 2/5/24 | At Maturity | 501 | (19 | ) | — | (19 | ) | ||||||||||||||||||||||
Receive | 0.57% | TCL Technology Group Corp. A-shares | Morgan Stanley | 2/5/24 | At Maturity | 123 | 1 | — | 1 | ||||||||||||||||||||||||
Receive | 0.57% | TCL Zhonghuan Renewable Energy Technology Co. Ltd. A-shares | Morgan Stanley | 2/5/24 | At Maturity | 241 | 17 | — | 17 | ||||||||||||||||||||||||
Receive | 0.57% | TES Touch Embedded Solutions Xiamen Co. Ltd. A-shares | Morgan Stanley | 2/5/24 | At Maturity | 42 | 1 | — | 1 | ||||||||||||||||||||||||
Receive | 0.57% | Thinkingdom Media Group Ltd. A-shares | Morgan Stanley | 2/5/24 | At Maturity | 40 | — | — | — | ||||||||||||||||||||||||
Receive | 0.57% | Tian Di Science & Technology Co. Ltd. A-shares | Morgan Stanley | 2/5/24 | At Maturity | 436 | 15 | — | 15 | ||||||||||||||||||||||||
Receive | 0.57% | Tianneng Battery Group Co. Ltd. A-shares | Morgan Stanley | 2/5/24 | At Maturity | 70 | 3 | — | 3 | ||||||||||||||||||||||||
Receive | 0.57% | Tianqi Lithium Corp. A-shares | Morgan Stanley | 2/5/24 | At Maturity | 208 | (12 | ) | — | (12 | ) | ||||||||||||||||||||||
Receive | 0.57% | TJK Machinery Tianjin Co. Ltd. A-shares | Morgan Stanley | 2/5/24 | At Maturity | 7 | — | — | — | ||||||||||||||||||||||||
Receive | 0.57% | Tongwei Co. Ltd. A-shares | Morgan Stanley | 2/5/24 | At Maturity | 1,057 | (82 | ) | — | (82 | ) | ||||||||||||||||||||||
See accompanying notes to financial statements.
170
HC CAPITAL TRUST
The Emerging Markets Portfolio
Portfolio of Investments (continued) — June 30, 2023
Total Return Swap Agreements | |||||||||||||||||||||||||||||||||
Pay/ | Financing | Description | Counterparty | Expiration | Payment | Notional | Value | Upfront | Unrealized | ||||||||||||||||||||||||
Receive | 0.57% | Touchstone International Medical Science Co. Ltd. A-shares | Morgan Stanley | 2/5/24 | At Maturity | $ | 305 | $ | (5 | ) | $ | — | $ | (5 | ) | ||||||||||||||||||
Receive | 0.57% | Trina Solar Co. Ltd. A-shares | Morgan Stanley | 2/5/24 | At Maturity | 205 | (11 | ) | — | (11 | ) | ||||||||||||||||||||||
Receive | 0.57% | UE Furniture Co. Ltd. A-shares | Morgan Stanley | 2/5/24 | At Maturity | 382 | (10 | ) | — | (10 | ) | ||||||||||||||||||||||
Receive | 0.57% | Unigroup Guoxin Microelectronics Co. Ltd. A-shares | Morgan Stanley | 2/5/24 | At Maturity | 285 | (6 | ) | — | (6 | ) | ||||||||||||||||||||||
Receive | 0.57% | Unisplendour Corp. Ltd. A-shares | Morgan Stanley | 2/5/24 | At Maturity | 54 | (3 | ) | — | (3 | ) | ||||||||||||||||||||||
Receive | 0.57% | Universal Scientific Industrial Shanghai Co. Ltd. A-shares | Morgan Stanley | 2/5/24 | At Maturity | 28 | 1 | — | 1 | ||||||||||||||||||||||||
Receive | 0.57% | Vohringer Home Technology Co. Ltd. A-shares | Morgan Stanley | 2/5/24 | At Maturity | 11 | — | — | — | ||||||||||||||||||||||||
Receive | 0.57% | Wanhua Chemical Group Co. Ltd. A-shares | Morgan Stanley | 2/5/24 | At Maturity | 146 | 3 | — | 3 | ||||||||||||||||||||||||
Receive | 0.57% | Weichai Power Co. Ltd. A-shares | Morgan Stanley | 2/5/24 | At Maturity | 173 | 5 | — | 5 | ||||||||||||||||||||||||
Receive | 0.57% | Weihai Baihe Biology Technological Co. Ltd. A-shares | Morgan Stanley | 2/5/24 | At Maturity | 20 | — | — | — | ||||||||||||||||||||||||
Receive | 0.57% | Weiye Construction Group Co. Ltd. A-shares | Morgan Stanley | 2/5/24 | At Maturity | 321 | 2 | — | 2 | ||||||||||||||||||||||||
Receive | 0.57% | Well Lead Medical Co. Ltd. A-shares | Morgan Stanley | 2/5/24 | At Maturity | 7 | (1 | ) | — | (1 | ) | ||||||||||||||||||||||
Receive | 0.57% | Wens Foodstuffs Group Co. Ltd. A-shares | Morgan Stanley | 2/5/24 | At Maturity | 1 | — | — | — | ||||||||||||||||||||||||
Receive | 0.57% | Wuliangye Yibin Co. Ltd. A-shares | Morgan Stanley | 2/5/24 | At Maturity | 1,280 | (140 | ) | — | (140 | ) | ||||||||||||||||||||||
Receive | 0.57% | WuXi AppTec Co. Ltd. A-shares | Morgan Stanley | 2/5/24 | At Maturity | 275 | (21 | ) | — | (21 | ) | ||||||||||||||||||||||
Receive | 0.57% | Wuxi Honghui New Materials Technology Co. Ltd. A-shares | Morgan Stanley | 2/5/24 | At Maturity | 400 | 9 | — | 9 | ||||||||||||||||||||||||
Receive | 0.57% | Wuxi Hongsheng Heat Exchanger Manufacturing Co. Ltd. A-shares | Morgan Stanley | 2/5/24 | At Maturity | 3 | — | — | — | ||||||||||||||||||||||||
Receive | 0.57% | Wuxi Hyatech Co. Ltd. A-shares | Morgan Stanley | 2/5/24 | At Maturity | 1 | — | — | — | ||||||||||||||||||||||||
Receive | 0.57% | XCMG Construction Machinery Co. Ltd. A-shares | Morgan Stanley | 2/5/24 | At Maturity | 89 | 1 | — | 1 | ||||||||||||||||||||||||
Receive | 0.57% | Xiamen Faratronic Co. Ltd. A-shares | Morgan Stanley | 2/5/24 | At Maturity | 4 | — | — | — | ||||||||||||||||||||||||
Receive | 0.57% | Xiamen Xiangyu Co. Ltd. A-shares | Morgan Stanley | 2/5/24 | At Maturity | 47 | 1 | — | 1 | ||||||||||||||||||||||||
Receive | 0.57% | Xuji Electric Co. Ltd. A-shares | Morgan Stanley | 2/5/24 | At Maturity | 67 | 4 | — | 4 | ||||||||||||||||||||||||
Receive | 0.57% | Yealink Network Technology Corp. Ltd. A-shares | Morgan Stanley | 2/5/24 | At Maturity | 87 | — | — | — | ||||||||||||||||||||||||
See accompanying notes to financial statements.
171
HC CAPITAL TRUST
The Emerging Markets Portfolio
Portfolio of Investments (continued) — June 30, 2023
Total Return Swap Agreements | |||||||||||||||||||||||||||||||||
Pay/ | Financing | Description | Counterparty | Expiration | Payment | Notional | Value | Upfront | Unrealized | ||||||||||||||||||||||||
Receive | 0.57% | Yifeng Pharmacy Chain Co. Ltd. A-shares | Morgan Stanley | 2/5/24 | At Maturity | $ | 1 | $ | — | $ | — | $ | — | ||||||||||||||||||||
Receive | 0.57% | YingTong Telecommunication Co. Ltd. A-shares | Morgan Stanley | 2/5/24 | At Maturity | 23 | 1 | — | 1 | ||||||||||||||||||||||||
Receive | 0.57% | YongXing Special Materials Technology Co. Ltd. A-shares | Morgan Stanley | 2/5/24 | At Maturity | 5 | — | — | — | ||||||||||||||||||||||||
Receive | 0.57% | Youcare Pharmaceutical Group Co. Ltd. A-shares | Morgan Stanley | 2/5/24 | At Maturity | 4 | — | — | — | ||||||||||||||||||||||||
Receive | 0.57% | Yunnan Baiyao Group Co. Ltd. A-shares | Morgan Stanley | 2/5/24 | At Maturity | — | — | — | — | ||||||||||||||||||||||||
Receive | 0.57% | Yunnan Bowin Technology Industry Co. Ltd. A-shares | Morgan Stanley | 2/5/24 | At Maturity | 71 | — | — | — | ||||||||||||||||||||||||
Receive | 0.57% | Zhejiang Benli Technology Co. Ltd. A-shares | Morgan Stanley | 2/5/24 | At Maturity | 15 | — | — | — | ||||||||||||||||||||||||
Receive | 0.57% | Zhejiang Chint Electrics Co. Ltd. A-shares | Morgan Stanley | 2/5/24 | At Maturity | 56 | 1 | — | 1 | ||||||||||||||||||||||||
Receive | 0.57% | Zhejiang Crystal-Optech Co. Ltd. A-shares | Morgan Stanley | 2/5/24 | At Maturity | 57 | (1 | ) | — | (1 | ) | ||||||||||||||||||||||
Receive | 0.57% | Zhejiang Dahua Technology Co. Ltd. A-shares | Morgan Stanley | 2/5/24 | At Maturity | 80 | (3 | ) | — | (3 | ) | ||||||||||||||||||||||
Receive | 0.57% | Zhejiang Dibay Electric Co. Ltd. A-shares | Morgan Stanley | 2/5/24 | At Maturity | 55 | 4 | — | 4 | ||||||||||||||||||||||||
Receive | 0.57% | Zhejiang Double Arrow Rubber Co. Ltd. A-shares | Morgan Stanley | 2/5/24 | At Maturity | 207 | 4 | — | 4 | ||||||||||||||||||||||||
Receive | 0.57% | Zhejiang Giuseppe Garment Co. Ltd. A-shares | Morgan Stanley | 2/5/24 | At Maturity | 11 | — | — | — | ||||||||||||||||||||||||
Receive | 0.57% | Zhejiang Golden Eagle Co. Ltd. A-shares | Morgan Stanley | 2/5/24 | At Maturity | 207 | — | — | — | ||||||||||||||||||||||||
Receive | 0.57% | Zhejiang Huayou Cobalt Co. Ltd. A-shares | Morgan Stanley | 2/5/24 | At Maturity | 14 | (1 | ) | — | (1 | ) | ||||||||||||||||||||||
Receive | 0.57% | Zhejiang Huilong New Material Co. Ltd. A-shares | Morgan Stanley | 2/5/24 | At Maturity | 90 | 3 | — | 3 | ||||||||||||||||||||||||
Receive | 0.57% | Zhejiang Jianye Chemical Co. Ltd. A-shares | Morgan Stanley | 2/5/24 | At Maturity | 10 | — | — | — | ||||||||||||||||||||||||
Receive | 0.57% | Zhejiang Jingsheng Mechanical & Electrical Co. Ltd. A-shares | Morgan Stanley | 2/5/24 | At Maturity | 431 | 4 | — | 4 | ||||||||||||||||||||||||
Receive | 0.57% | Zhejiang Jingxin Pharmaceutical Co. Ltd. A-shares | Morgan Stanley | 2/5/24 | At Maturity | 1 | — | — | — | ||||||||||||||||||||||||
Receive | 0.57% | Zhejiang Jiuzhou Pharmaceutical Co. Ltd. A-shares | Morgan Stanley | 2/5/24 | At Maturity | 13 | (1 | ) | — | (1 | ) | ||||||||||||||||||||||
Receive | 0.57% | Zhejiang Meilun Elevator Co. Ltd. A-shares | Morgan Stanley | 2/5/24 | At Maturity | 102 | 6 | — | 6 | ||||||||||||||||||||||||
Receive | 0.57% | Zhejiang Risun Intelligent Technology Co. Ltd. A-shares | Morgan Stanley | 2/5/24 | At Maturity | 13 | — | — | — | ||||||||||||||||||||||||
Receive | 0.57% | Zhejiang Sanhua Intelligent Controls Co. Ltd. A-shares | Morgan Stanley | 2/5/24 | At Maturity | 10 | — | — | — | ||||||||||||||||||||||||
See accompanying notes to financial statements.
172
HC CAPITAL TRUST
The Emerging Markets Portfolio
Portfolio of Investments (concluded) — June 30, 2023
Total Return Swap Agreements | |||||||||||||||||||||||||||||||||
Pay/ | Financing | Description | Counterparty | Expiration | Payment | Notional | Value | Upfront | Unrealized | ||||||||||||||||||||||||
Receive | 0.57% | Zhejiang Tengen Electrics Co. Ltd. A-shares | Morgan Stanley | 2/5/24 | At Maturity | $ | 148 | $ | 2 | $ | — | $ | 2 | ||||||||||||||||||||
Receive | 0.57% | Zhejiang Yankon Group Co. Ltd. A-shares | Morgan Stanley | 2/5/24 | At Maturity | 36 | 1 | — | 1 | ||||||||||||||||||||||||
Receive | 0.57% | Zhejiang Zhenyuan Co. Ltd. A-shares | Morgan Stanley | 2/5/24 | At Maturity | 192 | (7 | ) | — | (7 | ) | ||||||||||||||||||||||
Receive | 0.57% | Zhengzhou Coal Mining Machinery Group Co. Ltd. A-shares | Morgan Stanley | 2/5/24 | At Maturity | 361 | (27 | ) | — | (27 | ) | ||||||||||||||||||||||
Receive | 0.57% | Zhenhai Petrochemical Engineering Co. Ltd. A-shares | Morgan Stanley | 2/5/24 | At Maturity | 31 | (1 | ) | — | (1 | ) | ||||||||||||||||||||||
Receive | 0.57% | Zheshang Development Group Co. Ltd. A-shares | Morgan Stanley | 2/5/24 | At Maturity | 160 | (15 | ) | — | (15 | ) | ||||||||||||||||||||||
Receive | 0.57% | Zhongji Innolight Co. Ltd. A-shares | Morgan Stanley | 2/5/24 | At Maturity | 177 | (2 | ) | — | (2 | ) | ||||||||||||||||||||||
Receive | 0.57% | Zhuhai Winbase International Chemical Tank Terminal Co. Ltd. A-shares | Morgan Stanley | 2/5/24 | At Maturity | 226 | (14 | ) | — | (14 | ) | ||||||||||||||||||||||
Receive | 0.57% | Zhuzhou Feilu High-Tech Materials Co. Ltd. A-shares | Morgan Stanley | 2/5/24 | At Maturity | 1 | — | — | — | ||||||||||||||||||||||||
Receive | 0.57% | Zijin Mining Group Co. Ltd. A-shares | Morgan Stanley | 2/5/24 | At Maturity | 510 | (43 | ) | — | (43 | ) | ||||||||||||||||||||||
Receive | 0.57% | Zoy Home Furnishing Co. Ltd. A-shares | Morgan Stanley | 2/5/24 | At Maturity | 14 | — | — | — | ||||||||||||||||||||||||
Receive | 0.57% | ZTE Corp. A-shares | Morgan Stanley | 2/5/24 | At Maturity | 556 | 184 | — | 184 | ||||||||||||||||||||||||
Receive | 0.57% | ZYNP Corp. A-shares | Morgan Stanley | 2/5/24 | At Maturity | 3 | — | — | — | ||||||||||||||||||||||||
| $ | (2,176 | ) | $ | — | $ | (2,176 | ) | ||||||||||||||||||||||||||
Total swap agreements at value (assets) | $ | 747 | |||||||||||||||||||||||||||||||
Total swap agreements at value (liabilities) | (2,923 | ) | |||||||||||||||||||||||||||||||
Net swap agreements at value | $ | (2,176 | ) | ||||||||||||||||||||||||||||||
Amounts Designated as “—” are $0 or have been rounded to $0
(a) | Receive represents that the Portfolio receives payments for any positive return on the underlying reference. The Portfolio makes payments for any negative return on such underlying reference. Pay represents that the Portfolio receives payments for any negative return on the underlying reference. The Portfolio makes payments for any positive return on such underlying reference. |
See accompanying notes to financial statements.
173
HC CAPITAL TRUST
The Core Fixed Income Portfolio
Portfolio of Investments — June 30, 2023
Principal | Security Description | Rate % | Maturity | Value | ||||||||||||
Asset Backed Securities — 0.18% | ||||||||||||||||
| $ | 10 | Americredit Automobile Receivables Trust, Series 2022-1, Class - A3, Callable 4/18/26 @ 100.00 | 2.45 | 11/18/26 | $ | 10 | ||||||||||
| 15 | Capital One Multi-Asset Execution Trust, Series 2021-A2, Class - A2 | 1.39 | 7/15/30 | 13 | ||||||||||||
| 10 | Ford Credit Auto Lease Trust, Series 2023-A, Class - A3, Callable 8/15/25 @ 100.00 | 4.94 | 3/15/26 | 10 | ||||||||||||
| 6 | GM Financial Automobile Leasing Trust, Series 2021-3, Class - A3, Callable 2/20/24 @ 100.00 | 0.39 | 10/21/24 | 6 | ||||||||||||
| 10 | GM Financial Consumer Automobile Receivables Trust, Series 2023-1, Class - A3, Callable 8/16/26 @ 100.00 | 4.66 | 2/16/28 | 10 | ||||||||||||
| 20 | Hyundai Auto Receivables Trust, Series 2022-A, Class - A3, Callable 6/15/26 @ 100.00 | 2.22 | 10/15/26 | 19 | ||||||||||||
| 10 | Hyundai Auto Receivables Trust, Series 2022-C, Class - A4, Callable 12/15/26 @ 100.00 | 5.52 | 10/16/28 | 10 | ||||||||||||
| 40 | Synchrony Card Funding LLC, Series 2022-A1, Class - A, Callable 4/15/25 @ 100.00 | 3.37 | 4/15/28 | 38 | ||||||||||||
| 10 | World Omni Auto Receivables Trust, Series 2021-C, Class - A4, Callable 5/15/25 @ 100.00 | 0.64 | 9/15/27 | 9 | ||||||||||||
| 5 | World Omni Auto Receivables Trust, Series 2023-B, Class - A3, Callable 5/15/26 @ 100.00 | 4.66 | 5/15/28 | 5 | ||||||||||||
Total Asset Backed Securities | 130 | |||||||||||||||
Collateralized Mortgage Obligations — 0.84% | ||||||||||||||||
| 20 | Bank, Series 2019-BN21, Class - A5, Callable 10/15/29 @ 100.00 | 2.85 | 10/17/52 | 17 | ||||||||||||
| 23 | Bank, Series 2017-BNK9, Class - ASB, Callable 12/15/29 @ 100.00 | 3.47 | 11/15/54 | 21 | ||||||||||||
| 25 | Bank, Series 2022-BNK41, Class - A4 | 3.92(a) | 4/15/65 | 22 | ||||||||||||
| 20 | BBCMS Mortgage Trust, Series 2020-C7, Class - AS, Callable 4/15/30 @ 100.00 | 2.44 | 4/15/53 | 16 | ||||||||||||
| 10 | Benchmark Mortgage Trust, Series 2020-IG1, Class - AS, Callable 1/15/30 @ 100.00 | 2.91(a) | 9/15/43 | 7 | ||||||||||||
| 10 | Benchmark Mortgage Trust, Series 2019-B9, Class - A5, Callable 2/15/29 @ 100.00 | 4.02 | 3/15/52 | 9 | ||||||||||||
| 17 | Citigroup Commercial Mortgage Trust, Series 2015-GC27, Class - A4, Callable 1/10/25 @ 100.00 | 2.88 | 2/10/48 | 17 | ||||||||||||
| 15 | Citigroup Commercial Mortgage Trust, Series 2020-GC46, Class - AS, Callable 2/15/30 @ 100.00 | 2.92 | 2/15/53 | 12 | ||||||||||||
| 10 | Citigroup Commercial Mortgage Trust, Series 2019-C7, Class - A4, Callable 12/15/29 @ 100.00 | 3.10 | 12/15/72 | 9 | ||||||||||||
| 25 | COMM Mortgage Trust, Series 2015-LC19, Class - A4, Callable 1/10/27 @ 100.00 | 3.18 | 2/10/48 | 24 | ||||||||||||
| 20 | COMM Mortgage Trust, Series 2015-DC1, Class - A5, Callable 2/10/25 @ 100.00 | 3.35 | 2/10/48 | 19 | ||||||||||||
| 10 | Fannie Mae-ACES, Series 2020-M52, Class - A2 | 1.36(a) | 10/25/30 | 8 | ||||||||||||
| 20 | Fannie Mae-ACES, Series 2020-M14, Class - A2 | 1.78 | 5/25/30 | 17 | ||||||||||||
| 8 | Fannie Mae-ACES, Series 2015-M8, Class - A2 | 2.90(a) | 1/25/25 | 8 | ||||||||||||
| 18 | Fannie Mae-ACES, Series 2018-M1, Class - A2 | 3.09(a) | 12/25/27 | 17 | ||||||||||||
| 16 | Fannie Mae-ACES, Series 2017-M12, Class - A2 | 3.16(a) | 6/25/27 | 16 | ||||||||||||
| 20 | Fannie Mae-ACES, Series 2019-M5, Class - A2 | 3.27 | 2/25/29 | 18 | ||||||||||||
| 25 | Fannie Mae-ACES, Series 2018-M10, Class - A2 | 3.47(a) | 7/25/28 | 24 | ||||||||||||
| 20 | Freddie Mac Multifamily Structured Pass Through Certificates, Series K112, Class - A2 | 1.31 | 5/25/30 | 16 | ||||||||||||
| 20 | Freddie Mac Multifamily Structured Pass Through Certificates, Series K1516, Class - A2 | 1.72 | 5/25/35 | 14 | ||||||||||||
| 25 | Freddie Mac Multifamily Structured Pass Through Certificates, Series K126, Class - A2 | 2.07 | 1/25/31 | 21 | ||||||||||||
| 15 | Freddie Mac Multifamily Structured Pass Through Certificates, Series K749, Class - A2 | 2.12(a) | 3/25/29 | 13 | ||||||||||||
| 10 | Freddie Mac Multifamily Structured Pass Through Certificates, Series K1521, Class - A2 | 2.18 | 8/25/36 | 7 | ||||||||||||
| 25 | Freddie Mac Multifamily Structured Pass Through Certificates, Series K052, Class - A2 | 3.15 | 11/25/25 | 24 | ||||||||||||
| 50 | Freddie Mac Multifamily Structured Pass Through Certificates, Series K091, Class - A2 | 3.51 | 3/25/29 | 47 | ||||||||||||
| 20 | Freddie Mac Multifamily Structured Pass Through Certificates, Series K-152, Class - A2 | 3.78 | 11/25/32 | 19 | ||||||||||||
| 25 | GS Mortgage Securities Trust, Series 2018-GS9, Class - A4, Callable 3/10/28 @ 100.00 | 3.99(a) | 3/10/51 | 23 | ||||||||||||
| 25 | JPMDB Commercial Mortgage Securities Trust, Series 2016-C4, Class - A3, Callable 4/15/27 @ 100.00 | 3.14 | 12/15/49 | 22 | ||||||||||||
| 25 | Morgan Stanley Bank of America Merrill Lynch Trust, Series 2014-C19, Class - A4, Callable 10/15/26 @ 100.00 | 3.53 | 12/15/47 | 24 | ||||||||||||
| 25 | Morgan Stanley Bank of America Merrill Lynch Trust, Series 2017-C33, Class - A5, Callable 5/15/27 @ 100.00 | 3.60 | 5/15/50 | 23 | ||||||||||||
See accompanying notes to financial statements.
174
HC CAPITAL TRUST
The Core Fixed Income Portfolio
Portfolio of Investments (continued) — June 30, 2023
Principal | Security Description | Rate % | Maturity | Value | ||||||||||||
Collateralized Mortgage Obligations (continued) | ||||||||||||||||
| $ | 25 | SG Commercial Mortgage Securities Trust, Series 2016-C5, Class - A4, Callable 7/10/26 @ 100.00 | 3.06 | 10/10/48 | $ | 23 | ||||||||||
| 20 | Wells Fargo Commercial Mortgage Trust, Series 2022- C62, Class - A4, Callable 4/15/32 @ 100.00 | 4.00(a) | 4/15/55 | 18 | ||||||||||||
| 25 | Wells Fargo Commercial Mortgage Trust, Series 2018-C47, Class - A4, Callable 10/15/28 @ 100.00 | 4.44 | 9/15/61 | 24 | ||||||||||||
Total Collateralized Mortgage Obligations | 599 | |||||||||||||||
U.S. Government Agency Mortgages — 12.76% | ||||||||||||||||
| 17 | Fannie Mae, Pool #MA4205 | 1.50 | 12/1/35 | 15 | ||||||||||||
| 16 | Fannie Mae, Pool #BQ5781 | 1.50 | 11/1/35 | 14 | ||||||||||||
| 21 | Fannie Mae, Pool #MA4280 | 1.50 | 3/1/51 | 16 | ||||||||||||
| 42 | Fannie Mae, Pool #FM6579 | 1.50 | 3/1/51 | 33 | ||||||||||||
| 22 | Fannie Mae, Pool #FS1327 | 1.50 | 6/1/36 | 19 | ||||||||||||
| 44 | Fannie Mae, Pool #MA4343 | 1.50 | 5/1/51 | 34 | ||||||||||||
| 22 | Fannie Mae, Pool #MA4445 | 1.50 | 10/1/41 | 18 | ||||||||||||
| 20 | Fannie Mae, Pool #CA7695 | 1.50 | 11/1/50 | 16 | ||||||||||||
| 42 | Fannie Mae, Pool #MA4441 | 1.50 | 10/1/36 | 36 | ||||||||||||
| 21 | Fannie Mae, Pool #MA4122 | 1.50 | 9/1/35 | 18 | ||||||||||||
| 21 | Fannie Mae, Pool #MA4236 | 1.50 | 1/1/51 | 16 | ||||||||||||
| 20 | Fannie Mae, Pool #CA7696 | 1.50 | 11/1/50 | 16 | ||||||||||||
| 21 | Fannie Mae, Pool #MA4342 | 1.50 | 5/1/41 | 17 | ||||||||||||
| 21 | Fannie Mae, Pool #BR4094 | 2.00 | 1/1/51 | 17 | ||||||||||||
| 22 | Fannie Mae, Pool #CB0497 | 2.00 | 5/1/51 | 18 | ||||||||||||
| 21 | Fannie Mae, Pool #CB0684 | 2.00 | 6/1/51 | 18 | ||||||||||||
| 19 | Fannie Mae, Pool #MA4208 | 2.00 | 12/1/50 | 16 | ||||||||||||
| 23 | Fannie Mae, Pool #BU7103 | 2.00 | 12/1/51 | 18 | ||||||||||||
| 19 | Fannie Mae, Pool #MA4360 | 2.00 | 6/1/36 | 17 | ||||||||||||
| 40 | Fannie Mae, Pool #BQ3004 | 2.00 | 10/1/50 | 33 | ||||||||||||
| 39 | Fannie Mae, Pool #BQ8341 | 2.00 | 12/1/50 | 32 | ||||||||||||
| 40 | Fannie Mae, Pool #CA8110 | 2.00 | 12/1/50 | 33 | ||||||||||||
| 21 | Fannie Mae, Pool #BQ9685 | 2.00 | 1/1/51 | 17 | ||||||||||||
| 39 | Fannie Mae, Pool #BQ7777 | 2.00 | 3/1/36 | 34 | ||||||||||||
| 23 | Fannie Mae, Pool #FM4969 | 2.00 | 12/1/50 | 19 | ||||||||||||
| 38 | Fannie Mae, Pool #BP9370 | 2.00 | 7/1/50 | 31 | ||||||||||||
| 23 | Fannie Mae, Pool #FS1621 | 2.00 | 7/1/51 | 19 | ||||||||||||
| 17 | Fannie Mae, Pool #MA4176 | 2.00 | 11/1/40 | 15 | ||||||||||||
| 31 | Fannie Mae, Pool #MA4128 | 2.00 | 9/1/40 | 26 | ||||||||||||
| 37 | Fannie Mae, Pool #MA4303 | 2.00 | 4/1/36 | 33 | ||||||||||||
| 40 | Fannie Mae, Pool #MA4255 | 2.00 | 2/1/51 | 33 | ||||||||||||
| 39 | Fannie Mae, Pool #MA4237 | 2.00 | 1/1/51 | 32 | ||||||||||||
| 21 | Fannie Mae, Pool #MA4119 | 2.00 | 9/1/50 | 17 | ||||||||||||
| 42 | Fannie Mae, Pool #MA4325 | 2.00 | 5/1/51 | 35 | ||||||||||||
| 21 | Fannie Mae, Pool #FM6559 | 2.00 | 3/1/51 | 17 | ||||||||||||
| 20 | Fannie Mae, Pool #CA8118 | 2.00 | 12/1/50 | 16 | ||||||||||||
| 42 | Fannie Mae, Pool #BR4435 | 2.00 | 4/1/51 | 35 | ||||||||||||
| 22 | Fannie Mae, Pool #MA4474 | 2.00 | 11/1/41 | 18 | ||||||||||||
| 22 | Fannie Mae, Pool #BT0240 | 2.00 | 9/1/51 | 18 | ||||||||||||
See accompanying notes to financial statements.
175
HC CAPITAL TRUST
The Core Fixed Income Portfolio
Portfolio of Investments (continued) — June 30, 2023
Principal | Security Description | Rate % | Maturity | Value | ||||||||||||
U.S. Government Agency Mortgages (continued) | ||||||||||||||||
| $ | 20 | Fannie Mae, Pool #MA4403 | 2.00 | 8/1/36 | $ | 18 | ||||||||||
| 42 | Fannie Mae, Pool #MA4305 | 2.00 | 4/1/51 | 34 | ||||||||||||
| 20 | Fannie Mae, Pool #CA7833 | 2.00 | 11/1/50 | 16 | ||||||||||||
| 41 | Fannie Mae, Pool #MA4281 | 2.00 | 3/1/51 | 33 | ||||||||||||
| 22 | Fannie Mae, Pool #MA4602 | 2.00 | 5/1/37 | 20 | ||||||||||||
| 21 | Fannie Mae, Pool #BR0948 | 2.00 | 4/1/51 | 18 | ||||||||||||
| 39 | Fannie Mae, Pool #FM4788 | 2.00 | 11/1/50 | 32 | ||||||||||||
| 23 | Fannie Mae, Pool #FS0317 | 2.00 | 2/1/42 | 19 | ||||||||||||
| 22 | Fannie Mae, Pool #MA4437 | 2.00 | 10/1/51 | 18 | ||||||||||||
| 42 | Fannie Mae, Pool #FM6448 | 2.00 | 3/1/51 | 35 | ||||||||||||
| 27 | Fannie Mae, Pool #FM3755 | 2.00 | 9/1/35 | 24 | ||||||||||||
| 19 | Fannie Mae, Pool #CA7224 | 2.00 | 10/1/50 | 15 | ||||||||||||
| 44 | Fannie Mae, Pool #CB0325 | 2.00 | 4/1/51 | 36 | ||||||||||||
| 37 | Fannie Mae, Pool #CA9183 | 2.00 | 2/1/36 | 33 | ||||||||||||
| 19 | Fannie Mae, Pool #MA4182 | 2.00 | 11/1/50 | 15 | ||||||||||||
| 45 | Fannie Mae, Pool #FM7411 | 2.00 | 5/1/51 | 37 | ||||||||||||
| 20 | Fannie Mae, Pool #CA8687 | 2.00 | 1/1/51 | 17 | ||||||||||||
| 19 | Fannie Mae, Pool #CA7225 | 2.00 | 10/1/50 | 15 | ||||||||||||
| 7 | Fannie Mae, Pool #AS2673 | 2.00 | 5/1/29 | 7 | ||||||||||||
| 41 | Fannie Mae, Pool #CA8850 | 2.00 | 2/1/51 | 34 | ||||||||||||
| 20 | Fannie Mae, Pool #CA8893 | 2.00 | 2/1/51 | 17 | ||||||||||||
| 20 | Fannie Mae, Pool #FM5308 | 2.00 | 12/1/50 | 17 | ||||||||||||
| 46 | Fannie Mae, Pool #MA4511 | 2.00 | 1/1/52 | 38 | ||||||||||||
| 22 | Fannie Mae, Pool #FM9579 | 2.00 | 7/1/51 | 18 | ||||||||||||
| 14 | Fannie Mae, Pool #FM4039 | 2.00 | 10/1/35 | 13 | ||||||||||||
| 18 | Fannie Mae, Pool #BQ5110 | 2.50 | 11/1/50 | 15 | ||||||||||||
| 12 | Fannie Mae, Pool #BK2588 | 2.50 | 5/1/50 | 11 | ||||||||||||
| 5 | Fannie Mae, Pool #MA2789 | 2.50 | 10/1/36 | 4 | ||||||||||||
| 15 | Fannie Mae, Pool #BP5878 | 2.50 | 6/1/50 | 13 | ||||||||||||
| 21 | Fannie Mae, Pool #MA4399 | 2.50 | 8/1/51 | 18 | ||||||||||||
| 21 | Fannie Mae, Pool #MA4414 | 2.50 | 9/1/51 | 18 | ||||||||||||
| 16 | Fannie Mae, Pool #MA4256 | 2.50 | 2/1/51 | 14 | ||||||||||||
| 42 | Fannie Mae, Pool #BR7857 | 2.50 | 5/1/51 | 35 | ||||||||||||
| 8 | Fannie Mae, Pool #MA1277 | 2.50 | 12/1/27 | 8 | ||||||||||||
| 21 | Fannie Mae, Pool #FM9033 | 2.50 | 10/1/51 | 18 | ||||||||||||
| 23 | Fannie Mae, Pool #CB1828 | 2.50 | 10/1/51 | 20 | ||||||||||||
| 21 | Fannie Mae, Pool #BO4657 | 2.50 | 11/1/49 | 18 | ||||||||||||
| 7 | Fannie Mae, Pool #MA3930 | 2.50 | 2/1/35 | 6 | ||||||||||||
| 21 | Fannie Mae, Pool #CB1131 | 2.50 | 7/1/51 | 18 | ||||||||||||
| 22 | Fannie Mae, Pool #CB2868 | 2.50 | 2/1/52 | 19 | ||||||||||||
| 8 | Fannie Mae, Pool #MA3990 | 2.50 | 4/1/50 | 7 | ||||||||||||
| 12 | Fannie Mae, Pool #AU6677 | 2.50 | 9/1/28 | 11 | ||||||||||||
| 11 | Fannie Mae, Pool #MA4075 | 2.50 | 7/1/35 | 10 | ||||||||||||
| 12 | Fannie Mae, Pool #MA4078 | 2.50 | 7/1/50 | 10 | ||||||||||||
| 14 | Fannie Mae, Pool #AB7391 | 2.50 | 12/1/42 | 12 | ||||||||||||
| �� | 6 | Fannie Mae, Pool #MA3154 | 2.50 | 10/1/32 | 5 | |||||||||||
| 18 | Fannie Mae, Pool #CA8131 | 2.50 | 12/1/50 | 15 | ||||||||||||
| 14 | Fannie Mae, Pool #BQ0329 | 2.50 | 7/1/50 | 12 | ||||||||||||
See accompanying notes to financial statements.
176
HC CAPITAL TRUST
The Core Fixed Income Portfolio
Portfolio of Investments (continued) — June 30, 2023
Principal | Security Description | Rate % | Maturity | Value | ||||||||||||
U.S. Government Agency Mortgages (continued) | ||||||||||||||||
| $ | 15 | Fannie Mae, Pool #AP4742 | 2.50 | 8/1/27 | $ | 14 | ||||||||||
| 24 | Fannie Mae, Pool #CA6074 | 2.50 | 6/1/50 | 20 | ||||||||||||
| 15 | Fannie Mae, Pool #MA4183 | 2.50 | 11/1/50 | 13 | ||||||||||||
| 23 | Fannie Mae, Pool #BU1451 | 2.50 | 1/1/52 | 19 | ||||||||||||
| 10 | Fannie Mae, Pool #AS8893 | 2.50 | 2/1/32 | 9 | ||||||||||||
| 11 | Fannie Mae, Pool #BD8046 | 2.50 | 9/1/31 | 10 | ||||||||||||
| 24 | Fannie Mae, Pool #FS0235 | 2.50 | 1/1/52 | 20 | ||||||||||||
| 23 | Fannie Mae, Pool #FS0547 | 2.50 | 2/1/52 | 20 | ||||||||||||
| 23 | Fannie Mae, Pool #FS1340 | 2.50 | 3/1/52 | 19 | ||||||||||||
| 8 | Fannie Mae, Pool #MA3902 | 2.50 | 1/1/50 | 7 | ||||||||||||
| 21 | Fannie Mae, Pool #MA4423 | 2.50 | 9/1/41 | 18 | ||||||||||||
| 16 | Fannie Mae, Pool #FM4231 | 2.50 | 9/1/50 | 14 | ||||||||||||
| 22 | Fannie Mae, Pool #BU5917 | 2.50 | 12/1/51 | 19 | ||||||||||||
| 22 | Fannie Mae, Pool #FM9543 | 2.50 | 12/1/51 | 19 | ||||||||||||
| 22 | Fannie Mae, Pool #FM8745 | 2.50 | 9/1/51 | 19 | ||||||||||||
| 14 | Fannie Mae, Pool #BC9041 | 2.50 | 11/1/31 | 13 | ||||||||||||
| 7 | Fannie Mae, Pool #MA3965 | 2.50 | 3/1/40 | 6 | ||||||||||||
| 15 | Fannie Mae, Pool #MA4159 | 2.50 | 10/1/50 | 13 | ||||||||||||
| 13 | Fannie Mae, Pool #MA4096 | 2.50 | 8/1/50 | 11 | ||||||||||||
| 21 | Fannie Mae, Pool #FM2881 | 2.50 | 4/1/50 | 18 | ||||||||||||
| 14 | Fannie Mae, Pool #MA2854 | 2.50 | 12/1/46 | 12 | ||||||||||||
| 6 | Fannie Mae, Pool #MA3827 | 2.50 | 11/1/34 | 6 | ||||||||||||
| 30 | Fannie Mae, Pool #FM4638 | 2.50 | 10/1/50 | 25 | ||||||||||||
| 22 | Fannie Mae, Pool #FM8997 | 2.50 | 10/1/51 | 19 | ||||||||||||
| 6 | Fannie Mae, Pool #MA3765 | 2.50 | 9/1/49 | 5 | ||||||||||||
| 29 | Fannie Mae, Pool #AO0752 | 3.00 | 4/1/42 | 26 | ||||||||||||
| 8 | Fannie Mae, Pool #CA5519 | 3.00 | 4/1/50 | 7 | ||||||||||||
| 9 | Fannie Mae, Pool #BO9169 | 3.00 | 12/1/49 | 8 | ||||||||||||
| 28 | Fannie Mae, Pool #AB7099 | 3.00 | 11/1/42 | 25 | ||||||||||||
| 5 | Fannie Mae, Pool #MA3127 | 3.00 | 9/1/37 | 5 | ||||||||||||
| 8 | Fannie Mae, Pool #MA1307 | 3.00 | 1/1/33 | 8 | ||||||||||||
| 21 | Fannie Mae, Pool #AB8897 | 3.00 | 4/1/43 | 19 | ||||||||||||
| 11 | Fannie Mae, Pool #BP6466 | 3.00 | 7/1/50 | 10 | ||||||||||||
| 10 | Fannie Mae, Pool #AU3353 | 3.00 | 8/1/43 | 9 | ||||||||||||
| 24 | Fannie Mae, Pool #AS0302 | 3.00 | 8/1/43 | 21 | ||||||||||||
| 23 | Fannie Mae, Pool #BU8883 | 3.00 | 3/1/52 | 20 | ||||||||||||
| 8 | Fannie Mae, Pool #MA3738 | 3.00 | 8/1/34 | 8 | ||||||||||||
| 8 | Fannie Mae, Pool #CA5423 | 3.00 | 3/1/50 | 7 | ||||||||||||
| 8 | Fannie Mae, Pool #MA3897 | 3.00 | 1/1/35 | 8 | ||||||||||||
| 13 | Fannie Mae, Pool #BC9003 | 3.00 | 11/1/46 | 12 | ||||||||||||
| 6 | Fannie Mae, Pool #MA3871 | 3.00 | 12/1/49 | 5 | ||||||||||||
| 26 | Fannie Mae, Pool #AS8483 | 3.00 | 12/1/46 | 24 | ||||||||||||
| 11 | Fannie Mae, Pool #AS8276 | 3.00 | 11/1/46 | 10 | ||||||||||||
| 9 | Fannie Mae, Pool #BP1932 | 3.00 | 4/1/50 | 8 | ||||||||||||
| 6 | Fannie Mae, Pool #AS8074 | 3.00 | 10/1/46 | 5 | ||||||||||||
| 9 | Fannie Mae, Pool #BO7242 | 3.00 | 1/1/50 | 8 | ||||||||||||
| 7 | Fannie Mae, Pool #MA2863 | 3.00 | 1/1/47 | 6 | ||||||||||||
| 12 | Fannie Mae, Pool #MA3834 | 3.00 | 11/1/49 | 11 | ||||||||||||
See accompanying notes to financial statements.
177
HC CAPITAL TRUST
The Core Fixed Income Portfolio
Portfolio of Investments (continued) — June 30, 2023
Principal | Security Description | Rate % | Maturity | Value | ||||||||||||
U.S. Government Agency Mortgages (continued) | ||||||||||||||||
| $ | 7 | Fannie Mae, Pool #FM1370 | 3.00 | 4/1/46 | $ | 6 | ||||||||||
| 19 | Fannie Mae, Pool #AQ7920 | 3.00 | 12/1/42 | 17 | ||||||||||||
| 8 | Fannie Mae, Pool #BO6219 | 3.00 | 12/1/49 | 7 | ||||||||||||
| 7 | Fannie Mae, Pool #BO8947 | 3.00 | 1/1/50 | 6 | ||||||||||||
| 6 | Fannie Mae, Pool #MA3890 | 3.00 | 1/1/40 | 5 | ||||||||||||
| 18 | Fannie Mae, Pool #MA2246 | 3.00 | 4/1/30 | 17 | ||||||||||||
| 7 | Fannie Mae, Pool #AZ2936 | 3.00 | 9/1/45 | 6 | ||||||||||||
| 22 | Fannie Mae, Pool #CB3172 | 3.00 | 3/1/52 | 20 | ||||||||||||
| 22 | Fannie Mae, Pool #CB2759 | 3.00 | 2/1/52 | 20 | ||||||||||||
| 4 | Fannie Mae, Pool #MA3744 | 3.00 | 8/1/49 | 3 | ||||||||||||
| 4 | Fannie Mae, Pool #MA2523 | 3.00 | 2/1/36 | 4 | ||||||||||||
| 9 | Fannie Mae, Pool #MA3802 | 3.00 | 10/1/49 | 8 | ||||||||||||
| 23 | Fannie Mae, Pool #FS2122 | 3.00 | 3/1/52 | 20 | ||||||||||||
| 23 | Fannie Mae, Pool #CB3364 | 3.00 | 4/1/52 | 21 | ||||||||||||
| 5 | Fannie Mae, Pool #MA3237 | 3.00 | 1/1/48 | 5 | ||||||||||||
| 23 | Fannie Mae, Pool #BU1241 | 3.00 | 3/1/52 | 20 | ||||||||||||
| 6 | Fannie Mae, Pool #AB2047 | 3.00 | 1/1/26 | 5 | ||||||||||||
| 4 | Fannie Mae, Pool #MA3691 | 3.00 | 7/1/49 | 3 | ||||||||||||
| 6 | Fannie Mae, Pool #MA3905 | 3.00 | 1/1/50 | 5 | ||||||||||||
| 14 | Fannie Mae, Pool #MA3937 | 3.00 | 2/1/50 | 13 | ||||||||||||
| 9 | Fannie Mae, Pool #MA4048 | 3.00 | 6/1/50 | 8 | ||||||||||||
| 6 | Fannie Mae, Pool #MA2897 | 3.00 | 2/1/37 | 6 | ||||||||||||
| 14 | Fannie Mae, Pool #BC4764 | 3.00 | 10/1/46 | 12 | ||||||||||||
| 4 | Fannie Mae, Pool #FM1585 | 3.00 | 9/1/49 | 4 | ||||||||||||
| 8 | Fannie Mae, Pool #FM4317 | 3.00 | 9/1/50 | 7 | ||||||||||||
| 10 | Fannie Mae, Pool #FM3395 | 3.00 | 6/1/50 | 9 | ||||||||||||
| 5 | Fannie Mae, Pool #MA3831 | 3.00 | 11/1/39 | 5 | ||||||||||||
| 8 | Fannie Mae, Pool #AL9996 | 3.00 | 4/1/32 | 7 | ||||||||||||
| 9 | Fannie Mae, Pool #CA5668 | 3.00 | 5/1/50 | 8 | ||||||||||||
| 5 | Fannie Mae, Pool #FM2132 | 3.00 | 1/1/50 | 5 | ||||||||||||
| 10 | Fannie Mae, Pool #AL9263 | 3.00 | 10/1/46 | 9 | ||||||||||||
| 4 | Fannie Mae, Pool #FM1299 | 3.00 | 7/1/49 | 4 | ||||||||||||
| 5 | Fannie Mae, Pool #MA3339 | 3.00 | 4/1/33 | 4 | ||||||||||||
| 6 | Fannie Mae, Pool #BO3192 | 3.00 | 10/1/49 | 6 | ||||||||||||
| 6 | Fannie Mae, Pool #BO2201 | 3.00 | 9/1/49 | 5 | ||||||||||||
| 5 | Fannie Mae, Pool #BN7703 | 3.00 | 8/1/49 | 5 | ||||||||||||
| 6 | Fannie Mae, Pool #MA3377 | 3.00 | 5/1/48 | 5 | ||||||||||||
| 4 | Fannie Mae, Pool #MA3774 | 3.00 | 9/1/49 | 4 | ||||||||||||
| 13 | Fannie Mae, Pool #MA3991 | 3.00 | 4/1/50 | 12 | ||||||||||||
| 10 | Fannie Mae, Pool #MA4079 | 3.00 | 7/1/50 | 9 | ||||||||||||
| 5 | Fannie Mae, Pool #BM2000 | 3.50 | 5/1/47 | 5 | ||||||||||||
| 5 | Fannie Mae, Pool #ZM4908 | 3.50 | 11/1/47 | 5 | ||||||||||||
| 5 | Fannie Mae, Pool #MA3906 | 3.50 | 1/1/50 | 4 | ||||||||||||
| 10 | Fannie Mae, Pool #BJ4916 | 3.50 | 3/1/48 | 9 | ||||||||||||
| 3 | Fannie Mae, Pool #CA4026 | 3.50 | 5/1/49 | 3 | ||||||||||||
| 5 | Fannie Mae, Pool #FM1001 | 3.50 | 11/1/48 | 4 | ||||||||||||
| 3 | Fannie Mae, Pool #MA3692 | 3.50 | 7/1/49 | 3 | ||||||||||||
| 5 | Fannie Mae, Pool #BJ3716 | 3.50 | 12/1/47 | 5 | ||||||||||||
See accompanying notes to financial statements.
178
HC CAPITAL TRUST
The Core Fixed Income Portfolio
Portfolio of Investments (continued) — June 30, 2023
Principal | Security Description | Rate % | Maturity | Value | ||||||||||||
U.S. Government Agency Mortgages (continued) | ||||||||||||||||
| $ | 4 | Fannie Mae, Pool #MA3835 | 3.50 | 11/1/49 | $ | 4 | ||||||||||
| 5 | Fannie Mae, Pool #MA3210 | 3.50 | 12/1/47 | 5 | ||||||||||||
| 10 | Fannie Mae, Pool #BM1568 | 3.50 | 7/1/47 | 9 | ||||||||||||
| 5 | Fannie Mae, Pool #FM1566 | 3.50 | 11/1/48 | 5 | ||||||||||||
| 4 | Fannie Mae, Pool #MA3059 | 3.50 | 7/1/37 | 4 | ||||||||||||
| 3 | Fannie Mae, Pool #BM5485 | 3.50 | 2/1/49 | 3 | ||||||||||||
| 4 | Fannie Mae, Pool #MA3057 | 3.50 | 7/1/47 | 4 | ||||||||||||
| 6 | Fannie Mae, Pool #AL1717 | 3.50 | 5/1/27 | 5 | ||||||||||||
| 5 | Fannie Mae, Pool #BK9038 | 3.50 | 10/1/33 | 5 | ||||||||||||
| 47 | Fannie Mae, Pool #MA4600 | 3.50 | 5/1/52 | 43 | ||||||||||||
| 3 | Fannie Mae, Pool #MA3637 | 3.50 | 4/1/49 | 2 | ||||||||||||
| 3 | Fannie Mae, Pool #MA3494 | 3.50 | 10/1/48 | 3 | ||||||||||||
| 4 | Fannie Mae, Pool #MA3305 | 3.50 | 3/1/48 | 4 | ||||||||||||
| 6 | Fannie Mae, Pool #MA3520 | 3.50 | 11/1/48 | 6 | ||||||||||||
| 6 | Fannie Mae, Pool #FM1911 | 3.50 | 7/1/48 | 6 | ||||||||||||
| 4 | Fannie Mae, Pool #BM4703 | 3.50 | 2/1/48 | 4 | ||||||||||||
| 24 | Fannie Mae, Pool #BU8723 | 3.50 | 6/1/52 | 21 | ||||||||||||
| 3 | Fannie Mae, Pool #MA3745 | 3.50 | 8/1/49 | 3 | ||||||||||||
| 3 | Fannie Mae, Pool #FM0020 | 3.50 | 7/1/49 | 3 | ||||||||||||
| 14 | Fannie Mae, Pool #MA2125 | 3.50 | 12/1/44 | 13 | ||||||||||||
| 8 | Fannie Mae, Pool #BP1947 | 3.50 | 4/1/50 | 7 | ||||||||||||
| 24 | Fannie Mae, Pool #MA4654 | 3.50 | 7/1/52 | 22 | ||||||||||||
| 3 | Fannie Mae, Pool #BA1893 | 3.50 | 8/1/45 | 3 | ||||||||||||
| 7 | Fannie Mae, Pool #MA3026 | 3.50 | 6/1/47 | 7 | ||||||||||||
| 8 | Fannie Mae, Pool #MA2706 | 3.50 | 8/1/46 | 7 | ||||||||||||
| 9 | Fannie Mae, Pool #BC2926 | 3.50 | 3/1/46 | 9 | ||||||||||||
| 6 | Fannie Mae, Pool #AS7388 | 3.50 | 6/1/46 | 6 | ||||||||||||
| 4 | Fannie Mae, Pool #AS6394 | 3.50 | 12/1/45 | 3 | ||||||||||||
| 3 | Fannie Mae, Pool #AS4236 | 3.50 | 1/1/45 | 3 | ||||||||||||
| 9 | Fannie Mae, Pool #AZ0862 | 3.50 | 7/1/45 | 8 | ||||||||||||
| 4 | Fannie Mae, Pool #MA3148 | 3.50 | 10/1/47 | 4 | ||||||||||||
| 9 | Fannie Mae, Pool #MA1980 | 3.50 | 8/1/44 | 8 | ||||||||||||
| 12 | Fannie Mae, Pool #AS4771 | 3.50 | 4/1/45 | 11 | ||||||||||||
| 6 | Fannie Mae, Pool #BC0443 | 3.50 | 12/1/45 | 5 | ||||||||||||
| 5 | Fannie Mae, Pool #BD5046 | 3.50 | 2/1/47 | 4 | ||||||||||||
| 7 | Fannie Mae, Pool #AS0024 | 3.50 | 7/1/43 | 7 | ||||||||||||
| 7 | Fannie Mae, Pool #AS6102 | 3.50 | 11/1/45 | 6 | ||||||||||||
| 4 | Fannie Mae, Pool #MA2522 | 3.50 | 2/1/46 | 4 | ||||||||||||
| 7 | Fannie Mae, Pool #BC1158 | 3.50 | 2/1/46 | 6 | ||||||||||||
| 5 | Fannie Mae, Pool #AB2052 | 3.50 | 1/1/26 | 5 | ||||||||||||
| 4 | Fannie Mae, Pool #MA3775 | 3.50 | 9/1/49 | 4 | ||||||||||||
| 26 | Fannie Mae, Pool #AQ0546 | 3.50 | 11/1/42 | 25 | ||||||||||||
| 3 | Fannie Mae, Pool #MA3663 | 3.50 | 5/1/49 | 3 | ||||||||||||
| 2 | Fannie Mae, Pool #MA3614 | 3.50 | 3/1/49 | 2 | ||||||||||||
| 3 | Fannie Mae, Pool #MA3597 | 3.50 | 2/1/49 | 2 | ||||||||||||
| 9 | Fannie Mae, Pool #MA3182 | 3.50 | 11/1/47 | 8 | ||||||||||||
| 10 | Fannie Mae, Pool #MA3243 | 3.50 | 1/1/38 | 9 | ||||||||||||
| 6 | Fannie Mae, Pool #AS7491 | 3.50 | 7/1/46 | 5 | ||||||||||||
See accompanying notes to financial statements.
179
HC CAPITAL TRUST
The Core Fixed Income Portfolio
Portfolio of Investments (continued) — June 30, 2023
Principal | Security Description | Rate % | Maturity | Value | ||||||||||||
U.S. Government Agency Mortgages (continued) | ||||||||||||||||
| $ | 4 | Fannie Mae, Pool #MA3746 | 4.00 | 8/1/49 | $ | 3 | ||||||||||
| 3 | Fannie Mae, Pool #BM4991 | 4.00 | 9/1/48 | 3 | ||||||||||||
| 3 | Fannie Mae, Pool #BK0920 | 4.00 | 7/1/48 | 3 | ||||||||||||
| 4 | Fannie Mae, Pool #BM4306 | 4.00 | 9/1/25 | 4 | ||||||||||||
| 9 | Fannie Mae, Pool #AS3468 | 4.00 | 10/1/44 | 9 | ||||||||||||
| 3 | Fannie Mae, Pool #AS8532 | 4.00 | 12/1/46 | 3 | ||||||||||||
| 4 | Fannie Mae, Pool #MA3183 | 4.00 | 11/1/47 | 4 | ||||||||||||
| 11 | Fannie Mae, Pool #BK7943 | 4.00 | 11/1/48 | 11 | ||||||||||||
| 3 | Fannie Mae, Pool #BN0334 | 4.00 | 12/1/48 | 3 | ||||||||||||
| 5 | Fannie Mae, Pool #AS7558 | 4.00 | 7/1/46 | 5 | ||||||||||||
| 7 | Fannie Mae, Pool #AU8849 | 4.00 | 11/1/43 | 7 | ||||||||||||
| 16 | Fannie Mae, Pool #AO2959 | 4.00 | 5/1/42 | 15 | ||||||||||||
| 4 | Fannie Mae, Pool #FM1415 | 4.00 | 12/1/48 | 3 | ||||||||||||
| 3 | Fannie Mae, Pool #FM1571 | 4.00 | 12/1/48 | 3 | ||||||||||||
| 8 | Fannie Mae, Pool #AS3467 | 4.00 | 10/1/44 | 8 | ||||||||||||
| 2 | Fannie Mae, Pool #MA3615 | 4.00 | 3/1/49 | 2 | ||||||||||||
| 6 | Fannie Mae, Pool #AS9314 | 4.00 | 3/1/47 | 6 | ||||||||||||
| 3 | Fannie Mae, Pool #BK0909 | 4.00 | 7/1/48 | 3 | ||||||||||||
| 4 | Fannie Mae, Pool #MA3277 | 4.00 | 2/1/48 | 4 | ||||||||||||
| 10 | Fannie Mae, Pool #BM1066 | 4.00 | 2/1/47 | 9 | ||||||||||||
| 4 | Fannie Mae, Pool #AS7600 | 4.00 | 7/1/46 | 4 | ||||||||||||
| 3 | Fannie Mae, Pool #BD7060 | 4.00 | 3/1/47 | 3 | ||||||||||||
| 3 | Fannie Mae, Pool #CA2316 | 4.00 | 7/1/48 | 3 | ||||||||||||
| 8 | Fannie Mae, Pool #AS8823 | 4.00 | 2/1/47 | 8 | ||||||||||||
| 7 | Fannie Mae, Pool #MA2995 | 4.00 | 5/1/47 | 7 | ||||||||||||
| 4 | Fannie Mae, Pool #CA0183 | 4.00 | 8/1/47 | 4 | ||||||||||||
| 3 | Fannie Mae, Pool #MA3563 | 4.00 | 1/1/49 | 3 | ||||||||||||
| 2 | Fannie Mae, Pool #MA3592 | 4.00 | 2/1/49 | 2 | ||||||||||||
| 5 | Fannie Mae, Pool #BN6677 | 4.00 | 6/1/49 | 5 | ||||||||||||
| 6 | Fannie Mae, Pool #AH6242 | 4.00 | 4/1/26 | 6 | ||||||||||||
| 4 | Fannie Mae, Pool #FM1960 | 4.00 | 5/1/49 | 4 | ||||||||||||
| 3 | Fannie Mae, Pool #MA3638 | 4.00 | 4/1/49 | 3 | ||||||||||||
| 3 | Fannie Mae, Pool #FM0021 | 4.00 | 3/1/49 | 3 | ||||||||||||
| 4 | Fannie Mae, Pool #AZ7362 | 4.00 | 11/1/45 | 4 | ||||||||||||
| 7 | Fannie Mae, Pool #MA3121 | 4.00 | 9/1/47 | 7 | ||||||||||||
| 3 | Fannie Mae, Pool #MA3521 | 4.00 | 11/1/48 | 2 | ||||||||||||
| 8 | Fannie Mae, Pool #AX0841 | 4.00 | 9/1/44 | 8 | ||||||||||||
| 24 | Fannie Mae, Pool #MA4732 | 4.00 | 9/1/52 | 23 | ||||||||||||
| 6 | Fannie Mae, Pool #MA3804 | 4.00 | 10/1/49 | 5 | ||||||||||||
| 7 | Fannie Mae, Pool #BM2002 | 4.00 | 10/1/47 | 6 | ||||||||||||
| 6 | Fannie Mae, Pool #AS9831 | 4.00 | 6/1/47 | 5 | ||||||||||||
| 4 | Fannie Mae, Pool #MA2415 | 4.00 | 10/1/45 | 4 | ||||||||||||
| 3 | Fannie Mae, Pool #MA3639 | 4.50 | 4/1/49 | 3 | ||||||||||||
| 11 | Fannie Mae, Pool #AS9394 | 4.50 | 4/1/47 | 10 | ||||||||||||
| 5 | Fannie Mae, Pool #BM3286 | 4.50 | 11/1/47 | 4 | ||||||||||||
| 3 | Fannie Mae, Pool #BK4850 | 4.50 | 5/1/48 | 3 | ||||||||||||
| 46 | Fannie Mae, Pool #BV7928 | 4.50 | 8/1/52 | 44 | ||||||||||||
| 2 | Fannie Mae, Pool #MA3537 | 4.50 | 12/1/48 | 2 | ||||||||||||
See accompanying notes to financial statements.
180
HC CAPITAL TRUST
The Core Fixed Income Portfolio
Portfolio of Investments (continued) — June 30, 2023
Principal | Security Description | Rate % | Maturity | Value | ||||||||||||
U.S. Government Agency Mortgages (continued) | ||||||||||||||||
| $ | 4 | Fannie Mae, Pool #CA0623 | 4.50 | 10/1/47 | $ | 4 | ||||||||||
| 6 | Fannie Mae, Pool #MA3747 | 4.50 | 8/1/49 | 6 | ||||||||||||
| 5 | Fannie Mae, Pool #AS2751 | 4.50 | 6/1/44 | 5 | ||||||||||||
| 2 | Fannie Mae, Pool #BN4309 | 4.50 | 1/1/49 | 2 | ||||||||||||
| 22 | Fannie Mae, Pool #AE0217 | 4.50 | 8/1/40 | 21 | ||||||||||||
| 1 | Fannie Mae, Pool #930998 | 4.50 | 4/1/29 | 1 | ||||||||||||
| 4 | Fannie Mae, Pool #CA1711 | 4.50 | 5/1/48 | 4 | ||||||||||||
| 11 | Fannie Mae, Pool #MA3184 | 4.50 | 11/1/47 | 11 | ||||||||||||
| 17 | Fannie Mae, Pool #AE0954 | 4.50 | 2/1/41 | 16 | ||||||||||||
| 2 | Fannie Mae, Pool #BK6328 | 4.50 | 6/1/48 | 2 | ||||||||||||
| 4 | Fannie Mae, Pool #BM3904 | 5.00 | 5/1/48 | 4 | ||||||||||||
| 4 | Fannie Mae, Pool #725027 | 5.00 | 11/1/33 | 4 | ||||||||||||
| 10 | Fannie Mae, Pool #725238 | 5.00 | 3/1/34 | 10 | ||||||||||||
| 20 | Fannie Mae, Pool #889117 | 5.00 | 10/1/35 | 20 | ||||||||||||
| 3 | Fannie Mae, Pool #890603 | 5.00 | 8/1/41 | 3 | ||||||||||||
| 23 | Fannie Mae, Pool #MA4761 | 5.00 | 9/1/52 | 23 | ||||||||||||
| 24 | Fannie Mae, Pool #FS3360 | 5.50 | 12/1/52 | 24 | ||||||||||||
| 4 | Fannie Mae, Pool #890221 | 5.50 | 12/1/33 | 4 | ||||||||||||
| 25 | Fannie Mae, Pool #MA5072 | 5.50 | 7/1/53 | 25 | ||||||||||||
| 10 | Fannie Mae, Pool #959451 | 6.00 | 12/1/37 | 10 | ||||||||||||
| 50 | Fannie Mae, 15 YR TBA | 1.50 | 7/25/38 | 43 | ||||||||||||
| 25 | Fannie Mae, 15 YR TBA | 4.50 | 7/25/38 | 25 | ||||||||||||
| 25 | Fannie Mae, 30 YR TBA | 3.50 | 7/25/53 | 23 | ||||||||||||
| 25 | Fannie Mae, 30 YR TBA | 4.00 | 7/25/53 | 23 | ||||||||||||
| 50 | Fannie Mae, 30 YR TBA | 4.50 | 7/25/53 | 48 | ||||||||||||
| 25 | Fannie Mae, 30 YR TBA | 5.00 | 8/25/53 | 25 | ||||||||||||
| 50 | Fannie Mae, 30 YR TBA | 5.00 | 7/25/53 | 49 | ||||||||||||
| 75 | Fannie Mae, 30 YR TBA | 5.50 | 7/25/53 | 76 | ||||||||||||
| 25 | Fannie Mae, 30 YR TBA | 5.50 | 8/25/52 | 25 | ||||||||||||
| 50 | Fannie Mae, 30 YR TBA | 6.00 | 7/25/53 | 50 | ||||||||||||
| 25 | Fannie Mae, 30 YR TBA | 6.00 | 8/25/53 | 25 | ||||||||||||
| 50 | Fannie Mae, 30 YR TBA | 6.50 | 7/25/53 | 52 | ||||||||||||
| 18 | Freddie Mac, Pool #SB8088 | 1.50 | 2/1/36 | 15 | ||||||||||||
| 44 | Freddie Mac, Pool #SD8154 | 1.50 | 7/1/51 | 34 | ||||||||||||
| 43 | Freddie Mac, Pool #QC0962 | 1.50 | 4/1/51 | 33 | ||||||||||||
| 21 | Freddie Mac, Pool #RB5110 | 1.50 | 5/1/41 | 17 | ||||||||||||
| 19 | Freddie Mac, Pool #SB8097 | 1.50 | 4/1/36 | 16 | ||||||||||||
| 22 | Freddie Mac, Pool #SB8144 | 1.50 | 3/1/37 | 19 | ||||||||||||
| 22 | Freddie Mac, Pool #QN9521 | 1.50 | 2/1/37 | 19 | ||||||||||||
| 46 | Freddie Mac, Pool #QD1254 | 2.00 | 11/1/51 | 38 | ||||||||||||
| 42 | Freddie Mac, Pool #QC0423 | 2.00 | 4/1/51 | 34 | ||||||||||||
| 19 | Freddie Mac, Pool #RB5095 | 2.00 | 1/1/41 | 15 | ||||||||||||
| 32 | Freddie Mac, Pool #SB8079 | 2.00 | 12/1/35 | 28 | ||||||||||||
| 40 | Freddie Mac, Pool #SD8128 | 2.00 | 2/1/51 | 32 | ||||||||||||
| 41 | Freddie Mac, Pool #QB7708 | 2.00 | 1/1/51 | 33 | ||||||||||||
| 42 | Freddie Mac, Pool #QB6893 | 2.00 | 12/1/50 | 35 | ||||||||||||
| 23 | Freddie Mac, Pool #QC7473 | 2.00 | 9/1/51 | 18 | ||||||||||||
| 19 | Freddie Mac, Pool #QB3926 | 2.00 | 10/1/50 | 15 | ||||||||||||
See accompanying notes to financial statements.
181
HC CAPITAL TRUST
The Core Fixed Income Portfolio
Portfolio of Investments (continued) — June 30, 2023
Principal | Security Description | Rate % | Maturity | Value | ||||||||||||
U.S. Government Agency Mortgages (continued) | ||||||||||||||||
| $ | 13 | Freddie Mac, Pool #SB8061 | 2.00 | 9/1/35 | $ | 12 | ||||||||||
| 19 | Freddie Mac, Pool #SB8107 | 2.00 | 6/1/36 | 17 | ||||||||||||
| 22 | Freddie Mac, Pool #SD8098 | 2.00 | 10/1/50 | 18 | ||||||||||||
| 21 | Freddie Mac, Pool #RA3328 | 2.00 | 8/1/50 | 18 | ||||||||||||
| 21 | Freddie Mac, Pool #RA4214 | 2.00 | 12/1/50 | 17 | ||||||||||||
| 41 | Freddie Mac, Pool #SB8128 | 2.00 | 11/1/36 | 37 | ||||||||||||
| 22 | Freddie Mac, Pool #RA5040 | 2.00 | 4/1/51 | 18 | ||||||||||||
| 22 | Freddie Mac, Pool #RA5257 | 2.00 | 5/1/51 | 18 | ||||||||||||
| 46 | Freddie Mac, Pool #SD8188 | 2.00 | 1/1/52 | 38 | ||||||||||||
| 21 | Freddie Mac, Pool #SD8079 | 2.00 | 7/1/50 | 17 | ||||||||||||
| 22 | Freddie Mac, Pool #RA5155 | 2.00 | 5/1/51 | 18 | ||||||||||||
| 23 | Freddie Mac, Pool #SD8172 | 2.00 | 10/1/51 | 18 | ||||||||||||
| 20 | Freddie Mac, Pool #SD8121 | 2.00 | 1/1/51 | 16 | ||||||||||||
| 41 | Freddie Mac, Pool #SD7537 | 2.00 | 3/1/51 | 34 | ||||||||||||
| 21 | Freddie Mac, Pool #SD8146 | 2.00 | 5/1/51 | 17 | ||||||||||||
| 45 | Freddie Mac, Pool #SD8177 | 2.00 | 11/1/51 | 37 | ||||||||||||
| 20 | Freddie Mac, Pool #SB8115 | 2.00 | 8/1/36 | 17 | ||||||||||||
| 23 | Freddie Mac, Pool #QD5748 | 2.00 | 2/1/52 | 19 | ||||||||||||
| 19 | Freddie Mac, Pool #SB8510 | 2.00 | 2/1/36 | 17 | ||||||||||||
| 16 | Freddie Mac, Pool #RC1727 | 2.00 | 12/1/35 | 14 | ||||||||||||
| 44 | Freddie Mac, Pool #SD8160 | 2.00 | 8/1/51 | 36 | ||||||||||||
| 23 | Freddie Mac, Pool #SD8199 | 2.00 | 3/1/52 | 19 | ||||||||||||
| 43 | Freddie Mac, Pool #QC3697 | 2.00 | 6/1/51 | 35 | ||||||||||||
| 22 | Freddie Mac, Pool #QC3597 | 2.00 | 6/1/51 | 18 | ||||||||||||
| 42 | Freddie Mac, Pool #QC1333 | 2.00 | 5/1/51 | 35 | ||||||||||||
| 46 | Freddie Mac, Pool #SD8193 | 2.00 | 2/1/52 | 38 | ||||||||||||
| 18 | Freddie Mac, Pool #RA3205 | 2.00 | 8/1/50 | 15 | ||||||||||||
| 21 | Freddie Mac, Pool #RB5114 | 2.00 | 6/1/41 | 17 | ||||||||||||
| 39 | Freddie Mac, Pool #SD8113 | 2.00 | 12/1/50 | 32 | ||||||||||||
| 21 | Freddie Mac, Pool #RB5121 | 2.00 | 8/1/41 | 18 | ||||||||||||
| 19 | Freddie Mac, Pool #RA3575 | 2.00 | 9/1/50 | 15 | ||||||||||||
| 31 | Freddie Mac, Pool #RA2634 | 2.50 | 5/1/50 | 27 | ||||||||||||
| 22 | Freddie Mac, Pool #SB0301 | 2.50 | 4/1/35 | 20 | ||||||||||||
| 20 | Freddie Mac, Pool #QC2031 | 2.50 | 5/1/51 | 17 | ||||||||||||
| 7 | Freddie Mac, Pool #RB5043 | 2.50 | 4/1/40 | 6 | ||||||||||||
| 13 | Freddie Mac, Pool #SD8083 | 2.50 | 8/1/50 | 11 | ||||||||||||
| 32 | Freddie Mac, Pool #SD8114 | 2.50 | 12/1/50 | 27 | ||||||||||||
| 16 | Freddie Mac, Pool #SD8122 | 2.50 | 1/1/51 | 14 | ||||||||||||
| 28 | Freddie Mac, Pool #SB8045 | 2.50 | 5/1/35 | 26 | ||||||||||||
| 22 | Freddie Mac, Pool #SD8167 | 2.50 | 9/1/51 | 18 | ||||||||||||
| 15 | Freddie Mac, Pool #SD8099 | 2.50 | 10/1/50 | 13 | ||||||||||||
| 23 | Freddie Mac, Pool #SD8189 | 2.50 | 1/1/52 | 19 | ||||||||||||
| 38 | Freddie Mac, Pool #SD8141 | 2.50 | 4/1/51 | 32 | ||||||||||||
| 21 | Freddie Mac, Pool #RA3528 | 2.50 | 9/1/50 | 18 | ||||||||||||
| 17 | Freddie Mac, Pool #SD8129 | 2.50 | 2/1/51 | 14 | ||||||||||||
| 16 | Freddie Mac, Pool #ZS4687 | 2.50 | 11/1/46 | 13 | ||||||||||||
| 16 | Freddie Mac, Pool #QB3703 | 2.50 | 9/1/50 | 14 | ||||||||||||
| 7 | Freddie Mac, Pool #ZS8692 | 2.50 | 4/1/33 | 6 | ||||||||||||
See accompanying notes to financial statements.
182
HC CAPITAL TRUST
The Core Fixed Income Portfolio
Portfolio of Investments (continued) — June 30, 2023
Principal | Security Description | Rate % | Maturity | Value | ||||||||||||
U.S. Government Agency Mortgages (continued) | ||||||||||||||||
| $ | 19 | Freddie Mac, Pool #SD8147 | 2.50 | 5/1/51 | $ | 16 | ||||||||||
| 45 | Freddie Mac, Pool #SD8183 | 2.50 | 12/1/51 | 38 | ||||||||||||
| 20 | Freddie Mac, Pool #SD8151 | 2.50 | 6/1/51 | 17 | ||||||||||||
| 15 | Freddie Mac, Pool #RA2897 | 2.50 | 6/1/50 | 13 | ||||||||||||
| 8 | Freddie Mac, Pool #G07445 | 2.50 | 7/1/43 | 7 | ||||||||||||
| 16 | Freddie Mac, Pool #QB3287 | 2.50 | 8/1/50 | 13 | ||||||||||||
| 12 | Freddie Mac, Pool #G18485 | 2.50 | 10/1/28 | 11 | ||||||||||||
| 12 | Freddie Mac, Pool #G18470 | 2.50 | 6/1/28 | 11 | ||||||||||||
| 22 | Freddie Mac, Pool #QC7457 | 2.50 | 9/1/51 | 18 | ||||||||||||
| 11 | Freddie Mac, Pool #RB5054 | 2.50 | 6/1/40 | 10 | ||||||||||||
| 13 | Freddie Mac, Pool #RA2595 | 2.50 | 5/1/50 | 11 | ||||||||||||
| 32 | Freddie Mac, Pool #RA2643 | 2.50 | 6/1/50 | 27 | ||||||||||||
| 6 | Freddie Mac, Pool #G18687 | 2.50 | 5/1/33 | 5 | ||||||||||||
| 17 | Freddie Mac, Pool #RA4527 | 2.50 | 2/1/51 | 14 | ||||||||||||
| 24 | Freddie Mac, Pool #QE2352 | 2.50 | 5/1/52 | 20 | ||||||||||||
| 46 | Freddie Mac, Pool #SD8194 | 2.50 | 2/1/52 | 39 | ||||||||||||
| 21 | Freddie Mac, Pool #SD8021 | 2.50 | 9/1/49 | 18 | ||||||||||||
| 20 | Freddie Mac, Pool #RA5286 | 2.50 | 5/1/51 | 17 | ||||||||||||
| 22 | Freddie Mac, Pool #RA5802 | 2.50 | 9/1/51 | 19 | ||||||||||||
| 23 | Freddie Mac, Pool #RA6621 | 2.50 | 1/1/52 | 19 | ||||||||||||
| 42 | Freddie Mac, Pool #RA5832 | 2.50 | 9/1/51 | 36 | ||||||||||||
| 46 | Freddie Mac, Pool #SD1011 | 2.50 | 4/1/52 | 39 | ||||||||||||
| 22 | Freddie Mac, Pool #RA6019 | 2.50 | 10/1/51 | 19 | ||||||||||||
| 23 | Freddie Mac, Pool #RA6136 | 2.50 | 10/1/51 | 20 | ||||||||||||
| 46 | Freddie Mac, Pool #RA6493 | 2.50 | 12/1/51 | 39 | ||||||||||||
| 22 | Freddie Mac, Pool #RA6815 | 2.50 | 2/1/52 | 19 | ||||||||||||
| 23 | Freddie Mac, Pool #SD8205 | 2.50 | 4/1/52 | 20 | ||||||||||||
| 12 | Freddie Mac, Pool #SD8030 | 3.00 | 12/1/49 | 11 | ||||||||||||
| 35 | Freddie Mac, Pool #ZS4522 | 3.00 | 7/1/43 | 31 | ||||||||||||
| 17 | Freddie Mac, Pool #G60989 | 3.00 | 12/1/46 | 15 | ||||||||||||
| 5 | Freddie Mac, Pool #QA1033 | 3.00 | 7/1/49 | 4 | ||||||||||||
| 6 | Freddie Mac, Pool #ZS4688 | 3.00 | 11/1/46 | 5 | ||||||||||||
| 8 | Freddie Mac, Pool #SB8046 | 3.00 | 5/1/35 | 7 | ||||||||||||
| 40 | Freddie Mac, Pool #SD8174 | 3.00 | 10/1/51 | 35 | ||||||||||||
| 24 | Freddie Mac, Pool #ZS4511 | 3.00 | 3/1/43 | 22 | ||||||||||||
| 14 | Freddie Mac, Pool #ZA2304 | 3.00 | 6/1/33 | 14 | ||||||||||||
| 13 | Freddie Mac, Pool #QB1382 | 3.00 | 7/1/50 | 12 | ||||||||||||
| 10 | Freddie Mac, Pool #QA9049 | 3.00 | 4/1/50 | 9 | ||||||||||||
| 7 | Freddie Mac, Pool #G61680 | 3.00 | 4/1/47 | 6 | ||||||||||||
| 8 | Freddie Mac, Pool #QA8065 | 3.00 | 3/1/50 | 8 | ||||||||||||
| 6 | Freddie Mac, Pool #J36428 | 3.00 | 2/1/32 | 6 | ||||||||||||
| 23 | Freddie Mac, Pool #QD9881 | 3.00 | 3/1/52 | 20 | ||||||||||||
| 9 | Freddie Mac, Pool #SD8074 | 3.00 | 7/1/50 | 8 | ||||||||||||
| 11 | Freddie Mac, Pool #G18663 | 3.00 | 10/1/32 | 10 | ||||||||||||
| 14 | Freddie Mac, Pool #ZS4706 | 3.00 | 3/1/47 | 13 | ||||||||||||
| 12 | Freddie Mac, Pool #G08737 | 3.00 | 12/1/46 | 11 | ||||||||||||
| 8 | Freddie Mac, Pool #G15145 | 3.00 | 7/1/29 | 8 | ||||||||||||
| 3 | Freddie Mac, Pool #G18518 | 3.00 | 7/1/29 | 3 | ||||||||||||
See accompanying notes to financial statements.
183
HC CAPITAL TRUST
The Core Fixed Income Portfolio
Portfolio of Investments (continued) — June 30, 2023
Principal | Security Description | Rate % | Maturity | Value | ||||||||||||
U.S. Government Agency Mortgages (continued) | ||||||||||||||||
| $ | 16 | Freddie Mac, Pool #ZS4606 | 3.00 | 3/1/45 | $ | 14 | ||||||||||
| 5 | Freddie Mac, Pool #G18601 | 3.00 | 5/1/31 | 4 | ||||||||||||
| 5 | Freddie Mac, Pool #G08635 | 3.00 | 4/1/45 | 4 | ||||||||||||
| — | Freddie Mac, Pool #J25193 | 3.00 | 8/1/23 | — | ||||||||||||
| 7 | Freddie Mac, Pool #SD8056 | 3.00 | 4/1/50 | 6 | ||||||||||||
| 11 | Freddie Mac, Pool #ZS4658 | 3.00 | 4/1/46 | 9 | ||||||||||||
| 7 | Freddie Mac, Pool #ZM2089 | 3.00 | 11/1/46 | 6 | ||||||||||||
| 5 | Freddie Mac, Pool #G08803 | 3.00 | 3/1/48 | 5 | ||||||||||||
| 8 | Freddie Mac, Pool #G08698 | 3.50 | 3/1/46 | 7 | ||||||||||||
| 2 | Freddie Mac, Pool #J14069 | 3.50 | 1/1/26 | 2 | ||||||||||||
| 16 | Freddie Mac, Pool #G08636 | 3.50 | 4/1/45 | 15 | ||||||||||||
| 3 | Freddie Mac, Pool #Q57871 | 3.50 | 8/1/48 | 3 | ||||||||||||
| 8 | Freddie Mac, Pool #G08687 | 3.50 | 1/1/46 | 7 | ||||||||||||
| 6 | Freddie Mac, Pool #J30284 | 3.50 | 11/1/29 | 6 | ||||||||||||
| 4 | Freddie Mac, Pool #ZS4713 | 3.50 | 4/1/47 | 4 | ||||||||||||
| 6 | Freddie Mac, Pool #SD8011 | 3.50 | 9/1/49 | 6 | ||||||||||||
| 9 | Freddie Mac, Pool #RA2469 | 3.50 | 4/1/50 | 8 | ||||||||||||
| 24 | Freddie Mac, Pool #SD8038 | 3.50 | 1/1/50 | 22 | ||||||||||||
| 5 | Freddie Mac, Pool #V83453 | 3.50 | 10/1/47 | 5 | ||||||||||||
| 4 | Freddie Mac, Pool #G08770 | 3.50 | 7/1/47 | 3 | ||||||||||||
| 7 | Freddie Mac, Pool #G08761 | 3.50 | 5/1/47 | 6 | ||||||||||||
| 5 | Freddie Mac, Pool #G08620 | 3.50 | 12/1/44 | 5 | ||||||||||||
| 7 | Freddie Mac, Pool #G08784 | 3.50 | 10/1/47 | 6 | ||||||||||||
| 23 | Freddie Mac, Pool #SD8214 | 3.50 | 5/1/52 | 21 | ||||||||||||
| 4 | Freddie Mac, Pool #ZA5052 | 3.50 | 11/1/47 | 4 | ||||||||||||
| 8 | Freddie Mac, Pool #SB8007 | 3.50 | 9/1/34 | 7 | ||||||||||||
| 8 | Freddie Mac, Pool #RA1508 | 3.50 | 10/1/49 | 8 | ||||||||||||
| 4 | Freddie Mac, Pool #ZS4599 | 3.50 | 1/1/45 | 4 | ||||||||||||
| 14 | Freddie Mac, Pool #ZS4642 | 3.50 | 12/1/45 | 13 | ||||||||||||
| 8 | Freddie Mac, Pool #G61148 | 3.50 | 9/1/47 | 7 | ||||||||||||
| 4 | Freddie Mac, Pool #G08627 | 3.50 | 2/1/45 | 3 | ||||||||||||
| 4 | Freddie Mac, Pool #SD8001 | 3.50 | 7/1/49 | 3 | ||||||||||||
| 17 | Freddie Mac, Pool #G08554 | 3.50 | 10/1/43 | 16 | ||||||||||||
| 3 | Freddie Mac, Pool #ZS4771 | 3.50 | 6/1/48 | 3 | ||||||||||||
| 7 | Freddie Mac, Pool #ZS4651 | 3.50 | 3/1/46 | 6 | ||||||||||||
| 12 | Freddie Mac, Pool #ZS4618 | 3.50 | 6/1/45 | 11 | ||||||||||||
| 4 | Freddie Mac, Pool #ZS4659 | 3.50 | 4/1/46 | 3 | ||||||||||||
| 6 | Freddie Mac, Pool #Q43933 | 3.50 | 10/1/46 | 5 | ||||||||||||
| 7 | Freddie Mac, Pool #ZA4988 | 4.00 | 8/1/47 | 7 | ||||||||||||
| 4 | Freddie Mac, Pool #G08801 | 4.00 | 2/1/48 | 4 | ||||||||||||
| 7 | Freddie Mac, Pool #ZS4708 | 4.00 | 3/1/47 | 6 | ||||||||||||
| 48 | Freddie Mac, Pool #SD8244 | 4.00 | 9/1/52 | 45 | ||||||||||||
| 10 | Freddie Mac, Pool #A96286 | 4.00 | 1/1/41 | 9 | ||||||||||||
| 3 | Freddie Mac, Pool #ZT1840 | 4.00 | 9/1/48 | 3 | ||||||||||||
| 5 | Freddie Mac, Pool #ZT1320 | 4.00 | 11/1/48 | 5 | ||||||||||||
| 6 | Freddie Mac, Pool #C91395 | 4.00 | 9/1/31 | 5 | ||||||||||||
| 49 | Freddie Mac, Pool #SD8286 | 4.00 | 1/1/53 | 46 | ||||||||||||
| 7 | Freddie Mac, Pool #G08775 | 4.00 | 8/1/47 | 7 | ||||||||||||
See accompanying notes to financial statements.
184
HC CAPITAL TRUST
The Core Fixed Income Portfolio
Portfolio of Investments (continued) — June 30, 2023
Principal | Security Description | Rate % | Maturity | Value | ||||||||||||
U.S. Government Agency Mortgages (continued) | ||||||||||||||||
| $ | 4 | Freddie Mac, Pool #G08771 | 4.00 | 7/1/47 | $ | 4 | ||||||||||
| 5 | Freddie Mac, Pool #SD0290 | 4.00 | 4/1/50 | 5 | ||||||||||||
| 24 | Freddie Mac, Pool #QE5462 | 4.00 | 7/1/52 | 23 | ||||||||||||
| 9 | Freddie Mac, Pool #G08567 | 4.00 | 1/1/44 | 9 | ||||||||||||
| 15 | Freddie Mac, Pool #ZL7781 | 4.00 | 2/1/44 | 14 | ||||||||||||
| 10 | Freddie Mac, Pool #G08606 | 4.00 | 9/1/44 | 10 | ||||||||||||
| 3 | Freddie Mac, Pool #ZA6946 | 4.00 | 5/1/49 | 2 | ||||||||||||
| 7 | Freddie Mac, Pool #Q58680 | 4.00 | 9/1/48 | 7 | ||||||||||||
| 8 | Freddie Mac, Pool #SD8070 | 4.00 | 6/1/50 | 7 | ||||||||||||
| 13 | Freddie Mac, Pool #G08637 | 4.00 | 4/1/45 | 12 | ||||||||||||
| 8 | Freddie Mac, Pool #ZS4631 | 4.00 | 9/1/45 | 8 | ||||||||||||
| 3 | Freddie Mac, Pool #ZT2106 | 4.00 | 3/1/49 | 3 | ||||||||||||
| 49 | Freddie Mac, Pool #SD8306 | 4.50 | 3/1/53 | 47 | ||||||||||||
| 4 | Freddie Mac, Pool #G08781 | 4.50 | 9/1/47 | 4 | ||||||||||||
| 24 | Freddie Mac, Pool #SD8266 | 4.50 | 11/1/52 | 23 | ||||||||||||
| 4 | Freddie Mac, Pool #C09059 | 4.50 | 3/1/44 | 4 | ||||||||||||
| 24 | Freddie Mac, Pool #SD8245 | 4.50 | 9/1/52 | 23 | ||||||||||||
| 13 | Freddie Mac, Pool #G01890 | 4.50 | 10/1/35 | 13 | ||||||||||||
| 5 | Freddie Mac, Pool #Q58217 | 4.50 | 9/1/48 | 5 | ||||||||||||
| 5 | Freddie Mac, Pool #Q52321 | 4.50 | 11/1/47 | 5 | ||||||||||||
| 3 | Freddie Mac, Pool #ZS4774 | 4.50 | 5/1/48 | 3 | ||||||||||||
| 17 | Freddie Mac, Pool #A97692 | 4.50 | 3/1/41 | 17 | ||||||||||||
| 3 | Freddie Mac, Pool #G08838 | 5.00 | 9/1/48 | 3 | ||||||||||||
| 7 | Freddie Mac, Pool #ZT1779 | 5.00 | 3/1/49 | 7 | ||||||||||||
| 24 | Freddie Mac, Pool #SD8288 | 5.00 | 1/1/53 | 24 | ||||||||||||
| 8 | Freddie Mac, Pool #G04817 | 5.00 | 9/1/38 | 9 | ||||||||||||
| 9 | Freddie Mac, Pool #G01962 | 5.00 | 12/1/35 | 9 | ||||||||||||
| 50 | Freddie Mac, Pool #SD8341 | 5.00 | 7/1/53 | 49 | ||||||||||||
| 9 | Freddie Mac, Pool #G05904 | 5.00 | 9/1/39 | 10 | ||||||||||||
| 14 | Freddie Mac, Pool #G01665 | 5.50 | 3/1/34 | 14 | ||||||||||||
| 24 | Freddie Mac, Pool #SD8300 | 5.50 | 2/1/53 | 24 | ||||||||||||
| 10 | Freddie Mac, Pool #G02794 | 6.00 | 5/1/37 | 10 | ||||||||||||
| 1 | Freddie Mac, Pool #C90989 | 6.00 | 9/1/26 | 1 | ||||||||||||
| 20 | Government National Mortgage Association, Pool #MA7366 | 2.00 | 5/20/51 | 17 | ||||||||||||
| 21 | Government National Mortgage Association, Pool #MA6994 | 2.00 | 11/20/50 | 18 | ||||||||||||
| 23 | Government National Mortgage Association, Pool #MA7880 | 2.00 | 2/20/52 | 19 | ||||||||||||
| 18 | Government National Mortgage Association, Pool #MA7135 | 2.00 | 1/20/51 | 15 | ||||||||||||
| 41 | Government National Mortgage Association, Pool #MA7471 | 2.00 | 7/20/51 | 35 | ||||||||||||
| 34 | Government National Mortgage Association, Pool #MA6930 | 2.00 | 10/20/50 | 29 | ||||||||||||
| 21 | Government National Mortgage Association, Pool #MA7588 | 2.00 | 9/20/51 | 18 | ||||||||||||
| 33 | Government National Mortgage Association, Pool #MA6864 | 2.00 | 9/20/50 | 28 | ||||||||||||
| 44 | Government National Mortgage Association, Pool #MA7704 | 2.00 | 11/20/51 | 37 | ||||||||||||
| 38 | Government National Mortgage Association, Pool #MA7254 | 2.00 | 3/20/51 | 32 | ||||||||||||
| 18 | Government National Mortgage Association, Pool #MA7051 | 2.00 | 12/20/50 | 15 | ||||||||||||
| 23 | Government National Mortgage Association, Pool #MA8041 | 2.00 | 5/20/52 | 20 | ||||||||||||
| 23 | Government National Mortgage Association, Pool #MA7986 | 2.00 | 4/20/52 | 20 | ||||||||||||
| 23 | Government National Mortgage Association, Pool #MA7826 | 2.00 | 1/20/52 | 19 | ||||||||||||
| 22 | Government National Mortgage Association, Pool #MA7766 | 2.00 | 12/20/51 | 19 | ||||||||||||
See accompanying notes to financial statements.
185
HC CAPITAL TRUST
The Core Fixed Income Portfolio
Portfolio of Investments (continued) — June 30, 2023
Principal | Security Description | Rate % | Maturity | Value | ||||||||||||
U.S. Government Agency Mortgages (continued) | ||||||||||||||||
| $ | 23 | Government National Mortgage Association, Pool #MA7935 | 2.00 | 3/20/52 | $ | 19 | ||||||||||
| 20 | Government National Mortgage Association, Pool #MA7417 | 2.00 | 6/20/51 | 17 | ||||||||||||
| 19 | Government National Mortgage Association, Pool #MA7311 | 2.00 | 4/20/51 | 16 | ||||||||||||
| 21 | Government National Mortgage Association, Pool #MA7589 | 2.50 | 9/20/51 | 18 | ||||||||||||
| 44 | Government National Mortgage Association, Pool #MA6709 | 2.50 | 6/20/50 | 38 | ||||||||||||
| 19 | Government National Mortgage Association, Pool #MA7136 | 2.50 | 1/20/51 | 16 | ||||||||||||
| 43 | Government National Mortgage Association, Pool #MA7649 | 2.50 | 10/20/51 | 38 | ||||||||||||
| 20 | Government National Mortgage Association, Pool #MA7418 | 2.50 | 6/20/51 | 17 | ||||||||||||
| 6 | Government National Mortgage Association, Pool #MA4355 | 2.50 | 4/20/32 | 5 | ||||||||||||
| 41 | Government National Mortgage Association, Pool #MA7472 | 2.50 | 7/20/51 | 36 | ||||||||||||
| 33 | Government National Mortgage Association, Pool #MA7193 | 2.50 | 2/20/51 | 28 | ||||||||||||
| 10 | Government National Mortgage Association, Pool #MA6655 | 2.50 | 5/20/50 | 9 | ||||||||||||
| 18 | Government National Mortgage Association, Pool #MA7312 | 2.50 | 4/20/51 | 16 | ||||||||||||
| 7 | Government National Mortgage Association, Pool #MA6540 | 2.50 | 3/20/50 | 6 | ||||||||||||
| 14 | Government National Mortgage Association, Pool #MA6931 | 2.50 | 10/20/50 | 12 | ||||||||||||
| 14 | Government National Mortgage Association, Pool #MA6995 | 2.50 | 11/20/50 | 12 | ||||||||||||
| 23 | Government National Mortgage Association, Pool #MA8042 | 2.50 | 5/20/52 | 20 | ||||||||||||
| 35 | Government National Mortgage Association, Pool #MA6865 | 2.50 | 9/20/50 | 31 | ||||||||||||
| 44 | Government National Mortgage Association, Pool #MA7767 | 2.50 | 12/20/51 | 38 | ||||||||||||
| 4 | Government National Mortgage Association, Pool #MA1155 | 2.50 | 7/20/43 | 4 | ||||||||||||
| 42 | Government National Mortgage Association, Pool #MA7534 | 2.50 | 8/20/51 | 36 | ||||||||||||
| 35 | Government National Mortgage Association, Pool #MA7255 | 2.50 | 3/20/51 | 30 | ||||||||||||
| 2 | Government National Mortgage Association, Pool #AA8341 | 2.50 | 2/15/28 | 2 | ||||||||||||
| 23 | Government National Mortgage Association, Pool #MA7936 | 2.50 | 3/20/52 | 20 | ||||||||||||
| 25 | Government National Mortgage Association, Pool #MA6819 | 2.50 | 8/20/50 | 22 | ||||||||||||
| 22 | Government National Mortgage Association, Pool #MA7828 | 3.00 | 1/20/52 | 20 | ||||||||||||
| 15 | Government National Mortgage Association, Pool #MA0851 | 3.00 | 3/20/43 | 13 | ||||||||||||
| 10 | Government National Mortgage Association, Pool #MA4320 | 3.00 | 3/20/47 | 9 | ||||||||||||
| 13 | Government National Mortgage Association, Pool #MA5018 | 3.00 | 2/20/48 | 12 | ||||||||||||
| 6 | Government National Mortgage Association, Pool #MA6089 | 3.00 | 8/20/49 | 5 | ||||||||||||
| 6 | Government National Mortgage Association, Pool #MA6283 | 3.00 | 11/20/49 | 5 | ||||||||||||
| 24 | Government National Mortgage Association, Pool #MA8098 | 3.00 | 6/20/52 | 21 | ||||||||||||
| 11 | Government National Mortgage Association, Pool #MA3375 | 3.00 | 1/20/46 | 10 | ||||||||||||
| 11 | Government National Mortgage Association, Pool #MA2520 | 3.00 | 1/20/45 | 10 | ||||||||||||
| 4 | Government National Mortgage Association, Pool #MA5815 | 3.00 | 3/20/49 | 4 | ||||||||||||
| 7 | Government National Mortgage Association, Pool #MA3243 | 3.00 | 11/20/45 | 7 | ||||||||||||
| 12 | Government National Mortgage Association, Pool #MA6474 | 3.00 | 2/20/50 | 11 | ||||||||||||
| 10 | Government National Mortgage Association, Pool #MA6820 | 3.00 | 8/20/50 | 9 | ||||||||||||
| 8 | Government National Mortgage Association, Pool #MA4195 | 3.00 | 1/20/47 | 7 | ||||||||||||
| 10 | Government National Mortgage Association, Pool #MA3735 | 3.00 | 6/20/46 | 9 | ||||||||||||
| 4 | Government National Mortgage Association, Pool #MA3596 | 3.00 | 4/20/46 | 3 | ||||||||||||
| 13 | Government National Mortgage Association, Pool #MA4003 | 3.00 | 10/20/46 | 11 | ||||||||||||
| 8 | Government National Mortgage Association, Pool #MA6599 | 3.00 | 4/20/50 | 7 | ||||||||||||
| 17 | Government National Mortgage Association, Pool #MA6656 | 3.00 | 5/20/50 | 15 | ||||||||||||
| 6 | Government National Mortgage Association, Pool #MA4068 | 3.00 | 11/20/46 | 5 | ||||||||||||
| 9 | Government National Mortgage Association, Pool #MA6710 | 3.00 | 6/20/50 | 8 | ||||||||||||
| 5 | Government National Mortgage Association, Pool #MA4261 | 3.00 | 2/20/47 | 5 | ||||||||||||
| 8 | Government National Mortgage Association, Pool #MA4836 | 3.00 | 11/20/47 | 7 | ||||||||||||
See accompanying notes to financial statements.
186
HC CAPITAL TRUST
The Core Fixed Income Portfolio
Portfolio of Investments (continued) — June 30, 2023
Principal | Security Description | Rate % | Maturity | Value | ||||||||||||
U.S. Government Agency Mortgages (continued) | ||||||||||||||||
| $ | 19 | Government National Mortgage Association, Pool #MA6766 | 3.00 | 7/20/50 | $ | 17 | ||||||||||
| 8 | Government National Mortgage Association, Pool #MA3662 | 3.00 | 5/20/46 | 7 | ||||||||||||
| 8 | Government National Mortgage Association, Pool #MA3802 | 3.00 | 7/20/46 | 7 | ||||||||||||
| 9 | Government National Mortgage Association, Pool #MA3936 | 3.00 | 9/20/46 | 8 | ||||||||||||
| 15 | Government National Mortgage Association, Pool #MA4899 | 3.00 | 12/20/47 | 13 | ||||||||||||
| 15 | Government National Mortgage Association, Pool #MA1011 | 3.00 | 5/20/43 | 13 | ||||||||||||
| 6 | Government National Mortgage Association, Pool #MA6338 | 3.00 | 12/20/49 | 5 | ||||||||||||
| 6 | Government National Mortgage Association, Pool #MA6409 | 3.00 | 1/20/50 | 6 | ||||||||||||
| 5 | Government National Mortgage Association, Pool #MA0205 | 3.00 | 7/20/27 | 5 | ||||||||||||
| 5 | Government National Mortgage Association, Pool #MA3873 | 3.00 | 8/20/46 | 5 | ||||||||||||
| 8 | Government National Mortgage Association, Pool #MA2960 | 3.00 | 7/20/45 | 7 | ||||||||||||
| 7 | Government National Mortgage Association, Pool #MA4126 | 3.00 | 12/20/46 | 6 | ||||||||||||
| 8 | Government National Mortgage Association, Pool #AA5897 | 3.00 | 12/15/42 | 7 | ||||||||||||
| 22 | Government National Mortgage Association, Pool #MA6218 | 3.00 | 10/20/49 | 20 | ||||||||||||
| 8 | Government National Mortgage Association, Pool #MA4510 | 3.50 | 6/20/47 | 8 | ||||||||||||
| 4 | Government National Mortgage Association, Pool #MA6339 | 3.50 | 12/20/49 | 4 | ||||||||||||
| 7 | Government National Mortgage Association, Pool #MA5875 | 3.50 | 4/20/49 | 6 | ||||||||||||
| 4 | Government National Mortgage Association, Pool #MA4837 | 3.50 | 11/20/47 | 4 | ||||||||||||
| 4 | Government National Mortgage Association, Pool #MA4778 | 3.50 | 10/20/47 | 4 | ||||||||||||
| 9 | Government National Mortgage Association, Pool #MA4127 | 3.50 | 12/20/46 | 9 | ||||||||||||
| 8 | Government National Mortgage Association, Pool #MA4004 | 3.50 | 10/20/46 | 8 | ||||||||||||
| 8 | Government National Mortgage Association, Pool #MA4382 | 3.50 | 4/20/47 | 7 | ||||||||||||
| 5 | Government National Mortgage Association, Pool #MA3244 | 3.50 | 11/20/45 | 5 | ||||||||||||
| 5 | Government National Mortgage Association, Pool #MA2826 | 3.50 | 5/20/45 | 5 | ||||||||||||
| 6 | Government National Mortgage Association, Pool #MA5019 | 3.50 | 2/20/48 | 5 | ||||||||||||
| 7 | Government National Mortgage Association, Pool #MA3736 | 3.50 | 6/20/46 | 7 | ||||||||||||
| 8 | Government National Mortgage Association, Pool #MA2371 | 3.50 | 11/20/44 | 7 | ||||||||||||
| 8 | Government National Mortgage Association, Pool #MA4321 | 3.50 | 3/20/47 | 7 | ||||||||||||
| 3 | Government National Mortgage Association, Pool #MA5762 | 3.50 | 2/20/49 | 3 | ||||||||||||
| 7 | Government National Mortgage Association, Pool #MA3376 | 3.50 | 1/20/46 | 7 | ||||||||||||
| 5 | Government National Mortgage Association, Pool #MA5191 | 3.50 | 5/20/48 | 5 | ||||||||||||
| 4 | Government National Mortgage Association, Pool #MA3454 | 3.50 | 2/20/46 | 3 | ||||||||||||
| 4 | Government National Mortgage Association, Pool #MA6219 | 3.50 | 10/20/49 | 4 | ||||||||||||
| 17 | Government National Mortgage Association, Pool #MA1157 | 3.50 | 7/20/43 | 16 | ||||||||||||
| 6 | Government National Mortgage Association, Pool #MA2961 | 3.50 | 7/20/45 | 6 | ||||||||||||
| 24 | Government National Mortgage Association, Pool #MA8199 | 3.50 | 8/20/52 | 22 | ||||||||||||
| 7 | Government National Mortgage Association, Pool #MA3597 | 3.50 | 4/20/46 | 7 | ||||||||||||
| 4 | Government National Mortgage Association, Pool #AB9211 | 3.50 | 11/15/42 | 3 | ||||||||||||
| 10 | Government National Mortgage Association, Pool #MA3173 | 3.50 | 10/20/45 | 9 | ||||||||||||
| 5 | Government National Mortgage Association, Pool #AC3938 | 3.50 | 1/15/43 | 4 | ||||||||||||
| 14 | Government National Mortgage Association, Pool #MA0699 | 3.50 | 1/20/43 | 14 | ||||||||||||
| 7 | Government National Mortgage Association, Pool #MA3310 | 3.50 | 12/20/45 | 7 | ||||||||||||
| 7 | Government National Mortgage Association, Pool #MA4586 | 3.50 | 7/20/47 | 7 | ||||||||||||
| 4 | Government National Mortgage Association, Pool #MA1574 | 3.50 | 1/20/29 | 4 | ||||||||||||
| 8 | Government National Mortgage Association, Pool #MA3874 | 3.50 | 8/20/46 | 7 | ||||||||||||
| 7 | Government National Mortgage Association, Pool #MA3803 | 3.50 | 7/20/46 | 7 | ||||||||||||
| 8 | Government National Mortgage Association, Pool #MA4652 | 3.50 | 8/20/47 | 8 | ||||||||||||
| 7 | Government National Mortgage Association, Pool #MA3105 | 3.50 | 9/20/45 | 7 | ||||||||||||
See accompanying notes to financial statements.
187
HC CAPITAL TRUST
The Core Fixed Income Portfolio
Portfolio of Investments (continued) — June 30, 2023
Principal | Security Description | Rate % | Maturity | Value | ||||||||||||
U.S. Government Agency Mortgages (continued) | ||||||||||||||||
| $ | 8 | Government National Mortgage Association, Pool #MA2223 | 3.50 | 9/20/44 | $ | 7 | ||||||||||
| 8 | Government National Mortgage Association, Pool #MA6091 | 4.00 | 8/20/49 | 8 | ||||||||||||
| 3 | Government National Mortgage Association, Pool #MA5986 | 4.00 | 6/20/49 | 3 | ||||||||||||
| 7 | Government National Mortgage Association, Pool #MA6040 | 4.00 | 7/20/49 | 6 | ||||||||||||
| 3 | Government National Mortgage Association, Pool #MA4322 | 4.00 | 3/20/47 | 3 | ||||||||||||
| 5 | Government National Mortgage Association, Pool #MA3522 | 4.00 | 3/20/46 | 4 | ||||||||||||
| 4 | Government National Mortgage Association, Pool #MA4653 | 4.00 | 8/20/47 | 3 | ||||||||||||
| 27 | Government National Mortgage Association, Pool #MA1091 | 4.00 | 6/20/43 | 26 | ||||||||||||
| 3 | Government National Mortgage Association, Pool #MA5466 | 4.00 | 9/20/48 | 3 | ||||||||||||
| 7 | Government National Mortgage Association, Pool #MA4511 | 4.00 | 6/20/47 | 6 | ||||||||||||
| 3 | Government National Mortgage Association, Pool #MA5710 | 4.00 | 1/20/49 | 3 | ||||||||||||
| 3 | Government National Mortgage Association, Pool #MA5595 | 4.00 | 11/20/48 | 3 | ||||||||||||
| 3 | Government National Mortgage Association, Pool #MA5876 | 4.00 | 4/20/49 | 3 | ||||||||||||
| 3 | Government National Mortgage Association, Pool #MA5651 | 4.00 | 12/20/48 | 3 | ||||||||||||
| 3 | Government National Mortgage Association, Pool #MA3245 | 4.00 | 11/20/45 | 3 | ||||||||||||
| 10 | Government National Mortgage Association, Pool #MA3737 | 4.00 | 6/20/46 | 9 | ||||||||||||
| 3 | Government National Mortgage Association, Pool #MA4263 | 4.00 | 2/20/47 | 3 | ||||||||||||
| 6 | Government National Mortgage Association, Pool #MA1996 | 4.00 | 6/20/44 | 6 | ||||||||||||
| 24 | Government National Mortgage Association, Pool #MA8200 | 4.00 | 8/20/52 | 23 | ||||||||||||
| 3 | Government National Mortgage Association, Pool #MA3377 | 4.00 | 1/20/46 | 3 | ||||||||||||
| 25 | Government National Mortgage Association, Pool #MA8877 | 4.50 | 5/20/53 | 24 | ||||||||||||
| 5 | Government National Mortgage Association, Pool #MA5399 | 4.50 | 8/20/48 | 5 | ||||||||||||
| 5 | Government National Mortgage Association, Pool #MA5764 | 4.50 | 2/20/49 | 5 | ||||||||||||
| 3 | Government National Mortgage Association, Pool #MA5193 | 4.50 | 5/20/48 | 2 | ||||||||||||
| 24 | Government National Mortgage Association, Pool #4801 | 4.50 | 9/20/40 | 24 | ||||||||||||
| 7 | Government National Mortgage Association, Pool #MA2756 | 4.50 | 4/20/45 | 7 | ||||||||||||
| 2 | Government National Mortgage Association, Pool #MA5818 | 4.50 | 3/20/49 | 2 | ||||||||||||
| 2 | Government National Mortgage Association, Pool #MA5596 | 4.50 | 11/20/48 | 2 | ||||||||||||
| 15 | Government National Mortgage Association, Pool #721760 | 4.50 | 8/15/40 | 14 | ||||||||||||
| 3 | Government National Mortgage Association, Pool #MA4721 | 4.50 | 9/20/47 | 3 | ||||||||||||
| 3 | Government National Mortgage Association, Pool #MA1762 | 4.50 | 3/20/44 | 3 | ||||||||||||
| 5 | Government National Mortgage Association, Pool #MA2373 | 4.50 | 11/20/44 | 5 | ||||||||||||
| 8 | Government National Mortgage Association, Pool #MA5987 | 4.50 | 6/20/49 | 8 | ||||||||||||
| 2 | Government National Mortgage Association, Pool #MA5653 | 5.00 | 12/20/48 | 2 | ||||||||||||
| 15 | Government National Mortgage Association, Pool #4559 | 5.00 | 10/20/39 | 15 | ||||||||||||
| 2 | Government National Mortgage Association, Pool #MA5530 | 5.00 | 10/20/48 | 2 | ||||||||||||
| 11 | Government National Mortgage Association, Pool #697946 | 5.00 | 3/15/39 | 12 | ||||||||||||
| 3 | Government National Mortgage Association, Pool #MA5988 | 5.00 | 6/20/49 | 3 | ||||||||||||
| 3 | Government National Mortgage Association, Pool #MA5933 | 5.00 | 5/20/49 | 3 | ||||||||||||
| 25 | Government National Mortgage Association, 30 YR TBA | 2.00 | 7/20/53 | 21 | ||||||||||||
| 50 | Government National Mortgage Association, 30 YR TBA | 3.50 | 7/20/53 | 46 | ||||||||||||
| 50 | Government National Mortgage Association, 30 YR TBA | 4.00 | 7/20/53 | 47 | ||||||||||||
| 25 | Government National Mortgage Association, 30 YR TBA | 4.50 | 8/1/53 | 24 | ||||||||||||
| 25 | Government National Mortgage Association, 30 YR TBA | 4.50 | 7/20/53 | 24 | ||||||||||||
| 75 | Government National Mortgage Association, 30 YR TBA | 5.00 | 7/20/53 | 75 | ||||||||||||
| 50 | Government National Mortgage Association, 30 YR TBA | 5.50 | 7/20/53 | 50 | ||||||||||||
| 50 | Government National Mortgage Association, 30 YR TBA | 6.00 | 7/20/53 | 51 | ||||||||||||
Total U.S. Government Agency Mortgages | 9,128 | |||||||||||||||
See accompanying notes to financial statements.
188
HC CAPITAL TRUST
The Core Fixed Income Portfolio
Portfolio of Investments (continued) — June 30, 2023
Principal | Security Description | Rate % | Maturity | Value | ||||||||||||
U.S. Government Agency Securities — 0.78% | ||||||||||||||||
| $ | 25 | Fannie Mae | 0.50 | 6/17/25 | $ | 23 | ||||||||||
| 25 | Fannie Mae | 0.75 | 10/8/27 | 22 | ||||||||||||
| 25 | Fannie Mae, Callable 9/18/23 @ 100.00 | 0.88 | 12/18/26 | 22 | ||||||||||||
| 25 | Fannie Mae | 1.63 | 1/7/25 | 24 | ||||||||||||
| 10 | Fannie Mae | 5.63 | 7/15/37 | 12 | ||||||||||||
| 20 | Fannie Mae | 6.63 | 11/15/30 | 23 | ||||||||||||
| 25 | Fannie Mae | 7.25 | 5/15/30 | 30 | ||||||||||||
| 75 | Federal Farm Credit Bank | 0.88 | 11/18/24 | 70 | ||||||||||||
| 25 | Federal Farm Credit Bank | 3.38 | 8/26/24 | 24 | ||||||||||||
| 25 | Federal Farm Credit Bank | 4.25 | 9/26/24 | 25 | ||||||||||||
| 25 | Federal Home Loan Bank | 2.75 | 6/28/24 | 24 | ||||||||||||
| 40 | Federal Home Loan Bank | 2.75 | 12/13/24 | 39 | ||||||||||||
| 40 | Federal Home Loan Bank | 2.88 | 9/13/24 | 38 | ||||||||||||
| 25 | Federal Home Loan Bank | 3.25 | 11/16/28 | 24 | ||||||||||||
| 25 | Federal Home Loan Bank | 5.00 | 2/28/25 | 25 | ||||||||||||
| 50 | Freddie Mac | 0.38 | 7/21/25 | 45 | ||||||||||||
| 15 | Freddie Mac | 6.25 | 7/15/32 | 17 | ||||||||||||
| 10 | Freddie Mac | 6.75 | 3/15/31 | 12 | ||||||||||||
| 5 | Tennessee Valley Authority | 3.50 | 12/15/42 | 4 | ||||||||||||
| 25 | Tennessee Valley Authority | 3.88 | 3/15/28 | 24 | ||||||||||||
| 30 | Tennessee Valley Authority | 5.88 | 4/1/36 | 34 | ||||||||||||
Total U.S. Government Agency Securities | 561 | |||||||||||||||
Corporate Bonds — 15.01% | ||||||||||||||||
| 145 | AbbVie, Inc. (Biotechnology) | 4.40 | 11/6/42 | 130 | ||||||||||||
| 25 | Air Products & Chemicals, Inc. (Chemicals), Callable 11/15/39 @ 100.00 | 2.70 | 5/15/40 | 19 | ||||||||||||
| 80 | Amgen, Inc. (Biotechnology), Callable 8/21/39 @ 100.00 | 3.15 | 2/21/40 | 61 | ||||||||||||
| 155 | Amgen, Inc. (Biotechnology), Callable 6/18/29 @ 100.00 | 4.05 | 8/18/29 | 147 | ||||||||||||
| 220 | Anheuser-Busch InBev Worldwide, Inc. (Beverages) | 4.95 | 1/15/42 | 215 | ||||||||||||
| 140 | Apple, Inc. (Technology Hardware, Storage & Peripherals), Callable 8/23/45 @ 100.00 | 4.65 | 2/23/46 | 138 | ||||||||||||
| 95 | Aptiv PLC/Aptiv Corp. (Automobile Components), Callable 7/18/23 @ 100.00 | 2.40 | 2/18/25 | 90 | ||||||||||||
| 148 | AT&T, Inc. (Diversified Telecommunication Services), Callable 3/15/55 @ 100.00 | 3.55 | 9/15/55 | 104 | ||||||||||||
| 115 | AT&T, Inc. (Diversified Telecommunication Services), Callable 12/1/28 @ 100.00 | 4.35 | 3/1/29 | 110 | ||||||||||||
| 55 | AT&T, Inc. (Diversified Telecommunication Services), Callable 9/9/48 @ 100.00 | 4.55 | 3/9/49 | 47 | ||||||||||||
| 95 | Atmos Energy Corp. (Gas Utilities), Callable 7/15/42 @ 100.00 | 4.15 | 1/15/43 | 81 | ||||||||||||
| 455 | Bank of America Corp. (Banks), Callable 4/22/31 @ 100.00 | 2.69 (SOFR + 132 bps)(b) | 4/22/32 | 377 | ||||||||||||
| 90 | Bank of America Corp., MTN (Banks), Callable 2/7/29 @ 100.00 | 3.97 (TSFR3M + 147 bps)(b) | 2/7/30 | 83 | ||||||||||||
| 95 | Berkshire Hathaway Energy Co. (Multi-Utilities), Callable 8/1/44 @ 100.00 | 4.50 | 2/1/45 | 81 | ||||||||||||
| 25 | BP Capital Markets America, Inc. (Financial Services), Callable 8/24/49 @ 100.00 | 3.00 | 2/24/50 | 17 | ||||||||||||
| 70 | Bristol-Myers Squibb Co. (Pharmaceuticals), Callable 4/26/49 @ 100.00 | 4.25 | 10/26/49 | 62 | ||||||||||||
| 137 | Brown & Brown, Inc. (Insurance), Callable 12/15/30 @ 100.00 | 2.38 | 3/15/31 | 110 | ||||||||||||
| 75 | Bunge Ltd. Finance Corp. (Consumer Staples Distribution & Retail), Callable 2/14/31 @ 100.00 | 2.75 | 5/14/31 | 62 | ||||||||||||
| 125 | Capital One Financial Corp. (Consumer Finance), Callable 2/1/28 @ 100.00 | 5.47 (SOFR + 208 bps)(b) | 2/1/29 | 120 | ||||||||||||
| 190 | Charter Communications Operating LLC/Charter Communications Operating Capital (Media), Callable 12/30/28 @ 100.00 | 5.05 | 3/30/29 | 182 | ||||||||||||
See accompanying notes to financial statements.
189
HC CAPITAL TRUST
The Core Fixed Income Portfolio
Portfolio of Investments (continued) — June 30, 2023
Principal | Security Description | Rate % | Maturity | Value | ||||||||||||
Corporate Bonds (continued) | ||||||||||||||||
| $ | 150 | Citigroup, Inc. (Banks), Callable 3/17/32 @ 100.00 | 3.79 (SOFR + 194 bps)(b) | 3/17/33 | $ | 132 | ||||||||||
| 65 | Citigroup, Inc. (Banks), Callable 4/23/28 @ 100.00 | 4.08 (TSFR3M + 145 bps)(b) | 4/23/29 | 61 | ||||||||||||
| 110 | Citigroup, Inc. (Banks), Callable 3/31/30 @ 100.00 | 4.41 (SOFR + 391 bps)(b) | 3/31/31 | 103 | ||||||||||||
| 155 | Collins Aerospace (Aerospace & Defense), Callable 12/15/26 @ 100.00 | 3.50 | 3/15/27 | 146 | ||||||||||||
| 100 | Comcast Corp. (Media), Callable 5/1/49 @ 100.00 | 4.00 | 11/1/49 | 82 | ||||||||||||
| 25 | Comcast Corp. (Media) | 4.65 | 7/15/42 | 23 | ||||||||||||
| 20 | Consolidated Edison Co. of New York, Inc., Series 2008-B (Multi-Utilities) | 6.75 | 4/1/38 | 22 | ||||||||||||
| 115 | Constellation Brands, Inc. (Beverages), Callable 2/1/30 @ 100.00 | 2.88 | 5/1/30 | 100 | ||||||||||||
| 115 | CSX Corp. (Ground Transportation) | 6.22 | 4/30/40 | 124 | ||||||||||||
| 120 | CVS Health Corp. (Health Care Providers & Services), Callable 9/25/37 @ 100.00 | 4.78 | 3/25/38 | 111 | ||||||||||||
| 60 | CVS Health Corp. (Health Care Providers & Services), Callable 1/20/45 @ 100.00 | 5.13 | 7/20/45 | 55 | ||||||||||||
| 70 | Dell International LLC/EMC Corp. (Technology Hardware, Storage & Peripherals), Callable 8/1/26 @ 100.00 | 4.90 | 10/1/26 | 70 | ||||||||||||
| 93 | Devon Energy Corp. (Oil, Gas & Consumable Fuels), Callable 1/15/41 @ 100.00 | 5.60 | 7/15/41 | 87 | ||||||||||||
| 75 | Digital Realty Trust LP (Specialized REITs), Callable 4/15/28 @ 100.00 | 4.45 | 7/15/28 | 70 | ||||||||||||
| 35 | Duke Energy Carolinas LLC (Electric Utilities), Callable 6/15/41 @ 100.00 | 4.25 | 12/15/41 | 30 | ||||||||||||
| 25 | Duke Energy Progress LLC (Electric Utilities), Callable 2/15/45 @ 100.00 | 4.20 | 8/15/45 | 21 | ||||||||||||
| 225 | Eastern Energy Gas Holdings LLC (Multi-Utilities), Callable 9/15/24 @ 100.00 | 3.60 | 12/15/24 | 217 | ||||||||||||
| 50 | EIDP, Inc. (Chemicals), Callable 2/15/33 @ 100.00 | 4.80 | 5/15/33 | 49 | ||||||||||||
| 40 | Elevance Health, Inc. (Health Care Providers & Services), Callable 2/15/30 @ 100.00 | 2.25 | 5/15/30 | 33 | ||||||||||||
| 60 | Elevance Health, Inc. (Health Care Providers & Services) | 4.65 | 1/15/43 | 54 | ||||||||||||
| 5 | Energy Transfer LP (Oil, Gas & Consumable Fuels), Callable 3/15/28 @ 100.00 | 4.95 | 6/15/28 | 5 | ||||||||||||
| 95 | Energy Transfer LP (Oil, Gas & Consumable Fuels), Callable 7/15/42 @ 100.00 | 4.95 | 1/15/43 | 78 | ||||||||||||
| 139 | Enterprise Products Operating LLC (Oil, Gas & Consumable Fuels), Callable 9/15/43 @ 100.00 | 4.85 | 3/15/44 | 127 | ||||||||||||
| 169 | FedEx Corp. Pass Through Trust, Series 2020-1, Class - AA (Air Freight & Logistics) | 1.88 | 2/20/34 | 138 | ||||||||||||
| 45 | Fiserv, Inc. (Financial Services), Callable 12/2/32 @ 100.00 | 5.60 | 3/2/33 | 46 | ||||||||||||
| 45 | General Motors Co. (Automobiles), Callable 9/1/25 @ 100.00 | 6.13 | 10/1/25 | 45 | ||||||||||||
| 55 | General Motors Financial Co., Inc. (Consumer Finance), Callable 1/26/25 @ 100.00 | 2.90 | 2/26/25 | 52 | ||||||||||||
| 125 | General Motors Financial Co., Inc. (Specialty Retail), Callable 2/6/30 @ 100.00 | 5.85 | 4/6/30 | 124 | ||||||||||||
| 46 | Gilead Sciences, Inc. (Biotechnology), Callable 8/1/44 @ 100.00 | 4.50 | 2/1/45 | 42 | ||||||||||||
| 150 | HCA, Inc. (Health Care Providers & Services) | 5.38 | 2/1/25 | 149 | ||||||||||||
| 35 | HCA, Inc. (Health Care Providers & Services), Callable 3/1/33 @ 100.00 | 5.50 | 6/1/33 | 35 | ||||||||||||
| 40 | Intel Corp. (Semiconductors & Semiconductor Equipment), Callable 6/8/47 @ 100.00 | 3.73 | 12/8/47 | 31 | ||||||||||||
| 100 | Intel Corp. (Semiconductors & Semiconductor Equipment), Callable 11/10/32 @ 100.00 | 5.20 | 2/10/33 | 101 | ||||||||||||
| 50 | International Business Machines Corp. (IT Services) | 4.00 | 6/20/42 | 42 | ||||||||||||
| 40 | International Paper Co. (Containers & Packaging), Callable 5/15/41 @ 100.00 | 6.00 | 11/15/41 | 41 | ||||||||||||
| 115 | JPMorgan Chase & Co. (Banks), Callable 4/22/31 @ 100.00 | 2.58 (TSFR3M + 125 bps)(b) | 4/22/32 | 95 | ||||||||||||
| 500 | JPMorgan Chase & Co. (Banks), Callable 4/23/28 @ 100.00 | 4.01 (TSFR3M + 138 bps)(b) | 4/23/29 | 470 | ||||||||||||
| 100 | Kinder Morgan, Inc. (Oil, Gas & Consumable Fuels), Callable 12/1/44 @ 100.00 | 5.55 | 6/1/45 | 91 | ||||||||||||
| 80 | Lincoln National Corp. (Insurance), Callable 10/15/30 @ 100.00 | 3.40 | 1/15/31 | 67 | ||||||||||||
| 105 | Lincoln National Corp. (Insurance), Callable 12/1/27 @ 100.00 | 3.80 | 3/1/28 | 95 | ||||||||||||
| 20 | LYB International Finance BV (Chemicals), Callable 9/15/43 @ 100.00 | 4.88 | 3/15/44 | 17 | ||||||||||||
| 70 | Martin Marietta Materials, Inc., Series CB (Construction Materials), Callable 12/15/29 @ 100.00 | 2.50 | 3/15/30 | 59 | ||||||||||||
See accompanying notes to financial statements.
190
HC CAPITAL TRUST
The Core Fixed Income Portfolio
Portfolio of Investments (continued) — June 30, 2023
Principal | Security Description | Rate % | Maturity | Value | ||||||||||||
Corporate Bonds (continued) | ||||||||||||||||
| $ | 80 | Marvell Technology, Inc. (Semiconductors & Semiconductor Equipment), Callable 1/15/31 @ 100.00 | 2.95 | 4/15/31 | $ | 67 | ||||||||||
| 190 | Microchip Technology, Inc. (Semiconductors & Semiconductor Equipment), Callable 8/7/23 @ 102.13 | 4.25 | 9/1/25 | 184 | ||||||||||||
| 110 | Microsoft Corp. (Software), Callable 9/17/61 @ 100.00 | 3.04 | 3/17/62 | 80 | ||||||||||||
| 55 | Mohawk Industries, Inc. (Household Durables), Callable 2/15/30 @ 100.00 | 3.63 | 5/15/30 | 49 | ||||||||||||
| 405 | Morgan Stanley, MTN (Capital Markets), Callable 7/20/26 @ 100.00 | 1.51 (SOFR + 86 bps)(b) | 7/20/27 | 359 | ||||||||||||
| 225 | Morgan Stanley, MTN (Capital Markets), Callable 1/23/29 @ 100.00 | 4.43 (TSFR3M + 189 bps)(b) | 1/23/30 | 214 | ||||||||||||
| 95 | National Rural Utilities Cooperative Finance Corp. (Financial Services), Callable 7/15/32 @ 100.00 | 5.80 | 1/15/33 | 99 | ||||||||||||
| 80 | NextEra Energy Capital Holdings, Inc. (Electric Utilities), Callable 11/28/32 @ 100.00 | 5.05 | 2/28/33 | 79 | ||||||||||||
| 40 | NextEra Energy Capital Holdings, Inc. (Electric Utilities), Callable 8/28/52 @ 100.00 | 5.25 | 2/28/53 | 38 | ||||||||||||
| 85 | NNN REIT, Inc. (Retail REITs), Callable 1/15/30 @ 100.00 | 2.50 | 4/15/30 | 71 | ||||||||||||
| 75 | Northrop Grumman Corp. (Aerospace & Defense), Callable 4/15/47 @ 100.00 | 4.03 | 10/15/47 | 64 | ||||||||||||
| 50 | Nucor Corp. (Metals & Mining), Callable 2/1/43 @ 100.00 | 5.20 | 8/1/43 | 49 | ||||||||||||
| 20 | NVIDIA Corp. (Semiconductors & Semiconductor Equipment), Callable 1/1/30 @ 100.00 | 2.85 | 4/1/30 | 18 | ||||||||||||
| 20 | Oklahoma Gas and Electric Co. (Electric Utilities), Callable 7/15/32 @ 100.00 | 5.40 | 1/15/33 | 20 | ||||||||||||
| 35 | Oklahoma Gas and Electric Co. (Electric Utilities), Callable 10/1/52 @ 100.00 | 5.60 | 4/1/53 | 35 | ||||||||||||
| 70 | Oracle Corp. (Software), Callable 11/15/44 @ 100.00 | 4.13 | 5/15/45 | 55 | ||||||||||||
| 165 | Ovintiv Exploration, Inc. (Oil, Gas & Consumable Fuels), Callable 10/1/25 @ 100.00 | 5.38 | 1/1/26 | 164 | ||||||||||||
| 50 | Pfizer Investment Enterprises Pte Ltd. (Capital Markets), Callable 11/19/42 @ 100.00 | 5.11 | 5/19/43 | 50 | ||||||||||||
| 50 | Pfizer, Inc. (Pharmaceuticals) | 4.30 | 6/15/43 | 46 | ||||||||||||
| 80 | Philip Morris International, Inc. (Tobacco) | 4.50 | 3/20/42 | 69 | ||||||||||||
| 70 | Principal Financial Group, Inc. (Insurance), Callable 3/15/30 @ 100.00 | 2.13 | 6/15/30 | 57 | ||||||||||||
| 85 | Progress Energy, Inc. (Electric Utilities) | 6.00 | 12/1/39 | 85 | ||||||||||||
| 55 | Prudential Financial, Inc. (Insurance) | 4.60 | 5/15/44 | 48 | ||||||||||||
| 15 | Prudential Financial, Inc. (Insurance) | 6.63 | 6/21/40 | 16 | ||||||||||||
| 30 | Public Service Electric & Gas Co. (Electric Utilities), Callable 3/1/42 @ 100.00 | 3.65 | 9/1/42 | 24 | ||||||||||||
| 50 | Raytheon Technologies Corp. (Aerospace & Defense) | 4.50 | 6/1/42 | 46 | ||||||||||||
| 95 | Reliance Steel & Aluminum Co. (Metals & Mining), Callable 7/15/25 @ 100.00 | 1.30 | 8/15/25 | 87 | ||||||||||||
| 70 | Reliance Steel & Aluminum Co. (Metals & Mining), Callable 5/15/30 @ 100.00 | 2.15 | 8/15/30 | 57 | ||||||||||||
| 140 | RELX Capital, Inc. (Professional Services), Callable 2/22/30 @ 100.00 | 3.00 | 5/22/30 | 125 | ||||||||||||
| 45 | Roper Technologies, Inc. (Software), Callable 3/30/30 @ 100.00 | 2.00 | 6/30/30 | 37 | ||||||||||||
| 70 | Sabra Health Care LP (Health Care REITs), Callable 9/1/31 @ 100.00 | 3.20 | 12/1/31 | 52 | ||||||||||||
| 30 | Southern Co. Gas Capital Corp. (Electric Utilities), Callable 3/15/26 @ 100.00 | 3.25 | 6/15/26 | 28 | ||||||||||||
| 80 | Southern Co. Gas Capital Corp. (Electric Utilities), Callable 11/30/46 @ 100.00 | 4.40 | 5/30/47 | 67 | ||||||||||||
| 55 | Southwest Airlines Co. (Passenger Airlines), Callable 4/15/27 @ 100.00 | 5.13 | 6/15/27 | 55 | ||||||||||||
| 150 | TCI Communications, Inc. (Media) | 7.88 | 2/15/26 | 159 | ||||||||||||
| 420 | The Goldman Sachs Group, Inc. (Capital Markets), Callable 6/5/27 @ 100.00 | 3.69 (TSFR3M + 177 bps)(b) | 6/5/28 | 394 | ||||||||||||
| 55 | The Home Depot, Inc. (Specialty Retail), Callable 6/6/48 @ 100.00 | 4.50 | 12/6/48 | 51 | ||||||||||||
| 40 | The Home Depot, Inc. (Specialty Retail), Callable 3/15/40 @ 100.00 | 5.40 | 9/15/40 | 41 | ||||||||||||
| 125 | The Interpublic Group of Cos., Inc. (Media) | 4.20 | 4/15/24 | 123 | ||||||||||||
| 25 | The Interpublic Group of Cos., Inc. (Media), Callable 4/1/48 @ 100.00 | 5.40 | 10/1/48 | 24 | ||||||||||||
| 60 | The Travelers Cos., Inc. (Insurance) | 5.35 | 11/1/40 | 61 | ||||||||||||
| 90 | The Walt Disney Co. (Entertainment), Callable 3/15/44 @ 100.00 | 4.75 | 9/15/44 | 84 | ||||||||||||
See accompanying notes to financial statements.
191
HC CAPITAL TRUST
The Core Fixed Income Portfolio
Portfolio of Investments (continued) — June 30, 2023
Principal | Security Description | Rate % | Maturity | Value | ||||||||||||
Corporate Bonds (continued) | ||||||||||||||||
| $ | 80 | T-Mobile US, Inc. (Wireless Telecommunication Services), Callable 7/18/23 @ 101.13 | 2.25 | 2/15/26 | $ | 74 | ||||||||||
| 35 | T-Mobile US, Inc. (Wireless Telecommunication Services), Callable 1/15/30 @ 100.00 | 3.88 | 4/15/30 | 32 | ||||||||||||
| 25 | T-Mobile US, Inc. (Wireless Telecommunication Services), Callable 7/15/52 @ 100.00 | 5.65 | 1/15/53 | 25 | ||||||||||||
| 25 | UDR, Inc. (Residential REITs), Callable 5/15/31 @ 100.00 | 3.00 | 8/15/31 | 21 | ||||||||||||
| 45 | UnitedHealth Group, Inc. (Health Care Providers & Services), Callable 5/15/41 @ 100.00 | 4.63 | 11/15/41 | 42 | ||||||||||||
| 35 | UnitedHealth Group, Inc. (Health Care Providers & Services) | 4.75 | 7/15/45 | 34 | ||||||||||||
| 70 | Valero Energy Corp. (Oil, Gas & Consumable Fuels) | 6.63 | 6/15/37 | 75 | ||||||||||||
| 25 | Ventas Realty LP (Health Care REITs), Callable 11/1/24 @ 100.00 | 3.50 | 2/1/25 | 24 | ||||||||||||
| 120 | Ventas Realty LP (Diversified REITs), Callable 2/1/24 @ 100.00 | 3.75 | 5/1/24 | 118 | ||||||||||||
| 40 | Ventas Realty LP (Real Estate Management & Development), Callable 10/15/28 @ 100.00 | 4.40 | 1/15/29 | 37 | ||||||||||||
| 40 | Verizon Communications, Inc. (Diversified Telecommunication Services), Callable 12/15/31 @ 100.00 | 2.36 | 3/15/32 | 32 | ||||||||||||
| 207 | Verizon Communications, Inc. (Diversified Telecommunication Services), Callable 9/22/40 @ 100.00 | 3.40 | 3/22/41 | 160 | ||||||||||||
| 55 | Verizon Communications, Inc. (Diversified Telecommunication Services) | 4.33 | 9/21/28 | 53 | ||||||||||||
| 85 | Virginia Electric and Power Co., Series B (Electric Utilities), Callable 3/15/47 @ 100.00 | 3.80 | 9/15/47 | 67 | ||||||||||||
| 80 | Warnermedia Holdings, Inc. (Diversified Telecommunication Services), Callable 12/15/31 @ 100.00 | 4.28 | 3/15/32 | 71 | ||||||||||||
| 220 | Wells Fargo & Co., MTN (Banks), Callable 10/30/29 @ 100.00 | 2.88 (TSFR3M + 143 bps)(b) | 10/30/30 | 190 | ||||||||||||
| 210 | Wells Fargo & Co., MTN (Banks), Callable 5/22/27 @ 100.00 | 3.58 (TSFR3M + 157 bps)(b) | 5/22/28 | 196 | ||||||||||||
| 50 | Wells Fargo & Co. (Banks), Callable 7/25/32 @ 100.00 | 4.90 (SOFR + 210 bps)(b) | 7/25/33 | 48 | ||||||||||||
| 55 | WestRock MWV LLC (Containers & Packaging) | 8.20 | 1/15/30 | 63 | ||||||||||||
| 55 | XTO Energy, Inc. (Oil, Gas & Consumable Fuels) | 6.75 | 8/1/37 | 63 | ||||||||||||
Total Corporate Bonds | 10,732 | |||||||||||||||
U.S. Treasury Obligations — 29.36% | ||||||||||||||||
| 15 | U.S. Treasury Bond | 1.13 | 5/15/40 | 10 | ||||||||||||
| 8 | U.S. Treasury Bond | 1.13 | 8/15/40 | 5 | ||||||||||||
| 125 | U.S. Treasury Bond | 1.25 | 5/15/50 | 70 | ||||||||||||
| 133 | U.S. Treasury Bond | 1.38 | 11/15/40 | 89 | ||||||||||||
| 145 | U.S. Treasury Bond | 1.38 | 8/15/50 | 84 | ||||||||||||
| 140 | U.S. Treasury Bond | 1.63 | 11/15/50 | 87 | ||||||||||||
| 100 | U.S. Treasury Bond | 1.75 | 8/15/41 | 70 | ||||||||||||
| 140 | U.S. Treasury Bond | 1.88 | 2/15/41 | 102 | ||||||||||||
| 156 | U.S. Treasury Bond | 1.88 | 2/15/51 | 103 | ||||||||||||
| 148 | U.S. Treasury Bond | 1.88 | 11/15/51 | 98 | ||||||||||||
| 159 | U.S. Treasury Bond | 2.00 | 8/15/51 | 108 | ||||||||||||
| 145 | U.S. Treasury Bond | 2.00 | 11/15/41 | 106 | ||||||||||||
| 106 | U.S. Treasury Bond | 2.00 | 2/15/50 | 73 | ||||||||||||
| 100 | U.S. Treasury Bond | 2.25 | 5/15/41 | 77 | ||||||||||||
| 173 | U.S. Treasury Bond | 2.25 | 2/15/52 | 125 | ||||||||||||
| 117 | U.S. Treasury Bond | 2.25 | 8/15/46 | 85 | ||||||||||||
| 101 | U.S. Treasury Bond | 2.25 | 8/15/49 | 73 | ||||||||||||
| 110 | U.S. Treasury Bond | 2.38 | 5/15/51 | 82 | ||||||||||||
| 110 | U.S. Treasury Bond | 2.38 | 2/15/42 | 86 | ||||||||||||
See accompanying notes to financial statements.
192
HC CAPITAL TRUST
The Core Fixed Income Portfolio
Portfolio of Investments (continued) — June 30, 2023
Principal | Security Description | Rate % | Maturity | Value | ||||||||||||
U.S. Treasury Obligations (continued) | ||||||||||||||||
| $ | 96 | U.S. Treasury Bond | 2.38 | 11/15/49 | $ | 72 | ||||||||||
| 75 | U.S. Treasury Bond | 2.50 | 5/15/46 | 58 | ||||||||||||
| 80 | U.S. Treasury Bond | 2.50 | 2/15/46 | 62 | ||||||||||||
| 60 | U.S. Treasury Bond | 2.50 | 2/15/45 | 46 | ||||||||||||
| 55 | U.S. Treasury Bond | 2.75 | 8/15/47 | 44 | ||||||||||||
| 80 | U.S. Treasury Bond | 2.75 | 11/15/47 | 64 | ||||||||||||
| 10 | U.S. Treasury Bond | 2.75 | 11/15/42 | 8 | ||||||||||||
| 60 | U.S. Treasury Bond | 2.88 | 5/15/43 | 50 | ||||||||||||
| 60 | U.S. Treasury Bond | 2.88 | 8/15/45 | 50 | ||||||||||||
| 65 | U.S. Treasury Bond | 2.88 | 11/15/46 | 54 | ||||||||||||
| 94 | U.S. Treasury Bond | 2.88 | 5/15/49 | 78 | ||||||||||||
| 147 | U.S. Treasury Bond | 2.88 | 5/15/52 | 122 | ||||||||||||
| 50 | U.S. Treasury Bond | 3.00 | 11/15/45 | 42 | ||||||||||||
| 50 | U.S. Treasury Bond | 3.00 | 2/15/48 | 42 | ||||||||||||
| 115 | U.S. Treasury Bond | 3.00 | 8/15/52 | 98 | ||||||||||||
| 55 | U.S. Treasury Bond | 3.00 | 5/15/47 | 46 | ||||||||||||
| 95 | U.S. Treasury Bond | 3.00 | 8/15/48 | 80 | ||||||||||||
| 90 | U.S. Treasury Bond | 3.00 | 2/15/49 | 76 | ||||||||||||
| 75 | U.S. Treasury Bond | 3.00 | 2/15/47 | 63 | ||||||||||||
| 50 | U.S. Treasury Bond | 3.00 | 5/15/45 | 42 | ||||||||||||
| 100 | U.S. Treasury Bond | 3.00 | 11/15/44 | 85 | ||||||||||||
| 22 | U.S. Treasury Bond | 3.13 | 8/15/44 | 19 | ||||||||||||
| 90 | U.S. Treasury Bond | 3.13 | 2/15/43 | 78 | ||||||||||||
| 80 | U.S. Treasury Bond | 3.13 | 5/15/48 | 69 | ||||||||||||
| 25 | U.S. Treasury Bond | 3.13 | 11/15/41 | 22 | ||||||||||||
| 125 | U.S. Treasury Bond | 3.25 | 5/15/42 | 112 | ||||||||||||
| 10 | U.S. Treasury Bond | 3.38 | 8/15/42 | 9 | ||||||||||||
| 75 | U.S. Treasury Bond | 3.38 | 5/15/44 | 68 | ||||||||||||
| 30 | U.S. Treasury Bond | 3.38 | 11/15/48 | 27 | ||||||||||||
| 8 | U.S. Treasury Bond | 3.50 | 2/15/39 | 8 | ||||||||||||
| 75 | U.S. Treasury Bond | 3.63 | 8/15/43 | 70 | ||||||||||||
| 100 | U.S. Treasury Bond | 3.63 | 2/15/44 | 94 | ||||||||||||
| 73 | U.S. Treasury Bond | 3.63 | 2/15/53 | 70 | ||||||||||||
| 75 | U.S. Treasury Bond | 3.63 | 5/15/53 | 72 | ||||||||||||
| 75 | U.S. Treasury Bond | 3.75 | 11/15/43 | 72 | ||||||||||||
| 33 | U.S. Treasury Bond | 3.75 | 8/15/41 | 32 | ||||||||||||
| 30 | U.S. Treasury Bond | 3.88 | 2/15/43 | 29 | ||||||||||||
| 25 | U.S. Treasury Bond | 3.88 | 5/15/43 | 24 | ||||||||||||
| 10 | U.S. Treasury Bond | 3.88 | 8/15/40 | 10 | ||||||||||||
| 73 | U.S. Treasury Bond | 4.00 | 11/15/52 | 75 | ||||||||||||
| 25 | U.S. Treasury Bond | 4.00 | 11/15/42 | 25 | ||||||||||||
| 100 | U.S. Treasury Bond | 4.25 | 11/15/40 | 104 | ||||||||||||
| 35 | U.S. Treasury Bond | 4.38 | 5/15/41 | 37 | ||||||||||||
| 15 | U.S. Treasury Bond | 4.38 | 5/15/40 | 16 | ||||||||||||
| 25 | U.S. Treasury Bond | 4.38 | 11/15/39 | 26 | ||||||||||||
| 25 | U.S. Treasury Bond | 4.38 | 2/15/38 | 27 | ||||||||||||
| 50 | U.S. Treasury Bond | 4.50 | 2/15/36 | 54 | ||||||||||||
| 35 | U.S. Treasury Bond | 4.63 | 2/15/40 | 38 | ||||||||||||
See accompanying notes to financial statements.
193
HC CAPITAL TRUST
The Core Fixed Income Portfolio
Portfolio of Investments (continued) — June 30, 2023
Principal | Security Description | Rate % | Maturity | Value | ||||||||||||
U.S. Treasury Obligations (continued) | ||||||||||||||||
| $ | 70 | U.S. Treasury Bond | 4.75 | 2/15/41 | $ | 77 | ||||||||||
| 10 | U.S. Treasury Bond | 4.75 | 2/15/37 | 11 | ||||||||||||
| 40 | U.S. Treasury Bond | 5.00 | 5/15/37 | 45 | ||||||||||||
| 20 | U.S. Treasury Bond | 5.25 | 2/15/29 | 21 | ||||||||||||
| 40 | U.S. Treasury Bond | 5.38 | 2/15/31 | 44 | ||||||||||||
| 25 | U.S. Treasury Bond | 6.00 | 2/15/26 | 26 | ||||||||||||
| 60 | U.S. Treasury Bond | 6.13 | 11/15/27 | 64 | ||||||||||||
| 25 | U.S. Treasury Bond | 6.13 | 8/15/29 | 28 | ||||||||||||
| 35 | U.S. Treasury Bond | 6.25 | 5/15/30 | 40 | ||||||||||||
| 15 | U.S. Treasury Bond | 6.50 | 11/15/26 | 16 | ||||||||||||
| 17 | U.S. Treasury Bond | 7.50 | 11/15/24 | 17 | ||||||||||||
| 15 | U.S. Treasury Bond | 7.63 | 2/15/25 | 16 | ||||||||||||
| 30 | U.S. Treasury Note | 0.25 | 7/31/25 | 27 | ||||||||||||
| 135 | U.S. Treasury Note | 0.25 | 9/30/25 | 122 | ||||||||||||
| 60 | U.S. Treasury Note | 0.25 | 8/31/25 | 54 | ||||||||||||
| 50 | U.S. Treasury Note | 0.25 | 5/31/25 | 46 | ||||||||||||
| 125 | U.S. Treasury Note | 0.25 | 10/31/25 | 113 | ||||||||||||
| 115 | U.S. Treasury Note | 0.38 | 7/31/27 | 98 | ||||||||||||
| 115 | U.S. Treasury Note | 0.38 | 7/15/24 | 109 | ||||||||||||
| 60 | U.S. Treasury Note | 0.38 | 11/30/25 | 54 | ||||||||||||
| 180 | U.S. Treasury Note | 0.38 | 9/15/24 | 170 | ||||||||||||
| 82 | U.S. Treasury Note | 0.38 | 1/31/26 | 74 | ||||||||||||
| 35 | U.S. Treasury Note | 0.38 | 9/30/27 | 30 | ||||||||||||
| 25 | U.S. Treasury Note | 0.38 | 12/31/25 | 23 | ||||||||||||
| 105 | U.S. Treasury Note | 0.38 | 8/15/24 | 99 | ||||||||||||
| 80 | U.S. Treasury Note | 0.38 | 4/30/25 | 74 | ||||||||||||
| 5 | U.S. Treasury Note | 0.50 | 4/30/27 | 4 | ||||||||||||
| 100 | U.S. Treasury Note | 0.50 | 8/31/27 | 86 | ||||||||||||
| 100 | U.S. Treasury Note | 0.50 | 10/31/27 | 85 | ||||||||||||
| 130 | U.S. Treasury Note | 0.50 | 2/28/26 | 117 | ||||||||||||
| 105 | U.S. Treasury Note | 0.50 | 6/30/27 | 91 | ||||||||||||
| 195 | U.S. Treasury Note | 0.63 | 5/15/30 | 156 | ||||||||||||
| 85 | U.S. Treasury Note | 0.63 | 11/30/27 | 73 | ||||||||||||
| 80 | U.S. Treasury Note | 0.63 | 12/31/27 | 68 | ||||||||||||
| 110 | U.S. Treasury Note | 0.63 | 10/15/24 | 104 | ||||||||||||
| 140 | U.S. Treasury Note | 0.63 | 7/31/26 | 125 | ||||||||||||
| 250 | U.S. Treasury Note | 0.63 | 8/15/30 | 199 | ||||||||||||
| 5 | U.S. Treasury Note | 0.63 | 3/31/27 | 4 | ||||||||||||
| 145 | U.S. Treasury Note | 0.75 | 3/31/26 | 131 | ||||||||||||
| 42 | U.S. Treasury Note | 0.75 | 8/31/26 | 37 | ||||||||||||
| 150 | U.S. Treasury Note | 0.75 | 5/31/26 | 135 | ||||||||||||
| 120 | U.S. Treasury Note | 0.75 | 1/31/28 | 103 | ||||||||||||
| 125 | U.S. Treasury Note | 0.75 | 4/30/26 | 113 | ||||||||||||
| 100 | U.S. Treasury Note | 0.75 | 11/15/24 | 94 | ||||||||||||
| 60 | U.S. Treasury Note | 0.88 | 6/30/26 | 54 | ||||||||||||
| 145 | U.S. Treasury Note | 0.88 | 9/30/26 | 130 | ||||||||||||
| 185 | U.S. Treasury Note | 0.88 | 11/15/30 | 150 | ||||||||||||
| 135 | U.S. Treasury Note | 1.00 | 12/15/24 | 127 | ||||||||||||
See accompanying notes to financial statements.
194
HC CAPITAL TRUST
The Core Fixed Income Portfolio
Portfolio of Investments (continued) — June 30, 2023
Principal | Security Description | Rate % | Maturity | Value | ||||||||||||
U.S. Treasury Obligations (continued) | ||||||||||||||||
| $ | 85 | U.S. Treasury Note | 1.00 | 7/31/28 | $ | 73 | ||||||||||
| 145 | U.S. Treasury Note | 1.13 | 10/31/26 | 130 | ||||||||||||
| 125 | U.S. Treasury Note | 1.13 | 8/31/28 | 108 | ||||||||||||
| 10 | U.S. Treasury Note | 1.13 | 2/28/27 | 9 | ||||||||||||
| 70 | U.S. Treasury Note | 1.13 | 2/28/25 | 66 | ||||||||||||
| 135 | U.S. Treasury Note | 1.13 | 1/15/25 | 127 | ||||||||||||
| 251 | U.S. Treasury Note | 1.13 | 2/15/31 | 205 | ||||||||||||
| 155 | U.S. Treasury Note | 1.13 | 2/29/28 | 135 | ||||||||||||
| 65 | U.S. Treasury Note | 1.25 | 6/30/28 | 57 | ||||||||||||
| 120 | U.S. Treasury Note | 1.25 | 9/30/28 | 104 | ||||||||||||
| 145 | U.S. Treasury Note | 1.25 | 12/31/26 | 131 | ||||||||||||
| 130 | U.S. Treasury Note | 1.25 | 3/31/28 | 114 | ||||||||||||
| 45 | U.S. Treasury Note | 1.25 | 8/31/24 | 43 | ||||||||||||
| 90 | U.S. Treasury Note | 1.25 | 4/30/28 | 79 | ||||||||||||
| 100 | U.S. Treasury Note | 1.25 | 5/31/28 | 87 | ||||||||||||
| 150 | U.S. Treasury Note | 1.25 | 11/30/26 | 135 | ||||||||||||
| 270 | U.S. Treasury Note | 1.25 | 8/15/31 | 221 | ||||||||||||
| 120 | U.S. Treasury Note | 1.38 | 10/31/28 | 104 | ||||||||||||
| 115 | U.S. Treasury Note | 1.38 | 12/31/28 | 100 | ||||||||||||
| 197 | U.S. Treasury Note | 1.38 | 11/15/31 | 162 | ||||||||||||
| 90 | U.S. Treasury Note | 1.50 | 11/30/24 | 85 | ||||||||||||
| 63 | U.S. Treasury Note | 1.50 | 2/15/30 | 54 | ||||||||||||
| 85 | U.S. Treasury Note | 1.50 | 11/30/28 | 74 | ||||||||||||
| 185 | U.S. Treasury Note | 1.50 | 1/31/27 | 168 | ||||||||||||
| 30 | U.S. Treasury Note | 1.50 | 9/30/24 | 29 | ||||||||||||
| 85 | U.S. Treasury Note | 1.50 | 2/15/25 | 80 | ||||||||||||
| 140 | U.S. Treasury Note | 1.50 | 8/15/26 | 128 | ||||||||||||
| 130 | U.S. Treasury Note | 1.63 | 8/15/29 | 113 | ||||||||||||
| 120 | U.S. Treasury Note | 1.63 | 2/15/26 | 111 | ||||||||||||
| 70 | U.S. Treasury Note | 1.63 | 9/30/26 | 64 | ||||||||||||
| 195 | U.S. Treasury Note | 1.63 | 5/15/31 | 166 | ||||||||||||
| 130 | U.S. Treasury Note | 1.63 | 5/15/26 | 120 | ||||||||||||
| 120 | U.S. Treasury Note | 1.75 | 11/15/29 | 105 | ||||||||||||
| 90 | U.S. Treasury Note | 1.75 | 1/31/29 | 80 | ||||||||||||
| 75 | U.S. Treasury Note | 1.75 | 3/15/25 | 71 | ||||||||||||
| 20 | U.S. Treasury Note | 1.75 | 12/31/26 | 18 | ||||||||||||
| 88 | U.S. Treasury Note | 1.75 | 12/31/24 | 84 | ||||||||||||
| 75 | U.S. Treasury Note | 1.88 | 7/31/26 | 69 | ||||||||||||
| 85 | U.S. Treasury Note | 1.88 | 2/28/29 | 76 | ||||||||||||
| 25 | U.S. Treasury Note | 1.88 | 6/30/26 | 23 | ||||||||||||
| 180 | U.S. Treasury Note | 1.88 | 2/28/27 | 165 | ||||||||||||
| 20 | U.S. Treasury Note | 1.88 | 8/31/24 | 19 | ||||||||||||
| 247 | U.S. Treasury Note | 1.88 | 2/15/32 | 211 | ||||||||||||
| 160 | U.S. Treasury Note | 2.00 | 11/15/26 | 148 | ||||||||||||
| 140 | U.S. Treasury Note | 2.00 | 8/15/25 | 132 | ||||||||||||
| 170 | U.S. Treasury Note | 2.00 | 2/15/25 | 162 | ||||||||||||
| 65 | U.S. Treasury Note | 2.13 | 9/30/24 | 63 | ||||||||||||
| 85 | U.S. Treasury Note | 2.13 | 5/15/25 | 81 | ||||||||||||
See accompanying notes to financial statements.
195
HC CAPITAL TRUST
The Core Fixed Income Portfolio
Portfolio of Investments (continued) — June 30, 2023
Principal | Security Description | Rate % | Maturity | Value | ||||||||||||
U.S. Treasury Obligations (continued) | ||||||||||||||||
| $ | 50 | U.S. Treasury Note | 2.13 | 11/30/24 | $ | 48 | ||||||||||
| 55 | U.S. Treasury Note | 2.13 | 7/31/24 | 53 | ||||||||||||
| 100 | U.S. Treasury Note | 2.13 | 5/31/26 | 94 | ||||||||||||
| 150 | U.S. Treasury Note | 2.25 | 11/15/24 | 144 | ||||||||||||
| 55 | U.S. Treasury Note | 2.25 | 10/31/24 | 53 | ||||||||||||
| 55 | U.S. Treasury Note | 2.25 | 12/31/24 | 53 | ||||||||||||
| 95 | U.S. Treasury Note | 2.25 | 11/15/25 | 90 | ||||||||||||
| 160 | U.S. Treasury Note | 2.25 | 8/15/27 | 148 | ||||||||||||
| 150 | U.S. Treasury Note | 2.25 | 11/15/27 | 138 | ||||||||||||
| 165 | U.S. Treasury Note | 2.25 | 2/15/27 | 153 | ||||||||||||
| 80 | U.S. Treasury Note | 2.25 | 3/31/26 | 75 | ||||||||||||
| 80 | U.S. Treasury Note | 2.38 | 4/30/26 | 75 | ||||||||||||
| 140 | U.S. Treasury Note | 2.38 | 5/15/27 | 130 | ||||||||||||
| 100 | U.S. Treasury Note | 2.38 | 8/15/24 | 97 | ||||||||||||
| 120 | U.S. Treasury Note | 2.38 | 5/15/29 | 109 | ||||||||||||
| 70 | U.S. Treasury Note | 2.38 | 3/31/29 | 64 | ||||||||||||
| 80 | U.S. Treasury Note | 2.50 | 3/31/27 | 75 | ||||||||||||
| 60 | U.S. Treasury Note | 2.50 | 2/28/26 | 57 | ||||||||||||
| 165 | U.S. Treasury Note | 2.63 | 2/15/29 | 153 | ||||||||||||
| 85 | U.S. Treasury Note | 2.63 | 1/31/26 | 81 | ||||||||||||
| 55 | U.S. Treasury Note | 2.63 | 7/31/29 | 51 | ||||||||||||
| 70 | U.S. Treasury Note | 2.63 | 4/15/25 | 67 | ||||||||||||
| 45 | U.S. Treasury Note | 2.63 | 5/31/27 | 42 | ||||||||||||
| 75 | U.S. Treasury Note | 2.63 | 3/31/25 | 72 | ||||||||||||
| 90 | U.S. Treasury Note | 2.63 | 12/31/25 | 86 | ||||||||||||
| 218 | U.S. Treasury Note | 2.75 | 8/15/32 | 200 | ||||||||||||
| 66 | U.S. Treasury Note | 2.75 | 7/31/27 | 62 | ||||||||||||
| 75 | U.S. Treasury Note | 2.75 | 4/30/27 | 71 | ||||||||||||
| 105 | U.S. Treasury Note | 2.75 | 2/15/28 | 99 | ||||||||||||
| 90 | U.S. Treasury Note | 2.75 | 2/28/25 | 87 | ||||||||||||
| 60 | U.S. Treasury Note | 2.75 | 5/31/29 | 56 | ||||||||||||
| 65 | U.S. Treasury Note | 2.75 | 5/15/25 | 62 | ||||||||||||
| 85 | U.S. Treasury Note | 2.75 | 8/31/25 | 81 | ||||||||||||
| 90 | U.S. Treasury Note | 2.75 | 6/30/25 | 86 | ||||||||||||
| 90 | U.S. Treasury Note | 2.88 | 4/30/25 | 87 | ||||||||||||
| 238 | U.S. Treasury Note | 2.88 | 5/15/32 | 220 | ||||||||||||
| 65 | U.S. Treasury Note | 2.88 | 6/15/25 | 63 | ||||||||||||
| 65 | U.S. Treasury Note | 2.88 | 4/30/29 | 61 | ||||||||||||
| 160 | U.S. Treasury Note | 2.88 | 5/15/28 | 151 | ||||||||||||
| 75 | U.S. Treasury Note | 2.88 | 7/31/25 | 72 | ||||||||||||
| 125 | U.S. Treasury Note | 2.88 | 8/15/28 | 118 | ||||||||||||
| 90 | U.S. Treasury Note | 2.88 | 11/30/25 | 86 | ||||||||||||
| 85 | U.S. Treasury Note | 3.00 | 9/30/25 | 82 | ||||||||||||
| 85 | U.S. Treasury Note | 3.00 | 10/31/25 | 82 | ||||||||||||
| 65 | U.S. Treasury Note | 3.00 | 7/31/24 | 63 | ||||||||||||
| 60 | U.S. Treasury Note | 3.00 | 7/15/25 | 58 | ||||||||||||
| 55 | U.S. Treasury Note | 3.13 | 8/31/29 | 52 | ||||||||||||
| 60 | U.S. Treasury Note | 3.13 | 8/15/25 | 58 | ||||||||||||
See accompanying notes to financial statements.
196
HC CAPITAL TRUST
The Core Fixed Income Portfolio
Portfolio of Investments (continued) — June 30, 2023
Principal | Security Description | Rate % | Maturity | Value | ||||||||||||
U.S. Treasury Obligations (continued) | ||||||||||||||||
| $ | 140 | U.S. Treasury Note | 3.13 | 11/15/28 | $ | 133 | ||||||||||
| 65 | U.S. Treasury Note | 3.13 | 8/31/27 | 62 | ||||||||||||
| 70 | U.S. Treasury Note | 3.25 | 6/30/27 | 67 | ||||||||||||
| 60 | U.S. Treasury Note | 3.25 | 6/30/29 | 57 | ||||||||||||
| 65 | U.S. Treasury Note | 3.25 | 8/31/24 | 63 | ||||||||||||
| 125 | U.S. Treasury Note | 3.38 | 5/15/33 | 121 | ||||||||||||
| 90 | U.S. Treasury Note | 3.50 | 1/31/28 | 87 | ||||||||||||
| 70 | U.S. Treasury Note | 3.50 | 1/31/30 | 68 | ||||||||||||
| 170 | U.S. Treasury Note | 3.50 | 2/15/33 | 166 | ||||||||||||
| 85 | U.S. Treasury Note | 3.50 | 4/30/28 | 83 | ||||||||||||
| 70 | U.S. Treasury Note | 3.50 | 4/30/30 | 68 | ||||||||||||
| 85 | U.S. Treasury Note | 3.50 | 9/15/25 | 83 | ||||||||||||
| 70 | U.S. Treasury Note | 3.63 | 3/31/30 | 68 | ||||||||||||
| 90 | U.S. Treasury Note | 3.63 | 3/31/28 | 88 | ||||||||||||
| 90 | U.S. Treasury Note | 3.63 | 5/31/28 | 88 | ||||||||||||
| 80 | U.S. Treasury Note | 3.63 | 5/15/26 | 78 | ||||||||||||
| 70 | U.S. Treasury Note | 3.75 | 6/30/30 | 69 | ||||||||||||
| 70 | U.S. Treasury Note | 3.75 | 5/31/30 | 69 | ||||||||||||
| 80 | U.S. Treasury Note | 3.75 | 4/15/26 | 78 | ||||||||||||
| 80 | U.S. Treasury Note | 3.88 | 1/15/26 | 79 | ||||||||||||
| 90 | U.S. Treasury Note | 3.88 | 12/31/27 | 89 | ||||||||||||
| 85 | U.S. Treasury Note | 3.88 | 3/31/25 | 83 | ||||||||||||
| 85 | U.S. Treasury Note | 3.88 | 4/30/25 | 83 | ||||||||||||
| 90 | U.S. Treasury Note | 3.88 | 11/30/27 | 89 | ||||||||||||
| 75 | U.S. Treasury Note | 3.88 | 11/30/29 | 74 | ||||||||||||
| 75 | U.S. Treasury Note | 3.88 | 12/31/29 | 74 | ||||||||||||
| 75 | U.S. Treasury Note | 3.88 | 9/30/29 | 74 | ||||||||||||
| 85 | U.S. Treasury Note | 4.00 | 12/15/25 | 84 | ||||||||||||
| 85 | U.S. Treasury Note | 4.00 | 6/30/28 | 85 | ||||||||||||
| 75 | U.S. Treasury Note | 4.00 | 10/31/29 | 75 | ||||||||||||
| 80 | U.S. Treasury Note | 4.00 | 2/15/26 | 79 | ||||||||||||
| 70 | U.S. Treasury Note | 4.00 | 2/28/30 | 70 | ||||||||||||
| 90 | U.S. Treasury Note | 4.00 | 2/29/28 | 89 | ||||||||||||
| 85 | U.S. Treasury Note | 4.13 | 1/31/25 | 84 | ||||||||||||
| 90 | U.S. Treasury Note | 4.13 | 10/31/27 | 90 | ||||||||||||
| 90 | U.S. Treasury Note | 4.13 | 9/30/27 | 89 | ||||||||||||
| 80 | U.S. Treasury Note | 4.13 | 6/15/26 | 79 | ||||||||||||
| 142 | U.S. Treasury Note | 4.13 | 11/15/32 | 145 | ||||||||||||
| 85 | U.S. Treasury Note | 4.25 | 5/31/25 | 84 | ||||||||||||
| 85 | U.S. Treasury Note | 4.25 | 10/15/25 | 84 | ||||||||||||
| 85 | U.S. Treasury Note | 4.25 | 12/31/24 | 84 | ||||||||||||
| 90 | U.S. Treasury Note | 4.25 | 9/30/24 | 89 | ||||||||||||
| 90 | U.S. Treasury Note | 4.38 | 10/31/24 | 89 | ||||||||||||
| 90 | U.S. Treasury Note | 4.50 | 11/30/24 | 89 | ||||||||||||
| 85 | U.S. Treasury Note | 4.50 | 11/15/25 | 85 | ||||||||||||
| 80 | U.S. Treasury Note | 4.63 | 3/15/26 | 80 | ||||||||||||
| 85 | U.S. Treasury Note | 4.63 | 2/28/25 | 84 | ||||||||||||
| 85 | U.S. Treasury Note | 4.63 | 6/30/25 | 85 | ||||||||||||
Total U.S. Treasury Obligations | 21,003 | |||||||||||||||
See accompanying notes to financial statements.
197
HC CAPITAL TRUST
The Core Fixed Income Portfolio
Portfolio of Investments (continued) — June 30, 2023
Principal | Security Description | Rate % | Maturity | Value | ||||||||||||
Yankee Dollars — 1.69% | ||||||||||||||||
| $ | 45 | America Movil SAB de CV (Wireless Telecommunication Services) | 6.13 | 11/15/37 | $ | 48 | ||||||||||
| 35 | BHP Billiton Finance USA Ltd. (Metals & Mining) | 5.00 | 9/30/43 | 35 | ||||||||||||
| 64 | British Telecommunications PLC (Diversified Telecommunication Services) | 9.63 | 12/15/30 | 78 | ||||||||||||
| 170 | Canadian Natural Resources Ltd. (Oil, Gas & Consumable Fuels), Callable 6/15/25 @ 100.00 | 2.05 | 7/15/25 | 159 | ||||||||||||
| 45 | Canadian Pacific Railway Co. (Transportation Infrastructure) | 7.13 | 10/15/31 | 51 | ||||||||||||
| 40 | Deutsche Telekom International Finance BV (Diversified Telecommunication Services) | 8.75 | 6/15/30 | 48 | ||||||||||||
| 90 | Diageo Capital PLC (Financial Services) | 5.88 | 9/30/36 | 96 | ||||||||||||
| 80 | Enbridge, Inc. (Oil, Gas & Consumable Fuels), Callable 2/1/51 @ 100.00 | 3.40 | 8/1/51 | 55 | ||||||||||||
| 105 | Equinor ASA (Oil, Gas & Consumable Fuels) | 5.10 | 8/17/40 | 105 | ||||||||||||
| 75 | Iberdrola International BV (Electric Utilities) | 5.81 | 3/15/25 | 75 | ||||||||||||
| 80 | Iberdrola International BV (Electric Utilities) | 6.75 | 7/15/36 | 90 | ||||||||||||
| 14 | LYB International Finance BV (Chemicals) | 4.00 | 7/15/23 | 14 | ||||||||||||
| 40 | Nutrien Ltd. (Chemicals), Callable 2/13/30 @ 100.00 | 2.95 | 5/13/30 | 35 | ||||||||||||
| 60 | Orange SA (Diversified Telecommunication Services) | 9.00 | 3/1/31 | 74 | ||||||||||||
| 70 | Shell International Finance BV (Financial Services) | 4.55 | 8/12/43 | 64 | ||||||||||||
| 35 | Telefonica Emisiones SA (Diversified Telecommunication Services) | 7.05 | 6/20/36 | 38 | ||||||||||||
| 70 | The Toronto-Dominion Bank (Banks) | 3.20 | 3/10/32 | 60 | ||||||||||||
| 25 | Vodafone Group PLC (Wireless Telecommunication Services) | 4.13 | 5/30/25 | 24 | ||||||||||||
| 55 | Vodafone Group PLC (Wireless Telecommunication Services) | 6.15 | 2/27/37 | 57 | ||||||||||||
Total Yankee Dollars | 1,206 | |||||||||||||||
Shares | ||||||||||||||||
Exchange-Traded Fund — 26.31% | ||||||||||||||||
| 396,740 | Vanguard Short-Term Inflation-Protected Securities ETF | 18,813 | ||||||||||||||
Total Exchange-Traded Fund | 18,813 | |||||||||||||||
Investment Companies — 13.71% | ||||||||||||||||
| 79,279 | State Street Institutional Treasury Money Market Fund, Premier Class | 5.02(c) | 79 | |||||||||||||
| 9,723,990 | State Street Institutional Treasury Plus Money Market Fund, Trust Class | 4.97(c) | 9,724 | |||||||||||||
Total Investment Companies | 9,803 | |||||||||||||||
Total Investments (cost $76,891) — 100.64% | 71,975 | |||||||||||||||
Liabilities in excess of other assets — (0.64)% | (456 | ) | ||||||||||||||
Net Assets — 100.00% | $ | 71,519 | ||||||||||||||
Amounts designated as “—” are $0 or have been rounded to $0.
(a) | The rate for certain asset-backed and mortgage-backed securities may vary based on factors relating to the pool of assets underlying the security. The rate disclosed is the rate in effect on June 30, 2023. |
(b) | Variable Rate Security. The rate disclosed is the rate in effect on June 30, 2023. |
(c) | Annualized 7-day yield as of period-end. |
bps—Basis Points |
ETF—Exchange-Traded Fund |
MTN—Medium Term Note |
REIT—Real Estate Investment Trust |
SOFR—Secured Overnight Financing Rate |
TBA—To Be Announced purchase or sale commitment. Security is subject to delayed delivery |
TSFR3M—3 Month SOFR |
See accompanying notes to financial statements.
198
HC CAPITAL TRUST
The Core Fixed Income Portfolio
Portfolio of Investments (concluded) — June 30, 2023
The following table reflects the percentage of total net assets of the Portfolio attributable to each Specialist Manager as of June 30, 2023.
The Core Fixed Income Portfolio | Agincourt | Mellon | Parametric | HC Capital | Total |
Asset Backed Securities | — | 0.18% | — | — | 0.18% |
Collateralized Mortgage Obligations | — | 0.84% | — | — | 0.84% |
U.S. Government Agency Mortgages | — | 12.76% | — | — | 12.76% |
U.S. Government Agency Securities | — | 0.78% | — | — | 0.78% |
Corporate Bonds | 15.01% | — | — | — | 15.01% |
U.S. Treasury Obligations | — | 29.36% | — | — | 29.36% |
Yankee Dollars | 1.69% | — | — | — | 1.69% |
Exchange Traded Fund | — | — | 26.31% | — | 26.31% |
Investment Companies | 0.11% | 1.16% | 0.01% | 12.43% | 13.71% |
Other Assets (Liabilities) | 0.19% | -0.83% | -0.02% | 0.02% | -0.64% |
Total Net Assets | 17.00% | 44.25% | 26.30% | 12.45% | 100.00% |
Amounts designated as “—” indicate the Specialist Manager did not manage any holdings in that category.
See accompanying notes to financial statements.
199
HC CAPITAL TRUST
The Corporate Opportunities Portfolio
Portfolio of Investments — June 30, 2023
Shares | Security Description | Rate % | Value | |||||||||||||
Common Stock — 0.00% | ||||||||||||||||
| 1,740,900 | ACC Claims Holding LLC (Financial Services) ^(a)(b) | $ | — | |||||||||||||
Total Common Stock | — | |||||||||||||||
Investment Companies — 97.36% | ||||||||||||||||
| 129,168 | Apollo Senior Floating Rate Fund, Inc. | 1,668 | ||||||||||||||
| 111,376 | Apollo Tactical Income Fund, Inc. | 1,413 | ||||||||||||||
| 282,886 | BlackRock Debt Strategies Fund, Inc. | 2,769 | ||||||||||||||
| 224,000 | BlackRock Floating Rate Income Strategies Fund, Inc. | 2,735 | ||||||||||||||
| 256,758 | BlackRock Floating Rate Income Trust | 2,994 | ||||||||||||||
| 374,047 | Blackstone Strategic Credit Term Fund | 4,087 | ||||||||||||||
| 1,177,000 | Federated Hermes Treasury Obligations Fund, Institutional Shares^^ | 4.75(c) | 1,177 | |||||||||||||
| 87,240 | First Trust High Income Long/Short Fund | 998 | ||||||||||||||
| 287,965 | First Trust High Yield Opportunities 2027 Term Fund | 3,951 | ||||||||||||||
| 373,586 | First Trust Senior Floating Rate Income Fund II | 3,699 | ||||||||||||||
| 60,395 | Neuberger Berman High Yield Strategies Fund, Inc. | 450 | ||||||||||||||
| 763,163 | Nuveen Credit Strategies Income Fund | 3,854 | ||||||||||||||
| 503,188 | Nuveen Floating Rate Income Opportunity Fund | 3,925 | ||||||||||||||
| 341,503 | PGIM Global High Yield Fund, Inc. | 3,746 | ||||||||||||||
| 324,067 | PGIM High Yield Bond Fund, Inc. | 4,025 | ||||||||||||||
| 277,339 | PGIM Short Duration High Yield Opportunities Fund | 4,129 | ||||||||||||||
| 75,426 | PIMCO Access Income Fund | 1,113 | ||||||||||||||
| 1,098,857 | State Street Institutional Treasury Plus Money Market Fund, Trust Class | 4.97(c) | 162,163 | |||||||||||||
| 1,878,857 | State Street Institutional U.S. Government Money Market Fund, Administrative Class | 4.78(c) | 1,099 | |||||||||||||
| 296,034 | Western Asset Diversified Income Fund | 3,988 | ||||||||||||||
| 310,578 | Western Asset High Income Opportunity Fund, Inc. | 1,174 | ||||||||||||||
| 101,625 | Western Asset High Yield Defined Opportunity Fund, Inc. | 1,194 | ||||||||||||||
Total Investment Companies | 216,351 | |||||||||||||||
Total Investments (cost $217,024) — 97.36% | 216,351 | |||||||||||||||
Other assets in excess of liabilities — 2.64% | 5,871 | |||||||||||||||
Net Assets — 100.00% | $ | 222,222 | ||||||||||||||
Amounts designated as “—” are $0 or have been rounded to $0.
^ | All or part of this security was on loan as of June 30, 2023. |
^^ | Purchased with cash collateral held from securities lending. |
(a) | Escrow security due to bankruptcy. |
(b) | Security was valued using significant unobservable inputs as of June 30, 2023. |
(c) | Annualized 7-day yield as of period-end. |
See accompanying notes to financial statements.
200
HC CAPITAL TRUST
The Corporate Opportunities Portfolio
Portfolio of Investments (concluded) — June 30, 2023
The following table reflects the percentage of total net assets of the Portfolio attributable to each Specialist Manager as of June 30, 2023.
The Corporate Opportunities Portfolio | City of London | Parametric | HC | Total |
Common Stock | — | — | 0.00% | 0.00% |
Investment Companies | 23.86% | 72.96% | 0.54% | 97.36% |
Other Assets (Liabilities) | 0.26% | 2.89% | -0.51% | 2.64% |
Total Net Assets | 24.12% | 75.85% | 0.03% | 100.00% |
Amounts designated as “—” indicate the Specialist Manager did not manage any holdings in that category.
The following table reflects the open derivative positions held by the Portfolio as of June 30, 2023.
Futures Contracts Purchased*
Description | Number of | Expiration Date | Notional | Value and | ||||||||||||
5 Year US Treasury Note Future | 930 | 9/29/23 | $ | 99,597 | $ | (1,971 | ) | |||||||||
E-Mini S&P 500 Future | 305 | 9/15/23 | 68,446 | 2,176 | ||||||||||||
| $ | 168,043 | $ | 205 | |||||||||||||
Total Unrealized Appreciation | $ | 2,176 | ||||||||||||||
Total Unrealized Depreciation | (1,971 | ) | ||||||||||||||
Total Net Unrealized Appreciation/(Depreciation) | $ | 205 | ||||||||||||||
* | Cash has been pledged as collateral for futures contracts held by the Portfolio. |
See accompanying notes to financial statements.
201
HC CAPITAL TRUST
The U.S. Government Fixed Income Securities Portfolio
Portfolio of Investments — June 30, 2023
Principal | Security Description | Rate % | Maturity | Value | ||||||||||||
U.S. Government Agency Securities — 1.17% | ||||||||||||||||
| $ | 200 | Fannie Mae | 0.38 | 8/25/25 | $ | 182 | ||||||||||
| 400 | Fannie Mae | 0.50 | 11/7/25 | 362 | ||||||||||||
| 650 | Fannie Mae | 0.50 | 6/17/25 | 596 | ||||||||||||
| 150 | Fannie Mae | 0.63 | 4/22/25 | 139 | ||||||||||||
| 550 | Fannie Mae | 0.75 | 10/8/27 | 476 | ||||||||||||
| 200 | Fannie Mae | 0.88 | 8/5/30 | 160 | ||||||||||||
| 100 | Fannie Mae, Callable 9/18/23 @ 100.00 | 0.88 | 12/18/26 | 88 | ||||||||||||
| 125 | Fannie Mae | 1.75 | 7/2/24 | 121 | ||||||||||||
| 100 | Fannie Mae | 1.88 | 9/24/26 | 92 | ||||||||||||
| 150 | Fannie Mae | 2.13 | 4/24/26 | 140 | ||||||||||||
| 250 | Fannie Mae | 2.63 | 9/6/24 | 242 | ||||||||||||
| 95 | Fannie Mae | 6.25 | 5/15/29 | 105 | ||||||||||||
| 160 | Fannie Mae | 6.63 | 11/15/30 | 185 | ||||||||||||
| 180 | Fannie Mae | 7.25 | 5/15/30 | 212 | ||||||||||||
| 500 | Federal Farm Credit Bank | 0.88 | 11/18/24 | 471 | ||||||||||||
| 250 | Federal Farm Credit Bank | 1.13 | 1/6/25 | 235 | ||||||||||||
| 75 | Federal Farm Credit Bank, Callable 7/14/23 @ 100.00 | 1.24 | 12/23/30 | 59 | ||||||||||||
| 250 | Federal Farm Credit Bank | 1.75 | 2/14/25 | 237 | ||||||||||||
| 125 | Federal Farm Credit Bank | 3.38 | 8/26/24 | 122 | ||||||||||||
| 200 | Federal Farm Credit Bank | 4.25 | 9/26/24 | 197 | ||||||||||||
| 700 | Federal Home Loan Bank | 0.50 | 4/14/25 | 646 | ||||||||||||
| 100 | Federal Home Loan Bank | 1.25 | 12/21/26 | 90 | ||||||||||||
| 450 | Federal Home Loan Bank | 2.75 | 6/28/24 | 438 | ||||||||||||
| 150 | Federal Home Loan Bank | 2.88 | 9/13/24 | 146 | ||||||||||||
| 250 | Federal Home Loan Bank | 3.25 | 3/8/24 | 246 | ||||||||||||
| 300 | Federal Home Loan Bank | 3.25 | 6/9/28 | 286 | ||||||||||||
| 600 | Federal Home Loan Bank | 3.25 | 11/16/28 | 571 | ||||||||||||
| 800 | Federal Home Loan Bank, Series 2, Callable 8/28/23 @ 100.00 | 4.00 | 8/28/25 | 780 | ||||||||||||
| 250 | Federal Home Loan Bank | 4.63 | 12/13/24 | 248 | ||||||||||||
| 165 | Federal Home Loan Bank | 5.50 | 7/15/36 | 185 | ||||||||||||
| 100 | Freddie Mac, Series 1 | 0.00(a) | 11/15/38 | 49 | ||||||||||||
| 300 | Freddie Mac | 0.25 | 12/4/23 | 294 | ||||||||||||
| 400 | Freddie Mac | 0.38 | 7/21/25 | 365 | ||||||||||||
| 500 | Freddie Mac | 0.38 | 9/23/25 | 453 | ||||||||||||
| 100 | Freddie Mac, Callable 7/27/23 @ 100.00 | 0.80 | 10/27/26 | 88 | ||||||||||||
| 350 | Freddie Mac | 1.50 | 2/12/25 | 330 | ||||||||||||
| 250 | Freddie Mac | 6.25 | 7/15/32 | 291 | ||||||||||||
| 180 | Freddie Mac | 6.75 | 3/15/31 | 211 | ||||||||||||
| 85 | Tennessee Valley Authority | 5.25 | 9/15/39 | 90 | ||||||||||||
| 200 | Tennessee Valley Authority | 5.38 | 4/1/56 | 219 | ||||||||||||
| 100 | Tennessee Valley Authority | 5.88 | 4/1/36 | 112 | ||||||||||||
| 140 | Tennessee Valley Authority | 6.15 | 1/15/38 | 163 | ||||||||||||
Total U.S. Government Agency Securities | 10,722 | |||||||||||||||
U.S. Treasury Obligations — 44.90% | ||||||||||||||||
| 1,500 | U.S. Treasury Bond | 1.13 | 5/15/40 | 972 | ||||||||||||
| 2,625 | U.S. Treasury Bond | 1.13 | 8/15/40 | 1,688 | ||||||||||||
| 2,610 | U.S. Treasury Bond | 1.25 | 5/15/50 | 1,467 | ||||||||||||
See accompanying notes to financial statements.
202
HC CAPITAL TRUST
The U.S. Government Fixed Income Securities Portfolio
Portfolio of Investments (continued) — June 30, 2023
Principal | Security Description | Rate % | Maturity | Value | ||||||||||||
U.S. Treasury Obligations (continued) | ||||||||||||||||
| $ | 2,580 | U.S. Treasury Bond | 1.38 | 8/15/50 | $ | 1,499 | ||||||||||
| 1,965 | U.S. Treasury Bond | 1.38 | 11/15/40 | 1,315 | ||||||||||||
| 2,820 | U.S. Treasury Bond | 1.63 | 11/15/50 | 1,751 | ||||||||||||
| 2,625 | U.S. Treasury Bond | 1.75 | 8/15/41 | 1,844 | ||||||||||||
| 2,140 | U.S. Treasury Bond | 1.88 | 2/15/41 | 1,554 | ||||||||||||
| 3,605 | U.S. Treasury Bond | 1.88 | 11/15/51 | 2,379 | ||||||||||||
| 2,695 | U.S. Treasury Bond | 1.88 | 2/15/51 | 1,785 | ||||||||||||
| 4,335 | U.S. Treasury Bond | 2.00 | 8/15/51 | 2,955 | ||||||||||||
| 1,370 | U.S. Treasury Bond | 2.00 | 2/15/50 | 939 | ||||||||||||
| 3,320 | U.S. Treasury Bond | 2.00 | 11/15/41 | 2,430 | ||||||||||||
| 1,750 | U.S. Treasury Bond | 2.25 | 5/15/41 | 1,348 | ||||||||||||
| 1,250 | U.S. Treasury Bond | 2.25 | 8/15/49 | 908 | ||||||||||||
| 1,985 | U.S. Treasury Bond | 2.25 | 2/15/52 | 1,434 | ||||||||||||
| 1,260 | U.S. Treasury Bond | 2.25 | 8/15/46 | 920 | ||||||||||||
| 3,860 | U.S. Treasury Bond | 2.38 | 5/15/51 | 2,869 | ||||||||||||
| 1,880 | U.S. Treasury Bond | 2.38 | 2/15/42 | 1,464 | ||||||||||||
| 3,000 | U.S. Treasury Bond | 2.38 | 11/15/49 | 2,241 | ||||||||||||
| 1,135 | U.S. Treasury Bond | 2.50 | 2/15/46 | 873 | ||||||||||||
| 800 | U.S. Treasury Bond | 2.50 | 5/15/46 | 615 | ||||||||||||
| 2,015 | U.S. Treasury Bond | 2.50 | 2/15/45 | 1,559 | ||||||||||||
| 2,320 | U.S. Treasury Bond | 2.75 | 11/15/47 | 1,866 | ||||||||||||
| 450 | U.S. Treasury Bond | 2.75 | 8/15/42 | 371 | ||||||||||||
| 1,110 | U.S. Treasury Bond | 2.75 | 8/15/47 | 893 | ||||||||||||
| 855 | U.S. Treasury Bond | 2.75 | 11/15/42 | 703 | ||||||||||||
| 2,381 | U.S. Treasury Bond | 2.88 | 5/15/43 | 1,990 | ||||||||||||
| 2,000 | U.S. Treasury Bond | 2.88 | 5/15/49 | 1,653 | ||||||||||||
| 1,895 | U.S. Treasury Bond | 2.88 | 5/15/52 | 1,570 | ||||||||||||
| 955 | U.S. Treasury Bond | 2.88 | 11/15/46 | 786 | ||||||||||||
| 780 | U.S. Treasury Bond | 2.88 | 8/15/45 | 644 | ||||||||||||
| 955 | U.S. Treasury Bond | 3.00 | 11/15/44 | 808 | ||||||||||||
| 1,370 | U.S. Treasury Bond | 3.00 | 2/15/48 | 1,155 | ||||||||||||
| 1,460 | U.S. Treasury Bond | 3.00 | 8/15/48 | 1,232 | ||||||||||||
| 440 | U.S. Treasury Bond | 3.00 | 2/15/47 | 370 | ||||||||||||
| 1,670 | U.S. Treasury Bond | 3.00 | 8/15/52 | 1,420 | ||||||||||||
| 1,010 | U.S. Treasury Bond | 3.00 | 5/15/45 | 853 | ||||||||||||
| 1,645 | U.S. Treasury Bond | 3.00 | 2/15/49 | 1,391 | ||||||||||||
| 670 | U.S. Treasury Bond | 3.00 | 11/15/45 | 565 | ||||||||||||
| 1,075 | U.S. Treasury Bond | 3.00 | 5/15/47 | 905 | ||||||||||||
| 1,125 | U.S. Treasury Bond | 3.00 | 5/15/42 | 967 | ||||||||||||
| 1,000 | U.S. Treasury Bond | 3.13 | 2/15/42 | 879 | ||||||||||||
| 827 | U.S. Treasury Bond | 3.13 | 2/15/43 | 720 | ||||||||||||
| 1,230 | U.S. Treasury Bond | 3.13 | 8/15/44 | 1,064 | ||||||||||||
| 1,030 | U.S. Treasury Bond | 3.13 | 5/15/48 | 889 | ||||||||||||
| 1,000 | U.S. Treasury Bond | 3.13 | 11/15/41 | 881 | ||||||||||||
| 850 | U.S. Treasury Bond | 3.25 | 5/15/42 | 758 | ||||||||||||
| 1,130 | U.S. Treasury Bond | 3.38 | 5/15/44 | 1,018 | ||||||||||||
| 2,900 | U.S. Treasury Bond | 3.38 | 11/15/48 | 2,622 | ||||||||||||
| 1,315 | U.S. Treasury Bond | 3.38 | 8/15/42 | 1,193 | ||||||||||||
See accompanying notes to financial statements.
203
HC CAPITAL TRUST
The U.S. Government Fixed Income Securities Portfolio
Portfolio of Investments (continued) — June 30, 2023
Principal | Security Description | Rate % | Maturity | Value | ||||||||||||
U.S. Treasury Obligations (continued) | ||||||||||||||||
| $ | 40 | U.S. Treasury Bond | 3.50 | 2/15/39 | $ | 38 | ||||||||||
| 970 | U.S. Treasury Bond | 3.63 | 8/15/43 | 910 | ||||||||||||
| 1,355 | U.S. Treasury Bond | 3.63 | 5/15/53 | 1,303 | ||||||||||||
| 2,100 | U.S. Treasury Bond | 3.63 | 2/15/53 | 2,016 | ||||||||||||
| 1,030 | U.S. Treasury Bond | 3.63 | 2/15/44 | 965 | ||||||||||||
| 645 | U.S. Treasury Bond | 3.75 | 11/15/43 | 616 | ||||||||||||
| 225 | U.S. Treasury Bond | 3.88 | 8/15/40 | 223 | ||||||||||||
| 875 | U.S. Treasury Bond | 3.88 | 2/15/43 | 853 | ||||||||||||
| 150 | U.S. Treasury Bond | 3.88 | 5/15/43 | 146 | ||||||||||||
| 925 | U.S. Treasury Bond | 4.00 | 11/15/52 | 950 | ||||||||||||
| 550 | U.S. Treasury Bond | 4.25 | 11/15/40 | 572 | ||||||||||||
| 30 | U.S. Treasury Bond | 4.25 | 5/15/39 | 31 | ||||||||||||
| 551 | U.S. Treasury Bond | 4.38 | 5/15/41 | 580 | ||||||||||||
| 163 | U.S. Treasury Bond | 4.38 | 5/15/40 | 172 | ||||||||||||
| 855 | U.S. Treasury Bond | 4.38 | 11/15/39 | 905 | ||||||||||||
| 530 | U.S. Treasury Bond | 4.38 | 2/15/38 | 564 | ||||||||||||
| 1,025 | U.S. Treasury Bond | 4.50 | 2/15/36 | 1,105 | ||||||||||||
| 1,150 | U.S. Treasury Bond | 4.50 | 8/15/39 | 1,237 | ||||||||||||
| 255 | U.S. Treasury Bond | 4.50 | 5/15/38 | 274 | ||||||||||||
| 673 | U.S. Treasury Bond | 4.63 | 2/15/40 | 733 | ||||||||||||
| 170 | U.S. Treasury Bond | 4.75 | 2/15/37 | 188 | ||||||||||||
| 1,500 | U.S. Treasury Bond | 4.75 | 2/15/41 | 1,655 | ||||||||||||
| 235 | U.S. Treasury Bond | 5.00 | 5/15/37 | 266 | ||||||||||||
| 425 | U.S. Treasury Bond | 5.25 | 2/15/29 | 447 | ||||||||||||
| 282 | U.S. Treasury Bond | 5.25 | 11/15/28 | 296 | ||||||||||||
| 849 | U.S. Treasury Bond | 5.38 | 2/15/31 | 926 | ||||||||||||
| 400 | U.S. Treasury Bond | 5.50 | 8/15/28 | 423 | ||||||||||||
| 85 | U.S. Treasury Bond | 6.00 | 2/15/26 | 88 | ||||||||||||
| 280 | U.S. Treasury Bond | 6.13 | 8/15/29 | 310 | ||||||||||||
| 265 | U.S. Treasury Bond | 6.13 | 11/15/27 | 284 | ||||||||||||
| 1,090 | U.S. Treasury Bond | 6.25 | 5/15/30 | 1,234 | ||||||||||||
| 100 | U.S. Treasury Bond | 6.38 | 8/15/27 | 108 | ||||||||||||
| 218 | U.S. Treasury Bond | 6.50 | 11/15/26 | 231 | ||||||||||||
| 1,000 | U.S. Treasury Bond | 6.63 | 2/15/27 | 1,071 | ||||||||||||
| 200 | U.S. Treasury Bond | 6.75 | 8/15/26 | 212 | ||||||||||||
| 300 | U.S. Treasury Bond | 6.88 | 8/15/25 | 312 | ||||||||||||
| 295 | U.S. Treasury Bond | 7.63 | 2/15/25 | 306 | ||||||||||||
| 820 | U.S. Treasury Note | 0.25 | 8/31/25 | 744 | ||||||||||||
| 1,675 | U.S. Treasury Note | 0.25 | 6/30/25 | 1,530 | ||||||||||||
| 2,680 | U.S. Treasury Note | 0.25 | 10/31/25 | 2,419 | ||||||||||||
| 1,110 | U.S. Treasury Note | 0.25 | 7/31/25 | 1,010 | ||||||||||||
| 1,990 | U.S. Treasury Note | 0.25 | 9/30/25 | 1,802 | ||||||||||||
| 2,525 | U.S. Treasury Note | 0.25 | 5/31/25 | 2,310 | ||||||||||||
| 2,075 | U.S. Treasury Note | 0.38 | 7/31/27 | 1,775 | ||||||||||||
| 3,130 | U.S. Treasury Note | 0.38 | 9/15/24 | 2,950 | ||||||||||||
| 3,415 | U.S. Treasury Note | 0.38 | 9/30/27 | 2,906 | ||||||||||||
| 1,400 | U.S. Treasury Note | 0.38 | 1/31/26 | 1,257 | ||||||||||||
| 1,895 | U.S. Treasury Note | 0.38 | 12/31/25 | 1,708 | ||||||||||||
See accompanying notes to financial statements.
204
HC CAPITAL TRUST
The U.S. Government Fixed Income Securities Portfolio
Portfolio of Investments (continued) — June 30, 2023
Principal | Security Description | Rate % | Maturity | Value | ||||||||||||
U.S. Treasury Obligations (continued) | ||||||||||||||||
| $ | 2,265 | U.S. Treasury Note | 0.38 | 8/15/24 | $ | 2,143 | ||||||||||
| 2,855 | U.S. Treasury Note | 0.38 | 7/15/24 | 2,711 | ||||||||||||
| 1,500 | U.S. Treasury Note | 0.38 | 11/30/25 | 1,354 | ||||||||||||
| 1,560 | U.S. Treasury Note | 0.38 | 4/30/25 | 1,435 | ||||||||||||
| 1,905 | U.S. Treasury Note | 0.50 | 3/31/25 | 1,762 | ||||||||||||
| 2,600 | U.S. Treasury Note | 0.50 | 5/31/27 | 2,247 | ||||||||||||
| 2,175 | U.S. Treasury Note | 0.50 | 2/28/26 | 1,954 | ||||||||||||
| 2,425 | U.S. Treasury Note | 0.50 | 10/31/27 | 2,070 | ||||||||||||
| 3,090 | U.S. Treasury Note | 0.50 | 8/31/27 | 2,651 | ||||||||||||
| 1,900 | U.S. Treasury Note | 0.50 | 6/30/27 | 1,638 | ||||||||||||
| 1,885 | U.S. Treasury Note | 0.50 | 4/30/27 | 1,633 | ||||||||||||
| 1,575 | U.S. Treasury Note | 0.63 | 3/31/27 | 1,375 | ||||||||||||
| 1,635 | U.S. Treasury Note | 0.63 | 7/31/26 | 1,457 | ||||||||||||
| 3,895 | U.S. Treasury Note | 0.63 | 8/15/30 | 3,103 | ||||||||||||
| 2,720 | U.S. Treasury Note | 0.63 | 5/15/30 | 2,179 | ||||||||||||
| 2,305 | U.S. Treasury Note | 0.63 | 10/15/24 | 2,171 | ||||||||||||
| 2,800 | U.S. Treasury Note | 0.63 | 12/31/27 | 2,392 | ||||||||||||
| 2,885 | U.S. Treasury Note | 0.63 | 11/30/27 | 2,471 | ||||||||||||
| 3,690 | U.S. Treasury Note | 0.75 | 4/30/26 | 3,323 | ||||||||||||
| 2,800 | U.S. Treasury Note | 0.75 | 5/31/26 | 2,515 | ||||||||||||
| 1,845 | U.S. Treasury Note | 0.75 | 8/31/26 | 1,646 | ||||||||||||
| 2,960 | U.S. Treasury Note | 0.75 | 11/15/24 | 2,784 | ||||||||||||
| 3,090 | U.S. Treasury Note | 0.75 | 3/31/26 | 2,793 | ||||||||||||
| 4,025 | U.S. Treasury Note | 0.75 | 1/31/28 | 3,452 | ||||||||||||
| 1,910 | U.S. Treasury Note | 0.88 | 9/30/26 | 1,709 | ||||||||||||
| 2,295 | U.S. Treasury Note | 0.88 | 6/30/26 | 2,068 | ||||||||||||
| 4,830 | U.S. Treasury Note | 0.88 | 11/15/30 | 3,909 | ||||||||||||
| 3,640 | U.S. Treasury Note | 1.00 | 7/31/28 | 3,122 | ||||||||||||
| 2,975 | U.S. Treasury Note | 1.00 | 12/15/24 | 2,800 | ||||||||||||
| 650 | U.S. Treasury Note | 1.13 | 2/28/27 | 580 | ||||||||||||
| 5,490 | U.S. Treasury Note | 1.13 | 2/15/31 | 4,515 | ||||||||||||
| 3,775 | U.S. Treasury Note | 1.13 | 10/31/26 | 3,395 | ||||||||||||
| 2,780 | U.S. Treasury Note | 1.13 | 1/15/25 | 2,614 | ||||||||||||
| 3,550 | U.S. Treasury Note | 1.13 | 8/31/28 | 3,059 | ||||||||||||
| 2,135 | U.S. Treasury Note | 1.13 | 2/28/25 | 2,001 | ||||||||||||
| 2,465 | U.S. Treasury Note | 1.13 | 2/29/28 | 2,148 | ||||||||||||
| 5,385 | U.S. Treasury Note | 1.25 | 8/15/31 | 4,419 | ||||||||||||
| 2,235 | U.S. Treasury Note | 1.25 | 3/31/28 | 1,956 | ||||||||||||
| 2,000 | U.S. Treasury Note | 1.25 | 12/31/26 | 1,800 | ||||||||||||
| 1,515 | U.S. Treasury Note | 1.25 | 8/31/24 | 1,445 | ||||||||||||
| 2,970 | U.S. Treasury Note | 1.25 | 9/30/28 | 2,571 | ||||||||||||
| 3,510 | U.S. Treasury Note | 1.25 | 4/30/28 | 3,066 | ||||||||||||
| 2,660 | U.S. Treasury Note | 1.25 | 5/31/28 | 2,321 | ||||||||||||
| 3,195 | U.S. Treasury Note | 1.25 | 11/30/26 | 2,878 | ||||||||||||
| 3,455 | U.S. Treasury Note | 1.25 | 6/30/28 | 3,008 | ||||||||||||
| 3,775 | U.S. Treasury Note | 1.38 | 10/31/28 | 3,285 | ||||||||||||
| 4,500 | U.S. Treasury Note | 1.38 | 11/15/31 | 3,710 | ||||||||||||
| 3,200 | U.S. Treasury Note | 1.38 | 12/31/28 | 2,776 | ||||||||||||
See accompanying notes to financial statements.
205
HC CAPITAL TRUST
The U.S. Government Fixed Income Securities Portfolio
Portfolio of Investments (continued) — June 30, 2023
Principal | Security Description | Rate % | Maturity | Value | ||||||||||||
U.S. Treasury Obligations (continued) | ||||||||||||||||
| $ | 1,205 | U.S. Treasury Note | 1.38 | 1/31/25 | $ | 1,136 | ||||||||||
| 450 | U.S. Treasury Note | 1.38 | 8/31/26 | 410 | ||||||||||||
| 1,485 | U.S. Treasury Note | 1.50 | 9/30/24 | 1,417 | ||||||||||||
| 3,370 | U.S. Treasury Note | 1.50 | 2/15/25 | 3,181 | ||||||||||||
| 2,400 | U.S. Treasury Note | 1.50 | 11/30/24 | 2,279 | ||||||||||||
| 370 | U.S. Treasury Note | 1.50 | 10/31/24 | 352 | ||||||||||||
| 1,000 | U.S. Treasury Note | 1.50 | 8/15/26 | 914 | ||||||||||||
| 3,750 | U.S. Treasury Note | 1.50 | 11/30/28 | 3,280 | ||||||||||||
| 435 | U.S. Treasury Note | 1.50 | 2/15/30 | 373 | ||||||||||||
| 4,105 | U.S. Treasury Note | 1.50 | 1/31/27 | 3,719 | ||||||||||||
| 600 | U.S. Treasury Note | 1.63 | 9/30/26 | 550 | ||||||||||||
| 2,230 | U.S. Treasury Note | 1.63 | 8/15/29 | 1,945 | ||||||||||||
| 3,500 | U.S. Treasury Note | 1.63 | 5/15/26 | 3,230 | ||||||||||||
| 1,000 | U.S. Treasury Note | 1.63 | 10/31/26 | 914 | ||||||||||||
| 1,400 | U.S. Treasury Note | 1.63 | 2/15/26 | 1,297 | ||||||||||||
| 945 | U.S. Treasury Note | 1.63 | 11/30/26 | 863 | ||||||||||||
| 4,455 | U.S. Treasury Note | 1.63 | 5/15/31 | 3,787 | ||||||||||||
| 2,575 | U.S. Treasury Note | 1.75 | 1/31/29 | 2,277 | ||||||||||||
| 2,350 | U.S. Treasury Note | 1.75 | 11/15/29 | 2,061 | ||||||||||||
| 1,100 | U.S. Treasury Note | 1.75 | 12/31/26 | 1,007 | ||||||||||||
| 1,160 | U.S. Treasury Note | 1.75 | 12/31/24 | 1,103 | ||||||||||||
| 1,095 | U.S. Treasury Note | 1.75 | 3/15/25 | 1,036 | ||||||||||||
| 1,245 | U.S. Treasury Note | 1.75 | 7/31/24 | 1,197 | ||||||||||||
| 2,390 | U.S. Treasury Note | 1.88 | 7/31/26 | 2,213 | ||||||||||||
| 475 | U.S. Treasury Note | 1.88 | 6/30/26 | 441 | ||||||||||||
| 990 | U.S. Treasury Note | 1.88 | 8/31/24 | 951 | ||||||||||||
| 1,650 | U.S. Treasury Note | 1.88 | 2/28/27 | 1,513 | ||||||||||||
| 3,100 | U.S. Treasury Note | 1.88 | 2/15/32 | 2,655 | ||||||||||||
| 2,500 | U.S. Treasury Note | 1.88 | 2/28/29 | 2,223 | ||||||||||||
| 2,971 | U.S. Treasury Note | 2.00 | 2/15/25 | 2,827 | ||||||||||||
| 1,825 | U.S. Treasury Note | 2.00 | 8/15/25 | 1,721 | ||||||||||||
| 2,885 | U.S. Treasury Note | 2.00 | 11/15/26 | 2,669 | ||||||||||||
| 1,450 | U.S. Treasury Note | 2.00 | 6/30/24 | 1,402 | ||||||||||||
| 1,065 | U.S. Treasury Note | 2.13 | 9/30/24 | 1,024 | ||||||||||||
| 1,750 | U.S. Treasury Note | 2.13 | 5/31/26 | 1,637 | ||||||||||||
| 445 | U.S. Treasury Note | 2.13 | 11/30/24 | 426 | ||||||||||||
| 2,985 | U.S. Treasury Note | 2.13 | 5/15/25 | 2,834 | ||||||||||||
| 1,340 | U.S. Treasury Note | 2.13 | 7/31/24 | 1,294 | ||||||||||||
| 1,675 | U.S. Treasury Note | 2.25 | 11/15/25 | 1,582 | ||||||||||||
| 1,785 | U.S. Treasury Note | 2.25 | 2/15/27 | 1,660 | ||||||||||||
| 2,500 | U.S. Treasury Note | 2.25 | 3/31/26 | 2,352 | ||||||||||||
| 1,135 | U.S. Treasury Note | 2.25 | 11/15/24 | 1,090 | ||||||||||||
| 2,575 | U.S. Treasury Note | 2.25 | 8/15/27 | 2,380 | ||||||||||||
| 1,775 | U.S. Treasury Note | 2.25 | 11/15/27 | 1,635 | ||||||||||||
| 790 | U.S. Treasury Note | 2.25 | 10/31/24 | 759 | ||||||||||||
| 795 | U.S. Treasury Note | 2.25 | 12/31/24 | 761 | ||||||||||||
| 3,200 | U.S. Treasury Note | 2.38 | 3/31/29 | 2,922 | ||||||||||||
| 3,475 | U.S. Treasury Note | 2.38 | 8/15/24 | 3,363 | ||||||||||||
See accompanying notes to financial statements.
206
HC CAPITAL TRUST
The U.S. Government Fixed Income Securities Portfolio
Portfolio of Investments (continued) — June 30, 2023
Principal | Security Description | Rate % | Maturity | Value | ||||||||||||
U.S. Treasury Obligations (continued) | ||||||||||||||||
| $ | 2,065 | U.S. Treasury Note | 2.38 | 5/15/29 | $ | 1,883 | ||||||||||
| 2,510 | U.S. Treasury Note | 2.38 | 5/15/27 | 2,337 | ||||||||||||
| 340 | U.S. Treasury Note | 2.38 | 4/30/26 | 321 | ||||||||||||
| 2,000 | U.S. Treasury Note | 2.50 | 3/31/27 | 1,874 | ||||||||||||
| 1,020 | U.S. Treasury Note | 2.50 | 1/31/25 | 979 | ||||||||||||
| 615 | U.S. Treasury Note | 2.63 | 7/31/29 | 568 | ||||||||||||
| 1,250 | U.S. Treasury Note | 2.63 | 5/31/27 | 1,175 | ||||||||||||
| 2,885 | U.S. Treasury Note | 2.63 | 2/15/29 | 2,673 | ||||||||||||
| 1,055 | U.S. Treasury Note | 2.63 | 1/31/26 | 1,004 | ||||||||||||
| 2,120 | U.S. Treasury Note | 2.63 | 4/15/25 | 2,033 | ||||||||||||
| 955 | U.S. Treasury Note | 2.63 | 3/31/25 | 917 | ||||||||||||
| 1,205 | U.S. Treasury Note | 2.63 | 12/31/25 | 1,148 | ||||||||||||
| 2,825 | U.S. Treasury Note | 2.75 | 2/15/28 | 2,655 | ||||||||||||
| 780 | U.S. Treasury Note | 2.75 | 8/31/25 | 747 | ||||||||||||
| 2,500 | U.S. Treasury Note | 2.75 | 2/28/25 | 2,408 | ||||||||||||
| 4,160 | U.S. Treasury Note | 2.75 | 8/15/32 | 3,814 | ||||||||||||
| 3,000 | U.S. Treasury Note | 2.75 | 5/31/29 | 2,793 | ||||||||||||
| 850 | U.S. Treasury Note | 2.75 | 6/30/25 | 815 | ||||||||||||
| 1,525 | U.S. Treasury Note | 2.75 | 5/15/25 | 1,465 | ||||||||||||
| 750 | U.S. Treasury Note | 2.75 | 4/30/27 | 709 | ||||||||||||
| 3,380 | U.S. Treasury Note | 2.88 | 8/15/28 | 3,185 | ||||||||||||
| 3,000 | U.S. Treasury Note | 2.88 | 4/30/29 | 2,813 | ||||||||||||
| 540 | U.S. Treasury Note | 2.88 | 7/31/25 | 519 | ||||||||||||
| 800 | U.S. Treasury Note | 2.88 | 11/30/25 | 767 | ||||||||||||
| 1,505 | U.S. Treasury Note | 2.88 | 5/31/25 | 1,448 | ||||||||||||
| 3,610 | U.S. Treasury Note | 2.88 | 5/15/32 | 3,347 | ||||||||||||
| 2,005 | U.S. Treasury Note | 2.88 | 6/15/25 | 1,929 | ||||||||||||
| 2,995 | U.S. Treasury Note | 2.88 | 5/15/28 | 2,826 | ||||||||||||
| 1,500 | U.S. Treasury Note | 2.88 | 4/30/25 | 1,444 | ||||||||||||
| 880 | U.S. Treasury Note | 3.00 | 10/31/25 | 846 | ||||||||||||
| 995 | U.S. Treasury Note | 3.00 | 9/30/25 | 957 | ||||||||||||
| 1,190 | U.S. Treasury Note | 3.00 | 7/31/24 | 1,160 | ||||||||||||
| 2,585 | U.S. Treasury Note | 3.00 | 7/15/25 | 2,491 | ||||||||||||
| 1,000 | U.S. Treasury Note | 3.00 | 6/30/24 | 976 | ||||||||||||
| 1,930 | U.S. Treasury Note | 3.13 | 8/15/25 | 1,864 | ||||||||||||
| 3,380 | U.S. Treasury Note | 3.13 | 11/15/28 | 3,220 | ||||||||||||
| 1,700 | U.S. Treasury Note | 3.25 | 6/30/29 | 1,626 | ||||||||||||
| 2,200 | U.S. Treasury Note | 3.25 | 6/30/27 | 2,116 | ||||||||||||
| 1,385 | U.S. Treasury Note | 3.25 | 8/31/24 | 1,352 | ||||||||||||
| 3,130 | U.S. Treasury Note | 3.38 | 5/15/33 | 3,019 | ||||||||||||
| 4,830 | U.S. Treasury Note | 3.50 | 2/15/33 | 4,705 | ||||||||||||
| 1,905 | U.S. Treasury Note | 3.50 | 9/15/25 | 1,853 | ||||||||||||
| 2,200 | U.S. Treasury Note | 3.50 | 1/31/28 | 2,137 | ||||||||||||
| 1,245 | U.S. Treasury Note | 3.50 | 1/31/30 | 1,208 | ||||||||||||
| 1,580 | U.S. Treasury Note | 3.63 | 5/15/26 | 1,541 | ||||||||||||
| 1,545 | U.S. Treasury Note | 3.75 | 4/15/26 | 1,512 | ||||||||||||
| 1,500 | U.S. Treasury Note | 3.88 | 4/30/25 | 1,471 | ||||||||||||
| 1,740 | U.S. Treasury Note | 3.88 | 1/15/26 | 1,708 | ||||||||||||
See accompanying notes to financial statements.
207
HC CAPITAL TRUST
The U.S. Government Fixed Income Securities Portfolio
Portfolio of Investments (continued) — June 30, 2023
Principal | Security Description | Rate % | Maturity | Value | ||||||||||||
U.S. Treasury Obligations (continued) | ||||||||||||||||
| $ | 1,325 | U.S. Treasury Note | 3.88 | 12/31/29 | $ | 1,314 | ||||||||||
| 265 | U.S. Treasury Note | 3.88 | 11/30/29 | 263 | ||||||||||||
| 1,900 | U.S. Treasury Note | 4.00 | 2/15/26 | 1,871 | ||||||||||||
| 1,725 | U.S. Treasury Note | 4.00 | 12/15/25 | 1,698 | ||||||||||||
| 1,580 | U.S. Treasury Note | 4.13 | 6/15/26 | 1,564 | ||||||||||||
| 3,720 | U.S. Treasury Note | 4.13 | 11/15/32 | 3,802 | ||||||||||||
| 1,835 | U.S. Treasury Note | 4.25 | 10/15/25 | 1,814 | ||||||||||||
| 1,765 | U.S. Treasury Note | 4.50 | 11/15/25 | 1,756 | ||||||||||||
| 1,555 | U.S. Treasury Note | 4.63 | 3/15/26 | 1,557 | ||||||||||||
Total U.S. Treasury Obligations | 413,009 | |||||||||||||||
Yankee Dollar — 0.01% | ||||||||||||||||
| 115 | AID-Israel (Sovereign Bond) | 5.50 | 9/18/23 | 115 | ||||||||||||
Total Yankee Dollar | 115 | |||||||||||||||
Shares | ||||||||||||||||
Exchange-Traded Fund — 52.59% | ||||||||||||||||
| 10,202,500 | Vanguard Short-Term Inflation-Protected Securities ETF | 483,803 | ||||||||||||||
Total Exchange-Traded Fund | 483,803 | |||||||||||||||
Investment Company — 1.13% | ||||||||||||||||
| 10,373,528 | State Street Institutional Treasury Plus Money Market Fund, Trust Class | 4.97(b) | 10,374 | |||||||||||||
Total Investment Company | 10,374 | |||||||||||||||
Total Investments (cost $968,794) — 99.80% | 918,023 | |||||||||||||||
Other assets in excess of liabilities — 0.20% | 1,849 | |||||||||||||||
Net Assets — 100.00% | $ | 919,872 | ||||||||||||||
(a) | Zero Coupon Security. Effective rate shown is as of June 30, 2023. |
(b) | Annualized 7-day yield as of period-end. |
ETF—Exchange-Traded Fund |
See accompanying notes to financial statements.
208
HC CAPITAL TRUST
The U.S. Government Fixed Income Securities Portfolio
Portfolio of Investments (concluded) — June 30, 2023
The following table reflects the percentage of total net assets of the Portfolio attributable to each Specialist Manager as of June 30, 2023.
The U.S. Government Fixed Income Securities Portfolio | Mellon | Parametric | Total |
U.S. Government Agency Securities | 1.17% | — | 1.17% |
U.S. Treasury Obligations | 44.90% | — | 44.90% |
Yankee Dollar | 0.01% | — | 0.01% |
Exchange-Traded Fund | — | 52.59% | 52.59% |
Investment Company | — | 1.13% | 1.13% |
Other Assets (Liabilities) | 0.13% | 0.07% | 0.20% |
Total Net Assets | 46.21% | 53.79% | 100.00% |
Amounts designated as “—” indicate the Specialist Manager did not manage any holdings in that category.
The following table reflects the open derivative positions held by the Portfolio as of June 30, 2023.
Futures Contracts Purchased*
Description | Number of | Expiration Date | Notional | Value and | ||||||||||||
10 Year US Treasury Note Future | 91 | 9/20/23 | $ | 10,216 | $ | (185 | ) | |||||||||
| $ | 10,216 | $ | (185 | ) | ||||||||||||
Total Unrealized Appreciation | $ | — | ||||||||||||||
Total Unrealized Depreciation | (185 | ) | ||||||||||||||
Total Net Unrealized Appreciation/(Depreciation) | $ | (185 | ) | |||||||||||||
* | Cash has been pledged as collateral for futures contracts held by the Portfolio. |
Options on Futures Contracts
Exchange-traded options on futures contacts written as of June 30, 2023 were as follows:
Description | Put/Call | Number of | Notional | Exercise | Expiration | Value | ||||||||||||||||||
10 Year US Treasury Note Future Option | Put | 50 | $ | 5,600 | $ | 112.00 | 7/21/23 | $ | (29 | ) | ||||||||||||||
10 Year US Treasury Note Future Option | Put | 100 | 10,950 | 109.50 | 8/25/23 | (34 | ) | |||||||||||||||||
10 Year US Treasury Note Future Option | Put | 50 | 5,450 | 109.00 | 8/25/23 | (13 | ) | |||||||||||||||||
10 Year US Treasury Note Future Option | Put | 100 | 11,000 | 110.00 | 8/25/23 | (44 | ) | |||||||||||||||||
| $ | (120 | ) | ||||||||||||||||||||||
See accompanying notes to financial statements.
209
HC CAPITAL TRUST
The U.S. Corporate Fixed Income Securities Portfolio
Portfolio of Investments — June 30, 2023
Principal | Security Description | Rate % | Maturity | Value | ||||||||||||
Corporate Bonds — 74.49% | ||||||||||||||||
| $ | 2,694 | AbbVie, Inc. (Biotechnology) | 4.40 | 11/6/42 | $ | 2,409 | ||||||||||
| 537 | Air Products & Chemicals, Inc. (Chemicals), Callable 11/15/39 @ 100.00 | 2.70 | 5/15/40 | 400 | ||||||||||||
| 530 | Alabama Power Co., Series B (Electric Utilities), Callable 6/1/47 @ 100.00 | 3.70 | 12/1/47 | 412 | ||||||||||||
| 155 | Alabama Power Co. (Electric Utilities), Callable 2/15/44 @ 100.00 | 4.15 | 8/15/44 | 130 | ||||||||||||
| 1,435 | Amgen, Inc. (Biotechnology), Callable 8/21/39 @ 100.00 | 3.15 | 2/21/40 | 1,093 | ||||||||||||
| 2,855 | Amgen, Inc. (Biotechnology), Callable 6/18/29 @ 100.00 | 4.05 | 8/18/29 | 2,705 | ||||||||||||
| 135 | Amgen, Inc. (Biotechnology), Callable 12/15/50 @ 100.00 | 4.66 | 6/15/51 | 121 | ||||||||||||
| 1,790 | Anheuser-Busch Cos. LLC/Anheuser-Busch InBev Worldwide, Inc. (Beverages), Callable 8/1/45 @ 100.00 | 4.90 | 2/1/46 | 1,711 | ||||||||||||
| 1,880 | Anheuser-Busch InBev Worldwide, Inc. (Beverages) | 4.95 | 1/15/42 | 1,839 | ||||||||||||
| 2,465 | Apple, Inc. (Technology Hardware, Storage & Peripherals), Callable 8/23/45 @ 100.00 | 4.65 | 2/23/46 | 2,426 | ||||||||||||
| 1,730 | Aptiv PLC/Aptiv Corp. (Automobile Components), Callable 7/18/23 @ 100.00 | 2.40 | 2/18/25 | 1,633 | ||||||||||||
| 2,519 | AT&T, Inc. (Diversified Telecommunication Services), Callable 3/15/55 @ 100.00 | 3.55 | 9/15/55 | 1,763 | ||||||||||||
| 2,250 | AT&T, Inc. (Diversified Telecommunication Services), Callable 12/1/28 @ 100.00 | 4.35 | 3/1/29 | 2,156 | ||||||||||||
| 875 | AT&T, Inc. (Diversified Telecommunication Services), Callable 9/9/48 @ 100.00 | 4.55 | 3/9/49 | 740 | ||||||||||||
| 255 | Atmos Energy Corp. (Gas Utilities), Callable 4/15/44 @ 100.00 | 4.13 | 10/15/44 | 215 | ||||||||||||
| 1,145 | Atmos Energy Corp. (Gas Utilities), Callable 7/15/42 @ 100.00 | 4.15 | 1/15/43 | 977 | ||||||||||||
| 5,480 | Bank of America Corp. (Banks), Callable 4/22/31 @ 100.00 | 2.69 (SOFR + 132 bps)(a) | 4/22/32 | 4,542 | ||||||||||||
| 5,225 | Bank of America Corp., MTN (Banks), Callable 2/7/29 @ 100.00 | 3.97 (TSFR3M + 147 bps)(a) | 2/7/30 | 4,836 | ||||||||||||
| 1,665 | Berkshire Hathaway Energy Co. (Multi-Utilities), Callable 8/1/44 @ 100.00 | 4.50 | 2/1/45 | 1,414 | ||||||||||||
| 265 | BP Capital Markets America, Inc. (Financial Services), Callable 8/24/49 @ 100.00 | 3.00 | 2/24/50 | 185 | ||||||||||||
| 1,245 | Bristol-Myers Squibb Co. (Pharmaceuticals), Callable 4/26/49 @ 100.00 | 4.25 | 10/26/49 | 1,103 | ||||||||||||
| 2,705 | Brown & Brown, Inc. (Insurance), Callable 12/15/30 @ 100.00 | 2.38 | �� | 3/15/31 | 2,172 | |||||||||||
| 705 | Bunge Ltd. Finance Corp. (Consumer Staples Distribution & Retail), Callable 2/14/31 @ 100.00 | 2.75 | 5/14/31 | 587 | ||||||||||||
| 1,305 | Bunge Ltd. Finance Corp. (Food Products), Callable 5/15/26 @ 100.00 | 3.25 | 8/15/26 | 1,225 | ||||||||||||
| 3,000 | Capital One Financial Corp. (Consumer Finance), Callable 2/1/28 @ 100.00 | 5.47 (SOFR + 208 bps)(a) | 2/1/29 | 2,870 | ||||||||||||
| 500 | Capital One NA (Banks), Callable 1/28/25 @ 100.00 | 2.28 (SOFR + 91 bps)(a) | 1/28/26 | 466 | ||||||||||||
| 3,930 | Charter Communications Operating LLC/Charter Communications Operating Capital (Media), Callable 12/30/28 @ 100.00 | 5.05 | 3/30/29 | 3,757 | ||||||||||||
| 310 | Cisco Systems, Inc. (Communications Equipment) | 5.50 | 1/15/40 | 329 | ||||||||||||
| 2,305 | Citigroup, Inc. (Banks), Callable 3/17/32 @ 100.00 | 3.79 (SOFR + 194 bps)(a) | 3/17/33 | 2,025 | ||||||||||||
| 650 | Citigroup, Inc. (Banks), Callable 4/23/28 @ 100.00 | 4.08 (TSFR3M + 145 bps)(a) | 4/23/29 | 611 | ||||||||||||
| 3,000 | Citigroup, Inc. (Banks), Callable 3/31/30 @ 100.00 | 4.41 (SOFR + 391 bps)(a) | 3/31/31 | 2,818 | ||||||||||||
| 1,244 | Collins Aerospace (Aerospace & Defense), Callable 12/15/26 @ 100.00 ^ | 3.50 | 3/15/27 | 1,171 | ||||||||||||
| 655 | Comcast Corp. (Media), Callable 5/1/49 @ 100.00 | 4.00 | 11/1/49 | 540 | ||||||||||||
| 295 | Comcast Corp. (Media) | 4.65 | 7/15/42 | 271 | ||||||||||||
| 2,185 | Comcast Corp. (Media) | 4.75 | 3/1/44 | 2,025 | ||||||||||||
| 175 | Consolidated Edison Co. of New York, Inc., Series 2008-B (Multi-Utilities) | 6.75 | 4/1/38 | 195 | ||||||||||||
| 455 | Constellation Brands, Inc. (Beverages), Callable 2/1/30 @ 100.00 | 2.88 | 5/1/30 | 396 | ||||||||||||
| 1,695 | Constellation Brands, Inc. (Beverages), Callable 5/1/29 @ 100.00 | 3.15 | 8/1/29 | 1,520 | ||||||||||||
| 2,050 | CSX Corp. (Ground Transportation) | 6.22 | 4/30/40 | 2,210 | ||||||||||||
See accompanying notes to financial statements.
210
HC CAPITAL TRUST
The U.S. Corporate Fixed Income Securities Portfolio
Portfolio of Investments (continued) — June 30, 2023
Principal | Security Description | Rate % | Maturity | Value | ||||||||||||
Corporate Bonds (continued) | ||||||||||||||||
| $ | 2,415 | CVS Health Corp. (Health Care Providers & Services), Callable 9/25/37 @ 100.00 | 4.78 | 3/25/38 | $ | 2,228 | ||||||||||
| 1,130 | CVS Health Corp. (Health Care Providers & Services), Callable 1/20/45 @ 100.00 | 5.13 | 7/20/45 | 1,041 | ||||||||||||
| 1,230 | Dell International LLC/EMC Corp. (Technology Hardware, Storage & Peripherals), Callable 8/1/26 @ 100.00 | 4.90 | 10/1/26 | 1,221 | ||||||||||||
| 1,565 | Devon Energy Corp. (Oil, Gas & Consumable Fuels), Callable 1/15/41 @ 100.00 | 5.60 | 7/15/41 | 1,458 | ||||||||||||
| 315 | Devon Energy Corp. (Oil, Gas & Consumable Fuels), Callable 9/15/25 @ 100.00 | 5.85 | 12/15/25 | 317 | ||||||||||||
| 1,958 | Digital Realty Trust LP (Specialized REITs), Callable 4/15/28 @ 100.00 | 4.45 | 7/15/28 | 1,829 | ||||||||||||
| 805 | Eastern Energy Gas Holdings LLC, Series B (Multi-Utilities), Callable 8/15/29 @ 100.00 | 3.00 | 11/15/29 | 702 | ||||||||||||
| 1,830 | Eastern Energy Gas Holdings LLC (Multi-Utilities), Callable 9/15/24 @ 100.00 | 3.60 | 12/15/24 | 1,769 | ||||||||||||
| 685 | EIDP, Inc. (Chemicals), Callable 4/15/30 @ 100.00 | 2.30 | 7/15/30 | 572 | ||||||||||||
| 600 | Elevance Health, Inc. (Health Care Providers & Services) | 4.63 | 5/15/42 | 539 | ||||||||||||
| 735 | Elevance Health, Inc. (Health Care Providers & Services) | 4.65 | 1/15/43 | 666 | ||||||||||||
| 800 | Energy Transfer LP (Oil, Gas & Consumable Fuels), Callable 3/15/28 @ 100.00 | 4.95 | 6/15/28 | 776 | ||||||||||||
| 1,625 | Energy Transfer LP (Oil, Gas & Consumable Fuels), Callable 7/15/42 @ 100.00 | 4.95 | 1/15/43 | 1,342 | ||||||||||||
| 2,497 | Enterprise Products Operating LLC (Oil, Gas & Consumable Fuels), Callable 9/15/43 @ 100.00 | 4.85 | 3/15/44 | 2,282 | ||||||||||||
| 1,876 | FedEx Corp. Pass Through Trust, Series 2020-1, Class - AA (Air Freight & Logistics) | 1.88 | 2/20/34 | 1,531 | ||||||||||||
| 990 | Fiserv, Inc. (Financial Services), Callable 12/2/32 @ 100.00 | 5.60 | 3/2/33 | 1,005 | ||||||||||||
| 780 | General Motors Co. (Automobiles), Callable 9/1/25 @ 100.00 | 6.13 | 10/1/25 | 785 | ||||||||||||
| 1,815 | General Motors Financial Co., Inc. (Consumer Finance), Callable 1/26/25 @ 100.00 | 2.90 | 2/26/25 | 1,722 | ||||||||||||
| 2,055 | General Motors Financial Co., Inc. (Specialty Retail), Callable 2/6/30 @ 100.00 | 5.85 | 4/6/30 | 2,032 | ||||||||||||
| 1,155 | Gilead Sciences, Inc. (Biotechnology), Callable 8/1/44 @ 100.00 | 4.50 | 2/1/45 | 1,051 | ||||||||||||
| 2,785 | HCA, Inc. (Health Care Providers & Services) | 5.38 | 2/1/25 | 2,757 | ||||||||||||
| 590 | HCA, Inc. (Health Care Providers & Services), Callable 3/1/33 @ 100.00 | 5.50 | 6/1/33 | 589 | ||||||||||||
| 722 | Intel Corp. (Semiconductors & Semiconductor Equipment), Callable 6/8/47 @ 100.00 | 3.73 | 12/8/47 | 561 | ||||||||||||
| 1,840 | Intel Corp. (Semiconductors & Semiconductor Equipment), Callable 11/10/32 @ 100.00 | 5.20 | 2/10/33 | 1,859 | ||||||||||||
| 1,300 | International Business Machines Corp. (IT Services) | 3.00 | 5/15/24 | 1,269 | ||||||||||||
| 765 | International Business Machines Corp. (IT Services) | 4.00 | 6/20/42 | 645 | ||||||||||||
| 795 | International Paper Co. (Containers & Packaging), Callable 5/15/41 @ 100.00 | 6.00 | 11/15/41 | 814 | ||||||||||||
| 2,105 | JPMorgan Chase & Co. (Banks), Callable 4/22/31 @ 100.00 | 2.58 (TSFR3M + 125 bps)(a) | 4/22/32 | 1,744 | ||||||||||||
| 3,018 | JPMorgan Chase & Co. (Banks), Callable 5/6/29 @ 100.00 | 3.70 (TSFR3M + 142 bps)(a) | 5/6/30 | 2,762 | ||||||||||||
| 5,900 | JPMorgan Chase & Co. (Banks), Callable 4/23/28 @ 100.00 | 4.01 (TSFR3M + 138 bps)(a) | 4/23/29 | 5,554 | ||||||||||||
| 1,665 | Kinder Morgan, Inc. (Oil, Gas & Consumable Fuels), Callable 12/1/44 @ 100.00 | 5.55 | 6/1/45 | 1,523 | ||||||||||||
| 1,365 | Lincoln National Corp. (Insurance), Callable 10/15/30 @ 100.00 ^ | 3.40 | 1/15/31 | 1,146 | ||||||||||||
| 2,000 | Lincoln National Corp. (Insurance), Callable 12/1/27 @ 100.00 ^ | 3.80 | 3/1/28 | 1,806 | ||||||||||||
| 200 | LYB International Finance BV (Chemicals), Callable 9/15/43 @ 100.00 | 4.88 | 3/15/44 | 175 | ||||||||||||
| 1,295 | Martin Marietta Materials, Inc., Series CB (Construction Materials), Callable 12/15/29 @ 100.00 | 2.50 | 3/15/30 | 1,088 | ||||||||||||
| 1,275 | Marvell Technology, Inc. (Semiconductors & Semiconductor Equipment), Callable 2/15/28 @ 100.00 | 2.45 | 4/15/28 | 1,111 | ||||||||||||
| 810 | Marvell Technology, Inc. (Semiconductors & Semiconductor Equipment), Callable 1/15/31 @ 100.00 | 2.95 | 4/15/31 | 676 | ||||||||||||
| 3,589 | Microchip Technology, Inc. (Semiconductors & Semiconductor Equipment), Callable 8/7/23 @ 102.13 | 4.25 | 9/1/25 | 3,475 | ||||||||||||
| 2,055 | Microsoft Corp. (Software), Callable 9/17/61 @ 100.00 | 3.04 | 3/17/62 | 1,498 | ||||||||||||
| 960 | Mohawk Industries, Inc. (Household Durables), Callable 2/15/30 @ 100.00 ^ | 3.63 | 5/15/30 | 862 | ||||||||||||
See accompanying notes to financial statements.
211
HC CAPITAL TRUST
The U.S. Corporate Fixed Income Securities Portfolio
Portfolio of Investments (continued) — June 30, 2023
Principal | Security Description | Rate % | Maturity | Value | ||||||||||||
Corporate Bonds (continued) | ||||||||||||||||
| $ | 5,250 | Morgan Stanley, MTN (Capital Markets), Callable 7/20/26 @ 100.00 | 1.51 (SOFR + 86 bps)(a) | 7/20/27 | $ | 4,652 | ||||||||||
| 5,085 | Morgan Stanley, MTN (Capital Markets), Callable 1/23/29 @ 100.00 | 4.43 (TSFR3M + 189 bps)(a) | 1/23/30 | 4,834 | ||||||||||||
| 1,838 | National Rural Utilities Cooperative Finance Corp. (Financial Services), Callable 7/15/32 @ 100.00 | 5.80 | 1/15/33 | 1,922 | ||||||||||||
| 450 | Netflix, Inc. (Entertainment) | 5.88 | 2/15/25 | 452 | ||||||||||||
| 1,490 | NextEra Energy Capital Holdings, Inc. (Electric Utilities), Callable 11/28/32 @ 100.00 | 5.05 | 2/28/33 | 1,468 | ||||||||||||
| 760 | NextEra Energy Capital Holdings, Inc. (Electric Utilities), Callable 8/28/52 @ 100.00 | 5.25 | 2/28/53 | 730 | ||||||||||||
| 1,580 | NNN REIT, Inc. (Retail REITs), Callable 1/15/30 @ 100.00 | 2.50 | 4/15/30 | 1,311 | ||||||||||||
| 1,395 | Northrop Grumman Corp. (Aerospace & Defense), Callable 4/15/47 @ 100.00 | 4.03 | 10/15/47 | 1,194 | ||||||||||||
| 1,056 | Nucor Corp. (Metals & Mining), Callable 2/1/43 @ 100.00 | 5.20 | 8/1/43 | 1,032 | ||||||||||||
| 405 | NVIDIA Corp. (Semiconductors & Semiconductor Equipment), Callable 1/1/30 @ 100.00 | 2.85 | 4/1/30 | 367 | ||||||||||||
| 400 | Oklahoma Gas and Electric Co. (Electric Utilities), Callable 7/15/32 @ 100.00 | 5.40 | 1/15/33 | 406 | ||||||||||||
| 630 | Oklahoma Gas and Electric Co. (Electric Utilities), Callable 10/1/52 @ 100.00 | 5.60 | 4/1/53 | 636 | ||||||||||||
| 1,460 | Oracle Corp. (Software), Callable 11/15/44 @ 100.00 | 4.13 | 5/15/45 | 1,147 | ||||||||||||
| 3,175 | Ovintiv Exploration, Inc. (Oil, Gas & Consumable Fuels), Callable 10/1/25 @ 100.00 | 5.38 | 1/1/26 | 3,151 | ||||||||||||
| 500 | Pfizer Investment Enterprises Pte Ltd. (Capital Markets), Callable 11/19/42 @ 100.00 | 5.11 | 5/19/43 | 497 | ||||||||||||
| 1,080 | Pfizer, Inc. (Pharmaceuticals), Callable 3/15/38 @ 100.00 | 4.10 | 9/15/38 | 977 | ||||||||||||
| 400 | Pfizer, Inc. (Pharmaceuticals) | 4.30 | 6/15/43 | 368 | ||||||||||||
| 1,435 | Philip Morris International, Inc. (Tobacco) | 4.50 | 3/20/42 | 1,237 | ||||||||||||
| 1,290 | Principal Financial Group, Inc. (Insurance), Callable 3/15/30 @ 100.00 | 2.13 | 6/15/30 | 1,043 | ||||||||||||
| 2,534 | Progress Energy, Inc. (Electric Utilities) | 6.00 | 12/1/39 | 2,540 | ||||||||||||
| 1,095 | Prudential Financial, Inc. (Insurance) | 4.60 | 5/15/44 | 954 | ||||||||||||
| 152 | Prudential Financial, Inc. (Insurance) | 6.63 | 6/21/40 | 164 | ||||||||||||
| 265 | Public Service Electric & Gas Co. (Electric Utilities), Callable 3/1/42 @ 100.00 | 3.65 | 9/1/42 | 213 | ||||||||||||
| 674 | Raytheon Technologies Corp. (Aerospace & Defense) | 4.50 | 6/1/42 | 619 | ||||||||||||
| 1,739 | Reliance Steel & Aluminum Co. (Metals & Mining), Callable 7/15/25 @ 100.00 | 1.30 | 8/15/25 | 1,589 | ||||||||||||
| 1,460 | Reliance Steel & Aluminum Co. (Metals & Mining), Callable 5/15/30 @ 100.00 | 2.15 | 8/15/30 | 1,190 | ||||||||||||
| 2,501 | RELX Capital, Inc. (Professional Services), Callable 2/22/30 @ 100.00 | 3.00 | 5/22/30 | 2,225 | ||||||||||||
| 850 | Roper Technologies, Inc. (Software), Callable 3/30/30 @ 100.00 | 2.00 | 6/30/30 | 694 | ||||||||||||
| 930 | Sabra Health Care LP (Health Care REITs), Callable 9/1/31 @ 100.00 | 3.20 | 12/1/31 | 694 | ||||||||||||
| 959 | Sabra Health Care LP (Health Care REITs), Callable 5/15/26 @ 100.00 | 5.13 | 8/15/26 | 904 | ||||||||||||
| 330 | Southern Co. Gas Capital Corp. (Electric Utilities), Callable 3/15/26 @ 100.00 | 3.25 | 6/15/26 | 311 | ||||||||||||
| 920 | Southern Co. Gas Capital Corp. (Electric Utilities), Callable 11/30/46 @ 100.00 | 4.40 | 5/30/47 | 768 | ||||||||||||
| 1,095 | Southwest Airlines Co. (Passenger Airlines), Callable 4/15/27 @ 100.00 | 5.13 | 6/15/27 | 1,087 | ||||||||||||
| 1,850 | TCI Communications, Inc. (Media) | 7.88 | 2/15/26 | 1,966 | ||||||||||||
| 7,890 | The Goldman Sachs Group, Inc. (Capital Markets), Callable 6/5/27 @ 100.00 | 3.69 (TSFR3M + 177 bps)(a) | 6/5/28 | 7,410 | ||||||||||||
| 345 | The Home Depot, Inc. (Specialty Retail), Callable 6/6/48 @ 100.00 | 4.50 | 12/6/48 | 320 | ||||||||||||
| 1,210 | The Home Depot, Inc. (Specialty Retail), Callable 3/15/40 @ 100.00 | 5.40 | 9/15/40 | 1,247 | ||||||||||||
| 1,065 | The Interpublic Group of Cos., Inc. (Media) ^ | 4.20 | 4/15/24 | 1,048 | ||||||||||||
| 2 | The Interpublic Group of Cos., Inc. (Media), Callable 12/30/29 @ 100.00 | 4.75 | 3/30/30 | 2 | ||||||||||||
| 575 | The Interpublic Group of Cos., Inc. (Media), Callable 4/1/48 @ 100.00 | 5.40 | 10/1/48 | 541 | ||||||||||||
| 475 | The Travelers Cos., Inc. (Insurance) | 5.35 | 11/1/40 | 487 | ||||||||||||
| 901 | The Travelers Cos., Inc. (Insurance) | 6.25 | 6/15/37 | 990 | ||||||||||||
| 1,485 | The Walt Disney Co. (Entertainment), Callable 3/15/44 @ 100.00 | 4.75 | 9/15/44 | 1,393 | ||||||||||||
| 720 | T-Mobile US, Inc. (Wireless Telecommunication Services), Callable 7/18/23 @ 101.13 | 2.25 | 2/15/26 | 662 | ||||||||||||
See accompanying notes to financial statements.
212
HC CAPITAL TRUST
The U.S. Corporate Fixed Income Securities Portfolio
Portfolio of Investments (continued) — June 30, 2023
Principal | Security Description | Rate % | Maturity | Value | ||||||||||||
Corporate Bonds (continued) | ||||||||||||||||
| $ | 900 | T-Mobile US, Inc. (Wireless Telecommunication Services), Callable 1/15/30 @ 100.00 | 3.88 | 4/15/30 | $ | 828 | ||||||||||
| 460 | T-Mobile US, Inc. (Wireless Telecommunication Services), Callable 7/15/52 @ 100.00 | 5.65 | 1/15/53 | 468 | ||||||||||||
| 400 | Toyota Motor Credit Corp., MTN (Consumer Finance) | 3.38 | 4/1/30 | 368 | ||||||||||||
| 435 | UDR, Inc. (Residential REITs), Callable 5/15/31 @ 100.00 | 3.00 | 8/15/31 | 368 | ||||||||||||
| 140 | United Parcel Service, Inc. (Air Freight & Logistics), Callable 9/15/48 @ 100.00 | 4.25 | 3/15/49 | 125 | ||||||||||||
| 810 | UnitedHealth Group, Inc. (Health Care Providers & Services), Callable 5/15/41 @ 100.00 | 4.63 | 11/15/41 | 759 | ||||||||||||
| 905 | UnitedHealth Group, Inc. (Health Care Providers & Services) | 4.75 | 7/15/45 | 870 | ||||||||||||
| 1,190 | Valero Energy Corp. (Oil, Gas & Consumable Fuels) | 6.63 | 6/15/37 | 1,269 | ||||||||||||
| 475 | Ventas Realty LP (Health Care REITs), Callable 11/1/24 @ 100.00 | 3.50 | 2/1/25 | 455 | ||||||||||||
| 670 | Ventas Realty LP (Diversified REITs), Callable 2/1/24 @ 100.00 | 3.75 | 5/1/24 | 657 | ||||||||||||
| 945 | Ventas Realty LP (Real Estate Management & Development), Callable 10/15/28 @ 100.00 | 4.40 | 1/15/29 | 876 | ||||||||||||
| 715 | Verizon Communications, Inc. (Diversified Telecommunication Services), Callable 12/15/31 @ 100.00 | 2.36 | 3/15/32 | 575 | ||||||||||||
| 3,830 | Verizon Communications, Inc. (Diversified Telecommunication Services), Callable 9/22/40 @ 100.00 | 3.40 | 3/22/41 | 2,952 | ||||||||||||
| 1,010 | Verizon Communications, Inc. (Diversified Telecommunication Services) | 4.33 | 9/21/28 | 974 | ||||||||||||
| 625 | Virginia Electric and Power Co., Series B (Electric Utilities), Callable 3/15/47 @ 100.00 | 3.80 | 9/15/47 | 490 | ||||||||||||
| 820 | Virginia Electric and Power Co., Series D (Electric Utilities), Callable 2/15/43 @ 100.00 | 4.65 | 8/15/43 | 722 | ||||||||||||
| 1,455 | Warnermedia Holdings, Inc. (Diversified Telecommunication Services), Callable 12/15/31 @ 100.00 | 4.28 | 3/15/32 | 1,291 | ||||||||||||
| 5,380 | Wells Fargo & Co., MTN (Banks), Callable 10/30/29 @ 100.00 | 2.88 (TSFR3M + 143 bps)(a) | 10/30/30 | 4,652 | ||||||||||||
| 2,190 | Wells Fargo & Co., MTN (Banks), Callable 5/22/27 @ 100.00 | 3.58 (TSFR3M + 157 bps)(a) | 5/22/28 | 2,040 | ||||||||||||
| 610 | Wells Fargo & Co. (Banks), Callable 7/25/32 @ 100.00 | 4.90 (SOFR + 210 bps)(a) | 7/25/33 | 585 | ||||||||||||
| 340 | WestRock MWV LLC (Containers & Packaging) | 8.20 | 1/15/30 | 388 | ||||||||||||
| 3,045 | WRKCo, Inc. (Containers & Packaging), Callable 1/15/26 @ 100.00 | 4.65 | 3/15/26 | 2,952 | ||||||||||||
| 1,146 | XTO Energy, Inc. (Oil, Gas & Consumable Fuels) | 6.75 | 8/1/37 | 1,305 | ||||||||||||
Total Corporate Bonds | 198,191 | |||||||||||||||
Yankee Dollars — 8.18% | ||||||||||||||||
| 850 | America Movil SAB de CV (Wireless Telecommunication Services) | 6.13 | 11/15/37 | 901 | ||||||||||||
| 645 | BHP Billiton Finance USA Ltd. (Metals & Mining) | 5.00 | 9/30/43 | 641 | ||||||||||||
| 1,246 | British Telecommunications PLC (Diversified Telecommunication Services) | 9.63 | 12/15/30 | 1,525 | ||||||||||||
| 880 | Canadian Natural Resources Ltd. (Oil, Gas & Consumable Fuels), Callable 6/15/25 @ 100.00 | 2.05 | 7/15/25 | 819 | ||||||||||||
| 2,504 | Canadian Natural Resources Ltd. (Oil, Gas & Consumable Fuels), Callable 3/1/27 @ 100.00 | 3.85 | 6/1/27 | 2,358 | ||||||||||||
| 935 | Canadian Pacific Railway Co. (Transportation Infrastructure) | 7.13 | 10/15/31 | 1,050 | ||||||||||||
| 836 | Deutsche Telekom International Finance BV (Diversified Telecommunication Services) | 8.75 | 6/15/30 | 997 | ||||||||||||
| 1,010 | Diageo Capital PLC (Financial Services) | 5.88 | 9/30/36 | 1,082 | ||||||||||||
| 1,365 | Enbridge, Inc. (Oil, Gas & Consumable Fuels), Callable 2/1/51 @ 100.00 | 3.40 | 8/1/51 | 947 | ||||||||||||
| 1 | Enbridge, Inc. (Oil, Gas & Consumable Fuels), Callable 4/15/27 @ 100.00 | 3.70 | 7/15/27 | 1 | ||||||||||||
| 560 | Equinor ASA (Oil, Gas & Consumable Fuels) | 3.95 | 5/15/43 | 480 | ||||||||||||
| 825 | Equinor ASA (Oil, Gas & Consumable Fuels) | 5.10 | 8/17/40 | 827 | ||||||||||||
| 1,375 | Iberdrola International BV (Electric Utilities) | 5.81 | 3/15/25 | 1,377 | ||||||||||||
| 1,490 | Iberdrola International BV (Electric Utilities) | 6.75 | 7/15/36 | 1,675 | ||||||||||||
| 1,012 | Nutrien Ltd. (Chemicals), Callable 2/13/30 @ 100.00 | 2.95 | 5/13/30 | 878 | ||||||||||||
| 1,143 | Orange SA (Diversified Telecommunication Services) | 9.00 | 3/1/31 | 1,402 | ||||||||||||
See accompanying notes to financial statements.
213
HC CAPITAL TRUST
The U.S. Corporate Fixed Income Securities Portfolio
Portfolio of Investments (continued) — June 30, 2023
Principal | Security Description | Rate % | Maturity | Value | ||||||||||||
Yankee Dollars (continued) | ||||||||||||||||
| $ | 1,445 | Shell International Finance BV (Financial Services) | 4.55 | 8/12/43 | $ | 1,328 | ||||||||||
| 850 | Telefonica Emisiones SA (Diversified Telecommunication Services) | 4.67 | 3/6/38 | 716 | ||||||||||||
| 1,670 | The Toronto-Dominion Bank (Banks) | 3.20 | 3/10/32 | 1,437 | ||||||||||||
| 475 | Vodafone Group PLC (Wireless Telecommunication Services) | 4.13 | 5/30/25 | 463 | ||||||||||||
| 826 | Vodafone Group PLC (Wireless Telecommunication Services) | 6.15 | 2/27/37 | 862 | ||||||||||||
Total Yankee Dollars | 21,766 | |||||||||||||||
Shares | ||||||||||||||||
Exchange-Traded Fund — 14.48% | ||||||||||||||||
| 509,200 | Vanguard Short-Term Corporate Bond ETF | 38,526 | ||||||||||||||
Total Exchange-Traded Fund | 38,526 | |||||||||||||||
Investment Companies — 3.35% | ||||||||||||||||
| 3,847,305 | Federated Hermes Treasury Obligations Fund, Institutional Shares^^ | 4.75(b) | 3,847 | |||||||||||||
| 586,619 | State Street Institutional Treasury Money Market Fund, Premier Class | 5.02(b) | 587 | |||||||||||||
| 4,485,612 | State Street Institutional Treasury Plus Money Market Fund, Trust Class | 4.97(b) | 4,486 | |||||||||||||
Total Investment Companies | 8,920 | |||||||||||||||
Total Investments (cost $292,178) — 100.50% | 267,403 | |||||||||||||||
Liabilities in excess of other assets — (0.50)% | (1,340 | ) | ||||||||||||||
Net Assets — 100.00% | $ | 266,063 | ||||||||||||||
^ | All or part of this security was on loan as of June 30, 2023. |
^^ | Purchased with cash collateral held from securities lending. The value of the collateral could include collateral held for securities that were sold on or before June 30, 2023. |
(a) | Variable Rate Security. The rate disclosed is the rate in effect on June 30, 2023. |
(b) | Annualized 7-day yield as of period-end. |
bps—Basis Points |
ETF—Exchange-Traded Fund |
MTN—Medium Term Note |
REIT—Real Estate Investment Trust |
SOFR—Secured Overnight Financing Rate |
TSFR3M—3 Month SOFR |
See accompanying notes to financial statements.
214
HC CAPITAL TRUST
The U.S. Corporate Fixed Income Securities Portfolio
Portfolio of Investments (concluded) — June 30, 2023
The following table reflects the percentage of total net assets of the Portfolio attributable to each Specialist Manager as of June 30, 2023.
The U.S. Corporate Fixed Income Securities Portfolio | Agincourt | Parametric | HC | Total |
Corporate Bonds | 74.49% | — | — | 74.49% |
Yankee Dollars | 8.18% | — | — | 8.18% |
Exchange-Traded Funds | — | 14.48% | — | 14.48% |
Investment Companies | 1.67% | 0.03% | 1.65% | 3.35% |
Other Assets (Liabilities) | -0.79% | — | 0.29% | -0.50% |
Total Net Assets | 83.55% | 14.51% | 1.94% | 100.00% |
Amounts designated as “—” indicate the Specialist Manager did not manage any holdings in that category.
See accompanying notes to financial statements.
215
HC CAPITAL TRUST
The U.S. Mortgage/Asset Backed Fixed Income Securities Portfolio
Portfolio of Investments — June 30, 2023
Principal | Security Description | Rate % | Maturity | Value | ||||||||||||
Asset Backed Securities — 1.15% | ||||||||||||||||
| $ | 150 | American Express Credit Account Master Trust, Series 2021-1, Class - A | 0.90 | 11/15/26 | $ | 141 | ||||||||||
| 100 | American Express Credit Account Master Trust, Series 2022-2, Class - A | 3.39 | 5/15/27 | 97 | ||||||||||||
| 150 | American Express Credit Account Master Trust, Series 2022-4, Class - A | 4.95 | 10/15/27 | 149 | ||||||||||||
| 100 | BA Credit Card Trust, Series 2022-A1, Class - A1 | 3.53 | 11/15/27 | 97 | ||||||||||||
| 100 | Barclays Dryrock Issuance Trust, Series 2022-1, Class - A | 3.07 | 2/15/28 | 96 | ||||||||||||
| 140 | Capital One Multi-Asset Execution Trust, Series 2021-A2, Class - A2 | 1.39 | 7/15/30 | 118 | ||||||||||||
| 200 | Capital One Multi-Asset Execution Trust, Series 2022-A2, Class - A | 3.49 | 5/15/27 | 192 | ||||||||||||
| 100 | Capital One Prime Auto Receivables Trust, Series 2022-1, Class - A3, Callable 3/15/26 @ 100.00 | 3.17 | 4/15/27 | 96 | ||||||||||||
| 100 | CarMax Auto Owner Trust, Series 2023-1, Class - A3, Callable 5/15/26 @ 100.00 | 4.75 | 10/15/27 | 99 | ||||||||||||
| 150 | GM Financial Consumer Automobile Receivables Trust, Series 2023-1, Class - A3, Callable 8/16/26 @ 100.00 | 4.66 | 2/16/28 | 148 | ||||||||||||
| 100 | Honda Auto Receivables Owner Trust, Series 2021-1, Class - A4, Callable 6/21/24 @ 100.00 | 0.42 | 1/21/28 | 95 | ||||||||||||
| 100 | Hyundai Auto Receivables Trust, Series 2022-A, Class - A3, Callable 6/15/26 @ 100.00 | 2.22 | 10/15/26 | 96 | ||||||||||||
| 100 | Hyundai Auto Receivables Trust, Series 2022-B, Class - A3, Callable 7/15/26 @ 100.00 | 3.72 | 11/16/26 | 97 | ||||||||||||
| 150 | Mercedes-Benz Auto Receivables Trust, Series 2023-1, Class - A3, Callable 5/15/26 @ 100.00 | 4.51 | 11/15/27 | 147 | ||||||||||||
| 100 | Nissan Auto Receivables Owner Trust, Series 2023-A, Class - A3, Callable 10/15/26 @ 100.00 | 4.91 | 11/15/27 | 99 | ||||||||||||
| 100 | Synchrony Card Funding LLC, Series 2022-A1, Class - A, Callable 4/15/25 @ 100.00 | 3.37 | 4/15/28 | 96 | ||||||||||||
| 100 | Toyota Auto Receivables Owner Trust, Series 2021-A, Class - A4, Callable 1/15/25 @ 100.00 | 0.39 | 6/15/26 | 94 | ||||||||||||
| 100 | Toyota Auto Receivables Owner Trust, Series 2022-C, Class - A3, Callable 9/15/26 @ 100.00 | 3.76 | 4/15/27 | 97 | ||||||||||||
| 200 | World Omni Auto Receivables Trust, Series 2021-C, Class - A4, Callable 5/15/25 @ 100.00 | 0.64 | 9/15/27 | 182 | ||||||||||||
| 200 | World Omni Auto Receivables Trust, Series 2020-B, Class - A4, Callable 5/15/24 @ 100.00 | 0.82 | 1/15/26 | 192 | ||||||||||||
| 75 | World Omni Auto Receivables Trust, Series 2023-B, Class - A3, Callable 5/15/26 @ 100.00 | 4.66 | 5/15/28 | 74 | ||||||||||||
Total Asset Backed Securities | 2,502 | |||||||||||||||
Collateralized Mortgage Obligations — 5.40% | ||||||||||||||||
| 150 | Bank, Series 2020-BN26, Class - A4, Callable 3/15/30 @ 100.00 | 2.40 | 3/15/63 | 124 | ||||||||||||
| 300 | Bank, Series 2021-BN37, Class - A5, Callable 11/15/31 @ 100.00 | 2.62(a) | 11/15/64 | 246 | ||||||||||||
| 100 | Bank, Series 2019-BN21, Class - A5, Callable 10/15/29 @ 100.00 | 2.85 | 10/17/52 | 85 | ||||||||||||
| 100 | Bank, Series 2019-BNK19, Class - A3, Callable 7/15/29 @ 100.00 | 3.18 | 8/15/61 | 84 | ||||||||||||
| 225 | Bank, Series 2017-BNK9, Class - ASB, Callable 12/15/29 @ 100.00 | 3.47 | 11/15/54 | 215 | ||||||||||||
| 300 | Bank, Series 2018-BN10, Class - A5, Callable 2/15/28 @ 100.00 | 3.69 | 2/15/61 | 277 | ||||||||||||
| 100 | Bank, Series 2019-BN17, Class - A4, Callable 4/15/29 @ 100.00 | 3.71 | 4/15/52 | 91 | ||||||||||||
| 150 | Bank, Series 2022-BNK41, Class - A4 | 3.92(a) | 4/15/65 | 135 | ||||||||||||
| — | Bank of America Merrill Lynch Commercial Mortgage Trust, Series 2017-BNK3, Class - ASB, Callable 2/15/27 @ 100.00 | 3.37 | 2/15/50 | — | ||||||||||||
| 60 | BBCMS Mortgage Trust, Series 2020-C7, Class - AS, Callable 4/15/30 @ 100.00 | 2.44 | 4/15/53 | 48 | ||||||||||||
| 100 | Benchmark Mortgage Trust, Series 2020-IG1, Class - AS, Callable 1/15/30 @ 100.00 | 2.91(a) | 9/15/43 | 74 | ||||||||||||
| 200 | Benchmark Mortgage Trust, Series 2022-B33, Class - A5, Callable 3/15/32 @ 100.00 | 3.46 | 3/15/55 | 175 | ||||||||||||
| 250 | Benchmark Mortgage Trust, Series 2019-B9, Class - A5, Callable 2/15/29 @ 100.00 | 4.02 | 3/15/52 | 226 | ||||||||||||
| 200 | Benchmark Mortgage Trust, Series 2018-B6, Class - A4, Callable 10/10/28 @ 100.00 | 4.26 | 10/10/51 | 184 | ||||||||||||
| 157 | Citigroup Commercial Mortgage Trust, Series 2015-GC27, Class - A4, Callable 1/10/25 @ 100.00 | 2.88 | 2/10/48 | 151 | ||||||||||||
| 100 | Citigroup Commercial Mortgage Trust, Series 2020-GC46, Class - AS, Callable 2/15/30 @ 100.00 | 2.92 | 2/15/53 | 78 | ||||||||||||
| 150 | Citigroup Commercial Mortgage Trust, Series 2019-C7, Class - A4, Callable 12/15/29 @ 100.00 | 3.10 | 12/15/72 | 130 | ||||||||||||
| 100 | Citigroup Commercial Mortgage Trust, Series 2016-GC37, Class - A4, Callable 3/10/26 @ 100.00 | 3.31 | 4/10/49 | 93 | ||||||||||||
| 100 | Citigroup Commercial Mortgage Trust, Series 2016-GC36, Class - A5, Callable 2/10/26 @ 100.00 | 3.62 | 2/10/49 | 93 | ||||||||||||
| 228 | Citigroup Commercial Mortgage Trust, Series 2014-GC23, Class - A4, Callable 7/10/24 @ 100.00 | 3.62 | 7/10/47 | 221 | ||||||||||||
| 183 | COMM Mortgage Trust, Series 2015-LC19, Class - A4, Callable 1/10/27 @ 100.00 | 3.18 | 2/10/48 | 174 | ||||||||||||
| 80 | COMM Mortgage Trust, Series 2015-DC1, Class - A5, Callable 2/10/25 @ 100.00 | 3.35 | 2/10/48 | 76 | ||||||||||||
See accompanying notes to financial statements.
216
HC CAPITAL TRUST
The U.S. Mortgage/Asset Backed Fixed Income Securities Portfolio
Portfolio of Investments (continued) — June 30, 2023
Principal | Security Description | Rate % | Maturity | Value | ||||||||||||
Collateralized Mortgage Obligations (continued) | ||||||||||||||||
| $ | 100 | COMM Mortgage Trust, Series 2014-UBS4, Class - AM, Callable 7/10/29 @ 100.00 | 3.97 | 8/10/47 | $ | 88 | ||||||||||
| 110 | CSAIL Commercial Mortgage Trust, Series 2016-C7, Class - ASB, Callable 11/15/26 @ 100.00 | 3.31 | 11/15/49 | 105 | ||||||||||||
| 198 | Fannie Mae-ACES, Series 2020-M8, Class - A2 | 1.82 | 2/25/30 | 167 | ||||||||||||
| 170 | Fannie Mae-ACES, Series 2017-M7, Class - A2 | 2.96(a) | 2/25/27 | 160 | ||||||||||||
| 100 | Fannie Mae-ACES, Series 2017-M11, Class - A2 | 2.98 | 8/25/29 | 92 | ||||||||||||
| 196 | Fannie Mae-ACES, Series 2022-M11, Class - A2 | 3.05(a) | 10/25/27 | 183 | ||||||||||||
| 198 | Fannie Mae-ACES, Series 2017-M12, Class - A2 | 3.16(a) | 6/25/27 | 187 | ||||||||||||
| 171 | Fannie Mae-ACES, Series 2017 M15, Class - ATS2 | 3.20(a) | 11/25/27 | 160 | ||||||||||||
| 239 | Fannie Mae-ACES, Series 2018-M14, Class - A2 | 3.70(a) | 8/25/28 | 229 | ||||||||||||
| 182 | Fannie Mae-ACES, Series 2019-M2, Class - A2 | 3.75(a) | 11/25/28 | 174 | ||||||||||||
| 300 | Freddie Mac Multifamily Structured Pass Through Certificates, Series K117, Class - A2 | 1.41 | 8/25/30 | 243 | ||||||||||||
| 300 | Freddie Mac Multifamily Structured Pass Through Certificates, Series K1516, Class - A2 | 1.72 | 5/25/35 | 215 | ||||||||||||
| 96 | Freddie Mac Multifamily Structured Pass Through Certificates, Series K106, Class - A1 | 1.78 | 10/25/29 | 85 | ||||||||||||
| 390 | Freddie Mac Multifamily Structured Pass Through Certificates, Series K126, Class - A2 | 2.07 | 1/25/31 | 329 | ||||||||||||
| 200 | Freddie Mac Multifamily Structured Pass Through Certificates, Series K133, Class - A2 | 2.10 | 9/25/31 | 167 | ||||||||||||
| 300 | Freddie Mac Multifamily Structured Pass Through Certificates, Series K749, Class - AM | 2.12 | 4/25/29 | 262 | ||||||||||||
| 150 | Freddie Mac Multifamily Structured Pass Through Certificates, Series K749, Class - A2 | 2.12(a) | 3/25/29 | 132 | ||||||||||||
| 100 | Freddie Mac Multifamily Structured Pass Through Certificates, Series K136, Class - A2 | 2.13 | 11/25/31 | 84 | ||||||||||||
| 300 | Freddie Mac Multifamily Structured Pass Through Certificates, Series K1521, Class - A2 | 2.18 | 8/25/36 | 225 | ||||||||||||
| 45 | Freddie Mac Multifamily Structured Pass Through Certificates, Series K099, Class - A1 | 2.26 | 6/25/29 | 41 | ||||||||||||
| 56 | Freddie Mac Multifamily Structured Pass Through Certificates, Series K058, Class - A1 | 2.34 | 7/25/26 | 53 | ||||||||||||
| 350 | Freddie Mac Multifamily Structured Pass Through Certificates, Series K055, Class - A2 | 2.67 | 3/25/26 | 330 | ||||||||||||
| 75 | Freddie Mac Multifamily Structured Pass Through Certificates, Series K1514, Class - A2 | 2.86 | 10/25/34 | 64 | ||||||||||||
| 200 | Freddie Mac Multifamily Structured Pass Through Certificates, Series K147, Class - A2 | 3.00 | 6/25/32 | 178 | ||||||||||||
| 100 | Freddie Mac Multifamily Structured Pass Through Certificates, Series K092, Class - A2 | 3.30 | 4/25/29 | 94 | ||||||||||||
| 100 | Freddie Mac Multifamily Structured Pass Through Certificates, Series K047, Class - A2 | 3.33(a) | 5/25/25 | 97 | ||||||||||||
| 250 | Freddie Mac Multifamily Structured Pass Through Certificates, Series K091, Class - A2 | 3.51 | 3/25/29 | 237 | ||||||||||||
| 250 | Freddie Mac Multifamily Structured Pass Through Certificates, Series K087, Class - A2 | 3.77 | 12/25/28 | 240 | ||||||||||||
| 150 | Freddie Mac Multifamily Structured Pass Through Certificates, Series K-152, Class - A2 | 3.78 | 11/25/32 | 142 | ||||||||||||
| 500 | Freddie Mac Multifamily Structured Pass Through Certificates, Series K077, Class - A2 | 3.85 | 5/25/28 | 483 | ||||||||||||
| 400 | Freddie Mac Multifamily Structured Pass Through Certificates, Series K081, Class - A2 | 3.90(a) | 8/25/28 | 388 | ||||||||||||
| 224 | GS Mortgage Securities Trust, Series 2016-GS2, Class - A3, Callable 5/10/26 @ 100.00 | 2.79 | 5/10/49 | 207 | ||||||||||||
| 200 | GS Mortgage Securities Trust, Series 2019-GC42, Class - A4, Callable 9/10/29 @ 100.00 | 3.00 | 9/10/52 | 173 | ||||||||||||
| 100 | GS Mortgage Securities Trust, Series 2020-GC45, Class - AS, Callable 1/13/30 @ 100.00 | 3.17(a) | 2/13/53 | 83 | ||||||||||||
| 250 | GS Mortgage Securities Trust, Series 2017-GS5, Class - A4, Callable 3/10/27 @ 100.00 | 3.67 | 3/10/50 | 226 | ||||||||||||
| 100 | GS Mortgage Securities Trust, Series 2018-GS10, Class - A5, Callable 7/10/28 @ 100.00 | 4.16(a) | 7/10/51 | 92 | ||||||||||||
| 137 | JPMBB Commercial Mortgage Securities Trust, Series 2014-C24, Class - A5, Callable 10/15/25 @ 100.00 | 3.64 | 11/15/47 | 131 | ||||||||||||
| 183 | JPMBB Commercial Mortgage Securities Trust, Series 2014-C22, Class - A4, Callable 3/15/26 @ 100.00 | 3.80 | 9/15/47 | 175 | ||||||||||||
| 183 | Morgan Stanley Bank of America Merrill Lynch Trust, Series 2015-C20, Class - A4, Callable 11/15/26 @ 100.00 | 3.25 | 2/15/48 | 173 | ||||||||||||
| 200 | Morgan Stanley Bank of America Merrill Lynch Trust, Series 2014-C19, Class - A4, Callable 10/15/26 @ 100.00 | 3.53 | 12/15/47 | 191 | ||||||||||||
| 200 | Morgan Stanley Bank of America Merrill Lynch Trust, Series 2017-C33, Class - A5, Callable 5/15/27 @ 100.00 | 3.60 | 5/15/50 | 184 | ||||||||||||
| 200 | Morgan Stanley Capital I Trust, Series 2017-H1, Class - A4, Callable 6/15/27 @ 100.00 | 3.26 | 6/15/50 | 181 | ||||||||||||
See accompanying notes to financial statements.
217
HC CAPITAL TRUST
The U.S. Mortgage/Asset Backed Fixed Income Securities Portfolio
Portfolio of Investments (continued) — June 30, 2023
Principal | Security Description | Rate % | Maturity | Value | ||||||||||||
Collateralized Mortgage Obligations (continued) | ||||||||||||||||
| $ | 100 | SG Commercial Mortgage Securities Trust, Series 2016-C5, Class - A4, Callable 7/10/26 @ 100.00 | 3.06 | 10/10/48 | $ | 91 | ||||||||||
| 122 | Wells Fargo Commercial Mortgage Trust, Series 2019-C53, Class - A4, Callable 10/15/29 @ 100.00 | 3.04 | 10/15/52 | 105 | ||||||||||||
| 500 | Wells Fargo Commercial Mortgage Trust, Series 2016-C34, Class - A4, Callable 5/15/26 @ 100.00 | 3.10 | 6/15/49 | 459 | ||||||||||||
| 183 | Wells Fargo Commercial Mortgage Trust, Series 2015-C30, Class - A4, Callable 8/15/25 @ 100.00 | 3.66 | 9/15/58 | 173 | ||||||||||||
| 124 | Wells Fargo Commercial Mortgage Trust, Series 2015-P2, Class - A4, Callable 12/15/25 @ 100.00 | 3.81 | 12/15/48 | 117 | ||||||||||||
| 169 | Wells Fargo Commercial Mortgage Trust, Series 2014-LC16, Class - A5, Callable 6/15/24 @ 100.00 | 3.82 | 8/15/50 | 164 | ||||||||||||
| 142 | Wells Fargo Commercial Mortgage Trust, Series 2015-C26, Class - C, Callable 2/15/25 @ 100.00 | 4.07 | 2/15/48 | 128 | ||||||||||||
| 100 | Wells Fargo Commercial Mortgage Trust, Series 2018-C47, Class - A4, Callable 10/15/28 @ 100.00 | 4.44 | 9/15/61 | 95 | ||||||||||||
Total Collateralized Mortgage Obligations | 11,762 | |||||||||||||||
U.S. Government Agency Mortgages — 82.04% | ||||||||||||||||
| 256 | Fannie Mae, Pool #BQ5781 | 1.50 | 11/1/35 | 222 | ||||||||||||
| 314 | Fannie Mae, Pool #BQ3141 | 1.50 | 10/1/35 | 272 | ||||||||||||
| 396 | Fannie Mae, Pool #MA4343 | 1.50 | 5/1/51 | 306 | ||||||||||||
| 145 | Fannie Mae, Pool #MA4310 | 1.50 | 4/1/41 | 118 | ||||||||||||
| 419 | Fannie Mae, Pool #CB0711 | 1.50 | 6/1/51 | 325 | ||||||||||||
| 373 | Fannie Mae, Pool #MA4417 | 1.50 | 9/1/36 | 322 | ||||||||||||
| 88 | Fannie Mae, Pool #MA4445 | 1.50 | 10/1/41 | 72 | ||||||||||||
| 380 | Fannie Mae, Pool #MA4441 | 1.50 | 10/1/36 | 328 | ||||||||||||
| 348 | Fannie Mae, Pool #CB0310 | 1.50 | 4/1/36 | 301 | ||||||||||||
| 21 | Fannie Mae, Pool #MA4181 | 1.50 | 11/1/50 | 16 | ||||||||||||
| 406 | Fannie Mae, Pool #MA4280 | 1.50 | 3/1/51 | 313 | ||||||||||||
| 379 | Fannie Mae, Pool #FM6579 | 1.50 | 3/1/51 | 294 | ||||||||||||
| 81 | Fannie Mae, Pool #MA4286 | 1.50 | 3/1/41 | 66 | ||||||||||||
| 178 | Fannie Mae, Pool #MA4266 | 1.50 | 2/1/41 | 145 | ||||||||||||
| 42 | Fannie Mae, Pool #MA4342 | 1.50 | 5/1/41 | 34 | ||||||||||||
| 134 | Fannie Mae, Pool #FM9249 | 1.50 | 10/1/41 | 109 | ||||||||||||
| 325 | Fannie Mae, Pool #MA4236 | 1.50 | 1/1/51 | 252 | ||||||||||||
| 171 | Fannie Mae, Pool #MA4386 | 1.50 | 7/1/41 | 139 | ||||||||||||
| 441 | Fannie Mae, Pool #MA4354 | 1.50 | 6/1/51 | 341 | ||||||||||||
| 454 | Fannie Mae, Pool #MA4397 | 1.50 | 8/1/51 | 350 | ||||||||||||
| 136 | Fannie Mae, Pool #FS2037 | 1.50 | 5/1/37 | 117 | ||||||||||||
| 387 | Fannie Mae, Pool #CA7696 | 1.50 | 11/1/50 | 299 | ||||||||||||
| 206 | Fannie Mae, Pool #MA4302 | 1.50 | 4/1/36 | 178 | ||||||||||||
| 98 | Fannie Mae, Pool #BT2055 | 1.50 | 3/1/37 | 85 | ||||||||||||
| 391 | Fannie Mae, Pool #MA4304 | 1.50 | 4/1/51 | 301 | ||||||||||||
| 108 | Fannie Mae, Pool #MA4122 | 1.50 | 9/1/35 | 94 | ||||||||||||
| 295 | Fannie Mae, Pool #FS1327 | 1.50 | 6/1/36 | 255 | ||||||||||||
| 387 | Fannie Mae, Pool #CA7695 | 1.50 | 11/1/50 | 299 | ||||||||||||
| 9 | Fannie Mae, Pool #CA0052 | 2.00 | 7/1/32 | 9 | ||||||||||||
| 227 | Fannie Mae, Pool #FM4039 | 2.00 | 10/1/35 | 202 | ||||||||||||
See accompanying notes to financial statements.
218
HC CAPITAL TRUST
The U.S. Mortgage/Asset Backed Fixed Income Securities Portfolio
Portfolio of Investments (continued) — June 30, 2023
Principal | Security Description | Rate % | Maturity | Value | ||||||||||||
U.S. Government Agency Mortgages (continued) | ||||||||||||||||
| $ | 296 | Fannie Mae, Pool #FM3755 | 2.00 | 9/1/35 | $ | 264 | ||||||||||
| 149 | Fannie Mae, Pool #BP6626 | 2.00 | 8/1/50 | 122 | ||||||||||||
| 367 | Fannie Mae, Pool #MA4602 | 2.00 | 5/1/37 | 326 | ||||||||||||
| 42 | Fannie Mae, Pool #MA4071 | 2.00 | 7/1/40 | 35 | ||||||||||||
| 30 | Fannie Mae, Pool #MA4093 | 2.00 | 8/1/40 | 25 | ||||||||||||
| 39 | Fannie Mae, Pool #MA2906 | 2.00 | 2/1/32 | 36 | ||||||||||||
| 329 | Fannie Mae, Pool #CA9183 | 2.00 | 2/1/36 | 293 | ||||||||||||
| 342 | Fannie Mae, Pool #CA7225 | 2.00 | 10/1/50 | 279 | ||||||||||||
| 268 | Fannie Mae, Pool #MA4208 | 2.00 | 12/1/50 | 219 | ||||||||||||
| 455 | Fannie Mae, Pool #FS1334 | 2.00 | 11/1/51 | 373 | ||||||||||||
| 450 | Fannie Mae, Pool #FM4969 | 2.00 | 12/1/50 | 369 | ||||||||||||
| 275 | Fannie Mae, Pool #FS1621 | 2.00 | 7/1/51 | 224 | ||||||||||||
| 15 | Fannie Mae, Pool #AY4232 | 2.00 | 5/1/30 | 14 | ||||||||||||
| 88 | Fannie Mae, Pool #AS1058 | 2.00 | 11/1/28 | 83 | ||||||||||||
| 372 | Fannie Mae, Pool #FM6852 | 2.00 | 5/1/51 | 307 | ||||||||||||
| 381 | Fannie Mae, Pool #FM6448 | 2.00 | 3/1/51 | 313 | ||||||||||||
| 317 | Fannie Mae, Pool #CA7224 | 2.00 | 10/1/50 | 258 | ||||||||||||
| 475 | Fannie Mae, Pool #CA9273 | 2.00 | 2/1/51 | 388 | ||||||||||||
| 430 | Fannie Mae, Pool #FM9704 | 2.00 | 12/1/51 | 352 | ||||||||||||
| 417 | Fannie Mae, Pool #FM9579 | 2.00 | 7/1/51 | 340 | ||||||||||||
| 458 | Fannie Mae, Pool #FM7411 | 2.00 | 5/1/51 | 374 | ||||||||||||
| 16 | Fannie Mae, Pool #AS0001 | 2.00 | 7/1/28 | 15 | ||||||||||||
| 172 | Fannie Mae, Pool #MA4333 | 2.00 | 5/1/41 | 145 | ||||||||||||
| 433 | Fannie Mae, Pool #FM9441 | 2.00 | 4/1/51 | 354 | ||||||||||||
| 395 | Fannie Mae, Pool #CB0325 | 2.00 | 4/1/51 | 322 | ||||||||||||
| 394 | Fannie Mae, Pool #MA4442 | 2.00 | 10/1/36 | 349 | ||||||||||||
| 44 | Fannie Mae, Pool #FM9724 | 2.00 | 11/1/36 | 39 | ||||||||||||
| 374 | Fannie Mae, Pool #MA4128 | 2.00 | 9/1/40 | 310 | ||||||||||||
| 387 | Fannie Mae, Pool #FM5308 | 2.00 | 12/1/50 | 316 | ||||||||||||
| 436 | Fannie Mae, Pool #MA4378 | 2.00 | 7/1/51 | 356 | ||||||||||||
| 299 | Fannie Mae, Pool #BU7103 | 2.00 | 12/1/51 | 244 | ||||||||||||
| 229 | Fannie Mae, Pool #MA4437 | 2.00 | 10/1/51 | 187 | ||||||||||||
| 461 | Fannie Mae, Pool #MA4511 | 2.00 | 1/1/52 | 376 | ||||||||||||
| 137 | Fannie Mae, Pool #MA4287 | 2.00 | 3/1/41 | 116 | ||||||||||||
| 234 | Fannie Mae, Pool #BR4435 | 2.00 | 4/1/51 | 190 | ||||||||||||
| 215 | Fannie Mae, Pool #CA8118 | 2.00 | 12/1/50 | 175 | ||||||||||||
| 506 | Fannie Mae, Pool #FM4788 | 2.00 | 11/1/50 | 415 | ||||||||||||
| 372 | Fannie Mae, Pool #FM6555 | 2.00 | 4/1/51 | 305 | ||||||||||||
| 127 | Fannie Mae, Pool #FM5453 | 2.00 | 1/1/41 | 106 | ||||||||||||
| 242 | Fannie Mae, Pool #FM5044 | 2.00 | 12/1/50 | 199 | ||||||||||||
| 355 | Fannie Mae, Pool #BQ8341 | 2.00 | 12/1/50 | 290 | ||||||||||||
| 347 | Fannie Mae, Pool #BQ7777 | 2.00 | 3/1/36 | 308 | ||||||||||||
| 363 | Fannie Mae, Pool #BQ3004 | 2.00 | 10/1/50 | 297 | ||||||||||||
| 332 | Fannie Mae, Pool #BP9370 | 2.00 | 7/1/50 | 271 | ||||||||||||
| 365 | Fannie Mae, Pool #MA4360 | 2.00 | 6/1/36 | 324 | ||||||||||||
| 150 | Fannie Mae, Pool #MA4204 | 2.00 | 12/1/40 | 125 | ||||||||||||
| 501 | Fannie Mae, Pool #BQ5112 | 2.00 | 11/1/50 | 409 | ||||||||||||
| 174 | Fannie Mae, Pool #MA4176 | 2.00 | 11/1/40 | 149 | ||||||||||||
See accompanying notes to financial statements.
219
HC CAPITAL TRUST
The U.S. Mortgage/Asset Backed Fixed Income Securities Portfolio
Portfolio of Investments (continued) — June 30, 2023
Principal | Security Description | Rate % | Maturity | Value | ||||||||||||
U.S. Government Agency Mortgages (continued) | ||||||||||||||||
| $ | 450 | Fannie Mae, Pool #CA8252 | 2.00 | 12/1/45 | $ | 368 | ||||||||||
| 398 | Fannie Mae, Pool #CA8110 | 2.00 | 12/1/50 | 326 | ||||||||||||
| 424 | Fannie Mae, Pool #BT0240 | 2.00 | 9/1/51 | 346 | ||||||||||||
| 396 | Fannie Mae, Pool #CA7833 | 2.00 | 11/1/50 | 326 | ||||||||||||
| 431 | Fannie Mae, Pool #CB1787 | 2.00 | 10/1/51 | 352 | ||||||||||||
| 409 | Fannie Mae, Pool #CB1620 | 2.00 | 9/1/51 | 334 | ||||||||||||
| 337 | Fannie Mae, Pool #MA4403 | 2.00 | 8/1/36 | 299 | ||||||||||||
| 257 | Fannie Mae, Pool #FS0355 | 2.00 | 9/1/51 | 210 | ||||||||||||
| 410 | Fannie Mae, Pool #CB0497 | 2.00 | 5/1/51 | 336 | ||||||||||||
| 406 | Fannie Mae, Pool #CB0684 | 2.00 | 6/1/51 | 333 | ||||||||||||
| 91 | Fannie Mae, Pool #FS0317 | 2.00 | 2/1/42 | 77 | ||||||||||||
| 67 | Fannie Mae, Pool #BU8781 | 2.00 | 4/1/37 | 59 | ||||||||||||
| 375 | Fannie Mae, Pool #MA4305 | 2.00 | 4/1/51 | 306 | ||||||||||||
| 516 | Fannie Mae, Pool #BR4094 | 2.00 | 1/1/51 | 422 | ||||||||||||
| 330 | Fannie Mae, Pool #MA4303 | 2.00 | 4/1/36 | 293 | ||||||||||||
| 358 | Fannie Mae, Pool #MA4255 | 2.00 | 2/1/51 | 293 | ||||||||||||
| 244 | Fannie Mae, Pool #MA4119 | 2.00 | 9/1/50 | 199 | ||||||||||||
| 464 | Fannie Mae, Pool #BR0948 | 2.00 | 4/1/51 | 378 | ||||||||||||
| 457 | Fannie Mae, Pool #MA4536 | 2.00 | 2/1/37 | 405 | ||||||||||||
| 365 | Fannie Mae, Pool #MA4281 | 2.00 | 3/1/51 | 298 | ||||||||||||
| 353 | Fannie Mae, Pool #MA4237 | 2.00 | 1/1/51 | 289 | ||||||||||||
| 375 | Fannie Mae, Pool #BQ9685 | 2.00 | 1/1/51 | 306 | ||||||||||||
| 255 | Fannie Mae, Pool #MA4355 | 2.00 | 6/1/51 | 208 | ||||||||||||
| 14 | Fannie Mae, Pool #BJ4362 | 2.00 | 11/1/32 | 12 | ||||||||||||
| 414 | Fannie Mae, Pool #MA4182 | 2.00 | 11/1/50 | 338 | ||||||||||||
| 371 | Fannie Mae, Pool #CA8850 | 2.00 | 2/1/51 | 304 | ||||||||||||
| 117 | Fannie Mae, Pool #MA4155 | 2.00 | 10/1/35 | 104 | ||||||||||||
| 88 | Fannie Mae, Pool #MA4474 | 2.00 | 11/1/41 | 74 | ||||||||||||
| 187 | Fannie Mae, Pool #BQ5160 | 2.00 | 12/1/50 | 153 | ||||||||||||
| 459 | Fannie Mae, Pool #MA4158 | 2.00 | 10/1/50 | 375 | ||||||||||||
| 370 | Fannie Mae, Pool #BR2176 | 2.00 | 7/1/36 | 328 | ||||||||||||
| 234 | Fannie Mae, Pool #MA4325 | 2.00 | 5/1/51 | 191 | ||||||||||||
| 464 | Fannie Mae, Pool #CA8933 | 2.00 | 2/1/51 | 381 | ||||||||||||
| 461 | Fannie Mae, Pool #BK8461 | 2.00 | 1/1/51 | 376 | ||||||||||||
| 407 | Fannie Mae, Pool #CA8687 | 2.00 | 1/1/51 | 332 | ||||||||||||
| 254 | Fannie Mae, Pool #FM4231 | 2.50 | 9/1/50 | 217 | ||||||||||||
| 289 | Fannie Mae, Pool #FM3878 | 2.50 | 7/1/50 | 248 | ||||||||||||
| 438 | Fannie Mae, Pool #CB1828 | 2.50 | 10/1/51 | 371 | ||||||||||||
| 219 | Fannie Mae, Pool #CB1131 | 2.50 | 7/1/51 | 186 | ||||||||||||
| 11 | Fannie Mae, Pool #MA3830 | 2.50 | 11/1/39 | 10 | ||||||||||||
| 101 | Fannie Mae, Pool #MA3765 | 2.50 | 9/1/49 | 87 | ||||||||||||
| 262 | Fannie Mae, Pool #MA4256 | 2.50 | 2/1/51 | 222 | ||||||||||||
| 9 | Fannie Mae, Pool #MA3788 | 2.50 | 9/1/39 | 8 | ||||||||||||
| 21 | Fannie Mae, Pool #MA3737 | 2.50 | 8/1/34 | 19 | ||||||||||||
| 143 | Fannie Mae, Pool #MA3902 | 2.50 | 1/1/50 | 123 | ||||||||||||
| 83 | Fannie Mae, Pool #MA1210 | 2.50 | 10/1/27 | 78 | ||||||||||||
| 300 | Fannie Mae, Pool #CA7237 | 2.50 | 10/1/50 | 256 | ||||||||||||
| 49 | Fannie Mae, Pool #MA3955 | 2.50 | 3/1/35 | 44 | ||||||||||||
See accompanying notes to financial statements.
220
HC CAPITAL TRUST
The U.S. Mortgage/Asset Backed Fixed Income Securities Portfolio
Portfolio of Investments (continued) — June 30, 2023
Principal | Security Description | Rate % | Maturity | Value | ||||||||||||
U.S. Government Agency Mortgages (continued) | ||||||||||||||||
| $ | 6 | Fannie Mae, Pool #AS8172 | 2.50 | 10/1/36 | $ | 5 | ||||||||||
| 319 | Fannie Mae, Pool #FM4309 | 2.50 | 9/1/50 | 272 | ||||||||||||
| 466 | Fannie Mae, Pool #CA9289 | 2.50 | 2/1/51 | 396 | ||||||||||||
| 471 | Fannie Mae, Pool #FS0235 | 2.50 | 1/1/52 | 400 | ||||||||||||
| 251 | Fannie Mae, Pool #CA6304 | 2.50 | 7/1/50 | 213 | ||||||||||||
| 232 | Fannie Mae, Pool #CA6074 | 2.50 | 6/1/50 | 200 | ||||||||||||
| 81 | Fannie Mae, Pool #MA1277 | 2.50 | 12/1/27 | 76 | ||||||||||||
| 68 | Fannie Mae, Pool #FM3296 | 2.50 | 5/1/35 | 62 | ||||||||||||
| 239 | Fannie Mae, Pool #FM2881 | 2.50 | 4/1/50 | 205 | ||||||||||||
| 235 | Fannie Mae, Pool #BO4657 | 2.50 | 11/1/49 | 201 | ||||||||||||
| 57 | Fannie Mae, Pool #BE3032 | 2.50 | 1/1/32 | 53 | ||||||||||||
| 179 | Fannie Mae, Pool #MA4414 | 2.50 | 9/1/51 | 152 | ||||||||||||
| 54 | Fannie Mae, Pool #AU6387 | 2.50 | 11/1/28 | 50 | ||||||||||||
| 49 | Fannie Mae, Pool #MA3764 | 2.50 | 9/1/34 | 45 | ||||||||||||
| 414 | Fannie Mae, Pool #FM8997 | 2.50 | 10/1/51 | 353 | ||||||||||||
| 404 | Fannie Mae, Pool #CB0415 | 2.50 | 5/1/51 | 342 | ||||||||||||
| 26 | Fannie Mae, Pool #MA4016 | 2.50 | 5/1/40 | 23 | ||||||||||||
| 66 | Fannie Mae, Pool #MA4053 | 2.50 | 6/1/35 | 61 | ||||||||||||
| 419 | Fannie Mae, Pool #CB1556 | 2.50 | 9/1/51 | 358 | ||||||||||||
| 37 | Fannie Mae, Pool #AS8246 | 2.50 | 11/1/31 | 34 | ||||||||||||
| 20 | Fannie Mae, Pool #BJ3742 | 2.50 | 12/1/32 | 19 | ||||||||||||
| 24 | Fannie Mae, Pool #MA3282 | 2.50 | 2/1/33 | 22 | ||||||||||||
| 228 | Fannie Mae, Pool #MA4210 | 2.50 | 12/1/50 | 195 | ||||||||||||
| 7 | Fannie Mae, Pool #MA2888 | 2.50 | 1/1/47 | 6 | ||||||||||||
| 28 | Fannie Mae, Pool #BJ3944 | 2.50 | 1/1/33 | 26 | ||||||||||||
| 242 | Fannie Mae, Pool #BP5878 | 2.50 | 6/1/50 | 206 | ||||||||||||
| 27 | Fannie Mae, Pool #MA3801 | 2.50 | 10/1/49 | 23 | ||||||||||||
| 299 | Fannie Mae, Pool #FM4638 | 2.50 | 10/1/50 | 254 | ||||||||||||
| 30 | Fannie Mae, Pool #MA3217 | 2.50 | 12/1/32 | 28 | ||||||||||||
| 19 | Fannie Mae, Pool #MA2868 | 2.50 | 1/1/32 | 18 | ||||||||||||
| 51 | Fannie Mae, Pool #AS8892 | 2.50 | 2/1/32 | 46 | ||||||||||||
| 48 | Fannie Mae, Pool #MA3896 | 2.50 | 1/1/35 | 44 | ||||||||||||
| 9 | Fannie Mae, Pool #MA2854 | 2.50 | 12/1/46 | 7 | ||||||||||||
| 235 | Fannie Mae, Pool #BK2588 | 2.50 | 5/1/50 | 200 | ||||||||||||
| 91 | Fannie Mae, Pool #MA3154 | 2.50 | 10/1/32 | 83 | ||||||||||||
| 411 | Fannie Mae, Pool #BU5917 | 2.50 | 12/1/51 | 352 | ||||||||||||
| 334 | Fannie Mae, Pool #BQ5110 | 2.50 | 11/1/50 | 285 | ||||||||||||
| 432 | Fannie Mae, Pool #BU1451 | 2.50 | 1/1/52 | 367 | ||||||||||||
| 70 | Fannie Mae, Pool #AP4742 | 2.50 | 8/1/27 | 66 | ||||||||||||
| 94 | Fannie Mae, Pool #MA3827 | 2.50 | 11/1/34 | 87 | ||||||||||||
| 306 | Fannie Mae, Pool #CA8955 | 2.50 | 2/1/51 | 261 | ||||||||||||
| 246 | Fannie Mae, Pool #MA4078 | 2.50 | 7/1/50 | 210 | ||||||||||||
| 261 | Fannie Mae, Pool #CA6075 | 2.50 | 6/1/50 | 225 | ||||||||||||
| 404 | Fannie Mae, Pool #MA4517 | 2.50 | 1/1/37 | 368 | ||||||||||||
| 64 | Fannie Mae, Pool #MA3965 | 2.50 | 3/1/40 | 56 | ||||||||||||
| 141 | Fannie Mae, Pool #MA3990 | 2.50 | 4/1/50 | 120 | ||||||||||||
| 374 | Fannie Mae, Pool #BR7857 | 2.50 | 5/1/51 | 318 | ||||||||||||
| 145 | Fannie Mae, Pool #BQ0329 | 2.50 | 7/1/50 | 123 | ||||||||||||
See accompanying notes to financial statements.
221
HC CAPITAL TRUST
The U.S. Mortgage/Asset Backed Fixed Income Securities Portfolio
Portfolio of Investments (continued) — June 30, 2023
Principal | Security Description | Rate % | Maturity | Value | ||||||||||||
U.S. Government Agency Mortgages (continued) | ||||||||||||||||
| $ | 186 | Fannie Mae, Pool #MA4075 | 2.50 | 7/1/35 | $ | 170 | ||||||||||
| 13 | Fannie Mae, Pool #AS8437 | 2.50 | 12/1/36 | 12 | ||||||||||||
| 184 | Fannie Mae, Pool #MA4183 | 2.50 | 11/1/50 | 157 | ||||||||||||
| 22 | Fannie Mae, Pool #FM9543 | 2.50 | 12/1/51 | 19 | ||||||||||||
| 472 | Fannie Mae, Pool #CB2523 | 2.50 | 1/1/52 | 403 | ||||||||||||
| 46 | Fannie Mae, Pool #FS0547 | 2.50 | 2/1/52 | 39 | ||||||||||||
| 219 | Fannie Mae, Pool #FM3027 | 2.50 | 12/1/46 | 186 | ||||||||||||
| 61 | Fannie Mae, Pool #BC9041 | 2.50 | 11/1/31 | 57 | ||||||||||||
| 414 | Fannie Mae, Pool #FM9033 | 2.50 | 10/1/51 | 354 | ||||||||||||
| 461 | Fannie Mae, Pool #FM8745 | 2.50 | 9/1/51 | 391 | ||||||||||||
| 215 | Fannie Mae, Pool #CA8132 | 2.50 | 12/1/50 | 183 | ||||||||||||
| 9 | Fannie Mae, Pool #MA1511 | 2.50 | 7/1/33 | 8 | ||||||||||||
| 54 | Fannie Mae, Pool #AU2619 | 2.50 | 8/1/28 | 51 | ||||||||||||
| 14 | Fannie Mae, Pool #AZ6458 | 2.50 | 7/1/30 | 13 | ||||||||||||
| 5 | Fannie Mae, Pool #MA2789 | 2.50 | 10/1/36 | 4 | ||||||||||||
| 333 | Fannie Mae, Pool #CA8131 | 2.50 | 12/1/50 | 284 | ||||||||||||
| 65 | Fannie Mae, Pool #AO3019 | 2.50 | 5/1/27 | 62 | ||||||||||||
| 421 | Fannie Mae, Pool #FS0030 | 2.50 | 4/1/51 | 357 | ||||||||||||
| 164 | Fannie Mae, Pool #MA3246 | 2.50 | 1/1/33 | 150 | ||||||||||||
| 335 | Fannie Mae, Pool #MA4541 | 2.50 | 2/1/42 | 290 | ||||||||||||
| 17 | Fannie Mae, Pool #MA1270 | 2.50 | 11/1/32 | 15 | ||||||||||||
| 248 | Fannie Mae, Pool #MA4096 | 2.50 | 8/1/50 | 211 | ||||||||||||
| 18 | Fannie Mae, Pool #AS0513 | 2.50 | 8/1/43 | 16 | ||||||||||||
| 22 | Fannie Mae, Pool #CB2979 | 2.50 | 2/1/37 | 20 | ||||||||||||
| 76 | Fannie Mae, Pool #AB7391 | 2.50 | 12/1/42 | 66 | ||||||||||||
| 22 | Fannie Mae, Pool #AS4660 | 2.50 | 3/1/30 | 20 | ||||||||||||
| 28 | Fannie Mae, Pool #AU5334 | 2.50 | 11/1/28 | 26 | ||||||||||||
| 426 | Fannie Mae, Pool #CB1784 | 2.50 | 10/1/51 | 361 | ||||||||||||
| 244 | Fannie Mae, Pool #MA4159 | 2.50 | 10/1/50 | 208 | ||||||||||||
| 397 | Fannie Mae, Pool #MA4399 | 2.50 | 8/1/51 | 337 | ||||||||||||
| 123 | Fannie Mae, Pool #MA4099 | 2.50 | 8/1/35 | 112 | ||||||||||||
| 114 | Fannie Mae, Pool #FS1340 | 2.50 | 3/1/52 | 97 | ||||||||||||
| 62 | Fannie Mae, Pool #AS4946 | 2.50 | 5/1/30 | 58 | ||||||||||||
| 156 | Fannie Mae, Pool #MA2730 | 2.50 | 8/1/46 | 134 | ||||||||||||
| 30 | Fannie Mae, Pool #AT2717 | �� | 2.50 | 5/1/43 | 26 | |||||||||||
| 272 | Fannie Mae, Pool #FM3494 | 2.50 | 4/1/48 | 234 | ||||||||||||
| 22 | Fannie Mae, Pool #CA5423 | 3.00 | 3/1/50 | 19 | ||||||||||||
| 23 | Fannie Mae, Pool #MA3304 | 3.00 | 3/1/48 | 20 | ||||||||||||
| 84 | Fannie Mae, Pool #MA3774 | 3.00 | 9/1/49 | 74 | ||||||||||||
| 323 | Fannie Mae, Pool #AB7099 | 3.00 | 11/1/42 | 291 | ||||||||||||
| 10 | Fannie Mae, Pool #MA3078 | 3.00 | 7/1/37 | 9 | ||||||||||||
| 116 | Fannie Mae, Pool #AS7904 | 3.00 | 9/1/46 | 104 | ||||||||||||
| 171 | Fannie Mae, Pool #BP1932 | 3.00 | 4/1/50 | 151 | ||||||||||||
| 10 | Fannie Mae, Pool #MA3218 | 3.00 | 12/1/32 | 10 | ||||||||||||
| 26 | Fannie Mae, Pool #MA3331 | 3.00 | 4/1/48 | 23 | ||||||||||||
| 44 | Fannie Mae, Pool #MA3147 | 3.00 | 10/1/47 | 40 | ||||||||||||
| 24 | Fannie Mae, Pool #MA3339 | 3.00 | 4/1/33 | 22 | ||||||||||||
| 23 | Fannie Mae, Pool #CA4860 | 3.00 | 12/1/49 | 20 | ||||||||||||
See accompanying notes to financial statements.
222
HC CAPITAL TRUST
The U.S. Mortgage/Asset Backed Fixed Income Securities Portfolio
Portfolio of Investments (continued) — June 30, 2023
Principal | Security Description | Rate % | Maturity | Value | ||||||||||||
U.S. Government Agency Mortgages (continued) | ||||||||||||||||
| $ | 49 | Fannie Mae, Pool #MA1527 | 3.00 | 8/1/33 | $ | 46 | ||||||||||
| 40 | Fannie Mae, Pool #AS8186 | 3.00 | 10/1/46 | 36 | ||||||||||||
| 57 | Fannie Mae, Pool #FM1552 | 3.00 | 12/1/47 | 51 | ||||||||||||
| 67 | Fannie Mae, Pool #BE1901 | 3.00 | 12/1/46 | 60 | ||||||||||||
| 22 | Fannie Mae, Pool #MA3247 | 3.00 | 1/1/33 | 20 | ||||||||||||
| 21 | Fannie Mae, Pool #BJ2996 | 3.00 | 1/1/33 | 20 | ||||||||||||
| 8 | Fannie Mae, Pool #MA2065 | 3.00 | 10/1/34 | 8 | ||||||||||||
| 95 | Fannie Mae, Pool #BC4764 | 3.00 | 10/1/46 | 85 | ||||||||||||
| 105 | Fannie Mae, Pool #AT2014 | 3.00 | 4/1/43 | 95 | ||||||||||||
| 259 | Fannie Mae, Pool #BU1241 | 3.00 | 3/1/52 | 227 | ||||||||||||
| 17 | Fannie Mae, Pool #MA2579 | 3.00 | 4/1/36 | 15 | ||||||||||||
| 79 | Fannie Mae, Pool #MA2863 | 3.00 | 1/1/47 | 71 | ||||||||||||
| 423 | Fannie Mae, Pool #CB3172 | 3.00 | 3/1/52 | 373 | ||||||||||||
| 79 | Fannie Mae, Pool #AS8276 | 3.00 | 11/1/46 | 71 | ||||||||||||
| 24 | Fannie Mae, Pool #AS8424 | 3.00 | 12/1/36 | 22 | ||||||||||||
| 27 | Fannie Mae, Pool #AS8483 | 3.00 | 12/1/46 | 24 | ||||||||||||
| 454 | Fannie Mae, Pool #CB2755 | 3.00 | 2/1/52 | 402 | ||||||||||||
| 24 | Fannie Mae, Pool #MA1338 | 3.00 | 2/1/33 | 23 | ||||||||||||
| 13 | Fannie Mae, Pool #MA2897 | 3.00 | 2/1/37 | 12 | ||||||||||||
| 16 | Fannie Mae, Pool #MA2961 | 3.00 | 4/1/37 | 15 | ||||||||||||
| 82 | Fannie Mae, Pool #MA2246 | 3.00 | 4/1/30 | 78 | ||||||||||||
| 18 | Fannie Mae, Pool #MA3897 | 3.00 | 1/1/35 | 17 | ||||||||||||
| 114 | Fannie Mae, Pool #MA3905 | 3.00 | 1/1/50 | 101 | ||||||||||||
| 14 | Fannie Mae, Pool #MA3185 | 3.00 | 11/1/37 | 13 | ||||||||||||
| 24 | Fannie Mae, Pool #MA3631 | 3.00 | 4/1/34 | 23 | ||||||||||||
| 16 | Fannie Mae, Pool #BK1015 | 3.00 | 2/1/33 | 15 | ||||||||||||
| 116 | Fannie Mae, Pool #AL9865 | 3.00 | 2/1/47 | 104 | ||||||||||||
| 29 | Fannie Mae, Pool #MA2230 | 3.00 | 4/1/35 | 27 | ||||||||||||
| 38 | Fannie Mae, Pool #AB4483 | 3.00 | 2/1/27 | 37 | ||||||||||||
| 112 | Fannie Mae, Pool #AS8414 | 3.00 | 11/1/46 | 100 | ||||||||||||
| 26 | Fannie Mae, Pool #AS2312 | 3.00 | 5/1/29 | 25 | ||||||||||||
| 48 | Fannie Mae, Pool #MA1401 | 3.00 | 4/1/33 | 45 | ||||||||||||
| 19 | Fannie Mae, Pool #AS3117 | 3.00 | 8/1/29 | 18 | ||||||||||||
| 28 | Fannie Mae, Pool #BD5076 | 3.00 | 2/1/32 | 27 | ||||||||||||
| 38 | Fannie Mae, Pool #BO9169 | 3.00 | 12/1/49 | 34 | ||||||||||||
| 36 | Fannie Mae, Pool #AW7383 | 3.00 | 8/1/29 | 35 | ||||||||||||
| 19 | Fannie Mae, Pool #AW8295 | 3.00 | 8/1/29 | 18 | ||||||||||||
| 74 | Fannie Mae, Pool #BD4225 | 3.00 | 11/1/46 | 66 | ||||||||||||
| 115 | Fannie Mae, Pool #MA2737 | 3.00 | 9/1/46 | 103 | ||||||||||||
| 74 | Fannie Mae, Pool #MA3106 | 3.00 | 8/1/47 | 66 | ||||||||||||
| 182 | Fannie Mae, Pool #AP6493 | 3.00 | 9/1/42 | 164 | ||||||||||||
| 136 | Fannie Mae, Pool #BD2446 | 3.00 | 1/1/47 | 122 | ||||||||||||
| 6 | Fannie Mae, Pool #BA0826 | 3.00 | 10/1/30 | 6 | ||||||||||||
| 354 | Fannie Mae, Pool #FS2122 | 3.00 | 3/1/52 | 311 | ||||||||||||
| 68 | Fannie Mae, Pool #AK3302 | 3.00 | 3/1/27 | 66 | ||||||||||||
| 34 | Fannie Mae, Pool #FM4317 | 3.00 | 9/1/50 | 30 | ||||||||||||
| 27 | Fannie Mae, Pool #MA3060 | 3.00 | 7/1/32 | 26 | ||||||||||||
| 10 | Fannie Mae, Pool #MA2287 | 3.00 | 6/1/35 | 9 | ||||||||||||
See accompanying notes to financial statements.
223
HC CAPITAL TRUST
The U.S. Mortgage/Asset Backed Fixed Income Securities Portfolio
Portfolio of Investments (continued) — June 30, 2023
Principal | Security Description | Rate % | Maturity | Value | ||||||||||||
U.S. Government Agency Mortgages (continued) | ||||||||||||||||
| $ | 11 | Fannie Mae, Pool #BA4786 | 3.00 | 2/1/31 | $ | 11 | ||||||||||
| 50 | Fannie Mae, Pool #AY4200 | 3.00 | 5/1/45 | 45 | ||||||||||||
| 193 | Fannie Mae, Pool #FS0831 | 3.00 | 3/1/52 | 170 | ||||||||||||
| 238 | Fannie Mae, Pool #FS1374 | 3.00 | 3/1/52 | 210 | ||||||||||||
| 129 | Fannie Mae, Pool #AT0682 | 3.00 | 4/1/43 | 116 | ||||||||||||
| 118 | Fannie Mae, Pool #AB8897 | 3.00 | 4/1/43 | 106 | ||||||||||||
| 151 | Fannie Mae, Pool #AP2465 | 3.00 | 8/1/42 | 136 | ||||||||||||
| 34 | Fannie Mae, Pool #MA2425 | 3.00 | 10/1/30 | 32 | ||||||||||||
| 90 | Fannie Mae, Pool #MA3082 | 3.00 | 7/1/47 | 81 | ||||||||||||
| 6 | Fannie Mae, Pool #MA3738 | 3.00 | 8/1/34 | 5 | ||||||||||||
| 125 | Fannie Mae, Pool #MA2956 | 3.00 | 4/1/47 | 112 | ||||||||||||
| 23 | Fannie Mae, Pool #AU7890 | 3.00 | 9/1/28 | 22 | ||||||||||||
| 93 | Fannie Mae, Pool #BC9003 | 3.00 | 11/1/46 | 83 | ||||||||||||
| 48 | Fannie Mae, Pool #BD5787 | 3.00 | 9/1/46 | 43 | ||||||||||||
| 13 | Fannie Mae, Pool #AR7426 | 3.00 | 7/1/43 | 12 | ||||||||||||
| 33 | Fannie Mae, Pool #MA2773 | 3.00 | 10/1/36 | 30 | ||||||||||||
| 12 | Fannie Mae, Pool #MA2087 | 3.00 | 11/1/34 | 11 | ||||||||||||
| 20 | Fannie Mae, Pool #MA3237 | 3.00 | 1/1/48 | 18 | ||||||||||||
| 66 | Fannie Mae, Pool #BD5545 | 3.00 | 10/1/46 | 59 | ||||||||||||
| 95 | Fannie Mae, Pool #MA2806 | 3.00 | 11/1/46 | 85 | ||||||||||||
| 44 | Fannie Mae, Pool #AS7908 | 3.00 | 9/1/46 | 39 | ||||||||||||
| 22 | Fannie Mae, Pool #AQ3223 | 3.00 | 11/1/27 | 22 | ||||||||||||
| 5 | Fannie Mae, Pool #MA3100 | 3.00 | 8/1/37 | 4 | ||||||||||||
| 53 | Fannie Mae, Pool #MA3179 | 3.00 | 11/1/47 | 47 | ||||||||||||
| 134 | Fannie Mae, Pool #BP6466 | 3.00 | 7/1/50 | 119 | ||||||||||||
| 98 | Fannie Mae, Pool #CA5729 | 3.00 | 5/1/50 | 87 | ||||||||||||
| 24 | Fannie Mae, Pool #MA3090 | 3.00 | 8/1/32 | 23 | ||||||||||||
| 106 | Fannie Mae, Pool #MA3871 | 3.00 | 12/1/49 | 94 | ||||||||||||
| 116 | Fannie Mae, Pool #MA4079 | 3.00 | 7/1/50 | 103 | ||||||||||||
| 111 | Fannie Mae, Pool #MA1307 | 3.00 | 1/1/33 | 104 | ||||||||||||
| 28 | Fannie Mae, Pool #MA2149 | 3.00 | 1/1/30 | 27 | ||||||||||||
| 35 | Fannie Mae, Pool #MA3991 | 3.00 | 4/1/50 | 31 | ||||||||||||
| 125 | Fannie Mae, Pool #AT7620 | 3.00 | 6/1/43 | 112 | ||||||||||||
| 15 | Fannie Mae, Pool #BC4276 | 3.00 | 4/1/46 | 13 | ||||||||||||
| 38 | Fannie Mae, Pool #MA3127 | 3.00 | 9/1/37 | 35 | ||||||||||||
| 16 | Fannie Mae, Pool #AT1575 | 3.00 | 5/1/43 | 14 | ||||||||||||
| 81 | Fannie Mae, Pool #AU3735 | 3.00 | 8/1/43 | 73 | ||||||||||||
| 50 | Fannie Mae, Pool #AS1527 | 3.00 | 1/1/29 | 47 | ||||||||||||
| 90 | Fannie Mae, Pool #AS0196 | 3.00 | 8/1/28 | 86 | ||||||||||||
| 56 | Fannie Mae, Pool #CA5519 | 3.00 | 4/1/50 | 49 | ||||||||||||
| 141 | Fannie Mae, Pool #CA5668 | 3.00 | 5/1/50 | 126 | ||||||||||||
| 196 | Fannie Mae, Pool #FM3395 | 3.00 | 6/1/50 | 173 | ||||||||||||
| 110 | Fannie Mae, Pool #MA3937 | 3.00 | 2/1/50 | 97 | ||||||||||||
| 337 | Fannie Mae, Pool #AQ7920 | 3.00 | 12/1/42 | 303 | ||||||||||||
| 30 | Fannie Mae, Pool #AL9996 | 3.00 | 4/1/32 | 28 | ||||||||||||
| 387 | Fannie Mae, Pool #AP6375 | 3.00 | 9/1/42 | 349 | ||||||||||||
| 76 | Fannie Mae, Pool #BO7242 | 3.00 | 1/1/50 | 68 | ||||||||||||
| 142 | Fannie Mae, Pool #BO6219 | 3.00 | 12/1/49 | 126 | ||||||||||||
See accompanying notes to financial statements.
224
HC CAPITAL TRUST
The U.S. Mortgage/Asset Backed Fixed Income Securities Portfolio
Portfolio of Investments (continued) — June 30, 2023
Principal | Security Description | Rate % | Maturity | Value | ||||||||||||
U.S. Government Agency Mortgages (continued) | ||||||||||||||||
| $ | 421 | Fannie Mae, Pool #BU8883 | 3.00 | 3/1/52 | $ | 370 | ||||||||||
| 77 | Fannie Mae, Pool #AS8784 | 3.00 | 2/1/47 | 69 | ||||||||||||
| 76 | Fannie Mae, Pool #MA2833 | 3.00 | 12/1/46 | 68 | ||||||||||||
| 18 | Fannie Mae, Pool #MA2832 | 3.00 | 12/1/36 | 16 | ||||||||||||
| 12 | Fannie Mae, Pool #MA1058 | 3.00 | 5/1/32 | 11 | ||||||||||||
| 17 | Fannie Mae, Pool #BE9547 | 3.00 | 4/1/47 | 16 | ||||||||||||
| 29 | Fannie Mae, Pool #AL8861 | 3.00 | 7/1/31 | 28 | ||||||||||||
| 37 | Fannie Mae, Pool #CA3788 | 3.00 | 7/1/49 | 33 | ||||||||||||
| 56 | Fannie Mae, Pool #FM2132 | 3.00 | 1/1/50 | 50 | ||||||||||||
| 17 | Fannie Mae, Pool #BM1370 | 3.00 | 4/1/37 | 16 | ||||||||||||
| 95 | Fannie Mae, Pool #BN7703 | 3.00 | 8/1/49 | 84 | ||||||||||||
| 68 | Fannie Mae, Pool #AS4884 | 3.00 | 5/1/45 | 61 | ||||||||||||
| 103 | Fannie Mae, Pool #BO3192 | 3.00 | 10/1/49 | 91 | ||||||||||||
| 109 | Fannie Mae, Pool #BO8947 | 3.00 | 1/1/50 | 97 | ||||||||||||
| 7 | Fannie Mae, Pool #AL9848 | 3.00 | 3/1/47 | 6 | ||||||||||||
| 378 | Fannie Mae, Pool #CB3364 | 3.00 | 4/1/52 | 332 | ||||||||||||
| 373 | Fannie Mae, Pool #CB2759 | 3.00 | 2/1/52 | 329 | ||||||||||||
| 173 | Fannie Mae, Pool #MA4048 | 3.00 | 6/1/50 | 153 | ||||||||||||
| 69 | Fannie Mae, Pool #FM1134 | 3.00 | 4/1/48 | 62 | ||||||||||||
| 70 | Fannie Mae, Pool #MA3960 | 3.00 | 3/1/50 | 62 | ||||||||||||
| 30 | Fannie Mae, Pool #MA3831 | 3.00 | 11/1/39 | 27 | ||||||||||||
| 20 | Fannie Mae, Pool #MA3958 | 3.00 | 3/1/40 | 18 | ||||||||||||
| 40 | Fannie Mae, Pool #CA3754 | 3.00 | 6/1/34 | 38 | ||||||||||||
| 154 | Fannie Mae, Pool #MA4020 | 3.00 | 5/1/50 | 136 | ||||||||||||
| 120 | Fannie Mae, Pool #BO2201 | 3.00 | 9/1/49 | 107 | ||||||||||||
| 124 | Fannie Mae, Pool #FM1370 | 3.00 | 4/1/46 | 111 | ||||||||||||
| 211 | Fannie Mae, Pool #MA3834 | 3.00 | 11/1/49 | 187 | ||||||||||||
| 25 | Fannie Mae, Pool #AS8438 | 3.00 | 12/1/36 | 23 | ||||||||||||
| 68 | Fannie Mae, Pool #AY4829 | 3.00 | 5/1/45 | 61 | ||||||||||||
| 38 | Fannie Mae, Pool #AZ0538 | 3.00 | 9/1/30 | 36 | ||||||||||||
| 31 | Fannie Mae, Pool #MA3744 | 3.00 | 8/1/49 | 28 | ||||||||||||
| 4 | Fannie Mae, Pool #FM1585 | 3.00 | 9/1/49 | 4 | ||||||||||||
| 6 | Fannie Mae, Pool #MA3802 | 3.00 | 10/1/49 | 5 | ||||||||||||
| 25 | Fannie Mae, Pool #MA3934 | 3.00 | 2/1/40 | 23 | ||||||||||||
| 57 | Fannie Mae, Pool #AS8521 | 3.00 | 12/1/46 | 51 | ||||||||||||
| 11 | Fannie Mae, Pool #AZ4358 | 3.00 | 7/1/30 | 10 | ||||||||||||
| 40 | Fannie Mae, Pool #BE4400 | 3.00 | 1/1/47 | 36 | ||||||||||||
| 85 | Fannie Mae, Pool #MA2895 | 3.00 | 2/1/47 | 76 | ||||||||||||
| 21 | Fannie Mae, Pool #BE3861 | 3.00 | 1/1/47 | 19 | ||||||||||||
| 31 | Fannie Mae, Pool #MA2523 | 3.00 | 2/1/36 | 29 | ||||||||||||
| 8 | Fannie Mae, Pool #AX8309 | 3.00 | 11/1/29 | 8 | ||||||||||||
| 12 | Fannie Mae, Pool #AS8056 | 3.00 | 10/1/46 | 10 | ||||||||||||
| 214 | Fannie Mae, Pool #AO0752 | 3.00 | 4/1/42 | 193 | ||||||||||||
| 8 | Fannie Mae, Pool #MA3657 | 3.00 | 5/1/34 | 8 | ||||||||||||
| 191 | Fannie Mae, Pool #MA4579 | 3.00 | 4/1/52 | 168 | ||||||||||||
| 51 | Fannie Mae, Pool #AS7238 | 3.00 | 5/1/46 | 46 | ||||||||||||
| 7 | Fannie Mae, Pool #AK0006 | 3.00 | 1/1/27 | 7 | ||||||||||||
| 15 | Fannie Mae, Pool #AS4334 | 3.00 | 1/1/45 | 14 | ||||||||||||
See accompanying notes to financial statements.
225
HC CAPITAL TRUST
The U.S. Mortgage/Asset Backed Fixed Income Securities Portfolio
Portfolio of Investments (continued) — June 30, 2023
Principal | Security Description | Rate % | Maturity | Value | ||||||||||||
U.S. Government Agency Mortgages (continued) | ||||||||||||||||
| $ | 63 | Fannie Mae, Pool #AS4333 | 3.00 | 1/1/45 | $ | 56 | ||||||||||
| 463 | Fannie Mae, Pool #CA5229 | 3.00 | 2/1/50 | 410 | ||||||||||||
| 451 | Fannie Mae, Pool #CB2756 | 3.00 | 2/1/52 | 399 | ||||||||||||
| 44 | Fannie Mae, Pool #BE3767 | 3.50 | 7/1/47 | 40 | ||||||||||||
| 58 | Fannie Mae, Pool #FM1566 | 3.50 | 11/1/48 | 54 | ||||||||||||
| 56 | Fannie Mae, Pool #MA1059 | 3.50 | 5/1/32 | 54 | ||||||||||||
| 11 | Fannie Mae, Pool #MA3835 | 3.50 | 11/1/49 | 10 | ||||||||||||
| 8 | Fannie Mae, Pool #MA3634 | 3.50 | 4/1/39 | 8 | ||||||||||||
| 77 | Fannie Mae, Pool #FM1543 | 3.50 | 11/1/48 | 71 | ||||||||||||
| 131 | Fannie Mae, Pool #AQ0546 | 3.50 | 11/1/42 | 123 | ||||||||||||
| 50 | Fannie Mae, Pool #AZ9576 | 3.50 | 12/1/45 | 46 | ||||||||||||
| 81 | Fannie Mae, Pool #BM4703 | 3.50 | 2/1/48 | 75 | ||||||||||||
| 72 | Fannie Mae, Pool #FM1911 | 3.50 | 7/1/48 | 67 | ||||||||||||
| 3 | Fannie Mae, Pool #AJ6181 | 3.50 | 12/1/26 | 3 | ||||||||||||
| 57 | Fannie Mae, Pool #MA3026 | 3.50 | 6/1/47 | 52 | ||||||||||||
| 9 | Fannie Mae, Pool #AK0706 | 3.50 | 2/1/27 | 8 | ||||||||||||
| 21 | Fannie Mae, Pool #AP9390 | 3.50 | 10/1/42 | 20 | ||||||||||||
| 20 | Fannie Mae, Pool #BA1893 | 3.50 | 8/1/45 | 18 | ||||||||||||
| 22 | Fannie Mae, Pool #MA3597 | 3.50 | 2/1/49 | 20 | ||||||||||||
| 60 | Fannie Mae, Pool #MA3745 | 3.50 | 8/1/49 | 55 | ||||||||||||
| 76 | Fannie Mae, Pool #AL1717 | 3.50 | 5/1/27 | 73 | ||||||||||||
| 46 | Fannie Mae, Pool #AS4773 | 3.50 | 4/1/45 | 43 | ||||||||||||
| 142 | Fannie Mae, Pool #ZM4908 | 3.50 | 11/1/47 | 131 | ||||||||||||
| 25 | Fannie Mae, Pool #MA3775 | 3.50 | 9/1/49 | 23 | ||||||||||||
| 143 | Fannie Mae, Pool #BP1947 | 3.50 | 4/1/50 | 131 | ||||||||||||
| 50 | Fannie Mae, Pool #MA1980 | 3.50 | 8/1/44 | 46 | ||||||||||||
| 339 | Fannie Mae, Pool #AO2548 | 3.50 | 4/1/42 | 318 | ||||||||||||
| 56 | Fannie Mae, Pool #AU3742 | 3.50 | 8/1/43 | 53 | ||||||||||||
| 45 | Fannie Mae, Pool #FM1028 | 3.50 | 6/1/49 | 41 | ||||||||||||
| 9 | Fannie Mae, Pool #MA3152 | 3.50 | 10/1/37 | 8 | ||||||||||||
| 61 | Fannie Mae, Pool #FM1001 | 3.50 | 11/1/48 | 57 | ||||||||||||
| 19 | Fannie Mae, Pool #CA1191 | 3.50 | 11/1/47 | 18 | ||||||||||||
| 67 | Fannie Mae, Pool #BM2000 | 3.50 | 5/1/47 | 62 | ||||||||||||
| 39 | Fannie Mae, Pool #FM0020 | 3.50 | 7/1/49 | 35 | ||||||||||||
| 61 | Fannie Mae, Pool #MA3663 | 3.50 | 5/1/49 | 56 | ||||||||||||
| 32 | Fannie Mae, Pool #AS5696 | 3.50 | 8/1/45 | 30 | ||||||||||||
| 17 | Fannie Mae, Pool #AE0981 | 3.50 | 3/1/41 | 16 | ||||||||||||
| 5 | Fannie Mae, Pool #MA1021 | 3.50 | 3/1/27 | 5 | ||||||||||||
| 52 | Fannie Mae, Pool #AO4647 | 3.50 | 6/1/42 | 49 | ||||||||||||
| 45 | Fannie Mae, Pool #AO9140 | 3.50 | 7/1/42 | 42 | ||||||||||||
| 4 | Fannie Mae, Pool #AX0159 | 3.50 | 9/1/29 | 4 | ||||||||||||
| 8 | Fannie Mae, Pool #AS2081 | 3.50 | 4/1/29 | 8 | ||||||||||||
| 56 | Fannie Mae, Pool #AS4771 | 3.50 | 4/1/45 | 52 | ||||||||||||
| 20 | Fannie Mae, Pool #FS1774 | 3.50 | 5/1/37 | 19 | ||||||||||||
| 25 | Fannie Mae, Pool #MA2389 | 3.50 | 9/1/35 | 24 | ||||||||||||
| 77 | Fannie Mae, Pool #MA1107 | 3.50 | 7/1/32 | 73 | ||||||||||||
| 5 | Fannie Mae, Pool #AV6407 | 3.50 | 2/1/29 | 5 | ||||||||||||
| 28 | Fannie Mae, Pool #AX5201 | 3.50 | 10/1/29 | 27 | ||||||||||||
See accompanying notes to financial statements.
226
HC CAPITAL TRUST
The U.S. Mortgage/Asset Backed Fixed Income Securities Portfolio
Portfolio of Investments (continued) — June 30, 2023
Principal | Security Description | Rate % | Maturity | Value | ||||||||||||
U.S. Government Agency Mortgages (continued) | ||||||||||||||||
| $ | 7 | Fannie Mae, Pool #BM1231 | 3.50 | 11/1/31 | $ | 7 | ||||||||||
| 9 | Fannie Mae, Pool #MA3059 | 3.50 | 7/1/37 | 8 | ||||||||||||
| 96 | Fannie Mae, Pool #AU1635 | 3.50 | 7/1/43 | 89 | ||||||||||||
| 23 | Fannie Mae, Pool #BC7633 | 3.50 | 6/1/46 | 21 | ||||||||||||
| 35 | Fannie Mae, Pool #BC3126 | 3.50 | 1/1/46 | 33 | ||||||||||||
| 23 | Fannie Mae, Pool #AX7655 | 3.50 | 1/1/45 | 21 | ||||||||||||
| 77 | Fannie Mae, Pool #BC1158 | 3.50 | 2/1/46 | 71 | ||||||||||||
| 63 | Fannie Mae, Pool #MA2125 | 3.50 | 12/1/44 | 58 | ||||||||||||
| 60 | Fannie Mae, Pool #AS0024 | 3.50 | 7/1/43 | 56 | ||||||||||||
| 18 | Fannie Mae, Pool #AS5892 | 3.50 | 10/1/45 | 17 | ||||||||||||
| 10 | Fannie Mae, Pool #MA2692 | 3.50 | 7/1/36 | 9 | ||||||||||||
| 44 | Fannie Mae, Pool #AX2486 | 3.50 | 10/1/44 | 41 | ||||||||||||
| 106 | Fannie Mae, Pool #AO3760 | 3.50 | 5/1/42 | 100 | ||||||||||||
| 4 | Fannie Mae, Pool #AL8776 | 3.50 | 7/1/46 | 4 | ||||||||||||
| 159 | Fannie Mae, Pool #BM1568 | 3.50 | 7/1/47 | 149 | ||||||||||||
| 85 | Fannie Mae, Pool #AS3133 | 3.50 | 8/1/44 | 79 | ||||||||||||
| 38 | Fannie Mae, Pool #AS5068 | 3.50 | 6/1/45 | 36 | ||||||||||||
| 267 | Fannie Mae, Pool #AB6017 | 3.50 | 8/1/42 | 250 | ||||||||||||
| 2 | Fannie Mae, Pool #BA5031 | 3.50 | 1/1/46 | 2 | ||||||||||||
| 50 | Fannie Mae, Pool #AK7497 | 3.50 | 4/1/42 | 47 | ||||||||||||
| 277 | Fannie Mae, Pool #AO8137 | 3.50 | 8/1/42 | 260 | ||||||||||||
| 43 | Fannie Mae, Pool #AS7239 | 3.50 | 5/1/46 | 40 | ||||||||||||
| 79 | Fannie Mae, Pool #AZ0862 | 3.50 | 7/1/45 | 73 | ||||||||||||
| 74 | Fannie Mae, Pool #AY1306 | 3.50 | 3/1/45 | 69 | ||||||||||||
| 61 | Fannie Mae, Pool #MA1982 | 3.50 | 8/1/34 | 58 | ||||||||||||
| 27 | Fannie Mae, Pool #AZ6383 | 3.50 | 9/1/45 | 25 | ||||||||||||
| 26 | Fannie Mae, Pool #AY8856 | 3.50 | 9/1/45 | 25 | ||||||||||||
| 38 | Fannie Mae, Pool #AY3913 | 3.50 | 2/1/45 | 35 | ||||||||||||
| 39 | Fannie Mae, Pool #AY3802 | 3.50 | 2/1/45 | 37 | ||||||||||||
| 25 | Fannie Mae, Pool #BC0163 | 3.50 | 1/1/46 | 23 | ||||||||||||
| 22 | Fannie Mae, Pool #AJ4093 | 3.50 | 10/1/26 | 21 | ||||||||||||
| 24 | Fannie Mae, Pool #AZ2614 | 3.50 | 8/1/45 | 22 | ||||||||||||
| 52 | Fannie Mae, Pool #MA3332 | 3.50 | 4/1/48 | 48 | ||||||||||||
| 5 | Fannie Mae, Pool #MA2996 | 3.50 | 5/1/37 | 4 | ||||||||||||
| 67 | Fannie Mae, Pool #AJ8476 | 3.50 | 12/1/41 | 62 | ||||||||||||
| 239 | Fannie Mae, Pool #CB3601 | 3.50 | 5/1/52 | 218 | ||||||||||||
| 57 | Fannie Mae, Pool #AX9530 | 3.50 | 2/1/45 | 53 | ||||||||||||
| 76 | Fannie Mae, Pool #MA2292 | 3.50 | 6/1/45 | 71 | ||||||||||||
| 26 | Fannie Mae, Pool #AS4772 | 3.50 | 4/1/45 | 24 | ||||||||||||
| 48 | Fannie Mae, Pool #BM5485 | 3.50 | 2/1/49 | 44 | ||||||||||||
| 353 | Fannie Mae, Pool #BU8723 | 3.50 | 6/1/52 | 322 | ||||||||||||
| 59 | Fannie Mae, Pool #FM3387 | 3.50 | 3/1/35 | 56 | ||||||||||||
| 55 | Fannie Mae, Pool #MA3414 | 3.50 | 7/1/48 | 50 | ||||||||||||
| 9 | Fannie Mae, Pool #CA0234 | 3.50 | 8/1/47 | 8 | ||||||||||||
| 70 | Fannie Mae, Pool #MA3305 | 3.50 | 3/1/48 | 64 | ||||||||||||
| 75 | Fannie Mae, Pool #MA3520 | 3.50 | 11/1/48 | 70 | ||||||||||||
| 20 | Fannie Mae, Pool #MA3614 | 3.50 | 3/1/49 | 18 | ||||||||||||
| 26 | Fannie Mae, Pool #MA3462 | 3.50 | 9/1/33 | 25 | ||||||||||||
See accompanying notes to financial statements.
227
HC CAPITAL TRUST
The U.S. Mortgage/Asset Backed Fixed Income Securities Portfolio
Portfolio of Investments (continued) — June 30, 2023
Principal | Security Description | Rate % | Maturity | Value | ||||||||||||
U.S. Government Agency Mortgages (continued) | ||||||||||||||||
| $ | 58 | Fannie Mae, Pool #AO4385 | 3.50 | 6/1/42 | $ | 54 | ||||||||||
| 46 | Fannie Mae, Pool #AY4300 | 3.50 | 1/1/45 | 42 | ||||||||||||
| 391 | Fannie Mae, Pool #MA4654 | 3.50 | 7/1/52 | 356 | ||||||||||||
| 8 | Fannie Mae, Pool #MA3906 | 3.50 | 1/1/50 | 7 | ||||||||||||
| 16 | Fannie Mae, Pool #MA3637 | 3.50 | 4/1/49 | 14 | ||||||||||||
| 487 | Fannie Mae, Pool #MA4600 | 3.50 | 5/1/52 | 444 | ||||||||||||
| 23 | Fannie Mae, Pool #MA3494 | 3.50 | 10/1/48 | 21 | ||||||||||||
| 63 | Fannie Mae, Pool #BK9038 | 3.50 | 10/1/33 | 60 | ||||||||||||
| 84 | Fannie Mae, Pool #BH5155 | 3.50 | 9/1/47 | 77 | ||||||||||||
| 9 | Fannie Mae, Pool #310139 | 3.50 | 11/1/25 | 9 | ||||||||||||
| 28 | Fannie Mae, Pool #BJ0647 | 3.50 | 3/1/48 | 26 | ||||||||||||
| 79 | Fannie Mae, Pool #MA3182 | 3.50 | 11/1/47 | 73 | ||||||||||||
| 70 | Fannie Mae, Pool #BD5046 | 3.50 | 2/1/47 | 64 | ||||||||||||
| 6 | Fannie Mae, Pool #MA2909 | 3.50 | 2/1/37 | 5 | ||||||||||||
| 53 | Fannie Mae, Pool #AS7491 | 3.50 | 7/1/46 | 49 | ||||||||||||
| 30 | Fannie Mae, Pool #AS5319 | 3.50 | 7/1/45 | 28 | ||||||||||||
| 18 | Fannie Mae, Pool #MA3692 | 3.50 | 7/1/49 | 17 | ||||||||||||
| 51 | Fannie Mae, Pool #MA3057 | 3.50 | 7/1/47 | 47 | ||||||||||||
| 13 | Fannie Mae, Pool #AE5487 | 3.50 | 10/1/25 | 13 | ||||||||||||
| 96 | Fannie Mae, Pool #BD2436 | 3.50 | 1/1/47 | 89 | ||||||||||||
| 102 | Fannie Mae, Pool #BH9277 | 3.50 | 2/1/48 | 94 | ||||||||||||
| 12 | Fannie Mae, Pool #MA2495 | 3.50 | 1/1/46 | 11 | ||||||||||||
| 122 | Fannie Mae, Pool #MA3276 | 3.50 | 2/1/48 | 112 | ||||||||||||
| 73 | Fannie Mae, Pool #MA3238 | 3.50 | 1/1/48 | 67 | ||||||||||||
| 41 | Fannie Mae, Pool #AS6649 | 3.50 | 2/1/46 | 38 | ||||||||||||
| 6 | Fannie Mae, Pool #BM5446 | 3.50 | 2/1/49 | 5 | ||||||||||||
| 60 | Fannie Mae, Pool #CA0487 | 3.50 | 10/1/47 | 56 | ||||||||||||
| 26 | Fannie Mae, Pool #MA2923 | 3.50 | 3/1/37 | 25 | ||||||||||||
| 33 | Fannie Mae, Pool #BE5258 | 3.50 | 1/1/47 | 30 | ||||||||||||
| 83 | Fannie Mae, Pool #BJ2692 | 3.50 | 4/1/48 | 76 | ||||||||||||
| 52 | Fannie Mae, Pool #AY5303 | 3.50 | 3/1/45 | 49 | ||||||||||||
| 50 | Fannie Mae, Pool #AS7388 | 3.50 | 6/1/46 | 46 | ||||||||||||
| 29 | Fannie Mae, Pool #BM2001 | 3.50 | 12/1/46 | 27 | ||||||||||||
| 81 | Fannie Mae, Pool #BH9215 | 3.50 | 1/1/48 | 74 | ||||||||||||
| 52 | Fannie Mae, Pool #MA3121 | 4.00 | 9/1/47 | 49 | ||||||||||||
| 137 | Fannie Mae, Pool #AS0531 | 4.00 | 9/1/43 | 131 | ||||||||||||
| 74 | Fannie Mae, Pool #AU3753 | 4.00 | 8/1/43 | 71 | ||||||||||||
| 14 | Fannie Mae, Pool #MA3536 | 4.00 | 12/1/48 | 13 | ||||||||||||
| 9 | Fannie Mae, Pool #AL2689 | 4.00 | 2/1/27 | 9 | ||||||||||||
| 9 | Fannie Mae, Pool #AW5109 | 4.00 | 8/1/44 | 9 | ||||||||||||
| 26 | Fannie Mae, Pool #BC5559 | 4.00 | 3/1/46 | 25 | ||||||||||||
| 23 | Fannie Mae, Pool #BN5258 | 4.00 | 2/1/49 | 21 | ||||||||||||
| 9 | Fannie Mae, Pool #AS2117 | 4.00 | 4/1/44 | 8 | ||||||||||||
| 14 | Fannie Mae, Pool #BH2623 | 4.00 | 8/1/47 | 13 | ||||||||||||
| 19 | Fannie Mae, Pool #MA0493 | 4.00 | 8/1/30 | 19 | ||||||||||||
| 44 | Fannie Mae, Pool #AS9486 | 4.00 | 4/1/47 | 42 | ||||||||||||
| 5 | Fannie Mae, Pool #AL9742 | 4.00 | 7/1/29 | 5 | ||||||||||||
| 31 | Fannie Mae, Pool #CA0237 | 4.00 | 8/1/47 | 30 | ||||||||||||
See accompanying notes to financial statements.
228
HC CAPITAL TRUST
The U.S. Mortgage/Asset Backed Fixed Income Securities Portfolio
Portfolio of Investments (continued) — June 30, 2023
Principal | Security Description | Rate % | Maturity | Value | ||||||||||||
U.S. Government Agency Mortgages (continued) | ||||||||||||||||
| $ | 48 | Fannie Mae, Pool #BK7608 | 4.00 | 9/1/48 | $ | 46 | ||||||||||
| 20 | Fannie Mae, Pool #MA3521 | 4.00 | 11/1/48 | 19 | ||||||||||||
| 309 | Fannie Mae, Pool #190405 | 4.00 | 10/1/40 | 300 | ||||||||||||
| 43 | Fannie Mae, Pool #AS3293 | 4.00 | 9/1/44 | 41 | ||||||||||||
| 161 | Fannie Mae, Pool #AJ7689 | 4.00 | 12/1/41 | 156 | ||||||||||||
| 88 | Fannie Mae, Pool #FM5134 | 4.00 | 1/1/49 | 83 | ||||||||||||
| 24 | Fannie Mae, Pool #BA6910 | 4.00 | 2/1/46 | 23 | ||||||||||||
| 19 | Fannie Mae, Pool #AT3872 | 4.00 | 6/1/43 | 18 | ||||||||||||
| 34 | Fannie Mae, Pool #AC7328 | 4.00 | 12/1/39 | 32 | ||||||||||||
| 46 | Fannie Mae, Pool #AS9831 | 4.00 | 6/1/47 | 44 | ||||||||||||
| 22 | Fannie Mae, Pool #BM4991 | 4.00 | 9/1/48 | 21 | ||||||||||||
| 118 | Fannie Mae, Pool #AY1377 | 4.00 | 4/1/45 | 112 | ||||||||||||
| 60 | Fannie Mae, Pool #MA0641 | 4.00 | 2/1/31 | 59 | ||||||||||||
| 12 | Fannie Mae, Pool #MA2455 | 4.00 | 11/1/35 | 11 | ||||||||||||
| 34 | Fannie Mae, Pool #AS2498 | 4.00 | 5/1/44 | 33 | ||||||||||||
| 5 | Fannie Mae, Pool #MA3037 | 4.00 | 6/1/37 | 5 | ||||||||||||
| 42 | Fannie Mae, Pool #AV2340 | 4.00 | 12/1/43 | 40 | ||||||||||||
| 31 | Fannie Mae, Pool #AS7600 | 4.00 | 7/1/46 | 29 | ||||||||||||
| 61 | Fannie Mae, Pool #CA0183 | 4.00 | 8/1/47 | 58 | ||||||||||||
| 71 | Fannie Mae, Pool #MA2995 | 4.00 | 5/1/47 | 68 | ||||||||||||
| 240 | Fannie Mae, Pool #MA4732 | 4.00 | 9/1/52 | 225 | ||||||||||||
| 12 | Fannie Mae, Pool #MA0695 | 4.00 | 4/1/31 | 11 | ||||||||||||
| 159 | Fannie Mae, Pool #AJ5303 | 4.00 | 11/1/41 | 154 | ||||||||||||
| 23 | Fannie Mae, Pool #MA3638 | 4.00 | 4/1/49 | 21 | ||||||||||||
| 38 | Fannie Mae, Pool #BK0909 | 4.00 | 7/1/48 | 36 | ||||||||||||
| 6 | Fannie Mae, Pool #MA2655 | 4.00 | 6/1/36 | 5 | ||||||||||||
| 412 | Fannie Mae, Pool #FS0016 | 4.00 | 6/1/49 | 392 | ||||||||||||
| 26 | Fannie Mae, Pool #AS3468 | 4.00 | 10/1/44 | 25 | ||||||||||||
| 22 | Fannie Mae, Pool #AY2291 | 4.00 | 3/1/45 | 21 | ||||||||||||
| 12 | Fannie Mae, Pool #AH3394 | 4.00 | 1/1/41 | 11 | ||||||||||||
| 386 | Fannie Mae, Pool #FS3526 | 4.00 | 12/1/52 | 362 | ||||||||||||
| 26 | Fannie Mae, Pool #AY1595 | 4.00 | 1/1/45 | 24 | ||||||||||||
| 55 | Fannie Mae, Pool #CA1015 | 4.00 | 1/1/48 | 52 | ||||||||||||
| 41 | Fannie Mae, Pool #MA3277 | 4.00 | 2/1/48 | 39 | ||||||||||||
| 35 | Fannie Mae, Pool #AW5063 | 4.00 | 7/1/44 | 34 | ||||||||||||
| 13 | Fannie Mae, Pool #CA2469 | 4.00 | 10/1/48 | 12 | ||||||||||||
| 33 | Fannie Mae, Pool #AS3467 | 4.00 | 10/1/44 | 32 | ||||||||||||
| 46 | Fannie Mae, Pool #AS3216 | 4.00 | 9/1/44 | 44 | ||||||||||||
| 14 | Fannie Mae, Pool #AS8823 | 4.00 | 2/1/47 | 13 | ||||||||||||
| 37 | Fannie Mae, Pool #AH6242 | 4.00 | 4/1/26 | 36 | ||||||||||||
| 96 | Fannie Mae, Pool #AH5859 | 4.00 | 2/1/41 | 93 | ||||||||||||
| 5 | Fannie Mae, Pool #AW9041 | 4.00 | 8/1/44 | 5 | ||||||||||||
| 54 | Fannie Mae, Pool #BM2002 | 4.00 | 10/1/47 | 51 | ||||||||||||
| 38 | Fannie Mae, Pool #AY8981 | 4.00 | 8/1/45 | 37 | ||||||||||||
| 9 | Fannie Mae, Pool #BM4306 | 4.00 | 9/1/25 | 9 | ||||||||||||
| 32 | Fannie Mae, Pool #AL7347 | 4.00 | 9/1/45 | 30 | ||||||||||||
| 40 | Fannie Mae, Pool #FM1415 | 4.00 | 12/1/48 | 38 | ||||||||||||
| 65 | Fannie Mae, Pool #BD7081 | 4.00 | 3/1/47 | 62 | ||||||||||||
See accompanying notes to financial statements.
229
HC CAPITAL TRUST
The U.S. Mortgage/Asset Backed Fixed Income Securities Portfolio
Portfolio of Investments (continued) — June 30, 2023
Principal | Security Description | Rate % | Maturity | Value | ||||||||||||
U.S. Government Agency Mortgages (continued) | ||||||||||||||||
| $ | 61 | Fannie Mae, Pool #MA3804 | 4.00 | 10/1/49 | $ | 57 | ||||||||||
| 54 | Fannie Mae, Pool #BJ9169 | 4.00 | 5/1/48 | 52 | ||||||||||||
| 35 | Fannie Mae, Pool #MA3563 | 4.00 | 1/1/49 | 33 | ||||||||||||
| 13 | Fannie Mae, Pool #MA3427 | 4.00 | 7/1/33 | 12 | ||||||||||||
| 124 | Fannie Mae, Pool #AJ7857 | 4.00 | 12/1/41 | 120 | ||||||||||||
| 3 | Fannie Mae, Pool #CA3084 | 4.00 | 2/1/49 | 3 | ||||||||||||
| 9 | Fannie Mae, Pool #BM5525 | 4.00 | 3/1/31 | 8 | ||||||||||||
| 91 | Fannie Mae, Pool #AZ8067 | 4.00 | 9/1/45 | 87 | ||||||||||||
| 16 | Fannie Mae, Pool #FM1101 | 4.00 | 7/1/34 | 15 | ||||||||||||
| 74 | Fannie Mae, Pool #BK7943 | 4.00 | 11/1/48 | 70 | ||||||||||||
| 45 | Fannie Mae, Pool #FM1960 | 4.00 | 5/1/49 | 43 | ||||||||||||
| 52 | Fannie Mae, Pool #FM0021 | 4.00 | 3/1/49 | 49 | ||||||||||||
| 8 | Fannie Mae, Pool #AC2995 | 4.00 | 9/1/24 | 7 | ||||||||||||
| 96 | Fannie Mae, Pool #AS7558 | 4.00 | 7/1/46 | 92 | ||||||||||||
| 58 | Fannie Mae, Pool #MA3211 | 4.00 | 12/1/47 | 55 | ||||||||||||
| 72 | Fannie Mae, Pool #AO2959 | 4.00 | 5/1/42 | 69 | ||||||||||||
| 28 | Fannie Mae, Pool #BN0594 | 4.00 | 12/1/48 | 26 | ||||||||||||
| 7 | Fannie Mae, Pool #AS3448 | 4.00 | 9/1/44 | 7 | ||||||||||||
| 16 | Fannie Mae, Pool #MA3592 | 4.00 | 2/1/49 | 15 | ||||||||||||
| 21 | Fannie Mae, Pool #MA3244 | 4.00 | 1/1/38 | 20 | ||||||||||||
| 46 | Fannie Mae, Pool #MA4797 | 4.00 | 11/1/37 | 44 | ||||||||||||
| 38 | Fannie Mae, Pool #BM5685 | 4.00 | 6/1/48 | 36 | ||||||||||||
| 40 | Fannie Mae, Pool #CA1894 | 4.00 | 6/1/48 | 38 | ||||||||||||
| 39 | Fannie Mae, Pool #MA3615 | 4.00 | 3/1/49 | 37 | ||||||||||||
| 12 | Fannie Mae, Pool #MA3216 | 4.00 | 12/1/37 | 11 | ||||||||||||
| 12 | Fannie Mae, Pool #BJ0639 | 4.00 | 3/1/48 | 11 | ||||||||||||
| 6 | Fannie Mae, Pool #AS7028 | 4.00 | 4/1/46 | 6 | ||||||||||||
| 61 | Fannie Mae, Pool #MA3183 | 4.00 | 11/1/47 | 58 | ||||||||||||
| 32 | Fannie Mae, Pool #BK9697 | 4.00 | 12/1/48 | 30 | ||||||||||||
| 28 | Fannie Mae, Pool #BE8050 | 4.00 | 4/1/47 | 26 | ||||||||||||
| 57 | Fannie Mae, Pool #MA3027 | 4.00 | 6/1/47 | 55 | ||||||||||||
| 5 | Fannie Mae, Pool #MA2536 | 4.00 | 2/1/36 | 5 | ||||||||||||
| 6 | Fannie Mae, Pool #AE0375 | 4.00 | 7/1/25 | 6 | ||||||||||||
| 37 | Fannie Mae, Pool #FM1571 | 4.00 | 12/1/48 | 36 | ||||||||||||
| 21 | Fannie Mae, Pool #CA2474 | 4.00 | 7/1/48 | 20 | ||||||||||||
| 42 | Fannie Mae, Pool #AX0841 | 4.00 | 9/1/44 | 41 | ||||||||||||
| 2 | Fannie Mae, Pool #BA0847 | 4.00 | 3/1/46 | 1 | ||||||||||||
| 28 | Fannie Mae, Pool #AS3903 | 4.00 | 11/1/44 | 27 | ||||||||||||
| 26 | Fannie Mae, Pool #BK0915 | 4.00 | 7/1/48 | 24 | ||||||||||||
| 38 | Fannie Mae, Pool #AS7601 | 4.00 | 7/1/46 | 36 | ||||||||||||
| 53 | Fannie Mae, Pool #AZ7362 | 4.00 | 11/1/45 | 51 | ||||||||||||
| 24 | Fannie Mae, Pool #AL4778 | 4.00 | 10/1/32 | 24 | ||||||||||||
| 50 | Fannie Mae, Pool #AL8387 | 4.00 | 3/1/46 | 48 | ||||||||||||
| 40 | Fannie Mae, Pool #BN0334 | 4.00 | 12/1/48 | 38 | ||||||||||||
| 8 | Fannie Mae, Pool #MA3413 | 4.00 | 7/1/38 | 7 | ||||||||||||
| 40 | Fannie Mae, Pool #AS8532 | 4.00 | 12/1/46 | 38 | ||||||||||||
| 100 | Fannie Mae, Pool #BN6677 | 4.00 | 6/1/49 | 95 | ||||||||||||
| 2 | Fannie Mae, Pool #AZ8874 | 4.00 | 9/1/45 | 2 | ||||||||||||
See accompanying notes to financial statements.
230
HC CAPITAL TRUST
The U.S. Mortgage/Asset Backed Fixed Income Securities Portfolio
Portfolio of Investments (continued) — June 30, 2023
Principal | Security Description | Rate % | Maturity | Value | ||||||||||||
U.S. Government Agency Mortgages (continued) | ||||||||||||||||
| $ | 20 | Fannie Mae, Pool #AY0025 | 4.00 | 2/1/45 | $ | 20 | ||||||||||
| 65 | Fannie Mae, Pool #MA3746 | 4.00 | 8/1/49 | 61 | ||||||||||||
| 52 | Fannie Mae, Pool #AB3192 | 4.50 | 6/1/41 | 50 | ||||||||||||
| 23 | Fannie Mae, Pool #CA0623 | 4.50 | 10/1/47 | 23 | ||||||||||||
| 25 | Fannie Mae, Pool #AL5082 | 4.50 | 3/1/44 | 25 | ||||||||||||
| 13 | Fannie Mae, Pool #FM3619 | 4.50 | 1/1/50 | 13 | ||||||||||||
| 137 | Fannie Mae, Pool #AH7521 | 4.50 | 3/1/41 | 132 | ||||||||||||
| 4 | Fannie Mae, Pool #BN0877 | 4.50 | 11/1/48 | 4 | ||||||||||||
| 16 | Fannie Mae, Pool #MA3593 | 4.50 | 2/1/49 | 16 | ||||||||||||
| 51 | Fannie Mae, Pool #MA3639 | 4.50 | 4/1/49 | 49 | ||||||||||||
| 56 | Fannie Mae, Pool #CA1711 | 4.50 | 5/1/48 | 55 | ||||||||||||
| 15 | Fannie Mae, Pool #BE6489 | 4.50 | 1/1/47 | 15 | ||||||||||||
| 3 | Fannie Mae, Pool #AW7048 | 4.50 | 6/1/44 | 3 | ||||||||||||
| 13 | Fannie Mae, Pool #AU5302 | 4.50 | 10/1/43 | 13 | ||||||||||||
| 45 | Fannie Mae, Pool #AL4450 | 4.50 | 12/1/43 | 44 | ||||||||||||
| 19 | Fannie Mae, Pool #MA3537 | 4.50 | 12/1/48 | 19 | ||||||||||||
| 139 | Fannie Mae, Pool #AH9055 | 4.50 | 4/1/41 | 135 | ||||||||||||
| 11 | Fannie Mae, Pool #CA1218 | 4.50 | 2/1/48 | 11 | ||||||||||||
| 12 | Fannie Mae, Pool #AA0860 | 4.50 | 1/1/39 | 11 | ||||||||||||
| 46 | Fannie Mae, Pool #AS8157 | 4.50 | 10/1/46 | 45 | ||||||||||||
| 107 | Fannie Mae, Pool #AS9394 | 4.50 | 4/1/47 | 105 | ||||||||||||
| 17 | Fannie Mae, Pool #BM1285 | 4.50 | 5/1/47 | 16 | ||||||||||||
| 34 | Fannie Mae, Pool #BE5992 | 4.50 | 2/1/47 | 34 | ||||||||||||
| 13 | Fannie Mae, Pool #AS8576 | 4.50 | 12/1/46 | 12 | ||||||||||||
| 226 | Fannie Mae, Pool #MA3184 | 4.50 | 11/1/47 | 223 | ||||||||||||
| 9 | Fannie Mae, Pool #AL8816 | 4.50 | 9/1/45 | 9 | ||||||||||||
| 56 | Fannie Mae, Pool #BK1416 | 4.50 | 5/1/48 | 54 | ||||||||||||
| 411 | Fannie Mae, Pool #BV7928 | 4.50 | 8/1/52 | 395 | ||||||||||||
| 4 | Fannie Mae, Pool #BK8830 | 4.50 | 8/1/48 | 4 | ||||||||||||
| 25 | Fannie Mae, Pool #AS1638 | 4.50 | 2/1/44 | 25 | ||||||||||||
| 23 | Fannie Mae, Pool #MA3522 | 4.50 | 11/1/48 | 22 | ||||||||||||
| 8 | Fannie Mae, Pool #AS0861 | 4.50 | 10/1/43 | 8 | ||||||||||||
| 27 | Fannie Mae, Pool #AB1389 | 4.50 | 8/1/40 | 27 | ||||||||||||
| 21 | Fannie Mae, Pool #BK5283 | 4.50 | 6/1/48 | 21 | ||||||||||||
| 33 | Fannie Mae, Pool #MA0481 | 4.50 | 8/1/30 | 32 | ||||||||||||
| 62 | Fannie Mae, Pool #AE0217 | 4.50 | 8/1/40 | 60 | ||||||||||||
| 55 | Fannie Mae, Pool #AI4815 | 4.50 | 6/1/41 | 54 | ||||||||||||
| 210 | Fannie Mae, Pool #AL1107 | 4.50 | 11/1/41 | 203 | ||||||||||||
| 3 | Fannie Mae, Pool #AA9781 | 4.50 | 7/1/24 | 3 | ||||||||||||
| 11 | Fannie Mae, Pool #AH6790 | 4.50 | 3/1/41 | 11 | ||||||||||||
| 11 | Fannie Mae, Pool #AB1470 | 4.50 | 9/1/40 | 11 | ||||||||||||
| 29 | Fannie Mae, Pool #AS2276 | 4.50 | 4/1/44 | 28 | ||||||||||||
| 3 | Fannie Mae, Pool #254954 | 4.50 | 10/1/23 | 3 | ||||||||||||
| 42 | Fannie Mae, Pool #CA0148 | 4.50 | 8/1/47 | 41 | ||||||||||||
| 400 | Fannie Mae, Pool #MA5070 | 4.50 | 7/1/53 | 384 | ||||||||||||
| 56 | Fannie Mae, Pool #AD8529 | 4.50 | 8/1/40 | 56 | ||||||||||||
| 23 | Fannie Mae, Pool #AS0575 | 5.00 | 9/1/43 | 23 | ||||||||||||
| 25 | Fannie Mae, Pool #836750 | 5.00 | 10/1/35 | 26 | ||||||||||||
See accompanying notes to financial statements.
231
HC CAPITAL TRUST
The U.S. Mortgage/Asset Backed Fixed Income Securities Portfolio
Portfolio of Investments (continued) — June 30, 2023
Principal | Security Description | Rate % | Maturity | Value | ||||||||||||
U.S. Government Agency Mortgages (continued) | ||||||||||||||||
| $ | 15 | Fannie Mae, Pool #725238 | 5.00 | 3/1/34 | $ | 15 | ||||||||||
| 9 | Fannie Mae, Pool #MA3617 | 5.00 | 3/1/49 | 9 | ||||||||||||
| 21 | Fannie Mae, Pool #AS0837 | 5.00 | 10/1/43 | 20 | ||||||||||||
| 338 | Fannie Mae, Pool #MA4761 | 5.00 | 9/1/52 | 332 | ||||||||||||
| 20 | Fannie Mae, Pool #BM3904 | 5.00 | 5/1/48 | 20 | ||||||||||||
| 11 | Fannie Mae, Pool #890603 | 5.00 | 8/1/41 | 11 | ||||||||||||
| 14 | Fannie Mae, Pool #CA0349 | 5.00 | 9/1/47 | 14 | ||||||||||||
| 12 | Fannie Mae, Pool #CA1795 | 5.00 | 5/1/48 | 12 | ||||||||||||
| 10 | Fannie Mae, Pool #MA3527 | 5.00 | 11/1/48 | 10 | ||||||||||||
| 13 | Fannie Mae, Pool #MA3472 | 5.00 | 9/1/48 | 13 | ||||||||||||
| 22 | Fannie Mae, Pool #MA3594 | 5.00 | 2/1/49 | 22 | ||||||||||||
| 26 | Fannie Mae, Pool #AL5788 | 5.00 | 5/1/42 | 26 | ||||||||||||
| 4 | Fannie Mae, Pool #BM3781 | 5.00 | 11/1/30 | 4 | ||||||||||||
| 16 | Fannie Mae, Pool #MA3669 | 5.00 | 5/1/49 | 16 | ||||||||||||
| 9 | Fannie Mae, Pool #MA3708 | 5.00 | 6/1/49 | 9 | ||||||||||||
| 11 | Fannie Mae, Pool #890621 | 5.00 | 5/1/42 | 12 | ||||||||||||
| 59 | Fannie Mae, Pool #AH5988 | 5.00 | 3/1/41 | 59 | ||||||||||||
| 271 | Fannie Mae, Pool #889117 | 5.00 | 10/1/35 | 274 | ||||||||||||
| 435 | Fannie Mae, Pool #890221 | 5.50 | 12/1/33 | 443 | ||||||||||||
| — | Fannie Mae, Pool #AL0725 | 5.50 | 6/1/24 | — | ||||||||||||
| 400 | Fannie Mae, Pool #MA5072 | 5.50 | 7/1/53 | 398 | ||||||||||||
| 6 | Fannie Mae, Pool #929451 | 5.50 | 5/1/38 | 7 | ||||||||||||
| 2 | Fannie Mae, Pool #A69671 | 5.50 | 12/1/37 | 2 | ||||||||||||
| 1 | Fannie Mae, Pool #A79636 | 5.50 | 7/1/38 | 1 | ||||||||||||
| 379 | Fannie Mae, Pool #FS3360 | 5.50 | 12/1/52 | 380 | ||||||||||||
| 268 | Fannie Mae, Pool #725228 | 6.00 | 3/1/34 | 279 | ||||||||||||
| 48 | Fannie Mae, Pool #CB5704 | 6.00 | 2/1/53 | 49 | ||||||||||||
| 61 | Fannie Mae, Pool #889984 | 6.50 | 10/1/38 | 64 | ||||||||||||
| 125 | Fannie Mae, 15 YR TBA | 1.50 | 7/25/38 | 108 | ||||||||||||
| 25 | Fannie Mae, 15 YR TBA | 2.00 | 7/25/38 | 22 | ||||||||||||
| 275 | Fannie Mae, 15 YR TBA | 3.00 | 7/25/38 | 256 | ||||||||||||
| 100 | Fannie Mae, 15 YR TBA | 3.50 | 7/25/38 | 95 | ||||||||||||
| 50 | Fannie Mae, 15 YR TBA | 4.00 | 7/25/38 | 48 | ||||||||||||
| 50 | Fannie Mae, 15 YR TBA | 4.00 | 8/25/38 | 48 | ||||||||||||
| 100 | Fannie Mae, 15 YR TBA | 4.50 | 7/25/38 | 98 | ||||||||||||
| 50 | Fannie Mae, 15 YR TBA | 4.50 | 5/25/38 | 49 | ||||||||||||
| 50 | Fannie Mae, 15 YR TBA | 5.00 | 7/25/38 | 50 | ||||||||||||
| 75 | Fannie Mae, 30 YR TBA | 2.50 | 7/25/53 | 64 | ||||||||||||
| 125 | Fannie Mae, 30 YR TBA | 3.00 | 7/25/53 | 110 | ||||||||||||
| 75 | Fannie Mae, 30 YR TBA | 3.00 | 8/25/53 | 66 | ||||||||||||
| 100 | Fannie Mae, 30 YR TBA | 3.50 | 7/25/53 | 91 | ||||||||||||
| 50 | Fannie Mae, 30 YR TBA | 3.50 | 8/25/53 | 46 | ||||||||||||
| 225 | Fannie Mae, 30 YR TBA | 4.00 | 7/25/53 | 211 | ||||||||||||
| 875 | Fannie Mae, 30 YR TBA | 4.50 | 7/25/53 | 840 | ||||||||||||
| 25 | Fannie Mae, 30 YR TBA | 4.50 | 8/25/53 | 24 | ||||||||||||
| 2,125 | Fannie Mae, 30 YR TBA | 5.00 | 7/25/53 | 2,081 | ||||||||||||
| 400 | Fannie Mae, 30 YR TBA | 5.00 | 8/25/53 | 392 | ||||||||||||
| 475 | Fannie Mae, 30 YR TBA | 5.50 | 8/25/52 | 473 | ||||||||||||
See accompanying notes to financial statements.
232
HC CAPITAL TRUST
The U.S. Mortgage/Asset Backed Fixed Income Securities Portfolio
Portfolio of Investments (continued) — June 30, 2023
Principal | Security Description | Rate % | Maturity | Value | ||||||||||||
U.S. Government Agency Mortgages (continued) | ||||||||||||||||
| $ | 1,350 | Fannie Mae, 30 YR TBA | 5.50 | 7/25/53 | $ | 1,342 | ||||||||||
| 425 | Fannie Mae, 30 YR TBA | 6.00 | 8/25/53 | 429 | ||||||||||||
| 1,125 | Fannie Mae, 30 YR TBA | 6.00 | 7/25/53 | 1,133 | ||||||||||||
| 500 | Fannie Mae, 30 YR TBA | 6.50 | 7/25/53 | 509 | ||||||||||||
| 63 | Freddie Mac, Pool #RB5110 | 1.50 | 5/1/41 | 51 | ||||||||||||
| 185 | Freddie Mac, Pool #SD8139 | 1.50 | 4/1/51 | 143 | ||||||||||||
| 393 | Freddie Mac, Pool #SB8106 | 1.50 | 6/1/36 | 339 | ||||||||||||
| 326 | Freddie Mac, Pool #QN9521 | 1.50 | 2/1/37 | 281 | ||||||||||||
| 368 | Freddie Mac, Pool #SB8097 | 1.50 | 4/1/36 | 318 | ||||||||||||
| 389 | Freddie Mac, Pool #QC0962 | 1.50 | 4/1/51 | 300 | ||||||||||||
| 398 | Freddie Mac, Pool #SD8154 | 1.50 | 7/1/51 | 307 | ||||||||||||
| 431 | Freddie Mac, Pool #SB8083 | 1.50 | 1/1/36 | 374 | ||||||||||||
| 418 | Freddie Mac, Pool #SB8088 | 1.50 | 2/1/36 | 360 | ||||||||||||
| 71 | Freddie Mac, Pool #SD8082 | 1.50 | 10/1/50 | 55 | ||||||||||||
| 408 | Freddie Mac, Pool #SB8144 | 1.50 | 3/1/37 | 351 | ||||||||||||
| 225 | Freddie Mac, Pool #RA5256 | 2.00 | 5/1/51 | 183 | ||||||||||||
| 255 | Freddie Mac, Pool #RA5257 | 2.00 | 5/1/51 | 208 | ||||||||||||
| 12 | Freddie Mac, Pool #J25759 | 2.00 | 8/1/28 | 11 | ||||||||||||
| 419 | Freddie Mac, Pool #QB9896 | 2.00 | 3/1/51 | 342 | ||||||||||||
| 410 | Freddie Mac, Pool #RA5040 | 2.00 | 4/1/51 | 334 | ||||||||||||
| 465 | Freddie Mac, Pool #SD8193 | 2.00 | 2/1/52 | 379 | ||||||||||||
| 444 | Freddie Mac, Pool #QC6925 | 2.00 | 9/1/51 | 362 | ||||||||||||
| 98 | Freddie Mac, Pool #ZS7735 | 2.00 | 1/1/32 | 90 | ||||||||||||
| 247 | Freddie Mac, Pool #RB5114 | 2.00 | 6/1/41 | 208 | ||||||||||||
| 516 | Freddie Mac, Pool #RA3606 | 2.00 | 10/1/50 | 420 | ||||||||||||
| 391 | Freddie Mac, Pool #RA4214 | 2.00 | 12/1/50 | 319 | ||||||||||||
| 470 | Freddie Mac, Pool #QB7708 | 2.00 | 1/1/51 | 383 | ||||||||||||
| 414 | Freddie Mac, Pool #QD1254 | 2.00 | 11/1/51 | 338 | ||||||||||||
| 382 | Freddie Mac, Pool #QC1333 | 2.00 | 5/1/51 | 312 | ||||||||||||
| 409 | Freddie Mac, Pool #QC3697 | 2.00 | 6/1/51 | 334 | ||||||||||||
| 423 | Freddie Mac, Pool #QC4423 | 2.00 | 7/1/51 | 345 | ||||||||||||
| 382 | Freddie Mac, Pool #QC1075 | 2.00 | 4/1/51 | 312 | ||||||||||||
| 16 | Freddie Mac, Pool #G18547 | 2.00 | 3/1/30 | 15 | ||||||||||||
| 378 | Freddie Mac, Pool #QB8064 | 2.00 | 1/1/51 | 308 | ||||||||||||
| 381 | Freddie Mac, Pool #QB6893 | 2.00 | 12/1/50 | 311 | ||||||||||||
| 358 | Freddie Mac, Pool #QB3926 | 2.00 | 10/1/50 | 293 | ||||||||||||
| 362 | Freddie Mac, Pool #QB3716 | 2.00 | 9/1/50 | 296 | ||||||||||||
| 357 | Freddie Mac, Pool #SD8128 | 2.00 | 2/1/51 | 291 | ||||||||||||
| 415 | Freddie Mac, Pool #QC3597 | 2.00 | 6/1/51 | 338 | ||||||||||||
| 354 | Freddie Mac, Pool #SB8115 | 2.00 | 8/1/36 | 314 | ||||||||||||
| 379 | Freddie Mac, Pool #RA3205 | 2.00 | 8/1/50 | 312 | ||||||||||||
| 440 | Freddie Mac, Pool #QD0433 | 2.00 | 11/1/51 | 359 | ||||||||||||
| 407 | Freddie Mac, Pool #RA5928 | 2.00 | 9/1/51 | 332 | ||||||||||||
| 130 | Freddie Mac, Pool #RB5095 | 2.00 | 1/1/41 | 108 | ||||||||||||
| 395 | Freddie Mac, Pool #SB8510 | 2.00 | 2/1/36 | 351 | ||||||||||||
| 414 | Freddie Mac, Pool #SD8098 | 2.00 | 10/1/50 | 338 | ||||||||||||
| 135 | Freddie Mac, Pool #RB5141 | 2.00 | 1/1/42 | 114 | ||||||||||||
| 278 | Freddie Mac, Pool #RB5153 | 2.00 | 4/1/42 | 236 | ||||||||||||
See accompanying notes to financial statements.
233
HC CAPITAL TRUST
The U.S. Mortgage/Asset Backed Fixed Income Securities Portfolio
Portfolio of Investments (continued) — June 30, 2023
Principal | Security Description | Rate % | Maturity | Value | ||||||||||||
U.S. Government Agency Mortgages (continued) | ||||||||||||||||
| $ | 411 | Freddie Mac, Pool #QO0110 | 2.00 | 4/1/37 | $ | 364 | ||||||||||
| 398 | Freddie Mac, Pool #SD8160 | 2.00 | 8/1/51 | 325 | ||||||||||||
| 421 | Freddie Mac, Pool #SD8199 | 2.00 | 3/1/52 | 343 | ||||||||||||
| 138 | Freddie Mac, Pool #QD3162 | 2.00 | 12/1/51 | 113 | ||||||||||||
| 133 | Freddie Mac, Pool #RB5138 | 2.00 | 12/1/41 | 112 | ||||||||||||
| 406 | Freddie Mac, Pool #RA3328 | 2.00 | 8/1/50 | 333 | ||||||||||||
| 405 | Freddie Mac, Pool #SD8134 | 2.00 | 3/1/51 | 330 | ||||||||||||
| 360 | Freddie Mac, Pool #SB8107 | 2.00 | 6/1/36 | 320 | ||||||||||||
| 443 | Freddie Mac, Pool #QD5748 | 2.00 | 2/1/52 | 361 | ||||||||||||
| 372 | Freddie Mac, Pool #SD8121 | 2.00 | 1/1/51 | 305 | ||||||||||||
| 418 | Freddie Mac, Pool #RA6507 | 2.00 | 12/1/51 | 341 | ||||||||||||
| 483 | Freddie Mac, Pool #SD8113 | 2.00 | 12/1/50 | 395 | ||||||||||||
| 428 | Freddie Mac, Pool #QC7473 | 2.00 | 9/1/51 | 349 | ||||||||||||
| 229 | Freddie Mac, Pool #QC0423 | 2.00 | 4/1/51 | 187 | ||||||||||||
| 231 | Freddie Mac, Pool #SD8146 | 2.00 | 5/1/51 | 189 | ||||||||||||
| 227 | Freddie Mac, Pool #SD7537 | 2.00 | 3/1/51 | 186 | ||||||||||||
| 354 | Freddie Mac, Pool #RA3575 | 2.00 | 9/1/50 | 291 | ||||||||||||
| 234 | Freddie Mac, Pool #RB5121 | 2.00 | 8/1/41 | 198 | ||||||||||||
| 165 | Freddie Mac, Pool #RB5111 | 2.00 | 5/1/41 | 139 | ||||||||||||
| 571 | Freddie Mac, Pool #SB8128 | 2.00 | 11/1/36 | 506 | ||||||||||||
| 228 | Freddie Mac, Pool #SB8061 | 2.00 | 9/1/35 | 203 | ||||||||||||
| 249 | Freddie Mac, Pool #RA6025 | 2.00 | 10/1/51 | 205 | ||||||||||||
| 404 | Freddie Mac, Pool #QC6815 | 2.00 | 9/1/51 | 329 | ||||||||||||
| 309 | Freddie Mac, Pool #RC1727 | 2.00 | 12/1/35 | 275 | ||||||||||||
| 422 | Freddie Mac, Pool #SD8079 | 2.00 | 7/1/50 | 345 | ||||||||||||
| 437 | Freddie Mac, Pool #SD0731 | 2.00 | 5/1/51 | 358 | ||||||||||||
| 32 | Freddie Mac, Pool #J25777 | 2.00 | 9/1/28 | 29 | ||||||||||||
| 33 | Freddie Mac, Pool #G18634 | 2.00 | 3/1/32 | 29 | ||||||||||||
| 459 | Freddie Mac, Pool #RA6333 | 2.00 | 11/1/51 | 374 | ||||||||||||
| 360 | Freddie Mac, Pool #RA4986 | 2.00 | 4/1/51 | 296 | ||||||||||||
| 453 | Freddie Mac, Pool #RA6026 | 2.00 | 10/1/51 | 369 | ||||||||||||
| 428 | Freddie Mac, Pool #SD8172 | 2.00 | 10/1/51 | 349 | ||||||||||||
| 381 | Freddie Mac, Pool #SB8079 | 2.00 | 12/1/35 | 339 | ||||||||||||
| 277 | Freddie Mac, Pool #SD8150 | 2.00 | 6/1/51 | 226 | ||||||||||||
| 431 | Freddie Mac, Pool #SD8177 | 2.00 | 11/1/51 | 352 | ||||||||||||
| 462 | Freddie Mac, Pool #SD8188 | 2.00 | 1/1/52 | 376 | ||||||||||||
| 427 | Freddie Mac, Pool #RA5155 | 2.00 | 5/1/51 | 348 | ||||||||||||
| 458 | Freddie Mac, Pool #SD8182 | 2.00 | 12/1/51 | 373 | ||||||||||||
| 125 | Freddie Mac, Pool #G18611 | 2.50 | 9/1/31 | 117 | ||||||||||||
| 297 | Freddie Mac, Pool #QB3287 | 2.50 | 8/1/50 | 254 | ||||||||||||
| 316 | Freddie Mac, Pool #SD8114 | 2.50 | 12/1/50 | 270 | ||||||||||||
| 321 | Freddie Mac, Pool #RA2643 | 2.50 | 6/1/50 | 272 | ||||||||||||
| 55 | Freddie Mac, Pool #RB5054 | 2.50 | 6/1/40 | 49 | ||||||||||||
| 459 | Freddie Mac, Pool #SD8147 | 2.50 | 5/1/51 | 390 | ||||||||||||
| 160 | Freddie Mac, Pool #SD8083 | 2.50 | 8/1/50 | 136 | ||||||||||||
| 141 | Freddie Mac, Pool #SB8108 | 2.50 | 6/1/36 | 129 | ||||||||||||
| 293 | Freddie Mac, Pool #QB3703 | 2.50 | 9/1/50 | 250 | ||||||||||||
| 24 | Freddie Mac, Pool #J25585 | 2.50 | 9/1/28 | 23 | ||||||||||||
See accompanying notes to financial statements.
234
HC CAPITAL TRUST
The U.S. Mortgage/Asset Backed Fixed Income Securities Portfolio
Portfolio of Investments (continued) — June 30, 2023
Principal | Security Description | Rate % | Maturity | Value | ||||||||||||
U.S. Government Agency Mortgages (continued) | ||||||||||||||||
| $ | 301 | Freddie Mac, Pool #SD8167 | 2.50 | 9/1/51 | $ | 255 | ||||||||||
| 105 | Freddie Mac, Pool #J38477 | 2.50 | 2/1/33 | 97 | ||||||||||||
| 310 | Freddie Mac, Pool #SD8122 | 2.50 | 1/1/51 | 264 | ||||||||||||
| 118 | Freddie Mac, Pool #RB5086 | 2.50 | 11/1/40 | 103 | ||||||||||||
| 411 | Freddie Mac, Pool #QC7457 | 2.50 | 9/1/51 | 349 | ||||||||||||
| 242 | Freddie Mac, Pool #RA2595 | 2.50 | 5/1/50 | 207 | ||||||||||||
| 62 | Freddie Mac, Pool #J37902 | 2.50 | 11/1/32 | 56 | ||||||||||||
| 157 | Freddie Mac, Pool #QA5290 | 2.50 | 12/1/49 | 134 | ||||||||||||
| 62 | Freddie Mac, Pool #G18568 | 2.50 | 9/1/30 | 58 | ||||||||||||
| 10 | Freddie Mac, Pool #ZT2094 | 2.50 | 6/1/34 | 9 | ||||||||||||
| 13 | Freddie Mac, Pool #G18665 | 2.50 | 11/1/32 | 12 | ||||||||||||
| 32 | Freddie Mac, Pool #C09026 | 2.50 | 2/1/43 | 28 | ||||||||||||
| 13 | Freddie Mac, Pool #C91904 | 2.50 | 11/1/36 | 12 | ||||||||||||
| 416 | Freddie Mac, Pool #RA6019 | 2.50 | 10/1/51 | 355 | ||||||||||||
| 401 | Freddie Mac, Pool #RA5802 | 2.50 | 9/1/51 | 341 | ||||||||||||
| 54 | Freddie Mac, Pool #RB5072 | 2.50 | 9/1/40 | 47 | ||||||||||||
| 381 | Freddie Mac, Pool #RA5286 | 2.50 | 5/1/51 | 323 | ||||||||||||
| 55 | Freddie Mac, Pool #G18470 | 2.50 | 6/1/28 | 52 | ||||||||||||
| 24 | Freddie Mac, Pool #G18485 | 2.50 | 10/1/28 | 23 | ||||||||||||
| 47 | Freddie Mac, Pool #J23440 | 2.50 | 4/1/28 | 44 | ||||||||||||
| 4 | Freddie Mac, Pool #J30875 | 2.50 | 3/1/30 | 4 | ||||||||||||
| 413 | Freddie Mac, Pool #QC9156 | 2.50 | 10/1/51 | 351 | ||||||||||||
| 458 | Freddie Mac, Pool #SD1011 | 2.50 | 4/1/52 | 389 | ||||||||||||
| 354 | Freddie Mac, Pool #SD8021 | 2.50 | 9/1/49 | 302 | ||||||||||||
| 89 | Freddie Mac, Pool #QE2352 | 2.50 | 5/1/52 | 75 | ||||||||||||
| 404 | Freddie Mac, Pool #RA5832 | 2.50 | 9/1/51 | 345 | ||||||||||||
| 439 | Freddie Mac, Pool #SD0780 | 2.50 | 12/1/51 | 374 | ||||||||||||
| 255 | Freddie Mac, Pool #RB5157 | 2.50 | 5/1/42 | 221 | ||||||||||||
| 39 | Freddie Mac, Pool #J35643 | 2.50 | 11/1/31 | 36 | ||||||||||||
| 426 | Freddie Mac, Pool #RA6493 | 2.50 | 12/1/51 | 361 | ||||||||||||
| 460 | Freddie Mac, Pool #RA6621 | 2.50 | 1/1/52 | 393 | ||||||||||||
| 22 | Freddie Mac, Pool #RA6815 | 2.50 | 2/1/52 | 19 | ||||||||||||
| 234 | Freddie Mac, Pool #SD8205 | 2.50 | 4/1/52 | 199 | ||||||||||||
| 434 | Freddie Mac, Pool #QD5204 | 2.50 | 1/1/52 | 368 | ||||||||||||
| 175 | Freddie Mac, Pool #RA2645 | 2.50 | 6/1/50 | 151 | ||||||||||||
| 9 | Freddie Mac, Pool #G08638 | 2.50 | 4/1/45 | 8 | ||||||||||||
| 60 | Freddie Mac, Pool #ZS4687 | 2.50 | 11/1/46 | 52 | ||||||||||||
| 51 | Freddie Mac, Pool #ZK8425 | 2.50 | 12/1/31 | 47 | ||||||||||||
| 250 | Freddie Mac, Pool #RA3528 | 2.50 | 9/1/50 | 212 | ||||||||||||
| 346 | Freddie Mac, Pool #SD0412 | 2.50 | 8/1/50 | 294 | ||||||||||||
| 303 | Freddie Mac, Pool #SD8151 | 2.50 | 6/1/51 | 257 | ||||||||||||
| 281 | Freddie Mac, Pool #SD8099 | 2.50 | 10/1/50 | 239 | ||||||||||||
| 9 | Freddie Mac, Pool #G08755 | 2.50 | 2/1/47 | 7 | ||||||||||||
| 211 | Freddie Mac, Pool #SD8067 | 2.50 | 6/1/50 | 180 | ||||||||||||
| 238 | Freddie Mac, Pool #QA9142 | 2.50 | 5/1/50 | 203 | ||||||||||||
| 56 | Freddie Mac, Pool #G18635 | 2.50 | 3/1/32 | 51 | ||||||||||||
| 24 | Freddie Mac, Pool #Q42878 | 2.50 | 9/1/46 | 21 | ||||||||||||
| 117 | Freddie Mac, Pool #RB5043 | 2.50 | 4/1/40 | 104 | ||||||||||||
See accompanying notes to financial statements.
235
HC CAPITAL TRUST
The U.S. Mortgage/Asset Backed Fixed Income Securities Portfolio
Portfolio of Investments (continued) — June 30, 2023
Principal | Security Description | Rate % | Maturity | Value | ||||||||||||
U.S. Government Agency Mortgages (continued) | ||||||||||||||||
| $ | 81 | Freddie Mac, Pool #G18680 | 2.50 | 3/1/33 | $ | 75 | ||||||||||
| 459 | Freddie Mac, Pool #SD8194 | 2.50 | 2/1/52 | 389 | ||||||||||||
| 429 | Freddie Mac, Pool #RA6340 | 2.50 | 11/1/51 | 366 | ||||||||||||
| 141 | Freddie Mac, Pool #SD8055 | 2.50 | 4/1/50 | 121 | ||||||||||||
| 40 | Freddie Mac, Pool #J18954 | 2.50 | 4/1/27 | 38 | ||||||||||||
| 9 | Freddie Mac, Pool #G18472 | 2.50 | 7/1/28 | 8 | ||||||||||||
| 47 | Freddie Mac, Pool #G18533 | 2.50 | 12/1/29 | 44 | ||||||||||||
| 344 | Freddie Mac, Pool #SD8141 | 2.50 | 4/1/51 | 292 | ||||||||||||
| 314 | Freddie Mac, Pool #SD8129 | 2.50 | 2/1/51 | 267 | ||||||||||||
| 383 | Freddie Mac, Pool #QC2031 | 2.50 | 5/1/51 | 325 | ||||||||||||
| 459 | Freddie Mac, Pool #RA6765 | 2.50 | 2/1/52 | 392 | ||||||||||||
| 75 | Freddie Mac, Pool #SB8045 | 2.50 | 5/1/35 | 68 | ||||||||||||
| 41 | Freddie Mac, Pool #ZS8692 | 2.50 | 4/1/33 | 38 | ||||||||||||
| 35 | Freddie Mac, Pool #SB8062 | 2.50 | 9/1/35 | 32 | ||||||||||||
| 75 | Freddie Mac, Pool #J26408 | 2.50 | 11/1/28 | 71 | ||||||||||||
| 323 | Freddie Mac, Pool #RA2897 | 2.50 | 6/1/50 | 276 | ||||||||||||
| 291 | Freddie Mac, Pool #RA2634 | 2.50 | 5/1/50 | 249 | ||||||||||||
| 46 | Freddie Mac, Pool #ZS8483 | 2.50 | 3/1/28 | 43 | ||||||||||||
| 339 | Freddie Mac, Pool #RA4527 | 2.50 | 2/1/51 | 289 | ||||||||||||
| 337 | Freddie Mac, Pool #SD0578 | 2.50 | 3/1/51 | 286 | ||||||||||||
| 402 | Freddie Mac, Pool #QC2251 | 2.50 | 5/1/51 | 341 | ||||||||||||
| 22 | Freddie Mac, Pool #SB8053 | 2.50 | 7/1/35 | 20 | ||||||||||||
| 132 | Freddie Mac, Pool #SB0301 | 2.50 | 4/1/35 | 120 | ||||||||||||
| 404 | Freddie Mac, Pool #SD8183 | 2.50 | 12/1/51 | 342 | ||||||||||||
| 431 | Freddie Mac, Pool #SD8189 | 2.50 | 1/1/52 | 365 | ||||||||||||
| 474 | Freddie Mac, Pool #SD8212 | 2.50 | 5/1/52 | 402 | ||||||||||||
| 24 | Freddie Mac, Pool #G18704 | 2.50 | 6/1/33 | 22 | ||||||||||||
| 28 | Freddie Mac, Pool #C91819 | 3.00 | 4/1/35 | 26 | ||||||||||||
| 66 | Freddie Mac, Pool #SD8074 | 3.00 | 7/1/50 | 59 | ||||||||||||
| 44 | Freddie Mac, Pool #ZT0195 | 3.00 | 9/1/46 | 39 | ||||||||||||
| 41 | Freddie Mac, Pool #G08783 | 3.00 | 10/1/47 | 36 | ||||||||||||
| 22 | Freddie Mac, Pool #G30945 | 3.00 | 9/1/36 | 20 | ||||||||||||
| 51 | Freddie Mac, Pool #G15145 | 3.00 | 7/1/29 | 49 | ||||||||||||
| 9 | Freddie Mac, Pool #C91826 | 3.00 | 5/1/35 | 8 | ||||||||||||
| 7 | Freddie Mac, Pool #G30999 | 3.00 | 2/1/37 | 6 | ||||||||||||
| 5 | Freddie Mac, Pool #C91939 | 3.00 | 6/1/37 | 4 | ||||||||||||
| 50 | Freddie Mac, Pool #G18518 | 3.00 | 7/1/29 | 48 | ||||||||||||
| 23 | Freddie Mac, Pool #RB5162 | 3.00 | 6/1/42 | 21 | ||||||||||||
| 12 | Freddie Mac, Pool #J29932 | 3.00 | 11/1/29 | 12 | ||||||||||||
| 63 | Freddie Mac, Pool #G18514 | 3.00 | 6/1/29 | 60 | ||||||||||||
| 5 | Freddie Mac, Pool #J14241 | 3.00 | 1/1/26 | 5 | ||||||||||||
| 143 | Freddie Mac, Pool #SD8184 | 3.00 | 12/1/51 | 127 | ||||||||||||
| 12 | Freddie Mac, Pool #G18534 | 3.00 | 12/1/29 | 12 | ||||||||||||
| 17 | Freddie Mac, Pool #G18715 | 3.00 | 12/1/33 | 16 | ||||||||||||
| 99 | Freddie Mac, Pool #Q43734 | 3.00 | 10/1/46 | 89 | ||||||||||||
| 108 | Freddie Mac, Pool #SD8024 | 3.00 | 11/1/49 | 96 | ||||||||||||
| 88 | Freddie Mac, Pool #ZA1283 | 3.00 | 1/1/43 | 79 | ||||||||||||
| 5 | Freddie Mac, Pool #C91949 | 3.00 | 9/1/37 | 5 | ||||||||||||
See accompanying notes to financial statements.
236
HC CAPITAL TRUST
The U.S. Mortgage/Asset Backed Fixed Income Securities Portfolio
Portfolio of Investments (continued) — June 30, 2023
Principal | Security Description | Rate % | Maturity | Value | ||||||||||||
U.S. Government Agency Mortgages (continued) | ||||||||||||||||
| $ | 40 | Freddie Mac, Pool #C91707 | 3.00 | 6/1/33 | $ | 37 | ||||||||||
| 52 | Freddie Mac, Pool #G15217 | 3.00 | 11/1/29 | 49 | ||||||||||||
| 97 | Freddie Mac, Pool #SD8242 | 3.00 | 9/1/52 | 85 | ||||||||||||
| 57 | Freddie Mac, Pool #ZS4706 | 3.00 | 3/1/47 | 50 | ||||||||||||
| 56 | Freddie Mac, Pool #ZS4779 | 3.00 | 6/1/48 | 50 | ||||||||||||
| 9 | Freddie Mac, Pool #C91943 | 3.00 | 7/1/37 | 9 | ||||||||||||
| — | Freddie Mac, Pool #J24886 | 3.00 | 7/1/23 | — | ||||||||||||
| 3 | Freddie Mac, Pool #J17111 | 3.00 | 10/1/26 | 3 | ||||||||||||
| 60 | Freddie Mac, Pool #J17774 | 3.00 | 1/1/27 | 58 | ||||||||||||
| 24 | Freddie Mac, Pool #G18582 | 3.00 | 1/1/31 | 22 | ||||||||||||
| 37 | Freddie Mac, Pool #G08640 | 3.00 | 5/1/45 | 33 | ||||||||||||
| 22 | Freddie Mac, Pool #C91798 | 3.00 | 12/1/34 | 20 | ||||||||||||
| 74 | Freddie Mac, Pool #C04422 | 3.00 | 12/1/42 | 65 | ||||||||||||
| 54 | Freddie Mac, Pool #ZT1323 | 3.00 | 10/1/48 | 48 | ||||||||||||
| 72 | Freddie Mac, Pool #C91581 | 3.00 | 11/1/32 | 68 | ||||||||||||
| 370 | Freddie Mac, Pool #QD9881 | 3.00 | 3/1/52 | 326 | ||||||||||||
| 15 | Freddie Mac, Pool #ZT2019 | 3.00 | 5/1/34 | 14 | ||||||||||||
| 172 | Freddie Mac, Pool #ZS4519 | 3.00 | 6/1/43 | 155 | ||||||||||||
| 6 | Freddie Mac, Pool #Q13086 | 3.00 | 11/1/42 | 5 | ||||||||||||
| 21 | Freddie Mac, Pool #J38675 | 3.00 | 3/1/33 | 20 | ||||||||||||
| 140 | Freddie Mac, Pool #ZS4697 | 3.00 | 1/1/47 | 125 | ||||||||||||
| 98 | Freddie Mac, Pool #ZS4621 | 3.00 | 7/1/45 | 88 | ||||||||||||
| 42 | Freddie Mac, Pool #SD8056 | 3.00 | 4/1/50 | 37 | ||||||||||||
| 103 | Freddie Mac, Pool #ZS4658 | 3.00 | 4/1/46 | 92 | ||||||||||||
| 31 | Freddie Mac, Pool #G08648 | 3.00 | 6/1/45 | 28 | ||||||||||||
| 120 | Freddie Mac, Pool #Q16222 | 3.00 | 3/1/43 | 108 | ||||||||||||
| 235 | Freddie Mac, Pool #Q21065 | 3.00 | 8/1/43 | 212 | ||||||||||||
| 22 | Freddie Mac, Pool #Q19754 | 3.00 | 7/1/43 | 20 | ||||||||||||
| 44 | Freddie Mac, Pool #G18531 | 3.00 | 11/1/29 | 42 | ||||||||||||
| 90 | Freddie Mac, Pool #ZS4512 | 3.00 | 5/1/43 | 81 | ||||||||||||
| 43 | Freddie Mac, Pool #Q41795 | 3.00 | 7/1/46 | 38 | ||||||||||||
| 60 | Freddie Mac, Pool #RA2594 | 3.00 | 5/1/50 | 53 | ||||||||||||
| 33 | Freddie Mac, Pool #ZS4641 | 3.00 | 12/1/45 | 30 | ||||||||||||
| 87 | Freddie Mac, Pool #ZS4609 | 3.00 | 4/1/45 | 78 | ||||||||||||
| 19 | Freddie Mac, Pool #SD8030 | 3.00 | 12/1/49 | 17 | ||||||||||||
| 14 | Freddie Mac, Pool #J38807 | 3.00 | 4/1/33 | 13 | ||||||||||||
| 42 | Freddie Mac, Pool #G18569 | 3.00 | 9/1/30 | 40 | ||||||||||||
| 28 | Freddie Mac, Pool #ZS4703 | 3.00 | 2/1/47 | 25 | ||||||||||||
| 27 | Freddie Mac, Pool #C91927 | 3.00 | 5/1/37 | 25 | ||||||||||||
| 11 | Freddie Mac, Pool #C91969 | 3.00 | 1/1/38 | 10 | ||||||||||||
| 117 | Freddie Mac, Pool #QA9049 | 3.00 | 4/1/50 | 104 | ||||||||||||
| 56 | Freddie Mac, Pool #ZA2313 | 3.00 | 9/1/33 | 52 | ||||||||||||
| 125 | Freddie Mac, Pool #G60989 | 3.00 | 12/1/46 | 112 | ||||||||||||
| 14 | Freddie Mac, Pool #J33135 | 3.00 | 11/1/30 | 13 | ||||||||||||
| 2 | Freddie Mac, Pool #Q39527 | 3.00 | 3/1/46 | 1 | ||||||||||||
| 78 | Freddie Mac, Pool #ZM2089 | 3.00 | 11/1/46 | 70 | ||||||||||||
| 128 | Freddie Mac, Pool #Q45735 | 3.00 | 1/1/47 | 114 | ||||||||||||
| 115 | Freddie Mac, Pool #SB8046 | 3.00 | 5/1/35 | 108 | ||||||||||||
See accompanying notes to financial statements.
237
HC CAPITAL TRUST
The U.S. Mortgage/Asset Backed Fixed Income Securities Portfolio
Portfolio of Investments (continued) — June 30, 2023
Principal | Security Description | Rate % | Maturity | Value | ||||||||||||
U.S. Government Agency Mortgages (continued) | ||||||||||||||||
| $ | 57 | Freddie Mac, Pool #ZM2721 | 3.00 | 2/1/47 | $ | 51 | ||||||||||
| 358 | Freddie Mac, Pool #SD8174 | 3.00 | 10/1/51 | 316 | ||||||||||||
| 209 | Freddie Mac, Pool #QB1382 | 3.00 | 7/1/50 | 186 | ||||||||||||
| 16 | Freddie Mac, Pool #G18575 | 3.00 | 11/1/30 | 16 | ||||||||||||
| 26 | Freddie Mac, Pool #J36428 | 3.00 | 2/1/32 | 24 | ||||||||||||
| 68 | Freddie Mac, Pool #QA8065 | 3.00 | 3/1/50 | 60 | ||||||||||||
| 115 | Freddie Mac, Pool #ZM2285 | 3.00 | 12/1/46 | 103 | ||||||||||||
| 52 | Freddie Mac, Pool #Q20067 | 3.00 | 7/1/43 | 47 | ||||||||||||
| 13 | Freddie Mac, Pool #J38057 | 3.00 | 12/1/32 | 13 | ||||||||||||
| 82 | Freddie Mac, Pool #G60187 | 3.00 | 8/1/45 | 74 | ||||||||||||
| 45 | Freddie Mac, Pool #ZS4688 | 3.00 | 11/1/46 | 40 | ||||||||||||
| 106 | Freddie Mac, Pool #C04619 | 3.00 | 3/1/43 | 96 | ||||||||||||
| 4 | Freddie Mac, Pool #C91809 | 3.00 | 2/1/35 | 4 | ||||||||||||
| 41 | Freddie Mac, Pool #ZT0715 | 3.00 | 9/1/48 | 36 | ||||||||||||
| 72 | Freddie Mac, Pool #ZS4693 | 3.00 | 12/1/46 | 64 | ||||||||||||
| 32 | Freddie Mac, Pool #ZS8686 | 3.00 | 2/1/33 | 30 | ||||||||||||
| 5 | Freddie Mac, Pool #Q18882 | 3.00 | 5/1/43 | 5 | ||||||||||||
| 83 | Freddie Mac, Pool #QA1033 | 3.00 | 7/1/49 | 73 | ||||||||||||
| 57 | Freddie Mac, Pool #ZM2169 | 3.00 | 11/1/46 | 51 | ||||||||||||
| 13 | Freddie Mac, Pool #C91905 | 3.00 | 11/1/36 | 12 | ||||||||||||
| 84 | Freddie Mac, Pool #G18673 | 3.00 | 1/1/33 | 80 | ||||||||||||
| 13 | Freddie Mac, Pool #Q18599 | 3.00 | 6/1/43 | 12 | ||||||||||||
| 23 | Freddie Mac, Pool #G08540 | 3.00 | 8/1/43 | 20 | ||||||||||||
| 486 | Freddie Mac, Pool #ZS4522 | 3.00 | 7/1/43 | 438 | ||||||||||||
| 14 | Freddie Mac, Pool #C91924 | 3.00 | 4/1/37 | 13 | ||||||||||||
| 26 | Freddie Mac, Pool #ZS4659 | 3.50 | 4/1/46 | 24 | ||||||||||||
| 11 | Freddie Mac, Pool #J13582 | 3.50 | 11/1/25 | 11 | ||||||||||||
| 295 | Freddie Mac, Pool #SD8038 | 3.50 | 1/1/50 | 271 | ||||||||||||
| 14 | Freddie Mac, Pool #Q31134 | 3.50 | 2/1/45 | 13 | ||||||||||||
| 35 | Freddie Mac, Pool #Q04087 | 3.50 | 10/1/41 | 32 | ||||||||||||
| 31 | Freddie Mac, Pool #G18707 | 3.50 | 9/1/33 | 30 | ||||||||||||
| 10 | Freddie Mac, Pool #C92003 | 3.50 | 7/1/38 | 10 | ||||||||||||
| 19 | Freddie Mac, Pool #J27494 | 3.50 | 2/1/29 | 19 | ||||||||||||
| 70 | Freddie Mac, Pool #G08641 | 3.50 | 5/1/45 | 65 | ||||||||||||
| 9 | Freddie Mac, Pool #ZS4747 | 3.50 | 12/1/47 | 8 | ||||||||||||
| 38 | Freddie Mac, Pool #Q12052 | 3.50 | 10/1/42 | 36 | ||||||||||||
| 81 | Freddie Mac, Pool #G08766 | 3.50 | 6/1/47 | 75 | ||||||||||||
| 35 | Freddie Mac, Pool #Q36040 | 3.50 | 9/1/45 | 33 | ||||||||||||
| 63 | Freddie Mac, Pool #Q09896 | 3.50 | 8/1/42 | 59 | ||||||||||||
| 33 | Freddie Mac, Pool #G08733 | 3.50 | 11/1/46 | 31 | ||||||||||||
| 93 | Freddie Mac, Pool #G08627 | 3.50 | 2/1/45 | 86 | ||||||||||||
| 36 | Freddie Mac, Pool #Q06749 | 3.50 | 3/1/42 | 33 | ||||||||||||
| 50 | Freddie Mac, Pool #Q08998 | 3.50 | 6/1/42 | 46 | ||||||||||||
| 49 | Freddie Mac, Pool #SD2253 | 3.50 | 12/1/52 | 45 | ||||||||||||
| 42 | Freddie Mac, Pool #SD8011 | 3.50 | 9/1/49 | 38 | ||||||||||||
| 78 | Freddie Mac, Pool #G08804 | 3.50 | 3/1/48 | 72 | ||||||||||||
| 23 | Freddie Mac, Pool #C03920 | 3.50 | 5/1/42 | 22 | ||||||||||||
| 14 | Freddie Mac, Pool #C91742 | 3.50 | 1/1/34 | 13 | ||||||||||||
See accompanying notes to financial statements.
238
HC CAPITAL TRUST
The U.S. Mortgage/Asset Backed Fixed Income Securities Portfolio
Portfolio of Investments (continued) — June 30, 2023
Principal | Security Description | Rate % | Maturity | Value | ||||||||||||
U.S. Government Agency Mortgages (continued) | ||||||||||||||||
| $ | 53 | Freddie Mac, Pool #G08761 | 3.50 | 5/1/47 | $ | 49 | ||||||||||
| 8 | Freddie Mac, Pool #G08620 | 3.50 | 12/1/44 | 7 | ||||||||||||
| 39 | Freddie Mac, Pool #J15105 | 3.50 | 4/1/26 | 38 | ||||||||||||
| 87 | Freddie Mac, Pool #Q20860 | 3.50 | 8/1/43 | 81 | ||||||||||||
| 91 | Freddie Mac, Pool #SB8183 | 3.50 | 10/1/37 | 86 | ||||||||||||
| 17 | Freddie Mac, Pool #C91950 | 3.50 | 9/1/37 | 16 | ||||||||||||
| 58 | Freddie Mac, Pool #SD8001 | 3.50 | 7/1/49 | 53 | ||||||||||||
| 56 | Freddie Mac, Pool #ZS4630 | 3.50 | 9/1/45 | 52 | ||||||||||||
| 61 | Freddie Mac, Pool #ZS4713 | 3.50 | 4/1/47 | 56 | ||||||||||||
| 28 | Freddie Mac, Pool #G30776 | 3.50 | 7/1/35 | 27 | ||||||||||||
| 2 | Freddie Mac, Pool #E02735 | 3.50 | 10/1/25 | 2 | ||||||||||||
| 61 | Freddie Mac, Pool #Q08903 | 3.50 | 6/1/42 | 57 | ||||||||||||
| 92 | Freddie Mac, Pool #ZS4618 | 3.50 | 6/1/45 | 85 | ||||||||||||
| 461 | Freddie Mac, Pool #SD0968 | 3.50 | 4/1/52 | 426 | ||||||||||||
| 392 | Freddie Mac, Pool #SD8221 | 3.50 | 6/1/52 | 357 | ||||||||||||
| 26 | Freddie Mac, Pool #ZS4759 | 3.50 | 3/1/48 | 24 | ||||||||||||
| 63 | Freddie Mac, Pool #G08632 | 3.50 | 3/1/45 | 59 | ||||||||||||
| 36 | Freddie Mac, Pool #ZS4771 | 3.50 | 6/1/48 | 33 | ||||||||||||
| 16 | Freddie Mac, Pool #A96409 | 3.50 | 1/1/41 | 15 | ||||||||||||
| 21 | Freddie Mac, Pool #G08599 | 3.50 | 8/1/44 | 19 | ||||||||||||
| 62 | Freddie Mac, Pool #ZS4622 | 3.50 | 7/1/45 | 58 | ||||||||||||
| 155 | Freddie Mac, Pool #RA2469 | 3.50 | 4/1/50 | 142 | ||||||||||||
| 45 | Freddie Mac, Pool #ZS4704 | 3.50 | 2/1/47 | 42 | ||||||||||||
| 62 | Freddie Mac, Pool #G61148 | 3.50 | 9/1/47 | 57 | ||||||||||||
| 38 | Freddie Mac, Pool #ZA5128 | 3.50 | 12/1/47 | 35 | ||||||||||||
| 5 | Freddie Mac, Pool #C91925 | 3.50 | 4/1/37 | 5 | ||||||||||||
| 30 | Freddie Mac, Pool #Q58422 | 3.50 | 9/1/48 | 28 | ||||||||||||
| 70 | Freddie Mac, Pool #ZS4651 | 3.50 | 3/1/46 | 64 | ||||||||||||
| 100 | Freddie Mac, Pool #SD8226 | 3.50 | 7/1/52 | 91 | ||||||||||||
| 53 | Freddie Mac, Pool #Q53176 | 3.50 | 12/1/47 | 49 | ||||||||||||
| 11 | Freddie Mac, Pool #Q55002 | 3.50 | 3/1/48 | 10 | ||||||||||||
| 79 | Freddie Mac, Pool #QA8794 | 3.50 | 4/1/50 | 73 | ||||||||||||
| 125 | Freddie Mac, Pool #ZS4536 | 3.50 | 10/1/43 | 117 | ||||||||||||
| 90 | Freddie Mac, Pool #G08562 | 3.50 | 1/1/44 | 84 | ||||||||||||
| 67 | Freddie Mac, Pool #Q49490 | 3.50 | 7/1/47 | 62 | ||||||||||||
| 50 | Freddie Mac, Pool #Q51461 | 3.50 | 10/1/47 | 46 | ||||||||||||
| 20 | Freddie Mac, Pool #G08605 | 3.50 | 9/1/44 | 19 | ||||||||||||
| 37 | Freddie Mac, Pool #Q57871 | 3.50 | 8/1/48 | 34 | ||||||||||||
| 16 | Freddie Mac, Pool #SB8007 | 3.50 | 9/1/34 | 15 | ||||||||||||
| 32 | Freddie Mac, Pool #SB0031 | 3.50 | 10/1/27 | 31 | ||||||||||||
| 53 | Freddie Mac, Pool #C91456 | 3.50 | 6/1/32 | 51 | ||||||||||||
| 49 | Freddie Mac, Pool #C91403 | 3.50 | 3/1/32 | 46 | ||||||||||||
| 277 | Freddie Mac, Pool #ZS4487 | 3.50 | 6/1/42 | 260 | ||||||||||||
| 24 | Freddie Mac, Pool #G08813 | 3.50 | 5/1/48 | 22 | ||||||||||||
| 17 | Freddie Mac, Pool #RA1508 | 3.50 | 10/1/49 | 16 | ||||||||||||
| 34 | Freddie Mac, Pool #G08687 | 3.50 | 1/1/46 | 31 | ||||||||||||
| 103 | Freddie Mac, Pool #G08636 | 3.50 | 4/1/45 | 96 | ||||||||||||
| 9 | Freddie Mac, Pool #C91940 | 3.50 | 6/1/37 | 9 | ||||||||||||
See accompanying notes to financial statements.
239
HC CAPITAL TRUST
The U.S. Mortgage/Asset Backed Fixed Income Securities Portfolio
Portfolio of Investments (continued) — June 30, 2023
Principal | Security Description | Rate % | Maturity | Value | ||||||||||||
U.S. Government Agency Mortgages (continued) | ||||||||||||||||
| $ | 5 | Freddie Mac, Pool #C91760 | 3.50 | 5/1/34 | $ | 4 | ||||||||||
| 29 | Freddie Mac, Pool #Q37449 | 3.50 | 11/1/45 | 27 | ||||||||||||
| 2 | Freddie Mac, Pool #J26144 | 3.50 | 10/1/23 | 2 | ||||||||||||
| 29 | Freddie Mac, Pool #G08698 | 3.50 | 3/1/46 | 27 | ||||||||||||
| 22 | Freddie Mac, Pool #G08846 | 3.50 | 11/1/48 | 20 | ||||||||||||
| 102 | Freddie Mac, Pool #ZS4599 | 3.50 | 1/1/45 | 95 | ||||||||||||
| 567 | Freddie Mac, Pool #SD8214 | 3.50 | 5/1/52 | 515 | ||||||||||||
| 72 | Freddie Mac, Pool #ZS4642 | 3.50 | 12/1/45 | 67 | ||||||||||||
| 29 | Freddie Mac, Pool #ZT1951 | 3.50 | 5/1/49 | 27 | ||||||||||||
| 30 | Freddie Mac, Pool #ZS4663 | 3.50 | 5/1/46 | 27 | ||||||||||||
| 15 | Freddie Mac, Pool #ZT0711 | 3.50 | 10/1/48 | 14 | ||||||||||||
| 391 | Freddie Mac, Pool #SD8256 | 4.00 | 10/1/52 | 367 | ||||||||||||
| 489 | Freddie Mac, Pool #SD8286 | 4.00 | 1/1/53 | 459 | ||||||||||||
| 73 | Freddie Mac, Pool #ZS4708 | 4.00 | 3/1/47 | 70 | ||||||||||||
| 42 | Freddie Mac, Pool #G08567 | 4.00 | 1/1/44 | 40 | ||||||||||||
| 44 | Freddie Mac, Pool #G08618 | 4.00 | 12/1/44 | 43 | ||||||||||||
| 8 | Freddie Mac, Pool #G14453 | 4.00 | 6/1/26 | 8 | ||||||||||||
| 10 | Freddie Mac, Pool #ZN5030 | 4.00 | 4/1/49 | 10 | ||||||||||||
| 23 | Freddie Mac, Pool #ZA6946 | 4.00 | 5/1/49 | 22 | ||||||||||||
| 23 | Freddie Mac, Pool #Q34081 | 4.00 | 6/1/45 | 22 | ||||||||||||
| 396 | Freddie Mac, Pool #SD8313 | 4.00 | 4/1/53 | 372 | ||||||||||||
| 40 | Freddie Mac, Pool #SD8039 | 4.00 | 1/1/50 | 38 | ||||||||||||
| 28 | Freddie Mac, Pool #C91738 | 4.00 | 11/1/33 | 28 | ||||||||||||
| 2 | Freddie Mac, Pool #J12435 | 4.00 | 6/1/25 | 2 | ||||||||||||
| 35 | Freddie Mac, Pool #Q58680 | 4.00 | 9/1/48 | 34 | ||||||||||||
| 45 | Freddie Mac, Pool #ZS4573 | 4.00 | 7/1/44 | 44 | ||||||||||||
| 33 | Freddie Mac, Pool #ZT2106 | 4.00 | 3/1/49 | 31 | ||||||||||||
| 49 | Freddie Mac, Pool #G08459 | 4.00 | 9/1/41 | 47 | ||||||||||||
| 10 | Freddie Mac, Pool #ZT1800 | 4.00 | 3/1/34 | 9 | ||||||||||||
| 9 | Freddie Mac, Pool #C91994 | 4.00 | 5/1/38 | 9 | ||||||||||||
| 49 | Freddie Mac, Pool #G08785 | 4.00 | 10/1/47 | 46 | ||||||||||||
| 21 | Freddie Mac, Pool #G08483 | 4.00 | 3/1/42 | 21 | ||||||||||||
| 389 | Freddie Mac, Pool #QE5462 | 4.00 | 7/1/52 | 366 | ||||||||||||
| 27 | Freddie Mac, Pool #C91765 | 4.00 | 6/1/34 | 27 | ||||||||||||
| 27 | Freddie Mac, Pool #ZT1320 | 4.00 | 11/1/48 | 25 | ||||||||||||
| 394 | Freddie Mac, Pool #SD8244 | 4.00 | 9/1/52 | 370 | ||||||||||||
| 59 | Freddie Mac, Pool #ZS4731 | 4.00 | 8/1/47 | 56 | ||||||||||||
| 39 | Freddie Mac, Pool #C09070 | 4.00 | 12/1/44 | 37 | ||||||||||||
| 239 | Freddie Mac, Pool #A96286 | 4.00 | 1/1/41 | 231 | ||||||||||||
| 190 | Freddie Mac, Pool #QE6074 | 4.00 | 7/1/52 | 178 | ||||||||||||
| 67 | Freddie Mac, Pool #ZL7781 | 4.00 | 2/1/44 | 64 | ||||||||||||
| 14 | Freddie Mac, Pool #ZS4652 | 4.00 | 2/1/46 | 14 | ||||||||||||
| 37 | Freddie Mac, Pool #Q27594 | 4.00 | 8/1/44 | 36 | ||||||||||||
| 46 | Freddie Mac, Pool #G08616 | 4.00 | 11/1/44 | 44 | ||||||||||||
| 6 | Freddie Mac, Pool #G08633 | 4.00 | 3/1/45 | 6 | ||||||||||||
| 12 | Freddie Mac, Pool #G08672 | 4.00 | 10/1/45 | 11 | ||||||||||||
| 32 | Freddie Mac, Pool #G08767 | 4.00 | 6/1/47 | 30 | ||||||||||||
| 3 | Freddie Mac, Pool #G08642 | 4.00 | 5/1/45 | 3 | ||||||||||||
See accompanying notes to financial statements.
240
HC CAPITAL TRUST
The U.S. Mortgage/Asset Backed Fixed Income Securities Portfolio
Portfolio of Investments (continued) — June 30, 2023
Principal | Security Description | Rate % | Maturity | Value | ||||||||||||
U.S. Government Agency Mortgages (continued) | ||||||||||||||||
| $ | 22 | Freddie Mac, Pool #ZT1840 | 4.00 | 9/1/48 | $ | 21 | ||||||||||
| 381 | Freddie Mac, Pool #SD1132 | 4.00 | 6/1/52 | 359 | ||||||||||||
| 37 | Freddie Mac, Pool #ZT1952 | 4.00 | 5/1/49 | 35 | ||||||||||||
| 101 | Freddie Mac, Pool #SD0290 | 4.00 | 4/1/50 | 96 | ||||||||||||
| 58 | Freddie Mac, Pool #ZA4988 | 4.00 | 8/1/47 | 55 | ||||||||||||
| 19 | Freddie Mac, Pool #G08831 | 4.00 | 8/1/48 | 18 | ||||||||||||
| 20 | Freddie Mac, Pool #G08836 | 4.00 | 9/1/48 | 19 | ||||||||||||
| 27 | Freddie Mac, Pool #G08637 | 4.00 | 4/1/45 | 26 | ||||||||||||
| 83 | Freddie Mac, Pool #G06506 | 4.00 | 12/1/40 | 80 | ||||||||||||
| 23 | Freddie Mac, Pool #G08601 | 4.00 | 8/1/44 | 22 | ||||||||||||
| 123 | Freddie Mac, Pool #SD8070 | 4.00 | 6/1/50 | 117 | ||||||||||||
| 78 | Freddie Mac, Pool #ZS4627 | 4.00 | 8/1/45 | 74 | ||||||||||||
| 49 | Freddie Mac, Pool #G08588 | 4.00 | 5/1/44 | 47 | ||||||||||||
| 61 | Freddie Mac, Pool #ZS4631 | 4.00 | 9/1/45 | 59 | ||||||||||||
| 3 | Freddie Mac, Pool #Q27456 | 4.00 | 7/1/44 | 3 | ||||||||||||
| 6 | Freddie Mac, Pool #C91923 | 4.00 | 3/1/37 | 5 | ||||||||||||
| 7 | Freddie Mac, Pool #C92019 | 4.00 | 10/1/38 | 7 | ||||||||||||
| 391 | Freddie Mac, Pool #SD8306 | 4.50 | 3/1/53 | 376 | ||||||||||||
| 15 | Freddie Mac, Pool #G08596 | 4.50 | 7/1/44 | 14 | ||||||||||||
| 26 | Freddie Mac, Pool #Q59805 | 4.50 | 11/1/48 | 25 | ||||||||||||
| 47 | Freddie Mac, Pool #ZT1711 | 4.50 | 2/1/49 | 46 | ||||||||||||
| 17 | Freddie Mac, Pool #Q25432 | 4.50 | 3/1/44 | 17 | ||||||||||||
| 36 | Freddie Mac, Pool #G08759 | 4.50 | 4/1/47 | 35 | ||||||||||||
| 482 | Freddie Mac, Pool #A97692 | 4.50 | 3/1/41 | 467 | ||||||||||||
| 23 | Freddie Mac, Pool #ZS4774 | 4.50 | 5/1/48 | 23 | ||||||||||||
| 40 | Freddie Mac, Pool #A97495 | 4.50 | 3/1/41 | 39 | ||||||||||||
| 24 | Freddie Mac, Pool #G08754 | 4.50 | 3/1/47 | 24 | ||||||||||||
| 451 | Freddie Mac, Pool #SD8245 | 4.50 | 9/1/52 | 434 | ||||||||||||
| 395 | Freddie Mac, Pool #SD8266 | 4.50 | 11/1/52 | 380 | ||||||||||||
| 22 | Freddie Mac, Pool #ZT1321 | 4.50 | 11/1/48 | 22 | ||||||||||||
| 23 | Freddie Mac, Pool #ZS4781 | 4.50 | 7/1/48 | 22 | ||||||||||||
| 390 | Freddie Mac, Pool #SD8287 | 4.50 | 1/1/53 | 375 | ||||||||||||
| 94 | Freddie Mac, Pool #RA7928 | 4.50 | 9/1/52 | 90 | ||||||||||||
| 92 | Freddie Mac, Pool #SD8002 | 4.50 | 7/1/49 | 90 | ||||||||||||
| 19 | Freddie Mac, Pool #G60512 | 4.50 | 12/1/45 | 18 | ||||||||||||
| 27 | Freddie Mac, Pool #Q57957 | 4.50 | 8/1/48 | 27 | ||||||||||||
| 4 | Freddie Mac, Pool #A90437 | 4.50 | 1/1/40 | 4 | ||||||||||||
| 2 | Freddie Mac, Pool #E02862 | 4.50 | 3/1/26 | 2 | ||||||||||||
| 17 | Freddie Mac, Pool #Q22671 | 4.50 | 11/1/43 | 16 | ||||||||||||
| 7 | Freddie Mac, Pool #C09059 | 4.50 | 3/1/44 | 7 | ||||||||||||
| 372 | Freddie Mac, Pool #QE9161 | 4.50 | 9/1/52 | 357 | ||||||||||||
| 11 | Freddie Mac, Pool #G08781 | 4.50 | 9/1/47 | 11 | ||||||||||||
| 57 | Freddie Mac, Pool #ZT1779 | 5.00 | 3/1/49 | 56 | ||||||||||||
| 7 | Freddie Mac, Pool #G08838 | 5.00 | 9/1/48 | 7 | ||||||||||||
| — | Freddie Mac, Pool #G13255 | 5.00 | 7/1/23 | — | ||||||||||||
| 208 | Freddie Mac, Pool #C01598 | 5.00 | 8/1/33 | 206 | ||||||||||||
| 392 | Freddie Mac, Pool #SD8299 | 5.00 | 2/1/53 | 384 | ||||||||||||
| 14 | Freddie Mac, Pool #G05205 | 5.00 | 1/1/39 | 14 | ||||||||||||
See accompanying notes to financial statements.
241
HC CAPITAL TRUST
The U.S. Mortgage/Asset Backed Fixed Income Securities Portfolio
Portfolio of Investments (continued) — June 30, 2023
Principal | Security Description | Rate % | Maturity | Value | ||||||||||||
U.S. Government Agency Mortgages (continued) | ||||||||||||||||
| $ | 91 | Freddie Mac, Pool #G04913 | 5.00 | 3/1/38 | $ | 91 | ||||||||||
| 6 | Freddie Mac, Pool #G07068 | 5.00 | 7/1/41 | 6 | ||||||||||||
| 400 | Freddie Mac, Pool #SD8341 | 5.00 | 7/1/53 | 392 | ||||||||||||
| 5 | Freddie Mac, Pool #SD0093 | 5.00 | 10/1/49 | 5 | ||||||||||||
| 62 | Freddie Mac, Pool #Q00763 | 5.00 | 5/1/41 | 63 | ||||||||||||
| 398 | Freddie Mac, Pool #SD8288 | 5.00 | 1/1/53 | 390 | ||||||||||||
| 387 | Freddie Mac, Pool #SD8300 | 5.50 | 2/1/53 | 386 | ||||||||||||
| 1 | Freddie Mac, Pool #G06091 | 5.50 | 5/1/40 | 1 | ||||||||||||
| 31 | Freddie Mac, Pool #G06031 | 5.50 | 3/1/40 | 32 | ||||||||||||
| 128 | Freddie Mac, Pool #G01665 | 5.50 | 3/1/34 | 128 | ||||||||||||
| 25 | Freddie Mac, Pool #G03551 | 6.00 | 11/1/37 | 26 | ||||||||||||
| 2 | Freddie Mac, Pool #A62706 | 6.00 | 6/1/37 | 2 | ||||||||||||
| 13 | Freddie Mac, Pool #G05709 | 6.00 | 6/1/38 | 14 | ||||||||||||
| 118 | Freddie Mac, Pool #G02794 | 6.00 | 5/1/37 | 124 | ||||||||||||
| 361 | Government National Mortgage Association, Pool #MA7417 | 2.00 | 6/20/51 | 304 | ||||||||||||
| 341 | Government National Mortgage Association, Pool #MA7254 | 2.00 | 3/20/51 | 287 | ||||||||||||
| 646 | Government National Mortgage Association, Pool #MA7935 | 2.00 | 3/20/52 | 541 | ||||||||||||
| 520 | Government National Mortgage Association, Pool #MA7311 | 2.00 | 4/20/51 | 437 | ||||||||||||
| 382 | Government National Mortgage Association, Pool #MA8041 | 2.00 | 5/20/52 | 321 | ||||||||||||
| 469 | Government National Mortgage Association, Pool #MA7471 | 2.00 | 7/20/51 | 394 | ||||||||||||
| 337 | Government National Mortgage Association, Pool #MA7366 | 2.00 | 5/20/51 | 283 | ||||||||||||
| 310 | Government National Mortgage Association, Pool #MA6930 | 2.00 | 10/20/50 | 261 | ||||||||||||
| 408 | Government National Mortgage Association, Pool #MA7588 | 2.00 | 9/20/51 | 343 | ||||||||||||
| 320 | Government National Mortgage Association, Pool #MA6818 | 2.00 | 8/20/50 | 269 | ||||||||||||
| 329 | Government National Mortgage Association, Pool #MA7135 | 2.00 | 1/20/51 | 277 | ||||||||||||
| 184 | Government National Mortgage Association, Pool #MA6864 | 2.00 | 9/20/50 | 155 | ||||||||||||
| 605 | Government National Mortgage Association, Pool #MA7826 | 2.00 | 1/20/52 | 507 | ||||||||||||
| 419 | Government National Mortgage Association, Pool #MA6994 | 2.00 | 11/20/50 | 354 | ||||||||||||
| 192 | Government National Mortgage Association, Pool #MA7880 | 2.00 | 2/20/52 | 161 | ||||||||||||
| 449 | Government National Mortgage Association, Pool #MA7766 | 2.00 | 12/20/51 | 378 | ||||||||||||
| 424 | Government National Mortgage Association, Pool #MA7986 | 2.00 | 4/20/52 | 356 | ||||||||||||
| 582 | Government National Mortgage Association, Pool #MA7704 | 2.00 | 11/20/51 | 489 | ||||||||||||
| 257 | Government National Mortgage Association, Pool #MA7533 | 2.00 | 8/20/51 | 216 | ||||||||||||
| 367 | Government National Mortgage Association, Pool #MA7051 | 2.00 | 12/20/50 | 309 | ||||||||||||
| 378 | Government National Mortgage Association, Pool #MA7367 | 2.50 | 5/20/51 | 328 | ||||||||||||
| 6 | Government National Mortgage Association, Pool #MA4355 | 2.50 | 4/20/32 | 5 | ||||||||||||
| 327 | Government National Mortgage Association, Pool #MA7255 | 2.50 | 3/20/51 | 284 | ||||||||||||
| 13 | Government National Mortgage Association, Pool #776954 | 2.50 | 11/15/42 | 12 | ||||||||||||
| 427 | Government National Mortgage Association, Pool #MA7136 | 2.50 | 1/20/51 | 371 | ||||||||||||
| 189 | Government National Mortgage Association, Pool #MA4125 | 2.50 | 12/20/46 | 166 | ||||||||||||
| 188 | Government National Mortgage Association, Pool #MA4260 | 2.50 | 2/20/47 | 165 | ||||||||||||
| 6 | Government National Mortgage Association, Pool #MA2890 | 2.50 | 6/20/45 | 5 | ||||||||||||
| 188 | Government National Mortgage Association, Pool #MA7705 | 2.50 | 11/20/51 | 163 | ||||||||||||
| 422 | Government National Mortgage Association, Pool #MA6709 | 2.50 | 6/20/50 | 367 | ||||||||||||
| 417 | Government National Mortgage Association, Pool #MA7589 | 2.50 | 9/20/51 | 361 | ||||||||||||
| 16 | Government National Mortgage Association, Pool #MA0601 | 2.50 | 12/20/27 | 15 | ||||||||||||
| 337 | Government National Mortgage Association, Pool #MA7312 | 2.50 | 4/20/51 | 292 | ||||||||||||
| 415 | Government National Mortgage Association, Pool #MA7881 | 2.50 | 2/20/52 | 359 | ||||||||||||
See accompanying notes to financial statements.
242
HC CAPITAL TRUST
The U.S. Mortgage/Asset Backed Fixed Income Securities Portfolio
Portfolio of Investments (continued) — June 30, 2023
Principal | Security Description | Rate % | Maturity | Value | ||||||||||||
U.S. Government Agency Mortgages (continued) | ||||||||||||||||
| $ | 19 | Government National Mortgage Association, Pool #MA4067 | 2.50 | 11/20/46 | $ | 16 | ||||||||||
| 271 | Government National Mortgage Association, Pool #MA6995 | 2.50 | 11/20/50 | 236 | ||||||||||||
| 179 | Government National Mortgage Association, Pool #MA6655 | 2.50 | 5/20/50 | 156 | ||||||||||||
| 16 | Government National Mortgage Association, Pool #AA8341 | 2.50 | 2/15/28 | 15 | ||||||||||||
| 390 | Government National Mortgage Association, Pool #MA7649 | 2.50 | 10/20/51 | 338 | ||||||||||||
| 11 | Government National Mortgage Association, Pool #MA1133 | 2.50 | 7/20/28 | 10 | ||||||||||||
| 413 | Government National Mortgage Association, Pool #MA7936 | 2.50 | 3/20/52 | 357 | ||||||||||||
| 90 | Government National Mortgage Association, Pool #MA6598 | 2.50 | 4/20/50 | 78 | ||||||||||||
| 11 | Government National Mortgage Association, Pool #MA4424 | 2.50 | 5/20/32 | 10 | ||||||||||||
| 17 | Government National Mortgage Association, Pool #MA4717 | 2.50 | 9/20/47 | 15 | ||||||||||||
| 451 | Government National Mortgage Association, Pool #MA7827 | 2.50 | 1/20/52 | 391 | ||||||||||||
| 316 | Government National Mortgage Association, Pool #MA7193 | 2.50 | 2/20/51 | 274 | ||||||||||||
| 12 | Government National Mortgage Association, Pool #MA4194 | 2.50 | 1/20/47 | 10 | ||||||||||||
| 253 | Government National Mortgage Association, Pool #MA6931 | 2.50 | 10/20/50 | 220 | ||||||||||||
| 396 | Government National Mortgage Association, Pool #MA8147 | 2.50 | 7/20/52 | 344 | ||||||||||||
| 572 | Government National Mortgage Association, Pool #MA7767 | 2.50 | 12/20/51 | 496 | ||||||||||||
| 10 | Government National Mortgage Association, Pool #711729 | 2.50 | 3/15/43 | 9 | ||||||||||||
| 303 | Government National Mortgage Association, Pool #MA8042 | 2.50 | 5/20/52 | 262 | ||||||||||||
| 141 | Government National Mortgage Association, Pool #MA6540 | 2.50 | 3/20/50 | 123 | ||||||||||||
| 390 | Government National Mortgage Association, Pool #MA6865 | 2.50 | 9/20/50 | 339 | ||||||||||||
| 10 | Government National Mortgage Association, Pool #MA0908 | 2.50 | 4/20/28 | 9 | ||||||||||||
| 369 | Government National Mortgage Association, Pool #MA7472 | 2.50 | 7/20/51 | 320 | ||||||||||||
| 360 | Government National Mortgage Association, Pool #MA7418 | 2.50 | 6/20/51 | 312 | ||||||||||||
| 34 | Government National Mortgage Association, Pool #MA1283 | 2.50 | 9/20/43 | 29 | ||||||||||||
| 560 | Government National Mortgage Association, Pool #MA7534 | 2.50 | 8/20/51 | 485 | ||||||||||||
| 200 | Government National Mortgage Association, Pool #MA6819 | 2.50 | 8/20/50 | 174 | ||||||||||||
| 432 | Government National Mortgage Association, Pool #MA7052 | 2.50 | 12/20/50 | 375 | ||||||||||||
| 416 | Government National Mortgage Association, Pool #MA7987 | 2.50 | 4/20/52 | 360 | ||||||||||||
| 143 | Government National Mortgage Association, Pool #MA4261 | 3.00 | 2/20/47 | 130 | ||||||||||||
| 369 | Government National Mortgage Association, Pool #MA7828 | 3.00 | 1/20/52 | 331 | ||||||||||||
| 81 | Government National Mortgage Association, Pool #MA0153 | 3.00 | 6/20/42 | 75 | ||||||||||||
| 69 | Government National Mortgage Association, Pool #MA6710 | 3.00 | 6/20/50 | 62 | ||||||||||||
| 151 | Government National Mortgage Association, Pool #MA4195 | 3.00 | 1/20/47 | 136 | ||||||||||||
| 132 | Government National Mortgage Association, Pool #MA6474 | 3.00 | 2/20/50 | 119 | ||||||||||||
| 3 | Government National Mortgage Association, Pool #5276 | 3.00 | 1/20/27 | 3 | ||||||||||||
| 9 | Government National Mortgage Association, Pool #AA2934 | 3.00 | 7/15/42 | 8 | ||||||||||||
| 170 | Government National Mortgage Association, Pool #MA4126 | 3.00 | 12/20/46 | 154 | ||||||||||||
| 7 | Government National Mortgage Association, Pool #AN5756 | 3.00 | 7/15/45 | 7 | ||||||||||||
| 99 | Government National Mortgage Association, Pool #MA4651 | 3.00 | 8/20/47 | 90 | ||||||||||||
| 75 | Government National Mortgage Association, Pool #MA4961 | 3.00 | 1/20/48 | 68 | ||||||||||||
| 16 | Government National Mortgage Association, Pool #MA6766 | 3.00 | 7/20/50 | 14 | ||||||||||||
| 19 | Government National Mortgage Association, Pool #MA6820 | 3.00 | 8/20/50 | 17 | ||||||||||||
| 92 | Government National Mortgage Association, Pool #MA4509 | 3.00 | 6/20/47 | 84 | ||||||||||||
| 17 | Government National Mortgage Association, Pool #MA4559 | 3.00 | 7/20/32 | 16 | ||||||||||||
| 57 | Government National Mortgage Association, Pool #MA3596 | 3.00 | 4/20/46 | 51 | ||||||||||||
| 75 | Government National Mortgage Association, Pool #MA4777 | 3.00 | 10/20/47 | 68 | ||||||||||||
| 103 | Government National Mortgage Association, Pool #MA4836 | 3.00 | 11/20/47 | 93 | ||||||||||||
| 38 | Government National Mortgage Association, Pool #MA2753 | 3.00 | 4/20/45 | 34 | ||||||||||||
| 71 | Government National Mortgage Association, Pool #MA3802 | 3.00 | 7/20/46 | 64 | ||||||||||||
See accompanying notes to financial statements.
243
HC CAPITAL TRUST
The U.S. Mortgage/Asset Backed Fixed Income Securities Portfolio
Portfolio of Investments (continued) — June 30, 2023
Principal | Security Description | Rate % | Maturity | Value | ||||||||||||
U.S. Government Agency Mortgages (continued) | ||||||||||||||||
| $ | 86 | Government National Mortgage Association, Pool #MA1374 | 3.00 | 10/20/43 | $ | 76 | ||||||||||
| 13 | Government National Mortgage Association, Pool #AK7285 | 3.00 | 3/15/45 | 12 | ||||||||||||
| 152 | Government National Mortgage Association, Pool #MA4899 | 3.00 | 12/20/47 | 138 | ||||||||||||
| 30 | Government National Mortgage Association, Pool #MA4068 | 3.00 | 11/20/46 | 27 | ||||||||||||
| 425 | Government National Mortgage Association, Pool #MA8098 | 3.00 | 6/20/52 | 379 | ||||||||||||
| 4 | Government National Mortgage Association, Pool #AL5058 | 3.00 | 3/15/45 | 4 | ||||||||||||
| 21 | Government National Mortgage Association, Pool #MA3520 | 3.00 | 3/20/46 | 19 | ||||||||||||
| 169 | Government National Mortgage Association, Pool #MA4003 | 3.00 | 10/20/46 | 154 | ||||||||||||
| 48 | Government National Mortgage Association, Pool #MA2825 | 3.00 | 5/20/45 | 43 | ||||||||||||
| 129 | Government National Mortgage Association, Pool #AD8433 | 3.00 | 7/15/43 | 118 | ||||||||||||
| 366 | Government National Mortgage Association, Pool #MA7706 | 3.00 | 11/20/51 | 328 | ||||||||||||
| 126 | Government National Mortgage Association, Pool #MA6409 | 3.00 | 1/20/50 | 114 | ||||||||||||
| 21 | Government National Mortgage Association, Pool #MA1265 | 3.00 | 9/20/28 | 20 | ||||||||||||
| 14 | Government National Mortgage Association, Pool #AG0440 | 3.00 | 8/15/43 | 13 | ||||||||||||
| 377 | Government National Mortgage Association, Pool #MA7768 | 3.00 | 12/20/51 | 338 | ||||||||||||
| 347 | Government National Mortgage Association, Pool #MA6218 | 3.00 | 10/20/49 | 313 | ||||||||||||
| 140 | Government National Mortgage Association, Pool #MA5018 | 3.00 | 2/20/48 | 127 | ||||||||||||
| 83 | Government National Mortgage Association, Pool #MA2520 | 3.00 | 1/20/45 | 76 | ||||||||||||
| 22 | Government National Mortgage Association, Pool #MA3243 | 3.00 | 11/20/45 | 20 | ||||||||||||
| 462 | Government National Mortgage Association, Pool #MA0624 | 3.00 | 12/20/42 | 423 | ||||||||||||
| 54 | Government National Mortgage Association, Pool #MA3104 | 3.00 | 9/20/45 | 49 | ||||||||||||
| 73 | Government National Mortgage Association, Pool #MA0461 | 3.00 | 10/20/42 | 67 | ||||||||||||
| 131 | Government National Mortgage Association, Pool #MA0391 | 3.00 | 9/20/42 | 120 | ||||||||||||
| 157 | Government National Mortgage Association, Pool #MA5076 | 3.00 | 3/20/48 | 142 | ||||||||||||
| 57 | Government National Mortgage Association, Pool #MA3309 | 3.00 | 12/20/45 | 52 | ||||||||||||
| 30 | Government National Mortgage Association, Pool #MA0851 | 3.00 | 3/20/43 | 27 | ||||||||||||
| 97 | Government National Mortgage Association, Pool #AA6149 | 3.00 | 3/20/43 | 87 | ||||||||||||
| 51 | Government National Mortgage Association, Pool #MA2444 | 3.00 | 12/20/44 | 47 | ||||||||||||
| 5 | Government National Mortgage Association, Pool #MA4935 | 3.00 | 1/20/33 | 4 | ||||||||||||
| 49 | Government National Mortgage Association, Pool #MA2960 | 3.00 | 7/20/45 | 44 | ||||||||||||
| 108 | Government National Mortgage Association, Pool #MA6338 | 3.00 | 12/20/49 | 98 | ||||||||||||
| 61 | Government National Mortgage Association, Pool #MA4320 | 3.00 | 3/20/47 | 55 | ||||||||||||
| 115 | Government National Mortgage Association, Pool #MA3936 | 3.00 | 9/20/46 | 104 | ||||||||||||
| 48 | Government National Mortgage Association, Pool #AA2654 | 3.00 | 6/15/43 | 44 | ||||||||||||
| 106 | Government National Mortgage Association, Pool #MA2147 | 3.00 | 8/20/44 | 97 | ||||||||||||
| 40 | Government National Mortgage Association, Pool #779084 | 3.00 | 4/15/42 | 36 | ||||||||||||
| 79 | Government National Mortgage Association, Pool #MA4450 | 3.00 | 5/20/47 | 71 | ||||||||||||
| 73 | Government National Mortgage Association, Pool #MA6283 | 3.00 | 11/20/49 | 66 | ||||||||||||
| 127 | Government National Mortgage Association, Pool #MA3735 | 3.00 | 6/20/46 | 114 | ||||||||||||
| 70 | Government National Mortgage Association, Pool #MA6089 | 3.00 | 8/20/49 | 64 | ||||||||||||
| 213 | Government National Mortgage Association, Pool #MA6656 | 3.00 | 5/20/50 | 192 | ||||||||||||
| 62 | Government National Mortgage Association, Pool #MA3662 | 3.00 | 5/20/46 | 56 | ||||||||||||
| 241 | Government National Mortgage Association, Pool #MA6599 | 3.00 | 4/20/50 | 217 | ||||||||||||
| 16 | Government National Mortgage Association, Pool #MA0205 | 3.00 | 7/20/27 | 16 | ||||||||||||
| 51 | Government National Mortgage Association, Pool #MA3873 | 3.00 | 8/20/46 | 46 | ||||||||||||
| 19 | Government National Mortgage Association, Pool #MA2600 | 3.00 | 2/20/45 | 17 | ||||||||||||
| 7 | Government National Mortgage Association, Pool #MA1890 | 3.00 | 5/20/29 | 6 | ||||||||||||
| 71 | Government National Mortgage Association, Pool #MA3033 | 3.00 | 8/20/45 | 64 | ||||||||||||
| 45 | Government National Mortgage Association, Pool #MA3172 | 3.00 | 10/20/45 | 41 | ||||||||||||
See accompanying notes to financial statements.
244
HC CAPITAL TRUST
The U.S. Mortgage/Asset Backed Fixed Income Securities Portfolio
Portfolio of Investments (continued) — June 30, 2023
Principal | Security Description | Rate % | Maturity | Value | ||||||||||||
U.S. Government Agency Mortgages (continued) | ||||||||||||||||
| $ | 63 | Government National Mortgage Association, Pool #MA4381 | 3.00 | 4/20/47 | $ | 57 | ||||||||||
| 10 | Government National Mortgage Association, Pool #MA2797 | 3.00 | 5/20/30 | 10 | ||||||||||||
| 116 | Government National Mortgage Association, Pool #MA5019 | 3.50 | 2/20/48 | 107 | ||||||||||||
| 13 | Government National Mortgage Association, Pool #MA6711 | 3.50 | 6/20/50 | 12 | ||||||||||||
| 54 | Government National Mortgage Association, Pool #MA2961 | 3.50 | 7/20/45 | 50 | ||||||||||||
| 12 | Government National Mortgage Association, Pool #MA5762 | 3.50 | 2/20/49 | 11 | ||||||||||||
| 38 | Government National Mortgage Association, Pool #MA2371 | 3.50 | 11/20/44 | 36 | ||||||||||||
| 92 | Government National Mortgage Association, Pool #MA3034 | 3.50 | 8/20/45 | 87 | ||||||||||||
| 11 | Government National Mortgage Association, Pool #MA6475 | 3.50 | 2/20/50 | 10 | ||||||||||||
| 12 | Government National Mortgage Association, Pool #MA6219 | 3.50 | 10/20/49 | 11 | ||||||||||||
| 10 | Government National Mortgage Association, Pool #MA5875 | 3.50 | 4/20/49 | 9 | ||||||||||||
| 387 | Government National Mortgage Association, Pool #MA8199 | 3.50 | 8/20/52 | 357 | ||||||||||||
| 74 | Government National Mortgage Association, Pool #MA2892 | 3.50 | 6/20/45 | 70 | ||||||||||||
| 226 | Government National Mortgage Association, Pool #MA0220 | 3.50 | 7/20/42 | 213 | ||||||||||||
| 45 | Government National Mortgage Association, Pool #MA2754 | 3.50 | 4/20/45 | 43 | ||||||||||||
| 98 | Government National Mortgage Association, Pool #MA3521 | 3.50 | 3/20/46 | 92 | ||||||||||||
| 81 | Government National Mortgage Association, Pool #AM4971 | 3.50 | 4/20/45 | 74 | ||||||||||||
| 67 | Government National Mortgage Association, Pool #MA4900 | 3.50 | 12/20/47 | 63 | ||||||||||||
| 74 | Government National Mortgage Association, Pool #MA4004 | 3.50 | 10/20/46 | 70 | ||||||||||||
| 89 | Government National Mortgage Association, Pool #MA4127 | 3.50 | 12/20/46 | 84 | ||||||||||||
| 69 | Government National Mortgage Association, Pool #MA0022 | 3.50 | 4/20/42 | 65 | ||||||||||||
| 89 | Government National Mortgage Association, Pool #MA4837 | 3.50 | 11/20/47 | 83 | ||||||||||||
| 38 | Government National Mortgage Association, Pool #AC3938 | 3.50 | 1/15/43 | 36 | ||||||||||||
| 47 | Government National Mortgage Association, Pool #MA4778 | 3.50 | 10/20/47 | 44 | ||||||||||||
| 479 | Government National Mortgage Association, Pool #MA8149 | 3.50 | 7/20/52 | 442 | ||||||||||||
| 12 | Government National Mortgage Association, Pool #738602 | 3.50 | 8/15/26 | 12 | ||||||||||||
| 68 | Government National Mortgage Association, Pool #MA4652 | 3.50 | 8/20/47 | 64 | ||||||||||||
| 104 | Government National Mortgage Association, Pool #MA4196 | 3.50 | 1/20/47 | 98 | ||||||||||||
| 2 | Government National Mortgage Association, Pool #AL8566 | 3.50 | 3/15/45 | 2 | ||||||||||||
| 36 | Government National Mortgage Association, Pool #MA1919 | 3.50 | 5/20/44 | 34 | ||||||||||||
| 80 | Government National Mortgage Association, Pool #MA2303 | 3.50 | 10/20/44 | 75 | ||||||||||||
| 43 | Government National Mortgage Association, Pool #740798 | 3.50 | 1/15/42 | 40 | ||||||||||||
| 42 | Government National Mortgage Association, Pool #MA1838 | 3.50 | 4/20/44 | 39 | ||||||||||||
| 75 | Government National Mortgage Association, Pool #MA4382 | 3.50 | 4/20/47 | 70 | ||||||||||||
| 51 | Government National Mortgage Association, Pool #MA3736 | 3.50 | 6/20/46 | 48 | ||||||||||||
| 70 | Government National Mortgage Association, Pool #MA4321 | 3.50 | 3/20/47 | 66 | ||||||||||||
| 66 | Government National Mortgage Association, Pool #MA4262 | 3.50 | 2/20/47 | 62 | ||||||||||||
| 82 | Government National Mortgage Association, Pool #MA3244 | 3.50 | 11/20/45 | 77 | ||||||||||||
| 72 | Government National Mortgage Association, Pool #MA3376 | 3.50 | 1/20/46 | 68 | ||||||||||||
| 58 | Government National Mortgage Association, Pool #MA3663 | 3.50 | 5/20/46 | 54 | ||||||||||||
| 71 | Government National Mortgage Association, Pool #MA3597 | 3.50 | 4/20/46 | 67 | ||||||||||||
| 9 | Government National Mortgage Association, Pool #MA6410 | 3.50 | 1/20/50 | 8 | ||||||||||||
| 45 | Government National Mortgage Association, Pool #MA2445 | 3.50 | 12/20/44 | 42 | ||||||||||||
| 129 | Government National Mortgage Association, Pool #MA2073 | 3.50 | 7/20/44 | 123 | ||||||||||||
| 105 | Government National Mortgage Association, Pool #MA3173 | 3.50 | 10/20/45 | 99 | ||||||||||||
| 128 | Government National Mortgage Association, Pool #MA0462 | 3.50 | 10/20/42 | 120 | ||||||||||||
| 125 | Government National Mortgage Association, Pool #MA1090 | 3.50 | 6/20/43 | 118 | ||||||||||||
| 8 | Government National Mortgage Association, Pool #MA1574 | 3.50 | 1/20/29 | 7 | ||||||||||||
| 110 | Government National Mortgage Association, Pool #MA0934 | 3.50 | 4/20/43 | 104 | ||||||||||||
See accompanying notes to financial statements.
245
HC CAPITAL TRUST
The U.S. Mortgage/Asset Backed Fixed Income Securities Portfolio
Portfolio of Investments (continued) — June 30, 2023
Principal | Security Description | Rate % | Maturity | Value | ||||||||||||
U.S. Government Agency Mortgages (continued) | ||||||||||||||||
| $ | 67 | Government National Mortgage Association, Pool #MA4069 | 3.50 | 11/20/46 | $ | 63 | ||||||||||
| 48 | Government National Mortgage Association, Pool #MA4510 | 3.50 | 6/20/47 | 45 | ||||||||||||
| 67 | Government National Mortgage Association, Pool #MA0699 | 3.50 | 1/20/43 | 63 | ||||||||||||
| 32 | Government National Mortgage Association, Pool #MA4451 | 3.50 | 5/20/47 | 30 | ||||||||||||
| 110 | Government National Mortgage Association, Pool #MA0852 | 3.50 | 3/20/43 | 104 | ||||||||||||
| 16 | Government National Mortgage Association, Pool #MA3937 | 3.50 | 9/20/46 | 15 | ||||||||||||
| 242 | Government National Mortgage Association, Pool #MA8266 | 3.50 | 9/20/52 | 223 | ||||||||||||
| 56 | Government National Mortgage Association, Pool #MA5077 | 3.50 | 3/20/48 | 52 | ||||||||||||
| 61 | Government National Mortgage Association, Pool #MA5136 | 3.50 | 4/20/48 | 58 | ||||||||||||
| 46 | Government National Mortgage Association, Pool #MA5263 | 3.50 | 6/20/48 | 43 | ||||||||||||
| 15 | Government National Mortgage Association, Pool #MA6339 | 3.50 | 12/20/49 | 14 | ||||||||||||
| 25 | Government National Mortgage Association, Pool #BD5909 | 3.50 | 10/15/47 | 24 | ||||||||||||
| 63 | Government National Mortgage Association, Pool #783976 | 3.50 | 4/20/43 | 59 | ||||||||||||
| 61 | Government National Mortgage Association, Pool #MA4719 | 3.50 | 9/20/47 | 57 | ||||||||||||
| 55 | Government National Mortgage Association, Pool #MA3874 | 3.50 | 8/20/46 | 51 | ||||||||||||
| 50 | Government National Mortgage Association, Pool #MA4586 | 3.50 | 7/20/47 | 47 | ||||||||||||
| 14 | Government National Mortgage Association, Pool #796271 | 3.50 | 7/15/42 | 13 | ||||||||||||
| 40 | Government National Mortgage Association, Pool #MA3454 | 3.50 | 2/20/46 | 38 | ||||||||||||
| 182 | Government National Mortgage Association, Pool #MA2148 | 3.50 | 8/20/44 | 172 | ||||||||||||
| 15 | Government National Mortgage Association, Pool #AD2416 | 3.50 | 5/15/43 | 14 | ||||||||||||
| 68 | Government National Mortgage Association, Pool #MA2678 | 3.50 | 3/20/45 | 64 | ||||||||||||
| 88 | Government National Mortgage Association, Pool #MA0088 | 3.50 | 5/20/42 | 83 | ||||||||||||
| 128 | Government National Mortgage Association, Pool #MA1157 | 3.50 | 7/20/43 | 120 | ||||||||||||
| 56 | Government National Mortgage Association, Pool #MA3310 | 3.50 | 12/20/45 | 52 | ||||||||||||
| 4 | Government National Mortgage Association, Pool #MA1266 | 3.50 | 9/20/28 | 4 | ||||||||||||
| 55 | Government National Mortgage Association, Pool #778157 | 3.50 | 3/15/42 | 52 | ||||||||||||
| 59 | Government National Mortgage Association, Pool #MA3803 | 3.50 | 7/20/46 | 56 | ||||||||||||
| 52 | Government National Mortgage Association, Pool #MA4511 | 4.00 | 6/20/47 | 50 | ||||||||||||
| 396 | Government National Mortgage Association, Pool #MA8200 | 4.00 | 8/20/52 | 374 | ||||||||||||
| 31 | Government National Mortgage Association, Pool #MA2602 | 4.00 | 2/20/45 | 30 | ||||||||||||
| 39 | Government National Mortgage Association, Pool #MA1678 | 4.00 | 2/20/44 | 38 | ||||||||||||
| 36 | Government National Mortgage Association, Pool #MA4263 | 4.00 | 2/20/47 | 35 | ||||||||||||
| 492 | Government National Mortgage Association, Pool #MA8267 | 4.00 | 9/20/52 | 465 | ||||||||||||
| 46 | Government National Mortgage Association, Pool #713876 | 4.00 | 8/15/39 | 44 | ||||||||||||
| 12 | Government National Mortgage Association, Pool #AV6086 | 4.00 | 7/15/47 | 11 | ||||||||||||
| 18 | Government National Mortgage Association, Pool #740068 | 4.00 | 9/15/40 | 17 | ||||||||||||
| 20 | Government National Mortgage Association, Pool #753254 | 4.00 | 9/15/43 | 19 | ||||||||||||
| 35 | Government National Mortgage Association, Pool #AM8203 | 4.00 | 5/15/45 | 33 | ||||||||||||
| 28 | Government National Mortgage Association, Pool #MA3737 | 4.00 | 6/20/46 | 27 | ||||||||||||
| 28 | Government National Mortgage Association, Pool #MA1996 | 4.00 | 6/20/44 | 27 | ||||||||||||
| 15 | Government National Mortgage Association, Pool #MA4322 | 4.00 | 3/20/47 | 15 | ||||||||||||
| 50 | Government National Mortgage Association, Pool #MA1376 | 4.00 | 10/20/43 | 49 | ||||||||||||
| 57 | Government National Mortgage Association, Pool #MA2304 | 4.00 | 10/20/44 | 55 | ||||||||||||
| 44 | Government National Mortgage Association, Pool #MA4197 | 4.00 | 1/20/47 | 42 | ||||||||||||
| 47 | Government National Mortgage Association, Pool #AB1483 | 4.00 | 8/15/42 | 44 | ||||||||||||
| 21 | Government National Mortgage Association, Pool #MA0155 | 4.00 | 6/20/42 | 20 | ||||||||||||
| 47 | Government National Mortgage Association, Pool #MA3598 | 4.00 | 4/20/46 | 46 | ||||||||||||
| 11 | Government National Mortgage Association, Pool #4922 | 4.00 | 1/20/41 | 11 | ||||||||||||
| 77 | Government National Mortgage Association, Pool #MA1839 | 4.00 | 4/20/44 | 75 | ||||||||||||
See accompanying notes to financial statements.
246
HC CAPITAL TRUST
The U.S. Mortgage/Asset Backed Fixed Income Securities Portfolio
Portfolio of Investments (continued) — June 30, 2023
Principal | Security Description | Rate % | Maturity | Value | ||||||||||||
U.S. Government Agency Mortgages (continued) | ||||||||||||||||
| $ | 66 | Government National Mortgage Association, Pool #MA2224 | 4.00 | 9/20/44 | $ | 64 | ||||||||||
| 9 | Government National Mortgage Association, Pool #MA6040 | 4.00 | 7/20/49 | 8 | ||||||||||||
| 43 | Government National Mortgage Association, Pool #MA5078 | 4.00 | 3/20/48 | 42 | ||||||||||||
| 42 | Government National Mortgage Association, Pool #MA5876 | 4.00 | 4/20/49 | 41 | ||||||||||||
| 17 | Government National Mortgage Association, Pool #MA5931 | 4.00 | 5/20/49 | 16 | ||||||||||||
| 75 | Government National Mortgage Association, Pool #MA2074 | 4.00 | 7/20/44 | 73 | ||||||||||||
| 25 | Government National Mortgage Association, Pool #MA2149 | 4.00 | 8/20/44 | 25 | ||||||||||||
| 14 | Government National Mortgage Association, Pool #MA5986 | 4.00 | 6/20/49 | 14 | ||||||||||||
| 14 | Government National Mortgage Association, Pool #MA6091 | 4.00 | 8/20/49 | 13 | ||||||||||||
| 16 | Government National Mortgage Association, Pool #MA3455 | 4.00 | 2/20/46 | 15 | ||||||||||||
| 93 | Government National Mortgage Association, Pool #MA4587 | 4.00 | 7/20/47 | 89 | ||||||||||||
| 63 | Government National Mortgage Association, Pool #MA1761 | 4.00 | 3/20/44 | 61 | ||||||||||||
| 49 | Government National Mortgage Association, Pool #MA4383 | 4.00 | 4/20/47 | 48 | ||||||||||||
| 47 | Government National Mortgage Association, Pool #MA2522 | 4.00 | 1/20/45 | 46 | ||||||||||||
| 19 | Government National Mortgage Association, Pool #AD5627 | 4.00 | 4/15/43 | 19 | ||||||||||||
| 14 | Government National Mortgage Association, Pool #MA6155 | 4.00 | 9/20/49 | 13 | ||||||||||||
| 13 | Government National Mortgage Association, Pool #MA3106 | 4.00 | 9/20/45 | 13 | ||||||||||||
| 12 | Government National Mortgage Association, Pool #MA5330 | 4.00 | 7/20/48 | 12 | ||||||||||||
| 82 | Government National Mortgage Association, Pool #MA4452 | 4.00 | 5/20/47 | 79 | ||||||||||||
| 48 | Government National Mortgage Association, Pool #MA0319 | 4.00 | 8/20/42 | 46 | ||||||||||||
| 43 | Government National Mortgage Association, Pool #MA3377 | 4.00 | 1/20/46 | 42 | ||||||||||||
| 42 | Government National Mortgage Association, Pool #MA5710 | 4.00 | 1/20/49 | 41 | ||||||||||||
| 57 | Government National Mortgage Association, Pool #MA4653 | 4.00 | 8/20/47 | 55 | ||||||||||||
| 78 | Government National Mortgage Association, Pool #MA5466 | 4.00 | 9/20/48 | 75 | ||||||||||||
| 23 | Government National Mortgage Association, Pool #MA3245 | 4.00 | 11/20/45 | 23 | ||||||||||||
| 56 | Government National Mortgage Association, Pool #MA5595 | 4.00 | 11/20/48 | 54 | ||||||||||||
| 9 | Government National Mortgage Association, Pool #779401 | 4.00 | 6/15/42 | 8 | ||||||||||||
| 51 | Government National Mortgage Association, Pool #MA1449 | 4.00 | 11/20/43 | 50 | ||||||||||||
| 8 | Government National Mortgage Association, Pool #MA3174 | 4.00 | 10/20/45 | 8 | ||||||||||||
| 160 | Government National Mortgage Association, Pool #5139 | 4.00 | 8/20/41 | 155 | ||||||||||||
| 9 | Government National Mortgage Association, Pool #766495 | 4.00 | 10/15/41 | 8 | ||||||||||||
| 27 | Government National Mortgage Association, Pool #MA1286 | 4.00 | 9/20/43 | 26 | ||||||||||||
| 18 | Government National Mortgage Association, Pool #738710 | 4.00 | 9/15/41 | 17 | ||||||||||||
| 96 | Government National Mortgage Association, Pool #717148 | 4.50 | 5/15/39 | 94 | ||||||||||||
| 23 | Government National Mortgage Association, Pool #MA5467 | 4.50 | 9/20/48 | 23 | ||||||||||||
| 19 | Government National Mortgage Association, Pool #MA1092 | 4.50 | 6/20/43 | 19 | ||||||||||||
| 12 | Government National Mortgage Association, Pool #MA4721 | 4.50 | 9/20/47 | 12 | ||||||||||||
| 10 | Government National Mortgage Association, Pool #MA5399 | 4.50 | 8/20/48 | 10 | ||||||||||||
| 224 | Government National Mortgage Association, Pool #4801 | 4.50 | 9/20/40 | 222 | ||||||||||||
| 59 | Government National Mortgage Association, Pool #5260 | 4.50 | 12/20/41 | 59 | ||||||||||||
| 167 | Government National Mortgage Association, Pool #721760 | 4.50 | 8/15/40 | 163 | ||||||||||||
| 14 | Government National Mortgage Association, Pool #MA4780 | 4.50 | 10/20/47 | 14 | ||||||||||||
| 6 | Government National Mortgage Association, Pool #MA5529 | 4.50 | 10/20/48 | 5 | ||||||||||||
| 383 | Government National Mortgage Association, Pool #MA8151 | 4.50 | 7/20/52 | 371 | ||||||||||||
| 42 | Government National Mortgage Association, Pool #MA4384 | 4.50 | 4/20/47 | 41 | ||||||||||||
| 12 | Government National Mortgage Association, Pool #MA5711 | 4.50 | 1/20/49 | 12 | ||||||||||||
| 9 | Government National Mortgage Association, Pool #MA4129 | 4.50 | 12/20/46 | 9 | ||||||||||||
| 33 | Government National Mortgage Association, Pool #MA5818 | 4.50 | 3/20/49 | 33 | ||||||||||||
See accompanying notes to financial statements.
247
HC CAPITAL TRUST
The U.S. Mortgage/Asset Backed Fixed Income Securities Portfolio
Portfolio of Investments (continued) — June 30, 2023
Principal | Security Description | Rate % | Maturity | Value | ||||||||||||
U.S. Government Agency Mortgages (continued) | ||||||||||||||||
| $ | 30 | Government National Mortgage Association, Pool #MA4512 | 4.50 | 6/20/47 | $ | 30 | ||||||||||
| 3 | Government National Mortgage Association, Pool #MA5764 | 4.50 | 2/20/49 | 3 | ||||||||||||
| 17 | Government National Mortgage Association, Pool #MA3805 | 4.50 | 7/20/46 | 17 | ||||||||||||
| 39 | Government National Mortgage Association, Pool #MA5652 | 4.50 | 12/20/48 | 38 | ||||||||||||
| 11 | Government National Mortgage Association, Pool #729511 | 4.50 | 4/15/40 | 11 | ||||||||||||
| 6 | Government National Mortgage Association, Pool #BB7097 | 4.50 | 8/15/47 | 6 | ||||||||||||
| 4 | Government National Mortgage Association, Pool #MA5877 | 4.50 | 4/20/49 | 4 | ||||||||||||
| 175 | Government National Mortgage Association, Pool #MA8877 | 4.50 | 5/20/53 | 169 | ||||||||||||
| 34 | Government National Mortgage Association, Pool #MA0701 | 4.50 | 1/20/43 | 33 | ||||||||||||
| 59 | Government National Mortgage Association, Pool #MA1762 | 4.50 | 3/20/44 | 58 | ||||||||||||
| 53 | Government National Mortgage Association, Pool #MA2756 | 4.50 | 4/20/45 | 52 | ||||||||||||
| 13 | Government National Mortgage Association, Pool #738793 | 4.50 | 9/15/41 | 13 | ||||||||||||
| 7 | Government National Mortgage Association, Pool #MA5987 | 4.50 | 6/20/49 | 7 | ||||||||||||
| 10 | Government National Mortgage Association, Pool #MA5596 | 4.50 | 11/20/48 | 10 | ||||||||||||
| 4 | Government National Mortgage Association, Pool #MA5988 | 5.00 | 6/20/49 | 4 | ||||||||||||
| 20 | Government National Mortgage Association, Pool #MA4007 | 5.00 | 10/20/46 | 20 | ||||||||||||
| 10 | Government National Mortgage Association, Pool #MA5933 | 5.00 | 5/20/49 | 10 | ||||||||||||
| 5 | Government National Mortgage Association, Pool #MA0465 | 5.00 | 10/20/42 | 5 | ||||||||||||
| 4 | Government National Mortgage Association, Pool #MA5653 | 5.00 | 12/20/48 | 4 | ||||||||||||
| 10 | Government National Mortgage Association, Pool #MA5400 | 5.00 | 8/20/48 | 10 | ||||||||||||
| 77 | Government National Mortgage Association, Pool #782523 | 5.00 | 11/15/35 | 76 | ||||||||||||
| 17 | Government National Mortgage Association, Pool #MA5597 | 5.00 | 11/20/48 | 17 | ||||||||||||
| 35 | Government National Mortgage Association, Pool #MA2076 | 5.00 | 7/20/44 | 36 | ||||||||||||
| 164 | Government National Mortgage Association, Pool #4559 | 5.00 | 10/20/39 | 167 | ||||||||||||
| 9 | Government National Mortgage Association, Pool #MA5765 | 5.00 | 2/20/49 | 9 | ||||||||||||
| 4 | Government National Mortgage Association, Pool #MA5712 | 5.00 | 1/20/49 | 4 | ||||||||||||
| 37 | Government National Mortgage Association, Pool #604285 | 5.00 | 5/15/33 | 37 | ||||||||||||
| 10 | Government National Mortgage Association, Pool #782468 | 5.00 | 11/15/38 | 9 | ||||||||||||
| 9 | Government National Mortgage Association, Pool #MA5819 | 5.00 | 3/20/49 | 9 | ||||||||||||
| 24 | Government National Mortgage Association, Pool #712690 | 5.00 | 4/15/39 | 23 | ||||||||||||
| 395 | Government National Mortgage Association, Pool #MA8647 | 5.00 | 2/20/53 | 388 | ||||||||||||
| 9 | Government National Mortgage Association, Pool #MA5080 | 5.00 | 3/20/48 | 9 | ||||||||||||
| 9 | Government National Mortgage Association, Pool #MA5530 | 5.00 | 10/20/48 | 9 | ||||||||||||
| 46 | Government National Mortgage Association, Pool #694531 | 5.00 | 11/15/38 | 46 | ||||||||||||
| 15 | Government National Mortgage Association, Pool #675179 | 5.00 | 3/15/38 | 16 | ||||||||||||
| 249 | Government National Mortgage Association, Pool #MA8801 | 5.50 | 4/20/53 | 248 | ||||||||||||
| 6 | Government National Mortgage Association, Pool #658181 | 5.50 | 11/15/36 | 6 | ||||||||||||
| 52 | Government National Mortgage Association, Pool #783284 | 5.50 | 6/20/40 | 54 | ||||||||||||
| 7 | Government National Mortgage Association, Pool #MA0466 | 5.50 | 10/20/42 | 8 | ||||||||||||
| 29 | Government National Mortgage Association, Pool #510835 | 5.50 | 2/15/35 | 30 | ||||||||||||
| 26 | Government National Mortgage Association, Pool #4222 | 6.00 | 8/20/38 | 27 | ||||||||||||
| 27 | Government National Mortgage Association, Pool #781959 | 6.00 | 7/15/35 | 27 | ||||||||||||
| 30 | Government National Mortgage Association, Pool #4245 | 6.00 | 9/20/38 | 30 | ||||||||||||
| 8 | Government National Mortgage Association, Pool #699237 | 6.50 | 9/15/38 | 8 | ||||||||||||
| 1,850 | Government National Mortgage Association, 30 YR TBA | 2.00 | 7/20/53 | 1,551 | ||||||||||||
| 150 | Government National Mortgage Association, 30 YR TBA | 2.50 | 7/20/53 | 130 | ||||||||||||
| 350 | Government National Mortgage Association, 30 YR TBA | 3.00 | 7/20/53 | 312 | ||||||||||||
| 175 | Government National Mortgage Association, 30 YR TBA | 3.50 | 7/20/53 | 161 | ||||||||||||
| 750 | Government National Mortgage Association, 30 YR TBA | 4.00 | 7/20/53 | 708 | ||||||||||||
See accompanying notes to financial statements.
248
HC CAPITAL TRUST
The U.S. Mortgage/Asset Backed Fixed Income Securities Portfolio
Portfolio of Investments (continued) — June 30, 2023
Principal | Security Description | Rate % | Maturity | Value | ||||||||||||
U.S. Government Agency Mortgages (continued) | ||||||||||||||||
| $ | 50 | Government National Mortgage Association, 30 YR TBA | 4.50 | 8/1/53 | $ | 48 | ||||||||||
| 1,200 | Government National Mortgage Association, 30 YR TBA | 4.50 | 7/20/53 | 1,157 | ||||||||||||
| 175 | Government National Mortgage Association, 30 YR TBA | 5.00 | 8/20/53 | 172 | ||||||||||||
| 1,000 | Government National Mortgage Association, 30 YR TBA | 5.00 | 7/20/53 | 981 | ||||||||||||
| 775 | Government National Mortgage Association, 30 YR TBA | 5.50 | 7/20/53 | 770 | ||||||||||||
| 200 | Government National Mortgage Association, 30 YR TBA | 5.50 | 8/20/53 | 199 | ||||||||||||
| 800 | Government National Mortgage Association, 30 YR TBA | 6.00 | 7/20/53 | 807 | ||||||||||||
| 150 | Government National Mortgage Association, 30 YR TBA | 6.00 | 8/20/53 | 151 | ||||||||||||
Total U.S. Government Agency Mortgages | 178,585 | |||||||||||||||
Corporate Bond — 0.10% | ||||||||||||||||
| 225 | PG&E Wildfire Recovery Funding LLC, Series A-5 (Electric Utilities) | 5.10 | 6/1/52 | 226 | ||||||||||||
Total Corporate Bond | 226 | |||||||||||||||
Shares | ||||||||||||||||
Investment Company — 18.35% | ||||||||||||||||
| 39,941,893 | State Street Institutional Treasury Plus Money Market Fund, Trust Class | 4.97(b) | 39,942 | |||||||||||||
Total Investment Company | 39,942 | |||||||||||||||
Total Investments Before TBA Sale Commitments (cost $256,488) — 107.04% | 233,017 | |||||||||||||||
TBA Sale Commitments (c) — (0.09)% | ||||||||||||||||
| (50 | ) | Fannie Mae, 15 YR TBA | 2.50 | 7/25/38 | (45 | ) | ||||||||||
| (175 | ) | Fannie Mae, 30 YR TBA | 2.00 | 7/25/53 | (143 | ) | ||||||||||
Total TBA Sale Commitments | (188 | ) | ||||||||||||||
Liabilities in excess of other assets — (6.95)% | (15,135 | ) | ||||||||||||||
Net Assets — 100.00% | $ | 217,694 | ||||||||||||||
Amounts designated as “—” are $0 or have been rounded to $0.
(a) | The rate for certain asset-backed and mortgage-backed securities may vary based on factors relating to the pool of assets underlying the security. The rate disclosed is the rate in effect on June 30, 2023. |
(b) | Annualized 7-day yield as of period-end. |
(c) | Represents a “to be announced” transaction. The Portfolio has committed to sell securities for which all specific information is not available at this time. (See Note 2 in the Notes to Financial Statements.) |
TBA—To Be Announced purchase or sale commitment. Security is subject to delayed delivery |
See accompanying notes to financial statements.
249
HC CAPITAL TRUST
The U.S. Mortgage/Asset Backed Fixed Income Securities Portfolio
Portfolio of Investments (concluded) — June 30, 2023
The following table reflects the percentage of total net assets of the Portfolio attributable to each Specialist Manager as of June 30, 2023.
The U.S. Mortgage/Asset Backed Fixed Income Securities Portfolio | Mellon | HC | Total |
Asset Backed Securities | 1.15% | — | 1.15% |
Collateralized Mortgage Obligations | 5.40% | — | 5.40% |
Corporate Bond | 0.10% | — | 0.10% |
U.S. Government Agency Mortgages | 82.04% | — | 82.04% |
Investment Company | 7.21% | 11.14% | 18.35% |
TBA Sale Commitments | -0.09% | — | -0.09% |
Other Assets (Liabilities) | -6.95% | — | -6.95% |
Total Net Assets | 88.86% | 11.14% | 100.00% |
Amounts designated as “—” indicate the Specialist Manager did not manage any holdings in that category.
See accompanying notes to financial statements.
250
HC CAPITAL TRUST
The Short-Term Municipal Bond Portfolio
Portfolio of Investments — June 30, 2023
Principal | Security Description | Rate % | Maturity | Value |
Municipal Bonds — 96.36% | ||||
Alabama — 9.29% | ||||
$ 1,130 | Auburn University Revenue, Series A, Callable 6/1/25 @ 100.00 | 5.00 | 6/1/28 | $ 1,178 |
2,315 | City of Huntsville AL, GO, Series A | 5.00 | 3/1/27 | 2,492 |
2,025 | County of Baldwin AL, GO, Callable 11/1/24 @ 100.00 | 5.00 | 5/1/25 | 2,077 |
710 | The University of Alabama Revenue, Series A | 5.00 | 7/1/23 | 710 |
6,457 | ||||
Arizona — 8.15% | ||||
1,645 | Maricopa County High School District No. 214 Tolleson Union High School, GO, Series B | 5.00 | 7/1/24 | 1,672 |
2,475 | Maricopa County Industrial Development Authority Revenue, Series D | 5.00(a) | 1/1/46 | 2,587 |
1,350 | Maricopa County Unified School District No. 41 Gilbert, GO, Series C | 5.00 | 7/1/25 | 1,400 |
5,659 | ||||
Arkansas — 3.34% | ||||
2,295 | Rogers School District No. 30, GO, Callable 8/1/24 @ 100.00 (State Aid Withholding) | 4.00 | 2/1/26 | 2,316 |
District of Columbia — 0.73% | ||||
500 | District of Columbia, GO, Series D | 5.00 | 6/1/24 | 507 |
Illinois — 4.47% | ||||
1,015 | Du Page Cook & Will Counties Community College District No. 502, GO | 5.00 | 6/1/30 | 1,150 |
1,900 | Metropolitan Water Reclamation District of Greater Chicago, GO, Series C | 5.00 | 12/1/24 | 1,949 |
3,099 | ||||
Indiana — 3.94% | ||||
2,660 | Indiana Finance Authority Revenue, Series A (Pre-Refunded/Escrowed to Maturity) | 5.00 | 3/1/39 | 2,737 |
Iowa — 5.33% | ||||
1,000 | City of Ankeny IA, GO, Series A | 5.00 | 6/1/25 | 1,036 |
2,105 | City of Dubuque IA, GO, Series A | 2.00 | 6/1/24 | 2,079 |
550 | Linn-Mar Community School District, GO, Callable 5/1/26 @ 100.00 (BAM) | 5.00 | 5/1/27 | 582 |
3,697 | ||||
Kansas — 6.08% | ||||
2,540 | Kansas Development Finance Authority Revenue, Series D | 5.00 | 4/1/25 | 2,620 |
1,465 | Riley County Unified School District No. 383 Manhattan-Ogden, GO, Series A (Pre-Refunded/Escrowed to Maturity) | 5.00 | 9/1/36 | 1,597 |
4,217 | ||||
Kentucky — 1.00% | ||||
685 | University of Kentucky Revenue, Series A, Callable 4/1/24 @ 100.00 (State Intercept) | 5.00 | 4/1/25 | 695 |
Maryland — 1.98% | ||||
1,175 | County of Baltimore MD, GO | 5.00 | 3/1/31 | 1,374 |
Massachusetts — 2.35% | ||||
1,545 | Massachusetts School Building Authority Revenue, Series A (Pre-Refunded/Escrowed to Maturity) | 5.00 | 2/15/49 | 1,630 |
Michigan — 1.48% | ||||
1,065 | Michigan State Housing Development Authority Revenue, Series A-1, Callable 8/7/23 @ 100.00 | 0.65 | 10/1/24 | 1,030 |
Missouri — 1.65% | ||||
1,100 | Lindbergh School District, GO | 4.00 | 3/1/27 | 1,142 |
See accompanying notes to financial statements.
251
HC CAPITAL TRUST
The Short-Term Municipal Bond Portfolio
Portfolio of Investments (continued) — June 30, 2023
Principal | Security Description | Rate % | Maturity | Value |
Municipal Bonds (continued) | ||||
Nebraska — 3.11% | ||||
$ 2,060 | Nebraska Public Power District Revenue, Series A | 5.00 | 1/1/26 | $ 2,156 |
New Jersey — 6.46% | ||||
1,250 | New Jersey Health Care Facilities Financing Authority Revenue, Series A, Callable 7/1/26 @ 100.00 | 5.00 | 7/1/30 | 1,322 |
3,000 | State of New Jersey, GO, Series A | 5.00 | 6/1/26 | 3,165 |
4,487 | ||||
New York — 1.45% | ||||
1,000 | New York City Transitional Finance Authority Future Tax Secured Revenue | 5.00 | 11/1/23 | 1,006 |
North Dakota — 1.98% | ||||
1,365 | City of Bismarck ND, GO, Series Q | 4.00 | 5/1/24 | 1,371 |
Oregon — 3.88% | ||||
1,320 | City of Salem OR, GO | 5.00 | 6/1/24 | 1,341 |
1,250 | Oregon State Lottery Revenue, Series A, Callable 4/1/27 @ 100.00 | 5.00 | 4/1/30 | 1,354 |
2,695 | ||||
South Dakota — 3.16% | ||||
1,905 | South Dakota Conservancy District Revenue, Series B | 5.00 | 8/1/30 | 2,193 |
Texas — 9.79% | ||||
1,550 | City of Garland TX Electric Utility System Revenue, Series A | 5.00 | 3/1/24 | 1,564 |
1,565 | City of Irving TX, GO | 5.00 | 9/15/24 | 1,601 |
1,015 | Conroe Independent School District, GO (PSF-GTD) | 5.00 | 2/15/25 | 1,043 |
360 | Dallas Area Rapid Transit Revenue, Series A | 5.00 | 12/1/24 | 370 |
1,150 | Round Rock Independent School District, GO (PSF-GTD) | 5.00 | 8/1/25 | 1,197 |
1,000 | Spring Branch Independent School District, GO (PSF-GTD) | 5.00 | 2/1/25 | 1,029 |
6,804 | ||||
Utah — 3.59% | ||||
2,340 | Alpine School District/UT, GO, Series A (SCH BD GTY) | 4.00 | 3/15/29 | 2,491 |
Virginia — 1.48% | ||||
900 | City of Fredericksburg VA, GO, Series A (State Aid Withholding) | 5.00 | 10/1/29 | 1,024 |
Washington — 4.61% | ||||
1,260 | County of King WA, GO, Series B | 5.00 | 7/1/25 | 1,309 |
1,085 | King County School District No. 405 Bellevue, GO (SCH BD GTY) | 5.00 | 12/1/24 | 1,113 |
750 | State of Washington, GO | 4.00 | 7/1/26 | 774 |
3,196 | ||||
West Virginia — 3.03% | ||||
2,130 | Jefferson County Board of Education/WV, GO | 2.00 | 6/1/24 | 2,104 |
Wisconsin — 4.03% | ||||
2,700 | State of Wisconsin, GO, Callable 5/1/25 @ 100.00 | 5.00 | 5/1/29 | 2,794 |
Total Municipal Bonds | 66,881 | |||
See accompanying notes to financial statements.
252
HC CAPITAL TRUST
The Short-Term Municipal Bond Portfolio
Portfolio of Investments (concluded) — June 30, 2023
Principal | Security Description | Rate % | Maturity | Value |
U.S. Treasury Obligation — 2.14% | ||||
$ 1,500 | U.S. Treasury Bill | 5.28(b) | 9/7/23 | $ 1,486 |
Total U.S. Treasury Obligation | 1,486 | |||
Investment Company — 0.32% | ||||
223,694 | State Street Institutional Treasury Plus Money Market Fund, Trust Class | 4.97(c) | 224 | |
Total Investment Company | 224 | |||
Total Investments (cost $69,736) — 98.82% | 68,591 | |||
Other assets in excess of liabilities — 1.18% | 817 | |||
Net Assets — 100.00% | $ 69,408 |
(a) | Interest rate is determined by the Remarketing Agent. The rate disclosed is the rate in effect on June 30, 2023. |
(b) | The rate disclosed represents effective yield at purchase. |
(c) | Annualized 7-day yield as of period-end. |
BAM—Build America Mutual |
GO—General Obligation |
PSF-GTD—Public School Fund Guaranteed |
SCH BD GTY—School Board Guaranty |
As of June 30, 2023, 100% of the Portfolio’s net assets were managed by Breckinridge Capital Advisors, Inc. |
See accompanying notes to financial statements.
253
HC CAPITAL TRUST
The Intermediate Term Municipal Bond Portfolio
Portfolio of Investments — June 30, 2023
Principal | Security Description | Rate % | Maturity | Value | ||||||||||||
Municipal Bonds — 95.92% | ||||||||||||||||
Alabama — 2.09% | ||||||||||||||||
| $ | 1,415 | Alabama Special Care Facilities Financing Authority-Birmingham AL Revenue Continuously Callable @100 | 5.00 | 6/1/29 | $ | 1,473 | ||||||||||
| 1,675 | Auburn University Revenue, Series A | 5.00 | 6/1/26 | 1,769 | ||||||||||||
| 2,895 | Black Belt Energy Gas District Revenue, Callable 9/1/31 @ 100.53 | 4.00(a) | 6/1/51 | 2,863 | ||||||||||||
| 1,500 | Black Belt Energy Gas District Revenue, Series B, Callable 9/1/30 @ 100.32 | 5.25 | 12/1/53 | 1,586 | ||||||||||||
| 260 | City of Pell City AL, GO, Series A Pre-refunded 2/1/25 @ 100 | 5.00 | 2/1/26 | 268 | ||||||||||||
| 1,000 | The Lower Alabama Gas District Revenue, Callable 9/1/25 @ 100.58 | 4.00(a) | 12/1/50 | 983 | ||||||||||||
| 1,000 | Troy University Revenue, Series A (BAM) | 5.00 | 11/1/26 | 1,054 | ||||||||||||
| 9,996 | ||||||||||||||||
Alaska — 0.33% | ||||||||||||||||
| 1,495 | State of Alaska, GO, Series A Continuously Callable @100 | 5.00 | 8/1/29 | 1,562 | ||||||||||||
Arizona — 2.54% | ||||||||||||||||
| 1,555 | City of Phoenix Civic Improvement Corp. Revenue, Series B, Callable 7/1/29 @ 100.00 (AMT) | 5.00 | 7/1/30 | 1,684 | ||||||||||||
| 1,685 | City of Phoenix Civic Improvement Corp. Revenue, Series A, Callable 7/1/30 @ 100.00 | 5.00 | 7/1/32 | 1,938 | ||||||||||||
| 1,000 | Maricopa County Union High School District No. 210-Phoenix, GO | 5.00 | 7/1/25 | 1,039 | ||||||||||||
| 1,215 | Northern Arizona University Revenue, Series B (BAM) | 5.00 | 6/1/26 | 1,281 | ||||||||||||
| 4,000 | Salt River Project Agricultural Improvement & Power District Revenue, Series A, Callable 6/1/25 @ 100.00 | 5.00 | 12/1/36 | 4,107 | ||||||||||||
| 1,000 | Salt Verde Financial Corp. Revenue | 5.25 | 12/1/24 | 1,014 | ||||||||||||
| 1,015 | State of Arizona Certificates of Participation, Series A | 5.00 | 10/1/25 | 1,059 | ||||||||||||
| 12,122 | ||||||||||||||||
California — 1.95% | ||||||||||||||||
| 2,460 | Golden State Tobacco Securitization Corp. Revenue, Series A-1 | 5.00 | 6/1/26 | 2,605 | ||||||||||||
| 1,250 | State of California, GO | 5.00 | 8/1/24 | 1,275 | ||||||||||||
| 1,750 | State of California, GO, Callable 4/1/29 @ 100.00 | 5.00 | 4/1/30 | 1,969 | ||||||||||||
| 2,000 | State of California, GO, Callable 9/1/32 @ 100.00 | 5.00 | 9/1/33 | 2,376 | ||||||||||||
| 1,000 | State of California, GO, Callable 10/1/28 @ 100.00 | 5.00 | 4/1/35 | 1,106 | ||||||||||||
| 9,331 | ||||||||||||||||
Colorado — 3.69% | ||||||||||||||||
| 1,225 | Board of Governors of Colorado State University System Revenue, Series E-2 (State Intercept) | 5.00 | 3/1/25 | 1,261 | ||||||||||||
| 3,600 | City & County of Denver CO Airport System Revenue, Series A (AMT) | 5.00 | 12/1/25 | 3,738 | ||||||||||||
| 1,750 | City & County of Denver CO Airport System Revenue, Series A | 5.00 | 11/15/23 | 1,760 | ||||||||||||
| 3,550 | Colorado Health Facilities Authority Revenue, Series A | 5.00 | 1/1/25 | 3,632 | ||||||||||||
| 2,970 | Denver City & County School District No. 1, GO, Series A (State Aid Withholding) | 5.50 | 12/1/25 | 3,146 | ||||||||||||
| 3,740 | State of Colorado Certificates of Participation, Series M, Callable 3/15/28 @ 100.00 | 5.00 | 3/15/29 | 4,074 | ||||||||||||
| 17,611 | ||||||||||||||||
Connecticut — 1.35% | ||||||||||||||||
| 1,085 | Connecticut State Health & Educational Facilities Authority Revenue, Series B | 5.00 | 12/1/26 | 1,146 | ||||||||||||
| 1,500 | State of Connecticut Special Tax Revenue, Series D, Callable 11/1/31 @ 100.00 | 5.00 | 11/1/34 | 1,723 | ||||||||||||
| 1,000 | State of Connecticut, GO, Series A | 4.00 | 1/15/29 | 1,062 | ||||||||||||
| 2,000 | State of Connecticut, GO, Series A, Callable 10/15/23 @ 100.00 | 5.00 | 10/15/25 | 2,012 | ||||||||||||
| 465 | State of Connecticut, GO, Series E Continuously Callable @100 | 5.00 | 9/15/32 | 516 | ||||||||||||
| 6,459 | ||||||||||||||||
District of Columbia — 2.11% | ||||||||||||||||
| 1,500 | District of Columbia Revenue | 5.00 | 4/1/25 | 1,545 | ||||||||||||
| 1,000 | District of Columbia, GO, Series D, Callable 12/1/26 @ 100.00 | 5.00 | 6/1/33 | 1,061 | ||||||||||||
See accompanying notes to financial statements.
254
HC CAPITAL TRUST
The Intermediate Term Municipal Bond Portfolio
Portfolio of Investments (continued) — June 30, 2023
Principal | Security Description | Rate % | Maturity | Value | ||||||||||||
Municipal Bonds (continued) | ||||||||||||||||
District of Columbia (continued) | ||||||||||||||||
| $ | 2,075 | Metropolitan Washington Airports Authority Aviation Revenue, Series A, Callable 10/1/30 @ 100.00 (AMT) | 4.00 | 10/1/36 | $ | 2,055 | ||||||||||
| 2,000 | Metropolitan Washington Airports Authority Aviation Revenue, Series A (AMT) | 5.00 | 10/1/29 | 2,156 | ||||||||||||
| 2,815 | Washington Metropolitan Area Transit Authority Dedicated Revenue, Series A | 5.00 | 7/15/31 | 3,263 | ||||||||||||
| 10,080 | ||||||||||||||||
Florida — 4.08% | ||||||||||||||||
| 2,000 | Alachua County Health Facilities Authority Revenue, Callable 6/1/26 @ 100.00 | 5.00(a) | 12/1/37 | 2,076 | ||||||||||||
| 1,500 | Central Florida Expressway Authority Revenue (AGM) | 5.00 | 7/1/30 | 1,728 | ||||||||||||
| 1,500 | County of Lee FL Solid Waste System Revenue (AMT) | 5.00 | 10/1/25 | 1,547 | ||||||||||||
| 955 | County of Polk FL Utility System Revenue | 5.00 | 10/1/27 | 1,036 | ||||||||||||
| 1,000 | Florida Municipal Power Agency Revenue, Series A | 5.00 | 10/1/25 | 1,042 | ||||||||||||
| 2,030 | JEA Electric System Revenue, Series 3A, Callable 4/1/30 @ 100.00 | 5.00 | 10/1/34 | 2,243 | ||||||||||||
| 3,250 | Orange County Convention Center/Orlando Revenue, Series B | 5.00 | 10/1/25 | 3,383 | ||||||||||||
| 3,295 | Orlando Utilities Commission Revenue, Series A, Callable 10/1/27 @ 100.00 | 5.00 | 10/1/32 | 3,588 | ||||||||||||
| 1,300 | State of Florida Department of Transportation Revenue Continuously Callable @100 | 5.00 | 7/1/31 | 1,442 | ||||||||||||
| 1,200 | State of Florida, GO, Series A | 5.00 | 7/1/30 | 1,389 | ||||||||||||
| 19,474 | ||||||||||||||||
Georgia — 2.45% | ||||||||||||||||
| 250 | Development Authority for Fulton County Revenue, Series A | 5.00 | 7/1/23 | 250 | ||||||||||||
| 1,600 | Development Authority for Fulton County Revenue, Series A | 5.00 | 7/1/24 | 1,615 | ||||||||||||
| 5,000 | Main Street Natural Gas, Inc. Revenue, Series C, Callable 6/1/26 @ 100.50 | 4.00(a) | 3/1/50 | 4,977 | ||||||||||||
| 1,000 | Savannah Economic Development Authority Revenue | 1.90 | 8/1/24 | 978 | ||||||||||||
| 1,415 | State of Georgia, GO, Series A | 5.00 | 7/1/28 | 1,572 | ||||||||||||
| 1,225 | State of Georgia, GO, Series C | 4.00 | 1/1/28 | 1,296 | ||||||||||||
| 1,000 | The Atlanta Development Authority Revenue, Series A-1 | 5.00 | 7/1/23 | 1,000 | ||||||||||||
| 11,688 | ||||||||||||||||
Illinois — 6.74% | ||||||||||||||||
| 400 | Chicago O’Hare International Airport Revenue, Callable 1/1/32 @ 100.00 (AMT) | 5.00 | 1/1/33 | 430 | ||||||||||||
| 455 | Chicago O’Hare International Airport Revenue (AMT) | 5.00 | 1/1/32 | 492 | ||||||||||||
| 730 | Chicago O’Hare International Airport Revenue, Series B Continuously Callable @100 | 5.00 | 1/1/28 | 746 | ||||||||||||
| 1,000 | Chicago Park District, GO, Series B, Callable 1/1/24 @ 100.00 | 5.00 | 1/1/26 | 1,009 | ||||||||||||
| 66 | City of Chicago IL Certificates of Participation, Series NT, Callable 8/7/23 @ 100.00 | 7.46 | 2/15/26 | 45 | ||||||||||||
| 1,000 | City of Chicago IL Waterworks Revenue, Series 2017-2 | 5.00 | 11/1/24 | 1,017 | ||||||||||||
| 1,000 | City of Chicago IL Waterworks Revenue, Callable 11/1/24 @ 100.00 | 5.00 | 11/1/25 | 1,015 | ||||||||||||
| 1,375 | Illinois Finance Authority Revenue, Series B-2, Callable 5/15/26 @ 100.00 | 5.00(a) | 5/15/50 | 1,441 | ||||||||||||
| 945 | Illinois Finance Authority Revenue | 5.00 | 1/1/27 | 1,009 | ||||||||||||
| 1,635 | Illinois State Toll Highway Authority Revenue, Series B | 5.00 | 1/1/25 | 1,679 | ||||||||||||
| 1,725 | Metropolitan Water Reclamation District of Greater Chicago, GO, Series B | 5.00 | 12/1/24 | 1,768 | ||||||||||||
| 3,035 | Metropolitan Water Reclamation District of Greater Chicago, GO, Series A, Callable 12/1/26 @ 100.00 | 5.00 | 12/1/27 | 3,245 | ||||||||||||
| 1,420 | Metropolitan Water Reclamation District of Greater Chicago, GO, Series D | 5.00 | 12/1/30 | 1,636 | ||||||||||||
| 2,000 | Regional Transportation Authority Revenue (AGM) | 6.00 | 6/1/25 | 2,055 | ||||||||||||
| 3,000 | Sales Tax Securitization Corp. Revenue, Series A | 5.00 | 1/1/29 | 3,213 | ||||||||||||
| 4,600 | State of Illinois Sales Tax Revenue, Series A (BAM) | 5.00 | 6/15/25 | 4,697 | ||||||||||||
| 1,000 | State of Illinois, GO, Series D | 5.00 | 6/1/32 | 1,076 | ||||||||||||
| 2,995 | University of Illinois Certificates of Participation, Series B, Callable 10/1/26 @ 100.00 | 5.00 | 10/1/27 | 3,139 | ||||||||||||
See accompanying notes to financial statements.
255
HC CAPITAL TRUST
The Intermediate Term Municipal Bond Portfolio
Portfolio of Investments (continued) — June 30, 2023
Principal | Security Description | Rate % | Maturity | Value | ||||||||||||
Municipal Bonds (continued) | ||||||||||||||||
Illinois (continued) | ||||||||||||||||
| $ | 2,400 | University of Illinois Revenue, Series A | 5.00 | 4/1/25 | $ | 2,481 | ||||||||||
| 32,193 | ||||||||||||||||
Indiana — 1.86% | ||||||||||||||||
| 2,500 | City of Whiting IN Revenue (AMT) | 5.00(a) | 12/1/44 | 2,534 | ||||||||||||
| 1,350 | Indiana Finance Authority Revenue, Series A, Callable 10/1/32 @ 100.00 | 5.00 | 10/1/34 | 1,569 | ||||||||||||
| 2,250 | Indiana Finance Authority Revenue, Series B, Callable 1/1/25 @ 100.00 | 2.25(a) | 12/1/58 | 2,247 | ||||||||||||
| 1,000 | Indiana Finance Authority Revenue, Series A | 5.00 | 11/1/24 | 1,016 | ||||||||||||
| 1,500 | Indiana Finance Authority Revenue, Series A | 3.13 | 12/1/24 | 1,494 | ||||||||||||
| 8,860 | ||||||||||||||||
Iowa — 0.42% | ||||||||||||||||
| 450 | Iowa Tobacco Settlement Authority Revenue, Series A-2, Class - 1, Callable 6/1/31 @ 100.00 | 5.00 | 6/1/32 | 498 | ||||||||||||
| 1,280 | Waukee Community School District, GO, Series A Continuously Callable @100 | 5.00 | 6/1/32 | 1,486 | ||||||||||||
| 1,984 | ||||||||||||||||
Kentucky — 1.84% | ||||||||||||||||
| 3,500 | Kentucky Public Energy Authority Revenue, Series B, Callable 10/1/24 @ 100.24 | 4.00(a) | 1/1/49 | 3,500 | ||||||||||||
| 1,000 | Kentucky Public Energy Authority Revenue, Series A, Callable 1/2/24 @ 100.40 | 4.00 | 4/1/24 | 1,004 | ||||||||||||
| 3,560 | Kentucky Public Energy Authority Revenue, Series A-1, Callable 5/1/30 @ 100.38 | 4.00(a) | 8/1/52 | 3,488 | ||||||||||||
| 720 | Louisville and Jefferson County Metropolitan Sewer District Revenue, Series A | 5.00 | 5/15/29 | 803 | ||||||||||||
| 8,795 | ||||||||||||||||
Louisiana — 1.03% | ||||||||||||||||
| 1,415 | Jefferson Sales Tax District Revenue, Series A (AGM) | 5.00 | 12/1/25 | 1,470 | ||||||||||||
| 2,500 | Louisiana Offshore Terminal Authority Revenue | 1.65(a) | 9/1/33 | 2,474 | ||||||||||||
| 1,000 | Parish of St. John the Baptist LA Revenue | 2.10(a) | 6/1/37 | 979 | ||||||||||||
| 4,923 | ||||||||||||||||
Maine — 0.22% | ||||||||||||||||
| 1,025 | Finance Authority of Maine Revenue, Series A-1 (AGM) | 5.00 | 12/1/26 | 1,066 | ||||||||||||
Maryland — 2.90% | ||||||||||||||||
| 2,000 | County of Baltimore MD, GO, Callable 3/1/29 @ 100.00 | 4.00 | 3/1/33 | 2,111 | ||||||||||||
| 860 | County of Frederick MD, GO Continuously Callable @100 | 5.00 | 4/1/37 | 1,006 | ||||||||||||
| 1,190 | County of Howard MD, GO, Series A Continuously Callable @100 | 5.00 | 8/15/34 | 1,416 | ||||||||||||
| 2,905 | County of Montgomery MD, GO, Series A, Callable 8/1/30 @ 100.00 | 4.00 | 8/1/31 | 3,148 | ||||||||||||
| 2,090 | Maryland State Transportation Authority Passenger Facility Charge Revenue (AMT) | 5.00 | 6/1/28 | 2,261 | ||||||||||||
| 2,500 | State of Maryland Department of Transportation Revenue, Callable 10/1/30 @ 100.00 | 5.00 | 10/1/32 | 2,883 | ||||||||||||
| 1,000 | State of Maryland Department of Transportation Revenue, Callable 10/1/27 @ 100.00 | 4.00 | 10/1/32 | 1,042 | ||||||||||||
| 13,867 | ||||||||||||||||
Massachusetts — 1.81% | ||||||||||||||||
| 3,000 | Commonwealth of Massachusetts, GO, Series A (AMBAC) | 5.50 | 8/1/30 | 3,497 | ||||||||||||
| 780 | Commonwealth of Massachusetts, GO Continuously Callable @100 | 5.00 | 5/1/35 | 916 | ||||||||||||
| 1,000 | Massachusetts Educational Financing Authority Revenue (AMT) | 5.00 | 1/1/25 | 1,015 | ||||||||||||
| 1,400 | Massachusetts Educational Financing Authority Revenue, Series B (AMT) | 5.00 | 7/1/29 | 1,482 | ||||||||||||
| 1,500 | Massachusetts Port Authority Revenue, Series A (AMT) | 5.00 | 7/1/32 | 1,709 | ||||||||||||
| 8,619 | ||||||||||||||||
Michigan — 3.79% | ||||||||||||||||
| 1,810 | Great Lakes Water Authority Sewage Disposal System Revenue, Series B | 5.00 | 7/1/24 | 1,841 | ||||||||||||
See accompanying notes to financial statements.
256
HC CAPITAL TRUST
The Intermediate Term Municipal Bond Portfolio
Portfolio of Investments (continued) — June 30, 2023
Principal | Security Description | Rate % | Maturity | Value | ||||||||||||
Municipal Bonds (continued) | ||||||||||||||||
Michigan (continued) | ||||||||||||||||
| $ | 1,100 | Michigan Finance Authority Revenue | 5.00 | 10/1/29 | $ | 1,242 | ||||||||||
| 1,280 | Michigan Finance Authority Revenue, Series B | 5.00 | 10/1/30 | 1,474 | ||||||||||||
| 1,000 | Michigan Finance Authority Revenue, Callable 6/1/25 @ 100.00 | 5.50 | 12/1/29 | 1,042 | ||||||||||||
| 6,000 | Michigan Finance Authority Revenue, Callable 5/16/26 @ 100.00 | 5.00(a) | 11/15/44 | 6,234 | ||||||||||||
| 1,450 | Michigan State Building Authority Revenue | 5.00 | 4/15/25 | 1,498 | ||||||||||||
| 1,605 | Michigan Strategic Fund Revenue, Series P3 (AMT) | 5.00 | 6/30/25 | 1,629 | ||||||||||||
| 2,960 | Utica Community Schools/MI, GO (Q-SBLF) | 5.00 | 5/1/26 | 3,119 | ||||||||||||
| 18,079 | ||||||||||||||||
Minnesota — 1.49% | ||||||||||||||||
| 1,000 | Minneapolis-St Paul Metropolitan Airports Commission Revenue, Series C | 5.00 | 1/1/26 | 1,046 | ||||||||||||
| 1,985 | Minnesota Housing Finance Agency Revenue, Series B | 5.00 | 8/1/28 | 2,175 | ||||||||||||
| 1,240 | Minnesota Housing Finance Agency Revenue, Series B | 5.00 | 8/1/29 | 1,383 | ||||||||||||
| 2,195 | Minnesota Housing Finance Agency Revenue, Series B | 5.00 | 8/1/30 | 2,488 | ||||||||||||
| 7,092 | ||||||||||||||||
Missouri — 1.33% | ||||||||||||||||
| 2,400 | Health & Educational Facilities Authority of the State of Missouri Revenue, Series A | 5.00 | 6/1/25 | 2,469 | ||||||||||||
| 1,000 | Health & Educational Facilities Authority of the State of Missouri Revenue | 5.00 | 11/15/23 | 1,006 | ||||||||||||
| 2,505 | The Curators of the University of Missouri Revenue, Series B | 5.00 | 11/1/30 | 2,890 | ||||||||||||
| 6,365 | ||||||||||||||||
Nebraska — 0.78% | ||||||||||||||||
| 1,000 | City of Omaha NE Sewer Revenue, Series A, Callable 4/1/30 @ 100.00 | 4.00 | 4/1/31 | 1,069 | ||||||||||||
| 1,000 | City of Omaha NE Sewer Revenue, Series A, Callable 4/1/30 @ 100.00 | 4.00 | 4/1/32 | 1,066 | ||||||||||||
| 1,350 | Omaha Public Power District Revenue, Series B, Callable 2/1/32 @ 100.00 | 5.00 | 2/1/34 | 1,584 | ||||||||||||
| 3,719 | ||||||||||||||||
Nevada — 2.52% | ||||||||||||||||
| 2,915 | Clark County School District, GO, Series A, Callable 6/15/30 @ 100.00 (AGM) | 5.00 | 6/15/32 | 3,305 | ||||||||||||
| 1,000 | Clark County School District, GO, Series A | 5.00 | 6/15/26 | 1,052 | ||||||||||||
| 5,435 | Las Vegas Valley Water District, GO, Series C, Callable 6/1/32 @ 100.00 | 4.00 | 6/1/34 | 5,841 | ||||||||||||
| 800 | Nevada System of Higher Education Certificates of Participation, Series A Continuously Callable @100 | 5.00 | 7/1/26 | 816 | ||||||||||||
| 1,000 | State of Nevada Highway Improvement Revenue | 5.00 | 12/1/24 | 1,029 | ||||||||||||
| 12,043 | ||||||||||||||||
New Jersey — 2.83% | ||||||||||||||||
| 1,000 | New Jersey Economic Development Authority Revenue, Series RRR | 5.00 | 3/1/28 | 1,076 | ||||||||||||
| 1,210 | New Jersey Economic Development Authority Revenue | 5.00 | 6/15/28 | 1,300 | ||||||||||||
| 430 | New Jersey Economic Development Authority Revenue, Callable 11/1/29 @ 100.00 | 5.00 | 11/1/30 | 474 | ||||||||||||
| 1,000 | New Jersey Educational Facilities Authority Revenue, Series C | 5.00 | 3/1/31 | 1,174 | ||||||||||||
| 1,725 | New Jersey Higher Education Student Assistance Authority Revenue, Series B (AMT) | 5.00 | 12/1/29 | 1,874 | ||||||||||||
| 750 | New Jersey Transportation Trust Fund Authority Revenue, Series AA, Callable 6/15/33 @ 100.00 | 5.00 | 6/15/36 | 825 | ||||||||||||
| 4,295 | New Jersey Turnpike Authority Revenue, Series A, Callable 1/1/26 @ 100.00 | 5.00 | 1/1/31 | 4,487 | ||||||||||||
| 1,100 | State of New Jersey, GO, Series A | 4.00 | 6/1/31 | 1,175 | ||||||||||||
| 1,035 | Tobacco Settlement Financing Corp. Revenue, Series A, Callable 6/1/28 @ 100.00 | 5.00 | 6/1/33 | 1,117 | ||||||||||||
| 13,502 | ||||||||||||||||
New Mexico — 0.80% | ||||||||||||||||
| 1,025 | Albuquerque Municipal School District No. 12, GO Continuously Callable @100 (State Aid Withholding) | 5.00 | 8/1/29 | 1,126 | ||||||||||||
See accompanying notes to financial statements.
257
HC CAPITAL TRUST
The Intermediate Term Municipal Bond Portfolio
Portfolio of Investments (continued) — June 30, 2023
Principal | Security Description | Rate % | Maturity | Value | ||||||||||||
Municipal Bonds (continued) | ||||||||||||||||
New Mexico (continued) | ||||||||||||||||
| $ | 2,590 | New Mexico Educational Assistance Foundation Revenue, Series 1-A (AMT) | 5.00 | 9/1/25 | $ | 2,673 | ||||||||||
| 3,799 | ||||||||||||||||
New York — 7.43% | ||||||||||||||||
| 2,890 | City of New York NY, GO, Series 1-A, Callable 10/1/30 @ 100.00 | 5.00 | 4/1/32 | 3,330 | ||||||||||||
| 5,000 | City of New York NY, GO, Series C | 5.00 | 8/1/28 | 5,489 | ||||||||||||
| 570 | City of New York NY, GO, Series 1 | 5.00 | 4/1/31 | 665 | ||||||||||||
| 1,700 | Metropolitan Transportation Authority Revenue, Series B, Callable 11/15/26 @ 100.00 | 5.00 | 11/15/29 | 1,790 | ||||||||||||
| 3,000 | New York City Municipal Water Finance Authority Revenue, Series DD, Callable 6/15/33 @ 100.00 | 5.00 | 6/15/34 | 3,604 | ||||||||||||
| 2,410 | New York City Municipal Water Finance Authority Revenue, Series BB-2, Callable 12/15/25 @ 100.00 | 5.00 | 6/15/27 | 2,538 | ||||||||||||
| 900 | New York City Municipal Water Finance Authority Revenue, Series EE | 5.00 | 6/15/29 | 1,012 | ||||||||||||
| 1,000 | New York City Transitional Finance Authority Future Tax Secured Revenue, Series B-1, Callable 8/1/24 @ 100.00 | 5.00 | 8/1/29 | 1,019 | ||||||||||||
| 855 | New York City Transitional Finance Authority Future Tax Secured Revenue, Series E-1 | 5.00 | 11/1/28 | 949 | ||||||||||||
| 1,000 | New York State Dormitory Authority Revenue, Series A, Callable 2/15/27 @ 100.00 | 5.00 | 2/15/31 | 1,072 | ||||||||||||
| 1,500 | New York State Dormitory Authority Revenue, Series D | 5.00 | 2/15/25 | 1,541 | ||||||||||||
| 4,710 | New York State Thruway Authority Revenue, Series A, Callable 9/15/32 @ 100.00 | 5.00 | 3/15/35 | 5,472 | ||||||||||||
| 1,795 | New York Transportation Development Corp. Revenue (AMT) | 5.00 | 12/1/27 | 1,919 | ||||||||||||
| 4,970 | Port Authority of New York & New Jersey Revenue, Series 207, Callable 3/15/28 @ 100.00 (AMT) | 4.00 | 3/15/30 | 5,073 | ||||||||||||
| 35,473 | ||||||||||||||||
North Carolina — 0.89% | ||||||||||||||||
| 1,000 | City of Charlotte NC Airport Revenue, Series C | 5.00 | 7/1/24 | 1,018 | ||||||||||||
| 1,000 | County of Wake NC Revenue | 5.00 | 9/1/28 | 1,116 | ||||||||||||
| 1,000 | North Carolina Turnpike Authority Revenue (AGM) | 5.00 | 1/1/24 | 1,007 | ||||||||||||
| 1,000 | The Charlotte-Mecklenburg Hospital Authority Revenue | 5.00(a) | �� | 1/15/50 | 1,095 | |||||||||||
| 4,236 | ||||||||||||||||
Ohio — 3.71% | ||||||||||||||||
| 2,200 | American Municipal Power, Inc. Revenue, Series A Continuously Callable @100, Callable 2/15/24 @ 100.00 | 5.00 | 2/15/27 | 2,219 | ||||||||||||
| 3,000 | Buckeye Tobacco Settlement Financing Authority Revenue, Series A-2, Class - 1, Callable 6/1/30 @ 100.00 | 5.00 | 6/1/32 | 3,230 | ||||||||||||
| 1,450 | City of Columbus OH Sewerage Revenue, Callable 6/1/26 @ 100.00 | 5.00 | 6/1/29 | 1,539 | ||||||||||||
| 820 | City of Columbus OH, GO, Series A Continuously Callable @100 | 5.00 | 8/15/34 | 988 | ||||||||||||
| 1,000 | County of Butler OH Revenue, Series X | 5.00 | 5/15/29 | 1,124 | ||||||||||||
| 360 | County of Mahoning OH Revenue, Callable 8/7/23 @ 100.00 (NATL) | 5.50 | 10/15/25 | 367 | ||||||||||||
| 800 | County of Montgomery OH Revenue, Callable 8/1/31 @ 100.00 | 5.00 | 8/1/33 | 899 | ||||||||||||
| 2,000 | State of Ohio Revenue | 2.75(a) | 1/1/52 | 1,954 | ||||||||||||
| 500 | State of Ohio Revenue, Series A Continuously Callable @100 | 5.00 | 1/1/30 | 542 | ||||||||||||
| 1,200 | State of Ohio, GO, Series V | 5.00 | 5/1/28 | 1,329 | ||||||||||||
| 1,850 | University of Cincinnati Revenue, Series A | 5.00 | 6/1/27 | 1,993 | ||||||||||||
| 775 | University of Cincinnati Revenue, Series A | 5.00 | 6/1/26 | 818 | ||||||||||||
| 700 | University of Cincinnati Revenue, Series A | 5.00 | 6/1/25 | 724 | ||||||||||||
| 17,726 | ||||||||||||||||
See accompanying notes to financial statements.
258
HC CAPITAL TRUST
The Intermediate Term Municipal Bond Portfolio
Portfolio of Investments (continued) — June 30, 2023
Principal | Security Description | Rate % | Maturity | Value | ||||||||||||
Municipal Bonds (continued) | ||||||||||||||||
Oklahoma — 0.93% | ||||||||||||||||
| $ | 530 | Oklahoma Municipal Power Authority Revenue, Series A, Callable 1/1/31 @ 100.00 (AGM) | 4.00 | 1/1/32 | $ | 571 | ||||||||||
| 2,000 | Oklahoma Turnpike Authority Revenue, Series A | 5.00 | 1/1/30 | 2,269 | ||||||||||||
| 1,345 | Oklahoma Water Resources Board Revenue | 5.00 | 4/1/32 | 1,602 | ||||||||||||
| 4,442 | ||||||||||||||||
Oregon — 1.94% | ||||||||||||||||
| 1,305 | Benton & Linn Counties Consolidated School District No. 509J & 509A Corvallis, GO, Series A (SCH BD GTY) | 5.00(a) | 6/15/25 | 1,354 | ||||||||||||
| 2,500 | Multnomah County School District No. 1 Portland/OR, GO (SCH BD GTY) | 5.00 | 6/15/29 | 2,813 | ||||||||||||
| 2,500 | Port of Portland OR Airport Revenue, Series 29, Callable 7/1/33 @ 100.00 (AMT) | 5.00 | 7/1/35 | 2,759 | ||||||||||||
| 2,000 | Portland Community College District, GO, Callable 6/15/33 @ 100.00 | 5.00 | 6/15/35 | 2,355 | ||||||||||||
| 9,281 | ||||||||||||||||
Pennsylvania — 5.38% | ||||||||||||||||
| 1,000 | City of Philadelphia PA Water & Wastewater Revenue, Series B | 5.00 | 11/1/27 | 1,085 | ||||||||||||
| 2,600 | City of Philadelphia PA, GO, Series B, Callable 8/1/29 @ 100.00 | 5.00 | 2/1/30 | 2,892 | ||||||||||||
| 1,735 | City of Philadelphia PA, GO, Series B, Callable 8/1/29 @ 100.00 | 5.00 | 2/1/31 | 1,930 | ||||||||||||
| 1,000 | Commonwealth Financing Authority Revenue, Callable 6/1/28 @ 100.00 | 5.00 | 6/1/32 | 1,076 | ||||||||||||
| 850 | Easton Area School District, GO, Series A (State Aid Withholding) | 4.00 | 4/1/25 | 864 | ||||||||||||
| 1,860 | Luzerne County Industrial Development Authority Revenue, Callable 12/3/29 @ 100.00 (AMT) | 2.45(a) | 12/1/39 | 1,694 | ||||||||||||
| 3,625 | Pennsylvania Economic Development Financing Authority Revenue, Callable 12/31/32 @ 100.00 (AMT) | 5.00 | 12/31/33 | 4,015 | ||||||||||||
| 2,500 | Pennsylvania Economic Development Financing Authority Revenue (AMT) | 0.00(a)(b) | 7/1/41 | 2,457 | ||||||||||||
| 1,000 | Pennsylvania Higher Education Assistance Agency Revenue, Series A (AMT) | 5.00 | 6/1/29 | 1,079 | ||||||||||||
| 4,075 | Pennsylvania Higher Education Assistance Agency Revenue, Series A (AMT) | 5.00 | 6/1/30 | 4,422 | ||||||||||||
| 625 | Pennsylvania Turnpike Commission Revenue | 5.00 | 12/1/28 | 680 | ||||||||||||
| 3,225 | The School District of Philadelphia, GO, Series A (State Aid Withholding) | 5.00 | 9/1/28 | 3,479 | ||||||||||||
| 25,673 | ||||||||||||||||
Rhode Island — 0.57% | ||||||||||||||||
| 1,875 | Rhode Island Student Loan Authority Revenue, Series A (AMT) | 5.00 | 12/1/29 | 2,045 | ||||||||||||
| 625 | Rhode Island Student Loan Authority Revenue, Series A (AMT) | 5.00 | 12/1/29 | 691 | ||||||||||||
| 2,736 | ||||||||||||||||
South Carolina — 1.44% | ||||||||||||||||
| 3,680 | County of Charleston SC, GO, Series A (State Aid Withholding) | 5.00 | 11/1/26 | 3,929 | ||||||||||||
| 1,000 | Piedmont Municipal Power Agency Revenue, Series B | 5.00 | 1/1/29 | 1,103 | ||||||||||||
| 1,000 | South Carolina Public Service Authority Revenue, Series A | 5.00 | 12/1/31 | 1,111 | ||||||||||||
| 680 | South Carolina Public Service Authority Revenue, Series A | 5.00 | 12/1/27 | 726 | ||||||||||||
| 6,869 | ||||||||||||||||
South Dakota — 0.38% | ||||||||||||||||
| 1,675 | South Dakota Board of Regents Housing & Auxiliary Facilities System Revenue Continuously Callable @100 | 5.00 | 4/1/29 | 1,807 | ||||||||||||
Tennessee — 0.90% | ||||||||||||||||
| 1,215 | County of Hamblen TN, GO | 5.00 | 5/1/29 | 1,363 | ||||||||||||
| 1,350 | Metropolitan Government of Nashville & Davidson County TN, GO, Callable 7/1/28 @ 100.00 | 4.00 | 7/1/33 | 1,419 | ||||||||||||
| 1,500 | Tennessee Energy Acquisition Corp. Revenue, Callable 8/1/25 @ 100.22 | 4.00(a) | 11/1/49 | 1,491 | ||||||||||||
| 4,273 | ||||||||||||||||
See accompanying notes to financial statements.
259
HC CAPITAL TRUST
The Intermediate Term Municipal Bond Portfolio
Portfolio of Investments (continued) — June 30, 2023
Principal | Security Description | Rate % | Maturity | Value | ||||||||||||
Municipal Bonds (continued) | ||||||||||||||||
Texas — 13.15% | ||||||||||||||||
| $ | 2,000 | Aldine Independent School District, GO (PSF-GTD) | 5.00 | 2/15/25 | $ | 2,058 | ||||||||||
| 1,230 | Arlington Higher Education Finance Corp. Revenue (PSF-GTD) | 5.00 | 8/15/28 | 1,347 | ||||||||||||
| 1,025 | Arlington Higher Education Finance Corp. Revenue (PSF-GTD) | 5.00 | 8/15/27 | 1,105 | ||||||||||||
| 2,450 | City of Dallas TX, GO, Callable 2/15/25 @ 100.00 | 5.00 | 2/15/27 | 2,512 | ||||||||||||
| 2,500 | City of Houston TX Airport System Revenue, Series C (AMT) | 5.00 | 7/1/25 | 2,543 | ||||||||||||
| 1,550 | City of Missouri City TX, GO Continuously Callable @100 | 5.00 | 6/15/30 | 1,678 | ||||||||||||
| 300 | City of Pearland TX, GO Continuously Callable @100 | 5.00 | 3/1/29 | 324 | ||||||||||||
| 1,750 | City of San Antonio TX Airport System Revenue, Series A (AMT) | 5.00 | 7/1/25 | 1,803 | ||||||||||||
| 1,000 | City of San Antonio TX Airport System Revenue, Series A (AMT) | 5.00 | 7/1/26 | 1,047 | ||||||||||||
| 1,300 | City of San Antonio TX Electric & Gas Systems Revenue, Series B | 4.00 | 2/1/33 | 1,400 | ||||||||||||
| 950 | Clifton Higher Education Finance Corp. Revenue, Series T, Callable 8/15/32 @ 100.00 (PSF-GTD) | 4.00 | 8/15/34 | 992 | ||||||||||||
| 1,205 | Clifton Higher Education Finance Corp. Revenue (PSF-GTD) | 5.00 | 8/15/24 | 1,227 | ||||||||||||
| 2,200 | Clifton Higher Education Finance Corp. Revenue (PSF-GTD) | 5.00 | 8/15/25 | 2,280 | ||||||||||||
| 1,250 | Conroe Independent School District, GO Continuously Callable @100 (PSF-GTD) | 5.00 | 2/15/30 | 1,293 | ||||||||||||
| 1,545 | County of Harris TX Revenue, Series A Continuously Callable @100 | 5.00 | 8/15/30 | 1,664 | ||||||||||||
| 1,750 | County of Harris TX Revenue, Callable 8/15/25 @ 100.00 | 5.00 | 8/15/34 | 1,816 | ||||||||||||
| 4,730 | Dallas Area Rapid Transit Revenue, Callable 12/1/29 @ 100.00 | 5.00 | 12/1/33 | 5,290 | ||||||||||||
| 2,500 | Dallas Independent School District, GO, Series A, Callable 2/15/25 @ 100.00 (PSF-GTD) | 5.00 | 2/15/27 | 2,571 | ||||||||||||
| 2,100 | Harris County Cultural Education Facilities Finance Corp. Revenue | 5.00 | 11/15/27 | 2,269 | ||||||||||||
| 1,650 | Harris County Cultural Education Facilities Finance Corp. Revenue | 5.00 | 11/15/25 | 1,713 | ||||||||||||
| 1,500 | Harris County Cultural Education Facilities Finance Corp. Revenue Continuously Callable @100 | 5.00 | 10/1/27 | 1,563 | ||||||||||||
| 1,220 | Love Field Airport Modernization Corp. Revenue, Callable 8/7/23 @ 100.00 | 5.00 | 11/1/28 | 1,212 | ||||||||||||
| 2,300 | Love Field Airport Modernization Corp. Revenue (AMT) | 5.00 | 11/1/25 | 2,345 | ||||||||||||
| 1,090 | Lower Colorado River Authority Revenue (AGM) | 5.00 | 5/15/29 | 1,213 | ||||||||||||
| 1,000 | Lower Colorado River Authority Revenue, Callable 5/15/33 @ 100.00 (AGM) | 5.00 | 5/15/34 | 1,168 | ||||||||||||
| 2,180 | Lower Colorado River Authority Revenue, Callable 5/15/30 @ 100.00 | 5.00 | 5/15/32 | 2,450 | ||||||||||||
| 1,000 | Lower Colorado River Authority Revenue | 5.00 | 5/15/26 | 1,052 | ||||||||||||
| 3,475 | McKinney Independent School District, GO, Series A, Callable 2/15/25 @ 100.00 (PSF-GTD) | 5.00 | 2/15/31 | 3,579 | ||||||||||||
| 250 | North Texas Tollway Authority Revenue, Series A Continuously Callable @100 | 5.00 | 1/1/25 | 252 | ||||||||||||
| 1,000 | North Texas Tollway Authority Revenue, Series A | 5.00 | 1/1/24 | 1,007 | ||||||||||||
| 1,335 | Spring Independent School District, GO | 5.00 | 8/15/30 | 1,531 | ||||||||||||
| 2,000 | Tarrant County Cultural Education Facilities Finance Corp. Revenue, Series A, Callable 1/1/32 @ 100.00 | 5.00(a) | 7/1/53 | 2,231 | ||||||||||||
| 2,230 | University of Houston Revenue, Series C, Callable 2/15/26 @ 100.00 | 5.00 | 2/15/28 | 2,357 | ||||||||||||
| 1,200 | Waller Consolidated Independent School District, GO (BAM) | 5.00 | 2/15/33 | 1,405 | ||||||||||||
| 1,300 | West Harris County Regional Water Authority Revenue | 5.00 | 12/15/27 | 1,404 | ||||||||||||
| 1,000 | West Travis County Public Utility Agency Revenue (BAM) | 5.00 | 8/15/26 | 1,055 | ||||||||||||
| 62,756 | ||||||||||||||||
Utah — 0.24% | ||||||||||||||||
| 1,090 | Utah Transit Authority Revenue | 5.00 | 12/15/26 | 1,165 | ||||||||||||
Virginia — 1.70% | ||||||||||||||||
| 1,215 | City of Chesapeake VA, GO, Series A Continuously Callable @100 | 5.00 | 8/1/31 | 1,328 | ||||||||||||
| 1,500 | City of Richmond VA Public Utility Revenue, Callable 1/15/26 @ 100.00 | 5.00 | 1/15/29 | 1,594 | ||||||||||||
| 1,000 | Fairfax County Industrial Development Authority Revenue, Series A | 5.00 | 5/15/24 | 1,013 | ||||||||||||
See accompanying notes to financial statements.
260
HC CAPITAL TRUST
The Intermediate Term Municipal Bond Portfolio
Portfolio of Investments (continued) — June 30, 2023
Principal | Security Description | Rate % | Maturity | Value | ||||||||||||
Municipal Bonds (continued) | ||||||||||||||||
Virginia (continued) | ||||||||||||||||
| $ | 850 | Hampton Roads Transportation Accountability Commission Revenue, Series A, Callable 7/1/30 @ 100.00 | 5.00 | 7/1/31 | $ | 980 | ||||||||||
| 1,065 | Loudoun County Economic Development Authority Revenue, Series A | 5.00 | 12/1/27 | 1,166 | ||||||||||||
| 1,000 | Roanoke Economic Development Authority Revenue | 5.00 | 7/1/25 | 1,041 | ||||||||||||
| 1,000 | Virginia Public Building Authority Revenue, Series B (AMT) | 5.00 | 8/1/24 | 1,014 | ||||||||||||
| 8,136 | ||||||||||||||||
Washington — 4.83% | ||||||||||||||||
| 575 | County of King WA, GO Continuously Callable @100 | 5.00 | 1/1/30 | 645 | ||||||||||||
| 1,370 | King County School District No. 401 Highline, GO Continuously Callable @100 (SCH BD GTY) | 5.00 | 12/1/31 | 1,458 | ||||||||||||
| 1,050 | King County School District No. 405 Bellevue, GO Continuously Callable @100 (SCH BD GTY) | 5.00 | 12/1/29 | 1,156 | ||||||||||||
| 1,250 | King County School District No. 410 Snoqualmie Valley, GO Continuously Callable @100 (SCH BD GTY) | 5.00 | 12/1/27 | 1,352 | ||||||||||||
| 1,500 | Port of Seattle WA Revenue (AMT) | 5.00 | 4/1/26 | 1,557 | ||||||||||||
| 1,555 | Port of Seattle WA Revenue, Callable 8/1/32 @ 100.00 (AMT) | 5.00 | 8/1/33 | 1,740 | ||||||||||||
| 7,065 | State of Washington, GO, Series R-2017A, Callable 8/1/26 @ 100.00 | 5.00 | 8/1/32 | 7,488 | ||||||||||||
| 1,300 | State of Washington, GO, Series C, Callable 2/1/31 @ 100.00 | 5.00 | 2/1/33 | 1,507 | ||||||||||||
| 790 | State of Washington, GO, Series C | 5.00 | 2/1/32 | 932 | ||||||||||||
| 1,000 | State of Washington, GO, Series R Continuously Callable @100 | 5.00 | 7/1/27 | 1,035 | ||||||||||||
| 1,250 | Washington Health Care Facilities Authority Revenue, Series B | 5.00 | 10/1/25 | 1,279 | ||||||||||||
| 1,600 | Washington Health Care Facilities Authority Revenue, Series B1, Callable 2/1/24 @ 100.00 | 5.00(a) | 8/1/49 | 1,610 | ||||||||||||
| 1,310 | Washington Health Care Facilities Authority Revenue, Series B | 5.00 | 8/15/23 | 1,313 | ||||||||||||
| 23,072 | ||||||||||||||||
West Virginia — 0.24% | ||||||||||||||||
| 1,000 | State of West Virginia, GO, Series A Continuously Callable @100 | 5.00 | 6/1/33 | 1,124 | ||||||||||||
Wisconsin — 1.24% | ||||||||||||||||
| 3,455 | Public Finance Authority Revenue, Series A-2 | 3.70(a) | 10/1/46 | 3,486 | ||||||||||||
| 1,225 | University of Wisconsin Hospitals & Clinics Revenue, Series A | 5.00 | 4/1/26 | 1,289 | ||||||||||||
| 1,100 | Wisconsin Health & Educational Facilities Authority Revenue | 4.00 | 11/15/26 | 1,128 | ||||||||||||
| 5,903 | ||||||||||||||||
Total Municipal Bonds | 457,901 | |||||||||||||||
Investment Companies — 3.88% | ||||||||||||||||
| 140,938 | BlackRock California Municipal Income Trust | 1,671 | ||||||||||||||
| 2,016,550 | BlackRock Liquidity Funds MuniCash | 2,017 | ||||||||||||||
| 115,722 | BlackRock Municipal Income Fund, Inc. | 1,324 | ||||||||||||||
| 70,474 | BlackRock MuniYield Fund, Inc. | 736 | ||||||||||||||
| 112,779 | BlackRock MuniYield Quality Fund III, Inc. | 1,234 | ||||||||||||||
| 71,012 | DTF Tax-Free Income 2028 Term Fund, Inc. | 765 | ||||||||||||||
| 129,929 | DWS Municipal Income Trust | 1,119 | ||||||||||||||
| 149,822 | Eaton Vance California Municipal Bond Fund | 1,333 | ||||||||||||||
| 97,484 | Eaton Vance Municipal Bond Fund | 970 | ||||||||||||||
| 77,742 | Federated Hermes Premier Municipal Income Fund | 826 | ||||||||||||||
| 60,560 | Invesco Quality Municipal Income Trust | 579 | ||||||||||||||
| 96,654 | MFS High Yield Municipal Trust | 311 | ||||||||||||||
| 121,497 | Nuveen AMT-Free Quality Municipal Income Fund | 1,328 | ||||||||||||||
| 65,000 | Nuveen California Quality Municipal Income Fund | 710 | ||||||||||||||
See accompanying notes to financial statements.
261
HC CAPITAL TRUST
The Intermediate Term Municipal Bond Portfolio
Portfolio of Investments (concluded) — June 30, 2023
Principal | Security Description | Rate % | Maturity | Value | ||||||||||||
Investment Companies (continued) | ||||||||||||||||
| $ | 63,013 | Nuveen Municipal Credit Income Fund | $ | 735 | ||||||||||||
| 132,044 | Nuveen Quality Municipal Income Fund | 1,487 | ||||||||||||||
| 39,879 | Pioneer Municipal High Income Advantage Fund, Inc. | 315 | ||||||||||||||
| 64,655 | Pioneer Municipal High Income Opportunities Fund, Inc. | 696 | ||||||||||||||
| 36,627 | Western Asset Managed Municipals Fund, Inc. | 364 | ||||||||||||||
Total Investment Companies | 18,520 | |||||||||||||||
Total Investments (cost $491,763) — 99.80% | 476,421 | |||||||||||||||
Other assets in excess of liabilities — 0.20% | 961 | |||||||||||||||
Net Assets — 100.00% | $ | 477,382 | ||||||||||||||
(a) | Interest rate is determined by the Remarketing Agent. The rate disclosed is the rate in effect on June 30, 2023. |
(b) | Zero Coupon Security. Effective rate shown is as of June 30, 2023. |
AGM—Assured Guaranty Municipal Corporation |
AMBAC—American Municipal Bond Assurance Corporation |
AMT—Alternative Minimum Tax |
BAM—Build America Mutual |
GO—General Obligation |
PSF-GTD—Public School Fund Guaranteed |
Q-SBLF—Qualified School Bond Loan Fund |
SCH BD GTY—School Board Guaranty |
The following table reflects the percentage of total net assets of the Portfolio attributable to each Specialist Manager as of June 30, 2023.
The Intermediate Term Municipal Bond Portfolio | Insight North | Breckinridge | City of London | Total |
Municipal Bonds | 84.77% | 11.15% | — | 95.92% |
Investment Company | 0.39% | 0.09% | 3.40% | 3.88% |
Other Assets (Liabilities) | 0.03% | 0.08% | 0.09% | 0.20% |
Total Net Assets | 85.19% | 11.32% | 3.49% | 100.00% |
Amounts designated as “—” indicate the Specialist Manager did not manage any holdings in that category.
See accompanying notes to financial statements.
262
HC CAPITAL TRUST
Statements of Assets and Liabilities
As of June 30, 2023
(Amounts in thousands, except per share amounts)
The Value | The Growth | The | The Small | |||||||||||||
ASSETS: | ||||||||||||||||
Investments in securities, at value(a) | $ | 666,061 | $ | 805,943 | $ | 2,450,490 | $ | 76,223 | ||||||||
Cash | — | 419 | 9,142 | — | ||||||||||||
Foreign currency, at value (Cost $0, $0, $102, and $0) | — | — | 102 | — | ||||||||||||
Receivable for portfolio shares issued | — | 75 | 1,736 | — | ||||||||||||
Receivable from investments sold | — | 579 | 3,814 | — | ||||||||||||
Variation margin receivable on derivatives | — | 3 | 1,989 | 1 | ||||||||||||
Cash held as collateral at broker for derivatives | — | — | 8,295 | 33 | ||||||||||||
Dividends and interest receivable | 421 | 602 | 2,151 | 82 | ||||||||||||
Foreign tax reclaims receivable | 1 | 123 | 136 | 4 | ||||||||||||
Prepaid expenses | 17 | 18 | 39 | 9 | ||||||||||||
Total assets | 666,500 | 807,762 | 2,477,894 | 76,352 | ||||||||||||
LIABILITIES: | ||||||||||||||||
Payable for investments purchased | — | 436 | 4,510 | — | ||||||||||||
Payable for portfolio shares redeemed | — | — | 1,853 | — | ||||||||||||
Payable for collateral received on loaned securities | 560 | 485 | 1,274 | 1,086 | ||||||||||||
Variation margin payable on derivatives | — | — | 200 | — | ||||||||||||
Advisory fees payable | 39 | 138 | 307 | 5 | ||||||||||||
Management fees payable | 27 | 32 | 100 | 3 | ||||||||||||
Administrative services fees payable | 22 | 27 | 81 | 5 | ||||||||||||
Professional fees payable | 25 | 37 | 90 | 14 | ||||||||||||
Custodian fees payable | 9 | 15 | 36 | 2 | ||||||||||||
Other accrued expenses | 11 | 12 | 42 | 4 | ||||||||||||
Total liabilities | 693 | 1,182 | 8,493 | 1,119 | ||||||||||||
NET ASSETS | $ | 665,807 | $ | 806,580 | $ | 2,469,401 | $ | 75,233 | ||||||||
NET ASSETS CONSISTS OF: | ||||||||||||||||
Shares of beneficial interest, at par value | $ | 22 | $ | 28 | $ | 150 | $ | 3 | ||||||||
Additional paid-in capital | 304,557 | 267,582 | 1,899,067 | 45,192 | ||||||||||||
Total distributable earnings/(loss) | 361,228 | 538,970 | 570,184 | 30,038 | ||||||||||||
Net Assets | $ | 665,807 | $ | 806,580 | $ | 2,469,401 | $ | 75,233 | ||||||||
NET ASSETS: | ||||||||||||||||
HC Strategic Shares | $ | 665,807 | $ | 806,580 | $ | 2,469,401 | $ | 75,233 | ||||||||
Total | $ | 665,807 | $ | 806,580 | $ | 2,469,401 | $ | 75,233 | ||||||||
SHARES OF BENEFICIAL INTEREST OUTSTANDING (Unlimited number of shares authorized; par value $0.001): | ||||||||||||||||
HC Strategic Shares | 22,490 | 27,644 | 149,977 | 2,527 | ||||||||||||
Total | 22,490 | 27,644 | 149,977 | 2,527 | ||||||||||||
Net Asset Value, offering and redemption price per share: (b) | ||||||||||||||||
HC Strategic Shares | $ | 29.60 | $ | 29.18 | $ | 16.46 | $ | 29.77 | ||||||||
Investments in securities, at cost | $ | 286,046 | $ | 241,521 | $ | 1,683,402 | $ | 43,300 | ||||||||
Amounts designated as “—” are $0 or have been rounded to $0.
(a) | Includes securities on loan of $549, $475, $1,232, and $1,050, respectively. |
(b) | Per share amounts may not recalculate due to rounding of net assets and/or shares outstanding. |
See accompanying notes to financial statements.
263
HC CAPITAL TRUST
Statements of Assets and Liabilities (continued)
As of June 30, 2023
(Amounts in thousands, except per share amounts)
The ESG | The Catholic | The | The Institutional | |||||||||||||
ASSETS: | ||||||||||||||||
Investments in securities, at value(a) | $ | 163,313 | $ | 28,963 | $ | 534,975 | $ | 760,835 | ||||||||
Cash | 246 | — | 3,872 | 1,062 | ||||||||||||
Foreign currency, at value (Cost $189, $40, $1,109, and $1,536, respectively) | 190 | 41 | 1,362 | 1,573 | ||||||||||||
Receivable for portfolio shares issued | — | — | — | 630 | ||||||||||||
Receivable from investments sold | — | — | — | 905 | ||||||||||||
Variation margin receivable on derivatives | 5 | — | 158 | 2,089 | ||||||||||||
Cash held as collateral at broker for derivatives | 19 | — | 732 | 8,407 | ||||||||||||
Dividends and interest receivable | 114 | 26 | 851 | 1,747 | ||||||||||||
Foreign tax reclaims receivable | 285 | 43 | 3,424 | 5,073 | ||||||||||||
Prepaid expenses | 4 | 2 | 16 | 11 | ||||||||||||
Total assets | 164,176 | 29,075 | 545,390 | 782,332 | ||||||||||||
LIABILITIES: | ||||||||||||||||
Written options, at fair value (Premiums received, $0, $0, $137, and $1,129, respectively) | — | — | 37 | 310 | ||||||||||||
Payable for investments purchased | — | — | — | 1,093 | ||||||||||||
Payable for portfolio shares redeemed | — | — | — | 710 | ||||||||||||
Payable for collateral received on loaned securities | — | 2 | — | 420 | ||||||||||||
Variation margin payable on derivatives | — | — | 8 | 125 | ||||||||||||
Advisory fees payable | 24 | — | 38 | 106 | ||||||||||||
Management fees payable | 6 | 1 | 22 | 32 | ||||||||||||
Administrative services fees payable | 11 | 6 | 28 | 35 | ||||||||||||
Professional fees payable | 11 | 6 | 69 | 83 | ||||||||||||
Custodian fees payable | 5 | 2 | 22 | 28 | ||||||||||||
Other accrued expenses | 2 | 2 | 9 | 12 | ||||||||||||
Total liabilities | 59 | 19 | 233 | 2,954 | ||||||||||||
NET ASSETS | $ | 164,117 | $ | 29,056 | $ | 545,157 | $ | 779,378 | ||||||||
NET ASSETS CONSISTS OF: | ||||||||||||||||
Shares of beneficial interest, at par value | $ | 12 | $ | 3 | $ | 46 | $ | 79 | ||||||||
Additional paid-in capital | 122,031 | 20,004 | 424,868 | 721,416 | ||||||||||||
Total distributable earnings/(loss) | 42,074 | 9,049 | 120,243 | 57,883 | ||||||||||||
Net Assets | $ | 164,117 | $ | 29,056 | $ | 545,157 | $ | 779,378 | ||||||||
NET ASSETS: | ||||||||||||||||
HC Strategic Shares | $ | 164,117 | $ | 29,056 | $ | 545,157 | $ | 779,378 | ||||||||
Total | $ | 164,117 | $ | 29,056 | $ | 545,157 | $ | 779,378 | ||||||||
SHARES OF BENEFICIAL INTEREST OUTSTANDING (Unlimited number of shares authorized; par value $0.001): | ||||||||||||||||
HC Strategic Shares | 12,157 | 2,728 | 46,044 | 79,367 | ||||||||||||
Total | 12,157 | 2,728 | 46,044 | 79,367 | ||||||||||||
Net Asset Value, offering and redemption price per share: (b) | ||||||||||||||||
HC Strategic Shares | $ | 13.50 | $ | 10.65 | $ | 11.84 | $ | 9.82 | ||||||||
Investments in securities, at cost | $ | 119,308 | $ | 19,357 | $ | 321,243 | $ | 664,997 | ||||||||
Amounts designated as “—” are $0 or have been rounded to $0.
(a) | Includes securities on loan of $0, $2, $0, and $3,299, respectively. |
(b) | Per share amounts may not recalculate due to rounding of net assets and/or shares outstanding. |
See accompanying notes to financial statements.
264
HC CAPITAL TRUST
Statements of Assets and Liabilities (continued)
As of June 30, 2023
(Amounts in thousands, except per share amounts)
The | The Core | The Corporate | ||||||||||
ASSETS: | ||||||||||||
Investments in securities, at value(a) | $ | 699,740 | $ | 71,975 | $ | 216,351 | ||||||
Cash | 470 | 115 | 511 | |||||||||
Foreign currency, at value (Cost $2,029, $0, and $0, respectively) | 2,134 | — | — | |||||||||
Swap agreements, at value | 747 | — | — | |||||||||
Receivable for portfolio shares issued | 583 | 2 | 1 | |||||||||
Receivable from investments sold | 3 | 401 | — | |||||||||
Variation margin receivable on derivatives | 448 | — | 801 | |||||||||
Cash held as collateral at broker for derivatives | 2,672 | — | 4,975 | |||||||||
Dividends and interest receivable | 3,164 | 338 | 810 | |||||||||
Foreign tax reclaims receivable | 49 | — | — | |||||||||
Prepaid expenses | 13 | 7 | 8 | |||||||||
Total assets | 710,023 | 72,838 | 223,457 | |||||||||
LIABILITIES: | ||||||||||||
Written options, at fair value (Premiums received, $460, $0, and $0, respectively) | 121 | — | — | |||||||||
Swap agreements, at value | 2,923 | — | — | |||||||||
Payable for investments purchased | — | 467 | — | |||||||||
Payable for portfolio shares redeemed | 358 | 25 | — | |||||||||
Payable for collateral received on loaned securities | — | — | 1,177 | |||||||||
Variation margin payable on derivatives | 40 | — | — | |||||||||
Accrued foreign capital gains tax | 3,079 | — | — | |||||||||
Payable for closed swap positions | 172 | — | — | |||||||||
TBA sale commitments payable | — | 802 | — | |||||||||
Advisory fees payable | 116 | 6 | 27 | |||||||||
Management fees payable | 29 | 3 | 7 | |||||||||
Administrative services fees payable | 32 | 8 | 9 | |||||||||
Professional fees payable | 132 | 3 | 7 | |||||||||
Custodian fees payable | 140 | 4 | 3 | |||||||||
Other accrued expenses | 13 | 1 | 5 | |||||||||
Total liabilities | 7,155 | 1,319 | 1,235 | |||||||||
NET ASSETS | $ | 702,868 | $ | 71,519 | $ | 222,222 | ||||||
NET ASSETS CONSISTS OF: | ||||||||||||
Shares of beneficial interest, at par value | $ | 41 | $ | 8 | $ | 32 | ||||||
Additional paid-in capital | 756,446 | 79,900 | 246,649 | |||||||||
Total distributable earnings/(loss) | (53,619 | ) | (8,389 | ) | (24,459 | ) | ||||||
Net Assets | $ | 702,868 | $ | 71,519 | $ | 222,222 | ||||||
NET ASSETS: | ||||||||||||
HC Strategic Shares | $ | 702,868 | $ | 71,519 | $ | 222,222 | ||||||
Total | $ | 702,868 | $ | 71,519 | $ | 222,222 | ||||||
SHARES OF BENEFICIAL INTEREST OUTSTANDING (Unlimited number of shares authorized; par value $0.001): | ||||||||||||
HC Strategic Shares | 40,914 | 8,422 | 32,492 | |||||||||
Total | 40,914 | 8,422 | 32,492 | |||||||||
Net Asset Value, offering and redemption price per share: (b) | ||||||||||||
HC Strategic Shares | $ | 17.18 | $ | 8.49 | $ | 6.84 | ||||||
Investments in securities, at cost | $ | 662,973 | $ | 76,891 | $ | 217,024 | ||||||
Amounts designated as “—” are $0 or have been rounded to $0.
(a) | Includes securities on loan of $886, $0, and $0, respectively. |
(b) | Per share amounts may not recalculate due to rounding of net assets and/or shares outstanding. |
See accompanying notes to financial statements.
265
HC CAPITAL TRUST
Statements of Assets and Liabilities (continued)
As of June 30, 2023
(Amounts in thousands, except per share amounts)
The U.S. | The U.S. | The U.S. | ||||||||||
ASSETS: | ||||||||||||
Investments in securities, at value(a) | $ | 918,023 | $ | 267,403 | $ | 233,017 | ||||||
Cash | 3,257 | — | — | |||||||||
Receivable for portfolio shares issued | 161 | 143 | 142 | |||||||||
Receivable from investments sold | 5,709 | — | — | |||||||||
Variation margin receivable on derivatives | 13 | — | — | |||||||||
Cash held as collateral at broker for derivatives | 780 | — | — | |||||||||
Dividends and interest receivable | 2,326 | 2,780 | 621 | |||||||||
TBA sale commitments receivable | — | — | 280 | |||||||||
Prepaid expenses | 16 | 8 | 7 | |||||||||
Total assets | 930,285 | 270,334 | 234,067 | |||||||||
LIABILITIES: | ||||||||||||
Payable to Custodian | — | 20 | — | |||||||||
Written options, at fair value (Premiums received $121, $0, and $0, respectively) | 120 | — | — | |||||||||
Distributions payable | 288 | 248 | 173 | |||||||||
Payable for investments purchased | 8,391 | — | 156 | |||||||||
Payable for portfolio shares redeemed | 1,463 | 98 | 72 | |||||||||
Payable for collateral received on loaned securities | — | 3,847 | — | |||||||||
TBA sale commitments, at fair value | — | — | 188 | |||||||||
TBA sale commitments payable | — | — | 15,735 | |||||||||
Advisory fees payable | 22 | 19 | 10 | |||||||||
Management fees payable | 38 | 10 | 9 | |||||||||
Administrative services fees payable | 31 | 11 | 15 | |||||||||
Professional fees payable | 32 | 9 | 7 | |||||||||
Custodian fees payable | 13 | 4 | 4 | |||||||||
Other accrued expenses | 15 | 5 | 4 | |||||||||
Total liabilities | 10,413 | 4,271 | 16,373 | |||||||||
NET ASSETS | $ | 919,872 | $ | 266,063 | $ | 217,694 | ||||||
NET ASSETS CONSISTS OF: | ||||||||||||
Shares of beneficial interest, at par value | $ | 108 | $ | 31 | $ | 26 | ||||||
Additional paid-in capital | 987,757 | 298,554 | 258,108 | |||||||||
Total distributable earnings/(loss) | (67,993 | ) | (32,522 | ) | (40,440 | ) | ||||||
Net Assets | $ | 919,872 | $ | 266,063 | $ | 217,694 | ||||||
NET ASSETS: | ||||||||||||
HC Strategic Shares | $ | 919,872 | $ | 266,063 | $ | 217,694 | ||||||
Total | $ | 919,872 | $ | 266,063 | $ | 217,694 | ||||||
SHARES OF BENEFICIAL INTEREST OUTSTANDING (Unlimited number of shares authorized; par value $0.001): | ||||||||||||
HC Strategic Shares | 108,336 | 30,690 | 26,405 | |||||||||
Total | 108,336 | 30,690 | 26,405 | |||||||||
Net Asset Value, offering and redemption price per share: (b) | ||||||||||||
HC Strategic Shares | $ | 8.49 | $ | 8.67 | $ | 8.24 | ||||||
Investments in securities, at cost | $ | 968,794 | $ | 292,178 | $ | 256,488 | ||||||
Amounts designated as “—” are $0 or have been rounded to $0.
(a) | Includes securities on loan of $0, $3,727, and $0, respectively. |
(b) | Per share amounts may not recalculate due to rounding of net assets and/or shares outstanding. |
See accompanying notes to financial statements.
266
HC CAPITAL TRUST
Statements of Assets and Liabilities (concluded)
As of June 30, 2023
(Amounts in thousands, except per share amounts)
The | The | |||||||
ASSETS: | ||||||||
Investments in securities, at value | $ | 68,591 | $ | 476,421 | ||||
Cash | — | 299 | ||||||
Receivable from investments sold | — | 2,650 | ||||||
Dividends and interest receivable | 849 | 5,233 | ||||||
Prepaid expenses | 23 | 23 | ||||||
Total assets | 69,463 | 484,626 | ||||||
LIABILITIES: | ||||||||
Distributions payable | 10 | 60 | ||||||
Payable for investments purchased | — | 6,776 | ||||||
Payable for portfolio shares redeemed | 31 | 130 | ||||||
Advisory fees payable | 7 | 166 | ||||||
Management fees payable | 3 | 19 | ||||||
Administrative services fees payable | 3 | 18 | ||||||
Professional fees payable | — | 59 | ||||||
Custodian fees payable | — | 6 | ||||||
Other accrued expenses | 1 | 10 | ||||||
Total liabilities | 55 | 7,244 | ||||||
NET ASSETS | $ | 69,408 | $ | 477,382 | ||||
NET ASSETS CONSISTS OF: | ||||||||
Shares of beneficial interest, at par value | $ | 7 | $ | 49 | ||||
Additional paid-in capital | 74,595 | 500,362 | ||||||
Total distributable earnings/(loss) | (5,194 | ) | (23,029 | ) | ||||
Net Assets | $ | 69,408 | $ | 477,382 | ||||
NET ASSETS: | ||||||||
HC Strategic Shares | $ | 69,408 | $ | 477,382 | ||||
Total | $ | 69,408 | $ | 477,382 | ||||
SHARES OF BENEFICIAL INTEREST OUTSTANDING (Unlimited number of shares authorized; par value $0.001): | ||||||||
HC Strategic Shares | 7,267 | 49,441 | ||||||
Total | 7,267 | 49,441 | ||||||
Net Asset Value, offering and redemption price per share: (a) | ||||||||
HC Strategic Shares | $ | 9.55 | $ | 9.66 | ||||
Investments in securities, at cost | $ | 69,736 | $ | 491,763 | ||||
Amounts designated as “—” are $0 or have been rounded to $0.
(a) Per share amounts may not recalculate due to rounding of net assets and/or shares outstanding.
See accompanying notes to financial statements.
267
HC CAPITAL TRUST
Statements of Operations
For the Year Ended June 30, 2023
(Amounts in thousands)
The Value | The Growth | The | The Small | |||||||||||||
INVESTMENT INCOME: | ||||||||||||||||
Dividends (net of foreign withholding tax of $1, $0, $45 and $4, respectively) | $ | 10,322 | $ | 10,345 | $ | 51,168 | $ | 1,077 | ||||||||
Income from securities lending, net | 6 | 11 | 82 | 114 | ||||||||||||
Total Investment Income | 10,328 | 10,356 | 51,250 | 1,191 | ||||||||||||
EXPENSES: | ||||||||||||||||
Advisory fees | 497 | 924 | 3,644 | 67 | ||||||||||||
Management fees | 305 | 369 | 1,269 | 37 | ||||||||||||
Administrative services fees | 256 | 306 | 1,009 | 54 | ||||||||||||
Professional fees | 104 | 135 | 438 | 23 | ||||||||||||
Transfer agent fees | 18 | 22 | 77 | 2 | ||||||||||||
Compliance service fees | 16 | 20 | 66 | 2 | ||||||||||||
Custodian fees | 56 | 73 | 201 | 12 | ||||||||||||
Registration and filing fees | 19 | 19 | 13 | 16 | ||||||||||||
Trustee fees | 50 | 61 | 212 | 6 | ||||||||||||
Other | 46 | 60 | 183 | 7 | ||||||||||||
Total expenses before expenses paid indirectly | 1,367 | 1,989 | 7,112 | 226 | ||||||||||||
Less : Expenses paid indirectly | — | (3 | ) | (10 | ) | — | ||||||||||
Net Expenses | 1,367 | 1,986 | 7,102 | 226 | ||||||||||||
Net Investment Income | 8,961 | 8,370 | 44,148 | 965 | ||||||||||||
NET REALIZED/UNREALIZED GAIN/(LOSS) ON INVESTMENTS: | ||||||||||||||||
Net realized gains/(losses) from investment in securities and foreign currency translations | (2,388 | ) | 1,909 | 1,036 | 540 | |||||||||||
Net realized gains/(losses) from redemptions in-kind transactions | 1,840 | 8,022 | — | — | ||||||||||||
Net realized gains/(losses) from futures transactions | 329 | 992 | 68,336 | 35 | ||||||||||||
Net realized gains/(losses) from investments | (219 | ) | 10,923 | 69,372 | 575 | |||||||||||
Change in unrealized appreciation/(depreciation) on investment transactions and foreign currency translations | 98,547 | 124,038 | 290,336 | 7,803 | ||||||||||||
Change in unrealized appreciation/(depreciation) on futures | (28 | ) | (40 | ) | 832 | 189 | ||||||||||
Change in unrealized appreciation/(depreciation) on investments | 98,519 | 123,998 | 291,168 | 7,992 | ||||||||||||
Net realized/unrealized gains/(losses) from investments | 98,300 | 134,921 | 360,540 | 8,567 | ||||||||||||
Change in net assets resulting from operations | $ | 107,261 | $ | 143,291 | $ | 404,688 | $ | 9,532 | ||||||||
Amounts designated as “—” are $0 or have been rounded to $0.
See accompanying notes to financial statements.
268
HC CAPITAL TRUST
Statements of Operations (continued)
For the Year Ended June 30, 2023
(Amounts in thousands)
The ESG | The Catholic | The | The Institutional | |||||||||||||
INVESTMENT INCOME: | ||||||||||||||||
Dividends (net of foreign withholding tax of $221, $41, $3,301, and $2,310, respectively) | $ | 2,985 | $ | 533 | $ | 15,410 | $ | 18,723 | ||||||||
Income from securities lending, net | 1 | 1 | — | 67 | ||||||||||||
Total Investment Income | 2,986 | 534 | 15,410 | 18,790 | ||||||||||||
EXPENSES: | ||||||||||||||||
Advisory fees | 287 | 25 | 491 | 1,186 | ||||||||||||
Management fees | 76 | 13 | 264 | 329 | ||||||||||||
Administrative services fees | 102 | 51 | 264 | 313 | ||||||||||||
Professional fees | 50 | 29 | 153 | 187 | ||||||||||||
Transfer agent fees | 4 | 1 | 15 | 19 | ||||||||||||
Compliance service fees | 4 | 1 | 14 | 17 | ||||||||||||
Custodian fees | 28 | 15 | 125 | 157 | ||||||||||||
Registration and filing fees | 4 | 1 | 19 | 18 | ||||||||||||
Trustee fees | 11 | 2 | 42 | 50 | ||||||||||||
Other | 13 | 2 | 41 | 52 | ||||||||||||
Total expenses before waivers and/or reimbursements | 579 | 140 | 1,428 | 2,328 | ||||||||||||
Expenses waived and/or reimbursed by Adviser | — | (62 | ) | — | — | |||||||||||
Net Expenses | 579 | 78 | 1,428 | 2,328 | ||||||||||||
Net Investment Income | 2,407 | 456 | 13,982 | 16,462 | ||||||||||||
NET REALIZED/UNREALIZED GAIN/(LOSS) ON INVESTMENTS: | ||||||||||||||||
Net realized gains/(losses) from investment in securities and foreign currency translations | (807 | ) | (29 | ) | (2,738 | ) | 9,726 | |||||||||
Net realized gains/(losses) from futures transactions | (9 | ) | — | 5,314 | 5,556 | |||||||||||
Net realized gains/(losses) from written options transactions | — | — | 1,820 | 11,512 | ||||||||||||
Net realized gains/(losses) from investments | (816 | ) | (29 | ) | 4,396 | 26,794 | ||||||||||
Change in unrealized appreciation/(depreciation) on investment transactions and foreign currency translations | 21,030 | 4,299 | 71,979 | 58,960 | ||||||||||||
Change in unrealized appreciation/(depreciation) on futures | 5 | — | (169 | ) | 154 | |||||||||||
Change in unrealized appreciation/(depreciation) on written options | — | — | 205 | 1,485 | ||||||||||||
Change in unrealized appreciation/(depreciation) on investments | 21,035 | 4,299 | 72,015 | 60,599 | ||||||||||||
Net realized/unrealized gains/(losses) from investments | 20,219 | 4,270 | 76,411 | 87,393 | ||||||||||||
Change in net assets resulting from operations | $ | 22,626 | $ | 4,726 | $ | 90,393 | $ | 103,855 | ||||||||
Amounts designated as “—” are $0 or have been rounded to $0.
See accompanying notes to financial statements.
269
HC CAPITAL TRUST
Statements of Operations (continued)
For the Year Ended June 30, 2023
(Amounts in thousands)
The | The Core | The Corporate | ||||||||||
INVESTMENT INCOME: | ||||||||||||
Interest | $ | — | $ | 1,403 | $ | 324 | ||||||
Dividends (net of foreign withholding tax of $2,841, $0, and $0, respectively) | 21,715 | 1,080 | 11,099 | |||||||||
Non-cash dividends | 1,608 | — | — | |||||||||
Income from securities lending, net | 20 | — | 8 | |||||||||
Total Investment Income | 23,343 | 2,483 | 11,431 | |||||||||
EXPENSES: | ||||||||||||
Advisory fees | 1,422 | 74 | 343 | |||||||||
Management fees | 356 | 34 | 118 | |||||||||
Administrative services fees | 331 | 98 | 117 | |||||||||
Professional fees | 232 | 11 | 39 | |||||||||
Transfer agent fees | 21 | 2 | 7 | |||||||||
Compliance service fees | 19 | 2 | 6 | |||||||||
Custodian fees | 787 | 25 | 27 | |||||||||
Registration and filing fees | 19 | 10 | 12 | |||||||||
Trustee fees | 58 | 6 | 20 | |||||||||
Other | 55 | 7 | 21 | |||||||||
Net Expenses | 3,300 | 269 | 710 | |||||||||
Net Investment Income | 20,043 | 2,214 | 10,721 | |||||||||
NET REALIZED/UNREALIZED GAIN/(LOSS) ON INVESTMENTS: | ||||||||||||
Net realized gains/(losses) from investment in securities and foreign currency translations | (11,800 | ) | (2,979 | ) | (16 | ) | ||||||
Net realized gains/(losses) from futures transactions | 2,564 | — | 4,584 | |||||||||
Net realized gains/(losses) from written options transactions | 3,100 | — | — | |||||||||
Net realized gains/(losses) from swap transactions | (5,493 | ) | — | — | ||||||||
Net realized gains/(losses) from investments | (11,629 | ) | (2,979 | ) | 4,568 | |||||||
Change in unrealized appreciation/(depreciation) on investment transactions and foreign currency translations (net of deferred foreign tax) | 13,609 | 339 | (572 | ) | ||||||||
Change in unrealized appreciation/(depreciation) on futures | (658 | ) | — | 840 | ||||||||
Change in unrealized appreciation/(depreciation) on written options | 473 | — | — | |||||||||
Change in unrealized appreciation/(depreciation) on swaps | (6,477 | ) | — | — | ||||||||
Change in unrealized appreciation/(depreciation) on investments | 6,947 | 339 | 268 | |||||||||
Net realized/unrealized gains/(losses) from investments | (4,682 | ) | (2,640 | ) | 4,836 | |||||||
Change in net assets resulting from operations | $ | 15,361 | $ | (426 | ) | $ | 15,557 | |||||
Amounts designated as “—” are $0 or have been rounded to $0.
See accompanying notes to financial statements.
270
HC CAPITAL TRUST
Statements of Operations (continued)
For the Year Ended June 30, 2023
(Amounts in thousands)
The U.S. | The U.S. | The U.S. | ||||||||||
INVESTMENT INCOME: | ||||||||||||
Interest | $ | 12,727 | $ | 8,817 | $ | 5,148 | ||||||
Dividends | 21,591 | 1,044 | 1,451 | |||||||||
Income from securities lending, net | — | 6 | — | |||||||||
Total Investment Income | 34,318 | 9,867 | 6,599 | |||||||||
EXPENSES: | ||||||||||||
Advisory fees | 328 | 215 | 116 | |||||||||
Management fees | 463 | 131 | 109 | |||||||||
Administrative services fees | 379 | 131 | 174 | |||||||||
Professional fees | 138 | 40 | 34 | |||||||||
Transfer agent fees | 27 | 8 | 7 | |||||||||
Compliance service fees | 22 | 7 | 6 | |||||||||
Custodian fees | 73 | 26 | 26 | |||||||||
Registration and filing fees | 18 | 17 | 18 | |||||||||
Trustee fees | 74 | 21 | 18 | |||||||||
Other | 61 | 20 | 16 | |||||||||
Net Expenses | 1,583 | 616 | 524 | |||||||||
Net Investment Income | 32,735 | 9,251 | 6,075 | |||||||||
NET REALIZED/UNREALIZED GAIN/(LOSS) ON INVESTMENTS: | ||||||||||||
Net realized gains/(losses) from investment in securities | (15,606 | ) | (7,308 | ) | (517 | ) | ||||||
Net realized gains/(losses) from futures transactions | 265 | — | — | |||||||||
Net realized gains/(losses) from written options transactions | 120 | — | — | |||||||||
Net realized gains/(losses) from investments | (15,221 | ) | (7,308 | ) | (517 | ) | ||||||
Change in unrealized appreciation/(depreciation) on investment transactions | (26,716 | ) | 3,807 | (7,824 | ) | |||||||
Change in unrealized appreciation/(depreciation) on futures | (185 | ) | — | — | ||||||||
Change in unrealized appreciation/(depreciation) on written options | 1 | — | — | |||||||||
Change in unrealized appreciation/(depreciation) on investments | (26,900 | ) | 3,807 | (7,824 | ) | |||||||
Net realized/unrealized gains/(losses) from investments | (42,121 | ) | (3,501 | ) | (8,341 | ) | ||||||
Change in net assets resulting from operations | $ | (9,386 | ) | $ | 5,750 | $ | (2,266 | ) | ||||
Amounts designated as “—” are $0 or have been rounded to $0.
See accompanying notes to financial statements.
271
HC CAPITAL TRUST
Statements of Operations (concluded)
For the Year Ended June 30, 2023
(Amounts in thousands)
The | The | |||||||
INVESTMENT INCOME: | ||||||||
Interest | $ | 1,658 | $ | 8,404 | ||||
Dividends | 56 | 338 | ||||||
Total Investment Income | 1,714 | 8,742 | ||||||
EXPENSES: | ||||||||
Advisory fees | 117 | 613 | ||||||
Management fees | 47 | 195 | ||||||
Administrative services fees | 53 | 177 | ||||||
Professional fees | 12 | 139 | ||||||
Transfer agent fees | 3 | 12 | ||||||
Compliance service fees | 2 | 10 | ||||||
Custodian fees | 11 | 38 | ||||||
Registration and filing fees | 15 | 14 | ||||||
Trustee fees | 7 | 31 | ||||||
Other | 1 | 39 | ||||||
Net Expenses | 268 | 1,268 | ||||||
Net Investment Income | 1,446 | 7,474 | ||||||
NET REALIZED/UNREALIZED GAIN/(LOSS) ON INVESTMENTS: | ||||||||
Net realized gains/(losses) from investment in securities | (3,140 | ) | (3,801 | ) | ||||
Change in unrealized appreciation/(depreciation) on investments | 1,995 | 4,340 | ||||||
Net realized/unrealized gains/(losses) from investments | (1,145 | ) | 539 | |||||
Change in net assets resulting from operations | $ | 301 | $ | 8,013 | ||||
See accompanying notes to financial statements.
272
HC CAPITAL TRUST
Statements of Changes in Net Assets
(Amounts in thousands)
The Value | The Growth | The Institutional U.S. | ||||||||||||||||||||||
For the | For the | For the | For the | For the | For the | |||||||||||||||||||
Operations: | ||||||||||||||||||||||||
Net investment income | $ | 8,961 | $ | 8,178 | $ | 8,370 | $ | 7,654 | $ | 44,148 | $ | 18,783 | ||||||||||||
Net realized gains/(losses) from investments | (219 | ) | 1,250 | 10,923 | 44,721 | 69,372 | 46,692 | |||||||||||||||||
Change in unrealized appreciation/(depreciation) from investments | 98,519 | (97,424 | ) | 123,998 | (186,352 | ) | 291,168 | (452,432 | ) | |||||||||||||||
Change in net assets resulting from operations | 107,261 | (87,996 | ) | 143,291 | (133,977 | ) | 404,688 | (386,957 | ) | |||||||||||||||
Distributions to Shareholders: | ||||||||||||||||||||||||
HC Strategic Shares | (11,649 | ) | (11,621 | ) | (53,425 | ) | (80,181 | ) | (159,311 | ) | (571,108 | ) | ||||||||||||
Change in net assets resulting from distributions | (11,649 | ) | (11,621 | ) | (53,425 | ) | (80,181 | ) | (159,311 | ) | (571,108 | ) | ||||||||||||
HC Strategic Shares | ||||||||||||||||||||||||
Proceeds from shares issued | $ | 2,496 | $ | 2,231 | $ | 12,240 | $ | 64 | $ | 436,447 | $ | 584,570 | ||||||||||||
Proceeds from reinvestment of dividends | 9,063 | 9,278 | 41,441 | 55,608 | 149,012 | 559,905 | ||||||||||||||||||
Cost of shares redeemed | (25,929 | ) | (24,444 | ) | (43,843 | ) | (68,036 | ) | (613,675 | ) | (368,288 | ) | ||||||||||||
Change in net assets from HC Strategic Shares of beneficial interest | (14,370 | ) | (12,935 | ) | 9,838 | (12,364 | ) | (28,216 | ) | 776,187 | ||||||||||||||
Change in net assets from shares of beneficial interest | $ | (14,370 | ) | $ | (12,935 | ) | $ | 9,838 | $ | (12,364 | ) | $ | (28,216 | ) | $ | 776,187 | ||||||||
Change in net assets | 81,242 | (112,552 | ) | 99,704 | (226,522 | ) | 217,161 | (181,878 | ) | |||||||||||||||
Net Assets: | ||||||||||||||||||||||||
Beginning of period | 584,565 | 697,117 | 706,876 | 933,398 | 2,252,240 | 2,434,118 | ||||||||||||||||||
End of period | $ | 665,807 | $ | 584,565 | $ | 806,580 | $ | 706,876 | $ | 2,469,401 | $ | 2,252,240 | ||||||||||||
Share Transactions: | ||||||||||||||||||||||||
HC Strategic Shares | ||||||||||||||||||||||||
Issued | 86 | 74 | 441 | 2 | 28,683 | 32,615 | ||||||||||||||||||
Reinvested | 344 | 311 | 1,694 | 1,664 | 10,249 | 29,824 | ||||||||||||||||||
Redeemed | (974 | ) | (821 | ) | (1,640 | ) | (2,073 | ) | (39,796 | ) | (18,025 | ) | ||||||||||||
Change in HC Strategic Shares | (544 | ) | (436 | ) | 495 | (407 | ) | (864 | ) | 44,414 | ||||||||||||||
Total change in shares | (544 | ) | (436 | ) | 495 | (407 | ) | (864 | ) | 44,414 | ||||||||||||||
See accompanying notes to financial statements.
273
HC CAPITAL TRUST
Statements of Changes in Net Assets (continued)
(Amounts in thousands)
The Small Capitalization- | The ESG | The Catholic SRI | ||||||||||||||||||||||
For the | For the | For the | For the | For the | For the | |||||||||||||||||||
Operations: | ||||||||||||||||||||||||
Net investment income | $ | 965 | $ | 306 | $ | 2,407 | $ | 2,319 | $ | 456 | $ | 462 | ||||||||||||
Net realized gains/(losses) from investments | 575 | (1,069 | ) | (816 | ) | 898 | (29 | ) | 93 | |||||||||||||||
Change in unrealized appreciation/(depreciation) from investments | 7,992 | (19,971 | ) | 21,035 | (28,369 | ) | 4,299 | (5,203 | ) | |||||||||||||||
Change in net assets resulting from operations | 9,532 | (20,734 | ) | 22,626 | (25,152 | ) | 4,726 | (4,648 | ) | |||||||||||||||
Distributions to Shareholders: | ||||||||||||||||||||||||
From net investment income and/or net realized capital gains | (984 | ) | (6,549 | ) | (2,404 | ) | (8,113 | ) | (649 | ) | (10,591 | ) | ||||||||||||
Tax return of capital | (8 | ) | — | — | — | — | — | |||||||||||||||||
Change in net assets resulting from distributions | (992 | ) | (6,549 | ) | (2,404 | ) | (8,113 | ) | (649 | ) | (10,591 | ) | ||||||||||||
HC Strategic Shares | ||||||||||||||||||||||||
Proceeds from shares issued | $ | 123 | $ | 268 | $ | 112 | $ | 1,326 | $ | 3,749 | $ | 4,672 | ||||||||||||
Proceeds from reinvestment of dividends | 671 | 4,510 | 217 | 5,772 | 649 | 10,591 | ||||||||||||||||||
Cost of shares redeemed | (3,336 | ) | (6,077 | ) | (94 | ) | (665 | ) | (1,944 | ) | (6,411 | ) | ||||||||||||
Change in net assets from HC Strategic Shares of beneficial interest | (2,542 | ) | (1,299 | ) | 235 | 6,433 | 2,454 | 8,852 | ||||||||||||||||
Change in net assets from shares of beneficial interest | $ | (2,542 | ) | $ | (1,299 | ) | $ | 235 | $ | 6,433 | $ | 2,454 | $ | 8,852 | ||||||||||
Change in net assets | 5,998 | (28,582 | ) | 20,457 | (26,832 | ) | 6,531 | (6,387 | ) | |||||||||||||||
Net Assets: | ||||||||||||||||||||||||
Beginning of period | 69,235 | 97,817 | 143,660 | 170,492 | 22,525 | 28,912 | ||||||||||||||||||
End of period | $ | 75,233 | $ | 69,235 | $ | 164,117 | $ | 143,660 | $ | 29,056 | $ | 22,525 | ||||||||||||
Share Transactions: | ||||||||||||||||||||||||
HC Strategic Shares | ||||||||||||||||||||||||
Issued | 4 | 7 | 8 | 89 | 382 | 346 | ||||||||||||||||||
Reinvested | 24 | 135 | 17 | 395 | 68 | 921 | ||||||||||||||||||
Redeemed | (117 | ) | (180 | ) | (7 | ) | (55 | ) | (196 | ) | (585 | ) | ||||||||||||
Change in HC Strategic Shares | (89 | ) | (38 | ) | 18 | 429 | 254 | 682 | ||||||||||||||||
Total change in shares | (89 | ) | (38 | ) | 18 | 429 | 254 | 682 | ||||||||||||||||
See accompanying notes to financial statements.
274
HC CAPITAL TRUST
Statements of Changes in Net Assets (continued)
(Amounts in thousands)
The International | The Institutional | The Emerging | ||||||||||||||||||||||
For the | For the | For the | For the | For the | For the | |||||||||||||||||||
Operations: | ||||||||||||||||||||||||
Net investment income | $ | 13,982 | $ | 22,018 | $ | 16,462 | $ | 28,489 | $ | 20,043 | $ | 16,588 | ||||||||||||
Net realized gains/(losses) from investments | 4,396 | (8,346 | ) | 26,794 | (9,835 | ) | (11,629 | ) | (6,045 | ) | ||||||||||||||
Change in unrealized appreciation/(depreciation) from investments | 72,015 | (120,778 | ) | 60,599 | (213,185 | ) | 6,947 | (237,951 | ) | |||||||||||||||
Change in net assets resulting from operations | 90,393 | (107,106 | ) | 103,855 | (194,531 | ) | 15,361 | (227,408 | ) | |||||||||||||||
Distributions to Shareholders: | ||||||||||||||||||||||||
From net investment income and/or net realized capital gains | (13,334 | ) | (24,441 | ) | (10,428 | ) | (117,066 | ) | (13,347 | ) | (17,632 | ) | ||||||||||||
Tax return of capital | — | — | (6,505 | ) | — | — | — | |||||||||||||||||
Change in net assets resulting from distributions | (13,334 | ) | (24,441 | ) | (16,933 | ) | (117,066 | ) | (13,347 | ) | (17,632 | ) | ||||||||||||
HC Strategic Shares | ||||||||||||||||||||||||
Proceeds from shares issued | $ | 11,568 | $ | 19,127 | $ | 211,763 | $ | 166,148 | $ | 83,010 | $ | 86,489 | ||||||||||||
Proceeds from reinvestment of dividends | 9,140 | 16,914 | 14,735 | 105,685 | 10,376 | 14,462 | ||||||||||||||||||
Cost of shares redeemed | (88,818 | ) | (88,267 | ) | (330,441 | ) | (392,253 | ) | (108,931 | ) | (103,185 | ) | ||||||||||||
Change in net assets from HC Strategic Shares of beneficial interest | (68,110 | ) | (52,226 | ) | (103,943 | ) | (120,420 | ) | (15,545 | ) | (2,234 | ) | ||||||||||||
Change in net assets from shares of beneficial interest | $ | (68,110 | ) | $ | (52,226 | ) | $ | (103,943 | ) | $ | (120,420 | ) | $ | (15,545 | ) | $ | (2,234 | ) | ||||||
Change in net assets | 8,949 | (183,773 | ) | (17,021 | ) | (432,017 | ) | (13,531 | ) | (247,274 | ) | |||||||||||||
Net Assets: | ||||||||||||||||||||||||
Beginning of period | 536,208 | 719,981 | 796,399 | 1,228,416 | 716,399 | 963,673 | ||||||||||||||||||
End of period | $ | 545,157 | $ | 536,208 | $ | 779,378 | $ | 796,399 | $ | 702,868 | $ | 716,399 | ||||||||||||
Share Transactions: | ||||||||||||||||||||||||
HC Strategic Shares | ||||||||||||||||||||||||
Issued | 1,056 | 1,547 | 21,809 | 15,803 | 5,146 | 4,314 | ||||||||||||||||||
Reinvested | 762 | 1,510 | 1,483 | 10,100 | 643 | 703 | ||||||||||||||||||
Redeemed | (8,389 | ) | (7,578 | ) | (37,387 | ) | (38,245 | ) | (6,470 | ) | (5,148 | ) | ||||||||||||
Change in HC Strategic Shares | (6,571 | ) | (4,521 | ) | (14,095 | ) | (12,342 | ) | (681 | ) | (131 | ) | ||||||||||||
Total change in shares | (6,571 | ) | (4,521 | ) | (14,095 | ) | (12,342 | ) | (681 | ) | (131 | ) | ||||||||||||
See accompanying notes to financial statements.
275
HC CAPITAL TRUST
Statements of Changes in Net Assets (continued)
(Amounts in thousands)
The Core Fixed | The Corporate | The U.S. Government Fixed | ||||||||||||||||||||||
For the | For the | For the | For the | For the | For the | |||||||||||||||||||
Operations: | ||||||||||||||||||||||||
Net investment income | $ | 2,214 | $ | 1,163 | $ | 10,721 | $ | 800 | $ | 32,735 | $ | 5,653 | ||||||||||||
Net realized gains/(losses) from investments | (2,979 | ) | (222 | ) | 4,568 | (21,311 | ) | (15,221 | ) | (945 | ) | |||||||||||||
Change in unrealized appreciation/(depreciation) from investments | 339 | (8,166 | ) | 268 | (2,048 | ) | (26,900 | ) | (35,660 | ) | ||||||||||||||
Change in net assets resulting from operations | (426 | ) | (7,225 | ) | 15,557 | (22,559 | ) | (9,386 | ) | (30,952 | ) | |||||||||||||
Distributions to Shareholders: | ||||||||||||||||||||||||
HC Strategic Shares | (2,209 | ) | (1,826 | ) | (10,121 | ) | (30,837 | ) | (32,745 | ) | (6,950 | ) | ||||||||||||
Change in net assets resulting from distributions | (2,209 | ) | (1,826 | ) | (10,121 | ) | (30,837 | ) | (32,745 | ) | (6,950 | ) | ||||||||||||
HC Strategic Shares | ||||||||||||||||||||||||
Proceeds from shares issued | $ | 20,278 | $ | 9,101 | $ | 18,323 | $ | 14,541 | $ | 466,271 | $ | 469,627 | ||||||||||||
Proceeds from reinvestment of dividends | 2,205 | 1,823 | 9,717 | 30,098 | 23,950 | 5,369 | ||||||||||||||||||
Cost of shares redeemed | (5,823 | ) | (10,609 | ) | (70,341 | ) | (39,499 | ) | (156,686 | ) | (65,092 | ) | ||||||||||||
Change in net assets from HC Strategic Shares of beneficial interest | 16,660 | 315 | (42,301 | ) | 5,140 | 333,535 | 409,904 | |||||||||||||||||
Change in net assets from shares of beneficial interest | $ | 16,660 | $ | 315 | $ | (42,301 | ) | $ | 5,140 | $ | 333,535 | $ | 409,904 | |||||||||||
Change in net assets | 14,025 | (8,736 | ) | (36,865 | ) | (48,256 | ) | 291,404 | 372,002 | |||||||||||||||
Net Assets: | ||||||||||||||||||||||||
Beginning of period | 57,494 | 66,230 | 259,087 | 307,343 | 628,468 | 256,466 | ||||||||||||||||||
End of period | $ | 71,519 | $ | 57,494 | $ | 222,222 | $ | 259,087 | $ | 919,872 | $ | 628,468 | ||||||||||||
Share Transactions: | ||||||||||||||||||||||||
HC Strategic Shares | ||||||||||||||||||||||||
Issued | 2,324 | 967 | 2,716 | 1,898 | 52,796 | 51,491 | ||||||||||||||||||
Reinvested | 259 | 186 | 1,458 | 4,048 | 2,818 | 566 | ||||||||||||||||||
Redeemed | (679 | ) | (1,087 | ) | (10,509 | ) | (5,194 | ) | (18,208 | ) | (6,802 | ) | ||||||||||||
Change in HC Strategic Shares | 1,904 | 66 | (6,335 | ) | 752 | 37,406 | 45,255 | |||||||||||||||||
Total change in shares | 1,904 | 66 | (6,335 | ) | 752 | 37,406 | 45,255 | |||||||||||||||||
See accompanying notes to financial statements.
276
HC CAPITAL TRUST
Statements of Changes in Net Assets (continued)
(Amounts in thousands)
The U.S. Corporate Fixed | The U.S. Mortgage/Asset | The Short-Term | ||||||||||||||||||||||
For the | For the | For the | For the | For the | For the | |||||||||||||||||||
Operations: | ||||||||||||||||||||||||
Net investment income | $ | 9,251 | $ | 7,298 | $ | 6,075 | $ | 2,776 | $ | 1,446 | $ | 1,184 | ||||||||||||
Net realized gains/(losses) from investments | (7,308 | ) | 831 | (517 | ) | (2,775 | ) | (3,140 | ) | (908 | ) | |||||||||||||
Change in unrealized appreciation/(depreciation) from investments | 3,807 | (43,676 | ) | (7,824 | ) | (19,523 | ) | 1,995 | (4,969 | ) | ||||||||||||||
Change in net assets resulting from operations | 5,750 | (35,547 | ) | (2,266 | ) | (19,522 | ) | 301 | (4,693 | ) | ||||||||||||||
Distributions to Shareholders: | ||||||||||||||||||||||||
HC Strategic Shares | (9,281 | ) | (18,127 | ) | (6,210 | ) | (4,043 | ) | (1,460 | ) | (1,233 | ) | ||||||||||||
Change in net assets resulting from distributions | (9,281 | ) | (18,127 | ) | (6,210 | ) | (4,043 | ) | (1,460 | ) | (1,233 | ) | ||||||||||||
HC Strategic Shares | ||||||||||||||||||||||||
Proceeds from shares issued | $ | 33,977 | $ | 70,919 | $ | 32,140 | $ | 52,915 | $ | 25,006 | $ | 33,267 | ||||||||||||
Proceeds from reinvestment of dividends | 6,621 | 15,848 | 4,428 | 2,835 | 1,319 | 1,138 | ||||||||||||||||||
Cost of shares redeemed | (28,703 | ) | (45,829 | ) | (23,651 | ) | (33,966 | ) | (95,778 | ) | (38,943 | ) | ||||||||||||
Change in net assets from HC Strategic Shares of beneficial interest | 11,895 | 40,938 | 12,917 | 21,784 | (69,453 | ) | (4,538 | ) | ||||||||||||||||
Change in net assets from shares of beneficial interest | $ | 11,895 | $ | 40,938 | $ | 12,917 | $ | 21,784 | $ | (69,453 | ) | $ | (4,538 | ) | ||||||||||
Change in net assets | 8,364 | (12,736 | ) | 4,441 | (1,781 | ) | (70,612 | ) | (10,464 | ) | ||||||||||||||
Net Assets: | ||||||||||||||||||||||||
Beginning of period | 257,699 | 270,435 | 213,253 | 215,034 | 140,020 | 150,484 | ||||||||||||||||||
End of period | $ | 266,063 | $ | 257,699 | $ | 217,694 | $ | 213,253 | $ | 69,408 | $ | 140,020 | ||||||||||||
Share Transactions: | ||||||||||||||||||||||||
HC Strategic Shares | ||||||||||||||||||||||||
Issued | 3,900 | 7,142 | 3,831 | 5,788 | 2,611 | 3,391 | ||||||||||||||||||
Reinvested | 766 | 1,575 | 533 | 309 | 138 | 116 | ||||||||||||||||||
Redeemed | (3,285 | ) | (4,787 | ) | (2,816 | ) | (3,767 | ) | (10,065 | ) | (3,962 | ) | ||||||||||||
Change in HC Strategic Shares | 1,381 | 3,930 | 1,548 | 2,330 | (7,316 | ) | (455 | ) | ||||||||||||||||
Total change in shares | 1,381 | 3,930 | 1,548 | 2,330 | (7,316 | ) | (455 | ) | ||||||||||||||||
See accompanying notes to financial statements.
277
HC CAPITAL TRUST
Statements of Changes in Net Assets (concluded)
(Amounts in thousands)
The Intermediate Term | ||||||||
For the | For the | |||||||
Operations: | ||||||||
Net investment income | $ | 7,474 | $ | 5,904 | ||||
Net realized gains/(losses) from investments | (3,801 | ) | (360 | ) | ||||
Change in unrealized appreciation/(depreciation) from investments | 4,340 | (28,652 | ) | |||||
Change in net assets resulting from operations | 8,013 | (23,108 | ) | |||||
Distributions to Shareholders: | ||||||||
HC Strategic Shares | (7,421 | ) | (6,487 | ) | ||||
Change in net assets resulting from distributions | (7,421 | ) | (6,487 | ) | ||||
HC Strategic Shares | ||||||||
Proceeds from shares issued | $ | 204,064 | $ | 28,024 | ||||
Proceeds from merger (Note 9) | 70,657 | — | ||||||
Proceeds from reinvestment of dividends | 6,854 | 6,058 | ||||||
Cost of shares redeemed | (175,883 | ) | (21,462 | ) | ||||
Change in net assets from HC Strategic Shares of beneficial interest | 105,692 | 12,620 | ||||||
Change in net assets from shares of beneficial interest | $ | 105,692 | $ | 12,620 | ||||
Change in net assets | 106,284 | (16,975 | ) | |||||
Net Assets: | ||||||||
Beginning of period | 371,098 | 388,073 | ||||||
End of period | $ | 477,382 | $ | 371,098 | ||||
Share Transactions: | ||||||||
HC Strategic Shares | ||||||||
Issued | 21,290 | 2,830 | ||||||
Issued from merger (Note 9) | 7,303 | — | ||||||
Reinvested | 712 | 600 | ||||||
Redeemed | (18,418 | ) | (2,128 | ) | ||||
Change in HC Strategic Shares | 10,887 | 1,302 | ||||||
Total change in shares | 10,887 | 1,302 | ||||||
See accompanying notes to financial statements.
278
HC CAPITAL TRUST
Financial Highlights
Selected data for a share outstanding throughout the periods indicated.
Change in Net Assets | Distributions to Shareholders: | Ratios/Supplementary Data: | ||||||||||||||||||||||||||||||||||||||||||||||||||||||
Net Asset | Net | Net Realized/ | Total from | Net | Net | Total | Net Asset | Total | Net Assets, | Ratio of | Ratio of | Ratio of Net | Portfolio | |||||||||||||||||||||||||||||||||||||||||||
The Value Equity Portfolio | ||||||||||||||||||||||||||||||||||||||||||||||||||||||||
HC Strategic Shares | ||||||||||||||||||||||||||||||||||||||||||||||||||||||||
Year Ended June 30, 2023 | $ | 25.38 | $ | 0.39 | $ | 4.34 | $ | 4.73 | $ | (0.40 | ) | $ | (0.11 | ) | $ | (0.51 | ) | $ | 29.60 | 18.91 | % | $ | 665,807 | 0.22 | % | 0.22 | % | 1.47 | % | 5 | % | |||||||||||||||||||||||||
Year Ended June 30, 2022 | 29.70 | 0.35 | (4.17 | ) | (3.82 | ) | (0.34 | ) | (0.16 | ) | (0.50 | ) | 25.38 | (13.10 | )% | 584,565 | 0.22 | % | 0.22 | % | 1.17 | % | 8 | % | ||||||||||||||||||||||||||||||||
Year Ended June 30, 2021 | 21.23 | 0.31 | 8.48 | 8.79 | (0.32 | ) | — | (0.32 | ) | 29.70 | 41.63 | % | 697,117 | 0.22 | % | 0.22 | % | 1.20 | % | 6 | % | |||||||||||||||||||||||||||||||||||
Year Ended June 30, 2020 | 20.21 | 0.35 | 1.03 | 1.38 | (0.35 | ) | (0.01 | ) | (0.36 | ) | 21.23 | 6.89 | % | 538,326 | 0.22 | % | 0.22 | % | 1.68 | % | 19 | % | ||||||||||||||||||||||||||||||||||
Year Ended June 30, 2019 | 19.95 | 0.40 | 1.34 | 1.74 | (0.41 | ) | (1.07 | ) | (1.48 | ) | 20.21 | 9.78 | % | 583,757 | 0.21 | % | 0.21 | % | 2.05 | % | 74 | % | ||||||||||||||||||||||||||||||||||
HC Advisors Shares | ||||||||||||||||||||||||||||||||||||||||||||||||||||||||
Period Ended June 30, 2019(e) | $ | 19.95 | $ | 0.46 | $ | 1.26 | $ | 1.72 | $ | (0.33 | ) | $ | (1.07 | ) | $ | (1.40 | ) | $ | 20.27 | 9.69 | % | $ | — | 0.46 | % | 0.21 | % | 2.29 | % | 74 | % | |||||||||||||||||||||||||
The Growth Equity Portfolio | ||||||||||||||||||||||||||||||||||||||||||||||||||||||||
HC Strategic Shares | ||||||||||||||||||||||||||||||||||||||||||||||||||||||||
Year Ended June 30, 2023 | $ | 26.04 | $ | 0.30 | $ | 4.82 | $ | 5.12 | $ | (0.31 | ) | $ | (1.67 | ) | $ | (1.98 | ) | $ | 29.18 | 21.14 | % | $ | 806,580 | 0.27 | % | 0.27 | % | 1.13 | % | 11 | % | |||||||||||||||||||||||||
Year Ended June 30, 2022 | 33.87 | 0.28 | (5.17 | ) | (4.89 | ) | (0.28 | ) | (2.66 | ) | (2.94 | ) | 26.04 | (16.30 | )% | 706,876 | 0.27 | % | 0.27 | % | 0.85 | % | 12 | % | ||||||||||||||||||||||||||||||||
Year Ended June 30, 2021 | 25.84 | 0.25 | 9.63 | 9.88 | (0.26 | ) | (1.59 | ) | (1.85 | ) | 33.87 | 39.43 | % | 933,398 | 0.27 | % | 0.27 | % | 0.84 | % | 15 | % | ||||||||||||||||||||||||||||||||||
Year Ended June 30, 2020 | 24.52 | 0.31 | 2.37 | 2.68 | (0.33 | ) | (1.03 | ) | (1.36 | ) | 25.84 | 11.17 | % | 736,840 | 0.26 | % | 0.26 | % | 1.26 | % | 37 | % | ||||||||||||||||||||||||||||||||||
Year Ended June 30, 2019 | 23.54 | 0.30 | 2.30 | 2.60 | (0.30 | ) | (1.32 | ) | (1.62 | ) | 24.52 | 12.22 | % | 802,838 | 0.25 | % | 0.25 | % | 1.28 | % | 41 | % | ||||||||||||||||||||||||||||||||||
HC Advisors Shares | ||||||||||||||||||||||||||||||||||||||||||||||||||||||||
Period Ended June 30, 2019(e) | $ | 23.50 | $ | 0.28 | $ | 2.00 | $ | 2.28 | $ | (0.23 | ) | $ | (1.32 | ) | $ | (1.55 | ) | $ | 24.23 | 10.77 | % | $ | — | 0.51 | % | 0.26 | % | 1.19 | % | 41 | % | |||||||||||||||||||||||||
(a) | Not annualized for periods less than one year. |
(b) | Annualized for periods less than one year. |
(c) | Portfolio turnover is calculated on the basis of the Portfolio, as a whole, without distinguishing between the classes of shares issued and excludes any in-kind transaction. |
(d) | Per share amounts are based on average shares outstanding. |
(e) | HC Advisors Shares are still offered, but were fully redeemed on May 1, 2019. |
See accompanying notes to financial statements.
279
HC CAPITAL TRUST
Financial Highlights (continued)
Selected data for a share outstanding throughout the periods indicated.
Change in Net Assets | Distributions to Shareholders: | Ratios/Supplementary Data: | ||||||||||||||||||||||||||||||||||||||||||||||||||||||||||
Net Asset | Net | Net Realized/ | Total from | Net | Net | Tax Return | Total | Net Asset | Total | Net Assets, | Ratio of | Ratio of | Ratio of Net | Portfolio | ||||||||||||||||||||||||||||||||||||||||||||||
The Institutional U.S. Equity Portfolio | ||||||||||||||||||||||||||||||||||||||||||||||||||||||||||||
HC Strategic Shares | ||||||||||||||||||||||||||||||||||||||||||||||||||||||||||||
Year Ended June 30, 2023 | $ | 14.93 | $ | 0.27 | $ | 2.22 | �� | $ | 2.49 | $ | (0.26 | ) | $ | (0.70 | ) | $ | — | $ | (0.96 | ) | $ | 16.46 | 17.61 | % | $ | 2,469,401 | 0.28 | % | 0.28 | % | 1.74 | % | 39 | % | ||||||||||||||||||||||||||
Year Ended June 30, 2022 | 22.87 | 0.15 | (2.54 | ) | (2.39 | ) | (0.16 | ) | (5.39 | ) | — | (5.55 | ) | 14.93 | (15.30 | )% | 2,252,240 | 0.28 | % | 0.28 | % | 0.77 | % | 43 | % | |||||||||||||||||||||||||||||||||||
Year Ended June 30, 2021 | 17.12 | 0.17 | 6.79 | 6.96 | (0.18 | ) | (1.03 | ) | — | (1.21 | ) | 22.87 | 41.89 | % | 2,434,118 | 0.28 | % | 0.28 | % | 0.87 | % | 29 | % | |||||||||||||||||||||||||||||||||||||
Year Ended June 30, 2020 | 18.53 | 0.23 | 1.98 | 2.21 | (0.21 | ) | (3.41 | ) | — | (3.62 | ) | 17.12 | 12.71 | % | 2,724,391 | 0.24 | % | 0.24 | % | 1.36 | % | 74 | % | |||||||||||||||||||||||||||||||||||||
Year Ended June 30, 2019 | 18.25 | 0.24 | 1.59 | 1.83 | (0.24 | ) | (1.31 | ) | — | (1.55 | ) | 18.53 | 11.46 | % | 1,535,959 | 0.23 | % | 0.23 | % | 1.31 | % | 70 | % | |||||||||||||||||||||||||||||||||||||
HC Advisors Shares | ||||||||||||||||||||||||||||||||||||||||||||||||||||||||||||
Period Ended June 30, 2019(e) | $ | 18.25 | $ | 0.25 | $ | 0.72 | $ | 0.97 | $ | (0.19 | ) | $ | (1.31 | ) | $ | — | $ | (1.50 | ) | $ | 17.72 | 6.27 | % | $ | — | 0.48 | % | 0.23 | % | 1.36 | % | 70 | % | |||||||||||||||||||||||||||
The Small Capitalization-Mid Capitalization Equity Portfolio | ||||||||||||||||||||||||||||||||||||||||||||||||||||||||||||
HC Strategic Shares | ||||||||||||||||||||||||||||||||||||||||||||||||||||||||||||
Year Ended June 30, 2023 | $ | 26.47 | $ | 0.37 | $ | 3.32 | $ | 3.69 | $ | (0.38 | ) | $ | (0.01 | ) | $ | — | (f) | $ | (0.39 | ) | $ | 29.77 | 14.03 | % | $ | 75,233 | 0.31 | % | 0.31 | % | 1.32 | % | 81 | % | ||||||||||||||||||||||||||
Year Ended June 30, 2022 | 36.85 | (f) | 0.12 | (8.01 | ) | (7.89 | ) | (0.12 | ) | (2.37 | ) | — | (2.49 | ) | 26.47 | (22.74 | )% | 69,235 | 0.51 | % | 0.51 | % | 0.35 | % | 64 | % | ||||||||||||||||||||||||||||||||||
Year Ended June 30, 2021 | 23.30 | 0.08 | 13.58 | 13.66 | (0.11 | ) | — | — | (0.11 | ) | 36.85 | (g) | 58.67 | % | 97,817 | 0.49 | % | 0.49 | % | 0.25 | % | 32 | % | |||||||||||||||||||||||||||||||||||||
Year Ended June 30, 2020 | 26.25 | 0.15 | (1.82 | ) | (1.67 | ) | (0.18 | ) | (1.10 | ) | — | (1.28 | ) | 23.30 | (6.83 | )% | 68,527 | 0.53 | % | 0.52 | % | 0.64 | % | 87 | % | |||||||||||||||||||||||||||||||||||
Year Ended June 30, 2019 | 29.52 | 0.10 | (0.77 | ) | (0.67 | ) | (0.13 | ) | (2.47 | ) | — | (2.60 | ) | 26.25 | (0.81 | )% | 95,614 | 0.68 | % | 0.67 | % | 0.36 | % | 79 | % | |||||||||||||||||||||||||||||||||||
HC Advisors Shares | ||||||||||||||||||||||||||||||||||||||||||||||||||||||||||||
Period Ended June 30, 2019(h) | $ | 29.49 | $ | 0.08 | $ | (0.97 | ) | $ | (0.89 | ) | $ | (0.10 | ) | $ | (2.47 | ) | $ | — | $ | (2.57 | ) | $ | 26.03 | (1.62 | )% | $ | — | 0.93 | % | 0.66 | % | 0.27 | % | 79 | % | |||||||||||||||||||||||||
(a) | Not annualized for periods less than one year. |
(b) | Annualized for periods less than one year. |
(c) | Portfolio turnover is calculated on the basis of the Portfolio, as a whole, without distinguishing between the classes of shares issued. |
(d) | Per share amounts are based on average shares outstanding. |
(e) | HC Advisors Shares are still offered, but were fully redeemed on May 13, 2019. |
(f) | Amount rounds to less than $0.005 per share |
(g) | The net asset value per share (“NAV”) for financial reporting purposes differs from the NAV reported due to adjustments made in accordance with accounting principles generally accepted in United States of America. |
(h) | HC Advisors Shares are still offered, but were fully redeemed on May 1, 2019. |
See accompanying notes to financial statements.
280
HC CAPITAL TRUST
Financial Highlights (continued)
Selected data for a share outstanding throughout the periods indicated.
Change in Net Assets | Distributions to Shareholders: | Ratios/Supplementary Data: | ||||||||||||||||||||||||||||||||||||||||||||||||||||||
Net Asset | Net | Net Realized/ | Total from | Net | Net | Total | Net Asset | Total | Net Assets, | Ratio of | Ratio of | Ratio of Net | Portfolio | |||||||||||||||||||||||||||||||||||||||||||
The ESG Growth Portfolio | ||||||||||||||||||||||||||||||||||||||||||||||||||||||||
HC Strategic Shares | ||||||||||||||||||||||||||||||||||||||||||||||||||||||||
Year Ended June 30, 2023 | $ | 11.83 | $ | 0.20 | $ | 1.67 | $ | 1.87 | $ | (0.19 | ) | $ | (0.01 | ) | $ | (0.20 | ) | $ | 13.50 | 15.91 | % | $ | 164,117 | 0.38 | % | 0.38 | % | 1.59 | % | 12 | % | |||||||||||||||||||||||||
Year Ended June 30, 2022 | 14.56 | 0.19 | (2.23 | ) | (2.04 | ) | (0.21 | ) | (0.48 | ) | (0.69 | ) | 11.83 | (14.80 | )% | 143,660 | 0.39 | % | 0.39 | % | 1.36 | % | 10 | % | ||||||||||||||||||||||||||||||||
Year Ended June 30, 2021 | 10.72 | 0.16 | 3.98 | 4.14 | (0.17 | ) | (0.13 | ) | (0.30 | ) | 14.56 | 39.02 | % | 170,492 | 0.36 | % | 0.36 | % | 1.28 | % | 8 | % | ||||||||||||||||||||||||||||||||||
Year Ended June 30, 2020 | 10.92 | 0.18 | 0.32 | 0.50 | (0.19 | ) | (0.51 | ) | (0.70 | ) | 10.72 | 4.49 | % | 132,452 | 0.36 | % | 0.34 | % | 1.66 | % | 31 | % | ||||||||||||||||||||||||||||||||||
Year Ended June 30, 2019 | 11.42 | 0.28 | (b) | (0.10 | ) | 0.18 | (0.30 | ) | (0.38 | ) | (0.68 | ) | 10.92 | 2.06 | % | 148,978 | 0.34 | % | 0.34 | % | 2.52 | % | 172 | % | ||||||||||||||||||||||||||||||||
HC Advisors Shares | ||||||||||||||||||||||||||||||||||||||||||||||||||||||||
Period Ended June 30, 2019(e) | $ | 11.41 | $ | 0.28 | $ | (0.29 | ) | $ | (0.01 | ) | $ | (0.21 | ) | $ | (0.38 | ) | $ | (0.59 | ) | $ | 10.81 | 0.32 | % | $ | — | 0.60 | % | 0.35 | % | 2.56 | % | 172 | % | |||||||||||||||||||||||
The Catholic SRI Growth Portfolio | ||||||||||||||||||||||||||||||||||||||||||||||||||||||||
HC Strategic Shares | ||||||||||||||||||||||||||||||||||||||||||||||||||||||||
Year Ended June 30, 2023 | $ | 9.10 | $ | 0.17 | $ | 1.63 | $ | 1.80 | $ | (0.17 | ) | $ | (0.08 | ) | $ | (0.25 | ) | $ | 10.65 | 20.07 | % | $ | 29,056 | 0.56 | % | 0.31 | % | 1.81 | % | 11 | % | |||||||||||||||||||||||||
Year Ended June 30, 2022 | 16.13 | 0.20 | (1.74 | ) | (1.54 | ) | (0.24 | ) | (5.25 | ) | (5.49 | ) | 9.10 | (16.17 | )% | 22,525 | 0.56 | % | 0.31 | % | 1.56 | % | 25 | % | ||||||||||||||||||||||||||||||||
Year Ended June 30, 2021 | 11.63 | 0.19 | 4.55 | 4.74 | (0.24 | ) | — | (0.24 | ) | 16.13 | 41.00 | % | 28,912 | 0.38 | % | 0.31 | % | 1.38 | % | 42 | % | |||||||||||||||||||||||||||||||||||
Year Ended June 30, 2020 | 11.84 | 0.21 | 0.13 | 0.34 | (0.20 | ) | (0.35 | ) | (0.55 | ) | 11.63 | 2.72 | % | 53,083 | 0.42 | % | 0.31 | % | 1.80 | % | 14 | % | ||||||||||||||||||||||||||||||||||
Year Ended June 30, 2019 | 12.71 | 0.31 | (0.14 | ) | 0.17 | (0.31 | ) | (0.73 | ) | (1.04 | ) | 11.84 | 2.16 | % | 51,401 | 0.41 | % | 0.31 | % | 2.60 | % | 180 | % | |||||||||||||||||||||||||||||||||
HC Advisors Shares | ||||||||||||||||||||||||||||||||||||||||||||||||||||||||
Period Ended June 30, 2019(e) | $ | 12.72 | $ | 0.31 | $ | (0.39 | ) | $ | (0.08 | ) | $ | (0.20 | ) | $ | (0.73 | ) | $ | (0.93 | ) | $ | 11.71 | 0.07 | % | $ | — | 0.66 | % | 0.31 | % | 2.60 | % | 180 | % | |||||||||||||||||||||||
(a) | Not annualized for periods less than one year. |
(b) | Annualized for periods less than one year. |
(c) | Portfolio turnover is calculated on the basis of the Portfolio, as a whole, without distinguishing between the classes of shares issued. |
(d) | Per share amounts are based on average shares outstanding. |
(e) | HC Advisors Shares are still offered, but were fully redeemed on June 14, 2019. |
See accompanying notes to financial statements.
281
HC CAPITAL TRUST
Financial Highlights (continued)
Selected data for a share outstanding throughout the periods indicated.
Change in Net Assets | Distributions to Shareholders: | Ratios/Supplementary Data: | ||||||||||||||||||||||||||||||||||||||||||||||||||||||||||
Net Asset | Net | Net Realized/ | Total from | Net | Net | Tax Return | Total | Net Asset | Total | Net Assets, | Ratio of | Ratio of | Ratio of Net | Portfolio | ||||||||||||||||||||||||||||||||||||||||||||||
The International Equity Portfolio | ||||||||||||||||||||||||||||||||||||||||||||||||||||||||||||
HC Strategic Shares | ||||||||||||||||||||||||||||||||||||||||||||||||||||||||||||
Year Ended June 30, 2023 | $ | 10.19 | $ | 0.29 | $ | 1.65 | $ | 1.94 | $ | (0.29 | ) | $ | — | $ | — | $ | (0.29 | ) | $ | 11.84 | 19.01 | % | $ | 545,157 | 0.27 | % | 0.27 | % | 2.65 | % | 8 | % | ||||||||||||||||||||||||||||
Year Ended June 30, 2022 | 12.60 | 0.39 | (2.35 | ) | (1.96 | ) | (0.45 | ) | — | — | (0.45 | ) | 10.19 | (15.85 | )% | 536,208 | 0.26 | % | 0.26 | % | 3.20 | % | 19 | % | ||||||||||||||||||||||||||||||||||||
Year Ended June 30, 2021 | 9.75 | 0.29 | 2.85 | 3.14 | (0.29 | ) | — | — | (0.29 | ) | 12.60 | 32.16 | % | 719,981 | 0.25 | % | 0.25 | % | 2.51 | % | 23 | % | ||||||||||||||||||||||||||||||||||||||
Year Ended June 30, 2020 | 10.37 | 0.19 | (0.58 | ) | (0.39 | ) | (0.23 | ) | — | — | (0.23 | ) | 9.75 | (3.82 | )% | 605,097 | 0.41 | % | 0.41 | % | 1.88 | % | 95 | % | ||||||||||||||||||||||||||||||||||||
Year Ended June 30, 2019 | 10.74 | 0.34 | (0.32 | ) | 0.02 | (0.39 | ) | — | — | (0.39 | ) | 10.37 | 0.24 | % | 911,059 | 0.47 | % | 0.47 | % | 3.28 | % | 55 | % | |||||||||||||||||||||||||||||||||||||
HC Advisors Shares | ||||||||||||||||||||||||||||||||||||||||||||||||||||||||||||
Period Ended June 30, 2019(e) | $ | 10.75 | $ | 0.20 | $ | (0.17 | ) | $ | 0.03 | $ | (0.03 | ) | $ | — | $ | — | $ | (0.03 | ) | $ | 10.75 | 0.31 | % | $ | — | 0.72 | % | 0.46 | % | 1.95 | % | 55 | % | |||||||||||||||||||||||||||
The Institutional International Equity Portfolio | ||||||||||||||||||||||||||||||||||||||||||||||||||||||||||||
HC Strategic Shares | ||||||||||||||||||||||||||||||||||||||||||||||||||||||||||||
Year Ended June 30, 2023 | $ | 8.52 | $ | 0.23 | $ | 1.28 | $ | 1.51 | $ | (0.13 | ) | $ | — | (f) | $ | (0.08 | ) | $ | (0.21 | ) | $ | 9.82 | 17.76 | % | $ | 779,378 | 0.35 | % | 0.35 | % | 2.50 | % | 26 | % | ||||||||||||||||||||||||||
Year Ended June 30, 2022 | 11.61 | 0.27 | (2.20 | ) | (1.93 | ) | (0.67 | ) | (0.49 | ) | — | (1.16 | ) | 8.52 | (18.16 | )% | 796,399 | 0.27 | % | 0.27 | % | 2.55 | % | 23 | % | |||||||||||||||||||||||||||||||||||
Year Ended June 30, 2021 | 8.85 | 0.18 | 2.78 | 2.96 | (0.20 | ) | — | — | (0.20 | ) | 11.61 | 33.57 | % | 1,228,416 | 0.25 | % | 0.25 | % | 1.73 | % | 7 | % | ||||||||||||||||||||||||||||||||||||||
Year Ended June 30, 2020 | 9.70 | 0.18 | (0.83 | ) | (0.65 | ) | (0.20 | ) | — | (f) | — | (0.20 | ) | 8.85 | (6.83 | )% | 1,340,256 | 0.44 | % | 0.44 | % | 1.96 | % | 64 | % | |||||||||||||||||||||||||||||||||||
Year Ended June 30, 2019 | 10.57 | 0.34 | (0.40 | ) | (0.06 | ) | (0.42 | ) | (0.39 | ) | — | (0.81 | ) | 9.70 | 0.09 | % | 1,886,176 | 0.42 | % | 0.42 | % | 3.46 | % | 38 | % | |||||||||||||||||||||||||||||||||||
HC Advisors Shares | ||||||||||||||||||||||||||||||||||||||||||||||||||||||||||||
Period Ended June 30, 2019(g) | $ | 10.56 | $ | 0.22 | $ | (0.69 | ) | $ | (0.47 | ) | $ | (0.15 | ) | $ | (0.39 | ) | $ | — | $ | (0.54 | ) | $ | 9.55 | (4.06 | )% | $ | — | 0.67 | % | 0.42 | % | 2.14 | % | 38 | % | |||||||||||||||||||||||||
The Emerging Markets Portfolio | ||||||||||||||||||||||||||||||||||||||||||||||||||||||||||||
HC Strategic Shares | ||||||||||||||||||||||||||||||||||||||||||||||||||||||||||||
Year Ended June 30, 2023 | $ | 17.22 | (h) | $ | 0.47 | $ | (0.20 | ) | $ | 0.27 | $ | (0.31 | ) | $ | — | (f) | $ | — | $ | (0.31 | ) | $ | 17.18 | 1.63 | % | $ | 702,868 | 0.46 | % | 0.46 | % | 2.82 | % | 6 | % | |||||||||||||||||||||||||
Year Ended June 30, 2022 | 23.10 | 0.40 | (5.85 | ) | (5.45 | ) | (0.43 | ) | — | — | (0.43 | ) | 17.22 | (h) | (23.87 | )% | 716,399 | 0.52 | % | 0.46 | % | 1.96 | % | 20 | % | |||||||||||||||||||||||||||||||||||
Year Ended June 30, 2021 | 16.96 | 0.25 | 6.11 | 6.36 | (0.22 | ) | — | — | (0.22 | ) | 23.10 | 37.62 | % | 963,673 | 0.51 | % | 0.51 | % | 1.20 | % | 8 | % | ||||||||||||||||||||||||||||||||||||||
Year Ended June 30, 2020 | 18.14 | 0.48 | (1.05 | ) | (0.57 | ) | (0.61 | ) | — | — | (0.61 | ) | 16.96 | (3.44 | )% | 941,171 | 0.51 | % | 0.51 | % | 2.77 | % | 11 | % | ||||||||||||||||||||||||||||||||||||
Year Ended June 30, 2019 | 17.78 | 0.39 | 0.30 | 0.69 | (0.33 | ) | — | — | (0.33 | ) | 18.14 | 4.11 | % | 1,466,128 | 0.58 | % | 0.58 | % | 2.24 | % | 50 | % | ||||||||||||||||||||||||||||||||||||||
HC Advisors Shares | ||||||||||||||||||||||||||||||||||||||||||||||||||||||||||||
Period Ended June 30, 2019(g) | $ | 17.78 | $ | 0.38 | $ | (0.58 | ) | $ | (0.20 | ) | $ | (0.33 | ) | $ | — | $ | — | $ | (0.33 | ) | $ | 17.25 | (0.99 | )% | $ | — | 0.84 | % | 0.59 | % | 2.19 | % | 50 | % | ||||||||||||||||||||||||||
* | The expense ratios reflected do not include acquired fund fees and expenses of investment companies, in which a portfolio invests. |
(a) | Not annualized for periods less than one year. |
(b) | Annualized for periods less than one year. |
(c) | Portfolio turnover is calculated on the basis of the Portfolio, as a whole, without distinguishing between the classes of shares issued and excludes any in-kind transaction. |
(d) | Per share amounts are based on average shares outstanding. |
(e) | HC Advisors Shares are still offered, but were fully redeemed on May 1, 2019. |
(f) | Amount rounds to less than $0.005 per share. |
(g) | HC Advisors Shares are still offered, but were fully redeemed on May 13, 2019. |
(h) | The net asset value per share (“NAV”) for financial reporting purposes differs from the NAV reported due to adjustments made in accordance with accounting principles generally accepted in United States of America. |
See accompanying notes to financial statements.
282
HC CAPITAL TRUST
Financial Highlights (continued)
Selected data for a share outstanding throughout the periods indicated.
Change in Net Assets | Distributions to Shareholders: | Ratios/Supplementary Data: | ||||||||||||||||||||||||||||||||||||||||||||||||||||||
Net Asset | Net | Net Realized/ | Total from | Net | Net | Total | Net Asset | Total | Net Assets, | Ratio of | Ratio of | Ratio of Net | Portfolio | |||||||||||||||||||||||||||||||||||||||||||
The Core Fixed Income Portfolio | ||||||||||||||||||||||||||||||||||||||||||||||||||||||||
HC Strategic Shares | ||||||||||||||||||||||||||||||||||||||||||||||||||||||||
Year Ended June 30, 2023 | $ | 8.82 | $ | 0.28 | $ | (0.33 | ) | $ | (0.05 | ) | $ | (0.28 | ) | $ | — | $ | (0.28 | ) | $ | 8.49 | (0.51 | )% | $ | 71,519 | 0.40 | % | 0.40 | % | 3.27 | % | 45 | %(e) | ||||||||||||||||||||||||
Year Ended June 30, 2022 | 10.27 | 0.18 | (1.35 | ) | (1.17 | ) | (0.19 | ) | (0.09 | ) | (0.28 | ) | 8.82 | (11.58 | )% | 57,494 | 0.36 | % | 0.36 | % | 1.87 | % | 33 | %(e) | ||||||||||||||||||||||||||||||||
Year Ended June 30, 2021 | 10.59 | 0.18 | (0.17 | ) | 0.01 | (0.21 | ) | (0.12 | ) | (0.33 | ) | 10.27 | 0.09 | % | 66,230 | 0.33 | % | 0.33 | % | 1.71 | % | 38 | %(e) | |||||||||||||||||||||||||||||||||
Year Ended June 30, 2020 | 9.98 | 0.25 | 0.62 | 0.87 | (0.26 | ) | — | (0.26 | ) | 10.59 | 8.85 | % | 66,278 | 0.32 | % | 0.32 | % | 2.42 | % | 36 | %(e) | |||||||||||||||||||||||||||||||||||
Year Ended June 30, 2019 | 9.49 | 0.25 | 0.51 | 0.76 | (0.27 | ) | — | (0.27 | ) | 9.98 | 8.12 | % | 68,267 | 0.35 | % | 0.35 | % | 2.63 | % | 34 | %(e) | |||||||||||||||||||||||||||||||||||
HC Advisors Shares | ||||||||||||||||||||||||||||||||||||||||||||||||||||||||
Period Ended June 30, 2019(f) | $ | 9.49 | $ | 0.25 | $ | 0.23 | $ | 0.48 | $ | (0.22 | ) | $ | — | $ | (0.22 | ) | $ | 9.75 | 5.14 | % | $ | — | 0.60 | % | 0.35 | % | 2.63 | % | 34 | %(e) | ||||||||||||||||||||||||||
The Corporate Opportunities Portfolio | ||||||||||||||||||||||||||||||||||||||||||||||||||||||||
HC Strategic Shares | ||||||||||||||||||||||||||||||||||||||||||||||||||||||||
Year Ended June 30, 2023 | $ | 6.67 | $ | 0.30 | $ | 0.16 | $ | 0.46 | $ | (0.29 | ) | $ | — | $ | (0.29 | ) | $ | 6.84 | 7.16 | % | $ | 222,222 | 0.30 | % | 0.30 | % | 4.50 | % | 93 | % | ||||||||||||||||||||||||||
Year Ended June 30, 2022 | 8.07 | 0.02 | (0.58 | ) | (0.56 | ) | (0.02 | ) | (0.82 | ) | (0.84 | ) | 6.67 | (8.03 | )% | 259,087 | 0.21 | % | 0.21 | % | 0.27 | % | 44 | % | ||||||||||||||||||||||||||||||||
Year Ended June 30, 2021 | 7.14 | 0.01 | 0.93 | 0.94 | (0.01 | ) | — | (0.01 | ) | 8.07 | 13.17 | % | 307,343 | 0.21 | % | 0.21 | % | 0.12 | % | 123 | % | |||||||||||||||||||||||||||||||||||
Year Ended June 30, 2020 | 7.01 | (g) | 0.20 | 0.16 | 0.36 | (0.23 | ) | — | (0.23 | ) | 7.14 | 5.23 | % | 436,857 | 0.32 | % | 0.32 | % | 2.81 | % | 40 | % | ||||||||||||||||||||||||||||||||||
Year Ended June 30, 2019 | 6.85 | 0.40 | 0.17 | 0.57 | (0.41 | ) | — | (0.41 | ) | 7.01 | (g) | 8.62 | % | 597,848 | 0.47 | % | 0.47 | % | 5.81 | % | 52 | % | ||||||||||||||||||||||||||||||||||
HC Advisors Shares | ||||||||||||||||||||||||||||||||||||||||||||||||||||||||
Period Ended June 30, 2019(f) | $ | 6.85 | $ | 0.39 | $ | 0.05 | $ | 0.44 | $ | (0.30 | ) | $ | — | $ | (0.30 | ) | $ | 6.99 | 6.61 | % | $ | — | 0.72 | % | 0.47 | % | 5.74 | % | 52 | % | ||||||||||||||||||||||||||
The U.S. Government Fixed Income Securities Portfolio | ||||||||||||||||||||||||||||||||||||||||||||||||||||||||
HC Strategic Shares | ||||||||||||||||||||||||||||||||||||||||||||||||||||||||
Year Ended June 30, 2023 | $ | 8.86 | $ | 0.30 | $ | (0.37 | ) | $ | (0.07 | ) | $ | (0.30 | ) | $ | — | (h) | $ | (0.30 | ) | $ | 8.49 | (0.76 | )% | $ | 919,872 | 0.17 | % | 0.17 | % | 3.53 | % | 45 | % | |||||||||||||||||||||||
Year Ended June 30, 2022 | 9.99 | 0.18 | (1.10 | ) | (0.92 | ) | (0.15 | ) | (0.06 | ) | (0.21 | ) | 8.86 | (9.40 | )% | 628,468 | 0.22 | % | 0.22 | % | 1.93 | % | 41 | % | ||||||||||||||||||||||||||||||||
Year Ended June 30, 2021 | 10.83 | 0.15 | (0.50 | ) | (0.35 | ) | (0.15 | ) | (0.34 | ) | (0.49 | ) | 9.99 | (3.30 | )% | 256,466 | 0.20 | % | 0.20 | % | 1.47 | % | 67 | % | ||||||||||||||||||||||||||||||||
Year Ended June 30, 2020 | 10.03 | 0.21 | 0.80 | 1.01 | (0.21 | ) | — | (h) | (0.21 | ) | 10.83 | 10.21 | % | 305,689 | 0.19 | % | 0.19 | % | 1.99 | % | 58 | % | ||||||||||||||||||||||||||||||||||
Year Ended June 30, 2019 | 9.59 | 0.21 | 0.44 | 0.65 | (0.21 | ) | — | (0.21 | ) | 10.03 | 6.87 | % | 305,531 | 0.20 | % | 0.20 | % | 2.22 | % | 31 | % | |||||||||||||||||||||||||||||||||||
* | The expense ratios reflected do not include acquired fund fees and expenses of investment companies, in which a portfolio invests. |
(a) | Not annualized for periods less than one year. |
(b) | Annualized for periods less than one year. |
(c) | Portfolio turnover is calculated on the basis of the Portfolio, as a whole, without distinguishing between the classes of shares issued. |
(d) | Per share amounts are based on average shares outstanding. |
(e) | Portfolio turnover does not include TBA security transactions. |
(f) | HC Advisors Shares are still offered, but were fully redeemed on May 13, 2019. |
(g) | The net asset value per share (“NAV”) for financial reporting purposes differs from the NAV reported due to adjustments made in accordance with accounting principles generally accepted in United States of America. |
(h) | Amount rounds to less than $0.005 per share. |
See accompanying notes to financial statements.
283
HC CAPITAL TRUST
Financial Highlights (continued)
Selected data for a share outstanding throughout the periods indicated.
Change in Net Assets | Distributions to Shareholders: | Ratios/Supplementary Data: | ||||||||||||||||||||||||||||||||||||||||||||||||||||||
Net Asset | Net | Net Realized/ | Total from | Net | Net | Total | Net Asset | Total | Net Assets, | Ratio of | Ratio of | Ratio of Net | Portfolio | |||||||||||||||||||||||||||||||||||||||||||
The U.S. Corporate Fixed Income Securities Portfolio | ||||||||||||||||||||||||||||||||||||||||||||||||||||||||
HC Strategic Shares | ||||||||||||||||||||||||||||||||||||||||||||||||||||||||
Year Ended June 30, 2023 | $ | 8.79 | $ | 0.31 | $ | (0.12 | ) | $ | 0.19 | $ | (0.31 | ) | $ | — | $ | (0.31 | ) | $ | 8.67 | 2.19 | % | $ | 266,063 | 0.24 | % | 0.24 | % | 3.53 | % | 37 | % | |||||||||||||||||||||||||
Year Ended June 30, 2022 | 10.66 | 0.26 | (1.48 | ) | (1.22 | ) | (0.26 | ) | (0.39 | ) | (0.65 | ) | 8.79 | (12.12 | )% | 257,699 | 0.21 | % | 0.21 | % | 2.63 | % | 31 | % | ||||||||||||||||||||||||||||||||
Year Ended June 30, 2021 | 10.92 | 0.30 | 0.05 | 0.35 | (0.31 | ) | (0.30 | ) | (0.61 | ) | 10.66 | 3.21 | % | 270,435 | 0.23 | % | 0.23 | % | 2.77 | % | 46 | % | ||||||||||||||||||||||||||||||||||
Year Ended June 30, 2020 | 10.29 | 0.32 | 0.70 | 1.02 | (0.32 | ) | (0.07 | ) | (0.39 | ) | 10.92 | 10.10 | % | 347,653 | 0.21 | % | 0.21 | % | 3.04 | % | 43 | % | ||||||||||||||||||||||||||||||||||
Year Ended June 30, 2019 | 9.59 | 0.34 | 0.70 | 1.04 | (0.34 | ) | — | (0.34 | ) | 10.29 | 11.07 | % | 312,255 | 0.21 | % | 0.21 | % | 3.47 | % | 25 | % | |||||||||||||||||||||||||||||||||||
The U.S. Mortgage/Asset Backed Fixed Income Securities Portfolio | ||||||||||||||||||||||||||||||||||||||||||||||||||||||||
HC Strategic Shares | �� | |||||||||||||||||||||||||||||||||||||||||||||||||||||||
Year Ended June 30, 2023 | $ | 8.58 | $ | 0.23 | $ | (0.33 | ) | $ | (0.10 | ) | $ | (0.24 | ) | $ | — | $ | (0.24 | ) | $ | 8.24 | (1.18 | )% | $ | 217,694 | 0.24 | % | 0.24 | % | 2.80 | % | 12 | %(c) | ||||||||||||||||||||||||
Year Ended June 30, 2022 | 9.55 | 0.12 | (0.92 | ) | (0.80 | ) | (0.17 | ) | — | (0.17 | ) | 8.58 | (8.51 | )% | 213,253 | 0.23 | % | 0.23 | % | 1.25 | % | 27 | %(c) | |||||||||||||||||||||||||||||||||
Year Ended June 30, 2021 | 9.80 | 0.09 | (0.14 | ) | (0.05 | ) | (0.20 | ) | — | (0.20 | ) | 9.55 | (0.51 | )% | 215,034 | 0.23 | % | 0.23 | % | 0.96 | % | 46 | %(c) | |||||||||||||||||||||||||||||||||
Year Ended June 30, 2020 | 9.57 | 0.20 | 0.28 | 0.48 | (0.25 | ) | — | (0.25 | ) | 9.80 | 5.12 | % | 249,509 | 0.22 | % | 0.22 | % | 2.04 | % | 32 | %(c) | |||||||||||||||||||||||||||||||||||
Year Ended June 30, 2019 | 9.32 | 0.24 | 0.28 | 0.52 | (0.27 | ) | — | (0.27 | ) | 9.57 | 5.70 | % | 216,403 | 0.24 | % | 0.24 | % | 2.60 | % | 15 | %(c) | |||||||||||||||||||||||||||||||||||
The Short-Term Municipal Bond Portfolio | ||||||||||||||||||||||||||||||||||||||||||||||||||||||||
HC Strategic Shares | ||||||||||||||||||||||||||||||||||||||||||||||||||||||||
Year Ended June 30, 2023 | $ | 9.60 | $ | 0.15 | $ | (0.04 | ) | $ | 0.11 | $ | (0.16 | ) | $ | — | $ | (0.16 | ) | $ | 9.55 | 1.19 | % | $ | 69,408 | 0.29 | % | 0.29 | % | 1.54 | % | 30 | % | |||||||||||||||||||||||||
Year Ended June 30, 2022 | 10.01 | 0.08 | (0.41 | ) | (0.33 | ) | (0.08 | ) | — | (0.08 | ) | 9.60 | (3.27 | )% | 140,020 | 0.28 | % | 0.28 | % | 0.82 | % | 32 | % | |||||||||||||||||||||||||||||||||
Year Ended June 30, 2021 | 10.05 | 0.09 | (0.04 | ) | 0.05 | (0.09 | ) | — | (d) | (0.09 | ) | 10.01 | 0.51 | % | 150,484 | 0.28 | % | 0.28 | % | 0.91 | % | 18 | % | |||||||||||||||||||||||||||||||||
Year Ended June 30, 2020 | 9.93 | 0.14 | 0.12 | 0.26 | (0.14 | ) | — | (0.14 | ) | 10.05 | 2.68 | % | 135,065 | 0.28 | % | 0.28 | % | 1.44 | % | 21 | % | |||||||||||||||||||||||||||||||||||
Year Ended June 30, 2019 | 9.80 | 0.15 | 0.13 | 0.28 | (0.15 | ) | — | (0.15 | ) | 9.93 | 2.88 | % | 106,274 | 0.28 | % | 0.28 | % | 1.56 | % | 15 | % | |||||||||||||||||||||||||||||||||||
(a) | Portfolio turnover is calculated on the basis of the Portfolio, as a whole, without distinguishing between the classes of shares issued. |
(b) | Per share amounts are based on average shares outstanding. |
(c) | Portfolio turnover does not include TBA security transactions. |
(d) | Amount rounds to less than $0.005 per share. |
See accompanying notes to financial statements.
284
HC CAPITAL TRUST
Financial Highlights (concluded)
Selected data for a share outstanding throughout the periods indicated.
Change in Net Assets | Distributions to Shareholders: | Ratios/Supplementary Data: | ||||||||||||||||||||||||||||||||||||||||||||||||||||||
Net Asset | Net | Net Realized/ | Total from | Net | Net | Total | Net Asset | Total | Net Assets, | Ratio of | Ratio of | Ratio of Net | Portfolio | |||||||||||||||||||||||||||||||||||||||||||
The Intermediate Term Municipal Bond Portfolio | ||||||||||||||||||||||||||||||||||||||||||||||||||||||||
HC Strategic Shares | ||||||||||||||||||||||||||||||||||||||||||||||||||||||||
Year Ended June 30, 2023 | $ | 9.63 | $ | 0.19 | $ | 0.02 | $ | 0.21 | $ | (0.18 | ) | $ | — | $ | (0.18 | ) | $ | 9.66 | 2.20 | % | $ | 477,382 | 0.33 | % | 0.33 | % | 1.92 | % | 25 | % | ||||||||||||||||||||||||||
Year Ended June 30, 2022 | 10.42 | 0.16 | (0.77 | ) | (0.61 | ) | (0.16 | ) | (0.02 | ) | (0.18 | ) | 9.63 | (5.98 | )% | 371,098 | 0.31 | % | 0.31 | % | 1.56 | % | 7 | % | ||||||||||||||||||||||||||||||||
Year Ended June 30, 2021 | 10.32 | 0.17 | 0.11 | 0.28 | (0.18 | ) | — | (0.18 | ) | 10.42 | 2.70 | % | 388,073 | 0.30 | % | 0.30 | % | 1.61 | % | 17 | % | |||||||||||||||||||||||||||||||||||
Year Ended June 30, 2020 | 10.21 | 0.20 | 0.12 | 0.32 | (0.20 | ) | (0.01 | ) | (0.21 | ) | 10.32 | 3.21 | % | 391,308 | 0.31 | % | 0.31 | % | 1.92 | % | 36 | % | ||||||||||||||||||||||||||||||||||
Year Ended June 30, 2019 | 9.90 | 0.22 | 0.31 | 0.53 | (0.22 | ) | — | (0.22 | ) | 10.21 | 5.45 | % | 393,097 | 0.32 | % | 0.32 | % | 2.21 | % | 27 | % | |||||||||||||||||||||||||||||||||||
HC Advisors Shares | ||||||||||||||||||||||||||||||||||||||||||||||||||||||||
Period Ended June 30, 2019(e) | $ | 9.90 | $ | 0.22 | $ | 0.32 | $ | 0.54 | $ | (0.19 | ) | $ | — | $ | (0.19 | ) | $ | 10.25 | 5.48 | % | $ | — | 0.57 | % | 0.31 | % | 2.20 | % | 27 | % | ||||||||||||||||||||||||||
* | The expense ratios reflected do not include acquired fund fees and expenses of investment companies, in which a portfolio invests. |
(a) | Not annualized for periods less than one year. |
(b) | Annualized for periods less than one year. |
(c) | Portfolio turnover is calculated on the basis of the Portfolio, as a whole, without distinguishing between the classes of shares issued. |
(d) | Per share amounts are based on average shares outstanding. |
(e) | HC Advisors Shares are still offered, but were fully redeemed on May 1, 2019. |
See accompanying notes to financial statements.
285
HC CAPITAL TRUST
Notes to Financial Statements — June 30, 2023
1. DESCRIPTION. HC Capital Trust (the “Trust”) is registered under the Investment Company Act of 1940, as amended (the “1940 Act”), as an open-end management series investment company. The Trust is a Delaware statutory trust which was organized on December 15, 1994. As of June 30, 2023, the Trust offered sixteen separate investment portfolios: The Value Equity Portfolio (“Value Portfolio”), The Growth Equity Portfolio (“Growth Portfolio”), The Institutional U.S. Equity Portfolio (“Institutional U.S. Portfolio”), The Small Capitalization-Mid Capitalization Equity Portfolio (“Small Cap-Mid Cap Portfolio”), The ESG Growth Portfolio (“ESG Growth Portfolio”), The Catholic SRI Growth Portfolio (“Catholic SRI Growth Portfolio”), The International Equity Portfolio (“International Portfolio”), The Institutional International Equity Portfolio (“Institutional International Portfolio”), The Emerging Markets Portfolio (“Emerging Markets Portfolio”), The Core Fixed Income Portfolio (“Core Fixed Income Portfolio”), The Corporate Opportunities Portfolio (“Corporate Opportunities Portfolio”), The U.S. Government Fixed Income Securities Portfolio (“U.S. Government Fixed Income Portfolio”), The U.S. Corporate Fixed Income Securities Portfolio (“U.S. Corporate Fixed Income Portfolio”), The U.S. Mortgage/Asset Backed Fixed Income Securities Portfolio (“U.S. Mortgage/Asset Backed Fixed Income Portfolio”), The Short-Term Municipal Bond Portfolio (“Short-Term Municipal Portfolio”), and The Intermediate Term Municipal Bond Portfolio (“Intermediate Municipal Portfolio”) (each a “Portfolio” and collectively the “Portfolios”).
Each Portfolio is authorized to issue an unlimited number of shares of beneficial interest with a par value of $0.001 each in two classes of shares: HC Advisors Shares and HC Strategic Shares. As of June 30, 2023, the HC Advisors Shares were not active for any of the Portfolios. Each class of shares for each of the Portfolios has identical rights and privileges except with respect to voting rights on matters affecting a single class of shares. The Trust’s investment adviser is HC Capital Solutions (the “Adviser”), an operating division of Hirtle Callaghan & Co., LLC.
As of June 30, 2023, all Portfolios in the Trust are diversified Portfolios under the 1940 Act.
As is customary, the Trust’s organizational documents permit the Trust to indemnify its officers and trustees against certain liabilities under certain circumstances. In addition, in the normal course of business, the Trust enters into contracts with its vendors and others that also permit the indemnification of parties to the contract under certain circumstances. The Trust’s maximum exposure under these arrangements is unknown, as this would involve future claims that may be made against the Trust.
2. SIGNIFICANT ACCOUNTING POLICIES. The following is a summary of the significant accounting policies followed by the Portfolios in the preparation of their financial statements. The Portfolios are investment companies and follow accounting and reporting guidance under Financial Accounting Standards Board (“FASB”) Accounting Standards Codification (“ASC”) Topic 946, “Financial Services — Investment Companies.” The policies are in conformity with accounting principles generally accepted in the United States of America (“GAAP”). The presentation of the Portfolios’ financial statements in conformity with GAAP requires management to make estimates and assumptions that affect the reported amounts of assets and liabilities at the date of the financial statements and the reported amounts of income and expenses for the period. Actual results could differ from those estimates.
A. Portfolio Valuation. The net asset value (“NAV”) per share of each Portfolio is determined at the close of regular trading on the New York Stock Exchange (“NYSE”), normally at 4:00 p.m. Eastern time, on days the NYSE is open. Each class’s NAV per share is calculated by adding the market value or fair value, as applicable, of all securities and other assets of the Portfolio, subtracting its liabilities and dividing the result by the number of its outstanding shares.
B. Securities Valuation. Security values are ordinarily obtained through the use of independent pricing services in accordance with procedures adopted by the Trust’s Board of Trustees (the “Board”). Pursuant to such procedures, the Portfolios may use a pricing service, bank, or broker-dealer experienced in such matters to value the Portfolio’s securities. When reliable market quotations are not readily available for any security, the Board has designated the Adviser as its fair valuation designee to perform fair value determinations. The fair valuation process is designed to value the security at the price the Portfolio would reasonably expect to receive upon its current sale. Additional consideration is given to securities that have experienced a decrease in the volume or level of activity or to circumstances that indicate that a transaction is not orderly.
For disclosure purposes, the Trust has a three-tier fair value hierarchy that is dependent upon the observability of various “inputs” used to determine the value of the Portfolios’ investments. These inputs are summarized in the three broad levels listed below:
● | Level 1 — quoted prices in active markets for identical assets that each Portfolio has the ability to access |
286
HC CAPITAL TRUST
Notes to Financial Statements (continued) — June 30, 2023
● | Level 2 — other significant observable inputs (including quoted prices for similar securities, interest rates, prepayment speeds, credit risk, etc.) |
● | Level 3 — significant unobservable inputs (including a Portfolio’s own assumptions in determining the fair value of investments) |
Changes in valuation techniques may result in transfer in and out of an assigned level within the fair value hierarchy. The inputs or methodology used for valuing securities are not necessarily an indication of the risks associated with investing in those securities.
Equity Securities (Common and Preferred Stock, Exchange-Traded Funds and Closed-End Funds): Readily marketable portfolio securities listed on a securities exchange, including Nasdaq, are valued at the closing price on the exchange or at the Nasdaq Official Closing Price. If there have been no sales on such exchange, the securities are valued at the closing bid price. In each of these situations, valuations are typically categorized as Level 1 in the fair value hierarchy. Readily marketable securities traded only in the over-the-counter market are valued at the closing price and are typically categorized as Level 1 in the fair value hierarchy, or, if there have been no sales, are valued at the mean of the last reported bid and asked prices and are typically categorized as Level 2 in the fair value hierarchy.
Securities listed on a foreign exchange are valued at the closing price on that exchange, provided that where the prices of such securities are denominated in foreign currencies, such prices are converted into U.S. dollars at the bid price of such currencies against U.S. dollars at the time of the NAV calculation. If there have been no sales on such exchange, the security is valued at the closing bid price. In each of these situations, valuations are typically categorized as Level 1 in the fair value hierarchy. Fair value pricing may be used if events materially affecting the value of foreign securities occur between the time when the exchange on which they are traded closes and the time when the NAV is calculated. Such securities may be valued at fair value in accordance with procedures adopted by the Board. Management identifies possible fluctuations in international securities by monitoring the increase or decrease in the value of a designated benchmark index. In the event of an increase or decrease greater than predetermined levels, a Portfolio may use a systematic valuation model provided by an independent third party to fair value its international securities. Such systematic valuations are typically categorized as Level 2 in the fair value hierarchy.
Mutual Funds: Mutual funds are valued at their respective daily net asset value and are typically categorized as Level 1 in the fair value hierarchy.
Fixed Income Securities (Corporate, Municipal and Foreign Bonds, U.S. Government and Agency Securities): Fixed income securities are valued using various inputs including benchmark yields, reported trades, broker/ dealer quotes, issuer spreads, two-sided markets, benchmark securities, bids, offers, reference data, and industry and market events, and are typically categorized as Level 2 in the fair value hierarchy.
Asset-Backed and Mortgage-Backed Securities: In addition to the inputs discussed above for fixed-income securities, asset-backed and mortgage-backed securities are valued using new issue data, monthly payment information and collateral performance, and are typically categorized as Level 2 in the fair value hierarchy.
Short-Term Obligations: Short-term obligations with maturities of 60 days or less may also be valued at amortized cost, which constitutes fair value as determined by the Board. Such securities are typically categorized as Level 2 in the fair value hierarchy.
Derivative Instruments (Futures, Options, Swaps and Forward Currency Contracts): Swaps are valued using interdealer broker rates, benchmark yields, and swap details and are typically categorized as Level 2 in the fair value hierarchy. Exchange traded futures, swaps and options are valued using quoted prices from the exchange and are typically categorized as Level 1 in the fair value hierarchy. Forward currency contracts are valued using market quotes posted by major currency dealers and are typically categorized as Level 2 in the fair value hierarchy.
Rights Securities: Rights securities are valued at the closing price on the exchange and classified as Level 1 or intrinsically fair valued if there is not an exchange price available and classified as Level 2 or Level 3.
287
HC CAPITAL TRUST
Notes to Financial Statements (continued) — June 30, 2023
The following is a summary of the inputs used to value the following Portfolios’ securities as of June 30, 2023 (amounts in thousands). The breakdown of investment categorization is disclosed in the Schedule of Portfolio Investments for each Portfolio.
Portfolio | LEVEL 1 – | LEVEL 2 – | LEVEL 3 – | Total | ||||||||||||
Value Portfolio | ||||||||||||||||
Common Stocks | $ | 663,941 | $ | — | $ | — | $ | 663,941 | ||||||||
Investment Companies | 2,120 | — | — | 2,120 | ||||||||||||
Total Investment Securities | $ | 666,061 | $ | — | $ | — | $ | 666,061 | ||||||||
Growth Portfolio | ||||||||||||||||
Common Stocks | $ | 804,874 | $ | — | $ | — | $ | 804,874 | ||||||||
Investment Companies | 1,069 | — | — | 1,069 | ||||||||||||
Total Investment Securities | $ | 805,943 | $ | — | $ | — | $ | 805,943 | ||||||||
Institutional U.S. Portfolio | ||||||||||||||||
Common Stocks | $ | 2,236,554 | $ | 39,573 | $ | — | $ | 2,276,127 | ||||||||
Contingent Right | — | — | — | 2 | — | |||||||||||
Exchange-Traded Funds | 101,396 | — | — | 101,396 | ||||||||||||
Investment Companies | 72,967 | — | — | 72,967 | ||||||||||||
Total Investment Securities | $ | 2,410,917 | $ | 39,573 | $ | — | $ | 2,450,490 | ||||||||
Other Financial Instruments1 | ||||||||||||||||
Futures | $ | 4,260 | $ | — | $ | — | $ | 4,260 | ||||||||
Total Investments | $ | 2,415,177 | $ | 39,573 | $ | — | $ | 2,454,750 | ||||||||
Small Cap-Mid Cap Portfolio | ||||||||||||||||
Common Stocks | $ | 74,346 | $ | 5 | $ | — | $ | 74,351 | ||||||||
Contingent Rights | 55 | 1 | — | 2 | 56 | |||||||||||
Investment Companies | 1,816 | — | — | 1,816 | ||||||||||||
Total Investment Securities | $ | 76,217 | $ | 6 | $ | — | $ | 76,223 | ||||||||
Other Financial Instruments1 | ||||||||||||||||
Futures | $ | 3 | $ | — | $ | — | $ | 3 | ||||||||
Total Investments | $ | 76,220 | $ | 6 | $ | — | $ | 76,226 | ||||||||
ESG Growth Portfolio | ||||||||||||||||
Common Stocks | $ | 117,548 | $ | 45,178 | $ | — | 2 | $ | 162,726 | |||||||
Investment Company | 587 | — | — | 587 | ||||||||||||
Total Investment Securities | $ | 118,135 | $ | 45,178 | $ | — | $ | 163,313 | ||||||||
Other Financial Instruments1 | ||||||||||||||||
Futures | $ | 5 | $ | — | $ | — | $ | 5 | ||||||||
Total Investments | $ | 118,140 | $ | 45,178 | $ | — | $ | 163,318 | ||||||||
288
HC CAPITAL TRUST
Notes to Financial Statements (continued) — June 30, 2023
Portfolio | LEVEL 1 – | LEVEL 2 – | LEVEL 3 – | Total | ||||||||||||
Catholic SRI Growth Portfolio | ||||||||||||||||
Common Stocks | $ | 21,349 | $ | 7,592 | $ | — | 2 | $ | 28,941 | |||||||
Investment Companies | 22 | — | — | 22 | ||||||||||||
Total Investment Securities | $ | 21,371 | $ | 7,592 | $ | — | $ | 28,963 | ||||||||
International Portfolio | ||||||||||||||||
Common Stocks | $ | 63,194 | $ | 462,199 | $ | — | 2 | $ | 525,393 | |||||||
Investment Companies | 9,567 | — | — | 9,567 | ||||||||||||
Purchased Options | 15 | — | 15 | |||||||||||||
Total Investment Securities | $ | 72,776 | $ | 462,199 | $ | — | $ | 534,975 | ||||||||
Other Financial Instruments1 | ||||||||||||||||
Futures | $ | 45 | $ | — | $ | — | $ | 45 | ||||||||
Written Options | (37 | ) | — | — | (37 | ) | ||||||||||
Total Investments | $ | 72,784 | $ | 462,199 | $ | — | $ | 534,983 | ||||||||
Institutional International Portfolio | ||||||||||||||||
Common Stocks | $ | 17,368 | $ | 421,820 | $ | — | 2 | $ | 439,188 | |||||||
Investment Companies | 206,736 | 114,787 | — | 321,523 | ||||||||||||
Purchased Options | 124 | — | — | 124 | ||||||||||||
Total Investment Securities | $ | 224,228 | $ | 536,607 | $ | — | $ | 760,835 | ||||||||
Other Financial Instruments1 | ||||||||||||||||
Futures | $ | 1,159 | $ | — | $ | — | $ | 1,159 | ||||||||
Written Options | (310 | ) | — | — | (310 | ) | ||||||||||
Total Investments | $ | 225,077 | $ | 536,607 | $ | — | $ | 761,684 | ||||||||
Emerging Markets Portfolio | ||||||||||||||||
Common Stocks | $ | 88,994 | $ | 511,625 | $ | — | 2 | $ | 600,619 | |||||||
Investment Companies | 99,074 | — | — | 99,074 | ||||||||||||
Purchased Options | 47 | — | — | 47 | ||||||||||||
Total Investment Securities | $ | 188,115 | $ | 511,625 | $ | — | $ | 699,740 | ||||||||
Other Financial Instruments1 | ||||||||||||||||
Futures | $ | (653 | ) | $ | — | $ | — | $ | (653 | ) | ||||||
Written Options | (121 | ) | — | — | (121 | ) | ||||||||||
Total Return Swaps | — | (2,176 | ) | — | (2,176 | ) | ||||||||||
Total Investments | $ | 187,341 | $ | 509,449 | $ | — | $ | 696,790 | ||||||||
289
HC CAPITAL TRUST
Notes to Financial Statements (continued) — June 30, 2023
Portfolio | LEVEL 1 – | LEVEL 2 – | LEVEL 3 – | Total | ||||||||||||
Core Fixed Income Portfolio | ||||||||||||||||
Asset Backed Securities | $ | — | $ | 130 | $ | — | $ | 130 | ||||||||
Collateralized Mortgage Obligations | — | 599 | — | 599 | ||||||||||||
U.S. Government Agency Mortgages | — | 9,128 | — | 9,128 | ||||||||||||
U.S. Government Agency Securities | — | 561 | — | 561 | ||||||||||||
Corporate Bonds | — | 10,732 | — | 10,732 | ||||||||||||
U.S. Treasury Obligations | — | 21,003 | — | 21,003 | ||||||||||||
Yankee Dollars | — | 1,206 | — | 1,206 | ||||||||||||
Exchange-Traded Fund | 18,813 | — | — | 18,813 | ||||||||||||
Investment Companies | 9,803 | — | — | 9,803 | ||||||||||||
Total Investment Securities | $ | 28,616 | $ | 43,359 | $ | — | $ | 71,975 | ||||||||
Corporate Opportunities Portfolio | ||||||||||||||||
Common Stock | $ | — | $ | — | $ | — | 2 | $ | — | |||||||
Investment Companies | 216,351 | — | — | 216,351 | ||||||||||||
Total Investment Securities | $ | 216,351 | $ | — | $ | — | $ | 216,351 | ||||||||
Other Financial Instruments1 | ||||||||||||||||
Futures | $ | 205 | $ | — | $ | — | $ | 205 | ||||||||
Total Investments | $ | 216,556 | $ | — | $ | — | $ | 216,556 | ||||||||
U.S. Government Fixed Income Portfolio | ||||||||||||||||
U.S. Government Agency Securities | $ | — | $ | 10,722 | $ | — | $ | 10,722 | ||||||||
U.S. Treasury Obligations | — | 413,009 | — | 413,009 | ||||||||||||
Yankee Dollar | — | 115 | — | 115 | ||||||||||||
Exchange-Traded Fund | 483,803 | — | — | 483,803 | ||||||||||||
Investment Companies | 10,374 | — | — | 10,374 | ||||||||||||
Total Investment Securities | $ | 494,177 | $ | 423,846 | $ | — | $ | 918,023 | ||||||||
Other Financial Instruments1 | ||||||||||||||||
Futures | $ | (185 | ) | $ | — | $ | — | $ | (185 | ) | ||||||
Written Options | (120 | ) | — | — | (120 | ) | ||||||||||
Total Investments | $ | 493,872 | $ | 423,846 | $ | — | $ | 917,718 | ||||||||
U.S. Corporate Fixed Income Portfolio | ||||||||||||||||
Corporate Bonds | $ | — | $ | 198,191 | $ | — | $ | 198,191 | ||||||||
Yankee Dollars | — | 21,766 | — | 21,766 | ||||||||||||
Exchange-Traded Fund | 38,526 | — | 38,526 | |||||||||||||
Investment Companies | 8,920 | — | — | 8,920 | ||||||||||||
Total Investment Securities | $ | 47,446 | $ | 219,957 | $ | — | $ | 267,403 | ||||||||
290
HC CAPITAL TRUST
Notes to Financial Statements (continued) — June 30, 2023
Portfolio | LEVEL 1 – | LEVEL 2 – | LEVEL 3 – | Total | ||||||||||||
U.S. Mortgage/Asset Backed Fixed Income Portfolio | ||||||||||||||||
Asset Backed Securities | $ | — | $ | 2,502 | $ | — | $ | 2,502 | ||||||||
Collateralized Mortgage Obligations | — | 11,762 | — | 11,762 | ||||||||||||
U.S. Government Agency Mortgages | — | 178,585 | — | 178,585 | ||||||||||||
Corporate Bonds | — | 226 | — | 226 | ||||||||||||
Investment Company | 39,942 | — | — | 39,942 | ||||||||||||
Total Investment Securities | $ | 39,942 | $ | 193,075 | $ | — | $ | 233,017 | ||||||||
Other Financial Instruments1 | ||||||||||||||||
TBA Sale Commitments | $ | — | $ | (188 | ) | $ | — | $ | (188 | ) | ||||||
Total Investments | $ | 39,942 | $ | 192,887 | $ | — | $ | 232,829 | ||||||||
Short-Term Municipal Portfolio | ||||||||||||||||
Municipal Bonds | $ | — | $ | 66,881 | $ | — | $ | 66,881 | ||||||||
U.S. Treasury Obligations | — | 1,486 | — | 1,486 | ||||||||||||
Investment Company | 224 | — | — | 224 | ||||||||||||
Total Investment Securities | $ | 224 | $ | 68,367 | $ | — | $ | 68,591 | ||||||||
Intermediate Municipal Portfolio | ||||||||||||||||
Municipal Bonds | $ | — | $ | 457,901 | $ | — | $ | 457,901 | ||||||||
Investment Companies | 18,520 | — | — | 18,520 | ||||||||||||
Total Investment Securities | $ | 18,520 | $ | 457,901 | $ | — | $ | 476,421 | ||||||||
Amounts designated as “—” are $0 or have been rounded to $0.
1 | Other Financial Instruments are TBA sale commitments or derivative instruments not reflected in the total investment securities, such as futures, which are valued at the unrealized appreciation/(depreciation) on the instrument and written options and swap agreements, which are valued at fair value. |
2 | A reconciliation of assets in which Level 3 inputs are used in determining fair value, along with the additional quantitative disclosures, are presented when there are significant Level 3 investments at the end of the period. As of June 30, 2023, Level 3 investments were 0.00% of net assets and are not considered significant. |
The Portfolios’ financial instruments that are categorized as Level 3 were valued utilizing third party pricing information without adjustment. Such valuations are based on unobservable inputs. A significant change in third party information could result in a significantly lower or higher value of such Level 3 financial instruments.
C. Securities Transactions and Investment Income. For financial reporting purposes, portfolio securities transactions are reported on trade date. However, for daily NAV determination, portfolio securities transactions are reflected no later than in the first calculation on the first business day following trade date. Dividend income is recognized on the ex-dividend date and foreign dividends are recognized as soon as reliable information is available from the Portfolio’s sources. Interest income, including amortization of premium and accretion of discount on investments, is accrued daily. Pay-in-kind interest income and non-cash dividend income received in the form of securities in-lieu of cash, if any, are recorded at the fair value of the securities received. Realized gains and losses from securities transactions are determined by comparing the identified cost of the security lot sold to the net sales proceeds. Realized gains and losses from principal payment transactions on mortgage-backed and asset-backed securities are classified as investment income or loss for financial reporting purposes.
For certain securities, including real estate investment trusts, the Portfolio records distributions received in excess of income as a reduction of the cost of investments and/or realized gain. Such amounts are based on estimates if actual amounts are not available. Actual amounts of income, realized gain and return of capital may differ from the estimated amounts. The
291
HC CAPITAL TRUST
Notes to Financial Statements (continued) — June 30, 2023
Portfolio records adjustments to the estimated amounts of the components of distributions to investment income, unrealized appreciation/depreciation and realized gain/loss on investments as necessary, once the issuers provide information about the actual composition of the distributions.
D. Restricted Securities. A restricted security is a security that cannot be offered for public sale without prior registration under the Securities Act of 1933 (the “1933 Act”) (absent an exemption). Whether a restricted security is illiquid is determined pursuant to guidelines established by the Board. Not all restricted securities are considered illiquid.
E. Allocations. Expenses directly attributable to a Portfolio are charged to that Portfolio. Class-specific expenses, if any, are borne by that class. Other expenses are allocated proportionately among the Portfolios in relation to the net assets of each Portfolio or by another appropriate method. Income, non-class-specific expenses and realized and unrealized gains and losses are allocated to the respective classes based on relative net assets.
F. Dividends and Capital Gain Distributions to Shareholders. The Core Fixed Income Portfolio, U.S. Government Fixed Income Portfolio, U.S. Corporate Fixed Income Portfolio, U.S. Mortgage/Asset Backed Fixed Income Portfolio, Short-Term Municipal Portfolio and Intermediate Municipal Portfolio declare and distribute dividends from net investment income, if any, on a monthly basis. The Value Portfolio, Growth Portfolio, Institutional U.S. Portfolio, Small Cap-Mid Cap Portfolio, ESG Growth Portfolio, Catholic SRI Growth Portfolio and Corporate Opportunities Portfolio declare and distribute dividends from net investment income, if any, on a quarterly basis. The International Portfolio and Institutional International Portfolio declare and distribute dividends from net investment income, if any, on a semiannual basis. The Emerging Markets Portfolio declares and distributes dividends from net investment income, if any, on an annual basis. Net realized capital gains, if any, are declared and distributed at least annually by each Portfolio
G. Repurchase Agreements. Among the instruments that each of the Portfolios may use for temporary investment purposes are repurchase agreements. Under the terms of a typical repurchase agreement, a Portfolio would acquire an underlying debt security for a relatively short period (usually not more than one week), subject to an obligation of the seller to repurchase that security from the Portfolio at an agreed-upon price and date. Repurchase agreements may involve certain risks in the event of default or insolvency of the counterparty, including possible delays or restrictions upon the Portfolio’s ability to dispose of the underlying securities. The creditworthiness of those banks and non-bank dealers with which the Portfolios may enter into repurchase agreements are monitored in accordance with guidelines adopted by the Board, as is the market value of the securities underlying any repurchase agreement to ensure that the seller’s obligation to repurchase is collateralized by an amount at least equal to the repurchase price including accrued interest. All repurchase agreements are fully collateralized by cash and/or government securities (as defined in the 1940 Act). If approved by the Adviser, repurchase agreements may also be fully collateralized by other securities that, at the time the repurchase agreement is entered into, are determined by the Board, or its authorized delegate, to be (i) issued by an issuer that has an exceptionally strong capacity to meet its obligations on the collateral, and (ii) sufficiently liquid that they can be sold by the Portfolio at approximately their carrying value in the ordinary course of business within seven calendar days. Master Repurchase Agreements (“MRA”) permit the Portfolios, under certain circumstances, including an event of default (such as bankruptcy or insolvency), to offset receivables under the MRA with collateral posted by the counterparty and create one net payment due to or from the Portfolios. However, bankruptcy or insolvency laws of a particular jurisdiction may impose restrictions on or prohibitions against such a right of offset in the event of the counterparty’s bankruptcy or insolvency. Pursuant to the terms of the MRA, the Portfolios receive securities as collateral with a market value in excess of the repurchase price to be received by the Portfolios upon the maturity of the transaction. Upon a bankruptcy or insolvency of the counterparty, the Portfolios would recognize a liability with respect to such excess collateral to reflect the Portfolio’s obligation under bankruptcy law to return the excess to the counterparty.
H. TBA Purchase and Sale Commitments. Certain of the Portfolios may enter into “TBA” (to be announced) commitments to purchase or sell securities for a fixed price at a future date, typically not to exceed 45 days. TBA commitments may be considered securities in themselves, and involve a risk of loss if the value of the security to be purchased or sold declines or increases, respectively, prior to settlement date. Unsettled TBA commitments are valued at the current market value of the underlying securities, according to the procedures described under “Securities Valuation” above.
292
HC CAPITAL TRUST
Notes to Financial Statements (continued) — June 30, 2023
I. Commission Recapture. Certain of the Portfolios participate in a commission recapture program. These Portfolios will utilize the recaptured commissions to pay for, in whole or in part, certain expenses of the Portfolios, excluding investment advisory and distribution fees. The expenses eligible to be paid will include, but are not limited to, administrative service fees, audit fees, custodian fees, legal fees and printing expenses, as directed by the Trust. These amounts are disclosed as “Expenses paid indirectly” on the Statements of Operations.
For the period ended June 30, 2023, the following commissions were recaptured:
| Portfolio | Commissions Recaptured (000) | |||
| Growth Portfolio | $ | 3 | ||
| Institutional U.S. Portfolio | 10 | |||
J. Foreign Exchange Transactions. The books and records of the Portfolios are maintained in U.S. dollars. Non-U.S. dollar denominated amounts are translated into U.S. dollars as follows, with the resultant exchange gains and losses recorded in the Statements of Operations:
i) value of investment securities and other assets and liabilities at the exchange rate on the valuation date; and
ii) purchases and sales of investment securities and income and expenses at the exchange rate prevailing on the respective date of such transactions.
The Portfolios do not isolate realized and unrealized gains and losses attributable to changes in the exchange rates from gains and losses that arise from changes in the value of investments. Such fluctuations are included with net realized and unrealized gain or loss on investments.
Dividends and interest from non-U.S. sources received by a Portfolio are generally subject to non-U.S. withholding taxes at rates ranging up to 30%. Such withholding taxes may be reduced or eliminated under the terms of applicable U.S. income tax treaties, and each Portfolio intends to, if reasonable, undertake any procedural steps required to claim the benefits of such treaties. If the value of more than 50% of a Portfolio’s total assets at the close of any taxable year consists of stock or securities of non-U.S. corporations, the Portfolio may elect to treat any non-U.S. taxes paid by it as paid by its shareholders.
The Portfolios may be subject to foreign taxes on gains in investments or currency repatriation. The Portfolios accrue such taxes, as applicable, based on their current interpretation of tax rules in the foreign markets in which they invest.
K. Derivative Instruments. Certain of the Portfolios may invest in various financial instruments including positions in forward currency contracts, financial futures contracts, options contracts and swap agreements.
The following is a summary of the fair value of derivative instruments held by the Portfolios as of June 30, 2023 (amounts in thousands).
Assets | ||||||||||||
Portfolio | Unrealized | Investments, | Swap | |||||||||
Equity Risk Exposure: | ||||||||||||
Institutional U.S. Portfolio | $ | 4,260 | $ | — | $ | — | ||||||
Small Cap-Mid Cap Portfolio | 3 | — | — | |||||||||
ESG Growth Portfolio | 5 | — | — | |||||||||
International Portfolio | 67 | 101 | — | |||||||||
Institutional International Portfolio | 1,366 | 838 | — | |||||||||
Emerging Markets Portfolio | — | 155 | 747 | |||||||||
Corporate Opportunities Portfolio | 2,176 | — | — | |||||||||
293
HC CAPITAL TRUST
Notes to Financial Statements (continued) — June 30, 2023
Liabilities | ||||||||||||
Portfolio | Unrealized | Written | Swap | |||||||||
Equity Risk Exposure: | ||||||||||||
International Portfolio | $ | 22 | $ | 37 | $ | — | ||||||
Institutional International Portfolio | 207 | 310 | — | |||||||||
Emerging Markets Portfolio | 653 | 121 | 2,923 | |||||||||
Interest Rate Risk Exposure: | ||||||||||||
Corporate Opportunities Portfolio | 1,971 | — | — | |||||||||
U.S. Government Fixed Income Portfolio | 185 | 120 | — | |||||||||
Amounts designated as “—” are $0 or have been rounded to $0.
* | Total fair value is presented by Primary Risk Exposure. For futures contracts, the amounts represent their cumulative appreciation/depreciation, which includes movements of variation margin. |
The following is a summary of the effect of derivative instruments on the Statements of Operations for the period ended June 30, 2023 (amounts in thousands):
Portfolio | Net realized | Net realized | Net realized | Net realized | ||||||||||||
Equity Risk Exposure: | ||||||||||||||||
Value Portfolio | $ | 329 | $ | — | $ | — | $ | — | ||||||||
Growth Portfolio | 992 | — | — | — | ||||||||||||
Institutional U.S Portfolio | 68,336 | — | — | — | ||||||||||||
Small Cap-Mid Cap Portfolio | 35 | — | — | — | ||||||||||||
ESG Growth Portfolio | (9 | ) | — | — | — | |||||||||||
International Portfolio | 5,314 | 1,820 | (1,456 | ) | — | |||||||||||
Institutional International Portfolio | 5,556 | 11,512 | (9,967 | ) | — | |||||||||||
Emerging Markets Portfolio | 2,564 | 3,100 | (2,400 | ) | (5,493 | ) | ||||||||||
Corporate Opportunities Portfolio | 10,674 | — | — | — | ||||||||||||
Interest Rate Risk Exposure: | ||||||||||||||||
Corporate Opportunities Portfolio | 4,584 | — | — | — | ||||||||||||
U.S. Government Fixed Income Portfolio | 265 | 120 | 46 | — | ||||||||||||
294
HC CAPITAL TRUST
Notes to Financial Statements (continued) — June 30, 2023
Net Change in Unrealized Appreciation (Depreciation) | ||||||||||||||||
Portfolio | Change in | Change in | Change in | Change in | ||||||||||||
Equity Risk Exposure: | ||||||||||||||||
Value Portfolio | $ | (28 | ) | $ | — | $ | — | $ | — | |||||||
Growth Portfolio | (40 | ) | — | — | — | |||||||||||
Institutional U.S. Portfolio | 832 | — | — | — | ||||||||||||
Small Cap-Mid Cap Portfolio | 189 | — | — | — | ||||||||||||
ESG Growth Portfolio | 5 | — | — | — | ||||||||||||
International Portfolio | (169 | ) | 205 | (96 | ) | — | ||||||||||
Institutional International Portfolio | 154 | 1,485 | (502 | ) | — | |||||||||||
Emerging Markets Portfolio | (658 | ) | 473 | (191 | ) | (6,477 | ) | |||||||||
Corporate Opportunities Portfolio | 1,291 | — | — | — | ||||||||||||
Interest Rate Risk Exposure: | ||||||||||||||||
Corporate Opportunities Portfolio | 840 | — | — | — | ||||||||||||
U.S. Government Fixed Income Portfolio | (185 | ) | 1 | — | — | |||||||||||
Amounts designated as “—” are $0 or have been rounded to $0.
The Trust may be subject to master netting agreements (“MNA”) that allow for amounts owed between a Portfolio and the counterparty to be netted. The party that has the larger payable pays the excess of the larger amount over the smaller amount to the counterparty. The MNA do not apply to amounts owed to/from different counterparties. The amounts shown in the Statements of Assets and Liabilities do not take into consideration the effects of legally enforceable MNA. The table below presents the gross and net amounts of these assets and liabilities with any offsets to reflect the Portfolio’s ability to transact net amounts with counterparties at June 30, 2023.
As of June 30, 2023, each Portfolio’s derivative assets and liabilities by type are as follows (amounts in thousands):
Institutional | Small Cap-Mid | ESG Growth | ||||||||||||||||||||||
Assets | Liabilities | Assets | Liabilities | Assets | Liabilities | |||||||||||||||||||
Derivative Financial Instruments: | ||||||||||||||||||||||||
Futures contracts | $ | 4,260 | $ | — | $ | 3 | $ | — | $ | 5 | $ | — | ||||||||||||
Total derivative assets and liabilities on the Statements of Assets and Liabilities | 4,260 | 3 | — | 5 | — | |||||||||||||||||||
Derivatives not subject to a MNA or similar agreement | (4,260 | ) | — | (3 | ) | — | (5 | ) | — | |||||||||||||||
Total assets and liabilities subject to a MNA | $ | — | $ | — | $ | — | $ | — | $ | — | $ | — | ||||||||||||
295
HC CAPITAL TRUST
Notes to Financial Statements (continued) — June 30, 2023
International | Institutional | Emerging Markets | ||||||||||||||||||||||
Assets | Liabilities | Assets | Liabilities | Assets | Liabilities | |||||||||||||||||||
Derivative Financial Instruments: | ||||||||||||||||||||||||
Futures contracts | $ | 67 | $ | — | $ | 1,366 | $ | — | $ | — | $ | 603 | ||||||||||||
Options on futures contracts* | 101 | 210 | 838 | 1,470 | 155 | 121 | ||||||||||||||||||
Swap agreements | — | — | — | — | 747 | 2,923 | ||||||||||||||||||
Total derivative assets and liabilities on the Statements of Assets and Liabilities | 168 | 210 | 2,204 | 1,470 | 902 | 3,647 | ||||||||||||||||||
Derivatives not subject to a MNA or similar agreement | (168 | ) | (210 | ) | (2,204 | ) | (1,470 | ) | (155 | ) | (724 | ) | ||||||||||||
Total assets and liabilities subject to a MNA | $ | — | $ | — | $ | — | $ | — | $ | 747 | $ | 2,923 | ||||||||||||
Corporate | U.S. Government | |||||||||||||||
Assets | Liabilities | Assets | Liabilities | |||||||||||||
Derivative Financial Instruments: | ||||||||||||||||
Futures contracts | $ | 2,176 | $ | 1,971 | $ | — | $ | 185 | ||||||||
Options on futures contracts* | — | — | — | 120 | ||||||||||||
Total derivative assets and liabilities on the Statements of Assets and Liabilities | 2,176 | 1,971 | — | 305 | ||||||||||||
Derivatives not subject to a MNA or similar agreement | (2,176 | ) | (1,971 | ) | — | (305 | ) | |||||||||
Total assets and liabilities subject to a MNA | $ | — | $ | — | $ | — | $ | — | ||||||||
Amounts designated as “—” are $0 or have been rounded to $0.
* | Includes options contracts purchased at value as reported on the Statements of Assets and Liabilities. |
The following table represents the Emerging Markets Portfolio’s derivative assets by counterparty, net of amounts available for offset under an MNA and net of the related collateral received by the Portfolio as of June 30, 2023 (amounts in thousands).
Counterparty | Derivative | Derivatives | Non-cash | Cash Collateral | Net Amount | |||||||||||||||
Emerging Markets Portfolio | ||||||||||||||||||||
Morgan Stanley | $ | 747 | $ | (747 | ) | $ | — | $ | — | $ | — | |||||||||
Total | $ | 747 | $ | (747 | ) | $ | — | $ | — | $ | — | |||||||||
296
HC CAPITAL TRUST
Notes to Financial Statements (continued) — June 30, 2023
The following table represents the Emerging Markets Portfolio’s derivative liabilities by counterparty, net of amounts available for offset under an MNA and net of the related collateral pledged by the Portfolio as of June 30, 2023 (amounts in thousands).
Counterparty | Derivative | Derivatives | Non-cash | Cash Collateral | Net Amount | |||||||||||||||
Emerging Markets Portfolio | ||||||||||||||||||||
Morgan Stanley | $ | (2,923 | ) | $ | 747 | $ | — | $ | — | $ | (2,176 | ) | ||||||||
Total | $ | (2,923 | ) | $ | 747 | $ | — | $ | — | $ | (2,176 | ) | ||||||||
Amounts designated as “—” are $0 or have been rounded to $0.
(a) | The actual collateral received or pledged may be in excess of the amounts shown in the tables. The tables only reflect collateral amounts up to the amount of the financial instruments disclosed on the Statements of Assets and Liabilities. |
Forward Currency Contracts: Certain of the Portfolios may be subject to currency exchange rate risk in the normal course of pursuing their investment objectives. A Portfolio enters into forward currency contracts (“forward contracts”) for the purpose of hedging exposure to changes in foreign currency exchange rates on its holdings. A forward contract is an agreement between two parties to buy and sell a currency at a set price on a future date. The value of the forward contract fluctuates with changes in currency exchange rates. The forward contract is marked-to-market daily and the change in value is recorded by the Portfolio as unrealized appreciation or depreciation. When the forward contract is closed, the Portfolio records a realized gain or loss equal to the fluctuation in value during the period the forward contract was open. The Portfolio is subject to credit risk, which is the risk that the counterparty is unable to meet the terms of a forward contract, and market risk, which is the risk that the value of the currency changes unfavorably.
Forward contracts may involve credit or market risk in excess of the amounts reflected on a Portfolio’s Statement of Assets and Liabilities. The gain or loss from the difference between the cost of original contracts and the amount realized upon the closing of such forward contracts is included in net realized gains or losses on foreign currency transactions. Fluctuations in the value of forward contracts held are recorded for financial reporting purposes as net unrealized gains or losses. In addition, at June 30, 2023, the Portfolios entered into currency contracts to settle trades in foreign currencies. These transactions are included in “Receivable from investments sold” and “Payable for investments purchased” on the Statements of Assets and Liabilities. The Portfolios did not invest in forward currency contracts during the year ended June 30, 2023.
Financial Futures Contracts: Certain of the Portfolios may be subject to equity price risk, interest rate risk, and foreign currency exchange rate risk in the normal course of pursuing their investment objectives. Certain of the Portfolios may invest in financial futures contracts (“futures contracts”) in order to reduce such risks, as part of their investment strategies or to gain exposure to or hedge against changes in the value of equities, interest rates or foreign currencies. A futures contract represents a commitment for the future purchase or sale of an asset at a specified price on a specified date. Upon entering into a futures contract, a Portfolio is required to pledge to the broker an amount of cash and/or other assets equal to a certain percentage of the contract amount (initial margin deposit). Subsequent payments, known as “variation margin,” may be made or received by a Portfolio each day, depending on the daily fluctuations in the value of the underlying financial instrument. A Portfolio recognizes a gain or loss equal to the daily variation margin, which is recorded as a receivable or payable on the Statement of Assets and Liabilities (if applicable). When a futures contract is closed, a realized gain or loss is recorded as “Net realized gains/(losses) from futures transactions” on the Statement of Operations. Should market conditions move unexpectedly, the Portfolio may not achieve the anticipated benefits of the futures contracts and may realize a loss. The use of futures transactions involves the risk of an imperfect correlation in movements in the price of futures contracts, interest rates, and the underlying hedged assets. With futures contracts, there is minimal counterparty credit risk to the Portfolios since futures contracts are exchange traded and the exchange’s clearinghouse, as counterparty to all exchange-traded futures contracts, guarantees the futures contracts
297
HC CAPITAL TRUST
Notes to Financial Statements (continued) — June 30, 2023
against default. Securities designated as collateral for market value on futures contracts are noted in each Portfolio’s Portfolio of Investments (if applicable). Such collateral is held with the broker. The notional value of the futures contracts outstanding at June 30, 2023, and the month-end average notional amount for the period ended June 30, 2023 are detailed in the table below:
Outstanding | Monthly Average | |||||||||||||||
Futures Contracts: | Long | Short | Long | Short | ||||||||||||
Value Portfolio | $ | — | $ | — | $ | 3,286 | $ | — | ||||||||
Growth Portfolio | — | — | 3,749 | — | ||||||||||||
Institutional U.S. Portfolio | 135,361 | — | 661,688 | — | ||||||||||||
Small Cap-Mid Cap Portfolio | 286 | — | 2,190 | — | ||||||||||||
ESG Growth Portfolio | 440 | — | 118 | — | ||||||||||||
International Portfolio | 13,472 | 673 | 16,392 | 1,360 | ||||||||||||
Institutional International Portfolio | 166,728 | 6,508 | 55,708 | 7,761 | ||||||||||||
Emerging Markets Portfolio | 53,438 | 1,571 | 61,810 | 2,040 | ||||||||||||
Corporate Opportunities Portfolio | 168,043 | — | 183,604 | — | ||||||||||||
U.S. Government Fixed Income Portfolio | 10,216 | — | 6,892 | — | ||||||||||||
Amounts designated as “-” are $0 or have been rounded to $0.
Purchased Options Contracts: Certain of the Portfolios may be subject to equity price risk and interest rate risk in the normal course of pursuing their investment objectives. In order to reduce such risks, as part of their investment strategies and/ or in anticipation of future purchases, including to achieve market exposure pending direct investment in securities, certain of the Portfolios may purchase put or call options. Options contracts provide the purchaser with the right, but not the obligation, to buy or sell (call or put option, respectively) a financial instrument at the exercise price. The Portfolio pays a premium which is included in “Investments, at value” on the Statement of Assets and Liabilities and marked-to-market to reflect the current value of the option. Premiums paid for purchasing options which expire are treated as realized losses. When an option is exercised or closed, premiums paid for purchasing options are offset against proceeds to determine the realized gain or loss on the transaction.
Written Options Contracts: Certain of the Portfolios may be subject to equity price risk and interest rate risk in the normal course of pursuing their investment objectives. In order to reduce such risks, as part of their investment strategies and/or in anticipation of future purchases, including to achieve market exposure pending direct investment in securities, certain of the Portfolios may write put or call options. Premiums received from written options contracts are recorded as liabilities on the Statement of Assets and Liabilities and are marked-to-market to reflect the current value of the options written. Premiums received from writing options which expire are treated as realized gains. Premiums received from writing options, which are either exercised or closed, are offset against the proceeds received or the amount paid on the transaction to determine realized gains or losses. Realized gains and losses are reported as “Net realized gains/(losses) from written options transactions” on the Statement of Operations (if applicable). When writing an option, the Portfolio bears the market risk of unfavorable changes in the price of the underlying instrument.
With exchange-traded options, there is minimal counterparty credit risk to the Portfolios since the exchange’s clearinghouse, as counterparty to all exchange-traded options, guarantees the options against default. With over-the-counter options, the Portfolios bear the risk that counterparties will be unable to perform under the terms of the contracts.
298
HC CAPITAL TRUST
Notes to Financial Statements (continued) — June 30, 2023
The notional value of purchased and written options outstanding at June 30, 2023 and the month-end average notional amount for the period ended June 30, 2023 are detailed in the table below:
Purchased Option Contracts: | Outstanding | Monthly | ||||||
International Portfolio | $ | 5,574 | $ | 8,407 | ||||
Institutional International Portfolio | 46,961 | 58,152 | ||||||
Emerging Markets Portfolio | 17,746 | 15,641 | ||||||
U.S. Government Fixed Income Portfolio | — | 963 | ||||||
Written Option Contracts: | Outstanding | Monthly | ||||||
International Portfolio | $ | 20,448 | $ | 25,117 | ||||
Institutional International Portfolio | 168,253 | 165,774 | ||||||
Emerging Markets Portfolio | 68,295 | 48,376 | ||||||
U.S. Government Fixed Income Portfolio | 33,000 | 6,444 | ||||||
Swap Agreements: Certain of the Portfolios may enter into swap agreements (“swaps”) for purposes of attempting to gain exposure to the securities making up an index without actually purchasing those instruments, to hedge a position or to gain exposure to a particular instrument or currency. A swap is a two-party contract entered into for periods ranging from one day to more than one year. In a standard swap transaction, two parties agree to exchange the returns (or differentials in rates of return) earned or realized on particular predetermined investments or instruments. The gross returns to be exchanged or “swapped” between the parties are calculated with respect to a “notional amount,” i.e., the return on or increase in value of a particular dollar amount invested in a “basket” of securities representing a particular index. Swap agreements are privately negotiated in the over-the-counter (“OTC”) market and may be entered into as a bilateral contract (“OTC swaps”) or cleared through a third party, known as a clearing organization (“centrally cleared swap”). Swaps are marked to market daily based upon valuations as determined from the underlying contract or in accordance with the requirements of the clearing organization. Changes in market value, if any, are reflected as a component of net change in unrealized appreciation or depreciation on swap agreements on the Statement of Operations. Daily changes in valuation of centrally cleared swaps, if any, are recorded as variation margin on swap agreements on the Statement of Assets and Liabilities.
Total Return Swaps: Certain of the Portfolios may enter into total return swaps to gain or mitigate exposure to the underlying securities or indices. In “long” total return swaps, the counterparty will generally agree to pay the Portfolio the amount, if any, by which the notional amount of the swaps would have increased in value had it been invested in the particular instruments, plus an amount equal to any dividends or interest that would have been received on those instruments. The Portfolio will agree to pay to the counterparty an amount equal to a fixed or floating rate of interest on the notional amount of the swaps plus the amount, if any, by which the notional amount would have decreased in value had it been invested in such instruments plus, in certain instances, commissions or trading spreads on the notional amount. Total return swaps do not involve the delivery of securities or other underlying instruments. The net amount of the excess, if any, of a Portfolio’s obligations over its entitlements with respect to each swap is accrued on a daily basis and an amount of cash or liquid assets, having an aggregate value at least equal to such accrued excess, is maintained at the broker-dealer or the Portfolio’s custodian. Until a total return swap is settled in cash, the gain or loss on the notional amount plus dividends or interest on the instruments less the interest paid by the Portfolio on the notional amount is recorded as “change in unrealized appreciation/depreciation on swaps” and, when cash is exchanged, the gain or loss realized is recorded as “net realized gains/(losses) from swap transactions.” A Portfolio may enter into total return swaps that provide the opposite return of its benchmark index or security (“short” the index or security). Its operations are similar to those swaps disclosed above except that the counterparty pays interest to the Portfolio
299
HC CAPITAL TRUST
Notes to Financial Statements (continued) — June 30, 2023
on the notional amount outstanding and that dividends or interest on the underlying instruments reduce the value of the swaps plus, in certain instances, the Portfolio will agree to pay to the counterparty commissions or trading spreads on the notional amount. These amounts are netted against any unrealized appreciation or depreciation to determine the value of the swaps.
The primary risks associated with the use of swaps are an imperfect correlation between the prices of financial instruments and movements in the prices of the underlying investments and the inability of counterparties to perform under the agreement. The counterparty to any swap agreement will typically be a bank, investment banking firm or broker-dealer. The Portfolio will bear the counterparty risk, i.e., the risk of loss of the net amount, if any, expected to be received under a swap in the event of the default or bankruptcy of the swap counterparty. The counterparty risk for centrally cleared swap agreements is generally lower than for OTC swap agreements because generally a clearing organization becomes substituted for each counterparty to a centrally cleared swap agreement and, in effect, guarantees the parties’ performance under the contract as each party to a trade looks only to a clearing house for performance of financial obligations. However, there can be no assurance that the clearing house, or its members will satisfy obligations to the Portfolio. The unrealized gain or loss at June 30, 2023 is disclosed in the swap tables included in the Portfolios of Investments. The notional value of the swap agreements outstanding at June 30, 2023 and the month-end average notional amount for the period ended June 30, 2023 are detailed in the table below:
Total Return Swap Agreements: | Outstanding | Monthly | ||||||
Emerging Markets Portfolio | $ | 51,629 | $ | 53,450 | ||||
L. Securities Lending. Certain of the Portfolios may lend their portfolio securities to broker-dealers pursuant to a Master Securities Lending Agreement (“MSLA”) that requires the borrower to post collateral equal to at least the market value of the securities loaned, which is marked-to-market on a daily basis. Any collateral shortfalls associated with increases in the valuation of the securities loaned are adjusted the next business day. The Portfolios will continue to benefit from interest or dividends on the securities loaned and may also earn a return from the collateral. The Portfolios pay various fees in connection with the investment of the collateral. Any voting rights, or rights to consent, relating to securities loaned, pass to the borrower. Currently cash collateral received by a Portfolio in securities lending transactions may only be invested in repurchase agreements or money market funds that invest in U.S. treasury obligations. A Portfolio bears the risk of such investments. Securities on loan at June 30, 2023 are presented in the Portfolios of Investments. The Portfolios pay the Securities Lending Agent fees based on the investment income received from securities lending activities as reflected on the Statements of Operations.
Cash collateral received from the borrower is recorded on the Statements of Assets and Liabilities as “Payable for collateral received on loaned securities.” Investments acquired with such cash collateral are reported in a manner consistent with other portfolio investments held by the Portfolios as an investment, at value on the Statements of Assets and Liabilities. The Portfolios may receive non-cash collateral in the form of securities such as U.S. treasuries, which the Portfolios may not sell or re-pledge and accordingly are not reflected on the Statements of Assets and Liabilities.
Securities lending transactions are entered into by a Portfolio under a MSLA which permits the Portfolio, under certain circumstances, including an event of default (such as bankruptcy or insolvency), to offset amounts payable by the Portfolio to the same counterparty against amounts to be received and create a net payment due to or from the Portfolio.
300
HC CAPITAL TRUST
Notes to Financial Statements (continued) — June 30, 2023
The following table is a summary of the Portfolios’ securities lending transactions accounted for as secured borrowings, which are subject to offset under an MSLA, at June 30, 2023 (amounts in thousands):
Portfolio | Value of | Value of | Net Amount | |||||||||
Value Portfolio | $ | 549 | $ | 549 | $ | — | ||||||
Growth Portfolio | 475 | 475 | — | |||||||||
Institutional U.S. Portfolio | 1,232 | 1,232 | — | |||||||||
Small Cap-Mid Cap Portfolio | 1,050 | 1,050 | — | |||||||||
Catholic SRI Growth Portfolio | 2 | 2 | — | |||||||||
Institutional International Portfolio | 3,299 | 420 | 2,879 | |||||||||
Emerging Markets Portfolio | 886 | — | 886 | |||||||||
U.S. Corporate Fixed Income Portfolio | 3,727 | 3,727 | — | |||||||||
Amounts designated as “—” are $0 or have been round to $0.
* | The actual collateral received may be in excess of the amounts shown in the table. The table only reflects collateral amounts up to the amount of the value of securities on loan as disclosed in the Portfolios of Investments and excludes any non-cash collateral received with a value of (amounts in thousands) $3,060 and $932 for the Institutional International Portfolio and Emerging Markets, respectively. Any collateral shortfalls associated with increases in the valuation of the securities loaned are adjusted the next business day. |
Securities lending transactions as of June 30, 2023 (amounts in thousands):
Remaining Contractual Maturity | ||||||||
Portfolio | Overnight and Continuous | Total* | ||||||
Value Portfolio | $ | 560 | $ | 560 | ||||
Growth Portfolio | 485 | 485 | ||||||
Institutional U.S. Portfolio | 1,274 | 1,274 | ||||||
Small Cap-Mid Cap Portfolio | 1,086 | 1,086 | ||||||
Catholic SRI Growth Portfolio | 2 | 2 | ||||||
Institutional International Portfolio | 420 | 420 | ||||||
Emerging Markets Portfolio | — | — | ||||||
Corporate Opportunities | 1,177 | ** | 1,177 | |||||
U.S. Corporate Fixed Income Portfolio | 3,847 | 3,847 | ||||||
** | Represents collateral received from prior securities lending activity. |
M. Recent Accounting Pronouncements. Effective January 24, 2023, the SEC adopted rule and form amendments that require open-end management investment companies to transmit concise and visually engaging annual and semi-annual reports to shareholders that highlight key information. Other information, including financial statements, will no longer appear in a tailored shareholder report but must be available online, delivered free of charge upon request, and filed on a semi-annual basis on Form N-CSR. The rule and form amendments have a compliance date of July 24, 2024. Management is currently evaluating the effect of these amendments on the shareholder reports for the Portfolios.
3. INVESTMENT ADVISORY AND ADMINISTRATIVE CONTRACTS. The Trust has entered into investment advisory contracts (“Portfolio Management Contracts”) on behalf of each of the Portfolios with one or more investment management organizations (each, a “Specialist Manager”). For the Portfolio(s) it serves, each Specialist Manager is responsible for providing a continuous program of investment management for that portion of the Portfolio allocated to it and for placing all orders for
301
HC CAPITAL TRUST
Notes to Financial Statements (continued) — June 30, 2023
the purchase and sale of securities and other instruments for such portion of the Portfolio. Except as noted, each Specialist Manager earns a fee, accrued daily and paid either monthly or quarterly, based on average daily net assets of that portion of the Portfolio managed.
For the period ended June 30, 2023, the Portfolios incurred the following investment advisory fees, before any applicable fee waivers, with respect to the services of the indicated Specialist Manager(s) as reflected on the Statements of Operations as “Advisory fees.” The following annual fee rates are applied to the portions of the Portfolios that are managed by the Specialist Managers in determining amounts earned, except as footnoted.
Value Portfolio:
Specialist Manager | Amount | Fee | ||||||
Echo Street Capital Management, LLC | $ | — | 0.65 | %(a)(b) | ||||
Frontier Capital Management Company, LLC | — | 0.45 | %(b)(c) | |||||
Mellon Investments Corporation (Index Strategy) | — | 0.04 | %(b)(d) | |||||
Mellon Investments Corporation (Factor Strategy) | — | 0.065 | %(b)(d) | |||||
Parametric Portfolio Associates, LLC (Liquidity Strategy) | 12 | 0.35 | %(e) | |||||
Parametric Portfolio Associates, LLC (Targeted Strategy) | — | 0.05 | %(b)(f) | |||||
Parametric Portfolio Associates, LLC (Tax-Managed Custom Strategy) | 485 | 0.08 | %(g) | |||||
Parametric Portfolio Associates, LLC (Options Overlay Strategy) | — | 0.00 | %(h) | |||||
Total | $ | 497 | 0.08 | % | ||||
Growth Portfolio:
Specialist Manager | Amount | Fee | ||||||
Echo Street Capital Management LLC | $ | — | 0.65 | %(a)(b) | ||||
Jennison Associates, LLC | 449 | 0.29 | %(i) | |||||
Mellon Investments Corporation (Index Strategy) | — | 0.04 | %(b)(d) | |||||
Mellon Investments Corporation (Factor Strategy) | — | 0.065 | %(b)(d) | |||||
Parametric Portfolio Associates, LLC (Liquidity Strategy) | 12 | 0.33 | %(e) | |||||
Parametric Portfolio Associates, LLC (Targeted Strategy) | — | 0.05 | %(b)(f) | |||||
Parametric Portfolio Associates, LLC (Tax-Managed Custom Strategy) | 463 | 0.08 | %(g) | |||||
Parametric Portfolio Associates, LLC (Options Overlay Strategy) | — | 0.00 | %(h) | |||||
Total | $ | 924 | 0.13 | % | ||||
302
HC CAPITAL TRUST
Notes to Financial Statements (continued) — June 30, 2023
Institutional U.S. Portfolio:
Specialist Manager | Amount | Fee | ||||||
Echo Street Capital Management LLC | $ | 1,859 | 0.65 | %(a) | ||||
Frontier Capital Management Company, LLC | — | 0.45 | %(b)(c) | |||||
Jennison Associates, LLC | 231 | 0.29 | %(i) | |||||
Mellon Investments Corporation (Index Strategy) | 415 | 0.04 | %(d) | |||||
Mellon Investments Corporation (Factor Strategy) | 208 | 0.065 | %(d) | |||||
Parametric Portfolio Associates, LLC (Liquidity Strategy) | 384 | 0.06 | %(e) | |||||
Parametric Portfolio Associates, LLC (Targeted Strategy) | 59 | 0.06 | %(f) | |||||
Parametric Portfolio Associates, LLC (Options Overlay Strategy) | — | 0.00 | %(h) | |||||
RhumbLine Advisors LP | 8 | 0.04 | % | |||||
Wellington Management Company, LLP | 480 | 0.73 | %(j) | |||||
Total | $ | 3,644 | 0.14 | % | ||||
Small Cap-Mid Cap Portfolio:
Specialist Manager | Amount | Fee | ||||||
Frontier Capital Management Company, LLC | $ | — | 0.45 | %(b)(c) | ||||
Mellon Investments Corporation (Index Strategy) | — | 0.04 | %(b)(d) | |||||
Mellon Investments Corporation (Factor Strategy) | — | 0.065 | %(b)(d) | |||||
Parametric Portfolio Associates, LLC (Liquidity Strategy) | 11 | 0.47 | %(e) | |||||
Parametric Portfolio Associates, LLC (Targeted Strategy) | — | 0.05 | %(b)(f) | |||||
Parametric Portfolio Associates, LLC (Tax-Managed Custom Strategy) | 56 | 0.08 | %(g) | |||||
Total | $ | 67 | 0.09 | % | ||||
ESG Growth Portfolio:
Specialist Manager | Amount | Fee | ||||||
Agincourt Capital Management, LLC | $ | — | 0.12 | %(b) | ||||
Mellon Investments Corporation | 123 | 0.10 | % | |||||
Parametric Portfolio Associates, LLC (Liquidity Strategy) | 10 | 4.25 | %(e) | |||||
Parametric Portfolio Associates, LLC (Targeted Strategy) | — | 0.05 | %(b)(f) | |||||
RBC Global Asset Management (U.K.) Limited | 154 | 0.55 | %(k) | |||||
Total | $ | 287 | 0.19 | % | ||||
303
HC CAPITAL TRUST
Notes to Financial Statements (continued) — June 30, 2023
Catholic SRI Growth Portfolio:
Specialist Manager | Amount | Fee | ||||||
Agincourt Capital Management, LLC | $ | — | 0.12 | %(b) | ||||
Mellon Investments Corporation | 25 | 0.10 | % | |||||
Parametric Portfolio Associates, LLC (Liquidity Strategy) | — | 0.05 | %(b)(e) | |||||
Parametric Portfolio Associates, LLC (Targeted Strategy) | — | 0.05 | %(b)(f) | |||||
Total | $ | 25 | 0.10 | % | ||||
International Portfolio:
Specialist Manager | Amount | Fee | ||||||
City of London Investment Management Company, Limited | $ | — | 0.53 | %(b)(l) | ||||
Mellon Investments Corporation (Developed Markets Strategy) | — | 0.05 | %(b)(m) | |||||
Mellon Investments Corporation (Developed Factor Strategy) | — | 0.075 | %(b)(m) | |||||
Mellon Investments Corporation (Emerging Markets Strategy) | — | 0.13 | %(b)(m) | |||||
Parametric Portfolio Associates, LLC (Liquidity Strategy) | 17 | 0.15 | %(e) | |||||
Parametric Portfolio Associates, LLC (Targeted Strategy) | — | 0.05 | %(b)(f) | |||||
Parametric Portfolio Associates, LLC (Tax-Managed Custom Strategy) | 408 | 0.08 | %(g) | |||||
Parametric Portfolio Associates, LLC (Options Overlay Strategy) | 66 | 1.34 | %(h) | |||||
Total | $ | 491 | 0.09 | % | ||||
Institutional International Portfolio:
Specialist Manager | Amount | Fee | ||||||
City of London Investment Management Company, Limited | $ | 835 | 0.53 | %(l) | ||||
Mellon Investments Corporation (Developed Markets Strategy) | 189 | 0.05 | %(m) | |||||
Mellon Investments Corporation (Developed Factor Strategy) | 53 | 0.075 | %(m) | |||||
Mellon Investments Corporation (Emerging Markets Strategy) | — | 0.13 | %(b)(m) | |||||
Parametric Portfolio Associates, LLC (Liquidity Strategy) | 34 | 0.09 | %(e) | |||||
Parametric Portfolio Associates, LLC (Targeted Strategy) | 9 | 0.05 | %(f) | |||||
Parametric Portfolio Associates, LLC (Options Overlay Strategy) | 66 | 0.94 | %(h) | |||||
RhumbLine Advisors LP | — | 0.05 | %(b) | |||||
Total | $ | 1,186 | 0.18 | % | ||||
304
HC CAPITAL TRUST
Notes to Financial Statements (continued) — June 30, 2023
Emerging Markets Portfolio:
Specialist Manager | Amount | Fee | ||||||
City of London Investment Management Company, Limited | $ | — | 1.00 | %(b)(n) | ||||
Mellon Investments Corporation | 785 | 0.13 | %(m) | |||||
Parametric Portfolio Associates, LLC (Liquidity Strategy) | 38 | 0.08 | %(e) | |||||
Parametric Portfolio Associates, LLC (Targeted Strategy) | — | 0.05 | %(b)(f) | |||||
Parametric Portfolio Associates, LLC (Tax-Managed Custom Strategy) | — | 0.08 | %(b)(g) | |||||
Parametric Portfolio Associates, LLC (Options Overlay Strategy) | 66 | 0.75 | %(h) | |||||
XY Investments (HK) Limited | 533 | 1.00 | %(o) | |||||
Total | $ | 1,422 | 0.20 | % | ||||
Core Fixed Income Portfolio:
Specialist Manager | Amount | Fee | ||||||
Agincourt Capital Management, LLC | $ | 11 | 0.08 | % | ||||
Mellon Investments Corporation (U.S. Government, Mortgage and Asset Backed Strategy) | 18 | 0.06 | % | |||||
Mellon Investments Corporation (Corporate Strategy) | — | 0.15 | %(b) | |||||
Parametric Portfolio Associates, LLC (Options Overlay Strategy) | 45 | 0.29 | %(p) | |||||
Total | $ | 74 | 0.11 | % | ||||
Corporate Opportunities Portfolio:
Specialist Manager | Amount | Fee | ||||||
City of London Investment Management Company, Limited | $ | 221 | 0.45 | % | ||||
Fort Washington Investment Advisors, Inc. | — | 0.20 | %(b)(q) | |||||
MacKay Shields, LLC | — | 0.40 | %(b)(r) | |||||
Mellon Investments Corporation | — | 0.25 | %(b) | |||||
Parametric Portfolio Associates, LLC (Liquidity Strategy) | 122 | 0.07 | %(e) | |||||
Parametric Portfolio Associates, LLC (Targeted Strategy) | — | 0.05 | %(b)(f) | |||||
Parametric Portfolio Associates, LLC (Options Overlay Strategy) | — | N/A | (b)(p) | |||||
Total | $ | 343 | 0.14 | % | ||||
305
HC CAPITAL TRUST
Notes to Financial Statements (continued) — June 30, 2023
U.S. Government Fixed Income Portfolio:
Specialist Manager | Amount | Fee | ||||||
Mellon Investments Corporation | $ | 274 | 0.06 | % | ||||
Parametric Portfolio Associates, LLC (Options Overlay Strategy) | 54 | 0.01 | %(p) | |||||
| $ | 328 | 0.04 | % | |||||
U.S. Corporate Fixed Income Portfolio:
Specialist Manager | Amount | Fee | ||||||
Agincourt Capital Management, LLC | $ | 178 | 0.08 | % | ||||
Mellon Investments Corporation | — | 0.15 | %(b) | |||||
Parametric Portfolio Associates, LLC (Options Overlay Strategy) | 37 | 1.10 | %(p) | |||||
Total | $ | 215 | 0.08 | % | ||||
U.S. Mortgage/Asset Backed Fixed Income Portfolio:
Specialist Manager | Amount | Fee | ||||||
Mellon Investments Corporation | $ | 116 | 0.06 | % | ||||
Parametric Portfolio Associates, LLC (Options Overlay Strategy) | — | N/A | (b)(p) | |||||
| $ | 116 | 0.06 | % | |||||
Short-Term Municipal Portfolio:
Specialist Manager | Amount | Fee | ||||||
Breckinridge Capital Advisors, Inc. | $ | 117 | 0.125 | % | ||||
Intermediate Municipal Portfolio:
Specialist Manager | Amount | Fee | ||||||
Breckinridge Capital Advisors, Inc. | $ | 1 | 0.125 | % | ||||
City of London Investment Management Company, Limited | 1 | 0.45 | % | |||||
Insight North America LLC | 611 | 0.16 | %(s) | |||||
Parametric Portfolio Associates, LLC (Options Overlay Strategy) | — | N/A | (b)(p) | |||||
Total | $ | 613 | 0.16 | % | ||||
306
HC CAPITAL TRUST
Notes to Financial Statements (continued) — June 30, 2023
Amounts designated as “—” are $0 or have been rounded to $0.
(a) | Echo Street Capital Management LLC (“Echo Street”) receives a fee based on the average daily net assets, payable quarterly, of that portion of assets managed by Echo Street, at the annual rate of 0.85% of the first $50 million of Combined Assets (as defined below); 0.70% of the next $50 million of Combined Assets; 0.60% of the next $100 million of Combined Assets; and 0.55% of Combined Assets in excess of $200 million. |
“Combined Assets” shall mean the sum of: the net assets of each portion of the Value Portfolio, Growth Portfolio, and Institutional U.S. Portfolio allocated to Echo Street. |
(b) | Specialist Manager approved by the Board but a strategy to which no assets were allocated during the year ended June 30, 2023. |
(c) | Frontier Capital Management Company, LLC (“Frontier”) received a fee based on the average daily net assets of that portion of assets managed by Frontier, at an annual rate of 0.45% on the first $90 million of Combined Assets and 0.75% of Combined Assets exceeding $90 million. |
Frontier’s Portfolio Management Agreement was terminated on August 23, 2022. |
(d) | For assets allocated to an Index Strategy, for so long as the Combined Assets (as defined below) are greater than $2 billion, Mellon Investments Corporation (“Mellon”) receives a fee at the annual rate of 0.04% of the average daily net assets of the Account. If the Combined Assets are reduced to $2 billion or less due to withdrawals or redemptions, beginning with the start of the first calendar year following the date on which such withdrawals or redemptions reduced such Combined Assets to $2 billion or less, the fee shall be calculated based on average daily net assets of the Account at annual rate of 0.065%. Index Strategy shall mean a portfolio wherein the Portfolio Manager seeks to approximate, over the long term, the performance of a specific market index. |
For assets allocated to a Factor Strategy, for so long as the Combined Assets are greater than $2 billion, the fee shall be at the annual rate of 0.065% of the average daily net assets of the Account. If the Combined Assets are reduced to $2 billion or less due to withdrawals or redemptions, beginning with the start of the first calendar year following the date on which such withdrawal or redemption reduced such Combined Assets to $2 billion or less, the fee shall be calculated based on average daily net assets of the Account at annual rate of 0.075%. Factor Strategy shall mean a portfolio wherein the Portfolio Manager seeks to implement a strategy developed by Hirtle Callaghan & Co. or an affiliate with the objective of obtaining exposure to one or more factors such as value or quality within the U.S. equity markets. |
“Combined Assets” shall mean the sum of: the net assets managed by Mellon in the Value Portfolio, Growth Portfolio, Institutional U.S. Portfolio, Small Cap-Mid Cap Portfolio, International Portfolio, Institutional International Portfolio, Emerging Markets Portfolio, and the net assets managed by Mellon using these strategies in other investment advisory accounts for which HC Capital Solutions serves as investment adviser. |
(e) | With respect to its Liquidity Strategy, Parametric Portfolio Associates, LLC (“Parametric”), a part of the asset management division of Morgan Stanley Investment Management, receives a fee, which shall be calculated daily and payable monthly in arrears, at an annual rate of 0.15% of the first $50 million of the Combined Liquidity Assets (as defined below); 0.10% of the next $100 million of Combined Liquidity Assets; and 0.05% of Combined Liquidity Assets over $150 million. Parametric is also entitled to receive a flat fee of $10,000 per year for each Portfolio. One Twelfth of the flat fee with respect to any given Portfolio will be waived with respect to each calendar month during which no Portfolio assets were allocated to the Liquidity Strategy in that Portfolio. |
“Combined Liquidity Assets” shall mean the sum of: the net assets of that portion of each Portfolio managed by Parametric for investment in its Liquidity Strategy. |
(f) | With respect to its Targeted Strategy, Parametric receives a fee, which shall be calculated daily and payable in arrears at the rate of 0.05%. Parametric is also entitled to receive a flat fee of $5,000 per year for each Portfolio, provided that such fee will be waived with respect to each calendar year during which no Portfolio assets were allocated to the Targeted Strategy in that Portfolio. |
(g) | With respect to its Tax-Managed Custom Strategy, Parametric receives a fee, which shall be calculated daily and payable in arrears at the annual rate of 0.10% of the first $250 million of the Combined Tax-Managed Custom Strategy Assets (as defined below); 0.09% of the next $250 million of the Combined Tax-Managed Custom Strategy Assets; 0.08% of the next $500 million of the Combined Tax-Managed Custom Strategy Assets; and 0.07% of the Combined Tax-Managed Custom Strategy Assets over $1 billion. |
“Combined Tax-Managed Custom Strategy Assets” shall mean the sum of: the net assets of that portion of each of the other Portfolios of the Trust allocated to Parametric from time to time for investment in their Tax-Management Custom Core Strategy. |
(h) | With respect to its Options Overlay Strategy, Parametric receives a fee, which shall be calculated daily and payable in arrears, of $5,500 per calendar month for each Portfolio, provided that such fee will be waived with respect to each calendar month during which no Portfolio assets were allocated to the Options Overlay Strategy in that Portfolio. |
307
HC CAPITAL TRUST
Notes to Financial Statements (continued) — June 30, 2023
(i) | Jennison Associates LLC (“Jennison”) is entitled to receive an annual fee of no more than 0.30% of average daily net assets of that portion of the Growth Portfolio and Institutional U.S. Portfolio allocated to Jennison (the “Jennison Accounts”). While the rate at which Jennison’s fee for managing the Portfolios will not exceed 0.30%, the fee may decrease based on the aggregate market value of the Jennison Accounts and certain other assets managed by Jennison (which may pay fees exceeding 0.30%) for the benefit of certain investors who are clients of the Trust’s primary adviser at the following annual rates: |
— 0.75% on the first $10 million;
— 0.50% on the next $30 million;
— 0.35% on the next $25 million;
— 0.25% on the next $335 million;
— 0.22% on the next $600 million;
— 0.20% on the next $4 billion; and
— 0.25% on the balance
(j) | Wellington Management Company, LLP (“Wellington”) receives a fee, which shall be payable monthly in arrears of 0.75% of the average daily net assets of the first $50 million of the Combined Assets (as defined below). On Combined Assets over $50 million, the fee shall be at the annual rate of 0.65% of the Combined Assets. |
“Combined Assets” shall mean the sum of: the net assets of the Institutional U.S. Portfolio and assets in the same investment strategy as the Portfolio that are managed by Wellington for certain other clients of the Trust’s primary adviser. |
(k) | RBC Global Asset Management (U.K.) Limited (“RBC”) receives a fee based on the average daily net assets, payable monthly, of that portion of assets managed by RBC, at the annual rate of 0.55% of the first $50 million; 0.50% of the next $50 million; and 0.45% exceeding $100 million. |
(l) | City of London Investment Management Company, Limited (“CLIM”) receives a fee, which shall be calculated daily and payable monthly in arrears at the annual rate of 0.80% of the first $50 million of the Combined Assets (as defined below) and 0.40% of the Combined assets exceeding $50 million. |
“Combined Assets” shall mean the sum of: the average daily net assets managed by CLIM in the International Portfolio and the Institutional International Portfolio; and the net assets invested in the same strategy as the Portfolios that are managed by CLIM for certain other clients of the Trust’s primary adviser. |
(m) | For its services to the International Portfolio and the Institutional International Portfolio, Mellon receives differing fees from each Portfolio with respect to each of Mellon’s Developed Index Strategy, Developed Factor Strategy, and Emerging Markets Strategy calculated based on the average daily net assets of that portion of the assets of the Portfolio managed by it. |
For assets allocated to a Developed Index Strategy (the “Index Account”), for so long as the Combined Assets (as defined below) are greater than $2 billion, the fee shall be at the annual rate of 0.05% of the average daily net assets of the Index Account. If the Combined Assets are reduced to $2 billion or less due to withdrawals or redemptions, beginning with the start of the first calendar year following the date on which such withdrawal or redemption reduced such Combined Assets to $2 billion or less, the fee shall be calculated based on average daily net assets of the Index Account at an annual rate of 0.06%. |
For assets allocated to a Developed Factor Strategy (the “Factor Account”), for so long as the Combined Assets (as defined below) are greater than $2 billion, the fee shall be at the annual rate of 0.075% of the average daily net assets of the Factor Account. If the Combined Assets are reduced to $2 billion or less due to withdrawals or redemptions, beginning with the start of the first calendar year following the date on which such withdrawal or redemptions reduced such Combined Assets to $2 billion or less, the fee shall be calculated based on average daily net assets of the Account at an annual rate of 0.085%. |
For assets allocated to an Emerging Markets Strategy (the “EM Account”), for so long as the aggregate assets allocated to Mellon for all of its passive equity mandates (including accounts for other clients of the Advisor and certain of its affiliates besides the Trust) exceed $2 billion, the fee shall be at the annual rate of 0.13% of the average daily net assets of the EM Account. Should these aggregate assets fall below $2 billion; the fee will be calculated at an annual rate of 0.15% for those assets allocated to emerging markets strategies. |
The term “Combined Assets” means the sum of: (i) the net assets of the Value Portfolio, Growth Portfolio, Institutional U.S. Portfolio, Small Cap-Mid- Cap Portfolio, International Portfolio, Institutional International Portfolio and the Emerging Markets Portfolio of the Trust (“collectively the “Trust Portfolios”) managed by the Mellon; and (ii) the net assets of each other investment advisory account for which HC Capital Solutions or one of its affiliates serves as investment adviser and for which Mellon provides portfolio management services using the strategies employed in Trust Portfolios. |
308
HC CAPITAL TRUST
Notes to Financial Statements (continued) — June 30, 2023
(n) | CLIM receives a fee, which shall be calculated daily and payable quarterly in arrears at the annual rate of 1.00% of the first $100 million of the Combined Assets (as defined below); 0.80% of the next $100 million of Combined Assets; and 0.50% of Combined Assets exceeding $200 million. |
“Combined Assets” shall mean the sum of: the average daily net assets managed by CLIM in the Portfolio and the net assets invested in the same strategy as the Portfolio that are managed by CLIM for certain other clients of the Trust’s primary adviser. |
(o) | XY Investments (HK) Limited receives a fee, which shall be payable monthly in arrears at the annual rate of 1.00% of the average daily net assets of the Account. The annual rate shall be reduced to 0.90% once the assets under management with respect to the Portfolio Manager’s and its affiliates Offshore Strategy (as defined below) exceeds $2 billion. |
“Offshore Strategy” shall mean any vehicle, fund, account or other product utilizing a quantitative enhanced index investment strategy of investing in a China A-share market, but excluding any vehicle, fund, account or product dedicated solely to the Portfolio Manager’s Shanghai business. |
(p) | With respect to its Options Overlay Strategy, Parametric receives a fee, which shall be calculated daily and payable in arrears, of $4,500 per calendar month for each Portfolio, provided that such fee will be waived with respect to the calendar month during which no Portfolio assets were allocated to the Options Overlay Strategy in that Portfolio. |
(q) | Fort Washington Investment Advisors, Inc. (“Fort Washington”) receives a fee, which shall be payable quarterly in arrears. For so long as the Combined Assets (as defined below) are greater than $200 million, the fee shall be at the annual rate of 0.20% of the Combined Assets. If the Combined Assets are reduced to $200 million or less due to withdrawals or redemptions, beginning with the first calendar quarter following the date of such withdrawals or redemptions, the fee shall be based on 0.40% of the first $25 million of the Combined Assets, 0.375% of the next $25 million of the Combined Assets, 0.3375% of the next $50 million of the Combined Assets, 0.25% of the next $100 million of the Combined Assets, and 0.20% exceeding $200 million. |
“Combined Assets” shall mean the sum of: the net assets managed by Fort Washington in the Portfolio and the net assets invested in the same strategy as the Portfolio that are managed by Fort Washington for the benefit of certain investors who are clients of the Trust’s primary adviser. |
Fort Washington’s Portfolio Management Agreement expired on March 31, 2023. |
(r) | MacKay Shields, LLC receives a fee which shall be payable monthly in arrears at the annual rate on 0.40% on the first $100 million of the average daily net assets of the Account and 0.35% on daily average net assets over $100 million. |
(s) | Insight North America LLC (“Insight”) receives a fee, which shall be calculated daily and payable quarterly, at an annual rate of 0.25% for the first $100 million of the Combined Assets (as defined below); and 0.15% of the Combined Assets exceeding $100 million. Insight is entitled to receive a fee at an annual rate not to exceed 0.20% of the Combined Assets. |
“Combined Assets” shall mean the sum of: the net assets managed by Insight in the Portfolio and the net assets invested in the same strategy as the Portfolio that are managed by Insight for the benefit of certain investors who are clients of the Trust’s primary adviser. |
Pursuant to discretionary investment advisory agreements between the Trust and the Adviser, the Adviser is paid a fee which is accrued daily and paid monthly at an annual rate of 0.05% of average daily net assets per Portfolio. The fees that the Adviser receives are listed as “Management fees” on the Statements of Operations. The Adviser continuously monitors the performance of various investment management organizations, including the Specialist Managers retained by the Trust, and generally oversees the services provided to the Trust by its administrator, custodian and other service providers. The Adviser is also authorized to allocate and reallocate assets among Specialist Managers in multi-manager portfolios of the Trust from time to time without additional authorization of the Board. In addition, the Adviser makes its officers available to serve as officers and/or Trustees of the Trust, and maintains office space sufficient for the Trust’s principal office. The Securities and Exchange Commission has issued an order that permits the Trust to enter into portfolio management agreements with Specialist Managers upon the approval of the Board but without submitting such contracts for the approval of the shareholders of the relevant Portfolio under certain circumstances.
Citi Fund Services Ohio, Inc. (“Citi”) provides the Portfolios with administrative and fund accounting services. The fees for these services are disclosed as “Administrative service fees” on the Statements of Operations. The fees are accrued daily and payable on a monthly basis at an annual rate of 0.0506% of the Trust’s Portfolios’ average daily net assets up to $6 billion; 0.0047% of the Trust’s Portfolios’ average daily net assets between $6 billion and $12 billion; and 0.0276% of average daily net assets in excess of $12 billion. Citi receives additional fees paid by the Trust for compliance services, regulatory reporting services and reimbursement of certain expenses.
309
HC CAPITAL TRUST
Notes to Financial Statements (continued) — June 30, 2023
FIS Investor Services LLC, a wholly-owned subsidiary of Fidelity National Information Services, provides dividend and capital gains disbursing agent and transfer agency services. The fees for these services are disclosed as “Transfer agency fees” on the Statements of Operations. The fees are accrued daily and payable on a monthly basis at an annual rate of 0.0034% of the Trust’s Portfolios’ average daily net assets up to $6 billion; 0.0003% of the Trust’s Portfolios’ average daily net assets between $6 billion and $12 billion; and 0.0019% of average daily net assets in excess of $12 billion.
The Trust has adopted a Distribution Plan for the HC Advisors Shares under which the Adviser may receive compensation for distribution services. Under the Distribution Plan, which was adopted pursuant to Rule 12b-1 under the 1940 Act, the Adviser is entitled to receive a fee of up to 0.25% annually of the average daily net assets attributable to the HC Advisors Shares. The Adviser has voluntarily waived all fees associated with the Distribution Plan through June 30, 2023 and there is no current intention to collect such a fee in the future.
Ultimus Fund Distributors, LLC (“Ultimus”) provides certain distribution services to the Trust. Ultimus receives an annual fee of $50,000 for performing the services listed under its agreement with the Trust. None of Ultimus’ duties under its agreement are primarily intended to result in the sale of Trust shares.
Foreside Fund Officer Services LLC (dba ACA Group) provides CCO services to the Trust pursuant to a Compliance Services Agreement assigned to Foreside effective December 7, 2021 by Alaric Compliance Services LLC (“Alaric”) following Foreside Financial Group, LLC’s acquisition of Alaric. Through June 30, 2023 the Trust paid an annual fee of $164,000 for such services.
4. PURCHASE AND SALE TRANSACTIONS. The aggregate cost of purchases and proceeds from sales of investment securities, other than long-term U.S. government securities, TBA securities and short-term securities and purchases and sales associated with in-kind transactions, for the period ended June 30, 2023 were as follows (amounts in thousands). Any realized gains or losses from in-kind redemptions are reflected on the Statements of Operations as net realized gains/(losses) from in-kind redemptions.
Excluding U.S. Government | Associated with In- | |||||||||||||||
Portfolio | Purchases | Sales | Purchases | Sales | ||||||||||||
Value Portfolio | $ | 28,433 | $ | 38,660 | $ | — | $ | 2,228 | ||||||||
Growth Portfolio | 81,821 | 89,907 | — | 8,756 | ||||||||||||
Institutional U.S. Portfolio | 1,059,085 | 746,046 | — | — | ||||||||||||
Small Cap-Mid Cap Portfolio | 58,368 | 56,938 | — | — | ||||||||||||
ESG Growth Portfolio | 18,420 | 18,056 | — | — | ||||||||||||
Catholic SRI Growth Portfolio | 4,997 | 2,760 | — | — | ||||||||||||
International Portfolio | 39,573 | 96,219 | — | — | ||||||||||||
Institutional International Portfolio | 155,188 | 375,613 | — | — | ||||||||||||
Emerging Markets Portfolio | 36,567 | 43,873 | — | — | ||||||||||||
Core Fixed Income Portfolio | 25,838 | 17,195 | — | — | ||||||||||||
Corporate Opportunities Portfolio | 75,809 | 41,296 | — | — | ||||||||||||
U.S. Government Fixed Income Portfolio | 506,775 | 158,168 | — | — | ||||||||||||
U.S. Corporate Fixed Income Portfolio | 127,034 | 91,266 | — | — | ||||||||||||
U.S. Mortgage/Asset Backed Fixed Income Portfolio | 2,359 | 2,120 | — | — | ||||||||||||
Short-Term Municipal Portfolio | 26,622 | 92,308 | — | — | ||||||||||||
Intermediate Municipal Portfolio | 153,136 | 92,236 | — | — | ||||||||||||
310
HC CAPITAL TRUST
Notes to Financial Statements (continued) — June 30, 2023
The aggregate cost of purchases and proceeds from sales of long-term U.S. government securities for the period ended June 30, 2023 were as follows (amounts in thousands):
Portfolio | Purchases | Sales | ||||||
Core Fixed Income Portfolio | $ | 13,890 | $ | 8,994 | ||||
U.S. Government Fixed Income Portfolio | 218,343 | 246,456 | ||||||
U.S. Mortgage/Asset Backed Fixed Income Portfolio | 24,809 | 19,108 | ||||||
5. FEDERAL INCOME TAXES. It is the policy of each Portfolio to continue to qualify as a regulated investment company by complying with the provisions available to certain investment companies, as defined in applicable sections of the Internal Revenue Code (the “Code”), and to make distributions of net investment income and net realized capital gains sufficient to relieve it (but not the shareholders) from all, or substantially all, federal income taxes. The Portfolios may, under certain circumstances, utilize equalization accounting for tax purposes by designating earnings and profits, including net realized gains distributed to shareholders on redemption of shares, as a part of the dividends paid deduction for income tax purposes.
The Trust has evaluated tax positions taken or expected to be taken in the course of preparing each Portfolio’s tax returns to determine whether it is more likely than not (i.e., greater than 50-percent chance) that each tax position will be sustained upon examination by a tax authority based on the technical merits of the position. A tax position that meets the more- likely-than-not recognition threshold is measured to determine the amount of benefit to recognize in the financial statements. Differences between tax positions taken in a tax return and amounts recognized in the financial statements will generally result in an increase in a liability for taxes payable (or a reduction of a tax refund receivable), including the recognition of any related interest and penalties as an operating expense. Tax positions taken in tax years remain subject to examination by tax authorities (generally the last three tax year ends 2020 to 2022 and the interim tax period since then). The determination has been made that there are no uncertain tax positions that would require the Portfolios to record a tax liability and, therefore, there is no impact to the Portfolios’ financial statements. Furthermore, management of the Portfolios is not aware of any tax position for which it is reasonably possible that the total amounts of unrecognized tax benefits will significantly change in the next 12 months
A. As of the latest tax year ended June 30, 2023, the cost basis of investments for federal income tax purposes, gross unrealized appreciation, gross unrealized depreciation, and net unrealized appreciation/depreciation were as follows (amounts in thousands):
Portfolio | Tax Cost of | Tax Unrealized | Tax Unrealized | Unrealized | ||||||||||||
Value Portfolio | $ | 287,094 | $ | 380,105 | $ | (1,138 | ) | $ | 378,967 | |||||||
Growth Portfolio | 242,936 | 566,351 | (3,344 | ) | 563,007 | |||||||||||
Institutional U.S. Portfolio | 1,713,797 | 800,291 | (63,598 | ) | 736,693 | |||||||||||
Small Cap-Mid Cap Portfolio | 43,663 | 33,305 | (745 | ) | 32,560 | |||||||||||
ESG Growth Portfolio | 120,377 | 52,334 | (9,398 | ) | 42,936 | |||||||||||
Catholic SRI Growth Portfolio | 19,763 | 10,505 | (1,305 | ) | 9,200 | |||||||||||
International Portfolio | 331,345 | 215,805 | (12,327 | ) | 203,478 | |||||||||||
Institutional International Portfolio | 701,648 | 127,021 | (69,086 | ) | 57,935 | |||||||||||
Emerging Markets Portfolio | 673,506 | 146,010 | (120,283 | ) | 25,727 | |||||||||||
Core Fixed Income Portfolio | 76,960 | 15 | (5,000 | ) | (4,985 | ) | ||||||||||
Corporate Opportunities Portfolio | 217,036 | 493 | (1,178 | ) | (685 | ) | ||||||||||
U.S. Government Fixed Income Portfolio | 973,191 | 100 | (55,389 | ) | (55,289 | ) | ||||||||||
U.S. Corporate Fixed Income Portfolio | 292,269 | 1,052 | (25,918 | ) | (24,866 | ) | ||||||||||
U.S. Mortgage/Asset Backed Fixed Income Portfolio | 256,301 | 67 | (23,541 | ) | (23,474 | ) | ||||||||||
Short-Term Municipal Portfolio | 69,712 | 150 | (1,271 | ) | (1,121 | ) | ||||||||||
Intermediate Municipal Portfolio | 491,782 | 1,436 | (16,797 | ) | (15,361 | ) | ||||||||||
Amounts designated as “—” are $0 or have been rounded to $0.
311
HC CAPITAL TRUST
Notes to Financial Statements (continued) — June 30, 2023
The tax cost of investments includes the cost of securities, proceeds received from TBA sales commitments and any upfront premiums paid or received on derivatives, as applicable. The tax unrealized appreciation/depreciation amounts include securities, TBA sales commitments and derivatives that are not considered realized for tax purposes, as applicable.
The differences between book-basis and tax-basis unrealized appreciation/depreciation are attributable primarily to: tax deferral of losses on wash sales, the realization for tax purposes of unrealized gains/losses on investments in passive foreign investment companies, the difference between book and tax accretion methods for market discount, derivatives, and in-kind purchases by investors that, for tax purposes, created a controlling interest in a Portfolio.
B. Tax Characteristics of Distributions Paid
The tax characteristics of distributions paid during the fiscal years ended June 30, 2023 and June 30, 2022, respectively, were as follows (amounts in thousands):
Distributions Paid From: | ||||||||||||||||||||||||
Year Ended June 30, 2023 | Ordinary | Net Long | Total Taxable | Tax-Exempt | Tax Return | Total | ||||||||||||||||||
Value Portfolio | $ | 9,118 | $ | 2,531 | $ | 11,649 | $ | — | $ | — | $ | 11,649 | ||||||||||||
Growth Portfolio | 8,389 | 45,036 | 53,425 | — | — | 53,425 | ||||||||||||||||||
Institutional U.S. Portfolio | 43,136 | 116,175 | 159,311 | — | — | 159,311 | ||||||||||||||||||
Small Cap-Mid Cap Portfolio | 965 | 19 | 984 | — | 8 | 992 | ||||||||||||||||||
ESG Growth Portfolio | 2,350 | 54 | 2,404 | — | — | 2,404 | ||||||||||||||||||
Catholic SRI Growth Portfolio | 440 | 208 | 648 | — | — | 648 | ||||||||||||||||||
International Portfolio | 13,334 | — | 13,334 | — | — | 13,334 | ||||||||||||||||||
Institutional International Portfolio | 10,005 | 423 | 10,428 | — | 6,505 | 16,933 | ||||||||||||||||||
Emerging Markets Portfolio | 13,347 | — | 13,347 | — | — | 13,347 | ||||||||||||||||||
Core Fixed Income Portfolio | 2,209 | — | 2,209 | — | — | 2,209 | ||||||||||||||||||
Corporate Opportunities Portfolio | 10,121 | — | 10,121 | — | — | 10,121 | ||||||||||||||||||
U.S. Government Fixed Income Portfolio | 32,985 | 11 | 32,996 | — | — | 32,996 | ||||||||||||||||||
U.S. Corporate Fixed Income Portfolio | 9,227 | — | 9,227 | — | — | 9,227 | ||||||||||||||||||
U.S. Mortgage/Asset Backed Fixed Income Portfolio | 6,160 | — | 6,160 | — | — | 6,160 | ||||||||||||||||||
Short-Term Municipal Portfolio | 74 | — | 74 | 1,388 | — | 1,462 | ||||||||||||||||||
Intermediate Municipal Portfolio | 293 | — | 293 | 7,112 | — | 7,405 | ||||||||||||||||||
Distributions Paid From: | ||||||||||||||||||||
Year Ended June 30, 2022 | Ordinary | Net Long | Total Taxable | Tax-Exempt | Total | |||||||||||||||
Value Portfolio | $ | 7,920 | $ | 3,702 | $ | 11,622 | $ | — | $ | 11,622 | ||||||||||
Growth Portfolio | 11,760 | 68,421 | 80,181 | — | 80,181 | |||||||||||||||
Institutional U.S. Portfolio | 151,089 | 420,019 | 571,108 | — | 571,108 | |||||||||||||||
Small Cap-Mid Cap Portfolio | 306 | 6,243 | 6,549 | — | 6,549 | |||||||||||||||
ESG Growth Portfolio | 3,983 | 4,129 | 8,112 | — | 8,112 | |||||||||||||||
Catholic SRI Growth Portfolio | 525 | 10,067 | 10,592 | — | 10,592 | |||||||||||||||
International Portfolio | 24,441 | — | 24,441 | — | 24,441 | |||||||||||||||
Institutional International Portfolio | 73,315 | 43,751 | 117,066 | — | 117,066 | |||||||||||||||
Emerging Markets Portfolio | 17,632 | — | 17,632 | — | 17,632 | |||||||||||||||
Core Fixed Income Portfolio | 1,238 | 588 | 1,826 | — | 1,826 | |||||||||||||||
Corporate Opportunities Portfolio | 21,358 | 9,479 | 30,837 | — | 30,837 | |||||||||||||||
U.S. Government Fixed Income Portfolio | 4,982 | 1,533 | 6,515 | — | 6,515 | |||||||||||||||
U.S. Corporate Fixed Income Portfolio | 8,108 | 10,005 | 18,113 | — | 18,113 | |||||||||||||||
U.S. Mortgage/Asset Backed Fixed Income Portfolio | 4,032 | — | 4,032 | — | 4,032 | |||||||||||||||
312
HC CAPITAL TRUST
Notes to Financial Statements (continued) — June 30, 2023
Distributions Paid From: | ||||||||||||||||||||
Year Ended June 30, 2022 | Ordinary | Net Long | Total Taxable | Tax-Exempt | Total | |||||||||||||||
Short-Term Municipal Portfolio | $ | 82 | $ | 38 | $ | 120 | $ | 1,108 | $ | 1,228 | ||||||||||
Intermediate Municipal Portfolio | 13 | 653 | 666 | 5,810 | 6,476 | |||||||||||||||
Amounts designated as “—” are $0 or have been rounded to $0.
* | Total distributions paid may differ from what appears on the Statements of Changes in Net Assets because dividends for tax purposes are recognized when actually paid. |
C. Components of Accumulated Earnings
As of their tax year ended June 30, 2023, the components of accumulated earnings/(deficit) on a tax basis were as follows (amounts in thousands):
Portfolio | Undistributed | Undistributed | Accumulated | Distributions | Accumulated | Unrealized | Total | |||||||||||||||||||||
Value Portfolio | $ | 102 | $ | 1,591 | $ | 1,693 | $ | — | $ | (19,429 | )(a) | $ | 378,967 | $ | 361,231 | |||||||||||||
Growth Portfolio | 23 | 6,934 | 6,957 | — | (30,992 | )(a) | 563,007 | 538,972 | ||||||||||||||||||||
Institutional U.S. Portfolio | 21,683 | 79,411 | 101,094 | — | (267,607 | )(a) | 736,695 | 570,182 | ||||||||||||||||||||
Small Cap-Mid Cap Portfolio | — | — | — | — | (2,517 | ) | 32,559 | 30,042 | ||||||||||||||||||||
ESG Growth Portfolio | 35 | — | 35 | — | (896 | ) | 42,936 | 42,075 | ||||||||||||||||||||
Catholic SRI Growth Portfolio | 22 | — | 22 | — | (175 | ) | 9,200 | 9,047 | ||||||||||||||||||||
International Portfolio | 2,437 | — | 2,437 | — | (85,875 | )(a) | 203,678 | 120,240 | ||||||||||||||||||||
Institutional International Portfolio | — | — | — | — | — | 57,884 | 57,884 | |||||||||||||||||||||
Emerging Markets Portfolio | 11,594 | — | 11,594 | — | (88,016 | ) | 22,490 | (53,932 | ) | |||||||||||||||||||
Core Fixed Income Portfolio | 28 | — | 28 | — | (3,436 | ) | (4,985 | ) | (8,393 | ) | ||||||||||||||||||
Corporate Opportunities Portfolio | 804 | — | 804 | — | (24,580 | ) | (685 | ) | (24,461 | ) | ||||||||||||||||||
U.S. Government Fixed Income Portfolio | 459 | — | 459 | (288 | ) | (12,874 | ) | (55,289 | ) | (67,992 | ) | |||||||||||||||||
U.S. Corporate Fixed Income Portfolio | 378 | — | 378 | (248 | ) | (7,788 | ) | (24,866 | ) | (32,524 | ) | |||||||||||||||||
U.S. Mortgage/Asset Backed Fixed Income Portfolio | 274 | — | 274 | (173 | ) | (17,069 | ) | (23,472 | ) | (40,440 | ) | |||||||||||||||||
Short-Term Municipal Portfolio | 4 | — | 4 | (10 | ) | (4,065 | ) | (1,121 | ) | (5,192 | ) | |||||||||||||||||
Intermediate Municipal Portfolio | 193 | — | 193 | (60 | ) | (7,799 | ) | (15,361 | ) | (23,027 | ) | |||||||||||||||||
Amounts designated as “—” are $0 or have been rounded to $0.
* | Total accumulated earnings/(deficit) may differ from the total distributable earnings amounts reported on the Statements of Assets and Liabilities due to certain temporary differences between book-basis and tax-basis. |
(a) | Includes $19,429, $30,992, $255,165, and $30,363 of straddle losses which were deferred for the Value Portfolio, Growth Portfolio, Institutional U.S. Portfolio and International Portfolio, respectively (amounts in thousands). |
313
HC CAPITAL TRUST
Notes to Financial Statements (continued) — June 30, 2023
D. Capital Loss Carryforwards
As of their tax year ended June 30, 2023, the following Portfolios had capital loss carryforwards (“CLCFs”) which do not expire as summarized below (amounts in thousands):
Portfolio | Short-Term | Long-Term | Total | |||||||||
Institutional U.S. Portfolio | $ | 3,864 | $ | 8,577 | $ | 12,441 | (a) | |||||
Small Cap-Mid Cap Portfolio | 2,517 | — | 2,517 | |||||||||
ESG Growth Portfolio | 896 | — | 896 | |||||||||
International Portfolio | 55,512 | — | 55,512 | |||||||||
Emerging Markets Portfolio | 55,746 | 32,270 | 88,016 | |||||||||
Core Fixed Income Portfolio | 1,083 | 2,353 | 3,436 | |||||||||
Corporate Opportunities Portfolio | 9,830 | 14,750 | 24,580 | |||||||||
U.S. Government Fixed Income Portfolio | 8,304 | 4,570 | 12,874 | |||||||||
U.S. Corporate Fixed Income Portfolio | 2,084 | 5,704 | 7,788 | |||||||||
U.S. Mortgage/Asset Backed Fixed Income Portfolio | 6,407 | 10,662 | 17,069 | |||||||||
Short-Term Municipal Portfolio | 1,364 | 2,701 | 4,065 | |||||||||
Intermediate Municipal Portfolio | 1,267 | 6,532 | 7,799 | (a) | ||||||||
Amounts designated as “—” are $0 or have been rounded to $0.
(a) | All or a portion are limited as a result of changes in ownership in connection with merger reorganization. Unused limitations during a year accumulate for future use in offsetting net capital gains. |
E. Deferred Losses
Under current tax law, capital losses and specified ordinary losses realized after October 31 or non-specified ordinary losses realized after December 31 (ordinary losses collectively known as “late year ordinary loss”) may be deferred and treated as occurring on the first business day of the following fiscal year. The following Portfolios had net deferred losses, which will be treated as arising on the first day of the fiscal year ended June 30, 2024 (amounts in thousands):
| Portfolio | Post-October Capital Losses | Late Year Ordinary Losses | ||||||
| Catholic SRI Growth Portfolio | $ | 175 | $ | — | ||||
Amounts designated as “—” are $0 or have been rounded to $0.
F. Book-To-Tax Differences
Distributions are based on amounts calculated in accordance with applicable federal tax regulations, which may differ from GAAP. To the extent these differences are permanent in nature (e.g., net operating losses, reclassification of bond discount and premium, equalization accounting, treatment of gains and losses relating to foreign currency transactions, distribution re-characterization, in-kind redemptions and differing treatment of income relating to swap agreements), such amounts are reclassified within the capital accounts based on their federal tax-basis treatment; temporary differences do not require reclassifications.
314
HC CAPITAL TRUST
Notes to Financial Statements (continued) — June 30, 2023
On the Statements of Assets and Liabilities, as a result of permanent book-to-tax differences, reclassification adjustments were made as follows (amounts in thousands):
Portfolio | Paid-In | Distributable |
Value Portfolio | $ 1,863 | $ (1,863) |
Growth Portfolio | 8,101 | (8,101) |
Institutional U.S. Portfolio | (43) | 43 |
Small Cap-Mid Cap Portfolio | (8) | 8 |
Institutional International Portfolio | (6,505) | 6,505 |
U.S. Corporate Fixed Income Portfolio | 3 | (3) |
Intermediate Municipal Portfolio | 3,304 | (3,304) |
6. RISK CONSIDERATIONS.
Market Risk — Market risk is the risk that the market value of a security may move up and down, sometimes rapidly and unpredictably. These fluctuations may cause a security to be worth less than the price originally paid for it, or less than it was worth at an earlier time. Market risk may affect a single issuer, industrial sector of the economy or the market as a whole. In addition, unexpected events and their aftermaths, such as the spread of deadly diseases; natural environmental, or man-made disasters; financial, political, or social disruptions; terrorism and war; and other tragedies or catastrophes, can cause investor fear and panic, which can adversely affect the economies of many companies, sectors, nations, regions, and the market in general, in ways that cannot necessarily be foreseen. Finally, key information about a security or market may be inaccurate or unavailable. This is particularly relevant to investments in foreign securities.
Credit Risk — Credit risk is the risk that an issuer (or in the case of certain securities, the guarantor or counterparty) will be unable to make principal and interest payments when due. The creditworthiness of an issuer may be affected by a number of factors, including the financial condition of the issuer (or guarantor) and, in the case of foreign issuers, the financial condition of the region.
Foreign Investment Risk — Investments in securities issued by non-U.S. companies and non-U.S. governments and their agencies may be adversely affected by the lack of timely or reliable financial information, political, social and/or economic developments abroad and foreign regulatory requirements and market practices. Securities denominated in foreign currencies are subject to the risk that the value of the foreign currency will decline in relation to the U.S. dollar. In addition, risks associated with foreign investments may be intensified in the case of investments in emerging-market countries, whose political, legal and economic systems are less developed and less stable than those of more developed nations.
Options Risk — Purchasing and writing put and call options are highly specialized activities and entail greater-than-ordinary investments risks. If the Portfolio writes a put option, it incurs the risk that the market value of the underlying security or futures contract could decrease below the option’s exercise price. If this occurs, the option could be exercised and the portfolio would be forced to buy the underlying security or futures contract at a higher price than its current market value. When a Portfolio purchases an option, it will lose the premium paid for the option if the price of the underlying security or futures contract decreases or remains the same (in the case of a call option) or increases or remains the same (in the case of a put option). If an option purchased by the Portfolio were permitted to expire without being sold or exercised, its premium would represent a loss to the Portfolio.
Options Writing Strategy Risk — If the Index appreciates or depreciates sufficiently over the period to offset the new premium from the written option on that index, a net loss will result. In addition, the value of the index substitute is subject to change as the values of the component securities fluctuate. The performance of the index substitute may not exactly match the performance of the index. An index substitute reflects the underlying risks of the index and index substitute options are subject to the same risks as index options.
Floating Rate Investments Risk — Coupon rates on these investments are floating, not fixed, and are tied to a benchmark lending rate. The risks associated with floating rate loans are similar to the risks of below investment grade securities. Adverse changes in economic conditions are likely to cause issuers of these securities to be unable to meet their obligations. In addition,
315
HC CAPITAL TRUST
Notes to Financial Statements (continued) — June 30, 2023
the value of the collateral securing the loan may decline, causing a loan to be substantially unsecured. The sale and purchase of a bank loan are subject to the requirements of the underlying credit agreement governing such bank loan. These requirements may limit the eligible pool of potential bank loan holders by placing conditions or restrictions on sales and purchases of bank loans. Further, bank loans are not traded on an exchange and purchasers and sellers of bank loans rely on market makers, usually the administrative agent for a particular bank loan, to trade bank loans. These factors, in addition to overall market volatility, may negatively impact the liquidity of loans. Difficulty in selling a floating rate loan may result in a loss. Borrowers may pay back principal before the scheduled due date when interest rates decline, which may require the Portfolio to replace a particular loan with a lower-yielding security. There may be less extensive public information available with respect to loans than for rated, registered or exchange listed securities. The Portfolio may assume the credit risk of the primary lender in addition to the borrower, and investments in loan assignments may involve the risks of being a lender.
7. SIGNIFICANT SHAREHOLDERS.
Shareholders, including other funds, individuals, accounts, as well as the Portfolio’s investment manager(s) and/or investment personnel, may from time to time own (beneficially or of record) a significant percentage of the Portfolio’s Shares and can be considered to “control” the Portfolio when that ownership exceeds 25% of the Portfolio’s assets (which may differ from control as determined in accordance with accounting principles generally accepted in the United States of America).
The following table includes the Portfolios which had individual shareholder accounts with ownership of voting securities greater than 10% of the total outstanding voting securities but less than 25% and/or accounts with ownership of voting securities greater than 25% of the total outstanding voting securities.
Portfolio | Number of shareholders with | Number of shareholders with |
Institutional U.S. Portfolio | 1 | — |
Small Cap-Mid Cap Portfolio | 1 | 1 |
ESG Growth Portfolio | — | 1 |
Catholic SRI Growth Portfolio | 1 | 1 |
Institutional International Portfolio | 1 | — |
Emerging Markets Portfolio | 1 | — |
Corporate Opportunities Portfolio | 1 | — |
U.S. Government Fixed Income Portfolio | 1 | — |
U.S. Mortgage/Asset Backed Fixed Income Portfolio | 1 | — |
8. CONCENTRATION OF INVESTMENTS.
As of June 30, 2023, the Corporate Opportunities Portfolio’s investment in the State Street Institutional Treasury Plus Money Market Fund represented greater than 25% of the Portfolio’s net assets. The financial statements of the State Street Institutional Treasury Plus Money Market Fund can be found by accessing the fund’s website at http://www.ssga.com.
9. BUSINESS COMBINATIONS
Effective as of the close of business June 23, 2023, the Intermediate Municipal Portfolio acquired all of the assets and liabilities of the Intermediate Term Municipal Bond II Portfolio (“Acquired Fund”), a series of the Trust, an open-end registered management investment company, pursuant to a Board-approved plan of reorganization dated March 14, 2023 (the “Plan)”.
The acquisition was accomplished by a tax-free exchange of 7,302,990 Strategic Shares of the Intermediate Municipal Portfolio, with a finalized value of $70,656,775 for 7,925,033 Strategic Shares of the Acquired Fund outstanding as of close of business June 23, 2023.
316
HC CAPITAL TRUST
Notes to Financial Statements (concluded) — June 30, 2023
Pursuant to the Plan, all of the assets and liabilities of the Acquired Fund were transferred to the Intermediate Municipal Portfolio. At the close of business June 23, 2023, the Acquired Fund’s investments in securities had a fair value of $69,923,469 and identified cost of $74,656,941, representing unrealized depreciation of $4,733,472. For financial reporting purposes, assets received and shares issued by the Intermediate Municipal Portfolio were recorded at fair value; however, the cost basis of the investments received from the Acquired Fund was carried forward to align ongoing reporting of the Intermediate Municipal Portfolio’s realized and unrealized gains and losses with amounts distributable to shareholders for tax purposes.
Fees and expenses of the reorganization were borne by the Acquired Portfolio and the Intermediate Municipal Portfolio, based upon relative net assets, as provided by the Plan.
The acquisition did not result in a material change to the Acquired Fund’s investment portfolio due to the investment restrictions of the Intermediate Municipal Portfolio. Additionally, there are no material differences in accounting policies of the Acquired Fund as compared to those of the Intermediate Municipal Portfolio.
Assuming the reorganization had been completed on July 1, 2022, the beginning of the annual reporting period, the pro forma results of operations of the Acquiring Portfolio, post reorganization for the year ended June 30, 2023, are as follows (amounts in thousands):
| Net investment income (loss) | $ | 9,269 | ||
| Net realized/unrealized gains (losses) | (666 | ) | ||
| Change in net assets resulting from operations | $ | 8,603 |
Expenses related to reorganization were incurred by the Trust. The following are the expenses related to the reorgnization paid from the Targeted Portfolio and Acquiring Portfolio:
| Portfolio | Expenses (000) | |||
| Intermediate Municipal Portfolio | $ | 41 | ||
| Intermediate Municipal Portfolio II | 20 | |||
Because the combined investment portfolios have been managed as a single integrated portfolio since the acquisition was completed, it is not practicable to separate the amounts of revenue and earnings of the Acquired Fund that have been included in the Intermediate Municipal Portfolio’s Statement of Operations since June 23, 2023. Intermediate Municipal Portfolio did not purchase or sell securities following the acquisition for purposes of realigning its investment portfolio. Accordingly, the acquisition of the Acquired Fund did not affect Intermediate Municipal Portfolio’s portfolio turnover ratio for the year ended June 30, 2023.
10. SUBSEQUENT EVENTS.
Management has evaluated subsequent events through the date these financial statements were issued. The Board approved the termination of the HC Advisors Shares effective August 17, 2023.
Based on the evaluation, no additional disclosures or adjustments were required to the financial statements as of June 30, 2023.
317
318

319
HC CAPITAL TRUST
Additional Information — June 30, 2023 (Unaudited)
1. SECURITY PROXY VOTING. A description of the policies and procedures that the Trust uses to determine how to vote proxies relating to portfolio securities is contained in the Statement of Additional Information. Information regarding how the Portfolios voted proxies relating to portfolio securities during the most recent twelve months ended June 30 is available without charge, upon request, by calling 800-242-9596 and on the Securities and Exchange Commission’s (“SEC”) website at http://www.sec.gov.
2. SHAREHOLDER VOTES.
A special meeting of shareholders of the Portfolios was held on June 20, 2023. At the June 20, 2023 meeting, shareholders of the following Portfolios approved the following:
1. On the Proposal for a plan of reorganization of the Intermediate Term Municipal Bond II Portfolio to be acquired by the Intermediate Term Municipal Bond Portfolio;
Portfolio | Record Date | Shares Voted | % of Total | For Proposal | % of Votes |
The Intermediate Term Municipal Bond II | 8,158,328.729 | 8,106,683.284 | 99.366% | 8,106,683.284 | 100.00% |
3. EXPENSE EXAMPLE. As a shareholder of the Trust, you incur ongoing costs, including management fees and other Portfolio expenses. This example (as set forth in the table below) is intended to help you understand your ongoing costs (in dollars) of investing in the Trust and to compare these costs with the ongoing costs of investing in other mutual funds. The example is based on an investment of $1,000 invested at the beginning of the period and held for the entire period from January 1, 2023 through June 30, 2023.
Actual Expenses: The table below provides information about actual account values and actual expenses. You may use the information below, together with the amount you invested, to estimate the expenses that you paid over the period. Simply divide your account value by $1,000 (for example, an $8,600 account value divided by $1,000 = 8.6), then multiply the result by the number in the table under the heading entitled “Expenses Paid During Period” to estimate the expenses you paid on your account during this period.
Hypothetical Example for Comparison Purposes: The table below provides information about hypothetical account values and hypothetical expenses based on each of the Portfolio’s actual expense ratio and an assumed rate of return of 5% per year before expenses, which is not the Portfolio’s actual return. The hypothetical account values and expenses may not be used to estimate the actual ending account balance or expenses you paid for the period. You may use this information to compare this 5% hypothetical example with the 5% hypothetical examples that appear in the shareholder reports of other funds.
Please note that the expenses shown in the table are meant to highlight your ongoing costs only and do not reflect any transactional costs, such as redemption fees or exchange fees. Therefore, the table is useful in comparing ongoing costs only, and will not help you determine the relative total costs of owning different funds. In addition, if these transactional costs were included, your costs would have been higher.
Portfolio | Beginning | Ending | Expenses | Annualized | ||
Value Portfolio | HC Strategic Shares | Actual | $ 1,000.00 | $ 1,163.80 | $ 1.18 | 0.22% |
Hypothetical2 | $ 1,000.00 | $ 1,023.70 | $ 1.10 | 0.22% | ||
Growth Portfolio | HC Strategic Shares | Actual | $ 1,000.00 | $ 1,203.40 | $ 1.42 | 0.26% |
Hypothetical2 | $ 1,000.00 | $ 1,023.51 | $ 1.30 | 0.26% | ||
Institutional U.S. Portfolio | HC Strategic Shares | Actual | $ 1,000.00 | $ 1,157.20 | $ 1.50 | 0.28% |
Hypothetical2 | $ 1,000.00 | $ 1,023.41 | $ 1.40 | 0.28% | ||
320
HC CAPITAL TRUST
Additional Information (continued) — June 30, 2023 (Unaudited)
Portfolio | Beginning | Ending | Expenses | Annualized | ||
Small Cap-Mid Cap Portfolio | HC Strategic Shares | Actual | $ 1,000.00 | $ 1,080.30 | $ 1.24 | 0.24% |
Hypothetical2 | $ 1,000.00 | $ 1,023.60 | $ 1.20 | 0.24% | ||
ESG Growth Portfolio | HC Strategic Shares | Actual | $ 1,000.00 | $ 1,128.40 | $ 2.01 | 0.38% |
Hypothetical2 | $ 1,000.00 | $ 1,022.91 | $ 1.91 | 0.38% | ||
Catholic SRI Growth Portfolio | HC Strategic Shares | Actual | $ 1,000.00 | $ 1,172.90 | $ 1.67 | 0.31% |
Hypothetical2 | $ 1,000.00 | $ 1,023.26 | $ 1.56 | 0.31% | ||
International Portfolio | HC Strategic Shares | Actual | $ 1,000.00 | $ 1,111.50 | $ 1.31 | 0.25% |
Hypothetical2 | $ 1,000.00 | $ 1,023.55 | $ 1.25 | 0.25% | ||
Institutional International Portfolio | HC Strategic Shares | Actual | $ 1,000.00 | $ 1,110.00 | $ 1.73 | 0.33% |
Hypothetical2 | $ 1,000.00 | $ 1,023.16 | $ 1.66 | 0.33% | ||
Emerging Markets Portfolio | HC Strategic Shares | Actual | $ 1,000.00 | $ 1,057.20 | $ 2.19 | 0.43% |
Hypothetical2 | $ 1,000.00 | $ 1,022.66 | $ 2.16 | 0.43% | ||
Core Fixed Income Portfolio | HC Strategic Shares | Actual | $ 1,000.00 | $ 1,019.20 | $ 2.05 | 0.41% |
Hypothetical2 | $ 1,000.00 | $ 1,022.76 | $ 2.06 | 0.41% | ||
Corporate Opportunities Portfolio | HC Strategic Shares | Actual | $ 1,000.00 | $ 1,071.20 | $ 1.59 | 0.31% |
Hypothetical2 | $ 1,000.00 | $ 1,023.26 | $ 1.56 | 0.31% | ||
U.S. Government Fixed Income Portfolio | HC Strategic Shares | Actual | $ 1,000.00 | $ 1,016.10 | $ 0.85 | 0.17% |
Hypothetical2 | $ 1,000.00 | $ 1,023.95 | $ 0.85 | 0.17% | ||
U.S. Corporate Fixed Income Portfolio | HC Strategic Shares | Actual | $ 1,000.00 | $ 1,030.70 | $ 1.21 | 0.24% |
Hypothetical2 | $ 1,000.00 | $ 1,023.60 | $ 1.20 | 0.24% | ||
U.S. Mortgage/Asset Backed Fixed Income Portfolio | HC Strategic Shares | Actual | $ 1,000.00 | $ 1,016.10 | $ 1.20 | 0.24% |
Hypothetical2 | $ 1,000.00 | $ 1,023.60 | $ 1.20 | 0.24% | ||
Short-Term Municipal Portfolio | HC Strategic Shares | Actual | $ 1,000.00 | $ 1,008.30 | $ 1.39 | 0.28% |
Hypothetical2 | $ 1,000.00 | $ 1,023.41 | $ 1.40 | 0.28% | ||
Intermediate Municipal Portfolio | HC Strategic Shares | Actual | $ 1,000.00 | $ 1,013.60 | $ 1.75 | 0.35% |
Hypothetical2 | $ 1,000.00 | $ 1,023.06 | $ 1.76 | 0.35% | ||
1 | Expenses are equal to the average account value over the period, multiplied by the Portfolio’s annualized expense ratio, multiplied by 181/365 (to reflect the one half year period). |
2 | Represents the hypothetical 5% annual return before expenses. |
321
HC CAPITAL TRUST
Additional Information (continued) — June 30, 2023 (Unaudited)
4. ADDITIONAL FEDERAL INCOME TAX INFORMATION
A. Dividends Received Deduction. For corporate shareholders, the following percentage of the total ordinary income distributions paid during the fiscal year ending June 30, 2023, qualify for the corporate dividend received deduction for the following Portfolios:
Portfolio | Dividends | |||
Value Portfolio | 100.00 | % | ||
Growth Portfolio | 100.00 | % | ||
Institutional U.S. Portfolio | 33.11 | % | ||
Small Cap-Mid Cap Portfolio | 69.07 | % | ||
ESG Growth Portfolio | 60.96 | % | ||
Catholic SRI Growth Portfolio | 53.05 | % | ||
Institutional International Portfolio | 0.08 | % | ||
Emerging Markets Portfolio | 0.45 | % | ||
Corporate Opportunities Portfolio | 1.28 | % | ||
B. Qualified Dividends. For the fiscal year ending June 30, 2023, under current tax law, the following dividends paid may be subject to a maximum tax rate of 15%:
Portfolio | Qualified | |||
Value Portfolio | 100.00 | % | ||
Growth Portfolio | 100.00 | % | ||
Institutional U.S. Portfolio | 36.85 | % | ||
Small Cap-Mid Cap Portfolio | 76.47 | % | ||
ESG Growth Portfolio | 100.00 | % | ||
Catholic SRI Growth Portfolio | 100.00 | % | ||
International Portfolio | 88.72 | % | ||
Institutional International Portfolio | 91.86 | % | ||
Emerging Markets Portfolio | 71.27 | % | ||
Corporate Opportunities Portfolio | 1.38 | % | ||
C. Foreign Tax Pass through Credit. Certain HC Capital Trust Portfolios intend to elect to pass through to shareholders the income tax credit for taxes paid to foreign countries. The pass through of the credit will only affect those persons who are shareholders of the Portfolio on a dividend record date in calendar year 2023. These shareholders will receive more detailed information along with their 2023 Form 1099-DIV. Foreign source income and foreign tax expense per outstanding share on June 30, 2023, are as follows:
Portfolio | Foreign | Foreign Tax | ||||||
International Portfolio | $ | 0.40 | $ | 0.06 | ||||
Institutional International Portfolio | $ | 0.21 | $ | 0.02 | ||||
Emerging Markets Portfolio | $ | 0.56 | $ | 0.07 | ||||
The Portfolios intend to designate the maximum amount allowable as taxed at a maximum rate of 15%. Complete information will be reported in conjunction with your 2023 Form 1099-DIV.
322
HC CAPITAL TRUST
Additional Information (continued) — June 30, 2023 (Unaudited)
D. Qualified Interest Income. For the fiscal year ending June 30, 2023, the following dividends paid by the Portfolios were designated as Qualified Interest Income that may be exempt from U.S. withholding tax on accounts of foreign investors.
Portfolio | Qualified | |||
Core Fixed Income Portfolio | 55.86 | % | ||
Corporate Opportunities Portfolio | 14.27 | % | ||
U.S. Government Fixed Income Portfolio | 99.26 | % | ||
U.S. Corporate Fixed Income Portfolio | 85.93 | % | ||
U.S. Mortgage/Asset Backed Fixed Income Portfolio | 79.18 | % | ||
Intermediate Municipal Portfolio | 5.26 | % | ||
E. Long Term Capital Gains. The Portfolios declared long term distributions of realized gains qualifying for a maximum 15% capital gains tax rate for individuals as follows:
Portfolio | Amount | |||
Value Portfolio | $ | 2,551 | ||
Growth Portfolio | 45,115 | |||
Institutional U.S. Portfolio | 116,175 | |||
Small Cap-Mid Cap Portfolio | 19 | |||
ESG Growth Portfolio | 54 | |||
Catholic SRI Growth Portfolio | 208 | |||
Institutional International Portfolio | 423 | |||
U.S. Government Fixed Income Portfolio | 11 | |||
F. Short Term Capital Gains. The Portfolios declared short term distributions of realized gains as follows:
Portfolio | Amount | |||
U.S. Government Fixed Income Portfolio | $ | 4 | ||
G. Tax Exempt Distributions. The Portfolios declared and paid tax exempt distributions for the fiscal year ending June 30, 2023, as follows:
Portfolio | Amount | |||
Short-Term Municipal Portfolio | $ | 1,388 | ||
Intermediate Municipal Portfolio | 7,112 | |||
5. ACCESS TO QUARTERLY HOLDINGS
A complete schedule of each Portfolio’s portfolio holdings for the first and third fiscal quarter of each fiscal year is filed with the SEC on Form N-PORT and is available on the SEC’s website at http://www.sec.gov.
323
HC CAPITAL TRUST
Additional Information (continued) — June 30, 2023 (Unaudited)
6. ADDITIONAL PORTFOLIO HOLDINGS INFORMATION
The following tables reflect the percentage of the net assets of each Portfolio attributable to the indicated industry sector, type of investments, as appropriate for the indicated Portfolio.
Value Portfolio
Investment Allocation | Percentage | |||
Information Technology | 27.3 | % | ||
Health Care | 13.6 | % | ||
Financials | 12.3 | % | ||
Consumer Discretionary | 10.8 | % | ||
Industrials | 10.5 | % | ||
Communication Services | 7.7 | % | ||
Consumer Staples | 6.4 | % | ||
Energy | 4.0 | % | ||
Materials | 2.5 | % | ||
Real Estate | 2.4 | % | ||
Utilities | 2.2 | % | ||
Investment Companies | 0.3 | % | ||
Total Investment Securities | 100.0 | % | ||
Total Investments | 100.0 | % | ||
Growth Portfolio
Investment Allocation | Percentage | |||
Information Technology | 30.5 | % | ||
Consumer Discretionary | 14.6 | % | ||
Health Care | 12.9 | % | ||
Financials | 12.0 | % | ||
Industrials | 8.1 | % | ||
Communication Services | 7.3 | % | ||
Consumer Staples | 5.9 | % | ||
Energy | 2.9 | % | ||
Real Estate | 2.2 | % | ||
Materials | 1.7 | % | ||
Utilities | 1.7 | % | ||
Investment Companies | 0.1 | % | ||
Total Investment Securities | 99.9 | % | ||
Total Investments | 99.9 | % | ||
Institutional U.S. Equity Portfolio
Investment Allocation | Percentage | |||
Information Technology | 23.9 | % | ||
Financials | 11.6 | % | ||
Health Care | 11.4 | % | ||
Consumer Discretionary | 9.7 | % | ||
Industrials | 9.4 | % | ||
Communication Services | 7.1 | % | ||
Real Estate | 5.7 | % | ||
Consumer Staples | 5.3 | % | ||
Exchange-Traded Funds | 4.1 | % | ||
Investment Companies | 2.9 | % | ||
Materials | 2.8 | % | ||
Utilities | 2.8 | % | ||
Energy | 2.5 | % | ||
Contingent Right | 0.0 | % | ||
Total Investment Securities | 99.2 | % | ||
Other Financial Instruments | ||||
Futures | 0.2 | % | ||
Total Investments | 99.4 | % | ||
Small Cap–Mid Cap Portfolio
Investment Allocation | Percentage | |||
Health Care | 17.3 | % | ||
Industrials | 16.6 | % | ||
Financials | 15.2 | % | ||
Information Technology | 12.2 | % | ||
Consumer Discretionary | 10.9 | % | ||
Real Estate | 6.4 | % | ||
Energy | 6.3 | % | ||
Materials | 4.9 | % | ||
Consumer Staples | 3.9 | % | ||
Communication Services | 2.6 | % | ||
Utilities | 2.6 | % | ||
Investment Companies | 2.4 | % | ||
Contingent Rights | 0.0 | % | ||
Total Investment Securities | 101.3 | % | ||
Other Financial Instruments | ||||
Futures | 0.0 | % | ||
Total Investments | 101.3 | % | ||
324
HC CAPITAL TRUST
Additional Information (continued) — June 30, 2023 (Unaudited)
ESG Growth Portfolio
Investment Allocation | Percentage | |||
Information Technology | 21.2 | % | ||
Financials | 15.6 | % | ||
Health Care | 13.4 | % | ||
Consumer Discretionary | 11.8 | % | ||
Industrials | 11.7 | % | ||
Consumer Staples | 7.8 | % | ||
Communication Services | 6.6 | % | ||
Energy | 5.3 | % | ||
Materials | 3.2 | % | ||
Utilities | 1.6 | % | ||
Real Estate | 0.9 | % | ||
Investment Company | 0.4 | % | ||
Total Investment Securities | 99.5 | % | ||
Other Financial Instruments | ||||
Futures | 0.0 | % | ||
Total Investments | 99.5 | % | ||
Catholic SRI Growth Portfolio
Investment Allocation | Percentage | |||
Information Technology | 26.0 | % | ||
Financials | 17.5 | % | ||
Consumer Discretionary | 12.3 | % | ||
Industrials | 9.8 | % | ||
Communication Services | 8.0 | % | ||
Consumer Staples | 6.9 | % | ||
Energy | 5.9 | % | ||
Health Care | 4.6 | % | ||
Materials | 4.0 | % | ||
Utilities | 3.1 | % | ||
Real Estate | 1.5 | % | ||
Investment Companies | 0.1 | % | ||
Total Investment Securities | 99.7 | % | ||
Total Investments | 99.7 | % | ||
International Portfolio
Investment Allocation | Percentage | |||
Financials | 19.4 | % | ||
Industrials | 15.8 | % | ||
Consumer Discretionary | 11.4 | % | ||
Health Care | 11.1 | % | ||
Information Technology | 9.1 | % | ||
Consumer Staples | 8.5 | % | ||
Materials | 7.2 | % | ||
Energy | 5.7 | % | ||
Utilities | 3.3 | % | ||
Communication Services | 3.2 | % | ||
Investment Company | 1.8 | % | ||
Real Estate | 1.6 | % | ||
Purchased Options | 0.0 | % | ||
Total Investment Securities | 98.1 | % | ||
Other Financial Instruments | ||||
Futures | 0.0 | % | ||
Written Options | -0.0 | % | ||
Total Investments | 98.1 | % | ||
Institutional International Portfolio
Investment Allocation | Percentage | |||
Investment Companies | 41.3 | % | ||
Financials | 10.9 | % | ||
Industrials | 9.5 | % | ||
Health Care | 7.2 | % | ||
Consumer Discretionary | 7.2 | % | ||
Consumer Staples | 5.4 | % | ||
Information Technology | 5.3 | % | ||
Materials | 4.1 | % | ||
Energy | 2.8 | % | ||
Communication Services | 2.0 | % | ||
Utilities | 1.5 | % | ||
Real Estate | 0.4 | % | ||
Purchased Options | 0.0 | % | ||
Total Investment Securities | 97.6 | % | ||
Other Financial Instruments | ||||
Futures | 0.1 | % | ||
Written Options | -0.0 | % | ||
Total Investments | 97.7 | % | ||
325
HC CAPITAL TRUST
Additional Information (continued) — June 30, 2023 (Unaudited)
Emerging Markets Portfolio
Investment Allocation | Percentage | |||
Financials | 19.0 | % | ||
Information Technology | 18.4 | % | ||
Investment Companies | 14.1 | % | ||
Consumer Discretionary | 10.8 | % | ||
Communication Services | 8.7 | % | ||
Materials | 7.2 | % | ||
Consumer Staples | 6.0 | % | ||
Industrials | 4.8 | % | ||
Energy | 4.4 | % | ||
Health Care | 2.7 | % | ||
Utilities | 2.1 | % | ||
Real Estate | 1.4 | % | ||
Purchased Options | 0.0 | % | ||
Total Investment Securities | 99.6 | % | ||
Other Financial Instruments | ||||
Futures | -0.1 | % | ||
Written Options | -0.0 | % | ||
Total Return Swaps | -0.3 | % | ||
Total Investments | 99.2 | % | ||
Core Fixed Income Portfolio
Investment Allocation | Percentage | |||
U.S. Treasury Obligations | 29.3 | % | ||
Exchange-Traded Fund | 26.3 | % | ||
Investment Companies | 13.7 | % | ||
U.S. Government Agency Mortgages | 12.8 | % | ||
Financials | 5.2 | % | ||
Communication Services | 2.4 | % | ||
Health Care | 1.5 | % | ||
Energy | 1.4 | % | ||
Utilities | 1.2 | % | ||
Information Technology | 1.2 | % | ||
Industrials | 1.2 | % | ||
Collateralized Mortgage Obligations | 0.8 | % | ||
U.S. Government Agency Securities | 0.8 | % | ||
Materials | 0.7 | % | ||
Consumer Discretionary | 0.7 | % | ||
Consumer Staples | 0.6 | % | ||
Real Estate | 0.6 | % | ||
Asset Backed Securities | 0.2 | % | ||
Total Investment Securities | 100.6 | % | ||
Total Investments | 100.6 | % | ||
Corporate Opportunities Portfolio
Investment Allocation | Percentage | |||
Investment Companies | 97.4 | % | ||
Financials | 0.0 | % | ||
Total Investment Securities | 97.4 | % | ||
Other Financial Instruments | ||||
Futures | 0.1 | % | ||
Total Investments | 97.5 | % | ||
U.S. Government Fixed Income Portfolio
Investment Allocation | Percentage | |||
Exchange-Traded Fund | 52.6 | % | ||
U.S. Treasury Obligations | 44.9 | % | ||
U.S. Government Agency Securities | 1.2 | % | ||
Investment Company | 1.1 | % | ||
Sovereign Bond | 0.0 | % | ||
Total Investment Securities | 99.8 | % | ||
Other Financial Instruments | ||||
Futures | -0.0 | % | ||
Written Options | -0.0 | % | ||
Total Investments | 99.8 | % | ||
U.S. Corporate Fixed Income Portfolio
Investment Allocation | Percentage | |||
Financials | 26.5 | % | ||
Exchange-Traded Fund | 14.5 | % | ||
Communication Services | 11.8 | % | ||
Energy | 7.3 | % | ||
Health Care | 7.1 | % | ||
Utilities | 6.7 | % | ||
Information Technology | 6.5 | % | ||
Materials | 4.3 | % | ||
Industrials | 4.0 | % | ||
Investment Companies | 3.4 | % | ||
Consumer Staples | 3.2 | % | ||
Real Estate | 2.6 | % | ||
Consumer Discretionary | 2.6 | % | ||
Total Investment Securities | 100.5 | % | ||
Total Investments | 100.5 | % | ||
326
HC CAPITAL TRUST
Additional Information (continued) — June 30, 2023 (Unaudited)
U.S. Mortgage/Asset Backed Fixed Income Portfolio
Investment Allocation | Percentage | |||
U.S. Government Agency Mortgages | 82.0 | % | ||
Investment Company | 18.4 | % | ||
Collateralized Mortgage Obligations | 5.4 | % | ||
Asset Backed Securities | 1.1 | % | ||
Utilities | 0.1 | % | ||
Total Investment Securities | 107.0 | % | ||
TBA Sale Commitments | -0.1 | % | ||
Total Investments | 106.9 | % | ||
Short-Term Municipal Portfolio
Investment Allocation | Percentage | |||
General Obligation | 63.0 | % | ||
Revenue Bonds | 33.4 | % | ||
U.S. Treasury Obligation | 2.1 | % | ||
Investment Company | 0.3 | % | ||
Total Investment Securities | 98.8 | % | ||
Total Investments | 98.8 | % | ||
Intermediate Municipal Portfolio
Investment Allocation | Percentage | |||
Revenue Bonds | 67.1 | % | ||
General Obligation | 26.9 | % | ||
Investment Companies | 3.9 | % | ||
Certificates of Participation | 1.9 | % | ||
Total Investment Securities | 99.8 | % | ||
Total Investments | 99.8 | % | ||
7. BOARD APPROVAL OF INVESTMENT ADVISORY CONTRACTS
The Trust’s investment adviser is HC Capital Solutions (the “Adviser”), an operating division of Hirtle Callaghan & Co. LLC (“Hirtle Callaghan”). The Adviser provides overall investment management services with respect to HC Capital Trust (the “Trust”) and each of its separate portfolios (“Portfolios”) pursuant to the terms of two separate agreements with the Trust (the “HC Contracts”). The Adviser is authorized under the HC Contracts to purchase and sell portfolio securities for the Portfolios. Day-to-day portfolio management services, however, are generally provided to the respective Portfolios by one or more investment advisory organizations (each a “Specialist Manager”) pursuant to the terms of separate investment advisory agreements (each a “Portfolio Management Agreement”). The Trust offers seventeen Portfolios, sixteen of which are managed by two or more Specialist Managers. Each Specialist Manager is responsible for providing day-to-day portfolio management services for that portion of a Portfolio’s assets allocated to it by, and under the supervision of, the Adviser.
At its meeting held on March 14, 2023, the Trust’s Board of Trustees (the “Board”):
● Approved Amended and Restated HC Contracts
● Approved the continuation of certain Portfolio Management Agreements, as set forth below
In considering the information and materials described herein, the Trustees of the Trust who are not “interested persons” of the Trust or the Adviser within the meaning of the Investment Company Act (the “Independent Trustees”) were represented by, and met separately with, their independent legal counsel and were provided with a written description of their statutory responsibilities and the legal standards that are applicable to approvals of advisory agreements. Specifically, the Independent Trustees and their independent legal counsel conferred in executive sessions both with and without representatives of management prior to the March 14, 2023 and June 1, 2023 Board meetings. In view of the broad scope and variety of factors and information, the Board did not find it practicable to, and did not assign relative weights to the specific factors considered in reaching its conclusions to approve the various Portfolio Management Agreements and amendments. Rather, the conclusions were made on the basis of each Trustee’s business judgment after consideration of all of the factors taken in their entirety.
1 | The Intermediate Term Municipal Bond II Portfolio was reorganized into The Intermediate Term Municipal Bond Portfolio on June 23, 2023 and ceased operations on that date. |
327
HC CAPITAL TRUST
Additional Information (continued) — June 30, 2023 (Unaudited)
Approval of the HC Contracts. The Trust’s Board approved the continuation of both of the HC Contracts. In approving the HC Contracts, the Board gave substantial weight to the fact that the Trust and the Portfolios are designed to serve as asset allocation vehicles for, and are available exclusively to, clients of Hirtle Callaghan. Other factors considered by the Board in connection with its determination to approve the HC Contracts are summarized below.
With respect to the nature, extent and quality of the services provided by the Adviser to the Trust, the Board concluded that it was satisfied with the services. The Board determined that the Adviser’s services, including its role in the selection and oversight of the Specialist Managers, the allocation of assets among the Specialist Managers in multi-manager Portfolios, the process for identifying instances where there may be a need to add, eliminate or replace a Specialist Manager and the process with regard to the efficient and economical implementation of such changes were consistent with the expectations of the Trust’s shareholders. In reaching this determination, the Board considered the services of the Trust’s executive officers, each of whom is an employee of Hirtle Callaghan, their oversight of the activities of the Trust’s administrator and other service providers, and the oversight of the Specialist Managers provided by the Adviser. The Board also considered the Adviser’s efforts to control the costs of the Trust, including obtaining advisory fee concessions from various Specialist Managers.
With respect to the performance achieved by the Trust’s Portfolios, the Board viewed the overall performance of the respective Portfolios in the context of their use as vehicles through which the Adviser seeks to access specific asset classes on behalf of Hirtle Callaghan clients. The Board was informed with respect to publicly available information about the performance of peer funds but based its conclusions primarily on the specific facts and circumstances of the Trust. The Board concluded that the performance results achieved by each Portfolio reflect appropriate manager selection by the Adviser and that the continuation of the relationship with the Adviser and approval of the HC Contracts were in the best interests of the Trust’s shareholders and consistent with shareholder expectations.
With respect to the fees paid to the Adviser under the HC Contracts, the Board considered the fact that Hirtle Callaghan’s standard client agreement provides for a fee reduction to the extent that a client’s assets are invested in a Portfolio that is equal to the 0.05% fee payable to the Adviser by each Portfolio under the HC Contract, effectively reducing the Adviser’s income from the Trust to 0.00%. Although informed with respect to advisory fees charged by peer funds, the Board did not consider such information to be a material factor in reaching its conclusion regarding the reasonableness of the fees paid to the Adviser by the Portfolios under the HC Contracts although the Board did consider comparisons of overall expenses to those of peer funds. In light of the unique fee reduction feature embedded in Hirtle Callaghan’s standard client agreements, the Board did not consider the financial position of the Adviser or specific information with respect to the costs and expenses incurred by the Adviser in providing services to the Trust other than to confirm the Adviser’s continued financial viability. Given the structure of the Advisor’s fee schedule, the Board determined that there was no realistic opportunity for a Portfolio to achieve economies of scale with respect to the level of the Adviser’s fee. Based on the foregoing and other information relating to the structure and level of the Adviser’s fee provided to the Board, the Board concluded that the rate at which the Adviser is paid by the Trust for the services it provides to each Portfolio is reasonable.
Continuation of Certain Portfolio Management Agreements. The Portfolio Management Agreements approved for continuance during the period (collectively, the “Continuing Agreements”) are identified below, together with the Specialist Managers subject to review during the period.
Specialist Manager | Portfolios |
Agincourt Capital Management, LLC (“Agincourt”) | The ESG Growth Portfolio The Catholic SRI Growth Portfolio The Core Fixed Income Portfolio The U.S. Corporate Fixed Income Securities Portfolio |
Breckinridge Capital Advisors, Inc. (“Breckinridge”) | The Short-Term Municipal Bond Portfolio The Intermediate Term Municipal Bond Portfolio The Intermediate Term Municipal Bond II Portfolio |
328
HC CAPITAL TRUST
Additional Information (continued) — June 30, 2023 (Unaudited)
Specialist Manager | Portfolios |
City of London Investment Management Company (“CLIM”) | The International Equity Portfolio The Institutional International Equity Portfolio The Emerging Markets Portfolio The Corporate Opportunities Portfolio The Intermediate Term Municipal Bond Portfolio The Intermediate Term Municipal Bond II Portfolio |
Insight North America, LLC (“Insight”) | The Intermediate Term Municipal Bond Portfolio |
Jennison Associates LLC (“Jennison”) | The Growth Equity Portfolio The Institutional U.S. Equity Portfolio |
Parametric Portfolio Associates (“Parametric”) | The Value Equity Portfolio (four agreements related to four different strategies) The Growth Equity Portfolio (four agreements related to four different strategies) The Institutional U.S. Equity Portfolio (three agreements related to three different strategies) The Small Capitalization-Mid Capitalization Equity Portfolio (three agreements related to three different strategies) The ESG Growth Portfolio (two agreements related to two different strategies) The Catholic SRI Growth Portfolio (two agreements related to two different strategies) The International Equity Portfolio (four agreements related to four different strategies) The Institutional International Equity Portfolio (three agreements related to three different strategies) The Emerging Markets Portfolio (four agreements related to four different strategies) The Core Fixed Income Portfolio The Corporate Opportunities Portfolio (three agreements related to three different strategies) The U.S. Government Fixed Income Securities Portfolio The U.S. Corporate Fixed Income Securities Portfolio The U.S. Mortgage/Asset Backed Fixed Income Securities Portfolio The Intermediate Term Municipal Bond Portfolio The Intermediate Term Municipal Bond II Portfolio |
In its deliberations with respect to each of the Continuing Agreements, the Board recognized that, under each such agreement, a Specialist Manager is responsible only for day-to-day investment decisions with respect that portion of a Portfolio’s assets allocated to it. The Board further recognized that the Specialist Managers do not participate in the administration of any of the Portfolios or in the distribution of shares of any of the Portfolios and thus receive limited, if any, benefit from their association with the Trust other than the fee paid to them by the respective Portfolios for investment management services.
In approving the Continuing Agreements, the Board concluded that continuation of each of the Continuing Agreements was in the best interests of each respective Portfolio and consistent with the expectations of shareholders of the Portfolios. While the Board did not identify any particular factor as controlling, the Board gave substantial weight to the fact that the Trust is designed primarily to serve as a vehicle through which the Adviser implements asset allocation strategies on behalf of
329
HC CAPITAL TRUST
Additional Information (continued) — June 30, 2023 (Unaudited)
Hirtle Callaghan’s clients; and that shares of the respective Portfolios are generally available only to such clients. With respect to the nature, extent and quality of the services provided by each of the Specialist Managers, the Board was informed with respect to the specific investment process employed by each of the Specialist Managers in managing the assets of the respective Portfolios allocated to them and the qualifications of each Specialist Manager’s investment management personnel. The Board was also informed with respect to each Specialist Manager’s infrastructure and whether it appears to adequately support the strategies being implemented for the various Portfolios. At its March 2023 meeting, the Board noted management’s proposal to reorganize The Intermediate Term Municipal Bond II Portfolio into The Intermediate Term Municipal Bond Portfolio in June 2023. The Board concluded that the nature, extent and quality of the portfolio management services provided by each of the Specialist Managers were satisfactory in light of the specific strategies employed on behalf of the respective Portfolios and, thus, supported a decision to approve the continuation of each of the Continuing Agreements.
The Board also considered representations made by the Adviser that the performance achieved by the relevant Specialist Managers was consistent with the Adviser’s expectations in the context of the overall objectives, and multi-manager strategy, of each of the respective Portfolios. During the course of its deliberations, the Board was informed with respect to publicly available information assembled by a third-party service provider about the performance of peer funds managed by other investment advisory organizations. The Board did not specifically rely on such information but based its conclusions on the facts and circumstances related to each Portfolio.
With respect to Agincourt, the Board was informed that Agincourt’s investment process uses a yield-driven active management approach which focuses on value, while minimizing interest rate forecasting and market timing, and which is implemented by using three specific strategies: sector management, security selection and yield curve/duration management. For the ESG Growth and Catholic SRI Growth Portfolios, additional screens would be applied before final investment decisions are made, but that at the current time, there were no assets allocated to Agincourt with respect to The ESG Growth Portfolio and The Catholic SRI Growth Portfolio. With respect to the Portfolios for which Agincourt was managing assets, the Board was informed that Agincourt’s returns were in line with its peer group and benchmark for the one-year period and outperformed the returns of its peer group and benchmark during the three and five year periods.
With respect to Breckinridge, the Board was informed that the firm uses a flexible bottom-up approach that seeks to take advantage of opportunities created by inefficiencies in the market for municipal securities without exposure to excessive risk. The firm’s reported performance for The Short-Term Municipal Bond Portfolio showed that it outperformed its benchmark index for the one-year period and underperformed that index for the three and five year periods, while showing mixed results for each of these periods when compared to a group of peer funds. For The Intermediate Term Municipal Bond II Portfolio, Agincourt underperformed its benchmark index and an identified group of peer funds for each of the one, three and fine-year periods. The Board was further informed with respect to the Adviser’s evaluation that the firm’s focus on high grade municipal securities causes their performance to lag the market when low quality securities do well, but that the Adviser has specifically contracted Breckinridge to focus on the high grade sector of the market.
With respect to CLIM, the Board was informed that CLIM’s investment strategy involves an actively managed bottom-up selection process to identify closed-end funds that City of London believes will provide the desired asset-class exposure with a lower volatility than their peers in order to take advantage of closed-end fund discount volatility. The Board was informed that, at the time of the meeting, Trust assets were only allocated to CLIM in The Institutional International Equity Portfolio and The Intermediate Term Municipal Bond II Portfolio. The Board noted that, with respect to The Institutional International Equity Portfolio, the firm underperformed its benchmark index for the most recent one-year period and outperformed that index for the most recent three and five-year periods, while showing mixed results when compared to identified groups of peer funds. With respect to The Intermediate Term Municipal Bond II Portfolio, the Board was informed that CLIM had managed assets for just over one year and had underperformed both its benchmark index and a group of peer funds during that period. The Board was also presented with composite performance information for firm strategies that correspond to the strategies that would be employed in the other Portfolios for which it is under contract and such information showed that, for fixed income strategies, the firm had underperformed its respective benchmark indices and peer groups for the previous one, three and five-year periods and for emerging markets strategies, it underperformed its benchmark index and peer group for the most recent one-year period, while outperforming the index and peer group for the three and five-year periods.
330
HC CAPITAL TRUST
Additional Information (continued) — June 30, 2023 (Unaudited)
With respect to Insight, the Board was informed that the firm actively manages assets for The Intermediate Term Municipal Bond Portfolio by focusing on sector analysis and security selection. The Board was informed that the firm (including performance of the management team under predecessor firms) has performed in line with its benchmark index for the one, three and five year periods.
With respect to Jennison, the Board was informed that Jennison’s investment process seeks to provide exposure to companies with above-average growth in units, revenues, earnings, and cash flows that will drive the value of these securities over time while seeking to capture acceleration or duration of growth that is not fully reflected in a stock’s price. The Board was informed that Jennison’s returns underperformed the returns of its peer group and its benchmark for the one-, three- and five-year periods ended March 31, 2023, while performing in line with its benchmark and outperforming its peer group for the ten-year period.
With respect to Parametric, the Board was informed that the firm provides investment services using several different strategies. The Liquidity strategy uses derivatives to “equitize” a Portfolio’s cash position. The Targeted strategy is designed to provide exposure to market segments that a Portfolio’s primary investment adviser determines is unintentionally underrepresented in the investment portfolios of the other Specialist Managers. The Tax-Managed Custom Core strategy is designed to track a specified index while taking advantage of opportunities for active tax management. The Options Overlay Strategy uses written put and call options to attempt to capitalize on market volatility. The Board was informed that, given the highly customized nature of the Liquidity and Targeted strategies, there were no meaningful peer group comparisons available, but that of the accounts being managed across the various Portfolios in these strategies, five had underperformed their benchmark index since inception and five had outperformed their benchmark index since inception. For the Tax-Managed Custom Core strategies, all three Portfolios underperformed their benchmark index for the 1- and 3-year periods. The Board was advised that the firm had executed the strategies it had been assigned and that such underperformances and/or outperformances reflected the nature of such assignments. With respect to the Options Overlay Strategies, the Board was informed as to the amounts earned by such strategies since their inceptions.
In concluding that continuation of the Continuing Agreements was appropriate, the Board did not rely upon any single factor but gave considerable weight to the Adviser’s recommendations and its assessment of each Specialist Manager’s overall compliance profile and the success and future ability of each Specialist Manager in capturing the respective Portfolios’ desired asset classes. Based on the foregoing, the Board concluded that the performance of the Specialist Managers was satisfactory, and that continuation of such contracts was in the best interests of shareholders of the respective Portfolios.
The Board also concluded that the fee rates at which each of the Specialist Managers is compensated under the Continuing Agreements is reasonable. In reaching this conclusion, the Board had before it information about the impact of break-points, financial information about the Specialist Managers relating to factors such as profitability, comparable fees charged to other institutional clients and/or to peer funds for similar services and costs incurred by the Specialist Managers in providing services to the respective Portfolios. The Board was also informed with respect to advisory fees paid by other, unaffiliated, funds with similar objectives and strategies. In considering this information, the Board gave substantial weight to information demonstrating that the rate at which these Specialist Managers are compensated was determined as a result of arms-length negotiations conducted by the officers of the Trust and the Adviser, including in several cases, negotiated fee waivers/reductions and scheduled breakpoints designed to recognize economies of scale where appropriate. Accordingly, the Board concluded that the profitability to each Specialist Manager was not a material factor in its deliberations with respect to the consideration of the approval of the Continuing Agreements.
With respect to Agincourt, the Board was informed that the firm received an annual fee of 0.08% for the Core Fixed Income and U.S. Corporate Fixed Income Portfolios and 0.12% for the ESG Growth and Catholic SRI Growth Portfolios, noting that the higher fees for the ESG Growth and Catholic SRI Growth Portfolios were intended to compensate the firm for the additional work of applying the necessary ESG-related screens to the investment portfolios, and that these fees were substantially lower than the comparable industry average fees.
With respect to Breckinridge, the Board was informed that the firm received an annual fee of 0.125% for each of the Portfolios it serves, and that this fee was substantially lower than the comparable industry average fees.
331
HC CAPITAL TRUST
Additional Information (continued) — June 30, 2023 (Unaudited)
With respect to CLIM, the Board was informed that the firm receives an annual fee of 0.45% for each of the Corporate Opportunities, Intermediate Term Municipal Bond and Intermediate Term Municipal Bond II Portfolio, an annual fee ranging from 0.80% to 0.40%, depending on asset levels, for each of the International Equity and Institutional International Equity Portfolios, which resulted in an effective fee of 0.53% for The Institutional International Equity Portfolio, and an annual fee ranging from 1.00% to 0.50%, depending on asset levels for The Emerging Markets Portfolio. The Board was informed that some of these fees were higher than the closest comparable industry average fees and others were lower, but that the comparative fees were not necessarily directly comparable as they did not reflect advisors managing the type of closed-end fund strategies employed by CLIM, for which no comparable fee data was available.
With respect to Insight, the Board was informed that the Firm is entitled to an annual fee ranging from 0.25% to 0.15%, depending on asset levels, which resulted in an effective fee of 0.17% for 2022, and that this fee was substantially lower than the comparable industry average fees.
With respect to Jennison, the Board was informed that the firm received an annual fee of no more than 0.30%, with breakpoint schedules tied to the total aggregate level of assets managed by Jennison for all clients of Hirtle Callaghan, including the Trust Portfolios, and that this fee schedule was substantially lower than the comparable industry average fees.
With respect to Parametric, the Board was informed that the firm’s fees varies according to strategy. The Board noted that fees for the Liquidity Strategy use a breakpoint schedule starting at a rate of 0.15%, but also include an additional flat fee of $10,000 per Portfolio per year (which is waived for periods when no assets are being managed in a given Portfolio), and that for most Portfolios in which assets were being managed using this strategy, the effective fee paid was lower than comparable industry averages, although in some cases, the effect of the flat fee component on relatively small asset allocations caused the resulting fee to be higher than industry averages when these fees were expressed as percentages of assets. The Board was also informed that fees for the Targeted Strategy are 0.05% with an additional flat fee of $5,000 per Portfolio per year (which is waived for years when no assets are being managed in a given Portfolio), and that for each Portfolio in which assets were being managed using this strategy, the effective fee paid was lower than comparable industry averages. The Board also noted that fees for the Tax-Managed Custom Core Strategy use a breakpoint schedule starting at a rate of 0.10%, and that for each Portfolio in which assets were being managed using this strategy, the effective fee paid was lower than comparable industry averages. With respect to the Options Overlay Strategy, the Board was informed that Portfolios using this strategy pay a flat fee per month in which such strategy is employed and that in some cases, depending on the level of assets committed to the strategy, Portfolios paid a higher fee than industry averages for their asset class when these fees were expressed as percentages of assets.
8. OPERATION AND IMPLEMENTATION OF THE LIQUIDITY MANAGEMENT PROGRAM
Pursuant to Rule 22e-4 under the 1940 Act (the “Liquidity Rule”), the Trust has adopted a liquidity risk management program (“Program”). Liquidity risk is defined as the risk that a Portfolio could not meet redemption requests without significant dilution of remaining investors’ interests in the Portfolio.
The Program is overseen by the Trust’s Liquidity Risk Officer (the “Program Administrator”), appointed by the Trust’s Board of Trustees, and the Program’s principal objectives include assessing, managing and periodically reviewing the Portfolio’s liquidity risk, based on factors specific to the circumstances of each respective Portfolio.
In assessing and managing each Portfolio’s liquidity risk, the Program Administrator considers, as relevant, a variety of factors, including: (1) the Portfolio’s investment strategy and liquidity of portfolio investments during both normal and reasonably foreseeable stressed conditions; (2) short-term and long-term cash flow projections for the Portfolio during both normal and reasonably foreseeable stressed conditions; and (3) the Portfolio’s holdings of cash and cash equivalents and any borrowing arrangements. Classification of the Portfolio’s portfolio holdings in one of four liquidity categories is based on the number of days it is reasonably expected to take to convert the investment to cash (for Highly Liquid and Moderately Liquid holdings) or to sell or dispose of the investment (for Less Liquid and Illiquid investments), in current market conditions without significantly changing the investment’s market value. The Portfolio primarily holds assets that are classified as Highly Liquid, and therefore the Portfolio is not required to establish a Highly Liquid Investment Minimum (“HLIM”).
At a meeting of the Board of Trustees held on March 14, 2023, the Program Administrator provided a written report to the Board addressing the Program’s operation and assessing the adequacy and effectiveness of its implementation for the calendar year of 2022 (the “Review Period”). The Program Administrator concluded that the Program as adopted and implemented, operated effectively to achieve the goal of assessing and managing each Portfolio’s liquidity risk. The Program Administrator
332
HC CAPITAL TRUST
Additional Information (continued) — June 30, 2023 (Unaudited)
also concluded that the Program remained reasonably designed to continue to manage liquidity risk going forward. The Program Administrator also stated that the Portfolio was not required to set a HLIM, no material changes were made to the Program during the Review Period, and the Portfolio was able to meet requests for redemption without diluting the remaining investors’ interests in the Portfolio.
OFFICERS. The table below sets forth certain information about the Trust’s executive officers.
NAME, ADDRESS, | POSITION(S) | TERM OF | PRINCIPAL | NUMBER OF |
Geoffrey A. Trzepacz Five Tower Bridge, 300 Barr Harbor Drive, West Conshohocken, PA 19428 Born: 1975 | President | Indefinite; President since 12/11/18 | Mr. Trzepacz is currently the Chief Operating Officer (COO) of the Adviser since January 2018. | 16 |
Colette Bergman Five Tower Bridge, 300 Barr Harbor Drive, West Conshohocken, PA 19428 Born: 1970 | Vice President & Treasurer | Indefinite; Since 6/12/12 | Ms. Bergman is currently a Director of the Adviser. She has been with the Adviser for more than five years. | 16 |
Andrew Jones Foreside Fund Officer Services, LLC (dba ACA Group) Three Canal Plaza, Third Floor Portland, ME 04101 Born: 1994 | Chief Compliance Officer | Indefinite; Since 5/12/23 | Mr. Jones is currently a Principal Consultant with ACA Group, LLC. He has been with ACA Group, LLC and its predecessor organization for more than five years. | 16 |
Umar Ehtisham Five Tower Bridge, 300 Barr Harbor Drive, West Conshohocken, PA 19428 Born: 1981 | Liquidity Risk Officer | Indefinite; Since 12/01/18 | Mr. Ehtisham is currently the Chief Compliance & Risk Officer (CCO) of the Adviser since May 2018. | 16 |
Dimitrios Spiliakos Citi Fund Services 4400 Easton Commons, Suite 200 Columbus, OH 43219 Born: 1977 | Secretary | Indefinite; Since 6/14/22 | Mr. Spiliakos is a Vice President with Citi Fund Services Ohio, Inc. since May 2022. Prior to May 2022, Mr. Spiliakos served as a Vice President, Regulatory Administration Department, BNY Mellon Investment Servicing (US) Inc. (03/2015 – 04/2022). | 16 |
333
HC CAPITAL TRUST
Additional Information (continued) — June 30, 2023 (Unaudited)
INDEPENDENT TRUSTEES. The following table sets forth certain information about the Independent Trustees.
NAME, ADDRESS, | POSITION(S) | TERM OF | PRINCIPAL | NUMBER OF | OTHER |
John M. Dyer Five Tower Bridge, 300 Barr Harbor Drive, West Conshohocken, PA 19428 Born: 1954 | Trustee | Indefinite; Since 6/18/19 | Mr. Dyer is currently a Board member of Cox Enterprises, Inc. (technology, communications and automotive services) (“Cox”) since 2010 and World Wide Technology (technology services) since 2019. | 16 | EBSCO Industries (diversified business) (11/20 to current) |
Jarrett Burt Kling Five Tower Bridge, 300 Barr Harbor Drive, West Conshohocken, PA 19428 Born: 1943 | Trustee | Indefinite; Since 7/20/95 | For more than the past five years Mr. Kling has been a managing director of CBRE Investment Management, LLC, a registered investment adviser. | 16 | None |
R. Richard Williams Five Tower Bridge, 300 Barr Harbor Drive, West Conshohocken, PA 19428 Born: 1945 | Trustee and Chairman | Indefinite; Trustee Since 7/15/99; Chairman since 3/21/17 | Since 2000, Mr. Williams has been the owner of Seaboard Advisers (consulting services). | 16 | None |
Richard W. Wortham, III Five Tower Bridge, 300 Barr Harbor Drive, West Conshohocken, PA 19428 Born: 1938 | Trustee | Indefinite; Since 7/20/95 | Mr. Wortham is currently the President and Chief Executive Officer of The Wortham Foundation and has been a Trustee for more than the past five years. Prior to April 2021 and for more than the past five years, Mr. Wortham served as a director of Oncor Electric Delivery Company LLC. | 16 | None |
334
HC CAPITAL TRUST
Additional Information (concluded) — June 30, 2023 (Unaudited)
INTERESTED TRUSTEE. The following table sets forth certain information about the Interested Trustee.
NAME, ADDRESS, | POSITION(S) | TERM OF | PRINCIPAL | NUMBER OF | OTHER |
Geoffrey A. Trzepacz** Five Tower Bridge, 300 Barr Harbor Drive, West Conshohocken, PA 19428 Born: 1975 | Trustee and President | Indefinite; Since 1/01/19 | Mr. Trzepacz is currently the Chief Operating Officer (COO) of the Adviser since January 2018. | 16 | None |
* | The information in this column relates only to directorships in companies required to file certain reports with the SEC under the various federal securities laws. |
** | Mr. Trzepacz is considered to be “interested” as a result of his present positions with the Adviser or its affiliates. |
Additional information about the Portfolios’ Trustees and officers may be found in the Portfolios’ Statement of Additional Information, which is available without charge, upon request, by calling toll-free 1-800-242-9596.
335
THIS PAGE INTENTIONALLY LEFT BLANK
THIS PAGE INTENTIONALLY LEFT BLANK
HC CAPITAL TRUST
Trustees
GEOFFREY A. TRZEPACZ*
JOHN M. DYER
JARRETT B. KLING
R. RICHARD WILLIAMS
RICHARD W. WORTHAM III
* ‘Interested Person’ as that term is defined in the Investment Company Act of 1940.
Investment Adviser | Counsel |
Administrator | Independent Registered Public Accounting Firm |
Distributor | Custodian |
This report is for the information of the shareholders of HC Capital Trust. Its use in connection with any offering of the Trust’s shares is authorized only in case of a concurrent or prior delivery of the Trust’s current prospectus. The prospectus contains more complete information, including investment objectives, risks, fees and expenses and should be read carefully before investing or sending any money.
8/23
Item 2. Code of Ethics.
(a) The Registrant has adopted a code of ethics that applies to the Registrant’s principal executive officer, principal financial officer, principal accounting officer or controller, or persons performing similar functions, regardless of whether these individuals are employed by the Registrant or a third party (the “Code of Ethics”). The Code of Ethics is included as an Exhibit. During the period covered by the report, with respect to the Registrant’s Code of Ethics, there have been no amendments to, nor any waivers granted from, a provision that relates to any element of the code of ethics definition enumerated in paragraph (b) of this Item 2 of Form N-CSR.
Item 3. Audit Committee Financial Expert.
3(a)(1) The Registrant’s Board of Trustees has determined that the Registrant has at least one audit committee financial expert serving on its audit committee.
3(a)(2) The audit committee financial expert is John M. Dyer, who is “independent” for purposes of this Item 3 of Form N-CSR. Mr. Dyer was appointed to the Board of Trustees effective June 17, 2019 and was determined to be an audit committee financial expert on June 16, 2020.
Item 4. Principal Accountant Fees and Services.
(a) Audit Fees
2022 $420,000
2023 $423,530
For the fiscal years ended June 30, 2022 and June 30, 2023, the aggregate fees billed by Grant Thornton LLP for professional services rendered for the audits of the financial statements or services that are normally provided in connection with statutory and regulatory filings or engagements for those fiscal years for the Registrant are shown in the table above.
(b) Audit-Related Fees
2022 $0
2023 $0
(c) Tax Fees
2022 $89,400
2023 $84,800
Tax fees include the aggregate fees billed in each of the last two fiscal years for professional services related to tax compliance, tax advice, and tax planning. Such tax services included the review of income and excise tax returns for the Registrant as shown in the table above for the fiscal years ended June 30, 2022 and June 30, 2023.
(d) All Other Fees
2022 $0
2023 $0
(e)(1) - Except as permitted by Rule 2-01 (c)(7)(i)(c) of Regulation S-X, the HC Capital Trust Audit Committee must pre-approve all audit and non-audit services provided by the independent accountants relating to the operations or financial reporting of the Portfolios. Prior to the commencement of any audit or non-audit services to a Fund, the Audit Committee reviews the services to determine whether they are appropriate and permissible under applicable law.
(e)(2) – The following percentages of the services summarized in (b)-(d) above were approved by the Audit Committee pursuant to Rule 2-01 (c)(7)(i)(c) of Regulation S-X.
2022 0%
2023 0%
(f) - Not applicable.
(g) - For the fiscal years ended June 30, 2022 and June 30, 2023, the aggregate non-audit fees billed by Grant Thornton LLP for services rendered to the Registrant and to the Registrant’s investment advisers (the “Advisers”) and any entity controlling, controlled by, or under common control with the Advisers that provided ongoing services to the Registrant were $0 and $0, respectively.
(h) - Not applicable.
(i) - Not applicable.
(j) - Not applicable.
Item 5. Audit Committee of Listed Registrants.
Not Applicable
Item 6. Schedule of Investments.
(a) Not Applicable
(b) Not Applicable
Item 7. Disclosure of Proxy Voting Policies and Procedures for Closed-End Management Investment Companies.
Not applicable.
Item 8. Portfolio Managers of Closed-End Management Investment Companies.
Not applicable.
Item 9. Purchases of Equity Securities by Closed-End Management Investment Company and Affiliated Purchasers.
Not applicable.
Item 10. Submission of Matters to a Vote of Security Holders.
Not applicable.
Item 11. Controls and Procedures.
(a) The Registrant's principal executive officer and principal financial officer have concluded, based on their evaluation of the Registrant's disclosure controls and procedures as conducted within 90 days of the filing date of this report, that these disclosure controls and procedures are adequately designed and are operating effectively to ensure that information required to be disclosed by the Registrant on Form N-CSR is recorded, processed, summarized and reported within the time periods specified in the Securities and Exchange Commission's rules and forms.
(b) There were no changes in the Registrant's internal control over financial reporting (as defined in Rule 30a-3(d) under the Investment Company Act of 1940 ("the Act") (17 CFR 270.30a-3(d)) that occurred during the period covered by this report that have materially affected or are reasonably likely to materially affect, the Registrant's internal control over financial reporting.
Item 12. Disclosures of Securities Lending Activities for Closed-End Management Investment Companies.
Not applicable.
Item 13. Exhibits.
(a)(2) Certifications pursuant to Rule 30a-2(a) under the Act are attached hereto.
(a)(3) Not applicable.
(b) Certifications pursuant to Rule 30a-2(b) under the Act are attached hereto.
SIGNATURES
Pursuant to the requirements of the Securities Exchange Act of 1934 and the Investment Company Act of 1940, the Registrant has duly caused this report to be signed on its behalf by the undersigned, thereunto duly authorized.
| (Registrant) | HC Capital Trust | |
| By (Signature and Title) | /s/ Geoffrey Trzepacz | |
| Geoffrey Trzepacz, Principal Executive Officer | ||
| Date: | 8/31/2023 |
Pursuant to the requirements of the Securities Exchange Act of 1934 and the Investment Company Act of 1940, this report has been signed below by the following persons on behalf of the Registrant and in the capacities and on the dates indicated.
| By (Signature and Title) | /s/ Colette Bergman | |
| Colette Bergman, Principal Financial Officer | ||
| Date: | 8/31/2023 | |
| By (Signature and Title) | /s/ Geoffrey Trzepacz | |
| Geoffrey Trzepacz, Principal Executive Officer | ||
| Date: | 8/31/2023 |