UNITED STATES
SECURITIES AND EXCHANGE COMMISSION
Washington, D.C. 20549
FORM N-CSR
CERTIFIED SHAREHOLDER REPORT OF REGISTERED MANAGEMENT
INVESTMENT COMPANIES
Investment Company Act file number 811-08932
Artisan Funds, Inc.
(Exact name of registrant as specified in charter)
875 East Wisconsin Avenue, Suite 800
Milwaukee, WI 53202
(Address of principal executive offices) (Zip Code)
| | |
| Janet D. Olsen | | Kevin J. McCarthy |
| Artisan Funds, Inc. | | Bell, Boyd & Lloyd LLC |
| 875 East Wisconsin Avenue, #800 | | Three First National Plaza, #3100 |
| Milwaukee, Wisconsin 53202 | | Chicago, IL 60602 |
(Name and address of agents for service)
Registrant’s telephone number, including area code: (414) 390-6100
Date of fiscal year end: 09/30/05
Date of reporting period: 09/30/05
Item 1. | Reports to Shareholders. |

ANNUAL
R E P O R T
SEPTEMBER 30, 2005
ARTISAN INTERNATIONAL FUND
ARTISAN INTERNATIONAL SMALL CAP FUND
ARTISAN INTERNATIONAL VALUE FUND
ARTISAN MID CAP FUND
ARTISAN MID CAP VALUE FUND
ARTISAN SMALL CAP FUND
ARTISAN SMALL CAP VALUE FUND

ARTISAN FUNDS, INC.
INVESTOR SHARES
ARTISAN FUNDS
P.O. BOX 8412
BOSTON, MA 02266-8412
This report and the audited financial statements contained herein are provided for the general information of the shareholders of Artisan Funds. Investors should consider carefully before investing each Fund’s investment objective, risks and charges and expenses. For a prospectus, which contains that information and more information about each Fund, please call 800.344.1770 or visit our website at www.artisanfunds.com. Read it carefully before you invest or send money.
Company discussions are for illustration only and are not intended as recommendations of individual stocks. The discussions present information about the companies believed to be accurate, and the views of the portfolio managers, as of September 30, 2005. That information and those views may change, and the Funds disclaim any obligation to advise shareholders of any such changes. Artisan International Fund and Artisan Mid Cap Fund offer institutional classes of shares for institutional investors meeting certain minimum investment requirements. A report on each institutional class is available under separate cover.
Artisan Funds offered through Artisan Distributors LLC, member NASD.
TABLE OF CONTENTS
AVERAGE ANNUAL TOTAL RETURNS (as of 9/30/05)
| | | | | | | | | | | | | | | |
| | | 1-Year | | | 3-Year | | | 5-Year | | | 10-Year | | | Since
Inception | |
Artisan International Fund (inception 12/28/95) | | 26.97 | % | | 20.48 | % | | 1.68 | % | | NA | | | 13.38 | % |
Artisan International Small Cap Fund (inception 12/21/01) | | 42.13 | | | 38.61 | | | NA | | | NA | | | 26.38 | |
Artisan International Value Fund (inception 9/23/02) | | 22.71 | | | 33.00 | | | NA | | | NA | | | 32.41 | |
Artisan Mid Cap Fund (inception 6/27/97) | | 18.06 | | | 19.39 | | | 0.87 | | | NA | | | 18.20 | |
Artisan Mid Cap Value Fund (inception 3/28/01) | | 28.42 | | | 30.03 | | | NA | | | NA | | | 17.27 | |
Artisan Small Cap Fund (inception 3/28/95) | | 22.64 | | | 27.05 | | | 7.18 | | | 8.21 | % | | 10.23 | |
Artisan Small Cap Value Fund (inception 9/29/97) | | 22.42 | | | 26.58 | | | 17.56 | | | NA | | | 13.78 | |
The performance quoted represents past performance, which does not guarantee future results. The investment return and principal value of an investment in a Fund will fluctuate, so that an investor’s shares in the Fund, when redeemed, may be worth more or less than their original cost. Current performance may be lower or higher than the performance data quoted. For current to most recent month-end performance information, visit www.artisanfunds.com or call 800.344.1770. The performance information shown for Artisan International Fund, Artisan International Small Cap Fund and Artisan International Value Fund does not reflect the deduction of a 2% redemption fee on shares held by an investor for 90 days or less and, if reflected, the fee would reduce the performance quoted. Artisan International Small Cap Fund’s investments in initial public offerings (IPOs) made a material contribution to the Fund’s performance. IPO investments are not an integral component of the Fund’s investment process and may not be available in the future.
Artisan International Fund, International Small Cap Fund & International Value Fund: International investments involve special risks, including currency fluctuation, lower liquidity, different accounting methods and economic and political systems and higher transaction costs. These risks typically are greater in emerging markets. Artisan International Fund and International Small Cap Fund invest in growth stocks, which may underperform other asset types during a given period. Artisan International Small Cap Fund invests in the stocks of smaller companies, which tend to be more volatile and less liquid than those of larger companies, have underperformed the stocks of larger companies during some periods and tend to have a shorter history of operations than larger companies. Artisan International Value Fund invests in value stocks, which may underperform other asset types during a given period. In addition, the Fund may invest a significant portion of its assets in small and medium-sized companies, which tend to be more volatile and less liquid than those of large companies, have underperformed the stocks of larger companies during some periods and tend to have a shorter history of operations than larger companies.
Artisan Mid Cap Fund & Mid Cap Value Fund: Stocks of medium-sized companies tend to be more volatile than those of larger companies and have underperformed the stocks of small and large companies during some periods. Artisan Mid Cap Fund invests primarily in growth stocks, which may underperform other asset types during a given period. Artisan Mid Cap Value Fund invests primarily in value stocks, which may underperform other asset types during a given period.
Artisan Small Cap Fund & Small Cap Value Fund: Stocks of smaller companies tend to be more volatile and less liquid than those of larger companies, have underperformed the stocks of larger companies during some periods and tend to have a shorter history of operations than larger companies. Artisan Small Cap Fund invests primarily in growth stocks, which may underperform other asset types during a given period. Artisan Small Cap Value Fund invests primarily in value stocks, which may underperform other asset types during a given period.
ARTISAN INTERNATIONAL FUND (ARTIX)
| | |
| HIGHLIGHTS | | |
• For the twelve months ended September 30, 2005, Artisan International Fund outperformed the MSCI EAFE® and MSCI EAFE® Growth indices. • The Fund benefited from the performance of its energy and financials stocks relative to both benchmarks. On a regional basis, the Fund received a strong relative contribution versus the benchmarks from its emerging markets holdings. | | • One area of weakness relative to the benchmarks for the Fund was the consumer discretionary sector. |
| | | |
| INVESTMENT APPROACH | | |
| We use a bottom-up investment process to construct a portfolio of international growth companies of all market capitalizations. The investment team conducts its own fundamental analysis with particular emphasis on: | | 1) well-managed companies focused on increasing shareholder value; 2) sustainable growth prospects; 3) reasonable valuations; or 4) dominant or increasing market shares or direct exposure to an identified theme. |
| | | |
| PERFORMANCE REVIEW | | |
| For the trailing one- and five-year periods and since the Fund’s inception, Artisan International Fund has outpaced the MSCI EAFE® Growth Index. |
GROWTH OF AN ASSUMED $10,000 INVESTMENT (12/28/95 to 9/30/05)
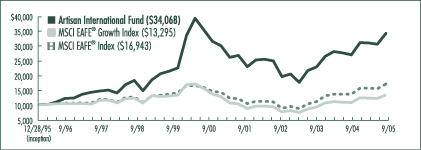
AVERAGE ANNUAL TOTAL RETURNS (as of 9/30/05)
| | | | | | | | | | | | |
| Fund / Index | | 1-Year | | | 3-Year | | | 5-Year | | | Since
Inception | |
Artisan International Fund | | 26.97 | % | | 20.48 | % | | 1.68 | % | | 13.38 | % |
MSCI EAFE® Growth Index | | 25.01 | | | 20.91 | | | -0.47 | | | 2.96 | |
MSCI EAFE® Index | | 25.79 | | | 24.61 | | | 3.16 | | | 5.55 | |
The performance quoted represents past performance, which does not guarantee future results. The investment return and principal value of an investment in the Fund will fluctuate, so that an investor’s shares in the Fund, when redeemed, may be worth more or less than their original cost. Current performance may be lower or higher than the performance data quoted. For current to most recent month-end performance information, visit www.artisanfunds.com or call 800.344.1770. The graph and table above do not reflect the deduction of taxes that a shareholder would pay on distributions or sale of Fund shares. The performance shown does not reflect the deduction of a 2% redemption fee on shares held by an investor for 90 days or less and, if reflected, the fee would reduce the performance quoted. See page 80 for a description of each index.
2
TWO
INVESTING ENVIRONMENT
International equities had a strong performance run during our fiscal year ended September 30, 2005. In developed markets, a few of the leading gainers were Spain, Germany, France and Japan—each of which advanced over 25%. Japan was particularly strong late in the fiscal year as mounting evidence of renewed economic growth attracted equity investors. The U.K. and U.S. markets were among the weakest performers. The U.K. economy struggled with higher interest rates, inflation concerns and a soft housing market. Those same issues started to creep up in the U.S., though to a lesser degree.
Many sectors in the MSCI EAFE® Index turned in gains in excess of 20%. Even technology, which was the worst performing sector, advanced nearly 13%. The leading performers were energy and materials, which notched returns in excess of 37%.
The U.S. dollar, which was a large contributing factor to performance for U.S.-based international investors in recent periods, had a small negative impact on absolute returns for investors. Two items that remained consistent with recent periods were the outperformance of small-cap stocks compared to large-cap stocks and emerging markets stocks compared to developed market stocks. Value stocks outperformed growth stocks for the full period, but in the second half of our fiscal year growth stocks held a slight edge.
PERFORMANCE DISCUSSION
The Fund benefited from the performance of stocks in our financials and energy themes. Our stocks in the consumer discretionary sector were the primary source of relative weakness in the portfolio. Regionally, our emerging markets and Japanese holdings turned in good gains compared to the benchmarks, while our French and U.K. positions weighed on our relative results.
SECTOR REVIEW
We invest on a stock-by-stock basis, but most of the stocks we own fall into one of our identified global investment themes derived from our understanding of changes in demographics, technology, restructuring and outsourcing. Traditional definitions of sectors can play a powerful role in the performance of a stock in the short-term, but over the long-term we think that inflection points due to long-term structural changes can create investment opportunities. Our global themes attempt to capture these opportunities.
During the fiscal year, our global financials theme was the Fund’s largest contributor to performance. Within the theme, our Japanese and Korean stocks were among the leading gainers. In Japan, Credit Saison Co., Ltd. (a Japanese credit card issuer), Mizuho Financial Group, Inc. (Japan’s largest bank) and Orix Corp. (Japan’s top non-bank financing company based on operating assets) all recorded returns in excess of 40%, with a good portion of those returns coming late in the period. Credit Saison’s business profited from new cardholder growth and growing shopping and cash advance volumes. Mizuho benefited from a mandate won by Prime Minister Koizumi to break up and sell Japan’s postal system, which is really a diversified financial services company that holds $3 trillion worth of individuals’ financial assets. Orix benefited from increased real estate sales and a strong increase in earnings. Two stocks in Japan that lagged were consumer finance company Promise Co., Ltd. and brokerage firm Nomura Holdings, Inc. We sold our positions in both stocks.
TOP 10 HOLDINGS
| | | | | |
| Company Name | | Country | | 9/30/05 | |
Credit Saison Co., Ltd. | | Japan | | 3.4 | % |
China Mobile (Hong Kong) Limited | | China | | 3.2 | |
Telefonaktiebolaget LM Ericsson | | Sweden | | 3.2 | |
UBS AG | | Switzerland | | 3.1 | |
Sega Sammy Holdings, Inc. | | Japan | | 3.0 | |
Fortis | | Netherlands | | 2.9 | |
LUKOIL | | Russia | | 2.8 | |
Nestle S.A. | | Switzerland | | 2.4 | |
Mizuho Financial Group, Inc. | | Japan | | 2.3 | |
EnCana Corporation | | Canada | | 2.2 | |
Total | | | | 28.5 | % |
As a percentage of total net assets. Top 10 Holdings are determined by issuer.
Korean banks Kookmin Bank, Hana Bank and Shinhan Financial Group Co., Ltd. were our leading performers in that country. All three
3
THREE
companies delivered on positive expectations for earnings growth. In addition, net interest margins improved and default ratios fell, which helped the banks reduce bad debt provisions. Other winners in our global financials theme, with their countries noted in parentheses, included Julius Baer Holding, Ltd. (Switzerland), Allianz AG (Germany), Commerzbank AG (Germany) and Fortis (Netherlands).
The investments in our energy theme were based on our assessment that the long-term imbalance between demand for energy, in particular oil, and the worldwide supply creates the potential for sustainable growth. Demand continued to grow, as emerging countries such as China continued to become major consumers and industry infrastructure continued to be under pressure due to a decade long period of under-investment. Our energy theme investments were limited because of concerns about valuation.
During the fiscal year, our average energy stock outgained those in both benchmarks, resulting in a strong performance contribution. Three of the leading contributors to performance were Canadian natural gas company EnCana Corporation, Russian oil producer LUKOIL and Italian oil services company Saipem S.p.A. EnCana’s share price more than doubled, LUKOIL increased over 80% and Saipem moved more than 50% higher. Among the factors that influenced EnCana’s appreciation were the announced sale of its natural gas storage business and positive expectations for earnings growth as oil and natural gas prices remained at historically high levels. LUKOIL reported a substantial increase in profits, and like EnCana, was expected to produce solid earnings growth in the future. Saipem benefited from strong demand for rigs, which led to a pick up in rig utilization, driving better pricing.
Across the rest of our themes there were two strong individual gainers of note. China Mobile (Hong Kong) Limited, the world’s largest mobile phone company by number of users, reported a strong increase in profits, which was partly driven by a surge in subscriber numbers and growth in wireless data, such as picture messages and ring tones. Roche Holding AG, which has strong franchises in oncology, virology and infectious diseases, released solid financial results as earnings growth was driven by good sales growth in pharmaceuticals. Roche is the world’s largest maker of diagnostic tests, owns more than 50% of U.S.-based biotechnology company Genentech, Inc. and expected future growth in sales of several of its drugs.
SECTOR DIVERSIFICATION
| | | | | | |
| Sector | | 9/30/04 | | | 9/30/05 | |
Consumer Discretionary | | 23.9 | % | | 23.6 | % |
Consumer Staples | | 11.9 | | | 9.8 | |
Energy | | 8.2 | | | 8.7 | |
Financials | | 26.8 | | | 30.4 | |
Healthcare | | 4.5 | | | 4.1 | |
Industrials | | 4.7 | | | 8.0 | |
Information Technology | | 6.4 | | | 6.8 | |
Materials | | 4.8 | | | — | |
Telecommunication Services | | 6.9 | | | 6.1 | |
Utilities | | 0.7 | | | 1.2 | |
Other assets less liabilities | | 1.2 | | | 1.3 | |
Total | | 100.0 | % | | 100.0 | % |
As a percentage of total net assets.
Collectively our consumer discretionary stocks moved higher, but as a group they trailed the returns of the indices. A good portion of the Fund’s relative weakness in the sector stemmed from the underperformance of stocks in our media theme. One of our best performers in the theme was Grupo Televisa S.A., the largest media company in the Spanish-speaking world. Its gain was due in part to a solid increase in earnings due to higher revenues from its satellite television unit. Two of our weaker stocks were British broadcasting company ITV PLC and French outdoor advertiser JC Decaux S.A. ITV was negatively impacted by concerns related to its loss of audience share and the potential for weaker revenues in the future. We significantly pared back our holdings. A key factor in JC Decaux’s decline was the failure to win a contract with New York City (offset partially by a contract win in Kobe, Japan) and softer advertising conditions in France.
Our worst individual performer in the consumer discretionary sector was home improvement retailer Kingfisher PLC. It has
4
FOUR
struggled due to the considerable strain on the consumer in its core U.K. market.
In the consumer staples sector, Wal-Mart de Mexico S.A. de C.V. (Walmex), Latin America’s largest retailer, partially offset those losses by posting a solid gain. Walmex’s sales were better than those of its competitors, it gained market share and it demonstrated an ability to successfully adapt new formats to its geographic and demographic environment.
COUNTRY REVIEW
Economic growth around the globe was generally healthy during the fiscal year, but the pace slowed in many economies and expectations were for additional cooling. Nevertheless, returns for most international markets were strong. We benefited from the strength of our holdings in Japan and in emerging markets.
In Japan, deflation was still a concern during the fiscal year, but it appeared that the government was taking the right steps to sustain economic growth. Consumer spending improved during the year, investment spending was strong and corporate profit margins rose. Plus, for the first time since 1991, economic expansion in Japan was being fueled by consumer and capital spending versus exports and the government. The combination of these effects supported equity prices in our Japanese financials as well as other holdings in Japan such as Sega Sammy Holdings, Inc. and Mitsubishi Corp.
South Korea, Mexico and Russia turned in eye-popping gains in excess of 57%, 64% and 56%, respectively, and were among the best performing emerging markets. In the portfolio, we participated in those gains with our Korean banks, Walmex and Grupo Televisa (Mexico) and LUKOIL (Russia).
REGION ALLOCATION
| | | | | | |
| Region | | 9/30/04 | | | 9/30/05 | |
Europe | | 65.6 | % | | 58.2 | % |
Asia/Pacific | | 25.0 | | | 33.7 | |
Latin America | | 5.3 | | | 3.6 | |
North America | | 2.9 | | | 3.2 | |
As a percentage of total net assets.
TOP 5 COUNTRY ALLOCATIONS
| | | |
| Country | | 9/30/05 | |
Japan | | 21.0 | % |
Germany | | 8.9 | |
United Kingdom | | 8.7 | |
Switzerland | | 8.5 | |
France | | 7.2 | |
As a percentage of total net assets.
FUND CHANGES
We had a fair amount of transaction activity, as represented by new buys and sales, during the fiscal year. As always, our decisions were based on our bottom-up fundamental research. Outside of an increase in our global financials theme early in the fiscal year, there were no specific trends worth noting across sectors. Regionally, the combined effect of our transactions was an increase in emerging markets and a reduction in Europe. We continue to find value in European companies, but the opportunities we found elsewhere were greater. The majority of the increase in emerging markets was due to our previously mentioned investments in Korean banks.
Our largest purchases during the fiscal year included Mitsubishi Corp. (a Japanese general trading company), Jupiter Telecommunications Co., Ltd. (a Japanese cable television provider), Commerzbank AG (a German bank), Banco Comercial Portugues, S.A. (a Portugese bank), Deutsche Post AG (a German retail banker and postal service company), Bayerische Hypo-und Vereinsbank AG (a German bank), Novartis AG (a Swiss pharmaceutical company) and PPR S.A. (a French retailer).
In addition to those already noted, we funded the purchases of those stocks through the sales of Credit Suisse Group, Telefonica, S.A., Clariant AG, Cesky Telecom, A.S., Telenor ASA, Nikko Cordial Corp. and The Bank of Yokohama, Ltd., among others.
FUND STATISTICS
| | | |
Net Assets | | $ 11.7 billion | |
Number of Holdings | | 99 | |
Weighted Average Market Cap | | $ 35.9 billion | |
Weighted Average Growth Rate (3-5 yr) | | 11.0 | % |
Weighted Harmonic Average P/E (2005E) | | 16.1X | |
Source: FactSet/Artisan Partners. All statistics are as of 9/30/05. Net Assets includes Investor Shares and Institutional Shares.
5
FIVE
ARTISAN INTERNATIONAL SMALL CAP FUND (ARTJX)
| | |
| HIGHLIGHTS | | |
• For the twelve months ended September 30, 2005, Artisan International Small Cap Fund outperformed the MSCI EAFE® Small Cap Index. • Strong stock selection in the consumer discretionary and technology sectors was the primary driver of the outperformance. | | • The telecommunications and utilities sectors were positive contributors to our return, but our average stock in those sectors underperformed those sectors’ returns for the benchmark. |
| | | |
| INVESTMENT APPROACH | | |
| We use a bottom-up investment process to construct a portfolio of smaller international growth companies. The investment team conducts its own fundamental analysis with particular emphasis on: | | 1) well-managed companies focused on increasing shareholder value; 2) sustainable growth prospects; 3) reasonable valuations; and 4) strong or increasing market shares or direct exposure to an identified theme. |
| | | |
| PERFORMANCE SUMMARY | | |
| Artisan International Small Cap Fund has slightly outperformed the MSCI EAFE® Small Cap Index since its inception, which generally has been a favorable period for international small cap stocks. |
GROWTH OF AN ASSUMED $10,000 INVESTMENT (12/21/01 to 9/30/05)
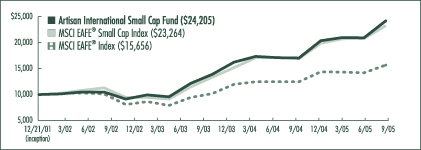
AVERAGE ANNUAL TOTAL RETURNS (as of 9/30/05)
| | | | | | | | | |
| Fund / Index | | 1-Year | | | 3-Year | | | Since
Inception | |
Artisan International Small Cap Fund | | 42.13 | % | | 38.61 | % | | 26.38 | % |
MSCI EAFE® Small Cap Index | | 37.61 | | | 35.03 | | | 25.06 | |
MSCI EAFE® Index | | 25.79 | | | 24.61 | | | 12.61 | |
The performance quoted represents past performance, which does not guarantee future results. The investment return and principal value of an investment in the Fund will fluctuate, so that an investor’s shares in the Fund, when redeemed, may be worth more or less than their original cost. Current performance may be lower or higher than the performance data quoted. For current to most recent month-end performance information, visit www.artisanfunds.com or call 800.344.1770. The graph and table above do not reflect the deduction of taxes that a shareholder would pay on distributions or sale of Fund shares. The performance shown does not reflect the deduction of a 2% redemption fee on shares held by an investor for 90 days or less and, if reflected, the fee would reduce the performance quoted. The Fund’s investments in initial public offerings (IPOs) made a material contribution to the Fund’s performance. IPO investments are not an integral component of the Fund’s investment process and may not be available in the future. See page 80 for a description of each index.
6
SIX
INVESTING ENVIRONMENT
During the twelve months ended September 30, 2005, international small capitalization stocks, measured by the MSCI EAFE® Small Cap Index, posted strong gains with a return of 37.6%, outpacing the return of the larger cap MSCI EAFE® Index, which was up 25.8%. For much of the fiscal year, international small-cap equities held a sizeable advantage compared to their domestic counterparts, and the margin would have been wider were it not for an increase in the U.S. dollar versus currencies such as the euro, yen and pound.
Within the MSCI EAFE® Small Cap Index, energy stocks, utilities and financials were among the best performing groups. The technology and consumer discretionary sectors were the worst performers, though every sector recorded double-digit gains. Regionally, Norway and Sweden were among the leaders in Europe, and Japan showed signs of strong growth.
PERFORMANCE DISCUSSION
Our strongest gains compared to the MSCI EAFE® Small Cap Index were found in the consumer discretionary and technology sectors, where our security selection was particularly good. Our financials and energy stocks also performed well. The telecommunications sector weighed on our relative performance. By country, we benefited most from our stock selection in Japan, while our returns in the United Kingdom were not as good as the Index.
SECTOR REVIEW
Many of our consumer discretionary stocks posted solid gains during the fiscal year ended September 30, 2005. Among the leading performers were Fadesa Inmobiliaria, S.A., Findexa Ltd. and Submarino S.A. Fadesa is the leading developer of residential housing in Spain. The company generated strong pre-sales orders and was expected to take advantage of expansion opportunities in Eastern Europe and Morocco. Low interest rates and strong employment creation in Spain also were beneficial to Fadesa. Findexa is one of the leading media companies in Norway. It received an acquisition offer from Eniro AB, the largest Nordic yellow pages publisher. The acquisition was expected to strengthen the combined companies’ position in the Nordic region, create cost synergies from combined sales and production functions and enhance cash flow generation. Submarino is the largest Internet retailer in Brazil. The company posted strong sales results for its second fiscal quarter, in addition to accelerating earnings and expanding margins. We sold Findexa and Submarino as their share prices increased.
TOP 10 HOLDINGS
| | | | | |
| Company Name | | Country | | 9/30/05 | |
Nexity | | France | | 3.5 | % |
Buhrmann NV | | Netherlands | | 3.2 | |
Banco Latinoamericano de Exportaciones, S.A. | | Panama | | 3.2 | |
Petroleum Geo-Services ASA | | Norway | | 3.1 | |
Elekta AB | | Sweden | | 3.0 | |
Creed Corporation | | Japan | | 2.7 | |
Sulzer AG | | Switzerland | | 2.6 | |
Japan Petroleum Exploration Company, Ltd. | | Japan | | 2.6 | |
Fraser & Neave Limited | | Singapore | | 2.5 | |
Bank Sarasin & Cie, AG | | Switzerland | | 2.1 | |
Total | | | | 28.5 | % |
As a percentage of total net assets. Top 10 Holdings are determined by issuer.
In the technology sector, our standout performers were FINETEC Corporation and Logitech International S.A. FINETEC develops cryogenic insulation materials, products that carry and store liquefied natural gas and rigid polyurethane foam to utilize as refrigerants. The company benefited from favorable contract terms with customers that allowed it to pass on raw material price increases. A surge in Korean shipbuilding orders and large volume orders for parts makers were also expected to fuel FINETEC’s future growth. Logitech, the world’s largest producer of computer mice, benefited from rising demand for wireless computer accessories. Logitech’s product innovation continued to serve as a catalyst for growth.
Our strongest contributors in the financials sector were French property developer Nexity and Japanese real estate advisory firm Creed Corporation. Nexity surged in the months following its initial public offering in October
7
SEVEN
due in part to a growing commercial property order backlog and the most favorable lending environment in France in a half-century. The company made further advances after it announced strong profit gains for the first half of its fiscal year and gave positive forward guidance. Creed posted a significant increase in operating profits as assets under management nearly doubled over the past fiscal year, driving up asset management fees. On the negative side, Malaysian bank AMMB Holdings Berhad posted its first quarterly net loss since the 1997/1998 Asian financial crisis. The loss was partly a result of the company writing off some of its non-performing loans. We trimmed our position.
Petroleum Geo-Services ASA, Smedvig ASA and Stolt Offshore S.A. were among the leading performers in our energy theme. Petroleum Geo-Services, a Norwegian company that uses soundwaves to map potential underground oil, and drilling company Smedvig generated strong profits during their second fiscal quarters. Stolt, a Norwegian oil service company, was expected to make progress in its market with the help of a newly restructured management team. Performance in its core business was strong, and the company was expected to benefit from a continuation of global spending on exploration and development.
Our weakness in the telecommunications sector was primarily the result of Brazilian wireless provider Telesp Celular Participacoes S.A. As competition intensified in the Brazilian cellular market, Telesp Celular’s costs of acquiring new subscribers increased, which caused declining average revenue per user. We trimmed our position.
Another area of relative weakness compared to the MSCI EAFE® Small Cap Index was the industrials sector. Unimpressive results from Austrian brickmaker Wienerberger AG and U.K. product testing company Intertek Group PLC overshadowed solid performance from companies such as Sulzer AG, Metso Oyi and Shanghai Electric Group Company Limited. Soft construction demand in Germany and Eastern Europe put pressure on Wienerberger’s stock price as profit expectations were called into question. Intertek’s first half results came in below expectations as a result of weakness in one of its primary divisions where margins have been under pressure in part due to expansion and restructuring costs.
SECTOR DIVERSIFICATION
| | | | | | |
| Sector | | 9/30/04 | | | 9/30/05 | |
Consumer Discretionary | | 27.6 | % | | 12.8 | % |
Consumer Staples | | 11.6 | | | 4.4 | |
Energy | | 5.2 | | | 10.7 | |
Financials | | 13.9 | | | 24.6 | |
Healthcare | | 8.0 | | | 6.4 | |
Industrials | | 13.1 | | | 22.6 | |
Information Technology | | 3.3 | | | 5.4 | |
Materials | | 3.1 | | | 2.8 | |
Telecommunication Services | | 5.8 | | | 3.1 | |
Utilities | | 1.8 | | | 2.0 | |
Other assets less liabilities | | 6.6 | | | 5.2 | |
Total | | 100.0 | % | | 100.0 | % |
As a percentage of total net assets.
COUNTRY REVIEW
In Europe, the Scandinavian countries of Norway, Denmark and Sweden were among the strongest performing areas of the MSCI EAFE® Small Cap Index. Spain and France also posted solid returns during the period. The United Kingdom was among the laggards due to rising inflation, pressures on the consumer and signs of an economic slowdown. The Bank of England cut interest rates in response to these factors. Our Norwegian holdings were a leading source of strength in the portfolio due to the performance of Petroleum-Geo Services, Smedvig, Findexa, and Stolt Offshore (all discussed above).
In the Pacific Basin, Japan’s economic expansion was fueled by consumer and capital spending versus exports and government spending for the first time since 1991. Our Japanese stocks collectively outpaced those in the benchmark with exceptional performance from Creed (discussed above), Japan Petroleum Exploration Company, Ltd., and Komeri Company, Ltd.
Emerging markets were generally strong this fiscal year, although there were a few pockets of weakness. Among the leaders were South Korea, Brazil and Russia, which turned in gains
8
EIGHT
of over 57%, 89% and 56%, respectively. In the portfolio, we participated in those gains with FINETEC (South Korea), Natura Cosmeticos S.A. (Brazil) and AO VimpelCom (Russia).
REGION ALLOCATION
| | | | | | |
| Region | | 9/30/04 | | | 9/30/05 | |
Europe | | 56.5 | % | | 51.2 | % |
Asia/Pacific | | 25.1 | | | 33.3 | |
Latin America | | 8.3 | | | 7.2 | |
North America | | 3.5 | | | 1.2 | |
Africa | | — | | | 1.8 | |
Middle East | | — | | | 0.1 | |
As a percentage of total net assets.
TOP 5 COUNTRY ALLOCATIONS
| | | |
| Country | | 9/30/05 | |
Japan | | 11.8 | % |
Switzerland | | 9.9 | |
France | | 8.9 | |
Norway | | 7.8 | |
Hong Kong | | 6.1 | |
As a percentage of total net assets.
FUND CHANGES
Notable purchases in the portfolio included Geodis S.A. (France), Shanghai Electric Group (China), Q-Free ASA (Norway) and SBM Offshore NV (Netherlands).
| • | | Geodis is a worldwide provider of shipping and postal services. The company offers parcel and express delivery, large load services, air and sea freight forwarding and warehousing services. The company’s first half fiscal year results showed improvement as it benefited from an increase in new contracts. Furthermore, Geodis has demonstrated its ability to improve upon the performances of its businesses as the company continued to implement its restructuring plan. |
| • | | Shanghai Electric Group is China’s largest manufacturer of coal-fired power equipment. We believed the company was well positioned to benefit from the growing power market in China, the world’s largest electricity consumer after the U.S. |
| • | | We also had some success with Norway-based Q-Free, which is a leading supplier of electronic toll collection systems. Its products include systems for tolling, traffic information, parking and ticketing. Q-Free has a strong market position as a technology leader in delivering those systems. We believed Q-Free stood to benefit from growing demand for road infrastructure and updated systems in several countries. |
| • | | SBM Offshore designs and manufactures offshore floating crude oil loading and unloading systems. The company reported strong results for the first half of its fiscal year and stood to benefit from potential developments of offshore oil fields. |
In addition to the previously mentioned sale of Findexa, we sold several other media stocks over the course of the fiscal year including Corus Entertainment, Inc., RCS MediaGroup S.p.A. and Impresa S.G.P.S., S.A. Canadian media company Corus posted solid earnings due to strong results in its TV and radio units. RCS MediaGroup, the leading publisher of national and sports newspapers in Italy, benefited from increased spending on publicity in television and print media, and we sold our position during the period. We also sold Impresa, one of the leading media companies in Portugal. While the company led the television audience share race in the first quarter, we became concerned with its second quarter earnings outlook as its position eroded in April and May. Additionally, we believed that Portuguese media companies would face a difficult environment in subsequent quarters as the budget crisis and personal consumption might negatively affect advertising spending, the core of media companies’ businesses.
FUND STATISTICS
| | | |
Net Assets | | $ 781.1 million | |
Number of Holdings | | 84 | |
Median Market Cap | | $ 1.5 billion | |
Weighted Average Market Cap | | $ 2.0 billion | |
Weighted Average Growth Rate (3-5 yr) | | 12.2 | % |
Weighted Harmonic Average P/E (2005E) | | 17.0X | |
Source: FactSet/Artisan Partners. All statistics are as of 9/30/05.
9
NINE
ARTISAN INTERNATIONAL VALUE FUND (ARTKX)
| | |
| HIGHLIGHTS | | |
• For the twelve months ended September 30, 2005, Artisan International Value Fund returned 22.71% compared to a 25.79% gain for the MSCI EAFE® Index. • Coming off what we estimated were depressed valuations, investments in branded consumer goods companies Diageo PLC and Unilever PLC provided a significant contribution to our return. | | • Weak economic conditions in the U.K. contributed to poor operating trends and stock price performance from U.K. retailers Carpetright PLC and Signet Group PLC, which negatively impacted portfolio returns during the fiscal year. |
| | | |
| INVESTMENT APPROACH | | |
| We use a bottom-up investment process to construct a portfolio of undervalued non-U.S. companies. We conduct our own in-depth fundamental research with the goal of investing in companies at prices that reflect a significant discount to our estimate of | | economic value. Attention is also given to a company’s balance sheet, historic returns on its capital and management team. Assessing the tradeoffs among these factors is at the heart of our investment process. |
| | | |
| PERFORMANCE REVIEW | | |
| Since inception, which generally has been a favorable period for international value stocks, Artisan International Value Fund has advanced a cumulative 133.39% or 32.41% on an annualized basis, outperforming the returns of both benchmarks. |
GROWTH OF AN ASSUMED $10,000 INVESTMENT (9/23/02 to 9/30/05)
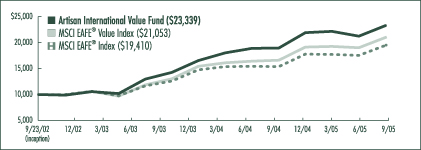
AVERAGE ANNUAL TOTAL RETURNS (as of 9/30/05)
| | | | | | | | | |
| Fund / Index | | 1-Year | | | 3-Year | | | Since
Inception | |
Artisan International Value Fund | | 22.71 | % | | 33.00 | % | | 32.41 | % |
MSCI EAFE® Value Index | | 26.59 | | | 28.32 | | | 27.96 | |
MSCI EAFE® Index | | 25.79 | | | 24.61 | | | 24.57 | |
The performance quoted represents past performance, which does not guarantee future results. The investment return and principal value of an investment in the Fund will fluctuate, so that an investor’s shares in the Fund, when redeemed, may be worth more or less than their original cost. Current performance may be lower or higher than the performance data quoted. For current to most recent month-end performance information, visit www.artisanfunds.com or call 800.344.1770. The graph and table above do not reflect the deduction of taxes that a shareholder would pay on distributions or sale of Fund shares. The performance shown does not reflect the deduction of a 2% redemption fee on shares held by an investor for 90 days or less and, if reflected, the fee would reduce the performance quoted. See page 80 for a description of each index.
10
TEN
INVESTING ENVIRONMENT
Over the twelve months ended September 30, 2005, non-U.S. equity markets earned a return well above what we would consider normal. After years of increasingly correlated performance, equity returns of U.S. and non-U.S. markets diverged during the fiscal year. We can only speculate as to the reasons for this, but we think rising interest rates and rising inflation, as well as record trade and budget deficits, dampened enthusiasm for U.S. assets. Arguably more attractive valuations and an improved economic growth outlook in Japan also might have motivated investors to find international equities more attractive. Currency had a modestly negative impact on performance during the period as the major European currencies and the Japanese Yen weakened.
REGION ALLOCATION
| | | | | | |
| Region | | 9/30/04 | | | 9/30/05 | |
Europe | | 70.1 | % | | 64.4 | % |
Asia/Pacific | | 20.2 | | | 21.1 | |
North America | | 2.0 | | | 5.7 | |
Latin America | | 1.8 | | | 1.8 | |
Middle East | | — | | | 0.6 | |
As a percentage of total net assets.
TOP 5 COUNTRY ALLOCATIONS
| | | |
| Country | | 9/30/05 | |
United Kingdom | | 31.9 | % |
Japan | | 12.4 | |
Switzerland | | 9.5 | |
France | | 8.5 | |
Germany | | 7.3 | |
As a percentage of total net assets.
PERFORMANCE DISCUSSION
We are value investors and our primary task is the purchase of shares of companies that are selling at a meaningful discount to our estimate of intrinsic value. As a result, our efforts are centered around monitoring the economic success or failure of the businesses owned in the portfolio and the consequent impact on intrinsic value. Therefore, our thoughts about performance are always focused on the fundamentals of the companies owned in the portfolio.
The share prices of the following companies had a meaningful positive impact on the portfolio during our fiscal year:
| • | | Euronext N.V. owns the French, Dutch, Belgian and Portuguese stock exchanges. Euronext also owns the London International Financial Futures Exchange. In mid-December 2004, the London Stock Exchange (LSE) received a bid from Deutsche Boerse AG, operator of the German stock exchange. Shortly thereafter, Euronext also approached the LSE with an offer to purchase the company. After a complex series of events, Deutsche Boerse withdrew its offer leaving Euronext as the sole bidder. During this process, the share price of Euronext increased significantly in anticipation of either a successful bid for the LSE or simply due to the increased attention on its own relatively attractive valuation. The bull market in European equities and a pick-up in the IPO market helped Euronext report solid growth in profits, which generated additional investor interest in the company. |
| • | | Zinifex Ltd., based in Australia, is an integrated zinc and lead production company. Though we only began purchasing shares in the company in October 2004, an increase in the price of zinc has caused a dramatic increase in the company’s share price. Zinifex’s earnings are leveraged to the price of zinc and any change in that price has a tremendous impact on the company’s cash flows. Unlike many other commodities, which have long since broken out of their historical trading ranges, zinc began to approach the upper end of its historical price range at the end of our fiscal year. Zinc had remained within its historical range due to the presence of significant excess zinc stockpiles. These excess inventories appeared to be working down, which created a much tighter supply of zinc. |
| • | | Diageo PLC is the world’s largest premium spirits company and has generally been one of the largest holdings in the Fund since inception. We purchased shares in the company because it has a stable of top tier brands and we believed, and still believe, that it is one of the best managed packaged goods companies in the world, as evidenced by the company’s attractive returns, strong cash |
11
ELEVEN
| | flow and modest but steady revenue growth. Over the last twelve months, its share price increased by over 15%. We also received two dividends during the fiscal year, which amounted to almost 4% of the share price as of September 30, 2005. Finally, the company announced a proposal to use its strong balance sheet to repurchase shares amounting to £1.4 billion, or nearly 6% of the company’s market capitalization as of September 30, 2005. |
TOP 10 HOLDINGS
| | | | | |
| Company Name | | Country | | 9/30/05 | |
Countrywide PLC | | United Kingdom | | 5.0 | % |
Diageo PLC | | United Kingdom | | 4.9 | |
Euronext N.V. | | France | | 4.0 | |
Pfeiffer Vacuum Technology AG | | Germany | | 3.9 | |
Wolters Kluwer N.V. | | Netherlands | | 3.8 | |
Meitec Corporation | | Japan | | 3.7 | |
Heidelberger Druckmaschinen AG | | Germany | | 3.5 | |
Signet Group PLC | | United Kingdom | | 3.4 | |
Vodafone Group PLC (ADR) | | United Kingdom | | 3.3 | |
Benfield Group PLC | | United Kingdom | | 3.3 | |
Total | | | | 38.8 | % |
As a percentage of total net assets. Top 10 Holdings are determined by issuer.
| • | | Unilever PLC is an Anglo-Dutch consumer products company. After falling significantly during the months leading up to September 30, 2004, the share price rebounded during the period under review. Though the company has reported a mixed set of results, a number of management and operational changes have been made that created expectations for an improvement in results over the long-term. Unilever has long been known for a cumbersome management structure, and recent simplifications, including a single CEO and a review of the dual corporate structure, have done much to convince investors that the company is serious about addressing its underperformance. |
During our fiscal year, three of our securities that had the largest negative impact on the Fund’s performance were Meitec Corporation, Carpetright PLC and Signet Group PLC.
| • | | Meitec is a Japanese provider of outsourcing services primarily in the engineering industry. The company has a long list of clients who pay a significant premium to gain access to the talent and training of Meitec’s staff. Over the last year, Meitec has run into stumbling blocks. First, in its core business, the company has found it difficult to expand its employee base due to increased competition for a short supply of university graduates. Second, the company made an acquisition that now appears to have eroded shareholder value. Although both of those outcomes lowered our estimate of intrinsic value, our estimate of intrinsic value remained meaningfully above the stock price and we increased our position. |
| • | | Both Carpetright and Signet Group are suffering from recent declines in retail sales and consumer sentiment. Carpetright PLC is a U.K.-based retailer of carpet. Signet Group is a U.K.-based company that owns chains of jewelry stores both in the U.S. and in the U.K., though the U.S. generates the majority of its profits. Following several interest rate increases by the Bank of England, the U.K. economy began to slow in the latter half of 2004. As a result, Carpetright and Signet reported declines in their U.K. revenues and their share prices fell with the whole U.K. retail industry. |
SECTOR DIVERSIFICATION
| | | | | | |
| Sector | | 9/30/04 | | | 9/30/05 | |
Consumer Discretionary | | 18.2 | % | | 21.1 | % |
Consumer Staples | | 17.1 | | | 14.4 | |
Energy | | 0.4 | | | — | |
Financials | | 23.0 | | | 24.3 | |
Healthcare | | 2.6 | | | 2.6 | |
Industrials | | 10.8 | | | 12.5 | |
Information Technology | | — | | | 1.6 | |
Materials | | 14.5 | | | 10.8 | |
Telecommunication Services | | 6.5 | | | 4.7 | |
Utilities | | 1.0 | | | 1.6 | |
Other assets less liabilities | | 5.9 | | | 6.4 | |
Total | | 100.0 | % | | 100.0 | % |
As a percentage of total net assets.
12
TWELVE
FUND CHANGES
We made a number of significant new investments during the fiscal year. We discussed four in our last semiannual report—Zinifex, Heidelberger Druckmaschinen AG, Willis Group Holdings Limited and Renault S.A. In this report, we will review three additional purchases from the second half of our fiscal year: Uni-Charm Corporation, Sekisui House, Ltd. and Tim Participacoes S.A.
Uni-Charm is Japan’s leading manufacturer of branded diapers, feminine care and other sanitary products. The company also has very strong market positions in Thailand, Indonesia and China. In our view, Uni-Charm had strong profitability and a cash-rich balance sheet, which it has used historically to repurchase its own shares. During our fiscal year, strong competition from rival manufacturers generated earnings pressure. The market’s unwillingness to look through to a more normal earnings environment allowed us to purchase a great business, with a shareholder-oriented capital allocation, at what we consider to be a cheap valuation.
Sekisui House is one of Japan’s largest homebuilders. The Japanese market for new homes has been depressed since the mid-1990s. Volumes of pre-fabricated homes, Sekisui’s core business, fell from 76,000 units in 1997 down to 56,000 units in 2004. During that time period, Sekisui’s management was able to maintain the company’s operating profits, which were somewhat offset by losses on land inventory. After years of retrenchment, the company finally started to invest again through a combination of increased marketing programs and increased commitments to land purchases. We invested because we expected a significant improvement in returns and profitability from the current levels through a combination of stabilizing land prices and better utilization of the company’s factories. We were also attracted to the company’s balance sheet strength, management’s material ownership of shares in the company, and most importantly, the market’s willingness to make shares available at close to book value when we initiated our position.
Tim Participacoes S.A. (TIM) is a Brazilian holding company for Telecom Italia Mobile’s investments in wireless telecom operators in the south and northeast of Brazil. According to third quarter 2005 company data, TIM has an estimated 37% of the market in the northeast and 46% share in the south. The company’s subscriber base has grown over the past several years, as penetration rates in Brazil historically have been significantly lower than in many developed parts of the world. That said, an increase in the competitive environment put pressure on companies across the industry. At the time of purchase, backing out the company’s significant net cash position, we estimated that the shares were trading at an enormous discount to valuations of both emerging market and developed market cellular operations elsewhere in the world.
As markets have appreciated, we sold shares in a number of companies as they approached or exceeded our estimate of intrinsic value, including NIPPONKOA Insurance Company, Ltd., Henkel KGaA, PubliGroupe S.A., Koninklijke Numico N.V., Caltagirone Editore S.p.A., Grupo Aeroportuario del Sureste S.A. de C.V. (Grupo Asur), Telecom Corporation of New Zealand, Ltd. and Rinker Group, Ltd. We also sold our shares in Asia Satellite Telecommunications Holdings, Ltd. due in part to our frustration over the slow recovery in demand for AsiaSat’s services. Although the business was strongly cash generative even during the current doldrums, we thought the company may have large expenditures and we felt disinclined to stick around.
We view this level of selling activity to be almost frenetic given our historical experience, though we are not surprised. The strong performance of international equity markets over the last three years offered us very attractive prices on a number of our investments, and we were happy to take the offers. Just as we insist on buying stocks at significant discounts to our estimates of intrinsic value, we also insist on selling them when they approach those targets.
FUND STATISTICS
| | |
Net Assets | | $ 601.2 million |
Number of Holdings | | 41 |
Median Market Cap | | $ 1.7 billion |
Weighted Average Market Cap | | $ 13.5 billion |
Median P/B Value | | 2.1X |
Weighted Harmonic Average P/E (2005E) | | 15.5X |
Source: FactSet/Artisan Partners. All statistics are as of 9/30/05.
13
THIRTEEN
ARTISAN MID CAP FUND (ARTMX)
| | |
| HIGHLIGHTS | | |
• For the twelve months ended September 30, 2005, Artisan Mid Cap Fund trailed the Russell Midcap® and the Russell Midcap® Growth indices. • The technology and healthcare sectors were the Fund’s largest positive return contributors. | | • Two sources of weakness versus the benchmarks were the Fund’s low investment in the utilities and energy (particularly crude producers) sectors and weak security selection in the financials sector. |
| | | |
| INVESTMENT APPROACH | | |
| We use a bottom-up investment process to identify well-managed mid-sized companies whose growth and profit potential are not yet fully recognized by investors. Specifically, we spend most of our time answering three questions about a company before we will invest in it: | | 1) Does the company exhibit franchise characteristics? 2) Is the company positioned for long-term growth and at an early stage in its profit cycle? 3) Is the stock of the company trading at a reasonable discount to our estimate of its private market value? |
| | | |
| PERFORMANCE REVIEW | | |
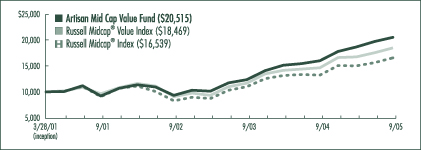
| Artisan Mid Cap Fund has outperformed the Russell Midcap® and Russell Midcap® Growth indices on an annualized basis since inception. |
GROWTH OF AN ASSUMED $10,000 INVESTMENT (6/27/97 to 9/30/05)
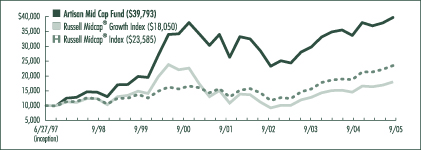
AVERAGE ANNUAL TOTAL RETURNS (as of 9/30/05)
| | | | | | | | | | | | |
| Fund / Index | | 1-Year | | | 3-Year | | | 5-Year | | | Since
Inception | |
Artisan Mid Cap Fund | | 18.06 | % | | 19.39 | % | | 0.87 | % | | 18.20 | % |
Russell Midcap® Growth Index | | 23.47 | | | 24.92 | | | -4.50 | | | 7.41 | |
Russell Midcap® Index | | 25.10 | | | 25.99 | | | 7.17 | | | 10.95 | |
The performance quoted represents past performance, which does not guarantee future results. The investment return and principal value of an investment in the Fund will fluctuate, so that an investor’s shares in the Fund, when redeemed, may be worth more or less than their original cost. Current performance may be lower or higher than the performance data quoted. For current to most recent month-end performance information, visit www.artisanfunds.com or call 800.344.1770. The graph and table above do not reflect the deduction of taxes that a shareholder would pay on distributions or sale of Fund shares. See page 80 for a description of each index.
14
FOURTEEN
INVESTING ENVIRONMENT
Mid-cap stocks held a wide advantage when compared to small- and large-cap stocks during our fiscal year. Within the mid-cap space, value stocks were preferred to growth. All major sectors within the Russell Midcap® and Russell Midcap® Growth indices recorded double-digit advances, but energy stocks were significantly ahead of most. The other sectors that performed well were technology, healthcare and utilities.
It was interesting to see technology and healthcare outperform when growth stocks generally seemed to be out of favor (they both carried a large weight in the Russell Midcap® Growth Index). Utilities likely outperformed as a result of persistently low long-term interest rates, despite the series of short-term interest rate hikes by the Federal Reserve during our fiscal year. Excluding technology, other traditionally cyclical sectors such as materials, producer durables, transportation and consumer discretionary were among the list of laggards. The consumer discretionary sector was under the most strain late in our fiscal year as a combination of record high gasoline prices, a softening housing sector and the threat of huge increases in home heating bills during the coming winter seemed to put a damper on discretionary spending.
PERFORMANCE DISCUSSION
The Fund generated a solid absolute return, but trailed the benchmark indices for the fiscal year ended September 30, 2005. The healthcare and technology sectors were the largest contributors to the Fund’s return. The portfolio also had several notable positive performers from a variety of other sectors. The performance of our financial stocks and our low weight in utilities and energy stocks (particularly crude producers) were key reasons for our underperformance versus the Russell Midcap® and Russell Midcap® Growth indices.
Arguably the largest shift in demographics that will be occurring over the coming years and decades is the retirement of baby boomers. We have used our thoughts about “Shifting Demographics” to focus our research on finding the companies that we believed were best positioned to benefit from the long-term cost burdens that we thought would be placed on the U.S. healthcare system by aging baby boomers. Examples include demand for pharmaceuticals (Allergan, Inc.), benefit management services (Aetna Inc., Caremark Rx, Inc. and Coventry Health Care, Inc.) and automation tools (Cerner Corporation). During our fiscal year, all five of those stocks generated strong absolute returns.
TOP 10 HOLDINGS
| | |
| Company Name | | 9/30/05 |
Constellation Brands, Inc. | | 2.8% |
Smith International, Inc. | | 2.7 |
Danaher Corporation | | 2.2 |
Precision Castparts Corp. | | 2.2 |
ITT Industries, Inc. | | 2.2 |
Allergan, Inc. | | 2.1 |
Varian Medical Systems, Inc. | | 2.0 |
Coventry Health Care, Inc. | | 1.8 |
Ecolab Inc. | | 1.7 |
Juniper Networks, Inc. | | 1.7 |
Total | | 21.4% |
As a percentage of total net assets. Top 10 Holdings are determined by issuer.
Allergan, Inc. benefited from the strength of its Botox® franchise. Botox is primarily known as an anti-wrinkle treatment, but it is also used to treat eye crossing, severe muscle and neck contractions, uncontrollable eye blinking, and excessive sweating, and may have application for headaches and bladder disorders. Aetna, Caremark and Coventry Health Care all released good financial results during our fiscal year. In addition, Aetna announced an acquisition that was expected to enhance earnings and showed good growth in enrollment; Caremark used its strong balance sheet to fund share buybacks and started to realize the true earnings potential of its AdvancePCS merger; and Coventry was on track with the integration of its recently acquired First Health business. Cerner illustrated the strength of its hospital systems automation profit cycle by announcing increases in bookings, earnings and guidance.
In the technology sector, the largest contributor to our performance was Broadcom Corporation, a leading developer of integrated circuits that enable the connectivity of voice, video and data to the consumer and business enterprise. It advanced over 70%. During the fiscal year, Broadcom demonstrated the strength of its profit cycle by reporting sales results well ahead
15
FIFTEEN
of expectations as several product lines (Bluetooth®, WiFi and personal video recorders) posted strong gains.
Other winners in the sector included Marvell Technology Group Ltd., which makes semiconductors, Macromedia, Inc., which develops software tools for the delivery of content across the Internet, and Corning Incorporated, a global technology company that derives the majority of its earnings from display technologies, such as liquid crystal displays (LCDs). Marvell benefited from solid earnings and a favorable outlook based on its increased focus on consumer applications, including hard disk drives and wireless LAN. Macromedia received a premium acquisition offer from Adobe Systems Incorporated, another portfolio holding. Corning has a technological edge over its competitors and benefited from solid LCD sales volumes. NCR Corporation, the world’s largest maker of ATM’s, was one laggard in the sector. It declined in part due to news that CEO Mark Hurd would be leaving to become CEO of Hewlett-Packard Company.
FUND STATISTICS
| | | |
Net Assets | | $ 5.9 billion | |
Number of Holdings | | 100 | |
Median Market Cap | | $ 6.7 billion | |
Weighted Average Market Cap | | $ 9.7 billion | |
Weighted Average Growth Rate (3-5 yr) | | 17.4 | % |
Weighted Harmonic Average P/E (2005E) | | 22.8X | |
Source: FactSet/Artisan Partners. All statistics are as of 9/30/05. Net assets includes Investor Shares and Institutional Shares.
Across the rest of the portfolio a few standout performers were Constellation Brands, Inc., Precision Castparts Corp. and Chico’s FAS, Inc.—all were top twenty holdings as of September 30, 2005.
| • | | Constellation Brands, Inc. is the world’s largest winemaker. It announced several acquisitions during our fiscal year, but the most notable was probably Robert Mondavi Corp. That acquisition closed in the first half of our fiscal year and results reported in the second half showed that it helped the company improve earnings and profitability. |
| • | | Precision Castparts Corp. is a worldwide manufacturer of complex metal components and castings serving the aerospace and industrial gas turbine markets. It announced a strong increase in sales and earnings. In addition, Precision gained market share and announced that it agreed to buy a maker of nickel-based alloys. The deal allowed the company to vertically integrate its forging business, which had the potential to result in significant margin expansion. |
| • | | Chico’s FAS, Inc. is a specialty retailer of women’s apparel targeting middle-aged women. It continued to benefit from its brand position with women baby boomers, which translated into strong organic sales growth, and from the growth of its White House Black Market concept. |
One of our weakest performers in the financials sector was student loan outsourcer The First Marblehead Corporation. Its shares were under pressure as one of its customers indicated that it would start marketing a private student loan product of its own. CapitalSource Inc., a lender to small and medium-sized businesses, Willis Group Holdings Limited, an insurance broker, and MGIC Investment Corporation, the U.S.’s leading provider of private mortgage insurance, also underperformed. CapitalSource was negatively impacted by some concerns about certain credit quality metrics. Willis Group reported weak earnings stemming from a regulatory settlement and related costs. These were a result of the company’s transition, with the rest of the industry, to a more transparent revenue model after the increased regulatory scrutiny of the industry. MGIC’s shares were under pressure due to the continued use of piggyback home equity loans, which negate the need for private mortgage insurance. We kept all three positions.
The global supply/demand imbalance, geopolitical uncertainty and speculation all contributed to record prices for crude oil and corresponding price appreciation for crude oil producers, which advanced more than 80% in our benchmarks during the fiscal year. We understood these trends, but crude producers did not meet the fundamental standards of our process. We seek out companies that possess franchise characteristics, such as a proprietary asset, a defensible brand or cost or market share advantages. By definition, commodity- driven earnings streams do not possess any of these traits. Because they did not meet the standards of our investment process, we had a relatively low weight in crude producers,
16
SIXTEEN
which weighed on performance compared to the Russell Midcap® and Russell Midcap® Growth indices.
Longer term, we believed that the growing demand for energy would have an impact that extended beyond the price of crude. Accordingly, we invested in service companies or what we defined as “infrastructure” providers. Examples include Smith International, Inc., Cooper Cameron Corporation, Noble Corporation, Kinder Morgan, Inc., Joy Global Inc. and McDermott International, Inc. We anticipated a lengthy cycle of renewed spending, aimed at increasing the capacity of traditional energy sources as well as developing alternatives. In fact, in the third quarter, Congress passed an energy bill that created incentives for such spending here in the United States.
FUND CHANGES
Our largest positions are those companies where our conviction is highest and throughout our fiscal year we took the opportunity to focus capital in the portfolio when opportunities presented themselves. Our
SECTOR DIVERSIFICATION
| | | | | | |
| Sector | | 9/30/04 | | | 9/30/05 | |
Auto & Transportation | | 4.0 | % | | 0.9 | % |
Consumer Discretionary | | 24.9 | | | 17.8 | |
Consumer Staples | | 2.1 | | | 2.8 | |
Financial Services | | 10.3 | | | 11.3 | |
Healthcare | | 16.6 | | | 19.6 | |
Integrated Oils | | — | | | — | |
Materials & Processing | | 8.1 | | | 7.0 | |
Other | | 2.4 | | | 3.8 | |
Other Energy | | 5.0 | | | 6.8 | |
Producer Durables | | 8.1 | | | 6.7 | |
Technology | | 14.9 | | | 19.0 | |
Utilities | | 0.9 | | | 1.7 | |
Other assets less liabilities | | 2.7 | | | 2.6 | |
Total | | 100.0 | % | | 100.0 | % |
As a percentage of total net assets.
top 10 holdings as a percentage of portfolio assets increased from 14% of the portfolio as of September 30, 2004 to 21% as of September 30, 2005. Over that same period, our top 20 holdings increased from 27% to nearly 37% of portfolio assets.
The largest change in our sector weights during the fiscal year was a reduction in consumer discretionary. It fell from about 25% of portfolio assets to approximately 18%. We believed that companies sensitive to consumer spending were facing headwinds, which put pressure on their ability to accelerate profits (a key tenet of our process). The waning effects of fiscal stimuli, an extended series of interest rate hikes by the Federal Reserve and the impact of record high gasoline prices were among the factors that were clearly starting to create strain on the consumer.
The retail industry was the group within the consumer discretionary sector to experience the most selling activity. Of the stocks we held at the beginning of the fiscal year, we sold American Eagle Outfitters, Inc., CarMax, Inc., Nordstrom, Inc., Staples, Inc., Ross Stores, Inc., Bed Bath & Beyond Inc., CDW Corporation, Costco Wholesale Corporation and Linens ‘n Things, Inc. We bought three securities in the retail industry during the fiscal year. Of those three, the only security we held at the end of the fiscal year was office supplies retailer Office Depot, Inc. Other recent sales of note in the consumer discretionary sector included Lamar Advertising Company, Univision Communications Inc. and Corinthian Colleges, Inc.
Our weight in the healthcare sector increased, which partially offset the drop in our consumer discretionary weight. The purchases we made in healthcare included Genzyme Corporation (one of the largest U.S. biotechnology companies), AmerisourceBergen Corporation (the third largest U.S. drug wholesaler), St. Jude Medical, Inc. (a maker of implantable cardiac defibrillators) and the previously mentioned Coventry Health Care. The largest sale in the sector was Boston Scientific Corporation.
17
SEVENTEEN
ARTISAN MID CAP VALUE FUND (ARTQX)
| | |
| HIGHLIGHTS | | |
• For the twelve months ended September 30, 2005, Artisan Mid Cap Value Fund outperformed the Russell Midcap® Value and Russell Midcap® indices. • The strongest contributors to our relative performance were our outsized investment in energy stocks and our security selection in the financial services sector. | | • Relative returns were hurt by our selections in the consumer discretionary sector when compared to the Russell Midcap® Value Index. |
| | | |
| INVESTMENT APPROACH | | |
| Our goal is to invest in companies that are priced below our estimate of the value of the business and that provide a controlled level of risk. It is important to complement stock price value with a company that is financially strong and possesses favorable economics. Our focus is on individual companies, rather than on economic or market trends. | | The Fund often finds investment opportunities in companies that are in the midst of a turnaround, are in transition, are experiencing declining earnings and/or have earnings short-falls. |
| | | |
| PERFORMANCE REVIEW | | |
| Artisan Mid Cap Value Fund has outperformed the Russell Midcap® Value and Russell Midcap® indices over the trailing one- and three-year periods ended September 30, 2005 and from the Fund’s inception through September 30, 2005. |
GROWTH OF AN ASSUMED $10,000 INVESTMENT (3/28/01 to 9/30/05)
AVERAGE ANNUAL TOTAL RETURNS (as of 9/30/05)
| | | | | | | | | |
| Fund / Index | | 1-Year | | | 3-Year | | | Since
Inception | |
Artisan Mid Cap Value Fund | | 28.42 | % | | 30.03 | % | | 17.27 | % |
Russell Midcap® Value Index | | 26.13 | | | 26.68 | | | 14.57 | |
Russell Midcap® Index | | 25.10 | | | 25.99 | | | 11.80 | |
The performance quoted represents past performance, which does not guarantee future results. The investment return and principal value of an investment in the Fund will fluctuate, so that an investor’s shares in the Fund, when redeemed, may be worth more or less than their original cost. Current performance may be lower or higher than the performance data quoted. For current to most recent month-end performance information, visit www.artisanfunds.com or call 800.344.1770. The graph and table above do not reflect the deduction of taxes that a shareholder would pay on distributions or sale of Fund shares. See page 80 for a description of each index.
18
EIGHTEEN
INVESTING ENVIRONMENT
All sectors in the Russell Midcap® Value Index posted double digit gains during the twelve months ended September 30, 2005. The energy sector was the strongest performer bar none, as investors reacted to the surge in gas and oil prices. The technology, healthcare and utilities sectors also generated returns that outpaced the overall Index. Financial stocks posted moderate results comparatively, but due to the substantial weight of that sector in the Index, they materially contributed to the overall performance of the Index. With the expectation that the rise in energy prices would pinch the pocketbooks of consumers, it is no surprise that consumer-oriented companies lagged other sectors.
The Fund benefited not only from our outsized investment in energy stocks but also from good stock selection in several sectors. Our relative performance was also strong in the financials and materials and processing sectors. The weakest area of the portfolio when compared to the Russell Midcap® Value Index was the consumer discretionary sector.
PERFORMANCE DISCUSSION
All of our holdings in the energy sector positively impacted returns and several were among our best performers for the fiscal year. EOG Resources, Inc., XTO Energy Inc., Pioneer Natural Resources Company and Noble Energy, Inc. were among the leaders in the group. The solid performance of EOG was the result of strong production growth coupled with increased enthusiasm for its Barnett Shale operation. As the stock became more optimistically valued, we responded by selling our shares and eventually exited our position as it reached our target selling range. XTO’s gains were primarily the result of stronger than expected production volumes, which drove excellent cash flows and earnings. In addition, XTO increased its dividend payout and announced a stock split during the period. Pioneer announced plans to sell a portion of its assets, primarily those located in the Gulf of Mexico, in order to focus more closely on its onshore assets. Noble increased production and reserves through its acquisition of Patina Oil & Gas Corp. and shifted to a lower-risk exploration and development strategy. Additional projects in the Gulf of Mexico, an area of competency for the company, were expected to provide additional benefits. Noble has a seasoned management team committed to maintaining a financially disciplined organization.
TOP 10 HOLDINGS
| | | |
| Company Name | | 9/30/05 | |
The Student Loan Corporation | | 4.6 | % |
Pioneer Natural Resources Company | | 4.5 | |
Nuveen Investments, Inc. | | 3.2 | |
Alleghany Corporation | | 3.1 | |
Lexmark International, Inc. | | 2.9 | |
Apache Corporation | | 2.7 | |
The Sherwin-Williams Company | | 2.5 | |
The Lubrizol Corporation | | 2.5 | |
White Mountains Insurance Group, Ltd. | | 2.5 | |
BEA Systems, Inc. | | 2.3 | |
Total | | 30.8 | % |
As a percentage of total net assets. Top 10 Holdings are determined by issuer.
While our minimal investments in the bank and REIT industries helped relative performance, it was our strong stock selection that was the true driver of performance within the financials sector. The Student Loan Corporation, SunGard Data Systems Inc. and Nuveen Investments, Inc. were our leading contributors, returning 67%, 51% and 33%, respectively. Student Loan, which was our largest single holding as of September 30, 2005, was positioned well to benefit from several long-term demographic trends. The market continued to recognize the company’s financial strength and its attractiveness compared to industry leader Sallie Mae. SunGard Data Systems’ stock price surged when the company announced that it had agreed to be acquired by a group of private equity investment firms. Nuveen’s municipal bond franchise has contributed to an industry leading level of profitability. The company also benefited from good quarterly earnings and strong net asset flows.
We also had good performance among our technology stocks. Avnet, Inc. is one of the largest distributors of electronic components and computer products in the world. Our
19
NINETEEN
initial attraction to the company was based on the potential for an improvement in profitability. We also liked the continued prospects for improving Avnet’s balance sheet, including a declining debt burden and its strong cash flow generation. Furthermore, Avnet announced the strategic acquisition of another distributor (Memec Group Holdings Limited), which excited the market because it was expected to create many synergies and add distribution in Japan. The share price of BMC Software, Inc., which provides infrastructure systems software, declined earlier in the year when it announced slower than expected sales growth. The stock subsequently rebounded upon news that the company was going to implement a new restructuring plan to help lower costs and improve profitability, which helped mitigate investor concerns. The company also reported strong year-over-year license revenue and better than expected earnings, due in part to solid performance from its mainframe and service management segments. Cash flow from operations was strong and BMC repurchased shares as a part of its buyback program.
FUND STATISTICS
| | |
Net Assets | | $ 2.8 billion |
Number of Holdings | | 51 |
Median Market Cap | | $3.5 billion |
Weighted Average Market Cap | | $5.0 billion |
Median P/B Value | | 1.9X |
Weighted Harmonic Average P/E (2005E) | | 14.5X |
Source: FactSet/Artisan Partners. All statistics are as of 9/30/05.
Our consumer-oriented stocks were the main area of weakness in the portfolio this year. The share prices of Furniture Brands International, Inc. and Rent-A-Center, Inc. declined during the fiscal year, with additional weakness in some other holdings. Furniture Brands, the largest home furnishings manufacturer in the U.S., continued to generate strong cash flows and to buy back stock aggressively, but reported a decline in profitability. The company was dealing with a difficult industry environment that was characterized by strong competitive pressures and weak demand. The company’s strategy of closing domestic factories and sourcing product offshore may be an effective way to address challenges it faced within the industry. Rent-A-Center, the largest U.S. rent-to-own retailer, reported a decline in profits resulting from lower sales and higher costs related to new stores and acquisitions. The company’s strategy to sell, merge or close underperforming stores may prove to be beneficial.
Although our consumer-oriented stocks were generally weak during the fiscal year, we had pockets of solid performance from names such as Reebok International Ltd., Darden Restaurants, Inc., and Marvel Entertainment, Inc. Reebok International’s stock rose sharply when Adidas-Salomon AG, the number two athletic-shoe and apparel maker in the world, announced plans to acquire Reebok in order to more effectively challenge the market leader, Nike Inc. Casual dining company Darden continued to benefit from the strength of the Olive Garden® brand and a recovery in its Red Lobster® brand. Marvel Entertainment, a globally recognized character franchise, generated strong cash flows and solid financial returns in its licensing business.
FUND CHANGES
We had a fair amount of activity in the portfolio this fiscal year as we added several new positions while trimming or exiting a good number of names. Some of our newer additions included Lexmark International, Inc., The Lubrizol Corporation and Mohawk Industries, Inc. Lexmark is a leading manufacturer of computer printers. We were attracted to the company’s strong business model defined by consistent revenue generation and limited competitors. The company has also produced strong cash flows and has a history of share repurchases. We liked diversified chemical company Lubrizol for its ability to generate free cash flow and reduce debt from the sale of non-core businesses. We were attracted to Mohawk, the largest provider of floor coverings in the U.S., because of its leadership position in the industry, its breadth of product selection, and its pricing advantage. Other purchases made during the period included Pogo Producing Company (oil and gas exploration and production company), Ryder System, Inc. (logistics and supply chain solutions provider), Leggett & Platt, Incorporated (component
20
TWENTY
manufacturer), Torchmark Corporation (life insurance provider) and Cimarex Energy Co. (independent oil and gas exploration and production company).
SECTOR DIVERSIFICATION
| | | | | | |
| Sector | | 9/30/04 | | | 9/30/05 | |
Auto & Transportation | | 3.5 | % | | 2.9 | % |
Consumer Discretionary | | 22.9 | | | 28.7 | |
Consumer Staples | | 1.3 | | | — | |
Financial Services | | 29.3 | | | 27.1 | |
Healthcare | | 5.7 | | | — | |
Integrated Oils | | — | | | — | |
Materials & Processing | | 5.0 | | | 7.0 | |
Other | | 0.3 | | | — | |
Other Energy | | 18.3 | | | 14.8 | |
Producer Durables | | — | | | 3.6 | |
Technology | | 6.0 | | | 7.9 | |
Utilities | | 1.5 | | | 1.0 | |
Other assets less liabilities | | 6.2 | | | 7.0 | |
Total | | 100.0 | % | | 100.0 | % |
As a percentage of total net assets.
Some of our larger sales this year were EOG Resources, Inc., Newfield Exploration Company, SunGard Data Systems, Inc., and Universal Health Services, Inc. Both EOG and Newfield Exploration were sold as they reached our target selling ranges. As mentioned earlier, SunGard Data Systems accepted an acquisition offer from a group of private equity investment firms, and we received cash in exchange for our shares as the transaction was completed. Other sales included Synopsys, Inc. (electronic design automation software supplier), Republic Services, Inc. (solid waste services provider) and Countrywide Financial Corporation (mortgage banking and diversified financial services). We sold Synopsys due to concerns its competitive position was deteriorating and uncertainties about its financial condition. We began paring back our position in Republic Services in 2004 and sold our position when it moved into the high end of our target selling range in 2005. Countrywide, which had a more than three and a half year run in the portfolio, was sold during the period. Its market capitalization had grown too large for the portfolio, and the company’s gains pushed its share price up to our target selling range.
Perhaps the most significant change to the Fund during the fiscal year was the reduction in our energy sector investments. Our energy holdings in aggregate returned over 79% during the fiscal year ended September 30, 2005, and application of our valuation discipline caused us consistently to pare back our energy investments during the period. As we mentioned earlier, two of our largest sales were EOG Resources and Newfield Exploration. We also trimmed other energy holdings on a stock-by-stock basis. Consequently, our investments in the sector as a percentage of the overall portfolio decreased to 14.8% as of September 30, 2005, down from 18.3% as of September 30, 2004.
Until recently, we believed many energy stocks still offered attractive valuations, but over the past several months, they too appreciated to the point where many began to look more fair than cheap. We attributed this to a growing belief among investors that the commodity price increases seen in energy were not a short-term blip, but in fact a longer-term feature of the landscape. This drove valuations in these stocks up from levels that reflected doubt to those that reflected some conviction.
The storms in the producing areas of the Gulf of Mexico and adjacent coastal areas magnified and accelerated this process. Our view continued to be that higher unit finding costs were the primary driving force behind long-term equilibrium prices.
Commodity prices at any given point in time are heavily influenced by incremental developments on both supply and demand sides of the equation. We valued companies on the basis of our view of long-term prices, not getting carried away in the excitement of the price charts and the TV. We then adjusted our portfolio positions by comparing our conclusions suggested by this work to what we saw going on in the market. Accordingly, we reduced our holdings over the course of the fiscal year. Even with our cutbacks, we still held a substantial weight in the energy area, believing that at least relatively, the stocks we owned still offered worthwhile potential.
21
TWENTY-ONE
ARTISAN SMALL CAP FUND (ARTSX)
| | |
| HIGHLIGHTS | | |
• For the twelve months ended September 30, 2005, Artisan Small Cap Fund led both the Russell 2000® and Russell 2000® Growth indices due to good stock selection. • The Fund performed best compared to the indices in the healthcare, technology and transportation sectors. | | • Although stock selection was fairly strong across the portfolio, there were a few positions in the materials and producer durables sectors that had poor returns. |
| | | |
| INVESTMENT APPROACH | | |
| We use a bottom-up investment process to identify well-managed small companies whose growth and profit potential are not yet fully recognized by investors. During the security selection process, our analysis is aimed at addressing four questions about a company: | | 1) Is the company growing earnings? 2) Does the company have a competitive advantage? 3) Is the company investing capital wisely? 4) Is the company’s stock trading at a reasonable price? |
| | | |
| PERFORMANCE REVIEW | | |
| For the one-, three-, and five-year periods ended September 30, 2005, the Fund has outperformed the Russell 2000® Growth and the Russell 2000® indices. |
GROWTH OF AN ASSUMED $10,000 INVESTMENT (3/28/95 to 9/30/05)
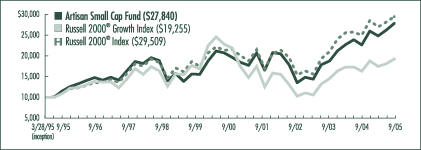
AVERAGE ANNUAL TOTAL RETURNS (as of 9/30/05)
| | | | | | | | | | | | | | | |
| Fund / Index | | 1-Year | | | 3-Year | | | 5-Year | | | 10-Year | | | Since
Inception | |
Artisan Small Cap Fund | | 22.64 | % | | 27.05 | % | | 7.18 | % | | 8.21 | % | | 10.23 | % |
Russell 2000® Growth Index | | 17.97 | | | 23.23 | | | -2.54 | | | 4.67 | | | 6.43 | |
Russell 2000® Index | | 17.95 | | | 24.12 | | | 6.45 | | | 9.37 | | | 10.85 | |
The performance quoted represents past performance, which does not guarantee future results. The investment return and principal value of an investment in the Fund will fluctuate, so that an investor’s shares in the Fund, when redeemed, may be worth more or less than their original cost. Current performance may be lower or higher than the performance data quoted. For current to most recent month-end performance information, visit www.artisanfunds.com or call 800.344.1770. The graph and table above do not reflect the deduction of taxes that a shareholder would pay on distributions or sale of Fund shares. See page 80 for a description of each index.
22
TWENTY-TWO
INVESTING ENVIRONMENT
Our fiscal year ended September 30, 2005 was a good period for small-cap stocks, which advanced nearly 18% measured by the Russell 2000® Index, and a phenomenal year for energy stocks. Supported by a surge in the price of crude oil, energy stocks in our benchmarks advanced over 70%. For most of the period, consumer stocks showed resilience to this upward pressure on energy costs, but at the end consumers clearly started to show some wear as gasoline costs set records. This translated to weak returns for consumer stocks late in the period.
Energy costs also contributed to concerns about inflation. This kept the Federal Reserve in a tightening mode throughout the fiscal year—it raised rates eight times during the period, bringing its string of hikes to eleven. The upward pressure on short-term interest rates caused some strain on financial stocks, particularly as long-term interest rates moved only slightly higher. Conversely, relatively low long-term interest rates were a catalyst behind the strength of utilities stocks.
Across the rest of the economy, healthcare stocks outperformed, while technology stocks and transportation stocks underperformed.
PERFORMANCE DISCUSSION
The main driver of the Fund’s outperformance during the fiscal year was good stock selection. Our stocks in the healthcare, technology and transportation sectors were three of the areas that added the most value relative to the benchmarks. Our stocks in the producer durables and materials sectors generally underperformed, but overall it was a good period for the portfolio.
In the healthcare sector, our list of largest gainers included IDX Systems Corporation and LabOne, Inc. Late in the fiscal year, IDX Systems, which makes software that tracks patient records and billing, received a takeout offer from GE, which was looking to expand in the fast-growing healthcare information technology business. Risk assessment services and lab testing company LabOne received an offer from Quest Diagnostics, the largest U.S. operator of medical-testing laboratories. The acquisition was expected to expand Quest’s lead in the laboratory testing services market. LabOne was doing well prior to the offer due in part to solid earnings results and news that its new laboratory facility was on target for a full transition early in the third quarter of 2005. We sold our position in LabOne.
Other winners in the healthcare sector included Respironics, Inc. (a medical devices company that develops therapy products for sleep apnea and other respiratory disorders), United Surgical Partners International, Inc. (a short-stay surgical facility operator) and SFBC International, Inc. (a contract research organization to pharmaceutical and biotechnology companies). All three posted solid financial results. We sold Respironics and United Surgical Partners after each reached our target price.
TOP 10 HOLDINGS
| | | |
| Company Name | | 9/30/05 | |
Tekelec | | 1.8 | % |
IDX Systems Corporation | | 1.6 | |
Sierra Health Services, Inc. | | 1.6 | |
TNS, Inc. | | 1.6 | |
Strayer Education, Inc. | | 1.6 | |
optionsXpress Holdings, Inc. | | 1.6 | |
Actuant Corporation | | 1.6 | |
Ohio Casualty Corporation | | 1.5 | |
Avocent Corporation | | 1.5 | |
W-H Energy Services, Inc. | | 1.5 | |
Total | | 15.9 | % |
As a percentage of total net assets. Top 10 Holdings are determined by issuer.
In the technology sector, our strongest individual contributor was SiRF Technology Holdings, Inc. (a purchase during the fiscal year). SiRF’s share price more than doubled from the time of our initial purchase. Its technologies are designed to provide location awareness capabilities for car navigation systems, cellular phones and other hand-held devices. We bought the security, in part, because the Global Positioning System (GPS) market currently has very low penetration rates, but we believed the end market opportunity is huge. During the period, SiRF benefited from rapid adoption of GPS technology, a new product that is expected to
23
TWENTY-THREE
lower the cost of automotive navigation and its designation as Motorola’s preferred GPS technology supplier. Switching and connectivity solutions provider Avocent Corporation and data networking equipment provider Foundry Networks, Inc. also contributed strongly to our performance in the technology sector. Avocent went through a rough period in the first half of our fiscal year, but recovered nicely during the second half as it reported sales well ahead of expectations and made significant strides in its plan to rebound from a pricing and packaging misstep. Foundry performed well as revenue growth was strong, it added a large number of new customers and its newer products gained momentum.
Financial software solutions provider SS&C Technologies, Inc. was one of several solid performers in the software industry. It reported record revenues as the company continued to grow its outsourcing business organically and through acquisitions. Progress Software Corporation and Ascential Software Corporation were two additional software providers that recorded strong gains. On the downside, Magma Design Automation, Inc. disappointed during the fiscal year. It booked a significant amount of new business, but failed to make any headway due to the overhang of patent litigation with a competitor. We ultimately sold our position due to better opportunities elsewhere.
FUND STATISTICS
| | | |
Net Assets | | $ 1.1 billion | |
Number of Holdings | | 84 | |
Median Market Cap | | $ 862.4 million | |
Weighted Average Market Cap | | $ 998.7 million | |
Weighted Average Growth Rate (3-5 yr) | | 19.4 | % |
Weighted Harmonic Average P/E (2005E) | | 21.7X | |
Source: FactSet/Artisan Partners. All statistics are as of 9/30/05.
In the transportation sector, the leading contributor to performance was global logistics provider Pacer International, Inc., whose share price increased more than 60% during the fiscal year. It benefited in part from good earnings results and improving business volumes. Low fare airline AirTran Holdings, Inc. was another winner. It benefited from an improved competitive landscape late in the fiscal year as Delta Air Lines announced fare increases and capacity cuts, and ultimately filed for bankruptcy.
Our gains relative to the benchmarks in the consumer discretionary sector were not as significant as those in healthcare, technology and transportation. The retail industry was the source of our largest relative gains. In the benchmarks, retail stocks generally were weak, but courtesy of big gains in Coldwater Creek Inc., Central Garden & Pet Company and Hibbett Sporting Goods, Inc., among others, the retail industry was one of our best. The prices of all three stocks posted large gains. Other stocks such as LKQ Corporation and Spectrum Brands, Inc. (formerly Rayovac Corporation) also produced big gains. Unfortunately, there were several stocks on the other side of the ledger that offset a good portion of our success. That list of stocks included Spanish Broadcasting System, Inc., MIVA Inc. (formerly FindWhat.com) and Autobytel Inc. We decided to hold onto our position in Spanish Broadcasting, but sold MIVA and Autobytel.
The securities in the materials and producer durables sectors that generated the most disappointing returns were Spartech Corporation, Trex Company, Inc. and Axcelis Technologies, Inc. Composite decking materials manufacturer Trex and plastics manufacturer Spartech each disappointed the market by announcing lower than anticipated financial guidance. In both cases the adjusted expectations were, to us, a prelude to transitions in which we did not want to participate, so we sold our positions in both stocks. Axcelis, a semiconductor equipment company, reported weak earnings and guidance, and orders for the company’s products were expected to be pushed out to future quarters. We held our position believing that its shares were trading at an attractive valuation.
During the fiscal year, merger and acquisition activity benefited small companies from many sectors. To a large degree, the pick-up could be attributed to strong profits for U.S. corporations and healthier balance sheets than we have seen in several decades. This generally
24
TWENTY-FOUR
had a positive impact on performance. We already mentioned the takeouts of IDX Systems and LabOne. Other companies in the portfolio that received takeout offers included Magnum Hunter Resources, Inc. (an oil and gas producer), Ascential Software Corporation (an enterprise software provider), Brookstone, Inc. (a multi-channel retailer), CUNO Incorporated (a manufacturer of water filtration products) and School Specialty, Inc. (an educational supplies marketer). We sold our positions in all five stocks.
FUND CHANGES
We had a fair amount of transaction activity (as defined by new purchases and sales) during our fiscal year. However, in large part, the sector weights in the portfolio were fairly similar when comparing the beginning and end of the period values. Three exceptions were a reduction in our consumer discretionary weight and increases to our energy and financial weights.
Gasoline prices have gone up significantly over the past two years, and it was estimated that the average consumer would face a large increase in home heating bills during the winter of 2005/2006. The threat of higher interest rates and a cooling housing market compounded the situation. We believed the obvious consequence would be a reduction in discretionary spending to compensate for the added cost burden. At the portfolio level, this translated to our lower weight in the consumer discretionary sector since the beginning of the fiscal year. In addition to the sales already noted, we exited RC2 Corporation, Carter’s, Inc., Too, Inc. and Harris Interactive Inc., among others. In the latter half of the fiscal year, we purchased Strayer Education, Inc., Prestige Brands Holdings, Inc. and Deckers Outdoor Corporation, which partially offset the reduction in weight caused by the sales.
Within the energy sector, we purchased Brigham Exploration Company, Global Power Equipment Group Inc., James River Coal Company, TODCO and Hornbeck Offshore Services, Inc. In the financial sector, most of our additions occurred during the first half of the fiscal year, but the one new addition in the second half was National Financial Partners Corp.
SECTOR DIVERSIFICATION
| | | | | | |
| Sector | | 9/30/04 | | | 9/30/05 | |
Auto & Transportation | | 4.0 | % | | 3.8 | % |
Consumer Discretionary | | 25.2 | | | 21.2 | |
Consumer Staples | | — | | | — | |
Financial Services | | 10.8 | | | 14.1 | |
Healthcare | | 13.5 | | | 14.7 | |
Integrated Oils | | — | | | — | |
Materials & Processing | | 3.8 | | | 3.8 | |
Other | | — | | | — | |
Other Energy | | 5.0 | | | 7.6 | |
Producer Durables | | 8.7 | | | 8.7 | |
Technology | | 23.5 | | | 22.4 | |
Utilities | | 1.1 | | | — | |
Other assets less liabilities | | 4.4 | | | 3.7 | |
Total | | 100.0 | % | | 100.0 | % |
As a percentage of total net assets.
Other significant purchases were Symmetry Medical Inc. (a manufacturer of medical devices for the orthopedics industry), IntraLase Corp. (a laser technology provider for the first step of LASIK surgery), F5 Networks, Inc. (an innovative provider of services that help companies manage their Internet traffic), Open Solutions Inc. (a provider of integrated processing technologies for banks and credit unions), California Pizza Kitchen, Inc. (an owner, licensor and franchiser of premium pizza restaurants) and Witness Systems, Inc. (a provider of customer contact software).
Those additions were funded, in part, by the sales already noted and sales of Impax Laboratories, Inc., Cost Plus, Inc., Borland Software Corporation, Strategic Hotel Capital, Inc. and Texas Capital Bancshares, Inc.
25
TWENTY-FIVE
ARTISAN SMALL CAP VALUE FUND (ARTVX)
| | |
| HIGHLIGHTS | | |
• For the twelve months ended September 30, 2005, Artisan Small Cap Value Fund outperformed the Russell 2000® and Russell 2000® Value indices. • The strong performance of our energy, financial and healthcare stocks was the main reason we were able to outpace the benchmarks during the period. | | • Relative returns were hurt by our selections in the consumer discretionary sector when compared to the Russell 2000® Value Index. |
| | | |
| INVESTMENT APPROACH | | |
| Our goal is to invest in companies that are priced below our estimate of the value of the business and that provide a controlled level of risk. It is important to complement stock price value with a company that is financially strong and possesses favorable economics. Our focus is on individual companies, rather than on economic or market trends. | | The Fund often finds investment opportunities in companies that are in the midst of a turnaround, are undiscovered or unsponsored, have hidden assets and/or are in the process of a major change. |
| | | |
| PERFORMANCE REVIEW | | |
| Artisan Small Cap Value Fund has outperformed the Russell 2000® Value and the Russell 2000® indices over the trailing one- three- and five-year periods ended September 30, 2005, and from the Fund’s inception through September 30, 2005. |
GROWTH OF AN ASSUMED $10,000 INVESTMENT (9/29/97 to 9/30/05)
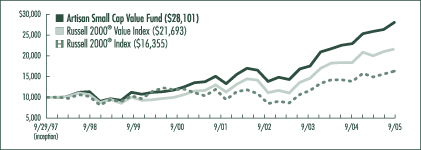
AVERAGE ANNUAL TOTAL RETURNS (as of 9/30/05)
| | | | | | | | | | | | |
| Fund / Index | | 1-Year | | | 3-Year | | | 5-Year | | | Since
Inception | |
Artisan Small Cap Value Fund | | 22.42 | % | | 26.58 | % | | 17.56 | % | | 13.78 | % |
Russell 2000® Value Index | | 17.75 | | | 24.89 | | | 15.18 | | | 10.16 | |
Russell 2000® Index | | 17.95 | | | 24.12 | | | 6.45 | | | 6.34 | |
The performance quoted represents past performance, which does not guarantee future results. The investment return and principal value of an investment in the Fund will fluctuate, so that an investor’s shares in the Fund, when redeemed, may be worth more or less than their original cost. Current performance may be lower or higher than the performance data quoted. For current to most recent month-end performance information, visit www.artisanfunds.com or call 800.344.1770. The graph and table above do not reflect the deduction of taxes that a shareholder would pay on distributions or sale of Fund shares. See page 80 for a description of each index.
26
TWENTY-SIX
INVESTING ENVIRONMENT
Small capitalization stocks posted solid gains for the fiscal year ended September 30, 2005, while, for the most part, value-oriented and medium-cap indices led the way. All sectors in the Russell 2000® Value Index generated positive returns, but the energy sector was the strongest performer bar none, as investors reacted to the surge in gas and oil prices. Other leading areas of the Index included the utilities, materials and processing, and producer durables sectors.
We benefited from gains in the energy sector primarily due to our out-sized investment in energy stocks, but also in part due to good stock selection. Our relative performance also was strong in the financials sector where both strong stock selection and good allocation contributed positively. Other areas of relative strength for the Fund were the healthcare and materials and processing sectors. The weakest area of the portfolio when compared to the Russell 2000® Value Index was the consumer discretionary sector.
PERFORMANCE DISCUSSION
Most of our energy holdings posted solid gains this fiscal year, including Plains Exploration & Production Company, St. Mary Land & Exploration Company and Forest Oil Corporation. Houston-based Plains Exploration had several positive factors that contributed to its outperformance during the fiscal year, including its low-risk drilling opportunities, production growth potential and long-lived reserve base that yielded substantial cash flows. The strength of Plains’ balance sheet and experienced management team also contributed to its success. St. Mary’s results were driven in part by improved pricing and lower costs. Additionally, the market began to recognize the company as a consistently solid producer. Forest Oil continued to execute its four-point strategy of cost reduction, balance sheet improvement, niche acquisitions and reduced frontier exploration spending. One highlight of its execution was the acquisition of a promising low-risk exploration play with strong growth opportunities, which was consistent with the company’s strategy of moving away from costly and riskier operations in the Gulf of Mexico and Alaska.
Strong security selection and good allocation within the financials sector also contributed to outperformance. Our minimal exposure to the REIT and bank industries positively impacted relative performance during the fiscal year. One of our strongest contributors in the financials space was our largest holding as of September 30, 2005, title insurer Stewart Information Services Corporation. It reported strong results for its fiscal second quarter with revenues reaching the highest level in the company’s history. The increase in revenues was primarily the result of a lower interest rate environment and recent acquisitions that contributed to a higher profit margin. Our strong relative performance in the financials sector was also driven by a solid gain in PICO Holdings, Inc. PICO, which is a Nevada landowner and water resource development company, reported a good increase in book value over the one-year period ended September 30, 2005.
TOP 10 HOLDINGS
| | | |
| Company Name | | 9/30/05 | |
Stewart Information Services Corporation | | 3.6 | % |
Hilb Rogal and Hobbs Company | | 3.4 | |
Plains Exploration & Production Company | | 2.9 | |
Stone Energy Corporation | | 2.8 | |
Kellwood Company | | 2.7 | |
Zale Corporation | | 2.5 | |
Watson Wyatt & Company Holdings | | 2.5 | |
St. Mary Land & Exploration Company | | 2.4 | |
Cimarex Energy Co. | | 2.1 | |
Simpson Manufacturing Co., Inc. | | 2.1 | |
Total | | 27.0 | % |
As a percentage of total net assets. Top 10 Holdings are determined by issuer.
Stock selection in the healthcare sector also contributed to relative performance with strong gains from eyeglass lens manufacturer SOLA International Inc. and VIASYS Healthcare Inc., a maker of respiratory and neurological medical devices. SOLA’s shares surged in December when it received an acquisition offer from German optical products maker Carl Zeiss AG and a Swedish private equity firm at a 30% premium to the outstanding share price at the time of the announcement. VIASYS reported two consecutive quarters of solid earnings. The company’s results were mostly attributable to its restructuring initiatives, which helped propel sales revenue and gross margins.
27
TWENTY-SEVEN
FUND STATISTICS
| | |
Net Assets | | $ 1.7 billion |
Number of Holdings | | 101 |
Median Market Cap | | $ 906.2 million |
Weighted Average Market Cap | | $ 1.2 billion |
Median P/B Value | | 1.9X |
Weighted Harmonic Average P/E (2005E) | | 15.9X |
Source: FactSet/Artisan Partners. All statistics are as of 9/30/05.
Our consumer-oriented stocks were the main area of weakness in the portfolio this fiscal year. We suffered double-digit declines from Kellwood Company, Furniture Brands International, Inc. and Movie Gallery, Inc., with additional weakness in a number of other holdings. Apparel manufacturer Kellwood’s price dropped on a disappointing earnings announcement. In the second half of 2004, the company took on some new initiatives during a tough time for the retail market and had a few fashion missteps. Its share price declined due in part to markdown pressures that were anticipated to reduce earnings. Furniture Brands, the largest home furnishings manufacturer in the U.S., continued to generate strong cash flows and to buy back stock aggressively, but reported a decline in profitability. The company has been closing domestic factories and sourcing product offshore as a means of dealing with a difficult industry environment, which is characterized by strong competitive pressures and weak demand.
In the first half of this fiscal year, movie rental retailer Movie Gallery posted solid gains. It was in a bidding war with Blockbuster Inc. over Hollywood Entertainment Corporation (another portfolio holding that we sold during the period) and it effectively won the battle, even though it offered a lower price than Blockbuster. Blockbuster dropped its bid amid likely regulatory hurdles. This was well received by the market given the complementary nature of Movie Gallery and Hollywood store locations—Movie Gallery is focused on rural areas while Hollywood is focused on suburban/urban markets. However, Movie Gallery’s stock came under pressure later in the year as investors reacted to poor same-store sales and rentals and weak forward guidance. Poor box office performance also may have negatively affected the company’s results, as Movie Gallery’s business is largely dependent on the success of movies produced and their appeal to customers. While its depreciation reduced its size in the portfolio as a percentage of net assets, we did not change our long-term outlook for Movie Gallery because the company had progressed well with its post-merger integration with Hollywood Entertainment and we expected synergies from the merger to generate considerable cost savings.
Although our consumer-oriented stocks were generally weak during the fiscal year, we had pockets of solid performance from names such as Payless ShoeSource, Inc. and ProQuest Company. Footwear retailer Payless ShoeSource’s same-store sales showed strength not seen in several years and the stock’s price rose over 71%. This may have been evidence that the company’s initiatives aimed at focusing on the core Payless business started to take hold. Publishing company ProQuest also advanced strongly during the period due to improved earnings and the completion of a highly attractive acquisition.
FUND CHANGES
We had a fair amount of activity in the portfolio this year as we added several new holdings while trimming or exiting a good number of positions. Some of the names added to the portfolio included Schnitzer Steel Industries, Inc., CSG Systems International, Inc., La-Z-Boy Incorporated and PETCO Animal Supplies, Inc. Schnitzer is one of the largest scrap steel processors in the U.S. The sell off in steel stocks during the third quarter of the fiscal year gave us the opportunity to re-enter this name, as we believed that Schnitzer’s price level became more attractive, particularly given its very low debt level and positive cash flows. CSG Systems is a provider of software that automates customer service and billing transactions for cable TV, online services and other telecommunications companies. We purchased the company, in part, due to its solid balance sheet, cash flow and share buyback program. La-Z-Boy, one of the world’s leading residential and commercial furniture producers, also historically has generated healthy cash flow. We were attracted to La-Z-Boy’s change to produce more of its furniture overseas and its low valuation. PETCO Animal Supplies is a leading retailer of premium pet food, supplies and accessories.
28
TWENTY-EIGHT
We were attracted to PETCO’s ability to gain market share and expected store growth and margin expansion.
Stocks sold this year included Black Hills Corporation (energy and communications company), BearingPoint, Inc. (systems integration provider), PNM Resources, Inc. (electricity and natural gas provider) and Eagle Materials Inc. (producer of cement and wallboard). We sold Black Hills as the stock reached our target selling range. Strong results were driven by the recontracting of one of its power plants, in addition to higher gas prices and stabilization of production volumes. BearingPoint declined substantially in the third quarter of the fiscal year as its financial condition deteriorated and the company continued to struggle. We believed we misjudged the depth of their problems and sold our position. PNM Resources reached our target selling range as the company experienced earnings improvement in its wholesale segment, so we sold it. We pared back our position in Eagle Materials in the third quarter of the fiscal year and sold our position when it moved into our target selling range. We believed the appreciation was driven by strong demand for cement and wallboard, which was helped in part by new home building and home renovations.
Perhaps the most significant change to the Fund during the fiscal year was the reduction in our energy sector investments. One of our larger sales during the period was Pioneer Natural Resources Company. We also trimmed our positions in Spinnaker Exploration Company, Cabot Oil & Gas Corporation, Forest Oil Corporation and Remington Oil and Gas Corporation. Consequently, our investments in the sector as a percentage of the overall portfolio decreased to 16.5% as of September 30, 2005, down from nearly 21% as of September 30, 2004.
Until recently, we believed many energy stocks still offered attractive valuations, but over the past several months, they too appreciated to the point where many began to look fairly valued rather than cheap. We attributed this to a growing belief among investors that the commodity price increases seen in energy were not a short-term blip, but in fact a longer-term feature of the landscape. This drove valuations in these stocks up from levels that reflected doubt to those that reflected some conviction.
SECTOR DIVERSIFICATION
| | | | | | |
| Sector | | 9/30/04 | | | 9/30/05 | |
Auto & Transportation | | 7.1 | % | | 4.1 | % |
Consumer Discretionary | | 25.7 | | | 31.0 | |
Consumer Staples | | — | | | — | |
Financial Services | | 14.6 | | | 14.4 | |
Healthcare | | 2.0 | | | 2.4 | |
Integrated Oils | | — | | | — | |
Materials & Processing | | 11.1 | | | 9.3 | |
Other | | — | | | — | |
Other Energy | | 20.5 | | | 16.5 | |
Producer Durables | | 4.1 | | | 3.3 | |
Technology | | 3.1 | | | 11.2 | |
Utilities | | 5.9 | | | 1.9 | |
Other assets less liabilities | | 5.9 | | | 5.9 | |
Total | | 100.0 | % | | 100.0 | % |
As a percentage of total net assets.
The storms in the producing areas of the Gulf of Mexico and adjacent coastal areas magnified and accelerated this process. Our view continued to be that higher unit finding costs were the primary driving force behind long-term equilibrium prices.
Commodity prices at any given point in time are heavily influenced by incremental developments on both supply and demand sides of the equation. We valued companies on the basis of our view of long-term prices, not getting carried away in the excitement of the price charts and the TV. We then adjusted our portfolio positions by comparing our conclusions suggested by this work to what we saw going on in the market. Accordingly, we reduced our holdings over the course of the fiscal year. Even with those cutbacks, we still held a substantial weight in the energy area, believing that at least relatively, the stocks we owned still offered worthwhile potential.
29
TWENTY-NINE
ARTISAN INTERNATIONAL FUND
Schedule of Investments – September 30, 2005
| | | | | |
| | | Shares
Held
| | Value
|
COMMON AND
PREFERRED STOCKS - 98.7% | | | | | |
| | | | | | |
| AUSTRALIA - 0.2% | | | | | |
Publishing & Broadcasting Limited | | 1,601,320 | | $ | 20,124,833 |
| | | | | | |
| BELGIUM - 1.4% | | | | | |
InBev NV | | 4,110,649 | | | 162,587,941 |
| | | | | | |
| BRAZIL - 0.5% | | | | | |
Companhia Brasileira de Distribuicao Grupo Pao de Acucar, Preferred (ADR) | | 161,200 | | | 4,653,844 |
Telesp Celular Participacoes S.A., Preferred (ADR)(1) | | 13,653,068 | | | 53,383,496 |
| | | | |
|
|
| | | | | | 58,037,340 |
| CANADA - 3.2% | | | | | |
Corus Entertainment, Inc., Class B | | 1,398,750 | | | 40,476,516 |
EnCana Corporation | | 4,318,000 | | | 252,022,624 |
Nortel Networks Corporation(1) | | 26,610,501 | | | 86,750,233 |
| | | | |
|
|
| | | | | | 379,249,373 |
| CHINA - 3.9% | | | | | |
China Merchants Holdings International Company Limited | | 11,590,000 | | | 25,847,358 |
China Mobile (Hong Kong) Limited | | 76,729,300 | | | 376,359,177 |
China Unicom Limited | | 32,332,100 | | | 26,883,155 |
Citic Pacific Limited | | 5,388,550 | | | 15,073,644 |
Cosco Pacific Limited | | 8,576,000 | | | 16,693,536 |
| | | | |
|
|
| | | | | | 460,856,870 |
| DENMARK - 0.6% | | | | | |
Novo Nordisk A/S, Class B | | 1,334,950 | | | 66,003,084 |
Vestas Wind Systems A/S(1) | | 315,000 | | | 7,609,615 |
| | | | |
|
|
| | | | | | 73,612,699 |
| FRANCE - 7.2% | | | | | |
Accor S.A. | | 902,153 | | | 45,560,271 |
Axa | | 2,270,859 | | | 62,335,625 |
Carrefour S.A. | | 3,263,776 | | | 150,155,874 |
JC Decaux S.A.(1) | | 5,910,029 | | | 130,410,434 |
LVMH Moet Hennessy Louis Vuitton S.A. | | 1,464,800 | | | 120,768,174 |
M6 Metropole Television | | 571,795 | | | 14,438,313 |
PagesJaunes S.A. | | 4,330,398 | | | 118,141,838 |
PPR S.A. | | 1,143,411 | | | 119,968,344 |
Vivendi Universal S.A. | | 2,279,316 | | | 74,401,957 |
| | | | |
|
|
| | | | | | 836,180,830 |
| | | | | |
| | | Shares
Held
| | Value
|
| GERMANY - 8.9% | | | | | |
Allianz AG | | 1,068,600 | | $ | 144,277,844 |
Bayerische Hypo-und Vereinsbank AG(1) | | 5,055,414 | | | 142,417,838 |
Commerzbank AG | | 5,582,774 | | | 152,309,137 |
Deutsche Post AG | | 6,112,354 | | | 142,955,671 |
E.ON AG | | 1,218,904 | | | 111,965,291 |
Heidelberger Druckmaschinen AG | | 840,936 | | | 28,814,442 |
ProSiebenSat.1 Media AG, Preferred | | 7,157,870 | | | 123,706,564 |
RWE AG | | 415,584 | | | 27,495,790 |
SAP AG | | 323,700 | | | 55,943,758 |
Siemens AG | | 1,419,679 | | | 109,370,007 |
| | | | |
|
|
| | | | | | 1,039,256,342 |
| HONG KONG - 1.7% | | | | | |
Cheung Kong (Holdings) Limited | | 5,300,900 | | | 59,860,499 |
MTR Corporation Limited | | 18,335,800 | | | 38,173,238 |
Sun Hung Kai Properties Limited | | 9,566,400 | | | 98,964,672 |
| | | | |
|
|
| | | | | | 196,998,409 |
| ITALY - 4.2% | | | | | |
Assicurazioni Generali S.p.A | | 4,473,345 | | | 141,073,772 |
Eni S.p.A. | | 4,673,717 | | | 138,798,640 |
Saipem S.p.A. | | 12,167,694 | | | 205,171,013 |
| | | | |
|
|
| | | | | | 485,043,425 |
| JAPAN - 21.0% | | | | | |
Aeon Co., Ltd. | | 278,100 | | | 5,585,518 |
Bridgestone Corp. | | 2,839,000 | | | 60,771,406 |
Chugai Pharmaceutical Co., Ltd. | | 2,795,000 | | | 53,304,924 |
Credit Saison Co., Ltd.(2) | | 8,952,300 | | | 392,727,748 |
Honda Motor Co., Ltd. | | 3,330,100 | | | 188,330,180 |
Japan Tobacco, Inc. | | 5,907 | | | 93,142,442 |
Jupiter Telecommunications Co., Ltd.(1) | | 185,738 | | | 160,508,261 |
Keyence Corp. | | 391,950 | | | 98,539,931 |
Mitsubishi Corp. | | 11,299,500 | | | 222,964,059 |
Mitsubishi Estate Co., Ltd. | | 1,598,000 | | | 21,931,677 |
Mitsui & Co., Ltd. | | 3,125,000 | | | 39,117,556 |
Mitsui Fudosan Co., Ltd. | | 1,324,000 | | | 19,908,985 |
Mizuho Financial Group, Inc. | | 41,415 | | | 263,404,070 |
Orix Corp. | | 1,371,400 | | | 247,654,158 |
Sega Sammy Holdings, Inc. | | 4,473,800 | | | 176,555,884 |
Sega Sammy Holdings, Inc. - When Issued(1)(3) | | 4,473,800 | | | 173,403,101 |
SMC Corp. | | 746,600 | | | 99,375,669 |
The Sumitomo Trust & Banking Co., Ltd. | | 16,393,500 | | | 134,879,572 |
| | | | |
|
|
| | | | | | 2,452,105,141 |
30
THIRTY
| | | | | |
| | | Shares
Held
| | Value
|
| LUXEMBOURG - 0.5% | | | | | |
RTL Group | | 772,286 | | $ | 59,681,426 |
| | | | | | |
| MEXICO - 3.1% | | | | | |
Grupo Televisa S.A. (ADR) | | 2,993,400 | | | 214,656,714 |
Wal-Mart de Mexico S.A. de C.V., Series V | | 27,914,700 | | | 142,077,701 |
| | | | |
|
|
| | | | | | 356,734,415 |
| NETHERLANDS - 5.7% | | | | | |
ASML Holding N.V.(1) | | 9,755,765 | | | 160,162,959 |
ASML Holding N.V., NY Shares(1) | | 1,734,100 | | | 28,629,991 |
Fortis | | 11,552,091 | | | 333,907,163 |
ING Groep N.V. | | 4,978,812 | | | 148,278,124 |
| | | | |
|
|
| | | | | | 670,978,237 |
| NORWAY - 0.8% | | | | | |
Aker ASA, A Shares(1) | | 22,800 | | | 678,618 |
Stolt Offshore S.A.(1) | | 7,851,500 | | | 90,780,216 |
| | | | |
|
|
| | | | | | 91,458,834 |
| PORTUGAL - 1.3% | | | | | |
Banco Comercial Portugues, S.A. | | 54,162,939 | | | 150,371,058 |
| | | | | | |
| RUSSIA - 3.4% | | | | | |
AFK Sistema (GDR)(4) | | 3,059,462 | | | 74,956,819 |
LUKOIL (ADR) | | 5,617,912 | | | 324,827,672 |
| | | | |
|
|
| | | | | | 399,784,491 |
| SINGAPORE - 2.5% | | | | | |
DBS Group Holdings Limited | | 669,645 | | | 6,253,001 |
Keppel Corporation Limited | | 9,560,500 | | | 71,758,134 |
Singapore Airlines Limited | | 16,865,300 | | | 115,621,571 |
Singapore Telecommunications Limited | | 66,787,970 | | | 96,705,491 |
| | | | |
|
|
| | | | | | 290,338,197 |
| SOUTH KOREA - 3.7% | | | | | |
Hana Bank | | 2,864,480 | | | 105,685,175 |
Kookmin Bank | | 3,687,935 | | | 217,353,141 |
Kookmin Bank (ADR) | | 72,600 | | | 4,301,550 |
Shinhan Financial Group Co., Ltd. | | 3,155,040 | | | 109,753,667 |
| | | | |
|
|
| | | | | | 437,093,533 |
| SPAIN - 3.8% | | | | | |
Banco Bilbao Vizcaya Argentaria, S.A. | | 7,290,603 | | | 127,840,598 |
Banco Santander Central Hispano, S.A. | | 7,145,800 | | | 93,868,758 |
Industria de Diseno Textil, S.A. | | 2,646,813 | | | 77,681,745 |
Promotora de Informaciones, S.A. | | 7,320,664 | | | 141,213,288 |
| | | | |
|
|
| | | | | | 440,604,389 |
| SWEDEN - 3.2% | | | | | |
Telefonaktiebolaget LM Ericsson (ADR) | | 4,222,150 | | | 155,544,006 |
Telefonaktiebolaget LM Ericsson, Class B | | 59,195,100 | | | 216,041,904 |
| | | | |
|
|
| | | | | | 371,585,910 |
| | | | | | |
| | | Shares
Held
| | Value
|
| SWITZERLAND - 8.5% | | | | | | |
Nestle S.A. | | | 955,414 | | $ | 279,712,569 |
Nobel Biocare Holding AG | | | 59,774 | | | 14,082,940 |
Novartis AG | | | 2,558,895 | | | 129,768,226 |
Roche Holding AG | | | 1,408,119 | | | 195,573,594 |
Swiss Re | | | 175,545 | | | 11,526,264 |
UBS AG | | | 4,226,175 | | | 359,104,901 |
| | | | | |
|
|
| | | | | | | 989,768,494 |
| TAIWAN - 0.7% | | | | | | |
Chunghwa Telecom Co., Ltd. (ADR) | | | 4,493,800 | | | 83,180,238 |
| | | | | | | |
| UNITED KINGDOM - 8.7% | | | | | | |
British Sky Broadcasting Group PLC | | | 21,025,757 | | | 207,862,607 |
Cadbury Schweppes PLC | | | 5,815,210 | | | 58,669,251 |
Carnival PLC | | | 1,339,478 | | | 69,246,929 |
Hilton Group PLC | | | 2,992,741 | | | 16,601,178 |
ITV PLC | | | 93,423,477 | | | 186,201,675 |
Kingfisher PLC | | | 56,463,834 | | | 215,116,255 |
Smith & Nephew PLC | | | 2,568,962 | | | 21,568,192 |
Tesco PLC | | | 25,283,895 | | | 138,023,725 |
William Morrison Supermarkets PLC | | | 33,704,047 | | | 105,667,340 |
| | | | | |
|
|
| | | | | | | 1,018,957,152 |
| | | | | |
|
|
Total common and preferred stocks
(Cost $8,718,905,170) | | | | | | 11,524,589,577 |
| | |
| | | Par
Amount
| | |
| SHORT-TERM INVESTMENTS (CASH EQUIVALENTS) - 0.4% | | | | | | |
Repurchase agreement with State Street Bank and Trust Company, 3.50%, dated 9/30/05, due 10/3/05, maturity value $42,468,383, collateralized by $43,308,257 market value Federal National Mortgage Association Note,
3.25%, due 8/15/08
(Cost $42,456,000) | | $ | 42,456,000 | | | 42,456,000 |
| | | | | |
|
|
| | | | | | | |
Total investments - 99.1%
(Cost $8,761,361,170) | | | | | | 11,567,045,577 |
| | | | | | | |
Other assets less liabilities - 0.9% | | | | | | 107,953,990 |
| | | | | |
|
|
| | | | | | | |
Total net assets - 100.0%(5) | | | | | $ | 11,674,999,567 |
| | | | | |
|
|
31
THIRTY-ONE
| (1) | Non-income producing security. |
| (2) | Affiliated company as defined by the Investment Company Act of 1940. See Note (6) in Notes to Financial Statements. |
| (3) | The issuer distributed in a corporate action one bonus share for every ordinary share held on record date. |
| (4) | Valued at a fair value in accordance with procedures established by the Board of Directors of Artisan Funds. In total, securities valued at a fair value were $74,956,819 or 0.6% of total net assets. |
| (5) | Percentages for the various classifications relate to total net assets. |
(ADR) American Depository Receipt
(GDR) Global Depository Receipt
| | | | | | |
| PORTFOLIO DIVERSIFICATION - SEPTEMBER 30, 2005 | |
| | | Value
| | Percentage
| |
Consumer Discretionary | | $ | 2,755,827,891 | | 23.6 | % |
Consumer Staples | | | 1,140,276,204 | | 9.8 | |
Energy | | | 1,012,278,783 | | 8.7 | |
Financials | | | 3,549,988,998 | | 30.4 | |
Healthcare | | | 480,300,960 | | 4.1 | |
Industrials | | | 933,374,501 | | 8.0 | |
Information Technology | | | 801,612,782 | | 6.8 | |
Materials | | | — | | — | |
Telecommunication Services | | | 711,468,377 | | 6.1 | |
Utilities | | | 139,461,081 | | 1.2 | |
| | |
|
| |
|
|
Total common and preferred stocks | | | 11,524,589,577 | | 98.7 | |
Short-term investments | | | 42,456,000 | | 0.4 | |
| | |
|
| |
|
|
Total investments | | | 11,567,045,577 | | 99.1 | |
Other assets less liabilities | | | 107,953,990 | | 0.9 | |
| | |
|
| |
|
|
Total net assets | | $ | 11,674,999,567 | | 100.0 | % |
| | |
|
| |
|
|
| | | | | | |
| CURRENCY EXPOSURE - SEPTEMBER 30, 2005 | |
| | | Value
| | Percentage
| |
Australian Dollar | | $ | 20,124,833 | | 0.2 | % |
British Pound | | | 1,018,957,152 | | 8.8 | |
Canadian Dollar | | | 292,499,140 | | 2.5 | |
Danish Krone | | | 73,612,699 | | 0.6 | |
Euro | | | 3,816,073,657 | | 33.0 | |
Hong Kong Dollar | | | 657,855,279 | | 5.7 | |
Japanese Yen | | | 2,452,105,141 | | 21.2 | |
Mexican Peso | | | 142,077,701 | | 1.2 | |
Norwegian Krone | | | 91,458,834 | | 0.8 | |
Singapore Dollar | | | 290,338,197 | | 2.5 | |
South Korean Won | | | 432,791,983 | | 3.7 | |
Swedish Krona | | | 216,041,904 | | 1.9 | |
Swiss Franc | | | 989,768,494 | | 8.6 | |
US Dollar | | | 1,073,340,563 | | 9.3 | |
| | |
|
| |
|
|
Total investments | | $ | 11,567,045,577 | | 100.0 | % |
| | |
|
| |
|
|
The accompanying notes are an integral part of the financial statements.
32
EIGHT
ARTISAN INTERNATIONAL SMALL CAP FUND
Schedule of Investments – September 30, 2005
| | | | | |
| | | Shares
Held
| | Value
|
COMMON AND
PREFERRED STOCKS - 94.8% | | | | | |
| | | | | | |
| ARGENTINA - 0.3% | | | | | |
BBVA Banco Frances S.A. (ADR)(1) | | 265,200 | | $ | 2,063,256 |
| | | | | | |
| AUSTRALIA - 1.6% | | | | | |
John Fairfax Holdings Limited | | 3,727,481 | | | 12,933,730 |
| | | | | | |
| AUSTRIA - 1.4% | | | | | |
Wienerberger AG | | 284,122 | | | 11,196,862 |
| | | | | | |
| BELGIUM - 0.1% | | | | | |
Umicore | | 6,700 | | | 730,754 |
| | | | | | |
| BRAZIL - 2.7% | | | | | |
Cyrela Brazil Realty S.A. Empreendimentos e Participacoes | | 500,000 | | | 4,125,191 |
Diagnosticos da America (ADR)(1)(2) | | 79,100 | | | 3,713,745 |
Natura Cosmeticos S.A. | | 213,300 | | | 8,512,106 |
Telesp Celular Participacoes S.A., Preferred (ADR)(1) | | 1,292,543 | | | 5,053,843 |
| | | | |
|
|
| | | | | | 21,404,885 |
| CANADA - 1.2% | | | | | |
Aur Resources Inc. | | 1,244,100 | | | 9,439,107 |
| | | | | | |
| CHINA - 4.0% | | | | | |
Beijing Capital International Airport Company Limited | | 20,164,600 | | | 8,838,023 |
China Oilfield Services Limited | | 9,497,100 | | | 3,917,668 |
China Travel International Investment Hong Kong Limited | | 11,373,200 | | | 3,078,850 |
Shanghai Electric Group Company Limited(1) | | 35,254,300 | | | 11,929,659 |
Sinopec Zhenhai Refining and Chemical Company Limited | | 3,064,100 | | | 3,357,442 |
| | | | |
|
|
| | | | | | 31,121,642 |
| EGYPT - 0.8% | | | | | |
Commercial International Bank (GDR) | | 647,758 | | | 6,542,356 |
| | | | | | |
| FINLAND - 1.6% | | | | | |
Metso Oyj | | 479,300 | | | 12,160,340 |
| | | | | |
| | | Shares
Held
| | Value
|
| FRANCE - 8.9% | | | | | |
Geodis S.A. | | 106,244 | | $ | 12,475,243 |
Ipsos | | 31,879 | | | 4,057,427 |
JC Decaux S.A.(1) | | 321,819 | | | 7,101,244 |
Kaufman & Broad S.A. | | 110,275 | | | 8,594,826 |
Nexity | | 546,072 | | | 27,564,445 |
NRJ Group | | 135,078 | | | 2,922,181 |
Remy Cointreau S.A. | | 154,828 | | | 7,024,518 |
| | | | |
|
|
| | | | | | 69,739,884 |
| GERMANY - 0.7% | | | | | |
Grenkeleasing AG | | 89,736 | | | 4,583,589 |
Heidelberger Druckmaschinen AG | | 17,933 | | | 614,469 |
| | | | |
|
|
| | | | | | 5,198,058 |
| HONG KONG - 6.1% | | | | | |
Aeon Stores (Hong Kong) Co. Limited | | 737,100 | | | 741,153 |
Emperor Entertainment Hotel Limited(1) | | 38,876,200 | | | 11,902,386 |
Hengan International Group Company Limited | | 3,991,900 | | | 3,808,009 |
Hong Kong Exchanges & Clearing Limited | | 2,326,000 | | | 7,975,868 |
Midland Holdings Limited | | 13,049,100 | | | 7,569,718 |
Panva Gas Holdings Limited(1) | | 33,871,800 | | | 15,500,769 |
| | | | |
|
|
| | | | | | 47,497,903 |
| ITALY - 2.4% | | | | | |
Gruppo Editoriale L’Espresso S.p.A. | | 1,569,729 | | | 8,881,065 |
Socotherm S.p.A. | | 255,936 | | | 3,921,856 |
Sorin S.p.A.(1) | | 2,311,088 | | | 6,360,658 |
| | | | |
|
|
| | | | | | 19,163,579 |
| JAPAN - 11.8% | | | | | |
Creed Corporation | | 6,186 | | | 20,870,666 |
Japan Petroleum Exploration Company, Ltd. | | 375,300 | | | 20,133,694 |
Komeri Company, Ltd. | | 375,900 | | | 12,251,850 |
NTT Urban Development Corporation | | 2,172 | | | 11,135,518 |
Ozeki Company, Ltd. | | 348,500 | | | 8,703,290 |
Sammy NetWorks Company, Ltd. | | 509 | | | 7,308,580 |
SFGC Company, Ltd. | | 45,667 | | | 11,786,849 |
| | | | |
|
|
| | | | | | 92,190,447 |
| MALAYSIA - 0.6% | | | | | |
AMMB Holdings Berhad | | 7,493,840 | | | 5,129,771 |
| | | | | | |
| MEXICO - 1.0% | | | | | |
Empresas ICA S.A. de C.V.(1) | | 19,491,700 | | | 7,447,326 |
Gruma S.A., Class B | | 123,900 | | | 319,627 |
| | | | |
|
|
| | | | | | 7,766,953 |
33
THIRTY-THREE
| | | | | |
| | | Shares
Held
| | Value
|
| MOROCCO - 0.5% | | | | | |
Maroc Telecom | | 349,300 | | $ | 3,736,273 |
| | | | | | |
| NETHERLANDS - 5.7% | | | | | |
Buhrmann NV | | 2,083,383 | | | 25,164,322 |
Eurocommercial Properties NV | | 91,824 | | | 3,476,296 |
SBM Offshore NV | | 103,372 | | | 8,622,088 |
VastNed Retail NV | | 106,178 | | | 6,986,646 |
| | | | |
|
|
| | | | | | 44,249,352 |
| NORWAY - 7.8% | | | | | |
Fast Search & Transfer ASA(1) | | 2,015,300 | | | 7,597,883 |
Petroleum Geo-Services ASA(1) | | 759,800 | | | 24,180,278 |
Q-Free ASA(1) | | 1,986,700 | | | 9,582,423 |
Smedvig ASA, B Shares | | 458,400 | | | 9,235,799 |
Stolt Offshore S.A.(1) | | 872,900 | | | 10,092,600 |
| | | | |
|
|
| | | | | | 60,688,983 |
| OMAN - 0.1% | | | | | |
Bank Muscat SAOG-When issued (GDR)(1)(2)(3) | | 18,000 | | | 452,160 |
| | | | | | |
| PANAMA - 3.2% | | | | | |
Banco Latinoamericano de Exportaciones, S.A., E Shares | | 1,480,714 | | | 25,142,524 |
| | | | | | |
| PORTUGAL - 2.4% | | | | | |
CIMPOR-Cimentos de Portugal, S.G.P.S., S.A. | | 931,019 | | | 5,135,956 |
Sonae, S.G.P.S., S.A. | | 7,788,798 | | | 13,292,566 |
| | | | |
|
|
| | | | | | 18,428,522 |
| RUSSIA - 2.0% | | | | | |
AO VimpelCom (ADR)(1) | | 198,000 | | | 8,799,120 |
Uralsvyazinform (ADR)(2) | | 863,600 | | | 6,787,896 |
| | | | |
|
|
| | | | | | 15,587,016 |
| SINGAPORE - 2.9% | | | | | |
Fraser & Neave Limited | | 1,928,320 | | | 19,601,728 |
LMA International NV(1) | | 6,294,000 | | | 2,864,206 |
| | | | |
|
|
| | | | | | 22,465,934 |
| SOUTH AFRICA - 0.5% | | | | | |
Massmart Holdings Limited | | 491,641 | | | 4,172,670 |
| | | | | | |
| SOUTH KOREA - 5.0% | | | | | |
FINETEC Corporation(4) | | 971,391 | | | 11,543,123 |
Gwangju Shinsegae Company, Ltd. | | 21,080 | | | 2,888,778 |
Hanil Cement Company, Ltd. | | 105,035 | | | 6,844,638 |
Hyundai Engineering & Construction Company, Ltd.(1) | | 63,400 | | | 2,004,983 |
Kangwon Land, Inc. | | 809,256 | | | 13,804,271 |
Shinsegae Food System Company, Ltd. | | 47,284 | | | 1,898,610 |
| | | | |
|
|
| | | | | | 38,984,403 |
| | | | | | |
| | | Shares
Held
| | Value
|
| SPAIN - 1.8% | | | | | | |
Corporacion Dermoestetica(1) | | | 134,300 | | $ | 1,727,070 |
Fadesa Inmobiliaria, S.A. | | | 342,678 | | | 12,314,236 |
| | | | | |
|
|
| | | | | | | 14,041,306 |
| SWEDEN - 4.3% | | | | | | |
Elekta AB, B Shares | | | 511,124 | | | 23,400,246 |
JM AB | | | 257,900 | | | 10,327,109 |
| | | | | |
|
|
| | | | | | | 33,727,355 |
| SWITZERLAND - 9.9% | | | | | | |
Bank Sarasin & Cie AG, B Shares | | | 7,184 | | | 16,093,314 |
Bobst Group AG | | | 235,255 | | | 10,122,208 |
Logitech International S.A.(1) | | | 146,802 | | | 5,936,491 |
Schindler Holding AG, Participation Certificates | | | 33,907 | | | 13,174,633 |
Straumann AG | | | 43,483 | | | 11,647,082 |
Sulzer AG | | | 39,908 | | | 20,222,972 |
| | | | | |
|
|
| | | | | | | 77,196,700 |
| THAILAND - 1.3% | | | | | | |
Bangkok Bank Public Company Limited | | | 1,777,300 | | | 4,936,343 |
National Finance Public Company Limited | | | 16,821,000 | | | 5,286,659 |
| | | | | |
|
|
| | | | | | | 10,223,002 |
| UNITED KINGDOM - 2.2% | | | | | | |
Intertek Group PLC | | | 666,531 | | | 8,035,409 |
Investec PLC | | | 101,700 | | | 3,874,573 |
NETeller PLC(1) | | | 341,521 | | | 4,984,648 |
| | | | | |
|
|
| | | | | | | 16,894,630 |
| | | | | |
|
|
Total common and preferred stocks
(Cost $511,909,343) | | | | | | 740,270,357 |
| | |
| | | Par
Amount
| | |
| SHORT-TERM INVESTMENTS (CASH EQUIVALENTS) - 3.6% | | | | | | |
Repurchase agreement with State Street Bank and Trust Company, 3.50%, dated 9/30/05, due 10/3/05, maturity value $28,161,211, collateralized by $28,719,800 market value
Federal Home Loan Bank Note,
5.80%, due 9/2/08
(Cost $28,153,000) | | $ | 28,153,000 | | | 28,153,000 |
| | | | | |
|
|
| | | | | | | |
Total investments - 98.4%
(Cost $540,062,343) | | | | | | 768,423,357 |
| | | | | | | |
Other assets less liabilities - 1.6% | | | | | | 12,726,154 |
| | | | | |
|
|
| | | | | | | |
Total net assets - 100.0%(5) | | | | | $ | 781,149,511 |
| | | | | |
|
|
34
THIRTY-FOUR
| (1) | Non-income producing security. |
| (2) | Valued at a fair value in accordance with procedures established by the Board of Directors of Artisan Funds. In total, securities valued at a fair value were $10,953,801 or 1.4% of total net assets. |
| (3) | Cash in the amount of $500,000 has been segregated to cover the when-issued purchase commitment and is included in Short-Term Investments. |
| (4) | Affiliated company as defined by the Investment Company Act of 1940. See Note (6) in Notes to Financial Statements. |
| (5) | Percentages for the various classifications relate to total net assets. |
(ADR) American Depository Receipt
(GDR) Global Depository Receipt
| | | | | | |
| PORTFOLIO DIVERSIFICATION - SEPTEMBER 30, 2005 | |
| | | Value
| | Percentage
| |
Consumer Discretionary | | $ | 99,896,720 | | 12.8 | % |
Consumer Staples | | | 34,438,830 | | 4.4 | |
Energy | | | 83,461,425 | | 10.7 | |
Financials | | | 192,482,776 | | 24.6 | |
Healthcare | | | 49,713,007 | | 6.4 | |
Industrials | | | 176,280,743 | | 22.6 | |
Information Technology | | | 41,968,500 | | 5.4 | |
Materials | | | 22,150,455 | | 2.8 | |
Telecommunication Services | | | 24,377,132 | | 3.1 | |
Utilities | | | 15,500,769 | | 2.0 | |
| | |
|
| |
|
|
Total common and preferred stocks | | | 740,270,357 | | 94.8 | |
Short-term investments | | | 28,153,000 | | 3.6 | |
| | |
|
| |
|
|
Total investments | | | 768,423,357 | | 98.4 | |
Other assets less liabilities | | | 12,726,154 | | 1.6 | |
| | |
|
| |
|
|
Total net assets | | $ | 781,149,511 | | 100.0 | % |
| | |
|
| |
|
|
| | | | | | |
| CURRENCY EXPOSURE - SEPTEMBER 30, 2005 | |
| | | Value
| | Percentage
| |
Australian Dollar | | $ | 12,933,730 | | 1.7 | % |
Brazilian Real | | | 12,637,297 | | 1.6 | |
British Pound | | | 16,894,630 | | 2.2 | |
Canadian Dollar | | | 9,439,107 | | 1.2 | |
Euro | | | 198,644,930 | | 25.9 | |
Hong Kong Dollar | | | 78,619,545 | | 10.2 | |
Japanese Yen | | | 92,190,447 | | 12.0 | |
Malaysian Ringgit | | | 5,129,771 | | 0.7 | |
Mexican Peso | | | 7,766,953 | | 1.0 | |
Norwegian Krone | | | 60,688,983 | | 7.9 | |
Singapore Dollar | | | 22,465,934 | | 2.9 | |
South African Rand | | | 4,172,670 | | 0.5 | |
South Korean Won | | | 38,984,403 | | 5.1 | |
Swedish Krona | | | 33,727,355 | | 4.4 | |
Swiss Franc | | | 77,196,700 | | 10.1 | |
Thai Baht | | | 10,223,002 | | 1.3 | |
US Dollar | | | 86,707,900 | | 11.3 | |
| | |
|
| |
|
|
Total investments | | $ | 768,423,357 | | 100.0 | % |
| | |
|
| |
|
|
The accompanying notes are an integral part of the financial statements.
35
THIRTY-FIVE
ARTISAN INTERNATIONAL VALUE FUND
Schedule of Investments – September 30, 2005
| | | | | |
| | | Shares
Held
| | Value
|
| COMMON STOCKS - 93.6% | | | | | |
| | | | | | |
| AUSTRALIA - 2.4% | | | | | |
Zinifex Ltd.(1) | | 4,138,197 | | $ | 14,390,403 |
| | | | | | |
| BRAZIL - 1.4% | | | | | |
Tim Participacoes S.A. | | 3,623,900,000 | | | 8,514,589 |
| | | | | | |
| FRANCE - 8.5% | | | | | |
Euronext N.V. | | 551,098 | | | 24,254,774 |
Renault S.A. | | 168,059 | | | 15,916,151 |
Vivendi Universal S.A. | | 340,748 | | | 11,122,775 |
| | | | |
|
|
| | | | | | 51,293,700 |
| GERMANY - 7.3% | | | | | |
Heidelberger Druckmaschinen AG | | 606,474 | | | 20,780,666 |
Pfeiffer Vacuum Technology AG(2) | | 467,396 | | | 23,306,576 |
| | | | |
|
|
| | | | | | 44,087,242 |
| HONG KONG - 2.1% | | | | | |
Guoco Group, Ltd. | | 1,230,000 | | | 12,478,617 |
| | | | | | |
| ISRAEL - 0.6% | | | | | |
RADVision Ltd.(1) | | 250,997 | | | 3,431,129 |
| | | | | | |
| ITALY - 2.6% | | | | | |
Cementir S.p.A. | | 3,206,803 | | | 15,830,692 |
| | | | | | |
| JAPAN - 12.4% | | | | | |
Meitec Corporation | | 702,800 | | | 22,473,256 |
Olympus Corporation | | 702,000 | | | 15,552,590 |
Sekisui House, Ltd. | | 1,380,100 | | | 16,910,845 |
Uni-Charm Corporation | | 450,800 | | | 19,458,421 |
| | | | |
|
|
| | | | | | 74,395,112 |
| MEXICO - 0.4% | | | | | |
Gruma S.A., Class B | | 905,900 | | | 2,336,964 |
| | | | | | |
| NETHERLANDS - 4.6% | | | | | |
Hunter Douglas N.V. | | 105,104 | | | 5,004,766 |
Wolters Kluwer N.V. | | 1,225,497 | | | 22,799,917 |
| | | | |
|
|
| | | | | | 27,804,683 |
| SINGAPORE - 0.5% | | | | | |
People’s Food Holdings Limited | | 5,087,500 | | | 3,307,379 |
| | | | | |
| | | Shares
Held
| | Value
|
| SOUTH KOREA - 3.7% | | | | | |
Lotte Chilsung Beverage Co., Ltd. | | 6,317 | | $ | 6,005,236 |
Lotte Confectionary Co., Ltd. | | 6,576 | | | 6,743,000 |
Samchully Co., Ltd. | | 96,790 | | | 9,368,270 |
| | | | |
|
|
| | | | | | 22,116,506 |
| SWITZERLAND - 9.5% | | | | | |
Clariant AG | | 1,036,726 | | | 14,895,604 |
Givaudan S.A. | | 30,804 | | | 19,726,172 |
Pargesa Holding S.A. | | 104,979 | | | 8,871,579 |
Tamedia AG | | 52,047 | | | 4,828,585 |
Zehnder Group AG | | 7,494 | | | 8,914,882 |
| | | | |
|
|
| | | | | | 57,236,822 |
| UNITED KINGDOM - 31.9% | | | | | |
Admiral Group PLC | | 745,499 | | | 5,588,369 |
Benfield Group PLC | | 3,612,821 | | | 19,849,684 |
Brit Insurance Holdings PLC | | 7,226,164 | | | 10,769,949 |
British Sky Broadcasting Group PLC | | 150,737 | | | 1,490,200 |
Carpetright PLC | | 845,134 | | | 13,117,690 |
Countrywide PLC | | 4,357,814 | | | 29,918,955 |
Diageo PLC | | 2,069,376 | | | 29,747,202 |
MFI Furniture Group PLC | | 7,570,684 | | | 14,521,567 |
Rotork PLC | | 616,032 | | | 6,475,878 |
Signet Group PLC | | 11,160,502 | | | 20,177,005 |
Unilever PLC (ADR) | | 451,925 | | | 19,080,273 |
The Vitec Group PLC | | 133,877 | | | 838,269 |
Vodafone Group PLC (ADR) | | 771,850 | | | 20,044,944 |
| | | | |
|
|
| | | | | | 191,619,985 |
| UNITED STATES - 5.7% | | | | | |
Arch Capital Group Ltd.(1) | | 315,010 | | | 15,621,346 |
Willis Group Holdings Limited | | 492,000 | | | 18,474,600 |
| | | | |
|
|
| | | | | | 34,095,946 |
| | | | |
|
|
Total common stocks
(Cost $490,832,945) | | | | | 562,939,769 |
36
THIRTY-SIX
| | | | | | |
| | | Par
Amount
| | Value
|
| SHORT-TERM INVESTMENTS (CASH EQUIVALENTS) - 5.0% | | | | | | |
Repurchase agreement with State Street Bank and Trust Company, 3.50%, dated 9/30/05, due 10/3/05, maturity value $30,005,749, collateralized by $30,597,091 market value Federal National Mortgage Association Note,
3.25%, due 2/15/09
(Cost $29,997,000) | | $ | 29,997,000 | | $ | 29,997,000 |
| | | | | |
|
|
| | | | | | | |
Total investments - 98.6%
(Cost $520,829,945) | | | | | | 592,936,769 |
| | | | | | | |
Other assets less liabilities - 1.4% | | | | | | 8,277,196 |
| | | | | |
|
|
| | | | | | | |
Total net assets - 100.0%(3) | | | | | $ | 601,213,965 |
| | | | | |
|
|
| (1) | Non-income producing security. |
| (2) | Affiliated company as defined by the Investment Company Act of 1940. See Note (6) in Notes to Financial Statements. |
| (3) | Percentages for the various classifications relate to total net assets. |
(ADR) American Depository Receipt
| | | | | | |
| PORTFOLIO DIVERSIFICATION - SEPTEMBER 30, 2005 | |
| | | Value
| | Percentage
| |
Consumer Discretionary | | $ | 126,727,770 | | 21.1 | % |
Consumer Staples | | | 86,678,476 | | 14.4 | |
Energy | | | — | | — | |
Financials | | | 145,827,873 | | 24.3 | |
Healthcare | | | 15,552,590 | | 2.6 | |
Industrials | | | 75,475,379 | | 12.5 | |
Information Technology | | | 9,907,007 | | 1.6 | |
Materials | | | 64,842,871 | | 10.8 | |
Telecommunication Services | | | 28,559,533 | | 4.7 | |
Utilities | | | 9,368,270 | | 1.6 | |
| | |
|
| |
|
|
Total common stocks | | | 562,939,769 | | 93.6 | |
Short-term investments | | | 29,997,000 | | 5.0 | |
| | |
|
| |
|
|
Total investments | | | 592,936,769 | | 98.6 | |
Other assets less liabilities | | | 8,277,196 | | 1.4 | |
| | |
|
| |
|
|
Total net assets | | $ | 601,213,965 | | 100.0 | % |
| | |
|
| |
|
|
| | | | | | |
| CURRENCY EXPOSURE - SEPTEMBER 30, 2005 | |
| | | Value
| | Percentage
| |
Australian Dollar | | $ | 14,390,403 | | 2.4 | % |
Brazilian Real | | | 8,514,589 | | 1.4 | |
British Pound | | | 152,494,768 | | 25.7 | |
Euro | | | 139,016,317 | | 23.4 | |
Hong Kong Dollar | | | 12,478,617 | | 2.1 | |
Japanese Yen | | | 74,395,112 | | 12.6 | |
Mexican Peso | | | 2,336,964 | | 0.4 | |
Singapore Dollar | | | 3,307,379 | | 0.6 | |
South Korean Won | | | 22,116,506 | | 3.7 | |
Swiss Franc | | | 57,236,822 | | 9.7 | |
US Dollar | | | 106,649,292 | | 18.0 | |
| | |
|
| |
|
|
Total investments | | $ | 592,936,769 | | 100.0 | % |
| | |
|
| |
|
|
The accompanying notes are an integral part of the financial statements.
37
THIRTY-SEVEN
ARTISAN MID CAP FUND
Schedule of Investments – September 30, 2005
| | | | | |
| | | Shares
Held
| | Value
|
| COMMON STOCKS - 97.4% | | | | | |
| | | | | | |
| AUTO & TRANSPORTATION - 0.9% | | | |
Air Transport - 0.8% | | | |
Expeditors International of Washington, Inc. | | 852,600 | | $ | 48,410,628 |
| | | | | | |
Auto Trucks & Parts - 0.1% | | | | | |
Oshkosh Truck Corporation | | 178,000 | | | 7,682,480 |
| | | | | | |
| CONSUMER DISCRETIONARY - 17.8% | | | |
Casinos & Gambling - 0.3% | | | | | |
Las Vegas Sands Corp.(1) | | 446,900 | | | 14,707,479 |
| | | | | | |
Consumer Electronics - 3.4% | | | | | |
Electronic Arts Inc.(1) | | 1,019,300 | | | 57,987,977 |
VeriSign, Inc.(1) | | 3,222,300 | | | 68,860,551 |
Yahoo! Inc.(1) | | 2,218,100 | | | 75,060,504 |
| | | | |
|
|
| | | | | | 201,909,032 |
Leisure Time - 1.0% | | | | | |
Royal Caribbean Cruises Ltd. | | 1,404,051 | | | 60,655,003 |
| | | | | | |
Restaurants - 1.8% | | | | | |
P.F. Chang’s China Bistro, Inc.(1) | | 246,100 | | | 11,032,663 |
Starbucks Corporation(1) | | 298,400 | | | 14,949,840 |
YUM! Brands, Inc. | | 1,660,400 | | | 80,379,964 |
| | | | |
|
|
| | | | | | 106,362,467 |
Retail - 5.2% | | | | | |
Amazon.com, Inc.(1) | | 343,100 | | | 15,542,430 |
Chico’s FAS, Inc.(1) | | 2,435,968 | | | 89,643,623 |
Fisher Scientific International Inc.(1) | | 1,398,900 | | | 86,801,745 |
Kohl’s Corporation(1) | | 1,659,600 | | | 83,278,728 |
Office Depot, Inc.(1) | | 951,900 | | | 28,271,430 |
| | | | |
|
|
| | | | | | 303,537,956 |
Services: Commercial - 5.6% | | | | | |
Getty Images, Inc.(1) | | 884,600 | | | 76,110,984 |
Hewitt Associates, Inc.(1) | | 2,516,000 | | | 68,636,480 |
Iron Mountain Incorporated(1) | | 2,481,100 | | | 91,056,370 |
Robert Half International Inc. | | 2,570,705 | | | 91,491,391 |
| | | | |
|
|
| | | | | | 327,295,225 |
Toys - 0.5% | | | | | |
Marvel Entertainment, Inc.(1) | | 1,769,000 | | | 31,612,030 |
| | | | | | |
| | | | | |
| | | Shares
Held
| | Value
|
| CONSUMER STAPLES - 2.8% | | | | | |
Beverage: Brewers (Wineries) - 2.8% | | | |
Constellation Brands, Inc.(1) | | 6,206,600 | | $ | 161,371,600 |
| | | | | | |
| FINANCIAL SERVICES - 11.3% | | | | | |
Banks: Outside New York City - 1.5% | | | |
Northern Trust Corporation | | 1,717,700 | | | 86,829,735 |
| | | | | | |
Finance: Small Loan - 0.3% | | | |
The First Marblehead Corporation | | 652,400 | | | 16,570,960 |
| | | | | | |
Financial Data Processing Services
& Systems - 2.2% | | | |
CheckFree Corporation(1) | | 1,936,000 | | | 73,219,520 |
Paychex, Inc. | | 1,538,600 | | | 57,051,288 |
| | | | |
|
|
| | | | | | 130,270,808 |
Financial Information Services - 0.9% | | | |
Equifax Inc. | | 1,481,700 | | | 51,770,598 |
| | | | | | |
Financial Miscellaneous - 2.9% | | | | | |
CapitalSource Inc.(1) | | 2,203,600 | | | 48,038,480 |
MGIC Investment Corporation | | 852,600 | | | 54,736,920 |
Willis Group Holdings Limited | | 1,859,100 | | | 69,809,205 |
| | | | |
|
|
| | | | | | 172,584,605 |
Insurance: Multi-Line - 0.9% | | | |
Aon Corporation | | 608,500 | | | 19,520,680 |
Genworth Financial, Inc. | | 977,700 | | | 31,521,048 |
| | | | |
|
|
| | | | | | 51,041,728 |
Insurance: Property-Casualty - 0.4% | | | |
RenaissanceRe Holdings Ltd. | | 563,700 | | | 24,650,601 |
| | | | | | |
Rental & Leasing Services: Commercial - 0.8% | | | | | |
GATX Corporation | | 1,253,900 | | | 49,591,745 |
| | | | | | |
Savings & Loans - 0.5% | | | |
Golden West Financial Corporation | | 481,300 | | | 28,584,407 |
| | | | | | |
Securities Brokerage & Services - 0.9% | | | |
The Bear Stearns Companies Inc. | | 504,300 | | | 55,346,925 |
| | | | | | |
38
THIRTY-EIGHT
| | | | | |
| | | Shares
Held
| | Value
|
| HEALTHCARE - 19.6% | | | |
Biotechnology Research & Production - 3.0% | | | | | |
Genzyme Corporation(1) | | 1,124,200 | | $ | 80,537,688 |
Invitrogen Corporation(1) | | 773,100 | | | 58,160,313 |
Millipore Corporation(1) | | 321,300 | | | 20,206,557 |
Neurocrine Biosciences, Inc.(1) | | 294,000 | | | 14,461,860 |
| | | | |
|
|
| | | | | | 173,366,418 |
Drugs & Pharmaceuticals - 5.7% | | | |
Allergan, Inc. | | 1,317,500 | | | 120,709,350 |
AmerisourceBergen Corporation | | 915,900 | | | 70,799,070 |
Barr Pharmaceuticals, Inc.(1) | | 518,800 | | | 28,492,496 |
Forest Laboratories, Inc.(1) | | 976,900 | | | 38,069,793 |
MedImmune, Inc.(1) | | 1,776,000 | | | 59,762,400 |
Shire Pharmaceuticals Group plc (ADR)(2) | | 368,000 | | | 13,612,320 |
| | | | |
|
|
| | | | | | 331,445,429 |
Electronics: Medical Systems - 2.0% | | | |
Varian Medical Systems, Inc.(1) | | 2,993,300 | | | 118,265,283 |
| | | | | | |
Health Care Facilities - 0.4% | | | |
Laboratory Corporation of America Holdings(1) | | 464,000 | | | 22,601,440 |
| | | | | | |
Health Care Management Services - 4.7% | | | | | |
Aetna Inc. | | 987,300 | | | 85,046,022 |
Caremark Rx, Inc.(1) | | 1,900,200 | | | 94,876,986 |
Cerner Corporation(1) | | 1,070,200 | | | 93,032,486 |
| | | | |
|
|
| | | | | | 272,955,494 |
Medical & Dental Instruments &
Supplies - 2.0% | | | |
Gen-Probe Incorporated(1) | | 312,400 | | | 15,448,180 |
St. Jude Medical, Inc.(1) | | 1,256,500 | | | 58,804,200 |
Zimmer Holdings, Inc.(1) | | 653,800 | | | 45,040,282 |
| | | | |
|
|
| | | | | | 119,292,662 |
Medical Services - 1.8% | | | | | |
Coventry Health Care, Inc.(1) | | 1,216,100 | | | 104,608,922 |
| | | | | | |
| MATERIALS & PROCESSING - 7.0% | | | |
Chemicals - 2.5% | | | |
Air Products and Chemicals, Inc. | | 800,600 | | | 44,145,084 |
Ecolab Inc. | | 3,143,600 | | | 100,375,148 |
| | | | |
|
|
| | | | | | 144,520,232 |
Diversified Materials & Processing - 1.6% | | | | | |
American Standard Companies Inc. | | 2,057,800 | | | 95,790,590 |
| | | | | | |
Metal Fabricating - 2.2% | | | | | |
Precision Castparts Corp. | | 2,382,200 | | | 126,494,820 |
| | | | | |
| | | Shares
Held
| | Value
|
| MATERIALS & PROCESSING (CONTINUED) | | | |
Real Estate - 0.7% | | | | | |
The St. Joe Company | | 632,500 | | $ | 39,499,625 |
| | | | | | |
| OTHER - 3.8% | | | | | |
Multi-Sector Companies - 3.8% | | | |
Brunswick Corporation | | 1,375,700 | | | 51,905,161 |
ITT Industries, Inc. | | 1,109,000 | | | 125,982,400 |
McDermott International, Inc.(1) | | 1,277,300 | | | 46,761,953 |
| | | | |
|
|
| | | | | | 224,649,514 |
| OTHER ENERGY - 6.8% | | | | | |
Coal - 1.6% | | | | | |
CONSOL Energy Inc. | | 234,000 | | | 17,847,180 |
Peabody Energy Corporation | | 886,800 | | | 74,801,580 |
| | | | |
|
|
| | | | | | 92,648,760 |
Machinery: Oil Well Equipment &
Services - 4.7% | | | |
Cooper Cameron Corporation(1) | | 841,100 | | | 62,182,523 |
Noble Corporation | | 833,300 | | | 57,047,718 |
Smith International, Inc. | | 4,675,700 | | | 155,747,567 |
| | | | |
|
|
| | | | | | 274,977,808 |
Oil: Crude Producers - 0.5% | | | |
Devon Energy Corporation | | 432,100 | | | 29,659,344 |
| | | | | | |
| PRODUCER DURABLES - 6.7% | | | |
Diversified Production - 2.7% | | | |
Danaher Corporation | | 2,385,900 | | | 128,432,997 |
Pentair, Inc. | | 730,700 | | | 26,670,550 |
| | | | |
|
|
| | | | | | 155,103,547 |
Homebuilding - 0.7% | | | |
D.R. Horton, Inc. | | 1,131,900 | | | 40,997,418 |
| | | | | | |
Identification Control & Filter
Devices - 1.1% | | | |
Agilent Technologies, Inc.(1) | | 1,315,200 | | | 43,072,800 |
Roper Industries, Inc. | | 579,000 | | | 22,748,910 |
| | | | |
|
|
| | | | | | 65,821,710 |
Machinery: Industrial/
Specialty - 0.7% | | | |
Joy Global Inc. | | 807,609 | | | 40,751,950 |
| | | | | | |
Production Technology
Equipment - 0.7% | | | |
Novellus Systems, Inc.(1) | | 1,532,200 | | | 38,427,576 |
| | | | | | |
Telecommunications
Equipment - 0.8% | | | |
Andrew Corporation(1) | | 4,105,200 | | | 45,772,980 |
| | | | | | |
39
THIRTY-NINE
| | | | | |
| | | Shares
Held
| | Value
|
| TECHNOLOGY - 19.0% | | | | | |
Communications Technology - 5.0% | | | |
Comverse Technology, Inc.(1) | | 2,667,000 | | $ | 70,062,090 |
Corning Incorporated(1) | | 2,395,700 | | | 46,308,881 |
Juniper Networks, Inc.(1) | | 4,195,600 | | | 99,813,324 |
NCR Corporation(1) | | 1,089,600 | | | 34,769,136 |
TIBCO Software Inc.(1) | | 5,333,200 | | | 44,585,552 |
| | | | |
|
|
| | | | | | 295,538,983 |
Computer Services Software &
Systems - 3.5% | | | |
Adobe Systems Incorporated | | 2,164,400 | | | 64,607,340 |
Autodesk, Inc. | | 854,300 | | | 39,673,692 |
CACI International Inc(1) | | 494,400 | | | 29,960,640 |
Cognizant Technology Solutions Corporation(1) | | 643,800 | | | 29,994,642 |
Macromedia, Inc.(1) | | 1,032,700 | | | 41,999,909 |
| | | | |
|
|
| | | | | | 206,236,223 |
Computer Technology - 2.8% | | | |
Network Appliance, Inc.(1) | | 2,963,000 | | | 70,341,620 |
UNOVA, Inc.(1) | | 1,660,300 | | | 58,077,294 |
Zebra Technologies Corporation(1) | | 974,300 | | | 38,085,387 |
| | | | |
|
|
| | | | | | 166,504,301 |
Electronics - 0.2% | | | |
FLIR Systems, Inc.(1) | | 382,000 | | | 11,299,560 |
| | | | | | |
Electronics: Semi-Conductors/
Components - 7.2% | | | |
Altera Corporation(1) | | 2,584,400 | | | 49,387,884 |
Broadcom Corporation(1) | | 2,102,900 | | | 98,647,039 |
Freescale Semiconductor, Inc.(1) | | 1,239,600 | | | 29,019,036 |
Jabil Circuit, Inc.(1) | | 2,270,100 | | | 70,191,492 |
Marvell Technology Group Ltd.(1) | | 945,400 | | | 43,592,394 |
Maxim Integrated Products, Inc. | | 1,606,700 | | | 68,525,755 |
Microchip Technology Incorporated | | 1,978,800 | | | 59,601,456 |
| | | | |
|
|
| | | | | | 418,965,056 |
Electronics: Technology - 0.3% | | | |
Rockwell Automation, Inc. | | 309,700 | | | 16,383,130 |
| | | | | | |
| UTILITIES - 1.7% | | | | | |
Utilities: Gas Distributors - 1.0% | | | |
Kinder Morgan, Inc. | | 608,300 | | | 58,494,128 |
| | | | | | |
Utilities: Telecommunications - 0.7% | | | |
NII Holdings, Inc.(1) | | 513,000 | | | 43,322,850 |
| | | | |
|
|
Total common stocks
(Cost $4,489,276,727) | | | | | 5,705,181,765 |
| | | | | | |
| | | Par
Amount
| | Value
|
SHORT-TERM INVESTMENTS
(CASH EQUIVALENTS) - 1.9% | | | |
Repurchase agreement with State Street Bank and Trust Company, 3.50%, dated 9/30/05, due 10/3/05, maturity value $109,840,027, collateralized by $112,008,643 market value Federal National Mortgage Association Note,
3.25%, due 8/15/08
(Cost $109,808,000) | | $ | 109,808,000 | | $ | 109,808,000 |
| | | | | |
|
|
| | | | | | | |
Total investments - 99.3%
(Cost $4,599,084,727) | | | | | | 5,814,989,765 |
| | | | | | | |
Other assets less liabilities - 0.7% | | | | | | 40,394,039 |
| | | | | |
|
|
| | | | | | | |
Total net assets - 100.0%(3) | | | | | $ | 5,855,383,804 |
| | | | | |
|
|
| (1) | Non-income producing security. |
| (2) | The Fund considers the issuer to be from the United Kingdom as designated by its securities information vendors or, if unavailable, by Artisan Partners using the primary vendor’s published criteria or its own judgment. The security trades on a U.S. exchange. |
| (3) | Percentages for the various classifications relate to total net assets. |
(ADR) American Depository Receipt
The accompanying notes are an integral part of the financial statements.
40
FORTY
ARTISAN MID CAP VALUE FUND
Schedule of Investments – September 30, 2005
| | | | | |
| | | Shares
Held
| | Value
|
| COMMON STOCKS - 93.0% | | | | | |
| | | | | | |
| AUTO & TRANSPORTATION - 2.9% | | | |
Auto Parts: Original Equipment - 1.4% | | | |
Lear Corporation | | 1,117,200 | | $ | 37,951,284 |
| | | | | | |
Truckers - 1.5% | | | | | |
Yellow Roadway Corporation(1) | | 1,006,900 | | | 41,705,798 |
| | | | | | |
| CONSUMER DISCRETIONARY - 28.7% | | | |
Hotel/Motel - 1.0% | | | | | |
Fairmont Hotels & Resorts, Inc.(2) | | 844,200 | | | 28,213,164 |
| | | | | | |
Household Furnishings - 6.3% | | | | | |
Furniture Brands International, Inc.(3) | | 3,386,900 | | | 61,065,807 |
Leggett & Platt, Incorporated | | 2,766,500 | | | 55,883,300 |
Mohawk Industries, Inc.(1) | | 707,000 | | | 56,736,750 |
| | | | |
|
|
| | | | | | 173,685,857 |
Rental & Leasing Services: Consumer - 1.9% | | | | | |
Rent-A-Center, Inc.(1) | | 2,776,400 | | | 53,612,284 |
| | | | | | |
Restaurants - 0.5% | | | | | |
Darden Restaurants, Inc. | | 465,100 | | | 14,125,087 |
| | | | | | |
Retail - 7.4% | | | | | |
AutoZone, Inc.(1) | | 549,200 | | | 45,720,900 |
Claire’s Stores, Inc. | | 2,507,800 | | | 60,513,214 |
Foot Locker, Inc. | | 2,178,400 | | | 47,794,096 |
Zale Corporation(1)(3) | | 1,888,800 | | | 51,337,584 |
| | | | |
|
|
| | | | | | 205,365,794 |
Services: Commercial - 4.8% | | | | | |
Convergys Corporation(1) | | 2,963,200 | | | 42,581,184 |
Hewitt Associates, Inc.(1) | | 1,694,600 | | | 46,228,688 |
Manpower Inc. | | 1,012,000 | | | 44,922,680 |
| | | | |
|
|
| | | | | | 133,732,552 |
Shoes - 2.0% | | | | | |
Reebok International Ltd. | | 965,000 | | | 54,590,050 |
| | | | | | |
Textiles: Apparel Manufacturers - 1.8% | | | |
Liz Claiborne Inc. | | 1,173,900 | | | 46,157,748 |
Polo Ralph Lauren Corporation | | 94,600 | | | 4,758,380 |
| | | | |
|
|
| | | | | | 50,916,128 |
| | | | | |
| | | Shares
Held
| | Value
|
| CONSUMER DISCRETIONARY (CONTINUED) | | | |
Toys - 3.0% | | | | | |
Hasbro, Inc. | | 2,263,700 | | $ | 44,481,705 |
Marvel Entertainment, Inc.(1) | | 2,176,600 | | | 38,895,842 |
| | | | |
|
|
| | | | | | 83,377,547 |
| FINANCIAL SERVICES - 27.1% | | | | | |
Finance: Small Loan - 4.6% | | | | | |
The Student Loan Corporation | | 533,300 | | | 126,328,104 |
| | | | | | |
Financial Data Processing Services
& Systems - 2.2% | | | |
Deluxe Corporation | | 1,541,800 | | | 61,918,688 |
| | | | | | |
Financial Miscellaneous - 1.5% | | | | | |
MBIA Inc. | | 708,400 | | | 42,943,208 |
| | | | | | |
Insurance: Multi-Line - 7.7% | | | | | |
Alleghany Corporation(1) | | 278,126 | | | 85,106,556 |
CNA Financial Corporation(1) | | 1,411,200 | | | 42,152,544 |
Old Republic International Corporation | | 1,692,450 | | | 45,137,642 |
Torchmark Corporation | | 803,500 | | | 42,448,905 |
| | | | |
|
|
| | | | | | 214,845,647 |
Insurance: Property-Casualty - 3.9% | | | |
Arch Capital Group Ltd.(1) | | 789,673 | | | 39,159,884 |
White Mountains Insurance Group, Ltd. | | 112,900 | | | 68,191,600 |
| | | | |
|
|
| | | | | | 107,351,484 |
Real Estate Investment Trusts (REIT) - 0.6% | | | | | |
Annaly Mortgage Management, Inc. | | 1,220,800 | | | 15,809,360 |
| | | | | | |
Rental & Leasing Services: Commercial - 2.1% | | | | | |
Ryder System, Inc. | | 1,698,500 | | | 58,122,670 |
| | | | | | |
Savings & Loans - 1.3% | | | | | |
Washington Federal, Inc. | | 1,585,016 | | | 35,757,961 |
| | | | | | |
Securities Brokerage & Services - 3.2% | | | |
Nuveen Investments, Inc. | | 2,231,300 | | | 87,890,907 |
41
FORTY-ONE
| | | | | |
| | | Shares
Held
| | Value
|
| MATERIALS & PROCESSING - 7.0% | | | |
Chemicals - 3.5% | | | | | |
Albemarle Corporation | | 747,600 | | $ | 28,184,520 |
The Lubrizol Corporation | | 1,591,700 | | | 68,968,361 |
| | | | |
|
|
| | | | | | 97,152,881 |
Engineering & Contracting Services - 1.0% | | | | | |
Jacobs Engineering Group Inc.(1) | | 409,800 | | | 27,620,520 |
| | | | | | |
Paints & Coatings - 2.5% | | | | | |
The Sherwin-Williams Company | | 1,598,600 | | | 70,450,302 |
| | | | | | |
| OTHER ENERGY - 14.8% | | | | | |
Oil: Crude Producers - 14.8% | | | | | |
Apache Corporation | | 992,846 | | | 74,681,876 |
Cimarex Energy Co.(1) | | 798,400 | | | 36,191,472 |
Noble Energy, Inc. | | 1,144,600 | | | 53,681,740 |
Pioneer Natural Resources Company | | 2,272,004 | | | 124,778,460 |
Pogo Producing Company | | 986,600 | | | 58,150,204 |
XTO Energy Inc. | | 1,360,942 | | | 61,677,891 |
| | | | |
|
|
| | | | | | 409,161,643 |
| PRODUCER DURABLES - 3.6% | | | | | |
Diversified Production - 0.7% | | | | | |
Dover Corporation | | 452,000 | | | 18,437,080 |
| | | | | | |
Office Furniture & Business Equipment - 2.9% | | | | | |
Lexmark International, Inc.(1) | | 1,327,300 | | | 81,031,665 |
| | | | | | |
| TECHNOLOGY - 7.9% | | | | | |
Computer Services Software &
Systems - 5.8% | | | |
BEA Systems, Inc.(1) | | 7,085,200 | | | 63,625,096 |
BMC Software, Inc.(1) | | 1,783,500 | | | 37,631,850 |
Siebel Systems, Inc. | | 5,623,000 | | | 58,085,590 |
| | | | |
|
|
| | | | | | 159,342,536 |
Computer Technology - 0.5% | | | |
Ingram Micro Inc.(1) | | 767,900 | | | 14,236,866 |
| | | | | | |
Electronics: Semi-Conductors/
Components - 1.6% | | | | | |
Avnet, Inc.(1) | | 1,865,900 | | | 45,621,255 |
| | | | | | |
| UTILITIES - 1.0% | | | | | |
Utilities: Electrical - 1.0% | | | | | |
Westar Energy, Inc. | | 1,126,000 | | | 27,170,380 |
| | | | |
|
|
Total common stocks
(Cost $2,373,299,569) | | | | | 2,578,468,702 |
| | | | | | | |
| | | Par
Amount
| | Value
| |
| SHORT-TERM INVESTMENTS (CASH EQUIVALENTS) - 7.4% | | | | | | | |
Repurchase agreement with State Street Bank & Trust Company, 3.50%, dated 9/30/05, due 10/3/05, maturity value $203,958,471, collateralized by $101,805,289 market value Federal Home Loan Bank Note, 4.125%, due 4/18/08 and $106,171,900 market value Federal National Mortgage Association Note,
6.00%, due 5/15/08
(Cost $203,899,000) | | $ | 203,899,000 | | $ | 203,899,000 | |
| | | | | |
|
|
|
| | | | | | | | |
Total investments - 100.4%
(Cost $2,577,198,569) | | | | | | 2,782,367,702 | |
| | | | | | | | |
Other assets less liabilities - (0.4%) | | | | | | (11,209,923 | ) |
| | | | | |
|
|
|
| | | | | | | | |
Total net assets - 100.0%(4) | | | | | $ | 2,771,157,779 | |
| | | | | |
|
|
|
| (1) | Non-income producing security. |
| (2) | The Fund considers the issuer to be from Canada, as designated by its securities information vendors or, if unavailable, by Artisan Partners using the primary vendor’s published criteria or its own judgment. The security trades on a U.S. exchange. |
| (3) | Affiliated company as defined by the Investment Company Act of 1940. See Note (6) in Notes to Financial Statements. |
| (4) | Percentages for the various classifications relate to total net assets. |
The accompanying notes are an integral part of the financial statements.
42
FORTY-TWO
ARTISAN SMALL CAP FUND
Schedule of Investments – September 30, 2005
| | | | | |
| | | Shares
Held
| | Value
|
| COMMON STOCKS - 96.3% | | | | | |
| | | | | | |
| AUTO & TRANSPORTATION - 3.8% | | | |
Air Transport - 1.3% | | | | | |
AirTran Holdings, Inc.(1) | | 1,118,200 | | $ | 14,156,412 |
| | | | | | |
Auto Parts: After Market - 1.0% | | | |
Keystone Automotive Industries, Inc.(1) | | 395,900 | | | 11,405,879 |
| | | | | | |
Transportation: Miscellaneous - 1.5% | | | |
Pacer International, Inc. | | 604,200 | | | 15,926,712 |
| | | | | | |
| CONSUMER DISCRETIONARY - 21.2% | | | |
Education Services - 3.0% | | | | | |
Strayer Education, Inc. | | 183,300 | | | 17,325,516 |
Universal Technical Institute, Inc.(1) | | 437,300 | | | 15,572,253 |
| | | | |
|
|
| | | | | | 32,897,769 |
Radio & TV Broadcasters - 1.1% | | | |
Spanish Broadcasting System, Inc.(1) | | 1,627,600 | | | 11,686,168 |
| | | | | | |
Restaurants - 2.3% | | | | | |
California Pizza Kitchen, Inc.(1) | | 363,100 | | | 10,617,044 |
RARE Hospitality International, Inc.(1) | | 584,950 | | | 15,033,215 |
| | | | |
|
|
| | | | | | 25,650,259 |
Retail - 4.4% | | | | | |
Central Garden & Pet Company(1) | | 269,400 | | | 12,190,350 |
The Children’s Place Retail Stores, Inc.(1) | | 243,600 | | | 8,681,904 |
Coldwater Creek Inc.(1) | | 302,225 | | | 7,622,114 |
Hibbett Sporting Goods, Inc.(1) | | 529,750 | | | 11,786,938 |
Rush Enterprises, Inc.(1) | | 504,000 | | | 7,701,120 |
| | | | |
|
|
| | | | | | 47,982,426 |
Services: Commercial - 6.0% | | | | | |
The Advisory Board Company(1) | | 277,900 | | | 14,461,916 |
CRA International, Inc.(1) | | 340,100 | | | 14,178,769 |
Hudson Highland Group, Inc.(1) | | 427,200 | | | 10,667,184 |
Jackson Hewitt Tax Service Inc. | | 580,300 | | | 13,874,973 |
Waste Connections, Inc.(1) | | 380,450 | | | 13,346,186 |
| | | | |
|
|
| | | | | | 66,529,028 |
Shoes - 1.1% | | | | | |
Deckers Outdoor Corporation(1) | | 520,400 | | | 12,520,824 |
| | | | | |
| | | Shares
Held
| | Value
|
| CONSUMER DISCRETIONARY (CONTINUED) | | | |
Textiles Apparel Manufacturers - 0.7% | | | |
Maidenform Brands, Inc.(1) | | 581,300 | | $ | 7,992,875 |
| | | | | | |
Wholesalers - 2.6% | | | | | |
LKQ Corporation(1) | | 512,700 | | | 15,483,540 |
Prestige Brands Holdings, Inc.(1) | | 1,044,500 | | | 12,868,240 |
| | | | |
|
|
| | | | | | 28,351,780 |
| FINANCIAL SERVICES - 14.1% | | | | | |
Banks: Outside New York City - 1.8% | | | |
Alabama National BanCorporation | | 145,600 | | | 9,309,664 |
Main Street Banks, Inc. | | 390,300 | | | 10,460,040 |
| | | | |
|
|
| | | | | | 19,769,704 |
Finance: Small Loan - 0.5% | | | | | |
The First Marblehead Corporation | | 214,500 | | | 5,448,300 |
| | | | | | |
Financial Data Processing Services & Systems - 1.6% | | | | | |
TNS, Inc.(1) | | 722,100 | | | 17,510,925 |
| | | | | | |
Insurance: Multi-Line - 2.4% | | | | | |
HealthExtras, Inc.(1) | | 606,800 | | | 12,973,384 |
Platinum Underwriters Holdings, Ltd. | | 447,800 | | | 13,384,742 |
| | | | |
|
|
| | | | | | 26,358,126 |
Insurance: Property-Casualty - 1.5% | | | |
Ohio Casualty Corporation | | 629,700 | | | 17,077,464 |
| | | | | | |
Investment Management Companies - 1.4% | | | | | |
National Financial Partners Corp. | | 349,500 | | | 15,776,430 |
| | | | | | |
Real Estate Investment Trusts (REIT) - 1.4% | | | | | |
La Quinta Corporation(1) | | 1,804,900 | | | 15,684,581 |
| | | | | | |
Savings & Loans - 1.9% | | | | | |
Bank Mutual Corporation | | 811,500 | | | 8,699,280 |
BankAtlantic Bancorp, Inc. | | 689,300 | | | 11,711,207 |
| | | | |
|
|
| | | | | | 20,410,487 |
Securities Brokerage & Services - 1.6% | | | |
optionsXpress Holdings, Inc. | | 909,200 | | | 17,311,168 |
43
FORTY-THREE
| | | | | |
| | | Shares
Held
| | Value
|
| HEALTHCARE - 14.7% | | | | | |
Biotechnology Research & Production - 0.9% | | | |
PRA International(1) | | 322,300 | | $ | 9,768,913 |
| | | | | | |
Drugs & Pharmaceuticals - 2.6% | | | |
Salix Pharmaceuticals, Ltd.(1) | | 586,200 | | | 12,456,750 |
SFBC International, Inc.(1) | | 370,200 | | | 16,433,178 |
| | | | |
|
|
| | | | | | 28,889,928 |
Electronics: Medical Systems - 1.1% | | | |
IntraLase Corp.(1) | | 854,200 | | | 12,565,282 |
| | | | | | |
Health Care Management Services - 1.6% | | | |
Sierra Health Services, Inc.(1) | | 257,300 | | | 17,720,251 |
| | | | | | |
Health Care Services - 1.6% | | | | | |
IDX Systems Corporation(1) | | 417,400 | | | 18,023,332 |
| | | | | | |
Medical & Dental Instruments &
Supplies - 5.7% | | | |
American Medical Systems Holdings, Inc.(1) | | 224,500 | | | 4,523,675 |
I-Flow Corporation(1) | | 776,700 | | | 10,648,557 |
Meridian Bioscience, Inc. | | 342,200 | | | 7,083,540 |
PSS World Medical, Inc.(1) | | 915,100 | | | 12,207,434 |
Symmetry Medical Inc.(1) | | 583,800 | | | 13,836,060 |
Wright Medical Group, Inc.(1) | | 574,500 | | | 14,178,660 |
| | | | |
|
|
| | | | | | 62,477,926 |
Medical Services - 1.2% | | | | | |
VCA Antech, Inc.(1) | | 517,000 | | | 13,193,840 |
| | | | | | |
| MATERIALS & PROCESSING - 3.8% | | | |
Building Materials - 1.3% | | | | | |
Hughes Supply, Inc. | | 443,000 | | | 14,441,800 |
| | | | | | |
Building: Heating & Plumbing - 1.4% | | | |
Interline Brands, Inc.(1) | | 759,800 | | | 15,963,398 |
| | | | | | |
Chemicals - 1.1% | | | | | |
NuCO2 Inc.(1) | | 450,900 | | | 11,610,675 |
| | | | | | |
| OTHER ENERGY - 7.6% | | | | | |
Coal - 1.2% | | | | | |
James River Coal Company(1) | | 256,100 | | | 12,925,367 |
| | | | | | |
Energy Equipment - 0.8% | | | | | |
Global Power Equipment Group Inc.(1)(2) | | 1,224,700 | | | 8,732,111 |
| | | | | |
| | | Shares
Held
| | Value
|
| OTHER ENERGY (CONTINUED) | | | | | |
Machinery: Oil Well Equipment &
Services - 2.2% | | | |
Hornbeck Offshore Services, Inc.(1) | | 215,700 | | $ | 7,901,091 |
W-H Energy Services, Inc.(1) | | 511,400 | | | 16,579,588 |
| | | | |
|
|
| | | | | | 24,480,679 |
Oil: Crude Producers - 3.4% | | | | | |
Brigham Exploration Company(1) | | 1,159,300 | | | 14,897,005 |
TODCO | | 180,000 | | | 7,507,800 |
Unit Corporation(1) | | 282,000 | | | 15,588,960 |
| | | | |
|
|
| | | | | | 37,993,765 |
| PRODUCER DURABLES - 8.7% | | | | | |
Aerospace - 1.2% | | | | | |
MTC Technologies, Inc.(1) | | 400,600 | | | 12,811,188 |
| | | | | | |
Homebuilding - 1.3% | | | | | |
WCI Communities, Inc.(1) | | 523,100 | | | 14,840,347 |
| | | | | | |
Machinery: Industrial/Specialty - 2.8% | | | |
Actuant Corporation | | 369,100 | | | 17,273,880 |
Gardner Denver, Inc.(1) | | 308,600 | | | 13,763,560 |
| | | | |
|
|
| | | | | | 31,037,440 |
Machinery: Specialty - 1.1% | | | | | |
Applied Films Corporation(1) | | 565,600 | | | 11,877,600 |
| | | | | | |
Production Technology Equipment - 2.3% | | | |
Axcelis Technologies, Inc.(1) | | 2,889,100 | | | 15,081,102 |
Cymer, Inc.(1) | | 327,700 | | | 10,263,564 |
| | | | |
|
|
| | | | | | 25,344,666 |
| TECHNOLOGY - 22.4% | | | | | |
Communications Technology - 4.2% | | | |
Avocent Corporation(1) | | 536,400 | | | 16,971,696 |
Foundry Networks, Inc.(1) | | 781,600 | | | 9,926,320 |
Tekelec(1) | | 934,500 | | | 19,577,775 |
| | | | |
|
|
| | | | | | 46,475,791 |
Computer Services Software &
Systems - 11.3% | | | |
Anteon International Corporation(1) | | 288,900 | | | 12,353,364 |
Dendrite International, Inc.(1) | | 725,200 | | | 14,569,268 |
Epicor Software Corporation(1) | | 775,500 | | | 10,081,500 |
F5 Networks, Inc.(1) | | 243,900 | | | 10,602,333 |
Infocrossing, Inc.(1) | | 499,900 | | | 4,594,081 |
Macrovision Corporation(1) | | 760,900 | | | 14,533,190 |
Open Solutions Inc.(1) | | 576,500 | | | 12,579,230 |
Progress Software Corporation(1) | | 310,700 | | | 9,870,939 |
Radware Ltd.(1)(3) | | 497,600 | | | 9,479,280 |
Serena Software Inc.(1) | | 734,200 | | | 14,632,606 |
Witness Systems, Inc.(1) | | 537,600 | | | 11,230,464 |
| | | | |
|
|
| | | | | | 124,526,255 |
44
FORTY-FOUR
| | | | | | | |
| | | Shares
Held
| | Value
| |
| TECHNOLOGY (CONTINUED) | | | | |
Computer Technology - 1.1% | | | | |
Stratasys Inc.(1) | | | 415,500 | | $ | 12,340,350 | |
| | | | | | | | |
Electronics - 2.9% | | | | | | | |
Aeroflex Incorporated(1) | | | 1,755,500 | | | 16,431,480 | |
Semtech Corporation(1) | | | 970,300 | | | 15,980,841 | |
| | | | | |
|
|
|
| | | | | | | 32,412,321 | |
Electronics: Semi-Conductors/
Components - 2.9% | | | | |
DSP Group, Inc.(1) | | | 578,900 | | | 14,854,574 | |
SiRF Technology Holdings, Inc.(1) | | | 202,400 | | | 6,098,312 | |
Skyworks Solutions Inc.(1) | | | 1,533,800 | | | 10,767,276 | |
| | | | | |
|
|
|
| | | | | | | 31,720,162 | |
| | | | | |
|
|
|
Total common stocks
(Cost $960,726,360) | | | | | | 1,062,620,704 | |
| | |
| | | Par
Amount
| | | |
| | | | | | | | |
| SHORT-TERM INVESTMENTS (CASH EQUIVALENTS) - 7.5% | | | | | | | |
Repurchase agreement with State Street Bank and Trust Company, 3.50%, dated 9/30/05, due 10/3/05, maturity value $83,050,216, collateralized by $84,687,145 market value Federal Home Loan Bank Note, 3.75%, due 8/15/08
(Cost $83,026,000) | | $ | 83,026,000 | | | 83,026,000 | |
| | | | | |
|
|
|
| | | | | | | | |
Total investments - 103.8%
(Cost $1,043,752,360) | | | | | | 1,145,646,704 | |
| | | | | | | | |
Other assets less liabilities - (3.8%) | | | | | | (42,395,286 | ) |
| | | | | |
|
|
|
| | | | | | | | |
Total net assets - 100.0%(4) | | | | | $ | 1,103,251,418 | |
| | | | | |
|
|
|
| (1) | Non-income producing security. |
| (2) | Affiliated company as defined by the Investment Company Act of 1940. See Note (6) in Notes to Financial Statements. |
| (3) | The Fund considers the issuer to be from Israel as designated by its securities information vendors or, if unavailable, by Artisan Partners using the primary vendor’s published criteria or its own judgment. The security trades on a U.S. exchange. |
| (4) | Percentages for the various classifications relate to total net assets. |
The accompanying notes are an integral part of the financial statements.
45
FORTY-FIVE
ARTISAN SMALL CAP VALUE FUND
Schedule of Investments – September 30, 2005
| | | | | |
| | | Shares
Held
| | Value
|
| COMMON STOCKS - 94.1% | | | | | |
| | | | | | |
| AUTO & TRANSPORTATION - 4.1% | | | |
Auto Parts: After Market - 1.8% | | | |
Superior Industries International, Inc.(1) | | 1,463,900 | | $ | 31,503,128 |
| | | | | | |
Recreational Vehicles & Boats - 0.4% | | | |
Arctic Cat Inc. | | 358,000 | | | 7,353,320 |
| | | | | | |
Shipping - 1.1% | | | |
Kirby Corporation(2) | | 359,000 | | | 17,745,370 |
| | | | | | |
Truckers - 0.8% | | | |
Arkansas Best Corporation | | 379,300 | | | 13,226,191 |
| | | | | | |
| CONSUMER DISCRETIONARY - 31.0% | | | |
Advertising Agencies - 1.8% | | | |
ADVO, Inc. | | 987,000 | | | 30,883,230 |
| | | | | | |
Commercial Information Services - 0.9% | | | |
ProQuest Company(2) | | 439,100 | | | 15,895,420 |
| | | | | | |
Consumer Electronics - 0.6% | | | |
EarthLink, Inc.(2) | | 558,700 | | | 5,978,090 |
United Online, Inc. | | 370,000 | | | 5,124,500 |
| | | | |
|
|
| | | | | | 11,102,590 |
Entertainment - 1.3% | | | |
Movie Gallery, Inc.(1) | | 2,081,900 | | | 21,630,941 |
| | | | | | |
Household Furnishings - 4.6% | | | |
Ethan Allen Interiors Inc. | | 1,016,900 | | | 31,879,815 |
Furniture Brands International, Inc.(1) | | 1,942,800 | | | 35,028,684 |
La-Z-Boy Incorporated | | 898,700 | | | 11,853,853 |
| | | | |
|
|
| | | | | | 78,762,352 |
Radio & TV Broadcasters - 0.8% | | | |
World Wrestling Entertainment, Inc. | | 988,200 | | | 12,846,600 |
| | | | | | |
Rental & Leasing Services:
Consumer - 0.9% | | | |
Rent-A-Center, Inc.(2) | | 841,700 | | | 16,253,227 |
| | | | | | |
Restaurants - 0.3% | | | |
Ruby Tuesday, Inc. | | 247,600 | | | 5,387,776 |
| | | | | | |
| | | | | |
| | | Shares
Held
| | Value
|
| CONSUMER DISCRETIONARY (CONTINUED) | | | |
Retail - 8.0% | | | |
1-800 CONTACTS, INC.(2) | | 583,200 | | $ | 10,935,000 |
Brown Shoe Company, Inc. | | 510,900 | | | 16,859,700 |
Global Imaging Systems, Inc.(2) | | 126,800 | | | 4,317,540 |
Linens ‘n Things, Inc.(2) | | 821,100 | | | 21,923,370 |
Payless ShoeSource, Inc.(2) | | 1,248,600 | | | 21,725,640 |
The Pep Boys - Manny, Moe & Jack | | 749,100 | | | 10,367,544 |
PETCO Animal Supplies, Inc.(2) | | 378,200 | | | 8,002,712 |
Zale Corporation(1)(2) | | 1,573,000 | | | 42,754,140 |
| | | | |
|
|
| | | | | | 136,885,646 |
Services: Commercial - 8.5% | | | |
AMN Healthcare Services, Inc.(1)(2) | | 1,579,100 | | | 24,428,677 |
CDI Corp. | | 608,200 | | | 17,966,228 |
Cross Country Healthcare, Inc.(2) | | 754,300 | | | 13,999,808 |
DiamondCluster International, Inc.(2) | | 1,548,000 | | | 11,733,840 |
Korn/Ferry International(2) | | 432,300 | | | 7,085,397 |
Medical Staffing Network Holdings, Inc.(2) | | 1,510,300 | | | 8,865,461 |
Tetra Tech, Inc.(2) | | 1,137,600 | | | 19,134,432 |
Watson Wyatt & Company Holdings | | 1,582,300 | | | 42,642,985 |
| | | | |
|
|
| | | | | | 145,856,828 |
Textiles: Apparel Manufacturers - 2.7% | | | |
Kellwood Company(1) | | 1,786,450 | | | 46,179,732 |
| | | | | | |
Wholesalers - 0.6% | | | |
United Stationers Inc.(2) | | 231,200 | | | 11,065,232 |
| | | | | | |
| FINANCIAL SERVICES - 14.4% | | | | | |
Finance Companies - 0.5% | | | |
Assured Guaranty Ltd. | | 333,500 | | | 7,980,655 |
| | | | | | |
Financial Data Processing Services &
Systems - 0.7% | | | |
Hypercom Corporation(2) | | 1,137,700 | | | 7,417,804 |
John H. Harland Company | | 119,500 | | | 5,305,800 |
| | | | |
|
|
| | | | | | 12,723,604 |
Financial: Miscellaneous - 4.2% | | | |
LandAmerica Financial Group, Inc. | | 160,400 | | | 10,369,860 |
Stewart Information Services Corporation(1) | | 1,222,900 | | | 62,612,480 |
| | | | |
|
|
| | | | | | 72,982,340 |
46
FORTY-SIX
| | | | | |
| | | Shares
Held
| | Value
|
| FINANCIAL SERVICES (CONTINUED) | | | |
Insurance: Multi-Line - 5.6% | | | |
Hilb Rogal and Hobbs Company | | 1,576,900 | | $ | 58,849,908 |
Hub International Limited(3) | | 577,800 | | | 13,104,504 |
PICO Holdings, Inc.(1)(2) | | 688,000 | | | 24,176,320 |
| | | | |
|
|
| | | | | | 96,130,732 |
Insurance: Property-Casualty - 1.2% | | | |
Arch Capital Group Ltd.(2) | | 151,800 | | | 7,527,762 |
IPC Holdings, Ltd. | | 414,400 | | | 13,530,160 |
| | | | |
|
|
| | | | | | 21,057,922 |
Investment Management
Companies - 1.8% | | | |
Capital Southwest Corporation | | 156,600 | | | 13,337,622 |
GAMCO Investors, Inc. | | 377,700 | | | 17,317,545 |
| | | | |
|
|
| | | | | | 30,655,167 |
Real Estate Investment
Trusts (REIT) - 0.4% | | | |
Eagle Hospitality Properties Trust, Inc. | | 689,200 | | | 6,878,216 |
| | | | | | |
| HEALTHCARE - 2.4% | | | |
Electronics: Medical Systems - 0.7% | | | |
Analogic Corporation | | 250,700 | | | 12,637,787 |
| | | | | | |
Medical & Dental Instruments &
Supplies - 1.3% | | | |
National Dentex Corporation(1)(2) | | 359,400 | | | 7,403,640 |
VIASYS Healthcare Inc.(2) | | 582,200 | | | 14,549,178 |
| | | | |
|
|
| | | | | | 21,952,818 |
Medical Services - 0.4% | | | |
America Service Group Inc.(2) | | 403,000 | | | 6,685,770 |
| | | | | | |
| MATERIALS & PROCESSING - 9.3% | | | |
Agriculture: Fishing & Ranching - 0.7% | | | |
Delta and Pine Land Company | | 420,600 | | | 11,108,046 |
| | | | | | |
Building Materials - 2.1% | | | |
Simpson Manufacturing Co., Inc. | | 931,300 | | | 36,451,082 |
| | | | | | |
Building: Miscellaneous - 0.5% | | | |
Griffon Corporation(2) | | 371,500 | | | 9,138,900 |
| | | | | | |
Chemicals - 2.2% | | | |
Albemarle Corporation | | 597,600 | | | 22,529,520 |
NewMarket Corporation(2) | | 479,800 | | | 8,319,732 |
Octel Corp. | | 378,100 | | | 6,302,927 |
| | | | |
|
|
| | | | | | 37,152,179 |
| | | | | |
| | | Shares
Held
| | Value
|
| MATERIALS & PROCESSING (CONTINUED) | | | |
Construction - 0.5% | | | |
EMCOR Group, Inc.(2) | | 63,000 | | $ | 3,735,900 |
Washington Group International, Inc.(2) | | 93,400 | | | 5,033,326 |
| | | | |
|
|
| | | | | | 8,769,226 |
Copper - 0.6% | | | |
Mueller Industries, Inc. | | 354,400 | | | 9,841,688 |
| | | | | | |
Engineering & Contracting
Services - 0.5% | | | |
Dycom Industries, Inc.(2) | | 453,600 | | | 9,171,792 |
| | | | | | |
Metal Fabricating - 1.4% | | | |
Quanex Corporation | | 171,150 | | | 11,333,553 |
Superior Essex Inc.(2) | | 660,900 | | | 11,902,809 |
| | | | |
|
|
| | | | | | 23,236,362 |
Steel - 0.8% | | | |
Schnitzer Steel Industries, Inc. | | 445,900 | | | 14,522,963 |
| | | | | | |
| OTHER ENERGY - 16.5% | | | | | |
Energy Equipment - 0.5% | | | |
Global Power Equipment Group Inc.(1)(2) | | 1,332,000 | | | 9,497,160 |
| | | | | | |
Energy: Miscellaneous - 1.0% | | | |
Penn Virginia Corporation | | 302,700 | | | 17,468,817 |
| | | | | | |
Machinery: Oil Well Equipment &
Services - 0.4% | | | |
Superior Energy Services, Inc.(2) | | 291,800 | | | 6,737,662 |
| | | | | | |
Oil: Crude Producers - 14.6% | | | |
Cabot Oil & Gas Corporation | | 351,425 | | | 17,750,477 |
Carrizo Oil & Gas, Inc.(2) | | 197,300 | | | 5,780,890 |
Cimarex Energy Co.(2) | | 815,200 | | | 36,953,016 |
Forest Oil Corporation(2) | | 269,358 | | | 14,033,552 |
The Meridian Resource Corporation(2) | | 658,700 | | | 2,746,779 |
Plains Exploration & Production Company(2) | | 1,172,593 | | | 50,210,432 |
Range Resources Corporation | | 130,500 | | | 5,038,605 |
Remington Oil and Gas Corporation(2) | | 407,800 | | | 16,923,700 |
St. Mary Land & Exploration Company | | 1,139,100 | | | 41,691,060 |
Spinnaker Exploration Company(2) | | 187,100 | | | 12,103,499 |
Stone Energy Corporation(2) | | 779,200 | | | 47,562,368 |
| | | | |
|
|
| | | | | | 250,794,378 |
47
FORTY-SEVEN
| | | | | |
| | | Shares
Held
| | Value
|
| PRODUCER DURABLES - 3.3% | | | |
Electrical Equipment &
Components - 1.5% | | | |
General Cable Corporation(2) | | 1,195,700 | | $ | 20,087,760 |
The Genlyte Group Incorporated(2) | | 138,600 | | | 6,663,888 |
| | | | |
|
|
| | | | | | 26,751,648 |
Power Transmission Equipment - 0.2% | | | |
Regal-Beloit Corporation | | 136,800 | | | 4,437,792 |
| | | | | | |
Production Technology
Equipment - 0.6% | | | |
LTX Corporation(2) | | 2,208,400 | | | 9,319,448 |
Ultratech, Inc.(2) | | 25,000 | | | 389,750 |
| | | | |
|
|
| | | | | | 9,709,198 |
Telecommunications Equipment - 1.0% | | | |
Belden CDT Inc. | | 865,600 | | | 16,818,608 |
| | | | | | |
| TECHNOLOGY - 11.2% | | | | | |
Communications Technology - 2.5% | | | |
Black Box Corporation | | 483,600 | | | 20,291,856 |
CSG Systems International, Inc.(2) | | 649,900 | | | 14,109,329 |
TIBCO Software Inc.(2) | | 1,068,700 | | | 8,934,332 |
| | | | |
|
|
| | | | | | 43,335,517 |
Computer Services Software &
Systems - 7.1% | | | |
Altiris, Inc.(2) | | 1,277,600 | | | 19,534,504 |
Borland Software Corporation(2) | | 1,305,000 | | | 7,595,100 |
CIBER, Inc.(2) | | 1,376,000 | | | 10,223,680 |
Gartner, Inc.(2) | | 1,523,400 | | | 17,808,546 |
Keane, Inc.(2) | | 1,349,500 | | | 15,424,785 |
Lawson Software, Inc.(2) | | 3,333,000 | | | 23,131,020 |
Manhattan Associates, Inc.(2) | | 764,300 | | | 17,731,760 |
webMethods, Inc.(2) | | 1,606,000 | | | 11,354,420 |
| | | | |
|
|
| | | | | | 122,803,815 |
Computer Technology - 1.2% | | | |
Advanced Digital Information Corporation(2) | | 1,766,500 | | | 16,605,100 |
Imation Corp. | | 70,300 | | | 3,013,761 |
| | | | |
|
|
| | | | | | 19,618,861 |
Scientific Equipment &
Suppliers - 0.4% | | | |
Newport Corporation(2) | | 530,900 | | | 7,395,437 |
| | | | | | |
| UTILITIES - 1.9% | | | | | |
Utilities: Electrical - 0.7% | | | |
El Paso Electric Company(2) | | 601,900 | | | 12,549,615 |
| | | | | | | |
| | | Shares
Held
| | Value
| |
Utilities: Gas Distributors - 0.5% | | | | |
SEMCO Energy, Inc.(2) | | | 1,138,340 | | $ | 7,501,661 | |
| | | | | | | | |
Utilities: Telecommunications - 0.7% | | | | |
IDT Corporation, Class B(2) | | | 547,800 | | | 6,677,682 | |
IDT Corporation, Class C(2) | | | 469,800 | | | 5,778,540 | |
| | | | | |
|
|
|
| | | | | | | 12,456,222 | |
| | | | | |
|
|
|
Total common stocks
(Cost $1,281,576,760) | | | | | | 1,619,531,223 | |
| | | Par Amount
| | | |
| SHORT-TERM INVESTMENTS (CASH EQUIVALENTS) - 6.2% | | | | | | | |
Repurchase agreement with State Street Bank and Trust Company, 3.50%, dated 9/30/05, due 10/3/05, maturity value $106,375,017, collateralized by $108,475,064 market value Federal National Mortgage Association Note,
3.25% due 8/15/08
(Cost $106,344,000) | | $ | 106,344,000 | | | 106,344,000 | |
| | | | | |
|
|
|
| | | | | | | | |
Total investments - 100.3%
(Cost $1,387,920,760) | | | | | | 1,725,875,223 | |
| | | | | | | | |
Other assets less liabilities - (0.3%) | | | (5,002,528 | ) |
| | | | | |
|
|
|
| | | | | | | | |
Total net assets - 100.0%(4) | | | | | $ | 1,720,872,695 | |
| | | | | |
|
|
|
| (1) | Affiliated company as defined by the Investment Company Act of 1940. See Note (6) in Notes to Financial Statements. |
| (2) | Non-income producing security. |
| (3) | The Fund considers the issuer to be from Canada as designated by its securities information vendors or, if unavailable, by Artisan Partners using the primary vendor’s published criteria or its own judgement. The security trades on the U.S. exchange. |
| (4) | Percentage for the various classifications relate to total net assets. |
The accompanying notes are an integral part of the financial statements.
48
FORTY-EIGHT
[THIS PAGE INTENTIONALLY LEFT BLANK]
ARTISAN FUNDS, INC.
Statements of Assets and Liabilities – September 30, 2005
| | | | | | | | |
| | | INTERNATIONAL
| | | INTERNATIONAL SMALL CAP
| |
| ASSETS: | | | | | | | | |
Investments in securities, unaffiliated, at value | | $ | 11,131,861,829 | | | $ | 728,727,234 | |
Investments in securities, affiliated, at value | | | 392,727,748 | | | | 11,543,123 | |
Short-term investments (repurchase agreements), at value | | | 42,456,000 | | | | 28,153,000 | |
| | |
|
|
| |
|
|
|
Total investments | | | 11,567,045,577 | | | | 768,423,357 | |
Cash | | | 936 | | | | 955 | |
Receivable from investments sold | | | 120,616,254 | | | | 18,253,750 | |
Unrealized gain on foreign currency forward contracts | | | - | | | | - | |
Foreign currency | | | 80,461 | | | | - | |
Receivable from fund shares sold | | | 17,395,083 | | | | 5,234,261 | |
Dividends and interest receivable | | | 25,751,066 | | | | 1,678,690 | |
| | |
|
|
| |
|
|
|
Total assets | | | 11,730,889,377 | | | | 793,591,013 | |
| | |
| LIABILITIES: | | | | | | | | |
Payable for investments purchased | | | 35,646,349 | | | | 10,170,444 | |
Unrealized loss on foreign currency forward contracts | | | 45,752 | | | | 12,999 | |
Due to custodian for foreign currency | | | - | | | | 784,006 | |
Payable for fund shares redeemed | | | 15,434,130 | | | | 1,059,787 | |
Payable for operating expenses | | | 2,711,699 | | | | 202,723 | |
Payable for withholding taxes | | | 2,051,880 | | | | 211,543 | |
| | |
|
|
| |
|
|
|
Total liabilities | | | 55,889,810 | | | | 12,441,502 | |
| | |
|
|
| |
|
|
|
Total net assets | | $ | 11,674,999,567 | | | $ | 781,149,511 | |
| | |
|
|
| |
|
|
|
| NET ASSETS CONSIST OF: | | | | | | | | |
Fund shares issued and outstanding | | $ | 9,396,337,173 | | | $ | 477,615,260 | |
Net unrealized appreciation (depreciation) on investments and foreign currency related transactions | | | 2,805,365,559 | | | | 228,169,647 | |
Accumulated undistributed net investment income (loss) | | | 104,696,688 | | | | 6,054,994 | |
Accumulated undistributed net realized gains (losses) on investments and foreign currency related transactions | | | (631,399,853 | ) | | | 69,309,610 | |
| | |
|
|
| |
|
|
|
| | | $ | 11,674,999,567 | | | $ | 781,149,511 | |
| | |
|
|
| |
|
|
|
| SUPPLEMENTARY INFORMATION: | | | | | | | | |
Net assets | | | | | | | | |
Investor Shares | | $ | 7,686,916,648 | | | $ | 781,149,511 | |
Institutional Shares | | $ | 3,988,082,919 | | | | | |
Shares outstanding (Indefinite number of shares authorized, $0.01 par value) | | | | | | | | |
Investor Shares | | | 315,006,611 | | | | 37,451,289 | |
Institutional Shares | | | 162,500,709 | | | | | |
Net asset value, offering price and redemption price per share | | | | | | | | |
Investor Shares | | $ | 24.40 | | | $ | 20.86 | |
Institutional Shares | | $ | 24.54 | | | | | |
Cost of securities of unaffiliated issuers held | | $ | 8,489,556,236 | | | $ | 535,168,529 | |
Cost of securities of affiliated issuers held | | $ | 271,804,934 | | | $ | 4,893,814 | |
Cost of foreign currency | | $ | 80,726 | | | $ | (773,654 | ) |
50
FIFTY
| | | | | | | | | | | | | |
INTERNATIONAL VALUE
| | MID CAP
| | MID CAP VALUE
| | SMALL CAP
| | SMALL CAP VALUE
|
| | | | | | | | | | | | | | |
| $ | 539,633,193 | | $ | 5,705,181,765 | | $ | 2,466,065,311 | | $ | 1,053,888,593 | | $ | 1,314,316,321 |
| | 23,306,576 | | | - | | | 112,403,391 | | | 8,732,111 | | | 305,214,902 |
| | 29,997,000 | | | 109,808,000 | | | 203,899,000 | | | 83,026,000 | | | 106,344,000 |
|
| |
|
| |
|
| |
|
| |
|
|
| | 592,936,769 | | | 5,814,989,765 | | | 2,782,367,702 | | | 1,145,646,704 | | | 1,725,875,223 |
| | 638 | | | 272 | | | 592 | | | 167 | | | 762 |
| | 5,821,803 | | | 157,669,469 | | | 9,393,455 | | | 4,099,608 | | | 4,773,425 |
| | 4,298 | | | - | | | - | | | - | | | - |
| | - | | | - | | | - | | | - | | | - |
| | 4,009,554 | | | 5,335,623 | | | 18,973,661 | | | 3,439,113 | | | 2,262,166 |
| | 2,097,294 | | | 2,432,051 | | | 1,257,420 | | | 279,975 | | | 599,685 |
|
| |
|
| |
|
| |
|
| |
|
|
| | 604,870,356 | | | 5,980,427,180 | | | 2,811,992,830 | | | 1,153,465,567 | | | 1,733,511,261 |
| | | | |
| | | | | | | | | | | | | | |
| | 2,775,114 | | | 73,829,045 | | | 38,036,954 | | | 49,600,939 | | | 11,501,501 |
| | - | | | - | | | - | | | - | | | - |
| | - | | | - | | | - | | | - | | | - |
| | 591,710 | | | 49,173,680 | | | 2,009,755 | | | 312,409 | | | 490,318 |
| | 254,429 | | | 2,040,651 | | | 788,342 | | | 300,801 | | | 646,747 |
| | 35,138 | | | - | | | - | | | - | | | - |
|
| |
|
| |
|
| |
|
| |
|
|
| | 3,656,391 | | | 125,043,376 | | | 40,835,051 | | | 50,214,149 | | | 12,638,566 |
|
| |
|
| |
|
| |
|
| |
|
|
| $ | 601,213,965 | | $ | 5,855,383,804 | | $ | 2,771,157,779 | | $ | 1,103,251,418 | | $ | 1,720,872,695 |
|
| |
|
| |
|
| |
|
| |
|
|
| | | | | | | | | | | | | | |
| $ | 512,220,333 | | $ | 4,497,540,829 | | $ | 2,458,945,149 | | $ | 975,056,820 | | $ | 1,200,020,118 |
| | 72,050,937 | | | 1,215,905,038 | | | 205,169,133 | | | 101,894,344 | | | 337,954,463 |
| | 7,171,341 | | | - | | | - | | | - | | | - |
| | 9,771,354 | | | 141,937,937 | | | 107,043,497 | | | 26,300,254 | | | 182,898,114 |
|
| |
|
| |
|
| |
|
| |
|
|
| $ | 601,213,965 | | $ | 5,855,383,804 | | $ | 2,771,157,779 | | $ | 1,103,251,418 | | $ | 1,720,872,695 |
|
| |
|
| |
|
| |
|
| |
|
|
| | | | | | | | | | | | | | |
| | | | | | | | | | | | | | |
| $ | 601,213,965 | | $ | 4,874,043,978 | | $ | 2,771,157,779 | | $ | 1,103,251,418 | | $ | 1,720,872,695 |
| | | | $ | 981,339,826 | | | | | | | | | |
| | | | | | | | | | | | | | |
| | 26,859,080 | | | 158,025,500 | | | 141,368,553 | | | 61,455,616 | | | 88,188,005 |
| | | | | 31,439,286 | | | | | | | | | |
| | | | | | | | | | | | | | |
| $ | 22.38 | | $ | 30.84 | | $ | 19.60 | | $ | 17.95 | | $ | 19.51 |
| | | | $ | 31.21 | | | | | | | | | |
| $ | 501,211,318 | | $ | 4,599,084,727 | | $ | 2,446,892,262 | | $ | 1,033,180,114 | | $ | 1,099,556,172 |
| $ | 19,618,627 | | $ | - | | $ | 130,306,307 | | $ | 10,572,246 | | $ | 288,364,588 |
| $ | - | | $ | - | | $ | - | | $ | - | | $ | - |
The accompanying notes are an integral part of the financial statements.
51
FIFTY-ONE
ARTISAN FUNDS, INC.
Statements of Operations – For the Year Ended September 30, 2005
| | | | | | | | |
| | | INTERNATIONAL
| | | INTERNATIONAL SMALL CAP
| |
| INVESTMENT INCOME: | | | | | | | | |
Interest | | $ | 3,536,574 | | | $ | 347,141 | |
Dividends, from unaffiliated issuers(1) | | | 222,249,002 | | | | 15,972,864 | |
Dividends, from affiliated issuers(1) | | | 2,763,078 | | | | 72,223 | |
Securities lending | | | 3,908,478 | | | | - | |
| | |
|
|
| |
|
|
|
Total investment income | | | 232,457,132 | | | | 16,392,228 | |
| | |
| EXPENSES: | | | | | | | | |
Advisory fees | | | 101,816,286 | | | | 7,991,210 | |
Transfer agent fees | | | | | | | | |
Investor Shares | | | 12,909,726 | | | | 1,012,803 | |
Institutional Shares | | | 26,416 | | | | | |
Shareholder communications | | | | | | | | |
Investor Shares | | | 1,230,606 | | | | 86,416 | |
Institutional Shares | | | 24,813 | | | | | |
Custodian fees | | | 6,094,807 | | | | 504,426 | |
Accounting fees | | | 74,144 | | | | 54,806 | |
Professional fees | | | (60,021 | ) | | | 56,971 | |
Registration fees | | | | | | | | |
Investor Shares | | | 48,714 | | | | 49,673 | |
Institutional Shares | | | 22,470 | | | | | |
Directors’ fees | | | 302,229 | | | | 17,327 | |
Other operating expenses | | | 276,447 | | | | 19,775 | |
| | |
|
|
| |
|
|
|
Total operating expenses | | | 122,766,637 | | | | 9,793,407 | |
| | |
|
|
| |
|
|
|
Net investment income (loss) | | | 109,690,495 | | | | 6,598,821 | |
| | |
NET REALIZED AND UNREALIZED GAINS (LOSSES) ON
INVESTMENTS: | | | | | | | | |
Net realized gain (loss) on: | | | | | | | | |
Investments(1) | | | 951,444,475 | | | | 74,774,575 | |
Foreign currency related transactions | | | (4,798,062 | ) | | | (70,491 | ) |
| | |
|
|
| |
|
|
|
| | | | 946,646,413 | | | | 74,704,084 | |
Net increase (decrease) in unrealized appreciation or depreciation on: | | | | | | | | |
Investments | | | 1,532,135,303 | | | | 137,805,025 | |
Foreign currency related transactions | | | (380,101 | ) | | | (135,597 | ) |
| | |
|
|
| |
|
|
|
| | | | 1,531,755,202 | | | | 137,669,428 | |
| | |
|
|
| |
|
|
|
Net gain (loss) on investments and foreign currency related transactions | | | 2,478,401,615 | | | | 212,373,512 | |
| | |
|
|
| |
|
|
|
Net increase (decrease) in net assets resulting from operations | | $ | 2,588,092,110 | | | $ | 218,972,333 | |
| | |
|
|
| |
|
|
|
| | | | | | | |
(1) Fund
| | Net of foreign taxes
withheld on dividends,
unaffiliated issuers
| | Net of foreign taxes
withheld on dividends,
affiliated issuers
| | Including net realized
gain (loss) on investments
from affiliated issuers
| |
International | | $24,198,830 | | $91,359 | | $(8,424,242 | ) |
International Small Cap | | 1,123,861 | | 14,272 | | 1,705,550 | |
International Value | | 674,450 | | 84,032 | | 1,104,013 | |
Mid Cap | | 31,284 | | - | | - | |
Mid Cap Value | | 4,671 | | - | | - | |
Small Cap | | - | | - | | 23,812 | |
Small Cap Value | | 18,743 | | - | | (5,097,134 | ) |
52
FIFTY-TWO
| | | | | | | | | | | | | | | | | | |
INTERNATIONAL VALUE
| | | MID CAP
| | | MID CAP VALUE
| | | SMALL CAP
| | | SMALL CAP VALUE
| |
| | | | | | | | | | | | | | | | | | | |
| $ | 723,971 | | | $ | 3,812,015 | | | $ | 2,864,001 | | | $ | 740,954 | | | $ | 2,394,289 | |
| | 12,494,453 | | | | 28,252,322 | | | | 11,856,403 | | | | 1,549,964 | | | | 9,298,462 | |
| | 653,602 | | | | - | | | | 1,044,915 | | | | - | | | | 3,166,849 | |
| | - | | | | - | | | | - | | | | - | | | | - | |
|
|
| |
|
|
| |
|
|
| |
|
|
| |
|
|
|
| | 13,872,026 | | | | 32,064,337 | | | | 15,765,319 | | | | 2,290,918 | | | | 14,859,600 | |
| | | | |
| | | | | | | | | | | | | | | | | | | |
| | 5,230,212 | | | | 54,278,551 | | | | 12,764,162 | | | | 5,976,034 | | | | 14,071,941 | |
| | | | | | | | | | | | | | | | | | | |
| | 1,015,947 | | | | 9,832,140 | | | | 2,626,657 | | | | 684,662 | | | | 2,582,445 | |
| | | | | | 22,715 | | | | | | | | | | | | | |
| | | | | | | | | | | | | | | | | | | |
| | 112,286 | | | | 1,021,259 | | | | 308,189 | | | | 110,907 | | | | 151,448 | |
| | | | | | 11,478 | | | | | | | | | | | | | |
| | 303,329 | | | | 286,604 | | | | 77,178 | | | | 78,777 | | | | 82,405 | |
| | 54,190 | | | | 65,944 | | | | 42,286 | | | | 46,718 | | | | 47,578 | |
| | 50,110 | | | | 176,267 | | | | 48,918 | | | | 38,974 | | | | 72,968 | |
| | | | | | | | | | | | | | | | | | | |
| | 82,680 | | | | 57,506 | | | | 318,694 | | | | 119,584 | | | | 84,358 | |
| | | | | | 15,460 | | | | | | | | | | | | | |
| | 13,826 | | | | 160,463 | | | | 31,298 | | | | 14,560 | | | | 40,298 | |
| | 15,048 | | | | 152,894 | | | | 21,537 | | | | 14,230 | | | | 39,504 | |
|
|
| |
|
|
| |
|
|
| |
|
|
| |
|
|
|
| | 6,877,628 | | | | 66,081,281 | | | | 16,238,919 | | | | 7,084,446 | | | | 17,172,945 | |
|
|
| |
|
|
| |
|
|
| |
|
|
| |
|
|
|
| | 6,994,398 | | | | (34,016,944 | ) | | | (473,600 | ) | | | (4,793,528 | ) | | | (2,313,345 | ) |
| | | | |
| | | | | | | | | | | | | | | | | | | |
| | | | | | | | | | | | | | | | | | | |
| | 14,858,879 | | | | 344,210,655 | | | | 111,731,536 | | | | 35,289,542 | | | | 214,241,152 | |
| | (8,583 | ) | | | - | | | | - | | | | - | | | | - | |
|
|
| |
|
|
| |
|
|
| |
|
|
| |
|
|
|
| | 14,850,296 | | | | 344,210,655 | | | | 111,731,536 | | | | 35,289,542 | | | | 214,241,152 | |
| | | | | | | | | | | | | | | | | | | |
| | 55,053,627 | | | | 617,698,766 | | | | 173,545,831 | | | | 78,443,136 | | | | 80,790,643 | |
| | (70,493 | ) | | | - | | | | - | | | | - | | | | - | |
|
|
| |
|
|
| |
|
|
| |
|
|
| |
|
|
|
| | 54,983,134 | | | | 617,698,766 | | | | 173,545,831 | | | | 78,443,136 | | | | 80,790,643 | |
|
|
| |
|
|
| |
|
|
| |
|
|
| |
|
|
|
| | 69,833,430 | | | | 961,909,421 | | | | 285,277,367 | | | | 113,732,678 | | | | 295,031,795 | |
|
|
| |
|
|
| |
|
|
| |
|
|
| |
|
|
|
| $ | 76,827,828 | | | $ | 927,892,477 | | | $ | 284,803,767 | | | $ | 108,939,150 | | | $ | 292,718,450 | |
|
|
| |
|
|
| |
|
|
| |
|
|
| |
|
|
|
The accompanying notes are an integral part of the financial statements.
53
FIFTY-THREE
ARTISAN FUNDS, INC.
Statements of Changes in Net Assets
| | | | | | | | |
| | | INTERNATIONAL
| |
| | | Year Ended
9/30/05
| | | Year Ended
9/30/04
| |
| OPERATIONS: | | | | | | | | |
Net investment income (loss) | | $ | 109,690,495 | | | $ | 70,075,203 | |
Net realized gain (loss) on: | | | | | | | | |
Investments | | | 951,444,475 | | | | (91,940,847 | ) |
Foreign currency related transactions | | | (4,798,062 | ) | | | (5,531,519 | ) |
Net increase (decrease) in unrealized appreciation or depreciation on: | | | | | | | | |
Investments | | | 1,532,135,303 | | | | 1,580,915,556 | |
Foreign currency related transactions | | | (380,101 | ) | | | (820,070 | ) |
| | |
|
|
| |
|
|
|
Net increase (decrease) in net assets resulting from operations | | | 2,588,092,110 | | | | 1,552,698,323 | |
| | |
| DISTRIBUTIONS PAID TO SHAREHOLDERS: | | | | | | | | |
Net investment income: | | | | | | | | |
Investor Shares | | | (39,392,658 | ) | | | (59,414,982 | ) |
Institutional Shares | | | (29,943,284 | ) | | | (42,472,917 | ) |
Net realized gains on investment transactions: | | | | | | | | |
Investor Shares | | | - | | | | - | |
Institutional Shares | | | - | | | | - | |
| | |
|
|
| |
|
|
|
Total distributions paid to shareholders | | | (69,335,942 | ) | | | (101,887,899 | ) |
| | |
| FUND SHARE ACTIVITIES: | | | | | | | | |
Net increase (decrease) in net assets
resulting from fund share activities | | | (596,036,624 | ) | | | (597,923,467 | ) |
| | |
|
|
| |
|
|
|
Total increase (decrease) in net assets | | | 1,922,719,544 | | | | 852,886,957 | |
| | |
|
|
| |
|
|
|
Net assets, beginning of period | | | 9,752,280,023 | | | | 8,899,393,066 | |
| | |
|
|
| |
|
|
|
Net assets, end of period | | $ | 11,674,999,567 | | | $ | 9,752,280,023 | |
| | |
|
|
| |
|
|
|
| | | | | | | | | |
Accumulated undistributed net investment income (loss) | | $ | 104,696,688 | | | $ | 64,567,549 | |
| | |
|
|
| |
|
|
|
54
FIFTY-FOUR
| | | | | | | | | | | | | | |
INTERNATIONAL SMALL CAP
| | | INTERNATIONAL VALUE
| |
Year Ended
9/30/05
| | | Year Ended
9/30/04
| | | Year Ended
9/30/05
| | | Year Ended
9/30/04
| |
| | | | | | | | | | | | | | | |
| $ | 6,598,821 | | | $ | 4,997,343 | | | $ | 6,994,398 | | | $ | 1,668,336 | |
| | | | | | | | | | | | | | | |
| | 74,774,575 | | | | 67,154,595 | | | | 14,858,879 | | | | 3,496,007 | |
| | (70,491 | ) | | | (346,102 | ) | | | (8,583 | ) | | | (47,257 | ) |
| | | | | | | | | | | | | | | |
| | 137,805,025 | | | | 25,704,988 | | | | 55,053,627 | | | | 13,353,539 | |
| | (135,597 | ) | | | (7,379 | ) | | | (70,493 | ) | | | 12,754 | |
|
|
| |
|
|
| |
|
|
| |
|
|
|
| | 218,972,333 | | | | 97,503,445 | | | | 76,827,828 | | | | 18,483,379 | |
| | | |
| | | | | | | | | | | | | | | |
| | | | | | | | | | | | | | | |
| | (3,652,844 | ) | | | (1,142,162 | ) | | | (1,728,097 | ) | | | (191,806 | ) |
| | | | | | | | | | | | | | | |
| | | | | | | | | | | | | | | |
| | (55,013,278 | ) | | | (15,685,346 | ) | | | (3,316,422 | ) | | | (636,769 | ) |
| | | | | | | | | | | | | | | |
|
|
| |
|
|
| |
|
|
| |
|
|
|
| | (58,666,122 | ) | | | (16,827,508 | ) | | | (5,044,519 | ) | | | (828,575 | ) |
| | | |
| | | | | | | | | | | | | | | |
| | 105,834,632 | | | | 43,008,188 | | | | 311,932,123 | | | | 176,229,783 | |
|
|
| |
|
|
| |
|
|
| |
|
|
|
| | 266,140,843 | | | | 123,684,125 | | | | 383,715,432 | | | | 193,884,587 | |
|
|
| |
|
|
| |
|
|
| |
|
|
|
| | 515,008,668 | | | | 391,324,543 | | | | 217,498,533 | | | | 23,613,946 | |
|
|
| |
|
|
| |
|
|
| |
|
|
|
| $ | 781,149,511 | | | $ | 515,008,668 | | | $ | 601,213,965 | | | $ | 217,498,533 | |
|
|
| |
|
|
| |
|
|
| |
|
|
|
| | | | | | | | | | | | | | | |
| $ | 6,054,994 | | | $ | 3,383,684 | | | $ | 7,171,341 | | | $ | 1,398,660 | |
|
|
| |
|
|
| |
|
|
| |
|
|
|
The accompanying notes are an integral part of the financial statements.
55
FIFTY-FIVE
ARTISAN FUNDS, INC.
Statements of Changes in Net Assets (Continued)
| | | | | | | | |
| | | MID CAP
| |
| | | Year Ended
9/30/05
| | | Year Ended
9/30/04
| |
| OPERATIONS: | | | | | | | | |
Net investment income (loss) | | $ | (34,016,944 | ) | | $ | (33,613,109 | ) |
Net realized gain (loss) on: | | | | | | | | |
Investments | | | 344,210,655 | | | | 330,560,106 | |
Foreign currency related transactions | | | - | | | | - | |
Net increase (decrease) in unrealized appreciation or depreciation on: | | | | | | | | |
Investments | | | 617,698,766 | | | | 172,866,182 | |
Foreign currency related transactions | | | - | | | | - | |
| | |
|
|
| |
|
|
|
Net increase (decrease) in net assets resulting from operations | | | 927,892,477 | | | | 469,813,179 | |
| | |
| DISTRIBUTIONS PAID TO SHAREHOLDERS: | | | | | | | | |
Net investment income: | | | | | | | | |
Investor Shares | | | - | | | | - | |
Institutional Shares | | | - | | | | - | |
Net realized gains on investment transactions: | | | | | | | | |
Investor Shares | | | - | | | | - | |
Institutional Shares | | | - | | | | - | |
| | |
|
|
| |
|
|
|
Total distributions paid to shareholders | | | - | | | | - | |
| | |
| FUND SHARE ACTIVITIES: | | | | | | | | |
Net increase (decrease) in net assets
resulting from fund share activities | | | (151,207,182 | ) | | | 1,096,126,727 | |
| | |
|
|
| |
|
|
|
Total increase (decrease) in net assets | | | 776,685,295 | | | | 1,565,939,906 | |
| | |
|
|
| |
|
|
|
Net assets, beginning of year | | | 5,078,698,509 | | | | 3,512,758,603 | |
| | |
|
|
| |
|
|
|
Net assets, end of year | | $ | 5,855,383,804 | | | $ | 5,078,698,509 | |
| | |
|
|
| |
|
|
|
| | | | | | | | | |
Accumulated undistributed net investment income (loss) | | $ | - | | | $ | - | |
| | |
|
|
| |
|
|
|
56
FIFTY-SIX
| | | | | | | | | | | | | | | | | | | | | | |
MID CAP VALUE
| | | SMALL CAP
| | | SMALL CAP VALUE
| |
Year Ended
9/30/05
| | | Year Ended
9/30/04
| | | Year Ended
9/30/05
| | | Year Ended
9/30/04
| | | Year Ended
9/30/05
| | | Year Ended
9/30/04
| |
| | | | | | | | | | | | | | | | | | | | | | | |
| $ | (473,600 | ) | | $ | 1,036,610 | | | $ | (4,793,528 | ) | | $ | (1,586,397 | ) | | $ | (2,313,345 | ) | | $ | (1,766,947 | ) |
| | | | | | | | | | | | | | | | | | | | | | | |
| | 111,731,536 | | | | 10,522,572 | | | | 35,289,542 | | | | 27,262,462 | | | | 214,241,152 | | | | 126,320,385 | |
| | - | | | | - | | | | - | | | | - | | | | - | | | | - | |
| | | | | | | | | | | | | | | | | | | | | | | |
| | 173,545,831 | | | | 22,190,097 | | | | 78,443,136 | | | | 1,847,755 | | | | 80,790,643 | | | | 127,503,467 | |
| | - | | | | - | | | | - | | | | - | | | | - | | | | - | |
|
|
| |
|
|
| |
|
|
| |
|
|
| |
|
|
| |
|
|
|
| | 284,803,767 | | | | 33,749,279 | | | | 108,939,150 | | | | 27,523,820 | | | | 292,718,450 | | | | 252,056,905 | |
| | | | | |
| | | | | | | | | | | | | | | | | | | | | | | |
| | | | | | | | | | | | | | | | | | | | | | | |
| | (121,029 | ) | | | - | | | | - | | | | - | | | | - | | | | - | |
| | | | | | | | | | | | | | | | | | | | | | | |
| | | | | | | | | | | | | | | | | | | | | | | |
| | (9,206,872 | ) | | | (1,599,811 | ) | | | (10,649,591 | ) | | | - | | | | (123,856,296 | ) | | | (11,783,598 | ) |
| | | | | | | | | | | | | | | | | | | | | | | |
|
|
| |
|
|
| |
|
|
| |
|
|
| |
|
|
| |
|
|
|
| | (9,327,901 | ) | | | (1,599,811 | ) | | | (10,649,591 | ) | | | - | | | | (123,856,296 | ) | | | (11,783,598 | ) |
| | | | | |
| | | | | | | | | | | | | | | | | | | | | | | |
| | 2,183,402,227 | | | | 202,730,099 | | | | 765,395,821 | | | | 84,168,692 | | | | 359,260,393 | | | | 177,321,270 | |
|
|
| |
|
|
| |
|
|
| |
|
|
| |
|
|
| |
|
|
|
| | 2,458,878,093 | | | | 234,879,567 | | | | 863,685,380 | | | | 111,692,512 | | | | 528,122,547 | | | | 417,594,577 | |
|
|
| |
|
|
| |
|
|
| |
|
|
| |
|
|
| |
|
|
|
| | 312,279,686 | | | | 77,400,119 | | | | 239,566,038 | | | | 127,873,526 | | | | 1,192,750,148 | | | | 775,155,571 | |
|
|
| |
|
|
| |
|
|
| |
|
|
| |
|
|
| |
|
|
|
| $ | 2,771,157,779 | | | $ | 312,279,686 | | | $ | 1,103,251,418 | | | $ | 239,566,038 | | | $ | 1,720,872,695 | | | $ | 1,192,750,148 | |
|
|
| |
|
|
| |
|
|
| |
|
|
| |
|
|
| |
|
|
|
| | | | | | | | | | | | | | | | | | | | | | | |
| $ | - | | | $ | 1,037,046 | | | $ | - | | | $ | - | | | $ | - | | | $ | - | |
|
|
| |
|
|
| |
|
|
| |
|
|
| |
|
|
| |
|
|
|
The accompanying notes are an integral part of the financial statements.
57
FIFTY-SEVEN
ARTISAN FUNDS, INC.
Financial Highlights – For a share outstanding throughout each period
The financial highlights table is intended to help you understand the Funds’ financial performance for the past 5 years or, if shorter, the period of a Fund’s operations. Certain information reflects financial results for a single Fund share. The total returns in the table represent the rate that an investor would have earned or lost on an investment in the Fund (assuming reinvestment of all dividends and distributions). This information has been audited by Ernst & Young, whose report, along with each Fund’s financial statements, are included in this annual report. The financial highlights of the Funds for the periods ended prior to September 30, 2003 were audited by other auditors.
| | | | | | | | | | | | | | | | | | | | | | | | |
Year or
Period
Ended | | | Net Asset
Value
Beginning
of Period | | Net
Investment
Income
(Loss)(1) | | |
Net Realized
and Unrealized
Gain (Loss) on
Investments | | | Total Income
(Loss) from
Investment
Operations | | | Dividends
from Net
Investment
Income | | | Distributions
from Net
Realized
Gains | |
| | | | | | | | | | | | | | | | | | | | | | | | | |
| ARTISAN INTERNATIONAL FUND | |
| Investor Shares | | | | | | | | | | | | | | | | | | | | | | | | |
| 9/30/2005 | | | $ | 19.33 | | $ | 0.21 | | | $ | 4.98 | | | $ | 5.19 | | | $ | (0.12 | ) | | $ | - | |
| 9/30/2004 | | | | 16.54 | | | 0.12 | | | | 2.85 | | | | 2.97 | | | | (0.18 | ) | | | - | |
| 9/30/2003 | (4) | | | 15.63 | | | 0.02 | | | | 0.89 | | | | 0.91 | | | | - | | | | - | |
| 6/30/2003 | | | | 18.15 | | | 0.20 | | | | (2.62 | ) | | | (2.42 | ) | | | (0.10 | ) | | | - | |
| 6/30/2002 | | | | 19.53 | | | 0.15 | | | | (1.46 | ) | | | (1.31 | ) | | | (0.07 | ) | | | - | |
| 6/30/2001 | | | | 30.16 | | | 0.10 | | | | (7.18 | ) | | | (7.08 | ) | | | - | | | | (3.55 | ) |
| Institutional Shares | | | | | | | | | | | | | | | | | | | | | | | | |
| 9/30/2005 | | | $ | 19.44 | | $ | 0.25 | | | $ | 5.01 | | | $ | 5.26 | | | $ | (0.16 | ) | | $ | - | |
| 9/30/2004 | | | | 16.63 | | | 0.16 | | | | 2.86 | | | | 3.02 | | | | (0.21 | ) | | | - | |
| 9/30/2003 | (4) | | | 15.71 | | | 0.03 | | | | 0.89 | | | | 0.92 | | | | - | | | | - | |
| 6/30/2003 | | | | 18.24 | | | 0.25 | | | | (2.65 | ) | | | (2.40 | ) | | | (0.13 | ) | | | - | |
| 6/30/2002 | | | | 19.62 | | | 0.18 | | | | (1.46 | ) | | | (1.28 | ) | | | (0.10 | ) | | | - | |
| 6/30/2001 | | | | 30.22 | | | 0.16 | | | | (7.21 | ) | | | (7.05 | ) | | | - | | | | (3.55 | ) |
| | | | | | | | | | | | | | | | | | | | | | | | | |
| ARTISAN INTERNATIONAL SMALL CAP FUND | |
| Investor Shares | | | | | | | | | | | | | | | | | | | | | | | | |
| 9/30/2005 | | | $ | 16.40 | | $ | 0.19 | | | $ | 6.16 | | | $ | 6.35 | | | $ | (0.12 | ) | | $ | (1.77 | ) |
| 9/30/2004 | | | | 13.84 | | | 0.15 | | | | 2.93 | | | | 3.08 | | | | (0.03 | ) | | | (0.49 | ) |
| 9/30/2003 | (4) | | | 12.10 | | | - | (6) | | | 1.74 | | | | 1.74 | | | | - | | | | - | |
| 6/30/2003 | | | | 10.50 | | | 0.03 | | | | 1.59 | | | | 1.62 | | | | - | | | | (0.02 | ) |
| 6/30/2002 | (7) | | | 10.00 | | | - | (6) | | | 0.50 | (8) | | | 0.50 | | | | - | | | | - | |
| | | | | | | | | | | | | | | | | | | | | | | | | |
| ARTISAN INTERNATIONAL VALUE FUND | |
| Investor Shares | | | | | | | | | | | | | | | | | | | | | | | | |
| 9/30/2005 | | | $ | 18.54 | | $ | 0.28 | | | $ | 3.88 | | | $ | 4.16 | | | $ | (0.11 | ) | | $ | (0.21 | ) |
| 9/30/2004 | | | | 14.32 | | | 0.28 | | | | 4.33 | | | | 4.61 | | | | (0.09 | ) | | | (0.30 | ) |
| 9/30/2003 | (4) | | | 13.01 | | | 0.02 | | | | 1.29 | | | | 1.31 | | | | - | | | | - | |
| 6/30/2003 | (9) | | | 10.00 | | | 0.09 | | | | 2.92 | | | | 3.01 | | | | - | | | | - | |
| (1) | Computed based on average shares outstanding. |
| (2) | Periods less than twelve months (where applicable) are not annualized. |
| (3) | Periods less than twelve months (where applicable) are annualized. |
| (4) | For the period from July 1, 2003 to September 30, 2003. Artisan Funds changed its fiscal year-end from June 30 to September 30 effective September 30, 2003. |
| (5) | The ratios of expenses to average net assets and net investment income (loss) to average net assets exclude expenses waived or paid by the Adviser. Absent expenses waived or paid by the Adviser, the ratios of expenses to average net assets and net investment income (loss) to average net assets would have been as follows: |
| | | | | | | | |
| Fund | | Period Ended | | Ratio of Expenses to
Average Net Assets | | | Ratio of Net Investment Income
(Loss) to Average Net Assets | |
International Investor Shares | | 9/30/2003 | | 1.23 | % | | 0.49 | % |
International Institutional Shares | | 9/30/2003 | | 1.00 | | | 0.73 | |
58
FIFTY-EIGHT
| | | | | | | | | | | | | | | | | | | | |
Total
Distributions | | | Net Asset
Value
End
of Period | | Total
Return(2) | | | Net Assets
End of
Period
(millions) | | Ratio of
Expenses
to Average
Net Assets(3) | | | Ratio of Net
Investment
Income (Loss)
to Average
Net Assets(3) | | | Portfolio
Turnover
Rate(2) | |
| | | | | | | | | | | | | | | | | | | | | |
| | | | | | | | | | | | | | | | | | | | | |
| | | | | | | | | | | | | | | | | | | | | |
| $ | (0.12 | ) | | $ | 24.40 | | 26.97 | % | | $ | 7,686.9 | | 1.19 | % | | 0.94 | % | | 56.15 | % |
| | (0.18 | ) | | | 19.33 | | 18.04 | | | | 6,130.2 | | 1.22 | | | 0.64 | | | 54.96 | |
| | - | | | | 16.54 | | 5.82 | | | | 5,544.7 | | 1.23 | (5) | | 0.49 | (5) | | 15.23 | |
| | (0.10 | ) | | | 15.63 | | (13.30 | ) | | | 5,182.8 | | 1.20 | | | 1.35 | | | 37.13 | |
| | (0.07 | ) | | | 18.15 | | (6.73 | ) | | | 5,289.6 | | 1.21 | | | 0.82 | | | 50.67 | |
| | (3.55 | ) | | | 19.53 | | (24.65 | ) | | | 3,907.1 | | 1.22 | | | 0.45 | | | 72.01 | |
| | | | | | | | | | | | | | | | | | | | | |
| $ | (0.16 | ) | | $ | 24.54 | | 27.21 | % | | $ | 3,988.1 | | 0.99 | % | | 1.11 | % | | 56.15 | % |
| | (0.21 | ) | | | 19.44 | | 18.31 | | | | 3,622.1 | | 1.01 | | | 0.85 | | | 54.96 | |
| | - | | | | 16.63 | | 5.86 | | | | 3,354.7 | | 1.00 | (5) | | 0.73 | (5) | | 15.23 | |
| | (0.13 | ) | | | 15.71 | | (13.09 | ) | | | 2,975.0 | | 1.01 | | | 1.68 | | | 37.13 | |
| | (0.10 | ) | | | 18.24 | | (6.52 | ) | | | 2,062.0 | | 1.01 | | | 1.01 | | | 50.67 | |
| | (3.55 | ) | | | 19.62 | | (24.53 | ) | | | 1,486.6 | | 1.03 | | | 0.70 | | | 72.01 | |
| | | | | | | | | | | | | | | | | | | | | |
| | | | | | | | | | | | | | | | | | | | | |
| | | | | | | | | | | | | | | | | | | | | |
| $ | (1.89 | ) | | $ | 20.86 | | 42.13 | % | | $ | 781.1 | | 1.53 | % | | 1.03 | % | | 57.25 | % |
| | (0.52 | ) | | | 16.40 | | 22.66 | | | | 515.0 | | 1.57 | | | 0.95 | | | 81.03 | |
| | - | | | | 13.84 | | 14.46 | | | | 391.3 | | 1.68 | (5) | | 0.06 | (5) | | 13.28 | |
| | (0.02 | ) | | | 12.10 | | 15.53 | | | | 238.6 | | 1.77 | | | 0.28 | | | 62.79 | |
| | - | | | | 10.50 | | 5.00 | | | | 74.5 | | 2.39 | | | (0.02 | ) | | 25.14 | |
| | | | | | | | | | | | | | | | | | | | | |
| | | | | | | | | | | | | | | | | | | | | |
| | | | | | | | | | | | | | | | | | | | | |
| $ | (0.32 | ) | | $ | 22.38 | | 22.71 | % | | $ | 601.2 | | 1.31 | % | | 1.33 | % | | 53.15 | % |
| | (0.39 | ) | | | 18.54 | | 32.81 | | | | 217.5 | | 1.56 | | | 1.61 | | | 14.66 | |
| | - | | | | 14.32 | | 10.07 | | | | 23.6 | | 2.00 | (5) | | 0.46 | (5) | | 9.30 | |
| | - | | | | 13.01 | | 30.10 | | | | 16.3 | | 2.45 | (5) | | 1.14 | (5) | | 17.42 | |
| | | | | | | | |
| Fund | | Period Ended | | Ratio of Expenses to
Average Net Assets | | | Ratio of Net Investment Income
(Loss) to Average Net Assets | |
International Small Cap Investor Shares | | 9/30/2003 | | 1.69 | % | | 0.05 | % |
International Value Investor Shares | | 9/30/2003 | | 2.80 | | | (0.34 | ) |
| | | 6/30/2003 | | 5.02 | | | (1.43 | ) |
| | (6) | Amount is between $0.005 and $(0.005) per share. |
| | (7) | For the period from commencement of operations (December 21, 2001) through June 30, 2002. |
| | (8) | The amount shown may not correlate with the aggregate gains and losses of portfolio securities due to the timing of subscriptions and redemptions of fund shares. |
| | (9) | For the period from commencement of operations (September 23, 2002) through June 30, 2003. |
The accompanying notes are an integral part of the financial statements.
59
FIFTY-NINE
ARTISAN FUNDS, INC.
Financial Highlights – For a share outstanding throughout each period (Continued)
| | | | | | | | | | | | | | | | | | | | | | | | |
Year or
Period
Ended | | | Net Asset
Value
Beginning
of Period | | Net
Investment
Income
(Loss)(1) | | | Net Realized
and Unrealized
Gain (Loss) on
Investments | | | Total Income
(Loss) from
Investment
Operations | | | Dividends
from Net
Investment
Income | | | Distributions
from Net
Realized Gains | |
| | | | | | | | | | | | | | | | | | | | | | | | | |
| ARTISAN MID CAP FUND | | | | | | | | | | | | | | | | | | | | |
| Investor Shares | | | | | | | | | | | | | | | | | | | | | | | | |
| 9/30/2005 | | | $ | 26.13 | | $ | (0.18 | ) | | $ | 4.89 | | | $ | 4.71 | | | $ | - | | | $ | - | |
| 9/30/2004 | | | | 23.11 | | | (0.20 | ) | | | 3.22 | | | | 3.02 | | | | - | | | | - | |
| 9/30/2003 | (4) | | | 21.81 | | | (0.05 | ) | | | 1.35 | | | | 1.30 | | | | - | | | | - | |
| 6/30/2003 | | | | 22.13 | | | (0.11 | ) | | | (0.21 | )(6) | | | (0.32 | ) | | | - | | | | - | |
| 6/30/2002 | | | | 26.43 | | | (0.19 | ) | | | (4.11 | ) | | | (4.30 | ) | | | - | | | | - | |
| 6/30/2001 | | | | 27.57 | | | (0.13 | ) | | | 0.02 | (6) | | | (0.11 | ) | | | - | | | | (1.03 | ) |
| Institutional Shares | | | | | | | | | | | | | | | | | | | | | | | | |
| 9/30/2005 | | | $ | 26.38 | | $ | (0.12 | ) | | $ | 4.95 | | | $ | 4.83 | | | $ | - | | | $ | - | |
| 9/30/2004 | | | | 23.28 | | | (0.14 | ) | | | 3.24 | | | | 3.10 | | | | - | | | | - | |
| 9/30/2003 | (4) | | | 21.96 | | | (0.03 | ) | | | 1.35 | | | | 1.32 | | | | - | | | | - | |
| 6/30/2003 | | | | 22.24 | | | (0.07 | ) | | | (0.21 | )(6) | | | (0.28 | ) | | | - | | | | - | |
| 6/30/2002 | | | | 26.48 | | | (0.13 | ) | | | (4.11 | ) | | | (4.24 | ) | | | - | | | | - | |
| 6/30/2001 | | | | 27.57 | | | (0.08 | ) | | | 0.02 | (6) | | | (0.06 | ) | | | - | | | | (1.03 | ) |
| | | | | | | | | | | | | | | | | | | | | | | | | |
| ARTISAN MID CAP VALUE FUND | | | | | | | | | | | | | | | | | | | | |
| Investor Shares | | | | | | | | | | | | | | | | | | | | | | | | |
| 9/30/2005 | | | $ | 15.55 | | $ | (0.01 | ) | | $ | 4.36 | | | $ | 4.35 | | | $ | - | (7) | | $ | (0.30 | ) |
| 9/30/2004 | | | | 12.22 | | | 0.10 | | | | 3.47 | | | | 3.57 | | | | - | | | | (0.24 | ) |
| 9/30/2003 | (4) | | | 11.64 | | | (0.01 | ) | | | 0.59 | | | | 0.58 | | | | - | | | | - | |
| 6/30/2003 | | | | 10.82 | | | (0.03 | ) | | | 0.85 | | | | 0.82 | | | | - | | | | - | |
| 6/30/2002 | | | | 11.18 | | | (0.09 | ) | | | (0.19 | ) | | | (0.28 | ) | | | - | | | | (0.08 | ) |
| 6/30/2001 | (8) | | | 10.00 | | | (0.01 | ) | | | 1.19 | | | | 1.18 | | | | - | | | | - | |
| | | | | | | | | | | | | | | | | | | | | | | | | |
| ARTISAN SMALL CAP FUND | | | | | | | | | | | | | | | | | | | | |
| Investor Shares | | | | | | | | | | | | | | | | | | | | | | | | |
| 9/30/2005 | | | $ | 15.12 | | $ | (0.13 | ) | | $ | 3.49 | | | $ | 3.36 | | | $ | - | | | $ | (0.53 | ) |
| 9/30/2004 | | | | 12.53 | | | (0.14 | ) | | | 2.73 | | | | 2.59 | | | | - | | | | - | |
| 9/30/2003 | (4) | | | 11.90 | | | (0.04 | ) | | | 0.67 | | | | 0.63 | | | | - | | | | - | |
| 6/30/2003 | | | | 11.99 | | | (0.10 | ) | | | 0.07 | (6) | | | (0.03 | ) | | | - | | | | (0.06 | ) |
| 6/30/2002 | | | | 13.99 | | | (0.13 | ) | | | (1.81 | ) | | | (1.94 | ) | | | - | | | | (0.06 | ) |
| 6/30/2001 | | | | 14.69 | | | (0.09 | ) | | | 0.05 | (6) | | | (0.04 | ) | | | - | | | | (0.66 | ) |
| | | | | | | | | | | | | | | | | | | | | | | | | |
| ARTISAN SMALL CAP VALUE FUND | | | | | | | | | | | | | | | | | | | | |
| Investor Shares | | | | | | | | | | | | | | | | | | | | | | | | |
| 9/30/2005 | | | $ | 17.63 | | $ | (0.03 | ) | | $ | 3.69 | | | $ | 3.66 | | | $ | - | | | $ | (1.78 | ) |
| 9/30/2004 | | | | 13.67 | | | (0.03 | ) | | | 4.19 | | | | 4.16 | | | | - | | | | (0.20 | ) |
| 9/30/2003 | (4) | | | 13.15 | | | (0.01 | ) | | | 0.53 | | | | 0.52 | | | | - | | | | - | |
| 6/30/2003 | | | | 13.48 | | | (0.03 | ) | | | 0.20 | | | | 0.17 | | | | - | | | | (0.50 | ) |
| 6/30/2002 | | | | 13.05 | | | (0.01 | ) | | | 1.16 | | | | 1.15 | | | | (0.01 | ) | | | (0.71 | ) |
| 6/30/2001 | | | | 10.63 | | | 0.05 | | | | 2.91 | | | | 2.96 | | | | (0.05 | ) | | | (0.49 | ) |
| (1) | Computed based on average shares outstanding. |
| (2) | Periods less than twelve months (where applicable) are not annualized. |
| (3) | Periods less than twelve months (where applicable) are annualized. |
| (4) | For the period from July 1, 2003 to September 30, 2003. Artisan Funds changed its fiscal year-end from June 30 to September 30 effective September 30, 2003. |
| (5) | The ratios of expenses to average net assets and net investment income (loss) to average net assets exclude expenses waived or paid by the Adviser. Absent expenses waived or paid by the Adviser, the ratios of expenses to average net assets and net investment income (loss) to average net assets would have been as follows: |
| | | | | | | | |
| Fund | | Year or
Period Ended | | Ratio of Expenses to
Average Net Assets | | | Ratio of Net Investment Income
(Loss) to Average Net Assets | |
Mid Cap Investor Shares | | 9/30/2003 | | 1.20 | % | | (0.81 | )% |
Mid Cap Institutional Shares | | 9/30/2003 | | 0.98 | | | (0.59 | ) |
Mid Cap Value Investor Shares | | 9/30/2003 | | 1.63 | | | (0.35 | ) |
60
SIXTY
| | | | | | | | | | | | | | | | | | | | |
Total
Distributions | | | Net Asset
Value
End of
Period | | Total
Return(2) | | | Net Assets
End of
Period
(millions) | | Ratio of
Expenses
to Average
Net Assets(3) | | | Ratio of Net
Investment
Income (Loss)
to Average
Net Assets(3) | | | Portfolio
Turnover
Rate(2) | |
| | | | | | | | | | | | | | | | | | | | | |
| | | | | | | | | | | | | | | | | | | | | |
| | | | | | | | | | | | | | | | | | | | | |
| $ | - | | | $ | 30.84 | | 18.06 | % | | $ | 4,874.0 | | 1.18 | % | | (0.63 | )% | | 83.00 | % |
| | - | | | | 26.13 | | 13.02 | | | | 4,042.7 | | 1.19 | | | (0.77 | ) | | 101.09 | |
| | - | | | | 23.11 | | 6.01 | | | | 2,583.2 | | 1.20 | (5) | | (0.81 | )(5) | | 26.52 | |
| | - | | | | 21.81 | | (1.45 | ) | | | 2,286.6 | | 1.20 | | | (0.56 | ) | | 102.85 | |
| | - | | | | 22.13 | | (16.27 | ) | | | 1,855.5 | | 1.22 | | | (0.77 | ) | | 121.14 | |
| | (1.03 | ) | | | 26.43 | | (0.60 | ) | | | 1,333.6 | | 1.31 | | | (0.52 | ) | | 153.95 | |
| | | | | | | | | | | | | | | | | | | | | |
| $ | - | | | $ | 31.21 | | 18.35 | % | | $ | 981.3 | | 0.95 | % | | (0.40 | )% | | 83.00 | % |
| | - | | | | 26.38 | | 13.27 | | | | 1,036.0 | | 0.96 | | | (0.54 | ) | | 101.09 | |
| | - | | | | 23.28 | | 6.06 | | | | 929.6 | | 0.98 | (5) | | (0.59 | )(5) | | 26.52 | |
| | - | | | | 21.96 | | (1.26 | ) | | | 829.0 | | 1.00 | | | (0.36 | ) | | 102.85 | |
| | - | | | | 22.24 | | (16.04 | ) | | | 449.8 | | 1.02 | | | (0.56 | ) | | 121.14 | |
| | (1.03 | ) | | | 26.48 | | (0.38 | ) | | | 212.2 | | 1.08 | | | (0.29 | ) | | 153.95 | |
| | | | | | | | | | | | | | | | | | | | | |
| | | | | | | | | | | | | | | | | | | | | |
| | | | | | | | | | | | | | | | | | | | | |
| $ | (0.30 | ) | | $ | 19.60 | | 28.42 | % | | $ | 2,771.2 | | 1.22 | % | | (0.04 | )% | | 51.60 | % |
| | (0.24 | ) | | | 15.55 | | 29.60 | | | | 312.3 | | 1.39 | | | 0.73 | | | 53.79 | |
| | - | | | | 12.22 | | 4.98 | | | | 77.4 | | 1.59 | (5) | | (0.31 | )(5) | | 11.90 | |
| | - | | | | 11.64 | | 7.58 | | | | 64.5 | | 1.78 | | | (0.34 | ) | | 45.55 | |
| | (0.08 | ) | | | 10.82 | | (2.37 | ) | | | 22.0 | | 1.95 | (5) | | (0.82 | )(5) | | 167.70 | |
| | - | | | | 11.18 | | 11.80 | | | | 13.2 | | 1.84 | (5) | | (0.52 | )(5) | | 40.72 | |
| | | | | | | | | | | | | | | | | | | | | |
| | | | | | | | | | | | | | | | | | | | | |
| | | | | | | | | | | | | | | | | | | | | |
| $ | (0.53 | ) | | $ | 17.95 | | 22.64 | % | | $ | 1,103.3 | | 1.18 | % | | (0.80 | )% | | 78.60 | % |
| | - | | | | 15.12 | | 20.67 | | | | 239.6 | | 1.27 | | | (0.95 | ) | | 119.40 | |
| | - | | | | 12.53 | | 5.29 | | | | 127.9 | | 1.44 | (5) | | (1.16 | )(5) | | 30.18 | |
| | (0.06 | ) | | | 11.90 | | (0.11 | ) | | | 116.0 | | 1.39 | | | (0.98 | ) | | 127.41 | |
| | (0.06 | ) | | | 11.99 | | (13.90 | ) | | | 131.9 | | 1.31 | | | (1.00 | ) | | 139.72 | |
| | (0.66 | ) | | | 13.99 | | 0.07 | | | | 145.4 | | 1.34 | | | (0.68 | ) | | 147.13 | |
| | | | | | | | | | | | | | | | | | | | | |
| | | | | | | | | | | | | | | | | | | | | |
| | | | | | | | | | | | | | | | | | | | | |
| $ | (1.78 | ) | | $ | 19.51 | | 22.42 | % | | $ | 1,720.9 | | 1.18 | % | | (0.16 | )% | | 56.03 | % |
| | (0.20 | ) | | | 17.63 | | 30.76 | | | | 1,192.8 | | 1.18 | | | (0.17 | ) | | 41.31 | |
| | - | | | | 13.67 | | 3.95 | | | | 775.2 | | 1.20 | (5) | | (0.40 | )(5) | | 12.20 | |
| | (0.50 | ) | | | 13.15 | | 1.90 | | | | 702.5 | | 1.21 | | | (0.21 | ) | | 49.57 | |
| | (0.72 | ) | | | 13.48 | | 9.65 | | | | 623.5 | | 1.20 | | | (0.10 | ) | | 33.59 | |
| | (0.54 | ) | | | 13.05 | | 28.81 | | | | 460.3 | | 1.20 | | | 0.45 | | | 40.77 | |
| | | | | | | | |
| Fund | | Year or
Period Ended | | Ratio of Expenses to
Average Net Assets | | | Ratio of Net Investment Income
(Loss) to Average Net Assets | |
Mid Cap Value Investor Shares | | 6/30/2002 | | 2.53 | % | | (1.40 | )% |
Mid Cap Value Investor Shares | | 6/30/2001 | | 5.17 | | | (3.84 | ) |
Small Cap Investor Shares | | 9/30/2003 | | 1.46 | | | (1.18 | ) |
Small Cap Value Investor Shares | | 9/30/2003 | | 1.20 | | | (0.41 | ) |
| | (6) | The amount shown may not correlate with the aggregate gains and losses of portfolio securities due to the timing of subscriptions and redemptions of fund shares. |
| | (7) | Amount is between $0.005 and $(0.005) per share. |
| | (8) | For the period from commencement of operations (March 28, 2001) through June 30, 2001. |
The accompanying notes are an integral part of the financial statements.
61
SIXTY-ONE
Artisan Funds, Inc.
Notes to Financial Statements – September 30, 2005
Artisan Funds, Inc. (“Artisan Funds”) was incorporated on January 5, 1995, as a Wisconsin corporation and is registered under the Investment Company Act of 1940, as amended. Artisan Funds is a series comprised of seven open-end, diversified mutual funds (each a “Fund” and collectively the “Funds”):
| | |
| Fund Name | | Inception Date |
Artisan International Fund (“International Fund” or “International”) | | December 28, 1995 |
Artisan International Small Cap Fund (“International Small Cap Fund” or “International Small Cap”) | | December 21, 2001 |
Artisan International Value Fund (“International Value Fund” or “International Value”) | | September 23, 2002 |
Artisan Mid Cap Fund (“Mid Cap Fund” or “Mid Cap”) | | June 27, 1997 |
Artisan Mid Cap Value Fund (“Mid Cap Value Fund” or “Mid Cap Value”) | | March 28, 2001 |
Artisan Small Cap Fund (“Small Cap Fund” or “Small Cap”) | | March 28, 1995 |
Artisan Small Cap Value Fund (“Small Cap Value Fund” or “Small Cap Value”) | | September 29, 1997 |
Each Fund’s investment objective is to seek long-term capital growth. Each Fund has offered shares of capital stock of the class designated Investor Shares since the commencement of operations. International Fund and Mid Cap Fund began offering Institutional Shares on July 1, 1997 and July 1, 2000, respectively. Institutional Shares are sold to institutional investors meeting certain minimum investment requirements. Each class of shares has equal rights with respect to portfolio assets and voting privileges. Each class has exclusive voting rights with respect to any matters involving only that class. Income, expenses not specific to either class and realized and unrealized gains and losses are allocated daily to each class of shares based upon the relative net asset value of outstanding shares. Expenses attributable to a particular class of shares, such as transfer agency fees, shareholder communication expenses and registration fees, are allocated directly to that class.
Each class of the Funds has an indefinite number of shares authorized with a $0.01 par value.
| (2) | Summary of significant accounting policies: |
The following is a summary of significant accounting policies of the Funds in effect during the period covered by the financial statements, which are in accordance with United States generally accepted accounting principles.
| | (a) | Security valuation – The net asset value (“NAV”) of the shares of each class of each Fund was determined as of the close of regular session trading on the |
62
SIXTY-TWO
NOTES TO FINANCIAL STATEMENTS
| | New York Stock Exchange (“NYSE”) (usually 3:00 p.m., Central time, but sometimes earlier) each day the NYSE was open for regular session trading. The NAV of each class of shares was determined by dividing the value of each Fund’s securities and other assets attributed to that class, less its liabilities attributed to that class, by the number of outstanding shares of that class of that Fund. |
In determining NAV, each equity security traded on a securities exchange, including the Nasdaq Stock Market, was valued at the closing price as of the time of valuation on the exchange or market on which the security was principally traded (the “principal exchange”). The closing price provided by each exchange may differ and may represent information such as last sales price, an official closing price, a closing auction price or other information, depending on exchange or market convention. Absent closing price information for a security from the principal exchange as of the time of valuation, the security was valued using the most recent bid quotation on the principal exchange, except that securities listed on the London Stock Exchange were valued at the mean of the most recent bid and asked quotations as of the time of valuation. Short-term investments maturing within sixty days of the valuation date were valued at amortized cost, which approximates market value.
Securities for which prices were not readily available were valued by Artisan Funds’ valuation committee (the “valuation committee”) at a fair value determined in good faith under procedures established by and under the general supervision of Artisan Funds’ Board of Directors (the “Board of Directors”). A price was considered not to be readily available if, among other things, the valuation committee believed that the price determined as described in the preceding paragraph did not reflect a fair value of the security.
International Fund, International Small Cap Fund and International Value Fund generally invest a significant portion, and perhaps as much as substantially all, of their total assets in securities principally traded in markets outside the U.S. Each of the other Funds has the ability to invest in securities principally traded outside the U.S., but did not do so in the period covered by these financial statements. The foreign markets in which the Funds may invest are sometimes open on days when the NYSE is not open and the Funds do not calculate their NAVs, and sometimes are not open on days when the Funds do calculate their NAVs. Even on days on which both the foreign market and the NYSE are open, several hours may have passed between the time when trading in the foreign market closed and the time as of which the Funds calculate their NAVs. That is generally the case for markets in Europe,
63
SIXTY-THREE
NOTES TO FINANCIAL STATEMENTS
Asia, Australia and other far eastern markets; the regular closing time of foreign markets in North and South America is generally the same as the closing time of the NYSE and the time as of which the Funds calculate their NAVs.
The valuation committee concluded that a price determined under the Funds’ valuation procedures was not readily available if, among other things, the valuation committee believed that the value of the security might have been materially affected by events occurring after the close of the market in which the security was principally traded but before the time for determination of NAV (“subsequent event”). A subsequent event might include a company-specific development (for example, announcement of a merger that is made after the close of the foreign market), a development that might affect an entire market or region (for example, imposition of foreign exchange controls by a foreign government) or a potentially global development (such as a terrorist attack that may be expected to have an impact on investor expectations worldwide) or a significant change in one or more United States securities indexes. Artisan Funds monitored for subsequent events using several tools, including the use of a third party research service to assist in determining estimates of fair values for foreign securities. That service utilized statistical data based on historical performance of securities, markets and other data in developing factors used to estimate a fair value. An indication by any of those tools of a potential material change in the value of securities resulted in a meeting of the valuation committee, which considered whether a subsequent event had occurred and whether local market closing prices continued to represent fair values for potentially affected non-U.S. securities.
Estimates of fair values utilized by the Funds as described above may differ from the value realized on the sale of those securities and the differences may be material to the NAV of the applicable Fund or to the financial statements presented.
| | (b) | Income taxes – No provision has been made for federal income taxes since each Fund intends to (i) comply with the provisions of Subchapter M of the Internal Revenue Code applicable to regulated investment companies and (ii) distribute to its shareholders substantially all of its taxable income as well as net realized gains from the sale of investment securities. The Funds may utilize earnings and profits distributed to shareholders on redemptions of Fund shares as part of the dividends paid deduction. |
| | (c) | Portfolio transactions – Security and shareholder transactions are recorded on trade date. Net realized gains and losses on securities are computed on specific security lot identification. |
64
SIXTY-FOUR
NOTES TO FINANCIAL STATEMENTS
| | (d) | Foreign currency translation – Values of investments, open foreign currency forward contracts, payables for capital gains taxes and cash denominated in foreign currencies were translated into U.S. dollars using a spot market rate of exchange as of 3:00 p.m. (Central time) on the day of valuation. Payables and receivables for securities transactions, dividend and reclaim receivables and other receivables and payables denominated in a foreign currency were translated into U.S. dollars using a spot market rate of exchange as of 11:00 a.m. (Central time) on the day of valuation. Purchases and sales of investments and dividend and interest income are translated into U.S. dollars using a spot market rate of exchange as of 11:00 a.m. (Central time) on the date of such transactions. The portion of security gains or losses resulting from changes in foreign exchange rates is included with net realized and unrealized gain or loss from investments, as appropriate, for both financial reporting and tax purposes. |
International Fund, International Small Cap Fund and International Value Fund may enter into foreign currency forward contracts to hedge the foreign currency exposure on open payables and receivables. The foreign currency forward contracts are recorded at market value and any related realized and unrealized gains and losses are reported as foreign currency related transactions for financial reporting purposes. For tax purposes, these foreign exchange gains and losses are treated as ordinary income or loss. International Fund, International Small Cap Fund and International Value Fund could be exposed to loss if the counterparties fail to perform under these contracts.
Other foreign currency related transaction gains and losses may result from currency gains and losses realized from the difference between the amounts of dividends and foreign withholding taxes recorded on the Funds’ books and the U.S. dollar equivalent of the amounts actually received or paid. The net increase (decrease) in unrealized appreciation or depreciation on foreign currency related transactions arise from changes in the values of assets and liabilities, other than investments in securities, resulting from changes in foreign exchange rates.
| | (e) | Repurchase agreements – Each Fund may enter into repurchase agreements with institutions that Artisan Partners Limited Partnership (“the Adviser”) has determined are creditworthy pursuant to criteria adopted by the Board of Directors. Repurchase agreements are recorded at cost plus accrued interest and are collateralized in an amount greater than or equal to the repurchase price plus accrued interest. Collateral is held by the Funds’ custodian and in the event of default on the obligation of the counterparty to repurchase, the Funds have the right to liquidate the collateral and apply the proceeds in satisfaction of the obligation. If the proceeds from any sale of such collateral were less than the repurchase price, the Fund would suffer a loss. |
65
SIXTY-FIVE
NOTES TO FINANCIAL STATEMENTS
| | (f) | Securities lending – Each Fund may enter into securities lending transactions. During the year ended September 30, 2005, International Fund earned $3,908,478 from securities lending transactions. When securities are on loan the Fund does not receive dividends on the securities loaned, but receives compensation from the borrower in lieu of such dividends. The loans are secured by collateral at least equal, at all times, to the fair value of the securities loaned. Gain or loss in the fair value of the securities loaned that may occur during the term of the loan will be for the account of the applicable Fund. As of September 30, 2005, there were no securities on loan. Each Fund’s risks in entering into securities lending arrangements are that the borrower may not provide additional collateral when required or return the securities when due or, if the borrower defaults, the Fund may experience delays in selling collateral or the collateral may not be sufficient to cover the value of securities lent. |
| | (g) | Commission recapture – Each of the Funds may direct portfolio trades to various brokers that have agreed to rebate a portion of the commissions generated. Such cash rebates are made directly to the applicable Fund and are included in net realized gain or loss on investments in the Statements of Operations as follows: |
| | | |
International | | $ | 5,177,838 |
International Small Cap | | | 317,753 |
International Value | | | 229,449 |
Mid Cap | | | 954,518 |
Mid Cap Value | | | 258,172 |
Small Cap | | | 186,421 |
Small Cap Value | | | 232,739 |
| | (h) | Use of estimates – The preparation of financial statements in conformity with United States generally accepted accounting principles requires management to make estimates and assumptions that affect the reported amounts and disclosures in the financial statements. Actual results could differ from those estimates. |
| | (i) | Indemnifications – In the normal course of business, the Funds enter into contracts in which the Funds agree to indemnify the other party or parties against various potential costs or liabilities. The Funds’ maximum exposure under these arrangements is unknown. No claim has been made for indemnification pursuant to any such agreement of the Funds. |
| | (j) | Other – Dividend income less foreign taxes withheld, if any, is recorded on the ex-dividend date, except that certain dividends from private placements and foreign securities are recorded as soon after the ex-dividend date as the information becomes available to the Funds. Non-cash dividends included in dividend income, if any, are generally recorded at the fair market value of the securities received. Interest income is reported on the accrual basis. |
66
SIXTY-SIX
NOTES TO FINANCIAL STATEMENTS
| | Distributions to shareholders are recorded on the ex-dividend date. Expenses attributable to Artisan Funds are generally allocated to each Fund based on net assets. Expenses attributable to a particular Fund are allocated directly to that Fund. |
The character of income and net realized gains and losses may differ for financial statement and tax purposes and may result in reclassification of permanent differences among certain capital accounts to more appropriately conform financial accounting to tax characterizations of dividend distributions.
International Fund, International Small Cap Fund and International Value Fund generally impose a 2% redemption fee on shares held 90 days or less. Those redemption fees are recorded as a reduction in the cost of shares redeemed and have the primary effect of increasing paid-in capital.
| (3) | Transactions with affiliates: |
The Adviser, with which the officers and a director of Artisan Funds are affiliated, provides investment advisory and administrative services to the Funds. In exchange for those services, each Fund (with the exception of International Small Cap Fund) pays a monthly management fee to the Adviser as follows:
| | | |
Average Daily Net Assets
| | Annual Rate
| |
Less than $500 million | | 1.000 | % |
$500 million to $750 million | | 0.975 | |
$750 million to $1 billion | | 0.950 | |
Greater than $1 billion | | 0.925 | |
International Small Cap Fund pays a monthly management fee to the Adviser at an annual rate of 1.250% of average daily net assets. The officers and director of Artisan Funds who are affiliated with the Adviser receive no compensation from the Funds.
Shares of Artisan Funds are offered for sale by Artisan Distributors LLC (“Distributors”). Distributors is wholly owned by the Adviser. All distribution expenses relating to the Funds are paid by the Adviser.
Each Fund also incurs other expenses for services such as maintaining shareholder records and furnishing shareholder statements and reports.
Prior to April 1, 2005, each director who was not an interested person of Artisan Funds or the Adviser received an annual retainer of $60,000, plus a fee for each board or committee meeting attended (other than a committee meeting held on the same day as a board meeting) of $3,000 for an in-person meeting and $500 for a telephonic meeting, as well as reimbursement of expenses related to his duties as a director of Artisan Funds. In addition, each chairman of a board committee who was a non-interested director and each non-interested director performing services
67
SIXTY-SEVEN
NOTES TO FINANCIAL STATEMENTS
deemed by the Board of Directors to be substantially equivalent to those of a committee chair received a supplemental annual retainer of $5,000. Those fees were generally allocated to each Fund based on net assets.
Effective April 1, 2005, each director who is not an interested person of Artisan Funds or the Adviser receives an annual retainer of $120,000 payable quarterly, as well as reimbursement of expenses related to his duties as a director of Artisan Funds. In addition, the non-interested chair of the board of directors receives an additional annual retainer of $60,000 payable quarterly, and each chair of a board committee who is a non-interested director receives an additional annual retainer of $30,000 payable quarterly.
| (4) | Line of credit arrangements: |
Artisan Funds is party to a line of credit agreement with State Street Bank and Trust Company, under which each Fund may borrow up to the lesser of (a) $75 million or (b) the lesser of (i) 10% of its total assets (after giving effect to the loan) or (ii) the maximum amount the Fund may borrow under the Investment Company Act, the limitations included in the Fund’s prospectus, or any limit or restriction under any law or regulation to which the Fund is subject or any agreement to which the Fund or Artisan Funds is a party; provided that the aggregate borrowings by all Funds may not exceed $100 million. Artisan Funds pays a commitment fee at the annual rate of 0.10% on the unused portion of the line of credit. Interest is charged on any borrowings at the current Federal Funds rate plus 0.50%. The use of the line of credit is generally restricted to temporary borrowing for extraordinary or emergency purposes. During the year ended September 30, 2005, there were no borrowings under the line of credit for International, Mid Cap, Mid Cap Value, Small Cap or Small Cap Value. During the year ended September 30, 2005, International Small Cap and International Value paid interest of $213 and $3,154 on maximum borrowings of $2,149,674 and $13,744,061, respectively.
| (5) | Investment transactions: |
The cost of securities purchased and the proceeds from the sale of securities (excluding short-term securities) for the year ended September 30, 2005 were as follows:
| | | | | | |
| Fund | | Security Purchases | | Security Sales |
International | | $ | 6,035,724,353 | | $ | 6,622,127,074 |
International Small Cap | | | 403,757,531 | | | 356,937,473 |
International Value | | | 550,051,428 | | | 261,517,983 |
Mid Cap | | | 4,668,792,914 | | | 4,863,636,635 |
Mid Cap Value | | | 2,647,859,684 | | | 647,157,999 |
Small Cap | | | 1,179,241,510 | | | 458,905,031 |
Small Cap Value | | | 973,121,551 | | | 771,227,845 |
68
SIXTY-EIGHT
NOTES TO FINANCIAL STATEMENTS
| (6) | Transactions in securities of affiliates: |
The table below shows information about securities of the Funds’ “affiliates” (as defined below) that were held by the Funds, purchased or sold by the Funds, or from which dividends were received by the Funds during the year ended September 30, 2005. The Funds identify a company as an affiliate for the purpose of this report if one or more of the Funds owned, in the aggregate, voting securities that it believed represented 5% or more of that company’s outstanding voting securities (as defined by the Investment Company Act of 1940) during the year ended September 30, 2005.
| | | | | | | | | | | | | | | | | | | | | | |
| | | | | As of 9/30/04
| | | | | | | | | | | As of 9/30/05
|
Fund
| | Security
| | Share
Balance
| | Purchase
Cost
| | Sales
Cost
| | Net Realized
Gain (Loss)
| | | Dividend
Income (4)
| | Share
Balance
| | Value
|
| International | | Clariant AG(1) | | 13,411,333 | | $ | - | | $ | 202,716,463 | | $ | (8,879,904 | ) | | $ | 1,549,314 | | - | | $ | - |
| | | Credit Saison Co. Ltd.(2) | | 4,474,500 | | | 155,690,142 | | | 5,788,207 | | | 455,662 | | | | 1,213,764 | | 8,952,300 | | | 392,727,748 |
International Small Cap | | FINETEC Corporation | | 1,201,124 | | | - | | | 1,268,191 | | | 1,705,550 | | | | 72,223 | | 971,391 | | | 11,543,123 |
International Value | | Clariant AG(1) | | 529,280 | | | 14,905,619 | | | 7,146,956 | | | (352,598 | ) | | | 211,592 | | 1,036,726 | | | 14,895,604 |
| | | Pfeiffer Vacuum Technology AG(2) | | 165,482 | | | 16,132,272 | | | 22,613,660 | | | 1,456,611 | | | | 442,010 | | 467,396 | | | 23,306,576 |
| Mid Cap Value | | Furniture Brands International, Inc.(2) | | 452,700 | | | 63,076,672 | | | - | | | - | | | | 1,044,915 | | 3,386,900 | | | 61,065,807 |
| | | Zale Corporation(2)(3) | | 248,700 | | | 50,264,279 | | | - | | | - | | | | - | | 1,888,800 | | | 51,337,584 |
| Small Cap | | Global Power Equipment Group Inc.(2)(3) | | - | | | 12,017,219 | | | 1,444,972 | | | 23,812 | | | | - | | 1,224,700 | | | 8,732,111 |
Small Cap Value | | AMN Healthcare Services, Inc.(2)(3) | | - | | | 24,049,564 | | | - | | | - | | | | - | | 1,579,100 | | | 24,428,677 |
| | | CellStar Corporation(1)(3) | | 1,194,400 | | | 573,394 | | | 7,432,579 | | | (6,685,488 | ) | | | - | | - | | | - |
| | | Furniture Brands International, Inc.(2) | | 169,700 | | | 42,430,573 | | | 1,878,559 | | | (255,791 | ) | | | 919,380 | | 1,942,800 | | | 35,028,684 |
| | | Global Power Equipment Group Inc.(2)(3) | | 333,500 | | | 10,232,444 | | | 2,410,207 | | | 1,199,103 | | | | - | | 1,332,000 | | | 9,497,160 |
| | | Kellwood Corporation(2) | | 1,136,750 | | | 19,796,801 | | | - | | | - | | | | 1,052,096 | | 1,786,450 | | | 46,179,732 |
| | | Movie Gallery, Inc.(2) | | 895,000 | | | 23,479,567 | | | - | | | - | | | | 169,701 | | 2,081,900 | | | 21,630,941 |
| | | National Dentex Corporation(3) | | 229,200 | | | 269,402 | | | - | | | - | | | | - | | 359,400 | | | 7,403,640 |
| | | PICO Holdings, Inc.(3) | | 703,100 | | | 322,844 | | | 609,005 | | | 313,970 | | | | - | | 688,000 | | | 24,176,320 |
| | | Stewart Information Services Corporation | | 1,005,300 | | | 9,200,289 | | | 1,258,836 | | | 60,739 | | | | 448,086 | | 1,222,900 | | | 62,612,480 |
| | | Superior Industries International, Inc.(2) | | 685,100 | | | 20,345,167 | | | - | | | - | | | | 577,586 | | 1,463,900 | | | 31,503,128 |
| | | Zale Corporation(2)(3) | | 1,108,500 | | | 14,561,525 | | | 2,068,799 | | | 270,333 | | | | - | | 1,573,000 | | | 42,754,140 |
| | (1) | Issuer was no longer an affiliate as of September 30, 2005. |
| | (2) | Issuer was not an affiliate as of September 30, 2004. |
| | (3) | Non-income producing security. |
| | (4) | Net of foreign taxes withheld, if any. |
69
SIXTY-NINE
NOTES TO FINANCIAL STATEMENTS
| (7) | Information for Federal income tax purposes: |
| | | | | | | | | | | | | |
Fund
| | Cost of Investments
| | Gross Unrealized Appreciation
| | Gross Unrealized Depreciation
| | | Net Unrealized Appreciation (Depreciation) on Investments
|
| International | | $ | 8,870,840,634 | | $ | 2,862,245,706 | | $ | (166,040,763 | ) | | $ | 2,696,204,943 |
| International Small Cap | | | 541,815,456 | | | 232,611,025 | | | (6,003,124 | ) | | | 226,607,901 |
| International Value | | | 528,155,205 | | | 73,129,099 | | | (8,347,535 | ) | | | 64,781,564 |
| Mid Cap | | | 4,615,316,636 | | | 1,261,868,261 | | | (62,195,132 | ) | | | 1,199,673,129 |
| Mid Cap Value | | | 2,577,538,864 | | | 266,117,385 | | | (61,288,547 | ) | | | 204,828,838 |
| Small Cap | | | 1,048,969,455 | | | 127,955,213 | | | (31,277,964 | ) | | | 96,677,249 |
| Small Cap Value | | | 1,388,885,991 | | | 398,252,738 | | | (61,263,506 | ) | | | 336,989,232 |
The difference between cost of investments for financial reporting and cost of investments for Federal income tax is due primarily to timing differences in recognizing certain gains and losses on security transactions (e.g., wash sale loss deferrals and passive foreign investment company transactions).
The tax basis of dividends and long-term capital gain distributions paid during the year ended September 30, 2005 and the year ended September 30, 2004 were as follows:
| | | | | | | | | | | | |
| | | Year ended 9/30/05
| | Year Ended 9/30/04
|
| | Ordinary
Income
Dividends
| | Long-Term
Capital Gain
Distributions
| | Ordinary
Income
Dividends
| | Long-Term
Capital Gain
Distributions
|
| International | | $ | 69,335,942 | | $ | - | | $ | 101,887,899 | | $ | - |
| International Small Cap | | | 38,631,361 | | | 20,034,761 | | | 12,868,474 | | | 3,959,034 |
| International Value | | | 3,707,149 | | | 1,337,370 | | | 828,575 | | | - |
| Mid Cap | | | - | | | - | | | - | | | - |
| Mid Cap Value | | | 4,542,632 | | | 4,785,269 | | | 920,430 | | | 679,381 |
| Small Cap | | | 715,625 | | | 9,933,966 | | | - | | | - |
| Small Cap Value | | | 33,641,530 | | | 90,214,766 | | | 2,241,194 | | | 9,542,404 |
Income and capital gain distributions are determined in accordance with income tax regulations that may differ from accounting principles that are generally accepted in the United States. These differences are due to differing treatments for items such as net short-term gains, wash sale loss deferrals, foreign currency transactions, net investment losses and capital loss carryovers.
70
SEVENTY
NOTES TO FINANCIAL STATEMENTS
Additional tax information as of and for the year ended September 30, 2005 follows:
| | | | | | | | | | | | | | | | | | | |
| | | As of 9/30/05 | | | | Year Ended 9/30/05 |
| | | Undistributed
Ordinary
Income | | Undistributed
Long-Term
Gain | | Net Capital
Loss
Carryforward(1) | | Capital Loss
Carryforward
Expiration | | | | Capital Loss
Carryforward
Utilized | | Post-October
Losses |
| International | | $ | 200,676,648 | | $ | - | | $ | 30,783,169 | | 2009 | | | | $ | 738,285,571 | | $ | - |
| | | | | | | | | | 384,841,928 | | 2010 | | | | | | | | |
| | | | | | | | | | 202,299,105 | | 2011 | | | | | | | | |
| International Small Cap | | | 33,527,660 | | | 43,577,189 | | | - | | | | | | | - | | | - |
| International Value | | | 16,629,783 | | | 7,642,471 | | | - | | | | | | | - | | | - |
| Mid Cap | | | - | | | 158,169,846 | | | - | | | | | | | 178,503,906 | | | - |
| Mid Cap Value | | | 82,288,696 | | | 25,095,097 | | | - | | | | | | | - | | | - |
| Small Cap | | | 15,318,450 | | | 16,198,898 | | | - | | | | | | | - | | | - |
| Small Cap Value | | | 49,851,555 | | | 134,011,790 | | | - | | | | | | | - | | | - |
| | (1) | The Funds expect to resume paying capital gain distributions in the future to the extent gains are realized in excess of the available carryforwards. |
71
SEVENTY-ONE
NOTES TO FINANCIAL STATEMENTS
| (8) | Fund share activities: |
Capital share transactions for the Funds were as follows:
| | | | | | | | | | | | |
| | | INTERNATIONAL
| | | INTERNATIONAL
SMALL CAP
| |
Year ended September 30, 2005
| | Investor Shares
| | | Institutional Shares
| | | Investor
Shares
| |
Proceeds from shares issued | | $ | 1,721,409,733 | | | $ | 213,745,441 | | | $ | 162,675,457 | |
Net asset value of shares issued in reinvestment of dividends and distributions | | | 35,336,667 | | | | 27,442,945 | | | | 57,876,739 | |
Cost of shares redeemed(1) | | | (1,815,852,822 | ) | | | (778,118,588 | ) | | | (114,717,564 | ) |
| | |
|
|
| |
|
|
| |
|
|
|
Net increase (decrease) from fund share transactions | | $ | (59,106,422 | ) | | $ | (536,930,202 | ) | | $ | 105,834,632 | |
| | |
|
|
| |
|
|
| |
|
|
|
| | | |
Shares sold | | | 78,912,846 | | | | 9,680,591 | | | | 8,896,487 | |
Shares issued in reinvestment of dividends and distributions | | | 1,677,108 | | | | 1,297,539 | | | | 3,597,063 | |
Shares redeemed | | | (82,739,336 | ) | | | (34,838,126 | ) | | | (6,444,012 | ) |
| | |
|
|
| |
|
|
| |
|
|
|
Net increase (decrease) in capital shares | | | (2,149,382 | ) | | | (23,859,996 | ) | | | 6,049,538 | |
| | |
|
|
| |
|
|
| |
|
|
|
| | |
| | | INTERNATIONAL
| | | INTERNATIONAL
SMALL CAP
| |
Year ended September 30, 2004
| | Investor Shares
| | | Institutional Shares
| | | Investor
Shares
| |
Proceeds from shares issued | | $ | 2,536,272,455 | | | $ | 334,559,000 | | | $ | 193,292,258 | |
Net asset value of shares issued in reinvestment of dividends and distributions | | | 54,531,342 | | | | 38,442,969 | | | | 16,704,120 | |
Cost of shares redeemed(2) | | | (2,903,431,496 | ) | | | (658,297,737 | ) | | | (166,988,190 | ) |
| | |
|
|
| |
|
|
| |
|
|
|
Net increase (decrease) from fund share transactions | | $ | (312,627,699 | ) | | $ | (285,295,768 | ) | | $ | 43,008,188 | |
| | |
|
|
| |
|
|
| |
|
|
|
| | | |
Shares sold | | | 134,972,302 | | | | 17,620,515 | | | | 12,511,213 | |
Shares issued in reinvestment of dividends and distributions | | | 3,107,199 | | | | 2,183,019 | | | | 1,141,772 | |
Shares redeemed | | | (156,104,065 | ) | | | (35,129,349 | ) | | | (10,515,918 | ) |
| | |
|
|
| |
|
|
| |
|
|
|
Net increase (decrease) in capital shares | | | (18,024,564 | ) | | | (15,325,815 | ) | | | 3,137,067 | |
| | |
|
|
| |
|
|
| |
|
|
|
| (1) | Net of redemption fees of $326,088, $179,833, $19,830 and $145,080 for International-Investor Shares, International-Institutional Shares, International Small Cap and International Value, respectively. |
| (2) | Net of redemption fees of $74,205, $41,388, $207,006 and $11,254 for International-Investor Shares, International-Institutional Shares, International Small Cap and International Value, respectively. |
72
SEVENTY-TWO
NOTES TO FINANCIAL STATEMENTS
| | | | | | | | | | | | | | | | | | | | | | |
INTERNATIONAL
VALUE
| | | MID CAP
| | | MID CAP VALUE
| | | SMALL CAP
| | | SMALL CAP
VALUE
| |
Investor Shares
| | | Investor Shares
| | | Institutional
Shares
| | | Investor Shares
| | | Investor Shares
| | | Investor Shares
| |
| $ | 613,671,425 | | | $ | 1,448,522,186 | | | $ | 65,819,361 | | | $ | 2,505,178,141 | | | $ | 875,101,149 | | | $ | 492,489,210 | |
| | 4,945,577 | | | | - | | | | - | | | | 8,873,823 | | | | 8,911,550 | | | | 114,845,085 | |
| | (306,684,879 | ) | | | (1,366,393,615 | ) | | | (299,155,114 | ) | | | (330,649,737 | ) | | | (118,616,878 | ) | | | (248,073,902 | ) |
|
|
| |
|
|
| |
|
|
| |
|
|
| |
|
|
| |
|
|
|
| $ | 311,932,123 | | | $ | 82,128,571 | | | $ | (233,335,753 | ) | | $ | 2,183,402,227 | | | $ | 765,395,821 | | | $ | 359,260,393 | |
|
|
| |
|
|
| |
|
|
| |
|
|
| |
|
|
| |
|
|
|
| | | | | |
| | 29,605,335 | | | | 50,306,407 | | | | 2,231,832 | | | | 138,992,400 | | | | 52,241,425 | | | | 27,512,339 | |
| | 251,300 | | | | - | | | | - | | | | 544,456 | | | | 554,201 | | | | 6,864,620 | |
| | (14,730,829 | ) | | | (46,997,550 | ) | | | (10,061,831 | ) | | | (18,249,715 | ) | | | (7,184,384 | ) | | | (13,859,519 | ) |
|
|
| |
|
|
| |
|
|
| |
|
|
| |
|
|
| |
|
|
|
| | 15,125,806 | | | | 3,308,857 | | | | (7,829,999 | ) | | | 121,287,141 | | | | 45,611,242 | | | | 20,517,440 | |
|
|
| |
|
|
| |
|
|
| |
|
|
| |
|
|
| |
|
|
|
| | | | |
INTERNATIONAL
VALUE
| | | MID CAP
| | | MID CAP VALUE
| | | SMALL CAP
| | | SMALL CAP
VALUE
| |
Investor Shares
| | | Investor Shares
| | | Institutional
Shares
| | | Investor Shares
| | | Investor Shares
| | | Investor Shares
| |
| $ | 199,024,062 | | | $ | 1,972,432,516 | | | $ | 69,966,247 | | | $ | 229,241,036 | | | $ | 119,391,774 | | | $ | 368,267,157 | |
| | 788,115 | | | | - | | | | - | | | | 1,567,572 | | | | - | | | | 10,992,907 | |
| | (23,582,394 | ) | | | (855,149,594 | ) | | | (91,122,442 | ) | | | (28,078,509 | ) | | | (35,223,082 | ) | | | (201,938,794 | ) |
|
|
| |
|
|
| |
|
|
| |
|
|
| |
|
|
| |
|
|
|
| $ | 176,229,783 | | | $ | 1,117,282,922 | | | $ | (21,156,195 | ) | | $ | 202,730,099 | | | $ | 84,168,692 | | | $ | 177,321,270 | |
|
|
| |
|
|
| |
|
|
| |
|
|
| |
|
|
| |
|
|
|
| | | | | |
| | 11,382,724 | | | | 75,836,138 | | | | 2,793,091 | | | | 15,586,699 | | | | 8,008,103 | | | | 22,595,547 | |
| | 52,262 | | | | - | | | | - | | | | 121,706 | | | | - | | | | 747,308 | |
| | (1,350,339 | ) | | | (32,884,883 | ) | | | (3,449,277 | ) | | | (1,960,621 | ) | | | (2,368,256 | ) | | | (12,359,689 | ) |
|
|
| |
|
|
| |
|
|
| |
|
|
| |
|
|
| |
|
|
|
| | 10,084,647 | | | | 42,951,255 | | | | (656,186 | ) | | | 13,747,784 | | | | 5,639,847 | | | | 10,983,166 | |
|
|
| |
|
|
| |
|
|
| |
|
|
| |
|
|
| |
|
|
|
73
SEVENTY-THREE
NOTES TO FINANCIAL STATEMENTS
Artisan Funds and the Adviser were defendants in a lawsuit that sought certification of a plaintiff class consisting of all persons in the United States who held shares in International Fund for a period of more than 14 days during the five years prior to the filing of the lawsuit. The suit sought compensatory and punitive damages under state law, as well as interest, costs and attorney’s fees. The lawsuit alleged, in summary, that Artisan Funds and the Adviser exposed long-term International Fund shareholders to trading by market timers by allegedly (a) failing to properly evaluate daily whether a significant event affecting the value of International Fund’s securities had occurred after foreign markets had closed but before the calculation of the Fund’s NAV; (b) failing to implement the Fund’s portfolio valuation and share pricing policies and procedures; (c) allowing portfolio valuation and share policies and procedures that benefited market timers at the expense of long-term shareholders; and (d) failing to know and implement applicable rules and regulations concerning the calculation of NAV.
After a successful appeal by Artisan Funds and the Adviser to the United States Court of Appeals for the Seventh Circuit, the plaintiff’s state law claims were dismissed. The plaintiffs are seeking review by the United States Supreme Court. If the Supreme Court grants review of the case and the plaintiff prevails, the lawsuit could be reinstated. If that occurs, Artisan Funds and the Adviser will continue to defend the lawsuit vigorously.
Certain legal fees incurred by Artisan Funds in defense of the lawsuit and related insurance recoveries of $565,637 have been allocated to International Fund and are included in professional fees in the Statement of Operations. Artisan Funds does not believe that the action described herein will have a material effect on the financial condition of any Fund.
74
SEVENTY-FOUR
Report of Independent Registered Public Accounting Firm
To the Board of Directors and Shareholders of Artisan Funds, Inc.
We have audited the accompanying statements of assets and liabilities, including the schedules of investments, of Artisan Funds, Inc., comprising the Artisan International Fund, Artisan International Small Cap Fund, Artisan International Value Fund, Artisan Mid Cap Fund, Artisan Mid Cap Value Fund, Artisan Small Cap Fund and Artisan Small Cap Value Fund (the “Funds”) as of September 30, 2005, and the related statements of operations for the year then ended, the statements of changes in net assets for each of the two years in the period then ended, and the financial highlights for each of the two years in the period then ended and for the period from July 1, 2003 to September 30, 2003. These financial statements and financial highlights are the responsibility of the Funds’ management. Our responsibility is to express an opinion on these financial statements and financial highlights based on our audits. The financial highlights of the Funds for the periods ended prior to September 30, 2003, were audited by other auditors whose report dated July 31, 2003, expressed an unqualified opinion on those financial highlights.
We conducted our audits in accordance with the standards of the Public Company Accounting Oversight Board (United States). Those standards require that we plan and perform the audit to obtain reasonable assurance about whether the financial statements and financial highlights are free of material misstatement. We were not engaged to perform an audit of the Funds’ internal control over financial reporting. Our audits included consideration of internal control over financial reporting as a basis for designing audit procedures that are appropriate in the circumstances, but not for the purpose of expressing an opinion on the effectiveness of the Funds’ internal control over financial reporting. Accordingly, we express no such opinion. An audit also includes examining, on a test basis, evidence supporting the amounts and disclosures in the financial statements and financial highlights, assessing the accounting principles used and significant estimates made by management, and evaluating the overall financial statement presentation. Our procedures included confirmation of securities owned as of September 30, 2005, by correspondence with the custodian and brokers or by other appropriate auditing procedures where replies from brokers were not received. We believe that our audits provide a reasonable basis for our opinion.
In our opinion, the financial statements and financial highlights referred to above present fairly, in all material respects, the financial position of each of the Funds constituting Artisan Funds, Inc. at September 30, 2005, the results of their operations for the year then ended, the changes in their net assets for each of the two years in the period then ended, and the financial highlights for each of the two years in the period then ended and for the period from July 1, 2003 to September 30, 2003, in conformity with U.S. generally accepted accounting principles.

Milwaukee, Wisconsin
November 10, 2005
75
SEVENTY-FIVE
NOTES TO FINANCIAL STATEMENTS
Other Federal tax information (unaudited):
The Internal Revenue Code requires that shareholders be notified within 60 days of the Funds’ fiscal year-end of certain information regarding long-term capital gains, qualified dividend income and the dividends received deduction for corporate shareholders. This data is informational only. Every year in January, shareholders are sent a Form 1099-DIV, which provides the federal tax status of dividends and distributions received during the calendar year. Shareholders are advised to consult their own tax advisor with respect to the specific tax consequences of investment in the Funds.
Each Fund hereby designates the following amounts as (i) long-term capital gain distributions for purposes of the dividends paid deduction (including earnings and profits distributed to shareholders on redemption of Fund shares), and (ii) the amount of ordinary dividends paid during the fiscal year ended September 30, 2005 that are considered qualified dividend income as defined in the Jobs and Growth Tax Relief Reconciliation Act of 2003.
| | | | | | |
| Fund | | Long-Term Capital Gains | | Qualified Dividend Income | |
International | | $ | - | | 100.00 | % |
International Small Cap | | | 22,365,185 | | 23.18 | |
International Value | | | 4,629,850 | | 70.80 | |
Mid Cap | | | 426,852 | | - | |
Mid Cap Value | | | 5,941,439 | | 34.70 | |
Small Cap | | | 10,142,698 | | - | |
Small Cap Value | | | 97,718,515 | | 37.83 | |
For the year ended September 30, 2005, of the ordinary income dividends paid by Mid Cap Value, Small Cap and Small Cap Value, 31%, 9% and 28% respectively, are eligible for the dividends received deduction available to certain corporate shareholders.
76
SEVENTY-SIX
SHAREHOLDER EXPENSE EXAMPLE
As a shareholder of Artisan Funds, you incur two types of costs: (1) transaction costs, including redemption fees; and (2) ongoing costs, including management fees, and other Fund expenses. This example is intended to help you understand your ongoing costs (in dollars) of investing in a Fund and to compare these costs with the ongoing costs of investing in other mutual funds.
The example is based on an investment of $1,000 invested at the beginning of the period and held for the entire period from April 1, 2005 to September 30, 2005.
Actual Expenses
The first line under the name of each Fund in the table below provides information about actual account values and actual expenses. You may use the information in this line, together with the amount you invested, to estimate the expenses that you paid over the period. Simply divide your account value by $1,000 (for example, an $8,600 account value divided by $1,000 = 8.6), then multiply the result by the number in the first line under the name of your Fund under the heading entitled “Expenses Paid During Period” to estimate the expenses you paid on your account during this period.
Hypothetical Example for Comparison Purposes
The second line below each Fund’s name in the table below provides information about hypothetical account values and hypothetical expenses based on each Fund’s actual expense ratio for the six months ended September 30, 2005 and an assumed rate of return of 5% per year before expenses, which is not the Fund’s actual return. The hypothetical account values and expenses may not be used to estimate the actual ending account balances or expenses you paid for the period. You may use this information to compare the ongoing costs of investing in each Fund and other funds. To do so, compare the 5% hypothetical example with the 5% hypothetical examples that appear in the shareholder reports of the other funds.
Please note that the expenses shown in the table are meant to highlight your ongoing costs only and do not reflect any transactional costs, such as redemption fees. Therefore, the second line of the table is useful in comparing ongoing costs only, and will not help you determine the relative costs of owning different funds. If these transactional costs were included, your costs would have been higher.
| | | | | | | | | |
| | | Beginning
Account Value
4/1/2005 | | Ending Account Value
9/30/2005 | | Expenses Paid During
Period* 4/1/2005-9/30/2005 |
Artisan International Fund - Investor Shares | | | | | | | | | |
Actual | | $ | 1,000.00 | | $ | 1,108.10 | | $ | 6.24 |
Hypothetical (5% return before expenses) | | $ | 1,000.00 | | $ | 1,019.15 | | $ | 5.97 |
Artisan International Fund - Institutional Shares | | | | | | | | | |
Actual | | $ | 1,000.00 | | $ | 1,109.40 | | $ | 5.18 |
Hypothetical (5% return before expenses) | | $ | 1,000.00 | | $ | 1,020.16 | | $ | 4.96 |
Artisan International Small Cap Fund | | | | | | | | | |
Actual | | $ | 1,000.00 | | $ | 1,152.50 | | $ | 8.26 |
Hypothetical (5% return before expenses) | | $ | 1,000.00 | | $ | 1,017.40 | | $ | 7.74 |
Artisan International Value Fund | | | | | | | | | |
Actual | | $ | 1,000.00 | | $ | 1,050.20 | | $ | 6.78 |
Hypothetical (5% return before expenses) | | $ | 1,000.00 | | $ | 1,018.45 | | $ | 6.68 |
77
SEVENTY-SEVEN
SHAREHOLDER EXPENSE EXAMPLE
| | | | | | | | | |
| | | Beginning
Account Value
4/1/2005 | | Ending
Account Value
9/30/2005 | | Expenses Paid During
Period*
4/1/2005-9/30/2005 |
Artisan Mid Cap Fund - Investor Shares | | | | | | | | | |
Actual | | $ | 1,000.00 | | $ | 1,076.80 | | $ | 6.20 |
Hypothetical (5% return before expenses) | | $ | 1,000.00 | | $ | 1,019.10 | | $ | 6.02 |
Artisan Mid Cap Fund - Institutional Shares | | | | | | | | | |
Actual | | $ | 1,000.00 | | $ | 1,078.00 | | $ | 4.95 |
Hypothetical (5% return before expenses) | | $ | 1,000.00 | | $ | 1,020.31 | | $ | 4.81 |
Artisan Mid Cap Value Fund | | | | | | | | | |
Actual | | $ | 1,000.00 | | $ | 1,098.70 | | $ | 6.42 |
Hypothetical (5% return before expenses) | | $ | 1,000.00 | | $ | 1,018.95 | | $ | 6.17 |
Artisan Small Cap Fund | | | | | | | | | |
Actual | | $ | 1,000.00 | | $ | 1,122.60 | | $ | 6.33 |
Hypothetical (5% return before expenses) | | $ | 1,000.00 | | $ | 1,019.10 | | $ | 6.02 |
Artisan Small Cap Value Fund | | | | | | | | | |
Actual | | $ | 1,000.00 | | $ | 1,083.90 | | $ | 6.16 |
Hypothetical (5% return before expenses) | | $ | 1,000.00 | | $ | 1,019.15 | | $ | 5.97 |
| * | Expenses are equal to the Fund’s ratio of expenses to average net assets for the six month period ended September 30, 2005 (shown below); multiplied by the average account value over the period; multiplied by 183/365 (to reflect the one-half year period). |
| | |
| Fund | | Annualized Ratio of Expenses to Average Net Assets for the Six Month
Period Ended September 30, 2005 |
Artisan International Fund - Investor Shares | | 1.18% |
Artisan International Fund - Institutional Shares | | 0.98 |
Artisan International Small Cap Fund | | 1.53 |
Artisan International Value Fund | | 1.32 |
Artisan Mid Cap Fund - Investor Shares | | 1.19 |
Artisan Mid Cap Fund - Institutional Shares | | 0.95 |
Artisan Mid Cap Value Fund | | 1.22 |
Artisan Small Cap Fund | | 1.19 |
Artisan Small Cap Value Fund | | 1.18 |
78
SEVENTY-EIGHT
NOTES ON MANAGEMENT’S DISCUSSION OF FUND PERFORMANCE
The discussions of each Fund included in this report include statistical information about the portfolios of each of the Funds. Except as otherwise noted, that information is as of September 30, 2005 and that information will vary with changes in a Fund’s portfolio investments. The performance information for each Fund relative to its benchmark index discussed in this Report was prepared by the Adviser using information reported by FactSet Databases (“FactSet”). For the purposes of assigning portfolio securities to a particular country, the Adviser considers an issuer to be from a particular country as designated by its securities information vendors. The Adviser currently uses MSCI as its primary source and FactSet as a secondary source for this information. As a result, Artisan Mid Cap Fund, Artisan Mid Cap Value Fund, Artisan Small Cap Fund and Artisan Small Cap Value Fund routinely hold securities of issuers organized outside the U.S., but with their primary trading markets in the U.S. In addition, those Funds may hold a limited number of non-U.S. securities that are traded in the U.S., directly or as ADRs. Also based on the designations of the securities information vendors, Artisan International Fund, Artisan International Small Cap Fund and Artisan International Value Fund routinely hold securities of issuers organized within the U.S. and/or issuers with their primary trading markets in the U.S. In the event (i) the Adviser’s securities information vendors do not assign a security to a particular country, or (ii) its primary vendor does not assign a security to a particular country and the secondary vendor has assigned a security to a particular country by using a methodology that is not the same as the methodology the primary vendor uses to assign a country, the Adviser assigns the security to a country using the primary vendor’s published criteria (to the extent available) or the Adviser’s own judgment. The primary information vendor’s criteria include the identity of the jurisdiction of the issuer’s incorporation, the main equity trading market for the issuer’s securities, the geographical distribution of the issuer’s operations and the location of the issuer’s headquarters.
For the purposes of assigning portfolio securities to a particular sector and industry, Artisan Mid Cap Fund, Artisan Mid Cap Value Fund, Artisan Small Cap Fund and Artisan Small Cap Value Fund assign securities in accordance with the sector and industry classifications provided by The Frank Russell Company (to the extent available). Artisan International Fund, Artisan International Small Cap Fund and Artisan International Value Fund assign securities for these purposes in accordance with the sector and industry classifications provided by MSCI (to the extent available).
Definitions of Portfolio Statistics
Median Market Cap provides a measure of the market capitalization value of the companies in a portfolio. Market capitalization is the aggregate value of all a company’s outstanding common stock. Market capitalization is calculated by FactSet using the price as of the most recent month-end multiplied by the number of shares outstanding as shown in the financial statements of the issuer. Equal numbers of companies in the portfolio have market capitalizations higher and lower than the median. Weighted Average Market Cap is the average of the market capitalizations of the companies in the portfolio weighted by the size of each company’s position within the portfolio. Weighted Average Growth Rate is a measure of the rate at which a company’s earnings are expected to grow and is the average of the 3-5 year forecasted growth rates of each company in the portfolio, weighted by the size of the company’s position within the portfolio. Median P/B Value measures the median ratio of portfolio stock prices to each stock’s book value of equity per share. Book value is a company’s assets minus its liabilities. Weighted Harmonic Average P/E is the harmonic average, which measures the price/earnings ratio (a measure of how expensive a stock is) of the Fund, excluding negative earners, weighted by the size of the company’s position within the portfolio. The earnings figures used are estimates for the current calendar year.
79
SEVENTY-NINE
NOTES ON MANAGEMENT’S DISCUSSION OF FUND PERFORMANCE
Descriptions of Indices
Each Fund’s performance is compared in this report to changes in one or more indices, including in all cases a broad-based index of changes in prices of securities in the market in which the Fund invests. All of the indices are unmanaged and their returns include reinvested dividends. Unlike the Funds’ returns, the returns of each index do not include the payment of sales commissions or other expenses that would be incurred in the purchase or sale of the securities included in that index.
The indices to which the Funds are compared are:
Artisan International, Artisan International Small Cap and Artisan International Value Funds – Morgan Stanley Capital International EAFE® Index (MSCI EAFE®) is a market-weighted index of companies in developed markets, excluding the U.S. and Canada. MSCI EAFE’s average annual return since inception of the International Fund is based upon a starting date of December 31, 1995.
Artisan International Fund – Morgan Stanley Capital International EAFE® Growth Index (MSCI EAFE® Growth) is a market-weighted index of companies in developed markets, excluding the U.S. and Canada, with higher price-to-book ratios. MSCI EAFE Growth’s average annual return since inception of the International Fund is based upon a starting date of December 31, 1995.
Artisan International Small Cap Fund – Morgan Stanley Capital International EAFE® Small Cap Index (MSCI EAFE® Small Cap) is a market-weighted index of small companies in developed markets, excluding the U.S. and Canada.
Artisan International Value Fund – Morgan Stanley Capital International EAFE® Value Index (MSCI EAFE® Value) is a market-weighted index of companies in developed markets, excluding the U.S. and Canada, with lower price-to-book ratios.
Artisan Mid Cap Fund – Russell Midcap® Index is a market-weighted index of about 800 medium-sized U.S. companies. The Russell Midcap® Growth Index is a market-weighted index of those medium-sized companies included in the Russell Midcap® Index with higher price-to-book and higher forecasted growth values.
Artisan Mid Cap Value Fund – Russell Midcap® Index is a market-weighted index of about 800 medium-sized U.S. companies. The Russell Midcap® Value Index is a market-weighted index of those medium-sized companies included in the Russell Midcap® Index with lower price-to-book ratios and lower forecasted growth values.
Artisan Small Cap Fund – Russell 2000® Index is a market-weighted index of about 2,000 small U.S. companies. Russell 2000® Growth Index is a market-weighted index of those small companies included in the Russell 2000® Index with higher price-to-book ratios and higher forecasted growth values.
Artisan Small Cap Value Fund – Russell 2000® Index is a market-weighted index of about 2,000 small U.S. companies. The Russell 2000® Value Index is a market-weighted index of those small companies included in the Russell 2000® Index with lower price-to-book ratios and lower forecasted growth values.
80
EIGHTY
NOTES ON MANAGEMENT’S DISCUSSION OF FUND PERFORMANCE
Trademarks
Trademarks and copyrights relating to the indices and products of portfolio companies mentioned in this report are owned by their respective owners. Except as otherwise indicated, the trademarks, including names, logos, slogans and service marks appearing in this report are the property of the Adviser and may not be copied, reproduced, published or in any way used without written permission.
PROXY VOTING POLICIES AND PROCEDURES
You may obtain a description of Artisan Funds’ proxy voting policies and procedures, without charge, upon request by calling 800.344.1770. That information also is included in Artisan Funds’ statement of additional information, which is available on the Funds’ website at www.artisanfunds.com and the Securities and Exchange Commission’s website at www.sec.gov.
Information relating to how each Artisan Fund voted proxies relating to portfolio securities held during the twelve months ended June 30 is available on the Funds’ website at www.artisanfunds.com and on the Securities and Exchange Commission’s website at www.sec.gov.
INFORMATION ABOUT PORTFOLIO SECURITIES
Artisan Funds files a complete schedule of portfolio holdings with the Securities and Exchange Commission for the quarters ending December 31 and June 30 (the first and third quarters of the Funds’ fiscal year) on Form N-Q. The Funds’ Forms N-Q are available on the Securities and Exchange Commission’s website at www.sec.gov. You may also review and copy those documents by visiting the Securities and Exchange Commission’s Public Reference Room in Washington, D.C. Information on the operation of the Public Reference Room may be obtained by calling the Securities and Exchange Commission at 800.SEC.0330.
DIRECTORS AND OFFICERS
The Board of Directors has overall responsibility for the conduct of the affairs of Artisan Funds. Each director serves an indefinite term of unlimited duration until the next annual meeting of shareholders and until the election and qualification of his or her successor. The Board of Directors may fill any vacancy on the board provided that after such appointment at least two-thirds of the directors have been elected by the shareholders. The shareholders may remove a director by a vote of a majority of the outstanding shares of the Funds at any meeting of shareholders called for the purpose of removing such director.
The Board of Directors elects the officers of Artisan Funds. Each officer serves until the election and qualification of his or her successor, or until he or she sooner dies, resigns, or is removed or disqualified. The Board of Directors may remove any officer with or without cause at any time.
81
EIGHTY-ONE
DIRECTORS AND OFFICERS
The names and ages of the directors and officers as of November 15, 2005, the position each holds with the Funds, the date each was first elected to office, their principal business occupations and other directorships they have held during the last five years are shown below. Each director oversees all seven series of Artisan Funds.
| | | | | | | | |
| | | | | |
Name and Age at 11/15/05 | | Positions Held with Funds | | Date First Elected
or Appointed to Office | | Principal Occupations during Past 5 Years | | Other Directorships Held |
| Directors who are not “interested persons” |
| David A. Erne – 62 | | Director and Independent Chair of the Board of Directors | | Director since 3/27/95; Independent Chair since 2/4/05 | | Partner of the law firm Reinhart Boerner Van Deuren s.c., Milwaukee, WI | | Trustee, Northwestern Mutual Life Insurance Company (individual life insurance, disability insurance and annuity company) |
| Thomas R. Hefty – 58 | | Director | | 3/27/95 | | Retired; Adjunct Faculty, Department of Business and Economics, Ripon College; Of Counsel to the law firm Reinhart Boerner Van Deuren s.c., Milwaukee, WI.; until December 2002, Chairman of the Board and Chief Executive Officer of Cobalt Corporation (provider of managed care and specialty business services) | | None |
| Jeffrey A. Joerres – 45 | | Director | | 8/9/01 | | Chairman of the Board (since May 2001), President and Chief Executive Officer of Manpower Inc. (non-governmental employment service organization); formerly, Senior Vice President, European Operations and Global Account Management and Development of Manpower Inc. | | Director, Johnson Controls, Inc. (manufacturer of automotive systems and building controls) |
| Patrick S. Pittard – 59 | | Director | | 8/9/01 | | Distinguished Executive in Residence (teaching position), University of Georgia. Until November 2001, Chairman of the Board, President and Chief Executive Officer of Heidrick & Struggles International, Inc. (executive search firm) | | Director, Jefferson Pilot Corporation (individual and group life insurance and annuity company); Former Chairman of the Board, The University of Georgia Foundation; Member, Board of Regents of the University System of Georgia |
| Howard B. Witt – 65 | | Director | | 3/27/95 | | Retired; formerly, Chairman of the Board, President and Chief Executive Officer of Littelfuse, Inc. until December 2004 (manufacturer of advanced circuit protection devices) | | Director, Littelfuse, Inc.; Director, Franklin Electric Co., Inc. (manufacturer of electric motors) |
82
EIGHTY-TWO
DIRECTORS AND OFFICERS
| | | | | | | | |
| | | | | |
Name and Age at 11/15/05 | | Positions Held with Funds | | Date First Elected
or Appointed to Office | | Principal Occupations during Past 5 Years | | Other Directorships Held |
| Director who is an “interested person”* |
| Andrew A. Ziegler – 48 | | Director, President and Chief Executive Officer | | Director since 1/5/95; and Chairman of the Board 1/5/95 - 12/19/03; President since 12/19/03 (Chief Executive Officer continuously since 1/5/95) | | Managing Director of Artisan Partners; Chairman and President of Artisan Distributors; until December 2003, Chairman of Artisan Funds | | None |
| Officers of Artisan Funds |
| Lawrence A. Totsky – 46 | | Chief Financial Officer and Treasurer | | 1/22/98 | | Managing Director and Chief Financial Officer of Artisan Partners; Vice President, Chief Financial Officer and Treasurer of Artisan Distributors | | None |
| Janet D. Olsen – 49 | | General Counsel and Secretary | | 1/18/01 | | Managing Director and General Counsel of Artisan Partners; Vice President and Secretary of Artisan Distributors | | None |
| Brooke J. Billick – 51 | | Chief Compliance Officer | | 8/19/04 | | Chief Compliance Officer and Associate Counsel of Artisan Partners; Chief Compliance Officer of Artisan Distributors; prior to joining Artisan Partners in February 2004, Vice President, Securities Counsel and Corporate Secretary of Marshall & Ilsley Trust Company, N.A. (bank) and M&I Investment Management Corp. (investment adviser) and Chief Legal Officer and Secretary of Marshall Funds, Inc. (mutual fund company) | | None |
| Carlene M. Ziegler – 49 | | Vice President | | 3/27/95 | | Managing Director of Artisan Partners and Portfolio Co-Manager of Artisan Small Cap Fund; until February 2005, Director of Artisan Funds | | None |
| Michael C. Roos – 47 | | Vice President | | 12/19/03 | | Managing Director of Artisan Partners; Vice President of Artisan Distributors; until December 2003, President of Artisan Funds | | None |
| * | Mr. Ziegler is an “interested person” of Artisan Funds, as defined in the Investment Company Act of 1940, because he is a Managing Director of the Adviser and an officer and director of Artisan Investment Corporation (the general partner of the Adviser). Mr. Ziegler and Carlene M. Ziegler (who are married to each other) control the Adviser. Mr. Ziegler is also President of Artisan Distributors, Artisan Funds’ principal underwriter. |
83
EIGHTY-THREE
DIRECTORS AND OFFICERS
| | | | | | | | |
| | | | | |
Name and Age at 11/15/05 | | Positions Held with Funds | | Date First Elected
or Appointed to Office | | Principal Occupations during Past 5 Years | | Other Directorships Held |
| Gregory K. Ramirez – 35 | | Assistant Secretary and Assistant Treasurer | | 1/22/98 | | Managing Director, Client Accounting of Artisan Partners since January 2003, Director of Client Accounting and Administration from January 2000 to December 2002 and Controller of Artisan Partners prior thereto; Assistant Treasurer of Artisan Distributors | | None |
| Sarah A. Johnson – 33 | | Assistant Secretary | | 2/5/03 | | Associate Counsel of Artisan Partners; prior to joining Artisan Partners in July 2002, Associate of the law firm Bell, Boyd & Lloyd LLC, Chicago, IL | | None |
The business address of the director and officers affiliated with Artisan Partners is 875 E. Wisconsin Avenue, Suite 800, Milwaukee, Wisconsin 53202. The addresses of the other directors are: Mr. Erne – 1000 N. Water Street, Milwaukee, Wisconsin 53202; Mr. Hefty – W233 N2080 Ridgeview Parkway, Waukesha, Wisconsin 53188; Mr. Joerres – 5301 North Ironwood, Milwaukee, Wisconsin 53217; and Mr. Pittard and Mr. Witt – c/o Artisan Funds, 875 E. Wisconsin Avenue, Suite 800, Milwaukee, Wisconsin 53202.
Artisan Funds’ statement of additional information (SAI) contains further information about the directors. Please call 800.344.1770 or visit our website at www.artisanfunds.com for a free copy of the SAI.
84
EIGHTY-FOUR
| | | | |
 | | ARTISAN FUNDS P.O. BOX 8412 BOSTON, MA 02266-8412 800.344.1770 WWW.ARTISANFUNDS.COM | | |


ANNUAL
R E P O R T
SEPTEMBER 30, 2005
ARTISAN INTERNATIONAL FUND
ARTISAN MID CAP FUND

ARTISAN FUNDS, INC.
INSTITUTIONAL SHARES
TABLE OF CONTENTS
ARTISAN FUNDS
P.O. BOX 8412
BOSTON, MA 02266-8412
This report and the audited financial statements contained herein are provided for the general information of the shareholders of the Institutional Shares of Artisan International Fund and Artisan Mid Cap Fund. Investors should consider carefully before investing each Fund’s investment objective, risks and charges and expenses. For a prospectus, which contains that information and more information about each Fund, please call 800.399.1770. Read it carefully before you invest or send money.
Company discussions are for illustration only and are not intended as recommendations of individual stocks. The discussions present information about the companies believed to be accurate, and the views of the portfolio managers, as of September 30, 2005. That information and those views may change, and the Funds disclaim any obligation to advise shareholders of any such changes.
Artisan Funds offered through Artisan Distributors LLC, member NASD.
ARTISAN INTERNATIONAL FUND
INSTITUTIONAL SHARES
| | |
| HIGHLIGHTS | | |
• For the twelve months ended September 30, 2005, Artisan International Fund outperformed the MSCI EAFE® and MSCI EAFE® Growth indices. • The Fund benefited from the performance of its energy and financials stocks relative to both benchmarks. On a regional basis, the Fund received a strong relative contribution versus the benchmarks from its emerging markets holdings. | | • One area of weakness relative to the benchmarks for the Fund was the consumer discretionary sector. |
| | | |
| INVESTMENT APPROACH | | |
| We use a bottom-up investment process to construct a portfolio of international growth companies of all market capitalizations. The investment team conducts its own fundamental analysis with particular emphasis on: | | 1) well-managed companies focused on increasing shareholder value; 2) sustainable growth prospects; 3) reasonable valuations; or 4) dominant or increasing market shares or direct exposure to an identified theme. |
| | | |
| PERFORMANCE REVIEW | | |
| For the trailing one- and five-year periods and since the Fund’s Institutional Shares inception, Artisan International Fund has outpaced the MSCI EAFE® Growth Index. |
GROWTH OF AN ASSUMED $10,000 INVESTMENT (7/1/97 to 9/30/05)
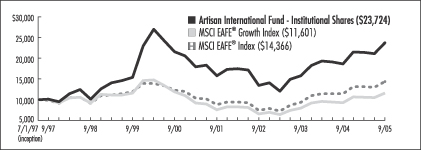
AVERAGE ANNUAL TOTAL RETURNS (as of 9/30/05)
| | | | | | | | | | | | |
| Fund / Index | | 1-Year | | | 3-Year | | | 5-Year | | | Since
Inception | |
Artisan International Fund - Institutional Shares | | 27.21 | % | | 20.74 | % | | 1.89 | % | | 11.04 | % |
MSCI EAFE® Growth Index | | 25.01 | | | 20.91 | | | -0.47 | | | 1.82 | |
MSCI EAFE® Index | | 25.79 | | | 24.61 | | | 3.16 | | | 4.49 | |
The performance quoted represents past performance, which does not guarantee future results. The investment return and principal value of an investment in the Fund will fluctuate, so that an investor’s shares in the Fund, when redeemed, may be worth more or less than their original cost. The inception date shown is the inception of the Fund’s Institutional Shares. Current performance may be lower or higher than the performance data quoted. For current to most recent month-end performance information or for performance information for periods before inception of the Fund’s Institutional Shares, call 800.399.1770. The graph and table above do not reflect the deduction of taxes that a shareholder would pay on distributions or sale of Fund shares. The performance shown does not reflect the deduction of a 2% redemption fee on shares held by an investor for 90 days or less and, if reflected, the fee would reduce the performance quoted. See page 36 for a description of each index.
1
ONE
INVESTING ENVIRONMENT
International equities had a strong performance run during our fiscal year ended September 30, 2005. In developed markets, a few of the leading gainers were Spain, Germany, France and Japan—each of which advanced over 25%. Japan was particularly strong late in the fiscal year as mounting evidence of renewed economic growth attracted equity investors. The U.K. and U.S. markets were among the weakest performers. The U.K. economy struggled with higher interest rates, inflation concerns and a soft housing market. Those same issues started to creep up in the U.S., though to a lesser degree.
Many sectors in the MSCI EAFE® Index turned in gains in excess of 20%. Even technology, which was the worst performing sector, advanced nearly 13%. The leading performers were energy and materials, which notched returns in excess of 37%.
The U.S. dollar, which was a large contributing factor to performance for U.S.-based international investors in recent periods, had a small negative impact on absolute returns for investors. Two items that remained consistent with recent periods were the outperformance of small-cap stocks compared to large-cap stocks and emerging markets stocks compared to developed market stocks. Value stocks outperformed growth stocks for the full period, but in the second half of our fiscal year growth stocks held a slight edge.
PERFORMANCE DISCUSSION
The Fund benefited from the performance of stocks in our financials and energy themes. Our stocks in the consumer discretionary sector were the primary source of relative weakness in the portfolio. Regionally, our emerging markets and Japanese holdings turned in good gains compared to the benchmarks, while our French and U.K. positions weighed on our relative results.
SECTOR REVIEW
We invest on a stock-by-stock basis, but most of the stocks we own fall into one of our identified global investment themes derived from our understanding of changes in demographics, technology, restructuring and outsourcing. Traditional definitions of sectors can play a powerful role in the performance of a stock in the short-term, but over the long-term we think that inflection points due to long-term structural changes can create investment opportunities. Our global themes attempt to capture these opportunities.
During the fiscal year, our global financials theme was the Fund’s largest contributor to performance. Within the theme, our Japanese and Korean stocks were among the leading gainers. In Japan, Credit Saison Co., Ltd. (a Japanese credit card issuer), Mizuho Financial Group, Inc. (Japan’s largest bank) and Orix Corp. (Japan’s top non-bank financing company based on operating assets) all recorded returns in excess of 40%, with a good portion of those returns coming late in the period. Credit Saison’s business profited from new cardholder growth and growing shopping and cash advance volumes. Mizuho benefited from a mandate won by Prime Minister Koizumi to break up and sell Japan’s postal system, which is really a diversified financial services company that holds $3 trillion worth of individuals’ financial assets. Orix benefited from increased real estate sales and a strong increase in earnings. Two stocks in Japan that lagged were consumer finance company Promise Co., Ltd. and brokerage firm Nomura Holdings, Inc. We sold our positions in both stocks.
TOP 10 HOLDINGS
| | | | | |
| Company Name | | Country | | 9/30/05 | |
Credit Saison Co., Ltd. | | Japan | | 3.4 | % |
China Mobile (Hong Kong) Limited | | China | | 3.2 | |
Telefonaktiebolaget LM Ericsson | | Sweden | | 3.2 | |
UBS AG | | Switzerland | | 3.1 | |
Sega Sammy Holdings, Inc. | | Japan | | 3.0 | |
Fortis | | Netherlands | | 2.9 | |
LUKOIL | | Russia | | 2.8 | |
Nestle S.A. | | Switzerland | | 2.4 | |
Mizuho Financial Group, Inc. | | Japan | | 2.3 | |
EnCana Corporation | | Canada | | 2.2 | |
Total | | | | 28.5 | % |
As a percentage of total net assets. Top 10 Holdings are determined by issuer.
Korean banks Kookmin Bank, Hana Bank and Shinhan Financial Group Co., Ltd. were our leading performers in that country. All three companies delivered on positive expectations
2
TWO
for earnings growth. In addition, net interest margins improved and default ratios fell, which helped the banks reduce bad debt provisions. Other winners in our global financials theme, with their countries noted in parentheses, included Julius Baer Holding, Ltd. (Switzerland), Allianz AG (Germany), Commerzbank AG (Germany) and Fortis (Netherlands).
The investments in our energy theme were based on our assessment that the long-term imbalance between demand for energy, in particular oil, and the worldwide supply creates the potential for sustainable growth. Demand continued to grow, as emerging countries such as China continued to become major consumers and industry infrastructure continued to be under pressure due to a decade long period of under-investment. Our energy theme investments were limited because of concerns about valuation.
During the fiscal year, our average energy stock outgained those in both benchmarks, resulting in a strong performance contribution. Three of the leading contributors to performance were Canadian natural gas company EnCana Corporation, Russian oil producer LUKOIL and Italian oil services company Saipem S.p.A. EnCana’s share price more than doubled, LUKOIL increased over 80% and Saipem moved more than 50% higher. Among the factors that influenced EnCana’s appreciation were the announced sale of its natural gas storage business and positive expectations for earnings growth as oil and natural gas prices remained at historically high levels. LUKOIL reported a substantial increase in profits, and like EnCana, was expected to produce solid earnings growth in the future. Saipem benefited from strong demand for rigs, which led to a pick up in rig utilization, driving better pricing.
Across the rest of our themes there were two strong individual gainers of note. China Mobile (Hong Kong) Limited, the world’s largest mobile phone company by number of users, reported a strong increase in profits, which was partly driven by a surge in subscriber numbers and growth in wireless data, such as picture messages and ring tones. Roche Holding AG, which has strong franchises in oncology, virology and infectious diseases, released solid financial results as earnings growth was driven by good sales growth in pharmaceuticals. Roche is the world’s largest maker of diagnostic tests, owns more than 50% of U.S.-based biotechnology company Genentech, Inc. and expected future growth in sales of several of its drugs.
SECTOR DIVERSIFICATION
| | | | | | |
| Sector | | 9/30/04 | | | 9/30/05 | |
Consumer Discretionary | | 23.9 | % | | 23.6 | % |
Consumer Staples | | 11.9 | | | 9.8 | |
Energy | | 8.2 | | | 8.7 | |
Financials | | 26.8 | | | 30.4 | |
Healthcare | | 4.5 | | | 4.1 | |
Industrials | | 4.7 | | | 8.0 | |
Information Technology | | 6.4 | | | 6.8 | |
Materials | | 4.8 | | | — | |
Telecommunication Services | | 6.9 | | | 6.1 | |
Utilities | | 0.7 | | | 1.2 | |
Other assets less liabilities | | 1.2 | | | 1.3 | |
Total | | 100.0 | % | | 100.0 | % |
As a percentage of total net assets.
Collectively our consumer discretionary stocks moved higher, but as a group they trailed the returns of the indices. A good portion of the Fund’s relative weakness in the sector stemmed from the underperformance of stocks in our media theme. One of our best performers in the theme was Grupo Televisa S.A., the largest media company in the Spanish-speaking world. Its gain was due in part to a solid increase in earnings due to higher revenues from its satellite television unit. Two of our weaker stocks were British broadcasting company ITV PLC and French outdoor advertiser JC Decaux S.A. ITV was negatively impacted by concerns related to its loss of audience share and the potential for weaker revenues in the future. We significantly pared back our holdings. A key factor in JC Decaux’s decline was the failure to win a contract with New York City (offset partially by a contract win in Kobe, Japan) and softer advertising conditions in France.
Our worst individual performer in the consumer discretionary sector was home
3
THREE
improvement retailer Kingfisher PLC. It has struggled due to the considerable strain on the consumer in its core U.K. market.
In the consumer staples sector, Wal-Mart de Mexico S.A. de C.V. (Walmex), Latin America’s largest retailer, partially offset those losses by posting a solid gain. Walmex’s sales were better than those of its competitors, it gained market share and it demonstrated an ability to successfully adapt new formats to its geographic and demographic environment.
COUNTRY REVIEW
Economic growth around the globe was generally healthy during the fiscal year, but the pace slowed in many economies and expectations were for additional cooling. Nevertheless, returns for most international markets were strong. We benefited from the strength of our holdings in Japan and in emerging markets.
In Japan, deflation was still a concern during the fiscal year, but it appeared that the government was taking the right steps to sustain economic growth. Consumer spending improved during the year, investment spending was strong and corporate profit margins rose. Plus, for the first time since 1991, economic expansion in Japan was being fueled by consumer and capital spending versus exports and the government. The combination of these effects supported equity prices in our Japanese financials as well as other holdings in Japan such as Sega Sammy Holdings, Inc. and Mitsubishi Corp.
South Korea, Mexico and Russia turned in eye-popping gains in excess of 57%, 64% and 56%, respectively, and were among the best performing emerging markets. In the portfolio, we participated in those gains with our Korean banks, Walmex and Grupo Televisa (Mexico) and LUKOIL (Russia).
REGION ALLOCATION
| | | | | | |
| Region | | 9/30/04 | | | 9/30/05 | |
Europe | | 65.6 | % | | 58.2 | % |
Asia/Pacific | | 25.0 | | | 33.7 | |
Latin America | | 5.3 | | | 3.6 | |
North America | | 2.9 | | | 3.2 | |
As a percentage of total net assets.
TOP 5 COUNTRY ALLOCATIONS
| | | |
| Country | | 9/30/05 | |
Japan | | 21.0 | % |
Germany | | 8.9 | |
United Kingdom | | 8.7 | |
Switzerland | | 8.5 | |
France | | 7.2 | |
As a percentage of total net assets.
FUND CHANGES
We had a fair amount of transaction activity, as represented by new buys and sales, during the fiscal year. As always, our decisions were based on our bottom-up fundamental research. Outside of an increase in our global financials theme early in the fiscal year, there were no specific trends worth noting across sectors. Regionally, the combined effect of our transactions was an increase in emerging markets and a reduction in Europe. We continue to find value in European companies, but the opportunities we found elsewhere were greater. The majority of the increase in emerging markets was due to our previously mentioned investments in Korean banks.
Our largest purchases during the fiscal year included Mitsubishi Corp. (a Japanese general trading company), Jupiter Telecommunications Co., Ltd. (a Japanese cable television provider), Commerzbank AG (a German bank), Banco Comercial Portugues, S.A. (a Portugese bank), Deutsche Post AG (a German retail banker and postal service company), Bayerische Hypo-und Vereinsbank AG (a German bank), Novartis AG (a Swiss pharmaceutical company) and PPR S.A. (a French retailer).
In addition to those already noted, we funded the purchases of those stocks through the sales of Credit Suisse Group, Telefonica, S.A., Clariant AG, Cesky Telecom, A.S., Telenor ASA, Nikko Cordial Corp. and The Bank of Yokohama, Ltd., among others.
FUND STATISTICS
| | | |
Net Assets | | $ 11.7 billion | |
Number of Holdings | | 99 | |
Weighted Average Market Cap | | $ 35.9 billion | |
Weighted Average Growth Rate (3-5 yr) | | 11.0 | % |
Weighted Harmonic Average P/E (2005E) | | 16.1X | |
Source: FactSet/Artisan Partners. All statistics are as of 9/30/05. Net Assets includes Investor Shares and Institutional Shares.
4
FOUR
ARTISAN MID CAP FUND
INSTITUTIONAL SHARES
| | |
| HIGHLIGHTS | | |
• For the twelve months ended September 30, 2005, Artisan Mid Cap Fund trailed the Russell Midcap® and the Russell Midcap® Growth indices. • The technology and healthcare sectors were the Fund’s largest positive return contributors. | | • Two sources of weakness versus the benchmarks were the Fund’s low investment in the utilities and energy (particularly crude producers) sectors and weak security selection in the financials sector. |
| | | |
| INVESTMENT APPROACH | | |
| We use a bottom-up investment process to identify well-managed mid-sized companies whose growth and profit potential are not yet fully recognized by investors. Specifically, we spend most of our time answering three questions about a company before we will invest in it: | | 1) Does the company exhibit franchise characteristics? 2) Is the company positioned for long-term growth and at an early stage in its profit cycle? 3) Is the stock of the company trading at a reasonable discount to our estimate of its private market value? |
| | | |
| PERFORMANCE REVIEW | | |
| Artisan Mid Cap Fund has outperformed the Russell Midcap® Growth index on an annualized basis since the Fund’s Institutional Shares inception. |
GROWTH OF AN ASSUMED $10,000 INVESTMENT (7/1/00 to 9/30/05)
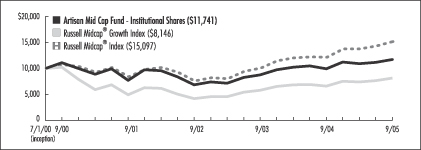
AVERAGE ANNUAL TOTAL RETURNS (as of 9/30/05)
| | | | | | | | | | | | |
| Fund / Index | | 1-Year | | | 3-Year | | | 5-Year | | | Since
Inception | |
Artisan Mid Cap Fund - Institutional Shares | | 18.35 | % | | 19.64 | % | | 1.10 | % | | 3.10 | % |
Russell Midcap® Growth Index | | 23.47 | | | 24.92 | | | -4.50 | | | -3.83 | |
Russell Midcap® Index | | 25.10 | | | 25.99 | | | 7.17 | | | 8.16 | |
The performance quoted represents past performance, which does not guarantee future results. The investment return and principal value of an investment in the Fund will fluctuate, so that an investor’s shares in the Fund, when redeemed, may be worth more or less than their original cost. The inception date shown is the inception of the Fund’s Institutional Shares. Current performance may be lower or higher than the performance data quoted. For current to most recent month-end performance information or for performance information for periods before inception of the Fund’s Institutional Shares, call 800.399.1770. The graph and table above do not reflect the deduction of taxes that a shareholder would pay on distributions or sale of Fund shares. See page 36 for a description of each index.
5
FIVE
INVESTING ENVIRONMENT
Mid-cap stocks held a wide advantage when compared to small- and large-cap stocks during our fiscal year. Within the mid-cap space, value stocks were preferred to growth. All major sectors within the Russell Midcap® and Russell Midcap® Growth indices recorded double-digit advances, but energy stocks were significantly ahead of most. The other sectors that performed well were technology, healthcare and utilities.
It was interesting to see technology and healthcare outperform when growth stocks generally seemed to be out of favor (they both carried a large weight in the Russell Midcap® Growth Index). Utilities likely outperformed as a result of persistently low long-term interest rates, despite the series of short-term interest rate hikes by the Federal Reserve during our fiscal year. Excluding technology, other traditionally cyclical sectors such as materials, producer durables, transportation and consumer discretionary were among the list of laggards. The consumer discretionary sector was under the most strain late in our fiscal year as a combination of record high gasoline prices, a softening housing sector and the threat of huge increases in home heating bills during the coming winter seemed to put a damper on discretionary spending.
PERFORMANCE DISCUSSION
The Fund generated a solid absolute return, but trailed the benchmark indices for the fiscal year ended September 30, 2005. The healthcare and technology sectors were the largest contributors to the Fund’s return. The portfolio also had several notable positive performers from a variety of other sectors. The performance of our financial stocks and our low weight in utilities and energy stocks (particularly crude producers) were key reasons for our underperformance versus the Russell Midcap® and Russell Midcap® Growth indices.
Arguably the largest shift in demographics that will be occurring over the coming years and decades is the retirement of baby boomers. We have used our thoughts about “Shifting Demographics” to focus our research on finding the companies that we believed were best positioned to benefit from the long-term cost burdens that we thought would be placed on the U.S. healthcare system by aging baby boomers. Examples include demand for pharmaceuticals (Allergan, Inc.), benefit management services (Aetna Inc., Caremark Rx, Inc. and Coventry Health Care, Inc.) and automation tools (Cerner Corporation). During our fiscal year, all five of those stocks generated strong absolute returns.
TOP 10 HOLDINGS
| | |
| Company Name | | 9/30/05 |
Constellation Brands, Inc. | | 2.8% |
Smith International, Inc. | | 2.7 |
Danaher Corporation | | 2.2 |
Precision Castparts Corp. | | 2.2 |
ITT Industries, Inc. | | 2.2 |
Allergan, Inc. | | 2.1 |
Varian Medical Systems, Inc. | | 2.0 |
Coventry Health Care, Inc. | | 1.8 |
Ecolab Inc. | | 1.7 |
Juniper Networks, Inc. | | 1.7 |
Total | | 21.4% |
As a percentage of total net assets. Top 10 Holdings are determined by issuer.
Allergan, Inc. benefited from the strength of its Botox® franchise. Botox is primarily known as an anti-wrinkle treatment, but it is also used to treat eye crossing, severe muscle and neck contractions, uncontrollable eye blinking, and excessive sweating, and may have application for headaches and bladder disorders. Aetna, Caremark and Coventry Health Care all released good financial results during our fiscal year. In addition, Aetna announced an acquisition that was expected to enhance earnings and showed good growth in enrollment; Caremark used its strong balance sheet to fund share buybacks and started to realize the true earnings potential of its AdvancePCS merger; and Coventry was on track with the integration of its recently acquired First Health business. Cerner illustrated the strength of its hospital systems automation profit cycle by announcing increases in bookings, earnings and guidance.
In the technology sector, the largest contributor to our performance was Broadcom Corporation, a leading developer of integrated circuits that enable the connectivity of voice, video and data to the consumer and business enterprise. It advanced over 70%. During the fiscal year, Broadcom demonstrated the strength of its
6
SIX
profit cycle by reporting sales results well ahead of expectations as several product lines (Bluetooth®, WiFi and personal video recorders) posted strong gains.
Other winners in the sector included Marvell Technology Group Ltd., which makes semiconductors, Macromedia, Inc., which develops software tools for the delivery of content across the Internet, and Corning Incorporated, a global technology company that derives the majority of its earnings from display technologies, such as liquid crystal displays (LCDs). Marvell benefited from solid earnings and a favorable outlook based on its increased focus on consumer applications, including hard disk drives and wireless LAN. Macromedia received a premium acquisition offer from Adobe Systems Incorporated, another portfolio holding. Corning has a technological edge over its competitors and benefited from solid LCD sales volumes. NCR Corporation, the world’s largest maker of ATM’s, was one laggard in the sector. It declined in part due to news that CEO Mark Hurd would be leaving to become CEO of Hewlett-Packard Company.
FUND STATISTICS
| | | |
Net Assets | | $ 5.9 billion | |
Number of Holdings | | 100 | |
Median Market Cap | | $ 6.7 billion | |
Weighted Average Market Cap | | $ 9.7 billion | |
Weighted Average Growth Rate (3-5 yr) | | 17.4 | % |
Weighted Harmonic Average P/E (2005E) | | 22.8X | |
Source: FactSet/Artisan Partners. All statistics are as of 9/30/05. Net assets includes Investor Shares and Institutional Shares.
Across the rest of the portfolio a few standout performers were Constellation Brands, Inc., Precision Castparts Corp. and Chico’s FAS, Inc.—all were top twenty holdings as of September 30, 2005.
| • | | Constellation Brands, Inc. is the world’s largest winemaker. It announced several acquisitions during our fiscal year, but the most notable was probably Robert Mondavi Corp. That acquisition closed in the first half of our fiscal year and results reported in the second half showed that it helped the company improve earnings and profitability. |
| • | | Precision Castparts Corp. is a worldwide manufacturer of complex metal components and castings serving the aerospace and industrial gas turbine markets. It announced a strong increase in sales and earnings. In addition, Precision gained market share and announced that it agreed to buy a maker of nickel-based alloys. The deal allowed the company to vertically integrate its forging business, which had the potential to result in significant margin expansion. |
| • | | Chico’s FAS, Inc. is a specialty retailer of women’s apparel targeting middle-aged women. It continued to benefit from its brand position with women baby boomers, which translated into strong organic sales growth, and from the growth of its White House Black Market concept. |
One of our weakest performers in the financials sector was student loan outsourcer The First Marblehead Corporation. Its shares were under pressure as one of its customers indicated that it would start marketing a private student loan product of its own. CapitalSource Inc., a lender to small and medium-sized businesses, Willis Group Holdings Limited, an insurance broker, and MGIC Investment Corporation, the U.S.’s leading provider of private mortgage insurance, also underperformed. CapitalSource was negatively impacted by some concerns about certain credit quality metrics. Willis Group reported weak earnings stemming from a regulatory settlement and related costs. These were a result of the company’s transition, with the rest of the industry, to a more transparent revenue model after the increased regulatory scrutiny of the industry. MGIC’s shares were under pressure due to the continued use of piggyback home equity loans, which negate the need for private mortgage insurance. We kept all three positions.
The global supply/demand imbalance, geopolitical uncertainty and speculation all contributed to record prices for crude oil and corresponding price appreciation for crude oil producers, which advanced more than 80% in our benchmarks during the fiscal year. We understood these trends, but crude producers did not meet the fundamental standards of our process. We seek out companies that possess franchise characteristics, such as a proprietary asset, a defensible brand or cost or market share advantages. By definition, commodity-driven earnings streams do not possess any of these traits. Because they did not meet the standards of our investment process, we had a
7
SEVEN
relatively low weight in crude producers, which weighed on performance compared to the Russell Midcap® and Russell Midcap® Growth indices.
Longer term, we believed that the growing demand for energy would have an impact that extended beyond the price of crude. Accordingly, we invested in service companies or what we defined as “infrastructure” providers. Examples include Smith International, Inc., Cooper Cameron Corporation, Noble Corporation, Kinder Morgan, Inc., Joy Global Inc. and McDermott International, Inc. We anticipated a lengthy cycle of renewed spending, aimed at increasing the capacity of traditional energy sources as well as developing alternatives. In fact, in the third quarter, Congress passed an energy bill that created incentives for such spending here in the United States.
FUND CHANGES
Our largest positions are those companies where our conviction is highest and throughout our fiscal year we took the opportunity to focus capital in the portfolio when opportunities presented themselves. Our top 10 holdings as a percentage of portfolio
SECTOR DIVERSIFICATION
| | | | | | |
| Sector | | 9/30/04 | | | 9/30/05 | |
Auto & Transportation | | 4.0 | % | | 0.9 | % |
Consumer Discretionary | | 24.9 | | | 17.8 | |
Consumer Staples | | 2.1 | | | 2.8 | |
Financial Services | | 10.3 | | | 11.3 | |
Healthcare | | 16.6 | | | 19.6 | |
Integrated Oils | | — | | | — | |
Materials & Processing | | 8.1 | | | 7.0 | |
Other | | 2.4 | | | 3.8 | |
Other Energy | | 5.0 | | | 6.8 | |
Producer Durables | | 8.1 | | | 6.7 | |
Technology | | 14.9 | | | 19.0 | |
Utilities | | 0.9 | | | 1.7 | |
Other assets less liabilities | | 2.7 | | | 2.6 | |
Total | | 100.0 | % | | 100.0 | % |
As a percentage of total net assets.
assets increased from 14% of the portfolio as of September 30, 2004 to 21% as of September 30, 2005. Over that same period, our top 20 holdings increased from 27% to nearly 37% of portfolio assets.
The largest change in our sector weights during the fiscal year was a reduction in consumer discretionary. It fell from about 25% of portfolio assets to approximately 18%. We believed that companies sensitive to consumer spending were facing headwinds, which put pressure on their ability to accelerate profits (a key tenet of our process). The waning effects of fiscal stimuli, an extended series of interest rate hikes by the Federal Reserve and the impact of record high gasoline prices were among the factors that were clearly starting to create strain on the consumer.
The retail industry was the group within the consumer discretionary sector to experience the most selling activity. Of the stocks we held at the beginning of the fiscal year, we sold American Eagle Outfitters, Inc., CarMax, Inc., Nordstrom, Inc., Staples, Inc., Ross Stores, Inc., Bed Bath & Beyond Inc., CDW Corporation, Costco Wholesale Corporation and Linens ‘n Things, Inc. We bought three securities in the retail industry during the fiscal year. Of those three, the only security we held at the end of the fiscal year was office supplies retailer Office Depot, Inc. Other recent sales of note in the consumer discretionary sector included Lamar Advertising Company, Univision Communications Inc. and Corinthian Colleges, Inc.
Our weight in the healthcare sector increased, which partially offset the drop in our consumer discretionary weight. The purchases we made in healthcare included Genzyme Corporation (one of the largest U.S. biotechnology companies), AmerisourceBergen Corporation (the third largest U.S. drug wholesaler), St. Jude Medical, Inc. (a maker of implantable cardiac defibrillators) and the previously mentioned Coventry Health Care. The largest sale in the sector was Boston Scientific Corporation.
8
EIGHT
ARTISAN INTERNATIONAL FUND
Schedule of Investments – September 30, 2005
| | | | | |
| | | Shares
Held
| | Value
|
COMMON AND
PREFERRED STOCKS - 98.7% | | | | | |
| | | | | | |
| AUSTRALIA - 0.2% | | | | | |
Publishing & Broadcasting Limited | | 1,601,320 | | $ | 20,124,833 |
| | | | | | |
| BELGIUM - 1.4% | | | | | |
InBev NV | | 4,110,649 | | | 162,587,941 |
| | | | | | |
| BRAZIL - 0.5% | | | | | |
Companhia Brasileira de Distribuicao Grupo Pao de Acucar, Preferred (ADR) | | 161,200 | | | 4,653,844 |
Telesp Celular Participacoes S.A., Preferred (ADR)(1) | | 13,653,068 | | | 53,383,496 |
| | | | |
|
|
| | | | | | 58,037,340 |
| CANADA - 3.2% | | | | | |
Corus Entertainment, Inc., Class B | | 1,398,750 | | | 40,476,516 |
EnCana Corporation | | 4,318,000 | | | 252,022,624 |
Nortel Networks Corporation(1) | | 26,610,501 | | | 86,750,233 |
| | | | |
|
|
| | | | | | 379,249,373 |
| CHINA - 3.9% | | | | | |
China Merchants Holdings International Company Limited | | 11,590,000 | | | 25,847,358 |
China Mobile (Hong Kong) Limited | | 76,729,300 | | | 376,359,177 |
China Unicom Limited | | 32,332,100 | | | 26,883,155 |
Citic Pacific Limited | | 5,388,550 | | | 15,073,644 |
Cosco Pacific Limited | | 8,576,000 | | | 16,693,536 |
| | | | |
|
|
| | | | | | 460,856,870 |
| DENMARK - 0.6% | | | | | |
Novo Nordisk A/S, Class B | | 1,334,950 | | | 66,003,084 |
Vestas Wind Systems A/S(1) | | 315,000 | | | 7,609,615 |
| | | | |
|
|
| | | | | | 73,612,699 |
| FRANCE - 7.2% | | | | | |
Accor S.A. | | 902,153 | | | 45,560,271 |
Axa | | 2,270,859 | | | 62,335,625 |
Carrefour S.A. | | 3,263,776 | | | 150,155,874 |
JC Decaux S.A.(1) | | 5,910,029 | | | 130,410,434 |
LVMH Moet Hennessy Louis Vuitton S.A. | | 1,464,800 | | | 120,768,174 |
M6 Metropole Television | | 571,795 | | | 14,438,313 |
PagesJaunes S.A. | | 4,330,398 | | | 118,141,838 |
PPR S.A. | | 1,143,411 | | | 119,968,344 |
Vivendi Universal S.A. | | 2,279,316 | | | 74,401,957 |
| | | | |
|
|
| | | | | | 836,180,830 |
| | | | | |
| | | Shares
Held
| | Value
|
| GERMANY - 8.9% | | | | | |
Allianz AG | | 1,068,600 | | $ | 144,277,844 |
Bayerische Hypo-und Vereinsbank AG(1) | | 5,055,414 | | | 142,417,838 |
Commerzbank AG | | 5,582,774 | | | 152,309,137 |
Deutsche Post AG | | 6,112,354 | | | 142,955,671 |
E.ON AG | | 1,218,904 | | | 111,965,291 |
Heidelberger Druckmaschinen AG | | 840,936 | | | 28,814,442 |
ProSiebenSat.1 Media AG, Preferred | | 7,157,870 | | | 123,706,564 |
RWE AG | | 415,584 | | | 27,495,790 |
SAP AG | | 323,700 | | | 55,943,758 |
Siemens AG | | 1,419,679 | | | 109,370,007 |
| | | | |
|
|
| | | | | | 1,039,256,342 |
| | | | |
| HONG KONG - 1.7% | | | | |
Cheung Kong (Holdings) Limited | | 5,300,900 | | 59,860,499 |
MTR Corporation Limited | | 18,335,800 | | 38,173,238 |
Sun Hung Kai Properties Limited | | 9,566,400 | | 98,964,672 |
| | | | |
|
| | | | | 196,998,409 |
| ITALY - 4.2% | | | | |
Assicurazioni Generali S.p.A | | 4,473,345 | | 141,073,772 |
Eni S.p.A. | | 4,673,717 | | 138,798,640 |
Saipem S.p.A. | | 12,167,694 | | 205,171,013 |
| | | | |
|
| | | | | 485,043,425 |
| JAPAN - 21.0% | | | | |
Aeon Co., Ltd. | | 278,100 | | 5,585,518 |
Bridgestone Corp. | | 2,839,000 | | 60,771,406 |
Chugai Pharmaceutical Co., Ltd. | | 2,795,000 | | 53,304,924 |
Credit Saison Co., Ltd.(2) | | 8,952,300 | | 392,727,748 |
Honda Motor Co., Ltd. | | 3,330,100 | | 188,330,180 |
Japan Tobacco, Inc. | | 5,907 | | 93,142,442 |
Jupiter Telecommunications Co., Ltd.(1) | | 185,738 | | 160,508,261 |
Keyence Corp. | | 391,950 | | 98,539,931 |
Mitsubishi Corp. | | 11,299,500 | | 222,964,059 |
Mitsubishi Estate Co., Ltd. | | 1,598,000 | | 21,931,677 |
Mitsui & Co., Ltd. | | 3,125,000 | | 39,117,556 |
Mitsui Fudosan Co., Ltd. | | 1,324,000 | | 19,908,985 |
Mizuho Financial Group, Inc. | | 41,415 | | 263,404,070 |
Orix Corp. | | 1,371,400 | | 247,654,158 |
Sega Sammy Holdings, Inc. | | 4,473,800 | | 176,555,884 |
Sega Sammy Holdings, Inc. - When Issued(1)(3) | | 4,473,800 | | 173,403,101 |
SMC Corp. | | 746,600 | | 99,375,669 |
The Sumitomo Trust & Banking Co., Ltd. | | 16,393,500 | | 134,879,572 |
| | | | |
|
| | | | | 2,452,105,141 |
9
NINE
| | | | | |
| | | Shares
Held
| | Value
|
| LUXEMBOURG - 0.5% | | | | | |
RTL Group | | 772,286 | | $ | 59,681,426 |
| | | | | | |
| MEXICO - 3.1% | | | | | |
Grupo Televisa S.A. (ADR) | | 2,993,400 | | | 214,656,714 |
Wal-Mart de Mexico S.A. de C.V., Series V | | 27,914,700 | | | 142,077,701 |
| | | | |
|
|
| | | | | | 356,734,415 |
| NETHERLANDS - 5.7% | | | | | |
ASML Holding N.V.(1) | | 9,755,765 | | | 160,162,959 |
ASML Holding N.V., NY Shares(1) | | 1,734,100 | | | 28,629,991 |
Fortis | | 11,552,091 | | | 333,907,163 |
ING Groep N.V. | | 4,978,812 | | | 148,278,124 |
| | | | |
|
|
| | | | | | 670,978,237 |
| NORWAY - 0.8% | | | | | |
Aker ASA, A Shares(1) | | 22,800 | | | 678,618 |
Stolt Offshore S.A.(1) | | 7,851,500 | | | 90,780,216 |
| | | | |
|
|
| | | | | | 91,458,834 |
| PORTUGAL - 1.3% | | | | | |
Banco Comercial Portugues, S.A. | | 54,162,939 | | | 150,371,058 |
| | | | | | |
| RUSSIA - 3.4% | | | | | |
AFK Sistema (GDR)(4) | | 3,059,462 | | | 74,956,819 |
LUKOIL (ADR) | | 5,617,912 | | | 324,827,672 |
| | | | |
|
|
| | | | | | 399,784,491 |
| SINGAPORE - 2.5% | | | | | |
DBS Group Holdings Limited | | 669,645 | | | 6,253,001 |
Keppel Corporation Limited | | 9,560,500 | | | 71,758,134 |
Singapore Airlines Limited | | 16,865,300 | | | 115,621,571 |
Singapore Telecommunications Limited | | 66,787,970 | | | 96,705,491 |
| | | | |
|
|
| | | | | | 290,338,197 |
| SOUTH KOREA - 3.7% | | | | | |
Hana Bank | | 2,864,480 | | | 105,685,175 |
Kookmin Bank | | 3,687,935 | | | 217,353,141 |
Kookmin Bank (ADR) | | 72,600 | | | 4,301,550 |
Shinhan Financial Group Co., Ltd. | | 3,155,040 | | | 109,753,667 |
| | | | |
|
|
| | | | | | 437,093,533 |
| | | | | |
| | | Shares
Held
| | Value
|
| SPAIN - 3.8% | | | | | |
Banco Bilbao Vizcaya Argentaria, S.A. | | 7,290,603 | | $ | 127,840,598 |
Banco Santander Central Hispano, S.A. | | 7,145,800 | | | 93,868,758 |
Industria de Diseno Textil, S.A. | | 2,646,813 | | | 77,681,745 |
Promotora de Informaciones, S.A. | | 7,320,664 | | | 141,213,288 |
| | | | |
|
|
| | | | | | 440,604,389 |
| SWEDEN - 3.2% | | | | | |
Telefonaktiebolaget LM Ericsson (ADR) | | 4,222,150 | | | 155,544,006 |
Telefonaktiebolaget LM Ericsson, Class B | | 59,195,100 | | | 216,041,904 |
| | | | |
|
|
| | | | | | 371,585,910 |
| SWITZERLAND - 8.5% | | | | | |
Nestle S.A. | | 955,414 | | | 279,712,569 |
Nobel Biocare Holding AG | | 59,774 | | | 14,082,940 |
Novartis AG | | 2,558,895 | | | 129,768,226 |
Roche Holding AG | | 1,408,119 | | | 195,573,594 |
| | | | |
Swiss Re | | 175,545 | | 11,526,264 |
UBS AG | | 4,226,175 | | 359,104,901 |
| | | | |
|
| | | | | 989,768,494 |
| TAIWAN - 0.7% | | | | |
Chunghwa Telecom Co., Ltd. (ADR) | | 4,493,800 | | 83,180,238 |
| | | | | |
| UNITED KINGDOM - 8.7% | | | | |
British Sky Broadcasting Group PLC | | 21,025,757 | | 207,862,607 |
Cadbury Schweppes PLC | | 5,815,210 | | 58,669,251 |
Carnival PLC | | 1,339,478 | | 69,246,929 |
Hilton Group PLC | | 2,992,741 | | 16,601,178 |
ITV PLC | | 93,423,477 | | 186,201,675 |
Kingfisher PLC | | 56,463,834 | | 215,116,255 |
Smith & Nephew PLC | | 2,568,962 | | 21,568,192 |
Tesco PLC | | 25,283,895 | | 138,023,725 |
William Morrison Supermarkets PLC | | 33,704,047 | | 105,667,340 |
| | | | |
|
| | | | | 1,018,957,152 |
| | | | |
|
Total common and preferred stocks
(Cost $8,718,905,170) | | | | 11,524,589,577 |
| | | | |
|
10
TEN
| | | | | | |
| | | Par
Amount
| | Value
|
| SHORT-TERM INVESTMENTS (CASH EQUIVALENTS) - 0.4% | | | | | | |
Repurchase agreement with State Street Bank and Trust Company, 3.50%, dated 9/30/05, due 10/3/05, maturity value $42,468,383, collateralized by $43,308,257 market value Federal National Mortgage Association Note,
3.25%, due 8/15/08
(Cost $42,456,000) | | $ | 42,456,000 | | $ | 42,456,000 |
| | | | | |
|
|
| | | | | | | |
Total investments - 99.1%
(Cost $8,761,361,170) | | | | | | 11,567,045,577 |
| | | | | | | |
Other assets less liabilities - 0.9% | | | | | | 107,953,990 |
| | | | | |
|
|
| | | | | | | |
Total net assets - 100.0%(5) | | | | | $ | 11,674,999,567 |
| | | | | |
|
|
| (1) | Non-income producing security. |
| (2) | Affiliated company as defined by the Investment Company Act of 1940. See Note (6) in Notes to Financial Statements. |
| (3) | The issuer distributed in a corporate action one bonus share for every ordinary share held on record date. |
| (4) | Valued at a fair value in accordance with procedures established by the Board of Directors of Artisan Funds. In total, securities valued at a fair value were $74,956,819 or 0.6% of total net assets. |
| (5) | Percentages for the various classifications relate to total net assets. |
(ADR) American Depository Receipt
(GDR) Global Depository Receipt
| | | | | | |
| PORTFOLIO DIVERSIFICATION - SEPTEMBER 30, 2005 | |
| | | Value
| | Percentage
| |
Consumer Discretionary | | $ | 2,755,827,891 | | 23.6 | % |
Consumer Staples | | | 1,140,276,204 | | 9.8 | |
Energy | | | 1,012,278,783 | | 8.7 | |
Financials | | | 3,549,988,998 | | 30.4 | |
Healthcare | | | 480,300,960 | | 4.1 | |
Industrials | | | 933,374,501 | | 8.0 | |
Information Technology | | | 801,612,782 | | 6.8 | |
Materials | | | — | | — | |
Telecommunication Services | | | 711,468,377 | | 6.1 | |
Utilities | | | 139,461,081 | | 1.2 | |
| | |
|
| |
|
|
Total common and preferred stocks | | | 11,524,589,577 | | 98.7 | |
Short-term investments | | | 42,456,000 | | 0.4 | |
| | |
|
| |
|
|
Total investments | | | 11,567,045,577 | | 99.1 | |
Other assets less liabilities | | | 107,953,990 | | 0.9 | |
| | |
|
| |
|
|
Total net assets | | $ | 11,674,999,567 | | 100.0 | % |
| | |
|
| |
|
|
| | | | | | |
| CURRENCY EXPOSURE - SEPTEMBER 30, 2005 | |
| | | Value
| | Percentage
| |
Australian Dollar | | $ | 20,124,833 | | 0.2 | % |
British Pound | | | 1,018,957,152 | | 8.8 | |
Canadian Dollar | | | 292,499,140 | | 2.5 | |
Danish Krone | | | 73,612,699 | | 0.6 | |
Euro | | | 3,816,073,657 | | 33.0 | |
Hong Kong Dollar | | | 657,855,279 | | 5.7 | |
Japanese Yen | | | 2,452,105,141 | | 21.2 | |
Mexican Peso | | | 142,077,701 | | 1.2 | |
Norwegian Krone | | | 91,458,834 | | 0.8 | |
Singapore Dollar | | | 290,338,197 | | 2.5 | |
South Korean Won | | | 432,791,983 | | 3.7 | |
Swedish Krona | | | 216,041,904 | | 1.9 | |
Swiss Franc | | | 989,768,494 | | 8.6 | |
US Dollar | | | 1,073,340,563 | | 9.3 | |
| | |
|
| |
|
|
Total investments | | $ | 11,567,045,577 | | 100.0 | % |
| | |
|
| |
|
|
The accompanying notes are an integral part of the financial statements.
11
ELEVEN
ARTISAN MID CAP FUND
Schedule of Investments – September 30, 2005
| | | | | |
| | | Shares
Held
| | Value
|
| COMMON STOCKS - 97.4% | | | | | |
| | | | | | |
| AUTO & TRANSPORTATION - 0.9% | | | |
Air Transport - 0.8% | | | |
Expeditors International of Washington, Inc. | | 852,600 | | $ | 48,410,628 |
| | | | | | |
Auto Trucks & Parts - 0.1% | | | | | |
Oshkosh Truck Corporation | | 178,000 | | | 7,682,480 |
| | | | | | |
| CONSUMER DISCRETIONARY - 17.8% | | | |
Casinos & Gambling - 0.3% | | | | | |
Las Vegas Sands Corp.(1) | | 446,900 | | | 14,707,479 |
| | | | | | |
Consumer Electronics - 3.4% | | | | | |
Electronic Arts Inc.(1) | | 1,019,300 | | | 57,987,977 |
VeriSign, Inc.(1) | | 3,222,300 | | | 68,860,551 |
Yahoo! Inc.(1) | | 2,218,100 | | | 75,060,504 |
| | | | |
|
|
| | | | | | 201,909,032 |
Leisure Time - 1.0% | | | | | |
Royal Caribbean Cruises Ltd. | | 1,404,051 | | | 60,655,003 |
| | | | | | |
Restaurants - 1.8% | | | | | |
P.F. Chang’s China Bistro, Inc.(1) | | 246,100 | | | 11,032,663 |
Starbucks Corporation(1) | | 298,400 | | | 14,949,840 |
YUM! Brands, Inc. | | 1,660,400 | | | 80,379,964 |
| | | | |
|
|
| | | | | | 106,362,467 |
Retail - 5.2% | | | | | |
Amazon.com, Inc.(1) | | 343,100 | | | 15,542,430 |
Chico’s FAS, Inc.(1) | | 2,435,968 | | | 89,643,623 |
Fisher Scientific International Inc.(1) | | 1,398,900 | | | 86,801,745 |
Kohl’s Corporation(1) | | 1,659,600 | | | 83,278,728 |
Office Depot, Inc.(1) | | 951,900 | | | 28,271,430 |
| | | | |
|
|
| | | | | | 303,537,956 |
Services: Commercial - 5.6% | | | | | |
Getty Images, Inc.(1) | | 884,600 | | | 76,110,984 |
Hewitt Associates, Inc.(1) | | 2,516,000 | | | 68,636,480 |
Iron Mountain Incorporated(1) | | 2,481,100 | | | 91,056,370 |
Robert Half International Inc. | | 2,570,705 | | | 91,491,391 |
| | | | |
|
|
| | | | | | 327,295,225 |
Toys - 0.5% | | | | | |
Marvel Entertainment, Inc.(1) | | 1,769,000 | | | 31,612,030 |
| | | | | | |
| | | | | |
| | | Shares
Held
| | Value
|
| CONSUMER STAPLES - 2.8% | | | | | |
Beverage: Brewers (Wineries) - 2.8% | | | |
Constellation Brands, Inc.(1) | | 6,206,600 | | $ | 161,371,600 |
| | | | | | |
| | | | |
| FINANCIAL SERVICES - 11.3% | | | | |
Banks: Outside New York City - 1.5% | | |
Northern Trust Corporation | | 1,717,700 | | 86,829,735 |
| | | | | |
Finance: Small Loan - 0.3% | | |
The First Marblehead Corporation | | 652,400 | | 16,570,960 |
| | | | | |
Financial Data Processing Services & Systems - 2.2% | | |
CheckFree Corporation(1) | | 1,936,000 | | 73,219,520 |
Paychex, Inc. | | 1,538,600 | | 57,051,288 |
| | | | |
|
| | | | | 130,270,808 |
Financial Information Services - 0.9% | | |
Equifax Inc. | | 1,481,700 | | 51,770,598 |
| | | | | |
Financial Miscellaneous - 2.9% | | | | |
CapitalSource Inc.(1) | | 2,203,600 | | 48,038,480 |
MGIC Investment Corporation | | 852,600 | | 54,736,920 |
Willis Group Holdings Limited | | 1,859,100 | | 69,809,205 |
| | | | |
|
| | | | | 172,584,605 |
Insurance: Multi-Line - 0.9% | | |
Aon Corporation | | 608,500 | | 19,520,680 |
Genworth Financial, Inc. | | 977,700 | | 31,521,048 |
| | | | |
|
| | | | | 51,041,728 |
Insurance: Property-Casualty - 0.4% | | |
RenaissanceRe Holdings Ltd. | | 563,700 | | 24,650,601 |
| | | | | |
Rental & Leasing Services: Commercial - 0.8% | | | | |
GATX Corporation | | 1,253,900 | | 49,591,745 |
| | | | | |
Savings & Loans - 0.5% | | |
Golden West Financial Corporation | | 481,300 | | 28,584,407 |
| | | | | |
Securities Brokerage & Services - 0.9% | | |
The Bear Stearns Companies Inc. | | 504,300 | | 55,346,925 |
| | | | | |
12
TWELVE
| | | | | |
| | | Shares
Held
| | Value
|
| HEALTHCARE - 19.6% | | | |
Biotechnology Research & Production - 3.0% | | | | | |
Genzyme Corporation(1) | | 1,124,200 | | $ | 80,537,688 |
Invitrogen Corporation(1) | | 773,100 | | | 58,160,313 |
Millipore Corporation(1) | | 321,300 | | | 20,206,557 |
Neurocrine Biosciences, Inc.(1) | | 294,000 | | | 14,461,860 |
| | | | |
|
|
| | | | | | 173,366,418 |
Drugs & Pharmaceuticals - 5.7% | | | |
Allergan, Inc. | | 1,317,500 | | | 120,709,350 |
AmerisourceBergen Corporation | | 915,900 | | | 70,799,070 |
Barr Pharmaceuticals, Inc.(1) | | 518,800 | | | 28,492,496 |
Forest Laboratories, Inc.(1) | | 976,900 | | | 38,069,793 |
MedImmune, Inc.(1) | | 1,776,000 | | | 59,762,400 |
Shire Pharmaceuticals Group plc (ADR)(2) | | 368,000 | | | 13,612,320 |
| | | | |
|
|
| | | | | | 331,445,429 |
Electronics: Medical Systems - 2.0% | | | |
Varian Medical Systems, Inc.(1) | | 2,993,300 | | | 118,265,283 |
| | | | | | |
Health Care Facilities - 0.4% | | | |
Laboratory Corporation of America Holdings(1) | | 464,000 | | | 22,601,440 |
| | | | | | |
Health Care Management Services - 4.7% | | | | | |
Aetna Inc. | | 987,300 | | | 85,046,022 |
Caremark Rx, Inc.(1) | | 1,900,200 | | | 94,876,986 |
Cerner Corporation(1) | | 1,070,200 | | | 93,032,486 |
| | | | |
|
|
| | | | | | 272,955,494 |
Medical & Dental Instruments & Supplies - 2.0% | | | |
Gen-Probe Incorporated(1) | | 312,400 | | | 15,448,180 |
St. Jude Medical, Inc.(1) | | 1,256,500 | | | 58,804,200 |
Zimmer Holdings, Inc.(1) | | 653,800 | | | 45,040,282 |
| | | | |
|
|
| | | | | | 119,292,662 |
Medical Services - 1.8% | | | | | |
Coventry Health Care, Inc.(1) | | 1,216,100 | | | 104,608,922 |
| | | | | | |
| MATERIALS & PROCESSING - 7.0% | | | |
Chemicals - 2.5% | | | |
Air Products and Chemicals, Inc. | | 800,600 | | | 44,145,084 |
Ecolab Inc. | | 3,143,600 | | | 100,375,148 |
| | | | |
|
|
| | | | | | 144,520,232 |
Diversified Materials & Processing - 1.6% | | | | | |
American Standard Companies Inc. | | 2,057,800 | | | 95,790,590 |
| | | | | | |
Metal Fabricating - 2.2% | | | | | |
Precision Castparts Corp. | | 2,382,200 | | | 126,494,820 |
| | | | | |
| | | Shares
Held
| | Value
|
| MATERIALS & PROCESSING (CONTINUED) | | | |
Real Estate - 0.7% | | | | | |
The St. Joe Company | | 632,500 | | $ | 39,499,625 |
| | | | | | |
| OTHER - 3.8% | | | | | |
Multi-Sector Companies - 3.8% | | | |
Brunswick Corporation | | 1,375,700 | | | 51,905,161 |
ITT Industries, Inc. | | 1,109,000 | | | 125,982,400 |
McDermott International, Inc.(1) | | 1,277,300 | | | 46,761,953 |
| | | | |
|
|
| | | | | | 224,649,514 |
| OTHER ENERGY - 6.8% | | | | | |
Coal - 1.6% | | | | | |
CONSOL Energy Inc. | | 234,000 | | | 17,847,180 |
Peabody Energy Corporation | | 886,800 | | | 74,801,580 |
| | | | |
|
|
| | | | | | 92,648,760 |
Machinery: Oil Well Equipment & Services - 4.7% | | | |
Cooper Cameron Corporation(1) | | 841,100 | | | 62,182,523 |
Noble Corporation | | 833,300 | | | 57,047,718 |
Smith International, Inc. | | 4,675,700 | | | 155,747,567 |
| | | | |
|
|
| | | | | | 274,977,808 |
Oil: Crude Producers - 0.5% | | | |
Devon Energy Corporation | | 432,100 | | | 29,659,344 |
| | | | | | |
| PRODUCER DURABLES - 6.7% | | | |
Diversified Production - 2.7% | | | |
Danaher Corporation | | 2,385,900 | | | 128,432,997 |
Pentair, Inc. | | 730,700 | | | 26,670,550 |
| | | | |
|
|
| | | | | | 155,103,547 |
Homebuilding - 0.7% | | | |
D.R. Horton, Inc. | | 1,131,900 | | | 40,997,418 |
| | | | | | |
Identification Control & Filter Devices - 1.1% | | | |
Agilent Technologies, Inc.(1) | | 1,315,200 | | | 43,072,800 |
Roper Industries, Inc. | | 579,000 | | | 22,748,910 |
| | | | |
|
|
| | | | | | 65,821,710 |
Machinery: Industrial/ Specialty - 0.7% | | | |
Joy Global Inc. | | 807,609 | | | 40,751,950 |
| | | | | | |
Production Technology Equipment - 0.7% | | | |
Novellus Systems, Inc.(1) | | 1,532,200 | | | 38,427,576 |
| | | | | | |
Telecommunications Equipment - 0.8% | | | |
Andrew Corporation(1) | | 4,105,200 | | | 45,772,980 |
| | | | | | |
13
THIRTEEN
| | | | | |
| | | Shares
Held
| | Value
|
| TECHNOLOGY - 19.0% | | | | | |
Communications Technology - 5.0% | | | |
Comverse Technology, Inc.(1) | | 2,667,000 | | $ | 70,062,090 |
Corning Incorporated(1) | | 2,395,700 | | | 46,308,881 |
Juniper Networks, Inc.(1) | | 4,195,600 | | | 99,813,324 |
NCR Corporation(1) | | 1,089,600 | | | 34,769,136 |
TIBCO Software Inc.(1) | | 5,333,200 | | | 44,585,552 |
| | | | |
|
|
| | | | | | 295,538,983 |
Computer Services Software & Systems - 3.5% | | | |
Adobe Systems Incorporated | | 2,164,400 | | | 64,607,340 |
Autodesk, Inc. | | 854,300 | | | 39,673,692 |
CACI International Inc(1) | | 494,400 | | | 29,960,640 |
Cognizant Technology Solutions Corporation(1) | | 643,800 | | | 29,994,642 |
Macromedia, Inc.(1) | | 1,032,700 | | | 41,999,909 |
| | | | |
|
|
| | | | | | 206,236,223 |
Computer Technology - 2.8% | | | |
Network Appliance, Inc.(1) | | 2,963,000 | | | 70,341,620 |
UNOVA, Inc.(1) | | 1,660,300 | | | 58,077,294 |
Zebra Technologies Corporation(1) | | 974,300 | | | 38,085,387 |
| | | | |
|
|
| | | | | | 166,504,301 |
Electronics - 0.2% | | | |
FLIR Systems, Inc.(1) | | 382,000 | | | 11,299,560 |
| | | | | | |
Electronics: Semi-Conductors/Components - 7.2% | | | |
Altera Corporation(1) | | 2,584,400 | | | 49,387,884 |
Broadcom Corporation(1) | | 2,102,900 | | | 98,647,039 |
Freescale Semiconductor, Inc.(1) | | 1,239,600 | | | 29,019,036 |
Jabil Circuit, Inc.(1) | | 2,270,100 | | | 70,191,492 |
Marvell Technology Group Ltd.(1) | | 945,400 | | | 43,592,394 |
Maxim Integrated Products, Inc. | | 1,606,700 | | | 68,525,755 |
Microchip Technology Incorporated | | 1,978,800 | | | 59,601,456 |
| | | | |
|
|
| | | | | | 418,965,056 |
Electronics: Technology - 0.3% | | | |
Rockwell Automation, Inc. | | 309,700 | | | 16,383,130 |
| | | | | | |
| UTILITIES - 1.7% | | | | | |
Utilities: Gas Distributors - 1.0% | | | |
Kinder Morgan, Inc. | | 608,300 | | | 58,494,128 |
| | | | | | |
Utilities: Telecommunications - 0.7% | | | |
NII Holdings, Inc.(1) | | 513,000 | | | 43,322,850 |
| | | | |
|
|
Total common stocks
(Cost $4,489,276,727) | | | | | 5,705,181,765 |
| | | | | | |
| | | Par
Amount
| | Value
|
SHORT-TERM INVESTMENTS
(CASH EQUIVALENTS) - 1.9% | | | |
Repurchase agreement with State Street Bank and Trust Company, 3.50%, dated 9/30/05, due 10/3/05, maturity value $109,840,027, collateralized by $112,008,643 market value Federal National Mortgage Association Note,
3.25%, due 8/15/08
(Cost $109,808,000) | | $ | 109,808,000 | | $ | 109,808,000 |
| | | | | |
|
|
| | | | | | | |
Total investments - 99.3%
(Cost $4,599,084,727) | | | | | | 5,814,989,765 |
| | | | | | | |
Other assets less liabilities - 0.7% | | | | | | 40,394,039 |
| | | | | |
|
|
| | | | | | | |
Total net assets - 100.0%(3) | | | | | $ | 5,855,383,804 |
| | | | | |
|
|
| (1) | Non-income producing security. |
| (2) | The Fund considers the issuer to be from the United Kingdom as designated by its securities information vendors or, if unavailable, by Artisan Partners using the primary vendor’s published criteria or its own judgment. The security trades on a U.S. exchange. |
| (3) | Percentages for the various classifications relate to total net assets. |
(ADR) American Depository Receipt
The accompanying notes are an integral part of the financial statements.
14
FOURTEEN
ARTISAN FUNDS, INC.
Statements of Assets and Liabilities – September 30, 2005
| | | | | | | |
| | | INTERNATIONAL
| | | MID CAP
|
| ASSETS: | | | | | | | |
Investments in securities, unaffiliated, at value | | $ | 11,131,861,829 | | | $ | 5,705,181,765 |
Investments in securities, affiliated, at value | | | 392,727,748 | | | | - |
Short-term investments (repurchase agreements), at value | | | 42,456,000 | | | | 109,808,000 |
| | |
|
|
| |
|
|
Total investments | | | 11,567,045,577 | | | | 5,814,989,765 |
Cash | | | 936 | | | | 272 |
Receivable from investments sold | | | 120,616,254 | | | | 157,669,469 |
Foreign currency | | | 80,461 | | | | - |
Receivable from fund shares sold | | | 17,395,083 | | | | 5,335,623 |
Dividends and interest receivable | | | 25,751,066 | | | | 2,432,051 |
| | |
|
|
| |
|
|
Total assets | | | 11,730,889,377 | | | | 5,980,427,180 |
| | |
| LIABILITIES: | | | | | | | |
Payable for investments purchased | | | 35,646,349 | | | | 73,829,045 |
Unrealized loss on foreign currency forward contracts | | | 45,752 | | | | - |
Payable for fund shares redeemed | | | 15,434,130 | | | | 49,173,680 |
Payable for operating expenses | | | 2,711,699 | | | | 2,040,651 |
Payable for withholding taxes | | | 2,051,880 | | | | - |
| | |
|
|
| |
|
|
Total liabilities | | | 55,889,810 | | | | 125,043,376 |
| | |
|
|
| |
|
|
Total net assets | | $ | 11,674,999,567 | | | $ | 5,855,383,804 |
| | |
|
|
| |
|
|
| NET ASSETS CONSIST OF: | | | | | | | |
Fund shares issued and outstanding | | $ | 9,396,337,173 | | | $ | 4,497,540,829 |
Net unrealized appreciation (depreciation) on investments and foreign currency related transactions | | | 2,805,365,559 | | | | 1,215,905,038 |
Accumulated undistributed net investment income (loss) | | | 104,696,688 | | | | - |
Accumulated undistributed net realized gains (losses) on investments and foreign currency related transactions | | | (631,399,853 | ) | | | 141,937,937 |
| | |
|
|
| |
|
|
| | | $ | 11,674,999,567 | | | $ | 5,855,383,804 |
| | |
|
|
| |
|
|
| SUPPLEMENTARY INFORMATION: | | | | | | | |
Net assets | | | | | | | |
Investor Shares | | $ | 7,686,916,648 | | | $ | 4,874,043,978 |
Institutional Shares | | $ | 3,988,082,919 | | | $ | 981,339,826 |
Shares outstanding (Indefinite number of shares authorized, $0.01 par value) | | | | | | | |
Investor Shares | | | 315,006,611 | | | | 158,025,500 |
Institutional Shares | | | 162,500,709 | | | | 31,439,286 |
Net asset value, offering price and redemption price per share | | | | | | | |
Investor Shares | | $ | 24.40 | | | $ | 30.84 |
Institutional Shares | | $ | 24.54 | | | $ | 31.21 |
Cost of securities of unaffiliated issuers held | | $ | 8,489,556,236 | | | $ | 4,599,084,727 |
Cost of securities of affiliated issuers held | | $ | 271,804,934 | | | $ | - |
Cost of foreign currency | | $ | 80,726 | | | $ | - |
The accompanying notes are an integral part of the financial statements.
15
FIFTEEN
ARTISAN FUNDS, INC.
Statements of Operations – For the Year Ended September 30, 2005
| | | | | | | | |
| | | INTERNATIONAL
| | | MID CAP
| |
| INVESTMENT INCOME: | | | | | | | | |
Interest | | $ | 3,536,574 | | | $ | 3,812,015 | |
Dividends, from unaffiliated issuers(1) | | | 222,249,002 | | | | 28,252,322 | |
Dividends, from affiliated issuers(1) | | | 2,763,078 | | | | - | |
Securities lending | | | 3,908,478 | | | | - | |
| | |
|
|
| |
|
|
|
Total investment income | | | 232,457,132 | | | | 32,064,337 | |
| | |
| EXPENSES: | | | | | | | | |
Advisory fees | | | 101,816,286 | | | | 54,278,551 | |
Transfer agent fees | | | | | | | | |
Investor Shares | | | 12,909,726 | | | | 9,832,140 | |
Institutional Shares | | | 26,416 | | | | 22,715 | |
Shareholder communications | | | | | | | | |
Investor Shares | | | 1,230,606 | | | | 1,021,259 | |
Institutional Shares | | | 24,813 | | | | 11,478 | |
Custodian fees | | | 6,094,807 | | | | 286,604 | |
Accounting fees | | | 74,144 | | | | 65,944 | |
Professional fees | | | (60,021 | ) | | | 176,267 | |
Registration fees | | | | | | | | |
Investor Shares | | | 48,714 | | | | 57,506 | |
Institutional Shares | | | 22,470 | | | | 15,460 | |
Directors’ fees | | | 302,229 | | | | 160,463 | |
Other operating expenses | | | 276,447 | | | | 152,894 | |
| | |
|
|
| |
|
|
|
Total operating expenses | | | 122,766,637 | | | | 66,081,281 | |
| | |
|
|
| |
|
|
|
Net investment income (loss) | | | 109,690,495 | | | | (34,016,944 | ) |
| | |
NET REALIZED AND UNREALIZED GAINS (LOSSES) ON
INVESTMENTS: | | | | | | | | |
Net realized gain (loss) on: | | | | | | | | |
Investments(1) | | | 951,444,475 | | | | 344,210,655 | |
Foreign currency related transactions | | | (4,798,062 | ) | | | - | |
| | |
|
|
| |
|
|
|
| | | | 946,646,413 | | | | 344,210,655 | |
Net increase (decrease) in unrealized appreciation or depreciation on: | | | | | | | | |
Investments | | | 1,532,135,303 | | | | 617,698,766 | |
Foreign currency related transactions | | | (380,101 | ) | | | - | |
| | |
|
|
| |
|
|
|
| | | | 1,531,755,202 | | | | 617,698,766 | |
| | |
|
|
| |
|
|
|
Net gain (loss) on investments and foreign currency related transactions | | | 2,478,401,615 | | | | 961,909,421 | |
| | |
|
|
| |
|
|
|
Net increase (decrease) in net assets resulting from operations | | $ | 2,588,092,110 | | | $ | 927,892,477 | |
| | |
|
|
| |
|
|
|
| | | | | | | |
(1) Fund
| | Net of foreign taxes
withheld on dividends,
unaffiliated issuers
| | Net of foreign taxes
withheld on dividends,
affiliated issuers
| | Including net realized
gain (loss) on investments
from affiliated issuers
| |
International | | $24,198,830 | | $91,359 | | $(8,424,242 | ) |
Mid Cap | | 31,284 | | - | | - | |
The accompanying notes are an integral part of the financial statements.
16
SIXTEEN
ARTISAN FUNDS, INC.
Statements of Changes in Net Assets
| | | | | | | | |
| | | INTERNATIONAL
| |
| | | Year Ended
9/30/05
| | | Year Ended
9/30/04
| |
| OPERATIONS: | | | | | | | | |
Net investment income (loss) | | $ | 109,690,495 | | | $ | 70,075,203 | |
Net realized gain (loss) on: | | | | | | | | |
Investments | | | 951,444,475 | | | | (91,940,847 | ) |
Foreign currency related transactions | | | (4,798,062 | ) | | | (5,531,519 | ) |
Net increase (decrease) in unrealized appreciation or depreciation on: | | | | | | | | |
Investments | | | 1,532,135,303 | | | | 1,580,915,556 | |
Foreign currency related transactions | | | (380,101 | ) | | | (820,070 | ) |
| | |
|
|
| |
|
|
|
Net increase (decrease) in net assets resulting from operations | | | 2,588,092,110 | | | | 1,552,698,323 | |
| | |
| DISTRIBUTIONS PAID TO SHAREHOLDERS: | | | | | | | | |
Net investment income: | | | | | | | | |
Investor Shares | | | (39,392,658 | ) | | | (59,414,982 | ) |
Institutional Shares | | | (29,943,284 | ) | | | (42,472,917 | ) |
Net realized gains on investment transactions: | | | | | | | | |
Investor Shares | | | - | | | | - | |
Institutional Shares | | | - | | | | - | |
| | |
|
|
| |
|
|
|
Total distributions paid to shareholders | | | (69,335,942 | ) | | | (101,887,899 | ) |
| | |
| FUND SHARE ACTIVITIES: | | | | | | | | |
Net increase (decrease) in net assets
resulting from fund share activities | | | (596,036,624 | ) | | | (597,923,467 | ) |
| | |
|
|
| |
|
|
|
Total increase (decrease) in net assets | | | 1,922,719,544 | | | | 852,886,957 | |
| | |
|
|
| |
|
|
|
Net assets, beginning of period | | | 9,752,280,023 | | | | 8,899,393,066 | |
| | |
|
|
| |
|
|
|
Net assets, end of period | | $ | 11,674,999,567 | | | $ | 9,752,280,023 | |
| | |
|
|
| |
|
|
|
| | | | | | | | | |
Accumulated undistributed net investment income (loss) | | $ | 104,696,688 | | | $ | 64,567,549 | |
| | |
|
|
| |
|
|
|
The accompanying notes are an integral part of the financial statements.
17
SEVENTEEN
ARTISAN FUNDS, INC.
Statements of Changes in Net Assets (Continued)
| | | | | | | | |
| | | MID CAP
| |
| | | Year Ended
9/30/05
| | | Year Ended
9/30/04
| |
| OPERATIONS: | | | | | | | | |
Net investment income (loss) | | $ | (34,016,944 | ) | | $ | (33,613,109 | ) |
Net realized gain (loss) on: | | | | | | | | |
Investments | | | 344,210,655 | | | | 330,560,106 | |
Foreign currency related transactions | | | - | | | | - | |
Net increase (decrease) in unrealized appreciation or depreciation on: | | | | | | | | |
Investments | | | 617,698,766 | | | | 172,866,182 | |
Foreign currency related transactions | | | - | | | | - | |
| | |
|
|
| |
|
|
|
Net increase (decrease) in net assets resulting from operations | | | 927,892,477 | | | | 469,813,179 | |
| | |
| DISTRIBUTIONS PAID TO SHAREHOLDERS: | | | | | | | | |
Net investment income: | | | | | | | | |
Investor Shares | | | - | | | | - | |
Institutional Shares | | | - | | | | - | |
Net realized gains on investment transactions: | | | | | | | | |
Investor Shares | | | - | | | | - | |
Institutional Shares | | | - | | | | - | |
| | |
|
|
| |
|
|
|
Total distributions paid to shareholders | | | - | | | | - | |
| | |
| FUND SHARE ACTIVITIES: | | | | | | | | |
Net increase (decrease) in net assets
resulting from fund share activities | | | (151,207,182 | ) | | | 1,096,126,727 | |
| | |
|
|
| |
|
|
|
Total increase (decrease) in net assets | | | 776,685,295 | | | | 1,565,939,906 | |
| | |
|
|
| |
|
|
|
Net assets, beginning of year | | | 5,078,698,509 | | | | 3,512,758,603 | |
| | |
|
|
| |
|
|
|
Net assets, end of year | | $ | 5,855,383,804 | | | $ | 5,078,698,509 | |
| | |
|
|
| |
|
|
|
| | | | | | | | | |
Accumulated undistributed net investment income (loss) | | $ | - | | | $ | - | |
| | |
|
|
| |
|
|
|
The accompanying notes are an integral part of the financial statements.
18
EIGHTEEN
(This page intentionally left blank.)
19
NINETEEN
ARTISAN FUNDS, Inc.
Financial Highlights – For a share outstanding throughout each period
The financial highlights table is intended to help you understand the Funds’ financial performance for the past 5 years. Certain information reflects financial results for a single Fund share. The total returns in the table represent the rate that an investor would have earned or lost on an investment in the Fund (assuming reinvestment of all dividends and distributions). This information has been audited by Ernst & Young, whose report, along with each Fund’s financial statements, are included in this annual report. The financial highlights of the Funds for the periods ended prior to September 30, 2003 were audited by other auditors.
| | | | | | | | | | | | | | | | | | | | | | | | |
Year or
Period
Ended | | | Net Asset
Value
Beginning
of Period | | Net
Investment
Income
(Loss)(1) | | |
Net Realized
and Unrealized
Gain (Loss) on
Investments | | | Total Income
(Loss) from
Investment
Operations | | | Dividends
from Net
Investment
Income | | | Distributions
from Net
Realized
Gains | |
| | | | | | | | | | | | | | | | | | | | | | | | | |
| ARTISAN INTERNATIONAL FUND | |
| Institutional Shares | | | | | | | | | | | | | | | | | | | | | | | | |
| 9/30/2005 | | | $ | 19.44 | | $ | 0.25 | | | $ | 5.01 | | | $ | 5.26 | | | $ | (0.16 | ) | | $ | - | |
| 9/30/2004 | | | | 16.63 | | | 0.16 | | | | 2.86 | | | | 3.02 | | | | (0.21 | ) | | | - | |
| 9/30/2003 | (4) | | | 15.71 | | | 0.03 | | | | 0.89 | | | | 0.92 | | | | - | | | | - | |
| 6/30/2003 | | | | 18.24 | | | 0.25 | | | | (2.65 | ) | | | (2.40 | ) | | | (0.13 | ) | | | - | |
| 6/30/2002 | | | | 19.62 | | | 0.18 | | | | (1.46 | ) | | | (1.28 | ) | | | (0.10 | ) | | | - | |
| 6/30/2001 | | | | 30.22 | | | 0.16 | | | | (7.21 | ) | | | (7.05 | ) | | | - | | | | (3.55 | ) |
| | | | | | | | | | | | | | | | | | | | | | | | | |
| ARTISAN MID CAP FUND | | | | | | | | | | | | | | | | | | | | |
| Institutional Shares | | | | | | | | | | | | | | | | | | | | | | | | |
| 9/30/2005 | | | $ | 26.38 | | $ | (0.12 | ) | | $ | 4.95 | | | $ | 4.83 | | | $ | - | | | $ | - | |
| 9/30/2004 | | | | 23.28 | | | (0.14 | ) | | | 3.24 | | | | 3.10 | | | | - | | | | - | |
| 9/30/2003 | (4) | | | 21.96 | | | (0.03 | ) | | | 1.35 | | | | 1.32 | | | | - | | | | - | |
| 6/30/2003 | | | | 22.24 | | | (0.07 | ) | | | (0.21 | )(6) | | | (0.28 | ) | | | - | | | | - | |
| 6/30/2002 | | | | 26.48 | | | (0.13 | ) | | | (4.11 | ) | | | (4.24 | ) | | | - | | | | - | |
| 6/30/2001 | | | | 27.57 | | | (0.08 | ) | | | 0.02 | (6) | | | (0.06 | ) | | | - | | | | (1.03 | ) |
| (1) | Computed based on average shares outstanding. |
| (2) | Periods less than twelve months (where applicable) are not annualized. |
| (3) | Periods less than twelve months (where applicable) are annualized. |
| (4) | For the period from July 1, 2003 to September 30, 2003. Artisan Funds changed its fiscal year-end from June 30 to September 30 effective September 30, 2003. |
| (5) | The ratios of expenses to average net assets and net investment income (loss) to average net assets exclude expenses waived or paid by the Adviser. Absent expenses waived or paid by the Adviser, the ratios of expenses to average net assets and net investment income (loss) to average net assets would have been as follows: |
| | | | | | | |
| Fund | | Period Ended | | Ratio of Expenses to
Average Net Assets | | Ratio of Net Investment Income
(Loss) to Average Net Assets | |
International Institutional Shares | | 9/30/2003 | | 1.00 | | 0.73 | % |
Mid Cap Institutional Shares | | 9/30/2003 | | 0.98 | | (0.59 | ) |
| (6) | The amount shown may not correlate with the aggregate gains and losses of portfolio securities due to the timing of subscriptions and redemptions of fund shares. |
20
TWENTY
| | | | | | | | | | | | | | | | | | | | |
Total
Distributions | | | Net Asset
Value
End
of Period | | Total
Return(2) | | | Net Assets
End of
Period
(millions) | | Ratio of
Expenses
to Average
Net Assets(3) | | | Ratio of Net
Investment
Income (Loss)
to Average
Net Assets(3) | | | Portfolio
Turnover
Rate(2) | |
| | | | | | | | | | | | | | | | | | | | | |
| | | | | | | | | | | | | | | | | | | | | |
| | | | | | | | | | | | | | | | | | | | | |
| $ | (0.16 | ) | | $ | 24.54 | | 27.21 | % | | $ | 3,988.1 | | 0.99 | % | | 1.11 | % | | 56.15 | % |
| | (0.21 | ) | | | 19.44 | | 18.31 | | | | 3,622.1 | | 1.01 | | | 0.85 | | | 54.96 | |
| | - | | | | 16.63 | | 5.86 | | | | 3,354.7 | | 1.00 | (5) | | 0.73 | (5) | | 15.23 | |
| | (0.13 | ) | | | 15.71 | | (13.09 | ) | | | 2,975.0 | | 1.01 | | | 1.68 | | | 37.13 | |
| | (0.10 | ) | | | 18.24 | | (6.52 | ) | | | 2,062.0 | | 1.01 | | | 1.01 | | | 50.67 | |
| | (3.55 | ) | | | 19.62 | | (24.53 | ) | | | 1,486.6 | | 1.03 | | | 0.70 | | | 72.01 | |
| | | | | | | | | | | | | | | | | | | | | |
| | | | | | | | | | | | | | | | | | | | | |
| | | | | | | | | | | | | | | | | | | | | |
| $ | - | | | $ | 31.21 | | 18.35 | % | | $ | 981.3 | | 0.95 | % | | (0.40 | )% | | 83.00 | % |
| | - | | | | 26.38 | | 13.27 | | | | 1,036.0 | | 0.96 | | | (0.54 | ) | | 101.09 | |
| | - | | | | 23.28 | | 6.06 | | | | 929.6 | | 0.98 | (5) | | (0.59 | )(5) | | 26.52 | |
| | - | | | | 21.96 | | (1.26 | ) | | | 829.0 | | 1.00 | | | (0.36 | ) | | 102.85 | |
| | - | | | | 22.24 | | (16.04 | ) | | | 449.8 | | 1.02 | | | (0.56 | ) | | 121.14 | |
| | (1.03 | ) | | | 26.48 | | (0.38 | ) | | | 212.2 | | 1.08 | | | (0.29 | ) | | 153.95 | |
The accompanying notes are an integral part of the financial statements.
21
TWENTY-ONE
Artisan Funds, Inc.
Notes to Financial Statements – September 30, 2005
Artisan Funds, Inc. (“Artisan Funds”) was incorporated on January 5, 1995, as a Wisconsin corporation and is registered under the Investment Company Act of 1940, as amended. Artisan Funds is a series comprised of seven open-end, diversified mutual funds. Artisan International Fund (“International Fund” or “International”) and Artisan Mid Cap Fund (“Mid Cap Fund” or “Mid Cap”), two series of Artisan Funds (each a “Fund” and collectively the “Funds”), commenced operations on December 28, 1995 and June 27, 1997, respectively. Each Fund’s investment objective is to seek long-term capital growth.
The Funds offer shares of capital stock of two classes—Institutional Shares and Investor Shares. Each Fund has offered Investor Shares since the commencement of operations. International Fund and Mid Cap Fund began offering Institutional Shares on July 1, 1997 and July 1, 2000, respectively. Institutional Shares are sold to institutional investors meeting certain minimum investment requirements. Each class of shares has equal rights with respect to portfolio assets and voting privileges. Each class has exclusive voting rights with respect to any matters involving only that class. Income, expenses not specific to either class and realized and unrealized gains and losses are allocated daily to each class of shares based upon the relative net asset value of outstanding shares. Expenses attributable to a particular class of shares, such as transfer agency fees, shareholder communication expenses and registration fees, are allocated directly to that class.
Each class of the Funds has an indefinite number of shares authorized with a $0.01 par value.
| (2) | Summary of significant accounting policies: |
The following is a summary of significant accounting policies of the Funds in effect during the period covered by the financial statements, which are in accordance with United States generally accepted accounting principles.
| | (a) | Security valuation – The net asset value (“NAV”) of the shares of each class of each Fund was determined as of the close of regular session trading on the New York Stock Exchange (“NYSE”) (usually 3:00 p.m., Central time, but sometimes earlier) each day the NYSE was open for regular session trading. The NAV of each class of shares was determined by dividing the value of each Fund’s securities and other assets attributed to that class, less its liabilities attributed to that class, by the number of outstanding shares of that class of that Fund. |
22
TWENTY-TWO
NOTES TO FINANCIAL STATEMENTS
In determining NAV, each equity security traded on a securities exchange, including the Nasdaq Stock Market, was valued at the closing price as of the time of valuation on the exchange or market on which the security was principally traded (the “principal exchange”). The closing price provided by each exchange may differ and may represent information such as last sales price, an official closing price, a closing auction price or other information, depending on exchange or market convention. Absent closing price information for a security from the principal exchange as of the time of valuation, the security was valued using the most recent bid quotation on the principal exchange, except that securities listed on the London Stock Exchange were valued at the mean of the most recent bid and asked quotations as of the time of valuation. Short-term investments maturing within sixty days of the valuation date were valued at amortized cost, which approximates market value.
Securities for which prices were not readily available were valued by Artisan Funds’ valuation committee (the “valuation committee”) at a fair value determined in good faith under procedures established by and under the general supervision of Artisan Funds’ Board of Directors (the “Board of Directors”). A price was considered not to be readily available if, among other things, the valuation committee believed that the price determined as described in the preceding paragraph did not reflect a fair value of the security.
International Fund generally invests a significant portion, and perhaps as much as substantially all, of its total assets in securities principally traded in markets outside the U.S. Mid Cap Fund has the ability to invest in securities principally traded outside the U.S., but did not do so in the period covered by these financial statements. The foreign markets in which the Funds may invest are sometimes open on days when the NYSE is not open and the Funds do not calculate their NAVs, and sometimes are not open on days when the Funds do calculate their NAVs. Even on days on which both the foreign market and the NYSE are open, several hours may have passed between the time when trading in the foreign market closed and the time as of which the Funds calculate their NAVs. That is generally the case for markets in Europe, Asia, Australia and other far eastern markets; the regular closing time of foreign markets in North and South America is generally the same as the closing time of the NYSE and the time as of which the Funds calculate their NAVs.
The valuation committee concluded that a price determined under the Funds’ valuation procedures was not readily available if, among other things, the valuation committee believed that the value of the security might have been
23
TWENTY-THREE
NOTES TO FINANCIAL STATEMENTS
materially affected by events occurring after the close of the market in which the security was principally traded but before the time for determination of NAV (“subsequent event”). A subsequent event might include a company-specific development (for example, announcement of a merger that is made after the close of the foreign market), a development that might affect an entire market or region (for example, imposition of foreign exchange controls by a foreign government) or a potentially global development (such as a terrorist attack that may be expected to have an impact on investor expectations worldwide) or a significant change in one or more United States securities indexes. Artisan Funds monitored for subsequent events using several tools, including the use of a third party research service to assist in determining estimates of fair values for foreign securities. That service utilized statistical data based on historical performance of securities, markets and other data in developing factors used to estimate a fair value. An indication by any of those tools of a potential material change in the value of securities resulted in a meeting of the valuation committee, which considered whether a subsequent event had occurred and whether local market closing prices continued to represent fair values for potentially affected non-U.S. securities.
Estimates of fair values utilized by the Funds as described above may differ from the value realized on the sale of those securities and the differences may be material to the NAV of the applicable Fund or to the financial statements presented.
| | (b) | Income taxes – No provision has been made for federal income taxes since each Fund intends to (i) comply with the provisions of Subchapter M of the Internal Revenue Code applicable to regulated investment companies and (ii) distribute to its shareholders substantially all of its taxable income as well as net realized gains from the sale of investment securities. The Funds may utilize earnings and profits distributed to shareholders on redemptions of Fund shares as part of the dividends paid deduction. |
| | (c) | Portfolio transactions – Security and shareholder transactions are recorded on trade date. Net realized gains and losses on securities are computed on specific security lot identification. |
| | (d) | Foreign currency translation – Values of investments, open foreign currency forward contracts, payables for capital gains taxes and cash denominated in foreign currencies were translated into U.S. dollars using a spot market rate of exchange as of 3:00 p.m. (Central time) on the day of valuation. Payables and receivables for securities transactions, dividend and reclaim receivables and other receivables and payables denominated in a foreign currency were translated into U.S. dollars using a spot market rate of exchange as of |
24
TWENTY-FOUR
NOTES TO FINANCIAL STATEMENTS
| | 11:00 a.m. (Central time) on the day of valuation. Purchases and sales of investments and dividend and interest income are translated into U.S. dollars using a spot market rate of exchange as of 11:00 a.m. (Central time) on the date of such transactions. The portion of security gains or losses resulting from changes in foreign exchange rates is included with net realized and unrealized gain or loss from investments, as appropriate, for both financial reporting and tax purposes. |
International Fund may enter into foreign currency forward contracts to hedge the foreign currency exposure on open payables and receivables. The foreign currency forward contracts are recorded at market value and any related realized and unrealized gains and losses are reported as foreign currency related transactions for financial reporting purposes. For tax purposes, these foreign exchange gains and losses are treated as ordinary income or loss. International Fund could be exposed to loss if the counterparties fail to perform under these contracts.
Other foreign currency related transaction gains and losses may result from currency gains and losses realized from the difference between the amounts of dividends and foreign withholding taxes recorded on the Funds’ books and the U.S. dollar equivalent of the amounts actually received or paid. The net increase (decrease) in unrealized appreciation or depreciation on foreign currency related transactions arise from changes in the values of assets and liabilities, other than investments in securities, resulting from changes in foreign exchange rates.
| | (e) | Repurchase agreements – Each Fund may enter into repurchase agreements with institutions that Artisan Partners Limited Partnership (“the Adviser”) has determined are creditworthy pursuant to criteria adopted by the Board of Directors. Repurchase agreements are recorded at cost plus accrued interest and are collateralized in an amount greater than or equal to the repurchase price plus accrued interest. Collateral is held by the Funds’ custodian and in the event of default on the obligation of the counterparty to repurchase, the Funds have the right to liquidate the collateral and apply the proceeds in satisfaction of the obligation. If the proceeds from any sale of such collateral were less than the repurchase price, the Fund would suffer a loss. |
| | (f) | Securities lending – Each Fund may enter into securities lending transactions. During the year ended September 30, 2005, International Fund earned $3,908,478 from securities lending transactions. When securities are on loan the Fund does not receive dividends on the securities loaned, but receives compensation from the borrower in lieu of such dividends. The loans are secured by collateral at least equal, at all times, to the fair value of the securities loaned. Gain or loss in the fair value of the securities loaned that |
25
TWENTY-FIVE
NOTES TO FINANCIAL STATEMENTS
| | may occur during the term of the loan will be for the account of the applicable Fund. As of September 30, 2005, there were no securities on loan. Each Fund’s risks in entering into securities lending arrangements are that the borrower may not provide additional collateral when required or return the securities when due or, if the borrower defaults, the Fund may experience delays in selling collateral or the collateral may not be sufficient to cover the value of securities lent. |
| | (g) | Commission recapture – Each of the Funds may direct portfolio trades to various brokers that have agreed to rebate a portion of the commissions generated. Such cash rebates are made directly to the applicable Fund and are included in net realized gain or loss on investments in the Statements of Operations as follows: |
| | | |
International | | $ | 5,177,838 |
Mid Cap | | | 954,518 |
| | (h) | Use of estimates – The preparation of financial statements in conformity with United States generally accepted accounting principles requires management to make estimates and assumptions that affect the reported amounts and disclosures in the financial statements. Actual results could differ from those estimates. |
| | (i) | Indemnifications – In the normal course of business, the Funds enter into contracts in which the Funds agree to indemnify the other party or parties against various potential costs or liabilities. The Funds’ maximum exposure under these arrangements is unknown. No claim has been made for indemnification pursuant to any such agreement of the Funds. |
| | (j) | Other – Dividend income less foreign taxes withheld, if any, is recorded on the ex-dividend date, except that certain dividends from private placements and foreign securities are recorded as soon after the ex-dividend date as the information becomes available to the Funds. Non-cash dividends included in dividend income, if any, are generally recorded at the fair market value of the securities received. Interest income is reported on the accrual basis. Distributions to shareholders are recorded on the ex-dividend date. Expenses attributable to Artisan Funds are generally allocated to each Fund based on net assets. Expenses attributable to a particular Fund are allocated directly to that Fund. |
The character of income and net realized gains and losses may differ for financial statement and tax purposes and may result in reclassification of permanent differences among certain capital accounts to more appropriately conform financial accounting to tax characterizations of dividend distributions.
26
TWENTY-SIX
NOTES TO FINANCIAL STATEMENTS
International Fund generally imposes a 2% redemption fee on shares held 90 days or less. Those redemption fees are recorded as a reduction in the cost of shares redeemed and have the primary effect of increasing paid-in capital.
| (3) | Transactions with affiliates: |
The Adviser, with which the officers and a director of Artisan Funds are affiliated, provides investment advisory and administrative services to the Funds. In exchange for those services, each Fund pays a monthly management fee to the Adviser as follows:
| | | |
Average Daily Net Assets
| | Annual Rate
| |
Less than $500 million | | 1.000 | % |
$500 million to $750 million | | 0.975 | |
$750 million to $1 billion | | 0.950 | |
Greater than $1 billion | | 0.925 | |
The officers and director of Artisan Funds who are affiliated with the Adviser receive no compensation from the Funds.
Shares of Artisan Funds are offered for sale by Artisan Distributors LLC (“Distributors”). Distributors is wholly owned by the Adviser. All distribution expenses relating to the Funds are paid by the Adviser.
Each Fund also incurs other expenses for services such as maintaining shareholder records and furnishing shareholder statements and reports.
Prior to April 1, 2005, each director who was not an interested person of Artisan Funds or the Adviser received an annual retainer of $60,000, plus a fee for each board or committee meeting attended (other than a committee meeting held on the same day as a board meeting) of $3,000 for an in-person meeting and $500 for a telephonic meeting, as well as reimbursement of expenses related to his duties as a director of Artisan Funds. In addition, each chairman of a board committee who was a non-interested director and each non-interested director performing services deemed by the Board of Directors to be substantially equivalent to those of a committee chair received a supplemental annual retainer of $5,000. Those fees were generally allocated to each Fund based on net assets.
Effective April 1, 2005, each director who is not an interested person of Artisan Funds or the Adviser receives an annual retainer of $120,000 payable quarterly, as well as reimbursement of expenses related to his duties as a director of Artisan Funds. In addition, the non-interested chair of the board of directors receives an additional annual retainer of $60,000 payable quarterly, and each chair of a board committee who is a non-interested director receives an additional annual retainer of $30,000 payable quarterly.
27
TWENTY-SEVEN
NOTES TO FINANCIAL STATEMENTS
| (4) | Line of credit arrangements: |
Artisan Funds is party to a line of credit agreement with State Street Bank and Trust Company, under which each Fund may borrow up to the lesser of (a) $75 million or (b) the lesser of (i) 10% of its total assets (after giving effect to the loan) or (ii) the maximum amount the Fund may borrow under the Investment Company Act, the limitations included in the Fund’s prospectus, or any limit or restriction under any law or regulation to which the Fund is subject or any agreement to which the Fund or Artisan Funds is a party; provided that the aggregate borrowings by all Funds may not exceed $100 million. Artisan Funds pays a commitment fee at the annual rate of 0.10% on the unused portion of the line of credit. Interest is charged on any borrowings at the current Federal Funds rate plus 0.50%. The use of the line of credit is generally restricted to temporary borrowing for extraordinary or emergency purposes. During the year ended September 30, 2005, there were no borrowings under the line of credit for International or Mid Cap.
| (5) | Investment transactions: |
The cost of securities purchased and the proceeds from the sale of securities (excluding short-term securities) for the year ended September 30, 2005 were as follows:
| | | | | | |
| Fund | | Security Purchases | | Security Sales |
International | | $ | 6,035,724,353 | | $ | 6,622,127,074 |
Mid Cap | | | 4,668,792,914 | | | 4,863,636,635 |
| (6) | Transactions in securities of affiliates: |
The table below shows information about securities of the Funds’ “affiliates” (as defined below) that were held by the Funds, purchased or sold by the Funds, or from which dividends were received by the Funds during the year ended September 30, 2005. The Funds identify a company as an affiliate for the purpose of this report if one or more of the Funds owned, in the aggregate, voting securities that it believed represented 5% or more of that company’s outstanding voting securities (as defined by the Investment Company Act of 1940) during the year ended September 30, 2005.
| | | | | | | | | | | | | | | | | | | | | | |
| | | | | As of 9/30/04
| | | | | | | | | | | As of 9/30/05
|
Fund
| | Security
| | Share
Balance
| | Purchase
Cost
| | Sales
Cost
| | Net Realized
Gain (Loss)
| | | Dividend
Income (3)
| | Share
Balance
| | Value
|
| International | | Clariant AG(1) | | 13,411,333 | | $ | - | | $ | 202,716,463 | | $ | (8,879,904 | ) | | $ | 1,549,314 | | - | | $ | - |
| | | Credit Saison Co. Ltd.(2) | | 4,474,500 | | | 155,690,142 | | | 5,788,207 | | | 455,662 | | | | 1,213,764 | | 8,952,300 | | | 392,727,748 |
| | (1) | Issuer was no longer an affiliate as of September 30, 2005. |
| | (2) | Issuer was not an affiliate as of September 30, 2004. |
| | (3) | Net of foreign taxes withheld, if any. |
28
TWENTY-EIGHT
NOTES TO FINANCIAL STATEMENTS
| (7) | Information for Federal income tax purposes: |
| | | | | | | | | | | | | |
Fund
| | Cost of Investments
| | Gross Unrealized Appreciation
| | Gross Unrealized Depreciation
| | | Net Unrealized Appreciation (Depreciation) on Investments
|
| International | | $ | 8,870,840,634 | | $ | 2,862,245,706 | | $ | (166,040,763 | ) | | $ | 2,696,204,943 |
| Mid Cap | | | 4,615,316,636 | | | 1,261,868,261 | | | (62,195,132 | ) | | | 1,199,673,129 |
The difference between cost of investments for financial reporting and cost of investments for Federal income tax is due primarily to timing differences in recognizing certain gains and losses on security transactions (e.g., wash sale loss deferrals and passive foreign investment company transactions).
The tax basis of dividends and long-term capital gain distributions paid during the year ended September 30, 2005 and the year ended September 30, 2004 were as follows:
| | | | | | | | | | | | |
| | | Year ended 9/30/05
| | Year Ended 9/30/04
|
| | Ordinary
Income
Dividends
| | Long-Term
Capital Gain
Distributions
| | Ordinary
Income
Dividends
| | Long-Term
Capital Gain
Distributions
|
| International | | $ | 69,335,942 | | $ | - | | $ | 101,887,899 | | $ | - |
| Mid Cap | | | - | | | - | | | - | | | - |
Income and capital gain distributions are determined in accordance with income tax regulations that may differ from accounting principles that are generally accepted in the United States. These differences are due to differing treatments for items such as net short-term gains, wash sale loss deferrals, foreign currency transactions, net investment losses and capital loss carryovers.
Additional tax information as of and for the year ended September 30, 2005 follows:
| | | | | | | | | | | | | | | | | | | |
| | As of 9/30/05
| | | | Year Ended 9/30/05
|
| | Undistributed
Ordinary
Income
| | Undistributed
Long-Term
Gain
| | Net Capital
Loss
Carryforward(1)
| | Capital Loss
Carryforward
Expiration
| | | | Capital Loss
Carryforward
Utilized
| | Post-October
Losses
|
| International | | $ | 200,676,648 | | $ | - | | $ | 30,783,169 | | 2009 | | | | $ | 738,285,571 | | $ | - |
| | | | | | | | | | 384,841,928 | | 2010 | | | | | | | | |
| | | | | | | | | | 202,299,105 | | 2011 | | | | | | | | |
| Mid Cap | | | - | | | 158,169,846 | | | - | | | | | | | 178,503,906 | | | - |
| | (1) | The Fund expects to resume paying capital gain distributions in the future to the extent gains are realized in excess of the available carryforwards. |
29
TWENTY-NINE
NOTES TO FINANCIAL STATEMENTS
| (8) | Fund share activities: |
Capital share transactions for the Funds were as follows:
| | | | | | | | | | | | | | | | |
| | | INTERNATIONAL
| | | MID CAP
| |
Year ended September 30, 2005
| | Investor Shares
| | | Institutional Shares
| | | Investor Shares
| | | Institutional
Shares
| |
Proceeds from shares issued | | $ | 1,721,409,733 | | | $ | 213,745,441 | | | $ | 1,448,522,186 | | | $ | 65,819,361 | |
Net asset value of shares issued in reinvestment of dividends and distributions | | | 35,336,667 | | | | 27,442,945 | | | | - | | | | - | |
Cost of shares redeemed(1) | | | (1,815,852,822 | ) | | | (778,118,588 | ) | | | (1,366,393,615 | ) | | | (299,155,114 | ) |
| | |
|
|
| |
|
|
| |
|
|
| |
|
|
|
Net increase (decrease) from fund share transactions | | $ | (59,106,422 | ) | | $ | (536,930,202 | ) | | $ | 82,128,571 | | | $ | (233,335,753 | ) |
| | |
|
|
| |
|
|
| |
|
|
| |
|
|
|
| | | | |
Shares sold | | | 78,912,846 | | | | 9,680,591 | | | | 50,306,407 | | | | 2,231,832 | |
Shares issued in reinvestment of dividends and distributions | | | 1,677,108 | | | | 1,297,539 | | | | - | | | | - | |
Shares redeemed | | | (82,739,336 | ) | | | (34,838,126 | ) | | | (46,997,550 | ) | | | (10,061,831 | ) |
| | |
|
|
| |
|
|
| |
|
|
| |
|
|
|
Net increase (decrease) in capital shares | | | (2,149,382 | ) | | | (23,859,996 | ) | | | 3,308,857 | | | | (7,829,999 | ) |
| | |
|
|
| |
|
|
| |
|
|
| |
|
|
|
| | |
| | | INTERNATIONAL
| | | MID CAP
| |
Year ended September 30, 2004
| | Investor Shares
| | | Institutional Shares
| | | Investor Shares
| | | Institutional
Shares
| |
Proceeds from shares issued | | $ | 2,536,272,455 | | | $ | 334,559,000 | | | $ | 1,972,432,516 | | | $ | 69,966,247 | |
Net asset value of shares issued in reinvestment of dividends and distributions | | | 54,531,342 | | | | 38,442,969 | | | | - | | | | - | |
Cost of shares redeemed(2) | | | (2,903,431,496 | ) | | | (658,297,737 | ) | | | (855,149,594 | ) | | | (91,122,442 | ) |
| | |
|
|
| |
|
|
| |
|
|
| |
|
|
|
Net increase (decrease) from fund share transactions | | $ | (312,627,699 | ) | | $ | (285,295,768 | ) | | $ | 1,117,282,922 | | | $ | (21,156,195 | ) |
| | |
|
|
| |
|
|
| |
|
|
| |
|
|
|
| | | | |
Shares sold | | | 134,972,302 | | | | 17,620,515 | | | | 75,836,138 | | | | 2,793,091 | |
Shares issued in reinvestment of dividends and distributions | | | 3,107,199 | | | | 2,183,019 | | | | - | | | | - | |
Shares redeemed | | | (156,104,065 | ) | | | (35,129,349 | ) | | | (32,884,883 | ) | | | (3,449,277 | ) |
| | |
|
|
| |
|
|
| |
|
|
| |
|
|
|
Net increase (decrease) in capital shares | | | (18,024,564 | ) | | | (15,325,815 | ) | | | 42,951,255 | | | | (656,186 | ) |
| | |
|
|
| |
|
|
| |
|
|
| |
|
|
|
| (1) | Net of redemption fees of $326,088 and $179,833 for International-Investor Shares and International-Institutional Shares, respectively. |
| (2) | Net of redemption fees of $74,205 and $41,388 for International-Investor Shares and International-Institutional Shares, respectively. |
Artisan Funds and the Adviser were defendants in a lawsuit that sought certification of a plaintiff class consisting of all persons in the United States who held shares in International Fund for a period of more than 14 days during the five years prior to the filing of the lawsuit. The suit sought compensatory and punitive damages under state law, as well as interest, costs and attorney’s fees. The lawsuit alleged, in summary, that Artisan Funds and the Adviser exposed long-term International Fund shareholders to trading by market timers by allegedly (a) failing to properly evaluate daily whether a significant event affecting the value of International Fund’s
30
THIRTY
NOTES TO FINANCIAL STATEMENTS
securities had occurred after foreign markets had closed but before the calculation of the Fund’s NAV; (b) failing to implement the Fund’s portfolio valuation and share pricing policies and procedures; (c) allowing portfolio valuation and share policies and procedures that benefited market timers at the expense of long-term shareholders; and (d) failing to know and implement applicable rules and regulations concerning the calculation of NAV.
After a successful appeal by Artisan Funds and the Adviser to the United States Court of Appeals for the Seventh Circuit, the plaintiff’s state law claims were dismissed. The plaintiffs are seeking review by the United States Supreme Court. If the Supreme Court grants review of the case and the plaintiff prevails, the lawsuit could be reinstated. If that occurs, Artisan Funds and the Adviser will continue to defend the lawsuit vigorously.
Certain legal fees incurred by Artisan Funds in defense of the lawsuit and related insurance recoveries of $565,637 have been allocated to International Fund and are included in professional fees in the Statement of Operations. Artisan Funds does not believe that the action described herein will have a material effect on the financial condition of any Fund.
31
THIRTY-ONE
Report of Independent Registered Public Accounting Firm
To the Board of Directors and Shareholders of Artisan Funds, Inc.
We have audited the accompanying statements of assets and liabilities, including the schedules of investments, of Artisan International Fund and Artisan Mid Cap Fund, two series constituting Artisan Funds, Inc. (the “Funds”) as of September 30, 2005, and the related statements of operations for the year then ended, the statements of changes in net assets for each of the two years in the period then ended, and the financial highlights for each of the two years in the period then ended and for the period from July 1, 2003 to September 30, 2003. These financial statements and financial highlights are the responsibility of the Funds’ management. Our responsibility is to express an opinion on these financial statements and financial highlights based on our audits. The financial highlights of the Funds for the periods ended prior to September 30, 2003, were audited by other auditors whose report dated July 31, 2003, expressed an unqualified opinion on those financial highlights.
We conducted our audits in accordance with the standards of the Public Company Accounting Oversight Board (United States). Those standards require that we plan and perform the audit to obtain reasonable assurance about whether the financial statements and financial highlights are free of material misstatement. We were not engaged to perform an audit of the Funds’ internal control over financial reporting. Our audits included consideration of internal control over financial reporting as a basis for designing audit procedures that are appropriate in the circumstances, but not for the purpose of expressing an opinion on the effectiveness of the Funds’ internal control over financial reporting. Accordingly, we express no such opinion. An audit also includes examining, on a test basis, evidence supporting the amounts and disclosures in the financial statements and financial highlights, assessing the accounting principles used and significant estimates made by management, and evaluating the overall financial statement presentation. Our procedures included confirmation of securities owned as of September 30, 2005, by correspondence with the custodian and brokers or by other appropriate auditing procedures where replies from brokers were not received. We believe that our audits provide a reasonable basis for our opinion.
In our opinion, the financial statements and financial highlights referred to above present fairly, in all material respects, the financial position of Artisan International Fund and Artisan Mid Cap Fund of Artisan Funds, Inc. at September 30, 2005, the results of their operations for the year then ended, the changes in their net assets for each of the two years in the period then ended, and the financial highlights for each of the two years in the period then ended and for the period from July 1, 2003 to September 30, 2003, in conformity with U.S. generally accepted accounting principles.

Milwaukee, Wisconsin
November 10, 2005
32
THIRTY-TWO
NOTES TO FINANCIAL STATEMENTS
Other Federal tax information (unaudited):
The Internal Revenue Code requires that shareholders be notified within 60 days of the Funds’ fiscal year-end of certain information regarding long-term capital gains and qualified dividend income. This data is informational only. Every year in January, shareholders are sent a Form 1099-DIV, which provides the federal tax status of dividends and distributions received during the calendar year. Shareholders are advised to consult their own tax advisor with respect to the specific tax consequences of investment in the Funds.
Each Fund hereby designates the following amounts as (i) long-term capital gain distributions for purposes of the dividends paid deduction (including earnings and profits distributed to shareholders on redemption of Fund shares), and (ii) the amount of ordinary dividends paid during the fiscal year ended September 30, 2005 that are considered qualified dividend income as defined in the Jobs and Growth Tax Relief Reconciliation Act of 2003.
| | | | | | |
| Fund | | Long-Term Capital Gains | | Qualified Dividend Income | |
International | | $ | - | | 100.00 | % |
Mid Cap | | | 426,852 | | - | |
33
THIRTY-THREE
SHAREHOLDER EXPENSE EXAMPLE
As a shareholder of Artisan Funds, you incur two types of costs: (1) transaction costs, including redemption fees; and (2) ongoing costs, including management fees, and other Fund expenses. This example is intended to help you understand your ongoing costs (in dollars) of investing in a Fund and to compare these costs with the ongoing costs of investing in other mutual funds.
The example is based on an investment of $1,000 invested at the beginning of the period and held for the entire period from April 1, 2005 to September 30, 2005.
Actual Expenses
The first line under the name of each Fund in the table below provides information about actual account values and actual expenses. You may use the information in this line, together with the amount you invested, to estimate the expenses that you paid over the period. Simply divide your account value by $1,000 (for example, an $8,600 account value divided by $1,000 = 8.6), then multiply the result by the number in the first line under the name of your Fund under the heading entitled “Expenses Paid During Period” to estimate the expenses you paid on your account during this period.
Hypothetical Example for Comparison Purposes
The second line below each Fund’s name in the table below provides information about hypothetical account values and hypothetical expenses based on each Fund’s actual expense ratio for the six months ended September 30, 2005 and an assumed rate of return of 5% per year before expenses, which is not the Fund’s actual return. The hypothetical account values and expenses may not be used to estimate the actual ending account balances or expenses you paid for the period. You may use this information to compare the ongoing costs of investing in each Fund and other funds. To do so, compare the 5% hypothetical example with the 5% hypothetical examples that appear in the shareholder reports of the other funds.
Please note that the expenses shown in the table are meant to highlight your ongoing costs only and do not reflect any transactional costs, such as redemption fees. Therefore, the second line of the table is useful in comparing ongoing costs only, and will not help you determine the relative costs of owning different funds. If these transactional costs were included, your costs would have been higher.
| | | | | | | | | |
| | | Beginning
Account Value
4/1/2005 | | Ending Account Value
9/30/2005 | | Expenses Paid During
Period* 4/1/2005-9/30/2005 |
Artisan International Fund - Institutional Shares | | | | | | | | | |
Actual | | $ | 1,000.00 | | $ | 1,109.40 | | $ | 5.18 |
Hypothetical (5% return before expenses) | | $ | 1,000.00 | | $ | 1,020.16 | | $ | 4.96 |
Artisan Mid Cap Fund - Institutional Shares | | | | | | | | | |
Actual | | $ | 1,000.00 | | $ | 1,078.00 | | $ | 4.95 |
Hypothetical (5% return before expenses) | | $ | 1,000.00 | | $ | 1,020.31 | | $ | 4.81 |
| * | Expenses are equal to the Fund’s ratio of expenses to average net assets for the six month period ended September 30, 2005 (shown below); multiplied by the average account value over the period; multiplied by 183/365 (to reflect the one-half year period). |
| | |
| Fund | | Annualized Ratio of Expenses to Average Net Assets for the Six Month
Period Ended September 30, 2005 |
Artisan International Fund - Institutional Shares | | 0.98% |
Artisan Mid Cap Fund - Institutional Shares | | 0.95 |
34
THIRTY-FOUR
NOTES ON MANAGEMENT’S DISCUSSION OF FUND PERFORMANCE
The discussions of each Fund included in this report include statistical information about the portfolios of each of the Funds. Except as otherwise noted, that information is as of September 30, 2005 and that information will vary with changes in a Fund’s portfolio investments. The performance information for each Fund relative to its benchmark index discussed in this Report was prepared by the Adviser using information reported by FactSet Databases (“FactSet”). For the purposes of assigning portfolio securities to a particular country, the Adviser considers an issuer to be from a particular country as designated by its securities information vendors. The Adviser currently uses MSCI as its primary source and FactSet as a secondary source for this information. As a result, Artisan Mid Cap Fund routinely holds securities of issuers organized outside the U.S., but with their primary trading markets in the U.S. In addition, Artisan Mid Cap Fund may hold a limited number of non-U.S. securities that are traded in the U.S., directly or as ADRs. Also based on the designations of the securities information vendors, Artisan International Fund routinely holds securities of issuers organized within the U.S. and/or issuers with their primary trading markets in the U.S. In the event (i) the Adviser’s securities information vendors do not assign a security to a particular country, or (ii) its primary vendor does not assign a security to a particular country and the secondary vendor has assigned a security to a particular country by using a methodology that is not the same as the methodology the primary vendor uses to assign a country, the Adviser assigns the security to a country using the primary vendor’s published criteria (to the extent available) or the Adviser’s own judgment. The primary information vendor’s criteria include the identity of the jurisdiction of the issuer’s incorporation, the main equity trading market for the issuer’s securities, the geographical distribution of the issuer’s operations and the location of the issuer’s headquarters.
For the purposes of assigning portfolio securities to a particular sector and industry, Artisan Mid Cap Fund assigns securities in accordance with the sector and industry classifications provided by The Frank Russell Company (to the extent available). Artisan International Fund assigns securities for these purposes in accordance with the sector and industry classifications provided by MSCI (to the extent available).
Definitions of Portfolio Statistics
Median Market Cap provides a measure of the market capitalization value of the companies in a portfolio. Market capitalization is the aggregate value of all a company’s outstanding common stock. Market capitalization is calculated by FactSet using the price as of the most recent month-end multiplied by the number of shares outstanding as shown in the financial statements of the issuer. Equal numbers of companies in the portfolio have market capitalizations higher and lower than the median. Weighted Average Market Cap is the average of the market capitalizations of the companies in the portfolio weighted by the size of each company’s position within the portfolio. Weighted Average Growth Rate is a measure of the rate at which a company’s earnings are expected to grow and is the average of the 3-5 year forecasted growth rates of each company in the portfolio, weighted by the size of the company’s position within the portfolio. Weighted Harmonic Average P/E is the harmonic average, which measures the price/earnings ratio (a measure of how expensive a stock is) of the Fund, excluding negative earners, weighted by the size of the company’s position within the portfolio. The earnings figures used are estimates for the current calendar year.
35
THIRTY-FIVE
NOTES ON MANAGEMENT’S DISCUSSION OF FUND PERFORMANCE
Descriptions of Indices
Each Fund’s performance is compared in this report to changes in one or more indices, including in all cases a broad-based index of changes in prices of securities in the market in which the Fund invests. All of the indices are unmanaged and their returns include reinvested dividends. Unlike the Funds’ returns, the returns of each index do not include the payment of sales commissions or other expenses that would be incurred in the purchase or sale of the securities included in that index.
The indices to which the Funds are compared are:
Artisan International Fund – Morgan Stanley Capital International EAFE® Index (MSCI EAFE®) is a market-weighted index of companies in developed markets, excluding the U.S. and Canada. The Morgan Stanley Capital International EAFE® Growth Index (MSCI EAFE® Growth) is a market-weighted index of companies in developed markets, excluding the U.S. and Canada, with higher price-to-book ratios.
Artisan Mid Cap Fund – Russell Midcap® Index is a market-weighted index of about 800 medium-sized U.S. companies. The Russell Midcap® Growth Index is a market-weighted index of those medium-sized companies included in the Russell Midcap® Index with higher price-to-book and higher forecasted growth values.
Trademarks
Trademarks and copyrights relating to the indices and products of portfolio companies mentioned in this report are owned by their respective owners. Except as otherwise indicated, the trademarks, including names, logos, slogans and service marks appearing in this report are the property of the Adviser and may not be copied, reproduced, published or in any way used without written permission.
PROXY VOTING POLICIES AND PROCEDURES
You may obtain a description of Artisan Funds’ proxy voting policies and procedures, without charge, upon request by calling 800.399.1770. That information also is included in Artisan Funds’ statement of additional information, which is available on the Funds’ website at www.artisanfunds.com and the Securities and Exchange Commission’s website at www.sec.gov.
Information relating to how each Artisan Fund voted proxies relating to portfolio securities held during the twelve months ended June 30 is available on the Funds’ website at www.artisanfunds.com and on the Securities and Exchange Commission’s website at www.sec.gov.
INFORMATION ABOUT PORTFOLIO SECURITIES
Artisan Funds files a complete schedule of portfolio holdings with the Securities and Exchange Commission for the quarters ending December 31 and June 30 (the first and third quarters of the Funds’ fiscal year) on Form N-Q. The Funds’ Forms N-Q are available on the Securities and Exchange Commission’s website at www.sec.gov. You may also review and copy those documents by visiting the Securities and Exchange Commission’s Public Reference Room in Washington, D.C. Information on the operation of the Public Reference Room may be obtained by calling the Securities and Exchange Commission at 800.SEC.0330.
36
THIRTY-SIX
DIRECTORS AND OFFICERS
The Board of Directors has overall responsibility for the conduct of the affairs of Artisan Funds. Each director serves an indefinite term of unlimited duration until the next annual meeting of shareholders and until the election and qualification of his or her successor. The Board of Directors may fill any vacancy on the board provided that after such appointment at least two-thirds of the directors have been elected by the shareholders. The shareholders may remove a director by a vote of a majority of the outstanding shares of the Funds at any meeting of shareholders called for the purpose of removing such director.
The Board of Directors elects the officers of Artisan Funds. Each officer serves until the election and qualification of his or her successor, or until he or she sooner dies, resigns, or is removed or disqualified. The Board of Directors may remove any officer with or without cause at any time.
The names and ages of the directors and officers as of November 15, 2005, the position each holds with the Funds, the date each was first elected to office, their principal business occupations and other directorships they have held during the last five years are shown below. Each director oversees all seven series of Artisan Funds.
| | | | | | | | |
| | | | | |
Name and Age at 11/15/05 | | Positions Held with Funds | | Date First
Elected or
Appointed to Office | | Principal Occupations during Past 5 Years | | Other Directorships Held |
| Directors who are not “interested persons” |
| David A. Erne – 62 | | Director and Independent Chair of the Board of Directors | | Director since 3/27/95; Independent Chair since 2/4/05 | | Partner of the law firm Reinhart Boerner Van Deuren s.c., Milwaukee, WI | | Trustee, Northwestern Mutual Life Insurance Company (individual life insurance, disability insurance and annuity company) |
| Thomas R. Hefty – 58 | | Director | | 3/27/95 | | Retired; Adjunct Faculty, Department of Business and Economics, Ripon College; Of Counsel to the law firm Reinhart Boerner Van Deuren s.c., Milwaukee, WI.; until December 2002, Chairman of the Board and Chief Executive Officer of Cobalt Corporation (provider of managed care and specialty business services) | | None |
| Jeffrey A. Joerres – 45 | | Director | | 8/9/01 | | Chairman of the Board (since May 2001), President and Chief Executive Officer of Manpower Inc. (non-governmental employment service organization); formerly, Senior Vice President, European Operations and Global Account Management and Development of Manpower Inc. | | Director, Johnson Controls, Inc. (manufacturer of automotive systems and building controls) |
37
THIRTY-SEVEN
DIRECTORS AND OFFICERS
| | | | | | | | |
| | | | | |
Name and Age at 11/15/05 | | Positions Held with Funds | | Date First
Elected or
Appointed to Office | | Principal Occupations during Past 5 Years | | Other Directorships Held |
| Patrick S. Pittard – 59 | | Director | | 8/9/01 | | Distinguished Executive in Residence (teaching position), University of Georgia. Until November 2001, Chairman of the Board, President and Chief Executive Officer of Heidrick & Struggles International, Inc. (executive search firm) | | Director, Jefferson Pilot Corporation (individual and group life insurance and annuity company); Former Chairman of the Board, The University of Georgia Foundation; Member, Board of Regents of the University System of Georgia |
| Howard B. Witt – 65 | | Director | | 3/27/95 | | Retired; formerly, Chairman of the Board, President and Chief Executive Officer of Littelfuse, Inc. until December 2004 (manufacturer of advanced circuit protection devices) | | Director, Littelfuse, Inc.; Director, Franklin Electric Co., Inc. (manufacturer of electric motors) |
| Director who is an “interested person”* |
| Andrew A. Ziegler – 48 | | Director, President and Chief Executive Officer | | Director since 1/5/95; and Chairman of the Board 1/5/95 - 12/19/03; President since 12/19/03 (Chief Executive Officer continuously since 1/5/95) | | Managing Director of Artisan Partners; Chairman and President of Artisan Distributors; until December 2003, Chairman of Artisan Funds | | None |
| Officers of Artisan Funds |
| Lawrence A. Totsky – 46 | | Chief Financial Officer and Treasurer | | 1/22/98 | | Managing Director and Chief Financial Officer of Artisan Partners; Vice President, Chief Financial Officer and Treasurer of Artisan Distributors | | None |
| Janet D. Olsen – 49 | | General Counsel and Secretary | | 1/18/01 | | Managing Director and General Counsel of Artisan Partners; Vice President and Secretary of Artisan Distributors | | None |
| * | Mr. Ziegler is an “interested person” of Artisan Funds, as defined in the Investment Company Act of 1940, because he is a Managing Director of the Adviser and an officer and director of Artisan Investment Corporation (the general partner of the Adviser). Mr. Ziegler and Carlene M. Ziegler (who are married to each other) control the Adviser. Mr. Ziegler is also President of Artisan Distributors, Artisan Funds’ principal underwriter. |
38
THIRTY-EIGHT
DIRECTORS AND OFFICERS
| | | | | | | | |
| | | | | |
Name and Age at 11/15/05 | | Positions Held with Funds | | Date First
Elected or
Appointed to Office | | Principal Occupations during Past 5 Years | | Other Directorships Held |
| Brooke J. Billick – 51 | | Chief Compliance Officer | | 8/19/04 | | Chief Compliance Officer and Associate Counsel of Artisan Partners; Chief Compliance Officer of Artisan Distributors; prior to joining Artisan Partners in February 2004, Vice President, Securities Counsel and Corporate Secretary of Marshall & Ilsley Trust Company, N.A. (bank) and M&I Investment Management Corp. (investment adviser) and Chief Legal Officer and Secretary of Marshall Funds, Inc. (mutual fund company) | | None |
| Carlene M. Ziegler – 49 | | Vice President | | 3/27/95 | | Managing Director of Artisan Partners and Portfolio Co-Manager of Artisan Small Cap Fund; until February 2005, Director of Artisan Funds | | None |
| Michael C. Roos – 47 | | Vice President | | 12/19/03 | | Managing Director of Artisan Partners; Vice President of Artisan Distributors; until December 2003, President of Artisan Funds | | None |
| Gregory K. Ramirez – 35 | | Assistant Secretary and Assistant Treasurer | | 1/22/98 | | Managing Director, Client Accounting of Artisan Partners since January 2003, Director of Client Accounting and Administration from January 2000 to December 2002 and Controller of Artisan Partners prior thereto; Assistant Treasurer of Artisan Distributors | | None |
| Sarah A. Johnson – 33 | | Assistant Secretary | | 2/5/03 | | Associate Counsel of Artisan Partners; prior to joining Artisan Partners in July 2002, Associate of the law firm Bell, Boyd & Lloyd LLC, Chicago, IL | | None |
The business address of the director and officers affiliated with Artisan Partners is 875 E. Wisconsin Avenue, Suite 800, Milwaukee, Wisconsin 53202. The addresses of the other directors are: Mr. Erne – 1000 N. Water Street, Milwaukee, Wisconsin 53202; Mr. Hefty – W233 N2080 Ridgeview Parkway, Waukesha, Wisconsin 53188; Mr. Joerres – 5301 North Ironwood, Milwaukee, Wisconsin 53217; and Mr. Pittard and Mr. Witt – c/o Artisan Funds, 875 E. Wisconsin Avenue, Suite 800, Milwaukee, Wisconsin 53202.
Artisan Funds’ statement of additional information (SAI) contains further information about the directors. Please call 800.399.1770 or visit our website at www.artisanfunds.com for a free copy of the SAI.
39
THIRTY-NINE
| | | | |
 | | ARTISAN FUNDS P.O. BOX 8412 BOSTON, MA 02266-8412 800.399.1770 | | |
(a) Registrant has adopted a code of ethics (the “Code”) that applies to its principal executive officer, principal financial officer and principal accounting officer (the “Covered Officers”).
(b) No disclosures are required pursuant to this Item 2(b).
(c) During the period covered by the report, registrant did not amend the Code.
(d) During the period covered by the report, registrant did not grant any waivers, including implicit waivers, from the provisions of the Code.
(e) Not applicable.
(f) A copy of the Code is filed as Exhibit (a)(1) to this Form N-CSR.
Item 3. | Audit Committee Financial Expert. |
Registrant’s board of directors has determined that Thomas R. Hefty, member and chairman of the registrant’s audit committee, qualifies as an “audit committee financial expert,” as such term is defined in Instruction 2(b) to Item 3 of Form N-CSR. Mr. Hefty is “independent” as such term is defined in paragraph (a)(2) of Item 3 of Form N-CSR.
Under applicable securities laws, a person who is determined to be an audit committee financial expert will not be deemed an “expert” for any purpose, including without limitation for the purposes of Section 11 of the Securities Act of 1933, as a result of being designated or identified as an audit committee financial expert. The designation or identification of a person as an audit committee financial expert does not impose on such person any duties, obligations, or liabilities that are greater than the duties, obligations, and liabilities imposed on such person as a member of the audit committee and board of directors in the absence of such designation or identification.
Item 4. | Principal Accountant Fees and Services. |
Aggregate fees billed to the registrant for professional services rendered by the registrant’s accountant are summarized in the tables below. The tables summarize fees billed (or to be billed) by the registrant’s principal accountant for work performed relating to each applicable period identified below.
Fees billed by Ernst & Young LLP:
| | | | | | |
| | | Fiscal Year Ended September 30, 2005
| | Fiscal Year Ended September 30, 2004
|
Audit Fees (a) | | $ | 121,300 | | $ | 112,500 |
Audit-Related Fees (b) | | $ | 21,375 | | $ | 18,200 |
Tax Fees (c) | | $ | 113,750 | | $ | 79,700 |
All Other Fees (d) | | | — | | | — |
(a) “Audit Fees” include amounts for professional services rendered by the principal accountant for the audit of the registrant’s annual financial statements and services that are normally provided by the accountant in connection with statutory and regulatory filings or engagements, including fees billed for review of the registrant’s post-effective amendments to the Funds’ registration statements filed on January 28, 2004 and November 30, 2004.
(b) “Audit-Related Fees” include amounts for assurance and related services by the principal accountant that are reasonably related to the performance of the audit of the registrant’s financial statements. Audit-related fees have not been reported under the item “audit fees” in the chart above.
The fees billed by Ernst & Young LLP during the fiscal year ended September 30, 2005 include fees billed for services for certain agreed upon procedures performed in conjunction with a review of the semi-annual report to shareholders at March 31, 2005.
(c) “Tax Fees” include amounts for professional services rendered by the principal accountant for tax compliance, tax advice and tax planning.
The fees billed by Ernst & Young LLP during the fiscal year ended September 30, 2005 include fees billed for (1) the review and preparation of the Funds’ income tax returns for the fiscal year ended September 30, 2005, which have not been billed as of the time of this filing; (2) the review of excise tax calculations and preparation of excise tax returns for the calendar year ended December 31, 2005, which also have not yet been billed as of the time of this filing; (3) the use of a PFIC database supplied by Ernst & Young LLP for the fiscal year ended September 30, 2003 and excise year ended December 31, 2003 (the fees were billed in two parts, the second of which occurred during the fiscal year ended September 30, 2005); and (4) the use of a Qualified Foreign Corporation (QFC) Database supplied by Ernst & Young LLP for the calendar year ended December 31, 2004. The fees billed by Ernst & Young LLP during the fiscal year ended September 30, 2004 include fees billed for (1) the review and preparation of the Funds’ income tax returns for the fiscal year ended September 30, 2004; (2) the review of excise tax calculations and preparation of excise tax returns for the calendar year ended December 31, 2004; and (3) the use of a PFIC database supplied by Ernst & Young LLP for the fiscal year ended September 30, 2003 and excise year ended December 31, 2003 (the fees were billed in two parts, the first of which occurred during the fiscal year ended September 30, 2004).
(d) None.
(e)(1) During its regularly scheduled periodic meetings, the registrant’s audit committee considers any requests to pre-approve any audit, audit-related, tax and other services to be provided by the principal accountants of the registrant. The audit committee has authorized its chairman to exercise that authority in the intervals between meetings; and the chairman presents any such pre-approvals to the audit committee at its next regularly scheduled meeting. Under paragraph (c)(7)(i)(C) of Rule 2-01 of Regulation S-X, pre-approval of non-audit services may be waived provided that: 1) the aggregate fees for all such services provided constitutes no more than five percent of the total amount of fees paid by the registrant to its principal accountant during the fiscal year in which services are provided, 2) such services were not recognized by the registrant at the time of engagement as non-audit services and 3) such services are promptly brought to the attention of the audit committee of the registrant and approved prior to the completion of the audit.
(e)(2) No services included in Items 4(b) - (d) above were approved pursuant to paragraph (c)(7)(i)(C) of Rule 2-01 of Regulation S-X.
(f) Less than 50 percent of the hours expended on the principal accountant’s engagement to audit the registrant’s financial statements for the most recent fiscal year were attributed to work performed by persons other than the principal accountant’s full-time, permanent employees.
(g) The aggregate fees billed for the fiscal years ended September 30, 2005 and September 30, 2004 by the registrant’s principal accountant for non-audit services rendered to the registrant are shown in the tables above and described under Items 4(b) – (d) above. For the registrant’s fiscal years ended September 30, 2005 and September 30, 2004, Ernst & Young LLP served as the registrant’s principal accountant and provided [no services and billed no fees,] for non-audit services rendered to the registrant’s adviser or entities controlling, controlled by or under common control with the adviser.
(h) The audit committee of the registrant’s board of directors has considered whether the provision of non-audit services that were rendered to the registrant’s investment adviser, and any entity controlling, controlled by or under common control with the investment adviser that provides ongoing services to the registrant that were not pre-approved pursuant to paragraph (c)(7)(ii) of Rule 2-01 of Regulation S-X is compatible with maintaining the principal accountant’s independence. The provisions of Rule 2-01(c)(7) were effective on May 6, 2003. No such services were rendered on or after May 6, 2003.
Item 5. | Audit Committee of Listed Registrants. |
Not applicable.
Item 6. | Schedule of Investments. |
The Schedule of Investments in securities of unaffiliated issuers is included as part of the annual report to shareholders filed under Item 1 of this Form.
Item 7. | Disclosure of Proxy Voting Policies and Procedures for Closed-End Management Investment Companies. |
Not applicable.
Item 8. | Portfolio Managers of Closed-End Management Investment Companies. |
Not applicable.
Item 9. | Purchases of Equity Securities by Closed-End Management Investment Company and Affiliated Purchasers. |
Not applicable.
Item 10. | Submission of Matters to a Vote of Security Holders. |
The registrant has a governance and nominating committee, which is responsible for selecting and nominating persons for election or appointment as members of registrant’s board of directors. At a meeting of the committee held on August 19, 2004, the committee adopted guidelines by which the committee, which is comprised entirely of independent directors, will consider any candidates for board membership (whether recommended by a shareholder, the committee, the board of directors or management personnel). The committee has not made any material changes to those procedures, which were disclosed in response to Item 9 of Form N-CSR filed by the registrant on November 30, 2004.
Item 11. | Controls and Procedures. |
(a) The registrant’s principal executive and principal financial officers have concluded, based on an evaluation of the registrant’s disclosure controls and procedures (as defined in Rule 30a-3(c) under the Investment Company Act of 1940, the “Disclosure Controls”) as of a date within 90 days prior to the filing date (the “Filing Date”) of this Form N-CSR (the “Report”), the Disclosure Controls are effectively designed to ensure that information required to be disclosed by the registrant in the Report is recorded, processed, summarized and reported by the Filing Date, including ensuring that information required to be disclosed in the Report is accumulated and communicated to the registrant’s management, including the registrant’s principal executive officer and principal financial officer, as appropriate to allow timely decisions regarding required disclosure.
(b) There were no changes in the registrant’s internal controls over financial reporting (as defined in Rule 30a-3(d) under the Investment Company Act of 1940) that occurred
during the registrant’s most recent fiscal year that have materially affected, or are reasonably likely to materially affect, the registrant’s internal control over financial reporting.
| | | | | |
(a) | | (1 | ) | | Code of Ethics for Principal Executive Officer, Principal Financial Officer and Principal Accounting Officer (as referenced in Item 2 above), attached hereto as Exhibit (a)(1) |
| | |
| | | (2 | ) | | Certifications of Andrew A. Ziegler, Principal Executive Officer and Lawrence A. Totsky, Principal Financial Officer pursuant to Rule 30a-2(a) under the Investment Company Act of 1940 (17 CFR 270.30a-2(a)), attached hereto as Exhibits (a)(2)(i) and (a)(2)(ii) |
| | |
(b) | | | | | Certification of Andrew A. Ziegler, Principal Executive Officer and Lawrence A. Totsky, Principal Financial Officer pursuant to Section 906 of the Sarbanes-Oxley Act of 2002, attached hereto as Exhibit (b) |
SIGNATURES
Pursuant to the requirements of the Securities Exchange Act of 1934 and the Investment Company Act of 1940, the registrant has duly caused this report to be signed on its behalf by the undersigned, thereunto duly authorized.
| | |
Artisan Funds, Inc. |
| |
By: | | /s/ ANDREW A. ZIEGLER |
| | | Andrew A. Ziegler |
| | | Principal Executive Officer |
Date: November 30, 2005 |
Pursuant to the requirements of the Securities Exchange Act of 1934 and the Investment Company Act of 1940, this report has been signed below by the following persons on behalf of the registrant and in the capacities and on the dates indicated.
| | |
| |
By: | | /s/ ANDREW A. ZIEGLER |
| | | Andrew A. Ziegler |
| | | Principal Executive Officer |
Date: November 30, 2005 |
| | |
| |
By: | | /s/ LAWRENCE A. TOTSKY |
| | | Lawrence A. Totsky |
| | | Principal Financial Officer |
Date: November 30, 2005 |