UNITED STATES
SECURITIES AND EXCHANGE COMMISSION
Washington, D.C. 20549
FORM N-CSR
CERTIFIED SHAREHOLDER REPORT OF REGISTERED MANAGEMENT
INVESTMENT COMPANIES
Investment Company Act file number 811-08932
Artisan Funds, Inc.
(Exact name of registrant as specified in charter)
875 East Wisconsin Avenue, Suite 800
Milwaukee, WI 53202
(Address of principal executive offices) (Zip Code)
| | |
| Janet D. Olsen | | Kevin J. McCarthy |
| Artisan Funds, Inc. | | Bell, Boyd & Lloyd LLC |
| 875 East Wisconsin Avenue, #800 | | Three First National Plaza, #3100 |
| Milwaukee, Wisconsin 53202 | | Chicago, IL 60602 |
(Name and address of agents for service)
Registrant’s telephone number, including area code: (414) 390-6100
Date of fiscal year end: 09/30/06
Date of reporting period: 09/30/06
Item 1. Reports to Shareholders.
ANNUAL
R E P O R T
SEPTEMBER 30, 2006
ARTISAN INTERNATIONAL FUND
ARTISAN INTERNATIONAL SMALL CAP FUND
ARTISAN INTERNATIONAL VALUE FUND
ARTISAN MID CAP FUND
ARTISAN MID CAP VALUE FUND
ARTISAN OPPORTUNISTIC VALUE FUND
ARTISAN SMALL CAP FUND
ARTISAN SMALL CAP VALUE FUND

ARTISAN FUNDS, INC.
INVESTOR SHARES
ARTISAN FUNDS
P.O. BOX 8412
BOSTON, MA 02266-8412
This report and the audited financial statements contained herein are provided for the general information of the shareholders of Artisan Funds. Investors should consider carefully before investing each Fund’s investment objective, risks and charges and expenses. For a prospectus, which contains that information and more information about each Fund, please call 800.344.1770 or visit our website at www.artisanfunds.com. Read it carefully before you invest or send money.
Company discussions are for illustration only and are not intended as recommendations of individual stocks. The discussions present information about the companies believed to be accurate, and the views of the portfolio managers, as of September 30, 2006. That information and those views may change, and the Funds disclaim any obligation to advise shareholders of any such changes. Artisan International Fund and Artisan Mid Cap Fund offer institutional classes of shares for institutional investors meeting certain minimum investment requirements. A report on each institutional class is available under separate cover.
Artisan Funds offered through Artisan Distributors LLC, member NASD.
TABLE OF CONTENTS
AVERAGE ANNUAL TOTAL RETURNS (as of 9/30/06)
| | | | | | | | | | | | | | | |
| | | 1-Year | | | 3-Year | | | 5-Year | | | 10-Year | | | Since
Inception | |
Artisan International Fund (inception 12/28/95) | | 19.84 | % | | 21.55 | % | | 12.33 | % | | 12.82 | % | | 13.97 | % |
Artisan International Small Cap Fund (inception 12/21/01) | | 21.63 | | | 28.47 | | | NA | | | NA | | | 25.37 | |
Artisan International Value Fund (inception 9/23/02) | | 25.38 | | | 26.90 | | | NA | | | NA | | | 30.62 | |
Artisan Mid Cap Fund (inception 6/27/97) | | 7.42 | | | 12.75 | | | 10.09 | | | NA | | | 16.98 | |
Artisan Mid Cap Value Fund (inception 3/28/01) | | 5.87 | | | 20.78 | | | 18.87 | | | NA | | | 15.12 | |
Artisan Opportunistic Value Fund (inception 3/27/06) | | NA | | | NA | | | NA | | | NA | | | 4.10 | |
Artisan Small Cap Fund (inception 3/28/95) | | 0.74 | | | 14.24 | | | 11.10 | | | 7.07 | | | 9.37 | |
Artisan Small Cap Value Fund (inception 9/29/97) | | 11.40 | | | 21.26 | | | 18.62 | | | NA | | | 13.51 | |
The performance quoted represents past performance, which does not guarantee future results. The investment return and principal value of an investment in a Fund will fluctuate, so that an investor’s shares in the Fund, when redeemed, may be worth more or less than their original cost. Current performance may be lower or higher than the performance data quoted. For current to most recent month-end performance information, visit www.artisanfunds.com or call 800.344.1770. The performance information shown for Artisan International Fund, Artisan International Small Cap Fund and Artisan International Value Fund does not reflect the deduction of a 2% redemption fee on shares held by an investor for 90 days or less and, if reflected, the fee would reduce the performance quoted. Artisan International Small Cap Fund’s investments in initial public offerings (IPOs) made a material contribution to the Fund’s performance. IPO investments are not an integral component of the Fund’s investment process and may not be available in the future. The performance shown for Artisan Opportunistic Value Fund is not annualized and may vary greatly over short periods, and current performance may be materially lower or higher than the performance data quoted. That Fund’s performance information reflects Artisan Partners’ undertaking to limit the Fund’s expenses, which may be terminated at any time, has been in effect since the Fund’s inception and has had a material impact on the Fund’s performance. In addition, the outside directors of Artisan Funds have waived that portion of their fees allocable to Artisan Opportunistic Value Fund for the first six months of the fiscal year ended September 30, 2006. Absent that expense waiver, the Fund’s performance would have been lower.
Artisan International Fund, International Small Cap Fund, International Value Fund & Opportunistic Value Fund: International investments involve special risks, including currency fluctuation, lower liquidity, different accounting methods and economic and political systems and higher transaction costs. These risks typically are greater in emerging markets. Artisan International Fund and International Small Cap Fund invest in growth stocks, which may underperform other asset types during a given period. Artisan International Small Cap Fund invests in the stocks of smaller companies, which tend to be more volatile and less liquid than those of larger companies, have underperformed the stocks of larger companies during some periods and tend to have a shorter history of operations than larger companies. Artisan International Value Fund invests in value stocks, which may underperform other asset types during a given period. In addition, the Fund may invest a significant portion of its assets in small and medium-sized companies, which tend to be more volatile and less liquid than those of large companies, have underperformed the stocks of larger companies during some periods and tend to have a shorter history of operations than larger companies.
Artisan Mid Cap Fund, Mid Cap Value Fund & Opportunistic Value Fund: Stocks of medium-sized companies tend to be more volatile than those of larger companies and have underperformed the stocks of small and large companies during some periods. Artisan Mid Cap Fund invests primarily in growth stocks, which may underperform other asset types during a given period. Artisan Mid Cap Value Fund and Artisan Opportunistic Value Fund invest primarily in value stocks, which may underperform other asset types during a given period.
Artisan Small Cap Fund & Small Cap Value Fund: Stocks of smaller companies tend to be more volatile and less liquid than those of larger companies, have underperformed the stocks of larger companies during some periods and tend to have a shorter history of operations than larger companies. Artisan Small Cap Fund invests primarily in growth stocks, which may underperform other asset types during a given period. Artisan Small Cap Value Fund invests primarily in value stocks, which may underperform other asset types during a given period.
ARTISAN INTERNATIONAL FUND (ARTIX)
| | |
| INVESTMENT PROCESS HIGHLIGHTS | | |
Artisan International Fund uses a fundamental stock selection process focused on identifying long-term growth opportunities. Themes. The investment team’s thematic approach identifies catalysts for change and develops investment themes with the objective of capitalizing on them globally. Changing demographics, developing technology, privatization of economic resources and outsourcing are among the long-term catalysts for change that currently form the basis for the team’s investment themes. The team incorporates these catalysts along with sector and regional fundamentals into a long-term global framework for investment analysis and decision-making. Sustainable Growth. The team applies a fundamental approach to identifying the long-term, sustainable growth characteristics of potential investments. The team seeks high quality companies that are well managed, have a dominant or improving market position and competitive advantages compared to industry and regional peers. Valuation. The team assesses the relationship between its estimate of a company’s sustainable growth prospects and its stock price. The team uses multiple valuation metrics to establish price targets. The Fund primarily invests in non-U.S. growth companies of all market capitalizations in developed and emerging markets. |
| | |
| PERFORMANCE HISTORY | | |
|
GROWTH OF AN ASSUMED $10,000 INVESTMENT (12/28/95 to 9/30/06)
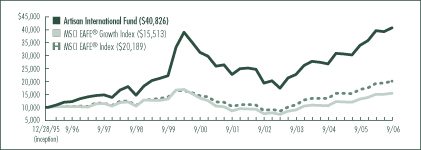
AVERAGE ANNUAL TOTAL RETURNS (as of 9/30/06)
| | | | | | | | | | | | | | | |
| Fund / Index | | 1-Year | | | 3-Year | | | 5-Year | | | 10-Year | | | Since
Inception | |
Artisan International Fund | | 19.84 | % | | 21.55 | % | | 12.33 | % | | 12.82 | % | | 13.97 | % |
MSCI EAFE® Growth Index | | 16.68 | | | 19.38 | | | 12.38 | | | 4.18 | | | 4.17 | |
MSCI EAFE® Index | | 19.16 | | | 22.32 | | | 14.26 | | | 6.82 | | | 6.75 | |
The performance quoted represents past performance, which does not guarantee future results. The investment return and principal value of an investment in the Fund will fluctuate, so that an investor’s shares in the Fund, when redeemed, may be worth more or less than their original cost. Current performance may be lower or higher than the performance data quoted. For current to most recent month-end performance information, visit www.artisanfunds.com or call 800.344.1770. The graph and table above do not reflect the deduction of taxes that a shareholder would pay on distributions or sale of Fund shares. The performance shown does not reflect the deduction of a 2% redemption fee on shares held by an investor for 90 days or less and, if reflected, the fee would reduce the performance quoted. See page 89 for a description of each index.
2
TWO
INVESTING ENVIRONMENT
The fiscal year ended September 30, 2006, was, on the whole, a good period for international equities. Taken in parts, the first half of the year was strong, while the second half was characterized by a fair amount of volatility.
During the first half of the fiscal year, the growth of the global economy and strong corporate profits created a fair amount of optimism in international markets. In early May, however, concerns that inflation and higher interest rates would stifle global growth, caused a steep decline among international equities. At the end of the period, concerns somewhat subsided as a more moderate inflation outlook, lower energy prices and still robust earnings growth bolstered confidence.
Weakness in the U.S. dollar generally added to the returns of U.S. dollar based investors, but the performance of currencies vis-à-vis the dollar varied quite substantially. Though the U.S. dollar was weak versus many major currencies, it strengthened against the Japanese yen. This was a key reason that Japan was among the laggards during the fiscal year in U.S. dollar terms.
PERFORMANCE DISCUSSION
The Fund performed well during the fiscal year as it returned 19.84%, outgaining the MSCI EAFE® Index, which advanced 19.16%. A number of our leading performers could be found in our energy and infrastructure, communications and global financials themes. Our holdings in the consumer staples sector also performed very well. The consumer discretionary sector was a source of weakness compared to the Index.
With expectations for capital spending high, there was high demand for our energy infrastructure providers: Italy-based Saipem S.p.A., Singapore-based Keppel Corporation Limited and Norwegian energy companies Acergy SA (formerly Stolt Offshore SA) and SeaDrill Ltd. Russian oil producer LUKOIL also performed well.
Canadian natural gas provider EnCana Corp fell roughly 20% during the period. EnCana struggled as natural gas prices fell and stayed at low levels.
Our valuation discipline led us to do some trimming in LUKOIL, EnCana, Saipem and Acergy.
TOP 10 HOLDINGS
| | | | | |
| Company Name | | Country | | 9/30/06 | |
UBS AG | | Switzerland | | 3.8 | % |
RWE AG | | Germany | | 3.0 | |
Credit Saison Co., Ltd. | | Japan | | 2.8 | |
Allianz AG | | Germany | | 2.4 | |
Nestle SA | | Switzerland | | 2.3 | |
Mizuho Financial Group, Inc. | | Japan | | 2.2 | |
ORIX Corporation | | Japan | | 2.2 | |
Kookmin Bank | | South Korea | | 2.1 | |
ASML Holding N.V. | | Netherlands | | 2.1 | |
Fortum Oyj | | Finland | | 2.0 | |
Total | | | | 24.9 | % |
As a percentage of total net assets. Top 10 Holdings are determined by issuer.
Chinese wireless provider China Mobile Ltd. was a leading contributor among our communications holdings. China Mobile generated strong subscriber growth and was solidifying its market position ahead of potential new entrants to the market by cutting prices.
European financials Fortis and UBS AG, Korean financials Kookmin Bank and Shinhan Financial Group Co., Ltd., and Japanese financial ORIX Corporation were leading gainers in our global financials theme.
Japanese credit card company Credit Saison Co., Ltd., and Japanese consumer finance company, AIFUL CORPORATION were two stocks in our global financials theme that underperformed. Both stocks struggled most of the year as the industry awaited the LDP’s (Liberal Democratic Party) decision on new consumer lending regulations, which could negatively impact revenues.
British grocer William Morrison Supermarkets PLC, Mexican retailer Wal-Mart de Mexico SA de CV (Walmex) and French food retailer Carrefour SA were three standouts among our consumer staples holdings. Morrison reported strong sales performance and was ahead of schedule with its 3-year optimization plan to improve margins. Walmex reported consistent same store sales growth, and floor space expansion. Carrefour sold its Korean business, which was expected to add to earnings, and
3
THREE
reported sales that indicated a recovery in its French supermarket business.
SECTOR DIVERSIFICATION
| | | | | | |
| Sector | | 9/30/05 | | | 9/30/06 | |
Consumer Discretionary | | 23.6 | % | | 11.8 | % |
Consumer Staples | | 9.8 | | | 9.8 | |
Energy | | 8.7 | | | 6.5 | |
Financials | | 30.4 | | | 37.3 | |
Healthcare | | 4.1 | | | 5.7 | |
Industrials | | 8.0 | | | 10.9 | |
Information Technology | | 6.8 | | | 4.8 | |
Materials | | — | | | 0.0(1 | ) |
Telecommunication Services | | 6.1 | | | 4.8 | |
Utilities | | 1.2 | | | 7.7 | |
Other assets less liabilities | | 1.3 | | | 0.7 | |
Total | | 100.0 | % | | 100.0 | % |
As a percentage of total net assets.
(1) Represents less than 0.1% of total net assets.
In the consumer discretionary sector, we were hurt by weakness in Japanese video game manufacturer SEGA SAMMY HOLDINGS, INC., and Japanese cable and internet service provider Jupiter Telecommunications Co., Ltd. Late in the period, Sega Sammy reported a decline in profits and increased development expenses in its consumer business. Jupiter Telecom suffered most early in the period due in part to concerns about competition from satellite providers and the potential for a decline in profitability. The price of its stock recovered some as the fiscal year wore on.
FUND CHANGES
During the fiscal year ended September 30, 2006, a large portion of our selling could be found in the consumer discretionary sector, mainly the media industry. We used proceeds from that selling in part to buy or add to a number of stocks in the utilities sector.
In the consumer discretionary sector, two of our most recent sales were retailer and luxury goods manufacturer PPR S.A. and French phone directories publisher PagesJaunes S.A. PPR benefited in part from good sales growth in its core Gucci brand and improvements in French retail. PagesJaunes is majority owned by France Telecom, which recently announced exclusive negotiations to sell its majority stake to a private equity company. We took the opportunity to sell our position.
The largest purchase in the utilities sector during the fiscal year was Finland-based Fortum Oyj, which provides a full range of energy-related services including generation, distribution and the sale of electricity. Fortum had been achieving power prices that were less than the continental averages, potentially creating a large growth opportunity if its realized power prices converge to the averages.
A few of our larger transactions outside of those sectors were the purchases of Bouygues SA and GlaxoSmithKline plc and the sales of Commerzbank AG and Siemens AG.
Bouygues is an industrial conglomerate involved in the telecom and construction industries. It is the world leader in road construction and it recently purchased a large stake in construction services firm Alstom. GlaxoSmithKline is a market leader in the vaccine industry, which has had high barriers to entry because of the research investment and knowledge required to produce vaccines.
Commerzbank, a German bank focused on retail customers and small to mid-sized enterprises, benefited from optimism about Germany’s economy and the acquisition of Eurohypo AG. Siemens is a German conglomerate that manufactures a wide range of industrial and consumer products. Recently it became clear that restructuring efforts were going to take longer than anticipated and we were concerned about weakness in Siemens’ end markets.
REGION ALLOCATION
| | | | | |
| Region | | 9/30/05 | | | 9/30/06 |
Europe | | 55.0 | % | | 55.4% |
Pacific Basin | | 25.2 | | | 29.0 |
Emerging Markets | | 15.3 | | | 14.0 |
Americas | | 3.2 | | | 0.9 |
As a percentage of total net assets.
4
FOUR
ARTISAN INTERNATIONAL SMALL CAP FUND (ARTJX)
| | |
| INVESTMENT PROCESS HIGHLIGHTS | | |
Artisan International Small Cap Fund uses a fundamental stock selection process focused on identifying long-term growth opportunities among small non-U.S. companies. Themes. The investment team’s thematic approach identifies catalysts for change and develops investment themes with the objective of capitalizing on them globally. Changing demographics, developing technology, privatization of economic resources and outsourcing are among the long-term catalysts for change that currently form the basis for the team’s investment themes. The team incorporates these catalysts along with sector and regional fundamentals into a long-term global framework for investment analysis and decision-making. Sustainable Growth. The team applies a fundamental approach to identifying the long-term, sustainable growth characteristics of potential investments. The team seeks high quality companies that are well managed, have a dominant or improving market position and competitive advantages compared to industry and regional peers. Valuation. The team assesses the relationship between its estimate of a company’s sustainable growth prospects and its stock price. The team uses multiple valuation metrics to establish price targets. The Fund primarily invests in non-U.S. small-cap growth companies in developed and emerging markets with market capitalizations less than $3 billion at the time of investment. |
| | |
| PERFORMANCE HISTORY | | |
|
GROWTH OF AN ASSUMED $10,000 INVESTMENT (12/21/01 to 9/30/06)

AVERAGE ANNUAL TOTAL RETURNS (as of 9/30/06)
| | | | | | | | | |
| Fund / Index | | 1-Year | | | 3-Year | | | Since
Inception | |
Artisan International Small Cap Fund | | 21.63 | % | | 28.47 | % | | 25.37 | % |
MSCI EAFE® Small Cap Index | | 15.16 | | | 26.21 | | | 22.92 | |
MSCI EAFE® Index | | 19.16 | | | 22.32 | | | 13.95 | |
The performance quoted represents past performance, which does not guarantee future results. The investment return and principal value of an investment in the Fund will fluctuate, so that an investor’s shares in the Fund, when redeemed, may be worth more or less than their original cost. Current performance may be lower or higher than the performance data quoted. For current to most recent month-end performance information, visit www.artisanfunds.com or call 800.344.1770. The graph and table above do not reflect the deduction of taxes that a shareholder would pay on distributions or sale of Fund shares. The performance shown does not reflect the deduction of a 2% redemption fee on shares held by an investor for 90 days or less and, if reflected, the fee would reduce the performance quoted. The Fund’s investments in initial public offerings (IPOs) made a material contribution to the Fund’s performance. IPO investments are not an integral component of the Fund’s investment process and may not be available in the future. See page 89 for a description of each index.
5
FIVE
INVESTING ENVIRONMENT
The fiscal year ended September 30, 2006, was a solid period for international small-cap stocks as the MSCI EAFE® Small Cap Index posted a gain of 15.16%. During the first half of the fiscal year, the growth of the global economy and strong corporate profits created a fair amount of optimism in the markets. In early May, however, concerns that inflation and higher interest rates would stifle global growth, caused a steep decline among international equities. At the end of the period, concerns somewhat subsided as a more moderate inflation outlook, lower energy prices and still robust earnings growth bolstered confidence.
Most sectors in the MSCI EAFE® Small Cap Index advanced during the period. The leading areas were the materials, energy and financial sectors, each of which increased more than 20%. From a regional perspective, stocks in Europe and in emerging markets posted solid returns. The U.S. dollar weakened during the period, and as a result, the MSCI EAFE® Small Cap Index had a local return of 14.03%, and a U.S. dollar-based return of 15.16%.
PERFORMANCE DISCUSSION
The Fund outperformed relative to the MSCI EAFE® Small Cap Index, primarily because of solid gains from our stocks in the industrial sector and holdings in our energy and consumer themes. On the downside, our results were hindered by weakness in our technology holdings.
Two of our leading contributors in the industrial sector were Swiss pumps manufacturer Sulzer AG and Mexican engineering and construction company Empresas ICA S.A. de C.V. Sulzer experienced strong order growth in three of its core divisions. Empresas reported solid revenue growth in its civil and industrial construction divisions, which was driven in part by airport and highway projects. As the need for more infrastructure continued to grow in Mexico, Empresas’ long-term growth prospects remained attractive as the company was expected to benefit from new projects.
In our energy theme, expectations for capital spending were high due to tight industry capacity, an aging fleet of oil rigs and a shortage of offshore oil rigs, all of which we believed contributed to ongoing pricing power. We think this greatly benefited our energy holdings during the period. Three of our leading performers were Petroleum Geo-Services ASA (Norway), Sibir Energy PLC (United Kingdom) and SeaDrill Ltd. (Norway).
TOP 10 HOLDINGS
| | | | | |
| Company Name | | Country | | 9/30/06 | |
Empresas ICA S.A. de C.V. | | Mexico | | 3.2 | % |
Buhrmann NV | | Netherlands | | 3.1 | |
Fraser & Neave Limited | | Singapore | | 2.6 | |
Sibir Energy PLC | | United Kingdom | | 2.6 | |
CREED CORPORATION | | Japan | | 2.2 | |
Korea Investment Holdings Co. Ltd. | | South Korea | | 2.2 | |
Elekta AB | | Sweden | | 2.1 | |
Geodis SA | | France | | 2.0 | |
Banco Latinoamericano de Exportaciones, S.A. | | Panama | | 1.9 | |
Commercial International Bank | | Egypt | | 1.9 | |
Total | | | | 23.8 | % |
As a percentage of total net assets. Top 10 Holdings are determined by issuer.
Petroleum Geo-Services is one of the world’s largest providers of oilfield-mapping services. The seismic market continued to improve and the company announced plans to spin off its oil-production unit. The spin-off was expected to provide the company increased flexibility to pursue growth opportunities within its seismic business. We sold Petroleum Geo-Services at a gain. Sibir Energy, a British independent oil and gas production company, benefited from operational progress at its Salym Field project and increases in both production and reserves at its Magma Field. Drilling services provider SeaDrill benefited from strong demand for its rigs and it completed the acquisition of Smedvig ASA (a holding we sold in January), another Norwegian driller.
One of our energy-related holdings that partially offset these results was gas distributor Panva Gas Holdings Limited. The company was hurt in part by a slowdown in gas connections. We continued to like Panva’s growth potential due to the development of new projects and growing power demand in China.
6
SIX
SECTOR DIVERSIFICATION
| | | | | | |
| Sector | | 9/30/05 | | | 9/30/06 | |
Consumer Discretionary | | 12.8 | % | | 7.3 | % |
Consumer Staples | | 4.4 | | | 7.1 | |
Energy | | 10.7 | | | 10.1 | |
Financials | | 24.6 | | | 31.5 | |
Healthcare | | 6.4 | | | 2.9 | |
Industrials | | 22.6 | | | 29.4 | |
Information Technology | | 5.4 | | | 0.1 | |
Materials | | 2.8 | | | 3.2 | |
Telecommunication Services | | 3.1 | | | 1.3 | |
Utilities | | 2.0 | | | 2.2 | |
Other assets less liabilities | | 5.2 | | | 4.9 | |
Total | | 100.0 | % | | 100.0 | % |
As a percentage of total net assets.
In our consumer theme, standout performers included Hengan International Group Company Limited (HongKong) and real estate developers Cyrela Brazil Realty S.A. (Brazil) and JM AB (Sweden). Hengan International is one of the leading brands in personal hygiene products in China. It benefited from strong sales growth in each of its primary divisions—tissue paper, feminine hygiene products and disposable diapers. Cyrela Brazil benefited from good sales growth, increased backlog and strong demand conditions, while JM experienced sales growth due in part to a high level of production starts and increased housing prices. We sold our positions in Cyrela Brazil and JM.
Other strong performers included copper producer Aur Resources Inc. (Canada) and several holdings in our global financial theme including Hong Kong Exchanges & Clearing Limited (Hong Kong) and Indiabulls Financial Services Ltd. (India). Aur Resources benefited from a strong rise in copper prices during the period. Hong Kong Exchanges & Clearing benefited from increased trading volume. The stock of securities company Indiabulls Ltd. increased late in the fiscal year when the company joined the bidding process to acquire an Indian bank.
In the technology sector, weakness in Q-Free ASA hindered the Fund’s performance. Norway-based Q-Free, a leading supplier of electronic toll collection systems, declined early in the fiscal year due to downward pressure on earnings, which was driven in part by higher costs, despite an increase in revenue. We sold our position.
Other technology holdings that suffered declines were Japanese internet services company Sammy NetWorks Co., Ltd. and Norwegian enterprise software vendor Fast Search & Transfer ASA.
U.K.-based NETeller PLC, an online money transfer service, was another negative contributor to performance. It experienced higher staffing costs at its Canadian business due to wage inflation and increased hiring. Despite increased cost pressure, the company attracted more than half a million new customers. We purchased additional shares on weakness.
REGION ALLOCATION
| | | | | | |
| Region | | 9/30/05 | | | 9/30/06 | |
Europe | | 49.2 | % | | 43.8 | % |
Emerging Markets | | 22.0 | | | 24.9 | |
Pacific Basin | | 22.4 | | | 24.0 | |
Americas | | 1.2 | | | 2.4 | |
As a percentage of total net assets.
FUND CHANGES
The largest changes to the composition of the portfolio over the fiscal year were an increase in our financial weight and a reduction in our consumer discretionary holdings. In the financial sector our purchases included Singapore Exchange Limited (Singapore), Postal Savings Bank (Greece), Korea Investment Holdings Co. Ltd. (South Korea), Indiabulls Financial Services (India), Tian An China Investments Company Limited (Hong Kong), Queen’s Walk Investment Ltd. (United Kingdom) and Azimut Holding SpA (Italy).
In the consumer discretionary sector, we sold Nexity (French real estate developer), John Fairfax Holdings Limited (Australian newspaper publisher), Fadesa Inmobiliaria S.A. (Spanish residential real estate developer) and Gruppo Editoriale L’Espresso S.p.A. (Italian publishing firm), in addition to the previously mentioned sales of Cyrela Brazil and JM.
7
SEVEN
ARTISAN INTERNATIONAL VALUE FUND (ARTKX)
| | |
| INVESTMENT PROCESS HIGHLIGHTS | | |
Artisan International Value Fund uses a bottom-up investment process focused on identifying what the investment team believes are high quality, undervalued businesses that offer the potential for superior risk/reward outcomes. Undervaluation. Determining the intrinsic value of the business is the heart of the team’s research process. As long-term investors, it is the team’s core belief that valuation is the most crucial determinant of stock market return over the long-term. Business quality. The team seeks to invest in companies with a history of generating strong free cash flow, improving returns on capital and strong competitive positions in their industries. This criteria helps rule out businesses that are statistically cheap, but whose values are deteriorating over time. Financial strength. The team believes that investing in companies with strong balance sheets helps to reduce the potential for capital risk and provides company management the ability to build value when attractive opportunities are available. Shareholder-oriented management. The team’s research process attempts to identify management teams with a history of building value for shareholders. The Fund primarily invests in undervalued, non-U.S. companies of all market capitalizations in developed and emerging markets. |
| | |
| PERFORMANCE HISTORY | | |
|
GROWTH OF AN ASSUMED $10,000 INVESTMENT (9/23/02 to 9/30/06)
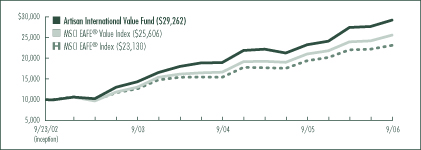
AVERAGE ANNUAL TOTAL RETURNS (as of 9/30/06)
| | | | | | | | | |
| Fund / Index | | 1-Year | | | 3-Year | | | Since
Inception | |
Artisan International Value Fund | | 25.38 | % | | 26.90 | % | | 30.62 | % |
MSCI EAFE® Value Index | | 21.63 | | | 25.23 | | | 26.36 | |
MSCI EAFE® Index | | 19.16 | | | 22.32 | | | 23.20 | |
The performance quoted represents past performance, which does not guarantee future results. The investment return and principal value of an investment in the Fund will fluctuate, so that an investor’s shares in the Fund, when redeemed, may be worth more or less than their original cost. Current performance may be lower or higher than the performance data quoted. For current to most recent month-end performance information, visit www.artisanfunds.com or call 800.344.1770. The graph and table above do not reflect the deduction of taxes that a shareholder would pay on distributions or sale of Fund shares. The performance shown does not reflect the deduction of a 2% redemption fee on shares held by an investor for 90 days or less and, if reflected, the fee would reduce the performance quoted. See page 89 for a description of each index.
8
EIGHT
INVESTING ENVIRONMENT
During the fiscal year ended September 30, 2006, global stock markets continued to advance, as they have since this equity bull market began in 2003. In U.S. dollar terms a number of European markets advanced well in excess of 20%. Near the end of the period we started to see a slowdown in many of the growth drivers that have characterized the global economic expansion of the last several years.
PERFORMANCE DISCUSSION
Artisan International Value Fund increased 25.38% during the twelve months ended September 30, 2006, outpacing the MSCI EAFE® Index, which increased 19.16%.
The share prices of the following companies had a meaningful positive impact on the portfolio during our fiscal year:
| • | | Euronext NV, which operates several European stock exchanges and the London International Financial Futures Exchange, advanced more than 120%. During the period, there were many merger discussions surrounding Euronext and other listed European exchanges. We significantly reduced our position. |
| • | | Countrywide PLC is the leading residential real estate broker in the U.K. Countrywide’s share price has benefited from signs of recovery in the real estate market as well as a recently announced takeover approach from private equity group 3i Group plc. Countrywide has no debt and has historically been a cash generating business. As of the end of the period, we were awaiting the specific terms of the offer. |
| • | | Pfeiffer Vacuum Technology AG’s price per share increased by more than 30% during the period. Pfeiffer is a German company that designs, manufactures and services a range of vacuum pumps used in a wide variety of applications including optical glass coating, semiconductor manufacturing, and scientific research. During the period, the company produced solid operating profit growth and announced a significant increase in its dividend. |
| • | | Cementir S.p.A., an Italian cement company, saw its share price increase roughly 56%. During the period, Cementir won the auction of a significant collection of cement assets in Turkey. The company also announced that its Italian cement operations had started to recover. |
| • | | Diageo PLC is the leading premium drinks provider in the world. It increased nearly 23% due in part to solid organic growth and sizeable dividends and share repurchases. |
TOP 10 HOLDINGS
| | | | | |
| Company Name | | Country | | 9/30/06 | |
Diageo PLC | | United Kingdom | | 5.0 | % |
Tyco International Ltd. | | United States | | 4.8 | |
Countrywide PLC | | United Kingdom | | 4.7 | |
Wolters Kluwer NV | | Netherlands | | 4.3 | |
Vodafone Group PLC | | United Kingdom | | 3.8 | |
Pfeiffer Vacuum Technology AG | | Germany | | 3.6 | |
Central Japan Railway Company | | Japan | | 3.2 | |
MEITEC CORPORATION | | Japan | | 3.0 | |
Benfield Group PLC | | United Kingdom | | 2.9 | |
Givaudan SA | | Switzerland | | 2.9 | |
Total | | | | 38.2 | % |
As a percentage of total net assets. Top 10 Holdings are determined by issuer.
Three stocks that detracted from the performance of the portfolio during the period were Premiere AG, CanWest Global Communications Corp. and Vodafone Group PLC.
| • | | Premiere is the leading provider of pay television in Germany and Austria. At the time of initial purchase, the company dominated the ownership of premium content, such as movies and sporting events, which is a key competitive advantage in this business. Unfortunately, during an auction, management made what looked to be a miscalculation and lost a bid for arguably its most important content, the German Bundesliga soccer matches. We sold our shares at a loss. |
| • | | CanWest is a holding company. It owns one of Canada’s television networks, which has been in a ratings slump, and a number of different publicly traded assets. CanWest has incurred higher programming costs in an effort to restore ratings of its free-to-air business, which has negatively impacted the company’s earnings. |
9
NINE
| • | | Vodafone, the world’s largest mobile phone company, slumped at the beginning of the fiscal year due to profit pressures. These pressures were the result of market saturation, regulatory intervention, competition and heavy investment in broadening the company’s third generation (3G) technology presence. In Spain and several emerging markets, growth prospects were such that the business overall continued to grow modestly. The investment case was supported by share repurchase activity, a dividend and a healthy balance sheet. |
SECTOR DIVERSIFICATION
| | | | | | |
| Sector | | 9/30/05 | | | 9/30/06 | |
Consumer Discretionary | | 21.1 | % | | 26.3 | % |
Consumer Staples | | 14.4 | | | 17.0 | |
Financials | | 24.3 | | | 18.4 | |
Healthcare | | 2.6 | | | — | |
Industrials | | 12.5 | | | 16.5 | |
Information Technology | | 1.6 | | | 2.8 | |
Materials | | 10.8 | | | 4.4 | |
Telecommunication Services | | 4.7 | | | 5.1 | |
Utilities | | 1.6 | | | 1.1 | |
Other assets less liabilities | | 6.4 | | | 8.4 | |
Total | | 100.0 | % | | 100.0 | % |
As a percentage of total net assets.
FUND CHANGES
We exited twelve companies during the fiscal year. Our most recent sales were: Clariant AG, Tim Participaçóes S.A., Tandberg ASA and People’s Food Holdings Limited.
Proceeds from our sales were used in part to purchase shares in Grupo Televisa S.A., SK Telecom Co., Ltd., Lancashire Holdings Ltd., Red Eléctrica de Espana and Honam Petrochemical Corporation. As of September 30, 2006, those companies represented 1.2%, 1.2%, 1.1%, 1.1% and 0.5% of the portfolio, respectively.
Grupo Televisa is the largest media company in the Spanish-speaking world. Based in Mexico, it has dominated the production of content, has had a near monopoly on free-to-air broadcasting, and has been the largest pay TV operator in the country through cable platforms. It has been highly profitable and has had a very healthy balance sheet with virtually no debt.
SK Telecom is the leading operator in the South Korean wireless market. Facing competitive pressures from an aggressive rival, it was selling at a significant discount to our estimate of its intrinsic value. In addition, we believed the company’s balance sheet was underutilized and offered tremendous value creation through share buy backs and dividends.
Lancashire Holdings is a start-up specialty insurance underwriter. The main target of the company’s underwriting strategy is retrocession (a form of reinsurance involving the assumption of risk from other reinsurers) and energy insurance in hurricane-affected areas. The company’s CEO has a good reputation, premium rates had risen significantly and we believed its valuation could prove cheap in a benign hurricane environment.
Red Eléctrica operates the Spanish electricity system. Thanks to solid growth in the demand for electricity in Spain, the business is undergoing an investment boom. When combined with an attractive regulatory regime, we believe the company has the potential for continued double-digit growth in earnings and dividends over the next five years.
Honam Petrochemical is one of the largest petrochemical companies in Korea. Honam is located close to the growing Chinese market. Our attraction to Honam was based primarily on valuation and the company’s strong balance sheet. In terms of the balance sheet, the company had net cash plus investments in public and non-public entities worth about half of the market capitalization at our initial purchase. In terms of valuation at the time of purchase, we estimated that the shares traded at a meaningful discount to book value.
REGION ALLOCATION
| | | | | | |
| Region | | 9/30/05 | | | 9/30/06 | |
Europe | | 64.4 | % | | 54.3 | % |
Pacific Basin | | 17.4 | | | 14.0 | |
Americas | | 5.7 | | | 12.5 | |
Emerging Markets | | 6.1 | | | 10.8 | |
As a percentage of total net assets.
10
TEN
ARTISAN MID CAP FUND (ARTMX)
| | |
| INVESTMENT PROCESS HIGHLIGHTS | | |
Artisan Mid Cap Fund uses a bottom-up investment process to construct a diversified portfolio of U.S. mid-cap growth companies. Security Selection. The team’s investment process begins by identifying companies possessing franchise characteristics (strong competitive positions), selling at attractive valuations and benefiting from an accelerating trend. The investment team looks for companies that are well positioned for long-term growth, driven by demand for their products and services, at an early enough stage in their profit cycle to benefit from the increased cash flows produced by the profit cycle. Capital Allocation. Based on the investment team’s fundamental analysis of a company’s profit cycle, portfolio holdings develop through three stages. GardenSM investments are small positions in the early part of their profit cycle that will warrant a more sizeable allocation once their profit cycle accelerates. CropSM investments are positions that are being increased to a full weight because they are moving through the strongest part of their profit cycle. HarvestSM investments are positions that are being reduced as they near the team’s estimate of full valuation or their profit cycle begins to decelerate. Broad Diversification. The team looks for investment opportunities across the entire economy so that it can find sustainable growth regardless of the sector or industry. The Fund primarily invests in medium-sized U.S. growth companies. The Fund generally maintains median and weighted average market capitalizations of less than $10 billion. |
| | |
| PERFORMANCE HISTORY | | |
GROWTH OF AN ASSUMED $10,000 INVESTMENT (6/27/97 to 9/30/06)
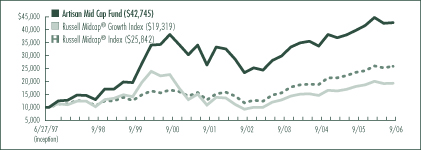
AVERAGE ANNUAL TOTAL RETURNS (as of 9/30/06)
| | | | | | | | | | | | |
| Fund / Index | | 1-Year | | | 3-Year | | | 5-Year | | | Since
Inception | |
Artisan Mid Cap Fund | | 7.42 | % | | 12.75 | % | | 10.09 | % | | 16.98 | % |
Russell Midcap® Growth Index | | 7.03 | | | 14.53 | | | 12.01 | | | 7.37 | |
Russell Midcap® Index | | 9.57 | | | 18.22 | | | 14.81 | | | 10.80 | |
The performance quoted represents past performance, which does not guarantee future results. The investment return and principal value of an investment in the Fund will fluctuate, so that an investor’s shares in the Fund, when redeemed, may be worth more or less than their original cost. Current performance may be lower or higher than the performance data quoted. For current to most recent month-end performance information, visit www.artisanfunds.com or call 800.344.1770. The graph and table above do not reflect the deduction of taxes that a shareholder would pay on distributions or sale of Fund shares. See page 89 for a description of each index.
11
ELEVEN
INVESTING ENVIRONMENT
During the fiscal year ended September 30, 2006, stocks of all sizes generally performed well, though large-caps were the leaders. During the period, the market continued to show a preference for value.
In the early part of the fiscal year stock gains were fairly strong. As the period wore on, the risks of inflation weighed on equity returns. A fall in energy prices and an end to the Federal Reserve’s string of interest rate hikes contributed to improved sentiment near the end of the period.
The best performing sectors in the Russell Midcap® Index were materials, transportation, financials and consumer staples which generated strong double-digit gains. The energy sector recorded a loss, as investors sold energy stocks with the declines in the prices of oil and natural gas. The producer durables sector also underperformed, but managed to eke out a small gain.
PERFORMANCE DISCUSSION
The Fund returned 7.42% during its fiscal year ended September 30, 2006, outperforming the Russell Midcap® Growth Index, which returned 7.03%, but coming up short of the 9.57% gain for the Russell Midcap® Index. Two key sources of strength in the portfolio relative to the benchmarks were our energy and infrastructure related holdings. Our performance in the technology sector was mixed. We were hurt by the relative weakness of our stocks in the consumer discretionary sector.
Our energy related investments have generally been centered around those companies that we believed were poised to benefit from a lengthy cycle of renewed global spending on energy development and infrastructure. This positioning helped the portfolio in two ways. First, it kept our allocation to crude producers low and crude producers generally declined during the period. Second, it led us to a number of energy infrastructure providers that generated solid gains. McDermott International, Inc., Cameron International Corporation and Smith International, Inc., were three of our best performers.
Worldwide energy services company McDermott International benefited from
TOP 10 HOLDINGS
| | | |
| Company Name | | 9/30/06 | |
Fisher Scientific International Inc. | | 3.8 | % |
Electronic Arts Inc. | | 2.6 | |
Allergan, Inc. | | 2.5 | |
Freescale Semiconductor, Inc. | | 2.5 | |
McDermott International, Inc. | | 2.2 | |
Juniper Networks, Inc. | | 2.2 | |
MGIC Investment Corporation | | 2.0 | |
Precision Castparts Corp. | | 1.9 | |
NII Holdings, Inc. | | 1.8 | |
Equifax Inc. | | 1.8 | |
Total | | 23.3 | % |
As a percentage of total net assets. Top 10 Holdings are determined by issuer
strong growth in backlog due to resurgence in drilling activity, solid operating margin performance and improving cash flows. Cameron International, a leading manufacturer of pressure control systems, equipment and services for oil and gas drilling and production, benefited from positive trends in the subsea market. Smith International is a worldwide supplier of premium products and services to the oil and gas exploration and production industry and is a dominant market player in both drill bits and drilling fluids. It benefited from higher oil rig activity and better pricing.
Logistics company Expeditors International of Washington, Inc. (EXPD) and cleaning products and services provider Ecolab Inc. were two leaders among our infrastructure holdings. We believed that EXPD was a well-managed company exposed to the development of the transportation market in Asia. Market share gains and a strong international freight environment drove solid growth at EXPD. During the period, revenue trends at Ecolab were solid due in part to evolving sanitation standards and increased awareness of infection control.
Student loan outsourcer The First Marblehead Corporation (FMD) was another top performer. FMD moved strongly higher as growth in tuition costs and enrollments rates contributed to demand for FMD’s services—loan disbursement processing, student
12
TWELVE
applications processing and securitization volumes. We sold our position.
In the technology sector, our leading contributor was Freescale Semiconductor, Inc. It advanced strongly in the latter part of the fiscal year after it reached an agreement with a consortium of private equity firms to be purchased at a price that valued the company at $40 per share. This represented a significant premium to the share price at the time of the announcement and it was very close to our private market value estimate.
On the downside, we were hurt by weakness in Juniper Networks, Inc., a leading provider of internet protocol (IP) routers and security solutions. It experienced a slowdown in demand as the market prepared for next generation IP networks. Widespread concern over options backdating also weighed on Juniper. We elected to reserve judgment on Juniper until we had all of the facts at hand.
In the consumer discretionary sector, a good portion of our security selection weakness was in stocks that we would identify as sensitive to ad spending. Two of our largest negative contributors in the sector were internet media company Yahoo! Inc. and stock photography company Getty Images, Inc. Yahoo! was experiencing a slowdown in ad spending in the auto and financial services industries and expected a delayed contribution from its new paid search platform. Getty was pressured by heightened competition and fears that its core business would be cannibalized by lower cost alternatives.
Private label women’s clothing retailer Chico’s FAS, Inc. was one of our more traditional consumer businesses that did not perform well during the fiscal year. Sales slowed due to poor merchandising and a reduction in store traffic.
FUND CHANGES
During the fiscal year ended September 30, 2006, we continued to apply our time-tested process to the portfolio. We seeded the portfolio with new GardenSM investments that we estimated were in the early stages of a positive profit cycle. We committed additional capital to our highest conviction ideas and harvested names where we felt the profit cycle had run its course or where we believed the valuation no longer made economic sense. At fiscal year-end, we had over 52% of portfolio assets in our top 30 holdings.
Recent GardenSM investments included Patterson Companies, Inc., a distributor of dental, veterinary and rehabilitation supplies; Amazon.com, Inc., an online retailer; Supervalu Inc., a grocery retailer; CIGNA Corporation, a healthcare benefits provider; Hospira, Inc., a specialty pharmaceutical and medication delivery company and Dresser-Rand Group Inc., a provider of rotating equipment solutions to the energy sector.
In addition to the sale of First Marblehead, we funded those purchases in part with the sales of AmerisourceBergen Corporation, Marvell Technology Group Ltd., Genzyme Corporation, Hewitt Associates, Inc. and Agilent Technologies, Inc., among others.
SECTOR DIVERSIFICATION
| | | | | | |
| Sector | | 9/30/05 | | | 9/30/06 | |
Auto & Transportation | | 0.9 | % | | 2.1 | % |
Consumer Discretionary | | 17.8 | | | 16.6 | |
Consumer Staples | | 2.8 | | | 2.2 | |
Financial Services | | 11.3 | | | 16.2 | |
Healthcare | | 19.6 | | | 17.5 | |
Materials & Processing | | 7.0 | | | 6.1 | |
Other | | 3.8 | | | 3.1 | |
Other Energy | | 6.8 | | | 4.8 | |
Producer Durables | | 6.7 | | | 5.5 | |
Technology | | 19.0 | | | 19.9 | |
Utilities | | 1.7 | | | 3.5 | |
Other assets less liabilities | | 2.6 | | | 2.5 | |
Total | | 100.0 | % | | 100.0 | % |
As a percentage of total net assets.
13
THIRTEEN
ARTISAN MID CAP VALUE FUND (ARTQX)
|
| INVESTMENT PROCESS HIGHLIGHTS |
Artisan Mid Cap Value Fund uses a bottom-up investment process to construct a diversified portfolio of U.S. mid-cap value companies that the investment team believes are undervalued, in sound financial condition and have attractive business economics. Attractive valuation. The team values a business using what it believes are reasonable expectations for the long-term earnings power and capitalization rates of that business. This results in a range of values for the company that the team believes would be reasonable. The team generally will purchase a security if the stock price falls below or toward the lower end of that range. Sound financial condition. The team favors companies with an acceptable level of debt and positive cash flow. At a minimum, the team tries to avoid companies that have so much debt that management may be unable to make decisions that would be in the best interests of the companies’ shareholders. Attractive business economics. The team favors cash-producing businesses that it believes are capable of earning acceptable returns on capital over the company’s business cycle. The team believes companies with these characteristics are less likely to experience eroding values over the long-term. The Fund primarily invests in U.S. securities with market capitalizations between $1.5 billion and $10 billion at the time of purchase. |
| PERFORMANCE HISTORY |
GROWTH OF AN ASSUMED $10,000 INVESTMENT (3/28/01 to 9/30/06)
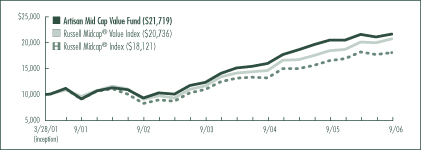
AVERAGE ANNUAL TOTAL RETURNS (as of 9/30/06)
| | | | | | | | | | | | |
| Fund / Index | | 1-Year | | | 3-Year | | | 5-Year | | | Since
Inception | |
Artisan Mid Cap Value Fund | | 5.87 | % | | 20.78 | % | | 18.87 | % | | 15.12 | % |
Russell Midcap® Value Index | | 12.27 | | | 21.17 | | | 16.63 | | | 14.15 | |
Russell Midcap® Index | | 9.57 | | | 18.22 | | | 14.81 | | | 11.39 | |
The performance quoted represents past performance, which does not guarantee future results. The investment return and principal value of an investment in the Fund will fluctuate, so that an investor’s shares in the Fund, when redeemed, may be worth more or less than their original cost. Current performance may be lower or higher than the performance data quoted. For current to most recent month-end performance information, visit www.artisanfunds.com or call 800.344.1770. The graph and table above do not reflect the deduction of taxes that a shareholder would pay on distributions or sale of Fund shares. See page 89 for a description of each index.
14
FOURTEEN
INVESTING ENVIRONMENT
The fiscal year ended September 30, 2006, was a strong period for mid-cap stocks as the Russell Midcap® Value and Russell Midcap® indices increased 12.27% and 9.57%, respectively. During the period, market participants priced most sectors in the Russell Midcap® Value Index higher, but the overall gain was held back by weakness in energy stocks. The last three months of the fiscal year were particularly detrimental to energy stocks as oil prices declined considerably.
The Fund was generally supported by the returns of our consumer discretionary and technology stocks during the period. Conversely, our holdings in the financial sector and our outsized investment in energy stocks dragged down returns.
PERFORMANCE DISCUSSION
Ryder System, Inc., Rent-A-Center, Inc., BEA Systems, Inc., Marvel Entertainment, Inc. and Claire’s Stores, Inc. were stocks that had a significant positive impact on the portfolio over the fiscal year ended September 30, 2006.
Ryder System advanced over 50% during the period. The company offers transportation services, including truck leasing and supply chain management. Our attraction to Ryder was our belief that the company’s high quality management team would move it through a turnaround phase and into a period of strong cash flow production. After a period of investment, Ryder’s core leasing business generated solid results, which contributed to a fair amount of optimism in the company’s shares.
Rent-A-Center is the largest rent-to-own operator in the United States. The company had strong cash flow generation, an aggressive share repurchase program and a low valuation compared to its peers. During the period, Rent-A-Center experienced improved sales trends and benefited from its store consolidation plan.
Infrastructure software company BEA Systems benefited from strong sales of its AquaLogicTM platform and double-digit gains in license revenue. BEA Systems is a technology leader in its market and continued to introduce new products as a means to stimulate sales. We sold our position in September as the stock reached our target selling range.
Marvel Entertainment is a globally recognized character franchise with a library of over 5,000 characters. Its high-margin licensing business has enabled Marvel to generate strong cash flow. During the period, Marvel regained the movie rights to Hulk, its second-largest character franchise behind Spider-Man licensing, and experienced an increase in publishing and toy sales.
Teenage fashion accessories retailer Claire’s Stores benefited from strong jewelry sales in North America. We began accumulating shares after the price decline in May and continued to pick up additional shares later in the period. Claire’s had no debt and it has participated in a large teen demographic space with considerable spending power.
Our outsized investment in energy names worked against us over the past twelve months. Pioneer Natural Resources Company and Cimarex Energy Co. were two of our holdings that were clipped by the sell-off in energy stocks. Pioneer Natural Resources had been in a transition period as it worked to improve its asset base through the sale of its deepwater Gulf of Mexico assets in order to focus mainly on North American onshore drilling. Pioneer suffered in the short-term during this transition process. Cimarex Energy experienced a production shortfall at its Gulf Coast operations, which put pressure on its stock price. We continued to hold Cimarex during the period in part because of its ability to generate free cash flow. We also liked its experienced management team and strong balance sheet.
Within the financials sector, our underperformance can be partly attributed to our minimal investment in real estate investment trusts (REITs) and to weakness in guaranteed student loan originator The Student Loan Corporation and check printing company Deluxe Corporation.
At Student Loan Corp., managed loan assets expanded, but lower net income left earnings below expectations. Deluxe Corp. experienced price competition for checks and its financial
15
FIFTEEN
position weakened. Having a strong financial condition is a key component of our discipline. We sold out of our position as the risk/reward scenario for Deluxe Corp. no longer fit the process we are committed to following.
Elsewhere in the portfolio, our trucking companies—Con-way Inc. and YRC Worldwide Inc.—hindered the Fund’s relative performance. Trucking companies in general came under pressure in the last few months of our fiscal year. Market participants have tended to trade these names on cyclical hopes and fears instead of investing based on their normalized earnings power as we do. Both of these companies have been among the leaders within the trucking industry and have been in strong financial shape.
TOP 10 HOLDINGS
| | | |
| Company Name | | 9/30/06 | |
The Student Loan Corporation | | 4.2 | % |
Alleghany Corporation | | 3.5 | |
Avnet, Inc. | | 3.4 | |
Pioneer Natural Resources Company | | 2.8 | |
Claire’s Stores, Inc. | | 2.8 | |
Zale Corporation | | 2.7 | |
Ingram Micro Inc. | | 2.6 | |
The Lubrizol Corporation | | 2.6 | |
Leggett & Platt, Incorporated | | 2.4 | |
Liz Claiborne Inc. | | 2.4 | |
Total | | 29.4 | % |
As a percentage of total net assets. Top 10 Holdings are determined by issuer.
FUND CHANGES
We made several purchases and sales during the fiscal year. Three of our largest purchases were Fidelity National Financial, Inc., Arthur J. Gallagher & Co. and Analog Devices, Inc. Fidelity National is the largest title insurer in the United States. The company paid an attractive dividend, traded at a large discount to its sum-of-the-parts valuation at the time of purchase and produced a solid return on equity in recent years. Arthur J. Gallagher is one of the world’s largest insurance brokers and risk management services companies. It recently generated solid returns on equity and has benefited from market share gains in its brokerage segment. Analog Devices is a leading supplier of analog, mixed signal and digital signal processors. We were attracted to the company’s huge cash position, no debt and attractive valuation. Its core businesses—analog converters and amplifiers—were solid, and the company is committed to the restructuring of its Digital Signal Processors business and the improvement of its operating margins.
Other recent purchases included Nabors Industries Ltd. (land drilling contractor), Allied World Assurance Holdings, Ltd. (specialty insurer/reinsurer), USG Corporation (building materials manufacturer), Chico’s FAS, Inc. (women’s clothing retailer) and Cognos Incorporated (business intelligence software developer).
In addition to the sales of BEA Systems and Deluxe Corporation, our purchases were funded in part by the sales of The Sherwin-Williams Company, Torchmark Corporation, Lexmark International, Inc., Old Republic International Corporation, Westar Energy, Inc. and Lear Corporation. We sold life insurance provider Torchmark and paint retailer Sherwin-Williams as their stocks reached our target selling ranges. The shares of printer manufacturer Lexmark International came under pressure due in part to increased competition and an aggressive pricing environment. The company had a strong financial position, but we concluded that we had misjudged the economics of the business and sold our position.
SECTOR DIVERSIFICATION
| | | | | | |
| Sector | | 9/30/05 | | | 9/30/06 | |
Auto & Transportation | | 2.9 | % | | 6.0 | % |
Consumer Discretionary | | 28.7 | | | 31.0 | |
Consumer Staples | | — | | | 4.2 | |
Financial Services | | 27.1 | | | 26.9 | |
Materials & Processing | | 7.0 | | | 4.3 | |
Other Energy | | 14.8 | | | 15.0 | |
Producer Durables | | 3.6 | | | 1.1 | |
Technology | | 7.9 | | | 8.6 | |
Utilities | | 1.0 | | | — | |
Other assets less liabilities | | 7.0 | | | 2.9 | |
Total | | 100.0 | % | | 100.0 | % |
As a percentage of total net assets.
16
SIXTEEN
ARTISAN OPPORTUNISTIC VALUE FUND (ARTLX)
INVESTMENT PROCESS HIGHLIGHTS
Artisan Opportunistic Value Fund uses a bottom-up investment process to construct a flexible portfolio of value-oriented companies that the team believes are undervalued, in solid financial condition and have attractive business economics.
Attractive valuation. The team values a business using what it believes are reasonable expectations for the long-term earnings power and capitalization rates of that business. This results in a range of values for the company that the team believes would be reasonable. The team generally will purchase a security if the stock price falls below or toward the lower end of that range.
Sound financial condition. The team favors companies with an acceptable level of debt and positive cash flow. At a minimum, the team tries to avoid companies that have so much debt that management may be unable to make decisions that would be in the best interests of the companies’ shareholders.
Attractive business economics. The team favors cash-producing businesses that it believes are capable of earning acceptable returns on capital over the company’s business cycle. The team believes companies with these characteristics are less likely to experience eroding values over the long-term.
The Fund primarily invests in securities with market capitalizations greater than $1.5 billion at the time of initial purchase.
The Fund can invest up to 25% of its assets in non-U.S. securities.
PERFORMANCE HISTORY
GROWTH OF AN ASSUMED $10,000 INVESTMENT (3/27/06 to 9/30/06)
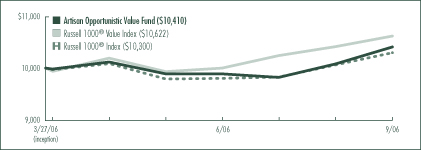
TOTAL RETURNS (as of 9/30/06)
| | | |
| Fund / Index | | Since
Inception(1) | |
Artisan Opportunistic Value Fund | | 4.10 | % |
Russell 1000® Value Index | | 6.22 | |
Russell 1000® Index | | 3.00 | |
| (1) | For the period from commencement of operations (March 27, 2006) through September 30, 2006; not annualized. |
The performance quoted represents past performance, which does not guarantee future results. The investment return and principal value of an investment in the Fund will fluctuate, so that an investor’s shares in the Fund, when redeemed, may be worth more or less than their original cost. The Fund’s performance may vary greatly over short periods and current performance may be materially lower or higher than the performance data quoted. For current to most recent month-end performance information, visit www.artisanfunds.com or call 800.344.1770. The graph and table above do not reflect the deduction of taxes that a shareholder would pay on distributions or sale of Fund shares. The Fund’s performance information reflects Artisan Partners’ undertaking to limit the Fund’s expenses, which may be terminated at any time, has been in effect since the Fund’s inception and has had a material impact on the Fund’s performance. In addition, the outside directors of Artisan Funds have waived that portion of their fees allocable to the Fund for the first six months of the fiscal year ended September 30, 2006. Absent that expense waiver, the Fund’s performance would have been lower. See page 89 for a description of each index.
17
SEVENTEEN
INVESTING ENVIRONMENT
From March 27, 2006 (the Fund’s inception) through September 30, 2006, equity markets made modest advances. Market participants showed a preference for defensive stocks amid a fair amount of uncertainty about the prospects for inflation and the economy. Large-cap stocks outperformed both small- and mid-cap companies during the period, and our list of leading performers included a number of large-cap stocks.
PERFORMANCE DISCUSSION
Consumer stocks rallied in the last two months of the period, as consumers welcomed a meaningful drop in gas prices and the Federal Reserve kept interest rates steady at two consecutive meetings. However, the group struggled in the period since the Fund’s inception. We were able to outperform in that environment with good stock selection. Carnival Corporation, EchoStar Communications Corporation and News Corporation each recorded solid gains.
TOP 10 HOLDINGS
| | | |
| Company Name | | 9/30/06 | |
NIKE, Inc. | | 5.1 | % |
Wal-Mart Stores, Inc. | | 5.0 | |
Apache Corporation | | 5.0 | |
American International Group, Inc. | | 4.8 | |
Microsoft Corporation | | 4.8 | |
Avnet, Inc. | | 4.4 | |
The Student Loan Corporation(1) | | 4.4 | |
Carnival Corporation | | 4.2 | |
Royal Bank of Scotland Group plc | | 3.9 | |
Citigroup Inc.(1) | | 3.8 | |
Total | | 45.4 | % |
As a percentage of total net assets. Top 10 Holdings are determined by issuer.
(1) Citibank, N.A., an indirect wholly-owned subsidiary of Citigroup Inc., is the primary shareholder of The Student Loan Corporation, with an ownership of 80% of The Student Loan Corporation’s outstanding common stock.
Cruise ship operator Carnival Corp. is the clear market leader in its segment of the leisure industry. We took the opportunity to purchase Carnival Corp. as market participants were concerned about fuel costs. We liked its strong financial condition, solid long-term growth potential, superior business economics and the high barriers to entry of the industry. During the period, the company experienced strong demand for its Alaskan and European trips, despite weak booking trends in its Caribbean markets. Fuel cost pressure moderated later in the period.
Satellite operator EchoStar Communications and media company News Corp. were two holdings that we sold as their stocks advanced strongly during the period. EchoStar Communications’ stock moved higher in July on rumors about a potential buyout from a competitor, The DIRECTV Group, Inc. It was reported that the motivation for the potential deal was possible cost savings for both companies. News Corp. benefited from advertising sales at its cable networks and the success of American Idol® at its Fox™ television network.
Other stocks that had a significant positive impact on the portfolio during the period were Ryder System, Inc., Royal Bank of Scotland Group plc and Bank of America Corporation.
Ryder System offers transportation services, including truck leasing and supply chain management. Our attraction to Ryder was our belief that the company’s high quality management team would move it through a turnaround phase and into a period of strong cash flow production. After a period of investment, Ryder’s core leasing business generated solid results, which contributed to a fair amount of optimism in the company’s shares.
Based in the United Kingdom, Royal Bank of Scotland is one of Europe’s leading financial services groups. By market cap, it is the second-largest bank in the United Kingdom and Europe and ranks fifth globally. We were attracted to the company’s strategy of providing a full range of services in many diverse product areas across multiple geographies, which has successfully created value in the past. At the time of purchase, the stock traded at a low price-to-earnings valuation relative to its peers, the company was financially strong, and management had announced a stock repurchase program and increased its dividend.
Bank of America is one of the largest banks in the U.S. It is also the leading issuer of consumer credit cards in the U.S., with a
18
EIGHTEEN
growing presence in certain international markets. Management has had a history of creating shareholder value through dividends and share repurchases, and its stock has traded at a significant discount to most large-cap banks. Its stock price advanced during the period, as the company benefited from strong loan growth and cost savings related to synergies created from its acquisition of MBNA Corporation. The company announced a 12% increase in its quarterly dividend in July.
The Fund’s largest detractors during the period included Dell Inc., The Student Loan Corporation and Avnet, Inc. Dell, the world’s largest computer maker, lowered its earnings outlook late in the period due to multiple factors, including ending its exclusive relationship with Intel Corporation. From a process standpoint, we often find investments that have had poor recent results or are in the process of change, so it is not uncommon for it to take some time for the stocks we buy to produce results. For Dell, we were willing to wait until the underlying fundamentals came closer to our normalized view. We used the weakness in Dell’s stock price to purchase additional shares as we continued to like its efficient business model, strong brand and cash generation ability.
Student Loan is one of the nation’s largest originators and holders of insured student loans. During the period, the company reported solid financial results primarily due to gains from the securitization of student loans. The recent decline in stock price was due in part to downward pressure on consumer finance companies in general and concerns about the November 2006 elections.
Electronic components distributor Avnet operates in a cyclical business and a perceived or possible peak in the cycle drove the company’s stock price down. On the positive side, the integration of Avnet’s acquisition of Memec, Inc. was tracking ahead of plan, which was generating meaningful cost synergies.
FUND CHANGES
In addition to the sales noted above, we also exited HCA Inc., SunTrust Banks, Inc. and Liberty Media Corporation during the period. Our most recent purchases included Valero Energy Corporation, Analog Devices, Inc. and YRC Worldwide Inc.
Valero Energy Corp. is the largest independent petroleum refiner in the United States. The company was exposed to the continued growth in refined product demand and refining capacity remained tight.
Analog Devices is a leading supplier of analog, mixed signal and digital signal processors. We liked the company’s huge cash position and lack of debt. Its core businesses—analog converters and amplifiers—were solid, and the company is committed to the restructuring of its Digital Signal Processors business and the improvement of its operating margins.
YRC Worldwide is the third largest North American trucking company, primarily offering less-than-truckload (LTL) services. The trucking industry has been pegged as a highly cyclical group and the prospect of a slowing economy put pressure on the stocks of trucking companies. We used that as our chance to establish a position in YRC Worldwide. The company has a broad network of customer relationships and has positioned itself well to gain share in the growing regional LTL market. YRC has more consistently generated free cash flow in recent years and authorized a $100 million share repurchase program in April. Its stock also traded at a low price-to-earnings valuation and a discount to its peers at the time of purchase.
SECTOR DIVERSIFICATION
| | | |
| Sector | | 9/30/06 | |
Auto & Transportation | | 2.1 | % |
Consumer Discretionary | | 24.2 | |
Financial Services | | 31.7 | |
Healthcare | | 3.6 | |
Integrated Oils | | 2.4 | |
Materials & Processing | | 2.8 | |
Other | | 3.8 | |
Other Energy | | 10.0 | |
Technology | | 16.7 | |
Other assets less liabilities | | 2.7 | |
Total | | 100.0 | % |
As a percentage of total net assets.
19
NINETEEN
ARTISAN SMALL CAP FUND (ARTSX)
| | |
| INVESTMENT PROCESS HIGHLIGHTS | | |
Artisan Small Cap Fund uses a bottom-up investment process to construct a diversified portfolio of U.S. small-cap growth companies. Competitive advantages. A sustainable competitive advantage is critical to producing above average growth and profitability. Identifying the source of a company’s competitive advantage lends confidence to the team’s assessment of intrinsic value. Return on invested capital. The team believes that, over time, a company with improving returns on its invested capital will be rewarded with a higher valuation. The team determines how much capital investment is needed to achieve a company’s continued growth and analyzes management’s ability to use that capital in the most effective way to support that growth. Intrinsic value. The team estimates a company’s intrinsic value—the value it thinks a buyer would pay to buy the entire company. The team bases its buy and sell targets for a company’s stock on its intrinsic value estimates. The Fund primarily invests in companies with market capitalizations between $200 million and $1.5 billion that meet its standards for earnings growth and sustainable growth prospects. |
| | |
| PERFORMANCE HISTORY | | |
GROWTH OF AN ASSUMED $10,000 INVESTMENT (3/28/95 to 9/30/06)
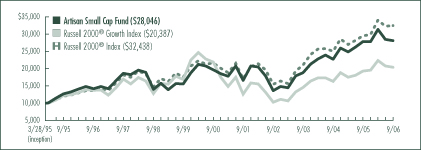
AVERAGE ANNUAL TOTAL RETURNS (as of 9/30/06)
| | | | | | | | | | | | | | | |
| Fund / Index | | 1-Year | | | 3-Year | | | 5-Year | | | 10-Year | | | Since
Inception | |
Artisan Small Cap Fund | | 0.74 | % | | 14.24 | % | | 11.10 | % | | 7.07 | % | | 9.37 | % |
Russell 2000® Growth Index | | 5.88 | | | 11.81 | | | 10.15 | | | 4.03 | | | 6.38 | |
Russell 2000® Index | | 9.92 | | | 15.48 | | | 13.78 | | | 9.06 | | | 10.76 | |
The performance quoted represents past performance, which does not guarantee future results. The investment return and principal value of an investment in the Fund will fluctuate, so that an investor’s shares in the Fund, when redeemed, may be worth more or less than their original cost. Current performance may be lower or higher than the performance data quoted. For current to most recent month-end performance information, visit www.artisanfunds.com or call 800.344.1770. The graph and table above do not reflect the deduction of taxes that a shareholder would pay on distributions or sale of Fund shares. See page 89 for a description of each index.
20
TWENTY
INVESTING ENVIRONMENT
The fiscal year ended September 30, 2006 was a volatile period for small-cap stocks. In the first half of the fiscal year, market participants responded positively to indications of strong economic growth and relatively benign inflation. However, as the year wore on, sentiment shifted and investors generally became more anxious about whether the Federal Reserve would be able to successfully limit the risks of inflation without stifling economic growth.
Without the benefit of perfect hindsight, it has been nearly impossible to determine whether or not the Federal Reserve successfully navigated an economic “soft landing” (a period of slower, yet still positive economic growth), but at the end of the fiscal year there were several indications that the economic backdrop had improved.
In the Russell 2000® and Russell 2000® Growth indices, performance varied widely across sectors during the period. The financials, materials and consumer staples sectors generated double-digit gains in both benchmarks. A decline in natural gas and oil prices left energy as the only sector to post losses in both benchmarks. The healthcare sector was another laggard.
PERFORMANCE DISCUSSION
The Fund performed well relative to the benchmarks in the transportation sector and had several winners in the financial sector. The technology, healthcare and energy sectors were areas of weakness compared to the indices.
The two largest contributors to performance among our transportation holdings were aftermarket car parts distributor Keystone Automotive Industries, Inc. and aftermarket aviation parts distributor Aviall, Inc. Keystone Automotive experienced increased usage of its aftermarket parts by insurers. This was an important long-term growth catalyst for Keystone Automotive because the insurance industry’s utilization of generic and aftermarket parts was very low. Aviall received a takeout offer from The Boeing Company. We sold our position.
TOP 10 HOLDINGS
| | | |
| Company Name | | 9/30/06 | |
Avocent Corporation | | 2.2 | % |
Interline Brands, Inc. | | 2.0 | |
ESCO Technologies Inc. | | 1.9 | |
Carter’s, Inc. | | 1.8 | |
HealthExtras, Inc. | | 1.8 | |
Guitar Center, Inc. | | 1.7 | |
Bright Horizons Family Solutions, Inc. | | 1.7 | |
Open Solutions Inc. | | 1.7 | |
Strayer Education, Inc. | | 1.7 | |
CRA International, Inc. | | 1.7 | |
Total | | 18.2 | % |
As a percentage of total net assets. Top 10 Holdings are determined by issuer.
In the financial sector, private student loan outsourcer The First Marblehead Corporation (FMD) was our standout performer. The private student loan market has been a very attractive segment of the student lending industry. Tuition at schools grew at a rate far in excess of income and enrollment rates rose, which created a huge funding gap that was filled by private student loans. FMD has benefited from loan disbursement processing, student applications processing and securitization volumes. We sold FMD because it was nearing our valuation target and the stock’s market cap had become quite large. Other winners in the financial sector included optionsXpress Holdings, Inc. (a leading online brokerage firm specializing in options trading), Open Solutions Inc. (software provider to the financial industry), HealthExtras, Inc. (pharmacy benefit manager) and La Quinta Corporation (Dallas-based hotel chain). We sold our position in La Quinta after it received a takeout offer.
A probe into options backdating impacted some of our technology holdings, including Openwave Systems Inc., a software provider to the telecom industry, and semiconductor manufacturer Semtech Corporation, contributing to their declines. We sold our position in Openwave due to the options investigation and uncertainties surrounding its business transition. We maintained our position in Semtech.
21
TWENTY-ONE
Networking systems manufacturer Tekelec also dropped during the period. Early in the fiscal year, Tekelec was hurt by the retirement of its CEO. As the period progressed, we lost confidence in the company’s future earnings potential and were uncomfortable with its new accounting methods. We sold our position.
Pharmaceutical research firm PharmaNet Development Group, Inc. (formerly SFBC International, Inc.) was the largest negative contributor among our healthcare holdings. Its shares were pressured in November 2005, as the company was the subject of negative press reports alleging deficiencies in the U.S. drug-testing industry. Due to the headline risk and our concern about the near-term outlook for the company, we sold the stock. Symmetry Medical Inc., a manufacturer of medical devices for the orthopedics industry, and specialty pharmaceutical company Salix Pharmaceuticals, Ltd. also suffered losses. Animal healthcare company VCA Antech, Inc. and PSS World Medical, Inc., which distributes medical products to elder care facilities and physicians’ offices, offset some of the negative contribution with strong gains.
The majority of our weakness in the energy sector could be attributed to coal producer James River Coal Company. Late in the period, production shortfalls could partly be attributed to new government regulations and a mudslide.
FUND CHANGES
During the latter part of the fiscal year, we made a concerted effort to flush out companies that we believed were not executing well. As of September 30, 2006, we held 73 stocks, which was down from 84 as of September 30, 2005. That is the lowest our holdings count has been in several years. We used the proceeds from our sales to reinvest in or purchase companies where we have higher conviction.
Three of our more recent purchases were Global Cash Access Holdings, Inc., Adams Respiratory Therapeutics, Inc. (ARXT) and The Geo Group, Inc.
Global Cash Access Holdings is the dominant provider of cash access products (ATMs, credit and debit cash advance and check cashing) and related services to the gaming industry. We liked the company’s market leading position and expected growth to be fueled by new products, new markets and transaction growth, as consumers increasingly shift toward electronic payments. ARXT is a specialty pharmaceutical company focused on marketing over-the-counter and prescription products for the treatment of respiratory disorders. We believed that the company had the ability to drive earnings growth through the development of its product pipeline and strategic product acquisitions. The GEO Group is the second largest private prison operator in the country. We purchased shares in the company because we believed the company was well positioned to fill the void created by growing inmate populations and a continued focus on homeland and border security.
We funded those purchases in part with the sales previously mentioned and a number of others that reached our target prices or where we reduced our growth expectations. Strategic Hotels & Resorts, Inc., Shuffle Master, Inc., The Children’s Place Retail Stores, Inc., BankUnited Financial Corporation, Bank Mutual Corporation and Jack in the Box® Inc. reached our target prices. Stocks we sold due to reduced growth expectations included IntraLase Corp., Martek Biosciences Corporation, Symmetry Medical, American Medical Systems Holdings, Inc., Brigham Exploration Company and Universal Technical Institute, Inc.
SECTOR DIVERSIFICATION
| | | | | | |
| Sector | | 9/30/05 | | | 9/30/06 | |
Auto & Transportation | | 3.8 | % | | 5.4 | % |
Consumer Discretionary | | 21.2 | | | 23.1 | |
Financial Services | | 14.1 | | | 19.8 | |
Healthcare | | 14.7 | | | 10.1 | |
Materials & Processing | | 3.8 | | | 4.7 | |
Other Energy | | 7.6 | | | 6.8 | |
Producer Durables | | 8.7 | | | 5.3 | |
Technology | | 22.4 | | | 21.8 | |
Other assets less liabilities | | 3.7 | | | 3.0 | |
Total | | 100.0 | % | | 100.0 | % |
As a percentage of total net assets.
22
TWENTY-TWO
ARTISAN SMALL CAP VALUE FUND (ARTVX)
| | |
| INVESTMENT PROCESS HIGHLIGHTS | | |
Artisan Small Cap Value Fund uses a bottom-up investment process to construct a diversified portfolio of U.S. small-cap value companies that the investment team believes are undervalued, in sound financial condition and have attractive business economics. Attractive valuation. The team values a business using what it believes are reasonable expectations for the long-term earnings power and capitalization rates of that business. This results in a range of values for the company that the team believes would be reasonable. The team generally will purchase a security if the stock price falls below or toward the lower end of that range. Sound financial condition. The team favors companies with an acceptable level of debt and positive cash flow. At a minimum, the team tries to avoid companies that have so much debt that management may be unable to make decisions that would be in the best interests of the companies’ shareholders. Attractive business economics. The team favors cash-producing businesses that it believes are capable of earning acceptable returns on capital over the company’s business cycle. The team believes companies with these characteristics are less likely to experience eroding values over the long-term. The Fund primarily invests in U.S. securities with market capitalizations below $1.5 billion at the time of purchase. |
| PERFORMANCE HISTORY |
GROWTH OF AN ASSUMED $10,000 INVESTMENT (9/29/97 to 9/30/06)
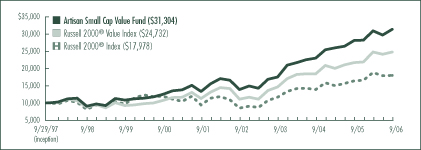
AVERAGE ANNUAL TOTAL RETURNS (as of 9/30/06)
| | | | | | | | | | | | |
| Fund / Index | | 1-Year | | | 3-Year | | | 5-Year | | | Since
Inception | |
Artisan Small Cap Value Fund | | 11.40 | % | | 21.26 | % | | 18.62 | % | | 13.51 | % |
Russell 2000® Value Index | | 14.01 | | | 19.04 | | | 16.96 | | | 10.58 | |
Russell 2000® Index | | 9.92 | | | 15.48 | | | 13.78 | | | 6.73 | |
The performance quoted represents past performance, which does not guarantee future results. The investment return and principal value of an investment in the Fund will fluctuate, so that an investor’s shares in the Fund, when redeemed, may be worth more or less than their original cost. Current performance may be lower or higher than the performance data quoted. For current to most recent month-end performance information, visit www.artisanfunds.com or call 800.344.1770. The graph and table above do not reflect the deduction of taxes that a shareholder would pay on distributions or sale of Fund shares. See page 89 for a description of each index.
23
TWENTY-THREE
INVESTING ENVIRONMENT
The fiscal year ended September 30, 2006, generally was a volatile but strong period for small-cap stocks. Several sectors in the Russell 2000® Value Index posted double-digit returns—materials and technology were two of the leaders. Energy diverged considerably on the downside, falling 9.70% during the period. The last three months of the fiscal year were particularly detrimental to energy stocks, as oil prices declined considerably.
The Fund generally was supported by the returns of our consumer, producer durable and technology stocks during the period. Conversely, our outsized investment in energy stocks relative to the Index hindered the Fund’s performance.
PERFORMANCE DISCUSSION
Several of our strongest performers could be found among our consumer-related holdings. Watson Wyatt Worldwide, Inc., AMN Healthcare Services, Inc., Gold Kist Inc., PETCO Animal Supplies, Inc., and Rent-A-Center, Inc. were leading contributors. Human resources consulting firm Watson Wyatt benefited from growth in its Benefits Group, which was due in part to an increase in plan design consulting work and pension administration. The company also authorized a repurchase of 1.5 million shares. Healthcare staffing company AMN Healthcare Services experienced growth in its permanent and temporary physician staffing business and strength in the pricing environment. The company generated strong cash flow, which it used to repurchase shares and pay down debt.
Chicken producer Gold Kist and pet supplies retailer PETCO both received takeout offers during the period. Gold Kist’s share price surged in August when Pilgrim’s Pride Corporation announced a tender offer for the shares of Gold Kist. PETCO, agreed to be acquired in July by two private equity firms and we sold our shares into strength.
Rent-A-Center is the largest rent-to-own operator in the United States. The company had strong cash flow generation, an aggressive share repurchase program and a low valuation compared to its peers. During the period, Rent-A-Center experienced improved sales trends and benefited from its store consolidation plan.
TOP 10 HOLDINGS
| | | |
| Company Name | | 9/30/06 | |
Watson Wyatt Worldwide, Inc. | | 3.2 | % |
Hilb Rogal & Hobbs Company | | 3.1 | |
Zale Corporation | | 2.7 | |
Stewart Information Services Corporation | | 2.6 | |
St. Mary Land & Exploration Company | | 2.3 | |
Lawson Software, Inc. | | 2.2 | |
Sanderson Farms, Inc. | | 1.9 | |
Furniture Brands International, Inc. | | 1.9 | |
Manhattan Associates, Inc. | | 1.8 | |
Cimarex Energy Co. | | 1.8 | |
Total | | 23.5 | % |
As a percentage of total net assets. Top 10 Holdings are determined by issuer.
Two of our wire and cable manufacturers, Belden CDT Inc. and General Cable Corporation, advanced strongly during the period, and we sold our positions as the stocks reached our target selling ranges. We originally were interested in these two companies because their industry was experiencing a period of stress due in part to overcapacity. As capacity rationalized and demand improved, the stocks performed well and we realized gains in both.
Two of the leading performers among our technology holdings were Altiris, Inc. and Advanced Digital Information Corporation. Systems management software provider Altiris improved the utility of its existing products by bundling products to make more functional packages for its customers. The company also benefited from its strategic relationship with Dell Inc. The stock of data storage company Advanced Digital Information surged in May when it agreed to be purchased by Quantum Corporation. The combination was expected to produce cost synergies and add to the earnings of the new entity. We sold our position as the news pushed Advanced Digital’s share price into our target selling range.
The Fund’s weakness in the financial sector stemmed primarily from the underperformance of Stewart Information Services Corporation and our minimal investment in real estate investment trusts (REITs). Results at title insurer Stewart were negatively influenced by employee costs during the slow down in the
24
TWENTY-FOUR
real estate market. Additionally, Stewart’s stock price historically has been volatile during periods of rising and falling interest rates as speculators have tended to use it as a proxy for long-term interest rates. The ten-year treasury fluctuated considerably during the period, and we opportunistically purchased additional shares.
Over the past year, our weight in energy investments in the portfolio fell significantly as we sold several positions, though we still found stocks within the energy sector in which to invest. Some examples of recent purchases included RPC, Inc., Energy Partners, Ltd. and Atwood Oceanics, Inc. Oil and gas exploration and production company Cimarex Energy Co. was one of our worst performers in the energy sector during the period. The company experienced a production shortfall at its Gulf Coast operations which put pressure on its stock price. We continued to hold Cimarex during the period in part because of its ability to generate free cash flow. We also liked its experienced management team and strong balance sheet.
SECTOR DIVERSIFICATION
| | | | | | |
| Sector | | 9/30/05 | | | 9/30/06 | |
Auto & Transportation | | 4.1 | % | | 3.5 | % |
Consumer Discretionary | | 31.0 | | | 30.3 | |
Consumer Staples | | — | | | 1.9 | |
Financial Services | | 14.4 | | | 14.0 | |
Healthcare | | 2.4 | | | 4.2 | |
Materials & Processing | | 9.3 | | | 9.8 | |
Other Energy | | 16.5 | | | 12.0 | |
Producer Durables | | 3.3 | | | 2.9 | |
Technology | | 11.2 | | | 11.6 | |
Utilities | | 1.9 | | | 2.5 | |
Other assets less liabilities | | 5.9 | | | 7.3 | |
Total | | 100.0 | % | | 100.0 | % |
As a percentage of total net assets.
FUND CHANGES
We found opportunities to purchase several new names during the period, including Applebee’s International, Inc., and Standard Microsystems Corporation. Applebee’s franchises and operates restaurants under the Applebee’s Neighborhood Grill & Bar® brand. The company had consistently repurchased shares over the past several years and had repeatedly shown its ability to achieve sales growth at its restaurants. Standard Microsystems is a semiconductor manufacturer for mobile and desktop personal computers. At the time of purchase, it had a cash position of roughly $6 per share and no debt. We purchased the stock because we believed the company would benefit from the increasing desire for connectivity between personal computers and consumer electronics devices.
Other recent purchases included Sonic Automotive, Inc., Tuesday Morning Corporation, Commercial Vehicle Group, Inc., Security Capital Assurance Ltd, OMI Corporation, Vail Resorts, Inc. and Hudson Highland Group, Inc.
In addition to the sales already noted, we sold ADVO, Inc., Superior Essex Inc., Movie Gallery, Inc., webMethods, Inc., OM Group, Inc., and Acuity Brands, Inc.
Video-rental chain Movie Gallery struggled with weak sales trends, poor box office performance and post-merger integration issues from its acquisition of Hollywood Entertainment Corporation. In August, the company announced its fourth loss in four quarters due in part to rising interest costs and restructuring costs. Because we had some concern about its financial condition, we sold our position.
Direct mail media company ADVO agreed to an acquisition offer from Valassis Communications, Inc. (a portfolio holding as of September 30, 2006), the largest provider of newspaper inserts. We sold our ADVO shares at a gain, which proved timely as news that the merger may not be completed was announced after we sold our position. Superior Essex, a manufacturer of wire and cable products, reached our target selling range as a healthy demand environment and better pricing power contributed to higher revenues and earnings.
25
TWENTY-FIVE
ARTISAN INTERNATIONAL FUND
Schedule of Investments – September 30, 2006
| | | | | |
| | | | | |
| | | Shares
Held | | Value |
COMMON AND
PREFERRED STOCKS - 99.3% | | | |
| | | | | |
| AUSTRALIA - 1.6% | | | | | |
Publishing & Broadcasting Limited | | 16,115,816 | | $ | 223,887,163 |
| | | | | |
| AUSTRIA - 0.8% | | | | | |
Wiener Staedtische Versicherung AG | | 1,742,306 | | | 109,361,951 |
| | | | | |
| BELGIUM - 1.7% | | | | | |
Fortis | | 5,935,575 | | | 240,851,521 |
Umicore | | 9,380 | | | 1,388,067 |
| | | | | |
| | | | | 242,239,588 |
| BRAZIL - 0.3% | | | | | |
Vivo Participacoes S.A., Preferred (ADR)(1) | | 13,530,268 | | | 42,214,436 |
| | | | | |
| CANADA - 0.9% | | | | | |
EnCana Corp | | 2,678,700 | | | 124,642,529 |
| | | | | |
| CHINA - 3.4% | | | | | |
China Life Insurance Co., Limited | | 16,014,000 | | | 31,326,444 |
China Merchants Holdings International Company Limited | | 33,143,500 | | | 97,422,699 |
China Mobile Ltd. | | 35,948,700 | | | 254,711,512 |
China Unicom Limited | | 83,863,400 | | | 82,457,002 |
| | | | | |
| | | | | 465,917,657 |
| DENMARK - 0.4% | | | | | |
Carlsberg A/S, B Shares | | 629,000 | | | 52,899,394 |
| | | | | |
| FINLAND - 2.0% | | | | | |
Fortum Oyj | | 10,460,530 | | | 278,686,775 |
| | | | | |
| FRANCE - 9.1% | | | | | |
Alstom(1) | | 1,038,206 | | | 93,932,121 |
Axa | | 3,875,252 | | | 142,899,586 |
Bouygues SA | | 2,960,237 | | | 158,332,357 |
Carrefour SA | | 3,790,879 | | | 239,534,144 |
Electricite de France (EDF) | | 2,484,725 | | | 138,003,169 |
LVMH Moet Hennessy Louis Vuitton SA | | 1,765,512 | | | 181,899,147 |
Safran SA | | 2,274,982 | | | 45,983,593 |
Sanofi-Aventis | | 557,773 | | | 49,651,368 |
Technip SA | | 2,062,167 | | | 117,201,266 |
Vinci SA | | 939,008 | | | 104,544,316 |
| | | | | |
| | | | | 1,271,981,067 |
| | | | | |
| | | | | |
| | | Shares
Held | | Value |
| GERMANY - 8.5% | | | | | |
Allianz AG | | 1,932,746 | | $ | 334,487,903 |
Deutsche Post AG | | 4,080,528 | | | 107,108,349 |
E.ON AG | | 1,143,626 | | | 135,562,429 |
IVG Immobilien AG | | 1,241,382 | | | 44,925,822 |
RWE AG | | 4,595,757 | | | 423,961,748 |
SAP AG | | 678,078 | | | 134,478,551 |
| | | | | |
| | | | | 1,180,524,802 |
| HONG KONG - 2.5% | | | | | |
Hutchison Whampoa Limited | | 4,655,000 | | | 41,078,889 |
MTR Corporation Limited | | 30,280,000 | | | 76,024,054 |
NWS Holdings Limited | | 23,556,800 | | | 48,802,956 |
Sun Hung Kai Properties Limited | | 14,394,400 | | | 156,957,928 |
Swire Pacific Limited, A Shares | | 2,797,577 | | | 29,212,311 |
| | | | | |
| | | | | 352,076,138 |
| INDONESIA - 0.0%(2) | | | | | |
PT Bank Mandiri | | 12,160,500 | | | 3,064,841 |
| | | | | |
| ITALY - 5.0% | | | | | |
Banca Intesa S.p.A. | | 5,115,021 | | | 33,662,890 |
Capitalia S.p.A | | 222,000 | | | 1,838,242 |
Mediobanca S.p.A. | | 4,841,131 | | | 105,587,353 |
Saipem S.p.A. | | 9,652,867 | | | 209,799,167 |
Telecom Italia S.p.A. | | 12,700,395 | | | 36,074,628 |
Telecom Italia S.p.A. - RNC | | 25,632,699 | | | 61,756,768 |
UniCredito Italiano SpA | | 29,060,970 | | | 241,188,377 |
| | | | | |
| | | | | 689,907,425 |
| JAPAN - 22.4% | | | | | |
AIFUL CORPORATION | | 2,800,300 | | | 108,337,532 |
BRIDGESTONE CORPORATION | | 5,268,600 | | | 106,375,543 |
Chugai Pharmaceutical Co., Ltd. | | 7,401,500 | | | 159,151,831 |
Credit Saison Co., Ltd.(3) | | 9,284,400 | | | 391,418,514 |
JAPAN TOBACCO INC. | | 52,487 | | | 203,949,486 |
Jupiter Telecommunications Co., Ltd.(1) | | 227,341 | | | 171,480,069 |
KEYENCE CORPORATION | | 403,350 | | | 92,877,206 |
Millea Holdings, Inc.(4) | | 8,241 | | | 143,192,825 |
Mitsubishi Estate Company Ltd. | | 5,299,000 | | | 115,736,889 |
Mitsubishi UFJ Financial Group, Inc. (MUFG) | | 14,787 | | | 190,275,048 |
Mitsui & Co., Ltd. | | 8,741,000 | | | 111,144,821 |
Mitsui Fudosan Co., Ltd. | | 5,401,800 | | | 122,783,771 |
Mizuho Financial Group, Inc. | | 40,324 | | | 312,692,351 |
NTT Data Corporation | | 16,405 | | | 75,688,677 |
ORIX Corporation | | 1,083,700 | | | 299,536,974 |
SEGA SAMMY HOLDINGS INC. | | 4,525,800 | | | 145,591,873 |
SMC CORPORATION | | 437,600 | | | 57,902,121 |
Sumitomo Mitsui Financial Group, Inc. | | 11,007 | | | 115,544,381 |
TAISEI CORPORATION(3) | | 54,263,300 | | | 194,773,665 |
| | | | | |
| | | | | 3,118,453,577 |
26
TWENTY-SIX
| | | | | |
| | | | | |
| | | Shares
Held | | Value |
| LUXEMBOURG - 0.6% | | | | | |
RTL Group | | 772,286 | | $ | 81,281,718 |
| | | | | |
| MEXICO - 2.9% | | | | | |
Grupo Televisa S.A. (ADR) | | 11,318,529 | | | 240,631,927 |
Wal-Mart de Mexico SA de CV, Series V | | 48,790,500 | | | 165,978,234 |
| | | | | |
| | | | | 406,610,161 |
| NETHERLANDS - 3.9% | | | | | |
ASML Holding N.V.(1) | | 10,865,503 | | | 254,066,480 |
ASML Holding N.V., NY Shares(1) | | 1,502,800 | | | 34,985,184 |
ING Groep N.V. CVA | | 4,751,479 | | | 209,011,284 |
Unilever NV CVA | | 2,061,040 | | | 50,701,962 |
| | | | | |
| | | | | 548,764,910 |
| NORWAY - 2.0% | | | | | |
Acergy SA(1) | | 8,128,500 | | | 138,866,753 |
Renewable Energy Corp AS(1) | | 484,300 | | | 7,494,607 |
SeaDrill Ltd.(1) | | 9,494,005 | | | 124,519,172 |
| | | | | |
| | | | | 270,880,532 |
| RUSSIA - 2.1% | | | | | |
LUKOIL (ADR) | | 2,024,402 | | | 152,842,351 |
NovaTek OAO (GDR) | | 872,583 | | | 43,411,004 |
RAO Unified Energy System (UES) (GDR) | | 1,326,204 | | | 96,812,892 |
| | | | | |
| | | | | 293,066,247 |
| SINGAPORE - 2.5% | | | | | |
Keppel Corporation Limited | | 19,557,500 | | | 182,245,238 |
Singapore Airlines Limited | | 18,288,900 | | | 168,120,850 |
| | | | | |
| | | | | 350,366,088 |
| SOUTH AFRICA - 0.1% | | | | | |
MTN Group Limited | | 1,008,743 | | | 8,159,308 |
| | | | | |
| SOUTH KOREA - 4.7% | | | | | |
Hana Financial Group Inc. | | 3,314,174 | | | 151,655,201 |
Kookmin Bank | | 3,689,109 | | | 290,840,192 |
Shinhan Financial Group Co., Ltd. | | 4,579,820 | | | 206,424,648 |
| | | | | |
| | | | | 648,920,041 |
| SPAIN - 1.0% | | | | | |
Industria de Diseno Textil, S.A. (Inditex) | | 2,733,417 | | | 127,414,253 |
Telefonica S.A. | | 761,482 | | | 13,199,722 |
| | | | | |
| | | | | 140,613,975 |
| SWITZERLAND - 12.3% | | | | | |
Adecco SA | | 3,044,624 | | | 183,707,370 |
Nestle SA | | 900,000 | | | 313,807,030 |
Novartis AG | | 3,138,997 | | | 183,251,454 |
Roche Holding AG | | 1,408,119 | | | 243,460,616 |
Swatch Group AG | | 95,293 | | | 18,411,603 |
Swiss Re | | 3,275,613 | | | 250,690,683 |
UBS AG | | 8,751,416 | | | 523,496,275 |
| | | | | |
| | | | | 1,716,825,031 |
| | | | | | |
| | | | | | |
| | | Shares
Held | | Value |
| TAIWAN - 0.5% | | | | | | |
Taiwan Semiconductor Manufacturing Company Ltd. (ADR) | | | 7,824,733 | | $ | 75,117,437 |
| | | | | | |
| UNITED KINGDOM - 8.1% | | | | | | |
Barclays PLC | | | 9,510,528 | | | 120,019,470 |
Cadbury Schweppes PLC | | | 12,066,733 | | | 128,442,087 |
Carnival PLC | | | 2,680,143 | | | 128,214,178 |
GlaxoSmithKline plc | | | 6,113,854 | | | 162,780,298 |
HSBC Holdings PLC | | | 3,543,529 | | | 64,655,432 |
HSBC Holdings PLC (Hong Kong Line) | | | 5,278,200 | | | 96,273,382 |
Kingfisher PLC | | | 45,858,002 | | | 210,577,189 |
Vodafone Group Plc | | | 3,391,251 | | | 7,762,399 |
William Morrison Supermarkets PLC | | | 46,677,731 | | | 212,593,394 |
| | | | | | |
| | | | | | 1,131,317,829 |
| | | | | | |
Total common and preferred stocks
(Cost $10,536,661,602) | | | 13,827,780,620 |
| | | Par Amount | | |
| SHORT-TERM INVESTMENTS (CASH EQUIVALENTS) - 0.5% | | | |
Repurchase agreement with Fixed Income Clearing Corporation, 5.00%, dated 9/29/06, due 10/2/06, maturity value $64,295,779, collateralized by $65,554,913 market value Federal National Mortgage Association Note,
5.35%, due 9/5/08
(Cost $64,269,000) | | $ | 64,269,000 | | | 64,269,000 |
| | | | | | |
| | | | | | |
Total investments - 99.8%
(Cost $10,600,930,602) | | | | | | 13,892,049,620 |
| | | | | | |
Other assets less liabilities - 0.2% | | | 25,802,770 |
| | | | | | |
| | | | | | |
Total net assets - 100.0%(5) | | | | | $ | 13,917,852,390 |
| | | | | | |
| (1) | Non-income producing security. |
| (2) | Represents less than 0.1% of total net assets. |
| (3) | Affiliated company as defined by the Investment Company Act of 1940. See Note (6) in Notes to Financial Statements. |
| (4) | Valued at a fair value in accordance with procedures established by the Board of Directors of Artisan Funds. In total, securities valued at a fair value were $143,192,825 or 1.0% of total net assets. |
| (5) | Percentages for the various classifications relate to total net assets. |
(ADR) American Depository Receipt
(GDR) Global Depository Receipt
27
TWENTY-SEVEN
| | | | | | |
| PORTFOLIO DIVERSIFICATION - SEPTEMBER 30, 2006 | |
| | | Value | | Percentage
of Total
Net Assets | |
Consumer Discretionary | | $ | 1,635,764,663 | | 11.8 | % |
Consumer Staples | | | 1,367,905,731 | | 9.8 | |
Energy | | | 911,282,242 | | 6.5 | |
Financials | | | 5,187,950,021 | | 37.3 | |
Healthcare | | | 798,295,567 | | 5.7 | |
Industrials | | | 1,512,791,042 | | 10.9 | |
Information Technology | | | 674,708,142 | | 4.8 | |
Materials | | | 1,388,067 | | 0.0(1 | ) |
Telecommunication Services | | | 664,668,132 | | 4.8 | |
Utilities | | | 1,073,027,013 | | 7.7 | |
| | | | | | |
Total common and preferred stocks | | | 13,827,780,620 | | 99.3 | |
Short-term investments | | | 64,269,000 | | 0.5 | |
| | | | | | |
Total investments | | | 13,892,049,620 | | 99.8 | |
Other assets less liabilities | | | 25,802,770 | | 0.2 | |
| | | | | | |
Total net assets | | $ | 13,917,852,390 | | 100.0 | % |
| | | | | | |
| (1) | Represents less than 0.1% of total net assets. |
| | | | | | |
| CURRENCY EXPOSURE - SEPTEMBER 30, 2006 | |
| | | Value | | Percentage
of Total
Investments | |
Australian dollar | | $ | 223,887,163 | | 1.6 | % |
British pound | | | 1,035,044,447 | | 7.4 | |
Canadian dollar | | | 124,642,529 | | 0.9 | |
Danish krone | | | 52,899,394 | | 0.4 | |
Euro | | | 4,508,377,027 | | 32.5 | |
Hong Kong dollar | | | 914,267,177 | | 6.6 | |
Indonesian rupiah | | | 3,064,841 | | 0.0(1 | ) |
Japanese yen | | | 3,118,453,577 | | 22.4 | |
Mexican peso | | | 165,978,234 | | 1.2 | |
Norwegian krone | | | 270,880,532 | | 1.9 | |
Singapore dollar | | | 350,366,088 | | 2.5 | |
South African rand | | | 8,159,308 | | 0.1 | |
South Korean won | | | 648,920,041 | | 4.7 | |
Swiss franc | | | 1,716,825,031 | | 12.4 | |
US dollar | | | 750,284,231 | | 5.4 | |
| | | | | | |
Total investments | | $ | 13,892,049,620 | | 100.0 | % |
| | | | | | |
| (1) | Represents less than 0.1% of total investments. |
The accompanying notes are an integral part of the financial statements.
28
TWENTY-EIGHT
ARTISAN INTERNATIONAL SMALL CAP FUND
Schedule of Investments – September 30, 2006
| | | | | |
| | | Shares
Held | | Value |
| | | | | |
COMMON AND
PREFERRED STOCKS - 95.1% | | | |
| | | | | |
| AUSTRALIA - 0.7% | | | | | |
Billabong International Limited | | 634,721 | | $ | 6,930,291 |
| | | | | |
| AUSTRIA - 3.0% | | | | | |
C.A.T. oil AG(1) | | 348,150 | | | 7,637,463 |
Flughafen Wien AG | | 127,899 | | | 10,592,134 |
Wienerberger AG | | 216,243 | | | 10,211,472 |
| | | | | |
| | | | | 28,441,069 |
| BRAZIL - 0.5% | | | | | |
Saraiva S.A. Livreiros Editores, Preferred | | 89,600 | | | 770,602 |
Vivo Participacoes S.A., Preferred (ADR)(1) | | 1,292,543 | | | 4,032,734 |
| | | | | |
| | | | | 4,803,336 |
| CANADA - 2.4% | | | | | |
Aur Resources Inc. | | 856,200 | | | 13,788,056 |
Great Canadian Gaming Corporation(1) | | 874,300 | | | 8,956,148 |
| | | | | |
| | | | | 22,744,204 |
| CHINA - 5.0% | | | | | |
Beijing Capital International Airport Company Limited, Series H | | 22,228,600 | | | 14,580,060 |
China Oilfield Services Limited, Series H | | 14,651,100 | | | 7,879,716 |
Dalian Port (PDA) Company Ltd., Series H(1) | | 677,200 | | | 299,021 |
Hengan International Group Company Limited | | 6,183,900 | | | 13,287,529 |
Shanghai Electric Group Company Limited, Series H | | 32,652,300 | | | 10,980,987 |
| | | | | |
| | | | | 47,027,313 |
| EGYPT - 1.9% | | | | | |
Commercial International Bank (GDR) | | 2,243,897 | | | 17,659,469 |
| | | | | |
| FINLAND - 1.3% | | | | | |
Metso Corporation | | 326,300 | | | 12,007,459 |
| | | | | |
| FRANCE - 5.6% | | | | | |
Geodis SA | | 116,325 | | | 18,733,262 |
Guyenne et Gascogne SA | | 62,451 | | | 7,934,942 |
Kaufman & Broad S.A. | | 261,579 | | | 15,506,762 |
Norbert Dentressangle | | 128,932 | | | 10,169,222 |
| | | | | |
| | | | | 52,344,188 |
| | | | | |
| | | Shares
Held | | Value |
| | | | | |
| GERMANY - 3.1% | | | | | |
DAB Bank AG | | 465,953 | | $ | 4,354,579 |
Grenkeleasing AG | | 125,064 | | | 7,184,013 |
Patrizia Immobilien AG(1) | | 293,058 | | | 7,833,589 |
Vossloh AG | | 156,917 | | | 9,246,541 |
| | | | | |
| | | | | 28,618,722 |
| GREECE - 1.1% | | | | | |
Postal Savings Bank(1) | | 496,300 | | | 9,981,230 |
| | | | | |
| HONG KONG - 4.9% | | | | | |
Emperor Entertainment Hotel Limited | | 28,851,700 | | | 5,443,962 |
Hong Kong Exchanges & Clearing Limited | | 2,182,000 | | | 15,950,518 |
Panva Gas Holdings Limited(1) | | 31,702,800 | | | 10,824,443 |
Tian An China Investments Company Limited(1) | | 23,891,400 | | | 13,585,375 |
| | | | | |
| | | | | 45,804,298 |
| INDIA - 1.7% | | | | | |
Indiabulls Financial Services Ltd. | | 1,816,026 | | | 16,311,611 |
| | | | | |
| ITALY - 4.3% | | | | | |
Azimut Holding SpA | | 870,194 | | | 9,931,051 |
Pirelli & C. Real Estate S.p.A. | | 189,420 | | | 11,260,302 |
Socotherm S.p.A. | | 1,015,711 | | | 14,824,570 |
Tod’s S.p.A. | | 58,729 | | | 4,643,289 |
| | | | | |
| | | | | 40,659,212 |
| JAPAN - 11.8% | | | | | |
CREED CORPORATION | | 5,888 | | | 20,984,957 |
FJ Next Co., Ltd. | | 608,400 | | | 6,232,076 |
Japan Wind Development Co., Ltd. | | 1,448 | | | 2,574,222 |
KOMERI CO., LTD. | | 280,400 | | | 9,352,601 |
NTT URBAN DEVELOPMENT CORPORATION | | 2,040 | | | 16,302,730 |
Ozeki Co., Ltd. | | 387,400 | | | 11,380,131 |
Pasona Inc. | | 5,860 | | | 11,360,339 |
Raito Kogyo Co., Ltd. | | 2,397,100 | | | 7,934,528 |
Sammy NetWorks Co., Ltd. | | 200 | | | 1,041,270 |
SHIZUOKA GAS CO., LTD. | | 922,000 | | | 6,814,019 |
SHO-BOND CORPORATION | | 1,064,500 | | | 9,561,350 |
Tokyu Community Corp. | | 259,600 | | | 7,669,875 |
| | | | | |
| | | | | 111,208,098 |
| MEXICO - 4.7% | | | | | |
Empresas ICA S.A. de C.V.(1) | | 8,471,950 | | | 30,515,665 |
Organizacion Soriana S.A. de C.V., Series B | | 2,772,700 | | | 13,871,066 |
| | | | | |
| | | | | 44,386,731 |
29
TWENTY-NINE
| | | | | |
| | | Shares
Held | | Value |
| | | | | |
| NETHERLANDS - 5.4% | | | | | |
Buhrmann NV | | 1,905,157 | | $ | 28,724,286 |
SBM Offshore NV | | 413,488 | | | 11,236,258 |
VastNed Retail NV | | 132,040 | | | 10,832,942 |
| | | | | |
| | | | | 50,793,486 |
| NORWAY - 3.1% | | | | | |
Acergy SA(1) | | 809,900 | | | 13,836,278 |
MPF Corp Ltd(1)(2) | | 1,115,000 | | | 3,758,465 |
SeaDrill Ltd.(1) | | 906,530 | | | 11,889,647 |
| | | | | |
| | | | | 29,484,390 |
| OMAN - 0.8% | | | | | |
Bank Muscat SAOG (GDR)(2) | | 414,532 | | | 4,808,571 |
Bank Muscat SAOG, (London line) (GDR) | | 242,872 | | | 2,817,315 |
| | | | | |
| | | | | 7,625,886 |
| PANAMA - 1.9% | | | | | |
Banco Latinoamericano de Exportaciones, S.A., E Shares | | 1,147,514 | | | 17,924,169 |
| | | | | |
| PORTUGAL - 0.7% | | | | | |
CIMPOR-Cimentos de Portugal, SGPS, SA | | 931,019 | | | 6,670,273 |
| | | | | |
| RUSSIA - 0.9% | | | | | |
Uralsvyazinform (ADR)(2) | | 1,067,900 | | | 8,521,842 |
| | | | | |
| SINGAPORE - 6.6% | | | | | |
Fraser & Neave Limited | | 9,241,600 | | | 24,089,548 |
Hyflux Limited | | 3,168,000 | | | 4,587,691 |
Jaya Holdings Limited | | 13,987,200 | | | 12,241,277 |
SIA Engineering Company | | 4,214,200 | | | 9,339,829 |
Singapore Exchange Limited | | 4,177,000 | | | 11,676,927 |
| | | | | |
| | | | | 61,935,272 |
| SOUTH AFRICA - 1.0% | | | | | |
Massmart Holdings Limited | | 1,295,270 | | | 9,464,139 |
| | | | | |
| SOUTH KOREA - 4.8% | | | | | |
FINETEC Corporation | | 646,658 | | | 9,840,819 |
Kangwon Land Inc. | | 707,056 | | | 14,944,380 |
Korea Investment Holdings Co. Ltd. | | 474,500 | | | 20,534,505 |
| | | | | |
| | | | | 45,319,704 |
| SWEDEN - 3.0% | | | | | |
D. Carnegie & Co AB | | 338,400 | | | 7,134,515 |
Elekta AB, B Shares | | 1,070,272 | | | 20,154,819 |
Gant Company AB(1) | | 36,100 | | | 985,242 |
| | | | | |
| | | | | 28,274,576 |
| SWITZERLAND - 6.4% | | | | | |
Bank Sarasin & Cie AG, B Shares | | 5,842 | | | 17,239,378 |
Banque Cantonale Vaudoise (BCV) | | 11,371 | | | 4,569,497 |
| | | | | | |
| | | Shares Held | | Value |
| SWITZERLAND (CONTINUED) | | | | | | |
| | | | | | |
Schindler Holding AG, Participation Certificates | | | 319,396 | | $ | 16,653,700 |
Straumann Holding AG | | | 33,588 | | | 7,232,252 |
Sulzer AG | | | 18,390 | | | 14,655,232 |
| | | | | | |
| | | | | | 60,350,059 |
| THAILAND - 0.5% | | | | | | |
Bangkok Bank Public Company Limited | | | 1,479,900 | | | 4,333,529 |
| | | | | | |
| TURKEY - 1.2% | | | | | | |
Coca-Cola Icecek Uretim AS(1) | | | 2,217,815 | | | 10,982,907 |
| | | | | | |
| UNITED KINGDOM - 6.8% | | | | | | |
IMI PLC | | | 914,996 | | | 8,681,607 |
Investec PLC | | | 1,288,180 | | | 12,650,545 |
NETeller PLC(1) | | | 1,066,021 | | | 7,085,676 |
Queen’s Walk Investment Ltd. | | | 822,332 | | | 11,001,104 |
Sibir Energy PLC(1) | | | 2,799,662 | | | 23,968,811 |
| | | | | | |
| | | | | | 63,387,743 |
| | | | | | |
Total common and preferred stocks (Cost $667,179,249) | | | | | | 893,995,206 |
| | | Par Amount | | |
| SHORT-TERM INVESTMENTS (CASH EQUIVALENTS) - 4.5% | | | |
Repurchase agreement with Fixed Income Clearing Corporation, 5.00%, dated 9/29/06, due 10/2/06, maturity value $42,080,526, collateralized by $42,907,975 market value Federal Home Loan Mortgage
Corporation Note,
5.125%, due 6/18/08
(Cost $42,063,000) | | $ | 42,063,000 | | | 42,063,000 |
| | | | | | |
| | | | | | |
Total investments - 99.6%
(Cost $709,242,249) | | | | | | 936,058,206 |
| | | | | | |
Other assets less liabilities - 0.4% | | | | | | 3,703,678 |
| | | | | | |
| | | | | | |
Total net assets - 100.0%(3) | | | | | $ | 939,761,884 |
| | | | | | |
| (1) | Non-income producing security. |
| (2) | Valued at a fair value in accordance with procedures established by the Board of Directors of Artisan Funds. In total, securities valued at a fair value were $17,088,878 or 1.8% of total net assets. |
| (3) | Percentages for the various classifications relate to total net assets. |
(ADR) American Depository Receipt
(GDR) Global Depository Receipt
30
THIRTY
| | | | | | |
| PORTFOLIO DIVERSIFICATION - SEPTEMBER 30, 2006 | |
| | | Value | | Percentage
of Total
Net Assets | |
Consumer Discretionary | | $ | 68,404,389 | | 7.3 | % |
Consumer Staples | | | 66,920,714 | | 7.1 | |
Energy | | | 95,031,208 | | 10.1 | |
Financials | | | 296,208,334 | | 31.5 | |
Healthcare | | | 27,387,071 | | 2.9 | |
Industrials | | | 275,935,812 | | 29.4 | |
Information Technology | | | 1,041,270 | | 0.1 | |
Materials | | | 30,299,148 | | 3.2 | |
Telecommunication Services | | | 12,554,576 | | 1.3 | |
Utilities | | | 20,212,684 | | 2.2 | |
| | | | | | |
Total common and preferred stocks | | | 893,995,206 | | 95.1 | |
Short-term investments | | | 42,063,000 | | 4.5 | |
| | | | | | |
Total investments | | | 936,058,206 | | 99.6 | |
Other assets less liabilities | | | 3,703,678 | | 0.4 | |
| | | | | | |
Total net assets | | $ | 939,761,884 | | 100.0 | % |
| | | | | | |
| | | | | | |
| CURRENCY EXPOSURE - SEPTEMBER 30, 2006 | | | |
| | | Value | | Percentage
of Total
Investments | |
Australian dollar | | $ | 6,930,291 | | 0.7 | % |
Brazilian real | | | 770,602 | | 0.1 | |
British pound | | | 52,386,639 | | 5.6 | |
Canadian dollar | | | 22,744,204 | | 2.4 | |
Euro | | | 240,516,743 | | 25.7 | |
Hong Kong dollar | | | 92,831,611 | | 9.9 | |
Indian rupee | | | 16,311,611 | | 1.7 | |
Japanese yen | | | 111,208,098 | | 11.9 | |
Mexican peso | | | 44,386,731 | | 4.7 | |
Norwegian krone | | | 29,484,390 | | 3.2 | |
Singapore dollar | | | 61,935,272 | | 6.6 | |
South African rand | | | 9,464,139 | | 1.0 | |
South Korean won | | | 45,319,704 | | 4.8 | |
Swedish krona | | | 28,274,576 | | 3.0 | |
Swiss franc | | | 60,350,059 | | 6.5 | |
Thai baht | | | 4,333,529 | | 0.5 | |
Turkish lira | | | 10,982,907 | | 1.2 | |
US dollar | | | 97,827,100 | | 10.5 | |
| | | | | | |
Total investments | | $ | 936,058,206 | | 100.0 | % |
| | | | | | |
The accompanying notes are an integral part of the financial statements.
31
THIRTY-ONE
ARTISAN INTERNATIONAL VALUE FUND
Schedule of Investments – September 30, 2006
| | | | | |
| | | | | |
| | | Shares
Held | | Value |
| COMMON STOCKS - 91.6% | | | | | |
| | | | | |
| BERMUDA - 1.1% | | | | | |
Lancashire Holdings Ltd(1) | | 2,305,082 | | $ | 14,922,299 |
| | | | | |
| CANADA - 2.4% | | | | | |
CanWest Global Communications Corp.(1) | | 4,272,600 | | | 31,726,755 |
| | | | | |
| FRANCE - 5.0% | | | | | |
Euronext NV | | 140,120 | | | 13,619,116 |
Renault SA | | 158,072 | | | 18,130,097 |
Vivendi | | 936,746 | | | 33,770,332 |
| | | | | |
| | | | | 65,519,545 |
| GERMANY - 6.8% | | | | | |
Bayerische Motoren Werke (BMW) AG | | 310,599 | | | 16,636,447 |
Heidelberger Druckmaschinen AG | | 640,606 | | | 26,408,552 |
Pfeiffer Vacuum Technology AG(2) | | 714,441 | | | 46,610,994 |
| | | | | |
| | | | | 89,655,993 |
| HONG KONG - 2.3% | | | | | |
Guoco Group Limited | | 2,366,600 | | | 30,210,364 |
| | | | | |
| ITALY - 1.0% | | | | | |
Cementir S.p.A. | | 1,676,465 | | | 12,957,011 |
| | | | | |
| JAPAN - 11.7% | | | | | |
Central Japan Railway Company | | 3,881 | | | 41,397,333 |
MEITEC CORPORATION | | 1,282,600 | | | 39,414,502 |
Sekisui House, Ltd. | | 2,245,700 | | | 33,973,045 |
UNI- CHARM CORPORATION | | 688,500 | | | 38,235,429 |
| | | | | |
| | | | | 153,020,309 |
| MEXICO - 6.2% | | | | | |
Gruma S.A., B Shares | | 2,177,640 | | | 6,659,292 |
Grupo Modelo, S.A. de C.V., Series C | | 6,787,800 | | | 29,629,482 |
Grupo Televisa S.A. (ADR) | | 718,400 | | | 15,273,184 |
Kimberly-Clark de Mexico, S.A. de C.V., A Shares | | 7,509,600 | | | 30,396,325 |
| | | | | |
| | | | | 81,958,283 |
| NETHERLANDS - 4.3% | | | | | |
Wolters Kluwer NV | | 2,139,332 | | | 55,801,914 |
| | | | | |
| | | | | |
| | | | | |
| | | Shares
Held | | Value |
| SOUTH KOREA - 3.5% | | | | | |
Honam Petrochemical Corporation | | 108,650 | | $ | 6,774,478 |
Lotte Chilsung Beverage Co., Ltd. | | 11,116 | | | 15,071,945 |
Lotte Confectionery Co., Ltd. | | 6,447 | | | 7,862,444 |
SK Telecom Co., Ltd. (ADR) | | 688,000 | | | 16,257,440 |
| | | | | |
| | | | | 45,966,307 |
| SPAIN - 1.1% | | | | | |
Red Electrica de Espana | | 372,706 | | | 14,466,595 |
| | | | | |
| SWITZERLAND - 5.0% | | | | | |
Givaudan SA | | 47,944 | | | 38,379,738 |
Pargesa Holding SA | | 211,521 | | | 20,450,949 |
Tamedia AG | | 57,992 | | | 6,279,433 |
| | | | | |
| | | | | 65,110,120 |
| UNITED KINGDOM - 31.1% | | | | | |
Benfield Group PLC | | 5,634,564 | | | 38,559,809 |
Brit Insurance Holdings PLC | | 2,531,382 | | | 14,313,697 |
Carpetright PLC | | 1,030,062 | | | 22,275,760 |
Countrywide PLC | | 6,347,089 | | | 62,242,324 |
Diageo PLC | | 3,678,896 | | | 64,990,009 |
GUS PLC | | 1,701,970 | | | 30,783,373 |
MFI Furniture Group PLC(1) | | 16,259,011 | | | 29,224,867 |
Signet Group PLC | | 17,795,597 | | | 36,818,155 |
SurfControl PLC(1)(2) | | 1,603,124 | | | 14,047,536 |
Unilever PLC (ADR) | | 1,240,716 | | | 30,782,164 |
Vitec Group PLC | | 1,383,803 | | | 14,068,937 |
Vodafone Group PLC (ADR) | | 2,200,568 | | | 50,304,984 |
| | | | | |
| | | | | 408,411,615 |
| UNITED STATES - 10.1% | | | | | |
Amdocs Limited(1) | | 583,600 | | | 23,110,560 |
Arch Capital Group Ltd.(1) | | 210,978 | | | 13,394,993 |
Tyco International Ltd. | | 2,253,900 | | | 63,086,661 |
Willis Group Holdings Limited | | 878,000 | | | 33,364,000 |
| | | | | |
| | | | | 132,956,214 |
| | | | | |
Total common stocks
(Cost $1,027,562,354) | | | | | 1,202,683,324 |
32
THIRTY-TWO
| | | | | | |
| | | Par Amount | | Value |
| SHORT-TERM INVESTMENTS (CASH EQUIVALENTS) - 7.8% | | | | | | |
Repurchase agreement with Fixed Income Clearing Corporation, 5.00%, dated 9/29/06, due 10/2/06, maturity value $102,588,728, collateralized by $104,601,750 market value Federal National Mortgage Association Note,
5.44%, due 11/1/07
(Cost $102,546,000) | | $ | 102,546,000 | | $ | 102,546,000 |
| | | | | | |
| | | | | | |
Total investments - 99.4%
(Cost $1,130,108,354) | | | | | | 1,305,229,324 |
| | | | | | |
Other assets less liabilities - 0.6% | | | | | | 7,345,714 |
| | | | | | |
| | | | | | |
Total net assets - 100.0%(3) | | | | | $ | 1,312,575,038 |
| | | | | | |
| (1) | Non-income producing security. |
| (2) | Affiliated company as defined by the Investment Company Act of 1940. See Note (6) in Notes to Financial Statements. |
| (3) | Percentages for the various classifications relate to total net assets. |
(ADR) American Depository Receipt
| | | | | | |
| PORTFOLIO DIVERSIFICATION - SEPTEMBER 30, 2006 | |
| | | Value | | Percentage
of Total
Net Assets | |
Consumer Discretionary | | $ | 344,762,299 | | 26.3 | % |
Consumer Staples | | | 223,627,090 | | 17.0 | |
Financials | | | 241,077,551 | | 18.4 | |
Industrials | | | 216,918,042 | | 16.5 | |
Information Technology | | | 37,158,096 | | 2.8 | |
Materials | | | 58,111,227 | | 4.4 | |
Telecommunication Services | | | 66,562,424 | | 5.1 | |
Utilities | | | 14,466,595 | | 1.1 | |
| | | | | | |
Total common stocks | | | 1,202,683,324 | | 91.6 | |
Short-term investments | | | 102,546,000 | | 7.8 | |
| | | | | | |
Total investments | | | 1,305,229,324 | | 99.4 | |
Other assets less liabilities | | | 7,345,714 | | 0.6 | |
| | | | | | |
Total net assets | | $ | 1,312,575,038 | | 100.0 | % |
| | | | | | |
| | | | | | |
| CURRENCY EXPOSURE - SEPTEMBER 30, 2006 | |
| | | Value | | Percentage
of Total
Investments | |
British pound | | $ | 342,246,766 | | 26.2 | % |
Canadian dollar | | | 31,726,755 | | 2.4 | |
Euro | | | 238,401,058 | | 18.3 | |
Hong Kong dollar | | | 30,210,364 | | 2.3 | |
Japanese yen | | | 153,020,309 | | 11.7 | |
Mexican peso | | | 66,685,099 | | 5.1 | |
South Korean won | | | 29,708,867 | | 2.3 | |
Swiss franc | | | 65,110,120 | | 5.0 | |
US dollar | | | 348,119,986 | | 26.7 | |
| | | | | | |
Total investments | | $ | 1,305,229,324 | | 100.0 | % |
| | | | | | |
The accompanying notes are an integral part of the financial statements.
33
THIRTY-THREE
ARTISAN MID CAP FUND
Schedule of Investments – September 30, 2006
| | | | | |
| | | | | |
| | | Shares
Held | | Value |
| COMMON STOCKS - 97.5% | | | | | |
| | | | | |
| AUTO & TRANSPORTATION - 2.1% | | | |
Air Transport - 0.5% | | | | | |
Expeditors International of Washington, Inc. | | 658,800 | | $ | 29,369,304 |
| | | | | |
Auto Parts: Original Equipment - 1.0% | | | |
BorgWarner Inc. | | 952,600 | | | 54,460,142 |
| | | | | |
Transportation Miscellaneous - 0.6% | | | |
C.H. Robinson Worldwide, Inc. | | 722,000 | | | 32,186,760 |
| | | | | |
| CONSUMER DISCRETIONARY -16.6% | | | |
Advertising Agencies - 0.7% | | | |
Clear Channel Outdoor Holdings, Inc., Class A(1) | | 1,916,500 | | | 39,096,600 |
| | | | | |
Consumer Electronics - 4.7% | | | |
Electronic Arts Inc.(1) | | 2,483,600 | | | 138,286,848 |
Harman International Industries, Incorporated | | 330,600 | | | 27,585,264 |
VeriSign, Inc.(1) | | 1,255,700 | | | 25,365,140 |
Yahoo! Inc.(1) | | 2,361,900 | | | 59,708,832 |
| | | | | |
| | | | | 250,946,084 |
Education Services - 0.1% | | | | | |
Laureate Education, Inc.(1) | | 109,200 | | | 5,226,312 |
| | | | | |
Radio & TV Broadcasters - 0.1% | | | |
XM Satellite Radio Holdings Inc., Class A(1) | | 559,800 | | | 7,215,822 |
| | | | | |
Restaurants - 1.2% | | | | | |
YUM! Brands, Inc. | | 1,232,500 | | | 64,151,625 |
| | | | | |
Retail - 5.3% | | | | | |
Amazon.com, Inc.(1) | | 1,917,000 | | | 61,574,040 |
Chico’s FAS, Inc.(1) | | 3,457,068 | | | 74,430,674 |
Kohl’s Corporation(1) | | 862,100 | | | 55,967,532 |
The TJX Companies, Inc. | | 3,217,000 | | | 90,172,510 |
| | | | | |
| | | | | 282,144,756 |
Services: Commercial - 2.7% | | | |
Getty Images, Inc.(1) | | 809,600 | | | 40,220,928 |
Iron Mountain Incorporated (1) | | 1,144,050 | | | 49,125,507 |
Monster Worldwide, Inc.(1) | | 784,500 | | | 28,391,055 |
Robert Half International Inc. | | 843,605 | | | 28,657,262 |
| | | | | |
| | | | | 146,394,752 |
| | | | | |
| | | | | |
| | | Shares
Held | | Value |
| CONSUMER DISCRETIONARY (CONTINUED) | | | |
Textiles Apparel Manufacturers - 1.2% | | | |
Polo Ralph Lauren Corporation, Class A | | 1,029,800 | | $ | 66,617,762 |
| | | | | |
Toys - 0.6% | | | | | |
Marvel Entertainment, Inc. (1)(2) | | 1,361,100 | | | 32,856,954 |
| | | | | |
| CONSUMER STAPLES - 2.2% | | | | | |
Beverage: Brewers (Wineries) - 1.4% | | | |
Constellation Brands, Inc., Class A (1) | | 2,606,200 | | | 75,006,436 |
| | | | | |
Drug & Grocery Store Chains - 0.8% | | | |
Supervalu Inc. | | 1,454,500 | | | 43,125,925 |
| | | | | |
| FINANCIAL SERVICES - 16.2% | | | |
Banks: Outside New York City - 3.3% | | | |
Investors Financial Services Corp. | | 1,868,700 | | | 80,503,596 |
M&T Bank Corporation | | 249,600 | | | 29,942,016 |
Northern Trust Corporation | | 1,166,900 | | | 68,181,967 |
| | | | | |
| | | | | 178,627,579 |
Diversified Financial Services - 1.4% | | | |
CB Richard Ellis Group, Inc.(1) | | 1,608,200 | | | 39,561,720 |
Greenhill & Co., Inc. | | 543,800 | | | 36,445,476 |
| | | | | |
| | | | | 76,007,196 |
Financial Data Processing
Services & Systems - 3.2% | | | |
Alliance Data Systems Corporation(1) | | 1,568,900 | | | 86,587,591 |
CheckFree Corporation(1) | | 1,722,800 | | | 71,186,096 |
Paychex, Inc. | | 435,100 | | | 16,033,435 |
| | | | | |
| | | | | 173,807,122 |
Financial Information Services - 2.2% | | | |
Equifax Inc. | | 2,604,800 | | | 95,622,208 |
Moody’s Corporation | | 372,900 | | | 24,380,202 |
| | | | | |
| | | | | 120,002,410 |
Financial Miscellaneous - 2.0% | | | |
MGIC Investment Corporation | | 1,778,700 | | | 106,668,639 |
| | | | | |
Insurance: Multi-Line - 1.8% | | | |
Aon Corporation | | 1,535,100 | | | 51,993,837 |
CIGNA Corporation | | 370,300 | | | 43,073,296 |
| | | | | |
| | | | | 95,067,133 |
34
THIRTY-FOUR
| | | | | |
| | | | | |
| | | Shares
Held | | Value |
| FINANCIAL SERVICES (CONTINUED) | | | |
Insurance: Property-Casualty - 0.5% | | | |
W. R. Berkley Corporation | | 764,500 | | $ | 27,055,655 |
| | | | | |
Securities Brokerage & Services - 1.8% | | | |
The Bear Stearns Companies Inc. | | 307,000 | | | 43,010,700 |
Investment Technology Group, Inc.(1) | | 352,100 | | | 15,756,475 |
Nuveen Investments, Inc. | | 705,000 | | | 36,117,150 |
| | | | | |
| | | | | 94,884,325 |
| HEALTHCARE - 17.5% | | | | | |
Biotechnology Research & Production - 2.0% |
Celgene Corporation(1) | | 1,105,800 | | | 47,881,140 |
Millipore Corporation(1) | | 933,200 | | | 57,205,160 |
| | | | | |
| | | | | 105,086,300 |
Drugs & Pharmaceuticals - 4.2% | | | |
Allergan, Inc. | | 1,212,900 | | | 136,584,669 |
Hospira, Inc.(1) | | 1,106,200 | | | 42,334,274 |
MedImmune, Inc.(1) | | 1,160,400 | | | 33,895,284 |
Shire PLC (ADR)(3) | | 279,000 | | | 13,779,810 |
| | | | | |
| | | | | 226,594,037 |
Electronics: Medical Systems - 0.8% | | | |
Varian Medical Systems, Inc.(1) | | 809,500 | | | 43,219,205 |
| | | | | |
Health Care Management Services - 1.7% |
Cerner Corporation(1) | | 2,038,700 | | | 92,556,980 |
| | | | | |
Medical & Dental Instruments &
Supplies - 7.1% |
Fisher Scientific International Inc.(1) | | 2,627,600 | | | 205,583,424 |
Gen-Probe Incorporated(1) | | 763,700 | | | 35,809,893 |
Patterson Companies, Inc.(1) | | 1,998,800 | | | 67,179,668 |
Ventana Medical Systems, Inc.(1) | | 950,200 | | | 38,796,666 |
Zimmer Holdings, Inc. (1) | | 525,100 | | | 35,444,250 |
| | | | | |
| | | | | 382,813,901 |
Medical Services - 1.7% | | | | | |
Coventry Health Care, Inc.(1) | | 1,734,300 | | | 89,351,136 |
| | | | | |
| MATERIALS & PROCESSING - 6.1% | | | |
Agriculture Fishing & Ranching - 1.1% | | | |
Bunge Limited | | 1,046,800 | | | 60,662,060 |
| | | | | |
Chemicals - 1.2% | | | | | |
Ecolab Inc. | | 1,544,100 | | | 66,118,362 |
| | | | | |
Engineering & Contracting Services - 0.6% |
Quanta Services, Inc. (1) | | 1,854,600 | | | 31,268,556 |
| | | | | |
| | | | | |
| | | Shares
Held | | Value |
| MATERIALS & PROCESSING (CONTINUED) | | | |
Metal Fabricating - 1.9% | | | | | |
Precision Castparts Corp. | | 1,612,000 | | $ | 101,813,920 |
| | | | | |
Real Estate - 1.3% | | | | | |
The St. Joe Company | | 1,224,700 | | | 67,199,289 |
| | | | | |
| OTHER - 3.1% | | | | | |
Multi-Sector Companies - 3.1% | | | |
ITT Industries, Inc. | | 927,000 | | | 47,527,290 |
McDermott International, Inc.(1) | | 2,825,650 | | | 118,112,170 |
| | | | | |
| | | | | 165,639,460 |
| OTHER ENERGY - 4.8% | | | | | |
Coal - 0.8% | | | | | |
CONSOL Energy Inc. | | 1,315,700 | | | 41,747,161 |
| | | | | |
Machinery: Oil Well Equipment
& Services - 4.0% |
Cameron International Corporation(1) | | 1,510,100 | | | 72,952,931 |
Dresser-Rand Group Inc.(1) | | 2,031,700 | | | 41,446,680 |
Helix Energy Solutions Group, Inc.(1) | | 789,000 | | | 26,352,600 |
Smith International, Inc. | | 1,951,900 | | | 75,733,720 |
| | | | | |
| | | | | 216,485,931 |
| PRODUCER DURABLES - 5.5% | | | |
Diversified Production - 1.2% | | | |
Danaher Corporation | | 959,600 | | | 65,895,732 |
| | | | | |
Electrical Equipment & Components - 1.7% | | | |
Cooper Industries, Ltd., Class A | | 1,063,500 | | | 90,631,470 |
| | | | | |
Identification Control & Filter Devices - 1.4% | | | | | |
Roper Industries, Inc. | | 1,618,800 | | | 72,425,112 |
| | | | | |
Machinery: Industrial/Specialty - 1.0% | | | |
Joy Global Inc. | | 1,378,413 | | | 51,842,113 |
| | | | | |
Telecommunications Equipment - 0.2% | | | |
American Tower Corporation(1) | | 251,000 | | | 9,161,500 |
| | | | | |
| TECHNOLOGY - 19.9% | | | | | |
Communications Technology - 3.2% | | | |
Corning Incorporated(1) | | 1,731,400 | | | 42,263,474 |
Juniper Networks, Inc.(1) | | 6,722,000 | | | 116,156,160 |
Tellabs, Inc.(1) | | 1,190,900 | | | 13,052,264 |
| | | | | |
| | | | | 171,471,898 |
35
THIRTY-FIVE
| | | | | |
| | | | | |
| | | Shares
Held | | Value |
| TECHNOLOGY (CONTINUED) | | | | | |
Computer Services Software
& Systems - 3.5% | | | |
Adobe Systems Incorporated(1) | | 2,166,454 | | $ | 81,133,702 |
Autodesk, Inc.(1) | | 1,827,100 | | | 63,546,538 |
Cadence Design Systems, Inc.(1) | | 1,773,000 | | | 30,070,080 |
The Western Union Company(1) | | 544,800 | | | 10,422,024 |
| | | | | |
| | | | | 185,172,344 |
Computer Technology - 3.2% | | | |
Intermec, Inc.(1)(2) | | 3,374,500 | | | 88,951,820 |
Network Appliance, Inc.(1) | | 1,227,300 | | | 45,422,373 |
SanDisk Corporation(1) | | 691,400 | | | 37,017,556 |
| | | | | |
| | | | | 171,391,749 |
Electronics - 0.9% | | | | | |
Avid Technology, Inc.(1) | | 1,337,600 | | | 48,715,392 |
| | | | | |
Electronics: Semi-Conductors/
Components - 6.9% | | | |
Advanced Micro Devices, Inc.(1) | | 3,385,500 | | | 84,129,675 |
Broadcom Corporation, Class A (1) | | 1,932,200 | | | 58,622,948 |
Freescale Semiconductor, Inc., Class A(1) | | 3,461,500 | | | 131,710,075 |
Integrated Device Technology, Inc.(1) | | 1,729,600 | | | 27,777,376 |
Jabil Circuit, Inc. | | 1,139,200 | | | 32,546,944 |
Linear Technology Corporation | | 783,900 | | | 24,394,968 |
Maxim Integrated Products, Inc. | | 359,200 | | | 10,082,744 |
| | | | | |
| | | | | 369,264,730 |
Electronics: Technology - 2.2% | | | |
Rockwell Automation, Inc. | | 1,192,700 | | | 69,295,870 |
Trimble Navigation Limited (1) | | 998,500 | | | 47,009,380 |
| | | | | |
| | | | | 116,305,250 |
| UTILITIES - 3.5% | | | | | |
Utilities: Gas Distributors - 1.1% | | | |
Kinder Morgan, Inc. | | 584,700 | | | 61,305,795 |
| | | | | |
Utilities: Telecommunications - 2.4% | | | |
Level 3 Communications, Inc.(1) | | 6,347,700 | | | 33,960,195 |
NII Holdings, Inc.(1) | | 1,559,600 | | | 96,944,736 |
| | | | | |
| | | | | 130,904,931 |
| | | | | |
Total common stocks
(Cost $4,271,596,242) | | | | | 5,235,963,607 |
| | | | | | |
| | | | | | |
| | | Par Amount | | Value |
SHORT-TERM INVESTMENTS
(CASH EQUIVALENTS) - 1.3% | | | |
Repurchase agreement with Fixed Income Clearing Corporation, 5.00%, dated 9/29/06, due 10/2/06, maturity value $70,518,370, collateralized by $71,901,900 market value Federal National Mortgage Association Note, 4.84%, due 6/22/07
(Cost $70,489,000) | | $ | 70,489,000 | | $ | 70,489,000 |
| | | | | | |
| | | | | | |
Total investments - 98.8%
(Cost $4,342,085,242) | | | | | | 5,306,452,607 |
| | | | | | |
Other assets less liabilities - 1.2% | | | | | | 63,342,238 |
| | | | | | |
| | | | | | |
Total net assets - 100.0%(4) | | | | | $ | 5,369,794,845 |
| | | | | | |
| (1) | Non-income producing security. |
| (2) | Affiliated company as defined by the Investment Company Act of 1940. See Note (6) in Notes to Financial Statements. |
| (3) | The Fund considers the issuer to be from the United Kingdom. See the Fund’s Statement of Additional Information for information on how a particular country is assigned. The security trades on a U.S. exchange. |
| (4) | Percentages for the various classifications relate to total net assets. |
(ADR) American Depository Receipt
The accompanying notes are an integral part of the financial statements.
36
THIRTY-SIX
ARTISAN MID CAP VALUE FUND
Schedule of Investments – September 30, 2006
| | | | | |
| | | | | |
| | | Shares
Held | | Value |
| COMMON STOCKS - 97.1% | | | |
| | | | | |
| AUTO & TRANSPORTATION - 6.0% | | | |
Shipping - 1.8% | | | |
Teekay Shipping Corporation | | 1,178,900 | | $ | 48,464,579 |
| | | | | |
Truckers - 4.2% | | | |
Con-way Inc. | | 1,338,400 | | | 59,987,088 |
YRC Worldwide Inc.(1) | | 1,349,100 | | | 49,970,664 |
| | | | | |
| | | | | 109,957,752 |
| CONSUMER DISCRETIONARY - 31.0% | | | |
Hotel/Motel - 1.7% | | | |
Hilton Hotels Corporation | | 1,573,500 | | | 43,821,975 |
| | | | | |
Household Furnishings - 6.4% | | | |
Furniture Brands International, Inc.(2) | | 2,696,700 | | | 51,345,168 |
Leggett & Platt, Incorporated | | 2,586,000 | | | 64,727,580 |
Mohawk Industries, Inc.(1) | | 713,000 | | | 53,082,850 |
| | | | | |
| | | | | 169,155,598 |
Rental & Leasing Services: Consumer - 1.2% | | | |
Rent-A-Center, Inc.(1) | | 1,061,500 | | | 31,091,335 |
| | | | | |
Retail - 10.9% | | | |
AutoZone, Inc.(1) | | 541,900 | | | 55,978,270 |
Chico’s FAS, Inc.(1) | | 1,306,600 | | | 28,131,098 |
Claire’s Stores, Inc. | | 2,505,200 | | | 73,051,632 |
Foot Locker, Inc. | | 2,386,300 | | | 60,254,075 |
Zale Corporation(1)(2) | | 2,543,200 | | | 70,548,368 |
| | | | | |
| | | | | 287,963,443 |
Services: Commercial - 4.4% | | | |
Convergys Corporation(1) | | 937,700 | | | 19,363,505 |
Hewitt Associates, Inc., Class A(1) | | 2,476,700 | | | 60,084,742 |
Manpower Inc. | | 613,500 | | | 37,589,145 |
| | | | | |
| | | | | 117,037,392 |
Textiles Apparel Manufacturers - 2.4% | | | |
Liz Claiborne Inc. | | 1,588,700 | | | 62,769,537 |
| | | | | |
Toys - 4.0% | | | |
Hasbro, Inc. | | 2,101,100 | | | 47,800,025 |
Marvel Entertainment, Inc.(1)(2) | | 2,440,500 | | | 58,913,670 |
| | | | | |
| | | | | 106,713,695 |
| | | | | |
| | | | | |
| | | Shares
Held | | Value |
| CONSUMER STAPLES - 4.2% | | | |
Foods - 4.2% | | | |
Pilgrim’s Pride Corporation | | 2,291,300 | | $ | 62,667,055 |
Tyson Foods, Inc., Class A | | 3,080,400 | | | 48,916,752 |
| | | | | |
| | | | | 111,583,807 |
| FINANCIAL SERVICES - 26.9% | | | |
Finance: Small Loan - 4.2% | | | |
The Student Loan Corporation | | 581,400 | | | 111,733,452 |
| | | | | |
Financial Miscellaneous - 5.9% | | | |
Fidelity National Financial, Inc. | | 1,207,400 | | | 50,288,210 |
Fidelity National Title Group, Inc., Class A | | 1,796,900 | | | 37,663,024 |
H&R Block, Inc. | | 1,272,100 | | | 27,655,454 |
MBIA Inc. | | 660,800 | | | 40,599,552 |
| | | | | |
| | | | | 156,206,240 |
Insurance: Multi-Line - 5.2% | | | |
Alleghany Corporation(1) | | 320,628 | | | 92,664,698 |
Arthur J. Gallagher & Co. | | 1,687,500 | | | 45,005,625 |
| | | | | |
| | | | | 137,670,323 |
Insurance: Property-Casualty - 4.3% | | | |
Allied World Assurance Holdings, Ltd(1) | | 738,700 | | | 29,843,480 |
Arch Capital Group Ltd.(1) | | 327,973 | | | 20,823,006 |
White Mountains Insurance Group, Ltd. | | 124,500 | | | 61,871,520 |
| | | | | |
| | | | | 112,538,006 |
Real Estate Investment Trusts (REIT) - 2.3% | | | |
Annaly Capital Management, Inc. | | 4,630,100 | | | 60,839,514 |
| | | | | |
Rental & Leasing Services: Commercial - 2.0% | | | |
Ryder System, Inc. | | 1,015,000 | | | 52,455,200 |
| | | | | |
Savings & Loan - 1.3% | | | |
Washington Federal, Inc. | | 1,564,716 | | | 35,112,227 |
| | | | | |
Securities Brokerage & Services - 1.7% | | | |
Nuveen Investments, Inc. | | 903,500 | | | 46,286,305 |
| | | | | |
| MATERIALS & PROCESSING - 4.3% | | | |
Building: Roofing & Wallboard - 1.1% | | | |
USG Corporation(1) | | 619,900 | | | 29,160,096 |
| | | | | |
37
THIRTY-SEVEN
| | | | | |
| | | | | |
| | | Shares
Held | | Value |
| MATERIALS & PROCESSING (CONTINUED) | | | |
Chemicals - 3.2% | | | |
Albemarle Corporation | | 320,900 | | $ | 17,434,497 |
The Lubrizol Corporation | | 1,487,900 | | | 68,041,667 |
| | | | | |
| | | | | 85,476,164 |
| OTHER ENERGY - 15.0% | | | |
Machinery: Oil Well Equipment & Services -1.5% | | | |
Nabors Industries Ltd. (1) | | 1,325,000 | | | 39,418,750 |
| | | |
Oil: Crude Producers - 13.5% | | | |
Apache Corporation | | 852,046 | | | 53,849,307 |
Cimarex Energy Co. | | 1,525,100 | | | 53,668,269 |
Forest Oil Corporation (1) | | 1,107,300 | | | 34,979,607 |
Mariner Energy, Inc.(1) | | 1,116,191 | | | 20,504,429 |
Noble Energy, Inc. | | 1,282,100 | | | 58,450,939 |
Pioneer Natural Resources Company | | 1,888,704 | | | 73,886,101 |
Pogo Producing Company | | 936,500 | | | 38,349,675 |
XTO Energy Inc. | | 528,042 | | | 22,246,409 |
| | | | | |
| | | | | 355,934,736 |
| PRODUCER DURABLES - 1.1% | | | |
Diversified Production - 1.1% | | | |
Dover Corporation | | 627,500 | | | 29,768,600 |
| | | | | |
| TECHNOLOGY - 8.6% | | | | | |
Computer Services Software & Systems - 1.0% | | | |
Cognos Incorporated (1)(3) | | 744,400 | | | 27,170,600 |
| | | | | |
Computer Technology - 2.6% | | | |
Ingram Micro Inc., Class A(1) | | 3,555,700 | | | 68,127,212 |
| | | | | |
Electronics: Semi-Conductors/Components -5.0% | | | |
Analog Devices, Inc. | | 1,423,400 | | | 41,833,726 |
Avnet, Inc.(1) | | 4,563,500 | | | 89,535,870 |
| | | | | |
| | | | | 131,369,596 |
| | | | | |
Total common stocks
(Cost $2,364,669,829) | | | | | 2,567,826,134 |
| | | | | | | |
| | | | | | | |
| | | Par
Amount | | Value | |
SHORT-TERM INVESTMENTS
(CASH EQUIVALENTS) - 3.7% | | | | |
Repurchase agreement with Fixed Income Clearing Corporation, 5.00%, dated 9/29/06, due 10/2/06, maturity value $97,252,505, collateralized by $50,500,000 market value Federal Home Loan Mortgage Corporation Note, 5.41%, due 9/11/09, and $48,656,338 market value Federal National Mortgage Association Note, 5.00%, due 9/15/08
(Cost $97,212,000) | | $ | 97,212,000 | | $ | 97,212,000 | |
| | | | | | | |
| | | | | | | |
Total investments - 100.8%
(Cost $2,461,881,829) | | | | | | 2,665,038,134 | |
| | | | | | | |
Other assets less liabilities - (0.8%) | | | (21,716,442 | ) |
| | | | | | | |
| | | | | | | |
Total net assets - 100.0%(4) | | | | | $ | 2,643,321,692 | |
| | | | | | | |
| (1) | Non-income producing security. |
| (2) | Affiliated company as defined by the Investment Company Act of 1940. See Note (6) in Notes to Financial Statements. |
| (3) | The Fund considers the issuer to be from Canada. See the Fund’s Statement of Additional Information for information on how a particular country is assigned. The security trades on a U.S. exchange. |
| (4) | Percentages for the various classifications relate to total net assets. |
The accompanying notes are an integral part of the financial statements.
38
THIRTY-EIGHT
ARTISAN OPPORTUNISTIC VALUE FUND
Schedule of Investments – September 30, 2006
| | | | | |
| | | Shares
Held | | Value |
| COMMON STOCKS - 97.3% | | | |
| | | | | |
| AUTO & TRANSPORTATION - 2.1% | | | |
Truckers - 2.1% | | | |
YRC Worldwide Inc.(1) | | 41,700 | | $ | 1,544,568 |
| |
| CONSUMER DISCRETIONARY - 24.2% | | | |
Household Furnishings - 2.3% | | | |
Mohawk Industries, Inc.(1) | | 23,200 | | | 1,727,240 |
| |
Leisure Time - 4.2% | | | |
Carnival Corporation | | 67,600 | | | 3,179,228 |
| |
Rental & Leasing Services: Consumer - 1.2% | | | |
Rent-A-Center, Inc.(1) | | 32,200 | | | 943,138 |
| |
Retail - 6.3% | | | |
Foot Locker, Inc. | | 37,700 | | | 951,925 |
Wal-Mart Stores, Inc. | | 76,200 | | | 3,758,184 |
| | | | | |
| | | | | 4,710,109 |
Services: Commercial - 5.1% | | | |
Accenture Ltd, Class A | | 53,500 | | | 1,696,485 |
Hewitt Associates, Inc., Class A(1) | | 88,000 | | | 2,134,880 |
| | | | | |
| | | | | 3,831,365 |
Shoes - 5.1% | | | |
NIKE, Inc., Class B | | 43,300 | | | 3,793,946 |
| |
| FINANCIAL SERVICES - 31.7% | | | |
Banks: Outside New York City - 6.0% | | | |
Bank of America Corporation | | 30,400 | | | 1,628,528 |
Royal Bank of Scotland Group plc(2) | | 83,900 | | | 2,888,889 |
| | | | | |
| | | | | 4,517,417 |
Diversified Financial Services - 3.8% | | | |
Citigroup Inc. | | 57,900 | | | 2,875,893 |
| |
Finance: Small Loan - 4.4% | | | |
The Student Loan Corporation | | 17,200 | | | 3,305,496 |
| |
Financial Miscellaneous - 2.8% | | | |
Fidelity National Title Group, Inc., Class A | | 98,900 | | | 2,072,944 |
| |
Insurance: Multi-Line - 8.5% | | | |
Alleghany Corporation(1) | | 5,000 | | | 1,445,050 |
The Allstate Corporation | | 21,100 | | | 1,323,603 |
American International Group, Inc. | | 54,600 | | | 3,617,796 |
| | | | | |
| | | | | 6,386,449 |
| | | | | |
| | | Shares
Held | | Value |
| FINANCIAL SERVICES (CONTINUED) | | | | | |
Insurance: Property-Casualty - 2.0% | | | |
The Progressive Corporation | | 60,800 | | $ | 1,492,032 |
| |
Real Estate Investment Trusts (REIT) - 2.1% | | | |
Annaly Capital Management, Inc. | | 120,300 | | | 1,580,742 |
| |
Securities Brokerage & Services - 2.1% | | | |
Countrywide Financial Corporation | | 46,000 | | | 1,611,840 |
| |
| HEALTHCARE - 3.6% | | | |
Drugs & Pharmaceuticals - 1.7% | | | |
Johnson & Johnson | | 19,700 | | | 1,279,318 |
| |
Health Care Management Services - 1.9% | | | |
Aetna Inc. | | 35,800 | | | 1,415,890 |
| | |
| INTEGRATED OILS - 2.4% | | | | | |
Oil: Integrated Domestic - 2.4% | | | |
ConocoPhillips | | 30,500 | | | 1,815,665 |
| | |
| MATERIALS & PROCESSING - 2.8% | | | | | |
Chemicals - 2.8% | | | |
The Dow Chemical Company | | 53,100 | | | 2,069,838 |
| | |
| OTHER - 3.8% | | | | | |
Multi-Sector Companies - 3.8% | | | |
Berkshire Hathaway Inc., Class B(1) | | 890 | | | 2,824,860 |
| | |
| OTHER ENERGY - 10.0% | | | | | |
Energy Miscellaneous - 3.1% | | | |
Valero Energy Corporation | | 44,900 | | | 2,311,003 |
|
Machinery: Oil Well Equipment & Services -1.9% |
Nabors Industries Ltd. (1) | | 47,400 | | | 1,410,150 |
| |
Oil: Crude Producers - 5.0% | | | |
Apache Corporation | | 59,000 | | | 3,728,800 |
| | |
| TECHNOLOGY - 16.7% | | | | | |
Computer Services Software & Systems - 4.8% | | | |
Microsoft Corporation | | 131,970 | | | 3,606,740 |
39
THIRTY-NINE
| | | | | |
| | | Shares
Held | | Value |
| TECHNOLOGY (CONTINUED) | | | |
Computer Technology - 5.6% | | | |
Dell Inc.(1) | | 99,000 | | $ | 2,261,160 |
International Business Machines Corporation | | 24,000 | | | 1,966,560 |
| | | | | |
| | | | | 4,227,720 |
Electronics: Semi-Conductors/Components - 6.3% |
Analog Devices, Inc. | | 47,200 | | | 1,387,208 |
Avnet, Inc.(1) | | 169,400 | | | 3,323,628 |
| | | | | |
| | | | | 4,710,836 |
| | | | | |
Total common stocks
(Cost $70,545,178) | | | | | 72,973,227 |
| | | | | | |
| | | Par
Amount | | Value |
SHORT-TERM INVESTMENTS (CASH EQUIVALENTS) - 2.5% | | | | | | |
Repurchase agreement with Fixed Income Clearing Corporation, 5.00%, dated 9/29/06, due 10/2/06, maturity value $1,860,775, collateralized by $1,900,000 market value Federal National Mortgage Association Note,
5.80%, due 2/9/26
(Cost $1,860,000) | | $ | 1,860,000 | | $ | 1,860,000 |
| | | | | | |
| | | | | | |
Total investments - 99.8% (Cost $72,405,178) | | | | | | 74,833,227 |
| | | | | | |
Other assets less liabilities - 0.2% | | | | | | 122,868 |
| | | | | | |
| | | | | | |
Total net assets - 100.0%(3) | | | | | $ | 74,956,095 |
| | | | | | |
| (1) | Non-income producing security. |
| (2) | The Fund considers the issuer to be from the United Kingdom. See the Fund’s Statement of Additional Information for information on how a particular country is assigned. The security’s trading currency is British pounds. |
| (3) | Percentages for the various classifications relate to total net assets. |
The accompanying notes are an integral part of the financial statements.
40
FORTY
ARTISAN SMALL CAP FUND
Schedule of Investments – September 30, 2006
| | | | | |
| | | | | |
| | | Shares
Held | | Value |
| COMMON STOCKS - 97.0% | | | |
| | | | | |
| AUTO & TRANSPORTATION - 5.4% | | | |
Air Transport - 0.7% | | | |
AirTran Holdings, Inc.(1) | | 856,300 | | $ | 8,494,496 |
| | | | | |
Auto Parts: After Market - 1.7% | | | |
Keystone Automotive Industries, Inc.(1) | | 560,400 | | | 21,306,408 |
| | | | | |
Transportation Miscellaneous - 1.7% | | | |
Pacer International, Inc. | | 765,200 | | | 21,241,952 |
| | | | | |
Truckers - 1.3% | | | |
Old Dominion Freight Line, Inc.(1) | | 556,000 | | | 16,696,680 |
| | | | | |
| CONSUMER DISCRETIONARY - 23.1% | | | |
Consumer Products - 1.8% | | | |
RC2 Corporation(1) | | 438,600 | | | 14,706,258 |
Spectrum Brands, Inc.(1) | | 948,200 | | | 8,002,808 |
| | | | | |
| | | | | 22,709,066 |
Education Services - 3.4% | | | |
Bright Horizons Family Solutions, Inc.(1) | | 520,900 | | | 21,737,157 |
Strayer Education, Inc. | | 199,400 | | | 21,577,074 |
| | | | | |
| | | | | 43,314,231 |
Restaurants - 1.5% | | | |
RARE Hospitality International, Inc.(1) | | 630,950 | | | 19,281,832 |
| | | | | |
Retail - 6.5% | | | |
Central Garden & Pet Company(1) | | 409,400 | | | 19,757,644 |
Guitar Center, Inc.(1) | | 491,500 | | | 21,960,220 |
Hibbett Sporting Goods, Inc.(1) | | 755,050 | | | 19,767,209 |
United Natural Foods, Inc.(1) | | 668,800 | | | 20,726,112 |
| | | | | |
| | | | | 82,211,185 |
Services: Commercial - 6.8% | | | |
The Advisory Board Company(1) | | 395,900 | | | 20,000,868 |
CRA International, Inc.(1) | | 451,900 | | | 21,537,554 |
The GEO Group, Inc.(1) | | 453,100 | | | 19,143,475 |
Resources Connection, Inc.(1) | | 236,900 | | | 6,346,551 |
Waste Connections, Inc.(1) | | 512,550 | | | 19,430,771 |
| | | | | |
| | | | | 86,459,219 |
| | | | | |
| | | Shares
Held | | Value |
| | | | | |
| CONSUMER DISCRETIONARY (CONTINUED) | | | |
Textiles Apparel Manufacturers - 1.8% | | | |
Carter’s, Inc.(1) | | 872,100 | | $ | 23,014,719 |
| | | | | |
Wholesalers - 1.3% | | | |
LKQ Corporation(1) | | 724,600 | | | 15,919,462 |
| | | | | |
| FINANCIAL SERVICES - 19.8% | | | |
Banks: Outside New York City - 3.0% | | | |
Alabama National BanCorporation | | 214,400 | | | 14,632,800 |
Westamerica Bancorporation | | 138,800 | | | 7,010,788 |
Wintrust Financial Corporation | | 320,900 | | | 16,093,135 |
| | | | | |
| | | | | 37,736,723 |
Diversified Financial Services - 1.6% | | | |
Euronet Worldwide, Inc.(1) | | 847,000 | | | 20,793,850 |
| | | | | |
Financial Data Processing Services & Systems - 2.8% | | | |
Open Solutions Inc.(1) | | 750,300 | | | 21,616,143 |
TNS, Inc.(1) | | 950,400 | | | 14,313,024 |
| | | | | |
| | | | | 35,929,167 |
Financial Miscellaneous - 1.6% | | | |
Global Cash Access Holdings, Inc.(1) | | 1,330,400 | | | 20,075,736 |
| | | | | |
Insurance: Multi-Line - 4.5% | | | |
HealthExtras, Inc.(1) | | 789,200 | | | 22,342,252 |
Max Re Capital Ltd. | | 807,500 | | | 18,540,200 |
Platinum Underwriters Holdings, Ltd. | | 505,500 | | | 15,584,565 |
| | | | | |
| | | | | 56,467,017 |
Insurance: Property-Casualty - 1.3% | | | |
Ohio Casualty Corporation | | 611,400 | | | 15,816,918 |
| | | | | |
Investment Management
Companies - 2.4% | | | |
Apollo Investment Corporation | | 887,010 | | | 18,192,575 |
National Financial Partners Corp. | | 292,400 | | | 11,997,172 |
| | | | | |
| | | | | 30,189,747 |
Rental & Leasing Services: Commercial - 1.3% | | | |
Williams Scotsman International, Inc.(1) | | 776,000 | | | 16,575,360 |
41
FORTY-ONE
| | | | | |
| | | Shares
Held | | Value |
| FINANCIAL SERVICES (CONTINUED) | | | |
Securities Brokerage & Services - 1.3% | | | |
optionsXpress Holdings, Inc. | | 611,300 | | $ | 17,043,044 |
| | | | | |
| HEALTHCARE - 10.1% | | | | | |
Biotechnology Research &
Production - 1.2% | | | |
PRA International(1) | | 587,600 | | | 15,683,044 |
| | | | | |
Drugs & Pharmaceuticals - 1.9% | | | |
Adams Respiratory Therapeutics, Inc.(1) | | 528,600 | | | 19,341,474 |
K-V Pharmaceutical Company, Class A(1) | | 193,200 | | | 4,578,840 |
| | | | | |
| | | | | 23,920,314 |
Health Care Facilities - 2.6% | | | |
ICON PLC (ADR)(1)(2) | | 265,800 | | | 18,760,164 |
United Surgical Partners International, Inc.(1) | | 551,300 | | | 13,688,779 |
| | | | | |
| | | | | 32,448,943 |
Health Care Management Services - 1.0% | | | |
Sierra Health Services, Inc.(1) | | 338,600 | | | 12,812,624 |
| | | | | |
Medical & Dental Instruments & Supplies - 2.5% | | | |
PSS World Medical, Inc.(1) | | 924,100 | | | 18,472,759 |
Thoratec Corporation(1) | | 816,600 | | | 12,747,126 |
| | | | | |
| | | | | 31,219,885 |
Medical Services - 0.9% | | | |
VCA Antech, Inc.(1) | | 322,500 | | | 11,629,350 |
| | | | | |
| MATERIALS & PROCESSING - 4.7% | | | |
Building: Heating & Plumbing - 2.0% | | | |
Interline Brands, Inc.(1) | | 1,038,500 | | | 25,630,180 |
| | | | | |
Building: Roofing & Wallboard - 1.4% | | | |
Beacon Roofing Supply, Inc.(1) | | 901,600 | | | 18,248,384 |
| | | | | |
Chemicals - 1.3% | | | |
NuCO2 Inc.(1) | | 619,700 | | | 16,669,930 |
| | | | | |
| OTHER ENERGY - 6.8% | | | | | |
Coal - 0.5% | | | |
James River Coal Company(1) | | 549,100 | | | 5,793,005 |
| | | | | |
Machinery: Oil Well Equipment & Services - 4.2% | | | |
Core Laboratories N.V.(1)(2) | | 227,200 | | | 14,495,360 |
Hornbeck Offshore Services, Inc.(1) | | 590,500 | | | 19,781,750 |
| | | | | |
| | | Shares
Held | | Value |
| OTHER ENERGY (CONTINUED) | | | | | |
Machinery: Oil Well Equipment & Services (Continued) | | | |
W-H Energy Services, Inc.(1) | | 461,700 | | $ | 19,146,699 |
| | | | | |
| | | | | 53,423,809 |
Offshore Drilling - 1.3% | | | |
Hercules Offshore, Inc.(1) | | 511,700 | | | 15,888,285 |
| | | | | |
Oil: Crude Producers - 0.8% | | | |
Bill Barrett Corporation(1) | | 430,400 | | | 10,570,624 |
| | | | | |
| PRODUCER DURABLES - 5.3% | | | |
Identification Control & Filter Devices - 1.9% | | | |
ESCO Technologies Inc.(1) | | 518,700 | | | 23,880,948 |
| | | | | |
Machinery: Industrial/Specialty - 2.9% | | | |
Actuant Corporation | | 395,500 | | | 19,814,550 |
Columbus McKinnon Corporation(1) | | 904,400 | | | 16,306,332 |
| | | | | |
| | | | | 36,120,882 |
Production Technology Equipment - 0.5% | | | |
Varian Semiconductor Equipment Associates, Inc.(1) | | 169,500 | | | 6,220,650 |
| | | | | |
| TECHNOLOGY - 21.8% | | | | | |
Communications Technology - 3.3% | | | |
Avocent Corporation(1) | | 911,200 | | | 27,445,344 |
Ixia(1) | | 1,595,000 | | | 14,211,450 |
| | | | | |
| | | | | 41,656,794 |
Computer Services Software & Systems - 10.5% | | | |
Concur Technologies, Inc.(1) | | 935,700 | | | 13,614,435 |
Epicor Software Corporation(1) | | 1,300,200 | | | 17,045,622 |
F5 Networks, Inc.(1) | | 390,000 | | | 20,950,800 |
Macrovision Corporation(1) | | 712,100 | | | 16,869,649 |
Progress Software Corporation(1) | | 818,700 | | | 21,286,200 |
SRA International, Inc.(1) | | 212,400 | | | 6,384,744 |
Wind River Systems, Inc.(1) | | 1,683,100 | | | 18,026,001 |
Witness Systems, Inc.(1) | | 1,023,100 | | | 17,934,943 |
| | | | | |
| | | | | 132,112,394 |
Computer Technology - 0.6% | | | |
Stratasys Inc.(1) | | 267,400 | | | 7,062,034 |
| | | | | |
Electronics - 2.9% | | | |
Aeroflex Incorporated(1) | | 1,816,200 | | | 18,670,536 |
Semtech Corporation(1) | | 1,412,200 | | | 18,019,672 |
| | | | | |
| | | | | 36,690,208 |
Electronics: Semi-Conductors/Components - 4.5% | | | |
DSP Group, Inc.(1) | | 896,700 | | | 20,489,595 |
42
FORTY-TWO
| | | | | | | |
| | | Shares
Held | | Value | |
| TECHNOLOGY (CONTINUED) | | | | | | | |
Electronics: Semi-Conductors/Components (Continued) | | | | |
SiRF Technology Holdings, Inc.(1) | | | 634,800 | | $ | 15,228,852 | |
Tessera Technologies, Inc.(1) | | | 590,000 | | | 20,520,200 | |
| | | | | | | |
| | | | | | 56,238,647 | |
| | | | | | | |
Total common stocks (Cost $1,146,574,859) | | | | | | 1,225,197,746 | |
| | | Par
Amount | | | |
SHORT-TERM INVESTMENTS
(CASH EQUIVALENTS) - 3.7% | | | | |
| Repurchase agreement with Fixed Income Clearing Corporation, 5.00%, dated 9/29/06, due 10/2/06, maturity value $47,258,683, collateralized by $48,187,569 market value Federal National Mortgage Association Note, 5.00%, due 4/15/15 (Cost $47,239,000) | | $ | 47,239,000 | | | 47,239,000 | |
| | | | | | | |
| | | | | | | |
Total investments - 100.7% (Cost $1,193,813,859) | | | | | | 1,272,436,746 | |
| | | | | | | |
Other assets less liabilities - (0.7%) | | | (8,617,400 | ) |
| | | | | | | |
| | | | | | | |
Total net assets - 100.0%(3) | | | | | $ | 1,263,819,346 | |
| | | | | | | |
| (1) | Non-income producing security. |
| (2) | The Fund considers the issuer to be from outside of the United States. See the Fund’s Statement of Additional Information for information on how a particular country is assigned. The security trades on a U.S. exchange. |
| | |
Security | | Issuer Country |
Core Laboratories N.V. | | Netherlands |
ICON PLC (ADR) | | Ireland |
| (3) | Percentages for the various classifications relate to total net assets. |
(ADR) American Depository Receipt
The accompanying notes are an integral part of the financial statements.
43
FORTY-THREE
ARTISAN SMALL CAP VALUE FUND
Schedule of Investments – September 30, 2006
| | | | | |
| | | | | |
| | | Shares
Held | | Value |
| COMMON STOCKS - 92.7% | | | | | |
| | | | | |
| AUTO & TRANSPORTATION - 3.5% | | | |
Auto Parts: After Market - 1.4% | | | |
Commercial Vehicle Group, Inc(1) | | 722,900 | | $ | 13,923,054 |
Superior Industries International, Inc. | | 876,300 | | | 14,713,077 |
| | | | | |
| | | | | 28,636,131 |
Auto Trucks & Parts - 1.0% | | | | | |
Wabash National Corporation | | 1,555,900 | | | 21,300,271 |
| | | | | |
Recreational Vehicles & Boats - 0.1% | | | |
Arctic Cat Inc. | | 147,200 | | | 2,443,520 |
| | | | | |
Shipping - 0.7% | | | | | |
OMI Corporation | | 618,800 | | | 13,434,148 |
| | | | | |
Truckers - 0.3% | | | | | |
Arkansas Best Corporation | | 158,400 | | | 6,815,952 |
| | | | | |
| CONSUMER DISCRETIONARY - 30.3% | | | |
Advertising Agencies - 0.4% | | | |
Valassis Communications, Inc.(1) | | 451,100 | | | 7,961,915 |
| | | | | |
Consumer Electronics - 1.2% | | | |
EarthLink, Inc.(1) | | 3,355,200 | | | 24,392,304 |
| | | | | |
Household Furnishings - 4.3% | | | |
Ethan Allen Interiors Inc. | | 1,045,400 | | | 36,233,564 |
Furniture Brands International, Inc.(2) | | 2,012,900 | | | 38,325,616 |
La-Z-Boy Incorporated | | 917,500 | | | 12,808,300 |
| | | | | |
| | | | | 87,367,480 |
Leisure Time - 0.5% | | | | | |
Vail Resorts, Inc.(1) | | 275,100 | | | 11,009,502 |
| | | | | |
Radio & TV Broadcasters - 0.5% | | | |
World Wrestling Entertainment, Inc., Class A | | 607,900 | | | 9,987,797 |
| | | | | |
Rental & Leasing Services: Consumer - 1.2% | | | | | |
Rent-A-Center, Inc.(1) | | 815,500 | | | 23,885,995 |
| | | | | |
| | | | | |
| | | Shares
Held | | Value |
| CONSUMER DISCRETIONARY (CONTINUED) | | | |
Restaurants - 1.5% | | | | | |
Applebee’s International, Inc. | | 1,401,100 | | $ | 30,137,661 |
| | | | | |
Retail - 6.1% | | | | | |
1-800 CONTACTS, INC.(1) | | 675,500 | | | 10,125,745 |
America’s Car-Mart, Inc.(1) | | 195,400 | | | 3,214,330 |
Global Imaging Systems, Inc.(1) | | 518,000 | | | 11,432,260 |
MarineMax, Inc.(1) | | 294,000 | | | 7,482,300 |
Sonic Automotive, Inc., Class A | | 911,300 | | | 21,041,917 |
Tuesday Morning Corporation | | 1,115,300 | | | 15,480,364 |
Zale Corporation(1)(2) | | 2,005,500 | | | 55,632,570 |
| | | | | |
| | | | | 124,409,486 |
Services: Commercial - 11.5% | | | |
AMN Healthcare Services, Inc.(1) | | 1,322,600 | | | 31,411,750 |
CDI Corp. | | 238,400 | | | 4,937,264 |
Cross Country Healthcare, Inc.(1)(2) | | 2,097,500 | | | 35,657,500 |
Diamond Management & Technology Consultants, Inc.(1)(2) | | 2,079,700 | | | 23,167,858 |
Gevity HR, Inc. | | 305,600 | | | 6,961,568 |
Hudson Highland Group, Inc.(1) | | 1,087,300 | | | 10,655,540 |
Korn/Ferry International(1) | | 894,400 | | | 18,728,736 |
Medical Staffing Network Holdings, Inc.(1)(2) | | 1,548,900 | | | 9,634,158 |
Tetra Tech, Inc.(1) | | 1,568,100 | | | 27,316,302 |
Watson Wyatt Worldwide, Inc. | | 1,618,300 | | | 66,220,836 |
| | | | | |
| | | | | 234,691,512 |
Textiles Apparel Manufacturers - 1.5% | | | |
Kellwood Company | | 1,072,150 | | | 30,910,084 |
| | | | | |
Toys - 0.7% | | | | | |
Marvel Entertainment, Inc.(1)(2) | | 576,200 | | | 13,909,468 |
| | | | | |
Wholesalers - 0.9% | | | | | |
United Stationers Inc.(1) | | 379,800 | | | 17,664,498 |
| | | | | |
| CONSUMER STAPLES - 1.9% | | | | | |
Foods - 1.9% | | | | | |
Sanderson Farms, Inc.(2) | | 1,197,500 | | | 38,751,100 |
| | | | | |
| FINANCIAL SERVICES - 14.0% | | | |
Finance Companies - 1.2% | | | | | |
Assured Guaranty Ltd. | | 939,600 | | | 24,363,828 |
44
FORTY-FOUR
| | | | | |
| | | | | |
| | | Shares
Held | | Value |
| FINANCIAL SERVICES (CONTINUED) | | | |
Financial Miscellaneous - 2.6% | | | |
Stewart Information Services Corporation(2) | | 1,501,100 | | $ | 52,193,247 |
| | | | | |
Insurance: Multi-Line - 6.5% | | | |
Hilb Rogal & Hobbs Company | | 1,506,000 | | | 64,230,900 |
Hub International Limited(3) | | 805,400 | | | 23,292,168 |
Max Re Capital Ltd. | | 553,600 | | | 12,710,656 |
PICO Holdings, Inc.(1) | | 614,200 | | | 19,992,210 |
Security Capital Assurance Ltd(1) | | 562,400 | | | 13,469,480 |
| | | | | |
| | | | | 133,695,414 |
Insurance: Property-Casualty - 0.6% | | | |
IPC Holdings, Ltd. | | 417,200 | | | 12,691,224 |
| | | | | |
Investment Management Companies - 1.0% | | | | | |
Capital Southwest Corporation | | 78,700 | | | 9,377,105 |
GAMCO Investors, Inc., Class A | | 317,900 | | | 12,099,274 |
| | | | | |
| | | | | 21,476,379 |
Real Estate Investment Trusts (REIT) - 2.1% | | | | | |
Annaly Capital Management, Inc. | | 1,858,400 | | | 24,419,376 |
Cousins Properties Incorporated | | 304,500 | | | 10,416,945 |
Eagle Hospitality Properties Trust, Inc. | | 809,200 | | | 7,525,560 |
| | | | | |
| | | | | 42,361,881 |
| HEALTHCARE - 4.2% | | | | | |
Drugs & Pharmaceuticals - 0.5% | | | |
Chattem, Inc.(1) | | 318,000 | | | 11,168,160 |
| | | | | |
Electronics: Medical Systems - 1.5% | | | |
Analogic Corporation | | 256,400 | | | 13,158,448 |
Datascope Corp. | | 517,500 | | | 17,320,725 |
| | | | | |
| | | | | 30,479,173 |
Medical & Dental
Instruments & Supplies - 1.8% | | | |
CONMED Corporation(1) | | 1,368,400 | | | 28,886,924 |
National Dentex Corporation(1)(2) | | 413,500 | | | 8,125,275 |
| | | | | |
| | | | | 37,012,199 |
Medical Services - 0.4% | | | | | |
America Service Group Inc.(1)(2) | | 603,600 | | | 7,852,836 |
| | | | | |
| MATERIALS & PROCESSING - 9.8% | | | |
Agriculture Fishing & Ranching - 1.3% | | | |
Delta and Pine Land Company | | 142,900 | | | 5,787,450 |
Gold Kist Inc.(1) | | 1,039,200 | | | 21,656,928 |
| | | | | |
| | | | | 27,444,378 |
| | | | | |
| | | | | |
| | | Shares
Held | | Value |
| MATERIALS & PROCESSING (CONTINUED) | | | |
Building Materials - 0.5% | | | | | |
Simpson Manufacturing Co., Inc. | | 346,500 | | $ | 9,365,895 |
| | | | | |
Chemicals - 2.2% | | | | | |
Albemarle Corporation | | 369,200 | | | 20,058,636 |
MacDermid, Incorporated | | 772,800 | | | 25,208,736 |
| | | | | |
| | | | | 45,267,372 |
Copper - 0.2% | | | | | |
Mueller Industries, Inc. | | 99,600 | | | 3,502,932 |
| | | | | |
Engineering & Contracting Services - 1.1% | | | |
Dycom Industries, Inc.(1) | | 1,056,300 | | | 22,710,450 |
| | | | | |
Metal Fabricating - 2.9% | | | | | |
Lone Star Technologies, Inc.(1) | | 624,900 | | | 30,232,662 |
Quanex Corporation | | 924,475 | | | 28,057,816 |
| | | | | |
| | | | | 58,290,478 |
Paper - 0.4% | | | | | |
Albany International Corp., Class A | | 284,600 | | | 9,055,972 |
| | | | | |
Steel - 1.2% | | | | | |
Schnitzer Steel Industries, Inc., Class A | | 799,000 | | | 25,200,460 |
| | | | | |
| OTHER ENERGY - 12.0% | | | | | |
Machinery: Oil Well
Equipment & Services -1.6% | | | |
RPC, Inc. | | 1,183,800 | | | 21,687,216 |
Superior Energy Services, Inc.(1) | | 385,500 | | | 10,123,230 |
| | | | | |
| | | | | 31,810,446 |
Offshore Drilling - 0.4% | | | | | |
Atwood Oceanics, Inc.(1) | | 168,500 | | | 7,577,445 |
| | | | | |
Oil: Crude Producers - 10.0% | | | |
Cabot Oil & Gas Corporation | | 179,225 | | | 8,590,254 |
Cimarex Energy Co. | | 1,047,900 | | | 36,875,601 |
Energy Partners, Ltd.(1) | | 493,400 | | | 12,162,310 |
Forest Oil Corporation(1) | | 616,258 | | | 19,467,590 |
Mariner Energy, Inc.(1) | | 1,260,997 | | | 23,164,515 |
Plains Exploration & Production Company (1) | | 231,793 | | | 9,946,238 |
Rosetta Resources Inc.(1) | | 982,800 | | | 16,874,676 |
St. Mary Land & Exploration Company | | 1,288,000 | | | 47,282,480 |
Stone Energy Corporation(1) | | 743,600 | | | 30,100,928 |
| | | | | |
| | | | | 204,464,592 |
45
FORTY-FIVE
| | | | | |
| | | | | |
| | | Shares
Held | | Value |
| PRODUCER DURABLES - 2.9% | | | |
Electrical Equipment & Components - 0.4% | | | | | |
Power-One, Inc.(1) | | 1,073,200 | | $ | 7,769,968 |
| | | | | |
Production Technology Equipment - 2.5% | | | | | |
Entegris, Inc.(1) | | 688,700 | | | 7,513,717 |
LTX Corporation(1) | | 2,465,500 | | | 12,352,155 |
Orbotech, Ltd.(1)(3) | | 1,277,200 | | | 30,269,640 |
| | | | | |
| | | | | 50,135,512 |
| TECHNOLOGY - 11.6% | | | | | |
Communications Technology - 2.9% | | | |
ADC Telecommunications, Inc.(1) | | 398,900 | | | 5,983,500 |
Black Box Corporation | | 224,000 | | | 8,718,080 |
CSG Systems International, Inc.(1) | | 604,000 | | | 15,963,720 |
Standard Microsystems Corporation(1) | | 807,900 | | | 22,960,518 |
TIBCO Software Inc.(1) | | 535,700 | | | 4,810,586 |
| | | | | |
| | | | | 58,436,404 |
Computer Services
Software & Systems - 7.9% | | | |
Altiris, Inc.(1) | | 819,200 | | | 17,276,928 |
Borland Software Corporation(1) | | 769,500 | | | 4,409,235 |
CIBER, Inc.(1) | | 1,697,700 | | | 11,255,751 |
Keane, Inc.(1) | | 1,892,200 | | | 27,266,602 |
Lawson Software, Inc.(1) | | 6,256,300 | | | 45,358,175 |
Manhattan Associates, Inc. (1)(2) | | 1,539,600 | | | 37,165,944 |
Open Text Corporation(1)(3) | | 981,100 | | | 17,561,690 |
| | | | | |
| | | | | 160,294,325 |
Electronics: Semi-Conductors/
Components - 0.8% | | | |
Actel Corporation(1) | | 1,033,700 | | | 16,074,035 |
| | | | | |
| UTILITIES - 2.5% | | | | | |
Utilities: Electrical - 0.7% | | | | | |
El Paso Electric Company(1) | | 648,500 | | | 14,487,490 |
| | | | | |
Utilities: Gas Distributors - 0.4% | | | |
SEMCO Energy, Inc.(1) | | 1,552,940 | | | 8,758,582 |
| | | | | |
Utilities: Telecommunications - 1.4% | | | |
IDT Corporation, Class B(1) | | 557,500 | | | 8,039,150 |
IDT Corporation, Class C(1) | | 538,700 | | | 7,617,218 |
USA Mobility, Inc. | | 572,800 | | | 13,082,752 |
| | | | | |
| | | | | 28,739,120 |
| | | | | |
Total common stocks
(Cost $1,612,773,633) | | | | | 1,890,389,021 |
| | | | | | |
| | | | | | |
| | | Par Amount | | Value |
| SHORT-TERM INVESTMENTS (CASH EQUIVALENTS) - 7.2% | | | |
Repurchase agreement with Fixed Income Clearing Corporation, 5.00%, dated 9/29/06, due 10/2/06, maturity value $146,896,181, collateralized by $63,042,538 market value Federal National Mortgage Association Note, 5.00%, due 4/15/15, and $49,375,000 market value Federal National Mortgage Association Note, 4.61%, due 10/10/13, and $37,355,000 market value Federal National Mortgage Association Note,
6.00%, due 9/26/13
(Cost $146,835,000) | | $ | 146,835,000 | | $ | 146,835,000 |
| | | | | | |
| | | | | | |
Total investments - 99.9%
(Cost $1,759,608,633) | | | | | | 2,037,224,021 |
| | | | | | |
Other assets less liabilities - 0.1% | | | | | | 2,258,102 |
| | | | | | |
| | | | | | |
Total net assets - 100.0%(4) | | | | | $ | 2,039,482,123 |
| | | | | | |
| (1) | Non-income producing security. |
| (2) | Affiliated company as defined by the Investment Company Act of 1940. See Note (6) in Notes to Financial Statements. |
| (3) | The Fund considers the issuer to be from outside of the United States. See the Fund’s Statement of Additional Information for information on how a particular country is assigned. The security trades on a U.S. exchange. |
| | |
Security | | Issuer Country |
Hub International Limited | | Canada |
Open Text Corporation | | Canada |
Orbotech, Ltd. | | Israel |
| (4) | Percentages for the various classifications relate to total net assets. |
The accompanying notes are an integral part of the financial statements.
46
FORTY-SIX
[THIS PAGE INTENTIONALLY LEFT BLANK]
47
FORTY-SEVEN
ARTISAN FUNDS, INC.
Statements of Assets and Liabilities – September 30, 2006
| | | | | | |
| | | INTERNATIONAL | | INTERNATIONAL SMALL CAP |
| ASSETS: | | | | | | |
Investments in securities, unaffiliated, at value | | $ | 13,241,588,441 | | $ | 893,995,206 |
Investments in securities, affiliated, at value | | | 586,192,179 | | | - |
Short-term investments (repurchase agreements), at value | | | 64,269,000 | | | 42,063,000 |
| | | | | | |
Total investments | | | 13,892,049,620 | | | 936,058,206 |
Cash | | | 820 | | | 952 |
Foreign currency | | | 2,154 | | | 124,165 |
Net unrealized gain on foreign currency forward contracts | | | 329,887 | | | 50,292 |
Receivable from investments sold | | | 79,594,308 | | | 14,354,968 |
Receivable from fund shares sold | | | 23,942,073 | | | 1,230,056 |
Dividends and interest receivable | | | 27,383,738 | | | 1,099,009 |
Other assets | | | 48,814 | | | 3,423 |
| | | | | | |
Total assets | | | 14,023,351,414 | | | 952,921,071 |
| | |
| LIABILITIES: | | | | | | |
Due to custodian | | | 8,736 | | | - |
Net unrealized loss on foreign currency forward contracts | | | - | | | - |
Payable for investments purchased | | | 55,250,153 | | | 5,701,796 |
Payable for fund shares redeemed | | | 44,934,381 | | | 6,292,975 |
Payable for operating expenses | | | 4,146,580 | | | 329,781 |
Payable for withholding taxes | | | 1,110,360 | | | 831,212 |
Payable for deferred directors’ compensation | | | 48,814 | | | 3,423 |
| | | | | | |
Total liabilities | | | 105,499,024 | | | 13,159,187 |
| | | | | | |
Total net assets | | $ | 13,917,852,390 | | $ | 939,761,884 |
| | | | | | |
| NET ASSETS CONSIST OF: | | | | | | |
Fund shares issued and outstanding | | $ | 9,590,824,737 | | $ | 548,059,912 |
Net unrealized appreciation on investments and foreign currency related transactions | | | 3,291,049,672 | | | 226,007,359 |
Accumulated undistributed net investment income (loss) | | | 29,515,834 | | | 10,046,921 |
Accumulated undistributed net realized gains on investments and foreign currency related transactions | | | 1,006,462,147 | | | 155,647,692 |
| | | | | | |
| | $ | 13,917,852,390 | | $ | 939,761,884 |
| | | | | | |
| SUPPLEMENTARY INFORMATION: | | | | | | |
Net assets | | | | | | |
Investor Shares | | $ | 9,801,901,102 | | $ | 939,761,884 |
Institutional Shares | | $ | 4,115,951,288 | | | |
Shares outstanding (Indefinite number of shares authorized, $0.01 par value) | | | | | | |
Investor Shares | | | 340,979,133 | | | 41,278,774 |
Institutional Shares | | | 142,327,678 | | | |
Net asset value, offering price and redemption price per share | | | | | | |
Investor Shares | | $ | 28.75 | | $ | 22.77 |
Institutional Shares | | $ | 28.92 | | | |
Cost of securities of unaffiliated issuers held | | $ | 10,076,689,841 | | $ | 709,242,249 |
Cost of securities of affiliated issuers held | | $ | 524,240,761 | | $ | - |
Cost of foreign currency | | $ | 2,155 | | $ | 124,419 |
48
FORTY-EIGHT
| | | | | | | | | | | |
| INTERNATIONAL VALUE | | MID CAP | | | | | | | |
| | | | | | | | | | | |
| $ | 1,142,024,794 | | $ | 5,114,154,833 | | | | | | | |
| | 60,658,530 | | | 121,808,774 | | | | | | | |
| | 102,546,000 | | | 70,489,000 | | | | | | | |
| | | | | | | | | | | | |
| | 1,305,229,324 | | | 5,306,452,607 | | | | | | | |
| | 535 | | | 9,633,867 | | | | | | | |
| | 3 | | | - | | | | | | | |
| | - | | | - | | | | | | | |
| | 254,082 | | | 102,707,075 | | | | | | | |
| | 85,333,314 | | | 11,289,333 | | | | | | | |
| | 3,492,136 | | | 1,400,483 | | | | | | | |
| | 3,121 | | | 22,438 | | | | | | | |
| | | | | | | | | | | | |
| | 1,394,312,515 | | | 5,431,505,803 | | | | | | | |
| | | | |
| | | | | | | | | | | |
| | - | | | - | | | | | | | |
| | 3,563 | | | - | | �� | | | | | |
| | 2,895,729 | | | 40,083,364 | | | | | | | |
| | 78,407,116 | | | 19,231,551 | | | | | | | |
| | 366,850 | | | 2,373,605 | | | | | | | |
| | 61,098 | | | - | | | | | | | |
| | 3,121 | | | 22,438 | | | | | | | |
| | | | | | | | | | | | |
| | 81,737,477 | | | 61,710,958 | | | | | | | |
| | | | | | | | | | | | |
| $ | 1,312,575,038 | | $ | 5,369,794,845 | | | | | | | |
| | | | | | | | | | | | |
| | | | | | | | | | | |
| $ | 1,068,057,406 | | $ | 3,855,711,699 | | | | | | | |
| | 175,101,955 | | | 964,367,365 | | | | | | | |
| | 12,395,483 | | | (21,602 | ) | | | | | | |
| | 57,020,194 | | | 549,737,383 | | | | | | | |
| | | | | | | | | | | | |
| $ | 1,312,575,038 | | $ | 5,369,794,845 | | | | | | | |
| | | | | | | | | | | | |
| | | | | | | | | | | |
| | | | | | | | | | | |
| $ | 1,312,575,038 | | $ | 4,571,943,921 | | | | | | | |
| | | $ | 797,850,924 | | | | | | | |
| | | | | | | | | | | |
| | 49,138,701 | | | 143,892,332 | | | | | | | |
| | | | 24,743,515 | | | | | | | |
| | | | | | | | | | | |
| $ | 26.71 | | $ | 31.77 | | | | | | | |
| | | $ | 32.24 | | | | | | | |
| $ | 1,081,872,449 | | $ | 4,225,259,546 | | | | | | | |
| $ | 48,235,905 | | $ | 116,825,696 | | | | | | | |
| $ | 3 | | $ | - | | | | | | | |
The accompanying notes are an integral part of the financial statements.
49
FORTY-NINE
ARTISAN FUNDS, INC.
Statements of Assets and Liabilities – September 30, 2006 (Continued)
| | | | | | |
| | | MID CAP VALUE | | OPPORTUNISTIC VALUE |
| ASSETS: | | | | | | |
Investments in securities, unaffiliated, at value | | $ | 2,387,018,928 | | $ | 72,973,227 |
Investments in securities, affiliated, at value | | | 180,807,206 | | | - |
Short-term investments (repurchase agreements), at value | | | 97,212,000 | | | 1,860,000 |
| | | | | | |
Total investments | | | 2,665,038,134 | | | 74,833,227 |
Cash | | | 917 | | | 456 |
Receivable from investments sold | | | - | | | - |
Receivable from fund shares sold | | | 3,410,970 | | | 266,383 |
Dividends and interest receivable | | | 2,340,565 | | | 94,090 |
Receivable from Adviser | | | - | | | 37,584 |
Other assets | | | 10,496 | | | - |
| | | | | | |
Total assets | | | 2,670,801,082 | | | 75,231,740 |
| | |
| LIABILITIES: | | | | | | |
Payable for investments purchased | | | 13,253,079 | | | - |
Payable for fund shares redeemed | | | 13,030,104 | | | 2,006 |
Payable for operating expenses | | | 1,185,711 | | | 53,493 |
Payable for withholding taxes | | | - | | | - |
Payable for advisory fees | | | - | | | 220,146 |
Payable for deferred directors’ compensation | | | 10,496 | | | - |
| | | | | | |
Total liabilities | | | 27,479,390 | | | 275,645 |
| | | | | | |
Total net assets | | $ | 2,643,321,692 | | $ | 74,956,095 |
| | | | | | |
| NET ASSETS CONSIST OF: | | | | | | |
Fund shares issued and outstanding | | $ | 2,298,909,453 | | $ | 71,829,768 |
Net unrealized appreciation on investments and foreign currency related transactions | | | 203,156,305 | | | 2,427,529 |
Accumulated undistributed net investment income (loss) | | | 7,408,113 | | | 185,076 |
Accumulated undistributed net realized gains on investments and foreign currency related transactions | | | 133,847,821 | | | 513,722 |
| | | | | | |
| | $ | 2,643,321,692 | | $ | 74,956,095 |
| | | | | | |
| SUPPLEMENTARY INFORMATION: | | | | | | |
Net assets | | | | | | |
Investor Shares | | $ | 2,643,321,692 | | $ | 74,956,095 |
Shares outstanding (Indefinite number of shares authorized, $0.01 par value) | | | | | | |
Investor Shares | | | 133,048,789 | | | 7,202,987 |
Net asset value, offering price and redemption price per share | | | | | | |
Investor Shares | | $ | 19.87 | | $ | 10.41 |
Cost of securities of unaffiliated issuers held | | $ | 2,294,674,212 | | $ | 72,405,178 |
Cost of securities of affiliated issuers held | | $ | 167,207,617 | | $ | - |
50
FIFTY
| | | | | | | | | | | | |
| SMALL CAP | | | SMALL CAP VALUE | | | | | | | |
| | | | | | | | | | | | |
| $ | 1,225,197,746 | | | $ | 1,569,973,449 | | | | | | | |
| | - | | | | 320,415,572 | | | | | | | |
| | 47,239,000 | | | | 146,835,000 | | | | | | | |
| | | | | | | | | | | | | |
| | 1,272,436,746 | | | | 2,037,224,021 | | | | | | | |
| | 902,821 | | | | 275 | | | | | | | |
| | 9,711,538 | | | | - | | | | | | | |
| | 2,746,578 | | | | 2,573,359 | | | | | | | |
| | 283,868 | | | | 1,719,591 | | | | | | | |
| | - | | | | - | | | | | | | |
| | 4,880 | | | | 203,089 | | | | | | | |
| | | | | | | | | | | | | |
| | 1,286,086,431 | | | | 2,041,720,335 | | | | | | | |
| | | | |
| | | | | | | | | | | | |
| | 18,794,266 | | | | 497,656 | | | | | | | |
| | 2,954,042 | | | | 859,202 | | | | | | | |
| | 513,897 | | | | 865,809 | | | | | | | |
| | - | | | | 8,457 | | | | | | | |
| | - | | | | - | | | | | | | |
| | 4,880 | | | | 7,088 | | | | | | | |
| | | | | | | | | | | | | |
| | 22,267,085 | | | | 2,238,212 | | | | | | | |
| | | | | | | | | | | | | |
| $ | 1,263,819,346 | | | $ | 2,039,482,123 | | | | | | | |
| | | | | | | | | | | | | |
| | | | | | | | | | | | |
| $ | 1,171,752,892 | | | $ | 1,520,786,300 | | | | | | | |
| | 78,622,887 | | | | 277,615,388 | | | | | | | |
| | (4,708 | ) | | | (6,834 | ) | | | | | | |
| | 13,448,275 | | | | 241,087,269 | | | | | | | |
| | | | | | | | | | | | | |
| $ | 1,263,819,346 | | | $ | 2,039,482,123 | | | | | | | |
| | | | | | | | | | | | | |
| | | | | | | | | | | | |
| | | | | | | | | | | | |
| $ | 1,263,819,346 | | | $ | 2,039,482,123 | | | | | | | |
| | | | | | | | | | | | |
| | 72,174,669 | | | | 106,373,608 | | | | | | | |
| | | | | | | | | | | | |
| $ | 17.51 | | | $ | 19.17 | | | | | | | |
| $ | 1,193,813,859 | | | $ | 1,482,514,648 | | | | | | | |
| $ | - | | | $ | 277,093,985 | | | | | | | |
The accompanying notes are an integral part of the financial statements.
51
FIFTY-ONE
ARTISAN FUNDS, INC.
Statements of Operations – For the Year Ended September 30, 2006
| | | | | | | | |
| | | INTERNATIONAL | | | INTERNATIONAL
SMALL CAP | |
| INVESTMENT INCOME: | | | | | | | | |
Dividends, from unaffiliated issuers(1) | | $ | 218,179,489 | | | $ | 16,504,463 | |
Dividends, from affiliated issuers(1) | | | 3,784,632 | | | | 120,046 | |
Interest | | | 7,993,511 | | | | 711,120 | |
Securities lending | | | 6,715,340 | | | | 37,574 | |
| | | | | | | | |
Total investment income | | | 236,672,972 | | | | 17,373,203 | |
| | |
| EXPENSES: | | | | | | | | |
Advisory fees | | | 118,863,237 | | | | 11,190,164 | |
Transfer agent fees(2) | | | | | | | | |
Investor Shares | | | 16,849,603 | | | | 1,498,803 | |
Institutional Shares | | | 25,859 | | | | | |
Shareholder communications | | | | | | | | |
Investor Shares | | | 970,004 | | | | 75,206 | |
Institutional Shares | | | 52,210 | | | | | |
Custodian fees | | | 6,994,690 | | | | 691,651 | |
Accounting fees | | | 77,000 | | | | 57,783 | |
Professional fees | | | 588,272 | | | | 65,550 | |
Less insurance recoveries(3) | | | (197,947 | ) | | | - | |
| | | | | | | | |
Net professional fees | | | 390,325 | | | | 65,550 | |
Registration fees | | | | | | | | |
Investor Shares | | | 163,419 | | | | 44,376 | |
Institutional Shares | | | 20,515 | | | | | |
Directors’ fees | | | 364,703 | | | | 25,322 | |
Other operating expenses | | | 633,152 | | | | 23,628 | |
| | | | | | | | |
Total operating expenses before amounts waived or paid by the Adviser or the Board of Directors | | | 145,404,717 | | | | 13,672,483 | |
Less amounts waived or paid by the Adviser or the Board of Directors | | | - | | | | - | |
| | | | | | | | |
Net expenses | | | 145,404,717 | | | | 13,672,483 | |
| | | | | | | | |
Net investment income (loss) | | | 91,268,255 | | | | 3,700,720 | |
| | |
NET REALIZED AND UNREALIZED GAINS (LOSSES) ON
INVESTMENTS: | | | | | | | | |
Net realized gain (loss) on: | | | | | | | | |
Investments(1) | | | 1,705,050,798 | | | | 165,713,461 | |
Foreign currency related transactions | | | (3,919,900 | ) | | | (381,598 | ) |
| | | | | | | | |
| | | 1,701,130,898 | | | | 165,331,863 | |
Net increase (decrease) in unrealized appreciation or depreciation on: | | | | | | | | |
Investments | | | 485,434,611 | | | | (1,545,057 | ) |
Foreign currency related transactions | | | 249,502 | | | | (617,231 | ) |
| | | | | | | | |
| | | 485,684,113 | | | | (2,162,288 | ) |
| | | | | | | | |
Net gain on investments and foreign currency related transactions | | | 2,186,815,011 | | | | 163,169,575 | |
| | | | | | | | |
Net increase in net assets resulting from operations | | $ | 2,278,083,266 | | | $ | 166,870,295 | |
| | | | | | | | |
| | | | | | |
(1) Fund | | Net of foreign taxes
withheld on dividends,
unaffiliated issuers | | Net of foreign taxes
withheld on dividends,
affiliated issuers | | Including net realized
gain on investments
from affiliated issuers |
International | | $25,092,580 | | $284,865 | | $14,037,874 |
International Small Cap | | 1,401,649 | | 23,722 | | 3,800,930 |
International Value | | 594,804 | | 159,904 | | 63,296 |
Mid Cap | | 1,033 | | - | | 2,644,667 |
| (2) | Includes fees paid to authorized agents. See Note 2(g) in Notes to Financial Statements. |
| (3) | For the year ended September 30, 2006, the International Fund incurred $588,272 in total professional fees. As described in Note (9) in Notes to Financial Statements, $197,947 in insurance recoveries were received relating to reimbursement of litigation defense costs, and were recorded as a reduction to professional fees during the year ended September 30, 2006. |
52
FIFTY-TWO
| | | | | | |
INTERNATIONAL VALUE | | | MID CAP | |
| | | | | | |
| $ | 25,534,135 | | | $ | 29,084,314 | |
| | 841,093 | | | | - | |
| | 2,669,251 | | | | 7,956,585 | |
| | 130,516 | | | | - | |
| | | | | | | |
| | 29,174,995 | | | | 37,040,899 | |
| |
| | | | | | |
| | 8,368,776 | | | | 54,380,280 | |
| | | | | | |
| | 1,511,888 | | | | 10,619,145 | |
| | | | | 22,205 | |
| | | | | | |
| | 98,741 | | | | 784,461 | |
| | | | | 16,402 | |
| | 377,298 | | | | 194,722 | |
| | 53,344 | | | | 65,475 | |
| | 62,884 | | | | 194,929 | |
| | - | | | | - | |
| | | | | | | |
| | 62,884 | | | | 194,929 | |
| | | | | | |
| | 108,479 | | | | 72,229 | |
| | | | | 16,408 | |
| | 22,260 | | | | 171,194 | |
| | 21,704 | | | | 121,284 | |
| | | | | | | |
| | 10,625,374 | | | | 66,658,734 | |
| | - | | | | - | |
| | | | | | | |
| | 10,625,374 | | | | 66,658,734 | |
| | | | | | | |
| | 18,549,621 | | | | (29,617,835 | ) |
| |
| | | | | | |
| | | | | | |
| | 63,848,919 | | | | 701,530,781 | |
| | (230,417 | ) | | | - | |
| | | | | | | |
| | 63,618,502 | | | | 701,530,781 | |
| | | | | | |
| | 103,014,146 | | | | (251,537,673 | ) |
| | 36,872 | | | | - | |
| | | | | | | |
| | 103,051,018 | | | | (251,537,673 | ) |
| | | | | | | |
| | 166,669,520 | | | | 449,993,108 | |
| | | | | | | |
| $ | 185,219,141 | | | $ | 420,375,273 | |
| | | | | | | |
The accompanying notes are an integral part of the financial statements.
53
FIFTY-THREE
ARTISAN FUNDS, INC.
Statements of Operations – For the Year Ended September 30, 2006 (Continued)
| | | | | | | | |
| | | MID CAP VALUE | | | OPPORTUNISTIC VALUE(1) | |
| INVESTMENT INCOME: | | | | | | | | |
Dividends, from unaffiliated issuers(2) | | $ | 32,627,628 | | | $ | 349,001 | |
Dividends, from affiliated issuers | | | 4,134,907 | | | | 69,799 | |
Interest | | | 5,356,507 | | | | 79,273 | |
| | | | | | | | |
Total investment income | | | 42,119,042 | | | | 498,073 | |
| | |
| EXPENSES: | | | | | | | | |
Advisory fees | | | 26,051,085 | | | | 220,146 | |
Transfer agent fees(3) | | | | | | | | |
Investor Shares | | | 5,905,291 | | | | 77,298 | |
Shareholder communications | | | | | | | | |
Investor Shares | | | 563,094 | | | | 8,500 | |
Custodian fees | | | 93,586 | | | | 5,648 | |
Accounting fees | | | 43,986 | | | | 20,741 | |
Professional fees | | | 100,218 | | | | 20,426 | |
Registration fees | | | | | | | | |
Investor Shares | | | 234,648 | | | | 42,885 | |
Directors’ fees | | | 80,329 | | | | 3,000 | |
Other operating expenses | | | 65,813 | | | | 2,850 | |
| | | | | | | | |
Total operating expenses before amounts waived or paid by the Adviser or the Board of Directors | | | 33,138,050 | | | | 401,494 | |
Less amounts waived or paid by the Adviser or the Board of Directors | | | - | | | | (37,584 | ) |
| | | | | | | | |
Net expenses | | | 33,138,050 | | | | 363,910 | |
| | | | | | | | |
Net investment income (loss) | | | 8,980,992 | | | | 134,163 | |
| | |
| NET REALIZED AND UNREALIZED GAINS (LOSSES) ON INVESTMENTS: | | | | | | | | |
Net realized gain (loss) on: | | | | | | | | |
Investments(2) | | | 142,494,534 | | | | 513,722 | |
Foreign currency related transactions | | | - | | | | (2,194 | ) |
| | | | | | | | |
| | | 142,494,534 | | | | 511,528 | |
Net increase (decrease) in unrealized appreciation or depreciation on: | | | | | | | | |
Investments | | | (2,012,828 | ) | | | 2,428,049 | |
Foreign currency related transactions | | | - | | | | (520 | ) |
| | | | | | | | |
| | | (2,012,828 | ) | | | 2,427,529 | |
| | | | | | | | |
Net gain on investments and foreign currency related transactions | | | 140,481,706 | | | | 2,939,057 | |
| | | | | | | | |
Net increase in net assets resulting from operations | | $ | 149,462,698 | | | $ | 3,073,220 | |
| | | | | | | | |
| (1) | For the period from commencement of operations (March 27, 2006) through September 30, 2006. |
| | | | | |
(2) Fund | | Net of foreign taxes
withheld on dividends,
unaffiliated issuers | | Including net realized
gain (loss) on investments
from affiliated issuers | |
Mid Cap Value | | $5,671 | | $311,183 | |
Opportunistic Value | | - | | (9,762 | ) |
Small Cap | | - | | (4,919,703 | ) |
Small Cap Value | | 29,466 | | (26,292,641 | ) |
| (3) | Includes fees paid to authorized agents. See Note 2(g) in Notes to Financial Statements. |
54
FIFTY-FOUR
| | | | | | |
| SMALL CAP | | | SMALL CAP VALUE | |
| | | | | | |
| $ | 3,500,680 | | | $ | 9,299,253 | |
| | - | | | | 5,788,494 | |
| | 2,134,759 | | | | 5,154,950 | |
| | | | | | | |
| | 5,635,439 | | | | 20,242,697 | |
| |
| | | | | | |
| | 12,153,734 | | | | 17,825,043 | |
| | | | | | |
| | 1,757,242 | | | | 3,503,611 | |
| | | | | | |
| | 177,681 | | | | 203,350 | |
| | 63,058 | | | | 69,301 | |
| | 49,136 | | | | 47,163 | |
| | 66,932 | | | | 77,584 | |
| | | | | | |
| | 65,652 | | | | 90,680 | |
| | 36,023 | | | | 53,168 | |
| | 30,652 | | | | 40,390 | |
| | | | | | | |
| |
| | 14,400,110 | | | | 21,910,290 | |
| | - | | | | - | |
| | | | | | | |
| | 14,400,110 | | | | 21,910,290 | |
| | | | | | | |
| | (8,764,671 | ) | | | (1,667,593 | ) |
| |
| | | | | | |
| | | | | | |
| | 32,875,407 | | | | 264,972,761 | |
| | - | | | | - | |
| | | | | | | |
| | 32,875,407 | | | | 264,972,761 | |
| | | | | | |
| | (23,271,457 | ) | | | (60,339,075 | ) |
| | - | | | | - | |
| | | | | | | |
| | (23,271,457 | ) | | | (60,339,075 | ) |
| | | | | | | |
| | 9,603,950 | | | | 204,633,686 | |
| | | | | | | |
| $ | 839,279 | | | $ | 202,966,093 | |
| | | | | | | |
The accompanying notes are an integral part of the financial statements.
55
FIFTY-FIVE
ARTISAN FUNDS, INC.
Statements of Changes in Net Assets
| | | | | | | | |
| | | INTERNATIONAL | |
| | | Year Ended
9/30/2006 | | | Year Ended
9/30/2005 | |
| OPERATIONS: | | | | | | | | |
Net investment income (loss) | | $ | 91,268,255 | | | $ | 109,690,495 | |
Net realized gain (loss) on: | | | | | | | | |
Investments | | | 1,705,050,798 | | | | 951,444,475 | |
Foreign currency related transactions | | | (3,919,900 | ) | | | (4,798,062 | ) |
Net increase (decrease) in unrealized appreciation or depreciation on: | | | | | | | | |
Investments | | | 485,434,611 | | | | 1,532,135,303 | |
Foreign currency related transactions | | | 249,502 | | | | (380,101 | ) |
| | | | | | | | |
Net increase in net assets resulting from operations | | | 2,278,083,266 | | | | 2,588,092,110 | |
| | |
| DISTRIBUTIONS PAID TO SHAREHOLDERS: | | | | | | | | |
Net investment income: | | | | | | | | |
Investor Shares | | | (129,259,160 | ) | | | (39,392,658 | ) |
Institutional Shares | | | (71,446,014 | ) | | | (29,943,284 | ) |
Net realized gains on investment transactions: | | | | | | | | |
Investor Shares | | | - | | | | - | |
Institutional Shares | | | - | | | | - | |
| | | | | | | | |
Total distributions paid to shareholders | | | (200,705,174 | ) | | | (69,335,942 | ) |
| | |
| FUND SHARE ACTIVITIES: | | | | | | | | |
Net increase (decrease) in net assets
resulting from fund share activities | | | 165,474,731 | | | | (596,036,624 | ) |
| | | | | | | | |
Total increase (decrease) in net assets | | | 2,242,852,823 | | | | 1,922,719,544 | |
Net assets, beginning of period | | | 11,674,999,567 | | | | 9,752,280,023 | |
| | | | | | | | |
Net assets, end of period | | $ | 13,917,852,390 | | | $ | 11,674,999,567 | |
| | | | | | | | |
| | | | | | | | |
Accumulated undistributed net investment income (loss) | | $ | 29,515,834 | | | $ | 104,696,688 | |
| | | | | | | | |
56
FIFTY-SIX
| | | | | | | | | | | | | | | | | | | | | | |
| INTERNATIONAL SMALL CAP | | | INTERNATIONAL VALUE | | | MID CAP | |
Year Ended
9/30/2006 | | | Year Ended
9/30/2005 | | | Year Ended
9/30/2006 | | | Year Ended
9/30/2005 | | | Year Ended
9/30/2006 | | | Year Ended
9/30/2005 | |
| | | | | | | | | | | | | | | | | | | | | | |
| $ | 3,700,720 | | | $ | 6,598,821 | | | $ | 18,549,621 | | | $ | 6,994,398 | | | $ | (29,617,835 | ) | | $ | (34,016,944 | ) |
| | | | | | | | | | | | | | | | | | | | | | |
| | 165,713,461 | | | | 74,774,575 | | | | 63,848,919 | | | | 14,858,879 | | | | 701,530,781 | | | | 344,210,655 | |
| | (381,598 | ) | | | (70,491 | ) | | | (230,417 | ) | | | (8,583 | ) | | | - | | | | - | |
| | | | | | | | | | | | | | | | | | | | | | |
| | (1,545,057 | ) | | | 137,805,025 | | | | 103,014,146 | | | | 55,053,627 | | | | (251,537,673 | ) | | | 617,698,766 | |
| | (617,231 | ) | | | (135,597 | ) | | | 36,872 | | | | (70,493 | ) | | | - | | | | - | |
| | | | | | | | | | | | | | | | | | | | | | | |
| | 166,870,295 | | | | 218,972,333 | | | | 185,219,141 | | | | 76,827,828 | | | | 420,375,273 | | | | 927,892,477 | |
| | | | | |
| | | | | | | | | | | | | | | | | | | | | | |
| | | | | | | | | | | | | | | | | | | | | | |
| | (7,528,607 | ) | | | (3,652,844 | ) | | | (13,095,062 | ) | | | (1,728,097 | ) | | | - | | | | - | |
| | | | | | | | | | | | | | | | | - | | | | - | |
| | | | | | | | | | | | | | | | | | | | | | |
| | (71,173,967 | ) | | | (55,013,278 | ) | | | (16,600,079 | ) | | | (3,316,422 | ) | | | (209,469,474 | ) | | | - | |
| | | | | | | | | | | | | | | | | (41,213,795 | ) | | | - | |
| | | | | | | | | | | | | | | | | | | | | | | |
| | (78,702,574 | ) | | | (58,666,122 | ) | | | (29,695,141 | ) | | | (5,044,519 | ) | | | (250,683,269 | ) | | | - | |
| | | | | |
| | | | | | | | | | | | | | | | | | | | | | |
|
70,444,652 |
| | | 105,834,632 | | | | 555,837,073 | | | | 311,932,123 | | | | (655,280,963 | ) | | | (151,207,182 | ) |
| | | | | | | | | | | | | | | | | | | | | | | |
| | 158,612,373 | | | | 266,140,843 | | | | 711,361,073 | | | | 383,715,432 | | | | (485,588,959 | ) | | | 776,685,295 | |
| | 781,149,511 | | | | 515,008,668 | | | | 601,213,965 | | | | 217,498,533 | | | | 5,855,383,804 | | | | 5,078,698,509 | |
| | | | | | | | | | | | | | | | | | | | | | | |
| $ | 939,761,884 | | | $ | 781,149,511 | | | $ | 1,312,575,038 | | | $ | 601,213,965 | | | $ | 5,369,794,845 | | | $ | 5,855,383,804 | |
| | | | | | | | | | | | | | | | | | | | | | | |
| | | | | | | | | | | | | | | | | | | | | | |
| $ | 10,046,921 | | | $ | 6,054,994 | | | $ | 12,395,483 | | | $ | 7,171,341 | | | $ | (21,602 | ) | | $ | - | |
| | | | | | | | | | | | | | | | | | | | | | | |
The accompanying notes are an integral part of the financial statements.
57
FIFTY-SEVEN
ARTISAN FUNDS, INC.
Statements of Changes in Net Assets (Continued)
| | | | | | | | |
| | | MID CAP VALUE | |
| | | Year Ended
9/30/2006 | | | Year Ended
9/30/2005 | |
| OPERATIONS: | | | | | | | | |
Net investment income (loss) | | $ | 8,980,992 | | | $ | (473,600 | ) |
Net realized gain (loss) on: | | | | | | | | |
Investments | | | 142,494,534 | | | | 111,731,536 | |
Foreign currency related transactions | | | - | | | | - | |
Net increase (decrease) in unrealized appreciation or depreciation on: | | | | | | | | |
Investments | | | (2,012,828 | ) | | | 173,545,831 | |
Foreign currency related transactions | | | - | | | | - | |
| | | | | | | | |
Net increase in net assets resulting from operations | | | 149,462,698 | | | | 284,803,767 | |
| | |
| DISTRIBUTIONS PAID TO SHAREHOLDERS: | | | | | | | | |
Net investment income: | | | | | | | | |
Investor Shares | | | (1,572,879 | ) | | | (121,029 | ) |
Net realized gains on investment transactions: | | | | | | | | |
Investor Shares | | | (115,690,210 | ) | | | (9,206,872 | ) |
| | | | | | | | |
Total distributions paid to shareholders | | | (117,263,089 | ) | | | (9,327,901 | ) |
| | |
| FUND SHARE ACTIVITIES: | | | | | | | | |
Net increase (decrease) in net assets
resulting from fund share activities | | | (160,035,696 | ) | | | 2,183,402,227 | |
| | | | | | | | |
Total increase (decrease) in net assets | | | (127,836,087 | ) | | | 2,458,878,093 | |
Net assets, beginning of period | | | 2,771,157,779 | | | | 312,279,686 | |
| | | | | | | | |
Net assets, end of period | | $ | 2,643,321,692 | | | $ | 2,771,157,779 | |
| | | | | | | | |
| | | | | | | | |
Accumulated undistributed net investment income (loss) | | $ | 7,408,113 | | | $ | - | |
| | | | | | | | |
| (1) | For the period from commencement of operations (March 27, 2006) through September 30, 2006. |
58
FIFTY-EIGHT
| | | | | | | | | | | | | | | | | | |
| OPPORTUNISTIC VALUE | | | SMALL CAP | | | SMALL CAP VALUE | |
Period Ended
9/30/2006(1) | | | Year Ended
9/30/2006 | | | Year Ended
9/30/2005 | | | Year Ended
9/30/2006 | | | Year Ended
9/30/2005 | |
| | | | | | | | | | | | | | | | | | |
| $ | 134,163 | | | $ | (8,764,671 | ) | | $ | (4,793,528 | ) | | $ | (1,667,593 | ) | | $ | (2,313,345 | ) |
| | | | | | | | | | | | | | | | | | |
| | 513,722 | | | | 32,875,407 | | | | 35,289,542 | | | | 264,972,761 | | | | 214,241,152 | |
| | (2,194 | ) | | | - | | | | - | | | | - | | | | - | |
| | | | | | | | | | | | | | | | | | |
| | 2,428,049 | | | | (23,271,457 | ) | | | 78,443,136 | | | | (60,339,075 | ) | | | 80,790,643 | |
| | (520 | ) | | | - | | | | - | | | | - | | | | - | |
| | | | | | | | | | | | | | | | | | | |
| | 3,073,220 | | | | 839,279 | | | | 108,939,150 | | | | 202,966,093 | | | | 292,718,450 | |
| | | | |
| | | | | | | | | | | | | | | | | | |
| | | | | | | | | | | | | | | | | | |
| | - | | | | - | | | | - | | | | - | | | | - | |
| | | | | | | | | | | | | | | | | | |
| | - | | | | (36,967,423 | ) | | | (10,649,591 | ) | | | (205,122,847 | ) | | | (123,856,296 | ) |
| | | | | | | | | | | | | | | | | | | |
| | - | | | | (36,967,423 | ) | | | (10,649,591 | ) | | | (205,122,847 | ) | | | (123,856,296 | ) |
| | | | |
| | | | | | | | | | | | | | | | | | |
|
71,882,875 |
| | | 196,696,072 | | | | 765,395,821 | | | | 320,766,182 | | | | 359,260,393 | |
| | | | | | | | | | | | | | | | | | | |
| | 74,956,095 | | | | 160,567,928 | | | | 863,685,380 | | | | 318,609,428 | | | | 528,122,547 | |
| | - | | | | 1,103,251,418 | | | | 239,566,038 | | | | 1,720,872,695 | | | | 1,192,750,148 | |
| | | | | | | | | | | | | | | | | | | |
| $ | 74,956,095 | | | $ | 1,263,819,346 | | | $ | 1,103,251,418 | | | $ | 2,039,482,123 | | | $ | 1,720,872,695 | |
| | | | | | | | | | | | | | | | | | | |
| | | | | | | | | | | | | | | | | | |
| $ | 185,076 | | | $ | (4,708 | ) | | $ | - | | | $ | (6,834 | ) | | $ | - | |
| | | | | | | | | | | | | | | | | | | |
The accompanying notes are an integral part of the financial statements.
59
FIFTY-NINE
ARTISAN FUNDS, INC.
Financial Highlights – For a share outstanding throughout each period
The financial highlights table is intended to help you understand the Funds’ financial performance for the past 5 years or, if shorter, the period of a Fund’s operations. Certain information reflects financial results for a single Fund share. The total returns in the table represent the rate that an investor would have earned or lost on an investment in the Fund (assuming reinvestment of all dividends and distributions). This information has been audited by Ernst & Young LLP, whose report, along with each Fund’s financial statements, is included in this annual report. The financial highlights of the Funds for the periods ended prior to September 30, 2003 were audited by other auditors.
| | | | | | | | | | | | | | | | | | | | | | | | |
Year or
Period
Ended | | |
Net Asset
Value
Beginning
of Period | | Net
Investment
Income(1) | | | Net Realized
and Unrealized
Gain (Loss) on
Investments | | | Total Income
(Loss) from
Investment
Operations | | | Dividends
from Net
Investment
Income | | | Distributions
from Net
Realized
Gains | |
| | | | | | | | | | | | | | | | | | | | | | | | |
| ARTISAN INTERNATIONAL FUND | | | | | | | | | | | | | | | | | | | | |
| Investor Shares | | | | | | | | | | | | | | | | | | | | | | | | |
| 9/30/2006 | | | $ | 24.40 | | $ | 0.18 | | | $ | 4.58 | | | $ | 4.76 | | | $ | (0.41 | ) | | $ | - | |
| 9/30/2005 | | | | 19.33 | | | 0.21 | | | | 4.98 | | | | 5.19 | | | | (0.12 | ) | | | - | |
| 9/30/2004 | | | | 16.54 | | | 0.12 | | | | 2.85 | | | | 2.97 | | | | (0.18 | ) | | | - | |
| 9/30/2003 | (5) | | | 15.63 | | | 0.02 | | | | 0.89 | | | | 0.91 | | | | - | | | | - | |
| 6/30/2003 | | | | 18.15 | | | 0.20 | | | | (2.62 | ) | | | (2.42 | ) | | | (0.10 | ) | | | - | |
| 6/30/2002 | | | | 19.53 | | | 0.15 | | | | (1.46 | ) | | | (1.31 | ) | | | (0.07 | ) | | | - | |
| Institutional Shares | | | | | | | | | | | | | | | | | | | | | | | | |
| 9/30/2006 | | | $ | 24.54 | | $ | 0.22 | | | $ | 4.62 | | | $ | 4.84 | | | $ | (0.46 | ) | | $ | - | |
| 9/30/2005 | | | | 19.44 | | | 0.25 | | | | 5.01 | | | | 5.26 | | | | (0.16 | ) | | | - | |
| 9/30/2004 | | | | 16.63 | | | 0.16 | | | | 2.86 | | | | 3.02 | | | | (0.21 | ) | | | - | |
| 9/30/2003 | (5) | | | 15.71 | | | 0.03 | | | | 0.89 | | | | 0.92 | | | | - | | | | - | |
| 6/30/2003 | | | | 18.24 | | | 0.25 | | | | (2.65 | ) | | | (2.40 | ) | | | (0.13 | ) | | | - | |
| 6/30/2002 | | | | 19.62 | | | 0.18 | | | | (1.46 | ) | | | (1.28 | ) | | | (0.10 | ) | | | - | |
| | | | | | | | | | | | | | | | | | | | | | | | |
| ARTISAN INTERNATIONAL SMALL CAP FUND | | | | | | | | | | | | | | | | | |
| Investor Shares | | | | | | | | | | | | | | | | | | | | | | | | |
| 9/30/2006 | | | $ | 20.86 | | $ | 0.09 | | | $ | 3.90 | | | $ | 3.99 | | | $ | (0.20 | ) | | $ | (1.88 | ) |
| 9/30/2005 | | | | 16.40 | | | 0.19 | | | | 6.16 | | | | 6.35 | | | | (0.12 | ) | | | (1.77 | ) |
| 9/30/2004 | | | | 13.84 | | | 0.15 | | | | 2.93 | | | | 3.08 | | | | (0.03 | ) | | | (0.49 | ) |
| 9/30/2003 | (5) | | | 12.10 | | | - | (6) | | | 1.74 | | | | 1.74 | | | | - | | | | - | |
| 6/30/2003 | | | | 10.50 | | | 0.03 | | | | 1.59 | | | | 1.62 | | | | - | | | | (0.02 | ) |
| 6/30/2002 | (7) | | | 10.00 | | | - | (6) | | | 0.50 | (8) | | | 0.50 | | | | - | | | | - | |
| | | | | | | | | | | | | | | | | | | | | | | | |
| ARTISAN INTERNATIONAL VALUE FUND | | | | | | | | | | | | | | | | | |
| Investor Shares | | | | | | | | | | | | | | | | | | | | | | | | |
| 9/30/2006 | | | $ | 22.38 | | $ | 0.53 | | | $ | 4.87 | | | $ | 5.40 | | | $ | (0.47 | ) | | $ | (0.60 | ) |
| 9/30/2005 | | | | 18.54 | | | 0.28 | | | | 3.88 | | | | 4.16 | | | | (0.11 | ) | | | (0.21 | ) |
| 9/30/2004 | | | | 14.32 | | | 0.28 | | | | 4.33 | | | | 4.61 | | | | (0.09 | ) | | | (0.30 | ) |
| 9/30/2003 | (5) | | | 13.01 | | | 0.02 | | | | 1.29 | | | | 1.31 | | | | - | | | | - | |
| 6/30/2003 | (9) | | | 10.00 | | | 0.09 | | | | 2.92 | | | | 3.01 | | | | - | | | | - | |
| (1) | Computed based on average shares outstanding. |
| (2) | Periods less than twelve months (where applicable) are not annualized. |
| (3) | Periods less than twelve months (where applicable) are annualized. |
| (4) | The ratios of expenses to average net assets and net investment income (loss) to average net assets exclude expenses waived or paid by the Adviser or the Board of Directors. Absent expenses waived or paid by the Adviser or the Board of Directors, the ratios of expenses to average net assets and net investment income (loss) to average net assets would have been as follows: |
| | | | | | | | |
| | | Year or
Period Ended | | Ratio of Expenses to
Average Net Assets | | | Ratio of Net Investment Income
(Loss) to Average Net Assets | |
International Investor Shares | | 9/30/2003 | | 1.23 | % | | 0.49 | % |
International Institutional Shares | | 9/30/2003 | | 1.00 | | | 0.73 | |
International Small Cap Investor Shares | | 9/30/2003 | | 1.69 | | | 0.05 | |
International Value Investor Shares | | 9/30/2003 | | 2.80 | | | (0.34 | ) |
| | 6/30/2003 | | 5.02 | | | (1.43 | ) |
60
SIXTY
| | | | | | | | | | | | | | | | | | | | |
Total
Distributions | | | Net Asset
Value
End
of Period | | Total
Return(2) | | | Net Assets
End of
Period
(millions) | | Ratio of
Expenses
to Average
Net Assets(3)(4) | | | Ratio of Net
Investment
Income (Loss)
to Average
Net Assets(3)(4) | | | Portfolio
Turnover
Rate(2) | |
| | | | | | | | | | | | | | | | | | | | |
| | | | | | | | | | | | | | | | | |
| | | | | | | | | | | | | | | | | | | | | |
| $ | (0.41 | ) | | $ | 28.75 | | 19.84 | % | | $ | 9,801.9 | | 1.20 | % | | 0.66 | % | | 57.80 | % |
| | (0.12 | ) | | | 24.40 | | 26.97 | | | | 7,686.9 | | 1.19 | | | 0.94 | | | 56.15 | |
| | (0.18 | ) | | | 19.33 | | 18.04 | | | | 6,130.2 | | 1.22 | | | 0.64 | | | 54.96 | |
| | - | | | | 16.54 | | 5.82 | | | | 5,544.7 | | 1.23 | | | 0.49 | | | 15.23 | |
| | (0.10 | ) | | | 15.63 | | (13.30 | ) | | | 5,182.8 | | 1.20 | | | 1.35 | | | 37.13 | |
| | (0.07 | ) | | | 18.15 | | (6.73 | ) | | | 5,289.6 | | 1.21 | | | 0.82 | | | 50.67 | |
| | | | | | | | | | | | | | | | | | | | | |
| $ | (0.46 | ) | | $ | 28.92 | | 20.07 | % | | $ | 4,116.0 | | 1.00 | % | | 0.82 | % | | 57.80 | % |
| | (0.16 | ) | | | 24.54 | | 27.21 | | | | 3,988.1 | | 0.99 | | | 1.11 | | | 56.15 | |
| | (0.21 | ) | | | 19.44 | | 18.31 | | | | 3,622.1 | | 1.01 | | | 0.85 | | | 54.96 | |
| | - | | | | 16.63 | | 5.86 | | | | 3,354.7 | | 1.00 | | | 0.73 | | | 15.23 | |
| | (0.13 | ) | | | 15.71 | | (13.09 | ) | | | 2,975.0 | | 1.01 | | | 1.68 | | | 37.13 | |
| | (0.10 | ) | | | 18.24 | | (6.52 | ) | | | 2,062.0 | | 1.01 | | | 1.01 | | | 50.67 | |
| | | | | | | | | | | | | | | | | | | | |
| | | | | | | | | | | | | | | | | |
| | | | | | | | | | | | | | | | | | | | | |
| $ | (2.08 | ) | | $ | 22.77 | | 21.63 | % | | $ | 939.8 | | 1.53 | % | | 0.41 | % | | 62.21 | % |
| | (1.89 | ) | | | 20.86 | | 42.13 | | | | 781.1 | | 1.53 | | | 1.03 | | | 57.25 | |
| | (0.52 | ) | | | 16.40 | | 22.66 | | | | 515.0 | | 1.57 | | | 0.95 | | | 81.03 | |
| | - | | | | 13.84 | | 14.46 | | | | 391.3 | | 1.68 | | | 0.06 | | | 13.28 | |
| | (0.02 | ) | | | 12.10 | | 15.53 | | | | 238.6 | | 1.77 | | | 0.28 | | | 62.79 | |
| | - | | | | 10.50 | | 5.00 | | | | 74.5 | | 2.39 | | | (0.02 | ) | | 25.14 | |
| | | | | | | | | | | | | | | | | | | | |
| | | | | | | | | | | | | | | | | |
| | | | | | | | | | | | | | | | | | | | | |
| $ | (1.07 | ) | | $ | 26.71 | | 25.38 | % | | $ | 1,312.6 | | 1.25 | % | | 2.18 | % | | 42.52 | % |
| | (0.32 | ) | | | 22.38 | | 22.71 | | | | 601.2 | | 1.31 | | | 1.33 | | | 53.15 | |
| | (0.39 | ) | | | 18.54 | | 32.81 | | | | 217.5 | | 1.56 | | | 1.61 | | | 14.66 | |
| | - | | | | 14.32 | | 10.07 | | | | 23.6 | | 2.00 | | | 0.46 | | | 9.30 | |
| | - | | | | 13.01 | | 30.10 | | | | 16.3 | | 2.45 | | | 1.14 | | | 17.42 | |
| | (5) | For the period from July 1, 2003 to September 30, 2003. Artisan Funds changed its fiscal year-end from June 30 to September 30 effective September 30, 2003. |
| | (6) | Amount is between $0.005 and $(0.005) per share. |
| | (7) | For the period from commencement of operations (December 21, 2001) through June 30, 2002. |
| | (8) | The amount shown may not correlate with the aggregate gains and losses of portfolio securities due to the timing of subscriptions and redemptions of fund shares. |
| | (9) | For the period from commencement of operations (September 23, 2002) through June 30, 2003. |
The accompanying notes are an integral part of the financial statements.
61
SIXTY-ONE
ARTISAN FUNDS, INC.
Financial Highlights – For a share outstanding throughout each period (Continued)
| | | | | | | | | | | | | | | | | | | | | | | | |
Year or
Period
Ended | | | Net Asset
Value
Beginning
of Period | | Net Investment
Income
(Loss)(1) | | | Net Realized
and Unrealized
Gain (Loss) on
Investments | | | Total Income
(Loss) from
Investment
Operations | | | Dividends
from Net
Investment
Income | | | Distributions
from Net
Realized Gains | |
| | | | | | | | | | | | | | | | | | | | | | | | |
| ARTISAN MID CAP FUND | | | | | | | | | | | | | | | | | |
| Investor Shares | | | | | | | | | | | | | | | | | | | | | | | | |
| 9/30/2006 | | | $ | 30.84 | | $ | (0.17 | ) | | $ | 2.43 | | | $ | 2.26 | | | $ | - | | | $ | (1.33 | ) |
| 9/30/2005 | | | | 26.13 | | | (0.18 | ) | | | 4.89 | | | | 4.71 | | | | - | | | | - | |
| 9/30/2004 | | | | 23.11 | | | (0.20 | ) | | | 3.22 | | | | 3.02 | | | | - | | | | - | |
| 9/30/2003 | (5) | | | 21.81 | | | (0.05 | ) | | | 1.35 | | | | 1.30 | | | | - | | | | - | |
| 6/30/2003 | | | | 22.13 | | | (0.11 | ) | | | (0.21 | )(6) | | | (0.32 | ) | | | - | | | | - | |
| 6/30/2002 | | | | 26.43 | | | (0.19 | ) | | | (4.11 | ) | | | (4.30 | ) | | | - | | | | - | |
| Institutional Shares | | | | | | | | | | | | | | | | | | | | | | | | |
| 9/30/2006 | | | $ | 31.21 | | $ | (0.10 | ) | | $ | 2.46 | | | $ | 2.36 | | | $ | - | | | $ | (1.33 | ) |
| 9/30/2005 | | | | 26.38 | | | (0.12 | ) | | | 4.95 | | | | 4.83 | | | | - | | | | - | |
| 9/30/2004 | | | | 23.28 | | | (0.14 | ) | | | 3.24 | | | | 3.10 | | | | - | | | | - | |
| 9/30/2003 | (5) | | | 21.96 | | | (0.03 | ) | | | 1.35 | | | | 1.32 | | | | - | | | | - | |
| 6/30/2003 | | | | 22.24 | | | (0.07 | ) | | | (0.21 | )(6) | | | (0.28 | ) | | | - | | | | - | |
| 6/30/2002 | | | | 26.48 | | | (0.13 | ) | | | (4.11 | ) | | | (4.24 | ) | | | - | | | | - | |
| | | | | | | | | | | | | | | | | | | | | | | | |
| ARTISAN MID CAP VALUE FUND | | | | | | | | | | | | | | | | | |
| Investor Shares | | | | | | | | | | | | | | | | | | | | | | | | |
| 9/30/2006 | | | $ | 19.60 | | $ | 0.06 | | | $ | 1.04 | | | $ | 1.10 | | | $ | (0.01 | ) | | $ | (0.82 | ) |
| 9/30/2005 | | | | 15.55 | | | (0.01 | ) | | | 4.36 | | | | 4.35 | | | | - | (7) | | | (0.30 | ) |
| 9/30/2004 | | | | 12.22 | | | 0.10 | | | | 3.47 | | | | 3.57 | | | | - | | | | (0.24 | ) |
| 9/30/2003 | (5) | | | 11.64 | | | (0.01 | ) | | | 0.59 | | | | 0.58 | | | | - | | | | - | |
| 6/30/2003 | | | | 10.82 | | | (0.03 | ) | | | 0.85 | | | | 0.82 | | | | - | | | | - | |
| 6/30/2002 | | | | 11.18 | | | (0.09 | ) | | | (0.19 | ) | | | (0.28 | ) | | | - | | | | (0.08 | ) |
| | | | | | | | | | | | | | | | | | | | | | | | |
| ARTISAN OPPORTUNISTIC VALUE FUND | | | | | | | | | | | | | | | | | |
| Investor Shares | | | | | | | | | | | | | | | | | |
| 9/30/2006 | (8) | | $ | 10.00 | | $ | 0.03 | | | $ | 0.38 | | | $ | 0.41 | | | $ | - | | | $ | - | |
| (1) | Computed based on average shares outstanding. |
| (2) | Periods less than twelve months (where applicable) are not annualized. |
| (3) | Periods less than twelve months (where applicable) are annualized. |
| (4) | The ratios of expenses to average net assets and net investment income (loss) to average net assets exclude expenses waived or paid by the Adviser or the Board of Directors. Absent expenses waived or paid by the Adviser or the Board of Directors, the ratios of expenses to average net assets and net investment income (loss) to average net assets would have been as follows: |
| | | | | | | | |
| | | Year or
Period Ended | | Ratio of Expenses to
Average Net Assets | | | Ratio of Net Investment Income
(Loss) to Average Net Assets | |
Mid Cap Investor Shares | | 9/30/2003 | | 1.20 | % | | (0.81 | )% |
Mid Cap Institutional Shares | | 9/30/2003 | | 0.98 | % | | (0.59 | )% |
Mid Cap Value Investor Shares | | 9/30/2003 | | 1.63 | % | | (0.35 | )% |
| | 6/30/2002 | | 2.53 | % | | (1.40 | )% |
| | 6/30/2001 | | 5.17 | % | | (3.84 | )% |
Opportunistic Value Investor Shares | | 9/30/2006 | | 1.64 | % | | 0.39 | % |
62
SIXTY-TWO
| | | | | | | | | | | | | | | | | | | | |
Total
Distributions | | | Net Asset
Value
End
of Period | | Total
Return(2) | | | Net Assets
End of
Period
(millions) | | Ratio of
Expenses
to Average
Net Assets(3)(4) | | | Ratio of Net
Investment
Income (Loss)
to Average
Net Assets(3)(4) | | | Portfolio
Turnover
Rate(2) | |
| | | | | | | | | | | | | | | | | | | | |
| | | | | | | | | | | | | | | | | |
| | | | | | | | | | | | | | | | | | | | | |
| $ | (1.33 | ) | | $ | 31.77 | | 7.42 | % | | $ | 4,571.9 | | 1.18 | % | | (0.55 | )% | | 73.59 | % |
| | - | | | | 30.84 | | 18.06 | | | | 4,874.0 | | 1.18 | | | (0.63 | ) | | 83.00 | |
| | - | | | | 26.13 | | 13.02 | | | | 4,042.7 | | 1.19 | | | (0.77 | ) | | 101.09 | |
| | - | | | | 23.11 | | 6.01 | | | | 2,583.2 | | 1.20 | | | (0.81 | ) | | 26.52 | |
| | - | | | | 21.81 | | (1.45 | ) | | | 2,286.6 | | 1.20 | | | (0.56 | ) | | 102.85 | |
| | - | | | | 22.13 | | (16.27 | ) | | | 1,855.5 | | 1.22 | | | (0.77 | ) | | 121.14 | |
| | | | | | | | | | | | | | | | | | | | | |
| $ | (1.33 | ) | | $ | 32.24 | | 7.66 | % | | $ | 797.9 | | 0.95 | % | | (0.31 | )% | | 73.59 | % |
| | - | | | | 31.21 | | 18.35 | | | | 981.3 | | 0.95 | | | (0.40 | ) | | 83.00 | |
| | - | | | | 26.38 | | 13.27 | | | | 1,036.0 | | 0.96 | | | (0.54 | ) | | 101.09 | |
| | - | | | | 23.28 | | 6.06 | | | | 929.6 | | 0.98 | | | (0.59 | ) | | 26.52 | |
| | - | | | | 21.96 | | (1.26 | ) | | | 829.0 | | 1.00 | | | (0.36 | ) | | 102.85 | |
| | - | | | | 22.24 | | (16.04 | ) | | | 449.8 | | 1.02 | | | (0.56 | ) | | 121.14 | |
| | | | | | | | | | | | | | | | | | | | |
| | | | | | | | | | | | | | | | | |
| | | | | | | | | | | | | | | | | | | | | |
| $ | (0.83 | ) | | $ | 19.87 | | 5.87 | % | | $ | 2,643.3 | | 1.20 | % | | 0.33 | % | | 47.73 | % |
| | (0.30 | ) | | | 19.60 | | 28.42 | | | | 2,771.2 | | 1.22 | | | (0.04 | ) | | 51.60 | |
| | (0.24 | ) | | | 15.55 | | 29.60 | | | | 312.3 | | 1.39 | | | 0.73 | | | 53.79 | |
| | - | | | | 12.22 | | 4.98 | | | | 77.4 | | 1.59 | | | (0.31 | ) | | 11.90 | |
| | - | | | | 11.64 | | 7.58 | | | | 64.5 | | 1.78 | | | (0.34 | ) | | 45.55 | |
| | (0.08 | ) | | | 10.82 | | (2.37 | ) | | | 22.0 | | 1.95 | | | (0.82 | ) | | 167.70 | |
| | | | | | | | | | | | | | | | | | | | |
| | | | | | | | | | | | | | | | | |
| | | | | | | | | | | | | | | | | | | | | |
| $ | - | | | $ | 10.41 | | 4.10 | % | | $ | 75.0 | | 1.49 | % | | 0.55 | % | | 34.07 | % |
| | (5) | For the period from July 1, 2003 to September 30, 2003. Artisan Funds changed its fiscal year-end from June 30 to September 30 effective September 30, 2003. |
| | (6) | The amount shown may not correlate with the aggregate gains and losses of portfolio securities due to the timing of subscriptions and redemptions of fund shares. |
| | (7) | Amount is between $0.005 and $(0.005) per share. |
| | (8) | For the period from commencement of operations (March 27, 2006) through September 30, 2006. |
The accompanying notes are an integral part of the financial statements.
63
SIXTY-THREE
ARTISAN FUNDS, INC.
Financial Highlights – For a share outstanding throughout each period (Continued)
| | | | | | | | | | | | | | | | | | | | | | | | |
Year or
Period
Ended | | | Net Asset
Value
Beginning
of Period | | Net
Investment
(Loss)(1) | | | Net Realized
and Unrealized
Gain (Loss) on
Investments | | | Total Income
(Loss) from
Investment
Operations | | | Dividends
from Net
Investment
Income | | | Distributions
from Net
Realized Gains | |
| | | | | | | | | | | | | | | | | | | | | | | | |
| ARTISAN SMALL CAP FUND | | | | | | | | | | | | | | | | | |
| Investor Shares | | | | | | | | | | | | | | | | | | | | | | | | |
| 9/30/2006 | | | $ | 17.95 | | $ | (0.13 | ) | | $ | 0.26 | | | $ | 0.13 | | | $ | - | | | $ | (0.57 | ) |
| 9/30/2005 | | | | 15.12 | | | (0.13 | ) | | | 3.49 | | | | 3.36 | | | | - | | | | (0.53 | ) |
| 9/30/2004 | | | | 12.53 | | | (0.14 | ) | | | 2.73 | | | | 2.59 | | | | - | | | | - | |
| 9/30/2003 | (5) | | | 11.90 | | | (0.04 | ) | | | 0.67 | | | | 0.63 | | | | - | | | | - | |
| 6/30/2003 | | | | 11.99 | | | (0.10 | ) | | | 0.07 | (6) | | | (0.03 | ) | | | - | | | | (0.06 | ) |
| 6/30/2002 | | | | 13.99 | | | (0.13 | ) | | | (1.81 | ) | | | (1.94 | ) | | | - | | | | (0.06 | ) |
| | | | | | | | | | | | | | | | | | | | | | | | |
| ARTISAN SMALL CAP VALUE FUND | | | | | | | | | | | | | | | | | |
| Investor Shares | | | | | | | | | | | | | | | | | | | | | | | | |
| 9/30/2006 | | | $ | 19.51 | | $ | (0.02 | ) | | $ | 2.00 | | | $ | 1.98 | | | $ | - | | | $ | (2.32 | ) |
| 9/30/2005 | | | | 17.63 | | | (0.03 | ) | | | 3.69 | | | | 3.66 | | | | - | | | | (1.78 | ) |
| 9/30/2004 | | | | 13.67 | | | (0.03 | ) | | | 4.19 | | | | 4.16 | | | | - | | | | (0.20 | ) |
| 9/30/2003 | (5) | | | 13.15 | | | (0.01 | ) | | | 0.53 | | | | 0.52 | | | | - | | | | - | |
| 6/30/2003 | | | | 13.48 | | | (0.03 | ) | | | 0.20 | | | | 0.17 | | | | - | | | | (0.50 | ) |
| 6/30/2002 | | | | 13.05 | | | (0.01 | ) | | | 1.16 | | | | 1.15 | | | | (0.01 | ) | | | (0.71 | ) |
| (1) | Computed based on average shares outstanding. |
| (2) | Periods less than twelve months (where applicable) are not annualized. |
| (3) | Periods less than twelve months (where applicable) are annualized. |
| (4) | The ratios of expenses to average net assets and net investment income (loss) to average net assets exclude expenses waived or paid by the Adviser or the Board of Directors. Absent expenses waived or paid by the Adviser or the Board of Directors, the ratios of expenses to average net assets and net investment income (loss) to average net assets would have been as follows: |
| | | | | | | | |
| | | Year or
Period Ended | | Ratio of Expenses to
Average Net Assets | | | Ratio of Net Investment (Loss)
to Average Net Assets | |
Small Cap Investor Shares | | 9/30/2003 | | 1.46 | % | | (1.18 | )% |
Small Cap Value Investor Shares | | 9/30/2003 | | 1.20 | % | | (0.41 | )% |
64
SIXTY-FOUR
| | | | | | | | | | | | | | | | | | | | |
Total
Distributions | | | Net Asset
Value
End
of Period | | Total
Return(2) | | | Net Assets
End of
Period
(millions) | | Ratio of
Expenses
to Average
Net Assets(3)(4) | | | Ratio of Net
Investment (Loss)
to Average
Net Assets(3)(4) | | | Portfolio
Turnover
Rate(2) | |
| | | | | | | | | | | | | | | | | | | | |
| | | | | | | | | | | | | | | | | |
| | | | | | | | | | | | | | | | | | | | | |
| $ | (0.57 | ) | | $ | 17.51 | | 0.74 | % | | $ | 1,263.8 | | 1.15 | % | | (0.70 | )% | | 101.98 | % |
| | (0.53 | ) | | | 17.95 | | 22.64 | | | | 1,103.3 | | 1.18 | | | (0.80 | ) | | 78.60 | |
| | - | | | | 15.12 | | 20.67 | | | | 239.6 | | 1.27 | | | (0.95 | ) | | 119.40 | |
| | - | | | | 12.53 | | 5.29 | | | | 127.9 | | 1.44 | | | (1.16 | ) | | 30.18 | |
| | (0.06 | ) | | | 11.90 | | (0.11 | ) | | | 116.0 | | 1.39 | | | (0.98 | ) | | 127.41 | |
| | (0.06 | ) | | | 11.99 | | (13.90 | ) | | | 131.9 | | 1.31 | | | (1.00 | ) | | 139.72 | |
| | | | | | | | | | | | | | | | | | | | |
| | | | | | | | | | | | | | | | | |
| | | | | | | | | | | | | | | | | | | | | |
| $ | (2.32 | ) | | $ | 19.17 | | 11.40 | % | | $ | 2,039.5 | | 1.17 | % | | (0.09 | )% | | 58.88 | % |
| | (1.78 | ) | | | 19.51 | | 22.42 | | | | 1,720.9 | | 1.18 | | | (0.16 | ) | | 56.03 | |
| | (0.20 | ) | | | 17.63 | | 30.76 | | | | 1,192.8 | | 1.18 | | | (0.17 | ) | | 41.31 | |
| | - | | | | 13.67 | | 3.95 | | | | 775.2 | | 1.20 | | | (0.40 | ) | | 12.20 | |
| | (0.50 | ) | | | 13.15 | | 1.90 | | | | 702.5 | | 1.21 | | | (0.21 | ) | | 49.57 | |
| | (0.72 | ) | | | 13.48 | | 9.65 | | | | 623.5 | | 1.20 | | | (0.10 | ) | | 33.59 | |
| | (5) | For the period from July 1, 2003 to September 30, 2003. Artisan Funds changed its fiscal year-end from June 30 to September 30 effective September 30, 2003. |
| | (6) | The amount shown may not correlate with the aggregate gains and losses of portfolio securities due to the timing of subscriptions and redemptions of fund shares. |
The accompanying notes are an integral part of the financial statements.
65
SIXTY-FIVE
ARTISAN FUNDS, INC.
Notes to Financial Statements – September 30, 2006
Artisan Funds, Inc. (“Artisan Funds”) was incorporated on January 5, 1995, as a Wisconsin corporation and is registered under the Investment Company Act of 1940, as amended. Artisan Funds is a series comprised of nine open-end, diversified mutual funds . The following funds (each a “Fund” and collectively the “Funds”) are covered by this report:
| | |
| Fund Name | | Inception Date |
Artisan International Fund (“International Fund” or “International”) | | December 28, 1995 |
Artisan International Small Cap Fund (“International Small Cap Fund” or “International Small Cap”) | | December 21, 2001 |
Artisan International Value Fund (“International Value Fund” or “International Value”) | | September 23, 2002 |
Artisan Mid Cap Fund (“Mid Cap Fund” or “Mid Cap”) | | June 27, 1997 |
Artisan Mid Cap Value Fund (“Mid Cap Value Fund” or “Mid Cap Value”) | | March 28, 2001 |
Artisan Opportunistic Value Fund (“Opportunistic Value Fund” or “Opportunistic Value”) | | March 27, 2006 |
Artisan Small Cap Fund (“Small Cap Fund” or “Small Cap”) | | March 28, 1995 |
Artisan Small Cap Value Fund (“Small Cap Value Fund” or “Small Cap Value”) | | September 29, 1997 |
Each Fund’s investment objective is to seek long-term capital growth. Each Fund has offered shares of capital stock of the class designated Investor Shares since the commencement of its operations. International Fund and Mid Cap Fund began offering Institutional Shares on July 1, 1997 and July 1, 2000, respectively. Subsequent to the fiscal year ended September 30, 2006, International Value Fund began offering Institutional Shares on October 2, 2006. Institutional Shares are sold to institutional investors meeting certain minimum investment requirements.
Each class of shares has equal rights with respect to portfolio assets and voting privileges. Each class has exclusive voting rights with respect to any matters involving only that class. Income, expenses not specific to either class and realized and unrealized gains and losses are allocated daily to each class of shares based upon the relative net asset value of outstanding shares. Expenses attributable to a particular class of shares, such as transfer agency fees, shareholder communication expenses and registration fees, are allocated directly to that class.
Artisan Emerging Markets Fund (inception date June 26, 2006) offers only Institutional Shares. The financial statements of Artisan Emerging Markets Fund are presented in a separate report.
| (2) | Summary of significant accounting policies: |
The following is a summary of significant accounting policies of the Funds in effect during the period covered by the financial statements, which are in accordance with United States generally accepted accounting principles.
66
SIXTY-SIX
NOTES TO FINANCIAL STATEMENTS
| | (a) | Security valuation – The net asset value (“NAV”) of the shares of each class of each Fund was determined as of the close of regular session trading on the New York Stock Exchange (“NYSE”) (usually 4:00 p.m., Eastern Time, but sometimes earlier) each day the NYSE was open for regular session trading. The NAV of each class of shares was determined by dividing the value of each Fund’s securities and other assets attributed to that class, less its liabilities attributed to that class, by the number of outstanding shares of that class of that Fund. |
In determining NAV, each equity security traded on a securities exchange was valued at the closing price as of the time of valuation on the exchange or market on which the security was principally traded (the “principal exchange”). The closing price provided by each exchange may differ and may represent information such as last sales price, an official closing price, a closing auction price or other information, depending on exchange or market convention. Absent closing price information for a security from the principal exchange as of the time of valuation, the security was valued using the most recent bid quotation on the principal exchange, except that securities listed on the London Stock Exchange were valued at the mean of the most recent bid and asked quotations as of the time of valuation. Short-term investments maturing within sixty days of the valuation date were valued at amortized cost, which approximates market value.
Securities for which prices were not readily available were valued by Artisan Funds’ valuation committee (the “valuation committee”) at a fair value determined in good faith under procedures established by and under the general supervision of Artisan Funds’ Board of Directors (the “Board of Directors”). A price was considered to be not readily available if, among other things, the valuation committee believed that the price determined as described in the preceding paragraph did not reflect a fair value of the security.
International Fund, International Small Cap Fund and International Value Fund generally invest a significant portion, and perhaps as much as substantially all, of their total assets in securities principally traded in markets outside the U.S. Each of the other Funds has the ability to invest in securities principally traded outside the U.S. The foreign markets in which the Funds may invest are sometimes open on days when the NYSE is not open and the Funds do not calculate their NAVs, and sometimes are not open on days when the Funds do calculate their NAVs. Even on days on which both the foreign market and the NYSE are open, several hours may have passed between the time when trading in the foreign market closed and the time as of which the Funds calculate their NAVs. That is generally the case for markets in Europe, Asia, Australia and
67
SIXTY-SEVEN
NOTES TO FINANCIAL STATEMENTS
other far eastern markets; the regular closing time of foreign markets in North and South America is generally the same as the closing time of the NYSE and the time as of which the Funds calculate their NAVs.
The valuation committee concluded that a price determined under the Funds’ valuation procedures was not readily available if, among other things, the valuation committee believed that the value of the security might have been materially affected by events occurring after the close of the market in which the security was principally traded but before the time for determination of NAV (“subsequent event”). A subsequent event might include a company-specific development (for example, announcement of a merger that is made after the close of the foreign market), a development that might affect an entire market or region (for example, imposition of foreign exchange controls by a foreign government), a potentially global development (such as a terrorist attack that may be expected to have an impact on investor expectations worldwide) or a significant change in one or more United States securities indexes. Artisan Funds monitored for subsequent events using several tools. An indication by any of those tools of a potential material change in the value of securities results in either a meeting of the valuation committee, which considers whether a subsequent event has occurred and whether local market closing prices continue to represent fair values for potentially affected non-U.S. securities, and/or a valuation based on information provided by a third party research service. This third party research service is used to assist in determining estimates of fair values for foreign securities. That service utilized statistical data based on historical performance of securities, markets and other data in developing factors used to estimate a fair value.
Estimates of fair values utilized by the Funds as described above may differ from the value realized on the sale of those securities and the differences may be material to the NAV of the applicable Fund or to the information presented.
There are certain risks involved in investing in foreign securities. These risks include those resulting from future adverse political, social, and economic developments, fluctuations in currency exchange rates, the possible imposition of exchange controls, and other foreign laws or restrictions.
| | (b) | Income taxes – No provision has been made for federal income taxes or excise taxes since each Fund intends to (i) comply with the provisions of Subchapter M of the Internal Revenue Code applicable to regulated investment companies and (ii) distribute to its shareholders substantially all of its taxable income as well as net realized gains from the sale of investment securities. The |
68
SIXTY-EIGHT
NOTES TO FINANCIAL STATEMENTS
| | Funds may utilize earnings and profits distributed to shareholders on redemptions of Fund shares as part of the dividends paid deduction. |
| | (c) | Portfolio transactions – In determining a Fund’s NAV, security transactions and shareholder transactions are accounted for no later than one business day after trade date, in accordance with applicable law. However, for financial reporting purposes, security transactions and shareholder transactions are recorded on trade date in accordance with United States generally accepted accounting principles. Net realized gains and losses on securities are computed on specific security lot identification. |
Certain countries impose taxes on realized gains on the sale of investment securities. The Funds record the foreign tax expense, if any, on an accrual basis. The taxes are included in “Payable for withholding taxes” on the Statement of Assets and Liabilities.
| | (d) | Foreign currency translation – Values of investments, open foreign currency forward contracts, payables for capital gains taxes and cash denominated in foreign currencies were translated into U.S. dollars using a spot market rate of exchange as of the time of determination of each Fund’s NAV on the day of valuation. Payables and receivables for securities transactions, dividend and reclaim receivables and other receivables and payables denominated in a foreign currency were translated into U.S. dollars using a spot market rate of exchange as of 12:00 p.m. (Eastern Time) on the day of valuation. Purchases and sales of investments and dividend and interest income are translated into U.S. dollars using a spot market rate of exchange as of 12:00 p.m. (Eastern Time) on the date of such transactions. The portion of security gains or losses resulting from changes in foreign exchange rates is included with net realized and unrealized gain or loss from investments, as appropriate, for both financial reporting and tax purposes. |
The Funds may enter into foreign currency forward contracts to hedge the foreign currency exposure on open payables and receivables. The foreign currency forward contracts are recorded at market value and any related realized and unrealized gains and losses are reported as foreign currency related transactions for financial reporting purposes. For tax purposes, these foreign exchange gains and losses are treated as ordinary income or loss. The Funds could be exposed to loss if the counterparties fail to perform under these contracts.
Other foreign currency related transaction gains and losses may result from the difference between the amounts of dividends and foreign withholding taxes recorded on the Funds’ books and the U.S. dollar equivalent of the amounts actually received or paid. The net increase (decrease) in unrealized
69
SIXTY-NINE
NOTES TO FINANCIAL STATEMENTS
appreciation or depreciation on foreign currency related transactions arises from changes in the values of assets and liabilities, other than investments in securities, resulting from changes in foreign exchange rates.
| | (e) | Repurchase agreements – Each Fund may enter into repurchase agreements with institutions that Artisan Partners Limited Partnership (the “Adviser”) has determined are creditworthy pursuant to criteria adopted by the Board |
| | of Directors. Repurchase agreements are recorded at cost plus accrued interest and are collateralized in an amount greater than or equal to the repurchase price plus accrued interest. Collateral is held by the Funds’ custodian and in the event of default on the obligation of the counterparty to repurchase, the Funds have the right to liquidate the collateral and apply the proceeds in satisfaction of the obligation. If the proceeds from any sale of such collateral were less than the repurchase price, the Fund would suffer a loss. |
| | (f) | Securities lending – Each Fund may enter into securities lending transactions. During the year ended September 30, 2006, International Fund, International Small Cap Fund and International Value Fund earned $6,715,340, $37,574 and $130,516, respectively, from securities lending transactions. When securities are on loan, the Fund does not receive dividends on the securities loaned, but receives compensation from the borrower in lieu of such dividends. The loans are secured by collateral in the form of acceptable securities at least equal to, at all times, the fair value of the securities loaned. Gain or loss in the fair value of the securities loaned that may occur during the term of the loan will be for the account of the applicable Fund. As of September 30, 2006, there were no securities on loan. Each Fund’s risks in entering into securities lending arrangements are that the borrower may not provide additional collateral when required or return the securities when due or, if the borrower defaults, the Fund may experience delays in selling collateral or the collateral may not be sufficient to cover the value of securities lent. |
| | (g) | Transfer agent fees – The Funds may authorize certain financial services companies, broker-dealers, banks or other authorized agents, and in some cases, other organizations designated by an authorized agent (with their designees, collectively “authorized agents”) to accept purchase, exchange and redemption orders for Investor Shares on the Funds’ behalf. Many authorized agents charge a fee for accounting and shareholder services that the authorized agent provides to Fund shareholders on the Fund’s behalf. These services may include record keeping, transaction processing for shareholders’ accounts and other services. The fee may be based on the number of accounts to which the authorized agent provides such services, or may be a percentage, |
70
SEVENTY
NOTES TO FINANCIAL STATEMENTS
| | currently up to 0.40% annually, of the average value of Fund shares held in such accounts. Each Fund pays a portion of such fees, which are intended to compensate the authorized agent for its provision of services of the type that would be provided by the Funds’ transfer agent or other service providers if the shares were registered on the books of the Funds’ transfer agent. The balance of the fees incurred are paid by the Adviser. The Funds’ expenses incurred for services provided by authorized agents are included in “Transfer agent fees” in the Statements of Operations. The table below shows the fees and expenses to the Funds’ transfer agent and the fees to authorized agents incurred by each class of each Fund during the year ended September 30, 2006: |
| | | | | | | | | |
| | | Year ended 9/30/06 |
Fund | | Fees and Expenses to
Transfer Agent | | Fees to
Authorized Agents | | Total |
| International—Investor Shares | | $ | 634,969 | | $ | 16,214,634 | | $ | 16,849,603 |
| International—Institutional Shares | | | 25,859 | | | - | | | 25,859 |
| International Small Cap—Investor Shares | | | 105,788 | | | 1,393,015 | | | 1,498,803 |
| International Value—Investor Shares | | | 120,653 | | | 1,391,235 | | | 1,511,888 |
| Mid Cap—Investor Shares | | | 291,994 | | | 10,327,151 | | | 10,619,145 |
| Mid Cap—Institutional Shares | | | 22,205 | | | - | | | 22,205 |
| Mid Cap Value—Investor Shares | | | 333,674 | | | 5,571,617 | | | 5,905,291 |
| Opportunistic Value—Investor Shares (1) | | | 35,927 | | | 41,371 | | | 77,298 |
| Small Cap—Investor Shares | | | 169,555 | | | 1,587,687 | | | 1,757,242 |
| Small Cap Value—Investor Shares | | | 109,430 | | | 3,394,181 | | | 3,503,611 |
| | (1) | For the period from commencement of operations (March 27, 2006) through September 30, 2006. |
| | (h) | Commission recapture – Each of the Funds may direct portfolio trades to various brokers that have agreed to rebate a portion of the commissions generated. Such cash rebates are made directly to the applicable Fund and are included in net realized gain or loss on investments in the Statements of Operations as follows: |
| | | |
International | | $ | 3,590,663 |
International Small Cap | | | 340,547 |
International Value | | | 224,424 |
Mid Cap | | | 675,488 |
Mid Cap Value | | | 246,394 |
Opportunistic Value | | | - |
Small Cap | | | 314,437 |
Small Cap Value | | | 250,970 |
| | (i) | Use of estimates – The preparation of financial statements in conformity with United States generally accepted accounting principles requires management |
71
SEVENTY-ONE
NOTES TO FINANCIAL STATEMENTS
| | to make estimates and assumptions that affect the reported amounts and disclosures in the financial statements. Actual results could differ from those estimates. |
| | (j) | Indemnifications – In the normal course of business, the Funds enter into contracts in which the Funds agree to indemnify the other party or parties against various potential costs or liabilities. The Funds’ maximum exposure under these arrangements is unknown. No claim has been made for indemnification pursuant to any such agreement of the Funds. |
| | (k) | Other – Dividend income less foreign taxes withheld, if any, is generally recorded on the ex-dividend date. In some cases, the information is not available to the Fund on the ex-dividend date. In such cases, which may include private placements and foreign securities, dividends are recorded as soon after the ex-dividend date as the information becomes available to the Funds. Non-cash dividends included in dividend income, if any, are generally recorded at the fair market value of securities received. Interest income is reported on the accrual basis. Distributions to shareholders are recorded on the ex-dividend date. Expenses attributable to Artisan Funds are generally allocated to each Fund based on net assets. However, other expense allocation methodologies may be used, depending on the nature of the expense item. Expenses attributable to a particular Fund are allocated directly to that Fund. |
The character of income and net realized gains and losses may differ for financial statement and tax purposes and may result in reclassification of permanent differences among certain capital accounts to more appropriately conform financial accounting to tax characterizations of dividend distributions.
International Fund, International Small Cap Fund and International Value Fund generally impose a 2% redemption fee on shares held 90 days or less. Those redemption fees are recorded as a reduction in the cost of shares redeemed and have the primary effect of increasing paid-in capital. Each Fund reserves the right to waive or reduce the 2% redemption fee on shares held 90 days or less at its discretion when the Fund believes such waiver is in the best interests of the Fund, including but not limited to when it determines that imposition of the redemption fee is not necessary to protect the Fund from the effects of short-term trading. The Funds currently waive the redemption fee on redemptions of shares held by certain retirement or profit-sharing plans and shares purchased through certain authorized agents.
| (3) | Transactions with affiliates: |
The Adviser, with which the officers and a director of Artisan Funds are affiliated, provides investment advisory and administrative services to the Funds. In exchange
72
SEVENTY-TWO
NOTES TO FINANCIAL STATEMENTS
for those services, each Fund (with the exception of International Fund after November 30, 2005, International Small Cap Fund and Opportunistic Value Fund) pays a monthly management fee to the Adviser as follows:
| | | |
Average Daily Net Assets | | Annual Rate | |
Less than $500 million | | 1.000 | % |
$500 million to $750 million | | 0.975 | |
$750 million to $1 billion | | 0.950 | |
Greater than $1 billion | | 0.925 | |
Effective December 1, 2005, International Fund pays a monthly management fee to the Adviser as follows:
| | | |
Average Daily Net Assets | | Annual Rate | |
Less than $500 million | | 1.000 | % |
$500 million to $750 million | | 0.975 | |
$750 million to $1 billion | | 0.950 | |
$1 billion to $12 billion | | 0.925 | |
Greater than $12 billion | | 0.900 | |
International Small Cap Fund pays a monthly management fee to the Adviser at an annual rate of 1.250% of average daily net assets.
Opportunistic Value Fund pays a monthly management fee to the Adviser as follows:
| | | |
Average Daily Net Assets | | Annual Rate | |
Less than $1 billion | | 0.900 | % |
$1 billion to $4 billion | | 0.875 | |
$4 billion to $8 billion | | 0.850 | |
$8 billion to $12 billion | | 0.825 | |
Greater than $12 billion | | 0.800 | |
The Adviser has voluntarily undertaken to reimburse Opportunistic Value Fund for any ordinary operating expenses in excess of 1.50% of average daily net assets, annually.
The officers and director of Artisan Funds who are affiliated with the Adviser receive no compensation from the Funds.
Each director who is not an interested person of Artisan Funds or the Adviser receives an annual retainer of $140,000, payable quarterly, as well as reimbursement of expenses related to his duties as a director of Artisan Funds. In addition, the non-interested chair of the Board of Directors receives an additional annual retainer of $60,000, payable quarterly, and each chair of a board committee
73
SEVENTY-THREE
NOTES TO FINANCIAL STATEMENTS
who is a non-interested director receives an additional annual retainer of $30,000, payable quarterly. Those fees were generally allocated to each of the Artisan Funds based on net assets, subject to a minimum allocation of $1,500 to each Fund per quarter. Directors fees for Opportunistic Value Fund have been waived through September 30, 2006.
The Board of Directors has adopted a deferred compensation plan for independent directors that enables directors to elect to defer receipt of all or a portion of the annual compensation they are entitled to receive from the Funds. For purposes of determining the amount owed to the directors under the plan, deferred amounts are invested in shares of the Artisan Funds as selected by the individual directors. Each Fund purchases shares of the funds selected for deferral by the director in amounts equal to his investment, resulting in a Fund asset equal to the deferred compensation liability. Such assets are included as a component of “Other assets” on the Statement of Assets and Liabilities. Deferral of directors’ fees under the plan will not affect the net assets of the Funds, and will not materially affect the Funds’ assets, liabilities or net investment income per share. Amounts will be deferred until distributed in accordance with the plan.
Shares of Artisan Funds are offered for sale by Artisan Distributors LLC (“Distributors”). Distributors is wholly owned by the Adviser. All distribution expenses relating to the Funds are paid by the Adviser.
| (4) | Line of credit arrangement: |
Artisan Funds is party to a line of credit agreement with State Street Bank and Trust Company, under which each Fund may borrow up to the lesser of (a) $75 million or (b) the lesser of (i) 10% of its total assets (after giving effect to the loan) or (ii) the maximum amount the Fund may borrow under the Investment Company Act of 1940, the limitations included in the Fund’s prospectus, or any limit or restriction under any law or regulation to which the Fund is subject or any agreement to which the Fund or Artisan Funds is a party; provided that the aggregate borrowings by all Funds may not exceed $100 million. Artisan Funds pays a commitment fee at the annual rate of 0.10% on the unused portion of the line of credit. Interest is charged on any borrowings at the current Federal Funds rate plus 0.50%. The use of the line of credit is generally restricted to temporary borrowing for extraordinary or emergency purposes. During the year ended September 30, 2006, there were no borrowings under the line of credit for International Fund, International Value Fund, Mid Cap Fund, Opportunistic Value Fund, Small Cap Fund and Small Cap Value Fund. During the year ended September 30, 2006, International Small Cap Fund and Mid Cap Value Fund paid interest of $1,602 and $1,778 on maximum borrowings of $6,454,459 and $11,014,336, respectively.
74
SEVENTY-FOUR
NOTES TO FINANCIAL STATEMENTS
| (5) | Investment transactions: |
The cost of securities purchased and the proceeds from the sale of securities (excluding short-term securities) for the year ended September 30, 2006 were as follows:
| | | | | | |
| Fund | | Security Purchases | | Security Sales |
International | | $ | 7,450,262,618 | | $ | 7,333,966,313 |
International Small Cap | | | 544,763,575 | | | 554,918,375 |
International Value | | | 814,032,026 | | | 340,927,112 |
Mid Cap | | | 4,156,273,918 | | | 5,073,814,119 |
Mid Cap Value | | | 1,263,072,872 | | | 1,413,950,431 |
Opportunistic Value(1) | | | 85,594,626 | | | 15,563,170 |
Small Cap | | | 1,387,604,341 | | | 1,233,475,744 |
Small Cap Value | | | 1,104,797,010 | | | 1,037,476,468 |
| | (1) | For the period from commencement of operations (March 27, 2006) through September 30, 2006. |
| (6) | Transactions in securities of affiliates: |
The table below shows information about securities of the Funds’ “affiliates” (as defined below) that were held by the Funds, purchased or sold by the Funds, or from which dividends were received by the Funds during the year ended September 30, 2006. The Funds identify a company as an affiliate for the purpose of this report if one or more of the Funds owned, in the aggregate, voting securities that it believed represented 5% or more of that company’s outstanding voting securities (as defined by the Investment Company Act of 1940) during the year ended September 30, 2006.
| | | | | | | | | | | | | | | | | | | | | |
Fund | | Security | | As of 9/30/05 | | | | Sales
Cost | | Net
Realized
Gain (Loss) | | Dividend
Income(1) | | As of 9/30/06 |
| | | Share
Balance | | Purchase
Cost | | | | | Share
Balance | | Value |
| International | | Acergy SA(2)(3)(4) | | 7,851,500 | | $ | 20,763,931 | | $ | 20,410,871 | | $ | 8,232,141 | | $ | - | | 8,128,500 | | $ | 138,866,753 |
| | | Credit Saison Co., Ltd. | | 8,952,300 | | | 35,605,052 | | | 17,056,388 | | | 5,805,733 | | | 1,800,017 | | 9,284,400 | | | 391,418,514 |
| | | TAISEI CORPORATION(3) | | - | | | 233,887,164 | | | - | | | - | | | 1,984,615 | | 54,263,300 | | | 194,773,665 |
| | | Total(6) | | | | | 290,256,147 | | | 37,467,259 | | | 14,037,874 | | | 3,784,632 | | | | | 586,192,179 |
| International Small Cap | | Acergy SA(2)(3)(4) | | 872,900 | | | - | | | 500,003 | | | 435,812 | | | - | | 809,900 | | | 13,836,278 |
| | | FINETEC Corporation(2) | | 971,391 | | | - | | | 1,728,127 | | | 3,365,118 | | | 120,046 | | 646,658 | | | 9,840,819 |
| | | Total(6) | | | | | - | | | 2,228,130 | | | 3,800,930 | | | 120,046 | | | | | - |
| International Value | | Pfeiffer Vacuum Technology AG | | 467,396 | | | 15,475,662 | | | 548,076 | | | 63,296 | | | 841,093 | | 714,441 | | | 46,610,994 |
| | | SurfControl PLC(3)(4) | | - | | | 13,689,693 | | | - | | | - | | | - | | 1,603,124 | | | 14,047,536 |
| | | Total(6) | | | | | 29,165,355 | | | 548,076 | | | 63,296 | | | 841,093 | | | | | 60,658,530 |
| Mid Cap | | Intermec, Inc.(3)(4) | | - | | | 50,377,602 | | | 1,231,075 | | | 35,602 | | | - | | 3,374,500 | | | 88,951,820 |
75
SEVENTY-FIVE
NOTES TO FINANCIAL STATEMENTS
| | | | | | | | | | | | | | | | | | | | | | |
Fund | | Security | | As of 9/30/05 | | | | Sales
Cost | | Net
Realized
Gain (Loss) | | | Dividend
Income(1) | | As of 9/30/06 |
| | | Share
Balance | | Purchase
Cost | | | | | Share
Balance | | Value |
| | | Marvel Entertainment, Inc.(3)(4) | | 1,769,000 | | $ | 9,099,830 | | $ | 19,346,535 | | $ | 2,609,065 | | | $ | - | | 1,361,100 | | $ | 32,856,954 |
| | | Total(6) | | | | | 59,477,432 | | | 20,577,610 | | | 2,644,667 | | | | - | | | | | 121,808,774 |
| Mid Cap Value | | Annaly Capital Management, Inc.(2)(3) | | 1,220,800 | | | 46,492,770 | | | 6,534,812 | | | (245,291 | ) | | | 2,320,077 | | 4,630,100 | | | 60,839,514 |
| | | Furniture Brands International, Inc. | | 3,386,900 | | | - | | | 17,069,121 | | | (3,885,708 | ) | | | 1,814,830 | | 2,696,700 | | | 51,345,168 |
| | | Marvel Entertainment, Inc.(3)(4) | | 2,176,600 | | | 19,048,789 | | | 17,669,155 | | | 2,643,861 | | | | - | | 2,440,500 | | | 58,913,670 |
| | | Rent-A-Center, Inc.(2)(3)(4) | | 2,776,400 | | | 7,252,810 | | | 52,100,294 | | | 4,303,314 | | | | - | | 1,061,500 | | | 31,091,335 |
| | | Zale Corporation(4) | | 1,888,800 | | | 23,734,599 | | | 9,586,746 | | | (2,504,993 | ) | | | - | | 2,543,200 | | | 70,548,368 |
| | | Total(6) | | | | | 96,528,968 | | | 102,960,128 | | | 311,183 | | | | 4,134,907 | | | | | 180,807,206 |
| Opportunistic Value (5) | | Annaly Capital Management, Inc.(2)(3) | | - | | | 1,599,451 | | | 51,548 | | | (6,644 | ) | | | 28,126 | | 120,300 | | | 1,580,742 |
| | | Fidelity National Title Group, Inc., Class A(2)(3) | | - | | | 2,042,347 | | | 49,011 | | | (5,651 | ) | | | 41,673 | | 98,900 | | | 2,072,944 |
| | | Rent-A-Center, Inc.(2)(3)(4) | | - | | | 1,381,630 | | | 603,575 | | | 2,533 | | | | - | | 32,200 | | | 943,138 |
| | | Total(6) | | | | | 5,023,428 | | | 704,134 | | | (9,762 | ) | | | 69,799 | | | | | - |
| Small Cap | | Global Power Equipment Group Inc.(2)(4) | | 1,224,700 | | | 250,468 | | | 10,822,714 | | | (5,324,247 | ) | | | - | | - | | | - |
| | | Stratasys Inc.(2)(3)(4) | | 415,500 | | | 4,190,749 | | | 9,055,493 | | | 404,544 | | | | - | | 267,400 | | | 7,062,034 |
| | | Total(6) | | | | | 4,441,217 | | | 19,878,207 | | | (4,919,703 | ) | | | - | | | | | - |
| Small Cap Value | | Altiris, Inc.(2)(3)(4) | | 1,277,600 | | | 8,649,606 | | | 16,779,125 | | | 4,487,028 | | | | - | | 819,200 | | | 17,276,928 |
| | | America Service Group Inc.(3)(4) | | 403,000 | | | 2,773,702 | | | - | | | - | | | | - | | 603,600 | | | 7,852,836 |
| | | AMN Healthcare Services, Inc.(2)(4) | | 1,579,100 | | | 8,656,631 | | | 12,812,431 | | | 4,356,625 | | | | - | | 1,322,600 | | | 31,411,750 |
| | | Annaly Capital Management, Inc.(2)(3) | | - | | | 22,138,471 | | | - | | | - | | | | 762,875 | | 1,858,400 | | | 24,419,376 |
| | | Cross Country Healthcare, Inc.(3)(4) | | 754,300 | | | 23,002,385 | | | - | | | - | | | | - | | 2,097,500 | | | 35,657,500 |
| | | Diamond Management & Technology Consultants, Inc.(3)(4) | | 1,548,000 | | | 4,427,144 | | | 513,331 | | | (21,014 | ) | | | - | | 2,079,700 | | | 23,167,858 |
| | | Eagle Hospitality Properties Trust, Inc.(2)(3) | | 689,200 | | | 1,765,524 | | | 1,033,070 | | | (116,066 | ) | | | 591,780 | | 809,200 | | | 7,525,560 |
| | | Furniture Brands International, Inc. | | 1,942,800 | | | 1,891,630 | | | 379,784 | | | (38,880 | ) | | | 1,257,612 | | 2,012,900 | | | 38,325,616 |
| | | Global Power Equipment Group Inc.(2)(4) | | 1,332,000 | | | 110,186 | | | 10,234,323 | | | 7,105,336 | | | | - | | - | | | - |
| | | Hudson Highland Group, Inc.(2)(3)(4) | | - | | | 15,906,449 | | | - | | | - | | | | - | | 1,087,300 | | | 10,655,540 |
| | | Kellwood Company(2) | | 1,786,450 | | | 3,770,553 | | | 29,975,750 | | | (3,685,391 | ) | | | 935,392 | | 1,072,150 | | | 30,910,084 |
| | | Manhattan Associates, Inc.(3)(4) | | 764,300 | | | 15,427,839 | | | - | | | - | | | | - | | 1,539,600 | | | 37,165,944 |
| | | Marvel Entertainment, Inc.(3)(4) | | - | | | 8,336,981 | | | 14,302 | | | 9,175 | | | | - | | 576,200 | | | 13,909,468 |
| | | Medical Staffing Network Holdings, Inc.(3)(4) | | 1,510,300 | | | 202,825 | | | - | | | - | | | | - | | 1,548,900 | | | 9,634,158 |
| | | Movie Gallery, Inc.(2)(4) | | 2,081,900 | | | 207,400 | | | 40,374,460 | | | (32,845,195 | ) | | | - | | - | | | - |
| | | National Dentex Corporation(4) | | 359,400 | | | 1,242,079 | | | - | | | - | | | | - | | 413,500 | | | 8,125,275 |
| | | PICO Holdings, Inc.(2)(4) | | 688,000 | | | 699,183 | | | 1,919,143 | | | 1,225,924 | | | | - | | 614,200 | | | 19,992,210 |
| | | Rent-A-Center, Inc.(2)(3)(4) | | 841,700 | | | 10,721,213 | | | 11,622,671 | | | 4,290,183 | | | | - | | 815,500 | | | 23,885,995 |
| | | Sanderson Farms, Inc.(3) | | - | | | 32,309,532 | | | 3,856,965 | | | 631,097 | | | | 339,840 | | 1,197,500 | | | 38,751,100 |
| | | Stewart Information Services Corporation | | 1,222,900 | | | 12,166,467 | | | - | | | - | | | | 941,475 | | 1,501,100 | | | 52,193,247 |
76
SEVENTY-SIX
NOTES TO FINANCIAL STATEMENTS
| | | | | | | | | | | | | | | | | | | | | | |
Fund | | Security | | As of 9/30/05 | | | | Sales
Cost | | Net
Realized
Gain (Loss) | | | Dividend
Income(1) | | As of 9/30/06 |
| | | Share
Balance | | Purchase
Cost | | | | | Share
Balance | | Value |
| | | Superior Industries International, Inc.(2) | | 1,463,900 | | $ | 1,294,904 | | $ | 23,051,715 | | $ | (11,691,463 | ) | | $ | 959,520 | | 876,300 | | $ | 14,713,077 |
| | | Zale Corporation(4) | | 1,573,000 | | | 11,070,354 | | | - | | | - | | | | - | | 2,005,500 | | | 55,632,570 |
| | | Total(6) | | | | | 186,771,058 | | | 152,567,070 | | | (26,292,641 | ) | | | 5,788,494 | | | | | 320,415,572 |
| | (1) | Net of foreign taxes withheld, if any. |
| | (2) | Issuer was no longer an affiliate as of September 30, 2006. |
| | (3) | Issuer was not an affiliate as of September 30, 2005. |
| | (4) | Non-income producing security. |
| | (5) | For the period from commencement of operations (March 27, 2006) through September 30, 2006. |
| | (6) | Total value as of September 30, 2006 is presented for only those issuers that were affiliates as of September 30, 2006. |
| (7) | Information for Federal income tax purposes: |
| | | | | | | | | | | | | |
Fund | | Cost of
Investments | | Gross
Unrealized
Appreciation | | Gross
Unrealized
Depreciation | | | Net
Unrealized
Appreciation
on Investments |
| International | | $ | 10,795,740,989 | | $ | 3,309,401,805 | | $ | (213,093,174 | ) | | $ | 3,096,308,631 |
| International Small Cap | | | 727,031,196 | | | 238,919,485 | | | (29,892,475 | ) | | | 209,027,010 |
| International Value | | | 1,144,740,031 | | | 175,584,959 | | | (15,095,666 | ) | | | 160,489,293 |
| Mid Cap | | | 4,355,351,017 | | | 1,019,396,966 | | | (68,295,376 | ) | | | 951,101,590 |
| Mid Cap Value | | | 2,464,123,255 | | | 262,206,561 | | | (61,291,682 | ) | | | 200,914,879 |
| Opportunistic Value | | | 72,583,698 | | | 3,367,802 | | | (1,118,273 | ) | | | 2,249,529 |
| Small Cap | | | 1,202,986,941 | | | 129,611,105 | | | (60,161,300 | ) | | | 69,449,805 |
| Small Cap Value | | | 1,760,621,289 | | | 338,218,219 | | | (61,615,487 | ) | | | 276,602,732 |
The difference between cost of investments for financial reporting and cost of investments for Federal income tax purposes is due primarily to timing differences in recognizing certain gains and losses on security transactions (e.g., wash sale loss deferrals and passive foreign investment company transactions).
The tax basis of dividends and long-term capital gain distributions paid during the year ended September 30, 2006 and the year ended September 30, 2005 were as follows:
| | | | | | | | | | | | |
| | | Year Ended 9/30/06 | | Year Ended 9/30/05 |
Fund | | Ordinary
Income
Dividends | | Long-Term
Capital Gain
Distributions | | Ordinary
Income
Dividends | | Long-Term
Capital Gain
Distributions |
| International | | $ | 200,705,174 | | $ | - | | $ | 69,335,942 | | $ | - |
| International Small Cap | | | 33,534,988 | | | 45,167,586 | | | 38,631,361 | | | 20,034,761 |
| International Value | | | 20,163,763 | | | 9,531,378 | | | 3,707,149 | | | 1,337,370 |
| Mid Cap | | | 30,312,731 | | | 220,370,538 | | | - | | | - |
| Mid Cap Value | | | 91,428,711 | | | 25,834,378 | | | 4,542,632 | | | 4,785,269 |
| Opportunistic Value(1) | | | - | | | - | | | | | | |
| Small Cap | | | 19,680,637 | | | 17,286,786 | | | 715,625 | | | 9,933,966 |
| Small Cap Value | | | 52,669,430 | | | 152,453,417 | | | 33,641,530 | | | 90,214,766 |
| | (1) | For the period from commencement of operations (March 27, 2006) through September 30, 2006. |
77
SEVENTY-SEVEN
NOTES TO FINANCIAL STATEMENTS
Income and capital gain distributions are determined in accordance with income tax regulations that may differ from accounting principles that are generally accepted in the United States. These differences are due to differing treatments for items such as net short-term gains, wash sale loss deferrals, foreign currency transactions, net investment losses and capital loss carryovers. Gains on redemptions-in-kind for International Fund and Mid Cap Fund of $29,012,833 and $13,451,833, respectively, included in net realized gain (loss) on investments in the Statement of Operations for the year ended September 30, 2006, are not recognized for Federal income tax purposes.
Additional tax information as of and for the year ended September 30, 2006 follows:
| | | | | | | | | | | | |
| | | As of 9/30/06 | | Year Ended 9/30/06 |
Fund | | Undistributed
Ordinary
Income | | Undistributed
Long-Term
Gain | | Capital Loss
Carryforward
Utilized | | Post-October
Losses |
| International | | $ | 212,453,758 | | $ | 1,018,713,221 | | $ | 617,923,426 | | $ | - |
| International Small Cap | | | 48,705,322 | | | 134,831,447 | | | - | | | - |
| International Value | | | 46,295,790 | | | 37,751,013 | | | - | | | - |
| Mid Cap | | | 26,118,296 | | | 536,884,861 | | | - | | | - |
| Mid Cap Value | | | 72,061,396 | | | 71,446,073 | | | - | | | - |
| Opportunistic Value | | | 879,512 | | | - | | | - | | | 2,194 |
| Small Cap | | | 16,656,782 | | | 5,964,573 | | | - | | | - |
| Small Cap Value | | | 85,448,393 | | | 156,651,531 | | | - | | | - |
As of September 30, 2006, none of the Funds had capital loss carryforwards.
78
SEVENTY-EIGHT
[THIS PAGE INTENTIONALLY LEFT BLANK]
79
SEVENTY-NINE
NOTES TO FINANCIAL STATEMENTS
| (8) | Fund share activities: |
Capital share transactions for the Funds were as follows:
| | | | | | | | | | | | |
Year ended September 30, 2006 | | INTERNATIONAL | | | INTERNATIONAL
SMALL CAP | |
| | Investor
Shares | | | Institutional
Shares | | | Investor
Shares | |
Proceeds from shares issued | | $ | 2,314,789,322 | | | $ | 316,068,084 | | | $ | 183,703,921 | |
Net asset value of shares issued in reinvestment of dividends and distributions | | | 121,587,382 | | | | 67,354,311 | | | | 76,365,043 | |
Cost of shares redeemed(2) | | | (1,736,641,589 | ) | | | (917,682,779 | ) | | | (189,624,312 | ) |
| | | | | | | | | | | | |
Net increase (decrease) from fund share transactions | | $ | 699,735,115 | | | $ | (534,260,384 | ) | | $ | 70,444,652 | |
| | | | | | | | | | | | |
| | | |
Shares sold | | | 85,995,680 | | | | 12,075,907 | | | | 8,475,604 | |
Shares issued in reinvestment of dividends and distributions | | | 5,049,329 | | | | 2,785,484 | | | | 4,198,188 | |
Shares redeemed | | | (65,072,487 | ) | | | (35,034,422 | ) | | | (8,846,307 | ) |
| | | | | | | | | | | | |
Net increase (decrease) in capital shares | | | 25,972,522 | | | | (20,173,031 | ) | | | 3,827,485 | |
| | | | | | | | | | | | |
| | |
Year ended September 30, 2005 | | INTERNATIONAL | | | INTERNATIONAL
SMALL CAP | |
| | Investor
Shares | | | Institutional
Shares | | | Investor
Shares | |
Proceeds from shares issued | | $ | 1,721,409,733 | | | $ | 213,745,441 | | | $ | 162,675,457 | |
Net asset value of shares issued in reinvestment of dividends and distributions | | | 35,336,667 | | | | 27,442,945 | | | | 57,876,739 | |
Cost of shares redeemed(2) | | | (1,815,852,822 | ) | | | (778,118,588 | ) | | | (114,717,564 | ) |
| | | | | | | | | | | | |
Net increase (decrease) from fund share transactions | | $ | (59,106,422 | ) | | $ | (536,930,202 | ) | | $ | 105,834,632 | |
| | | | | | | | | | | | |
| | | |
Shares sold | | | 78,912,846 | | | | 9,680,591 | | | | 8,896,487 | |
Shares issued in reinvestment of dividends and distributions | | | 1,677,108 | | | | 1,297,539 | | | | 3,597,063 | |
Shares redeemed | | | (82,739,336 | ) | | | (34,838,126 | ) | | | (6,444,012 | ) |
| | | | | | | | | | | | |
Net increase (decrease) in capital shares | | | (2,149,382 | ) | | | (23,859,996 | ) | | | 6,049,538 | |
| | | | | | | | | | | | |
| | (1) | For the period from commencement of operations (March 27, 2006) through September 30, 2006. |
| | (2) | Net of redemption fees of: |
| | | | | | |
| | | Year Ended |
Fund | | 9/30/2006 | | 9/30/2005 |
International - Investor Shares | | $ | 863,753 | | $ | 326,088 |
International - Institutional Shares | | | 389,313 | | | 179,833 |
International Small Cap - Investor Shares | | | 29,405 | | | 19,830 |
International Value - Investor Shares | | | 222,110 | | | 145,080 |
80
EIGHTY
NOTES TO FINANCIAL STATEMENTS
| | | | | | | | | | | | | | | | | | | | | | | | | | |
INTERNATIONAL
VALUE | | | MID CAP | | | MID CAP
VALUE | | | OPPORTUNISTIC
VALUE | | | SMALL CAP | | | SMALL CAP
VALUE | |
Investor
Shares | | | Investor
Shares | | | Institutional
Shares | | | Investor
Shares | | | Investor
Shares(1) | | | Investor
Shares | | | Investor
Shares | |
| $ | 711,293,524 | | | $ | 902,753,102 | | | $ | 55,931,735 | | | $ | 1,278,114,752 | | | $ | 76,696,206 | | | $ | 469,041,774 | | | $ | 482,338,945 | |
| | 28,357,891 | | | | 205,964,332 | | | | 40,056,662 | | | | 113,719,066 | | | | - | | | | 29,151,935 | | | | 198,667,438 | |
| | (183,814,342 | ) | | | (1,552,986,575 | ) | | | (307,000,219 | ) | | | (1,551,869,514 | ) | | | (4,813,331 | ) | | | (301,497,637 | ) | | | (360,240,201 | ) |
| | | | | | | | | | | | | | | | | | | | | | | | | | | |
| $ | 555,837,073 | | | $ | (444,269,141 | ) | | $ | (211,011,822 | ) | | $ | (160,035,696 | ) | | $ | 71,882,875 | | | $ | 196,696,072 | | | $ | 320,766,182 | |
| | | | | | | | | | | | | | | | | | | | | | | | | | | |
| | | | | | |
| | 28,589,432 | | | | 28,570,035 | | | | 1,750,257 | | | | 66,702,499 | | | | 7,689,378 | | | | 25,960,358 | | | | 26,431,133 | |
| | 1,344,769 | | | | 6,671,990 | | | | 1,280,993 | | | | 6,061,606 | | | | - | | | | 1,669,642 | | | | 11,477,024 | |
| | (7,654,580 | ) | | | (49,375,193 | ) | | | (9,727,021 | ) | | | (81,083,869 | ) | | | (486,391 | ) | | | (16,910,947 | ) | | | (19,722,554 | ) |
| | | | | | | | | | | | | | | | | | | | | | | | | | | |
| | 22,279,621 | | | | (14,133,168 | ) | | | (6,695,771 | ) | | | (8,319,764 | ) | | | 7,202,987 | | | | 10,719,053 | | | | 18,185,603 | |
| | | | | | | | | | | | | | | | | | | | | | | | | | | |
| | | | | |
INTERNATIONAL
VALUE | | | MID CAP | | | MID CAP
VALUE | | | | | | SMALL CAP | | | SMALL CAP
VALUE | |
Investor
Shares | | | Investor
Shares | | | Institutional
Shares | | | Investor
Shares | | | | | | Investor
Shares | | | Investor
Shares | |
| $ | 613,671,425 | | | $ | 1,448,522,186 | | | $ | 65,819,361 | | | $ | 2,505,178,141 | | | | | | | $ | 875,101,149 | | | $ | 492,489,210 | |
| | 4,945,577 | | | | - | | | | - | | | | 8,873,823 | | | | | | | | 8,911,550 | | | | 114,845,085 | |
| | (306,684,879 | ) | | | (1,366,393,615 | ) | | | (299,155,114 | ) | | | (330,649,737 | ) | | | | | | | (118,616,878 | ) | | | (248,073,902 | ) |
| | | | | | | | | | | | | | | | | | | | | | | | | | | |
| $ | 311,932,123 | | | $ | 82,128,571 | | | $ | (233,335,753 | ) | | $ | 2,183,402,227 | | | | | | | $ | 765,395,821 | | | $ | 359,260,393 | |
| | | | | | | | | | | | | | | | | | | | | | | | | | | |
| | | | | | |
| | 29,605,335 | | | | 50,306,407 | | | | 2,231,832 | | | | 138,992,400 | | | | | | | | 52,241,425 | | | | 27,512,339 | |
| | 251,300 | | | | - | | | | - | | | | 544,456 | | | | | | | | 554,201 | | | | 6,864,620 | |
| | (14,730,829 | ) | | | (46,997,550 | ) | | | (10,061,831 | ) | | | (18,249,715 | ) | | | | | | | (7,184,384 | ) | | | (13,859,519 | ) |
| | | | | | | | | | | | | | | | | | | | | | | | | | | |
| | 15,125,806 | | | | 3,308,857 | | | | (7,829,999 | ) | | | 121,287,141 | | | | | | | | 45,611,242 | | | | 20,517,440 | |
| | | | | | | | | | | | | | | | | | | | | | | | | | | |
81
EIGHTY-ONE
NOTES TO FINANCIAL STATEMENTS
Artisan Funds and the Adviser were defendants in a lawsuit in the Circuit Court of the Third Judicial Circuit, Madison County, Illinois that sought certification of a plaintiff class consisting of all persons in the United States who held shares in International Fund for a period of more than 14 days during the five years prior to the filing of the lawsuit. The suit sought compensatory and punitive damages under state law, as well as interest, costs and attorney’s fees. The lawsuit alleged, in summary, that Artisan Funds and the Adviser exposed long-term International Fund shareholders to trading by market timers by allegedly (a) failing to properly evaluate daily whether a significant event affecting the value of International Fund’s securities had occurred after foreign markets had closed but before the calculation of the Fund’s NAV; (b) failing to implement the Fund’s portfolio valuation and share pricing policies and procedures; (c) allowing portfolio valuation and share policies and procedures that benefited market timers at the expense of long-term shareholders; and (d) failing to know and implement applicable rules and regulations concerning the calculation of NAV.
Artisan Funds and the Adviser removed the lawsuit from state court to federal district court. The federal district court ordered the case remanded to Illinois state court. Artisan Funds and the Adviser then appealed the remand order to the United States Court of Appeals for the Seventh Circuit and, on April 5, 2005, the Court of Appeals ruled in favor of Artisan Funds and the Adviser. As a result, the action was dismissed with prejudice in May 2005. The plaintiff subsequently sought and was granted review by the United States Supreme Court on the question of whether the Court of Appeals had jurisdiction to hear the appeal. On June 15, 2006, the United States Supreme Court ruled that the Court of Appeals had lacked jurisdiction to hear the appeal of Artisan Funds and the Adviser, vacated the judgment of the Court of Appeals and remanded the case to the Court of Appeals with instructions to dismiss the appeal for lack of jurisdiction. On October 16, 2006, the Court of Appeals dismissed the appeal and remanded the case to state court. Artisan Funds and the Adviser intend to continue to defend the lawsuit vigorously.
Certain legal fees incurred by Artisan Funds in defense of the lawsuit and related insurance recoveries of $197,947 have been allocated to International Fund and are included in professional fees in the Statement of Operations. Artisan Funds does not believe that the action described herein will have a material effect on the financial condition of any Fund.
| (10) | Recent Accounting Pronouncements: |
On July 13, 2006, the Financial Accounting Standards Board (FASB) released FASB Interpretation No. 48 “Accounting for Uncertainty in Income Taxes” (FIN 48). FIN 48 provides guidance for how uncertain tax positions should be recognized,
82
EIGHTY-TWO
NOTES TO FINANCIAL STATEMENTS
measured, presented and disclosed in the financial statements. FIN 48 requires the evaluation of tax positions taken or expected to be taken in the course of preparing the Fund’s tax returns to determine whether the tax positions are “more-likely-than-not” of being sustained by the applicable tax authority. Tax positions not deemed to meet the more-likely-than-not threshold would be recorded as a tax benefit or expense in the current year. Adoption of FIN 48 is required for fiscal years beginning after December 15, 2006 and is to be applied to all open tax years as of the effective date. At this time, management is evaluating the implications of FIN 48 and its impact on the financial statements has not yet been determined.
In September 2006, the Financial Accounting Standards Board (FASB) issued Statement on Financial Accounting Standards No. 157, “Fair Value Measurements” (FAS 157). This standard clarifies the definition of fair value for financial reporting, establishes a framework for measuring fair value and requires additional disclosures about the use of fair value measurements. FAS 157 is effective for financial statements issued for fiscal years beginning after November 15, 2007 and interim periods within those fiscal years. As of September 30, 2006, the Funds do not believe the adoption of FAS 157 will impact the amounts reported in the financial statements, however, additional disclosures will be required about the inputs used to develop the measurements of fair value and the effect of certain of the measurements reported in the statement of operations for a fiscal period.
83
EIGHTY-THREE
Report of Independent Registered Public Accounting Firm
The Board of Directors and Shareholders of Artisan Funds, Inc.
We have audited the accompanying statements of assets and liabilities, including the schedules of investments, of Artisan International Fund, Artisan International Small Cap Fund, Artisan International Value Fund, Artisan Mid Cap Fund, Artisan Mid Cap Value Fund, Artisan Opportunistic Value Fund, Artisan Small Cap Fund and Artisan Small Cap Value Fund (eight of the nine series constituting Artisan Funds, Inc.) (the “Funds”) as of September 30, 2006, and the related statements of operations for the year then ended (or since commencement of operations if less than one year), the statements of changes in net assets for each of the two years in the period then ended (or since commencement of operations if less than two years), and the financial highlights for each of the three years in the period then ended and for the period from July 1, 2003 to September 30, 2003 (or since commencement of operations if less than three years). These financial statements and financial highlights are the responsibility of the Funds’ management. Our responsibility is to express an opinion on these financial statements and financial highlights based on our audits. The financial highlights of the Funds for the periods ended prior to September 30, 2003, were audited by other auditors whose report dated July 31, 2003, expressed an unqualified opinion on those financial highlights.
We conducted our audits in accordance with the standards of the Public Company Accounting Oversight Board (United States). Those standards require that we plan and perform the audit to obtain reasonable assurance about whether the financial statements and financial highlights are free of material misstatement. We were not engaged to perform an audit of the Funds’ internal control over financial reporting. Our audits included consideration of internal control over financial reporting as a basis for designing audit procedures that are appropriate in the circumstances, but not for the purpose of expressing an opinion on the effectiveness of the Funds’ internal control over financial reporting. Accordingly, we express no such opinion. An audit also includes examining, on a test basis, evidence supporting the amounts and disclosures in the financial statements and financial highlights, assessing the accounting principles used and significant estimates made by management, and evaluating the overall financial statement presentation. Our procedures included confirmation of securities owned as of September 30, 2006, by correspondence with the custodian and brokers or by other appropriate auditing procedures where replies from brokers were not received. We believe that our audits provide a reasonable basis for our opinion.
In our opinion, the financial statements and financial highlights referred to above present fairly, in all material respects, the financial position of Artisan International Fund, Artisan International Small Cap Fund, Artisan International Value Fund, Artisan Mid Cap Fund, Artisan Mid Cap Value Fund, Artisan Opportunistic Value Fund, Artisan Small Cap Fund and Artisan Small Cap Value Fund of Artisan Funds, Inc. at September 30, 2006, the results of their operations for the year then ended (or since commencement of operations if less than one year), the changes in their net assets for each of the two years in the period then ended (or since commencement of operations if less than two years), and the financial highlights for each of the three years in the period then ended and for the period from July 1, 2003 to September 30, 2003 (or since commencement of operations if less than three years), in conformity with U.S. generally accepted accounting principles.

Milwaukee, Wisconsin
November 3, 2006
84
EIGHTY-FOUR
NOTES TO FINANCIAL STATEMENTS
Other Federal tax information (unaudited):
The Internal Revenue Code requires that shareholders be notified within 60 days of the Funds’ fiscal year-end of certain information regarding long-term capital gains, qualified dividend income and the dividends received deduction for corporate shareholders. This data is informational only. Every year in January, shareholders are sent a Form 1099-DIV, which provides the federal tax status of dividends and distributions received during the calendar year. Shareholders are advised to consult their own tax advisors with respect to the specific tax consequences of investment in the Funds.
Each Fund hereby designates the following amounts as (i) long-term capital gain distributions for purposes of the dividends paid deduction, and (ii) the amount of ordinary dividends paid during the fiscal year ended September 30, 2006 that are considered qualified dividend income as defined in the Jobs and Growth Tax Relief Reconciliation Act of 2003.
| | | | | | |
| Fund | | Long-Term Capital Gains | | Qualified Dividend Income | |
International | | $ | - | | 66.4 | % |
International Small Cap | | | 45,167,586 | | 41.2 | |
International Value | | | 9,531,378 | | 66.8 | |
Mid Cap | | | 220,370,538 | | 40.3 | |
Mid Cap Value | | | 25,834,378 | | 24.3 | |
Opportunistic Value | | | - | | - | |
Small Cap | | | 17,286,786 | | 11.0 | |
Small Cap Value | | | 152,453,417 | | 20.7 | |
For the year ended September 30, 2006, of the ordinary income dividends paid by Mid Cap, Mid Cap Value, Small Cap and Small Cap Value, 48%, 17%, 10% and 20% respectively, are eligible for the dividends received deduction available to certain corporate shareholders.
85
EIGHTY-FIVE
SHAREHOLDER EXPENSE EXAMPLE
As a shareholder of Artisan Funds, you incur two types of costs: (1) transaction costs, including redemption fees; and (2) ongoing costs, including management fees, and other Fund expenses. This example is intended to help you understand your ongoing costs (in dollars) of investing in a Fund and to compare these costs with the ongoing costs of investing in other mutual funds.
The example is based on an investment of $1,000 invested at the beginning of the period and held for the entire period from April 1, 2006 to September 30, 2006.
Actual Expenses
The first line under the name of each Fund in the table below provides information about actual account values and actual expenses. You may use the information in this line, together with the amount you invested, to estimate the expenses that you paid over the period. Simply divide your account value by $1,000 (for example, an $8,600 account value divided by $1,000 = 8.6), then multiply the result by the number in the first line under the name of your Fund under the heading entitled “Expenses Paid During Period” to estimate the expenses you paid on your account during this period.
Hypothetical Example for Comparison Purposes
The second line below each Fund’s name in the table below provides information about hypothetical account values and hypothetical expenses based on each Fund’s actual expense ratio for the six months ended September 30, 2006 and an assumed rate of return of 5% per year before expenses, which is not the Fund’s actual return. The hypothetical account values and expenses may not be used to estimate the actual ending account balances or expenses you paid for the period. You may use this information to compare the ongoing costs of investing in each Fund and other funds. To do so, compare the 5% hypothetical example with the 5% hypothetical examples that appear in the shareholder reports of the other funds.
Please note that the expenses shown in the table are meant to highlight your ongoing costs only and do not reflect any transactional costs, such as redemption fees. Therefore, the second line of the table is useful in comparing ongoing costs only, and will not help you determine the relative costs of owning different funds. If these transactional costs were included, your costs would have been higher.
| | | | | | |
| | | Beginning
Account Value
4/1/2006 | | Ending
Account Value
9/30/2006 | | Expenses Paid During
Period
4/1/2006-9/30/2006(1) |
Artisan International Fund - Investor Shares | | | | | | |
Actual | | $1,000.00 | | $1,026.79 | | $6.10 |
Hypothetical (5% return before expenses) | | $1,000.00 | | $1,019.05 | | $6.07 |
Artisan International Fund - Institutional Shares | | | | | | |
Actual | | $1,000.00 | | $1,027.72 | | $5.03 |
Hypothetical (5% return before expenses) | | $1,000.00 | | $1,020.10 | | $5.01 |
Artisan International Small Cap Fund - Investor Shares | | | | | | |
Actual | | $1,000.00 | | $994.76 | | $7.65 |
Hypothetical (5% return before expenses) | | $1,000.00 | | $1,017.40 | | $7.74 |
Artisan International Value Fund - Investor Shares | | | | | | |
Actual | | $1,000.00 | | $1,064.57 | | $6.42 |
Hypothetical (5% return before expenses) | | $1,000.00 | | $1,018.85 | | $6.28 |
86
EIGHTY-SIX
SHAREHOLDER EXPENSE EXAMPLE
| | | | | | |
| | | Beginning
Account Value
4/1/2006 | | Ending
Account Value
9/30/2006 | | Expenses Paid During
Period
4/1/2006-9/30/2006(1) |
Artisan Mid Cap Fund - Investor Shares | | | | | | |
Actual | | $1,000.00 | | $956.64 | | $5.79 |
Hypothetical (5% return before expenses) | | $1,000.00 | | $1,019.15 | | $5.97 |
Artisan Mid Cap Fund - Institutional Shares | | | | | | |
Actual | | $1,000.00 | | $957.53 | | $4.71 |
Hypothetical (5% return before expenses) | | $1,000.00 | | $1,020.26 | | $4.86 |
Artisan Mid Cap Value Fund - Investor Shares | | | | | | |
Actual | | $1,000.00 | | $1,004.04 | | $6.13 |
Hypothetical (5% return before expenses) | | $1,000.00 | | $1,018.95 | | $6.17 |
Artisan Opportunistic Value Fund - Investor Shares | | | | | | |
Actual | | $1,000.00 | | $1,043.09 | | $7.63 |
Hypothetical (5% return before expenses) | | $1,000.00 | | $1,017.60 | | $7.54 |
Artisan Small Cap Fund - Investor Shares | | | | | | |
Actual | | $1,000.00 | | $894.74 | | $5.51 |
Hypothetical (5% return before expenses) | | $1,000.00 | | $1,019.25 | | $5.87 |
Artisan Small Cap Value Fund - Investor Shares | | | | | | |
Actual | | $1,000.00 | | $1,013.75 | | $5.96 |
Hypothetical (5% return before expenses) | | $1,000.00 | | $1,019.15 | | $5.97 |
| (1) | Expenses are equal to the Fund’s ratio of expenses to average net assets for the six-month period ended September 30, 2006 (shown below); multiplied by the average account value over the period; multiplied by 183/365 (to reflect the one-half year period). |
| | |
| Fund | | Annualized Ratio of Expenses to Average Net Assets for the Six-Month
Period Ended September 30, 2006 |
Artisan International Fund - Investor Shares | | 1.20% |
Artisan International Fund - Institutional Shares | | 0.99 |
Artisan International Small Cap Fund - Investor Shares | | 1.53 |
Artisan International Value Fund - Investor Shares | | 1.24 |
Artisan Mid Cap Fund - Investor Shares | | 1.18 |
Artisan Mid Cap Fund - Institutional Shares | | 0.96 |
Artisan Mid Cap Value Fund - Investor Shares | | 1.22 |
Artisan Opportunistic Value Fund - Investor Shares | | 1.49(1) |
Artisan Small Cap Fund - Investor Shares | | 1.16 |
Artisan Small Cap Value Fund - Investor Shares | | 1.18 |
| (1) | The annualized ratio of expenses to average net assets excludes expenses waived or paid by the Adviser or the Board of Directors. |
87
EIGHTY-SEVEN
NOTES ON MANAGEMENT’S DISCUSSION OF FUND PERFORMANCE
The discussions of each Fund included in this report include statistical information about the portfolios of each of the Funds. Except as otherwise noted, that information is as of September 30, 2006. That information will vary with changes in a Fund’s portfolio investments. The performance information for each Fund relative to its benchmark index discussed in this Report was prepared by the Adviser using information reported by FactSet Databases (“FactSet”). For the purposes of assigning portfolio securities to a particular country, the Adviser considers an issuer to be from a particular country as designated by its securities information vendors. The Adviser currently uses MSCI as its primary source and FactSet as a secondary source for this information. As a result, Artisan Mid Cap Fund, Artisan Mid Cap Value Fund, Artisan Opportunistic Value Fund, Artisan Small Cap Fund and Artisan Small Cap Value Fund routinely hold securities of issuers organized outside the U.S., but with their primary trading markets in the U.S. In addition, those Funds may hold a limited number of non-U.S. securities that are traded in the U.S., directly or as ADRs. Also based on the designations of the securities information vendors, Artisan International Fund, Artisan International Small Cap Fund and Artisan International Value Fund routinely hold securities of issuers organized within the U.S. and/or issuers with their primary trading markets in the U.S. In the event (i) the Adviser’s securities information vendors do not assign a security to a particular country or if the published classification appears to be erroneous, or (ii) its primary vendor does not assign a security to a particular country and the secondary vendor has assigned a security to a particular country by using a methodology that is not the same as the methodology the primary vendor uses to assign a country, the Adviser assigns the security to a country using the primary vendor’s published criteria (to the extent available) or the Adviser’s own judgment. The primary information vendor’s criteria include the identity of the jurisdiction of the issuer’s incorporation, the main equity trading market for the issuer’s securities, the geographical distribution of the issuer’s operations and the location of the issuer’s headquarters. Country designations may change over time.
For the purposes of assigning portfolio securities to a particular sector and industry, Artisan Mid Cap Fund, Artisan Mid Cap Value Fund, Artisan Opportunistic Value Fund, Artisan Small Cap Fund and Artisan Small Cap Value Fund assign securities in accordance with the sector and industry classifications provided by The Frank Russell Company (to the extent available). Artisan International Fund, Artisan International Small Cap Fund and Artisan International Value Fund assign securities for these purposes in accordance with the sector and industry classifications provided by MSCI (to the extent available).
Definitions of Portfolio Statistics
Median Market Cap provides a measure of the market capitalization value of the companies in a portfolio. Market capitalization is the aggregate value of all a company’s outstanding common stock. Market capitalization is calculated by FactSet using the price as of the most recent month-end multiplied by the number of shares outstanding as shown in the financial statements of the issuer. Equal numbers of companies in the portfolio have market capitalizations higher and lower than the median. Weighted Average Market Cap is the average of the market capitalizations of the companies in the portfolio weighted by the size of each company’s position within the portfolio.
Descriptions of Indices
Each Fund’s performance is compared in this report to changes in one or more indices, including in all cases a broad-based index of changes in prices of securities in the market in which the Fund invests. All of the indices are unmanaged and their returns include reinvested dividends. Unlike the
88
EIGHTY-EIGHT
NOTES ON MANAGEMENT’S DISCUSSION OF FUND PERFORMANCE
Funds’ returns, the returns of each index do not include the payment of sales commissions or other expenses that would be incurred in the purchase or sale of the securities included in that index. An investment cannot be made directly in an index.
The indices to which the Funds are compared are:
Artisan International, Artisan International Small Cap and Artisan International Value Funds – Morgan Stanley Capital International EAFE® Index (MSCI EAFE®) is a market-weighted index of companies in developed markets, excluding the U.S. and Canada. MSCI EAFE’s average annual return since inception of the International Fund is based upon a starting date of December 31, 1995.
Artisan International Fund – Morgan Stanley Capital International EAFE® Growth Index (MSCI EAFE® Growth) is a market-weighted index of companies in developed markets, excluding the U.S. and Canada, with higher price-to-book ratios. MSCI EAFE Growth’s average annual return since inception of the International Fund is based upon a starting date of December 31, 1995.
Artisan International Small Cap Fund – Morgan Stanley Capital International EAFE® Small Cap Index (MSCI EAFE® Small Cap) is a market-weighted index of small companies in developed markets, excluding the U.S. and Canada.
Artisan International Value Fund – Morgan Stanley Capital International EAFE® Value Index (MSCI EAFE® Value) is a market-weighted index of companies in developed markets, excluding the U.S. and Canada, with lower price-to-book ratios.
Artisan Mid Cap Fund – Russell Midcap® Index is a market-weighted index of about 800 medium-sized U.S. companies. The Russell Midcap® Growth Index is a market-weighted index of those medium-sized companies included in the Russell Midcap® Index with higher price-to-book and higher forecasted growth values.
Artisan Mid Cap Value Fund – Russell Midcap® Index is a market-weighted index of about 800 medium-sized U.S. companies. The Russell Midcap® Value Index is a market-weighted index of those medium-sized companies included in the Russell Midcap® Index with lower price-to-book ratios and lower forecasted growth values.
Artisan Opportunistic Value Fund – Russell 1000® Index is a market-weighted index of about 1,000 large U.S. companies. The Russell 1000® Value Index is a market-weighted index of those large companies included in the Russell 1000® Index with lower price-to-book ratios and lower forecasted growth values.
Artisan Small Cap Fund – Russell 2000® Index is a market-weighted index of about 2,000 small U.S. companies. Russell 2000® Growth Index is a market-weighted index of those small companies included in the Russell 2000® Index with higher price-to-book ratios and higher forecasted growth values.
Artisan Small Cap Value Fund – Russell 2000® Index is a market-weighted index of about 2,000 small U.S. companies. The Russell 2000® Value Index is a market-weighted index of those small companies included in the Russell 2000® Index with lower price-to-book ratios and lower forecasted growth values.
89
EIGHTY-NINE
NOTES ON MANAGEMENT’S DISCUSSION OF FUND PERFORMANCE
Trademarks
Trademarks and copyrights relating to the indices and products of portfolio companies mentioned in this report are owned by their respective owners. Except as otherwise indicated, the trademarks, including names, logos, slogans and service marks appearing in this report are the property of the Adviser and may not be copied, reproduced, published or in any way used without written permission.
PROXY VOTING POLICIES AND PROCEDURES
You may obtain a description of Artisan Funds’ proxy voting policies and procedures, without charge, upon request by calling 800.344.1770. That information also is included in Artisan Funds’ statement of additional information, which is available on the Funds’ website at www.artisanfunds.com and the Securities and Exchange Commission’s website at www.sec.gov.
Information relating to how each Artisan Fund voted proxies relating to portfolio securities held during the twelve months ended June 30 is available on the Funds’ website at www.artisanfunds.com and on the Securities and Exchange Commission’s website at www.sec.gov.
INFORMATION ABOUT PORTFOLIO SECURITIES
Artisan Funds files a complete schedule of portfolio holdings with the Securities and Exchange Commission for the quarters ending December 31 and June 30 (the first and third quarters of the Funds’ fiscal year) on Form N-Q. The Funds’ Forms N-Q are available on the Securities and Exchange Commission’s website at www.sec.gov. You may also review and copy those documents by visiting the Securities and Exchange Commission’s Public Reference Room in Washington, D.C. Information on the operation of the Public Reference Room may be obtained by calling the Securities and Exchange Commission at 800.SEC.0330.
DIRECTORS AND OFFICERS
The Board of Directors has overall responsibility for the conduct of the affairs of Artisan Funds. Each director serves an indefinite term of unlimited duration until the next annual meeting of shareholders and until the election and qualification of his or her successor. The Board of Directors may fill any vacancy on the board provided that after such appointment at least two-thirds of the directors have been elected by the shareholders. The shareholders may remove a director by a vote of a majority of the outstanding shares of the Funds at any meeting of shareholders called for the purpose of removing such director.
The Board of Directors elects the officers of Artisan Funds. Each officer serves until the election and qualification of his or her successor, or until he or she sooner dies, resigns, or is removed or disqualified. The Board of Directors may remove any officer with or without cause at any time.
90
NINETY
DIRECTORS AND OFFICERS
The names and ages of the directors and officers as of November 15, 2006, the position each holds with the Funds, the date each was first elected to office, their principal business occupations and other directorships they have held during the last five years are shown below. Each director oversees all nine series of Artisan Funds.
| | | | | | | | |
| | | | | |
Name and Age at 11/15/06 | | Positions Held with Funds | | Date First Elected
or Appointed to Office | | Principal Occupations during Past 5 Years | | Other Directorships Held |
| Directors who are not “interested persons” |
| David A. Erne – 63 | | Director and Independent Chair of the Board of Directors | | Director since 3/27/95; Independent Chair since 2/4/05 | | Of counsel to the law firm Reinhart Boerner Van Deuren s.c., Milwaukee, WI | | Trustee, Northwestern Mutual Life Insurance Company (individual life insurance, disability insurance and annuity company) |
| Thomas R. Hefty – 59 | | Director | | 3/27/95 | | Retired; Adjunct Faculty, Department of Business and Economics, Ripon College; Of Counsel to the law firm Reinhart Boerner Van Deuren s.c., Milwaukee, WI.; until December 2002, Chairman of the Board and Chief Executive Officer of Cobalt Corporation (provider of managed care and specialty business services) | | None |
| Jeffrey A. Joerres – 46 | | Director | | 8/9/01 | | Chairman of the Board, President and Chief Executive Officer of Manpower Inc. (non-governmental employment service organization) | | Director, Johnson Controls, Inc. (manufacturer of automotive systems and building controls) |
| Patrick S. Pittard – 60 | | Director | | 8/9/01 | | Distinguished Executive in Residence (teaching position), University of Georgia. Until October 2001, Chairman of the Board, President and Chief Executive Officer of Heidrick & Struggles International, Inc. (executive search firm) | | Director, Lincoln National Corporation (insurance and investment management company); Former Chairman of the Board, The University of Georgia Foundation; Member, Board of Regents of the University System of Georgia |
| Howard B. Witt – 66 | | Director | | 3/27/95 | | Retired; Until December 2004, Chairman of the Board, President and Chief Executive Officer of Littelfuse, Inc. (manufacturer of advanced circuit protection devices) | | Director, Franklin Electric Co., Inc. (manufacturer of electric motors) |
91
NINETY-ONE
DIRECTORS AND OFFICERS
| | | | | | | | |
| | | | | |
Name and Age at 11/15/06 | | Positions Held with Funds | | Date First Elected
or Appointed to Office | | Principal Occupations during Past 5 Years | | Other Directorships Held |
| Director who is an “interested person”* |
| Andrew A. Ziegler – 49 | | Director, President and Chief Executive Officer | | Director since 1/5/95; and Chairman of the Board 1/5/95 - 12/19/03; President since 12/19/03 (Chief Executive Officer continuously since 1/5/95) | | Managing Director of Artisan Partners; Chairman and President of Artisan Distributors; until December 2003, Chairman of Artisan Funds | | None |
| Officers of Artisan Funds |
| Lawrence A. Totsky – 47 | | Chief Financial Officer and Treasurer | | 1/22/98 | | Managing Director and Chief Financial Officer of Artisan Partners; Vice President, Chief Financial Officer and Treasurer of Artisan Distributors | | None |
| Janet D. Olsen – 50 | | General Counsel and Secretary | | 1/18/01 | | Managing Director and General Counsel of Artisan Partners; Vice President and Secretary of Artisan Distributors | | None |
| Brooke J. Billick – 52 | | Chief Compliance Officer | | 8/19/04 | | Chief Compliance Officer and Associate Counsel of Artisan Partners; Chief Compliance Officer of Artisan Distributors; prior to joining Artisan Partners in February 2004, Vice President, Securities Counsel and Corporate Secretary of Marshall & Ilsley Trust Company, N.A. (bank) and M&I Investment Management Corp. (investment adviser) and Chief Legal Officer and Secretary of Marshall Funds, Inc. (mutual fund company) | | None |
| Carlene M. Ziegler – 50 | | Vice President | | 3/27/95 | | Managing Director of Artisan Partners and Portfolio Co-Manager of Artisan Small Cap Fund; until February 2005, Director of Artisan Funds | | None |
| Michael C. Roos – 48 | | Vice President | | 12/19/03 | | Managing Director of Artisan Partners; Vice President of Artisan Distributors; until December 2003, President of Artisan Funds | | None |
| * | Mr. Ziegler is an “interested person” of Artisan Funds, as defined in the Investment Company Act of 1940, because he is a Managing Director of the Adviser and an officer and director of Artisan Investment Corporation (the general partner of the Adviser). Mr. Ziegler and Carlene M. Ziegler (who are married to each other) control the Adviser. Mr. Ziegler is also President of Artisan Distributors, Artisan Funds’ principal underwriter. |
92
NINETY-TWO
DIRECTORS AND OFFICERS
| | | | | | | | |
| | | | | |
Name and Age at 11/15/06 | | Positions Held with Funds | | Date First Elected
or Appointed to Office | | Principal Occupations during Past 5 Years | | Other Directorships Held |
| Gregory K. Ramirez – 36 | | Assistant Secretary and Assistant Treasurer | | 1/22/98 | | Managing Director, Client Accounting and Administration of Artisan Partners since January 2003, Director of Client Accounting and Administration from January 2000 to December 2002 and Controller of Artisan Partners prior thereto; Assistant Treasurer of Artisan Distributors | | None |
| Sarah A. Johnson – 34 | | Assistant Secretary | | 2/5/03 | | Associate Counsel of Artisan Partners; prior to joining Artisan Partners in July 2002, Associate of the law firm Bell, Boyd & Lloyd LLC, Chicago, IL | | None |
The business address of the director and officers affiliated with Artisan Partners is 875 E. Wisconsin Avenue, Suite 800, Milwaukee, Wisconsin 53202. The addresses of the other directors are: Mr. Erne – 1000 N. Water Street, Milwaukee, Wisconsin 53202; Mr. Hefty – W233 N2080 Ridgeview Parkway, Waukesha, Wisconsin 53188; Mr. Joerres – 5301 North Ironwood, Milwaukee, Wisconsin 53217; and Mr. Pittard and Mr. Witt – c/o Artisan Funds, 875 E. Wisconsin Avenue, Suite 800, Milwaukee, Wisconsin 53202.
Artisan Funds’ statement of additional information (SAI) contains further information about the directors. Please call 800.344.1770 or visit our website at www.artisanfunds.com for a free copy of the SAI.
93
NINETY-THREE
| | | | |
 | | ARTISAN FUNDS P.O. BOX 8412 BOSTON, MA 02266-8412 800.344.1770 WWW.ARTISANFUNDS.COM | | |


ARTISAN
ANNUAL
REPORT
SEPTEMBER 30, 2006
ARTISAN EMERGING
MARKETS FUND
_________
ARTISAN INTERNATIONAL
FUND
_________
ARTISAN MID CAP FUND
Artisan Funds, Inc.
INSTITUTIONAL SHARES
TABLE OF CONTENTS
ARTISAN FUNDS
P.O. BOX 8412
BOSTON, MA 02266-8412
This report and the audited financial statements contained herein are provided for the general information of the shareholders of the Institutional Shares of Artisan Emerging Markets Fund, Artisan International Fund and Artisan Mid Cap Fund. Before investing, investors should consider carefully each Fund’s investment objective, risks and charges and expenses. For more complete information on any Fund, including fees and expenses, please call 800.399.1770 for a free prospectus. Read it carefully before you invest or send money.
Company discussions are for illustration only and are not intended as recommendations of individual stocks. The discussions present information about the companies believed to be accurate, and the views of the portfolio managers, as of September 30, 2006. That information and those views may change, and the Funds disclaim any obligation to advise shareholders of any such changes.
Artisan Funds offered through Artisan Distributors LLC, member NASD.
ARTISAN EMERGING MARKETS FUND
INSTITUTIONAL SHARES
| | |
| INVESTMENT PROCESS HIGHLIGHTS | | |
Artisan Emerging Markets Fund uses a fundamental research process to construct a diversified portfolio of emerging market companies. The team’s investment process is focused on identifying companies that are priced at a discount relative to the team’s estimate of their sustainable earnings. • Sustainable Earnings. The team estimates a company’s sustainable earnings based upon financial and business analysis. The team’s financial analysis focuses on a company’s balance sheet, income statement, and statement of cash flows within a normalized return on equity model to assess earnings potential. The team’s business analysis examines a company’s competitive advantages and financial strength to assess sustainability. The team believes that over the long-term a stock’s price is directly related to the company’s sustainable earnings. • Valuation. The team values a business and develops a price target based on its sustainable earnings and cash flow expectations and risk analysis. The team believes that investment opportunities develop when businesses with sustainable earnings are undervalued relative to historical, industry and regional valuations. • Risk Analysis. The team believes that a disciplined risk framework allows greater focus on fundamental stock selection. The team incorporates its assessment of company-specific and macroeconomic risks into its valuation analysis to develop a risk-adjusted target price. The team’s risk-rating assessment includes a review of the currency, interest rate, monetary and fiscal policy and political risks to which a company is exposed. |
|
| PERFORMANCE HISTORY | | |
TOTAL RETURNS (as of 9/30/06)
| | | |
| Fund / Index | | Since
Inception(1) | |
Artisan Emerging Markets Fund – Institutional Shares | | 11.50 | % |
MSCI Emerging Markets IndexSM | | 12.04 | |
| (1) | For the period from commencement of operations (June 26, 2006) through September 30, 2006; not annualized. |
The performance quoted represents past performance, which does not guarantee future results. The investment return and principal value of an investment in the Fund will fluctuate, so that an investor’s shares in the Fund, when redeemed, may be worth more or less than their original cost. The Fund’s return may vary greatly over short periods, and current performance may be materially lower or higher than the performance data quoted. For current to most recent month-end performance information call 800.399.1770. The table above does not reflect the deduction of taxes that a shareholder would pay on distributions or sale of Fund shares. The performance shown does not reflect the deduction of a 2% redemption fee on shares held by an investor for 90 days or less and, if reflected, the fee would reduce the performance quoted. The Fund’s performance information reflects Artisan Partners’ undertaking to limit the Fund’s expenses, which may be terminated at any time, has been in effect since the Fund’s inception and has had a material impact on the Fund’s performance. In addition, the outside directors of Artisan Funds have waived that portion of their fees allocable to the Fund through the first six months of its operations. Absent that expense waiver, the Fund’s performance would have been lower. See page 50 for a description of each index. The growth of $10,000 chart has been omitted due to the Fund’s short performance history, but will be included in the March 2007 semiannual report.
1
ONE
INVESTING ENVIRONMENT
In the period leading up to the inception of the Fund, emerging markets were under a considerable amount of strain, only to bounce in the period since the Fund’s inception. Though the timing was fortuitous, it was not by design, and incidental to our long-term view of the asset class. Our interest in emerging markets is based on the long-term economic growth potential of emerging economies and the opportunities presented by the volatility associated with their emerging nature.
PERFORMANCE DISCUSSION
During the period since inception, the Fund generated a return of 11.50%, which compared to the 12.04% return for the MSCI Emerging Markets IndexSM. The technology and telecommunications sectors were sources of strength in the portfolio. Our stocks in Latin America also performed well. We were negatively impacted by weakness in several of our materials stocks.
Two standouts among our technology and telecom holdings were Hon Hai Precision Industry Co., Ltd. and Orascom Telecom Holding SAE (OT). Hon Hai Precision is the largest electronic manufacturing services company in the world. As of its fiscal year end, Hon Hai Precision’s client list included technology heavyweights such as Sony Corporation, Apple Computer, Inc., Dell Inc. and Hewlett-Packard Company. OT is an Egyptian mobile phone company with subscribers in the Middle East and North Africa. As of June 30, 2006, it had over 40 million phone subscribers in those regions.
Hon Hai Precision reported substantial increases in sales and earnings. Egyptian mobile phone company OT benefited from solid subscriber growth in several of its markets. We remained long-term investors.
TOP 10 HOLDINGS
| | | | | |
| Company Name | | Country | | 9/30/06 | |
Samsung Electronics Co., Ltd. | | South Korea | | 6.1 | % |
Petroleo Brasileiro S.A. – Petrobras | | Brazil | | 3.1 | |
America Movil S.A. de C.V. | | Mexico | | 2.4 | |
Hon Hai Precision Industry Co., Ltd. (Foxconn) | | Taiwan | | 2.4 | |
Infosys Technologies Limited | | India | | 2.3 | |
LUKOIL | | Russia | | 2.3 | |
Kookmin Bank | | South Korea | | 2.2 | |
Companhia Vale do Rio Doce (CVRD) | | Brazil | | 2.1 | |
Taiwan Semiconductor Manufacturing Company Ltd. | | Taiwan | | 2.1 | |
Sasol | | South Africa | | 2.0 | |
Total | | | | 27.0 | % |
As a percentage of total net assets. Top 10 Holdings are determined by issuer.
Many of our leading performers in Latin America were Mexican companies. Grupo Financiero Banorte S.A. de C.V. (Banorte) (bank), Organizacion Soriana S.A. de C.V. (Soriana) (food retailer) and Controladora Comercial Mexicana S.A. de C.V. (Comerci) (food retailer) were among the largest contributors to performance. We invested in all three companies because we believed that a sound economic environment characterized by solid gross domestic product growth, expanding private consumption and labor market improvements, generally supported their sustainable earnings prospects. Favorable election results were among the factors that contributed to positive returns for Mexican equities. This was not a fundamental data point for the companies we own, so we did not adjust our sustainable earnings estimates and target price-to-earnings for Banorte, Soriana or Comerci. As a result, the gains served to tighten the gap between their share prices and our target prices.
2
TWO
SECTOR DIVERSIFICATION
| | | |
| Sector | | 9/30/06 | |
Consumer Discretionary | | 7.6 | % |
Consumer Staples | | 7.5 | |
Energy | | 12.0 | |
Financials | | 17.4 | |
Healthcare | | 2.5 | |
Industrials | | 8.2 | |
Information Technology | | 17.0 | |
Materials | | 12.1 | |
Telecommunication Services | | 12.8 | |
Utilities | | 1.8 | |
Other assets less liabilities | | 1.1 | |
Total | | 100.0 | % |
As a percentage of total net assets.
In the materials sector, we were hurt by weakness in commodity companies Impala Platinum Holdings Limited (South Africa / Platinum), Companhia Vale do Rio Doce (CVRD) (Brazil / Iron Ore) and Gold Fields Limited (South Africa / Gold). Given the decline in commodity prices during the period, it was not surprising to see our stocks pressured by the sell-off. However, our interest in these companies extended beyond the short-term direction of commodity prices. Each company has access to metals with positive demand dynamics. During the period, CVRD announced an all-cash offer for a nickel producer that would diversify company assets and make CVRD the second largest mining company in the world. Gold Fields announced its intentions to increase its stake in two gold mines. We found both events consistent with our long-term theses.
FUND CHANGES
Given the recent inception of the portfolio, our transaction activity was a little high. With that in mind, we thought it might be worthwhile to highlight one of our more recent purchases—Samson Holding Ltd.
Samson Holding is a Chinese residential furniture manufacturer. It historically has generated the lion’s share of its revenues in the United States on a low-cost, largely Chinese manufacturing base.
Sustainable Earnings – We believed the company’s growth potential was supported by its high margins relative to U.S. competitors (given its Chinese labor costs and primarily U.S. revenues) and its flexible manufacturing platform. In addition, the company had a highly experienced management team and a strong balance sheet.
Risk and Valuation Analysis – Samson historically has been sensitive to the risks of a U.S. housing downturn, a revaluation of the Chinese renminbi and tariffs on imported furniture into the U.S. However, at our initial purchase, we believed that Samson’s valuation was understated and compensated us for that risk.
We believe investment opportunities develop when a company is undervalued relative to its sustainable earnings potential. From our perspective, Samson Holding was a good example of a company with those characteristics.
REGION ALLOCATION
| | | |
| Region | | 9/30/06 | |
Emerging Asia | | 49.4 | % |
Latin America | | 23.4 | |
Europe, Middle East & Africa | | 23.4 | |
Developed Markets | | 2.7 | |
As a percentage of total net assets.
3
THREE
ARTISAN INTERNATIONAL FUND
INSTITUTIONAL SHARES
| | |
| INVESTMENT PROCESS HIGHLIGHTS | | |
Artisan International Fund uses a fundamental stock selection process focused on identifying long-term growth opportunities. Themes. The investment team’s thematic approach identifies catalysts for change and develops investment themes with the objective of capitalizing on them globally. Changing demographics, developing technology, privatization of economic resources and outsourcing are among the long-term catalysts for change that currently form the basis for the team’s investment themes. The team incorporates these catalysts along with sector and regional fundamentals into a long-term global framework for investment analysis and decision-making. Sustainable Growth. The team applies a fundamental approach to identifying the long-term, sustainable growth characteristics of potential investments. The team seeks high quality companies that are well managed, have a dominant or improving market position and competitive advantages compared to industry and regional peers. Valuation. The team assesses the relationship between its estimate of a company’s sustainable growth prospects and its stock price. The team uses multiple valuation metrics to establish price targets. The Fund primarily invests in non-U.S. growth companies of all market capitalizations in developed and emerging markets. |
| | |
| PERFORMANCE HISTORY | | |
|
GROWTH OF AN ASSUMED $10,000 INVESTMENT (7/1/97 to 9/30/06)
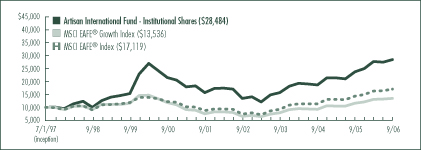
AVERAGE ANNUAL TOTAL RETURNS (as of 9/30/06)
| | | | | | | | | | | | |
| Fund / Index | | 1-Year | | | 3-Year | | | 5-Year | | | Since
Inception | |
Artisan International Fund - Institutional Shares | | 20.07 | % | | 21.80 | % | | 12.56 | % | | 11.98 | % |
MSCI EAFE® Growth Index | | 16.68 | | | 19.38 | | | 12.38 | | | 3.33 | |
MSCI EAFE® Index | | 19.16 | | | 22.32 | | | 14.26 | | | 5.98 | |
The performance quoted represents past performance, which does not guarantee future results. The investment return and principal value of an investment in the Fund will fluctuate, so that an investor’s shares in the Fund, when redeemed, may be worth more or less than their original cost. Current performance may be lower or higher than the performance data quoted. For current to most recent month-end performance information, visit www.artisanfunds.com or call 800.399.1770. The graph and table above do not reflect the deduction of taxes that a shareholder would pay on distributions or sale of Fund shares. The performance shown does not reflect the deduction of a 2% redemption fee on shares held by an investor for 90 days or less and, if reflected, the fee would reduce the performance quoted. See page 50 for a description of each index.
4
FOUR
INVESTING ENVIRONMENT
The fiscal year ended September 30, 2006, was, on the whole, a good period for international equities. Taken in parts, the first half of the year was strong, while the second half was characterized by a fair amount of volatility.
During the first half of the fiscal year, the growth of the global economy and strong corporate profits created a fair amount of optimism in international markets. In early May, however, concerns that inflation and higher interest rates would stifle global growth, caused a steep decline among international equities. At the end of the period, concerns somewhat subsided as a more moderate inflation outlook, lower energy prices and still robust earnings growth bolstered confidence.
Weakness in the U.S. dollar generally added to the returns of U.S. dollar based investors, but the performance of currencies vis-à-vis the dollar varied quite substantially. Though the U.S. dollar was weak versus many major currencies, it strengthened against the Japanese yen. This was a key reason that Japan was among the laggards during the fiscal year in U.S. dollar terms.
PERFORMANCE DISCUSSION
The Fund performed well during the fiscal year as it returned 20.07%, outgaining the MSCI EAFE® Index, which advanced 19.16%. A number of our leading performers could be found in our energy and infrastructure, communications and global financials themes. Our holdings in the consumer staples sector also performed very well. The consumer discretionary sector was a source of weakness compared to the Index.
With expectations for capital spending high, there was high demand for our energy infrastructure providers: Italy-based Saipem S.p.A., Singapore-based Keppel Corporation Limited and Norwegian energy companies Acergy SA (formerly Stolt Offshore SA) and SeaDrill Ltd. Russian oil producer LUKOIL also performed well.
Canadian natural gas provider EnCana Corp fell roughly 20% during the period. EnCana struggled as natural gas prices fell and stayed at low levels.
Our valuation discipline led us to do some trimming in LUKOIL, EnCana, Saipem and Acergy.
TOP 10 HOLDINGS
| | | | | |
| Company Name | | Country | | 9/30/06 | |
UBS AG | | Switzerland | | 3.8 | % |
RWE AG | | Germany | | 3.0 | |
Credit Saison Co., Ltd. | | Japan | | 2.8 | |
Allianz AG | | Germany | | 2.4 | |
Nestle SA | | Switzerland | | 2.3 | |
Mizuho Financial Group, Inc. | | Japan | | 2.2 | |
ORIX Corporation | | Japan | | 2.2 | |
Kookmin Bank | | South Korea | | 2.1 | |
ASML Holding N.V. | | Netherlands | | 2.1 | |
Fortum Oyj | | Finland | | 2.0 | |
Total | | | | 24.9 | % |
As a percentage of total net assets. Top 10 Holdings are determined by issuer.
Chinese wireless provider China Mobile Ltd. was a leading contributor among our communications holdings. China Mobile generated strong subscriber growth and was solidifying its market position ahead of potential new entrants to the market by cutting prices.
European financials Fortis and UBS AG, Korean financials Kookmin Bank and Shinhan Financial Group Co., Ltd., and Japanese financial ORIX Corporation were leading gainers in our global financials theme.
Japanese credit card company Credit Saison Co., Ltd., and Japanese consumer finance company, AIFUL CORPORATION were two stocks in our global financials theme that underperformed. Both stocks struggled most of the year as the industry awaited the LDP’s (Liberal Democratic Party) decision on new consumer lending regulations, which could negatively impact revenues.
British grocer William Morrison Supermarkets PLC, Mexican retailer Wal-Mart de Mexico SA de CV (Walmex) and French food retailer Carrefour SA were three standouts among our consumer staples holdings. Morrison reported strong sales performance and was ahead of schedule with its 3-year optimization plan to improve margins. Walmex reported consistent same store sales growth, and floor space expansion. Carrefour sold its Korean business, which was expected to add to earnings, and
5
FIVE
SECTOR DIVERSIFICATION
| | | | | | |
| Sector | | 9/30/05 | | | 9/30/06 | |
Consumer Discretionary | | 23.6 | % | | 11.8 | % |
Consumer Staples | | 9.8 | | | 9.8 | |
Energy | | 8.7 | | | 6.5 | |
Financials | | 30.4 | | | 37.3 | |
Healthcare | | 4.1 | | | 5.7 | |
Industrials | | 8.0 | | | 10.9 | |
Information Technology | | 6.8 | | | 4.8 | |
Materials | | — | | | 0.0(1 | ) |
Telecommunication Services | | 6.1 | | | 4.8 | |
Utilities | | 1.2 | | | 7.7 | |
Other assets less liabilities | | 1.3 | | | 0.7 | |
Total | | 100.0 | % | | 100.0 | % |
As a percentage of total net assets.
(1) Represents less than 0.1% of total net assets.
reported sales that indicated a recovery in its French supermarket business.
In the consumer discretionary sector, we were hurt by weakness in Japanese video game manufacturer SEGA SAMMY HOLDINGS, INC., and Japanese cable and internet service provider Jupiter Telecommunications Co., Ltd. Late in the period, Sega Sammy reported a decline in profits and increased development expenses in its consumer business. Jupiter Telecom suffered most early in the period due in part to concerns about competition from satellite providers and the potential for a decline in profitability. The price of its stock recovered some as the fiscal year wore on.
FUND CHANGES
During the fiscal year ended September 30, 2006, a large portion of our selling could be found in the consumer discretionary sector, mainly the media industry. We used proceeds from that selling in part to buy or add to a number of stocks in the utilities sector.
In the consumer discretionary sector, two of our most recent sales were retailer and luxury goods manufacturer PPR S.A. and French phone directories publisher PagesJaunes S.A. PPR benefited in part from good sales growth in its core Gucci brand and improvements in French retail. PagesJaunes is majority owned by France Telecom, which recently announced exclusive negotiations to sell its majority stake to a private equity company. We took the opportunity to sell our position.
The largest purchase in the utilities sector during the fiscal year was Finland-based Fortum Oyj, which provides a full range of energy-related services including generation, distribution and the sale of electricity. Fortum had been achieving power prices that were less than the continental averages, potentially creating a large growth opportunity if its realized power prices converge to the averages.
A few of our larger transactions outside of those sectors were the purchases of Bouygues SA and GlaxoSmithKline plc and the sales of Commerzbank AG and Siemens AG.
Bouygues is an industrial conglomerate involved in the telecom and construction industries. It is the world leader in road construction and it recently purchased a large stake in construction services firm Alstom. GlaxoSmithKline is a market leader in the vaccine industry, which has had high barriers to entry because of the research investment and knowledge required to produce vaccines.
Commerzbank, a German bank focused on retail customers and small to mid-sized enterprises, benefited from optimism about Germany’s economy and the acquisition of Eurohypo AG. Siemens is a German conglomerate that manufactures a wide range of industrial and consumer products. Recently it became clear that restructuring efforts were going to take longer than anticipated and we were concerned about weakness in Siemens’ end markets.
REGION ALLOCATION
| | | | | |
| Region | | 9/30/05 | | | 9/30/06 |
Europe | | 55.0 | % | | 55.4% |
Pacific Basin | | 25.2 | | | 29.0 |
Emerging Markets | | 15.3 | | | 14.0 |
Americas | | 3.2 | | | 0.9 |
As a percentage of total net assets.
6
SIX
ARTISAN MID CAP FUND
INSTITUTIONAL SHARES
| | |
| INVESTMENT PROCESS HIGHLIGHTS | | |
Artisan Mid Cap Fund uses a bottom-up investment process to construct a diversified portfolio of U.S. mid-cap growth companies. Security Selection. The team’s investment process begins by identifying companies possessing franchise characteristics (strong competitive positions), selling at attractive valuations and benefiting from an accelerating trend. The investment team looks for companies that are well positioned for long-term growth, driven by demand for their products and services, at an early enough stage in their profit cycle to benefit from the increased cash flows produced by the profit cycle. Capital Allocation. Based on the investment team’s fundamental analysis of a company’s profit cycle, portfolio holdings develop through three stages. GardenSM investments are small positions in the early part of their profit cycle that will warrant a more sizeable allocation once their profit cycle accelerates. CropSM investments are positions that are being increased to a full weight because they are moving through the strongest part of their profit cycle. HarvestSM investments are positions that are being reduced as they near the team’s estimate of full valuation or their profit cycle begins to decelerate. Broad Diversification. The team looks for investment opportunities across the entire economy so that it can find sustainable growth regardless of the sector or industry. The Fund primarily invests in medium-sized U.S. growth companies. The Fund generally maintains median and weighted average market capitalizations of less than $10 billion. |
| | |
| PERFORMANCE HISTORY | | |
GROWTH OF AN ASSUMED $10,000 INVESTMENT (7/1/00 to 9/30/06)
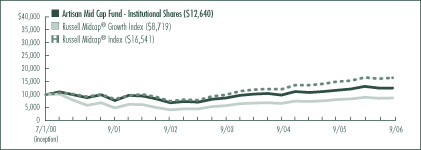
AVERAGE ANNUAL TOTAL RETURNS (as of 9/30/06)
| | | | | | | | | | | | |
| Fund / Index | | 1-Year | | | 3-Year | | | 5-Year | | | Since
Inception | |
Artisan Mid Cap Fund - Institutional Shares | | 7.66 | % | | 13.01 | % | | 10.33 | % | | 3.82 | % |
Russell Midcap® Growth Index | | 7.03 | | | 14.53 | | | 12.01 | | | -2.17 | |
Russell Midcap® Index | | 9.57 | | | 18.22 | | | 14.81 | | | 8.38 | |
The performance quoted represents past performance, which does not guarantee future results. The investment return and principal value of an investment in the Fund will fluctuate, so that an investor’s shares in the Fund, when redeemed, may be worth more or less than their original cost. Current performance may be lower or higher than the performance data quoted. For current to most recent month-end performance information, visit www.artisanfunds.com or call 800.399.1770. The graph and table above do not reflect the deduction of taxes that a shareholder would pay on distributions or sale of Fund shares. See page 50 for a description of each index.
7
SEVEN
INVESTING ENVIRONMENT
During the fiscal year ended September 30, 2006, stocks of all sizes generally performed well, though large-caps were the leaders. During the period, the market continued to show a preference for value.
In the early part of the fiscal year stock gains were fairly strong. As the period wore on, the risks of inflation weighed on equity returns. A fall in energy prices and an end to the Federal Reserve’s string of interest rate hikes contributed to improved sentiment near the end of the period.
The best performing sectors in the Russell Midcap® Index were materials, transportation, financials and consumer staples which generated strong double-digit gains. The energy sector recorded a loss, as investors sold energy stocks with the declines in the prices of oil and natural gas. The producer durables sector also underperformed, but managed to eke out a small gain.
PERFORMANCE DISCUSSION
The Fund returned 7.66% during its fiscal year ended September 30, 2006, outperforming the Russell Midcap® Growth Index, which returned 7.03%, but coming up short of the 9.57% gain for the Russell Midcap® Index. Two key sources of strength in the portfolio relative to the benchmarks were our energy and infrastructure related holdings. Our performance in the technology sector was mixed. We were hurt by the relative weakness of our stocks in the consumer discretionary sector.
Our energy related investments have generally been centered around those companies that we believed were poised to benefit from a lengthy cycle of renewed global spending on energy development and infrastructure. This positioning helped the portfolio in two ways. First, it kept our allocation to crude producers low and crude producers generally declined during the period. Second, it led us to a number of energy infrastructure providers that generated solid gains. McDermott International, Inc., Cameron International Corporation and Smith International, Inc., were three of our best performers.
TOP 10 HOLDINGS
| | | |
| Company Name | | 9/30/06 | |
Fisher Scientific International Inc. | | 3.8 | % |
Electronic Arts Inc. | | 2.6 | |
Allergan, Inc. | | 2.5 | |
Freescale Semiconductor, Inc. | | 2.5 | |
McDermott International, Inc. | | 2.2 | |
Juniper Networks, Inc. | | 2.2 | |
MGIC Investment Corporation | | 2.0 | |
Precision Castparts Corp. | | 1.9 | |
NII Holdings, Inc. | | 1.8 | |
Equifax Inc. | | 1.8 | |
Total | | 23.3 | % |
As a percentage of total net assets. Top 10 Holdings are determined by issuer
Worldwide energy services company McDermott International benefited from strong growth in backlog due to resurgence in drilling activity, solid operating margin performance and improving cash flows. Cameron International, a leading manufacturer of pressure control systems, equipment and services for oil and gas drilling and production, benefited from positive trends in the subsea market. Smith International is a worldwide supplier of premium products and services to the oil and gas exploration and production industry and is a dominant market player in both drill bits and drilling fluids. It benefited from higher oil rig activity and better pricing.
Logistics company Expeditors International of Washington, Inc. (EXPD) and cleaning products and services provider Ecolab Inc. were two leaders among our infrastructure holdings. We believed that EXPD was a well-managed company exposed to the development of the transportation market in Asia. Market share gains and a strong international freight environment drove solid growth at EXPD. During the period, revenue trends at Ecolab were solid due in part to evolving sanitation standards and increased awareness of infection control.
Student loan outsourcer The First Marblehead Corporation (FMD) was another top performer. FMD moved strongly higher as growth in tuition costs and enrollments rates
8
EIGHT
contributed to demand for FMD’s services—loan disbursement processing, student applications processing and securitization volumes. We sold our position.
In the technology sector, our leading contributor was Freescale Semiconductor, Inc., the former semiconductor arm of Motorola, Inc. It advanced strongly in the latter part of the fiscal year after it reached an agreement with a consortium of private equity firms to be purchased at a price that valued the company at $40 per share. This represented a significant premium to the share price at the time of the announcement and it was very close to our private market value estimate for the company.
On the downside, we were hurt by weakness in Juniper Networks, Inc., a leading provider of internet protocol (IP) routers and security solutions. It experienced a slowdown in demand as the market prepared for next generation IP networks. Widespread concern over options backdating also weighed on Juniper. We elected to reserve judgment on Juniper until we had all of the facts at hand.
In the consumer discretionary sector, a good portion of our security selection weakness was in stocks that we would identify as sensitive to ad spending. Two of our largest negative contributors in the sector were internet media company Yahoo! Inc. and stock photography company Getty Images, Inc. Yahoo! was experiencing a slowdown in ad spending in the auto and financial services industries and expected a delayed contribution from its new paid search platform. Getty was pressured by heightened competition and fears that its core business would be cannibalized by lower cost alternatives.
Private label women’s clothing retailer Chico’s FAS, Inc. was one of our more traditional consumer businesses that did not perform well during the fiscal year. Sales slowed due to poor merchandising and a reduction in store traffic.
FUND CHANGES
During the fiscal year ended September 30, 2006, we continued to apply our time-tested process to the portfolio. We seeded the portfolio with new GardenSM investments that we estimated were in the early stages of a positive profit cycle. We committed additional capital to our highest conviction ideas and harvested names where we felt the profit cycle had run its course or where we believed valuation no longer made economic sense. At fiscal year-end, we had over 52% of portfolio assets in our top 30 holdings.
Recent GardenSM investments included Patterson Companies, Inc., a distributor of dental, veterinary and rehabilitation supplies; Amazon.com, Inc., an online retailer; Supervalu Inc., a grocery retailer; CIGNA Corporation, a healthcare benefits provider; Hospira, Inc., a specialty pharmaceutical and medication delivery company created from Abbott Laboratories; and Dresser-Rand Group Inc., a provider of rotating equipment solutions to the energy sector.
In addition to the sale of First Marblehead, we funded those purchases in part with the sales of AmerisourceBergen Corporation, Marvell Technology Group Ltd., Genzyme Corporation, Hewitt Associates, Inc. and Agilent Technologies, Inc., among others.
SECTOR DIVERSIFICATION
| | | | | | |
| Sector | | 9/30/05 | | | 9/30/06 | |
Auto & Transportation | | 0.9 | % | | 2.1 | % |
Consumer Discretionary | | 17.8 | | | 16.6 | |
Consumer Staples | | 2.8 | | | 2.2 | |
Financial Services | | 11.3 | | | 16.2 | |
Healthcare | | 19.6 | | | 17.5 | |
Materials & Processing | | 7.0 | | | 6.1 | |
Other | | 3.8 | | | 3.1 | |
Other Energy | | 6.8 | | | 4.8 | |
Producer Durables | | 6.7 | | | 5.5 | |
Technology | | 19.0 | | | 19.9 | |
Utilities | | 1.7 | | | 3.5 | |
Other assets less liabilities | | 2.6 | | | 2.5 | |
Total | | 100.0 | % | | 100.0 | % |
As a percentage of total net assets.
9
NINE
ARTISAN EMERGING MARKETS FUND
Schedule of Investments – September 30, 2006
| | | | | |
| | | Shares
Held | | Value |
COMMON AND
PREFERRED STOCKS - 98.9% | | | | | |
| | | | | |
| ARGENTINA - 0.8% | | | | | |
Tenaris S.A. (ADR) | | 1,300 | | $ | 45,994 |
| | | | | |
| BRAZIL - 13.7% | | | | | |
All America Latina Logistica (ALL) (Units) | | 5,000 | | | 38,863 |
Banco Itau Holding Financeira SA, Preferred | | 2,600 | | | 77,846 |
Banco Nossa Caixa SA | | 1,400 | | | 27,900 |
Companhia de Saneamento Basico do Estado de Sao Paulo-SABESP | | 330,000 | | | 39,458 |
Companhia Vale do Rio Doce (CVRD) | | 5,700 | | | 122,819 |
EDP-Energias do Brasil SA | | 2,200 | | | 28,129 |
Empresa Brasileira de Aeronautica S.A. (Embraer) | | 4,400 | | | 43,104 |
Petroleo Brasileiro S.A.-Petrobras | | 8,700 | | | 181,458 |
Suzano Papel e Celulose S.A., Class A, Preferred | | 4,100 | | | 28,568 |
Tam SA, Preferred | | 1,200 | | | 37,971 |
Tele Norte Leste Participacoes S.A. (Telemar) | | 2,200 | | | 67,792 |
Telesp-Telecomunicacoes de Sao Paulo S.A. | | 1,500 | | | 28,195 |
Tim Participacoes S.A., Preferred | | 10,900,000 | | | 30,028 |
Unibanco-Uniao de Bancos Brasileiros S.A. (Units) | | 7,600 | | | 56,276 |
| | | | | |
| | | | | 808,407 |
| CHINA - 5.9% | | | | | |
Chaoda Modern Agriculture (Holdings) Limited | | 94,000 | | | 57,674 |
China Paradise Electronics Retail Ltd. | | 206,000 | | | 54,999 |
Geely Automobile Holdings Limited | | 205,000 | | | 24,208 |
Huaneng Power International, Inc., H Shares | | 50,000 | | | 36,005 |
Mindray Medical International Limited (ADR)(1) | | 1,000 | | | 16,690 |
New Oriental Education & Technology Group, Inc. (ADR)(1) | | 1,933 | | | 46,875 |
Samson Holding Ltd. | | 103,000 | | | 49,579 |
Shui On Land Limited(1) | | 40,000 | | | 27,469 |
Weichai Power Co., Ltd., H Shares | | 14,000 | | | 32,957 |
| | | | | |
| | | | | 346,456 |
| COLOMBIA - 0.6% | | | | | |
Bancolombia S.A., Preferred (ADR) | | 1,200 | | | 34,320 |
| | | | | |
| EGYPT - 1.8% | | | | | |
Orascom Construction Industries (OCI)(2) | | 952 | | | 41,632 |
Orascom Telecom Holding SAE(2) | | 1,131 | | | 64,435 |
| | | | | |
| | | | | 106,067 |
| | | | | |
| | | Shares
Held | | Value |
| HONG KONG - 1.2% | | | | | |
Huabao International Holdings Limited(1) | | 95,000 | | $ | 38,411 |
Tingyi (Cayman Islands) Holding Corporation | | 44,000 | | | 32,870 |
| | | | | |
| | | | | 71,281 |
| HUNGARY - 0.8% | | | | | |
MOL Hungarian Oil and Gas Nyrt. | | 483 | | | 44,040 |
| | | | | |
| INDIA - 6.1% | | | | | |
Bharat Petroleum Corporation Limited(1) | | 3,410 | | | 27,265 |
Hindalco Industries Limited | | 15,355 | | | 57,341 |
Infosys Technologies Limited | | 3,412 | | | 137,476 |
ITC Limited | | 10,442 | | | 42,689 |
Jaiprakash Associates Ltd. | | 2,901 | | | 30,321 |
Punjab National Bank Limited | | 2,720 | | | 31,224 |
Wockhardt Limited | | 3,400 | | | 29,688 |
| | | | | |
| | | | | 356,004 |
| INDONESIA - 2.2% | | | | | |
PT Indosat Tbk | | 90,500 | | | 50,523 |
PT Telekomunikasi Indonesia, Series B | | 83,500 | | | 76,485 |
| | | | | |
| | | | | 127,008 |
| ISRAEL - 3.4% | | | | | |
Bank Hapoalim B.M.(2) | | 14,670 | | | 69,325 |
Makhteshim-Agan Industries Ltd.(2) | | 6,402 | | | 31,622 |
Teva Pharmaceutical Industries Ltd.(2) | | 3,014 | | | 100,695 |
| | | | | |
| | | | | 201,642 |
| LEBANON - 0.6% | | | | | |
SOLIDERE (GDR)(2) | | 1,800 | | | 32,634 |
| | | | | |
| MALAYSIA - 0.5% | | | | | |
Digi.com Berhad | | 8,800 | | | 29,826 |
| | | | | |
| MEXICO - 8.3% | | | | | |
America Movil S.A. de C.V., Series L | | 71,400 | | | 140,930 |
Controladora Comercial Mexicana S.A. de C.V.,
UBC Shares | | 25,300 | | | 50,858 |
Fomento Economico Mexicano, S.A. de C.V.,
UBD Shares | | 6,600 | | | 64,091 |
Grupo Bimbo SA de CV, Series A | | 9,600 | | | 33,627 |
Grupo Financiero Banorte S.A. de C.V., O Shares | | 14,800 | | | 46,322 |
Grupo Mexico SAB de CV, Series B | | 17,500 | | | 54,805 |
Grupo Televisa S.A., Series CPO | | 16,900 | | | 72,079 |
Organizacion Soriana S.A. de C.V., Series B | | 5,300 | | | 26,514 |
| | | | | |
| | | | | 489,226 |
10
TEN
| | | | | |
| | | Shares
Held | | Value |
| RUSSIA - 6.1% | | | | | |
LUKOIL (ADR) | | 1,800 | | $ | 135,900 |
Mining and Metallurgical Company Norilsk Nickel (ADR) | | 617 | | | 80,210 |
NovaTek OAO (GDR) | | 2,171 | | | 108,007 |
VolgaTelecom (ADR)(1)(2) | | 4,200 | | | 34,188 |
| | | | | |
| | | | | 358,305 |
| SOUTH AFRICA - 7.9% | | | | | |
Edgars Consolidated Stores Limited | | 8,770 | | | 33,779 |
Gold Fields Limited | | 4,614 | | | 81,448 |
Impala Platinum Holdings Limited | | 604 | | | 99,649 |
MTN Group Limited | | 8,250 | | | 66,731 |
Reunert Limited | | 3,581 | | | 31,328 |
Sasol | | 3,509 | | | 115,334 |
Steinhoff International Holdings Limited | | 11,600 | | | 37,397 |
| | | | | |
| | | | | 465,666 |
| SOUTH KOREA - 17.0% | | | | | |
CJ Corp. | | 336 | | | 37,106 |
CJ Home Shopping | | 296 | | | 24,994 |
Daewoo Shipbuilding & Marine Engineering Co., Ltd. | | 1,170 | | | 37,836 |
GS Engineering & Construction Corp. | | 598 | | | 41,836 |
Hyundai Motor Company | | 891 | | | 76,271 |
Kookmin Bank | | 1,640 | | | 129,294 |
Korean Air Lines Co., Ltd. | | 810 | | | 29,704 |
Samsung Electronics Co., Ltd. | | 515 | | | 361,384 |
Samsung Fire & Marine Insurance Co., Ltd. | | 318 | | | 48,897 |
Shinhan Financial Group Co., Ltd. | | 1,780 | | | 80,229 |
Shinsegae Co., Ltd. | | 128 | | | 66,283 |
SK Telecom Co., Ltd. | | 323 | | | 68,781 |
| | | | | |
| | | | | 1,002,615 |
| TAIWAN - 13.8% | | | | | |
Acer Inc. | | 59,160 | | | 100,276 |
Cathay Financial Holding Co., Ltd. | | 44,088 | | | 88,316 |
Chinatrust Financial Holding Company Ltd. | | 97,440 | | | 72,717 |
Far Eastern Textile Ltd. | | 83,740 | | | 62,114 |
Far EasTone Telecommunications Co., Ltd. | | 24,000 | | | 25,996 |
Hon Hai Precision Industry Co., Ltd. (Foxconn) | | 22,800 | | | 138,808 |
Novatek Microelectronics Corp., Ltd. | | 6,659 | | | 31,487 |
Taishin Financial Holdings Co., Ltd.(1) | | 202,000 | | | 102,228 |
Taiwan Fertilizer Co., Ltd. | | 19,000 | | | 30,884 |
Taiwan Semiconductor Manufacturing Company Ltd. | | 68,000 | | | 122,656 |
United Microelectronics Corporation | | 66,513 | | | 37,278 |
| | | | | |
| | | | | 812,760 |
| | | | | | | |
| | | Shares
Held | | Value | |
| THAILAND - 3.9% | | | | | | | |
Advanced Info Service Public Company Limited (NVDR) | | | 14,800 | | $ | 35,459 | |
Airports of Thailand Public Company Ltd. (NVDR) | | | 19,200 | | | 29,645 | |
Krung Thai Bank Public Company Limited (NVDR) | | | 110,100 | | | 33,412 | |
The Siam Cement Public Company Limited (NVDR) | | | 6,500 | | | 41,182 | |
Siam City Bank Public Company Limited (NVDR) | | | 53,400 | | | 28,146 | |
Siam Commercial Bank Public Company Limited (NVDR) | | | 20,400 | | | 32,584 | |
Total Access Communication Public Company Limited(1) | | | 7,800 | | | 31,356 | |
| | | | | | | |
| | | | | | 231,784 | |
| TURKEY - 2.8% | | | | | | | |
Akcansa Cimento A.S. | | | 5,826 | | | 27,697 | |
Enka Insaat ve Sanayi AS | | | 3,579 | | | 26,231 | |
Tofas Turk Otomobil Fabrikasi AS | | | 10,914 | | | 29,258 | |
Tupras-Turkiye Petrol Rafinerileri A.S. | | | 2,924 | | | 44,985 | |
Turkiye Garanti Bankasi A.S. | | | 12,318 | | | 36,438 | |
| | | | | | | |
| | | | | | 164,609 | |
| UNITED KINGDOM - 1.5% | | | | | | | |
Anglo American PLC | | | 1,362 | | | 56,945 | |
SABMiller PLC | | | 1,508 | | | 28,179 | |
| | | | | | | |
| | | | | | 85,124 | |
Total common and preferred stocks
(Cost $5,370,705) | | | | | | 5,813,768 | |
| | | Par
Amount | | | |
SHORT-TERM INVESTMENTS
(CASH EQUIVALENTS) - 2.6% | | | | | | | |
Repurchase agreement with State
Street Bank and Trust Company,
5.00%, dated 9/29/06, due
10/2/06, maturity value
$154,064, collateralized by
$157,518 market value
Federal National Mortgage
Association Note,
5.75%, due 2/15/08
(Cost $154,000) | | $ | 154,000 | | | 154,000 | |
| | | | | | | |
Total investments - 101.5%
(Cost $5,524,705) | | | | | | 5,967,768 | |
Other assets less liabilities - (1.5%) | | | | | | (86,208 | ) |
| | | | | | | |
Total net assets - 100.0%(3) | | | | | $ | 5,881,560 | |
| | | | | | | |
11
ELEVEN
| (1) | Non-income producing security. |
| (2) | Valued at a fair value in accordance with procedures established by the Board of Directors of Artisan Funds. In total, securities valued at a fair value were $374,531 or 6.4% of total net assets. |
| (3) | Percentages for the various classifications relate to total net assets. |
(ADR) American Depository Receipt
(GDR) Global Depository Receipt
(NVDR) Non-Voting Depository Receipt
| | | | | |
| PORTFOLIO DIVERSIFICATION - SEPTEMBER 30, 2006 |
| | | Value | | Percentage
of Total
Net Assets |
Consumer Discretionary | | $ | 449,439 | | 7.6% |
Consumer Staples | | | 439,891 | | 7.5 |
Energy | | | 702,983 | | 12.0 |
Financials | | | 1,022,943 | | 17.4 |
Healthcare | | | 147,073 | | 2.5 |
Industrials | | | 484,848 | | 8.2 |
Information Technology | | | 999,104 | | 17.0 |
Materials | | | 713,170 | | 12.1 |
Telecommunication Services | | | 750,725 | | 12.8 |
Utilities | | | 103,592 | | 1.8 |
| | | | | |
Total common and preferred stocks | | | 5,813,768 | | 98.9 |
Short-term investments | | | 154,000 | | 2.6 |
| | | | | |
Total investments | | | 5,967,768 | | 101.5 |
Other assets less liabilities | | | (86,208) | | (1.5) |
| | | | | |
Total net assets | | $ | 5,881,560 | | 100.0% |
| | | | | |
| | | | | |
| CURRENCY EXPOSURE - SEPTEMBER 30, 2006 |
| | | Value | | Percentage
of Total
Investments |
Brazilian real | | $ | 808,407 | | 13.5% |
British pound | | | 85,124 | | 1.4 |
Egyptian pound | | | 106,067 | | 1.8 |
Hong Kong dollar | | | 354,172 | | 5.9 |
Hungarian forint | | | 44,040 | | 0.7 |
Indian rupee | | | 356,004 | | 6.0 |
Indonesian rupiah | | | 127,008 | | 2.1 |
Israeli shekel | | | 201,642 | | 3.4 |
Malaysian ringgit | | | 29,826 | | 0.5 |
Mexican peso | | | 489,226 | | 8.2 |
South African rand | | | 465,666 | | 7.8 |
South Korean won | | | 1,002,615 | | 16.8 |
Taiwan dollar | | | 812,760 | | 13.6 |
Thai baht | | | 200,428 | | 3.4 |
Turkish lira | | | 164,609 | | 2.8 |
US dollar | | | 720,174 | | 12.1 |
| | | | | |
Total investments | | $ | 5,967,768 | | 100.0% |
| | | | | |
The accompanying notes are an integral part of the financial statements.
12
TWELVE
ARTISAN INTERNATIONAL FUND
Schedule of Investments – September 30, 2006
| | | | | |
| | | | | |
| | | Shares
Held | | Value |
COMMON AND
PREFERRED STOCKS - 99.3% | | | |
| | | | | |
| AUSTRALIA - 1.6% | | | | | |
Publishing & Broadcasting Limited | | 16,115,816 | | $ | 223,887,163 |
| | | | | |
| AUSTRIA - 0.8% | | | | | |
Wiener Staedtische Versicherung AG | | 1,742,306 | | | 109,361,951 |
| | | | | |
| BELGIUM - 1.7% | | | | | |
Fortis | | 5,935,575 | | | 240,851,521 |
Umicore | | 9,380 | | | 1,388,067 |
| | | | | |
| | | | | 242,239,588 |
| BRAZIL - 0.3% | | | | | |
Vivo Participacoes S.A., Preferred (ADR)(1) | | 13,530,268 | | | 42,214,436 |
| | | | | |
| CANADA - 0.9% | | | | | |
EnCana Corp | | 2,678,700 | | | 124,642,529 |
| | | | | |
| CHINA - 3.4% | | | | | |
China Life Insurance Co., Limited | | 16,014,000 | | | 31,326,444 |
China Merchants Holdings International Company Limited | | 33,143,500 | | | 97,422,699 |
China Mobile Ltd. | | 35,948,700 | | | 254,711,512 |
China Unicom Limited | | 83,863,400 | | | 82,457,002 |
| | | | | |
| | | | | 465,917,657 |
| DENMARK - 0.4% | | | | | |
Carlsberg A/S, B Shares | | 629,000 | | | 52,899,394 |
| | | | | |
| FINLAND - 2.0% | | | | | |
Fortum Oyj | | 10,460,530 | | | 278,686,775 |
| | | | | |
| FRANCE - 9.1% | | | | | |
Alstom(1) | | 1,038,206 | | | 93,932,121 |
Axa | | 3,875,252 | | | 142,899,586 |
Bouygues SA | | 2,960,237 | | | 158,332,357 |
Carrefour SA | | 3,790,879 | | | 239,534,144 |
Electricite de France (EDF) | | 2,484,725 | | | 138,003,169 |
LVMH Moet Hennessy Louis Vuitton SA | | 1,765,512 | | | 181,899,147 |
Safran SA | | 2,274,982 | | | 45,983,593 |
Sanofi-Aventis | | 557,773 | | | 49,651,368 |
Technip SA | | 2,062,167 | | | 117,201,266 |
Vinci SA | | 939,008 | | | 104,544,316 |
| | | | | |
| | | | | 1,271,981,067 |
| | | | | |
| | | | | |
| | | Shares
Held | | Value |
| GERMANY - 8.5% | | | | | |
Allianz AG | | 1,932,746 | | $ | 334,487,903 |
Deutsche Post AG | | 4,080,528 | | | 107,108,349 |
E.ON AG | | 1,143,626 | | | 135,562,429 |
IVG Immobilien AG | | 1,241,382 | | | 44,925,822 |
RWE AG | | 4,595,757 | | | 423,961,748 |
SAP AG | | 678,078 | | | 134,478,551 |
| | | | | |
| | | | | 1,180,524,802 |
| HONG KONG - 2.5% | | | | | |
Hutchison Whampoa Limited | | 4,655,000 | | | 41,078,889 |
MTR Corporation Limited | | 30,280,000 | | | 76,024,054 |
NWS Holdings Limited | | 23,556,800 | | | 48,802,956 |
Sun Hung Kai Properties Limited | | 14,394,400 | | | 156,957,928 |
Swire Pacific Limited, A Shares | | 2,797,577 | | | 29,212,311 |
| | | | | |
| | | | | 352,076,138 |
| INDONESIA - 0.0%(2) | | | | | |
PT Bank Mandiri | | 12,160,500 | | | 3,064,841 |
| | | | | |
| ITALY - 5.0% | | | | | |
Banca Intesa S.p.A. | | 5,115,021 | | | 33,662,890 |
Capitalia S.p.A | | 222,000 | | | 1,838,242 |
Mediobanca S.p.A. | | 4,841,131 | | | 105,587,353 |
Saipem S.p.A. | | 9,652,867 | | | 209,799,167 |
Telecom Italia S.p.A. | | 12,700,395 | | | 36,074,628 |
Telecom Italia S.p.A. - RNC | | 25,632,699 | | | 61,756,768 |
UniCredito Italiano SpA | | 29,060,970 | | | 241,188,377 |
| | | | | |
| | | | | 689,907,425 |
| JAPAN - 22.4% | | | | | |
AIFUL CORPORATION | | 2,800,300 | | | 108,337,532 |
BRIDGESTONE CORPORATION | | 5,268,600 | | | 106,375,543 |
Chugai Pharmaceutical Co., Ltd. | | 7,401,500 | | | 159,151,831 |
Credit Saison Co., Ltd.(3) | | 9,284,400 | | | 391,418,514 |
JAPAN TOBACCO INC. | | 52,487 | | | 203,949,486 |
Jupiter Telecommunications Co., Ltd.(1) | | 227,341 | | | 171,480,069 |
KEYENCE CORPORATION | | 403,350 | | | 92,877,206 |
Millea Holdings, Inc.(4) | | 8,241 | | | 143,192,825 |
Mitsubishi Estate Company Ltd. | | 5,299,000 | | | 115,736,889 |
Mitsubishi UFJ Financial Group, Inc. (MUFG) | | 14,787 | | | 190,275,048 |
Mitsui & Co., Ltd. | | 8,741,000 | | | 111,144,821 |
Mitsui Fudosan Co., Ltd. | | 5,401,800 | | | 122,783,771 |
Mizuho Financial Group, Inc. | | 40,324 | | | 312,692,351 |
NTT Data Corporation | | 16,405 | | | 75,688,677 |
ORIX Corporation | | 1,083,700 | �� | | 299,536,974 |
SEGA SAMMY HOLDINGS INC. | | 4,525,800 | | | 145,591,873 |
SMC CORPORATION | | 437,600 | | | 57,902,121 |
Sumitomo Mitsui Financial Group, Inc. | | 11,007 | | | 115,544,381 |
TAISEI CORPORATION(3) | | 54,263,300 | | | 194,773,665 |
| | | | | |
| | | | | 3,118,453,577 |
13
THIRTEEN
| | | | | |
| | | | | |
| | | Shares
Held | | Value |
| LUXEMBOURG - 0.6% | | | | | |
RTL Group | | 772,286 | | $ | 81,281,718 |
| | | | | |
| MEXICO - 2.9% | | | | | |
Grupo Televisa S.A. (ADR) | | 11,318,529 | | | 240,631,927 |
Wal-Mart de Mexico SA de CV, Series V | | 48,790,500 | | | 165,978,234 |
| | | | | |
| | | | | 406,610,161 |
| NETHERLANDS - 3.9% | | | | | |
ASML Holding N.V.(1) | | 10,865,503 | | | 254,066,480 |
ASML Holding N.V., NY Shares(1) | | 1,502,800 | | | 34,985,184 |
ING Groep N.V. CVA | | 4,751,479 | | | 209,011,284 |
Unilever NV CVA | | 2,061,040 | | | 50,701,962 |
| | | | | |
| | | | | 548,764,910 |
| NORWAY - 2.0% | | | | | |
Acergy SA(1) | | 8,128,500 | | | 138,866,753 |
Renewable Energy Corp AS(1) | | 484,300 | | | 7,494,607 |
SeaDrill Ltd.(1) | | 9,494,005 | | | 124,519,172 |
| | | | | |
| | | | | 270,880,532 |
| RUSSIA - 2.1% | | | | | |
LUKOIL (ADR) | | 2,024,402 | | | 152,842,351 |
NovaTek OAO (GDR) | | 872,583 | | | 43,411,004 |
RAO Unified Energy System (UES) (GDR) | | 1,326,204 | | | 96,812,892 |
| | | | | |
| | | | | 293,066,247 |
| SINGAPORE - 2.5% | | | | | |
Keppel Corporation Limited | | 19,557,500 | | | 182,245,238 |
Singapore Airlines Limited | | 18,288,900 | | | 168,120,850 |
| | | | | |
| | | | | 350,366,088 |
| SOUTH AFRICA - 0.1% | | | | | |
MTN Group Limited | | 1,008,743 | | | 8,159,308 |
| | | | | |
| SOUTH KOREA - 4.7% | | | | | |
Hana Financial Group Inc. | | 3,314,174 | | | 151,655,201 |
Kookmin Bank | | 3,689,109 | | | 290,840,192 |
Shinhan Financial Group Co., Ltd. | | 4,579,820 | | | 206,424,648 |
| | | | | |
| | | | | 648,920,041 |
| SPAIN - 1.0% | | | | | |
Industria de Diseno Textil, S.A. (Inditex) | | 2,733,417 | | | 127,414,253 |
Telefonica S.A. | | 761,482 | | | 13,199,722 |
| | | | | |
| | | | | 140,613,975 |
| SWITZERLAND - 12.3% | | | | | |
Adecco SA | | 3,044,624 | | | 183,707,370 |
Nestle SA | | 900,000 | | | 313,807,030 |
Novartis AG | | 3,138,997 | | | 183,251,454 |
Roche Holding AG | | 1,408,119 | | | 243,460,616 |
Swatch Group AG | | 95,293 | | | 18,411,603 |
Swiss Re | | 3,275,613 | | | 250,690,683 |
UBS AG | | 8,751,416 | | | 523,496,275 |
| | | | | |
| | | | | 1,716,825,031 |
| | | | | | |
| | | | | | |
| | | Shares
Held | | Value |
| TAIWAN - 0.5% | | | | | | |
Taiwan Semiconductor Manufacturing Company Ltd. (ADR) | | | 7,824,733 | | $ | 75,117,437 |
| | | | | | |
| UNITED KINGDOM - 8.1% | | | | | | |
Barclays PLC | | | 9,510,528 | | | 120,019,470 |
Cadbury Schweppes PLC | | | 12,066,733 | | | 128,442,087 |
Carnival PLC | | | 2,680,143 | | | 128,214,178 |
GlaxoSmithKline plc | | | 6,113,854 | | | 162,780,298 |
HSBC Holdings PLC | | | 3,543,529 | | | 64,655,432 |
HSBC Holdings PLC (Hong Kong Line) | | | 5,278,200 | | | 96,273,382 |
Kingfisher PLC | | | 45,858,002 | | | 210,577,189 |
Vodafone Group Plc | | | 3,391,251 | | | 7,762,399 |
William Morrison Supermarkets PLC | | | 46,677,731 | | | 212,593,394 |
| | | | | | |
| | | | | | 1,131,317,829 |
| | | | | | |
Total common and preferred stocks
(Cost $10,536,661,602) | | | 13,827,780,620 |
| | | Par Amount | | |
| SHORT-TERM INVESTMENTS (CASH EQUIVALENTS) - 0.5% | | | |
Repurchase agreement with Fixed Income Clearing Corporation, 5.00%, dated 9/29/06, due 10/2/06, maturity value $64,295,779, collateralized by $65,554,913 market value Federal National Mortgage Association Note,
5.35%, due 9/5/08
(Cost $64,269,000) | | $ | 64,269,000 | | | 64,269,000 |
| | | | | | |
| | | | | | |
Total investments - 99.8%
(Cost $10,600,930,602) | | | | | | 13,892,049,620 |
| | | | | | |
Other assets less liabilities - 0.2% | | | 25,802,770 |
| | | | | | |
| | | | | | |
Total net assets - 100.0%(5) | | | | | $ | 13,917,852,390 |
| | | | | | |
| (1) | Non-income producing security. |
| (2) | Represents less than 0.1% of total net assets. |
| (3) | Affiliated company as defined by the Investment Company Act of 1940. See Note (6) in Notes to Financial Statements. |
| (4) | Valued at a fair value in accordance with procedures established by the Board of Directors of Artisan Funds. In total, securities valued at a fair value were $143,192,825 or 1.0% of total net assets. |
| (5) | Percentages for the various classifications relate to total net assets. |
(ADR) American Depository Receipt
(GDR) Global Depository Receipt
14
FOURTEEN
| | | | | | |
| PORTFOLIO DIVERSIFICATION - SEPTEMBER 30, 2006 | |
| | | Value | | Percentage
of Total
Net Assets | |
Consumer Discretionary | | $ | 1,635,764,663 | | 11.8 | % |
Consumer Staples | | | 1,367,905,731 | | 9.8 | |
Energy | | | 911,282,242 | | 6.5 | |
Financials | | | 5,187,950,021 | | 37.3 | |
Healthcare | | | 798,295,567 | | 5.7 | |
Industrials | | | 1,512,791,042 | | 10.9 | |
Information Technology | | | 674,708,142 | | 4.8 | |
Materials | | | 1,388,067 | | 0.0 | (1) |
Telecommunication Services | | | 664,668,132 | | 4.8 | |
Utilities | | | 1,073,027,013 | | 7.7 | |
| | | | | | |
Total common and preferred stocks | | | 13,827,780,620 | | 99.3 | |
Short-term investments | | | 64,269,000 | | 0.5 | |
| | | | | | |
Total investments | | | 13,892,049,620 | | 99.8 | |
Other assets less liabilities | | | 25,802,770 | | 0.2 | |
| | | | | | |
Total net assets | | $ | 13,917,852,390 | | 100.0 | % |
| | | | | | |
| (1) | Represents less than 0.1% of total net assets. |
| | | | | | |
| CURRENCY EXPOSURE - SEPTEMBER 30, 2006 | |
| | | Value | | Percentage
of Total
Investments | |
Australian dollar | | $ | 223,887,163 | | 1.6 | % |
British pound | | | 1,035,044,447 | | 7.4 | |
Canadian dollar | | | 124,642,529 | | 0.9 | |
Danish krone | | | 52,899,394 | | 0.4 | |
Euro | | | 4,508,377,027 | | 32.5 | |
Hong Kong dollar | | | 914,267,177 | | 6.6 | |
Indonesian rupiah | | | 3,064,841 | | 0.0 | (1) |
Japanese yen | | | 3,118,453,577 | | 22.4 | |
Mexican peso | | | 165,978,234 | | 1.2 | |
Norwegian krone | | | 270,880,532 | | 1.9 | |
Singapore dollar | | | 350,366,088 | | 2.5 | |
South African rand | | | 8,159,308 | | 0.1 | |
South Korean won | | | 648,920,041 | | 4.7 | |
Swiss franc | | | 1,716,825,031 | | 12.4 | |
US dollar | | | 750,284,231 | | 5.4 | |
| | | | | | |
Total investments | | $ | 13,892,049,620 | | 100.0 | % |
| | | | | | |
| (1) | Represents less than 0.1% of total investments. |
The accompanying notes are an integral part of the financial statements.
15
FIFTEEN
ARTISAN MID CAP FUND
Schedule of Investments – September 30, 2006
| | | | | |
| | | | | |
| | | Shares
Held | | Value |
| COMMON STOCKS - 97.5% | | | | | |
| | | | | |
| AUTO & TRANSPORTATION - 2.1% | | | |
Air Transport - 0.5% | | | | | |
Expeditors International of Washington, Inc. | | 658,800 | | $ | 29,369,304 |
| | | | | |
Auto Parts: Original Equipment - 1.0% | | | |
BorgWarner Inc. | | 952,600 | | | 54,460,142 |
| | | | | |
Transportation Miscellaneous - 0.6% | | | |
C.H. Robinson Worldwide, Inc. | | 722,000 | | | 32,186,760 |
| | | | | |
| CONSUMER DISCRETIONARY -16.6% | | | |
Advertising Agencies - 0.7% | | | |
Clear Channel Outdoor Holdings, Inc., Class A(1) | | 1,916,500 | | | 39,096,600 |
| | | | | |
Consumer Electronics - 4.7% | | | |
Electronic Arts Inc.(1) | | 2,483,600 | | | 138,286,848 |
Harman International Industries, Incorporated | | 330,600 | | | 27,585,264 |
VeriSign, Inc.(1) | | 1,255,700 | | | 25,365,140 |
Yahoo! Inc.(1) | | 2,361,900 | | | 59,708,832 |
| | | | | |
| | | | | 250,946,084 |
Education Services - 0.1% | | | | | |
Laureate Education, Inc.(1) | | 109,200 | | | 5,226,312 |
| | | | | |
Radio & TV Broadcasters - 0.1% | | | |
XM Satellite Radio Holdings Inc., Class A(1) | | 559,800 | | | 7,215,822 |
| | | | | |
Restaurants - 1.2% | | | | | |
YUM! Brands, Inc. | | 1,232,500 | | | 64,151,625 |
| | | | | |
Retail - 5.3% | | | | | |
Amazon.com, Inc.(1) | | 1,917,000 | | | 61,574,040 |
Chico’s FAS, Inc.(1) | | 3,457,068 | | | 74,430,674 |
Kohl’s Corporation(1) | | 862,100 | | | 55,967,532 |
The TJX Companies, Inc. | | 3,217,000 | | | 90,172,510 |
| | | | | |
| | | | | 282,144,756 |
Services: Commercial - 2.7% | | | |
Getty Images, Inc.(1) | | 809,600 | | | 40,220,928 |
Iron Mountain Incorporated (1) | | 1,144,050 | | | 49,125,507 |
Monster Worldwide, Inc.(1) | | 784,500 | | | 28,391,055 |
Robert Half International Inc. | | 843,605 | | | 28,657,262 |
| | | | | |
| | | | | 146,394,752 |
| | | | | |
| | | | | |
| | | Shares
Held | | Value |
| CONSUMER DISCRETIONARY (CONTINUED) | | | |
Textiles Apparel Manufacturers - 1.2% | | | |
Polo Ralph Lauren Corporation, Class A | | 1,029,800 | | $ | 66,617,762 |
| | | | | |
Toys - 0.6% | | | | | |
Marvel Entertainment, Inc. (1)(2) | | 1,361,100 | | | 32,856,954 |
| | | | | |
| CONSUMER STAPLES - 2.2% | | | | | |
Beverage: Brewers (Wineries) - 1.4% | | | |
Constellation Brands, Inc., Class A (1) | | 2,606,200 | | | 75,006,436 |
| | | | | |
Drug & Grocery Store Chains - 0.8% | | | |
Supervalu Inc. | | 1,454,500 | | | 43,125,925 |
| | | | | |
| FINANCIAL SERVICES - 16.2% | | | |
Banks: Outside New York City - 3.3% | | | |
Investors Financial Services Corp. | | 1,868,700 | | | 80,503,596 |
M&T Bank Corporation | | 249,600 | | | 29,942,016 |
Northern Trust Corporation | | 1,166,900 | | | 68,181,967 |
| | | | | |
| | | | | 178,627,579 |
Diversified Financial Services - 1.4% | | | |
CB Richard Ellis Group, Inc.(1) | | 1,608,200 | | | 39,561,720 |
Greenhill & Co., Inc. | | 543,800 | | | 36,445,476 |
| | | | | |
| | | | | 76,007,196 |
Financial Data Processing
Services & Systems - 3.2% | | | |
Alliance Data Systems Corporation(1) | | 1,568,900 | | | 86,587,591 |
CheckFree Corporation(1) | | 1,722,800 | | | 71,186,096 |
Paychex, Inc. | | 435,100 | | | 16,033,435 |
| | | | | |
| | | | | 173,807,122 |
Financial Information Services - 2.2% | | | |
Equifax Inc. | | 2,604,800 | | | 95,622,208 |
Moody’s Corporation | | 372,900 | | | 24,380,202 |
| | | | | |
| | | | | 120,002,410 |
Financial Miscellaneous - 2.0% | | | |
MGIC Investment Corporation | | 1,778,700 | | | 106,668,639 |
| | | | | |
Insurance: Multi-Line - 1.8% | | | |
Aon Corporation | | 1,535,100 | | | 51,993,837 |
CIGNA Corporation | | 370,300 | | | 43,073,296 |
| | | | | |
| | | | | 95,067,133 |
16
SIXTEEN
| | | | | |
| | | | | |
| | | Shares
Held | | Value |
| FINANCIAL SERVICES (CONTINUED) | | | |
Insurance: Property-Casualty - 0.5% | | | |
W. R. Berkley Corporation | | 764,500 | | $ | 27,055,655 |
| | | | | |
Securities Brokerage & Services - 1.8% | | | |
The Bear Stearns Companies Inc. | | 307,000 | | | 43,010,700 |
Investment Technology Group, Inc.(1) | | 352,100 | | | 15,756,475 |
Nuveen Investments, Inc. | | 705,000 | | | 36,117,150 |
| | | | | |
| | | | | 94,884,325 |
| HEALTHCARE - 17.5% | | | | | |
Biotechnology Research & Production - 2.0% |
Celgene Corporation(1) | | 1,105,800 | | | 47,881,140 |
Millipore Corporation(1) | | 933,200 | | | 57,205,160 |
| | | | | |
| | | | | 105,086,300 |
Drugs & Pharmaceuticals - 4.2% | | | |
Allergan, Inc. | | 1,212,900 | | | 136,584,669 |
Hospira, Inc.(1) | | 1,106,200 | | | 42,334,274 |
MedImmune, Inc.(1) | | 1,160,400 | | | 33,895,284 |
Shire PLC (ADR)(3) | | 279,000 | | | 13,779,810 |
| | | | | |
| | | | | 226,594,037 |
Electronics: Medical Systems - 0.8% | | | |
Varian Medical Systems, Inc.(1) | | 809,500 | | | 43,219,205 |
| | | | | |
Health Care Management Services - 1.7% |
Cerner Corporation(1) | | 2,038,700 | | | 92,556,980 |
| | | | | |
Medical & Dental Instruments &
Supplies - 7.1% |
Fisher Scientific International Inc.(1) | | 2,627,600 | | | 205,583,424 |
Gen-Probe Incorporated(1) | | 763,700 | | | 35,809,893 |
Patterson Companies, Inc.(1) | | 1,998,800 | | | 67,179,668 |
Ventana Medical Systems, Inc.(1) | | 950,200 | | | 38,796,666 |
Zimmer Holdings, Inc. (1) | | 525,100 | | | 35,444,250 |
| | | | | |
| | | | | 382,813,901 |
Medical Services - 1.7% | | | | | |
Coventry Health Care, Inc.(1) | | 1,734,300 | | | 89,351,136 |
| | | | | |
| MATERIALS & PROCESSING - 6.1% | | | |
Agriculture Fishing & Ranching - 1.1% | | | |
Bunge Limited | | 1,046,800 | | | 60,662,060 |
| | | | | |
Chemicals - 1.2% | | | | | |
Ecolab Inc. | | 1,544,100 | | | 66,118,362 |
| | | | | |
Engineering & Contracting Services - 0.6% |
Quanta Services, Inc. (1) | | 1,854,600 | | | 31,268,556 |
| | | | | |
| | | | | |
| | | Shares
Held | | Value |
| MATERIALS & PROCESSING (CONTINUED) | | | |
Metal Fabricating - 1.9% | | | | | |
Precision Castparts Corp. | | 1,612,000 | | $ | 101,813,920 |
| | | | | |
Real Estate - 1.3% | | | | | |
The St. Joe Company | | 1,224,700 | | | 67,199,289 |
| | | | | |
| OTHER - 3.1% | | | | | |
Multi-Sector Companies - 3.1% | | | |
ITT Industries, Inc. | | 927,000 | | | 47,527,290 |
McDermott International, Inc.(1) | | 2,825,650 | | | 118,112,170 |
| | | | | |
| | | | | 165,639,460 |
| OTHER ENERGY - 4.8% | | | | | |
Coal - 0.8% | | | | | |
CONSOL Energy Inc. | | 1,315,700 | | | 41,747,161 |
| | | | | |
Machinery: Oil Well Equipment
& Services - 4.0% |
Cameron International Corporation(1) | | 1,510,100 | | | 72,952,931 |
Dresser-Rand Group Inc.(1) | | 2,031,700 | | | 41,446,680 |
Helix Energy Solutions Group, Inc.(1) | | 789,000 | | | 26,352,600 |
Smith International, Inc. | | 1,951,900 | | | 75,733,720 |
| | | | | |
| | | | | 216,485,931 |
| PRODUCER DURABLES - 5.5% | | | |
Diversified Production - 1.2% | | | |
Danaher Corporation | | 959,600 | | | 65,895,732 |
| | | | | |
Electrical Equipment & Components - 1.7% | | | |
Cooper Industries, Ltd., Class A | | 1,063,500 | | | 90,631,470 |
| | | | | |
Identification Control & Filter Devices - 1.4% | | | | | |
Roper Industries, Inc. | | 1,618,800 | | | 72,425,112 |
| | | | | |
Machinery: Industrial/Specialty - 1.0% | | | |
Joy Global Inc. | | 1,378,413 | | | 51,842,113 |
| | | | | |
Telecommunications Equipment - 0.2% | | | |
American Tower Corporation(1) | | 251,000 | | | 9,161,500 |
| | | | | |
| TECHNOLOGY - 19.9% | | | | | |
Communications Technology - 3.2% | | | |
Corning Incorporated(1) | | 1,731,400 | | | 42,263,474 |
Juniper Networks, Inc.(1) | | 6,722,000 | | | 116,156,160 |
Tellabs, Inc.(1) | | 1,190,900 | | | 13,052,264 |
| | | | | |
| | | | | 171,471,898 |
17
SEVENTEEN
| | | | | |
| | | | | |
| | | Shares
Held | | Value |
| TECHNOLOGY (CONTINUED) | | | | | |
Computer Services Software
& Systems - 3.5% | | | |
Adobe Systems Incorporated(1) | | 2,166,454 | | $ | 81,133,702 |
Autodesk, Inc.(1) | | 1,827,100 | | | 63,546,538 |
Cadence Design Systems, Inc.(1) | | 1,773,000 | | | 30,070,080 |
The Western Union Company(1) | | 544,800 | | | 10,422,024 |
| | | | | |
| | | | | 185,172,344 |
Computer Technology - 3.2% | | | |
Intermec, Inc.(1)(2) | | 3,374,500 | | | 88,951,820 |
Network Appliance, Inc.(1) | | 1,227,300 | | | 45,422,373 |
SanDisk Corporation(1) | | 691,400 | | | 37,017,556 |
| | | | | |
| | | | | 171,391,749 |
Electronics - 0.9% | | | | | |
Avid Technology, Inc.(1) | | 1,337,600 | | | 48,715,392 |
| | | | | |
Electronics: Semi-Conductors/
Components - 6.9% | | | |
Advanced Micro Devices, Inc.(1) | | 3,385,500 | | | 84,129,675 |
Broadcom Corporation, Class A (1) | | 1,932,200 | | | 58,622,948 |
Freescale Semiconductor, Inc., Class A(1) | | 3,461,500 | | | 131,710,075 |
Integrated Device Technology, Inc.(1) | | 1,729,600 | | | 27,777,376 |
Jabil Circuit, Inc. | | 1,139,200 | | | 32,546,944 |
Linear Technology Corporation | | 783,900 | | | 24,394,968 |
Maxim Integrated Products, Inc. | | 359,200 | | | 10,082,744 |
| | | | | |
| | | | | 369,264,730 |
Electronics: Technology - 2.2% | | | |
Rockwell Automation, Inc. | | 1,192,700 | | | 69,295,870 |
Trimble Navigation Limited (1) | | 998,500 | | | 47,009,380 |
| | | | | |
| | | | | 116,305,250 |
| UTILITIES - 3.5% | | | | | |
Utilities: Gas Distributors - 1.1% | | | |
Kinder Morgan, Inc. | | 584,700 | | | 61,305,795 |
| | | | | |
Utilities: Telecommunications - 2.4% | | | |
Level 3 Communications, Inc.(1) | | 6,347,700 | | | 33,960,195 |
NII Holdings, Inc.(1) | | 1,559,600 | | | 96,944,736 |
| | | | | |
| | | | | 130,904,931 |
| | | | | |
Total common stocks
(Cost $4,271,596,242) | | | | | 5,235,963,607 |
| | | | | | |
| | | | | | |
| | | Par Amount | | Value |
SHORT-TERM INVESTMENTS
(CASH EQUIVALENTS) - 1.3% | | | |
Repurchase agreement with Fixed Income Clearing Corporation, 5.00%, dated 9/29/06, due 10/2/06, maturity value $70,518,370, collateralized by $71,901,900 market value Federal National Mortgage Association Note, 4.84%, due 6/22/07
(Cost $70,489,000) | | $ | 70,489,000 | | $ | 70,489,000 |
| | | | | | |
| | | | | | |
Total investments - 98.8%
(Cost $4,342,085,242) | | | | | | 5,306,452,607 |
| | | | | | |
Other assets less liabilities - 1.2% | | | | | | 63,342,238 |
| | | | | | |
| | | | | | |
Total net assets - 100.0%(4) | | | | | $ | 5,369,794,845 |
| | | | | | |
| (1) | Non-income producing security. |
| (2) | Affiliated company as defined by the Investment Company Act of 1940. See Note (6) in Notes to Financial Statements. |
| (3) | The Fund considers the issuer to be from the United Kingdom. See the Fund’s Statement of Additional Information for information on how a particular country is assigned. The security trades on a U.S. exchange. |
| (4) | Percentages for the various classifications relate to total net assets. |
(ADR) American Depository Receipt
The accompanying notes are an integral part of the financial statements.
18
EIGHTEEN
[THIS PAGE INTENTIONALLY LEFT BLANK]
19
NINETEEN
ARTISAN FUNDS, INC.
Statements of Assets and Liabilities – September 30, 2006
| | | | | | | | | | |
| | | EMERGING MARKETS | | INTERNATIONAL | | MID CAP | |
| ASSETS: | | | | | | | | | | |
Investments in securities, unaffiliated, at value | | $ | 5,813,768 | | $ | 13,241,588,441 | | $ | 5,114,154,833 | |
Investments in securities, affiliated, at value | | | - | | | 586,192,179 | | | 121,808,774 | |
Short-term investments (repurchase agreements), at value | | | 154,000 | | | 64,269,000 | | | 70,489,000 | |
| | | | | | | | | | |
Total investments | | | 5,967,768 | | | 13,892,049,620 | | | 5,306,452,607 | |
Cash | | | 192 | | | 820 | | | 9,633,867 | |
Foreign currency | | | 45,808 | | | 2,154 | | | - | |
Net unrealized gain on foreign currency forward contracts | | | - | | | 329,887 | | | - | |
Receivable from investments sold | | | 88,387 | | | 79,594,308 | | | 102,707,075 | |
Receivable from fund shares sold | | | - | | | 23,942,073 | | | 11,289,333 | |
Dividends and interest receivable | | | 3,701 | | | 27,383,738 | | | 1,400,483 | |
Receivable from Adviser | | | 89,583 | | | - | | | - | |
Other assets | | | - | | | 48,814 | | | 22,438 | |
| | | | | | | | | | |
Total assets | | | 6,195,439 | | | 14,023,351,414 | | | 5,431,505,803 | |
| | | |
| LIABILITIES: | | | | | | | | | | |
Due to custodian | | | - | | | 8,736 | | | - | |
Net unrealized loss on foreign currency forward contracts | | | 69 | | | - | | | - | |
Payable for investments purchased | | | 199,683 | | | 55,250,153 | | | 40,083,364 | |
Payable for fund shares redeemed | | | - | | | 44,934,381 | | | 19,231,551 | |
Payable for operating expenses | | | 94,605 | | | 4,146,580 | | | 2,373,605 | |
Payable for withholding taxes | | | 4,304 | | | 1,110,360 | | | - | |
Payable for advisory fees | | | 15,218 | | | - | | | - | |
Payable for deferred directors’ compensation | | | - | | | 48,814 | | | 22,438 | |
| | | | | | | | | | |
Total liabilities | | | 313,879 | | | 105,499,024 | | | 61,710,958 | |
| | | | | | | | | | |
Total net assets | | $ | 5,881,560 | | $ | 13,917,852,390 | | $ | 5,369,794,845 | |
| | | | | | | | | | |
| NET ASSETS CONSIST OF: | | | | | | | | | | |
Fund shares issued and outstanding | | $ | 5,310,000 | | $ | 9,590,824,737 | | $ | 3,855,711,699 | |
Net unrealized appreciation on investments and foreign currency related transactions | | | 439,060 | | | 3,291,049,672 | | | 964,367,365 | |
Accumulated undistributed net investment income (loss) | | | 5,628 | | | 29,515,834 | | | (21,602 | ) |
Accumulated undistributed net realized gains on investments and foreign currency related transactions | | | 126,872 | | | 1,006,462,147 | | | 549,737,383 | |
| | | | | | | | | | |
| | $ | 5,881,560 | | $ | 13,917,852,390 | | $ | 5,369,794,845 | |
| | | | | | | | | | |
| SUPPLEMENTARY INFORMATION: | | | | | | | | | | |
Net assets | | | | | | | | | | |
Investor Shares | | | | | $ | 9,801,901,102 | | $ | 4,571,943,921 | |
Institutional Shares | | $ | 5,881,560 | | $ | 4,115,951,288 | | $ | 797,850,924 | |
Shares outstanding (Indefinite number of shares authorized, $0.01 par value) | | | | | | | | | | |
Investor Shares | | | | | | 340,979,133 | | | 143,892,332 | |
Institutional Shares | | | 527,411 | | | 142,327,678 | | | 24,743,515 | |
Net asset value, offering price and redemption price per share | | | | | | | | | | |
Investor Shares | | | | | $ | 28.75 | | $ | 31.77 | |
Institutional Shares | | $ | 11.15 | | $ | 28.92 | | $ | 32.24 | |
Cost of securities of unaffiliated issuers held | | $ | 5,524,705 | | $ | 10,076,689,841 | | $ | 4,225,259,546 | |
Cost of securities of affiliated issuers held | | $ | - | | $ | 524,240,761 | | $ | 116,825,696 | |
Cost of foreign currency | | $ | 45,860 | | $ | 2,155 | | $ | - | |
The accompanying notes are an integral part of the financial statements.
20
TWENTY
ARTISAN FUNDS, INC.
Statements of Operations – For the Year Ended September 30, 2006
| | | | | | | | | | | | |
| | | EMERGING MARKETS(1) | | | INTERNATIONAL | | | MID CAP | |
| INVESTMENT INCOME: | | | | | | | | | | | | |
Dividends, from unaffiliated issuers(2) | | $ | 32,788 | | | $ | 218,179,489 | | | $ | 29,084,314 | |
Dividends, from affiliated issuers(2) | | | - | | | | 3,784,632 | | | | - | |
Interest | | | 2,994 | | | | 7,993,511 | | | | 7,956,585 | |
Securities lending | | | - | | | | 6,715,340 | | | | - | |
| | | | | | | | | | | | |
Total investment income | | | 35,782 | | | | 236,672,972 | | | | 37,040,899 | |
| | | |
| EXPENSES: | | | | | | | | | | | | |
Advisory fees | | | 15,218 | | | | 118,863,237 | | | | 54,380,280 | |
Transfer agent fees | | | | | | | | | | | | |
Investor Shares | | | | | | | 16,849,603 | | | | 10,619,145 | |
Institutional Shares | | | 5,558 | | | | 25,859 | | | | 22,205 | |
Shareholder communications | | | | | | | | | | | | |
Investor Shares | | | | | | | 970,004 | | | | 784,461 | |
Institutional Shares | | | 5,089 | | | | 52,210 | | | | 16,402 | |
Custodian fees | | | 10,289 | | | | 6,994,690 | | | | 194,722 | |
Accounting fees | | | 9,453 | | | | 77,000 | | | | 65,475 | |
Professional fees | | | 35,415 | | | | 588,272 | | | | 194,929 | |
Less insurance recoveries(3) | | | - | | | | (197,947 | ) | | | - | |
| | | | | | | | | | | | |
Net professional fees | | | 35,415 | | | | 390,325 | | | | 194,929 | |
Registration fees | | | | | | | | | | | | |
Investor Shares | | | | | | | 163,419 | | | | 72,229 | |
Institutional Shares | | | 26,131 | | | | 20,515 | | | | 16,408 | |
Directors’ fees | | | 1,500 | | | | 364,703 | | | | 171,194 | |
Other operating expenses | | | 1,170 | | | | 633,152 | | | | 121,284 | |
| | | | | | | | | | | | |
Total operating expenses before amounts waived or paid by the Adviser or the Board of Directors | | | 109,823 | | | | 145,404,717 | | | | 66,658,734 | |
Less amounts waived or paid by the Adviser or the Board of Directors | | | (89,583 | ) | | | - | | | | - | |
| | | | | | | | | | | | |
Net expenses | | | 20,240 | | | | 145,404,717 | | | | 66,658,734 | |
| | | | | | | | | | | | |
Net investment income (loss) | | | 15,542 | | | | 91,268,255 | | | | (29,617,835 | ) |
| | | |
NET REALIZED AND UNREALIZED GAINS (LOSSES) ON
INVESTMENTS: | | | | | | | | | | | | |
Net realized gain (loss) on: | | | | | | | | | | | | |
Investments(2) | | | 126,872 | | | | 1,705,050,798 | | | | 701,530,781 | |
Foreign currency related transactions | | | (9,914 | ) | | | (3,919,900 | ) | | | - | |
| | | | | | | | | | | | |
| | | 116,958 | | | | 1,701,130,898 | | | | 701,530,781 | |
Net increase (decrease) in unrealized appreciation or depreciation on: | | | | | | | | | | | | |
Investments | | | 443,063 | | | | 485,434,611 | | | | (251,537,673 | ) |
Foreign currency related transactions | | | (4,003 | ) | | | 249,502 | | | | - | |
| | | | | | | | | | | | |
| | | 439,060 | | | | 485,684,113 | | | | (251,537,673 | ) |
| | | | | | | | | | | | |
Net gain on investments and foreign currency related transactions | | | 556,018 | | | | 2,186,815,011 | | | | 449,993,108 | |
| | | | | | | | | | | | |
Net increase in net assets resulting from operations | | $ | 571,560 | | | $ | 2,278,083,266 | | | $ | 420,375,273 | |
| | | | | | | | | | | | |
| (1) | For the period from commencement of operations (June 26, 2006) through September 30, 2006. |
| | | | | | |
| (2) Fund | | Net of foreign taxes
withheld on dividends,
unaffiliated issuers | | Net of foreign taxes
withheld on dividends,
affiliated issuers | | Including net realized
gain on investments
from affiliated issuers |
Emerging Markets | | $ 6,067 | | $ - | | $ - |
International | | 25,092,580 | | 284,865 | | 14,037,874 |
Mid Cap | | 1,033 | | - | | 2,644,667 |
| (3) | For the year ended September 30, 2006, the International Fund incurred $588,272 in total professional fees. As described in Note (9) in Notes to Financial Statements, $197,947 in insurance recoveries were received relating to reimbursement of litigation defense costs, and were recorded as a reduction to professional fees during the year ended September 30, 2006. |
The accompanying notes are an integral part of the financial statements.
21
TWENTY-ONE
ARTISAN FUNDS, INC.
Statements of Changes in Net Assets
| | | | | | | | | | | | |
| | | EMERGING MARKETS | | | INTERNATIONAL | |
| | | Period Ended
9/30/2006(1) | | | Year Ended
9/30/2006 | | | Year Ended
9/30/2005 | |
| OPERATIONS: | | | | | | | | | | | | |
Net investment income (loss) | | $ | 15,542 | | | $ | 91,268,255 | | | $ | 109,690,495 | |
Net realized gain (loss) on: | | | | | | | | | | | | |
Investments | | | 126,872 | | | | 1,705,050,798 | | | | 951,444,475 | |
Foreign currency related transactions | | | (9,914 | ) | | | (3,919,900 | ) | | | (4,798,062 | ) |
Net increase (decrease) in unrealized appreciation or depreciation on: | | | | | | | | | | | | |
Investments | | | 443,063 | | | | 485,434,611 | | | | 1,532,135,303 | |
Foreign currency related transactions | | | (4,003 | ) | | | 249,502 | | | | (380,101 | ) |
| | | | | | | | | | | | |
Net increase in net assets resulting from operations | | | 571,560 | | | | 2,278,083,266 | | | | 2,588,092,110 | |
| | | |
| DISTRIBUTIONS PAID TO SHAREHOLDERS: | | | | | | | | | | | | |
Net investment income: | | | | | | | | | | | | |
Investor Shares | | | | | | | (129,259,160 | ) | | | (39,392,658 | ) |
Institutional Shares | | | - | | | | (71,446,014 | ) | | | (29,943,284 | ) |
Net realized gains on investment transactions: | | | | | | | | | | | | |
Investor Shares | | | | | | | - | | | | - | |
Institutional Shares | | | - | | | | - | | | | - | |
| | | | | | | | | | | | |
Total distributions paid to shareholders | | | - | | | | (200,705,174 | ) | | | (69,335,942 | ) |
| | | |
| FUND SHARE ACTIVITIES: | | | | | | | | | | | | |
Net increase (decrease) in net assets resulting from fund share activities | | | 5,310,000 | | | | 165,474,731 | | | | (596,036,624 | ) |
| | | | | | | | | | | | |
Total increase (decrease) in net assets | | | 5,881,560 | | | | 2,242,852,823 | | | | 1,922,719,544 | |
Net assets, beginning of period | | | - | | | | 11,674,999,567 | | | | 9,752,280,023 | |
| | | | | | | | | | | | |
Net assets, end of period | | $ | 5,881,560 | | | $ | 13,917,852,390 | | | $ | 11,674,999,567 | |
| | | | | | | | | | | | |
| | | | | | | | | | | | |
Accumulated undistributed net investment income (loss) | | $ | 5,628 | | | $ | 29,515,834 | | | $ | 104,696,688 | |
| | | | | | | | | | | | |
| (1) | For the period from commencement of operations (June 26, 2006) through September 30, 2006. |
22
TWENTY-TWO
| | | | | | | | | | | | | | |
| MID CAP | | | | | | | | | |
Year Ended
9/30/2006 | | | Year Ended
9/30/2005 | | | | | | | | | |
| | | | | | | | | | | | | | |
| $ | (29,617,835 | ) | | $ | (34,016,944 | ) | | | | | | | | |
| | | | | | | | | | | | | | |
| | 701,530,781 | | | | 344,210,655 | | | | | | | | | |
| | - | | | | - | | | | | | | | | |
| | | | | | | | | | | | | | |
| | (251,537,673 | ) | | | 617,698,766 | | | | | | | | | |
| | - | | | | - | | | | | | | | | |
| | | | | | | | | | | | | | | |
| | 420,375,273 | | | | 927,892,477 | | | | | | | | | |
| | | | | |
| | | | | | | | | | | | | | |
| | | | | | | | | | | | | | |
| | - | | | | - | | | | | | | | | |
| | - | | | | - | | | | | | | | | |
| | | | | | | | | | | | | | |
| | (209,469,474 | ) | | | - | | | | | | | | | |
| | (41,213,795 | ) | | | - | | | | | | | | | |
| | | | | | | | | | | | | | | |
| | (250,683,269 | ) | | | - | | | | | | | | | |
| | | | | |
| | | | | | | | | | | | | | |
| | (655,280,963 | ) | | | (151,207,182 | ) | | | | | | | | |
| | | | | | | | | | | | | | | |
| | (485,588,959 | ) | | | 776,685,295 | | | | | | | | | |
| | 5,855,383,804 | | | | 5,078,698,509 | | | | | | | | | |
| | | | | | | | | | | | | | | |
| $ | 5,369,794,845 | | | $ | 5,855,383,804 | | | | | | | | | |
| | | | | | | | | | | | | | | |
| | | | | | | | | | | | | | |
| $ | (21,602 | ) | | $ | - | | | | | | | | | |
| | | | | | | | | | | | | | | |
The accompanying notes are an integral part of the financial statements.
23
TWENTY-THREE
ARTISAN FUNDS, INC.
Financial Highlights – For a share outstanding throughout each period
The financial highlights table is intended to help you understand the Funds’ financial performance for the past 5 years or, if shorter, the period of a Fund’s operations. Certain information reflects financial results for a single Fund share. The total returns in the table represent the rate that an investor would have earned or lost on an investment in the Fund (assuming reinvestment of all dividends and distributions). This information has been audited by Ernst & Young LLP, whose report, along with each Fund’s financial statements, is included in this annual report. The financial highlights of the Funds for the periods ended prior to September 30, 2003 were audited by other auditors.
| | | | | | | | | | | | | | | | | | | | | | | | |
Year or
Period
Ended | | |
Net Asset
Value
Beginning
of Period | | Net
Investment
Income(1) | | | Net Realized
and Unrealized
Gain (Loss) on
Investments | | | Total Income
(Loss) from
Investment
Operations | | | Dividends
from Net
Investment
Income | | | Distributions
from Net
Realized
Gains | |
| | | | | | | | | | | | | | | | | | | | | | | | |
| ARTISAN EMERGING MARKETS FUND | | | | | | | | | | | | | | | | | |
| Institutional Shares | | | | | | | | | | | | | | | | | | | | | | | | |
| 9/30/2006 | (5) | | $ | 10.00 | | $ | 0.03 | | | $ | 1.12 | | | $ | 1.15 | | | $ | - | | | $ | - | |
| | | | | | | | | | | | | | | | | | | | | | | | |
| ARTISAN INTERNATIONAL FUND | | | | | | | | | | | | | | | | | |
| Institutional Shares | | | | | | | | | | | | | | | | | | | | | | | | |
| 9/30/2006 | | | $ | 24.54 | | $ | 0.22 | | | $ | 4.62 | | | $ | 4.84 | | | $ | (0.46 | ) | | $ | - | |
| 9/30/2005 | | | | 19.44 | | | 0.25 | | | | 5.01 | | | | 5.26 | | | | (0.16 | ) | | | - | |
| 9/30/2004 | | | | 16.63 | | | 0.16 | | | | 2.86 | | | | 3.02 | | | | (0.21 | ) | | | - | |
| 9/30/2003 | (6) | | | 15.71 | | | 0.03 | | | | 0.89 | | | | 0.92 | | | | - | | | | - | |
| 6/30/2003 | | | | 18.24 | | | 0.25 | | | | (2.65 | ) | | | (2.40 | ) | | | (0.13 | ) | | | - | |
| 6/30/2002 | | | | 19.62 | | | 0.18 | | | | (1.46 | ) | | | (1.28 | ) | | | (0.10 | ) | | | - | |
| | | | | | | | | | | | | | | | | | | | | | | | |
| ARTISAN MID CAP FUND | | | | | | | | | | | | | | | | | |
| Institutional Shares | | | | | | | | | | | | | | | | | | | | | | | | |
| 9/30/2006 | | | $ | 31.21 | | $ | (0.10 | ) | | $ | 2.46 | | | $ | 2.36 | | | $ | - | | | $ | (1.33 | ) |
| 9/30/2005 | | | | 26.38 | | | (0.12 | ) | | | 4.95 | | | | 4.83 | | | | - | | | | - | |
| 9/30/2004 | | | | 23.28 | | | (0.14 | ) | | | 3.24 | | | | 3.10 | | | | - | | | | - | |
| 9/30/2003 | (6) | | | 21.96 | | | (0.03 | ) | | | 1.35 | | | | 1.32 | | | | - | | | | - | |
| 6/30/2003 | | | | 22.24 | | | (0.07 | ) | | | (0.21 | )(7) | | | (0.28 | ) | | | - | | | | - | |
| 6/30/2002 | | | | 26.48 | | | (0.13 | ) | | | (4.11 | ) | | | (4.24 | ) | | | - | | | | - | |
| | | | | | | | | | | | | | | | | | | | | | | | |
| (1) | Computed based on average shares outstanding. |
| (2) | Periods less than twelve months (where applicable) are not annualized. |
| (3) | Periods less than twelve months (where applicable) are annualized. |
| (4) | The ratios of expenses to average net assets and net investment income (loss) to average net assets exclude expenses waived or paid by the Adviser or the Board of Directors. Absent expenses waived or paid by the Adviser or the Board of Directors, the ratios of expenses to average net assets and net investment income (loss) to average net assets would have been as follows: |
| | | | | | | | |
| | | Year or
Period Ended | | Ratio of Expenses to
Average Net Assets | | | Ratio of Net Investment Income
(Loss) to Average Net Assets | |
Emerging Markets Institutional Shares | | 9/30/2006 | | 7.58 | % | | (5.11 | )% |
International Institutional Shares | | 9/30/2003 | | 1.00 | | | 0.73 | |
Mid Cap Institutional Shares | | 9/30/2003 | | 0.98 | | | (0.59 | ) |
| (5) | For the period from commencement of operations (June 26, 2006) through September 30, 2006. |
| (6) | For the period from July 1, 2003 to September 30, 2003. Artisan Funds changed its fiscal year-end from June 30 to September 30 effective September 30, 2003. |
| (7) | The amount shown may not correlate with the aggregate gains and losses of portfolio securities due to the timing of subscriptions and redemptions of fund shares. |
24
TWENTY-FOUR
| | | | | | | | | | | | | | | | | | | | |
Total
Distributions | | | Net Asset
Value
End
of Period | | Total
Return(2) | | | Net Assets
End of
Period
(millions) | | Ratio of
Expenses
to Average
Net Assets(3)(4) | | | Ratio of Net
Investment
Income (Loss)
to Average
Net Assets(3)(4) | | | Portfolio
Turnover
Rate(2) | |
| | | | | | | | | | | | | | | | | | | | |
| | | | | | | | | | | | | | | | | |
| | | | | | | | | | | | | | | | | | | | | |
| $ | - | | | $ | 11.15 | | 11.50 | % | | $ | 5.9 | | 1.40 | % | | 1.07 | % | | 24.26 | % |
| | | | | | | | | | | | | | | | | | | | |
| | | | | | | | | | | | | | | | | |
| | | | | | | | | | | | | | | | | | | | | |
| $ | (0.46 | ) | | $ | 28.92 | | 20.07 | % | | $ | 4,116.0 | | 1.00 | % | | 0.82 | % | | 57.80 | % |
| | (0.16 | ) | | | 24.54 | | 27.21 | | | | 3,988.1 | | 0.99 | | | 1.11 | | | 56.15 | |
| | (0.21 | ) | | | 19.44 | | 18.31 | | | | 3,622.1 | | 1.01 | | | 0.85 | | | 54.96 | |
| | - | | | | 16.63 | | 5.86 | | | | 3,354.7 | | 1.00 | | | 0.73 | | | 15.23 | |
| | (0.13 | ) | | | 15.71 | | (13.09 | ) | | | 2,975.0 | | 1.01 | | | 1.68 | | | 37.13 | |
| | (0.10 | ) | | | 18.24 | | (6.52 | ) | | | 2,062.0 | | 1.01 | | | 1.01 | | | 50.67 | |
| | | | | | | | | | | | | | | | | | | | | |
| | | | | | | | | | | | | | | | | | | | | |
| | | | | | | | | | | | | | | | | | | | | |
| $ | (1.33 | ) | | $ | 32.24 | | 7.66 | % | | $ | 797.9 | | 0.95 | % | | (0.31 | )% | | 73.59 | % |
| | - | | | | 31.21 | | 18.35 | | | | 981.3 | | 0.95 | | | (0.40 | ) | | 83.00 | |
| | - | | | | 26.38 | | 13.27 | | | | 1,036.0 | | 0.96 | | | (0.54 | ) | | 101.09 | |
| | - | | | | 23.28 | | 6.06 | | | | 929.6 | | 0.98 | | | (0.59 | ) | | 26.52 | |
| | - | | | | 21.96 | | (1.26 | ) | | | 829.0 | | 1.00 | | | (0.36 | ) | | 102.85 | |
| | - | | | | 22.24 | | (16.04 | ) | | | 449.8 | | 1.02 | | | (0.56 | ) | | 121.14 | |
| | | | | | | | | | | | | | | | | | | | |
The accompanying notes are an integral part of the financial statements.
25
TWENTY-FIVE
ARTISAN FUNDS, INC.
Notes to Financial Statements – September 30, 2006
Artisan Funds, Inc. (“Artisan Funds”) was incorporated on January 5, 1995, as a Wisconsin corporation and is registered under the Investment Company Act of 1940, as amended. Artisan Funds is a series comprised of nine open-end, diversified mutual funds. The following funds (each a “Fund” and collectively the “Funds”) are covered by this report:
| | |
| Fund Name | | Inception Date |
Artisan Emerging Markets Fund (“Emerging Markets Fund” or “Emerging Markets”) | | June 26, 2006 |
Artisan International Fund (“International Fund” or “International”) | | December 28, 1995 |
Artisan Mid Cap Fund (“Mid Cap Fund” or “Mid Cap”) | | June 27, 1997 |
Each Fund’s investment objective is to seek long-term capital growth. Emerging Markets Fund offers shares of capital stock of only one class—Institutional Shares. International Fund and Mid Cap Fund offer shares of capital stock of two classes—Institutional Shares and Investor Shares—and have offered Investor Shares since the commencement of operations. International Fund and Mid Cap Fund began offering Institutional Shares on July 1, 1997 and July 1, 2000, respectively. Subsequent to the fiscal year ended September 30, 2006, International Value Fund began offering Institutional Shares on October 2, 2006. Institutional Shares are sold to institutional investors meeting certain minimum investment requirements.
Each class of shares of International Fund and MidCap Fund has equal rights with respect to portfolio assets and voting privileges. Each class has exclusive voting rights with respect to any matters involving only that class. Income, expenses not specific to either class and realized and unrealized gains and losses are allocated daily to each class of shares based upon the relative net asset value of outstanding shares. Expenses attributable to a particular class of shares, such as transfer agency fees, shareholder communication expenses and registration fees, are allocated directly to that class.
| (2) | Summary of significant accounting policies: |
The following is a summary of significant accounting policies of the Funds in effect during the period covered by the financial statements, which are in accordance with United States generally accepted accounting principles.
| | (a) | Security valuation – The net asset value (“NAV”) of the shares of each class of each Fund was determined as of the close of regular session trading on the New York Stock Exchange (“NYSE”) (usually 4:00 p.m., Eastern Time, but sometimes earlier) each day the NYSE was open for regular session trading. The NAV of each class of shares was determined by dividing the value of each Fund’s securities and other assets attributed to that class, less its liabilities attributed to that class, by the number of outstanding shares of that class of that Fund. |
26
TWENTY-SIX
NOTES TO FINANCIAL STATEMENTS
In determining NAV, each equity security traded on a securities exchange was valued at the closing price as of the time of valuation on the exchange or market on which the security was principally traded (the “principal exchange”). The closing price provided by each exchange may differ and may represent information such as last sales price, an official closing price, a closing auction price or other information, depending on exchange or market convention. Absent closing price information for a security from the principal exchange as of the time of valuation, the security was valued using the most recent bid quotation on the principal exchange, except that securities listed on the London Stock Exchange were valued at the mean of the most recent bid and asked quotations as of the time of valuation. Short-term investments maturing within sixty days of the valuation date were valued at amortized cost, which approximates market value.
Securities for which prices were not readily available were valued by Artisan Funds’ valuation committee (the “valuation committee”) at a fair value determined in good faith under procedures established by and under the general supervision of Artisan Funds’ Board of Directors (the “Board of Directors”). A price was considered to be not readily available if, among other things, the valuation committee believed that the price determined as described in the preceding paragraph did not reflect a fair value of the security.
Emerging Markets Fund and International Fund generally invest a significant portion, and perhaps as much as substantially all, of their total assets in securities principally traded in markets outside the U.S. Mid Cap Fund has the ability to invest in securities principally traded outside the U.S. The foreign markets in which the Funds may invest are sometimes open on days when the NYSE is not open and the Funds do not calculate their NAVs, and sometimes are not open on days when the Funds do calculate their NAVs. Even on days on which both the foreign market and the NYSE are open, several hours may have passed between the time when trading in the foreign market closed and the time as of which the Funds calculate their NAVs. That is generally the case for markets in Europe, Asia, Australia and other far eastern markets; the regular closing time of foreign markets in North and South America is generally the same as the closing time of the NYSE and the time as of which the Funds calculate their NAVs.
The valuation committee concluded that a price determined under the Funds’ valuation procedures was not readily available if, among other things, the valuation committee believed that the value of the security might have been materially affected by events occurring after the close of the market in which the security was principally traded but before the time for determination of NAV (“subsequent event”). A subsequent event might include a company-specific development (for example, announcement of a merger that is made
27
TWENTY-SEVEN
NOTES TO FINANCIAL STATEMENTS
after the close of the foreign market), a development that might affect an entire market or region (for example, imposition of foreign exchange controls by a foreign government), a potentially global development (such as a terrorist attack that may be expected to have an impact on investor expectations worldwide) or a significant change in one or more United States securities indexes. Artisan Funds monitored for subsequent events using several tools. An indication by any of those tools of a potential material change in the value of securities results in either a meeting of the valuation committee, which considers whether a subsequent event has occurred and whether local market closing prices continue to represent fair values for potentially affected non-U.S. securities, and/or a valuation based on information provided by a third party research service. The third party research service is used to assist in determining estimates of fair values for foreign securities. That service utilized statistical data based on historical performance of securities, markets and other data in developing factors used to estimate a fair value.
Estimates of fair values utilized by the Funds as described above may differ from the value realized on the sale of those securities and the differences may be material to the NAV of the applicable Fund or to the information presented.
There are certain risks involved in investing in foreign securities. These risks include those resulting from future adverse political, social, and economic developments, fluctuations in currency exchange rates, the possible imposition of exchange controls, and other foreign laws or restrictions. Investing in emerging markets may accentuate these risks.
| | (b) | Income taxes – No provision has been made for federal income taxes or excise taxes since each Fund intends to (i) comply with the provisions of Subchapter M of the Internal Revenue Code applicable to regulated investment companies and (ii) distribute to its shareholders substantially all of its taxable income as well as net realized gains from the sale of investment securities. The Funds may utilize earnings and profits distributed to shareholders on redemptions of Fund shares as part of the dividends paid deduction. |
| | (c) | Portfolio transactions – In determining a Fund’s NAV, security transactions and shareholder transactions are accounted for no later than one business day after trade date, in accordance with applicable law. However, for financial reporting purposes, security transactions and shareholder transactions are recorded on trade date in accordance with United States generally accepted accounting principles. Net realized gains and losses on securities are computed on specific security lot identification. |
28
TWENTY-EIGHT
NOTES TO FINANCIAL STATEMENTS
Certain countries impose taxes on realized gains on the sale of investment securities. The Funds record the foreign tax expense, if any, on an accrual basis. The taxes are included in “Payable for withholding taxes” on the Statement of Assets and Liabilities.
| | (d) | Foreign currency translation – Values of investments, open foreign currency forward contracts, payables for capital gains taxes and cash denominated in foreign currencies were translated into U.S. dollars using a spot market rate of exchange as of the time of determination of each Fund’s NAV on the day of valuation. Payables and receivables for securities transactions, dividend and reclaim receivables and other receivables and payables denominated in a foreign currency were translated into U.S. dollars using a spot market rate of exchange as of 12:00 p.m. (Eastern Time) on the day of valuation. Purchases and sales of investments and dividend and interest income are translated into U.S. dollars using a spot market rate of exchange as of 12:00 p.m. (Eastern Time) on the date of such transactions. The portion of security gains or losses resulting from changes in foreign exchange rates is included with net realized and unrealized gain or loss from investments, as appropriate, for both financial reporting and tax purposes. |
The Funds may enter into foreign currency forward contracts to hedge the foreign currency exposure on open payables and receivables. The foreign currency forward contracts are recorded at market value and any related realized and unrealized gains and losses are reported as foreign currency related transactions for financial reporting purposes. For tax purposes, these foreign exchange gains and losses are treated as ordinary income or loss. The Funds could be exposed to loss if the counterparties fail to perform under these contracts.
Other foreign currency related transaction gains and losses may result from the difference between the amounts of dividends and foreign withholding taxes recorded on the Funds’ books and the U.S. dollar equivalent of the amounts actually received or paid. The net increase (decrease) in unrealized appreciation or depreciation on foreign currency related transactions arises from changes in the values of assets and liabilities, other than investments in securities, resulting from changes in foreign exchange rates.
| | (e) | Repurchase agreements – Each Fund may enter into repurchase agreements with institutions that Artisan Partners Limited Partnership (the “Adviser”) has determined are creditworthy pursuant to criteria adopted by the Board of Directors. Repurchase agreements are recorded at cost plus accrued interest and are collateralized in an amount greater than or equal to the repurchase price plus accrued interest. Collateral is held by the Funds’ custodian and in |
29
TWENTY-NINE
NOTES TO FINANCIAL STATEMENTS
| | the event of default on the obligation of the counterparty to repurchase, the Funds have the right to liquidate the collateral and apply the proceeds in satisfaction of the obligation. If the proceeds from any sale of such collateral were less than the repurchase price, the Fund would suffer a loss. |
| | (f) | Securities lending – Each Fund may enter into securities lending transactions. During the year ended September 30, 2006, International Fund earned $6,715,340 from securities lending transactions. When securities are on loan, the Fund does not receive dividends on the securities loaned, but receives compensation from the borrower in lieu of such dividends. The loans are secured by collateral in the form of acceptable securities at least equal to, at all times, the fair value of the securities loaned. Gain or loss in the fair value of the securities loaned that may occur during the term of the loan will be for the account of the applicable Fund. As of September 30, 2006, there were no securities on loan. Each Fund’s risks in entering into securities lending arrangements are that the borrower may not provide additional collateral when required or return the securities when due or, if the borrower defaults, the Fund may experience delays in selling collateral or the collateral may not be sufficient to cover the value of securities lent. |
| | (g) | Commission recapture – Each of the Funds may direct portfolio trades to various brokers that have agreed to rebate a portion of the commissions generated. Such cash rebates are made directly to the applicable Fund and are included in net realized gain or loss on investments in the Statements of Operations as follows: |
| | | |
Emerging Markets | | $ | - |
International | | | 3,590,663 |
Mid Cap | | | 675,488 |
| | (h) | Use of estimates – The preparation of financial statements in conformity with United States generally accepted accounting principles requires management to make estimates and assumptions that affect the reported amounts and disclosures in the financial statements. Actual results could differ from those estimates. |
| | (i) | Indemnifications – In the normal course of business, the Funds enter into contracts in which the Funds agree to indemnify the other party or parties against various potential costs or liabilities. The Funds’ maximum exposure under these arrangements is unknown. No claim has been made for indemnification pursuant to any such agreement of the Funds. |
30
THIRTY
NOTES TO FINANCIAL STATEMENTS
| | (j) | Other – Dividend income less foreign taxes withheld, if any, is generally recorded on the ex-dividend date. In some cases, the information is not available to the Fund on the ex-dividend date. In such cases, which may include private placements and foreign securities, dividends are recorded as soon after the ex-dividend date as the information becomes available to the Funds. Non-cash dividends included in dividend income, if any, are generally recorded at the fair market value of securities received. Interest income is reported on the accrual basis. Distributions to shareholders are recorded on the ex-dividend date. Expenses attributable to Artisan Funds are generally allocated to each Fund based on net assets. However, other expense allocation methodologies may be used, depending on the nature of the expense item. Expenses attributable to a particular Fund are allocated directly to that Fund. |
The character of income and net realized gains and losses may differ for financial statement and tax purposes and may result in reclassification of permanent differences among certain capital accounts to more appropriately conform financial accounting to tax characterizations of dividend distributions.
Emerging Markets Fund and International Fund generally impose a 2% redemption fee on shares held 90 days or less. Those redemption fees are recorded as a reduction in the cost of shares redeemed and have the primary effect of increasing paid-in capital. Each Fund reserves the right to waive or reduce the 2% redemption fee on shares held 90 days or less at its discretion when the Fund believes such waiver is in the best interests of the Fund, including but not limited to when it determines that imposition of the redemption fee is not necessary to protect the Fund from the effects of short-term trading. The Funds currently waive the redemption fee on redemptions of shares held by certain retirement or profit-sharing plans and shares purchased through certain authorized agents.
| (3) | Transactions with affiliates: |
The Adviser, with which the officers and a director of Artisan Funds are affiliated, provides investment advisory and administrative services to the Funds. In exchange for those services, each Fund (with the exception of International Fund after
November 30, 2005 and Emerging Markets Fund) pays a monthly management fee to the Adviser as follows:
| | | |
Average Daily Net Assets | | Annual Rate | |
Less than $500 million | | 1.000 | % |
$500 million to $750 million | | 0.975 | |
$750 million to $1 billion | | 0.950 | |
Greater than $1 billion | | 0.925 | |
31
THIRTY-ONE
NOTES TO FINANCIAL STATEMENTS
Effective December 1, 2005, International Fund pays a monthly management fee to the Adviser as follows:
| | | |
Average Daily Net Assets | | Annual Rate | |
Less than $500 million | | 1.000 | % |
$500 million to $750 million | | 0.975 | |
$750 million to $1 billion | | 0.950 | |
$1 billion to $12 billion | | 0.925 | |
Greater than $12 billion | | 0.900 | |
Emerging Markets Fund pays a monthly management fee to the Adviser at an annual rate of 1.050% of average daily net assets.
The Adviser has voluntarily undertaken to reimburse Emerging Markets Fund for any ordinary operating expenses in excess of 1.50% of average daily net assets, annually.
The officers and director of Artisan Funds who are affiliated with the Adviser receive no compensation from the Funds.
Each director who is not an interested person of Artisan Funds or the Adviser receives an annual retainer of $140,000, payable quarterly, as well as reimbursement of expenses related to his duties as a director of Artisan Funds. In addition, the non-interested chair of the Board of Directors receives an additional annual retainer of $60,000, payable quarterly, and each chair of a board committee who is a non-interested director receives an additional annual retainer of $30,000, payable quarterly. Those fees were generally allocated to each of the Artisan Funds based on net assets, subject to a minimum allocation of $1,500 to each Fund per quarter. Directors fees for Emerging Markets Fund have been waived through the first six months of the Fund’s operations.
The Board of Directors has adopted a deferred compensation plan for independent directors that enables directors to elect to defer receipt of all or a portion of the annual compensation they are entitled to receive from the Funds. For purposes of determining the amount owed to the directors under the plan, deferred amounts are invested in shares of the Artisan Funds as selected by the individual directors. Each Fund purchases shares of the funds selected for deferral by the director in amounts equal to his investment, resulting in a Fund asset equal to the deferred compensation liability. Such assets are included as a component of “Other assets” on the Statement of Assets and Liabilities. Deferral of directors’ fees under the plan will not affect the net assets of the Funds, and will not materially affect the Funds’ assets, liabilities or net investment income per share. Amounts will be deferred until distributed in accordance with the plan.
32
THIRTY-TWO
NOTES TO FINANCIAL STATEMENTS
| (4) | Line of credit arrangement: |
Artisan Funds is party to a line of credit agreement with State Street Bank and Trust Company, under which each Fund may borrow up to the lesser of (a) $75 million or (b) the lesser of (i) 10% of its total assets (after giving effect to the loan) or (ii) the maximum amount the Fund may borrow under the Investment Company Act of 1940, the limitations included in the Fund’s prospectus, or any limit or restriction under any law or regulation to which the Fund is subject or any agreement to which the Fund or Artisan Funds is a party; provided that the aggregate borrowings by all Funds may not exceed $100 million. Artisan Funds pays a commitment fee at the annual rate of 0.10% on the unused portion of the line of credit. Interest is charged on any borrowings at the current Federal Funds rate plus 0.50%. The use of the line of credit is generally restricted to temporary borrowing for extraordinary or emergency purposes. During the year ended September 30, 2006, there were no borrowings under the line of credit for Emerging Markets Fund, International Fund or Mid Cap Fund.
| (5) | Investment transactions: |
The cost of securities purchased and the proceeds from the sale of securities (excluding short-term securities) for the year ended September 30, 2006 were as follows:
| | | | | | |
| Fund | | Security Purchases | | Security Sales |
Emerging Markets(1) | | $ | 6,566,594 | | $ | 1,324,289 |
International | | | 7,450,262,618 | | | 7,333,966,313 |
Mid Cap | | | 4,156,273,918 | | | 5,073,814,119 |
| | (1) | For the period from commencement of operations (June 26, 2006) through September 30, 2006. |
33
THIRTY-THREE
NOTES TO FINANCIAL STATEMENTS
| (6) | Transactions in securities of affiliates: |
The table below shows information about securities of the Funds’ “affiliates” (as defined below) that were held by the Funds, purchased or sold by the Funds, or from which dividends were received by the Funds during the year ended September 30, 2006. The Funds identify a company as an affiliate for the purpose of this report if one or more of the Funds owned, in the aggregate, voting securities that it believed represented 5% or more of that company’s outstanding voting securities (as defined by the Investment Company Act of 1940) during the year ended September 30, 2006.
| | | | | | | | | | | | | | | | | | | | | |
Fund | | Security | | As of 9/30/05 | | | | Sales
Cost | | Net
Realized
Gain (Loss) | | Dividend
Income(1) | | As of 9/30/06 |
| | | Share
Balance | | Purchase
Cost | | | | | Share
Balance | | Value |
| International | | Acergy SA(2)(3)(4) | | 7,851,500 | | $ | 20,763,931 | | $ | 20,410,871 | | $ | 8,232,141 | | $ | - | | 8,128,500 | | $ | 138,866,753 |
| | | Credit Saison Co., Ltd. | | 8,952,300 | | | 35,605,052 | | | 17,056,388 | | | 5,805,733 | | | 1,800,017 | | 9,284,400 | | | 391,418,514 |
| | | TAISEI CORPORATION(3) | | - | | | 233,887,164 | | | - | | | - | | | 1,984,615 | | 54,263,300 | | | 194,773,665 |
| | | Total(5) | | | | | 290,256,147 | | | 37,467,259 | | | 14,037,874 | | | 3,784,632 | | | | | 586,192,179 |
| Mid Cap | | Intermec, Inc.(3)(4) | | - | | | 50,377,602 | | | 1,231,075 | | | 35,602 | | | - | | 3,374,500 | | | 88,951,820 |
| | | Marvel Entertainment, Inc.(3)(4) | | 1,769,000 | | | 9,099,830 | | | 19,346,535 | | | 2,609,065 | | | - | | 1,361,100 | | | 32,856,954 |
| | | Total(5) | | | | | 59,477,432 | | | 20,577,610 | | | 2,644,667 | | | - | | | | | 121,808,774 |
| | (1) | Net of foreign taxes withheld, if any. |
| | (2) | Issuer was no longer an affiliate as of September 30, 2006. |
| | (3) | Issuer was not an affiliate as of September 30, 2005. |
| | (4) | Non-income producing security. |
| | (5) | Total value as of September 30, 2006 is presented for only those issuers that were affiliates as of September 30, 2006. |
| (7) | Information for Federal income tax purposes: |
| | | | | | | | | | | | | |
| Fund | | Cost of
Investments | | Gross
Unrealized
Appreciation | | Gross
Unrealized
Depreciation | | | Net
Unrealized
Appreciation
on Investments |
| Emerging Markets | | $ | 5,527,083 | | $ | 507,400 | | $ | (66,715 | ) | | $ | 440,685 |
| International | | | 10,795,740,989 | | | 3,309,401,805 | | | (213,093,174 | ) | | | 3,096,308,631 |
| Mid Cap | | | 4,355,351,017 | | | 1,019,396,966 | | | (68,295,376 | ) | | | 951,101,590 |
The difference between cost of investments for financial reporting and cost of investments for Federal income tax purposes is due primarily to timing differences in recognizing certain gains and losses on security transactions (e.g., wash sale loss deferrals and passive foreign investment company transactions).
34
THIRTY-FOUR
NOTES TO FINANCIAL STATEMENTS
The tax basis of dividends and long-term capital gain distributions paid during the year ended September 30, 2006 and the year ended September 30, 2005 were as follows:
| | | | | | | | | | | | |
| | | Year Ended 9/30/06 | | Year Ended 9/30/05 |
| Fund | | Ordinary
Income
Dividends | | Long-Term
Capital Gain
Distributions | | Ordinary
Income
Dividends | | Long-Term
Capital Gain
Distributions |
| Emerging Markets(1) | | $ | - | | $ | - | | | | | | |
| International | | | 200,705,174 | | | - | | $ | 69,335,942 | | $ | - |
| Mid Cap | | | 30,312,731 | | | 220,370,538 | | | - | | | - |
| | (1) | For the period from commencement of operations (June 26, 2006) through September 30, 2006. |
Income and capital gain distributions are determined in accordance with income tax regulations that may differ from accounting principles that are generally accepted in the United States. These differences are due to differing treatments for items such as net short-term gains, wash sale loss deferrals, foreign currency transactions, net investment losses and capital loss carryovers. Gains on redemptions-in-kind for International Fund and Mid Cap Fund of $29,012,833 and $13,451,833, respectively, included in net realized gain (loss) on investments in the Statement of Operations for the year ended September 30, 2006, are not recognized for Federal income tax purposes.
Additional tax information as of and for the year ended September 30, 2006 follows:
| | | | | | | | | | | | | | |
| | | As of 9/30/06 | | Year Ended 9/30/06 | |
| Fund | | Undistributed
Ordinary
Income | | Undistributed
Long-Term
Gain | | Capital Loss
Carryforward
Utilized | | | Post-October
Losses | |
| Emerging Markets | | $ | 143,395 | �� | $ | - | | $ | - | (1) | | $ | 8,572 | (1) |
| International | | | 212,453,758 | | | 1,018,713,221 | | | 617,923,426 | | | | - | |
| Mid Cap | | | 26,118,296 | | | 536,884,861 | | | - | | | | - | |
| | (1) | For the period from commencement of operations (June 26, 2006) through September 30, 2006. |
As of September 30, 2006, none of the Funds had capital loss carryforwards.
35
THIRTY-FIVE
NOTES TO FINANCIAL STATEMENTS
| (8) | Fund share activities: |
Capital share transactions for the Funds were as follows:
| | | | | | | | | | | |
Year ended September 30, 2006 | | EMERGING MARKETS | | INTERNATIONAL | |
| | Institutional
Shares(1) | | Investor
Shares | | | Institutional
Shares | |
Proceeds from shares issued | | $ | 5,310,000 | | $ | 2,314,789,322 | | | $ | 316,068,084 | |
Net asset value of shares issued in reinvestment of dividends and distributions | | | - | | | 121,587,382 | | | | 67,354,311 | |
Cost of shares redeemed(2) | | | - | | | (1,736,641,589 | ) | | | (917,682,779 | ) |
| | | | | | | | | | | |
Net increase (decrease) from fund share transactions | | $ | 5,310,000 | | $ | 699,735,115 | | | $ | (534,260,384 | ) |
| | | | | | | | | | | |
| | | |
Shares sold | | | 527,411 | | | 85,995,680 | | | | 12,075,907 | |
Shares issued in reinvestment of dividends and distributions | | | - | | | 5,049,329 | | | | 2,785,484 | |
Shares redeemed | | | - | | | (65,072,487 | ) | | | (35,034,422 | ) |
| | | | | | | | | | | |
Net increase (decrease) in capital shares | | | 527,411 | | | 25,972,522 | | | | (20,173,031 | ) |
| | | | | | | | | | | |
| | |
Year ended September 30, 2005 | | | | INTERNATIONAL | |
| | | | Investor
Shares | | | Institutional
Shares | |
Proceeds from shares issued | | | | | $ | 1,721,409,733 | | | $ | 213,745,441 | |
Net asset value of shares issued in reinvestment of dividends and distributions | | | | | | 35,336,667 | | | | 27,442,945 | |
Cost of shares redeemed(2) | | | | | | (1,815,852,822 | ) | | | (778,118,588 | ) |
| | | | | | | | | | | |
Net increase (decrease) from fund share transactions | | | | | $ | (59,106,422 | ) | | $ | (536,930,202 | ) |
| | | | | | | | | | | |
| | | |
Shares sold | | | | | | 78,912,846 | | | | 9,680,591 | |
Shares issued in reinvestment of dividends and distributions | | | | | | 1,677,108 | | | | 1,297,539 | |
Shares redeemed | | | | | | (82,739,336 | ) | | | (34,838,126 | ) |
| | | | | | | | | | | |
Net increase (decrease) in capital shares | | | | | | (2,149,382 | ) | | | (23,859,996 | ) |
| | | | | | | | | | | |
| | (1) | For the period from commencement of operations (June 26, 2006) through September 30, 2006. |
| | (2) | Net of redemption fees of: |
| | | | | | |
| | | Year Ended |
| Fund | | 9/30/2006 | | 9/30/2005 |
International - Investor Shares | | $ | 863,753 | | $ | 326,088 |
International - Institutional Shares | | | 389,313 | | | 179,833 |
36
THIRTY-SIX
NOTES TO FINANCIAL STATEMENTS
| | | | | | | | | | | | | | | | | | | | | | | | | | | | | | |
| MID CAP | | | | | | | | | | | | | | | | | | | | | | | | | |
Investor
Shares | | | Institutional
Shares | | | | | | | | | | | | | | | | | | | | | | | | | |
| $ | 902,753,102 | | | $ | 55,931,735 | | | | | | | | | | | | | | | | | | | | | | | | | |
| | | | | | | | | | | | | |
| | 205,964,332 | | | | 40,056,662 | | | | | | | | | | | | | | | | | | | | | | | | | |
| | (1,552,986,575 | ) | | | (307,000,219 | ) | | | | | | | | | | | | | | | | | | | | | | | | |
| | | | | | | | | | | | | | | | | | | | | | | | | | | | | | | |
| $ | (444,269,141 | ) | | $ | (211,011,822 | ) | | | | | | | | | | | | | | | | | | | | | | | | |
| | | | | | | | | | | | | | | | | | | | | | | | | | | | | | | |
| | | | | | | | | | | | | |
| | 28,570,035 | | | | 1,750,257 | | | | | | | | | | | | | | | | | | | | | | | | | |
| | 6,671,990 | | | | 1,280,993 | | | | | | | | | | | | | | | | | | | | | | | | | |
| | (49,375,193 | ) | | | (9,727,021 | ) | | | | | | | | | | | | | | | | | | | | | | | | |
| | | | | | | | | | | | | | | | | | | | | | | | | | | | | | | |
| | (14,133,168 | ) | | | (6,695,771 | ) | | | | | | | | | | | | | | | | | | | | | | | | |
| | | | | | | | | | | | | | | | | | | | | | | | | | | | | | | |
| | | | | | | | | | | | |
| MID CAP | | | | | | | | | | | | | | | | | | | | | | | | | |
Investor
Shares | | | Institutional
Shares | | | | | | | | | | | | | | | | | | | | | | | | | |
| $ | 1,448,522,186 | | | $ | 65,819,361 | | | | | | | | | | | | | | | | | | | | | | | | | |
| | | | | | | | | | | | | |
| | - | | | | - | | | | | | | | | | | | | | | | | | | | | | | | | |
| | (1,366,393,615 | ) | | | (299,155,114 | ) | | | | | | | | | | | | | | | | | | | | | | | | |
| | | | | | | | | | | | | | | | | | | | | | | | | | | | | | | |
| $ | 82,128,571 | | | $ | (233,335,753 | ) | | | | | | | | | | | | | | | | | | | | | | | | |
| | | | | | | | | | | | | | | | | | | | | | | | | | | | | | | |
| | | | | | | | | | | | | |
| | 50,306,407 | | | | 2,231,832 | | | | | | | | | | | | | | | | | | | | | | | | | |
| | - | | | | - | | | | | | | | | | | | | | | | | | | | | | | | | |
| | (46,997,550 | ) | | | (10,061,831 | ) | | | | | | | | | | | | | | | | | | | | | | | | |
| | | | | | | | | | | | | | | | | | | | | | | | | | | | | | | |
| | 3,308,857 | | | | (7,829,999 | ) | | | | | | | | | | | | | | | | | | | | | | | | |
| | | | | | | | | | | | | | | | | | | | | | | | | | | | | | | |
37
THIRTY-SEVEN
NOTES TO FINANCIAL STATEMENTS
Artisan Funds and the Adviser were defendants in a lawsuit in the Circuit Court of the Third Judicial Circuit, Madison County, Illinois that sought certification of a plaintiff class consisting of all persons in the United States who held shares in International Fund for a period of more than 14 days during the five years prior to the filing of the lawsuit. The suit sought compensatory and punitive damages under state law, as well as interest, costs and attorney’s fees. The lawsuit alleged, in summary, that Artisan Funds and the Adviser exposed long-term International Fund shareholders to trading by market timers by allegedly (a) failing to properly evaluate daily whether a significant event affecting the value of International Fund’s securities had occurred after foreign markets had closed but before the calculation of the Fund’s NAV; (b) failing to implement the Fund’s portfolio valuation and share pricing policies and procedures; (c) allowing portfolio valuation and share policies and procedures that benefited market timers at the expense of long-term shareholders; and (d) failing to know and implement applicable rules and regulations concerning the calculation of NAV.
Artisan Funds and the Adviser removed the lawsuit from state court to federal district court. The federal district court ordered the case remanded to Illinois state court. Artisan Funds and the Adviser then appealed the remand order to the United States Court of Appeals for the Seventh Circuit and, on April 5, 2005, the Court of Appeals ruled in favor of Artisan Funds and the Adviser. As a result, the action was dismissed with prejudice in May 2005. The plaintiff subsequently sought and was granted review by the United States Supreme Court on the question of whether the Court of Appeals had jurisdiction to hear the appeal. On June 15, 2006, the United States Supreme Court ruled that the Court of Appeals had lacked jurisdiction to hear the appeal of Artisan Funds and the Adviser, vacated the judgment of the Court of Appeals and remanded the case to the Court of Appeals with instructions to dismiss the appeal for lack of jurisdiction. On October 16, 2006, the Court of Appeals dismissed the appeal and remanded the case to state court. Artisan Funds and the Adviser intend to continue to defend the lawsuit vigorously.
Certain legal fees incurred by Artisan Funds in defense of the lawsuit and related insurance recoveries of $197,947 have been allocated to International Fund and are included in professional fees in the Statement of Operations. Artisan Funds does not believe that the action described herein will have a material effect on the financial condition of any Fund.
| (10) | Recent Accounting Pronouncements: |
On July 13, 2006, the Financial Accounting Standards Board (FASB) released FASB Interpretation No. 48 “Accounting for Uncertainty in Income Taxes” (FIN 48). FIN 48 provides guidance for how uncertain tax positions should be recognized,
38
THIRTY-EIGHT
NOTES TO FINANCIAL STATEMENTS
measured, presented and disclosed in the financial statements. FIN 48 requires the evaluation of tax positions taken or expected to be taken in the course of preparing the Fund’s tax returns to determine whether the tax positions are “more-likely-than-not” of being sustained by the applicable tax authority. Tax positions not deemed to meet the more-likely-than-not threshold would be recorded as a tax benefit or expense in the current year. Adoption of FIN 48 is required for fiscal years beginning after December 15, 2006 and is to be applied to all open tax years as of the effective date. At this time, management is evaluating the implications of FIN 48 and its impact on the financial statements has not yet been determined.
In September 2006, the Financial Accounting Standards Board (FASB) issued Statement on Financial Accounting Standards No. 157, “Fair Value Measurements” (FAS 157). This standard clarifies the definition of fair value for financial reporting, establishes a framework for measuring fair value and requires additional disclosures about the use of fair value measurements. FAS 157 is effective for financial statements issued for fiscal years beginning after November 15, 2007 and interim periods within those fiscal years. As of September 30, 2006, the Funds do not believe the adoption of FAS 157 will impact the amounts reported in the financial statements, however, additional disclosures will be required about the inputs used to develop the measurements of fair value and the effect of certain of the measurements reported in the statement of operations for a fiscal period.
39
THIRTY-NINE
Report of Independent Registered Public Accounting Firm
To the Board of Directors and Shareholders of Artisan Funds, Inc.
We have audited the accompanying statements of assets and liabilities, including the schedules of investments, of Artisan Emerging Markets Fund, Artisan International Fund and Artisan Mid Cap Fund (three of the nine series constituting Artisan Funds, Inc.) (the “Funds”) as of September 30, 2006, and the related statements of operations for the year then ended (or since commencement of operations if less than one year), the statements of changes in net assets for each of the two years in the period then ended (or since commencement of operations if less than two years), and the financial highlights for each of the three years in the period then ended and for the period from July 1, 2003 to September 30, 2003 (or since commencement of operations if less than three years). These financial statements and financial highlights are the responsibility of the Funds’ management. Our responsibility is to express an opinion on these financial statements and financial highlights based on our audits. The financial highlights of the Funds for the periods ended prior to September 30, 2003, were audited by other auditors whose report dated July 31, 2003, expressed an unqualified opinion on those financial highlights.
We conducted our audits in accordance with the standards of the Public Company Accounting Oversight Board (United States). Those standards require that we plan and perform the audit to obtain reasonable assurance about whether the financial statements and financial highlights are free of material misstatement. We were not engaged to perform an audit of the Funds’ internal control over financial reporting. Our audits included consideration of internal control over financial reporting as a basis for designing audit procedures that are appropriate in the circumstances, but not for the purpose of expressing an opinion on the effectiveness of the Funds’ internal control over financial reporting. Accordingly, we express no such opinion. An audit also includes examining, on a test basis, evidence supporting the amounts and disclosures in the financial statements and financial highlights, assessing the accounting principles used and significant estimates made by management, and evaluating the overall financial statement presentation. Our procedures included confirmation of securities owned as of September 30, 2006, by correspondence with the custodian and brokers or by other appropriate auditing procedures where replies from brokers were not received. We believe that our audits provide a reasonable basis for our opinion.
In our opinion, the financial statements and financial highlights referred to above present fairly, in all material respects, the financial position of Artisan Emerging Markets Fund, Artisan International Fund and Artisan Mid Cap Fund of Artisan Funds, Inc. at September 30, 2006, the results of their operations for the year then ended (or since commencement of operations if less than one year), the changes in their net assets for each of the two years in the period then ended (or since commencement of operations if less than two years), and the financial highlights for each of the three years in the period then ended and for the period from July 1, 2003 to September 30, 2003 (or since commencement of operations if less than three years), in conformity with U.S. generally accepted accounting principles.

Milwaukee, Wisconsin
November 3, 2006
40
FORTY
NOTES TO FINANCIAL STATEMENTS
Other Federal tax information (unaudited):
The Internal Revenue Code requires that shareholders be notified within 60 days of the Funds’ fiscal year-end of certain information regarding long-term capital gains, qualified dividend income and the dividends received deduction for corporate shareholders. This data is informational only. Every year in January, shareholders are sent a Form 1099-DIV, which provides the federal tax status of dividends and distributions received during the calendar year. Shareholders are advised to consult their own tax advisors with respect to the specific tax consequences of investment in the Funds.
Each Fund hereby designates the following amounts as (i) long-term capital gain distributions for purposes of the dividends paid deduction, and (ii) the amount of ordinary dividends paid during the fiscal year ended September 30, 2006 that are considered qualified dividend income as defined in the Jobs and Growth Tax Relief Reconciliation Act of 2003.
| | | | | | |
| Fund | | Long-Term Capital Gains | | Qualified Dividend Income | |
Emerging Markets | | $ | - | | - | % |
International | | | - | | 66.4 | |
Mid Cap | | | 220,370,538 | | 40.3 | |
For the year ended September 30, 2006, of the ordinary income dividends paid by Mid Cap, 48%, are eligible for the dividends received deduction available to certain corporate shareholders.
41
FORTY-ONE
SHAREHOLDER EXPENSE EXAMPLE
As a shareholder of Artisan Funds, you incur two types of costs: (1) transaction costs, including redemption fees; and (2) ongoing costs, including management fees, and other Fund expenses. This example is intended to help you understand your ongoing costs (in dollars) of investing in a Fund and to compare these costs with the ongoing costs of investing in other mutual funds.
The example is based on an investment of $1,000 invested at the beginning of the period and held for the entire period from April 1, 2006 to September 30, 2006.
Actual Expenses
The first line under the name of each Fund in the table below provides information about actual account values and actual expenses. You may use the information in this line, together with the amount you invested, to estimate the expenses that you paid over the period. Simply divide your account value by $1,000 (for example, an $8,600 account value divided by $1,000 = 8.6), then multiply the result by the number in the first line under the name of your Fund under the heading entitled “Expenses Paid During Period” to estimate the expenses you paid on your account during this period.
Hypothetical Example for Comparison Purposes
The second line below each Fund’s name in the table below provides information about hypothetical account values and hypothetical expenses based on each Fund’s actual expense ratio for the six months ended September 30, 2006 and an assumed rate of return of 5% per year before expenses, which is not the Fund’s actual return. The hypothetical account values and expenses may not be used to estimate the actual ending account balances or expenses you paid for the period. You may use this information to compare the ongoing costs of investing in each Fund and other funds. To do so, compare the 5% hypothetical example with the 5% hypothetical examples that appear in the shareholder reports of the other funds.
Please note that the expenses shown in the table are meant to highlight your ongoing costs only and do not reflect any transactional costs, such as redemption fees. Therefore, the second line of the table is useful in comparing ongoing costs only, and will not help you determine the relative costs of owning different funds. If these transactional costs were included, your costs would have been higher.
| | | | | | |
| | | Beginning
Account Value
4/1/2006 | | Ending
Account Value
9/30/2006 | | Expenses Paid During
Period
4/1/2006-9/30/2006(2) |
Artisan Emerging Markets Fund - Institutional Shares(1) | | | | | | |
Actual | | $1,000.00 | | $1,115.00 | | $3.89 |
Hypothetical (5% return before expenses) | | $1,000.00 | | $1,009.47 | | $3.70 |
Artisan International Fund - Institutional Shares | | | | | | |
Actual | | $1,000.00 | | $1,027.72 | | $5.03 |
Hypothetical (5% return before expenses) | | $1,000.00 | | $1,020.10 | | $5.01 |
Artisan Mid Cap Fund - Institutional Shares | | | | | | |
Actual | | $1,000.00 | | $ 957.53 | | $4.71 |
Hypothetical (5% return before expenses) | | $1,000.00 | | $1,020.26 | | $4.86 |
42
FORTY-TWO
SHAREHOLDER EXPENSE EXAMPLE
| (1) | The account value and the expenses paid for Emerging Markets Fund have been presented for the period from commencement of operations (June 26, 2006) through September 30, 2006. Assuming a six month period, the actual account value as of September 30, 2006 and the expenses paid during period 4/1/2006-9/30/2006 would have been as follows: |
| | | | | | |
| | | Beginning
Account Value
4/1/2006 | | Ending
Account Value
9/30/2006 | | Expenses Paid During
Period
4/1/2006-9/30/2006(1) |
Artisan Emerging Markets Fund - Institutional Shares | | | | | | |
Actual | | $1,000.00 | | $1,115.00 | | $7.42 |
Hypothetical (5% return before expenses) | | $1,000.00 | | $1,018.05 | | $7.08 |
| (2) | Expenses are equal to the Fund’s ratio of expenses to average net assets for the six-month period ended September 30, 2006 (shown below); multiplied by the average account value over the period; multiplied by 183/365 (to reflect the one-half year period). |
| | | |
| Fund | | Annualized Ratio of Expenses to Average Net Assets for the Six-Month
Period Ended September 30, 2006 | |
Artisan Emerging Markets Fund - Institutional Shares(1) | | 1.40 | %(2) |
Artisan International Fund - Institutional Shares | | 0.99 | |
Artisan Mid Cap Fund - Institutional Shares | | 0.96 | |
| (1) | For the period from commencement of operations (June 26, 2006) through September 30, 2006. |
| (2) | The annualized ratio of expenses to average net assets excludes expenses waived or paid by the Adviser or the Board of Directors. |
43
FORTY-THREE
FACTORS CONSIDERED IN RENEWING EMERGING MARKETS FUND’S ADVISORY AGREEMENT
Artisan International Fund, Artisan Emerging Markets Fund and Artisan Mid Cap Fund are series of Artisan Funds, Inc., which has six other series. Artisan Partners Limited Partnership (“Artisan Partners”) is responsible for management of the Funds’ investment portfolios and for overall management of the Funds’ business and affairs pursuant to Investment Advisory Agreements dated December 27, 1995 (International Fund), November 7, 2001 (International Small Cap), August 8, 2002 (International Value Fund), May 10, 2006 (Emerging Markets Fund), April 10, 1997 (Mid Cap Fund), October 26, 2000 (Mid Cap Value Fund), February 9, 2006 (Opportunistic Value Fund), March 27, 1995 (Small Cap Fund), and July 31, 1997 (Small Cap Value Fund) (the “Advisory Agreements”).
Artisan Partners is a Delaware limited partnership the sole general partner of which is Artisan Investment Corporation. Artisan Investment Corporation was incorporated on December 7, 1994 for the sole purpose of acting as general partner of Artisan Partners. Artisan Investment Corporation is controlled by Andrew A. Ziegler and Carlene M. Ziegler, who together own 100% of its voting stock. The principal address of Artisan Partners is 875 E. Wisconsin Avenue, Suite 800, Milwaukee, Wisconsin 53202. Artisan Partners also has offices at 100 Pine Street, Suite 2950, San Francisco, California 94111; One Maritime Plaza, Suite 1450, San Francisco, California 94111; Five Concourse Parkway NE, Suite 2120, Atlanta, Georgia 30328; 1350 Avenue of the Americas, Suite 3005, New York, New York 10019; 800 Delaware Avenue, Suite 605, Wilmington, Delaware 19801 (until approximately December 1, 2006); and 800 Delaware Avenue, Suite 800, Wilmington, Delaware 19801 (beginning approximately December 1, 2006).
Each Fund’s Advisory Agreement may be continued from year to year only so long as the continuance is approved annually (a) by the vote of a majority of the directors of Artisan Funds who are not “interested persons” of Artisan Funds or Artisan Partners cast in person at a meeting called for the purpose of voting on such approval, and (b) by the Board of Directors or by the vote of a majority (as defined in the 1940 Act) of the outstanding shares of the Fund. Each Advisory Agreement provides that Artisan Partners shall not be liable for any loss suffered by a Fund or its shareholders as a consequence of any act or omission in connection with investment advisory or portfolio services under the agreement, except by reason of willful misfeasance, bad faith or gross negligence on the part of Artisan Partners in the performance of its duties or from reckless disregard by Artisan Partners of its obligations and duties under the Advisory Agreement. Each Agreement will terminate automatically in the event of its assignment (as defined in the 1940 Act).
The board considered the Advisory Agreement for Emerging Markets Fund, a new series of Artisan Funds that began investment operations on June 26, 2006, at meetings on May 9-10, 2006. At the meeting on May 9, 2006, the board discussed the proposed investment strategy of Emerging Markets Fund with the portfolio manager of Artisan Partners’ emerging markets investment team. The board reconvened its regular board meeting the next day to, among other items, consider the Advisory Agreement for Emerging Markets Fund.
The directors of Artisan Funds approved the Investment Advisory Agreement for each series of Artisan Funds other than Emerging Markets Fund at meetings of the board on November 17, 2005 and February 9, 2006. A discussion of the material factors and conclusions that formed the basis for the board’s approval of each of those Advisory Agreements was contained in the Fund’s semiannual report to shareholders for the period ended March 31, 2006.
44
FORTY-FOUR
FACTORS CONSIDERED IN RENEWING EMERGING MARKETS FUND’S ADVISORY AGREEMENT
In connection with the board’s consideration of the continuation of the Advisory Agreements for the other series of Artisan Funds, independent counsel to the independent directors sent to Artisan Partners a request for information. Prior to the May 9-10, 2006 meetings to consider the Advisory Agreement for Emerging Markets Fund, Artisan Partners provided materials to the directors regarding that Fund that were responsive to these requests, including a report prepared by Lipper, Inc. (“Lipper”), an independent source of investment company data, showing advisory fees and expense ratios for a peer group of funds selected by Lipper compared to the proposed advisory fee and estimated expense ratio for Emerging Markets Fund and other information Artisan Partners believed was useful in evaluating the Advisory Agreement. The directors also received and reviewed a memorandum from their independent counsel regarding the directors’ responsibilities in evaluating the Fund’s investment advisory agreement. In evaluating the Advisory Agreement for Emerging Markets Fund, the directors reviewed the available information and discussed with representatives of Artisan Partners the nature, extent and quality of the advisory and other services expected to be provided by Artisan Partners to Emerging Markets Fund, as well as the nature, extent and quality of the advisory services historically provided by Artisan Partners to each of the other Funds, the expected overall expense ratios of Emerging Markets Fund, the potential for economies of scale and other benefits that may be derived by Artisan Partners from its relationship with the Fund. In addition to the third party report prepared by Lipper and the memorandum from independent counsel, the directors reviewed information concerning the following:
| • | | The services expected to be performed by Artisan Partners for Emerging Markets Fund, including: a list of those services; Artisan Partners’ responsibility for making investment decisions and for observing investment objectives, policies and restrictions of Emerging Markets Fund; |
| • | | The terms of the Advisory Agreement, including standard of care and termination provisions; |
| • | | Artisan Partners’ personnel and operations, including: information on the portfolio management team that would be responsible for the Fund and that had recently joined Artisan Partners, the number and organization of Artisan Partners’ other employees; the education and experience of Artisan Partners’ investment personnel; Artisan Partners’ assessment of its ability to attract and retain capable investment and business professionals and recent hiring and retention information; Artisan Partners’ research and decision-making processes; policies relating to the assignment of personnel to the various Artisan Funds portfolios; the compensation of Artisan Partners’ personnel with primary responsibility for managing Artisan Funds; the time and attention of Artisan Partners’ personnel devoted to the Funds; and the adequacy and sophistication of Artisan Partners’ technology and systems with respect to investment and administrative matters; |
| • | | Potential for conflicts of interest between Emerging Markets Fund and Artisan Partners and circumstances and actions addressing or bearing on potential conflicts of interest, including: the basis of sharing personnel, services, research and advice among clients; the basis of decisions by Artisan Partners to buy or sell securities for Artisan Funds and other clients; Artisan Partners’ methodology of allocating investment opportunities, including initial public offerings, among Artisan Funds and other clients; potential advantages and disadvantages in having an investment adviser that has other clients; Artisan Partners’ own investments and possible conflicts with Artisan Funds; Artisan Partners’ code of ethics, including policies relating to personal securities transactions of employees; and litigation and regulatory matters; |
| • | | Potential “fall-out” benefits to be gained by Artisan Partners or its affiliates and by Emerging Markets Fund from their relationship, including: benefits to Artisan Partners in attracting and retaining other clients and the method of estimating other benefits to Artisan Partners; |
| • | | Brokerage and portfolio transactions, including: the standards and performance in seeking best execution; allocation of soft dollars for research products and services; Artisan Partners’ practices |
45
FORTY-FIVE
FACTORS CONSIDERED IN RENEWING EMERGING MARKETS FUND’S ADVISORY AGREEMENT
| | in light of SEC guidance under Section 28(e) of the Securities Exchange Act of 1934; research purchased with Artisan Partners’ funds; portfolio turnover rates; use of brokers who sell shares of Artisan Funds and steps taken to comply with applicable rules; and other benefits from the allocation of brokerage; |
| • | | The advisory fees to be charged, including: the method of computing fees; potential recognition of economies of scale; the frequency of the payment of fees; a comparison of the fees to be charged by Artisan Partners to Emerging Markets Fund with the fees charged by Artisan Partners to other accounts to be managed by Artisan Partners in the same investment strategy; a comparison of the fees to be charged by Artisan Partners to the Fund with the management fees charged by other investment advisers for managing mutual funds with similar investment objectives and strategies; and potential cost savings by Artisan Partners, incentives to effect savings and the sharing of savings with the Fund; |
| • | | The effect of advisory and other fees on the total expenses of Emerging Markets Fund, including: comparisons of expenses and expense ratios with those of other mutual funds, taking into account comparability factors such as size, account-level charges and investment objective; voluntary expense limitations or reductions and relationship of expenses to expense limitation; the allocation of certain expenses between Artisan Partners, Distributors and the Fund; and fees to be paid to service providers other than Artisan Partners, including custodial, transfer agent and shareholder servicing fees; and |
| • | | The financial condition and stability of Artisan Partners. |
At the end of the May 10, 2006 meeting, the independent directors met separately with their independent counsel to review and discuss relevant information regarding the approval of Emerging Markets Fund’s Advisory Agreement. In the course of this review process, the independent directors reviewed and discussed the following information:
The nature, extent and quality of Artisan Partners’ services. The independent directors reviewed the nature, extent and the quality of Artisan Partners’ services expected to be provided to the Fund and the nature, extent and quality of Artisan Partners’ services historically provided to each of the other Funds and considered the following:
| • | | Besides investment management, Artisan Partners would provide Emerging Markets Fund with general administration services, including the preparation of regulatory filings, provide services to certain of the Fund’s shareholders and management of the Fund’s relationships with its third party service providers, including its custodian, fund accounting agent, transfer agent, lawyers and auditors. |
| • | | The quality of the services to be provided by Artisan Partners to Emerging Markets Fund in absolute terms and relative to mutual fund industry standards. |
| • | | The sufficiency and quality of Artisan Partners personnel. |
| • | | Artisan Partners’ financial condition. |
The investment performance of the Fund. Because the Fund had not begun investment operations and Artisan Partners had not, at that time, managed the assets of any separate account client in its emerging markets strategy, the board had no performance history of the Fund or Artisan Partners to review. However, the board noted that Artisan Partners had advised the directors that the investment management team responsible for the Fund had historically produced positive results for other clients.
46
FORTY-SIX
FACTORS CONSIDERED IN RENEWING EMERGING MARKETS FUND’S ADVISORY AGREEMENT
Cost of services, economies of scale and benefits to be derived by Artisan Partners. The directors reviewed the expected overall expense ratio of Emerging Markets Fund (after giving effect to Artisan Partners’ agreement to reimburse the Fund for expenses in excess of 1.50% of the Fund’s average daily net assets) in comparison to the expense ratios of its peers in relation to the nature and quality of services to be provided by Artisan Partners and in relation to the fees Artisan Partners expects to charge its other clients who have similar investment strategies and objectives (but to whom Artisan Partners generally provides few or no services other than portfolio management). The directors also considered whether the Fund’s shareholders were likely to benefit from economies of scale under the management fee structure in the Advisory Agreement. In their review, the independent directors considered the following:
| • | | Under the proposed fee schedule for Emerging Markets Fund, the Fund would pay Artisan Partners a monthly fee at the annual rate of 1.05% of the Fund’s average daily net assets. |
| • | | Artisan Partners has voluntarily agreed to reimburse the expenses of Emerging Markets Fund to the extent they exceed 1.50% of the Fund’s average daily net assets annually. |
Because the Fund had not yet begun operations, the board was not able to evaluate the actual profitability to Artisan Partners of its relationship with the Fund. However, Artisan Partners advised the board that it expected its expenses incurred in management of Emerging Markets Fund to exceed its management fee until the Fund’s assets reached a significant level.
Other benefits to be derived by Emerging Markets Fund or Artisan Partners. The independent directors then reviewed the potential benefits that Artisan Partners may derive as a result of its relationship with Emerging Markets Fund, other than the services provided by Artisan Partners pursuant to the Advisory Agreement and the management fees paid in return. For Artisan Partners, the directors considered two potential benefits to Artisan Partners: (1) the potential conversion of a Fund shareholder to a separate account client; and (2) the acquisition of research products and services in return for commissions (“soft dollars”). The independent directors noted that, although Artisan Partners derives or may derive those additional benefits, the Fund may also benefit in similar fashion. In reaching those conclusions, the directors considered the following:
| • | | Artisan Partners does not solicit Artisan Funds’ shareholders to become separate account clients nor to purchase other goods or services provided by Artisan Partners or its affiliates. Artisan Partners refers potential separate account clients that do not meet Artisan Partners’ minimum separate account size requirements to Artisan Funds. |
| • | | Artisan Partners utilizes third-party research products and services and proprietary research from executing brokers paid for with soft dollars paid by the Funds and by other clients of Artisan Partners. Artisan Partners’ use of soft dollars provides Artisan Partners, and thereby Artisan Funds, with access to third party and proprietary research and also helps Artisan Partners maintain important and open relationships with brokers. Use of the Fund’s commissions for soft dollar purposes would be on the same terms as every other client account managed by Artisan Partners in the same investment strategy. |
The board then concluded that the information provided and reviewed prior to and during the meetings on May 9-10, 2006 and during the meeting of the independent directors with counsel to the independent directors provided a strong basis for consideration of the initial approval of the Advisory Agreement for Emerging Markets Fund. The directors reviewed and affirmed each of the following conclusions:
47
FORTY-SEVEN
FACTORS CONSIDERED IN RENEWING EMERGING MARKETS FUND’S ADVISORY AGREEMENT
The nature, extent and quality of Artisan Partners’ services. The directors concluded that the nature and extent of Artisan Partners’ services to be provided to Emerging Markets Fund was appropriate and consistent with, and in some cases more advantageous to the Fund than, the terms of the Advisory Agreement.
The investment performance of the Fund. The directors concluded that while Emerging Markets Fund had not yet begun operations and had no performance history, the proposed investment team had produced positive results for its clients over the past five years and that based on that information, the prospects for the performance of the Fund were favorable.
Cost of services, economies of scale and benefits to be derived by Artisan Partners. The directors concluded that the overall expected expense ratio of Emerging Markets Fund (after giving effect to Artisan Partners’ undertaking to reimburse the Fund for ordinary operating expenses in excess of 1.50% of the Fund’s average net assets annually) was within an acceptable range of the expense ratios of a peer group of funds selected by Lipper and the proposed fee schedule was fair and reasonable. The directors also concluded that Artisan Partners did not expect to benefit from economies of scale beyond those subsumed in the proposed fee schedule.
Other benefits to be derived by the Fund or Artisan Partners. The directors concluded that, other than the services provided by Artisan Partners pursuant to the Advisory Agreement and the management fees paid in return, Emerging Markets Fund and Artisan Partners may potentially benefit from their relationship with each other in several ways. For Artisan Partners, the directors concluded there were two principal benefits: (1) the potential conversion of a Fund shareholder to a separate account client; and (2) the acquisition of research products and services in return for commissions (“soft dollars”). The directors concluded that, although Artisan Partners may derive those additional benefits, the Fund also could benefit from conversions of separate account clients to Fund shareholders and would benefit from Artisan Partners’ use of soft dollars with respect to its separate account clients.
At the meeting on May 10, 2006, the board approved by the unanimous vote of all directors and also by the unanimous vote of all the “non-interested” directors, the Advisory Agreement for Emerging Markets Fund through November 30, 2007.
48
FORTY-EIGHT
NOTES ON MANAGEMENT’S DISCUSSION OF FUND PERFORMANCE
The discussions of each Fund included in this report include statistical information about the portfolios of each of the Funds. Except as otherwise noted, that information is as of September 30, 2006. That information will vary with changes in a Fund’s portfolio investments. The performance information for each Fund relative to its benchmark index discussed in this report was prepared by the Adviser using information reported by FactSet Databases (“FactSet”). For the purposes of assigning portfolio securities to a particular country, the Adviser considers an issuer to be from a particular country as designated by its securities information vendors. The Adviser currently uses MSCI as its primary source and FactSet as a secondary source for this information. As a result, Artisan Mid Cap Fund routinely holds securities of issuers organized outside the U.S., but with their primary trading markets in the U.S. In addition, Artisan Mid Cap Fund may hold a limited number of non-U.S. securities that are traded in the U.S., directly or as ADRs. Also based on the designations of the securities information vendors, Artisan International Fund routinely holds securities of issuers organized within the U.S. and/or issuers with their primary trading markets in the U.S. Artisan Emerging Markets Fund may hold securities of issuers organized in developed markets or traded in developed markets. In the event (i) the Adviser’s securities information vendors do not assign a security to a particular country or if the published classification appears to be erroneous, or (ii) its primary vendor does not assign a security to a particular country and the secondary vendor has assigned a security to a particular country by using a methodology that is not the same as the methodology the primary vendor uses to assign a country, the Adviser assigns the security to a country using the primary vendor’s published criteria (to the extent available) or the Adviser’s own judgment. The primary information vendor’s criteria include the identity of the jurisdiction of the issuer’s incorporation, the main equity trading market for the issuer’s securities, the geographical distribution of the issuer’s operations and the location of the issuer’s headquarters. Country designations may change over time.
For the purposes of assigning portfolio securities to a particular sector and industry, Artisan Mid Cap Fund assigns securities in accordance with the sector and industry classifications provided by The Frank Russell Company (to the extent available). Artisan International Fund and Artisan Emerging Markets Fund assigns securities for these purposes in accordance with the sector and industry classifications provided by MSCI (to the extent available).
Definitions of Portfolio Statistics
Median Market Cap provides a measure of the market capitalization value of the companies in a portfolio. Market capitalization is the aggregate value of all a company’s outstanding common stock. Market capitalization is calculated by FactSet using the price as of the most recent month-end multiplied by the number of shares outstanding as shown in the financial statements of the issuer. Equal numbers of companies in the portfolio have market capitalizations higher and lower than the median. Weighted Average Market Cap is the average of the market capitalizations of the companies in the portfolio weighted by the size of each company’s position within the portfolio. P/B Ratio is a ratio used to compare a stock’s market value to its book value. Book value is a company’s assets minus its liabilities.
Descriptions of Indices
Each Fund’s performance is compared in this report to changes in one or more indices, including in all cases a broad-based index of changes in prices of securities in the market in which the Fund invests. All of the indices are unmanaged and their returns include reinvested dividends. Unlike the Funds’ returns, the returns of each index do not include the payment of sales commissions or other expenses that would be incurred in the purchase or sale of the securities included in that index. An investment cannot be made directly in an index.
49
FORTY-NINE
NOTES ON MANAGEMENT’S DISCUSSION OF FUND PERFORMANCE
The indices to which the Funds are compared are:
Artisan Emerging Markets Fund – Morgan Stanley Capital International Emerging Markets IndexSM is a market-weighted index of companies in emerging markets.
Artisan International Fund – Morgan Stanley Capital International EAFE® Index (MSCI EAFE®) is a market-weighted index of companies in developed markets, excluding the U.S. and Canada. The Morgan Stanley Capital International EAFE® Growth Index (MSCI EAFE® Growth) is a market-weighted index of companies in developed markets, excluding the U.S. and Canada, with higher price-to-book ratios.
Artisan Mid Cap Fund – Russell Midcap® Index is a market-weighted index of about 800 medium-sized U.S. companies. The Russell Midcap® Growth Index is a market-weighted index of those medium-sized companies included in the Russell Midcap® Index with higher price-to-book ratios and higher forecasted growth values.
Trademarks
Trademarks and copyrights relating to the indices and products of portfolio companies mentioned in this report are owned by their respective owners. Except as otherwise indicated, the trademarks, including names, logos, slogans and service marks appearing in this report are the property of the Adviser and may not be copied, reproduced, published or in any way used without written permission.
PROXY VOTING POLICIES AND PROCEDURES
You may obtain a description of Artisan Funds’ proxy voting policies and procedures, without charge, upon request by calling 800.399.1770. That information also is included in Artisan Funds’ statement of additional information, which is available without charge, upon request, by calling 800.399.1770 and at the Securities and Exchange Commission’s website at www.sec.gov.
Information relating to how Artisan International Fund and Artisan Mid Cap Fund voted proxies relating to portfolio securities held during the twelve months ended June 30 is available on the Funds’ website at www.artisanfunds.com and on the Securities and Exchange Commission’s website at www.sec.gov. Information relating to Artisan Emerging Markets Fund will be available for the twelve months ended June 30, 2007 on its website at www.artemf.com and on the SEC’s website at www.sec.gov in August 2007.
INFORMATION ABOUT PORTFOLIO SECURITIES
Artisan Funds files a complete schedule of portfolio holdings with the Securities and Exchange Commission for the quarters ending December 31 and June 30 (the first and third quarters of the Funds’ fiscal year) on Form N-Q. The Funds’ Forms N-Q are available on the Securities and Exchange Commission’s website at www.sec.gov. You may also review and copy those documents by visiting the Securities and Exchange Commission’s Public Reference Room in Washington, D.C. Information on the operation of the Public Reference Room may be obtained by calling the Securities and Exchange Commission at 800.SEC.0330.
50
FIFTY
DIRECTORS AND OFFICERS
The Board of Directors has overall responsibility for the conduct of the affairs of Artisan Funds. Each director serves an indefinite term of unlimited duration until the next annual meeting of shareholders and until the election and qualification of his or her successor. The Board of Directors may fill any vacancy on the board provided that after such appointment at least two-thirds of the directors have been elected by the shareholders. The shareholders may remove a director by a vote of a majority of the outstanding shares of the Funds at any meeting of shareholders called for the purpose of removing such director.
The Board of Directors elects the officers of Artisan Funds. Each officer serves until the election and qualification of his or her successor, or until he or she sooner dies, resigns, or is removed or disqualified. The Board of Directors may remove any officer with or without cause at any time.
The names and ages of the directors and officers as of November 15, 2006, the position each holds with the Funds, the date each was first elected to office, their principal business occupations and other directorships they have held during the last five years are shown below. Each director oversees all nine series of Artisan Funds.
| | | | | | | | |
| | | | | |
Name and Age at 11/15/06 | | Positions Held with Funds | | Date First Elected
or Appointed to Office | | Principal Occupations during Past 5 Years | | Other Directorships Held |
| Directors who are not “interested persons” |
| David A. Erne – 63 | | Director and Independent Chair of the Board of Directors | | Director since 3/27/95; Independent Chair since 2/4/05 | | Of counsel to the law firm Reinhart Boerner Van Deuren s.c., Milwaukee, WI | | Trustee, Northwestern Mutual Life Insurance Company (individual life insurance, disability insurance and annuity company) |
| Thomas R. Hefty – 59 | | Director | | 3/27/95 | | Retired; Adjunct Faculty, Department of Business and Economics, Ripon College; Of Counsel to the law firm Reinhart Boerner Van Deuren s.c., Milwaukee, WI.; until December 2002, Chairman of the Board and Chief Executive Officer of Cobalt Corporation (provider of managed care and specialty business services) | | None |
| Jeffrey A. Joerres – 46 | | Director | | 8/9/01 | | Chairman of the Board, President and Chief Executive Officer of Manpower Inc. (non-governmental employment service organization) | | Director, Johnson Controls, Inc. (manufacturer of automotive systems and building controls) |
| Patrick S. Pittard – 60 | | Director | | 8/9/01 | | Distinguished Executive in Residence (teaching position), University of Georgia. Until October 2001, Chairman of the Board, President and Chief Executive Officer of Heidrick & Struggles International, Inc. (executive search firm) | | Director, Lincoln National Corporation (insurance and investment management company); Former Chairman of the Board, The University of Georgia Foundation; Member, Board of Regents of the University System of Georgia |
| Howard B. Witt – 66 | | Director | | 3/27/95 | | Retired; Until December 2004, Chairman of the Board, President and Chief Executive Officer of Littelfuse, Inc. (manufacturer of advanced circuit protection devices) | | Director, Franklin Electric Co., Inc. (manufacturer of electric motors) |
51
FIFTY-ONE
DIRECTORS AND OFFICERS
| | | | | | | | |
| | | | | |
Name and Age at 11/15/06 | | Positions Held with Funds | | Date First Elected
or Appointed to Office | | Principal Occupations during Past 5 Years | | Other Directorships Held |
| Director who is an “interested person”* |
| Andrew A. Ziegler – 49 | | Director, President and Chief Executive Officer | | Director since 1/5/95; and Chairman of the Board 1/5/95 - 12/19/03; President since 12/19/03 (Chief Executive Officer continuously since 1/5/95) | | Managing Director of Artisan Partners; Chairman and President of Artisan Distributors; until December 2003, Chairman of Artisan Funds | | None |
| Officers of Artisan Funds |
| Lawrence A. Totsky – 47 | | Chief Financial Officer and Treasurer | | 1/22/98 | | Managing Director and Chief Financial Officer of Artisan Partners; Vice President, Chief Financial Officer and Treasurer of Artisan Distributors | | None |
| Janet D. Olsen – 50 | | General Counsel and Secretary | | 1/18/01 | | Managing Director and General Counsel of Artisan Partners; Vice President and Secretary of Artisan Distributors | | None |
| Brooke J. Billick – 52 | | Chief Compliance Officer | | 8/19/04 | | Chief Compliance Officer and Associate Counsel of Artisan Partners; Chief Compliance Officer of Artisan Distributors; prior to joining Artisan Partners in February 2004, Vice President, Securities Counsel and Corporate Secretary of Marshall & Ilsley Trust Company, N.A. (bank) and M&I Investment Management Corp. (investment adviser) and Chief Legal Officer and Secretary of Marshall Funds, Inc. (mutual fund company) | | None |
| Carlene M. Ziegler – 50 | | Vice President | | 3/27/95 | | Managing Director of Artisan Partners and Portfolio Co-Manager of Artisan Small Cap Fund; until February 2005, Director of Artisan Funds | | None |
| Michael C. Roos – 48 | | Vice President | | 12/19/03 | | Managing Director of Artisan Partners; Vice President of Artisan Distributors; until December 2003, President of Artisan Funds | | None |
| * | Mr. Ziegler is an “interested person” of Artisan Funds, as defined in the Investment Company Act of 1940, because he is a Managing Director of the Adviser and an officer and director of Artisan Investment Corporation (the general partner of the Adviser). Mr. Ziegler and Carlene M. Ziegler (who are married to each other) control the Adviser. Mr. Ziegler is also President of Artisan Distributors, Artisan Funds’ principal underwriter. |
52
FIFTY-TWO
DIRECTORS AND OFFICERS
| | | | | | | | |
| | | | | |
Name and Age at 11/15/06 | | Positions Held with Funds | | Date First Elected
or Appointed to Office | | Principal Occupations during Past 5 Years | | Other Directorships Held |
| Gregory K. Ramirez – 36 | | Assistant Secretary and Assistant Treasurer | | 1/22/98 | | Managing Director, Client Accounting and Administration of Artisan Partners since January 2003, Director of Client Accounting and Administration from January 2000 to December 2002 and Controller of Artisan Partners prior thereto; Assistant Treasurer of Artisan Distributors | | None |
| Sarah A. Johnson – 34 | | Assistant Secretary | | 2/5/03 | | Associate Counsel of Artisan Partners; prior to joining Artisan Partners in July 2002, Associate of the law firm Bell, Boyd & Lloyd LLC, Chicago, IL | | None |
The business address of the director and officers affiliated with Artisan Partners is 875 E. Wisconsin Avenue, Suite 800, Milwaukee, Wisconsin 53202. The addresses of the other directors are: Mr. Erne – 1000 N. Water Street, Milwaukee, Wisconsin 53202; Mr. Hefty – W233 N2080 Ridgeview Parkway, Waukesha, Wisconsin 53188; Mr. Joerres – 5301 North Ironwood, Milwaukee, Wisconsin 53217; and Mr. Pittard and Mr. Witt – c/o Artisan Funds, 875 E. Wisconsin Avenue, Suite 800, Milwaukee, Wisconsin 53202.
Artisan Funds’ statement of additional information (SAI) contains further information about the directors. Please call 800.399.1770 for a free copy of the SAI.
53
FIFTY-THREE
| | | | |
 | | ARTISAN FUNDS P.O. BOX 8412 BOSTON, MA 02266-8412 800.399.1770 | | |
Item 2. Code of Ethics.
(a) Registrant has adopted a code of ethics (the “Code”) that applies to its principal executive officer, principal financial officer and principal accounting officer (the “Covered Officers”).
(b) No disclosures are required pursuant to this Item 2(b).
(c) During the period covered by the report, registrant did not amend the Code.
(d) During the period covered by the report, registrant did not grant any waivers, including implicit waivers, from the provisions of the Code.
(e) Not applicable.
(f) A copy of the Code is filed as Exhibit (a)(1) to this Form N-CSR.
Item 3. Audit Committee Financial Expert.
Registrant’s board of directors has determined that Thomas R. Hefty, member and chairman of the registrant’s audit committee, qualifies as an “audit committee financial expert,” as such term is defined in Instruction 2(b) to Item 3 of Form N-CSR. Mr. Hefty is “independent” as such term is defined in paragraph (a)(2) of Item 3 of Form N-CSR.
Under applicable securities laws, a person who is determined to be an audit committee financial expert will not be deemed an “expert” for any purpose, including without limitation for the purposes of Section 11 of the Securities Act of 1933, as a result of being designated or identified as an audit committee financial expert. The designation or identification of a person as an audit committee financial expert does not impose on such person any duties, obligations, or liabilities that are greater than the duties, obligations, and liabilities imposed on such person as a member of the audit committee and board of directors in the absence of such designation or identification.
Item 4. Principal Accountant Fees and Services.
Aggregate fees billed to the registrant for professional services rendered by the registrant’s accountant are summarized in the tables below. The tables summarize fees billed (or to be billed) by the registrant’s principal accountant for work performed relating to each applicable period identified below.
Fees billed by Ernst & Young LLP:
| | | | | | |
| | | Fiscal Year Ended
September 30, 2006 | | Fiscal Year Ended
September 30, 2005 |
Audit Fees (a) | | $ | 162,725 | | $ | 121,300 |
Audit-Related Fees (b) | | $ | 22,500 | | $ | 21,375 |
Tax Fees (c) | | $ | 159,175 | | $ | 113,750 |
All Other Fees (d) | | | — | | | — |
(a) “Audit Fees” include amounts for professional services rendered by the principal accountant for the audit of the registrant’s annual financial statements and services that are normally provided by the accountant in connection with statutory and regulatory filings or engagements, including fees billed for consents issued in connection with the registrant’s post-effective amendments to the Funds’ registration statements filed for each of the last two fiscal years. (b) “Audit-Related Fees” include amounts for assurance and related services by the principal accountant that are reasonably related to the performance of the audit of the registrant’s financial statements. Audit-related fees have not been reported under the item “audit fees” in the chart above.
The fees billed by Ernst & Young LLP during the fiscal years ended September 30, 2006 and September 30, 2005 include fees billed for services for certain agreed upon procedures performed in conjunction with the semiannual reports to shareholders as of March 31, 2006 and March 31, 2005.
(c) “Tax Fees” include amounts for professional services rendered by the principal accountant for tax compliance, tax advice and tax planning.
The fees billed or earned by Ernst & Young LLP during the fiscal year ended September 30, 2006 include fees billed for (1) the review and preparation of the Funds’ income tax returns for the fiscal year ended September 30, 2006, which have been earned but have not been billed as of the time of this filing; (2) the review of excise tax calculations and preparation of excise tax returns for the calendar year ended December 31, 2006, which also have not yet been billed as of the time of this filing; (3) the use of a PFIC database supplied by Ernst & Young LLP for the fiscal year ended September 30, 2005 and the excise year ended December 31, 2005; (4) the use of a PFIC database supplied by Ernst & Young LLP for the fiscal year ended September 30, 2004 and excise year ended December 31, 2004 (the fees were billed in two parts, the second of which occurred during the fiscal year ended September 30, 2006); and (5) the use of a Qualified Foreign Corporation (QFC) Database supplied by Ernst & Young LLP for the calendar year ended December 31, 2005.
The fees billed by Ernst & Young LLP during the fiscal year ended September 30, 2005 include fees billed for (1) the review and preparation of the Funds’ income tax returns for the fiscal year ended September 30, 2005; (2) the review of excise tax calculations and preparation of excise tax returns for the calendar year ended December 31, 2005; and (3) the use of a PFIC database supplied by Ernst & Young LLP for the fiscal year ended September 30, 2003 and excise year ended December 31, 2003 (the fees were billed in two parts, the second of which occurred during the fiscal year ended September 30, 2005); and (4) the use of a QFC Database supplied by Ernst & Young LLP for the calendar year ended December 31, 2004.
(d) None.
(e)(1) During its regularly scheduled periodic meetings, the registrant’s audit committee considers any requests to pre-approve any audit, audit-related, tax and other services to be provided by the principal accountants of the registrant. The audit committee has authorized its chairman to exercise that authority in the intervals between meetings; and the chairman presents any such pre-approvals to the audit committee at its next regularly scheduled meeting. Under paragraph (c)(7)(i)(C) of Rule 2-01 of Regulation S-X, pre-approval of non-audit services may be waived provided that: 1) the aggregate fees for all such services provided constitutes no more than five percent of the total amount of fees paid by the registrant to its principal accountant during the fiscal year in which services are provided, 2) such services were not recognized by the registrant at the time of engagement as non-audit services and 3) such services are promptly brought to the attention of the audit committee of the registrant and approved prior to the completion of the audit.
(e)(2) No services included in Items 4(b)—(d) above were approved pursuant to paragraph (c)(7)(i)(C) of Rule 2-01 of Regulation S-X.
(f) Less than 50 percent of the hours expended on the principal accountant’s engagement to audit the registrant’s financial statements for the most recent fiscal year were attributed to work performed by persons other than the principal accountant’s full-time, permanent employees.
(g) The aggregate fees billed for the fiscal years ended September 30, 2006 and September 30, 2005 by the registrant’s principal accountant for non-audit services rendered to the registrant are shown in the tables above and described under Items 4(b)—(d) above. For the registrant’s fiscal years ended September 30, 2006 and September 30, 2005, Ernst & Young LLP served as the registrant’s principal accountant and provided no services and billed no fees, for non-audit services rendered to the registrant’s adviser or entities controlling, controlled by or under common control with the adviser.
(h) The audit committee of the registrant’s board of directors has considered whether the provision of non-audit services that were rendered to the registrant’s investment adviser, and any entity controlling, controlled by or under common control with the investment adviser that provides ongoing services to the registrant that were not pre-approved pursuant to paragraph (c)(7)(ii) of Rule 2-01 of Regulation S-X is compatible with maintaining the principal accountant’s independence. The provisions of Rule 2-01(c)(7) were effective on May 6, 2003. No such services were rendered on or after May 6, 2003.
Item 5. Audit Committee of Listed Registrants.
Not applicable.
Item 6. Schedule of Investments.
The Schedule of Investments in securities of unaffiliated issuers is included as part of the annual report to shareholders filed under Item 1 of this Form.
Item 7. Disclosure of Proxy Voting Policies and Procedures for Closed-End Management Investment Companies.
Not applicable.
Item 8. Portfolio Managers of Closed-End Management Investment Companies.
Not applicable.
Item 9. Purchases of Equity Securities by Closed-End Management Investment Company and Affiliated Purchasers.
Not applicable.
Item 10. Submission of Matters to a Vote of Security Holders.
The registrant has a governance and nominating committee, which is responsible for selecting and nominating persons for election or appointment as members of registrant’s board of directors. At a meeting of the committee held on August 19, 2004, the committee adopted guidelines by which the committee, which is comprised entirely of independent directors, will consider any candidates for board membership (whether recommended by a shareholder, the committee, the board of directors or management personnel). The committee has not made any material changes to those procedures, which were disclosed in response to Item 9 of Form N-CSR filed by the registrant on November 30, 2004.
Item 11. Controls and Procedures.
(a) The registrant’s principal executive and principal financial officers have concluded, based on an evaluation of the registrant’s disclosure controls and procedures (as defined in Rule 30a-3(c) under the Investment Company Act of 1940, the “Disclosure Controls”) as of a date within 90 days prior to the filing date (the “Filing Date”) of this Form N-CSR (the “Report”), the Disclosure Controls are effectively designed to ensure that information required to be disclosed by the registrant in the Report is recorded, processed, summarized and reported by the Filing Date, including ensuring that information required to be disclosed in the Report is accumulated and communicated to the registrant’s management, including the registrant’s principal executive officer and principal financial officer, as appropriate to allow timely decisions regarding required disclosure.
(b) There were no changes in the registrant’s internal controls over financial reporting (as defined in Rule 30a-3(d) under the Investment Company Act of 1940) that occurred during the registrant’s most recent fiscal year that have materially affected, or are reasonably likely to materially affect, the registrant’s internal control over financial reporting.
Item 12. Exhibits.
| | | | |
| (a) | | (1) | | Code of Ethics for Principal Executive Officer, Principal Financial Officer and Principal Accounting Officer (as referenced in Item 2 above), attached hereto as Exhibit (a)(1) |
| | |
| | (2) | | Certifications of Andrew A. Ziegler, Principal Executive Officer and Lawrence A. Totsky, Principal Financial Officer pursuant to Rule 30a-2(a) under the Investment Company Act of 1940 (17 CFR 270.30a-2(a)), attached hereto as Exhibits (a)(2)(i) and (a)(2)(ii) |
| | |
| (b) | | | | Certification of Andrew A. Ziegler, Principal Executive Officer and Lawrence A. Totsky, Principal Financial Officer pursuant to Section 906 of the Sarbanes-Oxley Act of 2002, attached hereto as Exhibit (b) |
SIGNATURES
Pursuant to the requirements of the Securities Exchange Act of 1934 and the Investment Company Act of 1940, the registrant has duly caused this report to be signed on its behalf by the undersigned, thereunto duly authorized.
| | |
| ARTISAN FUNDS, INC. |
| |
| By: | | /S/ ANDREW A. ZIEGLER |
| | Andrew A. Ziegler Principal Executive Officer |
| |
| Date: | | December 1, 2006 |
| | |
Pursuant to the requirements of the Securities Exchange Act of 1934 and the Investment Company Act of 1940, this report has been signed below by the following persons on behalf of the registrant and in the capacities and on the dates indicated.
| | |
| |
| By: | | /S/ ANDREW A. ZIEGLER |
| | Andrew A. Ziegler Principal Executive Officer |
| |
| Date: | | December 1, 2006 |
| | |
| | |
| |
| By: | | /S/ LAWRENCE A. TOTSKY |
| | Lawrence A. Totsky Principal Financial Officer |
| |
| Date: | | December 1, 2006 |
| | |