UNITED STATES
SECURITIES AND EXCHANGE COMMISSION
Washington, D.C. 20549
FORM N-CSR
CERTIFIED SHAREHOLDER REPORT OF REGISTERED MANAGEMENT
INVESTMENT COMPANIES
Investment Company Act file number 811-08932
Artisan Funds, Inc.
(Exact name of registrant as specified in charter)
875 East Wisconsin Avenue, Suite 800
Milwaukee, WI 53202
(Address of principal executive offices) (Zip Code)
| | |
| Janet D. Olsen | | Alyssa Albertelli |
| Artisan Funds, Inc. | | Ropes & Gray LLP |
| 875 East Wisconsin Avenue, Suite 800 | | One Metro Center |
| Milwaukee, Wisconsin 53202 | | 700 12th Street, N.W., Suite 900 |
| | Washington, D.C. 20005-3948 |
(Name and address of agents for service)
Registrant’s telephone number, including area code: (414) 390-6100
Date of fiscal year end: 9/30/09
Date of reporting period: 9/30/09
| Item 1. | | Reports to Shareholders. |
A N N U A L
R E P O R T
SEPTEMBER 30, 2009
ARTISAN GLOBAL VALUE FUND
ARTISAN INTERNATIONAL FUND
ARTISAN INTERNATIONAL SMALL CAP FUND
ARTISAN INTERNATIONAL VALUE FUND
ARTISAN MID CAP FUND
ARTISAN MID CAP VALUE FUND
ARTISAN OPPORTUNISTIC GROWTH FUND
ARTISAN OPPORTUNISTIC VALUE FUND
ARTISAN SMALL CAP FUND
ARTISAN SMALL CAP VALUE FUND

ARTISAN
ARTISAN FUNDS, INC.
INVESTOR SHARES
ARTISAN FUNDS
P.O. BOX 8412
BOSTON, MA 02266-8412
This report and the audited financial statements contained herein are provided for the general information of the shareholders of Artisan Funds. Before investing, investors should consider carefully each Fund’s investment objective, risks and charges and expenses. For a prospectus, which contains that information and more information about each Fund, please call 800.344.1770 or visit our website at www.artisanfunds.com. Read it carefully before you invest or send money.
Company discussions are for illustration only and are not intended as recommendations of individual stocks. The discussions present information about the companies believed to be accurate, and the views of the portfolio managers, as of September 30, 2009. That information and those views may change, and the Funds disclaim any obligation to advise shareholders of any such changes. Artisan Emerging Markets Fund, Artisan International Fund, Artisan International Value Fund and Artisan Mid Cap Fund offer other classes of shares. Reports on each of the other classes are available under separate cover.
Artisan Funds offered through Artisan Distributors LLC, member FINRA.
TABLE OF CONTENTS
ARTISAN GLOBAL VALUE FUND (ARTGX)
INVESTMENT PROCESS HIGHLIGHTS
Artisan Global Value Fund employs a bottom-up investment process to construct a diversified portfolio of securities of undervalued U.S. and non-U.S. companies. The Fund’s investment process is focused on identifying what the investment team considers to be high quality, undervalued businesses that offer the potential for superior risk/reward outcomes. The team’s in-depth research process focuses on four key investment characteristics:
Undervaluation. Determining the intrinsic value of the business is the heart of the team’s research process. The team believes that intrinsic value represents the amount that a buyer would pay to own a company’s future cash flows. The team seeks to invest at a significant discount to the team’s estimate of the intrinsic value of a business.
Business quality. The team seeks to invest in companies with histories of generating strong free cash flow, improving returns on capital and strong competitive positions in their industries.
Financial strength. The team believes that investing in companies with strong balance sheets helps to reduce the potential for capital risk and provides company management the ability to build value when attractive opportunities are available.
Shareholder-oriented management. The team’s research process attempts to identify management teams with a history of building value for shareholders.
The Fund primarily invests in common stocks and other equity securities, both within and outside the U.S., with market capitalizations of at least $2 billion at the time of initial purchase.
PERFORMANCE HISTORY
GROWTH OF AN ASSUMED $10,000 INVESTMENT (12/10/2007 to 9/30/2009)
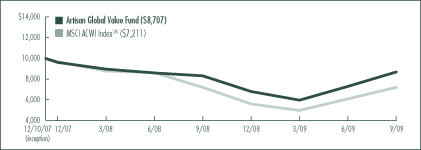
AVERAGE ANNUAL TOTAL RETURNS (as of 9/30/2009)
| | | | | | |
| Fund / Index | | 1-Year | | | Since
Inception | |
Artisan Global Value Fund | | 4.65 | % | | -7.37 | % |
MSCI ACWI (All Country World Index) IndexSM | | -0.11 | | | -16.54 | |
The performance quoted represents past performance, which does not guarantee future results. The investment return and principal value of an investment in the Fund will fluctuate, so that an investor’s shares in the Fund, when redeemed, may be worth more or less than their original cost. The Fund’s return may vary greatly over short periods, and current performance may be materially lower or higher than the performance data quoted. For current to most recent month-end performance information, visit www.artisanfunds.com or call 800.344.1770. The graph and table above do not reflect the deduction of taxes that a shareholder would pay on distributions or sale of Fund shares. The performance shown does not reflect the deduction of a 2% redemption fee on shares held by an investor for 90 days or less and, if reflected, the fee would reduce the performance quoted. The Fund’s performance information reflects Artisan Partners’ agreement to limit the Fund’s expenses to no more than 1.50%, which has been in effect since the Fund’s inception and has had a material impact on the Fund’s performance, which would have been lower in its absence. In addition, the outside directors of Artisan Funds waived that portion of their fees allocable to the Fund through September 30, 2008. Absent that expense waiver, the Fund’s performance would have been lower. See page 91 for a description of each index.
2
INVESTING ENVIRONMENT
Global equities, as measured by the MSCI All Country World IndexSM, posted sharp losses in the first part of the fiscal year and reached a low in early March. From that point, equity markets dramatically recovered, led by financials, materials and industrials, though all sectors and all regions posted positive returns for the twelve months ended September 30, 2009. One of the main drivers of market returns was improvement (or more accurately, less of a decline) in the underlying economy.
SECTOR DIVERSIFICATION
| | | | | | |
| Sector | | 9/30/08 | | | 9/30/09 | |
Consumer Discretionary | | 26.7 | % | | 21.5 | % |
Consumer Staples | | 10.4 | | | 14.2 | |
Energy | | — | | | 2.3 | |
Financials | | 19.4 | | | 22.6 | |
Healthcare | | 15.6 | | | 9.3 | |
Industrials | | 11.0 | | | 14.5 | |
Information Technology | | 11.1 | | | 9.1 | |
Materials | | — | | | 2.4 | |
Telecommunication Services | | 1.8 | | | — | |
Other assets less liabilities | | 4.0 | | | 4.1 | |
Total | | 100.0 | % | | 100.0 | % |
As a percentage of total net assets.
PERFORMANCE DISCUSSION
The Fund gained 4.65% during the twelve-month period ended September 30, 2009, outperforming the MSCI All Country World IndexSM, which decreased -0.11% over the same period.
Performance of the following stocks had a positive impact on the portfolio during the year: Experian PLC, a U.K. credit information firm; Signet Jewelers Ltd., a jewelry retailer in the U.S. and U.K.; Publicis Groupe, a French advertising services company; and Google Inc., a search engine provider.
Notable detractors to performance included: International Speedway Corporation, a motorsports activities promoter in the U.S.; Mohawk Industries, Inc., a floor coverings provider in the U.S.; Marsh & McLennan Companies, Inc., an insurance broker; and Julius Baer Holding AG, a Swiss bank, which we sold during the period.
REGION ALLOCATION
| | | | | | |
| Region | | 9/30/08 | | | 9/30/09 | |
Europe | | 38.5 | % | | 45.2 | % |
Americas | | 47.3 | | | 43.0 | |
Pacific Basin | | 7.2 | | | 6.4 | |
Emerging Markets | | 3.0 | | | 1.3 | |
As a percentage of total net assets.
FUND CHANGES
We remained focused on the intersection of balance sheet strength, business quality and valuation during the past year. Some of the larger additions made to the portfolio included flavor and fragrance maker Givaudan SA, contract caterers Sodexo and Compass Group PLC, medical products maker Covidien plc and low-cost airline Ryanair Holdings PLC. We exited our positions in previously mentioned Google Inc. and wireless operator SK Telecom Co., Ltd.
3
ARTISAN INTERNATIONAL FUND (ARTIX)
INVESTMENT PROCESS HIGHLIGHTS
Artisan International Fund employs a fundamental stock selection process focused on identifying long-term growth opportunities.
Themes. The investment team’s thematic approach identifies catalysts for change and develops investment themes with the objective of capitalizing on them globally. Changing demographics, developing technology, privatization of economic resources and outsourcing are among the long-term catalysts for change that currently form the basis for the team’s investment themes. The team incorporates these catalysts along with sector and regional fundamentals into a long-term global framework for investment analysis and decision-making.
Sustainable Growth. The team applies a fundamental approach to identifying the long term, sustainable growth characteristics of potential investments. The team seeks high quality companies that are well managed, have a dominant or improving market position and competitive advantages compared to industry and regional peers.
Valuation. The team assesses the relationship between its estimate of a company’s sustainable growth prospects and the company’s stock price. The team uses multiple valuation metrics to establish price targets.
The Fund primarily invests in non-U.S. growth companies of all market capitalizations in developed markets and emerging and less developed markets.
PERFORMANCE HISTORY
GROWTH OF AN ASSUMED $10,000 INVESTMENT (12/28/1995 to 9/30/2009)
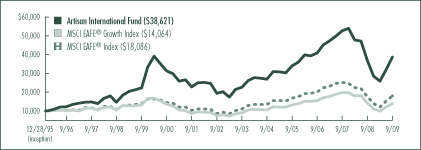
AVERAGE ANNUAL TOTAL RETURNS (as of 9/30/2009)
| | | | | | | | | | | | | | | |
| Fund / Index | | 1-Year | | | 3-Year | | | 5-Year | | | 10-Year | | | Since
Inception | |
Artisan International Fund | | 5.00 | % | | -1.83 | % | | 7.56 | % | | 5.63 | % | | 10.32 | % |
MSCI EAFE® Growth Index | | -0.78 | | | -3.22 | | | 5.75 | | | 0.56 | | | 2.51 | |
MSCI EAFE® Index | | 3.23 | | | -3.60 | | | 6.07 | | | 2.55 | | | 4.40 | |
The performance quoted represents past performance, which does not guarantee future results. The investment return and principal value of an investment in the Fund will fluctuate, so that an investor’s shares in the Fund, when redeemed, may be worth more or less than their original cost. Current performance may be lower or higher than the performance data quoted. For current to most recent month-end performance information, visit www.artisanfunds.com or call 800.344.1770. The graph and table above do not reflect the deduction of taxes that a shareholder would pay on distributions or sale of Fund shares. The performance shown does not reflect the deduction of a 2% redemption fee on shares held by an investor for 90 days or less and, if reflected, the fee would reduce the performance quoted. See page 91 for a description of each index.
4
INVESTING ENVIRONMENT
The MSCI EAFE® Index trended lower for the first part of the fiscal year to a low in early March. Stocks subsequently rebounded sharply, ending the twelve-month reporting period up 3.23%. Emerging markets, as measured by the MSCI Emerging Markets IndexSM, led the recovery from March lows amid stimulus spending and the prospect of a return to economic growth. Similarly, financial stocks rallied off their steep lows, although the sector remains in the red on a trailing twelve-month basis.
SECTOR DIVERSIFICATION
| | | | | | |
| Sector | | 9/30/08 | | | 9/30/09 | |
Consumer Discretionary | | 11.2 | % | | 12.1 | % |
Consumer Staples | | 9.8 | | | 14.2 | |
Energy | | 9.1 | | | 4.5 | |
Financials | | 14.2 | | | 30.7 | |
Healthcare | | 7.9 | | | 10.1 | |
Industrials | | 17.4 | | | 11.2 | |
Information Technology | | 4.7 | | | 6.4 | |
Materials | | 7.4 | | | 6.6 | |
Telecommunication Services | | 3.1 | | | 1.6 | |
Utilities | | 9.4 | | | 1.5 | |
Other assets less liabilities | | 5.8 | | | 1.1 | |
Total | | 100.0 | % | | 100.0 | % |
As a percentage of total net assets.
PERFORMANCE DISCUSSION
The Fund ended the period ahead of the MSCI EAFE® Index with a return of 5.00%. Our outperformance was primarily the result of strong stock selection in the technology, consumer discretionary and financial sectors. ASML Holding N.V. was our key source of strength in the technology sector. Our top performers in the consumer discretionary sector included our retailers (Industria de Diseno Textil, S.A., LVMH Moet Hennessy Louis Vuitton SA and Kingfisher PLC) and automobile companies (SUZUKI MOTOR COPORATION, DENSO CORPORATION and Daimler AG). Within the financial sector, China Resources Land Limited, China Construction Bank Corporation and China Life Insurance Co. were some of our strongest performers.
On the downside, our underweight positions in the telecommunications and energy sectors, two of the better performing sectors over the last twelve months, worked against us. Our positions in the utilities, energy and materials sectors also weighed on performance. RAO Unified Energy System (equity-linked participation certificate) which we sold during the period, was our biggest detractor in the utilities sector. The losses of SeaDrill Ltd., Technip SA and Gazprom hurt our performance in the energy sector. We sold SeaDrill Ltd. and Technip SA during the period.
Regionally, our European holdings outperformed those in the Index and our investments in emerging markets, particularly in China, proved positive. While our underweight position in Japan added relative value, the poor performance of our holdings in Japan and our low exposure to the strong yen outweighed the benefit.
FUND CHANGES
We look to invest in companies with attractive growth rates, trading at reasonable valuations, with exposure to the long-term themes we have identified. Our larger purchases during the period included several financial companies, as well as a number of companies in more defensive sectors. We added Societe Generale, HSBC Holdings plc, Credit Suisse Group AG and ING Groep N.V. in the financial sector, Pernod Ricard SA, Imperial Tobacco Group plc and Heineken NV in the consumer staples sector, and Covidien plc and Novartis AG in the health care sector.
Sales during the period included Alstom S.A., Bouygues SA, Fortum Oyj, LVMH Moet Hennessy Louis Vuitton SA and Redecard SA.
REGION ALLOCATION
| | | | | | |
| Region | | 9/30/08 | | | 9/30/09 | |
Europe | | 61.0 | % | | 68.7 | % |
Emerging Markets | | 15.5 | | | 13.9 | |
Pacific Basin | | 15.0 | | | 9.5 | |
Americas | | 2.2 | | | 6.8 | |
Middle East | | 0.5 | | | — | |
As a percentage of total net assets.
5
ARTISAN INTERNATIONAL SMALL CAP FUND (ARTJX)
INVESTMENT PROCESS HIGHLIGHTS
Artisan International Small Cap Fund employs a fundamental stock selection process focused on identifying long-term growth opportunities among small non-U.S. companies.
Themes. The investment team’s thematic approach identifies catalysts for change and develops investment themes with the objective of capitalizing on them globally. Changing demographics, developing technology, privatization of economic resources and outsourcing are among the long-term catalysts for change that currently form the basis for the team’s investment themes. The team incorporates these catalysts along with sector and regional fundamentals into a long-term global framework for investment analysis and decision-making.
Sustainable Growth. The team applies a fundamental approach to identifying the long term, sustainable growth characteristics of potential investments. The team seeks high quality companies that are well managed, have a dominant or improving market position and competitive advantages compared to industry and regional peers.
Valuation. The team assesses the relationship between its estimate of a company’s sustainable growth prospects and the company’s stock price. The team uses multiple valuation metrics to establish price targets.
The Fund primarily invests in non-U.S. small-cap growth companies in developed and emerging and less developed markets with market capitalizations less than $3 billion at the time of investment.
PERFORMANCE HISTORY
GROWTH OF AN ASSUMED $10,000 INVESTMENT (12/21/2001 to 9/30/2009)
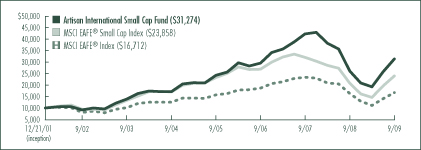
AVERAGE ANNUAL TOTAL RETURNS (as of 9/30/2009)
| | | | | | | | | | | | |
| Fund / Index | | 1-Year | | | 3-Year | | | 5-Year | | | Since
Inception | |
Artisan International Small Cap Fund | | 20.59 | % | | 2.03 | % | | 12.92 | % | | 15.79 | % |
MSCI EAFE® Small Cap Index | | 15.46 | | | -3.79 | | | 7.13 | | | 11.83 | |
MSCI EAFE® Index | | 3.23 | | | -3.60 | | | 6.07 | | | 6.83 | |
The performance quoted represents past performance, which does not guarantee future results. The investment return and principal value of an investment in the Fund will fluctuate, so that an investor’s shares in the Fund, when redeemed, may be worth more or less than their original cost. Current performance may be lower or higher than the performance data quoted. For current to most recent month-end performance information, visit www.artisanfunds.com or call 800.344.1770. The graph and table above do not reflect the deduction of taxes that a shareholder would pay on distributions or sale of Fund shares. The performance shown does not reflect the deduction of a 2% redemption fee on shares held by an investor for 90 days or less and, if reflected, the fee would reduce the performance quoted. The Fund’s investments in initial public offerings (IPOs) made a material contribution to the Fund’s performance. IPO investments are not an integral component of the Fund’s investment process and may not be available in the future. See page 91 for a description of each index.
6
INVESTING ENVIRONMENT
International equities, as measured by the MSCI EAFE® Index, trended lower for the first part of the fiscal year to a low in early March. Stocks subsequently rebounded sharply, recovering the steep losses suffered over the first six months of the fiscal year. Small cap stocks were standouts, outpacing their mid- and large-cap peers, as the MSCI EAFE® Small Cap Index ended the twelve-month reporting period up 15.46%. Almost all sectors in the MSCI EAFE® Small Cap Index ended the period up by double digits. Technology led the way by a considerable margin, gaining almost 30%. Regionally, small-cap emerging markets, up 41% during the period, far outpaced developed markets, although returns varied considerably at the country level.
SECTOR DIVERSIFICATION
| | | | | | |
| Sector | | 9/30/08 | | | 9/30/09 | |
Consumer Discretionary | | 8.5 | % | | 21.8 | % |
Consumer Staples | | 15.8 | | | 20.7 | |
Energy | | 6.1 | | | — | |
Financials | | 22.4 | | | 17.2 | |
Healthcare | | 1.6 | | | 8.4 | |
Industrials | | 21.3 | | | 16.8 | |
Information Technology | | 9.9 | | | 8.8 | |
Materials | | 2.6 | | | 3.5 | |
Other assets less liabilities | | 11.8 | | | 2.8 | |
Total | | 100.0 | % | | 100.0 | % |
As a percentage of total net assets.
PERFORMANCE DISCUSSION
The Fund outpaced the MSCI EAFE® Small Cap Index over the last twelve months with a return of 20.59%. Our outperformance was the result of strong stock selection, most notably in the industrials, technology and consumer staples sectors. Tech holdings Wirecard AG, Aixtron AG and Ebay Gmarket Co Ltd. all added substantially to returns. Rail and mass transport systems supplier Ansaldo STS SpA was a key source of strength in the industrials sector and Hengan International Group Company Limited, a leading consumer products company in China, was our top contributor in the consumer staples sector.
On the downside, our holdings in the energy and financial sectors did not keep pace with those in the Index. Sibir Energy PLC and SeaDrill Ltd. were the biggest detractors among our energy positions (we completely sold out of each position during the period), while Spazio Investment NV, which we also sold, was responsible for the majority of our weakness in the financial sector.
Regionally, our European holdings outperformed those in the Index and our investments in emerging markets, particularly China, proved positive. Our underweight to the strong Japanese yen and the performance of our holdings in Hong Kong and Singapore held back returns in the Far East region.
REGION ALLOCATION
| | | | | | |
| Region | | 9/30/08 | | | 9/30/09 | |
Europe | | 50.0 | % | | 61.4 | % |
Emerging Markets | | 24.8 | | | 23.3 | |
Pacific Basin | | 12.3 | | | 10.2 | |
Americas | | 1.1 | | | 2.3 | |
As a percentage of total net assets.
FUND CHANGES
We seek companies with attractive growth rates, trading at reasonable valuations, with exposure to the long-term themes we have identified. Our larger purchases during the period included food manufacturer Premier Foods PLC, health care group SSL International plc, luxury products manufacturer Bulgari S.p.A., online dating services provider Meetic and property developer The Berkeley Group Holdings PLC.
Two of our holdings were acquired during the period, however, we sold our positions prior to the completion of those acquisitions. Gmarket Inc. (now EBay Gmarket Co Ltd.) was acquired by eBay Inc. and USJ Co., Ltd. was bought out by its primary shareholder, The Goldman Sachs Group, Inc. Other sales during the period included Aixtron AG, Empresas ICA S.A.B. de C.V., Spazio Investment NV and Tod’s S.p.A.
7
ARTISAN INTERNATIONAL VALUE FUND (ARTKX)
INVESTMENT PROCESS HIGHLIGHTS
Artisan International Value Fund employs a bottom-up investment process to construct a diversified portfolio of stocks of undervalued non-U.S. companies. The Fund’s investment process is focused on identifying what the investment team believes are high quality, undervalued businesses that offer the potential for superior risk/reward outcomes. The team’s in-depth research process focuses on four key investment characteristics:
Undervaluation. Determining the intrinsic value of the business is the heart of the team’s research process. The team believes that intrinsic value represents the amount that a buyer would pay to own a company’s future cash flows. The team seeks to invest at a significant discount to its estimate of the intrinsic value of a business.
Business quality. The team seeks to invest in companies with histories of generating strong free cash flow, improving returns on capital and strong competitive positions in their industries.
Financial strength. The team believes that investing in companies with strong balance sheets helps to reduce the potential for capital risk and provides company management the ability to build value when attractive opportunities are available.
Shareholder-oriented management. The team’s research process attempts to identify management teams with a history of building value for shareholders.
The Fund primarily invests in common stocks and other equity securities of non-U.S. companies of all market capitalizations in developed and emerging markets.
PERFORMANCE HISTORY
GROWTH OF AN ASSUMED $10,000 INVESTMENT (9/23/2002 to 9/30/2009)
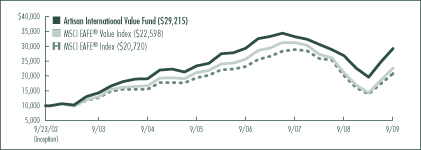
AVERAGE ANNUAL TOTAL RETURNS (as of 9/30/2009)
| | | | | | | | | | | | |
| Fund / Index | | 1-Year | | | 3-Year | | | 5-Year | | | Since
Inception | |
Artisan International Value Fund | | 8.95 | % | | -0.05 | % | | 8.96 | % | | 16.50 | % |
MSCI EAFE® Value Index | | 7.35 | | | -4.08 | | | 6.32 | | | 12.32 | |
MSCI EAFE® Index | | 3.23 | | | -3.60 | | | 6.07 | | | 10.94 | |
The performance quoted represents past performance, which does not guarantee future results. The investment return and principal value of an investment in the Fund will fluctuate, so that an investor’s shares in the Fund, when redeemed, may be worth more or less than their original cost. Current performance may be lower or higher than the performance data quoted. For current to most recent month-end performance information, visit www.artisanfunds.com or call 800.344.1770. The graph and table above do not reflect the deduction of taxes that a shareholder would pay on distributions or sale of Fund shares. The performance shown does not reflect the deduction of a 2% redemption fee on shares held by an investor for 90 days or less and, if reflected, the fee would reduce the performance quoted. See page 91 for a description of each index.
8
INVESTING ENVIRONMENT
International equities, as measured by the MSCI EAFE® Index, posted sharp losses in the first part of the fiscal year and reached a low in early March. From that point, equity markets dramatically recovered. Financials, materials and industrials led the way, though all sectors and all regions posted positive returns for the twelve months ended September 30, 2009. One of the main drivers of market returns was improvement (or more accurately, less of a decline) in the underlying economy.
SECTOR DIVERSIFICATION
| | | | | | |
| Sector | | 9/30/08 | | | 9/30/09 | |
Consumer Discretionary | | 22.3 | % | | 23.4 | % |
Consumer Staples | | 13.0 | | | 10.0 | |
Energy | | — | | | 4.7 | |
Financials | | 19.0 | | | 17.9 | |
Healthcare | | 13.5 | | | 8.8 | |
Industrials | | 15.1 | | | 14.6 | |
Information Technology | | 8.3 | | | 6.1 | |
Materials | | 2.2 | | | 3.2 | |
Telecommunication Services | | 1.6 | | | 1.4 | |
Other assets less liabilities | | 5.0 | | | 9.9 | |
Total | | 100.0 | % | | 100.0 | % |
As a percentage of total net assets.
PERFORMANCE DISCUSSION
The Fund gained 8.95% during the twelve-month period ended September 30, 2009, outperforming the MSCI EAFE® Index, which increased 3.23% over the same period. Our outperformance in the first half of the fiscal year was the key driver of strength.
Performance of the following stocks had a positive impact on the portfolio during the year: Publicis Groupe, a French advertising services company; Experian PLC, a U.K. credit information firm; Signet Jewelers Ltd., a jewelry retailer in the U.S. and U.K.; and Panalpina Welttransport Holding AG, a Swiss logistics provider. Notable detractors included Julius Baer Holding AG, a Swiss bank, which we sold during the period; Covidien plc, a medical products maker; MEITEC CORPORATION, a Japanese engineering outsourcing firm; and Kimberly-Clark de Mexico, S.A.B. de C.V., a paper products manufacturer.
FUND CHANGES
We remained focused on the intersection of balance sheet strength, business quality and valuation during the past year. Some of the more recent additions to the portfolio were contract caterer Compass Group PLC, technology services provider Accenture PLC and packaged food company Nestle SA. We exited our positions in memory chip manufacturer Samsung Electronics Co., Ltd., cosmetics maker L’Oreal SA, dental implant manufacturer Nobel Biocare Holding AG, financial services provider IGM Financial, Inc. and residential property website operator Rightmove PLC.
REGION ALLOCATION
| | | | | | |
| Region | | 9/30/08 | | | 9/30/09 | |
Europe | | 63.8 | % | | 64.2 | % |
Americas | | 10.7 | | | 13.0 | |
Pacific Basin | | 14.2 | | | 10.2 | |
Emerging Markets | | 6.3 | | | 2.7 | |
As a percentage of total net assets.
9
ARTISAN MID CAP FUND (ARTMX)
INVESTMENT PROCESS HIGHLIGHTS
Artisan Mid Cap Fund employs a bottom-up investment process to construct a diversified portfolio of primarily U.S. mid-cap growth companies. The Fund’s investment process focuses on two distinct areas – security selection and capital allocation.
The Fund’s investment team attempts to identify companies that possess franchise characteristics that are selling at attractive valuations and benefiting from an accelerating profit cycle.
Franchise characteristics. These are characteristics that the team believes help to protect a company’s stream of cash flow from the effects of competition. The team looks for companies with at least two of the following characteristics: low cost production capability, possession of a proprietary asset, dominant market share or a defensible brand name.
Attractive valuations. Through its own fundamental research, the team estimates the amount a buyer would pay to buy the entire company (the company’s “intrinsic value” or “private market value”) and considers whether to purchase a stock if it sells at a discount to that estimate.
Accelerating profit cycle. The team tries to invest in companies that are well positioned for long-term growth, at an early enough stage in their profit cycle to benefit from the increased cash flows produced by the profit cycle.
Based on the investment team’s fundamental analysis of a company’s profit cycle, portfolio holdings develop through three stages. GardenSM investments are small positions in the early part of their profit cycle that will warrant a more sizeable allocation once their profit cycle accelerates. CropSM investments are positions that are being increased to a full weight because they are moving through the strongest part of their profit cycle. HarvestSM investments are positions that are being reduced as they near the team’s estimate of full valuation or their profit cycle begins to decelerate.
PERFORMANCE HISTORY
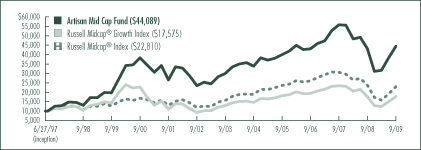
GROWTH OF AN ASSUMED $10,000 INVESTMENT (6/27/1997 to 9/30/2009)
AVERAGE ANNUAL TOTAL RETURNS (as of 9/30/2009)
| | | | | | | | | | | | | | | |
| Fund / Index | | 1-Year | | | 3-Year | | | 5-Year | | | 10-Year | | | Since
Inception | |
Artisan Mid Cap Fund | | 2.47 | % | | 1.04 | % | | 5.52 | % | | 8.44 | % | | 12.86 | % |
Russell Midcap® Growth Index | | -0.40 | | | -3.10 | | | 3.75 | | | 2.18 | | | 4.71 | |
Russell Midcap® Index | | -3.55 | | | -4.07 | | | 3.89 | | | 6.05 | | | 6.96 | |
The performance quoted represents past performance, which does not guarantee future results. The investment return and principal value of an investment in the Fund will fluctuate, so that an investor’s shares in the Fund, when redeemed, may be worth more or less than their original cost. Current performance may be lower or higher than the performance data quoted. For current to most recent month-end performance information, visit www.artisanfunds.com or call 800.344.1770. The graph and table above do not reflect the deduction of taxes that a shareholder would pay on distributions or sale of Fund shares. See page 91 for a description of each index.
10
INVESTING ENVIRONMENT
During the fiscal year ended September 30, 2009, the performance of mid-cap stocks was fairly volatile. Through early March, mid-cap stocks sank along with the broader market amid worsening economic conditions and turmoil in the financial sector. Mid-cap stocks then rebounded sharply on increasing signs of stabilization in the financial system and economy. The Russell Midcap® Index declined -3.55% over the full fiscal year. Growth stocks held up better than value names as the Russell Midcap® Growth Index was almost unchanged at -0.40%, while its value counterpart fell -7.12%. Within the Growth Index, sector returns diverged. Some sectors advanced, including technology, consumer discretionary and materials, while financial and telecommunications stocks were down by double-digit percentages.
SECTOR DIVERSIFICATION
| | | | | | |
| Sector | | 9/30/08 | | | 9/30/09 | |
Consumer Discretionary | | 7.7 | % | | 16.0 | % |
Consumer Staples | | 4.8 | | | 3.0 | |
Energy | | 4.0 | | | 2.1 | |
Financials | | 8.0 | | | 6.5 | |
Healthcare | | 25.4 | | | 17.8 | |
Industrials | | 14.9 | | | 13.2 | |
Information Technology | | 28.5 | | | 34.7 | |
Materials | | 1.6 | | | 2 .4 | |
Telecommunication Services | | 0.4 | | | — | |
Utilities | | 2.0 | | | — | |
Exchange Traded Funds | | — | | | 0.7 | |
Other assets less liabilities | | 2.7 | | | 3.6 | |
Total | | 100.0 | % | | 100.0 | % |
As a percentage of total net assets.
PERFORMANCE DISCUSSION
The Fund returned 2.47% in the period, outperforming the Russell Midcap® and Russell Midcap® Growth indices. Relative to the benchmarks, the Fund benefited from strong security selection, particularly among our health care, consumer discretionary and industrials holdings, although our leading performers came from a variety of sectors. Our outsized position in the technology sector was also beneficial. Our positive results in the health care sector were driven by Cerner Corporation, a health care information technology company, specialty pharmaceuticals company Allergan, Inc. and Intuitive Surgical, Inc., a maker of minimally invasive robotic surgical systems. Department store operator Kohl’s Corporation and Precision Castparts Corp., a manufacturer of complex metal components, were leading contributors to our return in the consumer discretionary and industrials sectors, respectively. Other standout performers included Broadcom Corporation, Red Hat, Inc. and NVIDIA Corporation.
Among the largest sources of weakness compared to the benchmarks were our utilities and energy holdings. Independent power producers Calpine Corporation and Dynegy Inc. and energy equipment and service provider Smith International, Inc. were among our worst performing utilities and energy holdings.
FUND CHANGES
The most notable changes to the portfolio during the period were increased exposure to the consumer discretionary and information technology sectors and a reduced weighting in the health care sector. In the consumer discretionary sector, we added to our position in Kohl’s Corporation and purchased several new holdings including Dick’s Sporting Goods, Inc., O’Reilly Automotive Inc. and Coach, Inc. In the information technology sector, new purchases included Agilent Technologies, Inc., Citrix Systems, Inc. and ANSYS, Inc., among others.
Our reduced weighting in the health care sector was due in part to the sales of Thermo Fisher Scientific, Inc., Gen-Probe Incorporated and Celgene Corporation. In addition to those sales in health care, our new purchases were funded with the sales of Cooper Industries, Ltd., AGCO Corporation, Intermec, Inc. and Calpine Corporation, among others.
11
ARTISAN MID CAP VALUE FUND (ARTQX)
INVESTMENT PROCESS HIGHLIGHTS
Artisan Mid Cap Value Fund employs a bottom-up investment process to construct a diversified portfolio of stocks of medium-sized U.S. companies that the investment team believes are undervalued, in solid financial condition and have attractive business economics. The team believes companies with these characteristics are less likely to experience eroding values over the long term.
Attractive valuation. The team values a business using what it believes are reasonable expectations for the long-term earnings power and capitalization rates of that business. This results in a range of values for the company that the team believes would be reasonable. The team generally will purchase a security if the stock price falls below or toward the lower end of that range.
Sound financial condition. The team favors companies with an acceptable level of debt and positive cash flow. At a minimum, the team tries to avoid companies that have so much debt that management may be unable to make decisions that would be in the best interests of the companies’ shareholders.
Attractive business economics. The team favors cash-producing businesses that it believes are capable of earning acceptable returns on capital over the company’s business cycle.
The Fund generally will not initiate a position in a company unless it has a market capitalization between $2 billion and $15 billion.
PERFORMANCE HISTORY
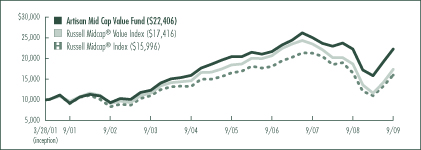
GROWTH OF AN ASSUMED $10,000 INVESTMENT (3/28/2001 to 9/30/2009)
AVERAGE ANNUAL TOTAL RETURNS (as of 9/30/2009)
| | | | | | | | | | | | |
| Fund / Index | | 1-Year | | | 3-Year | | | 5-Year | | | Since
Inception | |
Artisan Mid Cap Value Fund | | 0.21 | % | | 1.04 | % | | 7.00 | % | | 9.94 | % |
Russell Midcap® Value Index | | -7.12 | | | -5.65 | | | 3.53 | | | 6.74 | |
Russell Midcap® Index | | -3.55 | | | -4.07 | | | 3.89 | | | 5.68 | |
The performance quoted represents past performance, which does not guarantee future results. The investment return and principal value of an investment in the Fund will fluctuate, so that an investor’s shares in the Fund, when redeemed, may be worth more or less than their original cost. Current performance may be lower or higher than the performance data quoted. For current to most recent month-end performance information, visit www.artisanfunds.com or call 800.344.1770. The graph and table above do not reflect the deduction of taxes that a shareholder would pay on distributions or sale of Fund shares. See page 91 for a description of each index.
12
INVESTING ENVIRONMENT
For the twelve-month period ended September 30, 2009, the Russell Midcap® Value and Russell Midcap® indices returned -7.12% and -3.55%, respectively. The past year has been a tale of two halves. In the first half, markets continued to decline amidst the recessionary environment and both indices declined more than -40% through March 9, 2009. Mid-cap equities subsequently began to rebound and rallied more than 75% from March 10, 2009 through September 30, 2009. The sectors that suffered the biggest losses in the first half, such as financials, consumer discretionary, materials and industrials, were among those that rebounded the most in the latter half of the period. The traditionally defensive utilities and consumer staples sectors held up the best through the decline, but rallied the least.
SECTOR DIVERSIFICATION
| | | | | | |
| Sector | | 9/30/08 | | | 9/30/09 | |
Consumer Discretionary | | 18.3 | % | | 12.3 | % |
Consumer Staples | | 0.8 | | | 6.9 | |
Energy | | 4.4 | | | 10.3 | |
Financials | | 19.4 | | | 13.9 | |
Healthcare | | 2.0 | | | 6.8 | |
Industrials | | 27.6 | | | 22.9 | |
Information Technology | | 20.5 | | | 16.4 | |
Utilities | | 0.8 | | | 3.1 | |
Other assets less liabilities | | 6.2 | | | 7.4 | |
Total | | 100.0 | % | | 100.0 | % |
As a percentage of total net assets.
PERFORMANCE DISCUSSION
The Fund returned 0.21% during the twelve-month period ended September 30, 2009 outperforming the Russell Midcap® Value and Russell Midcap® indices. Our holdings in the financials sector were among our worst absolute performers. However, our stocks in that sector held up considerably better than those in the Russell Midcap® Value Index and contributed to our relative outperformance. In particular, we benefited from positive stock selection in the insurance industry. Our results were also helped by our lack of investment in banks and our minimal investment in REITs, as both industries suffered losses in excess of -25%.
We had a similar experience in the industrials sector, where we were not immune to the market weakness, but our losses were smaller than those of the Russell Midcap® Value Index. Strong stock selection in the consumer discretionary and technology sectors contributed positively to our performance during the period.
From an individual stock perspective, our leading performers included LCD glass manufacturer Corning Incorporated, automotive powertrain systems manufacturer BorgWarner Inc., design software developer Autodesk, Inc., mortgage REIT Annaly Capital Management, Inc. and cruise line operator Carnival Corporation. Our biggest decliners during the period included insurance provider White Mountains Insurance Group, Ltd., trucking companies Con-way Inc. and Ryder System, Inc., student loan originator The Student Loan Corporation and floor coverings manufacturer Mohawk Industries, Inc.
FUND CHANGES
The most recent additions to the portfolio included surgical and medical products manufacturer Stryker Corporation, supermarket operator The Kroger Co., prime system contractor L-3 Communications Holdings, Inc., fast food restaurant chain operator Burger King Holdings, Inc. and soup and food manufacturer Campbell Soup Company. On the sale side, we exited our positions in Corning Incorporated, recreational vehicles manufacturer Thor Industries, Inc., defense company General Dynamics Corporation, White Mountains Insurance Group, Ltd. and energy-related utility holding company TECO Energy, Inc.
13
ARTISAN OPPORTUNISTIC GROWTH FUND (ARTRX)
INVESTMENT PROCESS HIGHLIGHTS
Artisan Opportunistic Growth Fund employs a bottom-up investment process to construct a diversified portfolio of growth companies across a broad capitalization range. The Fund’s investment process focuses on two distinct areas – security selection and capital allocation.
The Fund’s investment team attempts to identify companies that possess franchise characteristics that are selling at attractive valuations and benefiting from an accelerating profit cycle.
Franchise characteristics. These are characteristics that the team believes help to protect a company’s stream of cash flow from the effects of competition. The team looks for companies with at least two of the following characteristics: low cost production capability, possession of a proprietary asset, dominant market share or a defensible brand name.
Attractive valuations. Through its own fundamental research, the team estimates the amount a buyer would pay to buy the entire company (the company’s “intrinsic value” or “private market value”) and considers whether to purchase a stock if it sells at a discount to that estimate.
Accelerating profit cycle. The team tries to invest in companies that are well positioned for long-term growth, at an early enough stage in their profit cycle to benefit from the increased cash flows produced by the profit cycle.
Based on the investment team’s fundamental analysis of a company’s profit cycle, portfolio holdings develop through three stages. GardenSM investments are small positions in the early part of their profit cycle that will warrant a more sizeable allocation once their profit cycle accelerates. CropSM investments are positions that are being increased to a full weight because they are moving through the strongest part of their profit cycle. HarvestSM investments are positions that are being reduced as they near the team’s estimate of full valuation or their profit cycle begins to decelerate.
PERFORMANCE HISTORY
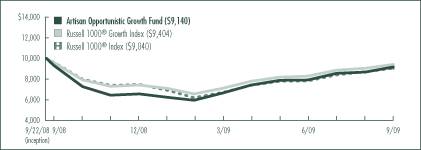
GROWTH OF AN ASSUMED $10,000 INVESTMENT (9/22/2008 to 9/30/2009)
AVERAGE ANNUAL TOTAL RETURNS (as of 9/30/2009)
| | | | | | |
| Fund / Index | | 1-Year | | | Since
Inception | |
Artisan Opportunistic Growth Fund | | -1.93 | % | | -8.42 | % |
Russell 1000® Growth Index | | -1.85 | | | -5.84 | |
Russell 1000® Index | | -6.14 | | | -9.41 | |
The performance quoted represents past performance, which does not guarantee future results. The investment return and principal value of an investment in the Fund will fluctuate, so that an investor’s shares in the Fund, when redeemed, may be worth more or less than their original cost. The Fund’s return may vary greatly over short periods, and current performance may be materially lower or higher than the performance data quoted. For current to most recent month-end performance information, visit www.artisanfunds.com or call 800.344.1770. The table above does not reflect the deduction of taxes that a shareholder would pay on distributions or sale of Fund shares. The Fund’s performance information reflects Artisan Partners’ agreement to limit the Fund’s expenses to no more than 1.50%, which has been in effect since the Fund’s inception and has had a material impact on the Fund’s performance, which would have been lower in its absence. In addition, the outside directors of Artisan Funds have waived that portion of their fees allocable to the Fund until September 30, 2009. Absent that expense waiver, the Fund’s performance would have been lower. See page 91 for a description of each index.
14
INVESTING ENVIRONMENT
During the fiscal year ended September 30, 2009, the performance of stocks was fairly volatile. Through early March, stocks sank amid worsening economic conditions and turmoil in the financial sector. Stocks then rebounded sharply on increasing signs of stabilization in the financial system and the broader economy. The Russell 1000® Index declined -6.14% over the full fiscal year. Growth stocks held up better than value names as the Russell 1000® Growth Index fell -1.85%, while its value counterpart lost -10.62%. Within the Russell 1000® Index, most sectors finished lower, although there was a fair amount of dispersion in returns. The financials sector, which has been at the center of the credit crisis, dropped more than -20%, while the information technology and consumer discretionary sectors managed to notch gains.
SECTOR DIVERSIFICATION
| | | | | | |
| Sector | | 9/30/08 | | | 9/30/09 | |
Consumer Discretionary | | 6.4 | % | | 15.1 | % |
Consumer Staples | | 10.2 | | | — | |
Energy | | 2.0 | | | 4.3 | |
Financials | | 12.2 | | | 7.8 | |
Healthcare | | 19.2 | | | 12.6 | |
Industrials | | 10.2 | | | 10.9 | |
Information Technology | | 31.3 | | | 41.8 | |
Materials | | 1.9 | | | 1.4 | |
Telecommunication Services | | 1.1 | | | — | |
Other assets less liabilities | | 5.5 | | | 6.1 | |
Total | | 100.0 | % | | 100.0 | % |
As a percentage of total net assets.
PERFORMANCE DISCUSSION
For the one-year period ended September 30, 2009, the Fund returned -1.93%. Our top performers were consumer electronics company Apple Inc., semiconductor company Broadcom Corporation, specialty coffee retailer Starbucks Corporation, Brazilian energy company Petroleo Brasileiro S.A. and auto components producer Johnson Controls, Inc. The Fund’s largest decliners were video game publisher Electronic Arts Inc., money transfer company The Western Union Company, credit card issuer Discover Financial Services, scientific equipment and consumables provider Thermo Fisher Scientific, Inc. and derivatives exchange operator CME Group Inc.
FUND CHANGES
The investment team seeks companies that possess franchise characteristics that are selling at attractive valuations and benefiting from an accelerating profit cycle. During the twelve-month period ended September 30, 2009, our purchases included EMC Corporation, Apple Inc., eBay Inc., Johnson Controls, Inc. and Citrix Systems, Inc.
Those purchases were partially funded with sales of Electronic Arts Inc., Philip Morris International Inc., Thermo Fisher Scientific, Inc., The Western Union Company and Microsoft Corporation, among others.
REGION ALLOCATION
| | | | | | |
| Region | | 9/30/08 | | | 9/30/09 | |
Americas | | 89.5 | % | | 79.8 | % |
Europe | | 3.9 | | | 12.2 | |
Emerging Markets | | 1.1 | | | 1.9 | |
As a percentage of total net assets.
15
ARTISAN OPPORTUNISTIC VALUE FUND (ARTLX)
INVESTMENT PROCESS HIGHLIGHTS
Artisan Opportunistic Value Fund employs a bottom-up investment process to construct a diversified portfolio of stocks that the team believes are undervalued, in solid financial condition with attractive business economics. The team believes companies with these characteristics are less likely to experience eroding values over the long term.
Attractive valuation. The team values a business using what it believes are reasonable expectations for the long-term earnings power and capitalization rates of that business. This results in a range of values for the company that the team believes would be reasonable. The team generally will purchase a security if the stock price falls below or toward the lower end of that range.
Sound financial condition. The team favors companies with an acceptable level of debt and positive cash flow. At a minimum, the team tries to avoid companies that have so much debt that management may be unable to make decisions that would be in the best interest of the companies’ shareholders.
Attractive business economics. The team favors cash-producing businesses that it believes are capable of earning acceptable returns on capital over the company’s business cycle.
The Fund will invest in U.S. companies with market capitalizations of at least $2 billion at the time of initial purchase, and may invest up to 25% of its net assets at market value at the time of purchase in non-U.S. securities.
PERFORMANCE HISTORY
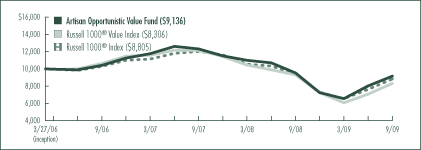
GROWTH OF AN ASSUMED $10,000 INVESTMENT (3/27/2006 to 9/30/2009)
AVERAGE ANNUAL TOTAL RETURNS (as of 9/30/2009)
| | | | | | | | | |
| Fund / Index | | 1-Year | | | 3-Year | | | Since
Inception | |
Artisan Opportunistic Value Fund | | -4.10 | % | | -4.26 | % | | -2.54 | % |
Russell 1000® Value Index | | -10.62 | | | -7.87 | | | -5.15 | |
Russell 1000® Index | | -6.14 | | | -5.10 | | | -3.56 | |
The performance quoted represents past performance, which does not guarantee future results. The investment return and principal value of an investment in the Fund will fluctuate, so that an investor’s shares in the Fund, when redeemed, may be worth more or less than their original cost. Current performance may be lower or higher than the performance data quoted. For current to most recent month-end performance information, visit www.artisanfunds.com or call 800.344.1770. The graph and table above do not reflect the deduction of taxes that a shareholder would pay on distributions or sale of Fund shares. See page 91 for a description of each index.
16
INVESTING ENVIRONMENT
For the twelve-month period ended September 30, 2009, the Russell 1000® Value and Russell 1000® indices returned -10.62% and -6.14%, respectively. The past year has been a tale of two halves. In the first half, markets continued to decline amidst the recessionary environment and both indices declined more than -40% through March 9, 2009. Large-cap equities subsequently began to rebound and rallied more than 59% from March 10, 2009 through September 30, 2009. The sectors that suffered the biggest losses in the first half, such as financials, industrials, materials and consumer discretionary, were those that rebounded the most in the latter half of the period. The traditionally defensive consumer staples, health care and utilities sectors held up the best through the declines, but were among those that rallied the least.
SECTOR DIVERSIFICATION
| | | | | | |
| Sector | | 9/30/08 | | | 9/30/09 | |
Consumer Discretionary | | 11.9 | % | | 12.6 | % |
Consumer Staples | | 0.8 | | | 14.2 | |
Energy | | 4.7 | | | 5.8 | |
Financials | | 18.0 | | | 18.9 | |
Healthcare | | 2.6 | | | 10.8 | |
Industrials | | 13.8 | | | 8.3 | |
Information Technology | | 44.0 | | | 26.5 | |
Other assets less liabilities | | 4.2 | | | 2.9 | |
Total | | 100.0 | % | | 100.0 | % |
As a percentage of total net assets.
PERFORMANCE DISCUSSION
For the twelve-month period ended September 30, 2009, the Fund returned -4.10%, outperforming the Russell 1000® Value and Russell 1000® indices. Our strongest positive contributors to performance included energy company Apache Corporation, mortgage REIT Annaly Capital Management, Inc., entertainment company The Walt Disney Company, tobacco company Philip Morris International Inc. and staffing firm Manpower Inc. The Fund’s biggest decliners during the period included investment management firm AllianceBernstein Holding LP, insurance company The Allstate Corporation, floor coverings manufacturer Mohawk Industries, Inc., electronic components distributor Arrow Electronics, Inc. and oil refiner Valero Energy Corporation.
FUND CHANGES
The most recent additions to the portfolio included global security company Lockheed Martin Corporation, discount retailer Wal-Mart Stores, Inc., supermarket operator The Kroger Co., fast food restaurant chain operator McDonald’s Corporation and multinational food company Nestle SA. On the sale side, we exited our positions in Valero Energy Corporation, defense company General Dynamics Corporation, Manpower Inc., commercial aircraft manufacturer The Boeing Company and data networking solutions provider Cisco Systems, Inc.
REGION ALLOCATION
| | | | | | |
| Region | | 9/30/08 | | | 9/30/09 | |
Americas | | 88.5 | % | | 89.4 | % |
Europe | | 4.4 | | | 7.7 | |
Emerging Markets | | 2.9 | | | — | |
As a percentage of total net assets.
17
ARTISAN SMALL CAP FUND (ARTSX)
INVESTMENT PROCESS HIGHLIGHTS
During the period Artisan Small Cap Fund employed the following bottom-up investment process to construct a diversified portfolio of U.S. small-cap growth companies.
Competitive advantages. A sustainable competitive advantage is critical to producing above-average growth and profitability. Identifying the source of a company’s competitive advantage lends confidence to the team’s assessment of intrinsic value.
Return on invested capital. The team believes that, over time, a company with improving returns on its invested capital will be rewarded with a higher valuation. The team determines how much capital investment is needed to achieve a company’s continued growth and analyzes management’s ability to use that capital in the most effective way to support that growth.
Intrinsic value. The team estimates a company’s intrinsic value—the value it thinks a buyer would pay to buy the entire company. The team bases its buy and sell targets for a company’s stock on its intrinsic value estimates.
The Fund will not initiate a position in a company unless it has a market capitalization of less than $2.5 billion and meets the team’s standards for earnings growth and sustainable growth prospects.
Effective October 1, 2009, Artisan Small Cap Fund will be managed by Craigh Cepukenas, Andrew Stephens and James Hamel. Mr. Stephens and Mr. Hamel also manage Artisan Mid Cap Fund and Artisan Opportunistic Growth Fund.
PERFORMANCE HISTORY
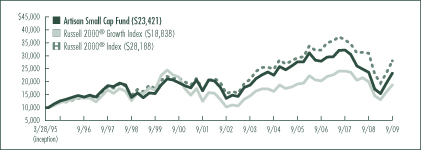
GROWTH OF AN ASSUMED $10,000 INVESTMENT (3/28/1995 to 9/30/2009)
AVERAGE ANNUAL TOTAL RETURNS (as of 9/30/2009)
| | | | | | | | | | | | | | | |
| Fund / Index | | 1-Year | | | 3-Year | | | 5-Year | | | 10-Year | | | Since
Inception | |
Artisan Small Cap Fund | | -1.73 | % | | -5.83 | % | | 0.63 | % | | 4.19 | % | | 6.04 | % |
Russell 2000® Growth Index | | -6.32 | | | -2.60 | | | 2.91 | | | 1.10 | | | 4.46 | |
Russell 2000® Index | | -9.55 | | | -4.57 | | | 2.41 | | | 4.88 | | | 7.40 | |
The performance quoted represents past performance, which does not guarantee future results. The investment return and principal value of an investment in the Fund will fluctuate, so that an investor’s shares in the Fund, when redeemed, may be worth more or less than their original cost. Current performance may be lower or higher than the performance data quoted. For current to most recent month-end performance information, visit www.artisanfunds.com or call 800.344.1770. The graph and table above do not reflect the deduction of taxes that a shareholder would pay on distributions or sale of Fund shares. See page 91 for a description of each index.
18
INVESTING ENVIRONMENT
During the fiscal year ended September 30, 2009, the performance of small-cap stocks was fairly volatile. Through early March, small-cap stocks sank along with the market generally amid worsening economic conditions and turmoil in the financial sector. Small-cap stocks then rebounded sharply on increasing signs of stabilization in the financial system and the broader economy. Small-cap stocks underperformed mid- and large-cap stocks for the year, as the Russell 2000® and Russell 2000® Growth indices dropped -9.55% and -6.32%, respectively. Within the Russell 2000® Growth Index, most sectors finished lower, although there was a fair amount of dispersion in returns. The energy, industrials and financials sectors each fell by double-digit percentages. The information technology sector was the standout, appreciating more than 10%.
SECTOR DIVERSIFICATION
| | | | | | |
| Sector | | 9/30/08 | | | 9/30/09 | |
Consumer Discretionary | | 10.6 | % | | 10.1 | % |
Consumer Staples | | 2.7 | | | 3.7 | |
Energy | | 7.1 | | | 7.4 | |
Financials | | 5.4 | | | 7.4 | |
Healthcare | | 18.0 | | | 14.8 | |
Industrials | | 25.8 | | | 20.6 | |
Information Technology | | 23.6 | | | 28.9 | |
Materials | | 0.6 | | | 1.3 | |
Telecommunication Services | | 0.7 | | | — | |
Utilities | | 1.2 | | | 1.4 | |
Other assets less liabilities | | 4.3 | | | 4.4 | |
Total | | 100.0 | % | | 100.0 | % |
As a percentage of total net assets.
PERFORMANCE DISCUSSION
The Fund returned -1.73% in the period, outperforming the Russell 2000® and Russell 2000® Growth indices. Compared with the Russell 2000® Growth Index, the Fund benefited from strong security selection, particularly in the information technology and industrials sectors. Digital entertainment solutions developer Rovi Corporation, electronic payments provider Euronet Worldwide, Inc. and Internet exchange services provider Equinix, Inc. were among the Fund’s best performers in the technology sector. Stocks that contributed to our outperformance in the industrials sector included ship refueling services company Aegean Marine Petroleum Network Inc., less-than-truckload provider Old Dominion Freight Line, Inc. and correctional facilities operator Corrections Corporation of America. Other leading performers during the period were gaming machine designer WMS Industries, offshore drilling contractor Atwood Oceanics, Inc. and business development company Ares Capital Corporation.
The health care sector was the primary area of relative weakness. Detracting from our performance in the sector were ICON PLC, a global clinical research services contractor, Wright Medical Group, Inc., an orthopedic device company, and minimally invasive surgical device company ArthroCare Corporation. Other major detractors to performance were oil services contractor Hercules Offshore, Inc., commodity risk management company FCStone Group, Inc. and specialty retailer Tween Brands, Inc.
FUND CHANGES
Record levels of volatility in the period created many new purchase opportunities. The biggest portfolio shifts occurred in the information technology and industrials sectors, which increased and decreased in weight, respectively. In the technology sector we added previously mentioned Equinix, Inc., information technology national security company ManTech International Corporation and design software company ANSYS, Inc.
Our exposure in the industrials sector declined due to sales of Interline Brands, Inc., Healthcare Services Group, Inc., Innerworkings, Inc. and Ladish Co., Inc., among others.
19
ARTISAN SMALL CAP VALUE FUND (ARTVX)
INVESTMENT PROCESS HIGHLIGHTS
Artisan Small Cap Value Fund employs a bottom-up investment process to construct a diversified portfolio of small-cap U.S. companies that the team believes are undervalued, in solid financial condition and have attractive business economics. The team believes companies with these characteristics are less likely to experience eroding values over the long term.
Attractive valuation. The team values a business using what it believes are reasonable expectations for the long-term earnings power and capitalization rates of that business. This results in a range of values for the company that the team believes would be reasonable. The team generally will purchase a security if the stock price falls below or toward the lower end of that range.
Sound financial condition. The team favors companies with an acceptable level of debt and positive cash flow. At a minimum, the team tries to avoid companies that have so much debt that management may be unable to make decisions that would be in the best interest of the companies’ shareholders.
Attractive business economics. The team favors cash-producing businesses that it believes are capable of earning acceptable returns on capital over the company’s business cycle.
The Fund will not initiate a position in a company unless it has a market capitalization below $2 billion.
PERFORMANCE HISTORY
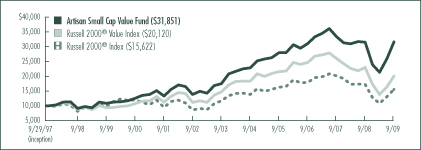
GROWTH OF AN ASSUMED $10,000 INVESTMENT (9/29/1997 to 9/30/2009)
AVERAGE ANNUAL TOTAL RETURNS (as of 9/30/2009)
| | | | | | | | | | | | | | | |
| Fund / Index | | 1-Year | | | 3-Year | | | 5-Year | | | 10-Year | | | Since
Inception | |
Artisan Small Cap Value Fund | | 0.46 | % | | 0.58 | % | | 6.77 | % | | 11.43 | % | | 10.13 | % |
Russell 2000® Value Index | | -12.61 | | | -6.65 | | | 1.78 | | | 8.05 | | | 6.00 | |
Russell 2000® Index | | -9.55 | | | -4.57 | | | 2.41 | | | 4.88 | | | 3.79 | |
The performance quoted represents past performance, which does not guarantee future results. The investment return and principal value of an investment in the Fund will fluctuate, so that an investor’s shares in the Fund, when redeemed, may be worth more or less than their original cost. Current performance may be lower or higher than the performance data quoted. For current to most recent month-end performance information, visit www.artisanfunds.com or call 800.344.1770. The graph and table above do not reflect the deduction of taxes that a shareholder would pay on distributions or sale of Fund shares. See page 91 for a description of each index.
20
INVESTING ENVIRONMENT
For the twelve months ended September 30, 2009, the Russell 2000® Value Index returned -12.61% and the Russell 2000® Index returned -9.55. The past year has been a tale of two halves. In the first half, markets continued to decline amidst the recessionary environment and both indices declined approximately -50% through March 9, 2009. Small-cap equities subsequently rebounded off March lows and rallied more than 80% through September 30, 2009. The sectors that suffered the biggest losses in the first half, such as financials, consumer discretionary, materials and energy, were those that rebounded the most in the latter half of the period. The traditionally defensive utilities and consumer staples sectors held up the best through the market’s decline, but rallied the least.
SECTOR DIVERSIFICATION
| | | | | | |
| Sector | | 9/30/08 | | | 9/30/09 | |
Consumer Discretionary | | 13.1 | % | | 5.8 | % |
Consumer Staples | | 3.1 | | | 2.6 | |
Energy | | 6.3 | | | 7.8 | |
Financials | | 11.8 | | | 8.6 | |
Healthcare | | 5.6 | | | 5.6 | |
Industrials | | 20.3 | | | 22.8 | |
Information Technology | | 28.1 | | | 24.9 | |
Materials | | 2.3 | | | 4.7 | |
Utilities | | 3.2 | | | 9.1 | |
Other assets less liabilities | | 6.2 | | | 8.1 | |
Total | | 100.0 | % | | 100.0 | % |
As a percentage of total net assets.
PERFORMANCE DISCUSSION
With a return of 0.46%, the Fund outpaced both indices by more than 10%. Our biggest source of relative strength was the outperformance of our industrials holdings, led by energy services company McDermott International, Inc. and civil construction and transportation contractor Granite Construction Incorporated. Our investments in the financial sector also held up better than those in the Russell 2000® Value Index, primarily due to our lack of investment in commercial banks, which declined -40% in the Index. Similarly, our outsized position in the technology sector, one of only two sectors in the Index to post a gain, worked in our favor. Other top contributors this period included semiconductor processing equipment company Varian Semiconductor Equipment Associates, Inc., steel scrap recycler Schnitzer Steel Industries, Inc., computer products distributor Arrow Electronics, Inc. and chicken producer Sanderson Farms, Inc.
On the downside, we underperformed the Index in the health care and consumer discretionary sectors. The double digit losses of some of our health care services providers, namely AMN Healthcare Services, Inc. and Cross Country Healthcare, Inc., held back returns in the health care sector. Ethan Allen Interiors Inc., AnnTaylor Stores Corporation and The Men’s Wearhouse, Inc. were our biggest detractors in the consumer discretionary sector. Our relative positioning in the consumer discretionary sector also worked against us. Our overweight position at the end of 2008 proved negative and, after we sold a number of our names in the sector, our newly underweight position held back returns as the sector sharply rebounded.
FUND CHANGES
During the period we initiated positions in energy services company Cleco Corporation, global consulting firm Watson Wyatt Worldwide, Inc., electric utility Portland General Electric Company, chemicals manufacturer Olin Corporation and gas and electricity distributor Vectren Corporation.
Some of our larger sales during the period included Con-way Inc., Cymer, Inc., Ethan Allen Interiors Inc., Old Dominion Freight Line, Inc., Schnitzer Steel Industries, Inc. and Thor Industries, Inc.
21
ARTISAN GLOBAL VALUE FUND
Schedule of Investments – September 30, 2009
| | | | | |
| | | Shares
Held | | Value |
| | | | | |
| COMMON STOCKS AND EQUITY-LINKED SECURITIES - 95.9% | | | |
| | | | | |
| CHINA - 0.0%(1) | | | | | |
Wynn Macau Ltd.(2)(3)(4)(5) | | 550 | | $ | 715 |
| | | | | |
| FRANCE - 8.7% | | | | | |
Publicis Groupe | | 19,886 | | | 797,635 |
Societe Television Francaise 1 | | 39,872 | | | 700,743 |
Sodexo | | 11,328 | | | 678,655 |
Total SA | | 5,394 | | | 320,508 |
| | | | | |
| | | | | 2,497,541 |
| HONG KONG - 2.9% | | | | | |
Guoco Group Limited | | 79,250 | | | 835,954 |
| | | | | |
| IRELAND - 1.3% | | | | | |
Ryanair Holdings PLC, Equity-Linked Security, 144A(2)(3)(5)(6) | | 75,397 | | | 378,163 |
| | | | | |
| JAPAN - 3.5% | | | | | |
Credit Saison Co., Ltd. | | 25,900 | | | 304,689 |
Daiwa Securities Group Inc. | | 59,596 | | | 307,391 |
SANKYO CO., LTD. | | 6,248 | | | 391,174 |
| | | | | |
| | | | | 1,003,254 |
| MEXICO - 1.3% | | | | | |
Grupo Modelo, S.A. de C.V., Series C(3) | | 98,292 | | | 366,019 |
| | | | | |
| NETHERLANDS - 1.2% | | | | | |
Wolters Kluwer NV | | 16,551 | | | 353,489 |
| | | | | |
| SWITZERLAND - 13.4% | | | | | |
Adecco SA | | 11,071 | | | 588,644 |
Givaudan SA | | 930 | | | 697,298 |
Novartis AG | | 21,640 | | | 1,082,731 |
Panalpina Welttransport Holding AG | | 6,026 | | | 497,757 |
Pargesa Holding SA | | 11,072 | | | 956,233 |
| | | | | |
| | | | | 3,822,663 |
| UNITED KINGDOM - 20.6% | | | | | |
Cadbury PLC | | 8,099 | | | 103,936 |
Cadbury PLC (DR) | | 4,832 | | | 247,447 |
Compass Group PLC | | 106,266 | | | 649,257 |
Diageo plc | | 57,147 | | | 876,764 |
Experian PLC | | 152,166 | | | 1,280,365 |
Home Retail Group plc | | 64,357 | | | 279,655 |
Royal Dutch Shell PLC, Class A | | 11,866 | | | 339,468 |
Signet Jewelers Ltd.(3) | | 46,757 | | | 1,231,112 |
| | | | | | | |
| | | Shares
Held | | Value | |
| | | | | | | |
| UNITED KINGDOM (CONTINUED) | | | | | | | |
Unilever PLC (DR) | | | 30,508 | | $ | 874,969 | |
| | | | | | | |
| | | | | | 5,882,973 | |
| UNITED STATES - 43.0% | | | | | | | |
3M Company | | | 7,690 | | | 567,522 | |
American Express Company | | | 35,403 | | | 1,200,162 | |
Arch Capital Group Ltd.(3) | | | 13,901 | | | 938,873 | |
The Bank of New York Mellon Corporation | | | 29,425 | | | 853,031 | |
Cintas Corporation | | | 24,874 | | | 753,931 | |
Covidien plc | | | 11,403 | | | 493,294 | |
Dell Inc.(3) | | | 50,072 | | | 764,099 | |
FedEx Corporation | | | 1,051 | | | 79,056 | |
Johnson & Johnson | | | 15,595 | | | 949,580 | |
Marsh & McLennan Companies, Inc. | | | 43,149 | | | 1,067,075 | |
Microsoft Corporation | | | 40,701 | | | 1,053,749 | |
Mohawk Industries, Inc.(3) | | | 14,603 | | | 696,417 | |
The Procter & Gamble Company | | | 17,800 | | | 1,030,976 | |
The Sherwin-Williams Company | | | 6,086 | | | 366,134 | |
Tyco Electronics Ltd. | | | 35,811 | | | 797,869 | |
Wal-Mart Stores, Inc. | | | 11,135 | | | 546,617 | |
WellPoint Inc.(3) | | | 2,990 | | | 141,606 | |
| | | | | | | |
| | | | | | 12,299,991 | |
| | | | | | | |
Total common stocks and equity-linked securities
(Cost $21,903,825) | | | | | | 27,440,762 | |
| | |
| | | Par
Amount | | | |
SHORT-TERM INVESTMENTS
(CASH EQUIVALENTS) - 4.8% | | | | | | | |
Repurchase agreement with Fixed Income Clearing Corporation, 0.01%, dated 9/30/09, due 10/1/09, maturity value $1,368,000(7)
(Cost $1,368,000) | | $ | 1,368,000 | | | 1,368,000 | |
| | | | | | | |
| | | | | | | |
Total investments - 100.7%
(Cost $23,271,825) | | | | | | 28,808,762 | |
| | | | | | | |
Other assets less liabilities - (0.7%) | | | | | | (191,197 | ) |
| | | | | | | |
| | | | | | | |
Total net assets - 100.0%(8) | | | | | $ | 28,617,565 | |
| | | | | | | |
22
| (1) | Represents less than 0.1% of total net assets. |
| (2) | Valued at a fair value in accordance with procedures established by the board of directors of Artisan Funds, Inc. In total, securities valued at a fair value were $378,878 or 1.3% of total net assets. |
| (3) | Non-income producing security. |
| (4) | Security has been determined to be illiquid under procedures established by the board of directors of Artisan Funds, Inc. In total, the value of securities determined to be illiquid were $715, or less than 0.1% of total net assets. |
| (5) | Securities are restricted and were acquired in a transaction under Rule 144A of the Securities Act of 1933. Restricted securities may be resold in transactions exempt from registration normally to qualified institutional buyers. Ryanair Holdings PLC was acquired on various dates from August 26, 2009 to September 24, 2009 at an aggregate cost of $334,783. Wynn Macau Ltd. was acquired on September 30, 2009 at an aggregate cost of $723. In total, the value of restricted securities held by the Fund was $378,878 or 1.3% of total net assets. |
| (6) | Security is an equity-linked participation certificate issued by HSBC Bank plc. As described in Note 2(i) in Notes to Financial Statements, equity-linked participation certificates are subject to counterparty risk with respect to the bank or broker-dealer that issues them. |
| | | | | | | | |
Issuer | | Rate | | | Maturity | | Value |
U.S. Treasury Bond | | 2.625 | % | | 7/31/2014 | | $ | 1,399,063 |
| (8) | Percentages for the various classifications relate to total net assets. |
Company names are as reported by a data service provider and in some cases are translations; a company’s legal name may be different.
(DR) Depository Receipt, voting rights may vary.
| | | | | | | |
| PORTFOLIO DIVERSIFICATION - September 30, 2009 | |
| | | Value | | | Percentage
of Total
Net Assets | |
Consumer Discretionary | | $ | 6,144,986 | | | 21.5 | % |
Consumer Staples | | | 4,046,728 | | | 14.2 | |
Energy | | | 659,976 | | | 2.3 | |
Financials | | | 6,463,408 | | | 22.6 | |
Healthcare | | | 2,667,211 | | | 9.3 | |
Industrials | | | 4,145,438 | | | 14.5 | |
Information Technology | | | 2,615,717 | | | 9.1 | |
Materials | | | 697,298 | | | 2.4 | |
| | | | | | | |
Total common stocks | | | 27,440,762 | | | 95.9 | |
Short term investments | | | 1,368,000 | | | 4.8 | |
| | | | | | | |
Total investments | | | 28,808,762 | | | 100.7 | |
Other assets less liabilities | | | (191,197 | ) | | (0.7 | ) |
| | | | | | | |
Total net assets | | $ | 28,617,565 | | | 100.0 | % |
| | | | | | | |
| | | | | | |
| CURRENCY EXPOSURE - September 30, 2009 | | | |
| | | Value | | Percentage
of Total
Investments | |
British pound | | $ | 3,189,977 | | 11.1 | % |
Euro | | | 3,568,661 | | 12.4 | |
Hong Kong dollar | | | 836,669 | | 2.9 | |
Japanese yen | | | 1,003,254 | | 3.5 | |
Mexican peso | | | 366,019 | | 1.3 | |
Swiss franc | | | 3,822,663 | | 13.2 | |
U.S. dollar | | | 16,021,519 | | 55.6 | |
| | | | | | |
Total investments | | $ | 28,808,762 | | 100.0 | % |
| | | | | | |
| | | | | |
| TOP TEN HOLDINGS - September 30, 2009 | |
Company Name | | Country | | Percentage
of Total
Net Assets | |
Experian PLC | | United Kingdom | | 4.5 | % |
Signet Jewelers Ltd. | | United Kingdom | | 4.3 | |
American Express Company | | United States | | 4.2 | |
Novartis AG | | Switzerland | | 3.8 | |
Marsh & McLennan Companies, Inc. | | United States | | 3.7 | |
Microsoft Corporation | | United States | | 3.7 | |
The Procter & Gamble Company | | United States | | 3.6 | |
Pargesa Holding SA | | Switzerland | | 3.3 | |
Johnson & Johnson | | United States | | 3.3 | |
Arch Capital Group Ltd. | | United States | | 3.3 | |
| | | | | |
Total | | | | 37.7 | % |
| | | | | |
For the purpose of determining the Fund’s top ten holdings, securities of the same issuer are aggregated to determine the weight in the Fund.
The accompanying notes are an integral part of the financial statements.
23
ARTISAN INTERNATIONAL FUND
Schedule of Investments – September 30, 2009
| | | | | |
| | | Shares
Held | | Value |
| COMMON AND PREFERRED STOCKS AND EQUITY-LINKED SECURITIES - 98.9% | | | | | |
| | | | | |
| BELGIUM - 1.4% | | | | | |
Anheuser-Busch InBev NV | | 3,038,935 | | $ | 138,769,333 |
Umicore | | 306,886 | | | 9,188,204 |
| | | | | |
| | | | | 147,957,537 |
| BRAZIL - 1.5% | | | | | |
Petroleo Brasileiro S.A., Preferred (DR) | | 4,143,960 | | | 162,899,068 |
| | | | | |
| CANADA - 2.7% | | | | | |
Canadian Pacific Railway Limited | | 6,172,234 | | | 288,551,939 |
| | | | | |
| CHINA - 5.3% | | | | | |
China Construction Bank, H Shares | | 209,744,100 | | | 167,794,197 |
China Life Insurance Co., Limited, H Shares | | 50,676,900 | | | 220,688,302 |
China Merchants Bank Co., Ltd., H Shares | | 10,226,500 | | | 22,801,649 |
China Merchants Holdings International Company Limited | | 28,474,900 | | | 94,793,249 |
Industrial and Commercial Bank of China Ltd, H Shares | | 71,035,000 | | | 53,436,307 |
Wynn Macau Ltd.(1)(2)(3)(4) | | 213,200 | | | 277,296 |
| | | | | |
| | | | | 559,791,000 |
| DENMARK - 1.0% | | | | | |
Danske Bank A/S(2) | | 3,886,311 | | | 101,797,887 |
| | | | | |
| FRANCE - 12.9% | | | | | |
Accor S.A. | | 3,289,802 | | | 183,129,442 |
BNP Paribas | | 2,243,378 | | | 179,243,330 |
BNP Paribas Rights(2)(5)
Exercise Price: 40.00 EUR
Expiration: 10/13/09 | | 2,243,378 | | | 4,858,609 |
Compagnie de Saint-Gobain | | 1,321,134 | | | 68,534,778 |
Credit Agricole S.A. | | 2,645,543 | | | 55,282,915 |
DANONE S.A. | | 430,414 | | | 25,937,053 |
Natixis(2) | | 14,561,979 | | | 87,794,138 |
Pernod Ricard SA | | 3,142,325 | | | 249,550,719 |
Societe Generale | | 2,612,019 | | | 210,226,241 |
Unibail-Rodamco | | 531,342 | | | 110,371,628 |
Vinci SA | | 3,506,906 | | | 198,396,442 |
| | | | | |
| | | | | 1,373,325,295 |
| GERMANY - 15.3% | | | | | |
Allianz SE | | 1,149,794 | | | 143,639,281 |
| | | | | |
| | | Shares
Held | | Value |
| GERMANY (CONTINUED) | | | | | |
Bayer AG | | 5,149,899 | | $ | 356,834,304 |
Daimler AG | | 6,650,536 | | | 334,831,351 |
Deutsche Post AG | | 7,488,127 | | | 140,259,109 |
Fraport AG | | 763,372 | | | 40,605,844 |
Linde AG | | 3,227,712 | | | 349,899,768 |
Muenchener Rueckversicherungs-Gesellschaft AG | | 1,640,735 | | | 261,777,526 |
| | | | | |
| | | | | 1,627,847,183 |
| HONG KONG - 2.0% | | | | | |
The Bank of East Asia, Ltd. | | 21,134,040 | | | 76,354,749 |
Li & Fung Limited | | 16,282,000 | | | 66,808,292 |
NWS Holdings Limited | | 34,876,746 | | | 67,772,956 |
| | | | | |
| | | | | 210,935,997 |
| INDIA - 2.4% | | | | | |
Housing Development Finance Corporation Ltd. | | 1,248,822 | | | 71,777,735 |
ICICI Bank Limited | | 2,180,220 | | | 41,014,241 |
ICICI Bank Limited (DR) | | 3,781,414 | | | 145,811,324 |
| | | | | |
| | | | | 258,603,300 |
| IRELAND - 0.3% | | | | | |
The Governor and Company of the Bank of Ireland(2) | | 7,014,128 | | | 35,103,280 |
| | | | | |
| ITALY - 3.8% | | | | | |
Assicurazioni Generali S.p.A. | | 4,549,408 | | | 124,692,568 |
Banca Monte dei Paschi di Siena S.p.A. | | 33,618,584 | | | 71,924,143 |
Intesa Sanpaolo(2) | | 46,351,919 | | | 205,013,251 |
| | | | | |
| | | | | 401,629,962 |
| JAPAN - 5.9% | | | | | |
ADVANTEST CORPORATION | | 915,900 | | | 25,406,238 |
DENSO CORPORATION | | 3,723,834 | | | 109,518,429 |
JAPAN TOBACCO INC. | | 22,388 | | | 76,817,290 |
MITSUI & CO., LTD. | | 3,733,500 | | | 48,828,931 |
Mitsui Fudosan Co., Ltd. | | 421,250 | | | 7,128,377 |
Mizuho Financial Group, Inc. | | 34,892,200 | | | 69,189,680 |
Sumitomo Mitsui Financial Group, Inc. | | 2,042,200 | | | 71,209,113 |
SUZUKI MOTOR CORPORATION | | 9,263,615 | | | 216,200,896 |
| | | | | |
| | | | | 624,298,954 |
| MEXICO - 1.0% | | | | | |
Grupo Televisa S.A. (DR) | | 5,763,446 | | | 107,142,461 |
| | | | | |
| NETHERLANDS - 8.7% | | | | | |
Akzo Nobel N.V. | | 1,636,135 | | | 101,360,000 |
ASML Holding N.V. | | 15,185,025 | | | 446,641,910 |
24
| | | | | |
| | | Shares
Held | | Value |
| NETHERLANDS (CONTINUED) | | | | | |
Heineken Holding NV | | 2,189,148 | | $ | 89,297,213 |
Heineken NV | | 2,605,835 | | | 120,136,313 |
ING Groep N.V.(2) | | 9,533,795 | | | 170,205,482 |
| | | | | |
| | | | | 927,640,918 |
| RUSSIA - 2.4% | | | | | |
Gazprom (DR) | | 10,789,888 | | | 250,864,896 |
| | | | | |
| SAUDI ARABIA - 0.1% | | | | | |
Almarai Company Ltd., Equity Linked Security, 144A(1)(4)(5)(6) | | 278,912 | | | 12,643,168 |
| | | | | |
| SINGAPORE - 1.6% | | | | | |
Genting Singapore PLC(2) | | 67,198,799 | | | 53,428,925 |
Oversea-Chinese Banking Corporation Limited | | 19,713,900 | | | 109,859,876 |
| | | | | |
| | | | | 163,288,801 |
| SPAIN - 2.5% | | | | | |
Industria de Diseno Textil, S.A. | | 1,753,277 | | | 100,599,375 |
Telefonica S.A. | | 6,075,187 | | | 167,623,186 |
| | | | | |
| | | | | 268,222,561 |
| SWEDEN - 2.5% | | | | | |
AB SKF, Class B | | 4,231,979 | | | 66,472,305 |
Atlas Copco AB, Class A | | 6,497,329 | | | 83,693,997 |
Sandvik AB | | 4,274,723 | | | 47,215,198 |
Skandinaviska Enskilda Banken AB (SEB), Class A(2) | | 9,841,141 | | | 66,347,784 |
| | | | | |
| | | | | 263,729,284 |
| SWITZERLAND - 10.1% | | | | | |
Credit Suisse Group AG | | 2,981,339 | | | 165,422,168 |
Holcim Ltd.(2) | | 3,542,374 | | | 243,040,424 |
Nestle SA | | 5,381,246 | | | 229,311,805 |
Novartis AG | | 2,806,649 | | | 140,427,242 |
Roche Holding AG | | 353,557 | | | 59,125,184 |
Roche Holding AG - Genussscheine(5) | | 1,471,650 | | | 237,866,810 |
| | | | | |
| | | | | 1,075,193,633 |
| TAIWAN - 1.2% | | | | | |
Taiwan Semiconductor Manufacturing Company Ltd. (DR) | | 11,679,533 | | | 128,007,682 |
| | | | | |
| UNITED KINGDOM - 10.2% | | | | | |
Cadbury PLC | | 5,712,282 | | | 73,306,598 |
Experian PLC | | 5,017,535 | | | 42,218,876 |
HSBC Holdings plc | | 18,443,715 | | | 211,604,917 |
Imperial Tobacco Group plc | | 4,563,135 | | | 131,849,845 |
Kingfisher PLC | | 35,168,844 | | | 119,660,727 |
National Grid PLC | | 16,651,187 | | | 160,731,137 |
Smith & Nephew PLC | | 13,927,869 | | | 124,760,806 |
Tesco PLC | | 21,804,052 | | | 139,245,308 |
William Morrison Supermarkets PLC | | 16,702,548 | | | 74,020,238 |
| | | | | |
| | | | | 1,077,398,452 |
| | | | | | | |
| | | Shares
Held | | Value | |
| UNITED STATES - 4.1% | | | | | | | |
Accenture PLC, Class A | | | 340,433 | | $ | 12,687,938 | |
Activision Blizzard, Inc.(2) | | | 5,157,574 | | | 63,902,342 | |
Covidien plc | | | 3,551,851 | | | 153,653,074 | |
Philip Morris International Inc. | | | 3,034,554 | | | 147,904,162 | |
Schlumberger Limited | | | 1,021,022 | | | 60,852,911 | |
| | | | | | | |
| | | | | | 439,000,427 | |
| | | | | | | |
Total common and preferred stocks and equity-linked securities
(Cost $9,157,886,883) | | | | | | 10,505,873,685 | |
| | |
| | | Par
Amount | | | |
| SHORT-TERM INVESTMENTS (CASH EQUIVALENTS) - 1.6% | | | | | | | |
Repurchase agreement with Fixed Income Clearing Corporation, 0.01%, dated 9/30/09, due 10/1/09, maturity value $173,052,048(7)
(Cost $173,052,000) | | $ | 173,052,000 | | | 173,052,000 | |
| | | | | | | |
| | | | | | | |
Total investments - 100.5%
(Cost $9,330,938,883) | | | | | | 10,678,925,685 | |
| | | | | | | |
Other assets less liabilities - (0.5%) | | | | | | (51,070,961 | ) |
| | | | | | | |
| | | | | | | |
Total net assets - 100.0%(8) | | | | | $ | 10,627,854,724 | |
| | | | | | | |
| (1) | Valued at a fair value in accordance with procedures established by the board of directors of Artisan Funds, Inc. In total, securities valued at a fair value were $12,920,464 or 0.1% of total net assets. |
| (2) | Non-income producing security. |
| (3) | Security has been determined to be illiquid under procedures established by the board of directors of Artisan Funds, Inc. In total, the value of securities determined to be illiquid were $277,296, or less than 0.1% of total net assets. |
| (4) | Securities are restricted and were acquired in a transaction under Rule 144A of the Securities Act of 1933. Restricted securities may be resold in transactions exempt from registration normally to qualified institutional buyers. Almarai Company Ltd. was acquired on various dates from August 13, 2009 to September 30, 2009 at an aggregate cost of $12,227,447. Wynn Macau Ltd. was acquired on September 30, 2009 at an aggregate cost of $280,094. In total, the value of restricted securities held by the Fund was $12,920,464 or 0.1% of total net assets. |
| (6) | Security is an equity-linked participation certificate issued by Deutsche Bank AG. As described in Note 2(i)in Notes to Financial Statements, equity-linked participation certificates are subject to counterparty risk with respect to the bank or broker-dealer that issues them. |
| | | | | | | | |
Issuer | | Rate | | | Maturity | | Value |
U.S. Treasury Bond | | 3.125 | % | | 5/15/2019 | | $ | 176,515,575 |
25
| (8) | Percentages for the various classifications relate to total net assets. |
Company names are as reported by a data service provider and in some cases are translations; a company’s legal name may be different.
(DR) Depository Receipt, voting rights may vary.
| | | | | | | |
| PORTFOLIO DIVERSIFICATION - September 30, 2009 | |
| | | Value | | | Percentage
of Total
Net Assets | |
Consumer Discretionary | | $ | 1,291,597,194 | | | 12.1 | % |
Consumer Staples | | | 1,508,789,045 | | | 14.2 | |
Energy | | | 474,616,875 | | | 4.5 | |
Financials | | | 3,262,370,698 | | | 30.7 | |
Healthcare | | | 1,072,667,420 | | | 10.1 | |
Industrials | | | 1,187,343,624 | | | 11.2 | |
Information Technology | | | 676,646,110 | | | 6.4 | |
Materials | | | 703,488,396 | | | 6.6 | |
Telecommunication Services | | | 167,623,186 | | | 1.6 | |
Utilities | | | 160,731,137 | | | 1.5 | |
| | | | | | | |
Total common and preferred stocks | | | 10,505,873,685 | | | 98.9 | |
Short-term investments | | | 173,052,000 | | | 1.6 | |
| | | | | | | |
Total investments | | | 10,678,925,685 | | | 100.5 | |
Other assets less liabilities | | | (51,070,961 | ) | | (0.5 | ) |
| | | | | | | |
Total net assets | | $ | 10,627,854,724 | | | 100.0 | % |
| | | | | | | |
| | | | | | |
| CURRENCY EXPOSURE - September 30, 2009 | | | |
| | | Value | | Percentage
of Total
Investments | |
British pound | | $ | 1,037,825,350 | | 9.7 | % |
Danish krone | | | 101,797,887 | | 0.9 | |
Euro | | | 4,781,726,736 | | 44.8 | |
Hong Kong dollar | | | 810,300,099 | | 7.6 | |
Indian rupee | | | 112,791,976 | | 1.1 | |
Japanese yen | | | 624,298,954 | | 5.8 | |
Singapore dollar | | | 163,288,801 | | 1.5 | |
Swedish krona | | | 263,729,284 | | 2.5 | |
Swiss franc | | | 1,075,193,633 | | 10.1 | |
U.S. dollar | | | 1,707,972,965 | | 16.0 | |
| | | | | | |
Total investments | | $ | 10,678,925,685 | | 100.0 | % |
| | | | | | |
| | | | | |
| TOP TEN HOLDINGS - September 30, 2009 | | | |
Company Name | | Country | | Percentage
of Total
Net Assets | |
ASML Holding N.V. | | Netherlands | | 4.2 | % |
Bayer AG | | Germany | | 3.4 | |
Linde AG | | Germany | | 3.3 | |
Daimler AG | | Germany | | 3.2 | |
Roche Holding AG | | Switzerland | | 2.8 | |
Canadian Pacific Railway Limited | | Canada | | 2.7 | |
Muenchener Rueckversicherungs-Gesellschaft AG | | Germany | | 2.5 | |
Gazprom | | Russia | | 2.4 | |
Pernod Ricard SA | | France | | 2.3 | |
Holcim Ltd. | | Switzerland | | 2.3 | |
| | | | | |
Total | | | | 29.1 | % |
| | | | | |
For the purpose of determining the Fund’s top ten holdings, securities of the same issuer are aggregated to determine the weight in the Fund.
The accompanying notes are an integral part of the financial statements.
26
ARTISAN INTERNATIONAL SMALL CAP FUND
Schedule of Investments – September 30, 2009
| | | | | |
| | | Shares
Held | | Value |
| COMMON STOCKS - 97.2% | | | | | |
| | | | | |
| AUSTRALIA - 1.6% | | | | | |
Domino’s Pizza Enterprises Limited | | 3,035,834 | | $ | 10,846,760 |
| | | | | |
| AUSTRIA - 2.6% | | | | | |
Flughafen Wien AG | | 345,918 | | | 17,970,056 |
| | | | | |
| BRAZIL - 0.3% | | | | | |
Tivit Terceirizacao de Tecnologia e Servicos SA(1) | | 270,442 | | | 1,984,503 |
| | | | | |
| CANADA - 2.3% | | | | | |
Finning International Inc. | | 667,479 | | | 9,974,935 |
Groupe Aeroplan, Inc. | | 654,105 | | | 6,048,325 |
| | | | | |
| | | | | 16,023,260 |
| CHINA - 9.2% | | | | | |
China Everbright International Limited | | 21,235,700 | | | 8,631,229 |
China Everbright Limited | | 2,854,600 | | | 6,467,929 |
China National Building Material Company Ltd., H Shares | | 4,752,000 | | | 11,159,464 |
Hengan International Group Company Limited | | 2,533,050 | | | 15,361,623 |
Lee & Man Paper Manufacturing Limited | | 3,949,400 | | | 7,001,859 |
Ports Design Limited | | 2,081,000 | | | 5,198,439 |
REXLot Holdings Limited(1) | | 102,000,000 | | | 9,081,232 |
Tong Ren Tang Technologies Company Limited, H Shares | | 891,000 | | | 1,335,917 |
| | | | | |
| | | | | 64,237,692 |
| EGYPT - 5.8% | | | | | |
Commercial International Bank (DR) | | 2,471,324 | | | 25,380,498 |
Eastern Tobacco | | 625,533 | | | 15,098,288 |
| | | | | |
| | | | | 40,478,786 |
| FRANCE - 4.3% | | | | | |
Guyenne et Gascogne SA | | 107,434 | | | 10,918,473 |
Meetic(1) | | 321,817 | | | 10,774,892 |
Remy Cointreau SA | | 190,297 | | | 7,960,091 |
| | | | | |
| | | | | 29,653,456 |
| GERMANY - 17.9% | | | | | |
Gerresheimer AG | | 230,806 | | | 7,261,619 |
KWS Saat AG | | 62,949 | | | 10,961,846 |
Praktiker Bau- und Heimwerkermaerkte Holding AG | | 2,108,881 | | | 29,101,252 |
Sixt AG | | 121,968 | | | 3,687,433 |
Sky Deutschland AG(1) | | 1,543,717 | | | 8,200,158 |
Vossloh AG | | 26,934 | | | 3,051,814 |
| | | | | |
| | | Shares
Held | | Value |
| GERMANY (CONTINUED) | | | | | |
Wacker Construction Equipment AG | | 1,082,563 | | $ | 13,211,956 |
Wirecard AG | | 4,101,120 | | | 48,851,149 |
| | | | | |
| | | | | 124,327,227 |
| HONG KONG - 5.6% | | | | | |
Cafe De Coral Holdings Limited | | 4,688,000 | | | 10,271,191 |
Industrial and Commercial Bank of China (Asia) Limited | | 12,700,000 | | | 28,742,782 |
| | | | | |
| | | | | 39,013,973 |
| INDIA - 0.2% | | | | | |
ACC Limited | | 103,300 | | | 1,761,393 |
| | | | | |
| ITALY - 7.4% | | | | | |
Ansaldo STS SpA | | 300,098 | | | 6,143,682 |
Azimut Holding SpA | | 296,613 | | | 3,748,007 |
Bulgari S.p.A. | | 1,381,375 | | | 10,673,170 |
Davide Campari - Milano S.p.A. | | 2,461,996 | | | 22,084,914 |
Geox SpA | | 1,053,098 | | | 9,115,310 |
| | | | | |
| | | | | 51,765,083 |
| MALAYSIA - 0.8% | | | | | |
PureCircle(1) | | 1,521,014 | | | 5,931,177 |
| | | | | |
| PHILIPPINES - 1.0% | | | | | |
Ayala Corporation | | 1,068,350 | | | 6,820,934 |
| | | | | |
| PORTUGAL - 0.7% | | | | | |
CIMPOR-Cimentos de Portugal, SGPS, SA | | 564,221 | | | 4,660,807 |
| | | | | |
| SINGAPORE - 3.0% | | | | | |
City Developments Limited | | 690,000 | | | 5,055,053 |
Raffles Education Corp Ltd | | 18,992,000 | | | 6,876,030 |
SIA Engineering Company | | 4,775,700 | | | 8,712,987 |
| | | | | |
| | | | | 20,644,070 |
| SOUTH AFRICA - 1.0% | | | | | |
Aspen Pharmacare Holdings Limited(1) | | 887,638 | | | 7,308,361 |
| | | | | |
| SWITZERLAND - 12.1% | | | | | |
Bank Sarasin & Cie AG, B Shares(1) | | 766,533 | | | 31,880,317 |
Banque Cantonale Vaudoise | | 11,371 | | | 4,685,339 |
Nobel Biocare Holding AG | | 509,107 | | | 16,850,690 |
Schindler Holding AG, Participation Certificates(2) | | 284,436 | | | 19,501,281 |
Straumann Holding AG | | 43,986 | | | 11,385,935 |
| | | | | |
| | | | | 84,303,562 |
| THAILAND - 1.0% | | | | | |
CP ALL PCL(3) | | 12,012,400 | | | 7,226,855 |
27
| | | | | | |
| | | Shares
Held | | Value |
| TURKEY - 4.0% | | | | | | |
Coca-Cola Icecek AS | | | 3,935,101 | | $ | 27,842,696 |
| | | | | | |
| UNITED KINGDOM - 16.4% | | | | | | |
The Berkeley Group Holdings PLC(1) | | | 709,398 | | | 10,044,806 |
Bovis Homes Group PLC(1) | | | 1,006,728 | | | 7,513,580 |
Britvic Plc | | | 1,100,644 | | | 6,200,459 |
Catlin Group Limited | | | 1,194,993 | | | 6,710,965 |
InterContinental Hotels Group PLC | | | 1,062,779 | | | 13,800,163 |
Intertek Group PLC | | | 737,006 | | | 14,946,879 |
Persimmon plc(1) | | | 1,171,135 | | | 8,542,215 |
Premier Foods PLC(1) | | | 21,151,009 | | | 14,197,055 |
Redrow plc(1) | | | 1,975,362 | | | 6,787,394 |
Robert Walters plc | | | 3,313,700 | | | 10,949,054 |
SSL International plc | | | 1,386,150 | | | 14,177,775 |
| | | | | | |
| | | | | | 113,870,345 |
| | | | | | |
Total common stocks
(Cost $572,540,558) | | | | | | 676,670,996 |
| | |
| | | Par
Amount | | |
| SHORT-TERM INVESTMENTS (CASH EQUIVALENTS) - 2.0% | | | | | | |
| Repurchase agreement with Fixed Income Clearing Corporation, 0.01%, dated 9/30/09, due 10/1/09, maturity value $13,589,004(4) (Cost $13,589,000) | | $ | 13,589,000 | | | 13,589,000 |
| | | | | | |
Total investments - 99.2%
(Cost $586,129,558) | | | | | | 690,259,996 |
| | | | | | |
Other assets less liabilities - 0.8% | | | | | | 5,542,736 |
| | | | | | |
| | | | | | |
Total net assets - 100.0%(5) | | | | | $ | 695,802,732 |
| | | | | | |
| (1) | Non-income producing security. |
| (3) | Valued at a fair value in accordance with procedures established by the board of directors of Artisan Funds, Inc. In total, securities valued at a fair value were $7,226,855 or 1.0% of total net assets. |
| | | | | | | | |
Issuer | | Rate | | | Maturity | | Value |
U.S. Treasury Bond | | 3.125 | % | | 8/31/2013 | | $ | 13,861,253 |
| (5) | Percentages for the various classifications relate to total net assets. |
Company names are as reported by a data service provider and in some cases are translations; a company’s legal name may be different.
(DR) Depository Receipt, voting rights may vary.
| | | | | | |
| PORTFOLIO DIVERSIFICATION - September 30, 2009 | |
| | | Value | | Percentage
of Total
Net Assets | |
Consumer Discretionary | | $ | 152,100,025 | | 21.8 | % |
Consumer Staples | | | 143,783,477 | | 20.7 | |
Financials | | | 119,491,824 | | 17.2 | |
Healthcare | | | 58,320,297 | | 8.4 | |
Industrials | | | 116,781,306 | | 16.8 | |
Information Technology | | | 61,610,544 | | 8.8 | |
Materials | | | 24,583,523 | | 3.5 | |
| | | | | | |
Total common stocks | | | 676,670,996 | | 97.2 | |
Short-term investments | | | 13,589,000 | | 2.0 | |
| | | | | | |
Total investments | | | 690,259,996 | | 99.2 | |
Other assets less liabilities | | | 5,542,736 | | 0.8 | |
| | | | | | |
Total net assets | | $ | 695,802,732 | | 100.0 | % |
| | | | | | |
| | | | | | |
| CURRENCY EXPOSURE - September 30, 2009 | |
| | | Value | | Percentage
of Total
Investments | |
Australian dollar | | $ | 10,846,760 | | 1.6 | % |
Brazilian real | | | 1,984,503 | | 0.3 | |
British pound | | | 119,801,522 | | 17.4 | |
Canadian dollar | | | 16,023,260 | | 2.3 | |
Egyptian pound | | | 15,098,288 | | 2.2 | |
Euro | | | 228,376,629 | | 33.1 | |
Hong Kong dollar | | | 103,251,665 | | 15.0 | |
Indian rupee | | | 1,761,393 | | 0.2 | |
Philippine peso | | | 6,820,934 | | 1.0 | |
Singapore dollar | | | 20,644,070 | | 3.0 | |
South African rand | | | 7,308,361 | | 1.1 | |
Swiss franc | | | 84,303,562 | | 12.2 | |
Thai baht | | | 7,226,855 | | 1.0 | |
Turkish lira | | | 27,842,696 | | 4.0 | |
U.S. dollar | | | 38,969,498 | | 5.6 | |
| | | | | | |
Total investments | | $ | 690,259,996 | | 100.0 | % |
| | | | | | |
28
| | | | | |
| TOP TEN HOLDINGS - September 30, 2009 | |
Company Name | | Country | | Percentage
of Total
Net Assets | |
Wirecard AG | | Germany | | 7.0 | % |
Bank Sarasin & Cie AG | | Switzerland | | 4.6 | |
Praktiker Bau- und Heimwerkermaerkte Holding AG | | Germany | | 4.2 | |
Industrial and Commercial Bank of China (Asia) Limited | | Hong Kong | | 4.1 | |
Coca-Cola Icecek AS | | Turkey | | 4.0 | |
Commercial International Bank | | Egypt | | 3.6 | |
Davide Campari - Milano S.p.A. | | Italy | | 3.2 | |
Schindler Holding AG | | Switzerland | | 2.8 | |
Flughafen Wien AG | | Austria | | 2.6 | |
Nobel Biocare Holding AG | | Switzerland | | 2.4 | |
| | | | | |
Total | | | | 38.5 | % |
| | | | | |
For the purpose of determining the Fund’s top ten holdings, securities of the same issuer are aggregated to determine the weight in the Fund.
The accompanying notes are an integral part of the financial statements.
29
ARTISAN INTERNATIONAL VALUE FUND
Schedule of Investments – September 30, 2009
| | | | | |
| | | Shares
Held | | Value |
| | | | | |
| COMMON STOCKS AND EQUITY-LINKED SECURITIES - 90.1% | | | | | |
| | | | | |
| BELGIUM - 0.8% | | | | | |
Groupe Bruxelles Lambert S.A. | | 174,287 | | $ | 16,098,295 |
| | | | | |
| CANADA - 0.3% | | | | | |
MDS Inc.(1) | | 831,521 | | | 6,811,226 |
| | | | | |
| CHINA - 0.0%(2) | | | | | |
Wynn Macau Ltd.(1)(3)(4)(5) | | 40,100 | | | 52,156 |
| | | | | |
| FRANCE - 14.1% | | | | | |
Gemalto NV(1) | | 771,434 | | | 35,971,670 |
Publicis Groupe | | 1,608,706 | | | 64,525,833 |
Societe Television Francaise 1 | | 4,812,308 | | | 84,575,452 |
Sodexo | | 727,664 | | | 43,593,991 |
Total SA | | 950,035 | | | 56,450,400 |
| | | | | |
| | | | | 285,117,346 |
| HONG KONG - 3.3% | | | | | |
Guoco Group Limited | | 6,394,600 | | | 67,452,281 |
| | | | | |
| IRELAND - 2.4% | | | | | |
Ryanair Holdings PLC, Equity-Linked Security, 144A(1)(3)(5)(6) | | 9,674,019 | | | 48,521,286 |
| | | | | |
| JAPAN - 6.9% | | | | | |
Credit Saison Co., Ltd. | | 2,566,639 | | | 30,194,071 |
Daiwa Securities Group Inc. | | 6,767,431 | | | 34,905,816 |
MEITEC CORPORATION | | 948,152 | | | 16,097,406 |
SANKYO CO., LTD. | | 763,238 | | | 47,784,744 |
SEINO HOLDINGS CO., LTD. | | 1,095,800 | | | 9,485,174 |
| | | | | |
| | | | | 138,467,211 |
| KOREA - 2.0% | | | | | |
Lotte Chilsung Beverage Co., Ltd. | | 18,021 | | | 12,312,247 |
SK Telecom Co., Ltd. (DR) | | 1,581,567 | | | 27,598,344 |
| | | | | |
| | | | | 39,910,591 |
| MEXICO - 0.7% | | | | | |
Grupo Modelo, S.A. de C.V., Series C(1) | | 3,554,821 | | | 13,237,409 |
| | | | | |
| NETHERLANDS - 1.5% | | | | | |
Wolters Kluwer NV | | 1,460,923 | | | 31,201,777 |
| | | | | |
| | | | | |
| | | Shares
Held | | Value |
| | | | | |
| SINGAPORE - 0.0%(2) | | | | | |
ARA Asset Management Limited | | 42,000 | | $ | 24,151 |
| | | | | |
| SWITZERLAND - 18.8% | | | | | |
Adecco SA | | 1,161,509 | | | 61,757,354 |
Givaudan SA | | 87,448 | | | 65,567,013 |
Nestle SA | | 453,598 | | | 19,329,236 |
Novartis AG | | 1,729,649 | | | 86,540,867 |
Panalpina Welttransport Holding AG | | 717,385 | | | 59,257,123 |
Pargesa Holding SA | | 904,386 | | | 78,107,254 |
Tamedia AG | | 110,411 | | | 8,416,934 |
| | | | | |
| | | | | 378,975,781 |
| UNITED KINGDOM - 26.6% | | | | | |
Cadbury PLC | | 1,910,484 | | | 24,517,537 |
Carpetright PLC | | 1,807,670 | | | 23,125,885 |
Compass Group PLC | | 8,130,336 | | | 49,674,176 |
Diageo plc | | 4,217,596 | | | 64,707,421 |
Experian PLC | | 11,868,964 | | | 99,868,625 |
Home Retail Group plc | | 6,379,227 | | | 27,720,123 |
Lancashire Holdings Ltd | | 3,133,361 | | | 25,588,759 |
Royal Dutch Shell PLC, Class A | | 1,381,965 | | | 39,535,907 |
Savills Plc | | 4,373,849 | | | 23,248,980 |
Signet Jewelers Ltd.(1) | | 3,212,986 | | | 84,597,921 |
Unilever PLC (DR) | | 2,340,290 | | | 67,119,517 |
Vitec Group PLC | | 1,221,882 | | | 7,127,546 |
| | | | | |
| | | | | 536,832,397 |
| UNITED STATES - 12.7% | | | | | |
Accenture PLC, Class A | | 672,488 | | | 25,063,628 |
Arch Capital Group Ltd.(1) | | 1,276,234 | | | 86,196,844 |
Covidien plc | | 1,941,670 | | | 83,996,644 |
Tyco Electronics Ltd. | | 2,785,447 | | | 62,059,759 |
| | | | | |
| | | | | 257,316,875 |
| | | | | |
Total common stocks and equity-linked securities
(Cost $1,630,055,927) | | | | | 1,820,018,782 |
30
| | | | | | |
| | | Par
Amount | | Value |
| | | | | | |
SHORT-TERM INVESTMENTS
(CASH EQUIVALENTS) - 9.3% | | | |
Repurchase agreement with Fixed Income Clearing Corporation,
0.01%, dated 9/30/09, due 10/1/09, maturity value $188,093,052(7)
(Cost $188,093,000) | | $ | 188,093,000 | | $ | 188,093,000 |
| | | | | | |
| | | | | | |
Total investments - 99.4%
(Cost $1,818,148,927) | | | | | | 2,008,111,782 |
| | | | | | |
Other assets less liabilities - 0.6% | | | | | | 11,633,870 |
| | | | | | |
| | | | | | |
Total net assets - 100.0%(8) | | | | | $ | 2,019,745,652 |
| | | | | | |
| (1) | Non-income producing security. |
| (2) | Represents less than 0.1% of total net assets. |
| (3) | Valued at a fair value in accordance with procedures established by the board of directors of Artisan Funds, Inc. In total, securities valued at a fair value were $48,573,442 or 2.4% of total net assets. |
| (4) | Security has been determined to be illiquid under procedures established by the board of directors of Artisan Funds, Inc. In total, the value of securities determined to be illiquid were $52,156, or less than 0.1% of total net assets. |
| (5) | Securities are restricted and were acquired in a transaction under Rule 144A of the Securities Act of 1933. Restricted securities may be resold in transactions exempt from registration normally to qualified institutional buyers. Ryanair Holdings PLC was acquired on various dates from September 17, 2008 to September 23, 2009 at an aggregate cost of $39,429,745. Wynn Macau Ltd. was acquired on September 30, 2009 at an aggregate cost of $52,682. In total, the value of restricted securities held by the Fund was $48,573,442 or 2.4% of total net assets. |
| (6) | Security is an equity-linked participation certificate issued by HSBC Bank plc. As described in Note 2(i) in Notes to Financial Statements, equity-linked participation certificates are subject to counterparty risk with respect to the bank or broker-dealer that issues them. |
| | | | | | | | |
Issuer | | Rate | | | Maturity | | Value |
U.S. Treasury Bond | | 5.125 | % | | 5/15/2016 | | $ | 57,915,000 |
U.S. Treasury Bond | | 2.675 | | | 2/29/2016 | | | 133,942,050 |
| | | | | | | | |
| | | | | | | $ | 191,857,050 |
| | | | | | | | |
| (8) | Percentages for the various classifications relate to total net assets. |
Company names are as reported by a data service provider and in some cases are translations; a company’s legal name may be different.
(DR) Depository Receipt, voting rights may vary.
| | | | | | |
| PORTFOLIO DIVERSIFICATION - September 30, 2009 | |
| | | Value | | Percentage
of Total
Net Assets | |
Consumer Discretionary | | $ | 472,396,538 | | 23.4 | % |
Consumer Staples | | | 201,223,367 | | 10.0 | |
Energy | | | 95,986,307 | | 4.7 | |
Financials | | | 361,816,451 | | 17.9 | |
Healthcare | | | 177,348,737 | | 8.8 | |
Industrials | | | 294,986,968 | | 14.6 | |
Information Technology | | | 123,095,057 | | 6.1 | |
Materials | | | 65,567,013 | | 3.2 | |
Telecommunication Services | | | 27,598,344 | | 1.4 | |
| | | | | | |
Total common stocks | | | 1,820,018,782 | | 90.1 | |
Short-term investments | | | 188,093,000 | | 9.3 | |
| | | | | | |
Total investments | | | 2,008,111,782 | | 99.4 | |
Other assets less liabilities | | | 11,633,870 | | 0.6 | |
| | | | | | |
Total net assets | | $ | 2,019,745,652 | | 100.0 | % |
| | | | | | |
| | | | | | |
| CURRENCY EXPOSURE - September 30, 2009 | |
| | | Value | | Percentage
of Total
Investments | |
British pound | | $ | 345,579,052 | | 17.2 | % |
Canadian dollar | | | 6,811,226 | | 0.3 | |
Euro | | | 420,474,611 | | 20.9 | |
Hong Kong dollar | | | 67,504,437 | | 3.4 | |
Japanese yen | | | 138,467,211 | | 6.9 | |
Korean won | | | 12,312,247 | | 0.6 | |
Mexican peso | | | 13,237,409 | | 0.7 | |
Singapore dollar | | | 24,151 | | 0.0 | 1 |
Swiss franc | | | 378,975,781 | | 18.9 | |
U.S. dollar | | | 624,725,657 | | 31.1 | |
| | | | | | |
Total investments | | $ | 2,008,111,782 | | 100.0 | % |
| | | | | | |
| (1) | Represents less than 0.1% of total investments. |
31
| | | | | |
| TOP TEN HOLDINGS - September 30, 2009 | |
Company Name | | Country | | Percentage
of Total
Net Assets | |
Experian PLC | | United Kingdom | | 4.9 | % |
Novartis AG | | Switzerland | | 4.3 | |
Arch Capital Group Ltd. | | United States | | 4.3 | |
Signet Jewelers Ltd. | | United Kingdom | | 4.2 | |
Societe Television Francaise 1 | | France | | 4.2 | |
Covidien plc | | United States | | 4.2 | |
Pargesa Holding SA | | Switzerland | | 3.9 | |
Guoco Group Limited | | Hong Kong | | 3.3 | |
Unilever plc | | United Kingdom | | 3.3 | |
Givaudan SA | | Switzerland | | 3.2 | |
| | | | | |
Total | | | | 39.8 | % |
| | | | | |
For the purpose of determining the Fund’s top ten holdings, securities of the same issuer are aggregated to determine the weight in the Fund.
The accompanying notes are an integral part of the financial statements.
32
ARTISAN MID CAP FUND
Schedule of Investments – September 30, 2009
| | | | | |
| | | Shares
Held | | Value |
| | | | | |
| COMMON STOCKS AND EXCHANGE TRADED FUNDS - 96.4% | | | | | |
| | | | | |
| CONSUMER DISCRETIONARY - 16.0% | | | |
Auto Components - 2.4% | | | | | |
BorgWarner Inc. | | 1,334,099 | | $ | 40,369,836 |
Johnson Controls, Inc. | | 2,278,062 | | | 58,227,265 |
| | | | | |
| | | | | 98,597,101 |
Distributors - 0.8% | | | | | |
LKQ Corporation(1) | | 1,785,901 | | | 33,110,605 |
| | | | | |
Hotels, Restaurants & Leisure - 4.2% | | | | | |
Chipotle Mexican Grill, Inc., Class A(1) | | 226,800 | | | 22,010,940 |
Ctrip.com International Limited (DR)(1)(2) | | 451,600 | | | 26,549,564 |
Home Inns & Hotels Management, Inc. (DR)(1)(2) | | 698,700 | | | 20,856,195 |
Panera Bread Company, Class A(1) | | 378,200 | | | 20,801,000 |
Starbucks Corporation(1) | | 567,283 | | | 11,714,394 |
Starwood Hotels & Resorts Worldwide, Inc. | | 1,475,622 | | | 48,739,795 |
YUM! Brands, Inc. | | 668,932 | | | 22,583,144 |
| | | | | |
| | | | | 173,255,032 |
Household Durables - 0.6% | | | | | |
Harman International Industries, Incorporated | | 683,300 | | | 23,150,204 |
| | | | | |
Multiline Retail - 3.4% | | | | | |
Kohl’s Corporation(1) | | 2,451,064 | | | 139,833,201 |
| | | | | |
Specialty Retail - 3.7% | | | | | |
Best Buy Co., Inc. | | 719,674 | | | 27,002,168 |
CarMax, Inc.(1) | | 1,203,600 | | | 25,155,240 |
Dick’s Sporting Goods, Inc., Class A(1) | | 2,024,300 | | | 45,344,320 |
O’Reilly Automotive, Inc.(1) | | 1,013,900 | | | 36,642,346 |
Williams-Sonoma, Inc. | | 1,018,200 | | | 20,598,186 |
| | | | | |
| | | | | 154,742,260 |
Textiles, Apparel & Luxury Goods - 0.9% | | | | | |
Coach, Inc. | | 1,137,200 | | | 37,436,624 |
| | | | | |
| | | | | |
| | | Shares
Held | | Value |
| | | | | |
| CONSUMER STAPLES - 3.0% | | | | | |
Beverages - 2.1% | | | | | |
Hansen Natural Corporation(1) | | 2,395,912 | | $ | 88,025,807 |
| | | | | |
Food Products - 0.2% | | | | | |
Bunge Limited | | 137,588 | | | 8,614,385 |
| | | | | |
Personal Products - 0.7% | | | | | |
Avon Products, Inc. | | 818,700 | | | 27,803,052 |
| | | | | |
| ENERGY - 2.1% | | | | | |
Energy Equipment & Services - 1.1% | | | | | |
Cameron International Corporation(1) | | 226,400 | | | 8,562,448 |
Dresser-Rand Group Inc.(1) | | 925,896 | | | 28,767,589 |
Smith International, Inc. | | 335,058 | | | 9,616,165 |
| | | | | |
| | | | | 46,946,202 |
Oil, Gas & Consumable Fuels - 1.0% | | | | | |
Range Resources Corporation | | 863,331 | | | 42,614,018 |
| | | | | |
| FINANCIALS - 6.5% | | | | | |
Capital Markets - 3.2% | | | | | |
Greenhill & Co., Inc. | | 554,886 | | | 49,706,688 |
Invesco Limited | | 1,731,915 | | | 39,418,385 |
TD Ameritrade Holding Corporation(1) | | 2,255,300 | | | 44,248,986 |
| | | | | |
| | | | | 133,374,059 |
Commercial Banks - 1.1% | | | | | |
Fifth Third Bancorp | | 2,049,300 | | | 20,759,409 |
HDFC Bank Ltd. (DR)(2) | | 225,948 | | | 26,745,465 |
| | | | | |
| | | | | 47,504,874 |
Diversified Financial Services - 1.6% | | | | | |
CME Group Inc., Class A | | 100,141 | | | 30,862,455 |
IntercontinentalExchange, Inc.(1) | | 365,600 | | | 35,532,664 |
| | | | | |
| | | | | 66,395,119 |
Real Estate Management & Development - 0.6% | | | | | |
The St. Joe Company(1) | | 910,387 | | | 26,510,469 |
| | | | | |
| HEALTHCARE - 17.8% | | | | | |
Health Care Equipment & Supplies - 3.9% | | | | | |
C.R. Bard, Inc. | | 828,955 | | | 65,164,153 |
33
| | | | | |
| | | Shares
Held | | Value |
| | | | | |
| HEALTHCARE (CONTINUED) | | | | | |
Health Care Equipment & Supplies (Continued) | | | | | |
Intuitive Surgical, Inc.(1) | | 172,312 | | $ | 45,188,822 |
NuVasive, Inc.(1) | | 1,196,270 | | | 49,956,235 |
| | | | | |
| | | | | 160,309,210 |
Health Care Providers & Services - 1.2% | | | | | |
Community Health Systems, Inc.(1) | | 1,591,800 | | | 50,826,174 |
| | | | | |
Health Care Technology - 6.3% | | | |
athenahealth, Inc.(1) | | 833,900 | | | 31,996,743 |
Cerner Corporation(1) | | 2,823,700 | | | 211,212,760 |
Quality Systems, Inc. | | 318,161 | | | 19,589,173 |
| | | | | |
| | | | | 262,798,676 |
Life Sciences Tools & Services - 2.2% | | | | | |
Illumina, Inc.(1) | | 2,140,796 | | | 90,983,830 |
| | | | | |
Pharmaceuticals - 4.2% | | | | | |
Allergan, Inc. | | 3,061,861 | | | 173,791,230 |
| | | | | |
| INDUSTRIALS - 13.2% | | | | | |
Aerospace & Defense - 2.4% | | | |
Precision Castparts Corp. | | 982,220 | | | 100,058,751 |
| | | | | |
Air Freight & Logistics - 0.7% | | | |
C.H. Robinson Worldwide, Inc. | | 292,102 | | | 16,868,891 |
Expeditors International of Washington, Inc. | | 395,927 | | | 13,916,834 |
| | | | | |
| | | | | 30,785,725 |
Building Products - 0.7% | | | | | |
Owens Corning(1) | | 1,380,363 | | | 30,989,149 |
| | | | | |
Construction & Engineering - 3.2% | | | |
AECOM Technology Corporation(1) | | 274,200 | | | 7,441,788 |
Fluor Corporation | | 1,336,419 | | | 67,956,906 |
Quanta Services, Inc.(1) | | 2,552,128 | | | 56,478,593 |
| | | | | |
| | | | | 131,877,287 |
Electrical Equipment - 2.4% | | | | | |
First Solar, Inc.(1) | | 252,555 | | | 38,605,557 |
Roper Industries, Inc. | | 1,170,054 | | | 59,649,353 |
| | | | | |
| | | | | 98,254,910 |
Machinery - 1.1% | | | | | |
PACCAR Inc | | 1,154,306 | | | 43,528,879 |
| | | | | |
Professional Services - 1.2% | | | | | |
IHS Inc., Class A(1) | | 267,500 | | | 13,677,275 |
Robert Half International Inc. | | 1,415,466 | | | 35,414,959 |
| | | | | |
| | | | | 49,092,234 |
| | | | | |
| | | Shares
Held | | Value |
| | | | | |
| INDUSTRIALS (CONTINUED) | | | | | |
Road & Rail - 1.0% | | | | | |
J.B. Hunt Transport Services, Inc. | | 1,339,226 | | $ | 43,029,331 |
| | | | | |
Trading Companies & Distributors - 0.5% | | | | | |
Watsco, Inc. | | 400,000 | | | 21,564,000 |
| | | | | |
| INFORMATION TECHNOLOGY - 34.7% | | | |
Communications Equipment - 3.6% | | | |
CommScope, Inc.(1) | | 1,332,600 | | | 39,884,718 |
Juniper Networks, Inc.(1) | | 2,543,127 | | | 68,715,292 |
Polycom, Inc.(1) | | 1,128,000 | | | 30,174,000 |
Riverbed Technology, Inc.(1) | | 472,100 | | | 10,367,316 |
| | | | | |
| | | | | 149,141,326 |
Computers & Peripherals - 0.9% | | | |
NetApp, Inc.(1) | | 1,334,975 | | | 35,617,133 |
| | | | | |
Electronic Equipment & Instruments - 3.2% | | | | | |
Agilent Technologies, Inc.(1) | | 3,388,100 | | | 94,290,823 |
Trimble Navigation Limited(1) | | 1,607,099 | | | 38,425,737 |
| | | | | |
| | | | | 132,716,560 |
Internet Software & Services - 1.6% | | | | | |
MercadoLibre, Inc.(1) | | 695,200 | | | 26,737,392 |
NetEase.com, Inc. (DR)(1)(2) | | 302,300 | | | 13,809,064 |
VistaPrint Limited(1) | | 470,200 | | | 23,862,650 |
| | | | | |
| | | | | 64,409,106 |
IT Services - 2.7% | | | | | |
Cognizant Technology Solutions Corporation, Class A(1) | | 709,000 | | | 27,409,940 |
The Western Union Company | | 4,473,347 | | | 84,635,725 |
| | | | | |
| | | | | 112,045,665 |
Semiconductors &
Semiconductor Equipment - 10.2% | | | | | |
Analog Devices, Inc. | | 3,058,566 | | | 84,355,250 |
ARM Holdings PLC (DR)(2) | | 6,828,200 | | | 47,797,400 |
Broadcom Corporation, Class A(1) | | 3,142,019 | | | 96,428,563 |
Cree, Inc.(1) | | 1,585,411 | | | 58,263,854 |
MEMC Electronic Materials, Inc.(1) | | 2,889,098 | | | 48,045,700 |
NVIDIA Corporation(1) | | 5,715,076 | | | 85,897,592 |
| | | | | |
| | | | | 420,788,359 |
Software - 12.5% | | | | | |
Adobe Systems Incorporated(1) | | 439,200 | | | 14,511,168 |
ANSYS, Inc.(1) | | 1,306,000 | | | 48,935,820 |
AsiaInfo Holdings, Inc.(1) | | 663,600 | | | 13,252,092 |
Autodesk, Inc.(1) | | 2,647,337 | | | 63,006,621 |
Blackboard Inc.(1) | | 930,700 | | | 35,161,846 |
Citrix Systems, Inc.(1) | | 2,302,160 | | | 90,313,737 |
Electronic Arts Inc.(1) | | 3,320,035 | | | 63,246,667 |
34
| | | | | | | |
| | | Shares
Held | | Value | |
| | | | | | | |
| INFORMATION TECHNOLOGY (CONTINUED) | | | | |
Software (Continued) | | | | | | | |
Intuit Inc.(1) | | | 536,057 | | $ | 15,277,624 | |
Mc Afee, Inc.(1) | | | 459,728 | | | 20,131,489 | |
Red Hat, Inc.(1) | | | 2,033,688 | | | 56,211,136 | |
salesforce.com, inc.(1) | | | 570,435 | | | 32,474,865 | |
Shanda Interactive Entertainment Ltd, (DR)(1)(2) | | | 390,268 | | | 19,981,722 | |
VMware, Inc., Class A(1) | | | 1,110,402 | | | 44,604,848 | |
| | | | | | | |
| | | | | | 517,109,635 | |
| MATERIALS - 2.4% | | | | | | | |
Chemicals - 2.4% | | | | | | | |
Agrium Inc.(2) | | | 1,177,700 | | | 58,637,683 | |
Ecolab Inc. | | | 875,518 | | | 40,475,197 | |
| | | | | | | |
| | | | | | 99,112,880 | |
| EXCHANGE TRADED FUNDS - 0.7% | | | | |
iShares Russell Midcap Growth Index Fund | | | 683,700 | | | 29,077,761 | |
| | | | | | | |
Total common stocks and exchange traded funds
(Cost $3,327,181,109) | | | | | | 3,995,820,823 | |
| | |
| | | Par
Amount | | | |
SHORT-TERM INVESTMENTS
(CASH EQUIVALENTS) - 3.8% | | | | |
Repurchase agreement with Fixed Income Clearing Corporation, 0.01%, dated 9/30/09, due 10/1/09, maturity value $155,263,043(3)
(Cost $155,263,000) | | $ | 155,263,000 | | | 155,263,000 | |
| | | | | | | |
Total investments - 100.2%
(Cost $3,482,444,109) | | | | | | 4,151,083,823 | |
| | | | | | | |
Other assets less liabilities - (0.2%) | | | (8,018,140 | ) |
| | | | | | | |
| | | | | | | |
Total net assets - 100.0%(4) | | | | | $ | 4,143,065,683 | |
| | | | | | | |
| (1) | Non-income producing security. |
| (2) | The Fund considers the company to be from outside of the United States. See the Fund’s Statement of Additional Information for information on how a particular country is assigned. |
| | | | |
Security | | Country | | Trading Currency |
Agrium Inc. | | Canada | | U.S. dollar |
ARM Holdings PLC (DR) | | United Kingdom | | |
Ctrip.com International Limited (DR) | | China | | U.S. dollar |
HDFC Bank Ltd. (DR) | | India | | U.S. dollar |
Home Inns & Hotels Management, Inc. (DR) | | China | | U.S. dollar |
NetEase.com, Inc. (DR) | | China | | U.S. dollar |
Shanda Interactive Entertainment Ltd, (DR) | | China | | U.S. dollar |
| | | | | | | | |
Issuer | | Rate | | | Maturity | | Value |
U.S. Treasury Bond | | 3.125 | % | | 8/31/2013 | | $ | 158,370,849 |
| (4) | Percentages for the various classifications relate to total net assets. |
Company names are as reported by a data service provider and in some cases are translations; a company’s legal name may be different.
(DR) Depository Receipt, voting rights may vary.
| | | | | |
| TOP TEN HOLDINGS - September 30, 2009 | |
Company Name | | Country | | Percentage
of Total
Net Assets | |
Cerner Corporation | | United States | | 5.1 | % |
Allergan, Inc. | | United States | | 4.2 | |
Kohl’s Corporation | | United States | | 3.4 | |
Precision Castparts Corp. | | United States | | 2.4 | |
Broadcom Corporation | | United States | | 2.3 | |
Agilent Technologies, Inc. | | United States | | 2.3 | |
Illumina, Inc. | | United States | | 2.2 | |
Citrix Systems, Inc. | | United States | | 2.2 | |
Hansen Natural Corporation | | United States | | 2.1 | |
NVIDIA Corporation | | United States | | 2.1 | |
| | | | | |
Total | | | | 28.3 | % |
| | | | | |
For the purpose of determining the Fund’s top ten holdings, securities of the same issuer are aggregated to determine the weight in the Fund.
The accompanying notes are an integral part of the financial statements.
35
ARTISAN MID CAP VALUE FUND
Schedule of Investments – September 30, 2009
| | | | | |
| | | Shares
Held | | Value |
| COMMON STOCKS - 92.6% | | | | | |
| | | | | |
| CONSUMER DISCRETIONARY - 12.3% | | | |
Auto Components - 1.2% | | | | | |
BorgWarner Inc. | | 1,821,400 | | $ | 55,115,564 |
| | | | | |
Diversified Consumer Services - 1.4% | | | |
H&R Block, Inc. | | 3,408,600 | | | 62,650,068 |
| | | | | |
Hotels, Restaurants & Leisure - 2.5% | | | |
Burger King Holdings, Inc. | | 4,309,000 | | | 75,795,310 |
Carnival Corporation | | 1,243,400 | | | 41,380,352 |
| | | | | |
| | | | | 117,175,662 |
Household Durables - 1.4% | | | | | |
Mohawk Industries, Inc.(1) | | 1,369,800 | | | 65,325,762 |
| | | | | |
Leisure Equipment & Products - 1.7% | | | |
Mattel, Inc. | | 4,155,400 | | | 76,708,684 |
| | | | | |
Media - 3.7% | | | | | |
Marvel Entertainment, Inc.(1) | | 1,545,900 | | | 76,707,558 |
Omnicom Group Inc. | | 2,617,200 | | | 96,679,368 |
| | | | | |
| | | | | 173,386,926 |
Specialty Retail - 0.4% | | | | | |
AutoZone, Inc.(1) | | 122,400 | | | 17,897,328 |
| | | | | |
| CONSUMER STAPLES - 6.9% | | | | | |
Food & Staples Retailing - 3.8% | | | |
The Kroger Co. | | 5,050,700 | | | 104,246,448 |
Sysco Corporation | | 2,922,500 | | | 72,624,125 |
| | | | | |
| | | | | 176,870,573 |
Food Products - 3.1% | | | | | |
Campbell Soup Company | | 2,204,000 | | | 71,894,480 |
H.J. Heinz Company | | 1,798,400 | | | 71,486,400 |
| | | | | |
| | | | | 143,380,880 |
| ENERGY - 10.3% | | | | | |
Energy Equipment & Services - 4.9% | | | | | |
Baker Hughes Incorporated | | 1,011,700 | | | 43,159,122 |
Nabors Industries Ltd.(1) | | 5,624,800 | | | 117,558,320 |
Pride International, Inc.(1) | | 2,118,000 | | | 64,471,920 |
Seahawk Drilling, Inc.(1) | | 33,035 | | | 1,027,058 |
| | | | | |
| | | | | 226,216,420 |
Oil, Gas & Consumable Fuels - 5.4% | | | |
Cimarex Energy Co. | | 2,754,990 | | | 119,346,167 |
EOG Resources, Inc. | | 960,000 | | | 80,169,600 |
| | | | | |
| | | Shares
Held | | Value |
| ENERGY (CONTINUED) | | | | | |
Oil, Gas & Consumable Fuels (Continued) | | | | | |
Valero Energy Corporation | | 2,508,400 | | $ | 48,637,876 |
| | | | | |
| | | | | 248,153,643 |
| FINANCIALS - 13.9% | | | | | |
Consumer Finance - 0.3% | | | | | |
The Student Loan Corporation | | 311,400 | | | 14,448,960 |
| | | | | |
Insurance - 12.1% | | | | | |
Alleghany Corporation(1)(2) | | 475,576 | | | 123,197,963 |
Allied World Assurance Company Holdings, Ltd | | 1,691,300 | | | 81,064,009 |
Arch Capital Group Ltd.(1) | | 1,414,873 | | | 95,560,522 |
Brown & Brown, Inc. | | 3,428,400 | | | 65,688,144 |
Fidelity National Financial, Inc. | | 6,559,281 | | | 98,913,958 |
The Progressive Corporation(1) | | 4,607,000 | | | 76,384,060 |
W. R. Berkley Corporation | | 776,200 | | | 19,622,336 |
| | | | | |
| | | | | 560,430,992 |
Real Estate Investment Trusts (REITS) - 1.5% | | | | | |
Annaly Capital Management, Inc. | | 3,918,200 | | | 71,076,148 |
| | | | | |
| HEALTHCARE - 6.8% | | | | | |
Health Care Equipment & Supplies - 2.7% | | | | | |
CareFusion Corporation(1) | | 945,100 | | | 20,603,180 |
Stryker Corporation | | 2,303,500 | | | 104,648,005 |
| | | | | |
| | | | | 125,251,185 |
Health Care Providers & Services - 2.7% | | | | | |
Cardinal Health, Inc. | | 1,890,200 | | | 50,657,360 |
CIGNA Corporation | | 2,693,800 | | | 75,668,842 |
| | | | | |
| | | | | 126,326,202 |
Life Sciences Tools & Services - 1.4% | | | | | |
Covance Inc.(1) | | 1,220,400 | | | 66,084,660 |
| | | | | |
| INDUSTRIALS - 22.9% | | | | | |
Aerospace & Defense - 4.5% | | | |
L-3 Communications Holdings, Inc. | | 979,600 | | | 78,681,472 |
Rockwell Collins, Inc. | | 2,555,100 | | | 129,799,080 |
| | | | | |
| | | | | 208,480,552 |
Commercial Services & Supplies - 2.2% | | | | | |
Cintas Corporation | | 3,351,900 | | | 101,596,089 |
36
| | | | | |
| | | Shares
Held | | Value |
| INDUSTRIALS (CONTINUED) | | | | | |
Electrical Equipment - 4.5% | | | | | |
Acuity Brands, Inc.(2) | | 2,418,315 | | $ | 77,893,926 |
Hubbell Inc., Class B | | 2,119,800 | | | 89,031,600 |
Thomas & Betts Corporation(1) | | 1,377,500 | | | 41,435,200 |
| | | | | |
| | | | | 208,360,726 |
Machinery - 1.8% | | | | | |
Dover Corporation | | 2,135,100 | | | 82,756,476 |
| | | | | |
Marine - 0.8% | | | | | |
Alexander & Baldwin, Inc. | | 1,179,300 | | | 37,843,737 |
| | | | | |
Professional Services - 6.3% | | | |
The Dun & Bradstreet Corporation | | 942,800 | | | 71,011,696 |
Equifax Inc. | | 3,213,500 | | | 93,641,390 |
Manpower Inc. | | 1,145,100 | | | 64,938,621 |
Robert Half International Inc. | | 2,387,700 | | | 59,740,254 |
| | | | | |
| | | | | 289,331,961 |
Road & Rail - 1.6% | | | | | |
Ryder System, Inc. | | 1,844,300 | | | 72,038,358 |
| | | | | |
Trading Companies & Distributors - 1.2% | | | | | |
GATX Corporation | | 2,005,100 | | | 56,042,545 |
| | | | | |
| INFORMATION TECHNOLOGY - 16.4% | | | |
Computers & Peripherals - 1.2% | | | |
Seagate Technology | | 3,792,100 | | | 57,677,841 |
| | | | | |
Electronic Equipment & Instruments - 6.6% | | | | | |
Arrow Electronics, Inc.(1) | | 3,315,200 | | | 93,322,880 |
Avnet, Inc.(1) | | 3,895,800 | | | 101,173,926 |
Ingram Micro Inc., Class A(1) | | 6,496,000 | | | 109,457,600 |
| | | | | |
| | | | | 303,954,406 |
IT Services - 3.3% | | | | | |
Hewitt Associates, Inc.(1) | | 2,517,800 | | | 91,723,454 |
SAIC, Inc.(1) | | 3,443,700 | | | 60,402,498 |
| | | | | |
| | | | | 152,125,952 |
Semiconductors & Semiconductor Equipment - 4.6% | | | | | |
Analog Devices, Inc. | | 2,427,700 | | | 66,955,966 |
Lam Research Corporation(1) | | 1,829,200 | | | 62,485,472 |
National Semiconductor Corporation | | 5,800,100 | | | 82,767,427 |
| | | | | |
| | | | | 212,208,865 |
Software - 0.7% | | | | | |
Autodesk, Inc.(1) | | 1,367,000 | | | 32,534,600 |
| | | | | |
| UTILITIES - 3.1% | | | | | |
Electrical Utilities - 1.5% | | | | | |
PPL Corporation | | 2,359,300 | | | 71,581,162 |
| | | | | | | |
| | | Shares
Held | | Value | |
| UTILITIES (CONTINUED) | | | | | | | |
Multi-Utilities - 1.6% | | | | | | | |
SCANA Corporation | | | 2,058,100 | | $ | 71,827,690 | |
| | | | | | | |
Total common stocks
(Cost $3,888,805,896) | | | | | | 4,284,860,617 | |
| | |
| | | Par
Amount | | | |
| SHORT-TERM INVESTMENTS (CASH EQUIVALENTS) - 7.6% | | | | |
| Repurchase agreement with Fixed Income Clearing Corporation, 0.01%, dated 9/30/09, due 10/1/09, maturity value $354,552,098(3) (Cost $354,552,000) | | $ | 354,552,000 | | | 354,552,000 | |
| | | | | | | |
Total investments - 100.2% (Cost $4,243,357,896) | | | | | | 4,639,412,617 | |
| | | | | | | |
Other assets less liabilities - (0.2%) | | | (11,456,191 | ) |
| | | | | | | |
| | | | | | | |
Total net assets - 100.0%(4) | | | | | $ | 4,627,956,426 | |
| | | | | | | |
| (1) | Non-income producing security. |
| (2) | Affiliated company as defined by the Investment Company Act of 1940. See Note (6) in Notes to Financial Statements. |
| | | | | | | | |
Issuer | | Rate | | | Maturity | | Value |
U.S. Treasury Bond | | 4.875 | % | | 7/31/2011 | | $ | 95,066,400 |
U.S. Treasury Bond | | 3.125 | | | 8/31/2013 | | | 111,629,780 |
U.S. Treasury Bond | | 0.875 | | | 1/31/2011 | | | 154,950,900 |
| | | | | | | | |
| | | | | | | $ | 361,647,080 |
| | | | | | | | |
| (4) | Percentages for the various classifications relate to total net assets. |
Company names are as reported by a data service provider and in some cases are translations; a company’s legal name may be different.
37
| | | | | |
| TOP TEN HOLDINGS - September 30, 2009 | |
Company Name | | Country | | Percentage
of Total
Net Assets | |
Rockwell Collins, Inc. | | United States | | 2.8 | % |
Alleghany Corporation | | United States | | 2.7 | |
Cimarex Energy Co. | | United States | | 2.6 | |
Nabors Industries Ltd. | | United States | | 2.5 | |
Ingram Micro Inc. | | United States | | 2.4 | |
Stryker Corporation | | United States | | 2.3 | |
The Kroger Co. | | United States | | 2.3 | |
Cintas Corporation | | United States | | 2.2 | |
Avnet, Inc. | | United States | | 2.2 | |
Fidelity National Financial, Inc. | | United States | | 2.1 | |
| | | | | |
Total | | | | 24.1 | % |
| | | | | |
For the purpose of determining the Fund’s top ten holdings, securities of the same issuer are aggregated to determine the weight in the Fund.
The accompanying notes are an integral part of the financial statements.
38
ARTISAN OPPORTUNISTIC GROWTH FUND
Schedule of Investments – September 30, 2009
| | | | | |
| | | Shares
Held | | Value |
| COMMON STOCKS - 93.9% | | | | | |
| | | | | |
| CONSUMER DISCRETIONARY - 15.1% | | | | | |
Auto Components - 3.1% | | | | | |
Johnson Controls, Inc. | | 54,994 | | $ | 1,405,647 |
| | | | | |
Hotels, Restaurants & Leisure - 1.3% | | | | | |
Starbucks Corporation(1) | | 28,552 | | | 589,599 |
| | | | | |
Multiline Retail - 5.7% | | | | | |
Kohl’s Corporation(1) | | 29,600 | | | 1,688,680 |
Target Corporation | | 19,615 | | | 915,628 |
| | | | | |
| | | | | 2,604,308 |
Specialty Retail - 2.1% | | | | | |
Best Buy Co., Inc. | | 25,050 | | | 939,876 |
| | | | | |
Textiles, Apparel & Luxury Goods - 2.9% | | | |
NIKE, Inc., Class B | | 20,045 | | | 1,296,912 |
| | | | | |
| ENERGY - 4.3% | | | | | |
Energy Equipment & Services - 1.3% | | | | | |
Schlumberger Limited | | 10,100 | | | 601,960 |
| | | | | |
Oil, Gas & Consumable Fuels - 3.0% | | | | | |
Petroleo Brasileiro S.A. (DR)(2) | | 19,025 | | | 873,248 |
Range Resources Corporation | | 10,300 | | | 508,408 |
| | | | | |
| | | | | 1,381,656 |
| FINANCIALS - 7.8% | | | | | |
Capital Markets - 0.9% | | | | | |
Invesco Limited | | 18,319 | | | 416,940 |
| | | | | |
Diversified Financial Services - 6.9% | | | | | |
Bank of America Corporation | | 69,000 | | | 1,167,480 |
CME Group Inc., Class A | | 2,035 | | | 627,167 |
JPMorgan Chase & Co. | | 31,075 | | | 1,361,706 |
| | | | | |
| | | | | 3,156,353 |
| HEALTHCARE - 12.6% | | | | | |
Health Care Equipment & Supplies - 2.2% | | | |
C.R. Bard, Inc. | | 12,825 | | | 1,008,173 |
| | | | | |
Health Care Providers & Services - 1.8% | | | |
Community Health Systems, Inc.(1) | | 25,300 | | | 807,829 |
| | | | | |
Health Care Technology - 3.9% | | | | | |
Cerner Corporation(1) | | 23,690 | | | 1,772,012 |
| | | | | |
Pharmaceuticals - 4.7% | | | | | |
Allergan, Inc. | | 38,075 | | | 2,161,137 |
| | | | | |
| | | Shares
Held | | Value |
| INDUSTRIALS - 10.9% | | | | | |
Construction & Engineering - 1.4% | | | | | |
Quanta Services, Inc.(1) | | 28,675 | | $ | 634,578 |
| | | | | |
Electrical Equipment - 6.2% | | | | | |
ABB Limited (DR)(1)(2) | | 34,500 | | | 691,380 |
First Solar, Inc.(1) | | 6,485 | | | 991,297 |
Gamesa Corporacion Tecnologica, S.A.(2) | | 51,725 | | | 1,158,840 |
| | | | | |
| | | | | 2,841,517 |
Machinery - 1.0% | | | | | |
PACCAR Inc | | 12,500 | | | 471,375 |
| | | | | |
Road & Rail - 2.3% | | | | | |
CSX Corporation | | 24,700 | | | 1,033,942 |
| | | | | |
| INFORMATION TECHNOLOGY - 41.8% | | | | | |
Communications Equipment - 5.6% | | | | | |
Tandberg ASA(2) | | 58,074 | | | 1,390,494 |
Telefonaktiebolaget LM Ericsson, Class B (DR)(2) | | 115,400 | | | 1,156,308 |
| | | | | |
| | | | | 2,546,802 |
Computers & Peripherals - 8.9% | | | | | |
Apple Inc.(1) | | 10,750 | | | 1,992,727 |
EMC Corporation(1) | | 121,600 | | | 2,072,064 |
| | | | | |
| | | | | 4,064,791 |
Electronic Equipment &
Instruments - 4.3% | | | |
Agilent Technologies, Inc.(1) | | 42,000 | | | 1,168,860 |
Corning Incorporated | | 51,200 | | | 783,872 |
| | | | | |
| | | | | 1,952,732 |
Internet Software & Services - 5.7% | | | |
eBay Inc.(1) | | 69,600 | | | 1,643,256 |
Google Inc., Class A(1) | | 1,935 | | | 959,470 |
| | | | | |
| | | | | 2,602,726 |
IT Services - 2.0% | | | | | |
Visa Inc., Class A | | 13,000 | | | 898,430 |
| | | | | |
Semiconductors & Semiconductor
Equipment - 10.0% | | | |
ARM Holdings PLC(2) | | 497,500 | | | 1,141,735 |
Broadcom Corporation, Class A(1) | | 49,625 | | | 1,522,991 |
MEMC Electronic Materials, Inc.(1) | | 47,400 | | | 788,262 |
NVIDIA Corporation(1) | | 73,320 | | | 1,102,000 |
| | | | | |
| | | | | 4,554,988 |
39
| | | | | | | |
| | | Shares
Held | | Value | |
| INFORMATION TECHNOLOGY (CONTINUED) | | | | |
Software - 5.3% | | | | | | | |
Activision Blizzard, Inc.(1) | | | 80,900 | | $ | 1,002,351 | |
Citrix Systems, Inc.(1) | | | 35,800 | | | 1,404,434 | |
| | | | | | | |
| | | | | | 2,406,785 | |
| MATERIALS - 1.4% | | | | | | | |
Chemicals - 1.4% | | | | | | | |
The Mosaic Company | | | 12,865 | | | 618,421 | |
| | | | | | | |
Total common stocks
(Cost $35,377,647) | | | | | | 42,769,489 | |
| | |
| | | Par
Amount | | | |
SHORT-TERM INVESTMENTS
(CASH EQUIVALENTS) - 8.2% | | | | | | | |
Repurchase agreement with Fixed Income Clearing Corporation, 0.01%, dated 9/30/09, due 10/1/09, maturity value $3,758,001(3)
(Cost $3,758,000) | | $ | 3,758,000 | | | 3,758,000 | |
| | | | | | | |
| | | | | | | |
Total investments - 102.1%
(Cost $39,135,647) | | | | | | 46,527,489 | |
| | | | | | | |
Other assets less liabilities - (2.1%) | | | | | | (970,449 | ) |
| | | | | | | |
| | | | | | | |
Total net assets - 100.0%(4) | | | | | $ | 45,557,040 | |
| | | | | | | |
| (1) | Non-income producing security. |
| (2) | The Fund considers the company to be from outside of the United States. See the Fund’s Statement of Additional Information for information on how a particular country is assigned. |
| | | | |
Security | | Country | | Trading
Currency |
ABB Limited (DR) | | Switzerland | | US dollar |
ARM Holdings PLC | | United Kingdom | | British pound |
Gamesa Corporacion Tecnologica, S.A. | | Spain | | Euro |
Petroleo Brasileiro S.A. (DR) | | Brazil | | US dollar |
Tandberg ASA | | Norway | | Norwegian krone |
Telefonaktiebolaget LM Ericsson, Class B (DR) | | Sweden | | US dollar |
| | | | | | | | |
Issuer | | Rate | | | Maturity | | Value |
U.S. Treasury Bond | | 2.625 | % | | 7/31/2014 | | $ | 3,835,975 |
| (4) | Percentages for the various classifications relate to total net assets. |
Company names are as reported by a data service provider and in some cases are translations; a company’s legal name may be different.
(DR) Depository Receipt, voting rights may vary.
| | | | | | |
| CURRENCY EXPOSURE - September 30, 2009 | | | |
| | | Value | | Percentage
of Total
Investments | |
British pound | | $ | 1,141,735 | | 2.4 | % |
Euro | | | 1,158,840 | | 2.5 | |
Norwegian krone | | | 1,390,494 | | 3.0 | |
U.S. dollar | | | 42,836,420 | | 92.1 | |
| | | | | | |
Total investments | | $ | 46,527,489 | | 100.0 | % |
| | | | | | |
| | | | | |
| TOP TEN HOLDINGS - September 30, 2009 | |
Company Name | | Country | | Percentage
of Total
Net Assets | |
Allergan, Inc. | | United States | | 4.7 | % |
EMC Corporation | | United States | | 4.5 | |
Apple Inc. | | United States | | 4.4 | |
Cerner Corporation | | United States | | 3.9 | |
Kohl’s Corporation | | United States | | 3.7 | |
eBay Inc. | | United States | | 3.6 | |
Broadcom Corporation | | United States | | 3.3 | |
Johnson Controls, Inc. | | United States | | 3.1 | |
Citrix Systems, Inc. | | United States | | 3.1 | |
Tandberg ASA | | Norway | | 3.1 | |
| | | | | |
Total | | | | 37.4 | % |
| | | | | |
For the purpose of determining the Fund’s top ten holdings, securities of the same issuer are aggregated to determine the weight in the Fund.
The accompanying notes are an integral part of the financial statements.
40
ARTISAN OPPORTUNISTIC VALUE FUND
Schedule of Investments – September 30, 2009
| | | | | |
| | | Shares
Held | | Value |
| COMMON STOCKS - 97.1% | | | | | |
| | | | | |
| CONSUMER DISCRETIONARY - 12.6% | | | |
Hotels, Restaurants & Leisure - 3.7% | | | |
Carnival Corporation | | 34,900 | | $ | 1,161,472 |
McDonald’s Corporation | | 98,400 | | | 5,615,688 |
| | | | | |
| | | | | 6,777,160 |
Household Durables - 1.8% | | | | | |
Mohawk Industries, Inc.(1) | | 68,300 | | | 3,257,227 |
| | | | | |
Media - 7.1% | | | | | |
Comcast Corporation, Class A Special(2) | | 327,100 | | | 5,259,768 |
Omnicom Group Inc. | | 107,000 | | | 3,952,580 |
The Walt Disney Company | | 130,400 | | | 3,580,784 |
| | | | | |
| | | | | 12,793,132 |
| CONSUMER STAPLES - 14.2% | | | | | |
Food & Staples Retailing - 7.0% | | | | | |
The Kroger Co. | | 287,100 | | | 5,925,744 |
Wal-Mart Stores, Inc. | | 138,500 | | | 6,798,965 |
| | | | | |
| | | | | 12,724,709 |
Food Products - 5.2% | | | | | |
Nestle SA(3) | | 122,400 | | | 5,215,849 |
Unilever PLC (DR)(3) | | 144,200 | | | 4,135,656 |
| | | | | |
| | | | | 9,351,505 |
Tobacco - 2.0% | | | | | |
Philip Morris International Inc. | | 73,500 | | | 3,582,390 |
| | | | | |
| ENERGY - 5.8% | | | | | |
Energy Equipment & Services - 3.3% | | | |
Nabors Industries Ltd.(1) | | 286,500 | | | 5,987,850 |
| | | | | |
Oil, Gas & Consumable Fuels - 2.5% | | | |
Apache Corporation | | 49,200 | | | 4,518,036 |
| | | | | |
| FINANCIALS - 18.9% | | | | | |
Insurance - 16.9% | | | | | |
ACE Limited(1) | | 54,000 | | | 2,886,840 |
The Allstate Corporation | | 129,850 | | | 3,976,007 |
Arch Capital Group Ltd.(1) | | 69,700 | | | 4,707,538 |
Berkshire Hathaway Inc., Class B(1) | | 2,410 | | | 8,008,430 |
The Chubb Corporation | | 55,900 | | | 2,817,919 |
Fidelity National Financial, Inc. | | 285,500 | | | 4,305,340 |
The Progressive Corporation(1) | | 233,000 | | | 3,863,140 |
| | | | | |
| | | | | 30,565,214 |
| | | | | |
| | | Shares
Held | | Value |
| FINANCIALS - (CONTINUED) | | | | | |
Real Estate Investment Trusts (REITS) - 2.0% | | | | | |
Annaly Capital Management, Inc. | | 201,000 | | $ | 3,646,140 |
| | | | | |
| HEALTHCARE - 10.8% | | | | | |
Health Care Equipment & Supplies - 2.6% | | | | | |
Stryker Corporation | | 102,200 | | | 4,642,946 |
| | | | | |
Health Care Providers & Services - 1.9% | | | |
CIGNA Corporation | | 121,300 | | | 3,407,317 |
| | | | | |
Pharmaceuticals - 6.3% | | | | | |
Johnson & Johnson | | 88,800 | | | 5,407,032 |
Pfizer Inc. | | 366,700 | | | 6,068,885 |
| | | | | |
| | | | | 11,475,917 |
| INDUSTRIALS - 8.3% | | | | | |
Aerospace & Defense - 8.3% | | | | | |
Lockheed Martin Corporation | | 122,200 | | | 9,541,376 |
Rockwell Collins, Inc. | | 107,900 | | | 5,481,320 |
| | | | | |
| | | | | 15,022,696 |
| INFORMATION TECHNOLOGY - 26.5% | | | |
Communications Equipment - 2.5% | | | |
Nokia Corporation (DR)(3) | | 312,800 | | | 4,573,136 |
| | | | | |
Computers & Peripherals - 6.3% | | | | | |
Dell Inc.(1) | | 206,800 | | | 3,155,768 |
Hewlett-Packard Company | | 177,100 | | | 8,360,891 |
| | | | | |
| | | | | 11,516,659 |
Electronic Equipment & Instruments - 6.8% | | | | | |
Avnet, Inc.(1) | | 134,200 | | | 3,485,174 |
Corning Incorporated | | 178,600 | | | 2,734,366 |
Ingram Micro Inc., Class A(1) | | 360,500 | | | 6,074,425 |
| | | | | |
| | | | | 12,293,965 |
IT Services - 3.8% | | | | | |
Accenture PLC, Class A | | 186,200 | | | 6,939,674 |
| | | | | |
Semiconductors & Semiconductor Equipment - 2.8% | | | | | |
Texas Instruments Incorporated | | 213,400 | | | 5,055,446 |
41
| | | | | | | |
| | | Shares
Held | | Value | |
| INFORMATION TECHNOLOGY (CONTINUED) | | | | | | | |
Software - 4.3% | | | | | | | |
Microsoft Corporation | | | 299,900 | | $ | 7,764,411 | |
| | | | | | | |
Total common stocks
(Cost $165,072,349) | | | | | | 175,895,530 | |
| | |
| | | Par
Amount | | | |
SHORT-TERM INVESTMENTS
(CASH EQUIVALENTS) - 5.7% | | | | |
Repurchase agreement with Fixed Income Clearing Corporation, 0.01%, dated 9/30/09, due 10/1/09, maturity value $10,305,003(4)
(Cost $10,305,000) | | $ | 10,305,000 | | | 10,305,000 | |
| | | | | | | |
| | | | | | | |
Total investments - 102.8%
(Cost $175,377,349) | | | | | | 186,200,530 | |
| | | | | | | |
Other assets less liabilities - (2.8%) | | | | | | (5,090,555 | ) |
| | | | | | | |
| | | | | | | |
Total net assets - 100.0%(5) | | | | | $ | 181,109,975 | |
| | | | | | | |
| (1) | Non-income producing security. |
| (3) | The Fund considers the company to be from outside of the United States. See the Fund’s Statement of Additional Information for information on how a particular country is assigned. |
| | | | |
Security | | Country | | Trading Currency |
Nestle SA | | Switzerland | | Swiss franc |
Nokia Corporation (DR) | | Finland | | U.S. dollar |
Unilever PLC (DR) | | United Kingdom | | U.S. dollar |
| | | | | | | | |
Issuer | | Rate | | | Maturity | | Value |
U.S. Treasury Bond | | 4.625 | % | | 8/31/2011 | | $ | 2,870,543 |
U.S. Treasury Bond | | 1.750 | | | 3/31/2014 | | | 93,219 |
U.S. Treasury Bond | | 3.250 | | | 5/31/2016 | | | 811,494 |
U.S. Treasury Bond | | 2.625 | | | 6/30/2014 | | | 781,256 |
U.S. Treasury Bond | | 2.625 | | | 7/31/2014 | | | 5,957,463 |
| | | | | | | | |
| | | | | | | $ | 10,513,975 |
| | | | | | | | |
| (5) | Percentages for the various classifications relate to total net assets. |
Company names are as reported by a data service provider and in some cases are translations; a company’s legal name may be different.
(DR) Depository Receipt, voting rights may vary.
| | | | | |
| TOP TEN HOLDINGS - September 30, 2009 | |
Company Name | | Country | | Percentage
of Total
Net Assets | |
Lockheed Martin Corporation | | United States | | 5.3 | % |
Hewlett-Packard Company | | United States | | 4.6 | |
Berkshire Hathaway Inc. | | United States | | 4.4 | |
Microsoft Corporation | | United States | | 4.3 | |
Accenture PLC | | United States | | 3.8 | |
Wal-Mart Stores, Inc. | | United States | | 3.8 | |
Ingram Micro Inc. | | United States | | 3.4 | |
Pfizer Inc. | | United States | | 3.4 | |
Nabors Industries Ltd. | | United States | | 3.3 | |
The Kroger Co. | | United States | | 3.3 | |
| | | | | |
Total | | | | 39.6 | % |
| | | | | |
For the purpose of determining the Fund’s top ten holdings, securities of the same issuer are aggregated to determine the weight in the Fund.
The accompanying notes are an integral part of the financial statements.
42
ARTISAN SMALL CAP FUND
Schedule of Investments – September 30, 2009
| | | | | |
| | | Shares
Held | | Value |
| COMMON STOCKS - 95.6% | | | | | |
| | | | | |
| CONSUMER DISCRETIONARY - 10.1% | | | |
Distributors - 2.1% | | | | | |
LKQ Corporation(1) | | 501,000 | | $ | 9,288,540 |
| | | | | |
Hotels, Restaurants & Leisure - 2.0% | | | |
Life Time Fitness, Inc.(1) | | 130,600 | | | 3,663,330 |
WMS Industries(1) | | 117,600 | | | 5,240,256 |
| | | | | |
| | | | | 8,903,586 |
Specialty Retail - 4.6% | | | |
The Gymboree Corporation(1) | | 105,200 | | | 5,089,576 |
Hibbett Sports, Inc.(1) | | 390,350 | | | 7,116,081 |
Monro Muffler Brake, Inc. | | 33,200 | | | 1,055,428 |
PETsMART, Inc. | | 309,200 | | | 6,725,100 |
| | | | | |
| | | | | 19,986,185 |
Textiles, Apparel & Luxury Goods - 1.4% | | | |
Iconix Brand Group, Inc.(1) | | 497,400 | | | 6,202,578 |
| | | | | |
| CONSUMER STAPLES - 3.7% | | | |
Food Products - 1.8% | | | |
Flowers Foods, Inc. | | 305,000 | | | 8,018,450 |
| | | | | |
Personal Products - 1.9% | | | |
Bare Escentuals, Inc.(1) | | 494,500 | | | 5,879,605 |
Chattem, Inc.(1) | | 39,000 | | | 2,589,990 |
| | | | | |
| | | | | 8,469,595 |
| ENERGY - 7.4% | | | |
Energy Equipment & Services - 4.4% | | | |
Atwood Oceanics, Inc.(1) | | 160,800 | | | 5,671,416 |
Core Laboratories N.V. | | 60,600 | | | 6,247,254 |
Dril-Quip, Inc.(1) | | 90,400 | | | 4,487,456 |
Helmerich & Payne, Inc. | | 67,600 | | | 2,672,228 |
| | | | | |
| | | | | 19,078,354 |
Oil, Gas & Consumable Fuels - 3.0% | | | |
Carrizo Oil & Gas, Inc.(1) | | 248,800 | | | 6,093,112 |
Comstock Resources, Inc.(1) | | 171,600 | | | 6,877,728 |
| | | | | |
| | | | | 12,970,840 |
| FINANCIALS - 7.4% | | | |
Capital Markets - 5.0% | | | |
Ares Capital Corporation | | 1,075,161 | | | 11,848,274 |
Artio Global Investors Inc., Class A(1) | | 68,200 | | | 1,783,430 |
Greenhill & Co., Inc. | | 26,100 | | | 2,338,038 |
Investment Technology Group, Inc.(1) | | 206,500 | | | 5,765,480 |
| | | | | |
| | | | | 21,735,222 |
Commercial Banks - 0.6% | | | |
MB Financial, Inc. | | 118,500 | | | 2,484,945 |
| | | | | |
| | | Shares
Held | | Value |
| FINANCIALS (CONTINUED) | | | |
Insurance - 1.8% | | | |
Reinsurance Group of America, Incorporated | | 161,400 | | $ | 7,198,440 |
Selective Insurance Group, Inc. | | 52,200 | | | 821,106 |
| | | | | |
| | | | | 8,019,546 |
| HEALTHCARE - 14.8% | | | |
Biotechnology - 1.2% | | | |
AMAG Pharmaceuticals, Inc.(1) | | 57,600 | | | 2,515,968 |
Cepheid(1) | | 190,300 | | | 2,515,766 |
| | | | | |
| | | | | 5,031,734 |
Health Care Equipment & Supplies - 1.4% | | | |
Masimo Corporation(1) | | 161,200 | | | 4,223,440 |
Wright Medical Group, Inc.(1) | | 98,700 | | | 1,762,782 |
| | | | | |
| | | | | 5,986,222 |
Health Care Providers & Services - 7.3% | | | |
Catalyst Health Solutions, Inc.(1) | | 219,800 | | | 6,407,170 |
Clarient, Inc.(1) | | 639,200 | | | 2,691,032 |
Genoptix, Inc.(1) | | 202,100 | | | 7,029,038 |
PSS World Medical, Inc.(1) | | 413,000 | | | 9,015,790 |
Psychiatric Solutions, Inc.(1) | | 245,200 | | | 6,561,552 |
| | | | | |
| | | | | 31,704,582 |
Health Care Technology - 3.0% | | | |
athenahealth, Inc.(1) | | 110,800 | | | 4,251,396 |
Phase Forward Incorporated(1) | | 642,600 | | | 9,022,104 |
| | | | | |
| | | | | 13,273,500 |
Life Sciences Tools & Services - 1.9% | | | |
ICON PLC (DR)(1)(2) | | 336,400 | | | 8,238,436 |
| | | | | |
| INDUSTRIALS - 20.6% | | | |
Aerospace & Defense - 1.7% | | | |
AAR CORP.(1) | | 331,200 | | | 7,266,528 |
| | | | | |
Air Freight & Logistics - 1.4% | | | |
UTi Worldwide Inc. | | 421,800 | | | 6,107,664 |
| | | | | |
Airlines - 1.2% | | | |
Allegiant Travel Company(1) | | 134,400 | | | 5,119,296 |
| | | | | |
Commercial Services & Supplies - 6.5% | | | |
Clean Harbors, Inc.(1) | | 78,500 | | | 4,416,410 |
Corrections Corporation of America(1) | | 321,400 | | | 7,279,710 |
The GEO Group, Inc.(1) | | 292,000 | | | 5,889,640 |
Waste Connections, Inc.(1) | | 370,625 | | | 10,696,238 |
| | | | | |
| | | | | 28,281,998 |
43
| | | | | |
| | | Shares
Held | | Value |
| INDUSTRIALS (CONTINUED) | | | |
Electrical Equipment - 0.8% | | | |
Regal-Beloit Corporation | | 72,400 | | $ | 3,309,404 |
| | | | | |
Machinery - 5.0% | | | |
Actuant Corporation | | 289,800 | | | 4,654,188 |
Astec Industries, Inc.(1) | | 140,900 | | | 3,588,723 |
IDEX Corporation | | 169,800 | | | 4,745,910 |
The Middleby Corporation(1) | | 84,200 | | | 4,631,842 |
Robbins & Myers, Inc. | | 176,300 | | | 4,139,524 |
| | | | | |
| | | | | 21,760,187 |
Professional Services - 1.4% | | | |
FTI Consulting, Inc.(1) | | 140,400 | | | 5,982,444 |
| | | | | |
Road & Rail - 1.3% | | | |
Old Dominion Freight Line, Inc.(1) | | 193,900 | | | 5,900,377 |
| | | | | |
Transportation Infrastructure - 1.3% | | | |
Aegean Marine Petroleum Network Inc.(2) | | 262,100 | | | 5,897,250 |
| | | | | |
| INFORMATION TECHNOLOGY - 28.9% | | | |
Communications Equipment - 3.4% | | | |
Avocent Corporation(1) | | 470,300 | | | 9,532,981 |
Riverbed Technology, Inc.(1) | | 247,000 | | | 5,424,120 |
| | | | | |
| | | | | 14,957,101 |
Computers & Peripherals - 0.6% | | | |
STEC, Inc.(1) | | 93,400 | | | 2,745,026 |
| | | | | |
Electronic Equipment & Instruments - 1.7% | | | |
Brightpoint, Inc.(1) | | 856,600 | | | 7,495,250 |
| | | | | |
Internet Software & Services - 5.0% | | | |
Equinix, Inc.(1) | | 87,000 | | | 8,004,000 |
GSI Commerce, Inc.(1) | | 297,500 | | | 5,744,725 |
Omniture, Inc.(1) | | 381,500 | | | 8,179,360 |
| | | | | |
| | | | | 21,928,085 |
IT Services - 4.0% | | | |
Euronet Worldwide, Inc.(1) | | 488,180 | | | 11,730,965 |
ManTech International Corporation, Class A(1) | | 121,900 | | | 5,748,804 |
| | | | | |
| | | | | 17,479,769 |
Semiconductors & Semiconductor Equipment - 4.2% | | | | | |
Atheros Communications, Inc.(1) | | 182,300 | | | 4,836,419 |
Microsemi Corporation(1) | | 409,400 | | | 6,464,426 |
Tessera Technologies, Inc.(1) | | 217,500 | | | 6,066,075 |
Varian Semiconductor Equipment Associates, Inc.(1) | | 25,900 | | | 850,556 |
| | | | | |
| | | | | 18,217,476 |
| | | | | | | |
| | | Shares
Held | | Value | |
| INFORMATION TECHNOLOGY (CONTINUED) | | | | | | | |
Software - 10.0% | | | | |
ANSYS, Inc.(1) | | | 160,800 | | $ | 6,025,176 | |
CommVault Systems, Inc.(1) | | | 301,800 | | | 6,262,350 | |
Concur Technologies, Inc.(1) | | | 128,700 | | | 5,117,112 | |
Informatica Corporation(1) | | | 346,200 | | | 7,817,196 | |
Progress Software Corporation(1) | | | 245,800 | | | 5,567,370 | |
Quest Software, Inc.(1) | | | 239,700 | | | 4,038,945 | |
Rovi Corporation(1) | | | 215,800 | | | 7,250,880 | |
Solarwinds Inc(1) | | | 82,500 | | | 1,817,475 | |
| | | | | | | |
| | | | | | 43,896,504 | |
| MATERIALS - 1.3% | | | | | | | |
Chemicals - 1.3% | | | | | | | |
Albemarle Corporation | | | 170,000 | | | 5,882,000 | |
| | | | | | | |
| UTILITIES - 1.4% | | | | | | | |
Electrical Utilities - 1.4% | | | | | | | |
ITC Holdings Corp. | | | 137,700 | | | 6,258,465 | |
| | | | | | | |
Total common stocks
(Cost $303,609,428) | | | | | | 417,877,139 | |
| | | | | | | |
| | |
| | | Par
Amount | | | |
| SHORT-TERM INVESTMENTS (CASH EQUIVALENTS) - 4.4% | | | | | | | |
Repurchase agreement with Fixed Income Clearing Corporation, 0.01%, dated 9/30/09, due 10/1/09, maturity value $19,147,005(3)
(Cost $19,147,000) | | $ | 19,147,000 | | | 19,147,000 | |
| | | | | | | |
| | | | | | | |
Total investments - 100.0%
(Cost $322,756,428) | | | | | | 437,024,139 | |
| | | | | | | |
Other assets less liabilities - 0.0%(4) | | | | | | (28,427 | ) |
| | | | | | | |
| | | | | | | |
Total net assets - 100.0%(5) | | | | | $ | 436,995,712 | |
| | | | | | | |
| (1) | Non-income producing security. |
| (2) | The Fund considers the company to be from outside of the United States. See the Fund’s Statement of Additional Information for information on how a particular country is assigned. |
| | | | |
Security | | Country | | Trading Currency |
Aegean Marine Petroleum Network Inc. | | Greece | | U.S. dollar |
ICON PLC (DR) | | Ireland | | U.S. dollar |
| | | | | | | | |
Issuer | | Rate | | | Maturity | | Value |
U.S. Treasury Bond | | 1.750 | % | | 3/31/2014 | | $ | 19,531,781 |
| (4) | Represents less than 0.1% of total net assets. |
| (5) | Percentages for the various classifications relate to total net assets. |
44
Company names are as reported by a data service provider and in some cases are translations; a company’s legal name may be different.
(DR) Depository Receipt, voting rights may vary.
| | | | | |
| TOP TEN HOLDINGS - September 30, 2009 | |
Company Name | | Country | | Percentage
of Total
Net Assets | |
Ares Capital Corporation | | United States | | 2.7 | % |
Euronet Worldwide, Inc. | | United States | | 2.7 | |
Waste Connections, Inc. | | United States | | 2.4 | |
Avocent Corporation | | United States | | 2.2 | |
LKQ Corporation | | United States | | 2.1 | |
Phase Forward Incorporated | | United States | | 2.1 | |
PSS World Medical, Inc. | | United States | | 2.1 | |
ICON PLC | | Ireland | | 1.9 | |
Omniture, Inc. | | United States | | 1.9 | |
Flowers Foods, Inc. | | United States | | 1.8 | |
| | | | | |
Total | | | | 21.9 | % |
| | | | | |
For the purpose of determining the Fund’s top ten holdings, securities of the same issuer are aggregated to determine the weight in the Fund.
The accompanying notes are an integral part of the financial statements.
45
ARTISAN SMALL CAP VALUE FUND
Schedule of Investments – September 30, 2009
| | | | | |
| | | Shares
Held | | Value |
| COMMON STOCKS - 91.9% | | | | | |
| | | | | |
| CONSUMER DISCRETIONARY - 5.8% | | | |
Diversified Consumer Services - 0.5% | | | |
Matthews International Corporation | | 269,500 | | $ | 9,534,910 |
| | | | | |
Hotels, Restaurants & Leisure - 2.1% | | | |
International Speedway Corporation, Class A | | 873,400 | | | 24,079,638 |
Jack in the Box Inc.(1) | | 990,800 | | | 20,301,492 |
| | | | | |
| | | | | 44,381,130 |
Media - 2.4% | �� | | | | |
Marvel Entertainment, Inc.(1) | | 381,000 | | | 18,905,220 |
Meredith Corporation | | 849,100 | | | 25,422,054 |
World Wrestling Entertainment, Inc., Class A | | 551,600 | | | 7,727,916 |
| | | | | |
| | | | | 52,055,190 |
Specialty Retail - 0.8% | | | | | |
Rent-A-Center, Inc.(1) | | 955,785 | | | 18,045,221 |
| | | | | |
| CONSUMER STAPLES - 2.6% | | | | | |
Food & Staples Retailing - 0.9% | | | | | |
Ruddick Corporation | | 761,200 | | | 20,263,144 |
| | | | | |
Food Products - 0.5% | | | | | |
Sanderson Farms, Inc. | | 277,300 | | | 10,437,572 |
| | | | | |
Tobacco - 1.2% | | | | | |
Universal Corporation | | 630,100 | | | 26,350,782 |
| | | | | |
| ENERGY - 7.8% | | | | | |
Energy Equipment & Services - 5.4% | | | |
Cal Dive International, Inc.(1) | | 2,539,988 | | | 25,120,481 |
Parker Drilling Company(1) | | 2,951,500 | | | 16,115,190 |
Patterson-UTI Energy, Inc. | | 1,440,800 | | | 21,756,080 |
RPC, Inc. | | 1,612,400 | | | 16,897,952 |
Seahawk Drilling, Inc.(1) | | 366,100 | | | 11,382,049 |
Superior Energy Services, Inc.(1) | | 1,107,700 | | | 24,945,404 |
| | | | | |
| | | | | 116,217,156 |
Oil, Gas & Consumable Fuels - 2.4% | | | |
Forest Oil Corporation(1) | | 1,264,900 | | | 24,754,093 |
Holly Corporation | | 798,100 | | | 20,447,322 |
St. Mary Land & Exploration Company | | 204,300 | | | 6,631,578 |
| | | | | |
| | | | | 51,832,993 |
| | | | | |
| | | Shares
Held | | Value |
| FINANCIALS - 8.6% | | | | | |
Consumer Finance - 0.6% | | | | | |
The Student Loan Corporation | | 298,300 | | $ | 13,841,120 |
| | | | | |
Diversified Financial Services - 1.1% | | | |
PICO Holdings, Inc.(1) | | 695,400 | | | 23,191,590 |
| | | | | |
Insurance - 6.3% | | | | | |
Allied World Assurance Company Holdings, Ltd | | 366,900 | | | 17,585,517 |
Aspen Insurance Holdings Limited | | 143,200 | | | 3,790,504 |
Assured Guaranty Ltd. | | 901,700 | | | 17,511,014 |
Endurance Specialty Holdings Ltd. | | 237,500 | | | 8,661,625 |
Max Capital Group Ltd. | | 574,300 | | | 12,272,791 |
Platinum Underwriters Holdings, Ltd. | | 603,800 | | | 21,640,192 |
Stewart Information Services Corporation(2) | | 1,120,678 | | | 13,862,787 |
Willis Group Holdings Limited | | 388,746 | | | 10,970,412 |
Zenith National Insurance Corp. | | 925,700 | | | 28,604,130 |
| | | | | |
| | | | | 134,898,972 |
Real Estate Investment Trusts (REITS) - 0.6% | | | | | |
Cousins Properties Incorporated | | 998,686 | | | 8,269,120 |
Hatteras Financial Corporation | | 169,645 | | | 5,085,957 |
| | | | | |
| | | | | 13,355,077 |
| HEALTHCARE - 5.6% | | | | | |
Health Care Equipment & Supplies - 1.6% | | | | | |
CONMED Corporation(1) | | 1,066,900 | | | 20,452,473 |
National Dentex Corporation(1) | | 257,300 | | | 2,192,196 |
STERIS Corporation | | 353,000 | | | 10,748,850 |
| | | | | |
| | | | | 33,393,519 |
Health Care Providers & Services - 2.5% | | | | | |
AMN Healthcare Services, Inc.(1)(2) | | 2,231,300 | | | 21,219,663 |
Cross Country Healthcare, Inc.(1)(2) | | 2,147,700 | | | 19,995,087 |
HealthSpring, Inc.(1) | | 936,900 | | | 11,477,025 |
Medical Staffing Network Holdings, Inc.(1)(2) | | 1,577,900 | | | 867,845 |
| | | | | |
| | | | | 53,559,620 |
Life Sciences Tools & Services - 1.5% | | | |
Varian Inc.(1) | | 631,300 | | | 32,234,178 |
| | | | | |
| INDUSTRIALS - 22.8% | | | | | |
Aerospace & Defense - 1.1% | | | | | |
Spirit AeroSystems Holdings, Inc., Class A(1) | | 1,308,900 | | | 23,638,734 |
46
| | | | | |
| | | Shares
Held | | Value |
| INDUSTRIALS (CONTINUED) | | | | | |
Aerospace & Defense (Continued) | | | | | |
Teledyne Technologies Incorporated(1) | | 14,200 | | $ | 511,058 |
| | | | | |
| | | | | 24,149,792 |
Building Products - 1.4% | | | | | |
Quanex Building Products Corporation(2) | | 2,030,475 | | | 29,157,621 |
| | | | | |
Commercial Services & Supplies - 0.4% | | | |
Sykes Enterprises, Incorporated(1) | | 445,300 | | | 9,271,146 |
| | | | | |
Construction & Engineering - 2.6% | | | |
Comfort Systems USA, Inc. | | 1,700,600 | | | 19,709,954 |
EMCOR Group, Inc.(1) | | 1,113,500 | | | 28,193,820 |
Granite Construction Incorporated | | 243,500 | | | 7,533,890 |
| | | | | |
| | | | | 55,437,664 |
Electrical Equipment - 3.3% | | | | | |
Acuity Brands, Inc.(2) | | 897,200 | | | 28,898,812 |
Regal-Beloit Corporation | | 314,900 | | | 14,394,079 |
Woodward Governor Company | | 1,178,300 | | | 28,585,558 |
| | | | | |
| | | | | 71,878,449 |
Industrial Conglomerates - 0.5% | | | | | |
McDermott International, Inc.(1) | | 451,500 | | | 11,409,405 |
| | | | | |
Machinery - 2.7% | | | | | |
Astec Industries, Inc.(1) | | 668,100 | | | 17,016,507 |
Harsco Corporation | | 131,600 | | | 4,659,956 |
IDEX Corporation | | 718,200 | | | 20,073,690 |
Mueller Industries, Inc. | | 726,300 | | | 17,336,781 |
| | | | | |
| | | | | 59,086,934 |
Marine - 0.8% | | | | | |
Kirby Corporation(1) | | 481,200 | | | 17,717,784 |
| | | | | |
Professional Services - 8.2% | | | | | |
Diamond Management & Technology Consultants, Inc.(2) | | 1,658,000 | | | 11,357,300 |
Hudson Highland Group, Inc.(1) | | 1,220,200 | | | 3,709,408 |
Kforce Inc.(1) | | 1,741,662 | | | 20,934,777 |
Korn/Ferry International(1) | | 1,154,500 | | | 16,844,155 |
Monster Worldwide, Inc.(1) | | 1,656,100 | | | 28,948,628 |
MPS Group, Inc.(1) | | 2,482,400 | | | 26,114,848 |
School Specialty, Inc.(1) | | 851,600 | | | 20,199,952 |
TrueBlue, Inc.(1) | | 1,386,300 | | | 19,505,241 |
Watson Wyatt Worldwide, Inc. | | 660,600 | | | 28,775,736 |
| | | | | |
| | | | | 176,390,045 |
Road & Rail - 1.8% | | | | | |
Arkansas Best Corporation | | 694,900 | | | 20,805,306 |
Ryder System, Inc. | | 482,500 | | | 18,846,450 |
| | | | | |
| | | | | 39,651,756 |
| | | | | |
| | | Shares
Held | | Value |
| INFORMATION TECHNOLOGY - 24.9% | | | |
Computers & Peripherals - 2.1% | | | | | |
Imation Corp. | | 1,010,100 | | $ | 9,363,627 |
Intermec, Inc.(1) | | 884,400 | | | 12,470,040 |
Lexmark International, Inc., Class A(1) | | 1,071,900 | | | 23,088,726 |
| | | | | |
| | | | | 44,922,393 |
Electronic Equipment & Instruments - 5.0% | | | | | |
Anixter International Inc.(1) | | 248,000 | | | 9,947,280 |
Arrow Electronics, Inc.(1) | | 1,053,500 | | | 29,656,025 |
Benchmark Electronics, Inc.(1) | | 1,370,500 | | | 24,669,000 |
Coherent, Inc.(1) | | 423,800 | | | 9,883,016 |
Orbotech, Ltd.(1)(2)(3) | | 2,243,779 | | | 21,214,931 |
RadiSys Corporation(1)(2) | | 1,294,500 | | | 11,249,205 |
| | | | | |
| | | | | 106,619,457 |
Internet Software & Services - 0.6% | | | |
EarthLink, Inc. | | 1,500,300 | | | 12,617,523 |
| | | | | |
IT Services - 3.5% | | | | | |
CACI International Inc(1) | | 472,800 | | | 22,349,256 |
MAXIMUS, Inc. | | 551,000 | | | 25,676,600 |
SRA International, Inc., Class A(1) | | 1,268,400 | | | 27,384,756 |
| | | | | |
| | | | | 75,410,612 |
Semiconductors & Semiconductor Equipment - 4.8% | | | | | |
Actel Corporation(1) | | 1,305,900 | | | 15,892,803 |
ATMI, Inc.(1) | | 604,900 | | | 10,978,935 |
LTX Corporation(1) | | 3,804,100 | | | 6,276,765 |
Rudolph Technologies, Inc.(1)(2) | | 1,922,600 | | | 14,227,240 |
Standard Microsystems Corporation(1) | | 442,600 | | | 10,272,746 |
Ultra Clean Holdings, Inc.(1)(2) | | 1,455,900 | | | 7,512,444 |
Ultratech, Inc.(1)(2) | | 1,434,300 | | | 18,975,789 |
Varian Semiconductor Equipment Associates, Inc.(1) | | 613,300 | | | 20,140,772 |
| | | | | |
| | | | | 104,277,494 |
Software - 8.9% | | | | | |
Fair Isaac Corporation | | 1,138,300 | | | 24,462,067 |
Jack Henry and Associates, Inc. | | 697,500 | | | 16,370,325 |
Lawson Software, Inc.(1) | | 4,799,000 | | | 29,945,760 |
Manhattan Associates, Inc.(1)(2) | | 1,503,300 | | | 30,366,660 |
MicroStrategy Incorporated, Class A(1) | | 503,700 | | | 36,034,698 |
Progress Software Corporation(1) | | 778,500 | | | 17,633,025 |
SPSS Inc.(1) | | 357,100 | | | 17,837,145 |
TIBCO Software Inc.(1) | | 1,369,400 | | | 12,995,606 |
Tyler Technologies, Inc.(1) | | 390,000 | | | 6,665,100 |
| | | | | |
| | | | | 192,310,386 |
47
| | | | | | |
| | | Shares
Held | | Value |
| MATERIALS - 4.7% | | | | | | |
Chemicals - 4.3% | | | | | | |
H.B. Fuller Company | | | 1,293,900 | | $ | 27,042,510 |
Olin Corporation | | | 1,429,500 | | | 24,930,480 |
OM Group, Inc.(1) | | | 574,900 | | | 17,471,211 |
Sensient Technologies Corporation | | | 828,000 | | | 22,993,560 |
| | | | | | |
| | | | | | 92,437,761 |
Construction Materials - 0.4% | | | |
Eagle Materials Inc. | | | 309,700 | | | 8,851,226 |
| | | | | | |
| UTILITIES - 9.1% | | | | | | |
Electrical Utilities - 6.9% | | | | | | |
ALLETE, Inc. | | | 371,100 | | | 12,457,827 |
Cleco Corporation | | | 1,166,600 | | | 29,258,328 |
El Paso Electric Company(1) | | | 1,766,600 | | | 31,215,822 |
The Empire District Electric Company | | | 634,700 | | | 11,481,723 |
IDACORP, Inc. | | | 750,500 | | | 21,606,895 |
Portland General Electric Company | | | 1,350,700 | | | 26,635,804 |
UIL Holdings Corporation | | | 599,600 | | | 15,823,444 |
| | | | | | |
| | | | | | 148,479,843 |
Gas Utilities - 0.3% | | | | | | |
Northwest Natural Gas Company | | | 174,000 | | | 7,248,840 |
| | | | | | |
Multi-Utilities - 1.9% | | | | | | |
NorthWestern Corporation | | | 662,800 | | | 16,192,204 |
Vectren Corporation | | | 1,037,900 | | | 23,913,216 |
| | | | | | |
| | | | | | 40,105,420 |
| | | | | | |
Total common stocks
(Cost $1,947,848,491) | | | | | | 1,981,023,725 |
| | |
| | | Par
Amount | | |
SHORT-TERM INVESTMENTS
(CASH EQUIVALENTS) - 8.0% | | | |
Repurchase agreement with Fixed Income Clearing Corporation, 0.01%, dated 9/30/09, due 10/1/09, maturity value $172,998,048(4)
(Cost $172,998,000) | | $ | 172,998,000 | | | 172,998,000 |
| | | | | | |
| | | | | | |
Total investments - 99.9%
(Cost $2,120,846,491) | | | | | | 2,154,021,725 |
| | | | | | |
Other assets less liabilities - 0.1% | | | | | | 2,473,573 |
| | | | | | |
| | | | | | |
Total net assets - 100.0%(5) | | | | | $ | 2,156,495,298 |
| | | | | | |
| (1) | Non-income producing security. |
| (2) | Affiliated company as defined by the Investment Company Act of 1940. See Note (6) in Notes to Financial Statements. |
| (3) | The Fund considers the company to be from Israel. See the Fund’s Statement of Additional Information for information on how a particular country is assigned. The security trades in U.S. dollars. |
| | | | | | | | |
Issuer | | Rate | | | Maturity | | Value |
U.S. Treasury Bond | | 0.875 | % | | 1/31/2011 | | $ | 176,462,925 |
| (5) | Percentages for the various classifications relate to total net assets. |
Company names are as reported by a data service provider and in some cases are translations; a company’s legal name may be different.
| | | | | |
| TOP TEN HOLDINGS - September 30, 2009 | |
Company Name | | Country | | Percentage
of Total
Net Assets | |
MicroStrategy Incorporated | | United States | | 1.7 | % |
Varian Inc. | | United States | | 1.5 | |
El Paso Electric Company | | United States | | 1.4 | |
Manhattan Associates, Inc. | | United States | | 1.4 | |
Lawson Software, Inc. | | United States | | 1.4 | |
Arrow Electronics, Inc. | | United States | | 1.4 | |
Cleco Corporation | | United States | | 1.4 | |
Quanex Building Products Corporation | | United States | | 1.4 | |
Monster Worldwide, Inc. | | United States | | 1.3 | |
Acuity Brands, Inc. | | United States | | 1.3 | |
| | | | | |
Total | | | | 14.2 | % |
| | | | | |
For the purpose of determining the Fund’s top ten holdings, securities of the same issuer are aggregated to determine the weight in the Fund.
The accompanying notes are an integral part of the financial statements.
48
[THIS PAGE INTENTIONALLY LEFT BLANK]
49
ARTISAN FUNDS, INC.
Statements of Assets and Liabilities – September 30, 2009
| | | | |
| | | GLOBAL VALUE | |
| ASSETS: | | | | |
Investments in securities, unaffiliated, at value | | $ | 27,440,762 | |
Short-term investments (repurchase agreements), at value | | | 1,368,000 | |
| | | | |
Total investments | | | 28,808,762 | |
Cash | | | 142 | |
Foreign currency | | | 12 | |
Net unrealized gain on foreign currency forward contracts | | | 14 | |
Receivable from investments sold | | | - | |
Receivable from fund shares sold | | | 84,600 | |
Dividends and interest receivable | | | 59,782 | |
Receivable from Adviser | | | 123,178 | |
Other assets | | | 212 | |
| | | | |
Total assets | | | 29,076,702 | |
| |
| LIABILITIES: | | | | |
Net unrealized loss on foreign currency forward contracts | | | - | |
Payable for investments purchased | | | 51,084 | |
Payable for fund shares redeemed | | | 4,213 | |
Payable for operating expenses | | | 216,354 | |
Payable for withholding taxes | | | 613 | |
Payable for advisory fees | | | 186,661 | |
Payable for deferred directors’ compensation | | | 212 | |
| | | | |
Total liabilities | | | 459,137 | |
| | | | |
Total net assets | | $ | 28,617,565 | |
| | | | |
| NET ASSETS CONSIST OF: | | | | |
Fund shares issued and outstanding | | $ | 25,370,560 | |
Net unrealized appreciation on investments and foreign currency related transactions | | | 5,537,496 | |
Accumulated undistributed net investment income (loss) | | | 181,509 | |
Accumulated undistributed net realized (losses) on investments and foreign currency related transactions | | | (2,472,000 | ) |
| | | | |
| | $ | 28,617,565 | |
| | | | |
| SUPPLEMENTARY INFORMATION: | | | | |
Net assets | | | | |
Investor Shares | | $ | 28,617,565 | |
Institutional Shares | | | | |
Shares outstanding (Indefinite number of shares authorized, $0.01 par value) | | | | |
Investor Shares | | | 3,313,027 | |
Institutional Shares | | | | |
Net asset value, offering price and redemption price per share | | | | |
Investor Shares | | $ | 8.64 | |
Institutional Shares | | | | |
Cost of securities of unaffiliated issuers held | | $ | 23,271,825 | |
Cost of foreign currency | | $ | 12 | |
50
| | | | | | | | | | | | | | |
| INTERNATIONAL | | | INTERNATIONAL SMALL CAP | | | INTERNATIONAL VALUE | | | MID CAP | |
| | | | | | | | | | | | | | |
| $ | 10,505,873,685 | | | $ | 676,670,996 | | | $ | 1,820,018,782 | | | $ | 3,995,820,823 | |
| | 173,052,000 | | | | 13,589,000 | | | | 188,093,000 | | | | 155,263,000 | |
| | | | | | | | | | | | | | | |
| | 10,678,925,685 | | | | 690,259,996 | | | | 2,008,111,782 | | | | 4,151,083,823 | |
| | 128 | | | | 871 | | | | 72 | | | | 797 | |
| | 401,835 | | | | 16,196 | | | | 16 | | | | - | |
| | - | | | | 2,062 | | | | 31,686 | | | | - | |
| | 79,915,581 | | | | 3,879,648 | | | | - | | | | 8,506,032 | |
| | 15,057,002 | | | | 919,076 | | | | 19,591,785 | | | | 4,225,717 | |
| | 24,476,100 | | | | 2,173,073 | | | | 4,607,585 | | | | 1,109,475 | |
| | - | | | | - | | | | - | | | | - | |
| | 290,183 | | | | 19,260 | | | | 30,150 | | | | 107,914 | |
| | | | | | | | | | | | | | | |
| | 10,799,066,514 | | | | 697,270,182 | | | | 2,032,373,076 | | | | 4,165,033,758 | |
| | | |
| | | | | | | | | | | | | | |
| | 143,792 | | | | - | | | | - | | | | - | |
| | 130,423,363 | | | | - | | | | 11,021,070 | | | | 17,097,320 | |
| | 34,907,700 | | | | 915,638 | | | | 1,011,916 | | | | 3,095,952 | |
| | 2,981,648 | | | | 218,714 | | | | 476,236 | | | | 1,666,889 | |
| | 2,465,104 | | | | 313,838 | | | | 88,052 | | | | - | |
| | - | | | | - | | | | - | | | | - | |
| | 290,183 | | | | 19,260 | | | | 30,150 | | | | 107,914 | |
| | | | | | | | | | | | | | | |
| | 171,211,790 | | | | 1,467,450 | | | | 12,627,424 | | | | 21,968,075 | |
| | | | | | | | | | | | | | | |
| $ | 10,627,854,724 | | | $ | 695,802,732 | | | $ | 2,019,745,652 | | | $ | 4,143,065,683 | |
| | | | | | | | | | | | | | | |
| | | | | | | | | | | | | | |
| $ | 11,868,599,481 | | | $ | 721,018,417 | | | $ | 1,967,058,381 | | | $ | 4,266,824,330 | |
| | 1,346,777,765 | | | | 103,906,489 | | | | 190,022,967 | | | | 668,639,714 | |
| | 129,049,002 | | | | 4,947,196 | | | | 13,816,491 | | | | (104,290 | ) |
| | (2,716,571,524 | ) | | | (134,069,370 | ) | | | (151,152,187 | ) | | | (792,294,071 | ) |
| | | | | | | | | | | | | | | |
| $ | 10,627,854,724 | | | $ | 695,802,732 | | | $ | 2,019,745,652 | | | $ | 4,143,065,683 | |
| | | | | | | | | | | | | | | |
| | | | | | | | | | | | | | |
| | | | | | | | | | | | | | |
| $ | 7,715,112,723 | | | $ | 695,802,732 | | | $ | 1,739,544,556 | | | $ | 3,688,551,659 | |
| $ | 2,912,742,001 | | | | | | | $ | 280,201,096 | | | $ | 454,514,024 | |
| | | | | | | | | | | | | | |
| | 382,746,599 | | | | 41,771,960 | | | | 76,204,498 | | | | 151,891,040 | |
| | 143,548,544 | | | | | | | | 12,273,119 | | | | 18,182,226 | |
| | | | | | | | | | | | | | |
| $ | 20.16 | | | $ | 16.66 | | | $ | 22.83 | | | $ | 24.28 | |
| $ | 20.29 | | | | | | | $ | 22.83 | | | $ | 25.00 | |
| $ | 9,330,938,883 | | | $ | 586,129,558 | | | $ | 1,818,148,927 | | | $ | 3,482,444,109 | |
| $ | 373,953 | | | $ | 15,280 | | | $ | 16 | | | $ | - | |
The accompanying notes are an integral part of the financial statements.
51
ARTISAN FUNDS, INC.
Statements of Assets and Liabilities – September 30, 2009 (Continued)
| | | | |
| | | MID CAP VALUE | |
| ASSETS: | | | | |
Investments in securities, unaffiliated, at value | | $ | 4,083,768,728 | |
Investments in securities, affiliated, at value | | | 201,091,889 | |
Short-term investments (repurchase agreements), at value | | | 354,552,000 | |
| | | | |
Total investments | | | 4,639,412,617 | |
Cash | | | 196 | |
Net unrealized gain on foreign currency forward contracts | | | - | |
Receivable from investments sold | | | 21,315,503 | |
Receivable from fund shares sold | | | 17,577,666 | |
Dividends and interest receivable | | | 6,896,568 | |
Receivable from Adviser | | | - | |
Other assets | | | 71,942 | |
| | | | |
Total assets | | | 4,685,274,492 | |
| |
| LIABILITIES: | | | | |
Payable for investments purchased | | | 52,864,305 | |
Payable for fund shares redeemed | | | 3,190,932 | |
Payable for operating expenses | | | 1,190,887 | |
Payable for withholding taxes | | | - | |
Payable for advisory fees | | | - | |
Payable for deferred directors’ compensation | | | 71,942 | |
| | | | |
Total liabilities | | | 57,318,066 | |
| | | | |
Total net assets | | $ | 4,627,956,426 | |
| | | | |
| NET ASSETS CONSIST OF: | | | | |
Fund shares issued and outstanding | | $ | 4,629,369,731 | |
Net unrealized appreciation on investments and foreign currency related transactions | | | 396,054,721 | |
Accumulated undistributed net investment income (loss) | | | 19,012,157 | |
Accumulated undistributed net realized (losses) on investments and foreign currency related transactions | | | (416,480,183 | ) |
| | | | |
| | $ | 4,627,956,426 | |
| | | | |
| |
| SUPPLEMENTARY INFORMATION: | | | | |
Net assets | | | | |
Investor Shares | | $ | 4,627,956,426 | |
Shares outstanding (Indefinite number of shares authorized, $0.01 par value) | | | | |
Investor Shares | | | 274,711,425 | |
Net asset value, offering price and redemption price per share | | | | |
Investor Shares | | $ | 16.85 | |
Cost of securities of unaffiliated issuers held | | $ | 4,029,796,289 | |
Cost of securities of affiliated issuers held | | $ | 213,561,607 | |
52
| | | | | | | | | | | | | | |
| OPPORTUNISTIC GROWTH | | | OPPORTUNISTIC VALUE | | | SMALL CAP | | | SMALL CAP VALUE | |
| | | | | | | | | | | | | | |
| $ | 42,769,489 | | | $ | 175,895,530 | | | $ | 417,877,139 | | | $ | 1,752,118,341 | |
| | - | | | | - | | | | - | | | | 228,905,384 | |
| | 3,758,000 | | | | 10,305,000 | | | | 19,147,000 | | | | 172,998,000 | |
| | | | | | | | | | | | | | | |
| | 46,527,489 | | | | 186,200,530 | | | | 437,024,139 | | | | 2,154,021,725 | |
| | 818 | | | | 158 | | | | 537 | | | | 438 | |
| | 374 | | | | - | | | | - | | | | - | |
| | - | | | | - | | | | 4,171,382 | | | | 5,230,928 | |
| | 27,348 | | | | 373,601 | | | | 1,013,425 | | | | 3,739,110 | |
| | 27,218 | | | | 301,952 | | | | 84,764 | | | | 1,237,530 | |
| | 142,502 | | | | - | | | | - | | | | - | |
| | - | | | | 3,568 | | | | 18,385 | | | | 42,514 | |
| | | | | | | | | | | | | | | |
| | 46,725,749 | | | | 186,879,809 | | | | 442,312,632 | | | | 2,164,272,245 | |
| | | |
| | | | | | | | | | | | | | |
| | 741,627 | | | | 5,581,707 | | | | 4,385,497 | | | | 4,810,859 | |
| | 11,399 | | | | 59,906 | | | | 657,286 | | | | 2,128,591 | |
| | 247,873 | | | | 124,653 | | | | 255,752 | | | | 794,983 | |
| | 753 | | | | - | | | | - | | | | - | |
| | 167,057 | | | | - | | | | - | | | | - | |
| | - | | | | 3,568 | | | | 18,385 | | | | 42,514 | |
| | | | | | | | | | | | | | | |
| | 1,168,709 | | | | 5,769,834 | | | | 5,316,920 | | | | 7,776,947 | |
| | | | | | | | | | | | | | | |
| $ | 45,557,040 | | | $ | 181,109,975 | | | $ | 436,995,712 | | | $ | 2,156,495,298 | |
| | | | | | | | | | | | | | | |
| | | | | | | | | | | | | | |
| $ | 39,011,737 | | | $ | 273,386,135 | | | $ | 617,449,543 | | | $ | 2,270,366,738 | |
| | 7,392,048 | | | | 10,823,181 | | | | 114,267,711 | | | | 33,175,234 | |
| | (374 | ) | | | 338,264 | | | | (18,488 | ) | | | 2,542,709 | |
| | (846,371 | ) | | | (103,437,605 | ) | | | (294,703,054 | ) | | | (149,589,383 | ) |
| | | | | | | | | | | | | | | |
| $ | 45,557,040 | | | $ | 181,109,975 | | | $ | 436,995,712 | | | $ | 2,156,495,298 | |
| | | | | | | | | | | | | | | |
| | | |
| | | | | | | | | | | | | | |
| | | | | | | | | | | | | | |
| $ | 45,557,040 | | | $ | 181,109,975 | | | $ | 436,995,712 | | | $ | 2,156,495,298 | |
| | | | | | | | | | | | | | |
| | 4,984,128 | | | | 22,311,298 | | | | 33,924,301 | | | | 159,075,582 | |
| | | | | | | | | | | | | | |
| $ | 9.14 | | | $ | 8.12 | | | $ | 12.88 | | | $ | 13.56 | |
| $ | 39,135,647 | | | $ | 175,377,349 | | | $ | 322,756,428 | | | $ | 1,790,576,166 | |
| $ | - | | | $ | - | | | $ | - | | | $ | 330,270,325 | |
The accompanying notes are an integral part of the financial statements.
53
ARTISAN FUNDS, INC.
Statements of Operations – For the Year Ended September 30, 2009
| | | | |
| | | GLOBAL VALUE | |
| INVESTMENT INCOME: | | | | |
Dividends, from unaffiliated issuers(1) | | $ | 485,729 | |
Dividends, from affiliated issuers(1) | | | - | |
Interest | | | 839 | |
Other | | | - | |
| | | | |
Total investment income | | | 486,568 | |
| |
| EXPENSES: | | | | |
Advisory fees | | | 186,661 | |
Transfer agent fees | | | | |
Investor Shares | | | 106,108 | |
Institutional Shares | | | | |
Shareholder communications | | | | |
Investor Shares | | | 5,821 | |
Institutional Shares | | | | |
Custodian fees | | | 11,742 | |
Accounting fees | | | 39,377 | |
Professional fees | | | 29,796 | |
Less insurance recoveries(2) | | | - | |
| | | | |
Net professional fees | | | 29,796 | |
Registration fees | | | | |
Investor Shares | | | 15,108 | |
Institutional Shares | | | | |
Directors’ fees | | | 6,000 | |
Other operating expenses | | | 2,557 | |
| | | | |
Total operating expenses | | | 403,170 | |
Less amounts waived or paid by the Adviser or the board of directors | | | (123,178 | ) |
| | | | |
Net Expenses | | | 279,992 | |
| | | | |
Net investment income (loss) | | | 206,576 | |
| |
| NET REALIZED AND UNREALIZED GAINS (LOSSES) ON INVESTMENTS: | | | | |
Net realized gain (loss) on: | | | | |
Investments(1) | | | (2,211,339 | ) |
Foreign currency related transactions | | | (1,249 | ) |
| | | | |
| | | (2,212,588 | ) |
Net increase (decrease) in unrealized appreciation or depreciation on: | | | | |
Investments | | | 6,796,447 | |
Foreign currency related transactions | | | 976 | |
| | | | |
| | | 6,797,423 | |
| | | | |
Net gain (loss) on investments and foreign currency related transactions | | | 4,584,835 | |
| | | | |
Net increase in net assets resulting from operations | | $ | 4,791,411 | |
| | | | |
| | | | | | | | | | | | |
| | | Fund | | Net of foreign taxes
withheld on dividends,
unaffiliated issuers | | Net of foreign taxes
withheld on dividends,
affiliated issuers | | Including net realized
(loss) on investments
from affiliated issuers | |
| | Global Value | | $ | 24,545 | | $ | - | | $ | - | |
| | International | | | 27,362,067 | | | - | | | (68,638,629 | ) |
| | International Small Cap | | | 990,132 | | | - | | | (21,036,404 | ) |
| | International Value | | | 2,250,235 | | | - | | | (7,840,431 | ) |
| | Mid Cap | | | 4,066 | | | - | | | (42,928,022 | ) |
| (2) | For the year ended September 30, 2009, International Fund incurred $246,062 in total professional fees. As described in Note (9) in Notes to Financial Statements, International Fund received $219,395 in insurance recoveries relating to reimbursement of litigation defense costs, which amount was recorded as a reduction to professional fees during the year ended September 30, 2009. |
54
| | | | | | | | | | | | | | |
| INTERNATIONAL | | | INTERNATIONAL SMALL CAP | | | INTERNATIONAL VALUE | | | MID CAP | |
| | | | | | | | | | | | | | |
| $ | 226,716,729 | | | $ | 12,518,449 | | | $ | 25,732,161 | | | $ | 21,107,231 | |
| | 959,558 | | | | 269,555 | | | | - | | | | - | |
| | 205,342 | | | | 28,407 | | | | 59,682 | | | | 85,857 | |
| | 4,093,998 | | | | - | | | | - | | | | - | |
| | | | | | | | | | | | | | | |
| | 231,975,627 | | | | 12,816,411 | | | | 25,791,843 | | | | 21,193,088 | |
| | | |
| | | | | | | | | | | | | | |
| | 79,830,684 | | | | 6,428,857 | | | | 11,395,382 | | | | 30,398,188 | |
| | | | | | | | | | | | | | |
| | 13,229,265 | | | | 732,476 | | | | 2,056,801 | | | | 7,047,423 | |
| | 25,164 | | | | | | | | 19,224 | | | | 19,755 | |
| | | | | | | | | | | | | | |
| | 1,178,354 | | | | 50,938 | | | | 92,869 | | | | 538,637 | |
| | 32,650 | | | | | | | | 5,415 | | | | 6,857 | |
| | 3,901,133 | | | | 289,066 | | | | 365,064 | | | | 95,143 | |
| | 71,686 | | | | 49,633 | | | | 73,719 | | | | 55,396 | |
| | 246,062 | | | | 67,361 | | | | 95,601 | | | | 166,866 | |
| | (219,395 | ) | | | - | | | | - | | | | - | |
| | | | | | | | | | | | | | | |
| | 26,667 | | | | 67,361 | | | | 95,601 | | | | 166,866 | |
| | | | | | | | | | | | | | |
| | 156,598 | | | | 45,476 | | | | 69,266 | | | | 78,169 | |
| | 24,545 | | | | | | | | 15,722 | | | | 16,559 | |
| | 448,629 | | | | 26,445 | | | | 55,539 | | | | 167,299 | |
| | 287,677 | | | | 17,521 | | | | 35,854 | | | | 100,322 | |
| | | | | | | | | | | | | | | |
| | 99,213,052 | | | | 7,707,773 | | | | 14,280,456 | | | | 38,690,614 | |
| | - | | | | - | | | | - | | | | - | |
| | | | | | | | | | | | | | | |
| | 99,213,052 | | | | 7,707,773 | | | | 14,280,456 | | | | 38,690,614 | |
| | | | | | | | | | | | | | | |
| | 132,762,575 | | | | 5,108,638 | | | | 11,511,387 | | | | (17,497,526 | ) |
| | | |
| | | | | | | | | | | | | | |
| | | | | | | | | | | | | | |
| | (2,628,919,339 | ) | | | (134,000,418 | ) | | | (139,186,395 | ) | | | (769,509,214 | ) |
| | (2,414,432 | ) | | | (142,407 | ) | | | 9,770,470 | | | | - | |
| | | | | | | | | | | | | | | |
| | (2,631,333,771 | ) | | | (134,142,825 | ) | | | (129,415,925 | ) | | | (769,509,214 | ) |
| | | | | | | | | | | | | | |
| | 2,629,216,166 | | | | 209,865,674 | | | | 299,492,429 | | | | 792,263,717 | |
| | 613,814 | | | | (180,609 | ) | | | 548,147 | | | | - | |
| | | | | | | | | | | | | | | |
| | 2,629,829,980 | | | | 209,685,065 | | | | 300,040,576 | | | | 792,263,717 | |
| | | | | | | | | | | | | | | |
| | (1,503,791 | ) | | | 75,542,240 | | | | 170,624,651 | | | | 22,754,503 | |
| | | | | | | | | | | | | | | |
| $ | 131,258,784 | | | $ | 80,650,878 | | | $ | 182,136,038 | | | $ | 5,256,977 | |
| | | | | | | | | | | | | | | |
The accompanying notes are an integral part of the financial statements.
55
ARTISAN FUNDS, INC.
Statements of Operations – For the Year Ended September 30, 2009 (Continued)
| | | | |
| | | MID CAP VALUE | |
| INVESTMENT INCOME: | | | | |
Dividends, from unaffiliated issuers(1) | | $ | 53,581,053 | |
Dividends, from affiliated issuers(1) | | | 2,466,007 | |
Interest | | | 112,147 | |
Other | | | - | |
| | | | |
Total investment income | | | 56,159,207 | |
| |
| EXPENSES: | | | | |
Advisory fees | | | 28,963,944 | |
Transfer agent fees | | | | |
Investor Shares | | | 6,699,325 | |
Shareholder communications | | | | |
Investor Shares | | | 719,169 | |
Custodian fees | | | 68,310 | |
Accounting fees | | | 34,349 | |
Professional fees | | | 179,956 | |
Registration fees | | | | |
Investor Shares | | | 190,129 | |
Directors’ fees | | | 149,892 | |
Other operating expenses | | | 90,420 | |
| | | | |
Total operating expenses | | | 37,095,494 | |
Less amounts waived or paid by the Adviser or the board of directors | | | - | |
| | | | |
Net Expenses | | | 37,095,494 | |
| | | | |
Net investment income (loss) | | | 19,063,713 | |
| |
| NET REALIZED AND UNREALIZED GAINS (LOSSES) ON INVESTMENTS: | | | | |
Net realized gain (loss) on: | | | | |
Investments(1) | | | (409,231,827 | ) |
Foreign currency related transactions | | | - | |
| | | | |
| | | (409,231,827 | ) |
Net increase (decrease) in unrealized appreciation or depreciation on: | | | | |
Investments | | | 623,062,782 | |
Foreign currency related transactions | | | - | |
| | | | |
| | | 623,062,782 | |
| | | | |
Net gain (loss) on investments and foreign currency related transactions | | | 213,830,955 | |
| | | | |
Net increase (decrease) in net assets resulting from operations | | $ | 232,894,668 | |
| | | | |
| | | | | | | | | | | | |
| | | Fund | | Net of foreign taxes
withheld on dividends,
unaffiliated issuers | | Net of foreign taxes
withheld on dividends,
affiliated issuers | | Including net realized
(loss) on investments
from affiliated issuers | |
| | Mid Cap Value | | $ | - | | $ | - | | $ | (77,371,187 | ) |
| | Opportunistic Growth | | | 2,543 | | | - | | | - | |
| | Opportunistic Value | | | 33,298 | | | - | | | - | |
| | Small Cap | | | 11,656 | | | - | | | - | |
| | Small Cap Value | | | 6,210 | | | - | | | (55,956,100 | ) |
56
| | | | | | | | | | | | | | |
| OPPORTUNISTIC GROWTH | | | OPPORTUNISTIC VALUE | | | SMALL CAP | | | SMALL CAP VALUE | |
| | | | | | | | | | | | | | |
| $ | 162,183 | | | $ | 3,345,541 | | | $ | 2,662,827 | | | $ | 18,995,157 | |
| | - | | | | - | | | | - | | | | 2,546,337 | |
| | 982 | | | | 4,117 | | | | 9,566 | | | | 65,036 | |
| | - | | | | - | | | | 157,920 | | | | - | |
| | | | | | | | | | | | | | | |
| | 163,165 | | | | 3,349,658 | | | | 2,830,313 | | | | 21,606,530 | |
| | | |
| | | | | | | | | | | | | | |
| | 167,057 | | | | 1,391,839 | | | | 3,588,326 | | | | 14,623,059 | |
| | | | | | | | | | | | | | |
| | 107,598 | | | | 440,265 | | | | 639,100 | | | | 3,313,694 | |
| | | | | | | | | | | | | | |
| | 8,989 | | | | 40,469 | | | | 95,972 | | | | 290,831 | |
| | 10,814 | | | | 10,731 | | | | 23,715 | | | | 48,890 | |
| | 41,975 | | | | 41,090 | | | | 42,292 | | | | 41,567 | |
| | 37,653 | | | | 65,701 | | | | 47,937 | | | | 87,683 | |
| | | | | | | | | | | | | | |
| | 32,503 | | | | 39,719 | | | | 35,623 | | | | 76,359 | |
| | 6,000 | | | | 8,188 | | | | 19,464 | | | | 76,543 | |
| | 2,342 | | | | 7,130 | | | | 12,555 | | | | 50,254 | |
| | | | | | | | | | | | | | | |
| | 414,931 | | | | 2,045,132 | | | | 4,504,984 | | | | 18,608,880 | |
| | (142,502 | ) | | | - | | | | - | | | | - | |
| | | | | | | | | | | | | | | |
| | 272,429 | | | | 2,045,132 | | | | 4,504,984 | | | | 18,608,880 | |
| | | | | | | | | | | | | | | |
| | (109,264 | ) | | | 1,304,526 | | | | (1,674,671 | ) | | | 2,997,650 | |
| | | |
| | | | | | | | | | | | | | |
| | | | | | | | | | | | | | |
| | (835,142 | ) | | | (68,445,898 | ) | | | (203,855,722 | ) | | | (141,698,056 | ) |
| | 447 | | | | 11,020 | | | | - | | | | (1,342 | ) |
| | | | | | | | | | | | | | | |
| | (834,695 | ) | | | (68,434,878 | ) | | | (203,855,722 | ) | | | (141,699,398 | ) |
| | | | | | | | | | | | | | |
| | 7,779,098 | | | | 44,443,949 | | | | 151,823,713 | | | | 158,604,198 | |
| | 195 | | | | - | | | | - | | | | - | |
| | | | | | | | | | | | | | | |
| | 7,779,293 | | | | 44,443,949 | | | | 151,823,713 | | | | 158,604,198 | |
| | | | | | | | | | | | | | | |
| | 6,944,598 | | | | (23,990,929 | ) | | | (52,032,009 | ) | | | 16,904,800 | |
| | | | | | | | | | | | | | | |
| $ | 6,835,334 | | | $ | (22,686,403 | ) | | $ | (53,706,680 | ) | | $ | 19,902,450 | |
| | | | | | | | | | | | | | | |
The accompanying notes are an integral part of the financial statements.
57
ARTISAN FUNDS, INC.
Statements of Changes in Net Assets
| | | | | | | | | | | | | | | | |
| | | GLOBAL VALUE | | | INTERNATIONAL | |
| | | Year Ended
9/30/2009 | | | Period Ended
9/30/2008(1) | | | Year Ended
9/30/2009 | | | Year Ended
9/30/2008 | |
| OPERATIONS: | | | | | | | | | | | | | | | | |
Net investment income (loss) | | $ | 206,576 | | | $ | 100,710 | | | $ | 132,762,575 | | | $ | 217,906,295 | |
Net realized gain (loss) on: | | | | | | | | | | | | | | | | |
Investments | | | (2,211,339 | ) | | | (258,896 | ) | | | (2,628,919,339 | ) | | | 660,360,491 | |
Foreign currency related transactions | | | (1,249 | ) | | | (5,756 | ) | | | (2,414,432 | ) | | | (5,330,672 | ) |
Net increase (decrease) in unrealized appreciation or depreciation on: | | | | | | | | | | | | | | | | |
Investments | | | 6,796,447 | | | | (1,259,510 | ) | | | 2,629,216,166 | | | | (6,035,684,040 | ) |
Foreign currency related transactions | | | 976 | | | | (417 | ) | | | 613,814 | | | | (1,742,370 | ) |
| | | | | | | | | | | | | | | | |
Net increase (decrease) in net assets resulting from operations | | | 4,791,411 | | | | (1,423,869 | ) | | | 131,258,784 | | | | (5,164,490,296 | ) |
| | | | |
| DISTRIBUTIONS PAID TO SHAREHOLDERS: | | | | | | | | | | | | | | | | |
Net investment income: | | | | | | | | | | | | | | | | |
Investor Shares | | | (120,537 | ) | | | - | | | | (73,117,872 | ) | | | (77,647,652 | ) |
Institutional Shares | | | | | | | | | | | (37,487,951 | ) | | | (38,324,885 | ) |
Net realized gains on investment transactions: | | | | | | | | | | | | | | | | |
Investor Shares | | | - | | | | - | | | | (274,728,222 | ) | | | (1,707,284,385 | ) |
Institutional Shares | | | | | | | | | | | (101,344,058 | ) | | | (637,085,303 | ) |
| | | | | | | | | | | | | | | | |
Total distributions paid to shareholders | | | (120,537 | ) | | | - | | | | (486,678,103 | ) | | | (2,460,342,225 | ) |
| | | | |
| FUND SHARE ACTIVITIES: | | | | | | | | | | | | | | | | |
Net increase (decrease) in net assets resulting from fund share activities | | | 14,381,195 | | | | 10,989,365 | | | | (820,456,337 | ) | | | 1,569,193,725 | |
| | | | | | | | | | | | | | | | |
Total increase (decrease) in net assets | | | 19,052,069 | | | | 9,565,496 | | | | (1,175,875,656 | ) | | | (6,055,638,796 | ) |
| | | | | | | | | | | | | | | | |
Net assets, beginning of period | | | 9,565,496 | | | | - | | | | 11,803,730,380 | | | | 17,859,369,176 | |
| | | | | | | | | | | | | | | | |
Net assets, end of period | | $ | 28,617,565 | | | $ | 9,565,496 | | | $ | 10,627,854,724 | | | $ | 11,803,730,380 | |
| | | | | | | | | | | | | | | | |
| | | | |
Accumulated undistributed net investment income (loss) | | $ | 181,509 | | | $ | 94,954 | | | $ | 129,049,002 | | | $ | 109,355,577 | |
| | | | | | | | | | | | | | | | |
| (1) | For the period from commencement of operations (December 10, 2007) through September 30, 2008. |
58
| | | | | | | | | | | | | | | | | | | | | | |
| INTERNATIONAL SMALL CAP | | | INTERNATIONAL VALUE | | | MID CAP | |
Year Ended
9/30/2009 | | | Year Ended
9/30/2008 | | | Year Ended
9/30/2009 | | | Year Ended
9/30/2008 | | | Year Ended
9/30/2009 | | | Year Ended
9/30/2008 | |
| | | | | | | | | | | | | | | | | | | | | | |
| $ | 5,108,638 | | | $ | 11,189,287 | | | $ | 11,511,387 | | | $ | 28,452,080 | | | $ | (17,497,526 | ) | | $ | (38,496,793 | ) |
| | | | | | | | | | | | | | | | | | | | | | |
| | (134,000,418 | ) | | | 44,166,209 | | | | (139,186,395 | ) | | | 4,267,300 | | | | (769,509,214 | ) | | | 258,568,758 | |
| | (142,407 | ) | | | (297,054 | ) | | | 9,770,470 | | | | (125,520 | ) | | | - | | | | 638 | |
| | | | | | | | | | | | | | | | | | | | | | |
| | 209,865,674 | | | | (553,734,650 | ) | | | 299,492,429 | | | | (339,642,758 | ) | | | 792,263,717 | | | | (1,548,010,123 | ) |
| | (180,609 | ) | | | 103,035 | | | | 548,147 | | | | (559,100 | ) | | | - | | | | (227 | ) |
| | | | | | | | | | | | | | | | | | | | | | | |
| | 80,650,878 | | | | (498,573,173 | ) | | | 182,136,038 | | | | (307,607,998 | ) | | | 5,256,977 | | | | (1,327,937,747 | ) |
| | | | | |
| | | | | | | | | | | | | | | | | | | | | | |
| | | | | | | | | | | | | | | | | | | | | | |
| | (6,726,029 | ) | | | (10,029,807 | ) | | | (10,176,045 | ) | | | (26,380,830 | ) | | | - | | | | - | |
| | | | | | | | | (2,362,145 | ) | | | (4,772,229 | ) | | | - | | | | - | |
| | | | | | | | | | | | | | | | | | | | | | |
| | (8,348,645 | ) | | | (168,397,767 | ) | | | - | | | | (86,616,796 | ) | | | (40,893,720 | ) | | | (883,929,699 | ) |
| | | | | | | | | - | | | | (13,775,532 | ) | | | (5,219,106 | ) | | | (121,786,964 | ) |
| | | | | | | | | | | | | | | | | | | | | | | |
| | (15,074,674 | ) | | | (178,427,574 | ) | | | (12,538,190 | ) | | | (131,545,387 | ) | | | (46,112,826 | ) | | | (1,005,716,663 | ) |
| | | | | |
| | | | | | | | | | | | | | | | | | | | | | |
| | | | | |
| | (102,179,473 | ) | | | 53,398,186 | | | | 634,624,462 | | | | (158,902,687 | ) | | | (85,588,305 | ) | | | 498,434,390 | |
| | | | | | | | | | | | | | | | | | | | | | | |
| | (36,603,269 | ) | | | (623,602,561 | ) | | | 804,222,310 | | | | (598,056,072 | ) | | | (126,444,154 | ) | | | (1,835,220,020 | ) |
| | | | | | | | | | | | | | | | | | | | | | | |
| | 732,406,001 | | | | 1,356,008,562 | | | | 1,215,523,342 | | | | 1,813,579,414 | | | | 4,269,509,837 | | | | 6,104,729,857 | |
| | | | | | | | | | | | | | | | | | | | | | | |
| $ | 695,802,732 | | | $ | 732,406,001 | | | $ | 2,019,745,652 | | | $ | 1,215,523,342 | | | $ | 4,143,065,683 | | | $ | 4,269,509,837 | |
| | | | | | | | | | | | | | | | | | | | | | | |
| | | | | |
| $ | 4,947,196 | | | $ | 6,711,234 | | | $ | 13,816,491 | | | $ | 5,072,824 | | | $ | (104,290 | ) | | $ | (74,763 | ) |
| | | | | | | | | | | | | | | | | | | | | | | |
The accompanying notes are an integral part of the financial statements.
59
ARTISAN FUNDS, INC.
Statements of Changes in Net Assets (Continued)
| | | | | | | | | | | | | | | | |
| | | MID CAP VALUE | | | OPPORTUNISTIC GROWTH | |
| | | Year Ended
9/30/2009 | | | Year Ended
9/30/2008 | | | Year Ended
9/30/2009 | | | Period Ended
9/30/2008(1) | |
| OPERATIONS: | | | | | | | | | | | | | | | | |
Net investment income (loss) | | $ | 19,063,713 | | | $ | 5,723,584 | | | $ | (109,264 | ) | | $ | (754 | ) |
Net realized gain (loss) on: | | | | | | | | | | | | | | | | |
Investments | | | (409,231,827 | ) | | | 100,480,649 | | | | (835,142 | ) | | | (11,229 | ) |
Foreign currency related transactions | | | - | | | | - | | | | 447 | | | | 244 | |
Net increase (decrease) in unrealized appreciation or depreciation on: | | | | | | | | | | | | | | | | |
Investments | | | 623,062,782 | | | | (515,679,265 | ) | | | 7,779,098 | | | | (387,256 | ) |
Foreign currency related transactions | | | - | | | | - | | | | 195 | | | | 11 | |
| | | | | | | | | | | | | | | | |
Net increase (decrease) in net assets resulting from operations | | | 232,894,668 | | | | (409,475,032 | ) | | | 6,835,334 | | | | (398,984 | ) |
| | | | |
| DISTRIBUTIONS PAID TO SHAREHOLDERS: | | | | | | | | | | | | | | | | |
Net investment income: | | | | | | | | | | | | | | | | |
Investor Shares | | | (4,661,179 | ) | | | (12,115,617 | ) | | | - | | | | - | |
Net realized gains on investment transactions: | | | | | | | | | | | | | | | | |
Investor Shares | | | (23,963,286 | ) | | | (350,592,517 | ) | | | - | | | | - | |
Tax return of capital: | | | | | | | | | | | | | | | | |
Investor Shares | | | - | | | | - | | | | - | | | | - | |
| | | | | | | | | | | | | | | | |
Total distributions paid to shareholders | | | (28,624,465 | ) | | | (362,708,134 | ) | | | - | | | | - | |
| | | | |
| FUND SHARE ACTIVITIES: | | | | | | | | | | | | | | | | |
Net increase (decrease) in net assets resulting from fund share activities | | | 1,192,224,172 | | | | 582,895,533 | | | | 33,056,223 | | | | 6,064,467 | |
| | | | | | | | | | | | | | | | |
Total increase (decrease) in net assets | | | 1,396,494,375 | | | | (189,287,633 | ) | | | 39,891,557 | | | | 5,665,483 | |
| | | | | | | | | | | | | | | | |
Net assets, beginning of period | | | 3,231,462,051 | | | | 3,420,749,684 | | | | 5,665,483 | | | | - | |
| | | | | | | | | | | | | | | | |
Net assets, end of period | | $ | 4,627,956,426 | | | $ | 3,231,462,051 | | | $ | 45,557,040 | | | $ | 5,665,483 | |
| | | | | | | | | | | | | | | | |
| | | | |
Accumulated undistributed net investment income (loss) | | $ | 19,012,157 | | | $ | 4,613,686 | | | $ | (374 | ) | | $ | - | |
| | | | | | | | | | | | | | | | |
| (1) | For the period from commencement of operations (September 22, 2008) through September 30, 2008. |
60
| | | | | | | | | | | | | | | | | | | | | | |
| OPPORTUNISTIC VALUE | | | SMALL CAP | | | SMALL CAP VALUE | |
Year Ended
9/30/2009 | | | Year Ended
9/30/2008 | | | Year Ended
9/30/2009 | | | Year Ended
9/30/2008 | | | Year Ended
9/30/2009 | | | Year Ended
9/30/2008 | |
| | | | | | | | | | | | | | | | | | | | | | |
| $ | 1,304,526 | | | $ | 1,907,230 | | | $ | (1,674,671 | ) | | $ | (5,048,277 | ) | | $ | 2,997,650 | | | $ | (3,012,815 | ) |
| | | | | | | | | | | | | | | | | | | | | | |
| | (68,445,898 | ) | | | (28,949,448 | ) | | | (203,855,722 | ) | | | (68,978,644 | ) | | | (141,698,056 | ) | | | 82,299,823 | |
| | 11,020 | | | | 19,392 | | | | - | | | | - | | | | (1,342 | ) | | | - | |
| | | | | | | | | | | | | | | | | | | | | | |
| | 44,443,949 | | | | (37,237,206 | ) | | | 151,823,713 | | | | (195,897,458 | ) | | | 158,604,198 | | | | (213,271,509 | ) |
| | - | | | | (11,067 | ) | | | - | | | | - | | | | - | | | | - | |
| | | | | | | | | | | | | | | | | | | | | | | |
| | (22,686,403 | ) | | | (64,271,099 | ) | | | (53,706,680 | ) | | | (269,924,379 | ) | | | 19,902,450 | | | | (133,984,501 | ) |
| | | | | |
| | | | | | | | | | | | | | | | | | | | | | |
| | | | | | | | | | | | | | | | | | | | | | |
| | (2,058,250 | ) | | | (2,875,226 | ) | | | - | | | | - | | | | - | | | | - | |
| | | | | | | | | | | | | | | | | | | | | | |
| | - | | | | (18,663,452 | ) | | | - | | | | (103,275,284 | ) | | | (41,873,575 | ) | | | (339,487,445 | ) |
| | | | | | | | | | | | | | | | | | | | | | |
| | - | | | | - | | | | (665,408 | ) | | | - | | | | - | | | | - | |
| | | | | | | | | | | | | | | | | | | | | | | |
| | (2,058,250 | ) | | | (21,538,678 | ) | | | (665,408 | ) | | | (103,275,284 | ) | | | (41,873,575 | ) | | | (339,487,445 | ) |
| | | | | |
| | | | | | | | | | | | | | | | | | | | | | |
| | | | | |
| | (24,429,047 | ) | | | 37,433,913 | | | | (95,759,005 | ) | | | (191,180,954 | ) | | | 276,386,431 | | | | 224,312,677 | |
| | | | | | | | | | | | | | | | | | | | | | | |
| | (49,173,700 | ) | | | (48,375,864 | ) | | | (150,131,093 | ) | | | (564,380,617 | ) | | | 254,415,306 | | | | (249,159,269 | ) |
| | | | | | | | | | | | | | | | | | | | | | | |
| | 230,283,675 | | | | 278,659,539 | | | | 587,126,805 | | | | 1,151,507,422 | | | | 1,902,079,992 | | | | 2,151,239,261 | |
| | | | | | | | | | | | | | | | | | | | | | | |
| $ | 181,109,975 | | | $ | 230,283,675 | | | $ | 436,995,712 | | | $ | 587,126,805 | | | $ | 2,156,495,298 | | | $ | 1,902,079,992 | |
| | | | | | | | | | | | | | | | | | | | | | | |
| | | | | |
| $ | 338,264 | | | $ | 1,357,614 | | | $ | (18,488 | ) | | $ | (15,052 | ) | | $ | 2,542,709 | | | $ | (26,685 | ) |
| | | | | | | | | | | | | | | | | | | | | | | |
The accompanying notes are an integral part of the financial statements.
61
ARTISAN FUNDS, INC.
Financial Highlights – For a share outstanding throughout each period
The financial highlights table is intended to help you understand the Funds’ financial performance for the past 5 years or, if shorter, the period of a Fund’s operations. Certain information reflects financial results for a single Fund share. The total returns in the table represent the rate that an investor would have earned or lost on an investment in the Fund (assuming reinvestment of all dividends and distributions). This information has been audited by Ernst & Young LLP, whose report, along with each Fund’s financial statements, are included in this annual report.
| | | | | | | | | | | | | | | | | | | | | | | |
Year or
Period
Ended | | |
Net Asset
Value
Beginning
of Period | | Net
Investment
Income(1) | | Net Realized
and Unrealized
Gain (Loss) on
Investments | | | Total Income
(Loss) from
Investment
Operations | | | Dividends
from Net
Investment
Income | | | Distributions
from Net
Realized Gains | |
| | | | | | | | | | | | | | | | | | | | | | | |
ARTISAN GLOBAL VALUE FUND | |
| Investor Shares | | | | | | | | | | | | | | | | | | | | | | | |
| 9/30/2009 | | | $ | 8.32 | | $ | 0.08 | | $ | 0.29 | | | $ | 0.37 | | | $ | (0.05 | ) | | $ | - | |
| 9/30/2008 | (5) | | | 10.00 | | | 0.10 | | | (1.78 | ) | | | (1.68 | ) | | | - | | | | - | |
| | | | | | | | | | | | | | | | | | | | | | | |
ARTISAN INTERNATIONAL FUND | |
| Investor Shares | | | | | | | | | | | | | | | | | | | | | | | |
| 9/30/2009 | | | $ | 20.34 | | $ | 0.23 | | $ | 0.48 | | | $ | 0.71 | | | $ | (0.19 | ) | | $ | (0.70 | ) |
| 9/30/2008 | | | | 33.75 | | | 0.36 | | | (9.10 | ) | | | (8.74 | ) | | | (0.20 | ) | | | (4.47 | ) |
| 9/30/2007 | | | | 28.75 | | | 0.31 | | | 7.45 | | | | 7.76 | | | | (0.43 | ) | | | (2.33 | ) |
| 9/30/2006 | | | | 24.40 | | | 0.18 | | | 4.58 | | | | 4.76 | | | | (0.41 | ) | | | - | |
| 9/30/2005 | | | | 19.33 | | | 0.21 | | | 4.98 | | | | 5.19 | | | | (0.12 | ) | | | - | |
| | | | | | | | | | | | | | | | | | | | | | | |
ARTISAN INTERNATIONAL SMALL CAP FUND | |
| Investor Shares | | | | | | | | | | | | | | | | | | | | | | | |
| 9/30/2009 | | | $ | 14.28 | | $ | 0.12 | | $ | 2.62 | | | $ | 2.74 | | | $ | (0.16 | ) | | $ | (0.20 | ) |
| 9/30/2008 | | | | 26.96 | | | 0.21 | | | (9.26 | ) | | | (9.05 | ) | | | (0.20 | ) | | | (3.43 | ) |
| 9/30/2007 | | | | 22.77 | | | 0.11 | | | 8.54 | | | | 8.65 | | | | (0.70 | ) | | | (3.76 | ) |
| 9/30/2006 | | | | 20.86 | | | 0.09 | | | 3.90 | | | | 3.99 | | | | (0.20 | ) | | | (1.88 | ) |
| 9/30/2005 | | | | 16.40 | | | 0.19 | | | 6.16 | | | | 6.35 | | | | (0.12 | ) | | | (1.77 | ) |
| (1) | Computed based on average shares outstanding. |
| (2) | Periods less than twelve months (where applicable) are not annualized. |
| (3) | Periods less than twelve months (where applicable) are annualized. |
| (4) | The ratios of expenses to average net assets and net investment income (loss) to average net assets exclude expenses waived or paid by the Adviser or the board of directors. Absent expenses waived or paid by the Adviser or the board of directors, the ratios of expenses to average net assets and net investment income (loss) to average net assets would have been as follows: |
| | | | | | | | |
| | | Year or
Period Ended | | Ratio of Expenses to
Average Net Assets | | | Ratio of Net Investment Income
(Loss) to Average Net Assets | |
Global Value Investor Shares | | 9/30/2009 | | 2.16 | % | | 0.45 | % |
| | 9/30/2008 | | 3.53 | % | | (0.70 | )% |
| (5) | For the period from commencement of operations (December 10, 2007) through September 30, 2008. |
62
| | | | | | | | | | | | | | | | | | | | |
Total
Distributions | | | Net Asset
Value
End
of Period | | Total
Return(2) | | | Net Assets
End of
Period
(millions) | | Ratio of
Expenses
to Average
Net Assets(3)(4) | | | Ratio of Net
Investment
Income
to Average
Net Assets(3)(4) | | | Portfolio
Turnover
Rate(2) | |
| | | | | | | | | | | | | | | | | | | | |
| | | | | | | | | | | | | | | | | | | | | |
| | | | | | | | | | | | | | | | | | | | | |
| $ | (0.05 | ) | | $ | 8.64 | | 4.65 | % | | $ | 28.6 | | 1.50 | % | | 1.11 | % | | 56.57 | % |
| | - | | | | 8.32 | | (16.80 | ) | | | 9.6 | | 1.44 | | | 1.39 | | | 42.27 | |
| | | | | | | | | | | | | | | | | | | | |
| | | | | | | | | | | | | | | | | | | | | |
| | | | | | | | | | | | | | | | | | | | | |
| $ | (0.89 | ) | | $ | 20.16 | | 5.00 | % | | $ | 7,715.1 | | 1.22 | % | | 1.47 | % | | 82.38 | % |
| | (4.67 | ) | | | 20.34 | | (29.99 | ) | | | 8,760.0 | | 1.22 | | | 1.28 | | | 54.42 | |
| | (2.76 | ) | | | 33.75 | | 28.69 | | | | 12,810.0 | | 1.21 | | | 1.01 | | | 66.30 | |
| | (0.41 | ) | | | 28.75 | | 19.84 | | | | 9,801.9 | | 1.20 | | | 0.66 | | | 57.80 | |
| | (0.12 | ) | | | 24.40 | | 26.97 | | | | 7,686.9 | | 1.19 | | | 0.94 | | | 56.15 | |
| | | | | | | | | | | | | | | | | | | | |
| | | | | | | | | | | | | | | | | | | | | |
| | | | | | | | | | | | | | | | | | | | | |
| $ | (0.36 | ) | | $ | 16.66 | | 20.59 | % | | $ | 695.8 | | 1.50 | % | | 0.99 | % | | 58.42 | % |
| | (3.63 | ) | | | 14.28 | | (38.44 | ) | | | 732.4 | | 1.51 | | | 0.96 | | | 42.80 | |
| | (4.46 | ) | | | 26.96 | | 43.10 | | | | 1,356.0 | | 1.52 | | | 0.45 | | | 49.85 | |
| | (2.08 | ) | | | 22.77 | | 21.63 | | | | 939.8 | | 1.53 | | | 0.41 | | | 62.21 | |
| | (1.89 | ) | | | 20.86 | | 42.13 | | | | 781.1 | | 1.53 | | | 1.03 | | | 57.25 | |
The accompanying notes are an integral part of the financial statements.
63
ARTISAN FUNDS, INC.
Financial Highlights – For a share outstanding throughout each period (Continued)
| | | | | | | | | | | | | | | | | | | | | | | |
| | | | | | |
Year or
Period
Ended | | Net Asset
Value
Beginning
of Period | | Net
Investment
Income
(Loss)(1) | | | Net Realized
and Unrealized
Gain (Loss) on
Investments | | | Total Income
(Loss) from
Investment
Operations | | | Dividends
from Net
Investment
Income | | | Distributions
from Net
Realized Gains | |
| | | | | | | | | | | | | | | | | | | | | | | |
ARTISAN INTERNATIONAL VALUE FUND | | | | | | | | | | | | | | | | | |
| Investor Shares | | | | | | | | | | | | | | | | | | | | | | | |
| 9/30/2009 | | $ | 21.20 | | $ | 0.17 | | | $ | 1.67 | | | $ | 1.84 | | | $ | (0.21 | ) | | $ | - | |
| 9/30/2008 | | | 28.49 | | | 0.45 | | | | (5.56 | ) | | | (5.11 | ) | | | (0.51 | ) | | | (1.67 | ) |
| 9/30/2007 | | | 26.71 | | | 0.38 | | | | 3.12 | | | | 3.50 | | | | (0.44 | ) | | | (1.28 | ) |
| 9/30/2006 | | | 22.38 | | | 0.53 | | | | 4.87 | | | | 5.40 | | | | (0.47 | ) | | | (0.60 | ) |
| 9/30/2005 | | | 18.54 | | | 0.28 | | | | 3.88 | | | | 4.16 | | | | (0.11 | ) | | | (0.21 | ) |
| | | | | | | | | | | | | | | | | | | | | | | |
ARTISAN MID CAP FUND | | | | | | | | | | | | | | | | | | | | |
| Investor Shares | | | | | | | | | | | | | | | | | | | | | | | |
| 9/30/2009 | | $ | 24.08 | | $ | (0.11 | ) | | $ | 0.59 | | | $ | 0.48 | | | $ | - | | | $ | (0.28 | ) |
| 9/30/2008 | | | 37.06 | | | (0.22 | ) | | | (6.86 | ) | | | (7.08 | ) | | | - | | | | (5.90 | ) |
| 9/30/2007 | | | 31.77 | | | (0.24 | ) | | | 9.00 | | | | 8.76 | | | | - | | | | (3.47 | ) |
| 9/30/2006 | | | 30.84 | | | (0.17 | ) | | | 2.43 | | | | 2.26 | | | | - | | | | (1.33 | ) |
| 9/30/2005 | | | 26.13 | | | (0.18 | ) | | | 4.89 | | | | 4.71 | | | | - | | | | - | |
| | | | | | | | | | | | | | | | | | | | | | | |
ARTISAN MID CAP VALUE FUND | | | | | | | | | | | | | | | | | | | | |
| Investor Shares | | | | | | | | | | | | | | | | | | | | | | | |
| 9/30/2009 | | $ | 17.01 | | $ | 0.08 | | | $ | (0.10 | ) | | $ | (0.02 | ) | | $ | (0.02 | ) | | $ | (0.12 | ) |
| 9/30/2008 | | | 21.70 | | | 0.03 | | | | (2.31 | ) | | | (2.28 | ) | | | (0.08 | ) | | | (2.33 | ) |
| 9/30/2007 | | | 19.87 | | | 0.09 | | | | 2.98 | | | | 3.07 | | | | (0.06 | ) | | | (1.18 | ) |
| 9/30/2006 | | | 19.60 | | | 0.06 | | | | 1.04 | | | | 1.10 | | | | (0.01 | ) | | | (0.82 | ) |
| 9/30/2005 | | | 15.55 | | | (0.01 | ) | | | 4.36 | | | | 4.35 | | | | - | (4) | | | (0.30 | ) |
| (1) | Computed based on average shares outstanding. |
| (2) | Periods less than twelve months (where applicable) are not annualized. |
| (3) | Periods less than twelve months (where applicable) are annualized. |
| (4) | Amount is between $0.005 and $(0.005) per share. |
64
| | | | | | | | | | | | | | | | | | | | |
Total
Distributions | | | Net Asset
Value
End
of Period | | Total
Return(2) | | | Net Assets
End of
Period
(millions) | | Ratio of
Expenses
to Average
Net Assets(3) | | | Ratio of Net
Investment
Income (Loss)
to Average
Net Assets(3) | | | Portfolio
Turnover
Rate(2) | |
| | | | | | | | | | | | | | | | | | | | |
| | | | | | | | | | | | | | | | | | | | | |
| | | | | | | | | | | | | | | | | | | | | |
| $ | (0.21 | ) | | $ | 22.83 | | 8.95 | % | | $ | 1,739.5 | | 1.25 | % | | 0.95 | % | | 55.49 | % |
| | (2.18 | ) | | | 21.20 | | (19.10 | ) | | | 1,029.4 | | 1.23 | | | 1.83 | | | 44.72 | |
| | (1.72 | ) | | | 28.49 | | 13.28 | | | | 1,594.7 | | 1.23 | | | 1.34 | | | 45.60 | |
| | (1.07 | ) | | | 26.71 | | 25.38 | | | | 1,312.6 | | 1.25 | | | 2.18 | | | 42.52 | |
| | (0.32 | ) | | | 22.38 | | 22.71 | | | | 601.2 | | 1.31 | | | 1.33 | | | 53.15 | |
| | | | | | | | | | | | | | | | | | | | |
| | | | | | | | | | | | | | | | | | | | | |
| | | | | | | | | | | | | | | | | | | | | |
| $ | (0.28 | ) | | $ | 24.28 | | 2.47 | % | | $ | 3,688.6 | | 1.23 | % | | (0.57 | )% | | 68.39 | % |
| | (5.90 | ) | | | 24.08 | | (22.47 | ) | | | 3,732.3 | | 1.24 | | | (0.75 | ) | | 79.76 | |
| | (3.47 | ) | | | 37.06 | | 29.83 | | | | 5,319.3 | | 1.22 | | | (0.73 | ) | | 71.04 | |
| | (1.33 | ) | | | 31.77 | | 7.42 | | | | 4,571.9 | | 1.18 | | | (0.55 | ) | | 73.59 | |
| | - | | | | 30.84 | | 18.06 | | | | 4,874.0 | | 1.18 | | | (0.63 | ) | | 83.00 | |
| | | | | | | | | | | | | | | | | | | | |
| | | | | | | | | | | | | | | | | | | | | |
| | | | | | | | | | | | | | | | | | | | | |
| $ | (0.14 | ) | | $ | 16.85 | | 0.21 | % | | $ | 4,628.0 | | 1.21 | % | | 0.62 | % | | 53.84 | % |
| | (2.41 | ) | | | 17.01 | | (11.16 | ) | | | 3,231.5 | | 1.21 | | | 0.18 | | | 69.77 | |
| | (1.24 | ) | | | 21.70 | | 15.88 | | | | 3,420.7 | | 1.20 | | | 0.41 | | | 53.62 | |
| | (0.83 | ) | | | 19.87 | | 5.87 | | | | 2,643.3 | | 1.20 | | | 0.33 | | | 47.73 | |
| | (0.30 | ) | | | 19.60 | | 28.42 | | | | 2,771.2 | | 1.22 | | | (0.04 | ) | | 51.60 | |
The accompanying notes are an integral part of the financial statements.
65
ARTISAN FUNDS, INC.
Financial Highlights – For a share outstanding throughout each period (Continued)
| | | | | | | | | | | | | | | | | | | | | | | | | | | | |
Year or
Period
Ended | | | Net Asset
Value
Beginning
of Period | | Net
Investment
Income
(Loss)(1) | | | Net Realized
and Unrealized
Gain (Loss) on
Investments | | | Total Income
(Loss) from
Investment
Operations | | | Dividends
from Net
Investment
Income | | | Distributions
from Net
Realized Gains | | | Distributions
from Tax
Return of
Capital | |
| | | | | | | | | | | | | | | | | | | | | | | | | | | | |
ARTISAN OPPORTUNISTIC GROWTH FUND | | | | | | | | | | | | | | | | | | | | | |
| Investor Shares | | | | | | | | | | | | | | | | | | | | | | | | | | | | |
| 9/30/2009 | | | $ | 9.32 | | $ | (0.05 | ) | | $ | (0.13 | ) | | $ | (0.18 | ) | | $ | - | | | $ | - | | | $ | - | |
| 9/30/2008 | (5) | | | 10.00 | | | - | (6) | | | (0.68 | ) | | | (0.68 | ) | | | - | | | | - | | | | - | |
| | | | | | | | | | | | | | | | | | | | | | | | | | | | |
ARTISAN OPPORTUNISTIC VALUE FUND | | | | | | | | | | | | | | | | | | | | | |
| Investor Shares | | | | | | | | | | | | | | | | | | | | | | | | | | | | |
| 9/30/2009 | | | $ | 8.58 | | $ | 0.06 | | | $ | (0.44 | ) | | $ | (0.38 | ) | | $ | (0.08 | ) | | $ | - | | | $ | - | |
| 9/30/2008 | | | | 12.22 | | | 0.08 | | | | (2.70 | ) | | | (2.62 | ) | | | (0.14 | ) | | | (0.88 | ) | | | - | |
| 9/30/2007 | | | | 10.41 | | | 0.20 | | | | 1.73 | | | | 1.93 | | | | (0.03 | ) | | | (0.09 | ) | | | - | |
| 9/30/2006 | (7) | | | 10.00 | | | 0.03 | | | | 0.38 | | | | 0.41 | | | | - | | | | - | | | | - | |
| | | | | | | | | | | | | | | | | | | | | | | | | | | | |
ARTISAN SMALL CAP FUND | | | | | | | | | | | | | | | | | | | | | |
| Investor Shares | | | | | | | | | | | | | | | | | | | | | | | | | | | | |
| 9/30/2009 | | | $ | 13.13 | | $ | (0.05 | ) | | $ | (0.18 | ) | | $ | (0.23 | ) | | $ | - | | | $ | - | | | $ | (0.02 | ) |
| 9/30/2008 | | | | 19.89 | | | (0.09 | ) | | | (4.82 | ) | | | (4.91 | ) | | | - | | | | (1.85 | ) | | | - | |
| 9/30/2007 | | | | 17.51 | | | (0.13 | ) | | | 2.87 | | | | 2.74 | | | | - | | | | (0.36 | ) | | | - | |
| 9/30/2006 | | | | 17.95 | | | (0.13 | ) | | | 0.26 | | | | 0.13 | | | | - | | | | (0.57 | ) | | | - | |
| 9/30/2005 | | | | 15.12 | | | (0.13 | ) | | | 3.49 | | | | 3.36 | | | | - | | | | (0.53 | ) | | | - | |
| | | | | | | | | | | | | | | | | | | | | | | | | | | | |
ARTISAN SMALL CAP VALUE FUND | | | | | | | | | | | | | | | | | | | | | |
| Investor Shares | | | | | | | | | | | | | | | | | | | | | | | | | | | | |
| 9/30/2009 | | | $ | 13.93 | | $ | 0.02 | | | $ | (0.07 | ) | | $ | (0.05 | ) | | $ | - | | | $ | (0.32 | ) | | $ | - | |
| 9/30/2008 | | | | 18.13 | | | (0.02 | ) | | | (1.09 | ) | | | (1.11 | ) | | | - | | | | (3.09 | ) | | | - | |
| 9/30/2007 | | | | 19.17 | | | (0.01 | ) | | | 1.44 | | | | 1.43 | | | | - | | | | (2.47 | ) | | | - | |
| 9/30/2006 | | | | 19.51 | | | (0.02 | ) | | | 2.00 | | | | 1.98 | | | | - | | | | (2.32 | ) | | | - | |
| 9/30/2005 | | | | 17.63 | | | (0.03 | ) | | | 3.69 | | | | 3.66 | | | | - | | | | (1.78 | ) | | | - | |
| (1) | Computed based on average shares outstanding. |
| (2) | Periods less than twelve months (where applicable) are not annualized. |
| (3) | Periods less than twelve months (where applicable) are annualized. |
| (4) | The ratios of expenses to average net assets and net investment income (loss) to average net assets exclude expenses waived or paid by the Adviser or the board of directors. Absent expenses waived or paid by the Adviser or the board of directors, the ratios of expenses to average net assets and net investment income (loss) to average net assets would have been as follows: |
| | | | | | | | |
| | | Year or
Period Ended | | Ratio of Expenses to
Average Net Assets | | | Ratio of Net Investment Income
(Loss) to Average Net Assets | |
Opportunistic Growth Investor Shares | | 9/30/2009 | | 2.24 | % | | (1.36 | )% |
| | 9/30/2008 | | 48.41 | % | | (47.60 | )% |
Opportunistic Value Investor Shares | | 9/30/2006 | | 1.64 | % | | 0 .39 | % |
| (5) | For the period from commencement of operations (September 22, 2008) through September 30, 2008. |
| (6) | Amount is between $0.005 and $(0.005) per share. |
| (7) | For the period from commencement of operations (March 27, 2006) through September 30, 2006. |
66
| | | | | | | | | | | | | | | | | | | | |
Total
Distributions | | | Net
Asset
Value
End of
Period | | Total
Return(2) | | | Net Assets
End of Period
(millions) | | Ratio of
Expenses
to Average
Net Assets(3)(4) | | | Ratio of Net
Investment
Income (Loss)
to Average
Net Assets(3)(4) | | | Portfolio
Turnover
Rate(2) | |
| | | | | | | | | | | | | | | | | | | | |
| | | | | | | | | | | | | | | | | | | | | |
| | | | | | | | | | | | | | | | | | | | | |
| $ | - | | | $ | 9.14 | | (1.93 | )% | | $ | 45.6 | | 1.47 | % | | (0.59 | )% | | 101.01 | % |
| | - | | | | 9.32 | | (6.80 | ) | | | 5.7 | | 1.50 | | | (0.69 | ) | | 3.05 | |
| | | | | | | | | | | | | | | | | | | | |
| | | | | | | | | | | | | | | | | | | | | |
| | | | | | | | | | | | | | | | | | | | | |
| $ | (0.08 | ) | | $ | 8.12 | | (4.10 | )% | | $ | 181.1 | | 1.32 | % | | 0.84 | % | | 85.44 | % |
| | (1.02 | ) | | | 8.58 | | (22.88 | ) | | | 230.3 | | 1.23 | | | 0.77 | | | 99.24 | |
| | (0.12 | ) | | | 12.22 | | 18.65 | | | | 278.7 | | 1.24 | | | 1.71 | | | 50.79 | |
| | - | | | | 10.41 | | 4.10 | | | | 75.0 | | 1.49 | | | 0.55 | | | 34.07 | |
| | | | | | | | | | | | | | | | | | | | |
| | | | | | | | | | | | | | | | | | | | | |
| | | | | | | | | | | | | | | | | | | | | |
| $ | (0.02 | ) | | $ | 12.88 | | (1.73 | )% | | $ | 437.0 | | 1.26 | % | | (0.47 | )% | | 80.51 | % |
| | (1.85 | ) | | | 13.13 | | (26.64 | ) | | | 587.1 | | 1.22 | | | (0.58 | ) | | 96.90 | |
| | (0.36 | ) | | | 19.89 | | 15.84 | | | | 1,151.5 | | 1.18 | | | (0.70 | ) | | 74.32 | |
| | (0.57 | ) | | | 17.51 | | 0.74 | | | | 1,263.8 | | 1.15 | | | (0.70 | ) | | 101.98 | |
| | (0.53 | ) | | | 17.95 | | 22.64 | | | | 1,103.3 | | 1.18 | | | (0.80 | ) | | 78.60 | |
| | | | | | | | | | | | | | | | | | | | |
| | | | | | | | | | | | | | | | | | | | | |
| | | | | | | | | | | | | | | | | | | | | |
| $ | (0.32 | ) | | $ | 13.56 | | 0.46 | % | | $ | 2,156.5 | | 1.22 | % | | 0.20 | % | | 63.05 | % |
| | (3.09 | ) | | | 13.93 | | (5.77 | ) | | | 1,902.1 | | 1.20 | | | (0.16 | ) | | 75.49 | |
| | (2.47 | ) | | | 18.13 | | 7.48 | | | | 2,151.2 | | 1.19 | | | (0.03 | ) | | 72.38 | |
| | (2.32 | ) | | | 19.17 | | 11.40 | | | | 2,039.5 | | 1.17 | | | (0.09 | ) | | 58.88 | |
| | (1.78 | ) | | | 19.51 | | 22.42 | | | | 1,720.9 | | 1.18 | | | (0.16 | ) | | 56.03 | |
The accompanying notes are an integral part of the financial statements.
67
ARTISAN FUNDS, INC.
Notes to Financial Statements – September 30, 2009
Artisan Funds, Inc. (“Artisan Funds”) was incorporated on January 5, 1995, as a Wisconsin corporation and is registered under the Investment Company Act of 1940, as amended. Artisan Funds is a series comprised of eleven open-end, diversified mutual funds. The following funds (each a “Fund” and collectively the “Funds”) are covered by this report:
| | |
| Fund Name | | Inception Date |
Artisan Global Value Fund (“Global Value Fund” or “Global Value”) | | December 10, 2007 |
Artisan International Fund (“International Fund” or “International”) | | December 28, 1995 |
Artisan International Small Cap Fund (“International Small Cap Fund” or “International Small Cap”) | | December 21, 2001 |
Artisan International Value Fund (“International Value Fund” or “International Value”) | | September 23, 2002 |
Artisan Mid Cap Fund (“Mid Cap Fund” or “Mid Cap”) | | June 27, 1997 |
Artisan Mid Cap Value Fund (“Mid Cap Value Fund” or “Mid Cap Value”) | | March 28, 2001 |
Artisan Opportunistic Growth Fund (“Opportunistic Growth Fund” or “Opportunistic Growth”) | | September 22, 2008 |
Artisan Opportunistic Value Fund (“Opportunistic Value Fund” or “Opportunistic Value”) | | March 27, 2006 |
Artisan Small Cap Fund (“Small Cap Fund” or “Small Cap”) | | March 28, 1995 |
Artisan Small Cap Value Fund (“Small Cap Value Fund” or “Small Cap Value”) | | September 29, 1997 |
Each Fund’s investment objective is to seek long-term capital growth. Each Fund has offered shares of capital stock of the class designated Investor Shares since the commencement of its operations. International Fund, International Value Fund and Mid Cap Fund began offering Institutional Shares on July 1, 1997, October 1, 2006 and July 1, 2000, respectively. Institutional Shares are sold to institutional investors meeting certain minimum investment requirements.
Each class of shares has equal rights with respect to portfolio assets and voting privileges. Each class has exclusive voting rights with respect to any matters involving only that class.
Income, expenses not specific to a particular class and realized and unrealized gains and losses were allocated daily to each class of shares based upon the relative net asset value of outstanding shares. Expenses attributable to a particular class of shares, such as transfer agency fees, shareholder communication expenses and registration fees, were allocated directly to that class.
Each Fund is managed by Artisan Partners Limited Partnership (the “Adviser”). The Adviser is wholly owned by Artisan Partners Holdings LP (“Artisan Holdings”).
Artisan Emerging Markets Fund, also a series of Artisan Funds, Inc., commenced operations on June 26, 2006 and has offered Institutional Shares since inception. It began offering Advisor shares on June 2, 2008. The financial statements of both classes of Artisan Emerging Markets Fund are presented in separate reports.
68
NOTES TO FINANCIAL STATEMENTS
| (2) | Summary of significant accounting policies: |
The following is a summary of significant accounting policies of the Funds in effect during the period covered by the financial statements, which were in accordance with United States generally accepted accounting principles.
| (a) | Security valuation – The net asset value (“NAV”) of the shares of each class of each Fund was determined as of the close of regular session trading on the New York Stock Exchange (“NYSE”) (usually 4:00 p.m., Eastern Time) each day the NYSE was open for regular session trading. The NAV of each class of shares was determined by dividing the value of each Fund’s securities and other assets attributed to that class, less its liabilities attributed to that class, by the number of outstanding shares of that class of that Fund. |
| | In determining NAV, each equity security traded on a securities exchange, including the Nasdaq Stock Market and over-the-counter securities, was valued at the closing price as of the time of valuation on the exchange or market designated by the Fund’s accounting agent or pricing vendor as the principal exchange (the “principal exchange”). The closing price provided by the pricing vendor for a principal exchange may differ and may represent information such as last sales price, an official closing price, a closing auction price or other information, depending on exchange or market convention. Absent closing price information from the principal exchange as of the time of valuation, the security was valued using the closing price on another exchange on which the security traded (if such price is made available by the pricing vendor) or the most recent bid quotation on the principal exchange or, if not available, another exchange or in the over-the-counter market, except that securities listed on the London Stock Exchange were valued at the mean of the most recent bid and asked quotations as of the time of valuation. Short-term investments, other than repurchase agreements, maturing within sixty days from the valuation date were valued at amortized cost, which approximates market value. |
| | Securities for which prices were not readily available were valued by Artisan Funds’ valuation committee (the “valuation committee”) at a fair value determined in good faith under procedures established by and under the general supervision of Artisan Funds’ board of directors (the “board of directors”). A price was considered to be not readily available if, among other things, the valuation committee believed that the price determined as described in the preceding paragraph did not reflect a fair value of the security. |
| | Global Value Fund, International Fund, International Small Cap Fund and International Value Fund generally invested a significant portion, and perhaps as much as substantially all, of their total assets in securities principally traded in markets outside the U.S. Opportunistic Growth Fund and Opportunistic Value Fund had the ability to invest, and did invest, in securities principally traded outside the U.S. The foreign markets in which the Funds invested were sometimes open on days when the NYSE was not open and the Funds did not calculate their NAVs, and sometimes were not open on days when the Funds did calculate their NAVs. Even on days on which both the foreign market and the NYSE were open, several hours may have passed between the time when trading in the foreign market closed and the time as of which the Funds calculate their NAVs. That was generally the case for markets in Europe, Asia, Australia |
69
NOTES TO FINANCIAL STATEMENTS
| | and other far eastern markets; the regular closing time of foreign markets in North and South America was generally the same as the closing time of the NYSE and the time as of which the Funds calculated their NAVs. |
| | The valuation committee concluded that a price determined under the Funds’ valuation procedures was not readily available if, among other things, the valuation committee believed that the value of the security might have been materially affected by events occurring after the close of the market in which the security was principally traded but before the time for determination of NAV (“subsequent event”). A subsequent event might include a company-specific development (for example, announcement of a merger that is made after the close of the foreign market), a development that might affect an entire market or region (for example, imposition of foreign exchange controls by a foreign government), a potentially global development (such as a terrorist attack that may be expected to have an impact on investor expectations worldwide) or a significant change in one or more U.S. securities indexes. Artisan Funds monitored for subsequent events using several tools. An indication by any of those tools of a potential material change in the value of securities resulted in either a meeting of the valuation committee, which considered whether a subsequent event had occurred and whether local market closing prices continued to represent fair values for potentially affected non-U.S. securities, and/or a valuation based on information provided by a third party research service. This third party research service was used to assist in determining estimates of fair values for foreign securities. That service utilized statistical data based on historical performance of securities, markets and other data in developing factors used to estimate a fair value. |
| | Estimates of fair values utilized by the Funds as described above may differ from the value realized on the subsequent sale of those securities and from quoted or published prices for those securities. The differences may have been material to the NAV of the applicable Fund or to the information presented. |
| | Foreign stocks as an asset class may underperform U.S. stocks, and foreign stocks may be more volatile than U.S. stocks. Risks relating to investment in foreign securities (including, but not limited to, depository receipts and participation certificates) include: currency exchange rate fluctuation; less available public information about the issuers of securities; less stringent regulatory standards; lack of uniform accounting, auditing and financial reporting standards; and country risks including less liquidity, high inflation rates, unfavorable economic practices and political instability. The risks of foreign investments are typically greater in emerging and less developed markets. |
| (b) | Fair Value Measurements – In April 2009, the Financial Accounting Standards Board (“FASB”) updated the accounting standards to provide guidance on (1) estimating the fair value of an asset or liability when the volume and level of activity for the asset or liability have significantly decreased, (2) identifying transactions that are not orderly, and (3) expands existing fair value measurement disclosure to include a breakout of the major security types. The Funds adopted this accounting guidance on June 30, 2009. |
| | The FASB updated the accounting standards to clarify the definition of fair value for financial reporting, establish a framework for measuring fair value and require additional disclosures about the use of fair value measurements. The Funds adopted this accounting guidance on October 1, 2008. In accordance with this standard, fair value is defined as the price that each Fund would receive upon selling an investment in an |
70
NOTES TO FINANCIAL STATEMENTS
| | orderly transaction to an independent buyer in the principal or most advantageous market of the investment. The standard establishes a three-tier hierarchy to distinguish between (1) inputs that reflect the assumptions market participants would use in pricing an asset or liability developed based on the market data obtained from sources independent of the reporting entity (observable inputs) and (2) inputs that reflect the reporting entity’s own assumptions about the assumptions market participants would use in pricing an asset or liability developed based on the best information available in the circumstances (unobservable inputs) and to establish classification of fair value measurements for disclosure purposes. Various inputs are used in determining the value of the Funds’ investments. The three-tier hierarchy of inputs is summarized in three broad levels: |
| | • | | Level 1 – quoted prices in active markets for identical investments |
| | • | | Level 2 – other significant observable inputs (including but not limited to quoted prices for similar securities, interest rates, prepayment speeds, credit risks, etc.) |
| | • | | Level 3 – significant unobservable inputs (including the Funds’ own assumptions in determining the fair value of investments) |
| | The inputs or methodology used for valuing securities are not necessarily an indication of the risk or liquidity associated with investing in those securities. |
| | The following table summarizes each Fund’s investments by major security type, based on the inputs used to determine their fair values as of September 30, 2009: |
| | | | | | | | | | | |
| Fund | | Level 1 - Quoted
Prices | | Level 2 - Other Significant
Observable Inputs | | Level 3 - Significant
Unobservable Inputs | | Total |
Global Value | | | | | | | | | | | |
Equity Securities(1) | | | | | | | | | | | |
Americas | | $ | 12,299,991 | | $ | - | | - | | $ | 12,299,991 |
Emerging Markets | | | 366,019 | | | 715 | | - | | | 366,734 |
Europe | | | 12,556,666 | | | 378,163 | | - | | | 12,934,829 |
Pacific Basin | | | 1,839,208 | | | - | | - | | | 1,839,208 |
Repurchase Agreements | | | - | | | 1,368,000 | | - | | | 1,368,000 |
Total | | $ | 27,061,884 | | $ | 1,746,878 | | - | | $ | 28,808,762 |
International | | | | | | | | | | | |
Equity Securities(1) | | | | | | | | | | | |
Americas | | $ | 727,552,366 | | $ | - | | - | | $ | 727,552,366 |
Emerging Markets | | | 1,467,031,111 | | | 12,920,464 | | - | | | 1,479,951,575 |
Europe | | | 7,299,845,992 | | | - | | - | | | 7,299,845,992 |
Pacific Basin | | | 998,523,752 | | | - | | - | | | 998,523,752 |
Repurchase Agreements | | | - | | | 173,052,000 | | - | | | 173,052,000 |
Total | | $ | 10,492,953,221 | | $ | 185,972,464 | | - | | $ | 10,678,925,685 |
International Small Cap | | | | | | | | | | | |
Equity Securities(1) | | | | | | | | | | | |
Americas | | $ | 16,023,260 | | $ | - | | - | | $ | 16,023,260 |
71
NOTES TO FINANCIAL STATEMENTS
| | | | | | | | | | | |
| Fund | | Level 1 - Quoted
Prices | | Level 2 - Other Significant
Observable Inputs | | Level 3 - Significant
Unobservable Inputs | | Total |
International Small Cap (continued) | | | | | | | | |
Emerging Markets | | | 156,365,542 | | $ | 7,226,855 | | - | | | 163,592,397 |
Europe | | | 426,550,536 | | | - | | - | | | 426,550,536 |
Pacific Basin | | | 70,504,803 | | | - | | - | | | 70,504,803 |
Repurchase Agreements | | | - | | | 13,589,000 | | - | | | 13,589,000 |
Total | | $ | 669,444,141 | | $ | 20,815,855 | | - | | $ | 690,259,996 |
International Value | | | | | | | | | | | |
Equity Securities(1) | | | | | | | | | | | |
Americas | | $ | 264,128,101 | | $ | - | | - | | $ | 264,128,101 |
Emerging Markets | | | 53,148,000 | | | 52,156 | | - | | | 53,200,156 |
Europe | | | 1,248,225,596 | | | 48,521,286 | | - | | | 1,296,746,882 |
Pacific Basin | | | 205,943,643 | | | - | | - | | | 205,943,643 |
Repurchase Agreements | | | - | | | 188,093,000 | | - | | | 188,093,000 |
Total | | $ | 1,771,445,340 | | $ | 236,666,442 | | - | | $ | 2,008,111,782 |
Mid Cap | | | | | | | | | | | |
Equity Securities(1) | | $ | 3,995,820,823 | | $ | - | | - | | $ | 3,995,820,823 |
Repurchase Agreements | | | - | | | 155,263,000 | | - | | | 155,263,000 |
Total | | $ | 3,995,820,823 | | $ | 155,263,000 | | - | | $ | 4,151,083,823 |
Mid Cap Value | | | | | | | | | | | |
Equity Securities(1) | | $ | 4,284,860,617 | | $ | - | | - | | $ | 4,284,860,617 |
Repurchase Agreements | | | - | | | 354,552,000 | | - | | | 354,552,000 |
Total | | $ | 4,284,860,617 | | $ | 354,552,000 | | - | | $ | 4,639,412,617 |
Opportunistic Growth Fund | | | | | | | | | | | |
Equity Securities(1) | | $ | 42,769,489 | | $ | - | | - | | $ | 42,769,489 |
Repurchase Agreements | | | - | | | 3,758,000 | | - | | | 3,758,000 |
Total | | $ | 42,769,489 | | $ | 3,758,000 | | - | | $ | 46,527,489 |
Opportunistic Value Fund | | | | | | | | | | | |
Equity Securities(1) | | $ | 175,895,530 | | $ | - | | - | | $ | 175,895,530 |
Repurchase Agreements | | | - | | | 10,305,000 | | - | | | 10,305,000 |
Total | | $ | 175,895,530 | | $ | 10,305,000 | | - | | $ | 186,200,530 |
Small Cap Fund | | | | | | | | | | | |
Equity Securities(1) | | $ | 417,877,139 | | $ | - | | - | | $ | 417,877,139 |
Repurchase Agreements | | | - | | | 19,147,000 | | - | | | 19,147,000 |
Total | | $ | 417,877,139 | | $ | 19,147,000 | | - | | $ | 437,024,139 |
Small Cap Value Fund | | | | | | | | | | | |
Equity Securities(1) | | $ | 1,981,023,725 | | $ | - | | - | | $ | 1,981,023,725 |
Repurchase Agreements | | | - | | | 172,998,000 | | - | | | 172,998,000 |
Total | | $ | 1,981,023,725 | | $ | 172,998,000 | | - | | $ | 2,154,021,725 |
|
(1) See Fund’s Schedule of Investments for sector or country classifications. |
72
NOTES TO FINANCIAL STATEMENTS
| | As of September 30, 2009, the reconciliation of assets in which significant unobservable inputs (Level 3) were used in determining fair value, is as follows: |
| | | | |
| | | INTERNATIONAL FUND(2) | |
Balance as of September 30, 2008 | | $ | 96,148,234 | |
Realized loss(3) | | | (156,374,528 | ) |
Change in unrealized appreciation (depreciation)(3) | | | 104,286,228 | |
Net sales | | | (44,059,934 | ) |
Transfers in and/or out of Level 3 | | | - | |
| | | | |
Balance as of September 30, 2009 | | $ | - | |
| | | | |
Net change in unrealized appreciation/(depreciation) for investments held as of September 30, 2009 | | $ | - | |
| | | | |
| | (2) | All Level 3 securities were equity securities with a regional classification of emerging markets. |
| | (3) | Realized loss and change in unrealized appreciation are included in the related amounts on investments in the Statement of Operations. |
| (c) | Income taxes – No provision was made for federal income taxes or excise taxes since each Fund intends to (i) comply with the provisions of Subchapter M of the Internal Revenue Code applicable to regulated investment companies and (ii) distribute to its shareholders substantially all of its taxable income as well as net realized gains from the sale of investment securities. The Funds may utilize earnings and profits distributed to shareholders on redemptions of Fund shares as part of the dividends paid deduction. |
| | The Funds have analyzed the tax positions taken on federal income tax returns for all open tax years and has concluded that as of September 30, 2009, no provision for income tax would be required in the Funds’ financial statements. The Funds’ federal and state income and federal excise tax returns for tax years for which the applicable statutes of limitations have not expired are subject to examination by the Internal Revenue Service and state department of revenue. |
| | The Funds may be subject to taxes on realized gains from the sale of investment securities imposed by certain countries in which the Funds invest. The foreign tax expense, if any, was recorded on an accrual basis and is included in “Payable for withholding taxes” on the accompanying Statements of Assets and Liabilities. |
| (d) | Portfolio transactions – In determining a Fund’s NAV, security transactions and shareholder transactions were accounted for no later than one business day after trade date, in accordance with applicable law. However, for financial reporting purposes, security transactions and shareholder transactions were recorded on trade date in accordance with United States generally accepted accounting principles. Net realized gains and losses on securities were computed on specific security lot identification. |
| (e) | Foreign currency translation – Values of foreign investments, open foreign currency forward contracts, payables for capital gains taxes and cash denominated in foreign currencies were translated into U.S. dollars using a spot market rate of exchange as of the time of determination of each Fund’s NAV on the day of valuation. Payables and receivables for securities transactions, dividend and reclaim receivables and other receivables and payables denominated in a foreign currency were translated into U.S. dollars using a spot market rate of exchange as of 12:00 p.m. (Eastern Time) on the day of valuation. Purchases and sales of investments and dividend and interest income were translated into U.S. dollars using a spot market rate of exchange as of 12:00 p.m. |
73
NOTES TO FINANCIAL STATEMENTS
| | (Eastern Time) on the date of such transactions. The portion of security gains or losses resulting from changes in foreign exchange rates was included with net realized and unrealized gain or loss from investments, as appropriate, for both financial reporting and tax purposes. |
| | The Funds may enter into foreign currency forward contracts to hedge the foreign currency exposure on open payables and receivables. These foreign currency forward contracts, or spot contracts, generally settle within two business days. The Funds also may enter into foreign currency forward contracts to hedge against foreign currency exchange rate risks on its non-U.S. dollar denominated investment securities. Foreign currency forward contracts were recorded at market value and any related realized and unrealized gains and losses were reported as foreign currency related transactions for financial reporting purposes. For tax purposes, these foreign exchange gains and losses were treated as ordinary income or loss. The Funds could be exposed to loss if the counterparties fail to perform under these contracts. |
| | Other foreign currency related transaction gains and losses may result from currency gains and losses realized from the difference between the amounts of dividends and foreign withholding taxes recorded on the Funds’ books and the U.S. dollar equivalent of the amounts actually received or paid. The net increase (decrease) in unrealized appreciation or depreciation on foreign currency related transactions arose from changes in the values of assets and liabilities, other than investments in securities, resulting from changes in foreign exchange rates. |
| (f) | Repurchase agreements – Each Fund may enter into repurchase agreements with institutions that the Adviser determined were creditworthy pursuant to criteria adopted by the board of directors. Repurchase agreements were recorded at cost plus accrued interest and were collateralized in an amount greater than or equal to the repurchase price plus accrued interest. Collateral (in the form of U.S. government securities) was held by the Funds’ custodian and in the event of default on the obligation of the counterparty to repurchase, the Funds had the right to liquidate the collateral and apply the proceeds in satisfaction of the obligation. If the proceeds from any sale of such collateral were less than the repurchase price, the Fund would have suffered a loss. |
| (g) | Depository receipts – Each of the Funds may invest in depository receipts. Depository receipts are typically issued by a financial institution (a “depository”), evidencing ownership interests in a security issued by an issuer and deposited with the depository. |
| (h) | Securities lending – Each of the Funds may (but does not currently intend to) enter into securities lending transactions secured by collateral in the form of U.S. Government securities at least equal to, at all times, the fair value of the securities loaned. Any such collateral will be held in a custody account maintained by State Street Bank and Trust Company, the Funds’ custodian. When securities are on loan, the Fund does not receive dividends on the securities loaned, but receives compensation from the borrower in lieu of such dividends. Gain or loss in the fair value of the securities loaned that may occur during the term of the loan will be for the account of the applicable Fund. In entering into securities lending arrangements, the Fund takes the risk that the borrower may not provide additional collateral when required or return the securities when due or, if the borrower defaults, the Fund may experience delays in selling collateral or the collateral may not be sufficient to cover the value of securities lent. There were no securities on loan during the year ended September 30, 2009. |
74
NOTES TO FINANCIAL STATEMENTS
| (i) | Equity-linked participation certificates – Global Value Fund, International Fund, International Small Cap Fund, International Value Fund, Opportunistic Growth Fund, and Opportunistic Value Fund may invest in equity-linked participation certificates. Equity-linked participation certificates are derivative securities which are designed to provide synthetic exposure to one or more underlying securities. An investment in an equity-linked participation certificate typically entitles the holder to a return equal to the market return of the underlying security or securities, subject to the credit risk of the issuing financial institution. |
| (j) | Transfer agent fees – Each Fund paid fees to, and reimbursed expenses of, the Funds’ transfer agent. In addition, the Funds have authorized certain financial services companies, broker-dealers, banks or other authorized agents, and in some cases, other organizations designated by an authorized agent (with their designees, collectively “authorized agents”) to accept purchase, exchange and redemption orders for Investor Shares on the Funds’ behalf. Many authorized agents charged a fee for accounting and shareholder services that the agent provided to Fund shareholders on the Fund’s behalf. Those services typically included recordkeeping, transaction processing for shareholders’ accounts and other services. The fee was either based on the number of accounts to which the authorized agent provided such services, or a percentage (as of September 30, 2009 up to 0.40% annually) of the average value of Fund shares held in such accounts. Each Fund paid a portion of such fees, which are intended to compensate the authorized agent for its provision of services of the type that would be provided by the Funds’ transfer agent or other service providers if the shares were registered on the books of the Funds’ transfer agent. The balance of the fees incurred was paid by the Adviser. The Funds’ expenses incurred for services provided by authorized agents were included in “Transfer agent fees” in the Statements of Operations. The table below shows the fees and expenses to the Funds’ transfer agent and the fees to authorized agents incurred by each class of each Fund during the year ended September 30, 2009: |
| | | | | | | | | |
| | | Year Ended 9/30/09 |
| Fund | | Fees and Expenses
to Transfer Agent | | Fees to
Authorized
Agents | | Total |
Global Value - Investor Shares | | $ | 66,384 | | $ | 39,724 | | $ | 106,108 |
International - Investor Shares | | | 626,978 | | | 12,602,287 | | | 13,229,265 |
International - Institutional Shares | | | 25,164 | | | - | | | 25,164 |
International Small Cap - Investor Shares | | | 88,243 | | | 644,233 | | | 732,476 |
International Value - Investor Shares | | | 121,651 | | | 1,935,150 | | | 2,056,801 |
International Value - Institutional Shares | | | 19,224 | | | - | | | 19,224 |
Mid Cap - Investor Shares | | | 178,389 | | | 6,869,034 | | | 7,047,423 |
Mid Cap - Institutional Shares | | | 19,755 | | | - | | | 19,755 |
Mid Cap Value - Investor Shares | | | 423,723 | | | 6,275,602 | | | 6,699,325 |
Opportunistic Growth - Investor Shares | | | 56,590 | | | 51,008 | | | 107,598 |
Opportunistic Value - Investor Shares | | | 81,708 | | | 358,557 | | | 440,265 |
Small Cap - Investor Shares | | | 123,218 | | | 515,882 | | | 639,100 |
Small Cap Value - Investor Shares | | | 101,199 | | | 3,212,495 | | | 3,313,694 |
75
NOTES TO FINANCIAL STATEMENTS
| (k) | Commission recapture – Each of the Funds had the ability to direct portfolio trades to various brokers that have agreed to rebate a portion of the commissions generated. Such cash rebates were made directly to the applicable Fund and were included in net realized gain or loss on investments in the Statements of Operations as follows: |
| | | |
Global Value | | $ | - |
International | | | 127,403 |
International Small Cap | | | 3,973 |
International Value | | | 46,042 |
Mid Cap | | | 307,989 |
Mid Cap Value | | | 229,679 |
Opportunistic Growth | | | 2,606 |
Opportunistic Value | | | 11,718 |
Small Cap | | | 94,032 |
Small Cap Value | | | 186,698 |
| (l) | Use of estimates – The preparation of financial statements in conformity with United States generally accepted accounting principles requires management to make estimates and assumptions that affect the reported amounts and disclosures in the financial statements. Actual results could differ from those estimates. |
| (m) | Indemnifications – In the normal course of business, the Funds have entered into contracts in which the Funds agree to indemnify the other party or parties against various potential costs or liabilities. The Funds’ maximum exposure under these arrangements is unknown. No claim had been made for indemnification pursuant to any such agreement of the Funds. |
| (n) | Other – Dividend income less foreign taxes withheld, if any, was generally recorded on the ex-dividend date. In some cases, the information was not available to the Fund on the ex-dividend date. In such cases, which may have included private placements and foreign securities, dividends were recorded as soon after the ex-dividend date as reliable information became available to the Funds. Non-cash dividends included in dividend income, if any, were generally recorded at the fair market value of securities received. Interest income was reported on the accrual basis. Distributions to shareholders were recorded on the ex-dividend date. Expenses attributable to Artisan Funds were generally allocated to each Fund based on net assets. However, other expense allocation methodologies were used, depending on the nature of the expense item. Expenses attributable to a particular Fund or class were allocated directly to that Fund or class. |
| | The character of income and net realized gains and losses may differ in some instances for financial statement and tax purposes and may result in reclassification of permanent differences among certain capital accounts to more appropriately conform financial accounting to tax characterizations of dividend and capital gain distributions. |
| | Global Value Fund, International Fund, International Small Cap Fund and International Value Fund generally imposed a 2% redemption fee on shares held 90 days or less. Those redemption fees were recorded as a reduction in the cost of shares redeemed and had the primary effect of increasing paid-in capital. Each Fund reserved the right to waive or reduce the 2% redemption fee on shares held 90 days or less at its discretion when the Fund believed such waiver was in the best interests of the Fund, including but not limited to when it determined that imposition of the redemption fee was not |
76
NOTES TO FINANCIAL STATEMENTS
| | necessary to protect the Fund from the effects of short-term trading. The Funds waived the fee on redemption of shares held by certain authorized agents or other Fund intermediaries and otherwise in accordance with the Funds’ prospectus. |
| (3) | Transactions with affiliates: |
The Adviser, with which the officers and a director of Artisan Funds were affiliated, provided investment advisory and administrative services to the Funds. In exchange for those services, each Fund (with the exception of Global Value Fund, International Fund, International Small Cap Fund, Opportunistic Growth Fund and Opportunistic Value Fund) paid a monthly management fee to the Adviser as follows:
| | | |
Average Daily Net Assets | | Annual Rate | |
Less than $500 million | | 1.000 | % |
$500 million to $750 million | | 0.975 | |
$750 million to $1 billion | | 0.950 | |
Greater than $1 billion | | 0.925 | |
Global Value Fund paid a monthly management fee to the Adviser as follows:
| | | |
Average Daily Net Assets | | Annual Rate | |
Less than $1 billion | | 1.000 | % |
$1 billion to $4 billion | | 0.975 | |
$4 billion to $8 billion | | 0.950 | |
$8 billion to $12 billion | | 0.925 | |
Greater than $12 billion | | 0.900 | |
International Fund paid a monthly management fee to the Adviser as follows:
| | | |
Average Daily Net Assets | | Annual Rate | |
Less than $500 million | | 1.000 | % |
$500 million to $750 million | | 0.975 | |
$750 million to $1 billion | | 0.950 | |
$1 billion to $12 billion | | 0.925 | |
Greater than $12 billion | | 0.900 | |
International Small Cap Fund paid a monthly management fee to the Adviser at an annual rate of 1.250% of average daily net assets.
Opportunistic Growth Fund and Opportunistic Value Fund paid a monthly management fee to the Adviser as follows:
| | | |
Average Daily Net Assets | | Annual Rate | |
Less than $1 billion | | 0.900 | % |
$1 billion to $4 billion | | 0.875 | |
$4 billion to $8 billion | | 0.850 | |
$8 billion to $12 billion | | 0.825 | |
Greater than $12 billion | | 0.800 | |
The Adviser has voluntarily undertaken to reimburse Global Value Fund and Opportunistic Growth Fund for any ordinary operating expenses in excess of 1.50% of average daily net assets, annually. For the year ended September 30, 2009, the Adviser paid operating expenses
77
NOTES TO FINANCIAL STATEMENTS
on behalf of Global Value Fund and Opportunistic Growth Fund. Global Value Fund and Opportunistic Growth Fund reimburse the Adviser annually for operating expenses paid on their behalf up to 1.50% of average daily net assets, annually. The amount of operating expenses owed to the Adviser is included in payable for operating expenses on the Statements of Assets and Liabilities for Global Value Fund and Opportunistic Growth Fund.
The Adviser reimbursed Opportunistic Value Fund $395,804 for costs resulting from an administrative error that occurred during the year ended September 30, 2009. This amount was recorded as an increase to fund share subscriptions, which had the primary effect of increasing paid-in-capital.
The officers and director of Artisan Funds who are affiliated with the Adviser receive no compensation from the Funds.
Each director who was not an affiliated person of the Adviser received an annual retainer, payable quarterly, as well as reimbursement of expenses related to his duties as a director of Artisan Funds. The amount of the annual retainer increases by $10,000 with each new series of Artisan Funds and, during the year ended September 30, 2009, was at the annual rate of $170,000. In addition, the non-interested chair of the board of directors received an annual retainer of $60,000, payable quarterly, and each chair of a board committee who was a non-interested director received an annual retainer of $30,000, payable quarterly. These fees were generally allocated to each of the Artisan Funds based on net assets, subject to a minimum allocation of $1,500 to each Fund per quarter. Directors fees allocable to Opportunistic Growth Fund have been waived through September 30, 2009.
Artisan Funds has adopted a deferred compensation plan for directors who are not affiliated persons of the Adviser that enables directors to elect to defer receipt of all or a portion of the annual compensation they are entitled to receive from the Funds. For purposes of determining the amount owed to the directors under the plan, deferred amounts were invested in shares of the Artisan Funds as selected by the individual directors. Each Fund purchased shares of the Artisan Funds selected for deferral by the director in amounts equal to his investment, resulting in a Fund asset equal to the deferred compensation liability. Such assets were included as a component of “Other assets” on the Statements of Assets and Liabilities. Deferral of directors’ fees under the plan did not affect the net assets of the Funds, and did not materially affect the Funds’ assets, liabilities or net investment income per share. Amounts will be deferred until distributed in accordance with the plan.
Shares of Artisan Funds were offered for sale by Artisan Distributors LLC (“Distributors”). Distributors is wholly owned by Artisan Holdings. All distribution expenses relating to the Funds were paid by the Adviser.
| (4) | Line of credit arrangement: |
Artisan Funds is party to a line of credit agreement with State Street Bank and Trust Company (“SSB”), which expires August 2010, under which each Fund may borrow up to the lesser of (a) $75 million or (b) the lesser of (i) 33 1/3% of its adjusted net assets, with adjusted net assets being total assets less liabilities and the value of any assets pledged to anyone other than SSB, (after giving effect to the loan) or (ii) the maximum amount the Fund may borrow under the Investment Company Act of 1940, the limitations included in the Fund’s prospectus, or any limit or restriction under any law or regulation to which the Fund was subject or any agreement to which the Fund or Artisan Funds is a party; provided that the
78
NOTES TO FINANCIAL STATEMENTS
aggregate borrowings by all Artisan Funds may not exceed $100 million. For the period October 1, 2008 to August 17, 2009, Artisan Funds paid a commitment fee at the annual rate of 0.10% on the unused portion of the line of credit and interest was charged on any borrowings at the current Federal Funds rate plus 0.50%. Effective August 18, 2009, Artisan Funds paid a commitment fee at the annual rate of 0.15% on the unused portion of the line of credit and interest was charged on any borrowings at the current Federal Funds rate plus 1.25%. SSB has agreed to waive 0.05% of the commitment fee by reducing the Funds’ custody expenses until August 2010. The use of the line of credit was generally restricted to temporary borrowing for extraordinary or emergency purposes. During the year ended September 30, 2009, there were no borrowings under the line of credit for Global Value Fund, International Fund, International Value Fund, Mid Cap Fund, Mid Cap Value Fund, Opportunistic Growth Fund, or Small Cap Value Fund. During the year ended September 30, 2009, International Small Cap Fund, Opportunistic Value Fund, and Small Cap Fund paid interest of $356, $79, and $6 on maximum borrowings of $3,859,000, $740,306, and $266,271, respectively.
| (5) | Investment transactions: |
The cost of securities purchased and the proceeds from the sale of securities (excluding short-term securities) for the year ended September 30, 2009 were as follows:
| | | | | | |
| Fund | | Security Purchases | | Security Sales |
Global Value | | $ | 23,857,030 | | $ | 10,206,459 |
International | | | 7,069,339,796 | | | 7,534,124,091 |
International Small Cap | | | 290,308,008 | | | 335,556,500 |
International Value | | | 1,121,559,967 | | | 619,638,035 |
Mid Cap | | | 2,203,168,853 | | | 2,345,097,667 |
Mid Cap Value | | | 2,654,556,840 | | | 1,614,870,951 |
Opportunistic Growth | | | 48,460,412 | | | 17,989,330 |
Opportunistic Value | | | 130,856,455 | | | 151,553,373 |
Small Cap | | | 291,488,905 | | | 383,679,626 |
Small Cap Value | | | 1,113,458,797 | | | 934,031,343 |
| (6) | Transactions in securities of affiliates: |
The table below shows information about securities of the Funds’ “affiliates” (as defined below) that were held by the Funds, purchased or sold by the Funds, or from which dividends were received by the Funds during the year ended September 30, 2009. The Funds identify a company as an affiliate for the purpose of this report if one or more of the Funds owned, in the aggregate, voting securities that it believed represented 5% or more of that company’s outstanding voting securities (as defined by the Investment Company Act of 1940) during the year ended September 30, 2009.
| | | | | | | | | | | | | | | | | | | | | | |
| | | | | As of
9/30/08 | | | | | | | | | | | As of 9/30/09 |
| Fund | | Security | | Share
Balance | | Purchase
Cost | | Sales
Cost | | Net
Realized
Gain (Loss) | | | Dividend
Income(1) | | Share
Balance | | Value |
| International | | | | | | | | | | | | | | | | | | | | | | |
| | | Shanghai Electric Group Company Limited, Series H(3) | | 150,931,921 | | $ | 2,961,958 | | $ | 113,000,839 | | $ | (68,638,629 | ) | | $ | 959,558 | | - | | $ | - |
| | | Total(2) | | | | $ | 2,961,958 | | $ | 113,000,839 | | $ | (68,638,629 | ) | | $ | 959,558 | | | | $ | - |
79
NOTES TO FINANCIAL STATEMENTS
| | | | | | | | | | | | | | | | | | | | | | |
| | | | | As of
9/30/08 | | | | | | | | | | | As of 9/30/09 |
| Fund | | Security | | Share
Balance | | Purchase
Cost | | Sales
Cost | | Net
Realized
Gain (Loss) | | | Dividend
Income(1) | | Share
Balance | | Value |
| International Small Cap | | | | | | | | | | | | | | | | | | | | |
| | | Robert Walters plc(3)(4) | | 3,236,209 | | $ | 1,269,410 | | $ | 2,117,824 | | $ | (602,040 | ) | | $ | 269,555 | | 3,313,700 | | $ | 10,949,054 |
| | | Spazio Investment NV(3) | | 1,600,055 | | | - | | | 25,003,860 | | | (20,434,364 | ) | | | - | | - | | | - |
| | | Total(2) | | | | $ | 1,269,410 | | $ | 27,121,684 | | $ | (21,036,404 | ) | | $ | 269,555 | | | | $ | - |
| International Value | | | | | | | | | | | | | | | | | | | | |
| | | Benfield Group Plc(3) | | 11,241,209 | | $ | - | | $ | 66,529,213 | | $ | (7,840,431 | ) | | $ | - | | - | | $ | - |
| | | Total(2) | | | | $ | - | | $ | 66,529,213 | | $ | (7,840,431 | ) | | $ | - | | | | $ | - |
| Mid Cap | | | | | | | | | | | | | | | | | | | | | | |
| | | Intermec, Inc.(3)(5) | | 3,481,619 | | $ | 35,991 | | $ | 88,918,810 | | $ | (42,928,022 | ) | | $ | - | | - | | $ | - |
| | | Total(2) | | | | $ | 35,991 | | $ | 88,918,810 | | $ | (42,928,022 | ) | | $ | - | | | | $ | - |
| Mid Cap Value | | | | | | | | | | | | | | | | | | | | | | |
| | | Acuity Brands, Inc. | | 2,806,700 | | $ | 16,040,184 | | $ | 42,802,434 | | $ | (13,641,283 | ) | | $ | 1,221,923 | | 2,418,315 | | $ | 77,893,926 |
| | | Alleghany Corporation(4)(5) | | 353,575 | | | 31,021,250 | | | 448,470 | | | (89,350 | ) | | | - | | 475,576 | | | 123,197,963 |
| | | Con-way Inc.(3) | | 2,001,900 | | | 6,117,254 | | | 96,740,193 | | | (30,525,280 | ) | | | 496,390 | | - | | | - |
| | | Rent-A-Center, Inc.(3)(5) | | 2,455,300 | | | 159,079 | | | 48,647,155 | | | (4,748,653 | ) | | | - | | - | | | - |
| | | Thor Industries, Inc.(3) | | 2,682,100 | | | 11,713,158 | | | 99,950,592 | | | (28,366,621 | ) | | | 747,694 | | - | | | - |
| | | Total(2) | | | | $ | 65,050,925 | | $ | 288,588,844 | | $ | (77,371,187 | ) | | $ | 2,466,007 | | | | $ | 201,091,889 |
| Small Cap Value | | | | | | | | | | | | | | | | | | | | |
| | | Acuity Brands, Inc. | | 1,000,800 | | $ | 2,999,032 | | $ | 10,244,579 | | $ | (3,274,206 | ) | | $ | 452,257 | | 897,200 | | $ | 28,898,812 |
| | | AMN Healthcare Services, Inc.(5) | | 2,009,800 | | | 1,666,325 | | | - | | | - | | | | - | | 2,231,300 | | | 21,219,663 |
| | | Con-way Inc.(3) | | 572,700 | | | 525,327 | | | 23,059,398 | | | (6,595,903 | ) | | | 145,210 | | - | | | - |
| | | Cross Country Healthcare, Inc.(5) | | 2,155,000 | | | 1,049,335 | | | 2,506,381 | | | (1,251,801 | ) | | | - | | 2,147,700 | | | 19,995,087 |
| | | Diamond Management & Technology Consultants, Inc. | | 1,897,400 | | | 562,758 | | | 3,775,652 | | | (1,616,718 | ) | | | 906,507 | | 1,658,000 | | | 11,357,300 |
| | | Hudson Highland Group, Inc.(3)(5) | | 1,563,500 | | | 168,525 | | | 6,145,502 | | | (4,745,036 | ) | | | - | | 1,220,200 | | | 3,709,408 |
| | | Intevac, Inc.(3)(5) | | 1,139,100 | | | - | | | 19,123,211 | | | (13,936,965 | ) | | | - | | - | | | - |
| | | Kforce Inc.(3)(5) | | 2,284,400 | | | 1,677,648 | | | 9,947,899 | | | (1,913,076 | ) | | | - | | 1,741,662 | | | 20,934,777 |
| | | Manhattan Associates, Inc.(5) | | 1,244,700 | | | 5,708,642 | | | 833,177 | | | (373,692 | ) | | | - | | 1,503,300 | | | 30,366,660 |
| | | Medical Staffing Network Holdings, Inc.(5) | | 1,760,100 | | | 2,272 | | | 1,538,099 | | | (1,505,617 | ) | | | - | | 1,577,900 | | | 867,845 |
| | | MicroStrategy Incorporated, Class A(3)(5) | | 462,000 | | | 2,709,888 | | | 833,799 | | | (448,353 | ) | | | - | | 503,700 | | | 36,034,698 |
| | | National Dentex Corporation(3)(5) | | 415,800 | | | 2,381 | | | 2,816,107 | | | (2,079,089 | ) | | | - | | 257,300 | | | 2,192,196 |
| | | Orbotech, Ltd.(5) | | 2,635,500 | | | 1,081,966 | | | 13,407,400 | | | (8,081,525 | ) | | | - | | 2,243,779 | | | 21,214,931 |
| | | Quanex Building Products Corporation(4) | | 1,838,375 | | | 2,951,936 | | | 762,973 | | | (388,080 | ) | | | 235,221 | | 2,030,475 | | | 29,157,621 |
| | | RadiSys Corporation(4)(5) | | 873,800 | | | 4,117,632 | | | 1,948,714 | | | (624,331 | ) | | | - | | 1,294,500 | | | 11,249,205 |
| | | Rent-A-Center, Inc.(3)(5) | | 1,638,400 | | | 10,777,503 | | | 26,254,217 | | | (2,154,829 | ) | | | - | | 955,785 | | | 18,045,221 |
| | | Rudolph Technologies, Inc.(5) | | 1,771,000 | | | 884,634 | | | - | | | - | | | | - | | 1,922,600 | | | 14,227,240 |
| | | Sanderson Farms, Inc.(3) | | 1,045,200 | | | 3,818,972 | | | 27,248,878 | | | 7,429,525 | | | | 379,638 | | 277,300 | | | 10,437,572 |
| | | SI International Inc.(3)(5) | | 834,500 | | | - | | | 23,787,932 | | | 1,012,327 | | | | - | | - | | | - |
| | | Stewart Information Services Corporation | | 1,447,400 | | | 6,828,324 | | | 26,856,781 | | | (9,265,736 | ) | | | 138,810 | | 1,120,678 | | | 13,862,787 |
| | | Thor Industries, Inc.(3) | | 1,019,300 | | | 415,654 | | | 30,663,307 | | | (6,124,565 | ) | | | 288,694 | | - | | | - |
80
NOTES TO FINANCIAL STATEMENTS
| | | | | | | | | | | | | | | | | | | | | | |
| | | | | As of
9/30/08 | | | | | | | | | | | As of 9/30/09 |
| Fund | | Security | | Share
Balance | | Purchase
Cost | | Sales
Cost | | Net
Realized
Gain (Loss) | | | Dividend
Income(1) | | Share
Balance | | Value |
| | | Ultra Clean Holdings, Inc.(5) | | 1,327,900 | | $ | 503,833 | | $ | - | | $ | - | | | $ | - | | 1,455,900 | | $ | 7,512,444 |
| | | Ultratech, Inc.(5) | | 1,176,300 | | | 2,984,142 | | | 205,038 | | | (18,430 | ) | | | - | | 1,434,300 | | | 18,975,789 |
| | | Total(2) | | | | $ | 51,436,729 | | $ | 231,959,044 | | $ | (55,956,100 | ) | | $ | 2,546,337 | | | | $ | 228,905,384 |
| (1) | Net of foreign taxes withheld, if any. |
| (2) | Total value as of September 30, 2009 is presented for only those issuers that were affiliates as of September 30, 2009. |
| (3) | Issuer was no longer an affiliate as of September 30, 2009. |
| (4) | Issuer was not an affiliate as of September 30, 2008. |
| (5) | Non-income producing security. |
| (7) | Information for Federal income tax purposes: |
For Federal income tax purposes, the cost of investments, gross unrealized appreciation, gross unrealized depreciation and net unrealized appreciation on investments as of September 30, 2009 were as follows:
| | | | | | | | | | | | | |
| Fund | | Cost of
Investments | | Gross Unrealized
Appreciation | | Gross
Unrealized
Depreciation | | | Net
Unrealized
Appreciation on
Investments |
Global Value | | $ | 24,560,027 | | $ | 4,526,816 | | $ | (278,081 | ) | | $ | 4,248,735 |
International | | | 9,456,868,050 | | | 1,815,393,842 | | | (593,336,207 | ) | | | 1,222,057,635 |
International Small Cap | | | 586,639,096 | | | 145,177,478 | | | (41,556,578 | ) | | | 103,620,900 |
International Value | | | 1,873,844,745 | | | 175,164,704 | | | (40,897,667 | ) | | | 134,267,037 |
Mid Cap | | | 3,517,424,049 | | | 828,335,538 | | | (194,675,764 | ) | | | 633,659,774 |
Mid Cap Value | | | 4,301,533,643 | | | 497,815,300 | | | (159,936,326 | ) | | | 337,878,974 |
Opportunistic Growth | | | 39,393,459 | | | 7,231,042 | | | (97,012 | ) | | | 7,134,030 |
Opportunistic Value | | | 185,015,798 | | | 13,338,639 | | | (12,153,907 | ) | | | 1,184,732 |
Small Cap | | | 348,862,695 | | | 91,991,290 | | | (3,829,846 | ) | | | 88,161,444 |
Small Cap Value | | | 2,140,245,496 | | | 236,645,116 | | | (222,868,887 | ) | | | 13,776,229 |
The difference between cost of investments for financial reporting and cost of investments for Federal income tax purposes was due primarily to timing differences in recognizing certain gains and losses on security transactions (e.g., wash sale loss deferrals and passive foreign investment company transactions).
The tax characterization of ordinary income dividends and long-term capital gain distributions paid during the year ended September 30, 2009 and the year ended September 30, 2008 were as follows:
| | | | | | | | | | | | | | | | | | | |
| | | Year Ended 9/30/09 | | | | Year Ended 9/30/08 | |
| Fund | | Ordinary
Income
Dividends | | Long-Term
Capital Gain
Distributions | | Tax Return
of Capital
Distributions | | | | Ordinary
Income
Dividends | | | Long-Term
Capital Gain
Distributions | |
Global Value | | $ | 120,537 | | $ | - | | $ | - | | | | $ | - | (1) | | $ | - | (1) |
International | | | 168,596,974 | | | 318,081,129 | | | - | | | | | 361,370,744 | | | | 2,098,971,481 | |
81
NOTES TO FINANCIAL STATEMENTS
| | | | | | | | | | | | | | | | | | | |
| | | Year Ended 9/30/09 | | | | Year Ended 9/30/08 | |
| Fund | | Ordinary
Income
Dividends | | Long-Term
Capital Gain
Distributions | | Tax Return
of Capital
Distributions | | | | Ordinary
Income
Dividends | | | Long-Term
Capital Gain
Distributions | |
International Small Cap | | $ | 8,262,565 | | $ | 6,812,109 | | $ | - | | | | $ | 35,072,445 | | | $ | 143,355,129 | |
International Value | | | 12,538,190 | | | - | | | - | | | | | 75,430,570 | | | | 56,114,817 | |
Mid Cap | | | - | | | 46,112,826 | | | - | | | | | 127,054,050 | | | | 878,662,613 | |
Mid Cap Value | | | 4,665,242 | | | 23,959,223 | | | - | | | | | 133,648,047 | | | | 229,060,087 | |
Opportunistic Growth | | | - | | | - | | | - | | | | | - | (2) | | | - | (2) |
Opportunistic Value | | | 2,058,250 | | | - | | | - | | | | | 17,623,743 | | | | 3,914,935 | |
Small Cap | | | - | | | - | | | 665,408 | | | | | 30,590,323 | | | | 72,684,961 | |
Small Cap Value | | | 19,312 | | | 41,854,263 | | | - | | | | | 101,945,017 | | | | 237,542,428 | |
| (1) | For the period from commencement of operations (December 10, 2007) through September 30, 2008. |
| (2) | For the period from commencement of operations (September 22, 2008) through September 30, 2008. |
Ordinary income dividends and long-term capital gain distributions were determined in accordance with income tax regulations that may differ from U.S. generally accepted accounting principles. These differences were due to differing treatments for items such as net short-term gains, wash sale loss deferrals, passive foreign investment company transactions, foreign currency transactions, net investment losses and post-October losses. Gains on redemptions-in-kind for International Fund of $37,855,006 and Mid Cap Fund of $1,020,536 were included in net realized gain (loss) on investments in the Statement of Operations for the period ended September 30, 2009, and were not recognized for Federal income tax purposes.
Additional tax information as of and for the year ended September 30, 2009 follows:
| | | | | | | | | |
| | | Undistributed
Ordinary Income | | Undistributed
Long-Term Gain | | Post-October
Losses |
Global Value | | $ | 689,180 | | $ | - | | $ | 1,454,259 |
International | | | 129,070,165 | | | - | | | 1,743,954,947 |
International Small Cap | | | 4,969,618 | | | - | | | 91,175,656 |
International Value | | | 40,471,520 | | | - | | | 100,777,481 |
Mid Cap | | | - | | | - | | | 623,684,822 |
Mid Cap Value | | | 19,078,639 | | | - | | | 293,694,457 |
Opportunistic Growth | | | - | | | - | | | 388,671 |
Opportunistic Value | | | 341,609 | | | - | | | 58,295,184 |
Small Cap | | | - | | | - | | | 178,632,090 |
Small Cap Value | | | 2,582,903 | | | - | | | 107,261,562 |
82
NOTES TO FINANCIAL STATEMENTS
As of September 30, 2009, the Funds had capital loss carryovers as follows:
| | | | | |
| | | Net Capital
Loss Carryover | | Expiration |
Global Value | | $ | 237,042 | | 2017 |
International | | | 846,687,411 | | 2017 |
International Small Cap | | | 42,384,176 | | 2017 |
International Value | | | 21,273,231 | | 2017 |
Mid Cap | | | 133,629,309 | | 2017 |
Mid Cap Value | | | 63,364,689 | | 2017 |
Opportunistic Growth | | | 199,888 | | 2017 |
Opportunistic Value | | | 35,503,974 | | 2017 |
Small Cap | | | 89,964,498 | | 2017 |
Small Cap Value | | | 22,928,816 | | 2017 |
83
NOTES TO FINANCIAL STATEMENTS
| (8) | Fund share activities: |
Capital share transactions for the Funds were as follows:
| | | | | | | | | | | | | | | | |
| | | GLOBAL
VALUE | | | INTERNATIONAL | | | INTERNATIONAL
SMALL CAP | |
Year ended September 30, 2009 | | Investor
Shares | | | Investor
Shares | | | Institutional
Shares | | | Investor
Shares | |
Proceeds from shares issued | | $ | 19,624,420 | | | $ | 1,592,516,571 | | | $ | 172,950,986 | | | $ | 176,434,127 | |
Net asset value of shares issued in reinvestment of dividends and distributions | | | 119,040 | | | | 331,783,610 | | | | 136,080,351 | | | | 14,306,941 | |
Cost of shares redeemed(1) | | | (5,362,265 | ) | | | (2,620,368,565 | ) | | | (433,419,290 | ) | | | (292,920,541 | ) |
| | | | | | | | | | | | | | | | |
Net increase (decrease) from fund share transactions | | $ | 14,381,195 | | | $ | (696,068,384 | ) | | $ | (124,387,953 | ) | | $ | (102,179,473 | ) |
| | | | | | | | | | | | | | | | |
| | | | |
Shares sold | | | 2,913,263 | | | | 102,961,075 | | | | 11,471,176 | | | | 14,930,821 | |
Shares issued in reinvestment of dividends and distributions | | | 17,454 | | | | 22,089,455 | | | | 9,017,916 | | | | 1,308,961 | |
Shares redeemed | | | (767,349 | ) | | | (173,003,712 | ) | | | (25,335,842 | ) | | | (25,771,244 | ) |
| | | | | | | | | | | | | | | | |
Net increase (decrease) in capital shares | | | 2,163,368 | | | | (47,953,182 | ) | | | (4,846,750 | ) | | | (9,531,462 | ) |
| | | | | | | | | | | | | | | | |
| | | |
| | | GLOBAL
VALUE | | | INTERNATIONAL | | | INTERNATIONAL
SMALL CAP | |
Year ended September 30, 2008 | | Investor
Shares(2) | | | Investor
Shares | | | Institutional
Shares | | | Investor
Shares | |
Proceeds from shares issued | | $ | 12,217,315 | | | $ | 2,769,106,273 | | | $ | 154,759,460 | | | $ | 338,978,430 | |
Net asset value of shares issued in reinvestment of dividends and distributions | | | - | | | | 1,711,689,210 | | | | 659,043,481 | | | | 168,476,300 | |
Cost of shares redeemed(1) | | | (1,227,950 | ) | | | (2,910,764,948 | ) | | | (814,639,751 | ) | | | (454,056,544 | ) |
| | | | | | | | | | | | | | | | |
Net increase (decrease) from fund share transactions | | $ | 10,989,365 | | | $ | 1,570,030,535 | | | $ | (836,810 | ) | | $ | 53,398,186 | |
| | | | | | | | | | | | | | | | |
| | | | |
Shares sold | | | 1,289,375 | | | | 99,755,202 | | | | 5,745,726 | | | | 15,891,243 | |
Shares issued in reinvestment of dividends and distributions | | | - | | | | 59,207,513 | | | | 22,647,542 | | | | 7,514,554 | |
Shares redeemed | | | (139,715 | ) | | | (107,847,385 | ) | | | (28,563,145 | ) | | | (22,390,636 | ) |
| | | | | | | | | | | | | | | | |
Net increase (decrease) in capital shares | | | 1,149,660 | | | | 51,115,330 | | | | (169,877 | ) | | | 1,015,161 | |
| | | | | | | | | | | | | | | | |
| (1) | Net of redemption fees of: |
| | | | | | |
| Fund | | 9/30/2009 | | 9/30/2008 |
Global Value - Investor Shares | | $ | 9,174 | | $ | 614 |
International - Investor Shares | | | 940,168 | | | 1,068,938 |
International - Institutional Shares | | | 357,772 | | | 381,010 |
International Small Cap - Investor Shares | | | 84,469 | | | 78,867 |
International Value - Investor Shares | | | 604,391 | | | 76,325 |
International Value - Institutional Shares | | | 107,009 | | | 13,231 |
| (2) | For the period from commencement of operations (December 10, 2007) through September 30, 2008. |
| (3) | For the period from commencement of operations (September 22, 2008) through September 30, 2008. |
84
NOTES TO FINANCIAL STATEMENTS
| | | | | | | | | | | | | | | | | | | | | | | | | | | | | | | | | | |
| INTERNATIONAL VALUE | | | MID CAP | | | MID CAP
VALUE | | | OPPORTUNISTIC
GROWTH | | | OPPORTUNISTIC
VALUE | | | SMALL CAP | | | SMALL CAP
VALUE | |
Investor
Shares | | | Institutional
Shares | | | Investor
Shares | | | Institutional
Shares | | | Investor
Shares | | | Investor
Shares | | | Investor
Shares | | | Investor
Shares | | | Investor
Shares | |
| $ | 998,478,418 | | | $ | 89,768,173 | | | $ | 736,881,835 | | | $ | 40,963,051 | | | $ | 2,001,278,772 | | | $ | 36,443,180 | | | $ | 77,642,687 | | | $ | 127,203,222 | | | $ | 663,675,871 | |
| | 9,494,289 | | | | 1,837,654 | | | | 40,618,187 | | | | 5,181,307 | | | | 27,732,642 | | | | - | | | | 2,040,180 | | | | 591,391 | | | | 41,643,045 | |
| | (442,674,211 | ) | | | (22,279,861 | ) | | | (787,631,410 | ) | | | (121,601,275 | ) | | | (836,787,242 | ) | | | (3,386,957 | ) | | | (104,111,914 | ) | | | (223,553,618 | ) | | | (428,932,485 | ) |
| | | | | | | | | | | | | | | | | | | | | | | | | | | | | | | | | | | |
| $ | 565,298,496 | | | $ | 69,325,966 | | | $ | (10,131,388 | ) | | $ | (75,456,917 | ) | | $ | 1,192,224,172 | | | $ | 33,056,223 | | | $ | (24,429,047 | ) | | $ | (95,759,005 | ) | | $ | 276,386,431 | |
| | | | | | | | | | | | | | | | | | | | | | | | | | | | | | | | | | | |
| | | | | | | | |
| | 52,470,821 | | | | 4,662,123 | | | | 38,015,250 | | | | 2,178,933 | | | | 146,741,963 | | | | 4,790,702 | | | | 11,576,435 | | | | 12,593,776 | | | | 60,531,651 | |
| | 527,754 | | | | 102,319 | | | | 2,392,119 | | | | 297,093 | | | | 2,180,239 | | | | - | | | | 322,303 | | | | 63,659 | | | | 4,189,441 | |
| | (25,344,403 | ) | | | (1,262,697 | ) | | | (43,513,929 | ) | | | (6,036,669 | ) | | | (64,200,797 | ) | | | (414,267 | ) | | | (16,422,436 | ) | | | (23,451,871 | ) | | | (42,194,212 | ) |
| | | | | | | | | | | | | | | | | | | | | | | | | | | | | | | | | | | |
| | 27,654,172 | | | | 3,501,745 | | | | (3,106,560 | ) | | | (3,560,643 | ) | | | 84,721,405 | | | | 4,376,435 | | | | (4,523,698 | ) | | | (10,794,436 | ) | | | 22,526,880 | |
| | | | | | | | | | | | | | | | | | | | | | | | | | | | | | | | | | | |
| | | | | | |
| INTERNATIONAL VALUE | | | MID CAP | | | MID CAP
VALUE | | | OPPORTUNISTIC
GROWTH | | | OPPORTUNISTIC
VALUE | | | SMALL CAP | | | SMALL CAP
VALUE | |
Investor
Shares | | | Institutional
Shares | | | Investor
Shares | | | Institutional
Shares | | | Investor
Shares | | | Investor
Shares(3) | | | Investor
Shares | | | Investor
Shares | | | Investor
Shares | |
| $ | 303,006,196 | | | $ | 50,740,000 | | | $ | 1,053,457,971 | | | $ | 18,291,682 | | | $ | 1,282,164,200 | | | $ | 6,064,467 | | | $ | 134,089,246 | | | $ | 114,409,460 | | | $ | 497,079,274 | |
| | 98,499,399 | | | | 15,729,244 | | | | 874,718,712 | | | | 120,999,695 | | | | 353,880,575 | | | | - | | | | 21,453,072 | | | | 88,840,327 | | | | 336,773,337 | |
| | (592,204,517 | ) | | | (34,673,009 | ) | | | (1,467,033,037 | ) | | | (102,000,633 | ) | | | (1,053,149,242 | ) | | | - | | | | (118,108,405 | ) | | | (394,430,741 | ) | | | (609,539,934 | ) |
| | | | | | | | | | | | | | | | | | | | | | | | | | | | | | | | | | | |
| $ | (190,698,922 | ) | | $ | 31,796,235 | | | $ | 461,143,646 | | | $ | 37,290,744 | | | $ | 582,895,533 | | | $ | 6,064,467 | | | $ | 37,433,913 | | | $ | (191,180,954 | ) | | $ | 224,312,677 | |
| | | | | | | | | | | | | | | | | | | | | | | | | | | | | | | | | | | |
| | | | | | | | |
| | 12,372,002 | | | | 1,981,408 | | | | 33,783,896 | | | | 611,019 | | | | 69,665,295 | | | | 607,693 | | | | 13,272,801 | | | | 7,289,087 | | | | 34,187,741 | |
| | 3,939,976 | | | | 629,926 | | | | 28,651,121 | | | | 3,870,752 | | | | 19,573,041 | | | | - | | | | 2,084,847 | | | | 5,335,755 | | | | 24,653,978 | |
| | (23,733,942 | ) | | | (1,513,600 | ) | | | (50,970,079 | ) | | | (3,530,702 | ) | | | (56,912,215 | ) | | | - | | | | (11,319,002 | ) | | | (25,799,968 | ) | | | (40,922,503 | ) |
| | | | | | | | | | | | | | | | | | | | | | | | | | | | | | | | | | | |
| | (7,421,964 | ) | | | 1,097,734 | | | | 11,464,938 | | | | 951,069 | | | | 32,326,121 | | | | 607,693 | | | | 4,038,646 | | | | (13,175,126 | ) | | | 17,919,216 | |
| | | | | | | | | | | | | | | | | | | | | | | | | | | | | | | | | | | |
85
NOTES TO FINANCIAL STATEMENTS
Artisan Funds and the Adviser were defendants in a lawsuit filed in the Circuit Court of the Third Judicial Circuit, Madison County, Illinois that sought certification of a plaintiff class consisting of all persons in the United States who held shares in International Fund for a period of more than 14 days during the five year period prior to the filing of the lawsuit in September 2003. The basic allegations in the case were that Artisan Funds and the Adviser did not make appropriate price adjustments to the foreign securities owned by International Fund prior to calculating the Fund’s NAV, thereby allegedly enabling market timing traders to trade the Fund’s shares in such a way as to disadvantage long-term investors. Following years of procedural litigation in state and federal courts, the case was resolved and dismissed with prejudice in May 2008.
Certain legal fees incurred by Artisan Funds in defense of the lawsuit prior to its resolution and related insurance recoveries of $219,395 have been allocated to International Fund and were included in professional fees in the Statements of Operations. The resolution of the lawsuit did not have a material effect on the financial condition or results of operations of any Fund.
| (10) | Recent Accounting Pronouncements: |
In March 2008, the FASB updated the accounting standards for disclosures about derivative instruments and hedging activities. The standard requires enhanced disclosure relating to an entity’s use of derivatives, how derivatives are accounted for, and how derivative instruments affect an entity’s results of operations and financial position. This standard was issued and is effective for fiscal years and interim reporting periods beginning after November 15, 2008. The Funds adopted this standard on April 1, 2009. The Funds have evaluated the implications of this standard and have determined there is no impact to the Funds’ September 30, 2009 financial statement disclosures.
In May 2009, the FASB updated the accounting standards on the recognition and disclosure of subsequent events. The standard requires the disclosure of the date through which subsequent events were evaluated. This standard was issued and is effective for interim or annual reporting periods ending after June 15, 2009, and applied prospectively. The Funds have evaluated subsequent events through the issuance of the Funds’ financial statements on November 19, 2009 and have determined there is no impact to the Funds’ financial statements.
86
Report of Independent Registered Public Accounting Firm
To the Board of Directors and Shareholders of Artisan Funds, Inc.
We have audited the accompanying statements of assets and liabilities, including the schedules of investments, of Artisan Global Value Fund, Artisan International Fund, Artisan International Small Cap Fund, Artisan International Value Fund, Artisan Mid Cap Fund, Artisan Mid Cap Value Fund, Artisan Opportunistic Growth Fund, Artisan Opportunistic Value Fund, Artisan Small Cap Fund, and Artisan Small Cap Value Fund (ten of eleven portfolios constituting Artisan Funds, Inc.) (the “Funds”) as of September 30, 2009, and the related statements of operations for the year then ended, the statements of changes in net assets for each of the two years in the period then ended, and the financial highlights for each of the periods indicated therein. These financial statements and financial highlights are the responsibility of the Funds’ management. Our responsibility is to express an opinion on these financial statements and financial highlights based on our audits.
We conducted our audits in accordance with the standards of the Public Company Accounting Oversight Board (United States). Those standards require that we plan and perform the audit to obtain reasonable assurance about whether the financial statements and financial highlights are free of material misstatement. We were not engaged to perform an audit of the Funds’ internal control over financial reporting. Our audits included consideration of internal control over financial reporting as a basis for designing audit procedures that are appropriate in the circumstances, but not for the purpose of expressing an opinion on the effectiveness of the Funds’ internal control over financial reporting. Accordingly, we express no such opinion. An audit also includes examining, on a test basis, evidence supporting the amounts and disclosures in the financial statements and financial highlights, assessing the accounting principles used and significant estimates made by management, and evaluating the overall financial statement presentation. Our procedures included confirmation of securities owned as of September 30, 2009, by correspondence with the custodian and brokers or by other appropriate auditing procedures where replies from brokers were not received. We believe that our audits provide a reasonable basis for our opinion.
In our opinion, the financial statements and financial highlights referred to above present fairly, in all material respects, the financial position of Artisan Global Value Fund, Artisan International Fund, Artisan International Small Cap Fund, Artisan International Value Fund, Artisan Mid Cap Fund, Artisan Mid Cap Value Fund, Artisan Opportunistic Growth Fund, Artisan Opportunistic Value Fund, Artisan Small Cap Fund, and Artisan Small Cap Value Fund of Artisan Funds, Inc. at September 30, 2009, the results of their operations for the year then ended, the changes in their net assets for each of the two years in the period then ended, and the financial highlights for each of the periods indicated therein, in conformity with U.S. generally accepted accounting principles.

Chicago, Illinois
November 19, 2009
87
NOTES TO FINANCIAL STATEMENTS
Other Federal tax information (unaudited):
The Internal Revenue Code requires that shareholders be notified within 60 days of the Funds’ fiscal year-end of certain information regarding long-term capital gains, qualified dividend income and the dividends received deduction for corporate shareholders. This data is informational only. Every year in January, shareholders are sent a Form 1099-DIV which provides the federal tax status of dividends and distributions received during the calendar year. Shareholders are advised to consult their own tax advisor with respect to the specific tax consequences of investment in the Funds.
Each Fund hereby designates the following amounts as (i) long-term capital gain distributions for purposes of the dividends paid deduction (including earnings and profits distributed to shareholders on redemption of Fund shares), (ii) the amount of ordinary dividends paid during the fiscal year ended September 30, 2009 that are considered qualified dividend income as defined in the Jobs and Growth Tax Relief Reconciliation Act of 2003, and (iii) the amount of ordinary dividends paid during the fiscal year ended September 30, 2009 that are eligible for the dividends received deduction available to certain corporate shareholders.
| | | | | | | | | |
| Fund | | Long-Term Capital Gains | | Qualified Dividend Income | | | Dividends Received Deduction | |
Global Value | | $ | - | | 93.00 | % | | 41.39 | % |
International | | | 318,081,129 | | 100.00 | | | - | |
International Small Cap | | | 6,812,109 | | 100.00 | | | - | |
International Value | | | - | | 85.04 | | | - | |
Mid Cap | | | 46,112,826 | | - | | | - | |
Mid Cap Value | | | 23,959,223 | | 94.60 | | | 88.46 | |
Opportunistic Growth | | | - | | - | | | - | |
Opportunistic Value | | | - | | 85.03 | | | 65.63 | |
Small Cap | | | - | | - | | | - | |
Small Cap Value | | | 41,854,263 | | - | | | - | |
88
SHAREHOLDER EXPENSE EXAMPLE (UNAUDITED)
As a shareholder of Artisan Funds, you may incur transaction costs, including redemption fees, and you will incur ongoing costs, including management fees and other Fund expenses. This example is intended to help you understand your ongoing costs (in dollars) of investing in a Fund and to compare these costs with the ongoing costs of investing in other mutual funds.
The example is based on an investment of $1,000 invested at the beginning of the period and held for the entire period from April 1, 2009 to September 30, 2009.
Actual Expenses
The first line under the name of each Fund in the table below provides information about actual account values and actual expenses. You may use the information in this line, together with the amount you invested, to estimate the expenses that you paid over the period. Simply divide your account value by $1,000 (for example, an $8,600 account value divided by $1,000 = 8.6), then multiply the result by the number in the first line under the name of your Fund under the heading entitled “Expenses Paid During Period” to estimate the expenses you paid on your account during this period.
Hypothetical Example for Comparison Purposes
The second line below each Fund’s name in the table below provides information about hypothetical account values and hypothetical expenses based on each Fund’s actual expense ratio for the six months ended September 30, 2009 and an assumed rate of return of 5% per year before expenses, which is not the Fund’s actual return. The hypothetical account values and expenses may not be used to estimate the actual ending account balances or expenses you paid for the period. You may use this information to compare the ongoing costs of investing in each Fund and other funds. To do so, compare the 5% hypothetical example with the 5% hypothetical examples that appear in the shareholder reports of the other funds.
Please note that the expenses shown in the table are meant to highlight your ongoing costs only and do not reflect any transactional costs, such as redemption fees. Therefore, the second line of the table is useful in comparing ongoing costs only, and will not help you determine the relative costs of owning different funds. If these transactional costs were included, your costs would have been higher.
| | | | | | | | | |
| | | Beginning
Account Value
4/1/2009 | | Ending
Account Value
9/30/2009 | | Expenses Paid During
Period
4/1/2009-9/30/2009(1) |
Artisan Global Value Fund - Investor Shares | | | | | | | | | |
Actual | | $ | 1,000.00 | | $ | 1,457.00 | | $ | 9.24 |
Hypothetical (5% return before expenses) | | $ | 1,000.00 | | $ | 1,017.55 | | $ | 7.59 |
Artisan International Fund - Investor Shares | | | | | | | | | |
Actual | | $ | 1,000.00 | | $ | 1,495.50 | | $ | 7.63 |
Hypothetical (5% return before expenses) | | $ | 1,000.00 | | $ | 1,018.95 | | $ | 6.17 |
Artisan International Small Cap Fund - Investor Shares | | | | | | | | | |
Actual | | $ | 1,000.00 | | $ | 1,634.90 | | $ | 9.91 |
Hypothetical (5% return before expenses) | | $ | 1,000.00 | | $ | 1,017.55 | | $ | 7.59 |
89
SHAREHOLDER EXPENSE EXAMPLE (UNAUDITED)
| | | | | | | | | |
| | | Beginning
Account Value
4/1/2009 | | Ending
Account Value
9/30/2009 | | Expenses Paid During
Period
4/1/2009-9/30/2009(1) |
Artisan International Value Fund - Investor Shares | | | | | | | | | |
Actual | | $ | 1,000.00 | | $ | 1,492.20 | | $ | 7.81 |
Hypothetical (5% return before expenses) | | $ | 1,000.00 | | $ | 1,018.80 | | $ | 6.33 |
Artisan Mid Cap Fund - Investor Shares | | | | | | | | | |
Actual | | $ | 1,000.00 | | $ | 1,400.20 | | $ | 7.40 |
Hypothetical (5% return before expenses) | | $ | 1,000.00 | | $ | 1,018.90 | | $ | 6.23 |
Artisan Mid Cap Value Fund - Investor Shares | | | | | | | | | |
Actual | | $ | 1,000.00 | | $ | 1,410.00 | | $ | 7.31 |
Hypothetical (5% return before expenses) | | $ | 1,000.00 | | $ | 1,019.00 | | $ | 6.12 |
Artisan Opportunistic Growth Fund - Investor Shares | | | | | | | | | |
Actual | | $ | 1,000.00 | | $ | 1,380.70 | | $ | 8.77 |
Hypothetical (5% return before expenses) | | $ | 1,000.00 | | $ | 1,017.70 | | $ | 7.44 |
Artisan Opportunistic Value Fund - Investor Shares | | | | | | | | | |
Actual | | $ | 1,000.00 | | $ | 1,400.00 | | $ | 7.94 |
Hypothetical (5% return before expenses) | | $ | 1,000.00 | | $ | 1,018.45 | | $ | 6.68 |
Artisan Small Cap Fund - Investor Shares | | | | | | | | | |
Actual | | $ | 1,000.00 | | $ | 1,513.50 | | $ | 7.94 |
Hypothetical (5% return before expenses) | | $ | 1,000.00 | | $ | 1,018.75 | | $ | 6.38 |
Artisan Small Cap Value Fund - Investor Shares | | | | | | | | | |
Actual | | $ | 1,000.00 | | $ | 1,490.10 | | $ | 7.62 |
Hypothetical (5% return before expenses) | | $ | 1,000.00 | | $ | 1,018.95 | | $ | 6.17 |
| (1) | Expenses are equal to the Fund’s ratio of expenses to average net assets for the six-month period ended September 30, 2009 (shown below), multiplied by the average account value over the period, multiplied by 183/365 (to reflect the one-half year period). |
| | | |
| Fund | | Annualized Ratio of Expenses to Average
Net Assets for the Six-Month
Period Ended September 30, 2009 | |
Artisan Global Value Fund - Investor Shares(a) | | 1.50 | % |
Artisan International Fund - Investor Shares | | 1.22 | % |
Artisan International Small Cap Fund - Investor Shares | | 1.50 | % |
Artisan International Value Fund - Investor Shares | | 1.25 | % |
Artisan Mid Cap Fund - Investor Shares | | 1.23 | % |
Artisan Mid Cap Value Fund - Investor Shares | | 1.21 | % |
Artisan Opportunistic Growth Fund - Investor Shares(a) | | 1.47 | % |
Artisan Opportunistic Value Fund - Investor Shares | | 1.32 | % |
Artisan Small Cap Fund - Investor Shares | | 1.26 | % |
Artisan Small Cap Value Fund - Investor Shares | | 1.22 | % |
| (a) | The annualized ratio of expenses to average net assets excludes expenses waived or paid by the Adviser or board of directors. |
90
NOTES ON MANAGEMENT’S DISCUSSION OF FUND PERFORMANCE AND PORTFOLIO HOLDINGS’ CLASSIFICATION
The discussions of each Fund included in this report include statistical information about the portfolios of each of the Funds. Except as otherwise noted, that information is as of September 30, 2009. That information will vary with changes in a Fund’s portfolio investments. The performance information for each Fund relative to its benchmark index discussed in this report was prepared by the Adviser using information reported by FactSet Databases (“FactSet”). For the purposes of assigning portfolio securities to a particular country, the Adviser considers an issuer to be from a particular country as designated by its securities information vendors. The Adviser currently uses MSCI Inc. as its primary source and FactSet as a secondary source for this information. In the event (i) the Adviser’s securities information vendors do not assign a security to a particular country or if the published classification appears to be erroneous, or (ii) its primary vendor does not assign a security to a particular country and the secondary vendor has assigned a security to a particular country by using a methodology that is not the same as the methodology the primary vendor uses to assign a country, the Adviser assigns the security to a country using the primary vendor’s published criteria (to the extent available) or the Adviser’s own judgment. The primary information vendor’s criteria include the identity of the jurisdiction of the issuer’s incorporation, the main equity trading market for the issuer’s securities, the geographical distribution of the issuer’s operations and the location of the issuer’s headquarters. Country designations may change over time.
For the purposes of assigning portfolio securities to a particular sector and industry, the Adviser assigns securities in accordance with the sector and industry classifications of the Global Industry Classification Standard (GICS®) developed by MSCI Inc. and Standard & Poor’s (to the extent available) as a primary source and FactSet (to the extent available) as a secondary source for this information. In the event the Adviser’s securities information vendors do not classify a security to a particular sector or industry or if the published classification appears to be erroneous, the Adviser classifies the security according to its own judgment, using other securities information vendors, the company description and other publicly available information about the company’s peer group. Sector and industry classifications may change over time.
The names of portfolio securities reflected in this report are as reported by the Funds’ data providers, may not represent the legal name of the entity and, in some cases, are translations of non-English names.
Definitions of Portfolio Statistics
Market Capitalization is the aggregate value of all of a company’s outstanding equity securities.
Weighted Average Market Cap is the average of the market capitalizations of the companies in the portfolio weighted by the size of each company’s position within the portfolio.
Descriptions of Indices
Each Fund’s performance is compared in this report to changes in one or more indices, including in all cases a broad-based index of changes in prices of securities in the markets in which the Fund invests. All of the indices are unmanaged and their returns include reinvested dividends. Unlike the Funds’ returns, the returns of each index do not include the payment of sales commissions or other expenses that would be incurred in the purchase or sale of the securities included in that index. An investment cannot be made directly in an index. Fair value pricing is not employed by market indices.
91
NOTES ON MANAGEMENT’S DISCUSSION OF FUND PERFORMANCE AND PORTFOLIO HOLDINGS’ CLASSIFICATION
The indices to which the Funds are compared are:
Artisan Global Value Fund – Morgan Stanley Capital International All Country World IndexSM (MSCI ACWISM) is a market-weighted index of global developed and emerging markets.
Artisan International, Artisan International Small Cap and Artisan International Value Funds – Morgan Stanley Capital International EAFE® Index (MSCI EAFE®) is a market-weighted index of companies in developed markets, excluding the U.S. and Canada. MSCI EAFE®’s average annual return since inception of the International Fund is based upon a starting date of December 31, 1995.
Artisan International Fund – Morgan Stanley Capital International EAFE® Growth Index (MSCI EAFE® Growth) is a market-weighted index of companies in developed markets, excluding the U.S. and Canada, that exhibits growth investment style characteristics according to MSCI’s methodology. MSCI EAFE® Growth’s average annual return since inception of the International Fund is based upon a starting date of December 31, 1995.
Artisan International Small Cap Fund – Morgan Stanley Capital International EAFE® Small Cap Index (MSCI EAFE® Small Cap) is a market-weighted index of small companies in developed markets, excluding the U.S. and Canada.
Artisan International Value Fund – Morgan Stanley Capital International EAFE® Value Index (MSCI EAFE® Value) is a market-weighted index of companies in developed markets, excluding the U.S. and Canada, that exhibits value investment style characteristics according to MSCI’s methodology.
Artisan Mid Cap and Artisan Mid Cap Value Funds – Russell Midcap® Index is a market-weighted index of about 800 medium-sized U.S. companies.
Artisan Mid Cap Fund – Russell Midcap® Growth Index is a market-weighted index of those medium-sized companies included in the Russell Midcap® Index with higher price-to-book and higher forecasted growth values.
Artisan Mid Cap Value Fund – Russell Midcap® Value Index is a market-weighted index of those medium-sized companies included in the Russell Midcap® Index with lower price-to-book ratios and lower forecasted growth values.
Artisan Opportunistic Growth and Artisan Opportunistic Value Funds – Russell 1000® Index is a market-weighted index of about 1,000 large U.S. companies.
Artisan Opportunistic Growth Fund – Russell 1000® Growth Index is a market-weighted index of those companies included in the Russell 1000® Index with higher price-to-book ratios and higher forecasted growth values.
Artisan Opportunistic Value Fund – Russell 1000® Value Index is a market-weighted index of those large companies included in the Russell 1000® Index with lower price-to-book ratios and lower forecasted growth values.
Artisan Small Cap and Artisan Small Cap Value Funds – Russell 2000® Index is a market-weighted index of about 2,000 small U.S. companies.
Artisan Small Cap Fund – Russell 2000® Growth Index is a market-weighted index of those small companies included in the Russell 2000® Index with higher price-to-book ratios and higher forecasted growth values.
92
NOTES ON MANAGEMENT’S DISCUSSION OF FUND PERFORMANCE AND PORTFOLIO HOLDINGS’ CLASSIFICATION
Artisan Small Cap Value Fund – Russell 2000® Value Index is a market-weighted index of those small companies included in the Russell 2000® Index with lower price-to-book ratios and lower forecasted growth values.
Trademarks
Trademarks and copyrights relating to the indices and products of portfolio companies mentioned in this report are owned by their respective owners. Except as otherwise indicated, the trademarks, including names, logos, slogans and service marks appearing in this report are the property of the Adviser and may not be copied, reproduced, published or in any way used without written permission.
The Global Industry Classification Standard (“GICS”) was developed by and is the exclusive property and a service mark of MSCI Inc. (“MSCI”) and Standard & Poor’s, a division of The McGraw-Hill Companies, Inc. (“S&P”) and is licensed for use by Artisan Partners Limited Partnership. Neither MSCI, S&P nor any third party involved in making or compiling the GICS or any GICS classifications makes any express or implied warranties or representations with respect to such standard or classification (or the results to be obtained by the use thereof), and all such parties hereby expressly disclaim all warranties of originality, accuracy, completeness, merchantability and fitness for a particular purpose with respect to any of such standard or classification. Without limiting any of the foregoing, in no event shall MSCI, S&P, any of their affiliates or any third party involved in making or compiling the GICS or any GICS classifications have any liability for any direct, indirect, special, punitive, consequential or any other damages (including lost profits) even if notified of the possibility of such damages.
The MSCI information may only be used by the reader, may not be reproduced or redisseminated in any form and may not be used to create any financial instruments or products or any indices. The MSCI information is provided on an “as is” basis and the reader of this information assumes the entire risk of any use made of this information. MSCI, each of its affiliates and each other person involved in or related to compiling, computing or creating any MSCI information (collectively, the “MSCI Parties”) expressly disclaims all warranties (including, without limitation, any warranties of originality, accuracy, completeness, timeliness, non-infringement, merchantability and fitness for a particular purpose) with respect to this information. Without limiting any of the foregoing, in no event shall MSCI Parties have any liability for any direct, indirect, special, incidental, punitive, consequential (including, without limitation, lost profits) or any other damages.
Russell Investment Group is the source and owner of the Russell Index data contained or reflected in this material and all trademarks and copyrights related thereto. The presentation may contain confidential information and unauthorized use, disclosure, copying, dissemination or redistribution is strictly prohibited. This is a presentation of Artisan Funds, Inc. Russell Investment Group is not responsible for the formatting or configuration of this material or for any inaccuracy in Artisan Funds’ presentation thereof.
PROXY VOTING POLICIES AND PROCEDURES
You may obtain a description of Artisan Funds’ proxy voting policies and procedures, without charge, upon request by calling 800.344.1770. That information also is included in Artisan Funds’ statement of additional information, which is available without charge, on the Funds’ website at www.artisanfunds.com and on the Securities and Exchange Commission’s website at www.sec.gov.
93
PROXY VOTING POLICIES AND PROCEDURES
Information relating to how each Artisan Fund voted proxies relating to portfolio securities held during the twelve-month period ended June 30 is available without charge, on the Funds’ website at www.artisanfunds.com and on the Securities and Exchange Commission’s website at www.sec.gov.
INFORMATION ABOUT PORTFOLIO SECURITIES
Artisan Funds files a complete schedule of portfolio holdings with the Securities and Exchange Commission for the quarters ending December 31 and June 30 (the first and third quarters of the Funds’ fiscal year) on Form N-Q. The Funds’ Forms N-Q are available on the Securities and Exchange Commission’s website at www.sec.gov. You also may review and copy those documents by visiting the Securities and Exchange Commission’s Public Reference Room in Washington, D.C. Information on the operation of the Public Reference Room may be obtained by calling the Securities and Exchange Commission at 800.SEC.0330.
94
DIRECTORS AND OFFICERS
The board of directors has overall responsibility for the conduct of the affairs of Artisan Funds. Each director serves an indefinite term of unlimited duration until the next annual meeting of shareholders and until the election and qualification of his or her successor. The board of directors may fill any vacancy on the board provided that after such appointment at least two-thirds of the directors have been elected by the shareholders. The shareholders may remove a director by a vote of a majority of the outstanding shares of the Funds at any meeting of shareholders called for the purpose of removing such director.
The board of directors elects the officers of Artisan Funds. Each officer serves until the election and qualification of his or her successor, or until he or she sooner dies, resigns, or is removed or disqualified. The board of directors may remove any officer with or without cause at any time.
The names and ages of the directors and officers as of November 13, 2009, the position each holds with the Funds, the date each was first elected to office, their principal business occupations and other directorships they have held during the last five years are shown below. Each director oversees all eleven series of Artisan Funds.
| | | | | | | | |
| | | | | |
Name and Age at 11/13/09 | | Position(s)
Held with
Artisan Funds | | Date First Elected
or Appointed to Office | | Principal Occupation(s) during Past 5 Years | | Other Public Company or
Registered Investment
Company Directorships Held |
| Directors who are not “interested persons” of Artisan Funds: |
| David A. Erne – 66 | | Director and Independent Chair of the Board of Directors | | Director since 3/27/95; Independent Chair since 2/4/05 | | Of counsel to the law firm Reinhart Boerner Van Deuren s.c., Milwaukee, WI. | | Trustee, Northwestern Mutual Life Insurance Company (individual life insurance, disability insurance and annuity company). |
| Thomas R. Hefty – 62 | | Director | | 3/27/95 | | Retired; from January 2007 to February 2008, President, Kern Family Foundation (private, grant-making organization); until December 2006, of counsel to the law firm Reinhart Boerner Van Deuren s.c., Milwaukee, WI; until December 2006, Adjunct Faculty, Department of Business and Economics, Ripon College. | | None. |
| Jeffrey A. Joerres – 49 | | Director | | 8/9/01 | | Chairman of the Board, President and Chief Executive Officer of Manpower Inc. (non-governmental employment service organization). | | Director, Johnson Controls, Inc. (manufacturer of automotive systems and building controls). |
| Patrick S. Pittard – 63 | | Director | | 8/9/01 | | Distinguished Executive in Residence (teaching position), University of Georgia. | | Director, Cbeyond, Inc. (telecommunications company, formerly Cbeyond Communications, Inc.); Director, Lincoln National Corporation (insurance and investment management company). |
| Howard B. Witt – 69 | | Director | | 3/27/95 | | Retired; until December 2004, Chairman of the Board, President and Chief Executive Officer of Littelfuse, Inc. (manufacturer of advanced circuit protection devices). | | Director, Franklin Electric Co., Inc. (manufacturer of electric motors). |
95
DIRECTORS AND OFFICERS
| | | | | | | | |
| | | | | |
Name and Age at 11/13/09 | | Position(s)
Held with
Artisan Funds | | Date First Elected
or Appointed to Office | | Principal Occupation(s) during Past 5 Years | | Other Public Company or
Registered Investment
Company Directorships Held |
| Director who is an “interested person” of Artisan Funds: |
| Andrew A. Ziegler – 52* | | Director, President and Chief Executive Officer | | Director since 1/5/95; President since 12/19/03 (Chief Executive Officer continuously since 1/5/95) | | Managing Director of Artisan Partners. | | None. |
| Officers: |
| Lawrence A. Totsky – 50 | | Chief Financial Officer and Treasurer | | 1/22/98 | | Managing Director and Chief Financial Officer of Artisan Partners; Vice President, Chief Financial Officer and Treasurer of Artisan Distributors LLC. | | None. |
| Janet D. Olsen – 53 | | General Counsel and Secretary | | 1/18/01 | | Managing Director and General Counsel of Artisan Partners; Vice President and Secretary of Artisan Distributors LLC. | | None. |
| Brooke J. Billick – 55 | | Chief Compliance Officer | | 8/19/04 | | Chief Compliance Officer and Associate Counsel of Artisan Partners; Chief Compliance Officer of Artisan Distributors LLC. | | None. |
| Carlene M. Ziegler – 53 | | Vice President | | 3/27/95 | | Managing Director of Artisan Partners; until April 2008, Portfolio Co-Manager of Artisan small-cap growth strategy, including Artisan Small Cap Fund; until February 2005, Director of Artisan Funds. | | None. |
| Michael C. Roos – 51 | | Vice President | | 12/19/03 | | Managing Director of Artisan Partners; Vice President of Artisan Distributors LLC. | | None. |
| Gregory K. Ramirez – 39 | | Assistant Secretary and Assistant Treasurer | | 1/22/98 | | Managing Director of Artisan Partners; Assistant Treasurer of Artisan Distributors LLC. | | None. |
| Sarah A. Johnson – 37 | | Assistant Secretary | | 2/5/03 | | Associate Counsel of Artisan Partners. | | None. |
| * | Mr. Ziegler is an “interested person” of Artisan Funds, as defined in the Investment Company Act of 1940, because he is a Managing Director of Artisan Partners and an officer of Artisan Investments GP LLC (the general partner of Artisan Partners). Mr. Ziegler and Carlene M. Ziegler (who are married to each other) control Artisan Partners. |
96
DIRECTORS AND OFFICERS
The business address of the officers and directors affiliated with Artisan Partners is 875 E. Wisconsin Avenue, Suite 800, Milwaukee, Wisconsin 53202. The addresses of the other directors are: Mr. Erne – 1000 North Water Street, Suite 2100, Milwaukee, Wisconsin 53202; Mr. Joerres – 100 Manpower Place, Milwaukee, Wisconsin 53212; and Mr. Hefty, Mr. Pittard and Mr. Witt – c/o Artisan Funds, 875 E. Wisconsin Avenue, Suite 800, Milwaukee, Wisconsin 53202.
Artisan Funds’ statement of additional information (SAI) contains further information about the directors. Please call 800.344.1770 or visit our website at www.artisanfunds.com for a free copy of the SAI.
97
| | | | |
 | | ARTISAN FUNDS P.O. BOX 8412 BOSTON, MA 02266-8412 800.344.1770 WWW.ARTISANFUNDS.COM | | |


ARTISAN
ANNUAL
REPORT
SEPTEMBER 30, 2009
ARTISAN EMERGING
MARKETS FUND
_________
ARTISAN INTERNATIONAL
FUND
_________
ARTISAN INTERNATIONAL
VALUE FUND
_________
ARTISAN MID CAP FUND
ARTISAN FUNDS, INC.
INSTITUTIONAL SHARES
TABLE OF CONTENTS
ARTISAN FUNDS
P.O. BOX 8412
BOSTON, MA 02266-8412
This report and the audited financial statements contained herein are provided for the general information of the shareholders of the Institutional Shares of Artisan Emerging Markets Fund, Artisan International Fund, Artisan International Value Fund and Artisan Mid Cap Fund. Before investing, investors should consider carefully each Fund’s investment objective, risks and charges and expenses. For more complete information on any Fund, including fees and expenses, please call 800.399.1770 for a free prospectus. Read it carefully before you invest or send money.
Company discussions are for illustration only and are not intended as recommendations of individual stocks. The discussions present information about the companies believed to be accurate, and the views of the portfolio managers, as of September 30, 2009. That information and those views may change, and the Funds disclaim any obligation to advise shareholders of any such changes. Each of the Funds offer other classes of shares. A report on each of the other classes is available under separate cover.
Artisan Funds offered through Artisan Distributors LLC, member FINRA.
ARTISAN EMERGING MARKETS FUND
INSTITUTIONAL SHARES
INVESTMENT PROCESS HIGHLIGHTS
| | |
Artisan Emerging Markets Fund employs a fundamental research process to construct a diversified portfolio of emerging market companies. The team’s investment process is focused on identifying companies that are priced at a discount relative to the team’s estimate of their sustainable earnings. • Sustainable Earnings. The team believes that over the long term a stock’s price is directly related to the company’s ability to deliver sustainable earnings. The team determines a company’s sustainable earnings based upon financial and business analysis. The financial analysis of a company’s balance sheet, income statement, and statement of cash flows focuses on identifying historical drivers of return on equity. The business analysis examines a company’s competitive advantages and financial strength to assess sustainability. • Valuation. The team believes that investment opportunities develop when businesses with sustainable earnings are undervalued relative to peers and historical industry, country and regional valuations. The team values a business and develops a price target based on their assessment of the business’s sustainable earnings and cash flow expectations and the team’s risk analysis. • Risk Analysis. The team believes that a disciplined risk framework allows greater focus on fundamental stock selection. The team incorporates its assessment of company-specific and macroeconomic risks into its valuation analysis to develop a risk-adjusted target price. The risk-rating assessment includes a review of the currency, interest rate, monetary and fiscal policy and political risks to which a company is exposed. |
|
| PERFORMANCE HISTORY | | |
GROWTH OF AN ASSUMED $1,000,000 INVESTMENT (6/26/2006 to 9/30/2009)
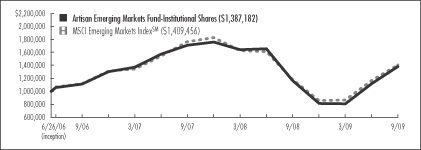
AVERAGE ANNUAL TOTAL RETURNS (as of 9/30/2009)
| | | | | | | | | |
| Fund / Index | | 1-Year | | | 3-Year | | | Since
Inception | |
Artisan Emerging Markets Fund - Institutional Shares | | 18.66 | % | | 7.55 | % | | 10.55 | % |
MSCI Emerging Markets IndexSM | | 19.07 | | | 7.95 | | | 11.09 | |
The performance quoted represents past performance, which does not guarantee future results. The investment return and principal value of an investment in the Fund will fluctuate, so that an investor’s shares in the Fund, when redeemed, may be worth more or less than their original cost. Current performance may be lower or higher than the performance data quoted. The Fund’s investments in initial public offerings (IPOs) made a material contribution to the Fund’s performance. IPO investments are not an integral component of the Fund’s investment process and may not be available in the future. For current to most recent month-end performance information call 800.399.1770. The graph and table above do not reflect the deduction of taxes that a shareholder would pay on distributions or sale of Fund shares. The performance shown does not reflect the deduction of a 2% redemption fee on shares held by an investor for 90 days or less and, if reflected, the fee would reduce the performance quoted. The Fund’s performance information reflects Artisan Partners’ agreement to limit the Fund’s expenses to no more than 1.50%, which has been in effect since the Fund’s inception and has had a material impact on the Fund’s performance. Absent that expense waiver, the Fund’s performance would have been lower. See page 51 for a description of the index.
2
INVESTING ENVIRONMENT
During the year ended September 30, 2009, global markets continued to deal with the economic downturn. Emerging markets stocks fell sharply in October 2008 and continued to trade around recent lows until early March when stocks started to rally on reports that the pace of the global economic slowdown had begun to moderate. For the year ended September 30, 2009, the MSCI Emerging Markets IndexSM advanced 19.07%, though not all markets enjoyed robust gains. From a regional perspective, Asia was the strongest performing region as stocks in China and India posted gains in excess of 30%. In Latin America, stocks advanced nearly 20% on the strength of the Brazilian market, which was up almost 27%. In contrast, stocks in Mexico fell approximately -4% during the period. The EMEA (Europe, Middle East & Africa) region was the weakest performing area.
SECTOR DIVERSIFICATION
| | | | | | |
| Sector | | 9/30/08 | | | 9/30/09 | |
Consumer Discretionary | | 10.6 | % | | 10.9 | % |
Consumer Staples | | 8.4 | | | 6.2 | |
Energy | | 14.8 | | | 12.7 | |
Financials | | 13.6 | | | 14.8 | |
Healthcare | | 2.6 | | | 2.2 | |
Industrials | | 12.6 | | | 10.8 | |
Information Technology | | 10.2 | | | 12.9 | |
Materials | | 13.0 | | | 11.3 | |
Telecommunication Services | | 9.5 | | | 11.8 | |
Utilities | | 1.5 | | | 2.6 | |
Other assets less liabilities | | 3.2 | | | 3.8 | |
Total | | 100.0 | % | | 100.0 | % |
As a percentage of total net assets.
PERFORMANCE DISCUSSION
The Fund returned 18.66% during the twelve-month period, slightly underperforming the Index. We benefited from strong security selection in Taiwan, Korea and Brazil. Some of our leading performers in these countries were Taiwanese fertilizer manufacturer and land owner Taiwan Fertilizer Co., Ltd., Taiwanese memory chip manufacturer MediaTek Incorporation, Korean memory chip manufacturer Samsung Electronics Co., Ltd., Brazilian consumer products manufacturer Hypermarcas SA, Brazilian bank Itau Unibanco Holdings SA and Brazilian oil company OGX Petroleo e Gas Participacoes SA.
On the downside, we were negatively impacted by weakness in our Russian and Indian holdings. Some of our biggest decliners in these countries were Russian banking services provider Sberbank, Russian seamless pipe manufacturer OAO TMK, Russian oil company Alliance Oil Company Ltd. and Indian consulting and IT services provider Satyam Computer Services Limited. We were also hurt on a relative basis by our lack of investment in Chinese financials, which advanced over 38%.
FUND CHANGES
We strive to identify stocks that possess unique access to growth and competitive advantages that will allow those companies to sustain earnings growth over the long term. The volatility in the market over the past twelve months unearthed several investment opportunities. The most recent additions to the portfolio included Chinese mobile telecom services provider China Mobile Limited, Indonesian telecom services company PT Telekomunikasi Indonesia, Indonesian cement and building materials manufacturer PT Indocement Tunggal Prakarsa Tbk, Indonesian commercial bank PT Bank Rakyat Indonesia and Brazilian telecom services provider Tele Norte Leste Participacoes S.A. Our purchases were funded in part by the sales of Weichai Power Co., Ltd., Dr. Reddy’s Laboratories Limited, Tiger Brands Limited, Credicorp Limited and Philippine Long Distance Telephone Company.
REGION ALLOCATION
| | | | | | |
| Region | | 9/30/08 | | | 9/30/09 | |
Emerging Asia | | 36.2 | % | | 41.9 | % |
Latin America | | 27.9 | | | 26.0 | |
Europe, Middle East & Africa | | 27.5 | | | 24.1 | |
Developed Markets | | 5.2 | | | 4.2 | |
As a percentage of total net assets.
3
ARTISAN INTERNATIONAL FUND
INSTITUTIONAL SHARES
INVESTMENT PROCESS HIGHLIGHTS
Artisan International Fund employs a fundamental stock selection process focused on identifying long-term growth opportunities.
Themes. The investment team’s thematic approach identifies catalysts for change and develops investment themes with the objective of capitalizing on them globally. Changing demographics, developing technology, privatization of economic resources and outsourcing are among the long-term catalysts for change that currently form the basis for the team’s investment themes. The team incorporates these catalysts along with sector and regional fundamentals into a long-term global framework for investment analysis and decision-making.
Sustainable Growth. The team applies a fundamental approach to identifying the long term, sustainable growth characteristics of potential investments. The team seeks high quality companies that are well managed, have a dominant or improving market position and competitive advantages compared to industry and regional peers.
Valuation. The team assesses the relationship between its estimate of a company’s sustainable growth prospects and the company’s stock price. The team uses multiple valuation metrics to establish price targets.
The Fund primarily invests in non-U.S. growth companies of all market capitalizations in developed markets and emerging and less developed markets.
PERFORMANCE HISTORY
GROWTH OF AN ASSUMED $1,000,000 INVESTMENT (7/1/1997 to 9/30/2009)
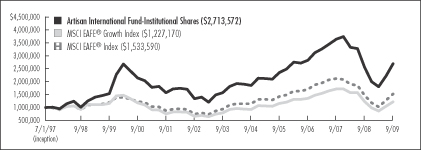
AVERAGE ANNUAL TOTAL RETURNS (as of 9/30/2009)
| | | | | | | | | | | | | | | |
| Fund / Index | | 1-Year | | | 3-Year | | | 5-Year | | | 10-Year | | | Since
Inception | |
Artisan International Fund – Institutional Shares | | 5.25 | % | | -1.60 | % | | 7.79 | % | | 5.85 | % | | 8.49 | % |
MSCI EAFE® Growth Index | | -0.78 | | | -3.22 | | | 5.75 | | | 0.56 | | | 1.68 | |
MSCI EAFE® Index | | 3.23 | | | -3.60 | | | 6.07 | | | 2.55 | | | 3.55 | |
The performance quoted represents past performance, which does not guarantee future results. The investment return and principal value of an investment in the Fund will fluctuate, so that an investor’s shares in the Fund, when redeemed, may be worth more or less than their original cost. Current performance may be lower or higher than the performance data quoted. For current to most recent month-end performance information, visit www.artisanfunds.com or call 800.399.1770. The graph and table above do not reflect the deduction of taxes that a shareholder would pay on distributions or sale of Fund shares. The performance shown does not reflect the deduction of a 2% redemption fee on shares held by an investor for 90 days or less and, if reflected, the fee would reduce the performance quoted. See page 51 for a description of each index.
4
INVESTING ENVIRONMENT
The MSCI EAFE® Index trended lower for the first part of the fiscal year to a low in early March. Stocks subsequently rebounded sharply, ending the twelve-month reporting period up 3.23%. Emerging markets, as measured by the MSCI Emerging Markets IndexSM, led the recovery from March lows amid stimulus spending and the prospect of a return to economic growth. Similarly, financial stocks rallied off their steep lows, although the sector remains in the red on a trailing twelve-month basis.
SECTOR DIVERSIFICATION
| | | | | | |
| Sector | | 9/30/08 | | | 9/30/09 | |
Consumer Discretionary | | 11.2 | % | | 12.1 | % |
Consumer Staples | | 9.8 | | | 14.2 | |
Energy | | 9.1 | | | 4.5 | |
Financials | | 14.2 | | | 30.7 | |
Healthcare | | 7.9 | | | 10.1 | |
Industrials | | 17.4 | | | 11.2 | |
Information Technology | | 4.7 | | | 6.4 | |
Materials | | 7.4 | | | 6.6 | |
Telecommunication Services | | 3.1 | | | 1.6 | |
Utilities | | 9.4 | | | 1.5 | |
Other assets less liabilities | | 5.8 | | | 1.1 | |
Total | | 100.0 | % | | 100.0 | % |
As a percentage of total net assets.
PERFORMANCE DISCUSSION
The Fund ended the period ahead of the MSCI EAFE® Index with a return of 5.25%. Our outperformance was primarily the result of strong stock selection in the technology, consumer discretionary and financial sectors. ASML Holding N.V. was our key source of strength in the technology sector. Our top performers in the consumer discretionary sector included our retailers (Industria de Diseno Textil, S.A., LVMH Moet Hennessy Louis Vuitton SA and Kingfisher PLC) and automobile companies (SUZUKI MOTOR COPORATION, DENSO CORPORATION and Daimler AG). Within the financial sector, China Resources Land Limited, China Construction Bank Corporation and China Life Insurance Co. were some of our strongest performers.
On the downside, our underweight positions in the telecommunications and energy sectors, two of the better performing sectors over the last twelve months, worked against us. Our positions in the utilities, energy and materials sectors also weighed on performance. RAO Unified Energy System (equity-linked participation certificate), which we sold during the period, was our biggest detractor in the utilities sector. The losses of SeaDrill Ltd., Technip SA and Gazprom hurt our performance in the energy sector. We sold SeaDrill Ltd. and Technip SA during the period.
Regionally, our European holdings outperformed those in the Index and our investments in emerging markets, particularly in China, proved positive. While our underweight position in Japan added relative value, the poor performance of our holdings in Japan and our low exposure to the strong yen outweighed the benefit.
FUND CHANGES
We look to invest in companies with attractive growth rates, trading at reasonable valuations, with exposure to the long-term themes we have identified. Our larger purchases during the period included several financial companies, as well as a number of companies in more defensive sectors. We added Societe Generale, HSBC Holdings plc, Credit Suisse Group AG and ING Groep N.V. in the financial sector, Pernod Ricard SA, Imperial Tobacco Group plc and Heineken NV in the consumer staples sector, and Covidien plc and Novartis AG in the health care sector.
Sales during the period included Alstom S.A., Bouygues SA, Fortum Oyj, LVMH Moet Hennessy Louis Vuitton SA and Redecard SA.
REGION ALLOCATION
| | | | | | |
| Region | | 9/30/08 | | | 9/30/09 | |
Europe | | 61.0 | % | | 68.7 | % |
Emerging Markets | | 15.5 | | | 13.9 | |
Pacific Basin | | 15.0 | | | 9.5 | |
Americas | | 2.2 | | | 6.8 | |
Middle East | | 0.5 | | | — | |
As a percentage of total net assets.
5
ARTISAN INTERNATIONAL VALUE FUND
INSTITUTIONAL SHARES
INVESTMENT PROCESS HIGHLIGHTS
Artisan International Value Fund employs a bottom-up investment process to construct a diversified portfolio of stocks of undervalued non-U.S. companies. The Fund’s investment process is focused on identifying what the investment team believes are high quality, undervalued businesses that offer the potential for superior risk/reward outcomes. The team’s in-depth research process focuses on four key investment characteristics:
Undervaluation. Determining the intrinsic value of the business is the heart of the team’s research process. The team believes that intrinsic value represents the amount that a buyer would pay to own a company’s future cash flows. The team seeks to invest at a significant discount to its estimate of the intrinsic value of a business.
Business quality. The team seeks to invest in companies with histories of generating strong free cash flow, improving returns on capital and strong competitive positions in their industries.
Financial strength. The team believes that investing in companies with strong balance sheets helps to reduce the potential for capital risk and provides company management the ability to build value when attractive opportunities are available.
Shareholder-oriented management. The team’s research process attempts to identify management teams with a history of building value for shareholders.
The Fund primarily invests in common stocks and other equity securities of non-U.S. companies of all market capitalizations in developed and emerging markets.
PERFORMANCE HISTORY
GROWTH OF AN ASSUMED $1,000,000 INVESTMENT (10/1/2006 to 9/30/2009)
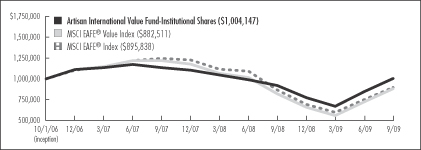
AVERAGE ANNUAL TOTAL RETURNS (as of 9/30/2009)
| | | | | | | | | |
| Fund / Index | | 1-Year | | | 3-Year | | | Since
Inception | |
Artisan International Value Fund – Institutional Shares | | 9.14 | % | | 0.14 | % | | 0.14 | % |
MSCI EAFE® Value Index | | 7.35 | | | -4.08 | | | -4.08 | |
MSCI EAFE® Index | | 3.23 | | | -3.60 | | | -3.60 | |
The performance quoted represents past performance, which does not guarantee future results. The investment return and principal value of an investment in the Fund will fluctuate, so that an investor’s shares in the Fund, when redeemed, may be worth more or less than their original cost. Current performance may be lower or higher than the performance data quoted. For current to most recent month-end performance information, visit www.artisanfunds.com or call 800.399.1770. The graph and table above do not reflect the deduction of taxes that a shareholder would pay on distributions or sale of Fund shares. The performance shown does not reflect the deduction of a 2% redemption fee on shares held by an investor for 90 days or less and, if reflected, the fee would reduce the performance quoted. See page 51 for a description of each index.
6
INVESTING ENVIRONMENT
International equities, as measured by the MSCI EAFE® Index, posted sharp losses in the first part of the fiscal year and reached a low in early March. From that point, equity markets dramatically recovered. Financials, materials and industrials led the way, though all sectors and all regions posted positive returns for the twelve months ended September 30, 2009. One of the main drivers of market returns was improvement (or more accurately, less of a decline) in the underlying economy.
SECTOR DIVERSIFICATION
| | | | | | |
| Sector | | 9/30/08 | | | 9/30/09 | |
Consumer Discretionary | | 22.3 | % | | 23.4 | % |
Consumer Staples | | 13.0 | | | 10.0 | |
Energy | | — | | | 4.7 | |
Financials | | 19.0 | | | 17.9 | |
Healthcare | | 13.5 | | | 8.8 | |
Industrials | | 15.1 | | | 14.6 | |
Information Technology | | 8.3 | | | 6.1 | |
Materials | | 2.2 | | | 3.2 | |
Telecommunication Services | | 1.6 | | | 1.4 | |
Other assets less liabilities | | 5.0 | | | 9.9 | |
Total | | 100.0 | % | | 100.0 | % |
As a percentage of total net assets.
PERFORMANCE DISCUSSION
The Fund gained 9.14% during the twelve-month period ended September 30, 2009, outperforming the MSCI EAFE® Index, which increased 3.23% over the same period. Our outperformance in the first half of the fiscal year was the key driver of strength.
Performance of the following stocks had a positive impact on the portfolio during the year: Publicis Groupe, a French advertising services company; Experian PLC, a U.K. credit information firm; Signet Jewelers Ltd., a jewelry retailer in the U.S. and U.K.; and Panalpina Welttransport Holding AG, a Swiss logistics provider. Notable detractors included Julius Baer Holding AG, a Swiss bank, which we sold during the period; Covidien plc, a medical products maker; MEITEC CORPORATION, a Japanese engineering outsourcing firm; and Kimberly-Clark de Mexico, S.A.B. de C.V., a paper products manufacturer.
FUND CHANGES
We remained focused on the intersection of balance sheet strength, business quality and valuation during the past year. Some of the more recent additions to the portfolio were contract caterer Compass Group PLC, technology services provider Accenture PLC and packaged food company Nestle SA. We exited our positions in memory chip manufacturer Samsung Electronics Co., Ltd., cosmetics maker L’Oreal SA, dental implant manufacturer Nobel Biocare Holding AG, financial services provider IGM Financial, Inc. and residential property website operator Rightmove PLC.
REGION ALLOCATION
| | | | | | |
| Region | | 9/30/08 | | | 9/30/09 | |
Europe | | 63.8 | % | | 64.2 | % |
Americas | | 10.7 | | | 13.0 | |
Pacific Basin | | 14.2 | | | 10.2 | |
Emerging Markets | | 6.3 | | | 2.7 | |
As a percentage of total net assets.
7
ARTISAN MID CAP FUND
INSTITUTIONAL SHARES
INVESTMENT PROCESS HIGHLIGHTS
Artisan Mid Cap Fund employs a bottom-up investment process to construct a diversified portfolio of primarily U.S. mid-cap growth companies. The Fund’s investment process focuses on two distinct areas – security selection and capital allocation.
The Fund’s investment team attempts to identify companies that possess franchise characteristics that are selling at attractive valuations and benefiting from an accelerating profit cycle.
Franchise characteristics. These are characteristics that the team believes help to protect a company’s stream of cash flow from the effects of competition. The team looks for companies with at least two of the following characteristics: low cost production capability, possession of a proprietary asset, dominant market share or a defensible brand name.
Attractive valuations. Through its own fundamental research, the team estimates the amount a buyer would pay to buy the entire company (the company’s “intrinsic value” or “private market value”) and considers whether to purchase a stock if it sells at a discount to that estimate.
Accelerating profit cycle. The team tries to invest in companies that are well positioned for long-term growth, at an early enough stage in their profit cycle to benefit from the increased cash flows produced by the profit cycle.
Based on the investment team’s fundamental analysis of a company’s profit cycle, portfolio holdings develop through three stages. GardenSM investments are small positions in the early part of their profit cycle that will warrant a more sizeable allocation once their profit cycle accelerates. CropSM investments are positions that are being increased to a full weight because they are moving through the strongest part of their profit cycle. HarvestSM investments are positions that are being reduced as they near the team’s estimate of full valuation or their profit cycle begins to decelerate.
PERFORMANCE HISTORY
GROWTH OF AN ASSUMED $1,000,000 INVESTMENT (7/1/2000 to 9/30/2009)
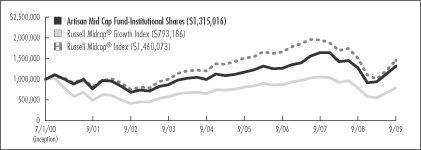
AVERAGE ANNUAL TOTAL RETURNS (as of 9/30/2009)
| | | | | | | | | | | | |
| Fund / Index | | 1-Year | | | 3-Year | | | 5-Year | | | Since
Inception | |
Artisan Mid Cap Fund – Institutional Shares | | 2.77 | % | | 1.33 | % | | 5.80 | % | | 3.00 | % |
Russell Midcap® Growth Index | | -0.40 | | | -3.10 | | | 3.75 | | | -2.47 | |
Russell Midcap® Index | | -3.55 | | | -4.07 | | | 3.89 | | | 4.18 | |
The performance quoted represents past performance, which does not guarantee future results. The investment return and principal value of an investment in the Fund will fluctuate, so that an investor’s shares in the Fund, when redeemed, may be worth more or less than their original cost. Current performance may be lower or higher than the performance data quoted. For current to most recent month-end performance information, visit www.artisanfunds.com or call 800.399.1770. The graph and table above do not reflect the deduction of taxes that a shareholder would pay on distributions or sale of Fund shares. See page 51 for a description of each index.
8
INVESTING ENVIRONMENT
During the fiscal year ended September 30, 2009, the performance of mid-cap stocks was fairly volatile. Through early March, mid-cap stocks sank along with the broader market amid worsening economic conditions and turmoil in the financial sector. Mid-cap stocks then rebounded sharply on increasing signs of stabilization in the financial system and economy. The Russell Midcap® Index declined -3.55% over the full fiscal year. Growth stocks held up better than value names as the Russell Midcap® Growth Index was almost unchanged at -0.40%, while its value counterpart fell -7.12%. Within the Growth Index, sector returns diverged. Some sectors advanced, including technology, consumer discretionary and materials, while financial and telecommunications stocks were down by double-digit percentages.
SECTOR DIVERSIFICATION
| | | | | | |
| Sector | | 9/30/08 | | | 9/30/09 | |
Consumer Discretionary | | 7.7 | % | | 16.0 | % |
Consumer Staples | | 4.8 | | | 3.0 | |
Energy | | 4.0 | | | 2.1 | |
Financials | | 8.0 | | | 6.5 | |
Healthcare | | 25.4 | | | 17.8 | |
Industrials | | 14.9 | | | 13.2 | |
Information Technology | | 28.5 | | | 34.7 | |
Materials | | 1.6 | | | 2 .4 | |
Telecommunication Services | | 0.4 | | | — | |
Utilities | | 2.0 | | | — | |
Exchange Traded Funds | | — | | | 0.7 | |
Other assets less liabilities | | 2.7 | | | 3.6 | |
Total | | 100.0 | % | | 100.0 | % |
As a percentage of total net assets.
PERFORMANCE DISCUSSION
The Fund returned 2.77% in the period, outperforming the Russell Midcap® and Russell Midcap® Growth indices. Relative to the benchmarks, the Fund benefited from strong security selection, particularly among our health care, consumer discretionary and industrials holdings, although our leading performers came from a variety of sectors. Our outsized position in the technology sector was also beneficial. Our positive results in the health care sector were driven by Cerner Corporation, a health care information technology company, specialty pharmaceuticals company Allergan, Inc. and Intuitive Surgical, Inc., a maker of minimally invasive robotic surgical systems. Department store operator Kohl’s Corporation and Precision Castparts Corp., a manufacturer of complex metal components, were leading contributors to our return in the consumer discretionary and industrials sectors, respectively. Other standout performers included Broadcom Corporation, Red Hat, Inc. and NVIDIA Corporation.
Among the largest sources of weakness compared to the benchmarks were our utilities and energy holdings. Independent power producers Calpine Corporation and Dynegy Inc. and energy equipment and service provider Smith International, Inc. were among our worst performing utilities and energy holdings.
FUND CHANGES
The most notable changes to the portfolio during the period were increased exposure to the consumer discretionary and information technology sectors and a reduced weighting in the health care sector. In the consumer discretionary sector, we added to our position in Kohl’s Corporation and purchased several new holdings including Dick’s Sporting Goods, Inc., O’Reilly Automotive Inc. and Coach, Inc. In the information technology sector, new purchases included Agilent Technologies, Inc., Citrix Systems, Inc. and ANSYS, Inc., among others.
Our reduced weighting in the health care sector was due in part to the sales of Thermo Fisher Scientific, Inc., Gen-Probe Incorporated and Celgene Corporation. In addition to those sales in health care, our new purchases were funded with the sales of Cooper Industries, Ltd., AGCO Corporation, Intermec, Inc. and Calpine Corporation, among others.
9
ARTISAN EMERGING MARKETS FUND
Schedule of Investments – September 30, 2009
| | | | | |
| | | Shares
Held | | Value |
| COMMON AND | | | | | |
| PREFERRED STOCKS - 96.2% | | | | | |
| | | | | |
| BRAZIL - 19.1% | | | | | |
All-America Latina Logistica S.A. (Units) | | 155,900 | | $ | 1,202,074 |
Amil Participacoes SA | | 133,200 | | | 730,059 |
Companhia Energetica de Minas Gerais- CEMIG, Preferred(1) | | 66,447 | | | 1,012,683 |
Companhia Vale do Rio Doce | | 158,462 | | | 3,684,268 |
Dufry South America Ltd (DR) | | 71,000 | | | 1,199,898 |
Empresa Brasileira de Aeronautica S.A.(2) | | 156,600 | | | 906,045 |
Hypermarcas SA(2) | | 73,000 | | | 1,429,425 |
Itau Unibanco Holdings SA, Preferred(1) | | 139,051 | | | 2,802,055 |
Marcopolo S.A., Preferred(1) | | 274,400 | | | 944,818 |
Net Servicos de Comunicacao SA, Preferred(2) | | 72,400 | | | 842,269 |
OGX Petroleo e Gas Participacoes SA | | 1,187 | | | 907,865 |
Petroleo Brasileiro S.A. | | 281,300 | | | 6,486,286 |
Randon SA Implementos e Participacoes, Preferred(1) | | 136,100 | | | 1,024,822 |
Rodobens Negocios Imobiliarios SA | | 97,300 | | | 987,499 |
SEB - Sistema Educacional Brasileiro SA (Units)(1) | | 99,100 | | | 990,105 |
SLC Agricola SA | | 69,278 | | | 595,957 |
Tele Norte Leste Participacoes S.A. | | 48,100 | | | 1,086,024 |
Tim Participacoes S.A., Preferred | | 599,100 | | | 1,491,325 |
Wilson Sons Limited (DR) | | 89,721 | | | 1,230,144 |
| | | | | |
| | | | | 29,553,621 |
| CHILE - 1.1% | | | | | |
Compania Cervecerias Unidas S.A. | | 140,189 | | | 956,269 |
Empresa Nacional de Telecomunicaciones S.A. | | 57,908 | | | 749,038 |
| | | | | |
| | | | | 1,705,307 |
| CHINA - 12.3% | | | | | |
Airmedia Group, Inc. (DR)(2) | | 116,302 | | | 854,820 |
Ajisen China Holdings Limited | | 1,337,913 | | | 1,191,167 |
Chaoda Modern Agriculture (Holdings) Limited | | 2,466,536 | | | 1,499,008 |
China Dongxiang Group Company | | 2,591,000 | | | 1,718,407 |
China Mobile Limited | | 389,500 | | | 3,794,459 |
China Railway Construction Corporation, H Shares | | 659,000 | | | 875,827 |
GOME Electrical Appliances Holdings Limited(2) | | 6,095,587 | | | 1,628,101 |
Huabao International Holdings Limited | | 2,188,900 | | | 2,347,051 |
Mindray Medical International Limited, Class A (DR) | | 44,083 | | | 1,438,869 |
New Oriental Education & Technology Group, Inc. (DR)(2) | | 9,472 | | | 762,022 |
Tingyi (Cayman Islands) Holding Corporation | | 722,300 | | | 1,493,054 |
Zhuzhou CSR Times Electric Co., Ltd., H Shares | | 813,200 | | | 1,420,730 |
| | | | | |
| | | | | 19,023,515 |
| | | | | |
| | | Shares
Held | | Value |
| CZECH REPUBLIC - 0.9% | | | | | |
CEZ | | 25,892 | | $ | 1,380,923 |
| | | | | |
| EGYPT - 1.4% | | | | | |
Commercial International Bank | | 74,988 | | | 790,086 |
Egyptian Financial Group-Hermes Holding | | 253,379 | | | 1,376,499 |
| | | | | |
| | | | | 2,166,585 |
| HONG KONG - 0.8% | | | | | |
Samson Holding Ltd. | | 6,230,955 | | | 1,286,382 |
| | | | | |
| HUNGARY - 0.8% | | | | | |
MOL Hungarian Oil and Gas Nyrt., Class A(2) | | 14,495 | | | 1,210,385 |
| | | | | |
| INDIA - 3.2% | | | | | |
Cairn India Ltd.(2) | | 314,654 | | | 1,710,467 |
Patni Computer Systems Ltd | | 112,773 | | | 1,076,507 |
Piramal Healthcare Ltd. | | 135,902 | | | 1,082,018 |
Power Finance Corporation | | 221,908 | | | 1,056,606 |
| | | | | |
| | | | | 4,925,598 |
| INDONESIA - 2.8% | | | | | |
PT Bank Rakyat Indonesia | | 1,590,500 | | | 1,234,221 |
PT Indocement Tunggal Prakarsa Tbk | | 1,207,595 | | | 1,324,419 |
PT Telekomunikasi Indonesia(3) | | 1,929,500 | | | 1,722,078 |
| | | | | |
| | | | | 4,280,718 |
| ITALY - 0.5% | | | | | |
Tenaris S.A. (DR) | | 23,625 | | | 841,523 |
| | | | | |
| KAZAKSTAN - 1.2% | | | | | |
KazMunaiGas Exploration Production (DR) | | 80,221 | | | 1,795,346 |
| | | | | |
| KOREA - 9.1% | | | | | |
Daewoo Shipbuilding & Marine Engineering Co., Ltd. | | 42,934 | | | 626,747 |
Hyundai Development Company | | 27,731 | | | 1,007,330 |
MegaStudy Co., Ltd. | | 6,312 | | | 1,299,096 |
Samsung Electronics Co., Ltd. | | 10,726 | | | 7,419,215 |
Shinhan Financial Group Co., Ltd.(2) | | 53,567 | | | 2,136,770 |
Shinsegae Co., Ltd. | | 3,049 | | | 1,539,703 |
| | | | | |
| | | | | 14,028,861 |
| LUXEMBOURG - 0.6% | | | | | |
Ternium S.A. (DR)(2) | | 32,780 | | | 871,948 |
| | | | | |
| MEXICO - 5.7% | | | | | |
America Movil SAB de C.V., Series L(1) | | 1,242,995 | | | 2,721,383 |
Bolsa Mexicana de Valores SA(2) | | 654,844 | | | 810,246 |
Fomento Economico Mexicano SAB, Series UBD (Units) | | 316,810 | | | 1,206,258 |
Grupo Financiero Banorte S.A.B. de C.V. | | 417,886 | | | 1,398,217 |
10
| | | | | |
| | | Shares
Held | | Value |
| MEXICO (CONTINUED) | | | | | |
Grupo Televisa S.A. | | 376,307 | | $ | 1,392,367 |
Urbi, Desarrollos Urbanos, S.A. de C.V.(2) | | 660,893 | | | 1,339,708 |
| | | | | |
| | | | | 8,868,179 |
| NETHERLANDS - 0.8% | | | | | |
Plaza Centers (Europe) BV(2) | | 577,767 | | | 1,211,909 |
| | | | | |
| POLAND - 0.6% | | | | | |
Polski Koncern Naftowy Orlen S.A.(2) | | 90,152 | | | 934,470 |
| | | | | |
| RUSSIA - 4.6% | | | | | |
Globaltrans Investment PLC (DR)(2) | | 144,207 | | | 1,067,132 |
Globaltrans Investment PLC, 144A (DR)(2)(3) | | 50,956 | | | 377,074 |
LUKOIL (DR) | | 64,329 | | | 3,486,632 |
Mobile TeleSystems (DR) | | 27,458 | | | 1,325,398 |
Razguliay Group(2)(3) | | 426,978 | | | 873,003 |
| | | | | |
| | | | | 7,129,239 |
| SINGAPORE - 0.8% | | | | | |
Epure International Ltd. | | 2,960,000 | | | 1,197,743 |
| | | | | |
| SOUTH AFRICA - 9.3% | | | | | |
ABSA Group Limited | | 103,317 | | | 1,650,431 |
African Bank Investments Limited | | 293,703 | | | 1,153,386 |
Barloworld Limited | | 124,095 | | | 809,459 |
Gold Fields Limited | | 121,474 | | | 1,641,322 |
Grindrod Limited | | 523,772 | | | 1,108,623 |
Harmony Gold Mining Company Limited | | 99,526 | | | 1,059,915 |
Impala Platinum Holdings Limited | | 82,110 | | | 1,912,840 |
Mondi Limited | | 273,218 | | | 1,418,464 |
Mr. Price Group Limited | | 153,914 | | | 696,629 |
MTN Group Limited(3) | | 135,053 | | | 2,147,328 |
Reunert Limited | | 111,437 | | | 830,734 |
| | | | | |
| | | | | 14,429,131 |
| SWEDEN - 0.8% | | | | | |
Alliance Oil Co Ltd. (DR) | | 93,993 | | | 1,162,888 |
| | | | | |
| TAIWAN - 11.7% | | | | | |
Acer Inc. | | 628,599 | | | 1,603,369 |
Cathay Financial Holding Co., Ltd.(2) | | 874,292 | | | 1,452,258 |
Chinatrust Financial Holding Company Ltd. | | 1,977,838 | | | 1,282,752 |
Far Eastern Textile Ltd. | | 1,076,698 | | | 1,262,645 |
Far EasTone Telecommunications Co., Ltd. | | 593,000 | | | 693,567 |
Hon Hai Precision Industry Co., Ltd. | | 683,729 | | | 2,743,593 |
HTC Corporation | | 93,400 | | | 1,025,576 |
MediaTek Incorporation | | 149,214 | | | 2,487,828 |
Taiwan Fertilizer Co., Ltd. | | 556,000 | | | 1,988,926 |
Taiwan Semiconductor Manufacturing Company Ltd. | | 1,750,647 | | | 3,512,403 |
| | | | | |
| | | | | 18,052,917 |
| THAILAND - 2.8% | | | | | |
Bangkok Bank Public Company Limited (DR) | | 254,600 | | | 922,077 |
Bumrungrad Hospital Public Company Limited (DR) | | 945,000 | | | 820,263 |
| | | | | | | |
| | | Shares
Held | | Value | |
| THAILAND (CONTINUED) | | | | | | | |
Glow Energy Pcl (DR) | | | 438,700 | | $ | 430,034 | |
Siam Commercial Bank Public Company Limited (DR) | | | 567,700 | | | 1,444,313 | |
Total Access Communication Public Company Limited (DR) | | | 593,300 | | | 759,161 | |
| | | | | | | |
| | | | | | 4,375,848 | |
| TURKEY - 5.3% | | | | | | | |
Cimsa Cimento Sanayi ve Ticaret A.S. | | | 278,976 | | | 1,231,329 | |
Ford Otomotiv Sanayi A.S. | | | 114,160 | | | 715,423 | |
Tekfen Holding A.S.(2) | | | 261,548 | | | 754,330 | |
Tupras-Turkiye Petrol Rafinerileri A.S. | | | 65,336 | | | 1,083,063 | |
Turk Hava Yollari Anonim Ortakligi | | | 475,255 | | | 1,236,175 | |
Turkcell Iletisim Hizmetleri AS | | | 247,135 | | | 1,765,250 | |
Turkiye Sinai Kalkinma Bankasi A.S.(2) | | | 1,387,291 | | | 1,374,203 | |
| | | | | | | |
| | | | | | 8,159,773 | |
| | | | | | | |
Total common and preferred stocks
(Cost $126,492,215) | | | | | | 148,592,809 | |
| | |
| | | Par
Amount | | | |
| SHORT-TERM INVESTMENTS (CASH EQUIVALENTS) - 3.9% | | | | | | | |
Repurchase agreement with Fixed Income Clearing Corporation, 0.01%, dated 9/30/09, due 10/1/09, maturity value $6,031,002(4) (Cost $6,031,000) | | $ | 6,031,000 | | | 6,031,000 | |
| | | | | | | |
| | | | | | | |
Total investments - 100.1%
(Cost $132,523,215) | | | | | | 154,623,809 | |
| | | | | | | |
Other assets less liabilities - (0.1%) | | | | | | (214,689 | ) |
| | | | | | | |
| | | | | | | |
Total net assets - 100.0%(5) | | | | | $ | 154,409,120 | |
| | | | | | | |
| (2) | Non-income producing security. |
| (3) | Valued at a fair value in accordance with procedures established by the board of directors of Artisan Funds, Inc. In total, securities valued at a fair value were $5,119,483 or 3.3% of total net assets. |
| | | | | | | | |
Issuer | | Rate | | | Maturity | | Value |
U.S. Treasury Bond | | 4.750 | % | | 3/31/2011 | | $ | 6,152,139 |
| (5) | Percentages for the various classifications relate to total net assets. |
Company names are as reported by a data service provider and in some cases are translations; a company’s legal name may be different.
(DR) Depository Receipt, voting rights may vary.
11
| | | | | | | |
| PORTFOLIO DIVERSIFICATION - SEPTEMBER 30, 2009 | |
| | | Value | | | Percentage
of Total
Net Assets | |
Consumer Discretionary | | $ | 16,903,893 | | | 10.9 | % |
Consumer Staples | | | 9,592,677 | | | 6.2 | |
Energy | | | 19,618,925 | | | 12.7 | |
Financials | | | 22,826,088 | | | 14.8 | |
Healthcare | | | 3,341,150 | | | 2.2 | |
Industrials | | | 16,684,709 | | | 10.8 | |
Information Technology | | | 19,868,491 | | | 12.9 | |
Materials | | | 17,480,482 | | | 11.3 | |
Telecommunication Services | | | 18,255,011 | | | 11.8 | |
Utilities | | | 4,021,383 | | | 2.6 | |
| | | | | | | |
Total common and preferred stocks | | | 148,592,809 | | | 96.2 | |
Short-term investments | | | 6,031,000 | | | 3.9 | |
| | | | | | | |
Total investments | | | 154,623,809 | | | 100.1 | |
Other assets less liabilities | | | (214,689 | ) | | (0.1 | ) |
| | | | | | | |
Total net assets | | $ | 154,409,120 | | | 100.0 | % |
| | | | | | | |
| | | | | | |
| CURRENCY EXPOSURE - SEPTEMBER 30, 2009 | |
| | | Value | | Percentage
of Total
Investments | |
Brazilian real | | $ | 29,553,621 | | 19.1 | % |
British pound | | | 1,211,909 | | 0.8 | |
Chilean peso | | | 1,705,307 | | 1.1 | |
Czech koruna | | | 1,380,923 | | 0.9 | |
Egyptian pound | | | 2,166,585 | | 1.4 | |
Hong Kong dollar | | | 17,254,186 | | 11.2 | |
Hungarian forint | | | 1,210,385 | | 0.8 | |
Indian rupee | | | 4,925,598 | | 3.2 | |
Indonesian rupiah | | | 4,280,718 | | 2.8 | |
Korean won | | | 14,028,861 | | 9.1 | |
Mexican peso | | | 8,868,179 | | 5.7 | |
Polish zloty | | | 934,470 | | 0.6 | |
Singapore dollar | | | 1,197,743 | | 0.8 | |
South African rand | | | 14,429,131 | | 9.3 | |
Swedish krona | | | 1,162,888 | | 0.7 | |
Taiwan dollar | | | 18,052,917 | | 11.7 | |
Thai baht | | | 4,375,848 | | 2.8 | |
Turkish lira | | | 8,159,773 | | 5.3 | |
U.S. dollar | | | 19,724,767 | | 12.7 | |
| | | | | | |
Total investments | | $ | 154,623,809 | | 100.0 | % |
| | | | | | |
| | | | | |
| TOP TEN HOLDINGS - SEPTEMBER 30, 2009 | |
Company Name | | Country | | Percentage
of Total
Net Assets | |
Samsung Electronics Co., Ltd. | | Korea | | 4.8 | % |
Petroleo Brasileiro S.A. | | Brazil | | 4.2 | |
China Mobile Limited | | China | | 2.5 | |
Companhia Vale do Rio Doce | | Brazil | | 2.4 | |
Taiwan Semiconductor Manufacturing Company Ltd. | | Taiwan | | 2.3 | |
LUKOIL | | Russia | | 2.3 | |
Banco Itau Holding Financeira S.A.,
Preferred | | Brazil | | 1.8 | |
Hon Hai Precision Industry Co., Ltd. | | Taiwan | | 1.8 | |
America Movil SAB de C.V. | | Mexico | | 1.8 | |
MediaTek Incorporation | | Taiwan | | 1.6 | |
| | | | | |
Total | | | | 25.5 | % |
| | | | | |
For the purpose of determining the Fund’s top ten holdings, securities of the same issuer are aggregated to determine the weight in the Fund.
The accompanying notes are an integral part of the financial statements.
12
ARTISAN INTERNATIONAL FUND
Schedule of Investments – September 30, 2009
| | | | | |
| | | Shares
Held | | Value |
| COMMON AND PREFERRED STOCKS AND EQUITY-LINKED SECURITIES - 98.9% | | | | | |
| | | | | |
| BELGIUM - 1.4% | | | | | |
Anheuser-Busch InBev NV | | 3,038,935 | | $ | 138,769,333 |
Umicore | | 306,886 | | | 9,188,204 |
| | | | | |
| | | | | 147,957,537 |
| BRAZIL - 1.5% | | | | | |
Petroleo Brasileiro S.A., Preferred (DR) | | 4,143,960 | | | 162,899,068 |
| | | | | |
| CANADA - 2.7% | | | | | |
Canadian Pacific Railway Limited | | 6,172,234 | | | 288,551,939 |
| | | | | |
| CHINA - 5.3% | | | | | |
China Construction Bank, H Shares | | 209,744,100 | | | 167,794,197 |
China Life Insurance Co., Limited, H Shares | | 50,676,900 | | | 220,688,302 |
China Merchants Bank Co., Ltd., H Shares | | 10,226,500 | | | 22,801,649 |
China Merchants Holdings International Company Limited | | 28,474,900 | | | 94,793,249 |
Industrial and Commercial Bank of China Ltd, H Shares | | 71,035,000 | | | 53,436,307 |
Wynn Macau Ltd.(1)(2)(3)(4) | | 213,200 | | | 277,296 |
| | | | | |
| | | | | 559,791,000 |
| DENMARK - 1.0% | | | | | |
Danske Bank A/S(2) | | 3,886,311 | | | 101,797,887 |
| | | | | |
| FRANCE - 12.9% | | | | | |
Accor S.A. | | 3,289,802 | | | 183,129,442 |
BNP Paribas | | 2,243,378 | | | 179,243,330 |
BNP Paribas Rights(2)(5)
Exercise Price: 40.00 EUR
Expiration: 10/13/09 | | 2,243,378 | | | 4,858,609 |
Compagnie de Saint-Gobain | | 1,321,134 | | | 68,534,778 |
Credit Agricole S.A. | | 2,645,543 | | | 55,282,915 |
DANONE S.A. | | 430,414 | | | 25,937,053 |
Natixis(2) | | 14,561,979 | | | 87,794,138 |
Pernod Ricard SA | | 3,142,325 | | | 249,550,719 |
Societe Generale | | 2,612,019 | | | 210,226,241 |
Unibail-Rodamco | | 531,342 | | | 110,371,628 |
Vinci SA | | 3,506,906 | | | 198,396,442 |
| | | | | |
| | | | | 1,373,325,295 |
| GERMANY - 15.3% | | | | | |
Allianz SE | | 1,149,794 | | | 143,639,281 |
| | | | | |
| | | Shares
Held | | Value |
| GERMANY (CONTINUED) | | | | | |
Bayer AG | | 5,149,899 | | $ | 356,834,304 |
Daimler AG | | 6,650,536 | | | 334,831,351 |
Deutsche Post AG | | 7,488,127 | | | 140,259,109 |
Fraport AG | | 763,372 | | | 40,605,844 |
Linde AG | | 3,227,712 | | | 349,899,768 |
Muenchener Rueckversicherungs-Gesellschaft AG | | 1,640,735 | | | 261,777,526 |
| | | | | |
| | | | | 1,627,847,183 |
| HONG KONG - 2.0% | | | | | |
The Bank of East Asia, Ltd. | | 21,134,040 | | | 76,354,749 |
Li & Fung Limited | | 16,282,000 | | | 66,808,292 |
NWS Holdings Limited | | 34,876,746 | | | 67,772,956 |
| | | | | |
| | | | | 210,935,997 |
| INDIA - 2.4% | | | | | |
Housing Development Finance Corporation Ltd. | | 1,248,822 | | �� | 71,777,735 |
ICICI Bank Limited | | 2,180,220 | | | 41,014,241 |
ICICI Bank Limited (DR) | | 3,781,414 | | | 145,811,324 |
| | | | | |
| | | | | 258,603,300 |
| IRELAND - 0.3% | | | | | |
The Governor and Company of the Bank of Ireland(2) | | 7,014,128 | | | 35,103,280 |
| | | | | |
| ITALY - 3.8% | | | | | |
Assicurazioni Generali S.p.A. | | 4,549,408 | | | 124,692,568 |
Banca Monte dei Paschi di Siena S.p.A. | | 33,618,584 | | | 71,924,143 |
Intesa Sanpaolo(2) | | 46,351,919 | | | 205,013,251 |
| | | | | |
| | | | | 401,629,962 |
| JAPAN - 5.9% | | | | | |
ADVANTEST CORPORATION | | 915,900 | | | 25,406,238 |
DENSO CORPORATION | | 3,723,834 | | | 109,518,429 |
JAPAN TOBACCO INC. | | 22,388 | | | 76,817,290 |
MITSUI & CO., LTD. | | 3,733,500 | | | 48,828,931 |
Mitsui Fudosan Co., Ltd. | | 421,250 | | | 7,128,377 |
Mizuho Financial Group, Inc. | | 34,892,200 | | | 69,189,680 |
Sumitomo Mitsui Financial Group, Inc. | | 2,042,200 | | | 71,209,113 |
SUZUKI MOTOR CORPORATION | | 9,263,615 | | | 216,200,896 |
| | | | | |
| | | | | 624,298,954 |
| MEXICO - 1.0% | | | | | |
Grupo Televisa S.A. (DR) | | 5,763,446 | | | 107,142,461 |
| | | | | |
| NETHERLANDS - 8.7% | | | | | |
Akzo Nobel N.V. | | 1,636,135 | | | 101,360,000 |
ASML Holding N.V. | | 15,185,025 | | | 446,641,910 |
13
| | | | | |
| | | Shares
Held | | Value |
| NETHERLANDS (CONTINUED) | | | | | |
Heineken Holding NV | | 2,189,148 | | $ | 89,297,213 |
Heineken NV | | 2,605,835 | | | 120,136,313 |
ING Groep N.V.(2) | | 9,533,795 | | | 170,205,482 |
| | | | | |
| | | | | 927,640,918 |
| RUSSIA - 2.4% | | | | | |
Gazprom (DR) | | 10,789,888 | | | 250,864,896 |
| | | | | |
| SAUDI ARABIA - 0.1% | | | | | |
Almarai Company Ltd., Equity Linked Security, 144A(1)(4)(5)(6) | | 278,912 | | | 12,643,168 |
| | | | | |
| SINGAPORE - 1.6% | | | | | |
Genting Singapore PLC(2) | | 67,198,799 | | | 53,428,925 |
Oversea-Chinese Banking Corporation Limited | | 19,713,900 | | | 109,859,876 |
| | | | | |
| | | | | 163,288,801 |
| SPAIN - 2.5% | | | | | |
Industria de Diseno Textil, S.A. | | 1,753,277 | | | 100,599,375 |
Telefonica S.A. | | 6,075,187 | | | 167,623,186 |
| | | | | |
| | | | | 268,222,561 |
| SWEDEN - 2.5% | | | | | |
AB SKF, Class B | | 4,231,979 | | | 66,472,305 |
Atlas Copco AB, Class A | | 6,497,329 | | | 83,693,997 |
Sandvik AB | | 4,274,723 | | | 47,215,198 |
Skandinaviska Enskilda Banken AB (SEB), Class A(2) | | 9,841,141 | | | 66,347,784 |
| | | | | |
| | | | | 263,729,284 |
| SWITZERLAND - 10.1% | | | | | |
Credit Suisse Group AG | | 2,981,339 | | | 165,422,168 |
Holcim Ltd.(2) | | 3,542,374 | | | 243,040,424 |
Nestle SA | | 5,381,246 | | | 229,311,805 |
Novartis AG | | 2,806,649 | | | 140,427,242 |
Roche Holding AG | | 353,557 | | | 59,125,184 |
Roche Holding AG - Genussscheine(5) | | 1,471,650 | | | 237,866,810 |
| | | | | |
| | | | | 1,075,193,633 |
| TAIWAN - 1.2% | | | | | |
Taiwan Semiconductor Manufacturing Company Ltd. (DR) | | 11,679,533 | | | 128,007,682 |
| | | | | |
| UNITED KINGDOM - 10.2% | | | | | |
Cadbury PLC | | 5,712,282 | | | 73,306,598 |
Experian PLC | | 5,017,535 | | | 42,218,876 |
HSBC Holdings plc | | 18,443,715 | | | 211,604,917 |
Imperial Tobacco Group plc | | 4,563,135 | | | 131,849,845 |
Kingfisher PLC | | 35,168,844 | | | 119,660,727 |
National Grid PLC | | 16,651,187 | | | 160,731,137 |
Smith & Nephew PLC | | 13,927,869 | | | 124,760,806 |
Tesco PLC | | 21,804,052 | | | 139,245,308 |
William Morrison Supermarkets PLC | | 16,702,548 | | | 74,020,238 |
| | | | | |
| | | | | 1,077,398,452 |
| | | | | | | |
| | | Shares
Held | | Value | |
| UNITED STATES - 4.1% | | | | | | | |
Accenture PLC, Class A | | | 340,433 | | $ | 12,687,938 | |
Activision Blizzard, Inc.(2) | | | 5,157,574 | | | 63,902,342 | |
Covidien plc | | | 3,551,851 | | | 153,653,074 | |
Philip Morris International Inc. | | | 3,034,554 | | | 147,904,162 | |
Schlumberger Limited | | | 1,021,022 | | | 60,852,911 | |
| | | | | | | |
| | | | | | 439,000,427 | |
| | | | | | | |
Total common and preferred stocks and equity-linked securities
(Cost $9,157,886,883) | | | | | | 10,505,873,685 | |
| | |
| | | Par
Amount | | | |
SHORT-TERM INVESTMENTS
(CASH EQUIVALENTS) - 1.6% | | | | | | | |
Repurchase agreement with Fixed Income Clearing Corporation, 0.01%, dated 9/30/09, due 10/1/09, maturity value $173,052,048(7)
(Cost $173,052,000) | | $ | 173,052,000 | | | 173,052,000 | |
| | | | | | | |
| | | | | | | |
Total investments - 100.5%
(Cost $9,330,938,883) | | | | | | 10,678,925,685 | |
| | | | | | | |
Other assets less liabilities - (0.5%) | | | | | | (51,070,961 | ) |
| | | | | | | |
| | | | | | | |
Total net assets - 100.0%(8) | | | | | $ | 10,627,854,724 | |
| | | | | | | |
| (1) | Valued at a fair value in accordance with procedures established by the board of directors of Artisan Funds, Inc. In total, securities valued at a fair value were $12,920,464 or 0.1% of total net assets. |
| (2) | Non-income producing security. |
| (3) | Security has been determined to be illiquid under procedures established by the board of directors of Artisan Funds, Inc. In total, the value of securities determined to be illiquid were $277,296, or less than 0.1% of total net assets. |
| (4) | Securities are restricted and were acquired in a transaction under Rule 144A of the Securities Act of 1933. Restricted securities may be resold in transactions exempt from registration normally to qualified institutional buyers. Almarai Company Ltd. was acquired on various dates from August 13, 2009 to September 30, 2009 at an aggregate cost of $12,227,447. Wynn Macau Ltd. was acquired on September 30, 2009 at an aggregate cost of $280,094. In total, the value of restricted securities held by the Fund was $12,920,464 or 0.1% of total net assets. |
| (6) | Security is an equity-linked participation certificate issued by Deutsche Bank AG. As described in Note 2(i)in Notes to Financial Statements, equity-linked participation certificates are subject to counterparty risk with respect to the bank or broker-dealer that issues them. |
| | | | | | | | |
Issuer | | Rate | | | Maturity | | Value |
U.S. Treasury Bond | | 3.125 | % | | 5/15/2019 | | $ | 176,515,575 |
14
| (8) | Percentages for the various classifications relate to total net assets. |
Company names are as reported by a data service provider and in some cases are translations; a company’s legal name may be different.
(DR) Depository Receipt, voting rights may vary.
| | | | | | | |
| PORTFOLIO DIVERSIFICATION - September 30, 2009 | |
| | | Value | | | Percentage
of Total
Net Assets | |
Consumer Discretionary | | $ | 1,291,597,194 | | | 12.1 | % |
Consumer Staples | | | 1,508,789,045 | | | 14.2 | |
Energy | | | 474,616,875 | | | 4.5 | |
Financials | | | 3,262,370,698 | | | 30.7 | |
Healthcare | | | 1,072,667,420 | | | 10.1 | |
Industrials | | | 1,187,343,624 | | | 11.2 | |
Information Technology | | | 676,646,110 | | | 6.4 | |
Materials | | | 703,488,396 | | | 6.6 | |
Telecommunication Services | | | 167,623,186 | | | 1.6 | |
Utilities | | | 160,731,137 | | | 1.5 | |
| | | | | | | |
Total common and preferred stocks | | | 10,505,873,685 | | | 98.9 | |
Short-term investments | | | 173,052,000 | | | 1.6 | |
| | | | | | | |
Total investments | | | 10,678,925,685 | | | 100.5 | |
Other assets less liabilities | | | (51,070,961 | ) | | (0.5 | ) |
| | | | | | | |
Total net assets | | $ | 10,627,854,724 | | | 100.0 | % |
| | | | | | | |
| | | | | | |
| CURRENCY EXPOSURE - September 30, 2009 | | | |
| | | Value | | Percentage
of Total
Investments | |
British pound | | $ | 1,037,825,350 | | 9.7 | % |
Danish krone | | | 101,797,887 | | 0.9 | |
Euro | | | 4,781,726,736 | | 44.8 | |
Hong Kong dollar | | | 810,300,099 | | 7.6 | |
Indian rupee | | | 112,791,976 | | 1.1 | |
Japanese yen | | | 624,298,954 | | 5.8 | |
Singapore dollar | | | 163,288,801 | | 1.5 | |
Swedish krona | | | 263,729,284 | | 2.5 | |
Swiss franc | | | 1,075,193,633 | | 10.1 | |
U.S. dollar | | | 1,707,972,965 | | 16.0 | |
| | | | | | |
Total investments | | $ | 10,678,925,685 | | 100.0 | % |
| | | | | | |
| | | | | |
| TOP TEN HOLDINGS - September 30, 2009 | | | |
Company Name | | Country | | Percentage
of Total
Net Assets | |
ASML Holding N.V. | | Netherlands | | 4.2 | % |
Bayer AG | | Germany | | 3.4 | |
Linde AG | | Germany | | 3.3 | |
Daimler AG | | Germany | | 3.2 | |
Roche Holding AG | | Switzerland | | 2.8 | |
Canadian Pacific Railway Limited | | Canada | | 2.7 | |
Muenchener Rueckversicherungs-Gesellschaft AG | | Germany | | 2.5 | |
Gazprom | | Russia | | 2.4 | |
Pernod Ricard SA | | France | | 2.3 | |
Holcim Ltd. | | Switzerland | | 2.3 | |
| | | | | |
Total | | | | 29.1 | % |
| | | | | |
For the purpose of determining the Fund’s top ten holdings, securities of the same issuer are aggregated to determine the weight in the Fund.
The accompanying notes are an integral part of the financial statements.
15
ARTISAN INTERNATIONAL VALUE FUND
Schedule of Investments – September 30, 2009
| | | | | |
| | | Shares
Held | | Value |
| | | | | |
| COMMON STOCKS AND EQUITY-LINKED SECURITIES - 90.1% | | | | | |
| | | | | |
| BELGIUM - 0.8% | | | | | |
Groupe Bruxelles Lambert S.A. | | 174,287 | | $ | 16,098,295 |
| | | | | |
| CANADA - 0.3% | | | | | |
MDS Inc.(1) | | 831,521 | | | 6,811,226 |
| | | | | |
| CHINA - 0.0%(2) | | | | | |
Wynn Macau Ltd.(1)(3)(4)(5) | | 40,100 | | | 52,156 |
| | | | | |
| FRANCE - 14.1% | | | | | |
Gemalto NV(1) | | 771,434 | | | 35,971,670 |
Publicis Groupe | | 1,608,706 | | | 64,525,833 |
Societe Television Francaise 1 | | 4,812,308 | | | 84,575,452 |
Sodexo | | 727,664 | | | 43,593,991 |
Total SA | | 950,035 | | | 56,450,400 |
| | | | | |
| | | | | 285,117,346 |
| HONG KONG - 3.3% | | | | | |
Guoco Group Limited | | 6,394,600 | | | 67,452,281 |
| | | | | |
| IRELAND - 2.4% | | | | | |
Ryanair Holdings PLC, Equity-Linked Security, 144A(1)(3)(5)(6) | | 9,674,019 | | | 48,521,286 |
| | | | | |
| JAPAN - 6.9% | | | | | |
Credit Saison Co., Ltd. | | 2,566,639 | | | 30,194,071 |
Daiwa Securities Group Inc. | | 6,767,431 | | | 34,905,816 |
MEITEC CORPORATION | | 948,152 | | | 16,097,406 |
SANKYO CO., LTD. | | 763,238 | | | 47,784,744 |
SEINO HOLDINGS CO., LTD. | | 1,095,800 | | | 9,485,174 |
| | | | | |
| | | | | 138,467,211 |
| KOREA - 2.0% | | | | | |
Lotte Chilsung Beverage Co., Ltd. | | 18,021 | | | 12,312,247 |
SK Telecom Co., Ltd. (DR) | | 1,581,567 | | | 27,598,344 |
| | | | | |
| | | | | 39,910,591 |
| MEXICO - 0.7% | | | | | |
Grupo Modelo, S.A. de C.V., Series C(1) | | 3,554,821 | | | 13,237,409 |
| | | | | |
| NETHERLANDS - 1.5% | | | | | |
Wolters Kluwer NV | | 1,460,923 | | | 31,201,777 |
| | | | | |
| | | | | |
| | | Shares
Held | | Value |
| | | | | |
| SINGAPORE - 0.0%(2) | | | | | |
ARA Asset Management Limited | | 42,000 | | $ | 24,151 |
| | | | | |
| SWITZERLAND - 18.8% | | | | | |
Adecco SA | | 1,161,509 | | | 61,757,354 |
Givaudan SA | | 87,448 | | | 65,567,013 |
Nestle SA | | 453,598 | | | 19,329,236 |
Novartis AG | | 1,729,649 | | | 86,540,867 |
Panalpina Welttransport Holding AG | | 717,385 | | | 59,257,123 |
Pargesa Holding SA | | 904,386 | | | 78,107,254 |
Tamedia AG | | 110,411 | | | 8,416,934 |
| | | | | |
| | | | | 378,975,781 |
| UNITED KINGDOM - 26.6% | | | | | |
Cadbury PLC | | 1,910,484 | | | 24,517,537 |
Carpetright PLC | | 1,807,670 | | | 23,125,885 |
Compass Group PLC | | 8,130,336 | | | 49,674,176 |
Diageo plc | | 4,217,596 | | | 64,707,421 |
Experian PLC | | 11,868,964 | | | 99,868,625 |
Home Retail Group plc | | 6,379,227 | | | 27,720,123 |
Lancashire Holdings Ltd | | 3,133,361 | | | 25,588,759 |
Royal Dutch Shell PLC, Class A | | 1,381,965 | | | 39,535,907 |
Savills Plc | | 4,373,849 | | | 23,248,980 |
Signet Jewelers Ltd.(1) | | 3,212,986 | | | 84,597,921 |
Unilever PLC (DR) | | 2,340,290 | | | 67,119,517 |
Vitec Group PLC | | 1,221,882 | | | 7,127,546 |
| | | | | |
| | | | | 536,832,397 |
| UNITED STATES - 12.7% | | | | | |
Accenture PLC, Class A | | 672,488 | | | 25,063,628 |
Arch Capital Group Ltd.(1) | | 1,276,234 | | | 86,196,844 |
Covidien plc | | 1,941,670 | | | 83,996,644 |
Tyco Electronics Ltd. | | 2,785,447 | | | 62,059,759 |
| | | | | |
| | | | | 257,316,875 |
| | | | | |
Total common stocks and equity-linked securities
(Cost $1,630,055,927) | | | | | 1,820,018,782 |
16
| | | | | | |
| | | Par
Amount | | Value |
| | | | | | |
SHORT-TERM INVESTMENTS
(CASH EQUIVALENTS) - 9.3% | | | |
Repurchase agreement with Fixed Income Clearing Corporation,
0.01%, dated 9/30/09, due 10/1/09, maturity value $188,093,052(7)
(Cost $188,093,000) | | $ | 188,093,000 | | $ | 188,093,000 |
| | | | | | |
| | | | | | |
Total investments - 99.4%
(Cost $1,818,148,927) | | | | | | 2,008,111,782 |
| | | | | | |
Other assets less liabilities - 0.6% | | | | | | 11,633,870 |
| | | | | | |
| | | | | | |
Total net assets - 100.0%(8) | | | | | $ | 2,019,745,652 |
| | | | | | |
| (1) | Non-income producing security. |
| (2) | Represents less than 0.1% of total net assets. |
| (3) | Valued at a fair value in accordance with procedures established by the board of directors of Artisan Funds, Inc. In total, securities valued at a fair value were $48,573,442 or 2.4% of total net assets. |
| (4) | Security has been determined to be illiquid under procedures established by the board of directors of Artisan Funds, Inc. In total, the value of securities determined to be illiquid were $52,156, or less than 0.1% of total net assets. |
| (5) | Securities are restricted and were acquired in a transaction under Rule 144A of the Securities Act of 1933. Restricted securities may be resold in transactions exempt from registration normally to qualified institutional buyers. Ryanair Holdings PLC was acquired on various dates from September 17, 2008 to September 23, 2009 at an aggregate cost of $39,429,745. Wynn Macau Ltd. was acquired on September 30, 2009 at an aggregate cost of $52,682. In total, the value of restricted securities held by the Fund was $48,573,442 or 2.4% of total net assets. |
| (6) | Security is an equity-linked participation certificate issued by HSBC Bank plc. As described in Note 2(i) in Notes to Financial Statements, equity-linked participation certificates are subject to counterparty risk with respect to the bank or broker-dealer that issues them. |
| | | | | | | | |
Issuer | | Rate | | | Maturity | | Value |
U.S. Treasury Bond | | 5.125 | % | | 5/15/2016 | | $ | 57,915,000 |
U.S. Treasury Bond | | 2.675 | | | 2/29/2016 | | | 133,942,050 |
| | | | | | | | |
| | | | | | | $ | 191,857,050 |
| | | | | | | | |
| (8) | Percentages for the various classifications relate to total net assets. |
Company names are as reported by a data service provider and in some cases are translations; a company’s legal name may be different.
(DR) Depository Receipt, voting rights may vary.
| | | | | | |
| PORTFOLIO DIVERSIFICATION - September 30, 2009 | |
| | | Value | | Percentage
of Total
Net Assets | |
Consumer Discretionary | | $ | 472,396,538 | | 23.4 | % |
Consumer Staples | | | 201,223,367 | | 10.0 | |
Energy | | | 95,986,307 | | 4.7 | |
Financials | | | 361,816,451 | | 17.9 | |
Healthcare | | | 177,348,737 | | 8.8 | |
Industrials | | | 294,986,968 | | 14.6 | |
Information Technology | | | 123,095,057 | | 6.1 | |
Materials | | | 65,567,013 | | 3.2 | |
Telecommunication Services | | | 27,598,344 | | 1.4 | |
| | | | | | |
Total common stocks | | | 1,820,018,782 | | 90.1 | |
Short-term investments | | | 188,093,000 | | 9.3 | |
| | | | | | |
Total investments | | | 2,008,111,782 | | 99.4 | |
Other assets less liabilities | | | 11,633,870 | | 0.6 | |
| | | | | | |
Total net assets | | $ | 2,019,745,652 | | 100.0 | % |
| | | | | | |
| | | | | | |
| CURRENCY EXPOSURE - SEPTEMBER 30, 2009 | |
| | | Value | | Percentage
of Total
Investments | |
British pound | | $ | 345,579,052 | | 17.2 | % |
Canadian dollar | | | 6,811,226 | | 0.3 | |
Euro | | | 420,474,611 | | 20.9 | |
Hong Kong dollar | | | 67,504,437 | | 3.4 | |
Japanese yen | | | 138,467,211 | | 6.9 | |
Korean won | | | 12,312,247 | | 0.6 | |
Mexican peso | | | 13,237,409 | | 0.7 | |
Singapore dollar | | | 24,151 | | 0.0 | 1 |
Swiss franc | | | 378,975,781 | | 18.9 | |
U.S. dollar | | | 624,725,657 | | 31.1 | |
| | | | | | |
Total investments | | $ | 2,008,111,782 | | 100.0 | % |
| | | | | | |
| (1) | Represents less than 0.1% of total investments. |
17
| | | | | |
| TOP TEN HOLDINGS - SEPTEMBER 30, 2009 | |
Company Name | | Country | | Percentage
of Total
Net Assets | |
Experian PLC | | United Kingdom | | 4.9 | % |
Novartis AG | | Switzerland | | 4.3 | |
Arch Capital Group Ltd. | | United States | | 4.3 | |
Signet Jewelers Ltd. | | United Kingdom | | 4.2 | |
Societe Television Francaise 1 | | France | | 4.2 | |
Covidien plc | | United States | | 4.2 | |
Pargesa Holding SA | | Switzerland | | 3.9 | |
Guoco Group Limited | | Hong Kong | | 3.3 | |
Unilever plc | | United Kingdom | | 3.3 | |
Givaudan SA | | Switzerland | | 3.2 | |
| | | | | |
Total | | | | 39.8 | % |
| | | | | |
For the purpose of determining the Fund’s top ten holdings, securities of the same issuer are aggregated to determine the weight in the Fund.
The accompanying notes are an integral part of the financial statements.
18
ARTISAN MID CAP FUND
Schedule of Investments – September 30, 2009
| | | | | |
| | | Shares
Held | | Value |
| | | | | |
| COMMON STOCKS AND EXCHANGE TRADED FUNDS - 96.4% | | | | | |
| | | | | |
| CONSUMER DISCRETIONARY - 16.0% | | | |
Auto Components - 2.4% | | | | | |
BorgWarner Inc. | | 1,334,099 | | $ | 40,369,836 |
Johnson Controls, Inc. | | 2,278,062 | | | 58,227,265 |
| | | | | |
| | | | | 98,597,101 |
Distributors - 0.8% | | | | | |
LKQ Corporation(1) | | 1,785,901 | | | 33,110,605 |
| | | | | |
Hotels, Restaurants & Leisure - 4.2% | | | | | |
Chipotle Mexican Grill, Inc., Class A(1) | | 226,800 | | | 22,010,940 |
Ctrip.com International Limited (DR)(1)(2) | | 451,600 | | | 26,549,564 |
Home Inns & Hotels Management, Inc. (DR)(1)(2) | | 698,700 | | | 20,856,195 |
Panera Bread Company, Class A(1) | | 378,200 | | | 20,801,000 |
Starbucks Corporation(1) | | 567,283 | | | 11,714,394 |
Starwood Hotels & Resorts Worldwide, Inc. | | 1,475,622 | | | 48,739,795 |
YUM! Brands, Inc. | | 668,932 | | | 22,583,144 |
| | | | | |
| | | | | 173,255,032 |
Household Durables - 0.6% | | | | | |
Harman International Industries, Incorporated | | 683,300 | | | 23,150,204 |
| | | | | |
Multiline Retail - 3.4% | | | | | |
Kohl’s Corporation(1) | | 2,451,064 | | | 139,833,201 |
| | | | | |
Specialty Retail - 3.7% | | | | | |
Best Buy Co., Inc. | | 719,674 | | | 27,002,168 |
CarMax, Inc.(1) | | 1,203,600 | | | 25,155,240 |
Dick’s Sporting Goods, Inc., Class A(1) | | 2,024,300 | | | 45,344,320 |
O’Reilly Automotive, Inc.(1) | | 1,013,900 | | | 36,642,346 |
Williams-Sonoma, Inc. | | 1,018,200 | | | 20,598,186 |
| | | | | |
| | | | | 154,742,260 |
Textiles, Apparel & Luxury Goods - 0.9% | | | | | |
Coach, Inc. | | 1,137,200 | | | 37,436,624 |
| | | | | |
| | | | | |
| | | Shares
Held | | Value |
| | | | | |
| CONSUMER STAPLES - 3.0% | | | | | |
Beverages - 2.1% | | | | | |
Hansen Natural Corporation(1) | | 2,395,912 | | $ | 88,025,807 |
| | | | | |
Food Products - 0.2% | | | | | |
Bunge Limited | | 137,588 | | | 8,614,385 |
| | | | | |
Personal Products - 0.7% | | | | | |
Avon Products, Inc. | | 818,700 | | | 27,803,052 |
| | | | | |
| ENERGY - 2.1% | | | | | |
Energy Equipment & Services - 1.1% | | | | | |
Cameron International Corporation(1) | | 226,400 | | | 8,562,448 |
Dresser-Rand Group Inc.(1) | | 925,896 | | | 28,767,589 |
Smith International, Inc. | | 335,058 | | | 9,616,165 |
| | | | | |
| | | | | 46,946,202 |
Oil, Gas & Consumable Fuels - 1.0% | | | | | |
Range Resources Corporation | | 863,331 | | | 42,614,018 |
| | | | | |
| FINANCIALS - 6.5% | | | | | |
Capital Markets - 3.2% | | | | | |
Greenhill & Co., Inc. | | 554,886 | | | 49,706,688 |
Invesco Limited | | 1,731,915 | | | 39,418,385 |
TD Ameritrade Holding Corporation(1) | | 2,255,300 | | | 44,248,986 |
| | | | | |
| | | | | 133,374,059 |
Commercial Banks - 1.1% | | | | | |
Fifth Third Bancorp | | 2,049,300 | | | 20,759,409 |
HDFC Bank Ltd. (DR)(2) | | 225,948 | | | 26,745,465 |
| | | | | |
| | | | | 47,504,874 |
Diversified Financial Services - 1.6% | | | | | |
CME Group Inc., Class A | | 100,141 | | | 30,862,455 |
IntercontinentalExchange, Inc.(1) | | 365,600 | | | 35,532,664 |
| | | | | |
| | | | | 66,395,119 |
Real Estate Management & Development - 0.6% | | | | | |
The St. Joe Company(1) | | 910,387 | | | 26,510,469 |
| | | | | |
| HEALTHCARE - 17.8% | | | | | |
Health Care Equipment & Supplies - 3.9% | | | | | |
C.R. Bard, Inc. | | 828,955 | | | 65,164,153 |
19
| | | | | |
| | | Shares
Held | | Value |
| | | | | |
| HEALTHCARE (CONTINUED) | | | | | |
Health Care Equipment & Supplies (Continued) | | | | | |
Intuitive Surgical, Inc.(1) | | 172,312 | | $ | 45,188,822 |
NuVasive, Inc.(1) | | 1,196,270 | | | 49,956,235 |
| | | | | |
| | | | | 160,309,210 |
Health Care Providers & Services - 1.2% | | | | | |
Community Health Systems, Inc.(1) | | 1,591,800 | | | 50,826,174 |
| | | | | |
Health Care Technology - 6.3% | | | |
athenahealth, Inc.(1) | | 833,900 | | | 31,996,743 |
Cerner Corporation(1) | | 2,823,700 | | | 211,212,760 |
Quality Systems, Inc. | | 318,161 | | | 19,589,173 |
| | | | | |
| | | | | 262,798,676 |
Life Sciences Tools & Services - 2.2% | | | | | |
Illumina, Inc.(1) | | 2,140,796 | | | 90,983,830 |
| | | | | |
Pharmaceuticals - 4.2% | | | | | |
Allergan, Inc. | | 3,061,861 | | | 173,791,230 |
| | | | | |
| INDUSTRIALS - 13.2% | | | | | |
Aerospace & Defense - 2.4% | | | |
Precision Castparts Corp. | | 982,220 | | | 100,058,751 |
| | | | | |
Air Freight & Logistics - 0.7% | | | |
C.H. Robinson Worldwide, Inc. | | 292,102 | | | 16,868,891 |
Expeditors International of Washington, Inc. | | 395,927 | | | 13,916,834 |
| | | | | |
| | | �� | | 30,785,725 |
Building Products - 0.7% | | | | | |
Owens Corning(1) | | 1,380,363 | | | 30,989,149 |
| | | | | |
Construction & Engineering - 3.2% | | | |
AECOM Technology Corporation(1) | | 274,200 | | | 7,441,788 |
Fluor Corporation | | 1,336,419 | | | 67,956,906 |
Quanta Services, Inc.(1) | | 2,552,128 | | | 56,478,593 |
| | | | | |
| | | | | 131,877,287 |
Electrical Equipment - 2.4% | | | | | |
First Solar, Inc.(1) | | 252,555 | | | 38,605,557 |
Roper Industries, Inc. | | 1,170,054 | | | 59,649,353 |
| | | | | |
| | | | | 98,254,910 |
Machinery - 1.1% | | | | | |
PACCAR Inc | | 1,154,306 | | | 43,528,879 |
| | | | | |
Professional Services - 1.2% | | | | | |
IHS Inc., Class A(1) | | 267,500 | | | 13,677,275 |
Robert Half International Inc. | | 1,415,466 | | | 35,414,959 |
| | | | | |
| | | | | 49,092,234 |
| | | | | |
| | | Shares
Held | | Value |
| | | | | |
| INDUSTRIALS (CONTINUED) | | | | | |
Road & Rail - 1.0% | | | | | |
J.B. Hunt Transport Services, Inc. | | 1,339,226 | | $ | 43,029,331 |
| | | | | |
Trading Companies & Distributors - 0.5% | | | | | |
Watsco, Inc. | | 400,000 | | | 21,564,000 |
| | | | | |
| INFORMATION TECHNOLOGY - 34.7% | | | |
Communications Equipment - 3.6% | | | |
CommScope, Inc.(1) | | 1,332,600 | | | 39,884,718 |
Juniper Networks, Inc.(1) | | 2,543,127 | | | 68,715,292 |
Polycom, Inc.(1) | | 1,128,000 | | | 30,174,000 |
Riverbed Technology, Inc.(1) | | 472,100 | | | 10,367,316 |
| | | | | |
| | | | | 149,141,326 |
Computers & Peripherals - 0.9% | | | |
NetApp, Inc.(1) | | 1,334,975 | | | 35,617,133 |
| | | | | |
Electronic Equipment & Instruments - 3.2% | | | | | |
Agilent Technologies, Inc.(1) | | 3,388,100 | | | 94,290,823 |
Trimble Navigation Limited(1) | | 1,607,099 | | | 38,425,737 |
| | | | | |
| | | | | 132,716,560 |
Internet Software & Services - 1.6% | | | | | |
MercadoLibre, Inc.(1) | | 695,200 | | | 26,737,392 |
NetEase.com, Inc. (DR)(1)(2) | | 302,300 | | | 13,809,064 |
VistaPrint Limited(1) | | 470,200 | | | 23,862,650 |
| | | | | |
| | | | | 64,409,106 |
IT Services - 2.7% | | | | | |
Cognizant Technology Solutions Corporation, Class A(1) | | 709,000 | | | 27,409,940 |
The Western Union Company | | 4,473,347 | | | 84,635,725 |
| | | | | |
| | | | | 112,045,665 |
Semiconductors &
Semiconductor Equipment - 10.2% | | | | | |
Analog Devices, Inc. | | 3,058,566 | | | 84,355,250 |
ARM Holdings PLC (DR)(2) | | 6,828,200 | | | 47,797,400 |
Broadcom Corporation, Class A(1) | | 3,142,019 | | | 96,428,563 |
Cree, Inc.(1) | | 1,585,411 | | | 58,263,854 |
MEMC Electronic Materials, Inc.(1) | | 2,889,098 | | | 48,045,700 |
NVIDIA Corporation(1) | | 5,715,076 | | | 85,897,592 |
| | | | | |
| | | | | 420,788,359 |
Software - 12.5% | | | | | |
Adobe Systems Incorporated(1) | | 439,200 | | | 14,511,168 |
ANSYS, Inc.(1) | | 1,306,000 | | | 48,935,820 |
AsiaInfo Holdings, Inc.(1) | | 663,600 | | | 13,252,092 |
Autodesk, Inc.(1) | | 2,647,337 | | | 63,006,621 |
Blackboard Inc.(1) | | 930,700 | | | 35,161,846 |
Citrix Systems, Inc.(1) | | 2,302,160 | | | 90,313,737 |
Electronic Arts Inc.(1) | | 3,320,035 | | | 63,246,667 |
20
| | | | | | | |
| | | Shares
Held | | Value | |
| | | | | | | |
| INFORMATION TECHNOLOGY (CONTINUED) | | | | |
Software (Continued) | | | | | | | |
Intuit Inc.(1) | | | 536,057 | | $ | 15,277,624 | |
Mc Afee, Inc.(1) | | | 459,728 | | | 20,131,489 | |
Red Hat, Inc.(1) | | | 2,033,688 | | | 56,211,136 | |
salesforce.com, inc.(1) | | | 570,435 | | | 32,474,865 | |
Shanda Interactive Entertainment Ltd, (DR)(1)(2) | | | 390,268 | | | 19,981,722 | |
VMware, Inc., Class A(1) | | | 1,110,402 | | | 44,604,848 | |
| | | | | | | |
| | | | | | 517,109,635 | |
| MATERIALS - 2.4% | | | | | | | |
Chemicals - 2.4% | | | | | | | |
Agrium Inc.(2) | | | 1,177,700 | | | 58,637,683 | |
Ecolab Inc. | | | 875,518 | | | 40,475,197 | |
| | | | | | | |
| | | | | | 99,112,880 | |
| EXCHANGE TRADED FUNDS - 0.7% | | | | |
iShares Russell Midcap Growth Index Fund | | | 683,700 | | | 29,077,761 | |
| | | | | | | |
Total common stocks and exchange traded funds
(Cost $3,327,181,109) | | | | | | 3,995,820,823 | |
| | |
| | | Par
Amount | | | |
SHORT-TERM INVESTMENTS
(CASH EQUIVALENTS) - 3.8% | | | | |
Repurchase agreement with Fixed Income Clearing Corporation, 0.01%, dated 9/30/09, due 10/1/09, maturity value $155,263,043(3)
(Cost $155,263,000) | | $ | 155,263,000 | | | 155,263,000 | |
| | | | | | | |
Total investments - 100.2%
(Cost $3,482,444,109) | | | | | | 4,151,083,823 | |
| | | | | | | |
Other assets less liabilities - (0.2%) | | | (8,018,140 | ) |
| | | | | | | |
| | | | | | | |
Total net assets - 100.0%(4) | | | | | $ | 4,143,065,683 | |
| | | | | | | |
| (1) | Non-income producing security. |
| (2) | The Fund considers the company to be from outside of the United States. See the Fund’s Statement of Additional Information for information on how a particular country is assigned. |
| | | | |
Security | | Country | | Trading Currency |
Agrium Inc. | | Canada | | U.S. dollar |
ARM Holdings PLC (DR) | | United Kingdom | | |
Ctrip.com International Limited (DR) | | China | | U.S. dollar |
HDFC Bank Ltd. (DR) | | India | | U.S. dollar |
Home Inns & Hotels Management, Inc. (DR) | | China | | U.S. dollar |
NetEase.com, Inc. (DR) | | China | | U.S. dollar |
Shanda Interactive Entertainment Ltd, (DR) | | China | | U.S. dollar |
| | | | | | | | |
Issuer | | Rate | | | Maturity | | Value |
U.S. Treasury Bond | | 3.125 | % | | 8/31/2013 | | $ | 158,370,849 |
| (4) | Percentages for the various classifications relate to total net assets. |
Company names are as reported by a data service provider and in some cases are translations; a company’s legal name may be different.
(DR) Depository Receipt, voting rights may vary.
| | | | | |
| TOP TEN HOLDINGS - SEPTEMBER 30, 2009 | |
Company Name | | Country | | Percentage
of Total
Net Assets | |
Cerner Corporation | | United States | | 5.1 | % |
Allergan, Inc. | | United States | | 4.2 | |
Kohl’s Corporation | | United States | | 3.4 | |
Precision Castparts Corp. | | United States | | 2.4 | |
Broadcom Corporation | | United States | | 2.3 | |
Agilent Technologies, Inc. | | United States | | 2.3 | |
Illumina, Inc. | | United States | | 2.2 | |
Citrix Systems, Inc. | | United States | | 2.2 | |
Hansen Natural Corporation | | United States | | 2.1 | |
NVIDIA Corporation | | United States | | 2.1 | |
| | | | | |
Total | | | | 28.3 | % |
| | | | | |
For the purpose of determining the Fund’s top ten holdings, securities of the same issuer are aggregated to determine the weight in the Fund.
The accompanying notes are an integral part of the financial statements.
21
ARTISAN FUNDS, INC.
Statements of Assets and Liabilities – September 30, 2009
| | | | |
| | | EMERGING MARKETS | |
| ASSETS: | | | | |
Investments in securities, unaffiliated, at value | | $ | 148,592,809 | |
Short-term investments (repurchase agreements), at value | | | 6,031,000 | |
| | | | |
Total investments | | | 154,623,809 | |
Cash | | | 199 | |
Foreign currency | | | 96,453 | |
Net unrealized gain on foreign currency forward contracts | | | 507 | |
Receivable from investments sold | | | 371,353 | |
Receivable from fund shares sold | | | 1,341,126 | |
Dividends and interest receivable | | | 231,874 | |
Receivable from Adviser | | | 376,318 | |
Other assets | | | 1,157 | |
| | | | |
Total assets | | | 157,042,796 | |
| |
| LIABILITIES: | | | | |
Net unrealized loss on foreign currency forward contracts | | | - | |
Payable for investments purchased | | | 1,838,646 | |
Payable for fund shares redeemed | | | 20,738 | |
Payable for operating expenses | | | 662,577 | |
Payable for withholding taxes | | | 110,558 | |
Payable for deferred directors’ compensation | | | 1,157 | |
| | | | |
Total liabilities | | | 2,633,676 | |
| | | | |
Total net assets | | $ | 154,409,120 | |
| | | | |
| NET ASSETS CONSIST OF: | | | | |
Fund shares issued and outstanding | | $ | 159,841,686 | |
Net unrealized appreciation on investments and foreign currency related transactions | | | 22,019,766 | |
Accumulated undistributed net investment income (loss) | | | 716,697 | |
Accumulated undistributed net realized (losses) on investments and foreign currency related transactions | | | (28,169,029 | ) |
| | | | |
| | $ | 154,409,120 | |
| | | | |
| SUPPLEMENTARY INFORMATION: | | | | |
Net assets | | | | |
Investor Shares | | | | |
Institutional Shares | | $ | 103,963,013 | |
Advisor Shares | | $ | 50,446,107 | |
Shares outstanding (Indefinite number of shares authorized, $0.01 par value) | | | | |
Investor Shares | | | | |
Institutional Shares | | | 7,985,335 | |
Advisor Shares | | | 3,871,671 | |
Net asset value, offering price and redemption price per share | | | | |
Investor Shares | | | | |
Institutional Shares | | $ | 13.02 | |
Advisor Shares | | $ | 13.03 | |
Cost of securities of unaffiliated issuers held | | $ | 132,523,215 | |
Cost of foreign currency | | $ | 95,406 | |
22
| | | | | | | | | | |
| INTERNATIONAL | | | INTERNATIONAL VALUE | | | MID CAP | |
| | | | | | | | | | |
| $ | 10,505,873,685 | | | $ | 1,820,018,782 | | | $ | 3,995,820,823 | |
| | 173,052,000 | | | | 188,093,000 | | | | 155,263,000 | |
| | | | | | | | | | | |
| | 10,678,925,685 | | | | 2,008,111,782 | | | | 4,151,083,823 | |
| | 128 | | | | 72 | | | | 797 | |
| | 401,835 | | | | 16 | | | | - | |
| | - | | | | 31,686 | | | | - | |
| | 79,915,581 | | | | - | | | | 8,506,032 | |
| | 15,057,002 | | | | 19,591,785 | | | | 4,225,717 | |
| | 24,476,100 | | | | 4,607,585 | | | | 1,109,475 | |
| | - | | | | - | | | | - | |
| | 290,183 | | | | 30,150 | | | | 107,914 | |
| | | | | | | | | | | |
| | 10,799,066,514 | | | | 2,032,373,076 | | | | 4,165,033,758 | |
| | |
| | | | | | | | | | |
| | 143,792 | | | | - | | | | - | |
| | 130,423,363 | | | | 11,021,070 | | | | 17,097,320 | |
| | 34,907,700 | | | | 1,011,916 | | | | 3,095,952 | |
| | 2,981,648 | | | | 476,236 | | | | 1,666,889 | |
| | 2,465,104 | | | | 88,052 | | | | - | |
| | 290,183 | | | | 30,150 | | | | 107,914 | |
| | | | | | | | | | | |
| | 171,211,790 | | | | 12,627,424 | | | | 21,968,075 | |
| | | | | | | | | | | |
| $ | 10,627,854,724 | | | $ | 2,019,745,652 | | | $ | 4,143,065,683 | |
| | | | | | | | | | | |
| | | | | | | | | | |
| $ | 11,868,599,481 | | | $ | 1,967,058,381 | | | $ | 4,266,824,330 | |
| | 1,346,777,765 | | | | 190,022,967 | | | | 668,639,714 | |
| | 129,049,002 | | | | 13,816,491 | | | | (104,290 | ) |
| | (2,716,571,524 | ) | | | (151,152,187 | ) | | | (792,294,071 | ) |
| | | | | | | | | | | |
| $ | 10,627,854,724 | | | $ | 2,019,745,652 | | | $ | 4,143,065,683 | |
| | | | | | | | | | | |
| | | | | | | | | | |
| | | | | | | | | | |
| $ | 7,715,112,723 | | | $ | 1,739,544,556 | | | $ | 3,688,551,659 | |
| $ | 2,912,742,001 | | | $ | 280,201,096 | | | $ | 454,514,024 | |
| | | | | | | | | | |
| | | | | | | | | | |
| | 382,746,599 | | | | 76,204,498 | | | | 151,891,040 | |
| | 143,548,544 | | | | 12,273,119 | | | | 18,182,226 | |
| | | | | | | | | | |
| | | | | | | | | | |
| $ | 20.16 | | | $ | 22.83 | | | $ | 24.28 | |
| $ | 20.29 | | | $ | 22.83 | | | $ | 25.00 | |
| | | | | | | | | | |
| $ | 9,330,938,883 | | | $ | 1,818,148,927 | | | $ | 3,482,444,109 | |
| $ | 373,953 | | | $ | 16 | | | $ | - | |
The accompanying notes are an integral part of the financial statements.
23
ARTISAN FUNDS, INC.
Statements of Operations – For the Year Ended September 30, 2009
| | | | |
| | | EMERGING MARKETS | |
| INVESTMENT INCOME: | | | | |
Dividends, from unaffiliated issuers(1) | | $ | 1,888,065 | |
Dividends, from affiliated issuers(1) | | | - | |
Interest | | | 5,254 | |
Other | | | - | |
| | | | |
Total investment income | | | 1,893,319 | |
| |
| EXPENSES: | | | | |
Advisory fees | | | 805,184 | |
Transfer agent fees | | | | |
Investor Shares | | | | |
Institutional Shares | | | 19,255 | |
Advisor Shares | | | 93,687 | |
Shareholder communications | | | | |
Investor Shares | | | | |
Institutional Shares | | | 5,030 | |
Advisor Shares | | | 25,587 | |
Custodian fees | | | 346,339 | |
Accounting fees | | | 56,567 | |
Professional fees | | | 92,036 | |
Less insurance recoveries(2) | | | - | |
| | | | |
Net professional fees | | | 92,036 | |
Registration fees | | | | |
Investor Shares | | | | |
Institutional Shares | | | 41,129 | |
Advisor Shares | | | 30,429 | |
Directors’ fees | | | 6,000 | |
Other operating expenses | | | 5,337 | |
| | | | |
Total operating expenses | | | 1,526,580 | |
Less amounts waived or paid by the Adviser | | | (376,318 | ) |
| | | | |
Net expenses | | | 1,150,262 | |
| | | | |
Net investment income (loss) | | | 743,057 | |
| |
| NET REALIZED AND UNREALIZED GAINS (LOSSES) ON INVESTMENTS: | | | | |
Net realized gain (loss) on: | | | | |
Investments(1) | | | (26,362,147 | ) |
Foreign currency related transactions | | | (230,806 | ) |
| | | | |
| | | (26,592,953 | ) |
Net increase (decrease) in unrealized appreciation or depreciation on: | | | | |
Investments | | | 52,745,622 | |
Foreign currency related transactions | | | 20,169 | |
| | | | |
| | | 52,765,791 | |
| | | | |
Net gain (loss) on investments and foreign currency related transactions | | | 26,172,838 | |
| | | | |
Net increase in net assets resulting from operations | | $ | 26,915,895 | |
| | | | |
| | | | | | | | | | | | |
| | | Fund | | Net of foreign taxes
withheld on dividends,
unaffiliated issuers | | Net of foreign taxes
withheld on dividends,
affiliated issuers | | Including net realized
(loss) on investments
from affiliated issuers | |
| | Emerging Markets | | $ | 199,059 | | $ | - | | $ | - | |
| | International | | | 27,362,067 | | | - | | | (68,638,629 | ) |
| | International Value | | | 2,250,235 | | | - | | | (7,840,431 | ) |
| | Mid Cap | | | 4,066 | | | - | | | (42,928,022 | ) |
| (2) | For the year ended September 30, 2009, International Fund incurred $246,062 in total professional fees. As described in Note (9) in Notes to Financial Statements, International Fund received $219,395 in insurance recoveries relating to reimbursement of litigation defense costs, which amount was recorded as a reduction to professional fees during the year ended September 30, 2009. |
24
| | | | | | | | | | |
| INTERNATIONAL | | | INTERNATIONAL VALUE | | | MID CAP | |
| | | | | | | | | | |
| $ | 226,716,729 | | | $ | 25,732,161 | | | $ | 21,107,231 | |
| | 959,558 | | | | - | | | | - | |
| | 205,342 | | | | 59,682 | | | | 85,857 | |
| | 4,093,998 | | | | - | | | | - | |
| | | | | | | | | | | |
| | 231,975,627 | | | | 25,791,843 | | | | 21,193,088 | |
| | |
| | | | | | | | | | |
| | 79,830,684 | | | | 11,395,382 | | | | 30,398,188 | |
| | | | | | | | | | |
| | 13,229,265 | | | | 2,056,801 | | | | 7,047,423 | |
| | 25,164 | | | | 19,224 | | | | 19,755 | |
| | | | | | | | | | |
| | | | | | | | | | |
| | 1,178,354 | | | | 92,869 | | | | 538,637 | |
| | 32,650 | | | | 5,415 | | | | 6,857 | |
| | | | | | | | | | |
| | 3,901,133 | | | | 365,064 | | | | 95,143 | |
| | 71,686 | | | | 73,719 | | | | 55,396 | |
| | 246,062 | | | | 95,601 | | | | 166,866 | |
| | (219,395 | ) | | | - | | | | - | |
| | | | | | | | | | | |
| | 26,667 | | | | 95,601 | | | | 166,866 | |
| | | | | | | | | | |
| | 156,598 | | | | 69,266 | | | | 78,169 | |
| | 24,545 | | | | 15,722 | | | | 16,559 | |
| | | | | | | | | | |
| | 448,629 | | | | 55,539 | | | | 167,299 | |
| | 287,677 | | | | 35,854 | | | | 100,322 | |
| | | | | | | | | | | |
| | 99,213,052 | | | | 14,280,456 | | | | 38,690,614 | |
| | - | | | | - | | | | - | |
| | | | | | | | | | | |
| | 99,213,052 | | | | 14,280,456 | | | | 38,690,614 | |
| | | | | | | | | | | |
| | 132,762,575 | | | | 11,511,387 | | | | (17,497,526 | ) |
| | |
| | | | | | | | | | |
| | | | | | | | | | |
| | (2,628,919,339 | ) | | | (139,186,395 | ) | | | (769,509,214 | ) |
| | (2,414,432 | ) | | | 9,770,470 | | | | - | |
| | | | | | | | | | | |
| | (2,631,333,771 | ) | | | (129,415,925 | ) | | | (769,509,214 | ) |
| | | | | | | | | | |
| | 2,629,216,166 | | | | 299,492,429 | | | | 792,263,717 | |
| | 613,814 | | | | 548,147 | | | | - | |
| | | | | | | | | | | |
| | 2,629,829,980 | | | | 300,040,576 | | | | 792,263,717 | |
| | | | | | | | | | | |
| | (1,503,791 | ) | | | 170,624,651 | | | | 22,754,503 | |
| | | | | | | | | | | |
| $ | 131,258,784 | | | $ | 182,136,038 | | | $ | 5,256,977 | |
| | | | | | | | | | | |
The accompanying notes are an integral part of the financial statements.
25
ARTISAN FUNDS, INC.
Statements of Changes in Net Assets
| | | | | | | | |
| | | EMERGING MARKETS | |
| | | Year Ended
9/30/2009 | | | Year Ended
9/30/2008 | |
| OPERATIONS: | | | | | | | | |
Net investment income (loss) | | $ | 743,057 | | | $ | 875,308 | |
Net realized gain (loss) on: | | | | | | | | |
Investments | | | (26,362,147 | ) | | | (1,369,976 | ) |
Foreign currency related transactions | | | (230,806 | ) | | | (80,293 | ) |
Net increase (decrease) in unrealized appreciation or depreciation on: | | | | | | | | |
Investments | | | 52,745,622 | | | | (33,499,682 | ) |
Foreign currency related transactions | | | 20,169 | | | | (82,858 | ) |
| | | | | | | | |
Net increase (decrease) in net assets resulting from operations | | | 26,915,895 | | | | (34,157,501 | ) |
| | |
| DISTRIBUTIONS PAID TO SHAREHOLDERS: | | | | | | | | |
Net investment income: | | | | | | | | |
Investor Shares | | | | | | | | |
Institutional Shares | | | (747,694 | ) | | | (39,728 | ) |
Advisor Shares | | | (51,612 | ) | | | - | |
Net realized gains on investment transactions: | | | | | | | | |
Investor Shares | | | | | | | | |
Institutional Shares | | | (59,063 | ) | | | (1,484,717 | ) |
Advisor Shares | | | (4,077 | ) | | | - | |
| | | | | | | | |
Total distributions paid to shareholders | | | (862,446 | ) | | | (1,524,445 | ) |
| | |
| FUND SHARE ACTIVITIES: | | | | | | | | |
Net increase (decrease) in net assets resulting from fund share activities | | | 55,346,259 | | | | 90,274,995 | |
| | | | | | | | |
Total increase (decrease) in net assets | | | 81,399,708 | | | | 54,593,049 | |
| | | | | | | | |
Net assets, beginning of period | | | 73,009,412 | | | | 18,416,363 | |
| | | | | | | | |
Net assets, end of period | | $ | 154,409,120 | | | $ | 73,009,412 | |
| | | | | | | | |
| | |
Accumulated undistributed net investment income (loss) | | $ | 716,697 | | | $ | 805,727 | |
| | | | | | | | |
26
| | | | | | | | | | | | | | | | | | | | | | |
| INTERNATIONAL | | | INTERNATIONAL VALUE | | | MID CAP | |
Year Ended
9/30/20009 | | | Year Ended
9/30/2008 | | | Year Ended
9/30/2009 | | | Year Ended
9/30/2008 | | | Year Ended
9/30/2009 | | | Year Ended
9/30/2008 | |
| | | | | | | | | | | | | | | | | | | | | | |
| $ | 132,762,575 | | | $ | 217,906,295 | | | $ | 11,511,387 | | | $ | 28,452,080 | | | $ | (17,497,526 | ) | | $ | (38,496,793 | ) |
| | | | | | | | | | | | | | | | | | | | | | |
| | (2,628,919,339 | ) | | | 660,360,491 | | | | (139,186,395 | ) | | | 4,267,300 | | | | (769,509,214 | ) | | | 258,568,758 | |
| | (2,414,432 | ) | | | (5,330,672 | ) | | | 9,770,470 | | | | (125,520 | ) | | | - | | | | 638 | |
| | | | | | | | | | | | | | | | | | | | | | |
| | 2,629,216,166 | | | | (6,035,684,040 | ) | | | 299,492,429 | | | | (339,642,758 | ) | | | 792,263,717 | | | | (1,548,010,123 | ) |
| | 613,814 | | | | (1,742,370 | ) | | | 548,147 | | | | (559,100 | ) | | | - | | | | (227 | ) |
| | | | | | | | | | | | | | | | | | | | | | | |
| | 131,258,784 | | | | (5,164,490,296 | ) | | | 182,136,038 | | | | (307,607,998 | ) | | | 5,256,977 | | | | (1,327,937,747 | ) |
| | | | | |
| | | | | | | | | | | | | | | | | | | | | | |
| | | | | | | | | | | | | | | | | | | | | | |
| | (73,117,872 | ) | | | (77,647,652 | ) | | | (10,176,045 | ) | | | (26,380,830 | ) | | | - | | | | - | |
| | (37,487,951 | ) | | | (38,324,885 | ) | | | (2,362,145 | ) | | | (4,772,229 | ) | | | - | | | | - | |
| | | | | | | | | | | | | | | | | | | | | | |
| | | | | | | | | | | | | | | | | | | | | | |
| | (274,728,222 | ) | | | (1,707,284,385 | ) | | | - | | | | (86,616,796 | ) | | | (40,893,720 | ) | | | (883,929,699 | ) |
| | (101,344,058 | ) | | | (637,085,303 | ) | | | - | | | | (13,775,532 | ) | | | (5,219,106 | ) | | | (121,786,964 | ) |
| | | | | | | | | | | | | | | | | | | | | | |
| | | | | | | | | | | | | | | | | | | | | | | |
| | (486,678,103 | ) | | | (2,460,342,225 | ) | | | (12,538,190 | ) | | | (131,545,387 | ) | | | (46,112,826 | ) | | | (1,005,716,663 | ) |
| | | | | |
| | | | | | | | | | | | | | | | | | | | | | |
| | (820,456,337 | ) | | | 1,569,193,725 | | | | 634,624,462 | | | | (158,902,687 | ) | | | (85,588,305 | ) | | | 498,434,390 | |
| | | | | | | | | | | | | | | | | | | | | | | |
| | (1,175,875,656 | ) | | | (6,055,638,796 | ) | | | 804,222,310 | | | | (598,056,072 | ) | | | (126,444,154 | ) | | | (1,835,220,020 | ) |
| | | | | | | | | | | | | | | | | | | | | | | |
| | 11,803,730,380 | | | | 17,859,369,176 | | | | 1,215,523,342 | | | | 1,813,579,414 | | | | 4,269,509,837 | | | | 6,104,729,857 | |
| | | | | | | | | | | | | | | | | | | | | | | |
| $ | 10,627,854,724 | | | $ | 11,803,730,380 | | | $ | 2,019,745,652 | | | $ | 1,215,523,342 | | | $ | 4,143,065,683 | | | $ | 4,269,509,837 | |
| | | | | | | | | | | | | | | | | | | | | | | |
| | | | | |
| $ | 129,049,002 | | | $ | 109,355,577 | | | $ | 13,816,491 | | | $ | 5,072,824 | | | $ | (104,290 | ) | | $ | (74,763 | ) |
| | | | | | | | | | | | | | | | | | | | | | | |
The accompanying notes are an integral part of the financial statements.
27
ARTISAN FUNDS, INC.
Financial Highlights – For a share outstanding throughout each period
The financial highlights table is intended to help you understand the Funds’ financial performance for the past 5 years or, if shorter, the period of a Fund’s operations. Certain information reflects financial results for a single Fund share. The total returns in the table represent the rate that an investor would have earned or lost on an investment in the Fund (assuming reinvestment of all dividends and distributions). This information has been audited by Ernst & Young LLP, whose report, along with each Fund’s financial statements, are included in this annual report.
| | | | | | | | | | | | | | | | | | | | | | | |
Year or
Period
Ended | | |
Net Asset
Value
Beginning
of Period | | Net
Investment
Income(1) | | Net Realized
and Unrealized
Gain (Loss) on
Investments | | | Total Income
(Loss) from
Investment
Operations | | | Dividends
from Net
Investment
Income | | | Distributions
from Net
Realized Gains | |
| | | | | | | | | | | | | | | | | | | | | | | |
ARTISAN EMERGING MARKETS FUND | |
| Institutional Shares | | | | | | | | | | | | | | | | | | | | | | | |
| 9/30/2009 | | | $ | 11.15 | | $ | 0.09 | | $ | 1.91 | | | $ | 2.00 | | | $ | (0.12 | ) | | $ | (0.01 | ) |
| 9/30/2008 | | | | 16.71 | | | 0.18 | | | (5.41 | ) | | | (5.23 | ) | | | (0.01 | ) | | | (0.32 | ) |
| 9/30/2007 | | | | 11.15 | | | 0.09 | | | 5.81 | | | | 5.90 | | | | (0.03 | ) | | | (0.31 | ) |
| 9/30/2006 | (5) | | | 10.00 | | | 0.03 | | | 1.12 | | | | 1.15 | | | | - | | | | - | |
| | | | | | | | | | | | | | | | | | | | | | | |
ARTISAN INTERNATIONAL FUND | |
| Institutional Shares | | | | | | | | | | | | | | | | | | | | | | | |
| 9/30/2009 | | | $ | 20.51 | | $ | 0.28 | | $ | 0.46 | | | $ | 0.74 | | | $ | (0.26 | ) | | $ | (0.70 | ) |
| 9/30/2008 | | | | 33.99 | | | 0.42 | | | (9.16 | ) | | | (8.74 | ) | | | (0.27 | ) | | | (4.47 | ) |
| 9/30/2007 | | | | 28.92 | | | 0.37 | | | 7.52 | | | | 7.89 | | | | (0.49 | ) | | | (2.33 | ) |
| 9/30/2006 | | | | 24.54 | | | 0.22 | | | 4.62 | | | | 4.84 | | | | (0.46 | ) | | | - | |
| 9/30/2005 | | | | 19.44 | | | 0.25 | | | 5.01 | | | | 5.26 | | | | (0.16 | ) | | | - | |
| (1) | Computed based on average shares outstanding. |
| (2) | Periods less than twelve months (where applicable) are not annualized. |
| (3) | Periods less than twelve months (where applicable) are annualized. |
| (4) | The ratios of expenses to average net assets and net investment income (loss) to average net assets exclude expenses waived or paid by the Adviser or the board of directors. Absent expenses waived or paid by the Adviser or the board of directors, the ratios of expenses to average net assets and net investment income (loss) to average net assets would have been as follows: |
| | | | | | | | |
| | | Year or
Period Ended | | Ratio of Expenses to
Average Net Assets | | | Ratio of Net Investment Income
(Loss) to Average Net Assets | |
Emerging Markets Institutional Shares | | 9/30/2009 | | 1.81 | % | | 0.71 | % |
| | 9/30/2008 | | 1.51 | % | | 1.16 | % |
| | 9/30/2007 | | 3.19 | % | | (1.08 | )% |
| | 9/30/2006 | | 7.58 | % | | (5.11 | )% |
| (5) | For the period from commencement of operations (June 26, 2006) through September 30, 2006. |
28
| | | | | | | | | | | | | | | | | | | | |
Total
Distributions | | | Net Asset
Value
End
of Period | | Total
Return(2) | | | Net Assets
End of
Period
(millions) | | Ratio of
Expenses
to Average
Net Assets(3)(4) | | | Ratio of Net
Investment
Income
to Average
Net Assets(3)(4) | | | Portfolio
Turnover
Rate(2) | |
| | | | | | | | | | | | | | | | | | | | |
| | | | | | | | | | | | | | | | | | | | | |
| | | | | | | | | | | | | | | | | | | | | |
| $ | (0.13 | ) | | $ | 13.02 | | 18.66 | % | | $ | 104.0 | | 1.50 | % | | 1.02 | % | | 56.88 | % |
| | (0.33 | ) | | | 11.15 | | (31.91 | ) | | | 69.8 | | 1.50 | | | 1.17 | | | 42.24 | |
| | (0.34 | ) | | | 16.71 | | 53.99 | | | | 18.4 | | 1.44 | | | 0.67 | | | 71.28 | |
| | - | | | | 11.15 | | 11.50 | | | | 5.9 | | 1.40 | | | 1.07 | | | 24.26 | |
| | | | | | | | | | | | | | | | | | | | |
| | | | | | | | | | | | | | | | | | | | | |
| | | | | | | | | | | | | | | | | | | | | |
| $ | (0.96 | ) | | $ | 20.29 | | 5.25 | % | | $ | 2,912.7 | | 0.99 | % | | 1.76 | % | | 82.38 | % |
| | (4.74 | ) | | | 20.51 | | (29.83 | ) | | | 3,043.8 | | 0.98 | | | 1.50 | | | 54.42 | |
| | (2.82 | ) | | | 33.99 | | 28.99 | | | | 5,049.3 | | 0.98 | | | 1.22 | | | 66.30 | |
| | (0.46 | ) | | | 28.92 | | 20.07 | | | | 4,116.0 | | 1.00 | | | 0.82 | | | 57.80 | |
| | (0.16 | ) | | | 24.54 | | 27.21 | | | | 3,988.1 | | 0.99 | | | 1.11 | | | 56.15 | |
The accompanying notes are an integral part of the financial statements.
29
ARTISAN FUNDS, INC.
Financial Highlights – For a share outstanding throughout each period (Continued)
| | | | | | | | | | | | | | | | | | | | | | | |
| | | | | | |
Year or
Period
Ended | | Net Asset
Value
Beginning
of Period | | Net
Investment
Income
(Loss)(1) | | | Net Realized
and Unrealized
Gain (Loss) on
Investments | | | Total Income
(Loss) from
Investment
Operations | | | Dividends
from Net
Investment
Income | | | Distributions
from Net
Realized Gains | |
| | | | | | | | | | | | | | | | | | | | | | | |
ARTISAN INTERNATIONAL VALUE FUND | | | | | | | | | | | | | | | | | |
| Institutional Shares | | | | | | | | | | | | | | | | | | | | | | | |
| 9/30/2009 | | $ | 21.22 | | $ | 0.21 | | | $ | 1.66 | | | $ | 1.87 | | | $ | (0.26 | ) | | $ | - | |
| 9/30/2008 | | | 28.53 | | | 0.52 | | | | (5.58 | ) | | | (5.06 | ) | | | (0.58 | ) | | | (1.67 | ) |
| 9/30/2007 | | | 26.71 | | | 0.41 | | | | 3.14 | | | | 3.55 | | | | (0.45 | ) | | | (1.28 | ) |
| | | | | | | | | | | | | | | | | | | | | | | |
ARTISAN MID CAP FUND | | | | | | | | | | | | | | | | | | | | |
| Institutional Shares | | | | | | | | | | | | | | | | | | | | | | | |
| 9/30/2009 | | $ | 24.71 | | $ | (0.06 | ) | | $ | 0.63 | | | $ | 0.57 | | | $ | - | | | $ | (0.28 | ) |
| 9/30/2008 | | | 37.78 | | | (0.14 | ) | | | (7.03 | ) | | | (7.17 | ) | | | - | | | | (5.90 | ) |
| 9/30/2007 | | | 32.24 | | | (0.16 | ) | | | 9.17 | | | | 9.01 | | | | - | | | | (3.47 | ) |
| 9/30/2006 | | | 31.21 | | | (0.10 | ) | | | 2.46 | | | | 2.36 | | | | - | | | | (1.33 | ) |
| 9/30/2005 | | | 26.38 | | | (0.12 | ) | | | 4.95 | | | | 4.83 | | | | - | | | | - | |
| (1) | Computed based on average shares outstanding. |
| (2) | Periods less than twelve months (where applicable) are not annualized. |
| (3) | Periods less than twelve months (where applicable) are annualized. |
30
| | | | | | | | | | | | | | | | | | | | |
Total
Distributions | | | Net Asset
Value
End
of Period | | Total
Return(2) | | | Net Assets
End of
Period
(millions) | | Ratio of
Expenses
to Average
Net Assets(3) | | | Ratio of Net
Investment
Income (Loss)
to Average
Net Assets(3) | | | Portfolio
Turnover
Rate(2) | |
| | | | | | | | | | | | | | | | | | | | |
| | | | | | | | | | | | | | | | | | | | | |
| | | | | | | | | | | | | | | | | | | | | |
| $ | (0.26 | ) | | $ | 22.83 | | 9.14 | % | | $ | 280.2 | | 1.04 | % | | 1.17 | % | | 55.49 | % |
| | (2.25 | ) | | | 21.22 | | (18.92 | ) | | | 186.1 | | 1.03 | | | 2.10 | | | 44.72 | |
| | (1.73 | ) | | | 28.53 | | 13.48 | | | | 218.9 | | 1.06 | | | 1.47 | | | 45.60 | |
| | | | | | | | | | | | | | | | | | | | |
| | | | | | | | | | | | | | | | | | | | | |
| | | | | | | | | | | | | | | | | | | | | |
| $ | (0.28 | ) | | $ | 25.00 | | 2.77 | % | | $ | 454.5 | | 0.97 | % | | (0.32 | )% | | 68.39 | % |
| | (5.90 | ) | | | 24.71 | | (22.23 | ) | | | 537.2 | | 0.95 | | | (0.46 | ) | | 79.76 | |
| | (3.47 | ) | | | 37.78 | | 30.17 | | | | 785.4 | | 0.95 | | | (0.47 | ) | | 71.04 | |
| | (1.33 | ) | | | 32.24 | | 7.66 | | | | 797.9 | | 0.95 | | | (0.31 | ) | | 73.59 | |
| | - | | | | 31.21 | | 18.35 | | | | 981.3 | | 0.95 | | | (0.40 | ) | | 83.00 | |
The accompanying notes are an integral part of the financial statements.
31
ARTISAN FUNDS, INC.
Notes to Financial Statements – September 30, 2009
Artisan Funds, Inc. (“Artisan Funds”) was incorporated on January 5, 1995, as a Wisconsin corporation and is registered under the Investment Company Act of 1940, as amended. Artisan Funds is a series comprised of eleven open-end, diversified mutual funds. Artisan Emerging Markets Fund (“Emerging Markets Fund” or “Emerging Markets”), Artisan International Fund (“International Fund” or “International”), Artisan International Value Fund (“International Value Fund” or “International Value”) and Artisan Mid Cap Fund (“Mid Cap Fund” or “Mid Cap”), each a series of Artisan Funds (each a “Fund,” and collectively, the “Funds”), commenced operations on June 26, 2006, December 28, 1995, September 23, 2002 and June 27, 1997, respectively. Each Fund’s investment objective is to seek long-term capital growth.
Emerging Markets Fund offers shares of capital stock of two classes – Institutional Shares and Advisor Shares – and has offered Institutional Shares since the commencement of operations and began offering Advisor Shares on June 2, 2008. Advisor Shares are sold to employee benefit plans, clients of financial advisors, clients of sponsored programs and institutional or other investors. All investments and exchanges are subject to approval by the Fund. International Fund, International Value Fund and Mid Cap Fund offer shares of capital stock of two classes – Institutional Shares and Investor Shares – and have offered Investor Shares since the commencement of operations. International Fund, International Value Fund and Mid Cap Fund began offering Institutional Shares on July 1, 1997, October 1, 2006 and July 1, 2000, respectively. Institutional Shares are sold to institutional investors meeting certain minimum investment requirements.
Each class of shares has equal rights with respect to portfolio assets and voting privileges. Each class has exclusive voting rights with respect to any matters involving only that class.
Income, expenses not specific to a particular class and realized and unrealized gains and losses were allocated daily to each class of shares based upon the relative net asset value of outstanding shares. Expenses attributable to a particular class of shares, such as transfer agency fees, shareholder communication expenses and registration fees, were allocated directly to that class.
Each Fund is managed by Artisan Partners Limited Partnership (the “Adviser”). The Adviser is wholly owned by Artisan Partners Holdings LP (“Artisan Holdings”).
| (2) | Summary of significant accounting policies: |
The following is a summary of significant accounting policies of the Funds in effect during the period covered by the financial statements, which were in accordance with United States generally accepted accounting principles.
| (a) | Security valuation – The net asset value (“NAV”) of the shares of each class of each Fund was determined as of the close of regular session trading on the New York Stock Exchange (“NYSE”) (usually 4:00 p.m., Eastern Time) each day the NYSE was open for regular session trading. The NAV of each class of shares was determined by dividing the value of each Fund’s securities and other assets attributed to that class, less its liabilities attributed to that class, by the number of outstanding shares of that class of that Fund. |
32
NOTES TO FINANCIAL STATEMENTS
| | In determining NAV, each equity security traded on a securities exchange, including the Nasdaq Stock Market and over-the-counter securities, was valued at the closing price as of the time of valuation on the exchange or market designated by the Fund’s accounting agent or pricing vendor as the principal exchange (the “principal exchange”). The closing price provided by the pricing vendor for a principal exchange may differ and may represent information such as last sales price, an official closing price, a closing auction price or other information, depending on exchange or market convention. Absent closing price information from the principal exchange as of the time of valuation, the security was valued using the closing price on another exchange on which the security traded (if such price is made available by the pricing vendor) or the most recent bid quotation on the principal exchange or, if not available, another exchange or in the over-the-counter market, except that securities listed on the London Stock Exchange were valued at the mean of the most recent bid and asked quotations as of the time of valuation. Short-term investments, other than repurchase agreements, maturing within sixty days from the valuation date were valued at amortized cost, which approximates market value. |
| | Securities for which prices were not readily available were valued by Artisan Funds’ valuation committee (the “valuation committee”) at a fair value determined in good faith under procedures established by and under the general supervision of Artisan Funds’ board of directors (the “board of directors”). A price was considered to be not readily available if, among other things, the valuation committee believed that the price determined as described in the preceding paragraph did not reflect a fair value of the security. |
| | Emerging Markets Fund, International Fund, and International Value Fund generally invested a significant portion, and perhaps as much as substantially all, of their total assets in securities principally traded in markets outside the U.S. Mid Cap Fund had the ability to invest in non-U.S. securities, but only if they were traded in the U.S. The foreign markets in which the Funds invested were sometimes open on days when the NYSE was not open and the Funds did not calculate their NAVs, and sometimes were not open on days when the Funds did calculate their NAVs. Even on days on which both the foreign market and the NYSE were open, several hours may have passed between the time when trading in the foreign market closed and the time as of which the Funds calculate their NAVs. That was generally the case for markets in Europe, Asia, Australia and other far eastern markets; the regular closing time of foreign markets in North and South America was generally the same as the closing time of the NYSE and the time as of which the Funds calculated their NAVs. |
| | The valuation committee concluded that a price determined under the Funds’ valuation procedures was not readily available if, among other things, the valuation committee believed that the value of the security might have been materially affected by events occurring after the close of the market in which the security was principally traded but before the time for determination of NAV (“subsequent event”). A subsequent event might include a company-specific development (for example, announcement of a merger that is made after the close of the foreign market), a development that might affect an entire market or region (for example, imposition of foreign exchange controls by a foreign government), a potentially global development (such as a terrorist attack that may be expected to have an impact on investor expectations worldwide) or a |
33
NOTES TO FINANCIAL STATEMENTS
| | significant change in one or more U.S. securities indexes. Artisan Funds monitored for subsequent events using several tools. An indication by any of those tools of a potential material change in the value of securities resulted in either a meeting of the valuation committee, which considered whether a subsequent event had occurred and whether local market closing prices continued to represent fair values for potentially affected non-U.S. securities, and/or a valuation based on information provided by a third party research service. This third party research service was used to assist in determining estimates of fair values for foreign securities. That service utilized statistical data based on historical performance of securities, markets and other data in developing factors used to estimate a fair value. |
| | Estimates of fair values utilized by the Funds as described above may differ from the value realized on the subsequent sale of those securities and from quoted or published prices for those securities. The differences may have been material to the NAV of the applicable Fund or to the information presented. |
| | Foreign stocks as an asset class may underperform U.S. stocks, and foreign stocks may be more volatile than U.S. stocks. Risks relating to investment in foreign securities (including, but not limited to, depository receipts and participation certificates) include: currency exchange rate fluctuation; less available public information about the issuers of securities; less stringent regulatory standards; lack of uniform accounting, auditing and financial reporting standards; and country risks including less liquidity, high inflation rates, unfavorable economic practices and political instability. The risks of foreign investments are typically greater in emerging and less developed markets. |
| (b) | Fair Value Measurements – In April 2009, the Financial Accounting Standards Board (“FASB”) updated the accounting standards to provide guidance on (1) estimating the fair value of an asset or liability when the volume and level of activity for the asset or liability have significantly decreased, (2) identifying transactions that are not orderly, and (3) expands existing fair value measurement disclosure to include a breakout of the major security types. The Funds adopted this accounting guidance on June 30, 2009. |
| | The FASB updated the accounting standards to clarify the definition of fair value for financial reporting, establish a framework for measuring fair value and require additional disclosures about the use of fair value measurements. The Funds adopted this accounting guidance on October 1, 2008. In accordance with this standard, fair value is defined as the price that each Fund would receive upon selling an investment in an orderly transaction to an independent buyer in the principal or most advantageous market of the investment. The standard establishes a three-tier hierarchy to distinguish between (1) inputs that reflect the assumptions market participants would use in pricing an asset or liability developed based on the market data obtained from sources independent of the reporting entity (observable inputs) and (2) inputs that reflect the reporting entity’s own assumptions about the assumptions market participants would use in pricing an asset or liability developed based on the best information available in the circumstances (unobservable inputs) and to establish classification of fair value measurements for disclosure purposes. Various inputs are used in determining the value of the Funds’ investments. The three-tier hierarchy of inputs is summarized in three broad levels: |
| | • | | Level 1 – quoted prices in active markets for identical investments |
34
NOTES TO FINANCIAL STATEMENTS
| | • | | Level 2 – other significant observable inputs (including but not limited to quoted prices for similar securities, interest rates, prepayment speeds, credit risks, etc.) |
| | • | | Level 3 – significant unobservable inputs (including the Funds’ own assumptions in determining the fair value of investments) |
| | The inputs or methodology used for valuing securities are not necessarily an indication of the risk or liquidity associated with investing in those securities. |
| | The following table summarizes each Fund’s investments by major security type, based on the inputs used to determine their fair values as of September 30, 2009: |
| | | | | | | | | | | |
| Fund | | Level 1 - Quoted
Prices | | Level 2 - Other Significant
Observable Inputs | | Level 3 - Significant
Unobservable Inputs | | Total |
Emerging Markets | | | | | | | | | | | |
Equity Securities(1) | | | | | | | | | | | |
Emerging Asia | | $ | 62,965,379 | | $ | 1,722,078 | | - | | $ | 64,687,457 |
Latin America | | | 40,127,108 | | | - | | - | | | 40,127,108 |
Emerging Europe, Middle East & Africa | | | 34,185,520 | | | 3,020,331 | | - | | | 37,205,851 |
Developed Markets | | | 6,572,393 | | | - | | - | | | 6,572,393 |
Repurchase Agreements | | | - | | | 6,031,000 | | - | | | 6,031,000 |
Total | | $ | 143,850,400 | | $ | 10,773,409 | | - | | $ | 154,623,809 |
International | | | | | | | | | | | |
Equity Securities(1) | | | | | | | | | | | |
Americas | | $ | 727,552,366 | | $ | - | | - | | $ | 727,552,366 |
Emerging Markets | | | 1,467,031,111 | | | 12,920,464 | | - | | | 1,479,951,575 |
Europe | | | 7,299,845,992 | | | - | | - | | | 7,299,845,992 |
Pacific Basin | | | 998,523,752 | | | - | | - | | | 998,523,752 |
Repurchase Agreements | | | - | | | 173,052,000 | | - | | | 173,052,000 |
Total | | $ | 10,492,953,221 | | $ | 185,972,464 | | - | | $ | 10,678,925,685 |
International Value | | | | | | | | | | | |
Equity Securities(1) | | | | | | | | | | | |
Americas | | $ | 264,128,101 | | $ | - | | - | | $ | 264,128,101 |
Emerging Markets | | | 53,148,000 | | | 52,156 | | - | | | 53,200,156 |
Europe | | | 1,248,225,596 | | | 48,521,286 | | - | | | 1,296,746,882 |
Pacific Basin | | | 205,943,643 | | | - | | - | | | 205,943,643 |
Repurchase Agreements | | | - | | | 188,093,000 | | - | | | 188,093,000 |
Total | | $ | 1,771,445,340 | | $ | 236,666,442 | | - | | $ | 2,008,111,782 |
Mid Cap | | | | | | | | | | | |
Equity Securities(1) | | $ | 3,995,820,823 | | $ | - | | - | | $ | 3,995,820,823 |
Repurchase Agreements | | | - | | | 155,263,000 | | - | | | 155,263,000 |
Total | | $ | 3,995,820,823 | | $ | 155,263,000 | | - | | $ | 4,151,083,823 |
|
(1) See Fund’s Schedule of Investments for sector or country classifications. |
35
NOTES TO FINANCIAL STATEMENTS
| | As of September 30, 2009, the reconciliation of assets in which significant unobservable inputs (Level 3) were used in determining fair value, is as follows: |
| | | | |
| | | INTERNATIONAL FUND(2) | |
Balance as of September 30, 2008 | | $ | 96,148,234 | |
Realized loss(3) | | | (156,374,528 | ) |
Change in unrealized appreciation (depreciation)(3) | | | 104,286,228 | |
Net sales | | | (44,059,934 | ) |
Transfers in and/or out of Level 3 | | | - | |
| | | | |
Balance as of September 30, 2009 | | $ | - | |
| | | | |
Net change in unrealized appreciation/(depreciation) for investments held as of September 30, 2009 | | $ | - | |
| | | | |
| | (2) | All Level 3 securities were equity securities with a regional classification of emerging markets. |
| | (3) | Realized loss and change in unrealized appreciation are included in the related amounts on investments in the Statement of Operations. |
| (c) | Income taxes – No provision was made for federal income taxes or excise taxes since each Fund intends to (i) comply with the provisions of Subchapter M of the Internal Revenue Code applicable to regulated investment companies and (ii) distribute to its shareholders substantially all of its taxable income as well as net realized gains from the sale of investment securities. The Funds may utilize earnings and profits distributed to shareholders on redemptions of Fund shares as part of the dividends paid deduction. |
| | The Funds have analyzed the tax positions taken on federal income tax returns for all open tax years and has concluded that as of September 30, 2009, no provision for income tax would be required in the Funds’ financial statements. The Funds’ federal and state income and federal excise tax returns for tax years for which the applicable statutes of limitations have not expired are subject to examination by the Internal Revenue Service and state department of revenue. |
| | The Funds may be subject to taxes on realized gains from the sale of investment securities imposed by certain countries in which the Funds invest. The foreign tax expense, if any, was recorded on an accrual basis and is included in “Payable for withholding taxes” on the accompanying Statements of Assets and Liabilities. |
| (d) | Portfolio transactions – In determining a Fund’s NAV, security transactions and shareholder transactions were accounted for no later than one business day after trade date, in accordance with applicable law. However, for financial reporting purposes, security transactions and shareholder transactions were recorded on trade date in accordance with United States generally accepted accounting principles. Net realized gains and losses on securities were computed on specific security lot identification. |
| (e) | Foreign currency translation – Values of foreign investments, open foreign currency forward contracts, payables for capital gains taxes and cash denominated in foreign currencies were translated into U.S. dollars using a spot market rate of exchange as of the time of determination of each Fund’s NAV on the day of valuation. Payables and receivables for securities transactions, dividend and reclaim receivables and other receivables and payables denominated in a foreign currency were translated into U.S. dollars using a spot market rate of exchange as of 12:00 p.m. (Eastern Time) on the day of valuation. Purchases and sales of investments and dividend and interest income were translated into U.S. dollars using a spot market rate of exchange as of 12:00 p.m. |
36
NOTES TO FINANCIAL STATEMENTS
| | (Eastern Time) on the date of such transactions. The portion of security gains or losses resulting from changes in foreign exchange rates was included with net realized and unrealized gain or loss from investments, as appropriate, for both financial reporting and tax purposes. |
| | The Funds may enter into foreign currency forward contracts to hedge the foreign currency exposure on open payables and receivables. These foreign currency forward contracts, or spot contracts, generally settle within two business days. The Funds also may enter into foreign currency forward contracts to hedge against foreign currency exchange rate risks on its non-U.S. dollar denominated investment securities. Foreign currency forward contracts were recorded at market value and any related realized and unrealized gains and losses were reported as foreign currency related transactions for financial reporting purposes. For tax purposes, these foreign exchange gains and losses were treated as ordinary income or loss. The Funds could be exposed to loss if the counterparties fail to perform under these contracts. |
| | Other foreign currency related transaction gains and losses may result from currency gains and losses realized from the difference between the amounts of dividends and foreign withholding taxes recorded on the Funds’ books and the U.S. dollar equivalent of the amounts actually received or paid. The net increase (decrease) in unrealized appreciation or depreciation on foreign currency related transactions arose from changes in the values of assets and liabilities, other than investments in securities, resulting from changes in foreign exchange rates. |
| (f) | Repurchase agreements – Each Fund may enter into repurchase agreements with institutions that the Adviser determined were creditworthy pursuant to criteria adopted by the board of directors. Repurchase agreements were recorded at cost plus accrued interest and were collateralized in an amount greater than or equal to the repurchase price plus accrued interest. Collateral (in the form of U.S. government securities) was held by the Funds’ custodian and in the event of default on the obligation of the counterparty to repurchase, the Funds had the right to liquidate the collateral and apply the proceeds in satisfaction of the obligation. If the proceeds from any sale of such collateral were less than the repurchase price, the Fund would have suffered a loss. |
| (g) | Depository receipts – Each of the Funds may invest in depository receipts. Depository receipts are typically issued by a financial institution (a “depository”), evidencing ownership interests in a security issued by an issuer and deposited with the depository. |
| (h) | Securities lending – Each of the Funds may (but does not currently intend to) enter into securities lending transactions secured by collateral in the form of U.S. Government securities at least equal to, at all times, the fair value of the securities loaned. Any such collateral will be held in a custody account maintained by State Street Bank and Trust Company, the Funds’ custodian. When securities are on loan, the Fund does not receive dividends on the securities loaned, but receives compensation from the borrower in lieu of such dividends. Gain or loss in the fair value of the securities loaned that may occur during the term of the loan will be for the account of the applicable Fund. In entering into securities lending arrangements, the Fund takes the risk that the borrower may not provide additional collateral when required or return the securities when due or, if the borrower defaults, the Fund may experience delays in selling collateral or the collateral may not be sufficient to cover the value of securities lent. There were no securities on loan during the year ended September 30, 2009. |
37
NOTES TO FINANCIAL STATEMENTS
| (i) | Equity-linked participation certificates – Emerging Markets Fund, International Fund, and International Value Fund, may invest in equity-linked participation certificates. Equity-linked participation certificates are derivative securities which are designed to provide synthetic exposure to one or more underlying securities. An investment in an equity-linked participation certificate typically entitles the holder to a return equal to the market return of the underlying security or securities, subject to the credit risk of the issuing financial institution. |
| (j) | Commission recapture – Each of the Funds had the ability to direct portfolio trades to various brokers that have agreed to rebate a portion of the commissions generated. Such cash rebates were made directly to the applicable Fund and were included in net realized gain or loss on investments in the Statements of Operations as follows: |
| | | |
Emerging Markets | | $ | - |
International | | | 127,403 |
International Value | | | 46,042 |
Mid Cap | | | 307,989 |
| (k) | Use of estimates – The preparation of financial statements in conformity with United States generally accepted accounting principles requires management to make estimates and assumptions that affect the reported amounts and disclosures in the financial statements. Actual results could differ from those estimates. |
| (l) | Indemnifications – In the normal course of business, the Funds have entered into contracts in which the Funds agree to indemnify the other party or parties against various potential costs or liabilities. The Funds’ maximum exposure under these arrangements is unknown. No claim had been made for indemnification pursuant to any such agreement of the Funds. |
| (m) | Other – Dividend income less foreign taxes withheld, if any, was generally recorded on the ex-dividend date. In some cases, the information was not available to the Fund on the ex-dividend date. In such cases, which may have included private placements and foreign securities, dividends were recorded as soon after the ex-dividend date as reliable information became available to the Funds. Non-cash dividends included in dividend income, if any, were generally recorded at the fair market value of securities received. Interest income was reported on the accrual basis. Distributions to shareholders were recorded on the ex-dividend date. Expenses attributable to Artisan Funds were generally allocated to each Fund based on net assets. However, other expense allocation methodologies were used, depending on the nature of the expense item. Expenses attributable to a particular Fund or class were allocated directly to that Fund or class. |
| | The character of income and net realized gains and losses may differ in some instances for financial statement and tax purposes and may result in reclassification of permanent differences among certain capital accounts to more appropriately conform financial accounting to tax characterizations of dividend and capital gain distributions. |
| | Emerging Markets Fund, International Fund, and International Value Fund generally imposed a 2% redemption fee on shares held 90 days or less. Those redemption fees were recorded as a reduction in the cost of shares redeemed and had the primary effect of increasing paid-in capital. Each Fund reserved the right to waive or reduce the 2% redemption fee on shares held 90 days or less at its discretion when the Fund believed such waiver was in the best interests of the Fund, including but not limited to when it |
38
NOTES TO FINANCIAL STATEMENTS
| | determined that imposition of the redemption fee was not necessary to protect the Fund from the effects of short-term trading. The Funds waived the fee on redemption of shares held by certain authorized agents or other Fund intermediaries and otherwise in accordance with the Funds’ prospectus. |
| (3) | Transactions with affiliates: |
The Adviser, with which the officers and a director of Artisan Funds were affiliated, provided investment advisory and administrative services to the Funds. In exchange for those services, each Fund paid a monthly management fee to the Adviser as follows:
Emerging Markets Fund
| | | |
Average Daily Net Assets | | Annual Rate | |
All | | 1.050 | % |
International Fund
| | | |
Average Daily Net Assets | | Annual Rate | |
Less than $500 million | | 1.000 | % |
$500 million to $750 million | | 0.975 | |
$750 million to $1 billion | | 0.950 | |
$1 billion to $12 billion | | 0.925 | |
Greater than $12 billion | | 0.900 | |
International Value Fund and Mid Cap Fund
| | | |
Average Daily Net Assets | | Annual Rate | |
Less than $500 million | | 1.000 | % |
$500 million to $750 million | | 0.975 | |
$750 million to $1 billion | | 0.950 | |
Greater than $1 billion | | 0.925 | |
The Adviser has voluntarily undertaken to reimburse Emerging Markets Fund for any ordinary operating expenses in excess of 1.50% of average daily net assets, annually. For the year ended September 30, 2009, the Adviser paid operating expenses on behalf of Emerging Markets Fund. Emerging Markets Fund reimburses the Adviser for ordinary operating expenses paid on its behalf up to 1.50% of average daily net assets, annually. The amount of operating expenses owed to the Adviser is included in payable for operating expenses on the Statement of Assets and Liabilities for Emerging Markets Fund.
The officers and director of Artisan Funds who are affiliated with the Adviser receive no compensation from the Funds.
Each director who was not an affiliated person of the Adviser received an annual retainer, payable quarterly, as well as reimbursement of expenses related to his duties as a director of Artisan Funds. The amount of the annual retainer increases by $10,000 with each new series of Artisan Funds and, during the year ended September 30, 2009, was at the annual rate of $170,000. In addition, the non-interested chair of the board of directors received an annual retainer of $60,000, payable quarterly, and each chair of a board committee who was a non-interested director received an annual retainer of $30,000, payable quarterly. These fees were generally allocated to each of the Artisan Funds based on net assets, subject to a minimum allocation of $1,500 to each Fund per quarter.
39
NOTES TO FINANCIAL STATEMENTS
Artisan Funds has adopted a deferred compensation plan for directors who are not affiliated persons of the Adviser that enables directors to elect to defer receipt of all or a portion of the annual compensation they are entitled to receive from the Funds. For purposes of determining the amount owed to the directors under the plan, deferred amounts were invested in shares of the Artisan Funds as selected by the individual directors. Each Fund purchased shares of the Artisan Funds selected for deferral by the director in amounts equal to his investment, resulting in a Fund asset equal to the deferred compensation liability. Such assets were included as a component of “Other assets” on the Statements of Assets and Liabilities. Deferral of directors’ fees under the plan did not affect the net assets of the Funds, and did not materially affect the Funds’ assets, liabilities or net investment income per share. Amounts will be deferred until distributed in accordance with the plan.
Shares of Artisan Funds were offered for sale by Artisan Distributors LLC (“Distributors”). Distributors is wholly owned by Artisan Holdings. All distribution expenses relating to the Funds were paid by the Adviser.
| (4) | Line of credit arrangement: |
Artisan Funds is party to a line of credit agreement with State Street Bank and Trust Company (“SSB”), which expires August 2010, under which each Fund may borrow up to the lesser of (a) $75 million or (b) the lesser of (i) 33 1/3% of its adjusted net assets, with adjusted net assets being total assets less liabilities and the value of any assets pledged to anyone other than SSB, (after giving effect to the loan) or (ii) the maximum amount the Fund may borrow under the Investment Company Act of 1940, the limitations included in the Fund’s prospectus, or any limit or restriction under any law or regulation to which the Fund was subject or any agreement to which the Fund or Artisan Funds is a party; provided that the aggregate borrowings by all Artisan Funds may not exceed $100 million. For the period October 1, 2008 to August 17, 2009, Artisan Funds paid a commitment fee at the annual rate of 0.10% on the unused portion of the line of credit and interest was charged on any borrowings at the current Federal Funds rate plus 0.50%. Effective August 18, 2009, Artisan Funds paid a commitment fee at the annual rate of 0.15% on the unused portion of the line of credit and interest was charged on any borrowings at the current Federal Funds rate plus 1.25%. SSB has agreed to waive 0.05% of the commitment fee by reducing the Funds’ custody expenses until August 2010. The use of the line of credit was generally restricted to temporary borrowing for extraordinary or emergency purposes. During the year ended September 30, 2009, there were no borrowings under the line of credit for International Fund, International Value Fund, or Mid Cap Fund. During the year ended September 30, 2009, Emerging Markets Fund paid interest of $876 on maximum borrowings of $7,792,684.
| (5) | Investment transactions: |
The cost of securities purchased and the proceeds from the sale of securities (excluding short-term securities) for the year ended September 30, 2009 were as follows:
| | | | | | |
| Fund | | Security Purchases | | Security Sales |
Emerging Markets | | $ | 95,981,062 | | $ | 44,483,849 |
International | | | 7,069,339,796 | | | 7,534,124,091 |
International Value | | | 1,121,559,967 | | | 619,638,035 |
Mid Cap | | | 2,203,168,853 | | | 2,345,097,667 |
40
NOTES TO FINANCIAL STATEMENTS
| (6) | Transactions in securities of affiliates: |
The table below shows information about securities of the Funds’ “affiliates” (as defined below) that were held by the Funds, purchased or sold by the Funds, or from which dividends were received by the Funds during the year ended September 30, 2009. The Funds identify a company as an affiliate for the purpose of this report if one or more of the Funds owned, in the aggregate, voting securities that it believed represented 5% or more of that company’s outstanding voting securities (as defined by the Investment Company Act of 1940) during the year ended September 30, 2009.
| | | | | | | | | | | | | | | | | | | | | | |
| | | | | As of
9/30/08 | | | | | | | | | | | As of 9/30/09 |
| Fund | | Security | | Share
Balance | | Purchase
Cost | | Sales
Cost | | Net
Realized
Gain (Loss) | | | Dividend
Income(1) | | Share
Balance | | Value |
| International | | | | | | | | | | | | | | | | | | | | | | |
| | | Shanghai Electric Group Company Limited, Series H(3) | | 150,931,921 | | $ | 2,961,958 | | $ | 113,000,839 | | $ | (68,638,629 | ) | | $ | 959,558 | | - | | $ | - |
| | | Total(2) | | | | $ | 2,961,958 | | $ | 113,000,839 | | $ | (68,638,629 | ) | | $ | 959,558 | | | | $ | - |
| International Value | | | | | | | | | | | | | | | | | | | | |
| | | Benfield Group Plc(3) | | 11,241,209 | | $ | - | | $ | 66,529,213 | | $ | (7,840,431 | ) | | $ | - | | - | | $ | - |
| | | Total(2) | | | | $ | - | | $ | 66,529,213 | | $ | (7,840,431 | ) | | $ | - | | | | $ | - |
| Mid Cap | | | | | | | | | | | | | | | | | | | | | | |
| | | Intermec, Inc.(3)(4) | | 3,481,619 | | $ | 35,991 | | $ | 88,918,810 | | $ | (42,928,022 | ) | | $ | - | | - | | $ | - |
| | | Total(2) | | | | $ | 35,991 | | $ | 88,918,810 | | $ | (42,928,022 | ) | | $ | - | | | | $ | - |
| (1) | Net of foreign taxes withheld, if any. |
| (2) | Total value as of September 30, 2009 is presented for only those issuers that were affiliates as of September 30, 2009. |
| (3) | Issuer was no longer an affiliate as of September 30, 2009. |
| (4) | Non-income producing security. |
| (7) | Information for Federal income tax purposes: |
For Federal income tax purposes, the cost of investments, gross unrealized appreciation, gross unrealized depreciation and net unrealized appreciation on investments as of September 30, 2009 were as follows:
| | | | | | | | | | | | | |
| Fund | | Cost of
Investments | | Gross Unrealized
Appreciation | | Gross
Unrealized
Depreciation | | | Net
Unrealized
Appreciation on
Investments |
Emerging Markets | | $ | 143,279,224 | | $ | 17,811,408 | | $ | (6,466,823 | ) | | $ | 11,344,585 |
International | | | 9,456,868,050 | | | 1,815,393,842 | | | (593,336,207 | ) | | | 1,222,057,635 |
International Value | | | 1,873,844,745 | | | 175,164,704 | | | (40,897,667 | ) | | | 134,267,037 |
Mid Cap | | | 3,517,424,049 | | | 828,335,538 | | | (194,675,764 | ) | | | 633,659,774 |
The difference between cost of investments for financial reporting and cost of investments for Federal income tax purposes was due primarily to timing differences in recognizing certain gains and losses on security transactions (e.g., wash sale loss deferrals and passive foreign investment company transactions).
41
NOTES TO FINANCIAL STATEMENTS
The tax characterization of ordinary income dividends and long-term capital gain distributions paid during the year ended September 30, 2009 and the year ended September 30, 2008 were as follows:
| | | | | | | | | | | | | | |
| | | Year Ended 9/30/09 | | | | Year Ended 9/30/08 |
| Fund | | Ordinary
Income
Dividends | | Long-Term
Capital Gain
Distributions | | | | Ordinary
Income
Dividends | | Long-Term
Capital Gain
Distributions |
Emerging Markets | | $ | 862,446 | | $ | - | | | | $ | 1,241,033 | | $ | 283,412 |
International | | | 168,596,974 | | | 318,081,129 | | | | | 361,370,744 | | | 2,098,971,481 |
International Value | | | 12,538,190 | | | - | | | | | 75,430,570 | | | 56,114,817 |
Mid Cap | | | - | | | 46,112,826 | | | | | 127,054,050 | | | 878,662,613 |
Ordinary income dividends and long-term capital gain distributions were determined in accordance with income tax regulations that may differ from U.S. generally accepted accounting principles. These differences were due to differing treatments for items such as net short-term gains, wash sale loss deferrals, passive foreign investment company transactions, foreign currency transactions, net investment losses and post-October losses. Gains on redemptions-in-kind for International Fund of $37,855,006 and Mid Cap Fund of $1,020,536 were included in net realized gain (loss) on investments in the Statement of Operations for the period ended September 30, 2009, and were not recognized for Federal income tax purposes.
Additional tax information as of and for the year ended September 30, 2009 follows:
| | | | | | | | | |
| | | Undistributed
Ordinary Income | | Undistributed
Long-Term Gain | | Post-October
Losses |
Emerging Markets | | $ | 1,495,995 | | $ | - | | $ | 13,611,288 |
International | | | 129,070,165 | | | - | | | 1,743,954,947 |
International Value | | | 40,471,520 | | | - | | | 100,777,481 |
Mid Cap | | | - | | | - | | | 623,684,822 |
As of September 30, 2009, the Funds had capital loss carryovers as follows:
| | | | | |
| | | Net Capital
Loss Carryover | | Expiration |
Emerging Markets | | $ | 4,542,143 | | 2017 |
International | | | 846,687,411 | | 2017 |
International Value | | | 21,273,231 | | 2017 |
Mid Cap | | | 133,629,309 | | 2017 |
42
NOTES TO FINANCIAL STATEMENTS
[THIS PAGE INTENTIONALLY LEFT BLANK]
43
NOTES TO FINANCIAL STATEMENTS
| (8) | Fund share activities: |
Capital share transactions for the Funds were as follows:
| | | | | | | | | | | | | | | | |
| | | EMERGING MARKETS | | | INTERNATIONAL | |
Year ended September 30, 2009 | | Institutional
Shares | | | Advisor
Shares | | | Investor
Shares | | | Institutional
Shares | |
Proceeds from shares issued | | $ | 36,046,627 | | | $ | 42,105,884 | | | $ | 1,592,516,571 | | | $ | 172,950,986 | |
Net asset value of shares issued in reinvestment of dividends and distributions | | | 801,388 | | | | 55,689 | | | | 331,783,610 | | | | 136,080,351 | |
Cost of shares redeemed(1) | | | (20,916,631 | ) | | | (2,746,698 | ) | | | (2,620,368,565 | ) | | | (433,419,290 | ) |
| | | | | | | | | | | | | | | | |
Net increase (decrease) from fund share transactions | | $ | 15,931,384 | | | $ | 39,414,875 | | | $ | (696,068,384 | ) | | $ | (124,387,953 | ) |
| | | | | | | | | | | | | | | | |
| | | | |
Shares sold | | | 3,727,344 | | | | 3,845,456 | | | | 102,961,075 | | | | 11,471,176 | |
Shares issued in reinvestment of dividends and distributions | | | 104,212 | | | | 7,232 | | | | 22,089,455 | | | | 9,017,916 | |
Shares redeemed | | | (2,106,464 | ) | | | (268,708 | ) | | | (173,003,712 | ) | | | (25,335,842 | ) |
| | | | | | | | | | | | | | | | |
Net increase (decrease) in capital shares | | | 1,725,092 | | | | 3,583,980 | | | | (47,953,182 | ) | | | (4,846,750 | ) |
| | | | | | | | | | | | | | | | |
| | |
| | | EMERGING MARKETS | | | INTERNATIONAL | |
Year ended September 30, 2008 | | Institutional
Shares | | | Advisor
Shares(2) | | | Investor
Shares | | | Institutional
Shares | |
Proceeds from shares issued | | $ | 86,328,968 | | | $ | 3,862,647 | | | $ | 2,769,106,273 | | | $ | 154,759,460 | |
Net asset value of shares issued in reinvestment of dividends and distributions | | | 1,510,191 | | | | - | | | | 1,711,689,210 | | | | 659,043,481 | |
Cost of shares redeemed(1) | | | (1,424,727 | ) | | | (2,084 | ) | | | (2,910,764,948 | ) | | | (814,639,751 | ) |
| | | | | | | | | | | | | | | | |
Net increase (decrease) from fund share transactions | | $ | 86,414,432 | | | $ | 3,860,563 | | | $ | 1,570,030,535 | | | $ | (836,810 | ) |
| | | | | | | | | | | | | | | | |
| | | | |
Shares sold | | | 5,178,178 | | | | 287,867 | | | | 99,755,202 | | | | 5,745,726 | |
Shares issued in reinvestment of dividends and distributions | | | 93,337 | | | | - | | | | 59,207,513 | | | | 22,647,542 | |
Shares redeemed | | | (113,088 | ) | | | (177 | ) | | | (107,847,385 | ) | | | (28,563,145 | ) |
| | | | | | | | | | | | | | | | |
Net increase (decrease) in capital shares | | | 5,158,427 | | | | 287,690 | | | | 51,115,330 | | | | (169,877 | ) |
| | | | | | | | | | | | | | | | |
| (1) | Net of redemption fees of: |
| | | | | | |
| Fund | | 9/30/2009 | | 9/30/2008 |
Emerging Markets - Institutional Shares | | $ | 618 | | $ | 420 |
Emerging Markets - Advisor Shares | | | 36 | | | 8 |
International - Investor Shares | | | 940,168 | | | 1,068,938 |
International - Institutional Shares | | | 357,772 | | | 381,010 |
International Value - Investor Shares | | | 604,391 | | | 76,325 |
International Value - Institutional Shares | | | 107,009 | | | 13,231 |
| (2) | For the period from commencement of operations (June 2, 2008) through September 30, 2008. |
44
NOTES TO FINANCIAL STATEMENTS
| | | | | | | | | | | | | | |
| INTERNATIONAL VALUE | | | MID CAP | |
Investor
Shares | | | Institutional
Shares | | | Investor
Shares | | | Institutional
Shares | |
| $ | 998,478,418 | | | $ | 89,768,173 | | | $ | 736,881,835 | | | $ | 40,963,051 | |
| | | |
| | 9,494,289 | | | | 1,837,654 | | | | 40,618,187 | | | | 5,181,307 | |
| | (442,674,211 | ) | | | (22,279,861 | ) | | | (787,631,410 | ) | | | (121,601,275 | ) |
| | | | | | | | | | | | | | | |
| $ | 565,298,496 | | | $ | 69,325,966 | | | $ | (10,131,388 | ) | | $ | (75,456,917 | ) |
| | | | | | | | | | | | | | | |
| | | |
| | 52,470,821 | | | | 4,662,123 | | | | 38,015,250 | | | | 2,178,933 | |
| | 527,754 | | | | 102,319 | | | | 2,392,119 | | | | 297,093 | |
| | (25,344,403 | ) | | | (1,262,697 | ) | | | (43,513,929 | ) | | | (6,036,669 | ) |
| | | | | | | | | | | | | | | |
| | 27,654,172 | | | | 3,501,745 | | | | (3,106,560 | ) | | | (3,560,643 | ) |
| | | | | | | | | | | | | | | |
| |
| INTERNATIONAL VALUE | | | MID CAP | |
Investor
Shares | | | Institutional
Shares | | | Investor
Shares | | | Institutional
Shares | |
| $ | 303,006,196 | | | $ | 50,740,000 | | | $ | 1,053,457,971 | | | $ | 18,291,682 | |
| | | |
| | 98,499,399 | | | | 15,729,244 | | | | 874,718,712 | | | | 120,999,695 | |
| | (592,204,517 | ) | | | (34,673,009 | ) | | | (1,467,033,037 | ) | | | (102,000,633 | ) |
| | | | | | | | | | | | | | | |
| $ | (190,698,922 | ) | | $ | 31,796,235 | | | $ | 461,143,646 | | | $ | 37,290,744 | |
| | | | | | | | | | | | | | | |
| | | |
| | 12,372,002 | | | | 1,981,408 | | | | 33,783,896 | | | | 611,019 | |
| | 3,939,976 | | | | 629,926 | | | | 28,651,121 | | | | 3,870,752 | |
| | (23,733,942 | ) | | | (1,513,600 | ) | | | (50,970,079 | ) | | | (3,530,702 | ) |
| | | | | | | | | | | | | | | |
| | (7,421,964 | ) | | | 1,097,734 | | | | 11,464,938 | | | | 951,069 | |
| | | | | | | | | | | | | �� | | |
45
NOTES TO FINANCIAL STATEMENTS
Artisan Funds and the Adviser were defendants in a lawsuit filed in the Circuit Court of the Third Judicial Circuit, Madison County, Illinois that sought certification of a plaintiff class consisting of all persons in the United States who held shares in International Fund for a period of more than 14 days during the five year period prior to the filing of the lawsuit in September 2003. The basic allegations in the case were that Artisan Funds and the Adviser did not make appropriate price adjustments to the foreign securities owned by International Fund prior to calculating the Fund’s NAV, thereby allegedly enabling market timing traders to trade the Fund’s shares in such a way as to disadvantage long-term investors. Following years of procedural litigation in state and federal courts, the case was resolved and dismissed with prejudice in May 2008.
Certain legal fees incurred by Artisan Funds in defense of the lawsuit prior to its resolution and related insurance recoveries of $219,395 have been allocated to International Fund and were included in professional fees in the Statements of Operations. The resolution of the lawsuit did not have a material effect on the financial condition or results of operations of any Fund.
| (10) | Recent Accounting Pronouncements: |
In March 2008, the FASB updated the accounting standards for disclosures about derivative instruments and hedging activities. The standard requires enhanced disclosure relating to an entity’s use of derivatives, how derivatives are accounted for, and how derivative instruments affect an entity’s results of operations and financial position. This standard was issued and is effective for fiscal years and interim reporting periods beginning after November 15, 2008. The Funds adopted this standard on April 1, 2009. The Funds have evaluated the implications of this standard and have determined there is no impact to the Funds’ September 30, 2009 financial statement disclosures.
In May 2009, the FASB updated the accounting standards on the recognition and disclosure of subsequent events. The standard requires the disclosure of the date through which subsequent events were evaluated. This standard was issued and is effective for interim or annual reporting periods ending after June 15, 2009, and applied prospectively. The Funds have evaluated subsequent events through the issuance of the Funds’ financial statements on November 19, 2009 and have determined there is no impact to the Funds’ financial statements.
46
Report of Independent Registered Public Accounting Firm
To the Board of Directors and Shareholders of Artisan Funds, Inc.
We have audited the accompanying statements of assets and liabilities, including the schedules of investments, of Artisan Emerging Markets Fund, Artisan International Fund, Artisan International Value Fund, and Artisan Mid Cap Fund (four of eleven portfolios constituting Artisan Funds, Inc.) (the “Funds”) as of September 30, 2009, and the related statements of operations for the year then ended, the statements of changes in net assets for each of the two years in the period then ended, and the financial highlights for each of the periods indicated therein. These financial statements and financial highlights are the responsibility of the Funds’ management. Our responsibility is to express an opinion on these financial statements and financial highlights based on our audits.
We conducted our audits in accordance with the standards of the Public Company Accounting Oversight Board (United States). Those standards require that we plan and perform the audit to obtain reasonable assurance about whether the financial statements and financial highlights are free of material misstatement. We were not engaged to perform an audit of the Funds’ internal control over financial reporting. Our audits included consideration of internal control over financial reporting as a basis for designing audit procedures that are appropriate in the circumstances, but not for the purpose of expressing an opinion on the effectiveness of the Funds’ internal control over financial reporting. Accordingly, we express no such opinion. An audit also includes examining, on a test basis, evidence supporting the amounts and disclosures in the financial statements and financial highlights, assessing the accounting principles used and significant estimates made by management, and evaluating the overall financial statement presentation. Our procedures included confirmation of securities owned as of September 30, 2009, by correspondence with the custodian and brokers or by other appropriate auditing procedures where replies from brokers were not received. We believe that our audits provide a reasonable basis for our opinion.
In our opinion, the financial statements and financial highlights referred to above present fairly, in all material respects, the financial position of Artisan Emerging Markets Fund, Artisan International Fund, Artisan International Value Fund, and Artisan Mid Cap Fund of Artisan Funds, Inc. at September 30, 2009, the results of their operations for the year then ended, the changes in their net assets for each of the two years in the period then ended, and the financial highlights for each of the periods indicated therein, in conformity with U.S. generally accepted accounting principles.

Chicago, Illinois
November 19, 2009
47
NOTES TO FINANCIAL STATEMENTS
Other Federal tax information (unaudited):
The Internal Revenue Code requires that shareholders be notified within 60 days of the Funds’ fiscal year-end of certain information regarding long-term capital gains, qualified dividend income and the dividends received deduction for corporate shareholders. This data is informational only. Every year in January, shareholders are sent a Form 1099-DIV which provides the federal tax status of dividends and distributions received during the calendar year. Shareholders are advised to consult their own tax advisor with respect to the specific tax consequences of investment in the Funds.
Each Fund hereby designates the following amounts as (i) long-term capital gain distributions for purposes of the dividends paid deduction (including earnings and profits distributed to shareholders on redemption of Fund shares), (ii) the amount of ordinary dividends paid during the fiscal year ended September 30, 2009 that are considered qualified dividend income as defined in the Jobs and Growth Tax Relief Reconciliation Act of 2003, and (iii) the amount of ordinary dividends paid during the fiscal year ended September 30, 2009 that are eligible for the dividends received deduction available to certain corporate shareholders.
| | | | | | | | |
| Fund | | Long-Term Capital Gains | | Qualified Dividend Income | | | Dividends Received Deduction |
Emerging Markets | | $ | - | | 99.97 | % | | - |
International | | | 318,081,129 | | 100.00 | | | - |
International Value | | | - | | 85.04 | | | - |
Mid Cap | | | 46,112,826 | | - | | | - |
48
SHAREHOLDER EXPENSE EXAMPLE (UNAUDITED)
As a shareholder of Artisan Funds, you may incur transaction costs, including redemption fees, and you will incur ongoing costs, including management fees and other Fund expenses. This example is intended to help you understand your ongoing costs (in dollars) of investing in a Fund and to compare these costs with the ongoing costs of investing in other mutual funds.
The example is based on an investment of $1,000 invested at the beginning of the period and held for the entire period from April 1, 2009 to September 30, 2009.
Actual Expenses
The first line under the name of each Fund in the table below provides information about actual account values and actual expenses. You may use the information in this line, together with the amount you invested, to estimate the expenses that you paid over the period. Simply divide your account value by $1,000 (for example, an $8,600 account value divided by $1,000 = 8.6), then multiply the result by the number in the first line under the name of your Fund under the heading entitled “Expenses Paid During Period” to estimate the expenses you paid on your account during this period.
Hypothetical Example for Comparison Purposes
The second line below each Fund’s name in the table below provides information about hypothetical account values and hypothetical expenses based on each Fund’s actual expense ratio for the six months ended September 30, 2009 and an assumed rate of return of 5% per year before expenses, which is not the Fund’s actual return. The hypothetical account values and expenses may not be used to estimate the actual ending account balances or expenses you paid for the period. You may use this information to compare the ongoing costs of investing in each Fund and other funds. To do so, compare the 5% hypothetical example with the 5% hypothetical examples that appear in the shareholder reports of the other funds.
Please note that the expenses shown in the table are meant to highlight your ongoing costs only and do not reflect any transactional costs, such as redemption fees. Therefore, the second line of the table is useful in comparing ongoing costs only, and will not help you determine the relative costs of owning different funds. If these transactional costs were included, your costs would have been higher.
| | | | | | | | | |
| | | Beginning
Account Value
4/1/2009 | | Ending
Account Value
9/30/2009 | | Expenses Paid During
Period
4/1/2009-9/30/2009(1) |
Artisan Emerging Markets Fund - Institutional Shares | | | | | | | | | |
Actual | | $ | 1,000.00 | | $ | 1,715.40 | | $ | 10.21 |
Hypothetical (5% return before expenses) | | $ | 1,000.00 | | $ | 1,017.55 | | $ | 7.59 |
Artisan International Fund - Institutional Shares | | | | | | | | | |
Actual | | $ | 1,000.00 | | $ | 1,496.30 | | $ | 6.20 |
Hypothetical (5% return before expenses) | | $ | 1,000.00 | | $ | 1,020.10 | | $ | 5.01 |
Artisan International Value Fund - Institutional Shares | | | | | | | | | |
Actual | | $ | 1,000.00 | | $ | 1,494.10 | | $ | 6.50 |
Hypothetical (5% return before expenses) | | $ | 1,000.00 | | $ | 1,019.85 | | $ | 5.27 |
49
SHAREHOLDER EXPENSE EXAMPLE (UNAUDITED)
| | | | | | | | | |
| | | Beginning
Account Value
4/1/2009 | | Ending
Account Value
9/30/2009 | | Expenses Paid During
Period
4/1/2009-9/30/2009(1) |
Artisan Mid Cap Fund - Institutional Shares | | | | | | | | | |
Actual | | $ | 1,000.00 | | $ | 1,401.30 | | $ | 5.84 |
Hypothetical (5% return before expenses) | | $ | 1,000.00 | | $ | 1,020.21 | | $ | 4.91 |
| (1) | Expenses are equal to the Fund’s ratio of expenses to average net assets for the six-month period ended September 30, 2009 (shown below), multiplied by the average account value over the period, multiplied by 183/365 (to reflect the one-half year period). |
| | | |
| Fund | | Annualized Ratio of Expenses to Average
Net Assets for the Six-Month
Period Ended September 30, 2009 | |
Artisan Emerging Markets Fund - Institutional Shares(a) | | 1.50 | % |
Artisan International Fund - Institutional Shares | | 0.99 | % |
Artisan International Value Fund - Institutional Shares | | 1.04 | % |
Artisan Mid Cap Fund - Institutional Shares | | 0.97 | % |
| (a) | The annualized ratio of expenses to average net assets excludes expenses paid by the Adviser. |
50
NOTES ON MANAGEMENT’S DISCUSSION OF FUND PERFORMANCE AND PORTFOLIO HOLDINGS’ CLASSIFICATION
The discussions of each Fund included in this report include statistical information about the portfolios of each of the Funds. Except as otherwise noted, that information is as of September 30, 2009. That information will vary with changes in a Fund’s portfolio investments. The performance information for each Fund relative to its benchmark index discussed in this report was prepared by the Adviser using information reported by FactSet Databases (“FactSet”). For the purposes of assigning portfolio securities to a particular country, the Adviser considers an issuer to be from a particular country as designated by its securities information vendors. The Adviser currently uses MSCI Inc. as its primary source and FactSet as a secondary source for this information. In the event (i) the Adviser’s securities information vendors do not assign a security to a particular country or if the published classification appears to be erroneous, or (ii) its primary vendor does not assign a security to a particular country and the secondary vendor has assigned a security to a particular country by using a methodology that is not the same as the methodology the primary vendor uses to assign a country, the Adviser assigns the security to a country using the primary vendor’s published criteria (to the extent available) or the Adviser’s own judgment. The primary information vendor’s criteria include the identity of the jurisdiction of the issuer’s incorporation, the main equity trading market for the issuer’s securities, the geographical distribution of the issuer’s operations and the location of the issuer’s headquarters. Country designations may change over time.
For the purposes of assigning portfolio securities to a particular sector and industry, the Adviser assigns securities in accordance with the sector and industry classifications of the Global Industry Classification Standard (GICS®) developed by MSCI Inc. and Standard & Poor’s (to the extent available) as a primary source and FactSet (to the extent available) as a secondary source for this information. In the event the Adviser’s securities information vendors do not classify a security to a particular sector or industry or if the published classification appears to be erroneous, the Adviser classifies the security according to its own judgment, using other securities information vendors, the company description and other publicly available information about the company’s peer group. Sector and industry classifications may change over time.
The names of portfolio securities reflected in this report are as reported by the Funds’ data providers, may not represent the legal name of the entity and, in some cases, are translations of non-English names.
Definitions of Portfolio Statistics
Market Capitalization is the aggregate value of all of a company’s outstanding equity securities.
Weighted Average Market Cap is the average of the market capitalizations of the companies in the portfolio weighted by the size of each company’s position within the portfolio.
Descriptions of Indices
Each Fund’s performance is compared in this report to changes in one or more indices, including in all cases a broad-based index of changes in prices of securities in the markets in which the Fund invests. All of the indices are unmanaged and their returns include reinvested dividends. Unlike the Funds’ returns, the returns of each index do not include the payment of sales commissions or other expenses that would be incurred in the purchase or sale of the securities included in that index. An investment cannot be made directly in an index. Fair value pricing is not employed by market indices.
51
NOTES ON MANAGEMENT’S DISCUSSION OF FUND PERFORMANCE AND PORTFOLIO HOLDINGS’ CLASSIFICATION
The indices to which the Funds are compared are:
Artisan Emerging Markets Fund – Morgan Stanley Capital International Emerging Markets IndexSM is a market-weighted index of companies in emerging markets.
Artisan International and Artisan International Value Funds – Morgan Stanley Capital International EAFE® Index (MSCI EAFE®) is a market-weighted index of companies in developed markets, excluding the U.S. and Canada. MSCI EAFE®’s average annual return since inception of the International Fund is based upon a starting date of December 31, 1995.
Artisan International Fund – Morgan Stanley Capital International EAFE® Growth Index (MSCI EAFE® Growth) is a market-weighted index of companies in developed markets, excluding the U.S. and Canada, that exhibits growth investment style characteristics according to MSCI’s methodology. MSCI EAFE® Growth’s average annual return since inception of the International Fund is based upon a starting date of December 31, 1995.
Artisan International Value Fund – Morgan Stanley Capital International EAFE® Value Index (MSCI EAFE® Value) is a market-weighted index of companies in developed markets, excluding the U.S. and Canada, that exhibits value investment style characteristics according to MSCI’s methodology.
Artisan Mid Cap Fund – Russell Midcap® Index is a market-weighted index of about 800 medium-sized U.S. companies.
Artisan Mid Cap Fund – Russell Midcap® Growth Index is a market-weighted index of those medium-sized companies included in the Russell Midcap® Index with higher price-to-book and higher forecasted growth values.
Trademarks
Trademarks and copyrights relating to the indices and products of portfolio companies mentioned in this report are owned by their respective owners. Except as otherwise indicated, the trademarks, including names, logos, slogans and service marks appearing in this report are the property of the Adviser and may not be copied, reproduced, published or in any way used without written permission.
The Global Industry Classification Standard (“GICS”) was developed by and is the exclusive property and a service mark of MSCI Inc. (“MSCI”) and Standard & Poor’s, a division of The McGraw-Hill Companies, Inc. (“S&P”) and is licensed for use by Artisan Partners Limited Partnership. Neither MSCI, S&P nor any third party involved in making or compiling the GICS or any GICS classifications makes any express or implied warranties or representations with respect to such standard or classification (or the results to be obtained by the use thereof), and all such parties hereby expressly disclaim all warranties of originality, accuracy, completeness, merchantability and fitness for a particular purpose with respect to any of such standard or classification. Without limiting any of the foregoing, in no event shall MSCI, S&P, any of their affiliates or any third party involved in making or compiling the GICS or any GICS classifications have any liability for any direct, indirect, special, punitive, consequential or any other damages (including lost profits) even if notified of the possibility of such damages.
The MSCI information may only be used by the reader, may not be reproduced or redisseminated in any form and may not be used to create any financial instruments or products or any indices. The MSCI information is provided on an “as is” basis and the reader of this information assumes the entire risk of any use made of this information. MSCI, each
52
NOTES ON MANAGEMENT’S DISCUSSION OF FUND PERFORMANCE AND PORTFOLIO HOLDINGS’ CLASSIFICATION
of its affiliates and each other person involved in or related to compiling, computing or creating any MSCI information (collectively, the “MSCI Parties”) expressly disclaims all warranties (including, without limitation, any warranties of originality, accuracy, completeness, timeliness, non-infringement, merchantability and fitness for a particular purpose) with respect to this information. Without limiting any of the foregoing, in no event shall MSCI Parties have any liability for any direct, indirect, special, incidental, punitive, consequential (including, without limitation, lost profits) or any other damages.
Russell Investment Group is the source and owner of the Russell Index data contained or reflected in this material and all trademarks and copyrights related thereto. The presentation may contain confidential information and unauthorized use, disclosure, copying, dissemination or redistribution is strictly prohibited. This is a presentation of Artisan Funds, Inc. Russell Investment Group is not responsible for the formatting or configuration of this material or for any inaccuracy in Artisan Funds’ presentation thereof.
PROXY VOTING POLICIES AND PROCEDURES
You may obtain a description of Artisan Funds’ proxy voting policies and procedures, without charge, upon request by calling 800.399.1770. That information also is included in Artisan Funds’ statement of additional information, which is available without charge, upon request, by calling 800.399.1770 and on the Securities and Exchange Commission’s website at www.sec.gov.
Information relating to how each Fund voted proxies relating to portfolio securities held during the twelve-month period ended June 30 is available without charge, on the Funds’ website at www.artisanfunds.com and on the Securities and Exchange Commission’s website at www.sec.gov. Information relating to Artisan Emerging Markets Fund also is available without charge on its website at www.artemf.com and on the Securities and Exchange Commission’s website.
INFORMATION ABOUT PORTFOLIO SECURITIES
Artisan Funds files a complete schedule of portfolio holdings with the Securities and Exchange Commission for the quarters ending December 31 and June 30 (the first and third quarters of the Funds’ fiscal year) on Form N-Q. The Funds’ Forms N-Q are available on the Securities and Exchange Commission’s website at www.sec.gov. You also may review and copy those documents by visiting the Securities and Exchange Commission’s Public Reference Room in Washington, D.C. Information on the operation of the Public Reference Room may be obtained by calling the Securities and Exchange Commission at 800.SEC.0330.
53
DIRECTORS AND OFFICERS
The board of directors has overall responsibility for the conduct of the affairs of Artisan Funds. Each director serves an indefinite term of unlimited duration until the next annual meeting of shareholders and until the election and qualification of his or her successor. The board of directors may fill any vacancy on the board provided that after such appointment at least two-thirds of the directors have been elected by the shareholders. The shareholders may remove a director by a vote of a majority of the outstanding shares of the Funds at any meeting of shareholders called for the purpose of removing such director.
The board of directors elects the officers of Artisan Funds. Each officer serves until the election and qualification of his or her successor, or until he or she sooner dies, resigns, or is removed or disqualified. The board of directors may remove any officer with or without cause at any time.
The names and ages of the directors and officers as of November 13, 2009, the position each holds with the Funds, the date each was first elected to office, their principal business occupations and other directorships they have held during the last five years are shown below. Each director oversees all eleven series of Artisan Funds.
| | | | | | | | |
| | | | | |
Name and Age at 11/13/09 | | Position(s)
Held with
Artisan Funds | | Date First Elected
or Appointed to Office | | Principal Occupation(s) during Past 5 Years | | Other Public Company or
Registered Investment
Company Directorships Held |
| Directors who are not “interested persons” of Artisan Funds: |
| David A. Erne – 66 | | Director and Independent Chair of the Board of Directors | | Director since 3/27/95; Independent Chair since 2/4/05 | | Of counsel to the law firm Reinhart Boerner Van Deuren s.c., Milwaukee, WI. | | Trustee, Northwestern Mutual Life Insurance Company (individual life insurance, disability insurance and annuity company). |
| Thomas R. Hefty – 62 | | Director | | 3/27/95 | | Retired; from January 2007 to February 2008, President, Kern Family Foundation (private, grant-making organization); until December 2006, of counsel to the law firm Reinhart Boerner Van Deuren s.c., Milwaukee, WI; until December 2006, Adjunct Faculty, Department of Business and Economics, Ripon College. | | None. |
| Jeffrey A. Joerres – 49 | | Director | | 8/9/01 | | Chairman of the Board, President and Chief Executive Officer of Manpower Inc. (non-governmental employment service organization). | | Director, Johnson Controls, Inc. (manufacturer of automotive systems and building controls). |
| Patrick S. Pittard – 63 | | Director | | 8/9/01 | | Distinguished Executive in Residence (teaching position), University of Georgia. | | Director, Cbeyond, Inc. (telecommunications company, formerly Cbeyond Communications, Inc.); Director, Lincoln National Corporation (insurance and investment management company). |
| Howard B. Witt – 69 | | Director | | 3/27/95 | | Retired; until December 2004, Chairman of the Board, President and Chief Executive Officer of Littelfuse, Inc. (manufacturer of advanced circuit protection devices). | | Director, Franklin Electric Co., Inc. (manufacturer of electric motors). |
54
DIRECTORS AND OFFICERS
| | | | | | | | |
| | | | | |
Name and Age at 11/13/09 | | Position(s)
Held with
Artisan Funds | | Date First Elected
or Appointed to Office | | Principal Occupation(s) during Past 5 Years | | Other Public Company or
Registered Investment
Company Directorships Held |
| Director who is an “interested person” of Artisan Funds: |
| Andrew A. Ziegler – 52* | | Director, President and Chief Executive Officer | | Director since 1/5/95; President since 12/19/03 (Chief Executive Officer continuously since 1/5/95) | | Managing Director of Artisan Partners. | | None. |
| Officers: |
| Lawrence A. Totsky – 50 | | Chief Financial Officer and Treasurer | | 1/22/98 | | Managing Director and Chief Financial Officer of Artisan Partners; Vice President, Chief Financial Officer and Treasurer of Artisan Distributors LLC. | | None. |
| Janet D. Olsen – 53 | | General Counsel and Secretary | | 1/18/01 | | Managing Director and General Counsel of Artisan Partners; Vice President and Secretary of Artisan Distributors LLC. | | None. |
| Brooke J. Billick – 55 | | Chief Compliance Officer | | 8/19/04 | | Chief Compliance Officer and Associate Counsel of Artisan Partners; Chief Compliance Officer of Artisan Distributors LLC. | | None. |
| Carlene M. Ziegler – 53 | | Vice President | | 3/27/95 | | Managing Director of Artisan Partners; until April 2008, Portfolio Co-Manager of Artisan small-cap growth strategy, including Artisan Small Cap Fund; until February 2005, Director of Artisan Funds. | | None. |
| Michael C. Roos – 51 | | Vice President | | 12/19/03 | | Managing Director of Artisan Partners; Vice President of Artisan Distributors LLC. | | None. |
| Gregory K. Ramirez – 39 | | Assistant Secretary and Assistant Treasurer | | 1/22/98 | | Managing Director of Artisan Partners; Assistant Treasurer of Artisan Distributors LLC. | | None. |
| Sarah A. Johnson – 37 | | Assistant Secretary | | 2/5/03 | | Associate Counsel of Artisan Partners. | | None. |
| * | Mr. Ziegler is an “interested person” of Artisan Funds, as defined in the Investment Company Act of 1940, because he is a Managing Director of Artisan Partners and an officer of Artisan Investments GP LLC (the general partner of Artisan Partners). Mr. Ziegler and Carlene M. Ziegler (who are married to each other) control Artisan Partners. |
The business address of the officers and directors affiliated with Artisan Partners is 875 E. Wisconsin Avenue, Suite 800, Milwaukee, Wisconsin 53202. The addresses of the other directors are: Mr. Erne – 1000 North Water Street, Suite 2100, Milwaukee, Wisconsin 53202; Mr. Joerres – 100 Manpower Place, Milwaukee, Wisconsin 53212; and Mr. Hefty, Mr. Pittard and Mr. Witt – c/o Artisan Funds, 875 E. Wisconsin Avenue, Suite 800, Milwaukee, Wisconsin 53202.
Artisan Funds’ statement of additional information (SAI) contains further information about the directors. Please call 800.399.1770 for a free copy of the SAI.
55
| | | | |

| | ARTISAN FUNDS P.O. BOX 8412 BOSTON, MA 02266-8412 800.399.1770 | | |

ARTISAN
ANNUAL
REPORT
SEPTEMBER 30, 2009
ARTISAN EMERGING
MARKETS FUND
_________
ARTISAN FUNDS, INC.
ADVISOR SHARES
TABLE OF CONTENTS
ARTISAN FUNDS
P.O. BOX 8412
BOSTON, MA 02266-8412
This report and the audited financial statements contained herein are provided for the general information of the shareholders of the Advisor Shares of Artisan Emerging Markets Fund. Before investing, investors should consider carefully the Fund’s investment objective, risks and charges and expenses. For more complete information on the Fund, including fees and expenses, please call 866.574.1770 for a free prospectus. Read it carefully before you invest or send money.
Company discussions are for illustration only and are not intended as recommendations of individual stocks. The discussion presents information about the companies believed to be accurate, and the views of the portfolio managers, as of September 30, 2009. That information and those views may change, and the Fund disclaims any obligation to advise shareholders of any such changes. Artisan Emerging Markets Fund also offers an institutional class of shares for institutional investors meeting certain minimum investment requirements. A report on the institutional class is available under separate cover.
Artisan Funds offered through Artisan Distributors LLC, member FINRA.
ARTISAN EMERGING MARKETS FUND (ARTZX)
INVESTMENT PROCESS HIGHLIGHTS
| | |
Artisan Emerging Markets Fund employs a fundamental research process to construct a diversified portfolio of emerging market companies. The team’s investment process is focused on identifying companies that are priced at a discount relative to the team’s estimate of their sustainable earnings. • Sustainable Earnings. The team believes that over the long term a stock’s price is directly related to the company’s ability to deliver sustainable earnings. The team determines a company’s sustainable earnings based upon financial and business analysis. The financial analysis of a company’s balance sheet, income statement, and statement of cash flows focuses on identifying historical drivers of return on equity. The business analysis examines a company’s competitive advantages and financial strength to assess sustainability. • Valuation. The team believes that investment opportunities develop when businesses with sustainable earnings are undervalued relative to peers and historical industry, country and regional valuations. The team values a business and develops a price target based on their assessment of the business’s sustainable earnings and cash flow expectations and the team’s risk analysis. • Risk Analysis. The team believes that a disciplined risk framework allows greater focus on fundamental stock selection. The team incorporates its assessment of company-specific and macroeconomic risks into its valuation analysis to develop a risk-adjusted target price. The risk-rating assessment includes a review of the currency, interest rate, monetary and fiscal policy and political risks to which a company is exposed. |
|
| PERFORMANCE HISTORY | | |
GROWTH OF AN ASSUMED $10,000 INVESTMENT (6/2/2008 to 9/30/2009)
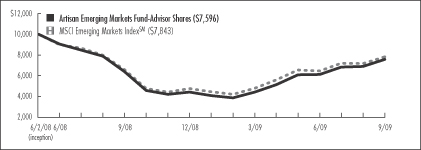
AVERAGE ANNUAL TOTAL RETURNS (as of 9/30/2009)
| | | | | | |
| Fund / Index | | 1-Year | | | Since
Inception | |
Artisan Emerging Markets Fund - Advisor Shares | | 18.64 | % | | -18.69 | % |
MSCI Emerging Markets IndexSM | | 19.07 | | | -16.71 | |
The performance quoted represents past performance, which does not guarantee future results. The investment return and principal value of an investment in the Fund will fluctuate, so that an investor’s shares in the Fund, when redeemed, may be worth more or less than their original cost. Current performance may be lower or higher than the performance data quoted. For current to most recent month-end performance information call 866.574.1770. The graph and table above do not reflect the deduction of taxes that a shareholder would pay on distributions or sale of Fund shares. The performance shown does not reflect the deduction of a 2% redemption fee on shares held by an investor for 90 days or less and, if reflected, the fee would reduce the performance quoted. The Fund’s performance information reflects Artisan Partners’ agreement to limit the Fund’s expenses to no more than 1.50%, which has been in effect since the Fund’s inception and has had a material impact on the Fund’s performance. Absent that expense waiver, the Fund’s performance would have been lower. See page 26 for a description of the index.
2
INVESTING ENVIRONMENT
During the year ended September 30, 2009, global markets continued to deal with the economic downturn. Emerging markets stocks fell sharply in October 2008 and continued to trade around recent lows until early March when stocks started to rally on reports that the pace of the global economic slowdown had begun to moderate. For the year ended September 30, 2009, the MSCI Emerging Markets IndexSM advanced 19.07%, though not all markets enjoyed robust gains. Asia was the strongest performing region as stocks in China and India posted gains in excess of 30%. In Latin America, stocks advanced nearly 20% on the strength of the Brazilian market, which was up almost 27%. In contrast, stocks in Mexico fell approximately -4% during the period. The EMEA (Europe, Middle East & Africa) region was the weakest performing area.
SECTOR DIVERSIFICATION
| | | | | | |
| Sector | | 9/30/08 | | | 9/30/09 | |
Consumer Discretionary | | 10.6
| %
| | 10.9
| %
|
Consumer Staples | | 8.4
|
| | 6.2
|
|
Energy | | 14.8
|
| | 12.7
|
|
Financials | | 13.6
|
| | 14.8
|
|
Healthcare | | 2.6
|
| | 2.2
|
|
Industrials | | 12.6
|
| | 10.8
|
|
Information Technology | | 10.2
|
| | 12.9
|
|
Materials | | 13.0
|
| | 11.3
|
|
Telecommunication Services | | 9.5
|
| | 11.8
|
|
Utilities | | 1.5
|
| | 2.6
|
|
Other assets less liabilities | | 3.2
|
| | 3.8
|
|
Total | | 100.0
| %
| | 100.0
| %
|
As a percentage of total net assets.
PERFORMANCE DISCUSSION
The Fund returned 18.64% during the twelve-month period, slightly underperforming the Index. We benefited from strong security selection in Taiwan, Korea and Brazil. Some of our leading performers in these countries were Taiwanese fertilizer manufacturer and land owner Taiwan Fertilizer Co., Ltd., Taiwanese memory chip manufacturer MediaTek Incorporation, Korean memory chip manufacturer Samsung Electronics Co., Ltd., Brazilian consumer products manufacturer Hypermarcas SA, Brazilian bank Itau Unibanco Holdings SA and Brazilian oil company OGX Petroleo e Gas Participacoes SA.
On the downside, we were negatively impacted by weakness in our Russian and Indian holdings. Some of our biggest decliners in these countries were Russian banking services provider Sberbank, Russian seamless pipe manufacturer OAO TMK, Russian oil company Alliance Oil Company Ltd. and Indian consulting and IT services provider Satyam Computer Services Limited. We were also hurt on a relative basis by our lack of investment in Chinese financials, which advanced over 38%.
FUND CHANGES
We strive to identify stocks that possess unique access to growth and competitive advantages that will allow those companies to sustain earnings growth over the long term. The volatility in the market over the past twelve months unearthed several investment opportunities. The most recent additions to the portfolio included Chinese mobile telecom services provider China Mobile Limited, Indonesian telecom services company PT Telekomunikasi Indonesia, Indonesian cement and building materials manufacturer PT Indocement Tunggal Prakarsa Tbk, Indonesian commercial bank PT Bank Rakyat Indonesia and Brazilian telecom services provider Tele Norte Leste Participacoes S.A. Our purchases were funded in part by the sales of Weichai Power Co., Ltd., Dr. Reddy’s Laboratories Limited, Tiger Brands Limited, Credicorp Limited and Philippine Long Distance Telephone Company.
REGION ALLOCATION
| | | | | | |
| Region | | 9/30/08 | | | 9/30/09 | |
Emerging Asia | | 36.2 | % | | 41.9 | % |
Latin America | | 27.9 | | | 26.0 | |
Europe, Middle East & Africa | | 27.5 | | | 24.1 | |
Developed Markets | | 5.2 | | | 4.2 | |
As a percentage of total net assets.
3
ARTISAN EMERGING MARKETS FUND
Schedule of Investments – September 30, 2009
| | | | | |
| | | Shares
Held | | Value |
| COMMON AND | | | | | |
| PREFERRED STOCKS - 96.2% | | | | | |
| | | | | |
| BRAZIL - 19.1% | | | | | |
All-America Latina Logistica S.A. (Units) | | 155,900 | | $ | 1,202,074 |
Amil Participacoes SA | | 133,200 | | | 730,059 |
Companhia Energetica de Minas Gerais- CEMIG, Preferred(1) | | 66,447 | | | 1,012,683 |
Companhia Vale do Rio Doce | | 158,462 | | | 3,684,268 |
Dufry South America Ltd (DR) | | 71,000 | | | 1,199,898 |
Empresa Brasileira de Aeronautica S.A.(2) | | 156,600 | | | 906,045 |
Hypermarcas SA(2) | | 73,000 | | | 1,429,425 |
Itau Unibanco Holdings SA, Preferred(1) | | 139,051 | | | 2,802,055 |
Marcopolo S.A., Preferred(1) | | 274,400 | | | 944,818 |
Net Servicos de Comunicacao SA, Preferred(2) | | 72,400 | | | 842,269 |
OGX Petroleo e Gas Participacoes SA | | 1,187 | | | 907,865 |
Petroleo Brasileiro S.A. | | 281,300 | | | 6,486,286 |
Randon SA Implementos e Participacoes, Preferred(1) | | 136,100 | | | 1,024,822 |
Rodobens Negocios Imobiliarios SA | | 97,300 | | | 987,499 |
SEB - Sistema Educacional Brasileiro SA (Units)(1) | | 99,100 | | | 990,105 |
SLC Agricola SA | | 69,278 | | | 595,957 |
Tele Norte Leste Participacoes S.A. | | 48,100 | | | 1,086,024 |
Tim Participacoes S.A., Preferred | | 599,100 | | | 1,491,325 |
Wilson Sons Limited (DR) | | 89,721 | | | 1,230,144 |
| | | | | |
| | | | | 29,553,621 |
| CHILE - 1.1% | | | | | |
Compania Cervecerias Unidas S.A. | | 140,189 | | | 956,269 |
Empresa Nacional de Telecomunicaciones S.A. | | 57,908 | | | 749,038 |
| | | | | |
| | | | | 1,705,307 |
| CHINA - 12.3% | | | | | |
Airmedia Group, Inc. (DR)(2) | | 116,302 | | | 854,820 |
Ajisen China Holdings Limited | | 1,337,913 | | | 1,191,167 |
Chaoda Modern Agriculture (Holdings) Limited | | 2,466,536 | | | 1,499,008 |
China Dongxiang Group Company | | 2,591,000 | | | 1,718,407 |
China Mobile Limited | | 389,500 | | | 3,794,459 |
China Railway Construction Corporation, H Shares | | 659,000 | | | 875,827 |
GOME Electrical Appliances Holdings Limited(2) | | 6,095,587 | | | 1,628,101 |
Huabao International Holdings Limited | | 2,188,900 | | | 2,347,051 |
Mindray Medical International Limited, Class A (DR) | | 44,083 | | | 1,438,869 |
New Oriental Education & Technology Group, Inc. (DR)(2) | | 9,472 | | | 762,022 |
Tingyi (Cayman Islands) Holding Corporation | | 722,300 | | | 1,493,054 |
Zhuzhou CSR Times Electric Co., Ltd., H Shares | | 813,200 | | | 1,420,730 |
| | | | | |
| | | | | 19,023,515 |
| | | | | |
| | | Shares
Held | | Value |
| CZECH REPUBLIC - 0.9% | | | | | |
CEZ | | 25,892 | | $ | 1,380,923 |
| | | | | |
| EGYPT - 1.4% | | | | | |
Commercial International Bank | | 74,988 | | | 790,086 |
Egyptian Financial Group-Hermes Holding | | 253,379 | | | 1,376,499 |
| | | | | |
| | | | | 2,166,585 |
| HONG KONG - 0.8% | | | | | |
Samson Holding Ltd. | | 6,230,955 | | | 1,286,382 |
| | | | | |
| HUNGARY - 0.8% | | | | | |
MOL Hungarian Oil and Gas Nyrt., Class A(2) | | 14,495 | | | 1,210,385 |
| | | | | |
| INDIA - 3.2% | | | | | |
Cairn India Ltd.(2) | | 314,654 | | | 1,710,467 |
Patni Computer Systems Ltd | | 112,773 | | | 1,076,507 |
Piramal Healthcare Ltd. | | 135,902 | | | 1,082,018 |
Power Finance Corporation | | 221,908 | | | 1,056,606 |
| | | | | |
| | | | | 4,925,598 |
| INDONESIA - 2.8% | | | | | |
PT Bank Rakyat Indonesia | | 1,590,500 | | | 1,234,221 |
PT Indocement Tunggal Prakarsa Tbk | | 1,207,595 | | | 1,324,419 |
PT Telekomunikasi Indonesia(3) | | 1,929,500 | | | 1,722,078 |
| | | | | |
| | | | | 4,280,718 |
| ITALY - 0.5% | | | | | |
Tenaris S.A. (DR) | | 23,625 | | | 841,523 |
| | | | | |
| KAZAKSTAN - 1.2% | | | | | |
KazMunaiGas Exploration Production (DR) | | 80,221 | | | 1,795,346 |
| | | | | |
| KOREA - 9.1% | | | | | |
Daewoo Shipbuilding & Marine Engineering Co., Ltd. | | 42,934 | | | 626,747 |
Hyundai Development Company | | 27,731 | | | 1,007,330 |
MegaStudy Co., Ltd. | | 6,312 | | | 1,299,096 |
Samsung Electronics Co., Ltd. | | 10,726 | | | 7,419,215 |
Shinhan Financial Group Co., Ltd.(2) | | 53,567 | | | 2,136,770 |
Shinsegae Co., Ltd. | | 3,049 | | | 1,539,703 |
| | | | | |
| | | | | 14,028,861 |
| LUXEMBOURG - 0.6% | | | | | |
Ternium S.A. (DR)(2) | | 32,780 | | | 871,948 |
| | | | | |
| MEXICO - 5.7% | | | | | |
America Movil SAB de C.V., Series L(1) | | 1,242,995 | | | 2,721,383 |
Bolsa Mexicana de Valores SA(2) | | 654,844 | | | 810,246 |
Fomento Economico Mexicano SAB, Series UBD (Units) | | 316,810 | | | 1,206,258 |
Grupo Financiero Banorte S.A.B. de C.V. | | 417,886 | | | 1,398,217 |
4
| | | | | |
| | | Shares
Held | | Value |
| MEXICO (CONTINUED) | | | | | |
Grupo Televisa S.A. | | 376,307 | | $ | 1,392,367 |
Urbi, Desarrollos Urbanos, S.A. de C.V.(2) | | 660,893 | | | 1,339,708 |
| | | | | |
| | | | | 8,868,179 |
| NETHERLANDS - 0.8% | | | | | |
Plaza Centers (Europe) BV(2) | | 577,767 | | | 1,211,909 |
| | | | | |
| POLAND - 0.6% | | | | | |
Polski Koncern Naftowy Orlen S.A.(2) | | 90,152 | | | 934,470 |
| | | | | |
| RUSSIA - 4.6% | | | | | |
Globaltrans Investment PLC (DR)(2) | | 144,207 | | | 1,067,132 |
Globaltrans Investment PLC, 144A (DR)(2)(3) | | 50,956 | | | 377,074 |
LUKOIL (DR) | | 64,329 | | | 3,486,632 |
Mobile TeleSystems (DR) | | 27,458 | | | 1,325,398 |
Razguliay Group(2)(3) | | 426,978 | | | 873,003 |
| | | | | |
| | | | | 7,129,239 |
| SINGAPORE - 0.8% | | | | | |
Epure International Ltd. | | 2,960,000 | | | 1,197,743 |
| | | | | |
| SOUTH AFRICA - 9.3% | | | | | |
ABSA Group Limited | | 103,317 | | | 1,650,431 |
African Bank Investments Limited | | 293,703 | | | 1,153,386 |
Barloworld Limited | | 124,095 | | | 809,459 |
Gold Fields Limited | | 121,474 | | | 1,641,322 |
Grindrod Limited | | 523,772 | | | 1,108,623 |
Harmony Gold Mining Company Limited | | 99,526 | | | 1,059,915 |
Impala Platinum Holdings Limited | | 82,110 | | | 1,912,840 |
Mondi Limited | | 273,218 | | | 1,418,464 |
Mr. Price Group Limited | | 153,914 | | | 696,629 |
MTN Group Limited(3) | | 135,053 | | | 2,147,328 |
Reunert Limited | | 111,437 | | | 830,734 |
| | | | | |
| | | | | 14,429,131 |
| SWEDEN - 0.8% | | | | | |
Alliance Oil Co Ltd. (DR) | | 93,993 | | | 1,162,888 |
| | | | | |
| TAIWAN - 11.7% | | | | | |
Acer Inc. | | 628,599 | | | 1,603,369 |
Cathay Financial Holding Co., Ltd.(2) | | 874,292 | | | 1,452,258 |
Chinatrust Financial Holding Company Ltd. | | 1,977,838 | | | 1,282,752 |
Far Eastern Textile Ltd. | | 1,076,698 | | | 1,262,645 |
Far EasTone Telecommunications Co., Ltd. | | 593,000 | | | 693,567 |
Hon Hai Precision Industry Co., Ltd. | | 683,729 | | | 2,743,593 |
HTC Corporation | | 93,400 | | | 1,025,576 |
MediaTek Incorporation | | 149,214 | | | 2,487,828 |
Taiwan Fertilizer Co., Ltd. | | 556,000 | | | 1,988,926 |
Taiwan Semiconductor Manufacturing Company Ltd. | | 1,750,647 | | | 3,512,403 |
| | | | | |
| | | | | 18,052,917 |
| THAILAND - 2.8% | | | | | |
Bangkok Bank Public Company Limited (DR) | | 254,600 | | | 922,077 |
Bumrungrad Hospital Public Company Limited (DR) | | 945,000 | | | 820,263 |
| | | | | | | |
| | | Shares
Held | | Value | |
| THAILAND (CONTINUED) | | | | | | | |
Glow Energy Pcl (DR) | | | 438,700 | | $ | 430,034 | |
Siam Commercial Bank Public Company Limited (DR) | | | 567,700 | | | 1,444,313 | |
Total Access Communication Public Company Limited (DR) | | | 593,300 | | | 759,161 | |
| | | | | | | |
| | | | | | 4,375,848 | |
| TURKEY - 5.3% | | | | | | | |
Cimsa Cimento Sanayi ve Ticaret A.S. | | | 278,976 | | | 1,231,329 | |
Ford Otomotiv Sanayi A.S. | | | 114,160 | | | 715,423 | |
Tekfen Holding A.S.(2) | | | 261,548 | | | 754,330 | |
Tupras-Turkiye Petrol Rafinerileri A.S. | | | 65,336 | | | 1,083,063 | |
Turk Hava Yollari Anonim Ortakligi | | | 475,255 | | | 1,236,175 | |
Turkcell Iletisim Hizmetleri AS | | | 247,135 | | | 1,765,250 | |
Turkiye Sinai Kalkinma Bankasi A.S.(2) | | | 1,387,291 | | | 1,374,203 | |
| | | | | | | |
| | | | | | 8,159,773 | |
| | | | | | | |
Total common and preferred stocks
(Cost $126,492,215) | | | | | | 148,592,809 | |
| | |
| | | Par
Amount | | | |
| SHORT-TERM INVESTMENTS (CASH EQUIVALENTS) - 3.9% | | | | | | | |
Repurchase agreement with Fixed Income Clearing Corporation, 0.01%, dated 9/30/09, due 10/1/09, maturity value $6,031,002(4) (Cost $6,031,000) | | $ | 6,031,000 | | | 6,031,000 | |
| | | | | | | |
| | | | | | | |
Total investments - 100.1%
(Cost $132,523,215) | | | | | | 154,623,809 | |
| | | | | | | |
Other assets less liabilities - (0.1%) | | | | | | (214,689 | ) |
| | | | | | | |
| | | | | | | |
Total net assets - 100.0%(5) | | | | | $ | 154,409,120 | |
| | | | | | | |
| (2) | Non-income producing security. |
| (3) | Valued at a fair value in accordance with procedures established by the board of directors of Artisan Funds, Inc. In total, securities valued at a fair value were $5,119,483 or 3.3% of total net assets. |
| | | | | | | | |
Issuer | | Rate | | | Maturity | | Value |
U.S. Treasury Bond | | 4.750 | % | | 3/31/2011 | | $ | 6,152,139 |
| (5) | Percentages for the various classifications relate to total net assets. |
Company names are as reported by a data service provider and in some cases are translations; a company’s legal name may be different.
(DR) Depository Receipt, voting rights may vary.
5
| | | | | | | |
| PORTFOLIO DIVERSIFICATION - SEPTEMBER 30, 2009 | |
| | | Value | | | Percentage
of Total
Net Assets | |
Consumer Discretionary | | $ | 16,903,893 | | | 10.9 | % |
Consumer Staples | | | 9,592,677 | | | 6.2 | |
Energy | | | 19,618,925 | | | 12.7 | |
Financials | | | 22,826,088 | | | 14.8 | |
Healthcare | | | 3,341,150 | | | 2.2 | |
Industrials | | | 16,684,709 | | | 10.8 | |
Information Technology | | | 19,868,491 | | | 12.9 | |
Materials | | | 17,480,482 | | | 11.3 | |
Telecommunication Services | | | 18,255,011 | | | 11.8 | |
Utilities | | | 4,021,383 | | | 2.6 | |
| | | | | | | |
Total common and preferred stocks | | | 148,592,809 | | | 96.2 | |
Short-term investments | | | 6,031,000 | | | 3.9 | |
| | | | | | | |
Total investments | | | 154,623,809 | | | 100.1 | |
Other assets less liabilities | | | (214,689 | ) | | (0.1 | ) |
| | | | | | | |
Total net assets | | $ | 154,409,120 | | | 100.0 | % |
| | | | | | | |
| | | | | | |
| CURRENCY EXPOSURE - SEPTEMBER 30, 2009 | |
| | | Value | | Percentage
of Total
Investments | |
Brazilian real | | $ | 29,553,621 | | 19.1 | % |
British pound | | | 1,211,909 | | 0.8 | |
Chilean peso | | | 1,705,307 | | 1.1 | |
Czech koruna | | | 1,380,923 | | 0.9 | |
Egyptian pound | | | 2,166,585 | | 1.4 | |
Hong Kong dollar | | | 17,254,186 | | 11.2 | |
Hungarian forint | | | 1,210,385 | | 0.8 | |
Indian rupee | | | 4,925,598 | | 3.2 | |
Indonesian rupiah | | | 4,280,718 | | 2.8 | |
Korean won | | | 14,028,861 | | 9.1 | |
Mexican peso | | | 8,868,179 | | 5.7 | |
Polish zloty | | | 934,470 | | 0.6 | |
Singapore dollar | | | 1,197,743 | | 0.8 | |
South African rand | | | 14,429,131 | | 9.3 | |
Swedish krona | | | 1,162,888 | | 0.7 | |
Taiwan dollar | | | 18,052,917 | | 11.7 | |
Thai baht | | | 4,375,848 | | 2.8 | |
Turkish lira | | | 8,159,773 | | 5.3 | |
U.S. dollar | | | 19,724,767 | | 12.7 | |
| | | | | | |
Total investments | | $ | 154,623,809 | | 100.0 | % |
| | | | | | |
| | | | | |
| TOP TEN HOLDINGS - SEPTEMBER 30, 2009 | |
Company Name | | Country | | Percentage
of Total
Net Assets | |
Samsung Electronics Co., Ltd. | | Korea | | 4.8 | % |
Petroleo Brasileiro S.A. | | Brazil | | 4.2 | |
China Mobile Limited | | China | | 2.5 | |
Companhia Vale do Rio Doce | | Brazil | | 2.4 | |
Taiwan Semiconductor Manufacturing Company Ltd. | | Taiwan | | 2.3 | |
LUKOIL | | Russia | | 2.3 | |
Banco Itau Holding Financeira S.A.,
Preferred | | Brazil | | 1.8 | |
Hon Hai Precision Industry Co., Ltd. | | Taiwan | | 1.8 | |
America Movil SAB de C.V. | | Mexico | | 1.8 | |
MediaTek Incorporation | | Taiwan | | 1.6 | |
| | | | | |
Total | | | | 25.5 | % |
| | | | | |
For the purpose of determining the Fund’s top ten holdings, securities of the same issuer are aggregated to determine the weight in the Fund.
The accompanying notes are an integral part of the financial statements.
6
ARTISAN FUNDS, INC.
Statement of Assets and Liabilities – September 30, 2009
| | | | |
| | | EMERGING MARKETS | |
| ASSETS: | | | | |
Investments in securities, unaffiliated, at value | | $ | 148,592,809 | |
Short-term investments (repurchase agreements), at value | | | 6,031,000 | |
| | | | |
Total investments | | | 154,623,809 | |
Cash | | | 199 | |
Foreign currency | | | 96,453 | |
Net unrealized gain on foreign currency forward contracts | | | 507 | |
Receivable from investments sold | | | 371,353 | |
Receivable from fund shares sold | | | 1,341,126 | |
Dividends and interest receivable | | | 231,874 | |
Receivable from Adviser | | | 376,318 | |
Other assets | | | 1,157 | |
| | | | |
Total assets | | | 157,042,796 | |
| |
| LIABILITIES: | | | | |
Payable for investments purchased | | | 1,838,646 | |
Payable for fund shares redeemed | | | 20,738 | |
Payable for operating expenses | | | 662,577 | |
Payable for withholding taxes | | | 110,558 | |
Payable for deferred directors’ compensation | | | 1,157 | |
| | | | |
Total liabilities | | | 2,633,676 | |
| | | | |
Total net assets | | $ | 154,409,120 | |
| | | | |
| NET ASSETS CONSIST OF: | | | | |
Fund shares issued and outstanding | | $ | 159,841,686 | |
Net unrealized appreciation on investments and foreign currency related transactions | | | 22,019,766 | |
Accumulated undistributed net investment income | | | 716,697 | |
Accumulated undistributed net realized (losses) on investments and foreign currency related transactions | | | (28,169,029 | ) |
| | | | |
| | $ | 154,409,120 | |
| | | | |
| SUPPLEMENTARY INFORMATION: | | | | |
Net assets | | | | |
Institutional Shares | | $ | 103,963,013 | |
Advisor Shares | | $ | 50,446,107 | |
Shares outstanding (Indefinite number of shares authorized, $0.01 par value) | | | | |
Institutional Shares | | | 7,985,335 | |
Advisor Shares | | | 3,871,671 | |
Net asset value, offering price and redemption price per share | | | | |
Institutional Shares | | $ | 13.02 | |
Advisor Shares | | $ | 13.03 | |
Cost of securities of unaffiliated issuers held | | $ | 132,523,215 | |
Cost of foreign currency | | $ | 95,406 | |
The accompanying notes are an integral part of the financial statements.
7
ARTISAN FUNDS, INC.
Statement of Operations – For the Year Ended September 30, 2009
| | | | |
| | | EMERGING MARKETS | |
| INVESTMENT INCOME: | | | | |
Dividends, from unaffiliated issuers(1) | | $ | 1,888,065 | |
Interest | | | 5,254 | |
| | | | |
Total investment income | | | 1,893,319 | |
| |
| EXPENSES: | | | | |
Advisory fees | | | 805,184 | |
Transfer agent fees | | | | |
Institutional Shares | | | 19,255 | |
Advisor Shares | | | 93,687 | |
Shareholder communications | | | | |
Institutional Shares | | | 5,030 | |
Advisor Shares | | | 25,587 | |
Custodian fees | | | 346,339 | |
Accounting fees | | | 56,567 | |
Professional fees | | | 92,036 | |
Registration fees | | | | |
Institutional Shares | | | 41,129 | |
Advisor Shares | | | 30,429 | |
Directors’ fees | | | 6,000 | |
Other operating expenses | | | 5,337 | |
| | | | |
Total operating expenses | | | 1,526,580 | |
Less amounts waived or paid by the Adviser | | | (376,318 | ) |
| | | | |
Net expenses | | | 1,150,262 | |
| | | | |
Net investment income | | | 743,057 | |
| |
| NET REALIZED AND UNREALIZED GAINS (LOSSES) ON INVESTMENTS: | | | | |
Net realized (loss) on: | | | | |
Investments(1) | | | (26,362,147 | ) |
Foreign currency related transactions | | | (230,806 | ) |
| | | | |
| | | (26,592,953 | ) |
Net increase in unrealized appreciation or depreciation on: | | | | |
Investments | | | 52,745,622 | |
Foreign currency related transactions | | | 20,169 | |
| | | | |
| | | 52,765,791 | |
| | | | |
Net gain on investments and foreign currency related transactions | | | 26,172,838 | |
| | | | |
Net increase in net assets resulting from operations | | $ | 26,915,895 | |
| | | | |
| (1) | Net of foreign taxes withheld of $199,059. |
The accompanying notes are an integral part of the financial statements.
8
ARTISAN FUNDS, INC.
Statement of Changes in Net Assets
| | | | | | | | |
| | | EMERGING MARKETS | |
| | | Year Ended
9/30/2009 | | | Year Ended
9/30/2008 | |
| | |
| OPERATIONS: | | | | | | | | |
Net investment income | | $ | 743,057 | | | $ | 875,308 | |
Net realized (loss) on: | | | | | | | | |
Investments | | | (26,362,147 | ) | | | (1,369,976 | ) |
Foreign currency related transactions | | | (230,806 | ) | | | (80,293 | ) |
Net increase (decrease) in unrealized appreciation or depreciation on: | | | | | | | | |
Investments | | | 52,745,622 | | | | (33,499,682 | ) |
Foreign currency related transactions | | | 20,169 | | | | (82,858 | ) |
| | | | | | | | |
Net increase (decrease) in net assets resulting from operations | | | 26,915,895 | | | | (34,157,501 | ) |
| | |
| DISTRIBUTIONS PAID TO SHAREHOLDERS: | | | | | | | | |
Net investment income: | | | | | | | | |
Institutional Shares | | | (747,694 | ) | | | (39,728 | ) |
Advisor Shares | | | (51,612 | ) | | | - | |
Net realized gains on investment transactions: | | | | | | | | |
Institutional Shares | | | (59,063 | ) | | | (1,484,717 | ) |
Advisor Shares | | | (4,077 | ) | | | - | |
| | | | | | | | |
Total distributions paid to shareholders | | | (862,446 | ) | | | (1,524,445 | ) |
| | |
| FUND SHARE ACTIVITIES: | | | | | | | | |
Net increase in net assets resulting from fund share activities | | | 55,346,259 | | | | 90,274,995 | |
| | | | | | | | |
Total increase in net assets | | | 81,399,708 | | | | 54,593,049 | |
| | | | | | | | |
Net assets, beginning of period | | | 73,009,412 | | | | 18,416,363 | |
| | | | | | | | |
Net assets, end of period | | $ | 154,409,120 | | | $ | 73,009,412 | |
| | | | | | | | |
| | |
Accumulated undistributed net investment income | | $ | 716,697 | | | $ | 805,727 | |
| | | | | | | | |
The accompanying notes are an integral part of the financial statements.
9
ARTISAN FUNDS, INC.
Financial Highlights – For a share outstanding throughout each period
The financial highlights table is intended to help you understand the Fund’s financial performance for the past 5 years or, if shorter, the period of the Fund’s operations. Certain information reflects financial results for a single Fund share. The total returns in the table represent the rate that an investor would have earned or lost on an investment in the Fund (assuming reinvestment of all dividends and distributions). This information has been audited by Ernst & Young LLP, whose report, along with the Fund’s financial statements, are included in this annual report.
| | | | | | | | | | | | | | | | | | | | | | | |
Year or
Period
Ended | | |
Net Asset
Value
Beginning
of Period | | Net
Investment
Income(1) | | Net Realized
and Unrealized
Gain (Loss) on
Investments | | | Total Income
(Loss) from
Investment
Operations | | | Dividends
from Net
Investment
Income | | | Distributions
from Net
Realized Gains | |
| | | | | | | | | | | | | | | | | | | | | | | |
ARTISAN EMERGING MARKETS FUND | | | | | | | | | | | | | | | | | | | |
| Advisor Shares | | | | | | | | | | | | | | | | | | | | | | | |
| 9/30/2009 | | | $ | 11.16 | | $ | 0.07 | | $ | 1.93 | | | $ | 2.00 | | | $ | (0.12 | ) | | $ | (0.01 | ) |
| 9/30/2008 | (5) | | | 17.43 | | | 0.04 | | | (6.31 | ) | | | (6.27 | ) | | | - | | | | - | |
| (1) | Computed based on average shares outstanding. |
| (2) | Periods less than twelve months (where applicable) are not annualized. |
| (3) | Periods less than twelve months (where applicable) are annualized. |
| (4) | The ratios of expenses to average net assets and net investment income (loss) to average net assets exclude expenses waived or paid by the Adviser or the board of directors. Absent expenses waived or paid by the Adviser or the board of directors, the ratios of expenses to average net assets and net investment income (loss) to average net assets would have been as follows: |
| | | | | | | | |
| | | Year or
Period Ended | | Ratio of Expenses to
Average Net Assets | | | Ratio of Net Investment Income
(Loss) to Average Net Assets | |
Emerging Markets Advisor Shares | | 9/30/2009 | | 3.00 | % | | (0.80 | )% |
| | 9/30/2008 | | 9.73 | % | | (7.30 | )% |
10
| | | | | | | | | | | | | | | | | | | | |
Total
Distributions | | | Net Asset
Value End
of Period | | Total
Return(2) | | | Net Assets
End of
Period
(millions) | | Ratio of
Expenses
to Average
Net Assets(3)(4) | | | Ratio of Net
Investment
Income
to Average
Net Assets(3)(4) | | | Portfolio
Turnover
Rate(2) | |
| | | | | | | | | | | | | | | | | | | | |
| | | | | | | | | | | | | | | | | | | | |
| | | | | | | | | | | | | | | | | | | | | |
| | | | | | | | | | | | | | | | | | | | | |
| $ | (0.13 | ) | | $ | 13.03 | | 18.64 | % | | $ | 50.4 | | 1.50 | % | | 0.70 | % | | 56.88 | % |
| | - | | | | 11.16 | | (35.97 | ) | | | 3.2 | | 1.50 | | | 0.93 | | | 42.24 | |
| | (5) | For the period from commencement of operations (June 2, 2008) through September 30, 2008. |
The accompanying notes are an integral part of the financial statements.
11
ARTISAN FUNDS, INC.
Notes to Financial Statements – September 30, 2009
Artisan Funds, Inc. (“Artisan Funds”) was incorporated on January 5, 1995, as a Wisconsin corporation and is registered under the Investment Company Act of 1940, as amended. Artisan Funds is a series comprised of eleven open-end, diversified mutual funds. Artisan Emerging Markets Fund (the “Fund”), commenced operations on June 26, 2006. The Fund’s investment objective is to seek long-term capital growth.
Emerging Markets Fund offers shares of capital stock of two classes – Institutional Shares and Advisor Shares – and began offering Advisor Shares on June 2, 2008. Advisor Shares are sold to employee benefit plans, clients of financial advisors, clients of sponsored programs and institutional or other investors. All investments and exchanges are subject to approval by the Fund. The financial statements of Institutional Shares are presented in a separate reports.
Each class of shares has equal rights with respect to portfolio assets and voting privileges. Each class has exclusive voting rights with respect to any matters involving only that class.
Income, expenses not specific to a particular class and realized and unrealized gains and losses were allocated daily to each class of shares based upon the relative net asset value of outstanding shares. Expenses attributable to a particular class of shares, such as transfer agency fees, shareholder communication expenses and registration fees, were allocated directly to that class.
The Fund is managed by Artisan Partners Limited Partnership (the “Adviser”). The Adviser is wholly owned by Artisan Partners Holdings LP (“Artisan Holdings”).
| (2) | Summary of significant accounting policies: |
The following is a summary of significant accounting policies of Artisan Funds in effect during the period covered by the financial statements, which were in accordance with United States generally accepted accounting principles.
| (a) | Security valuation – The net asset value (“NAV”) of the shares of each class of the Fund was determined as of the close of regular session trading on the New York Stock Exchange (“NYSE”) (usually 4:00 p.m., Eastern Time) each day the NYSE was open for regular session trading. The NAV of each class of shares was determined by dividing the value of the Fund’s securities and other assets attributed to that class, less its liabilities attributed to that class, by the number of outstanding shares of that class of the Fund. |
| | In determining NAV, each equity security traded on a securities exchange, including the Nasdaq Stock Market and over-the-counter securities, was valued at the closing price as of the time of valuation on the exchange or market designated by the Fund’s accounting agent or pricing vendor as the principal exchange (the “principal exchange”). The closing price provided by the pricing vendor for a principal exchange may differ and may represent information such as last sales price, an official closing price, a closing auction price or other information, depending on exchange or market convention. Absent closing price information from the principal exchange as of the time of valuation, the security was valued using the closing price on another exchange |
12
NOTES TO FINANCIAL STATEMENTS
| | on which the security traded (if such price is made available by the pricing vendor) or the most recent bid quotation on the principal exchange or, if not available, another exchange or in the over-the-counter market, except that securities listed on the London Stock Exchange were valued at the mean of the most recent bid and asked quotations as of the time of valuation. Short-term investments, other than repurchase agreements, maturing within sixty days from the valuation date were valued at amortized cost, which approximates market value. |
| | Securities for which prices were not readily available were valued by Artisan Funds’ valuation committee (the “valuation committee”) at a fair value determined in good faith under procedures established by and under the general supervision of Artisan Funds’ board of directors (the “board of directors”). A price was considered to be not readily available if, among other things, the valuation committee believed that the price determined as described in the preceding paragraph did not reflect a fair value of the security. |
| | Emerging Markets Fund generally invested a significant portion, and perhaps as much as substantially all, of its total assets in securities principally traded in markets outside the U.S. The foreign markets in which the Fund invested were sometimes open on days when the NYSE was not open and the Fund did not calculate its NAV, and sometimes were not open on days when the Fund did calculate its NAV. Even on days on which both the foreign market and the NYSE were open, several hours may have passed between the time when trading in the foreign market closed and the time as of which the Fund calculates its NAV. That was generally the case for markets in Europe, Asia, Australia and other far eastern markets; the regular closing time of foreign markets in North and South America was generally the same as the closing time of the NYSE and the time as of which the Fund calculated its NAV. |
| | The valuation committee concluded that a price determined under the Fund’s valuation procedures was not readily available if, among other things, the valuation committee believed that the value of the security might have been materially affected by events occurring after the close of the market in which the security was principally traded but before the time for determination of NAV (“subsequent event”). A subsequent event might include a company-specific development (for example, announcement of a merger that is made after the close of the foreign market), a development that might affect an entire market or region (for example, imposition of foreign exchange controls by a foreign government), a potentially global development (such as a terrorist attack that may be expected to have an impact on investor expectations worldwide) or a significant change in one or more U.S. securities indexes. Artisan Funds monitored for subsequent events using several tools. An indication by any of those tools of a potential material change in the value of securities resulted in either a meeting of the valuation committee, which considered whether a subsequent event had occurred and whether local market closing prices continued to represent fair values for potentially affected non-U.S. securities, and/or a valuation based on information provided by a third party research service. This third party research service was used to assist in determining estimates of fair values for foreign securities. That service utilized statistical data based on historical performance of securities, markets and other data in developing factors used to estimate a fair value. |
| | Estimates of fair values utilized by the Fund as described above may differ from the value realized on the subsequent sale of those securities and from quoted or published |
13
NOTES TO FINANCIAL STATEMENTS
| | prices for those securities. The differences may have been material to the NAV of the Fund or to the information presented. |
| | Foreign stocks as an asset class may underperform U.S. stocks, and foreign stocks may be more volatile than U.S. stocks. Risks relating to investments in foreign securities (including, but not limited to, depository receipts and participation certificates) include: currency exchange rate fluctuation; less available public information about the issuers of securities; less stringent regulatory standards; lack of uniform accounting, auditing and financial reporting standards; and country risks including less liquidity, high inflation rates, unfavorable economic practices and political instability. |
| | The risks of foreign investments typically are greater in emerging and less developed markets. For example, political and economic structures in these less developed countries may be new and changing rapidly, which may cause instability and greater risk of loss. Their securities markets may be less developed, and securities in those markets are generally more volatile and less liquid than those in the developed markets. Emerging market countries also are more likely to experience high levels of inflation, deflation or currency devaluations, which could hurt their economies and securities markets. Certain emerging markets also may face other significant internal or external risks, including a heightened risk of war, and ethnic, religious and racial conflicts. In addition, governments in many emerging market countries participate to a significant degree in their economies and securities markets, which may impair investment and economic growth of companies in those markets. High levels of national debt tend to make such markets also heavily reliant on foreign capital and, therefore, vulnerable to capital flight. |
| (b) | Fair Value Measurements – In April 2009, the Financial Accounting Standards Board (“FASB”) updated the accounting standards to provide guidance on (1) estimating the fair value of an asset or liability when the volume and level of activity for the asset or liability have significantly decreased, (2) identifying transactions that are not orderly, and (3) expands existing fair value measurement disclosure to include a breakout of the major security types. The Fund adopted this accounting guidance on June 30, 2009. |
| | The FASB updated the accounting standards to clarify the definition of fair value for financial reporting, establish a framework for measuring fair value and require additional disclosures about the use of fair value measurements. The Fund adopted this accounting guidance on October 1, 2008. In accordance with this standard, fair value is defined as the price that the Fund would receive upon selling an investment in an orderly transaction to an independent buyer in the principal or most advantageous market of the investment. The standard establishes a three-tier hierarchy to distinguish between (1) inputs that reflect the assumptions market participants would use in pricing an asset or liability developed based on the market data obtained from sources independent of the reporting entity (observable inputs) and (2) inputs that reflect the reporting entity’s own assumptions about the assumptions market participants would use in pricing an asset or liability developed based on the best information available in the circumstances (unobservable inputs) and to establish classification of fair value measurements for disclosure purposes. Various inputs are used in determining the value of the Fund’s investments. The three-tier hierarchy of inputs is summarized in three broad levels: |
| | • | | Level 1 – quoted prices in active markets for identical investments |
14
NOTES TO FINANCIAL STATEMENTS
| | • | | Level 2 – other significant observable inputs (including but not limited to quoted prices for similar securities, interest rates, prepayment speeds, credit risks, etc.) |
| | • | | Level 3 – significant unobservable inputs (including the Fund’s own assumptions in determining the fair value of investments) |
| | The inputs or methodology used for valuing securities are not necessarily an indication of the risk or liquidity associated with investing in those securities. |
| | The following table summarizes the Fund’s investments, based on the inputs used to determine their fair values as of September 30, 2009: |
| | | | | | | | | | | | |
| | | Level 1 - Quoted Prices | | Level 2 - Other Significant Observable Inputs | | Level 3 - Significant Unobservable Inputs | | Total |
Equity Securities(1) | | | | | | | | | | | | |
Emerging Asia | | $ | 62,965,379 | | $ | 1,722,078 | | $ | - | | $ | 64,687,457 |
Latin America | | | 40,127,108 | | | - | | | - | | | 40,127,108 |
Emerging Europe, Middle East & Africa | | | 34,185,520 | | | 3,020,331 | | | - | | | 37,205,851 |
Developed Markets | | | 6,572,393 | | | - | | | - | | | 6,572,393 |
Repurchase Agreements | | | - | | | 6,031,000 | | | - | | | 6,031,000 |
Total | | $ | 143,850,400 | | $ | 10,773,409 | | $ | - | | $ | 154,623,809 |
| | (1) | See Fund’s Schedule of Investments for country classifications. |
| (c) | Taxes – No provision was made for federal income taxes or excise taxes since the Fund intends to (i) comply with the provisions of Subchapter M of the Internal Revenue Code applicable to regulated investment companies and (ii) distribute to its shareholders substantially all of its taxable income as well as net realized gains from the sale of investment securities. The Fund may utilize earnings and profits distributed to shareholders on redemptions of Fund shares as part of the dividends paid deduction. |
| | The Fund has analyzed the tax positions taken on federal income tax returns for all open tax years and has concluded that as of September 30, 2009, no provision for income tax would be required in the Fund’s financial statements. The Fund’s federal and state income and federal excise tax returns for tax years for which the applicable statutes of limitations have not expired are subject to examination by the Internal Revenue Service and state department of revenue. |
The Fund may be subject to taxes on realized gains from the sale of investment securities imposed by certain countries in which the Fund invests. The foreign tax expense, if any, was recorded on an accrual basis and is included in “Payable for withholding taxes” on the accompanying Statement of Assets and Liabilities.
| (d) | Portfolio transactions – In determining the Fund’s NAV, security transactions and shareholder transactions were accounted for no later than one business day after trade date, in accordance with applicable law. However, for financial reporting purposes, security transactions and shareholder transactions were recorded on trade date in accordance with United States generally accepted accounting principles. Net realized gains and losses on securities were computed on specific security lot identification. |
15
NOTES TO FINANCIAL STATEMENTS
| (e) | Foreign currency translation – Values of foreign investments, open foreign currency forward contracts, payables for capital gains taxes and cash denominated in foreign currencies were translated into U.S. dollars using a spot market rate of exchange as of the time of determination of the Fund’s NAV on the day of valuation. Payables and receivables for securities transactions, dividend and reclaim receivables and other receivables and payables denominated in a foreign currency were translated into U.S. dollars using a spot market rate of exchange as of 12:00 p.m. (Eastern Time) on the day of valuation. Purchases and sales of investments and dividend and interest income were translated into U.S. dollars using a spot market rate of exchange as of 12:00 p.m. (Eastern Time) on the date of such transactions. The portion of security gains or losses resulting from changes in foreign exchange rates was included with net realized and unrealized gain or loss from investments, as appropriate, for both financial reporting and tax purposes. |
The Fund may enter into foreign currency forward contracts to hedge the foreign currency exposure on open payables and receivables. These foreign currency forward contracts, or spot contracts, generally settle within two business days. The Fund also may enter into foreign currency forward contracts to hedge against foreign currency exchange rate risks on its non-U.S. dollar denominated investment securities. Foreign currency forward contracts, if any, were recorded at market value and any related realized and unrealized gains and losses were reported as foreign currency related transactions for financial reporting purposes. For tax purposes, these foreign exchange gains and losses were treated as ordinary income or loss. The Fund could be exposed to loss if the counterparties fail to perform under these contracts.
Other foreign currency related transaction gains and losses may result from currency gains and losses realized from the difference between the amounts of dividends and foreign withholding taxes recorded on the Fund’s books and the U.S. dollar equivalent of the amounts actually received or paid. The net increase (decrease) in unrealized appreciation or depreciation on foreign currency related transactions arose from changes in the values of assets and liabilities, other than investments in securities, resulting from changes in foreign exchange rates.
| (f) | Repurchase agreements – The Fund may enter into repurchase agreements with institutions that the Adviser determined were creditworthy pursuant to criteria adopted by the board of directors. Repurchase agreements were recorded at cost plus accrued interest and were collateralized in an amount greater than or equal to the repurchase price plus accrued interest. Collateral (in the form of U.S. government securities) was held by the Fund’s custodian and in the event of default on the obligation of the counterparty to repurchase, the Fund had the right to liquidate the collateral and apply the proceeds in satisfaction of the obligation. If the proceeds from any sale of such collateral were less than the repurchase price, the Fund would have suffered a loss. |
| (g) | Depository receipts – The Fund may invest in depository receipts. Depository receipts are typically issued by a financial institution (a “depository”), evidencing ownership interests in a security issued by an issuer and deposited with the depository. |
| (h) | Securities lending – The Fund may (but does not currently intend to) enter into securities lending transactions secured by collateral in the form of U.S. Government securities at least equal to, at all times, the fair value of the securities loaned. Any such |
16
NOTES TO FINANCIAL STATEMENTS
| | collateral will be held in a custody account maintained by State Street Bank and Trust Company, the Fund’s custodian. When securities are on loan, the Fund does not receive dividends on the securities loaned, but receives compensation from the borrower in lieu of such dividends. Gain or loss in the fair value of the securities loaned that may occur during the term of the loan will be for the account of the applicable Fund. In entering into securities lending arrangements, the Fund takes the risk that the borrower may not provide additional collateral when required or return the securities when due or, if the borrower defaults, the Fund may experience delays in selling collateral or the collateral may not be sufficient to cover the value of securities lent. There were no securities on loan during the year ended September 30, 2009. |
| (i) | Equity-linked participation certificates – The Fund may invest in equity-linked participation certificates. Equity-linked participation certificates are derivative securities which are designed to provide synthetic exposure to one or more underlying securities. An investment in an equity-linked participation certificate typically entitles the holder to a return equal to the market return of the underlying security or securities, subject to the credit risk of the issuing financial institution. The Fund did not invest in participation certificates during the year ended September 30, 2009. |
| (j) | Transfer agent fees – The Fund paid fees to, and reimbursed expenses of, the Fund’s transfer agent. In addition, the Fund has authorized certain financial services companies, broker-dealers, banks or other authorized agents, and in some cases, other organizations designated by an authorized agent (with their designees, collectively “authorized agents”) to accept purchase, exchange and redemption orders for Advisor Shares on the Fund’s behalf. Many authorized agents charged a fee for accounting and shareholder services that the agent provided to Fund shareholders on the Fund’s behalf. Those services typically included recordkeeping, transaction processing for shareholders’ accounts and other services. The fee was either based on the number of accounts to which the authorized agent provided such services, or a percentage (as of September 30, 2009, up to 0.40% annually) of the average value of Fund shares held in such accounts. The Fund paid a portion of such fees, which are intended to compensate the authorized agent for its provision of services of the type that would be provided by the Fund’s transfer agent or other service providers if the shares were registered on the books of the Fund’s transfer agent. The balance of the fees incurred was paid by the Adviser. The Fund’s expenses incurred for services provided by authorized agents were included in “Transfer agent fees” in the Statement of Operations. The table below shows the fees and expenses to the Fund’s transfer agent and the fees to authorized agents incurred by each class of the Fund during the year ended September 30, 2009: |
| | | | | | | | | |
| | | Year Ended 9/30/09 |
| | | Fees and Expenses
to Transfer Agent | | Fees to
Authorized
Agents | | Total |
Institutional Shares | | $ | 19,255 | | $ | - | | $ | 19,255 |
Advisor Shares | | | 59,103 | | | 34,584 | | | 93,687 |
| (k) | Commission recapture – The Fund had the ability to direct portfolio trades to various brokers that have agreed to rebate a portion of the commissions generated. The Fund received no commission recapture rebates for the year ended September 30, 2009. |
17
NOTES TO FINANCIAL STATEMENTS
| (l) | Use of estimates – The preparation of financial statements in conformity with United States generally accepted accounting principles requires management to make estimates and assumptions that affect the reported amounts and disclosures in the financial statements. Actual results could differ from those estimates. |
| (m) | Indemnifications – In the normal course of business, the Fund has entered into contracts in which the Fund agrees to indemnify the other party or parties against various potential costs or liabilities. The Fund’s maximum exposure under these arrangements is unknown. No claim had been made for indemnification pursuant to any such agreement of the Fund. |
| (n) | Other – Dividend income less foreign taxes withheld, if any, was generally recorded on the ex-dividend date. In some cases, the information was not available to the Fund on the ex-dividend date. In such cases, which may have included private placements and foreign securities, dividends were recorded as soon after the ex-dividend date as reliable information became available to the Fund. Non-cash dividends included in dividend income, if any, were generally recorded at the fair market value of securities received. Interest income was reported on the accrual basis. Distributions to shareholders were recorded on the ex-dividend date. Expenses attributable to Artisan Funds were generally allocated to each Artisan Fund based on net assets. However, other expense allocation methodologies were used, depending on the nature of the expense item. Expenses attributable to a particular Fund or class were allocated directly to that Fund or class. |
| | The character of income and net realized gains and losses may differ in some instances for financial statement and tax purposes and may result in reclassification of permanent differences among certain capital accounts to more appropriately conform financial accounting to tax characterizations of dividend and capital gain distributions. |
| | Emerging Markets Fund generally imposed a 2% redemption fee on shares held 90 days or less. Those redemption fees were recorded as a reduction in the cost of shares redeemed and had the primary effect of increasing paid-in capital. The Fund reserved the right to waive or reduce the 2% redemption fee on shares held 90 days or less at its discretion when the Fund believed such waiver was in the best interests of the Fund, including but not limited to when it determined that imposition of the redemption fee was not necessary to protect the Fund from the effects of short-term trading. The Fund waived the fee on redemption of shares held by certain authorized agents or other Fund intermediaries and otherwise in accordance with the Fund’s prospectus. |
| (3) | Transactions with affiliates: |
The Adviser, with which the officers and a director of Artisan Funds were affiliated, provided investment advisory and administrative services to the Fund. In exchange for those services, Emerging Markets Fund paid a monthly management fee to the Adviser at the annual rate of 1.05% of the Fund’s average daily net assets.
The Adviser has voluntarily undertaken to reimburse Emerging Markets Fund for any ordinary operating expenses in excess of 1.50% of average daily net assets, annually. For the year ended September 30, 2009, the Adviser paid operating expenses on behalf of Emerging Markets Fund. Emerging Markets Fund reimburses the Adviser annually for operating expenses paid on its behalf up to 1.50% of average daily net assets, annually. The amount of
18
NOTES TO FINANCIAL STATEMENTS
operating expenses owed to the Adviser is included in payable for operating expenses on the Statements of Assets and Liabilities for Emerging Markets Fund.
The officers and director of Artisan Funds who are affiliated with the Adviser receive no compensation from Artisan Funds.
Each director who was not an affiliated person of the Adviser received an annual retainer, payable quarterly, as well as reimbursement of expenses related to his duties as a director of Artisan Funds. The amount of the annual retainer increases by $10,000 with each new series of Artisan Funds and, during the year ended September 30, 2009, was at the annual rate of $170,000. In addition, the non-interested chair of the board of directors received an annual retainer of $60,000, payable quarterly, and each chair of a board committee who was a non-interested director received an annual retainer of $30,000, payable quarterly. These fees were generally allocated to each of the Artisan Funds based on net assets, subject to a minimum allocation of $1,500 to each Fund per quarter.
Artisan Funds has adopted a deferred compensation plan for directors who are not affiliated persons of the Adviser that enables directors to elect to defer receipt of all or a portion of the annual compensation they are entitled to receive from Artisan Funds. For purposes of determining the amount owed to the directors under the plan, deferred amounts were invested in shares of Artisan Funds as selected by the individual directors. The Fund purchased shares of Artisan Funds selected for deferral by the director in amounts equal to his investment, resulting in a Fund asset equal to the deferred compensation liability. Such assets were included as a component of “Other assets” on the Statement of Assets and Liabilities. Deferral of directors’ fees under the plan did not affect the net assets of the Fund, and did not materially affect the Fund’s assets, liabilities or net investment income per share. Amounts will be deferred until distributed in accordance with the plan.
Shares of Artisan Funds were offered for sale by Artisan Distributors LLC (“Distributors”). Distributors is wholly owned by Artisan Holdings. All distribution expenses relating to the Fund were paid by the Adviser.
| (4) | Line of credit arrangement: |
Artisan Funds is party to a line of credit agreement with State Street Bank and Trust Company (“SSB”), which expires August 2010, under which the Fund may borrow up to the lesser of (a) $75 million or (b) the lesser of (i) 33 1/3% of its adjusted net assets, with adjusted net assets being total assets less liabilities and the value of any assets pledged to anyone other than SSB, (after giving effect to the loan) or (ii) the maximum amount the Fund may borrow under the Investment Company Act of 1940, the limitations included in the Fund’s prospectus, or any limit or restriction under any law or regulation to which the Fund was subject or any agreement to which the Fund or Artisan Funds is a party; provided that the aggregate borrowings by all Artisan Funds may not exceed $100 million. For the period October 1, 2008 to August 17, 2009, Artisan Funds paid a commitment fee at the annual rate of 0.10% on the unused portion of the line of credit and interest was charged on any borrowings at the current Federal Funds rate plus 0.50%. Effective August 18, 2009, Artisan Funds paid a commitment fee at the annual rate of 0.15% on the unused portion of the line of credit and interest was charged on any borrowings at the current Federal Funds rate plus 1.25%. SSB has agreed to waive 0.05% of the commitment fee by reducing the Funds’ custody expenses until August 2010. The use of the line of credit was generally restricted to
19
NOTES TO FINANCIAL STATEMENTS
temporary borrowing for extraordinary or emergency purposes. During the year ended September 30, 2009, the Fund paid interest of $876 on maximum borrowings of $7,792,684.
| (5) | Investment transactions: |
The cost of securities purchased and the proceeds from the sale of securities (excluding short-term securities) for the year ended September 30, 2009 were $95,981,062 and $44,483,849, respectively.
| (6) | Information for Federal income tax purposes: |
For Federal income tax purposes, the cost of investments, gross unrealized appreciation, gross unrealized depreciation and net unrealized appreciation on investments as of September 30, 2009 were as follows:
| | | | | | | | | | |
Cost of
Investments | | Gross Unrealized
Appreciation | | Gross
Unrealized
Depreciation | | | Net
Unrealized
Appreciation
on Investments |
| $143,279,224 | | $ | 17,811,408 | | $ | (6,466,823 | ) | | $ | 11,344,585 |
The difference between cost of investments for financial reporting and cost of investments for Federal income tax purposes was due primarily to timing differences in recognizing certain gains and losses on security transactions (e.g., wash sale loss deferrals and passive foreign investment company transactions).
The tax characterization of ordinary income dividends and long-term capital gain distributions paid during the year ended September 30, 2009 and the year ended September 30, 2008 were as follows:
| | | | | | |
| Year Ended 9/30/09 | | Year Ended 9/30/08 |
Ordinary
Income
Dividends | | Long-Term
Capital Gain
Distributions | | Ordinary
Income
Dividends | | Long-Term
Capital Gain
Distributions |
| $862,446 | | $ - | | $1,241,033 | | $283,412 |
| | | |
Ordinary income dividends and long-term capital gain distributions were determined in accordance with income tax regulations that may differ from U.S. generally accepted accounting principles. These differences were due to differing treatments for items such as net short-term gains, wash sale loss deferrals, passive foreign investment company transactions, foreign currency transactions, net investment losses and post-October losses.
Additional tax information as of and for the year ended September 30, 2009 follows:
| | | | |
Undistributed Ordinary Income | | Undistributed
Long-Term Gain | | Post-October
Losses |
| $1,495,995 | | $ - | | $13,611,288 |
As of September 30, 2009, the Fund had a capital loss carryover of $4,542,143 with an expiration of 2017.
20
NOTES TO FINANCIAL STATEMENTS
| (7) | Fund share activities: |
Capital share transactions for the Fund were as follows:
| | | | | | | | |
Year ended September 30, 2009 | | Institutional
Shares | | | Advisor
Shares | |
Proceeds from shares issued | | $ | 36,046,627 | | | $ | 42,105,884 | |
Net asset value of shares issued in reinvestment of dividends and distributions | | | 801,388 | | | | 55,689 | |
Cost of shares redeemed(1) | | | (20,916,631 | ) | | | (2,746,698 | ) |
| | | | | | | | |
Net increase from fund share transactions | | $ | 15,931,384 | | | $ | 39,414,875 | |
| | | | | | | | |
| | |
Shares sold | | | 3,727,344 | | | | 3,845,456 | |
Shares issued in reinvestment of dividends and distributions | | | 104,212 | | | | 7,232 | |
Shares redeemed | | | (2,106,464 | ) | | | (268,708 | ) |
| | | | | | | | |
Net increase in capital shares | | | 1,725,092 | | | | 3,583,980 | |
| | | | | | | | |
| | |
Year ended September 30, 2008 | | Institutional
Shares | | | Advisor
Shares(2) | |
Proceeds from shares issued | | $ | 86,328,968 | | | $ | 3,862,647 | |
Net asset value of shares issued in reinvestment of dividends and distributions | | | 1,510,191 | | | | - | |
Cost of shares redeemed(1) | | | (1,424,727 | ) | | | (2,084 | ) |
| | | | | | | | |
Net increase (decrease) from fund share transactions | | $ | 86,414,432 | | | $ | 3,860,563 | |
| | | | | | | | |
| | |
Shares sold | | | 5,178,178 | | | | 287,867 | |
Shares issued in reinvestment of dividends and distributions | | | 93,337 | | | | - | |
Shares redeemed | | | (113,088 | ) | | | (177 | ) |
| | | | | | | | |
Net increase (decrease) in capital shares | | | 5,158,427 | | | | 287,690 | |
| | | | | | | | |
| (1) | Net of redemption fees of: |
| | | | | | |
| | | 9/30/2009 | | 9/30/2008 |
Institutional Shares | | $ | 618 | | $ | 420 |
Advisor Shares | | | 36 | | | 8 |
| (2) | For the period from commencement of operations (June 2, 2008) through September 30, 2008. |
| (8) | Recent Accounting Pronouncements: |
In March 2008, the FASB updated the accounting standards for disclosures about derivative instruments and hedging activities. The standard requires enhanced disclosure relating to an entity’s use of derivatives, how derivatives are accounted for, and how derivative instruments affect an entity’s results of operations and financial position. This standard was issued and is effective for fiscal years and interim reporting periods beginning after November 15, 2008. The Fund adopted this standard on April 1, 2009. The Fund has evaluated the implications of this standard and has determined there is no impact to the Fund’s September 30, 2009 financial statement disclosures.
21
NOTES TO FINANCIAL STATEMENTS
In May 2009, the FASB updated the accounting standards on the recognition and disclosure of subsequent events. The standard requires the disclosure of the date through which subsequent events were evaluated. This standard was issued and is effective for interim or annual reporting periods ending after June 15, 2009, and applied prospectively. The Fund evaluated subsequent events through the issuance of the Fund’s financial statements on November 19, 2009 and has determined there is no impact to the Fund’s financial statements.
22
Report of Independent Registered Public Accounting Firm
To the Board of Directors and Shareholders of Artisan Funds, Inc.
We have audited the accompanying statements of assets and liabilities, including the schedules of investments, of Artisan Emerging Markets Fund (one of eleven portfolios constituting Artisan Funds, Inc.) (the “Fund”) as of September 30, 2009, and the related statements of operations for the year then ended, the statements of changes in net assets for each of the two years in the period then ended, and the financial highlights for the periods indicated therein. These financial statements and financial highlights are the responsibility of the Fund’s management. Our responsibility is to express an opinion on these financial statements and financial highlights based on our audits.
We conducted our audits in accordance with the standards of the Public Company Accounting Oversight Board (United States). Those standards require that we plan and perform the audit to obtain reasonable assurance about whether the financial statements and financial highlights are free of material misstatement. We were not engaged to perform an audit of the Fund’s internal control over financial reporting. Our audits included consideration of internal control over financial reporting as a basis for designing audit procedures that are appropriate in the circumstances, but not for the purpose of expressing an opinion on the effectiveness of the Fund’s internal control over financial reporting. Accordingly, we express no such opinion. An audit also includes examining, on a test basis, evidence supporting the amounts and disclosures in the financial statements and financial highlights, assessing the accounting principles used and significant estimates made by management, and evaluating the overall financial statement presentation. Our procedures included confirmation of securities owned as of September 30, 2009, by correspondence with the custodian and brokers or by other appropriate auditing procedures where replies from brokers were not received. We believe that our audits provide a reasonable basis for our opinion.
In our opinion, the financial statements and financial highlights referred to above present fairly, in all material respects, the financial position of Artisan Emerging Markets Fund of Artisan Funds, Inc. at September 30, 2009, the results of its operations for the year then ended, the changes in its net assets for each of the two years in the period then ended, and the financial highlights for the periods indicated therein, in conformity with U.S. generally accepted accounting principles.

Chicago, Illinois
November 19, 2009
23
NOTES TO FINANCIAL STATEMENTS
Other Federal tax information (unaudited):
The Internal Revenue Code requires that shareholders be notified within 60 days of the Fund’s fiscal year-end of certain information regarding long-term capital gains, qualified dividend income and the dividends received deduction for corporate shareholders. This data is informational only. Every year in January, shareholders are sent a Form 1099-DIV which provides the federal tax status of dividends and distributions received during the calendar year. Shareholders are advised to consult their own tax advisor with respect to the specific tax consequences of investment in the Fund.
The Fund hereby designates the following amounts as (i) long-term capital gain distributions for purposes of the dividends paid deduction (including earnings and profits distributed to shareholders on redemption of Fund shares), (ii) the amount of ordinary dividends paid during the fiscal year ended September 30, 2009 that are considered qualified dividend income as defined in the Jobs and Growth Tax Relief Reconciliation Act of 2003, and (iii) the amount of ordinary dividends paid during the fiscal year ended September 30, 2009 that are eligible for the dividends received deduction available to certain corporate shareholders.
| | | | | | |
| Long-Term Capital Gains | | Qualified Dividend Income | | | Dividends Received Deduction | |
| $ - | | 99.97 | % | | - | % |
24
SHAREHOLDER EXPENSE EXAMPLE (UNAUDITED)
As a shareholder of Artisan Funds, you may incur transaction costs, including redemption fees, and you will incur ongoing costs, including management fees and other Fund expenses. This example is intended to help you understand your ongoing costs (in dollars) of investing in a Fund and to compare these costs with the ongoing costs of investing in other mutual funds.
The example is based on an investment of $1,000 invested at the beginning of the period and held for the entire period from April 1, 2009 to September 30, 2009.
Actual Expenses
The first line below the Fund’s name in the table below provides information about actual account values and actual expenses. You may use the information in this line, together with the amount you invested, to estimate the expenses that you paid over the period. Simply divide your account value by $1,000 (for example, an $8,600 account value divided by $1,000 = 8.6), then multiply the result by the number in the first line under the name of the Fund under the heading entitled “Expenses Paid During Period” to estimate the expenses you paid on your account during this period.
Hypothetical Example for Comparison Purposes
The second line below the Fund’s name in the table below provides information about hypothetical account values and hypothetical expenses based on the Fund’s actual expense ratio for the six months ended September 30, 2009 and an assumed rate of return of 5% per year before expenses, which is not the Fund’s actual return. The hypothetical account values and expenses may not be used to estimate the actual ending account balances or expenses you paid for the period. You may use this information to compare the ongoing costs of investing in the Fund and other funds. To do so, compare the 5% hypothetical example with the 5% hypothetical examples that appear in the shareholder reports of the other funds.
Please note that the expenses shown in the table are meant to highlight your ongoing costs only and do not reflect any transactional costs, such as redemption fees. Therefore, the second line of the table is useful in comparing ongoing costs only, and will not help you determine the relative costs of owning different funds. If these transactional costs were included, your costs would have been higher.
| | | | | | | | | |
| | | Beginning
Account Value
4/1/2009 | | Ending
Account Value
9/30/2009 | | Expenses Paid During
Period
4/1/2009-9/30/2009(1) |
Artisan Emerging Markets Fund - Advisor Shares | | | | | | | | | |
Actual | | $ | 1,000.00 | | $ | 1,714.50 | | $ | 10.21 |
Hypothetical (5% return before expenses) | | $ | 1,000.00 | | $ | 1,017.55 | | $ | 7.59 |
| (1) | Expenses are equal to the Fund’s ratio of expenses to average net assets for the six-month period ended September 30, 2009 (shown below), multiplied by the average account value over the period, multiplied by 183/365 (to reflect the one-half year period). |
| | | |
| Fund | | Annualized Ratio of Expenses to Average
Net Assets for the Six-Month
Period Ended September 30, 2009 | |
Artisan Emerging Markets Fund - Advisor Shares(a) | | 1.50 | % |
| (a) | The annualized ratio of expenses to average net assets excludes expenses paid by the Adviser. |
25
NOTES ON MANAGEMENT’S DISCUSSION OF FUND PERFORMANCE AND PORTFOLIO HOLDINGS’ CLASSIFICATION
The discussions of the Fund included in this report include statistical information about the portfolio of the Fund. Except as otherwise noted, that information is as of September 30, 2009. That information will vary with changes in the Fund’s portfolio investments. The performance information for the Fund relative to its benchmark index discussed in this report was prepared by the Adviser using information reported by FactSet Databases (“FactSet”). For the purposes of assigning portfolio securities to a particular country, the Adviser considers an issuer to be from a particular country as designated by its securities information vendors. The Adviser currently uses MSCI Inc. as its primary source and FactSet as a secondary source for this information. In the event (i) the Adviser’s securities information vendors do not assign a security to a particular country or if the published classification appears to be erroneous, or (ii) its primary vendor does not assign a security to a particular country and the secondary vendor has assigned a security to a particular country by using a methodology that is not the same as the methodology the primary vendor uses to assign a country, the Adviser assigns the security to a country using the primary vendor’s published criteria (to the extent available) or the Adviser’s own judgment. The primary information vendor’s criteria include the identity of the jurisdiction of the issuer’s incorporation, the main equity trading market for the issuer’s securities, the geographical distribution of the issuer’s operations and the location of the issuer’s headquarters. Country designations may change over time.
For the purposes of assigning portfolio securities to a particular sector and industry, the Adviser assigns securities in accordance with the sector and industry classifications of the Global Industry Classification Standard (GICS®) developed by MSCI Inc. and Standard & Poor’s (to the extent available) as a primary source and FactSet (to the extent available) as a secondary source for this information. In the event the Adviser’s securities information vendors do not classify a security to a particular sector or industry or if the published classification appears to be erroneous, the Adviser classifies the security according to its own judgment, using other securities information vendors, the company description and other publicly available information about the company’s peer group. Sector and industry classifications may change over time.
The names of portfolio securities reflected in this report are as reported by the Fund’s data providers, may not represent the legal name of the entity and, in some cases, are translations of non-English names.
Descriptions of Indices
The Fund’s performance is compared in this report to changes in a broad-based index of changes in prices of securities in the markets in which the Fund invests. This index is unmanaged and its returns include reinvested dividends. Unlike the Fund’s returns, the returns of the index do not include the payment of sales commissions or other expenses that would be incurred in the purchase or sale of the securities included in the index. An investment cannot be made directly in an index. Fair value pricing is not employed by market indices.
The index to which the Fund is compared is the Morgan Stanley Capital International Emerging Markets IndexSM, a market-weighted index of companies in emerging markets.
Trademarks
Trademarks and copyrights relating to the indices and products of portfolio companies mentioned in this report are owned by their respective owners. Except as otherwise indicated, the trademarks, including names, logos, slogans and service marks appearing in
26
NOTES ON MANAGEMENT’S DISCUSSION OF FUND PERFORMANCE AND PORTFOLIO HOLDINGS’ CLASSIFICATION
this report are the property of the Adviser and may not be copied, reproduced, published or in any way used without written permission.
The Global Industry Classification Standard (“GICS”) was developed by and is the exclusive property and a service mark of MSCI Inc. (“MSCI”) and Standard & Poor’s, a division of The McGraw-Hill Companies, Inc. (“S&P”) and is licensed for use by Artisan Partners Limited Partnership. Neither MSCI, S&P nor any third party involved in making or compiling the GICS or any GICS classifications makes any express or implied warranties or representations with respect to such standard or classification (or the results to be obtained by the use thereof), and all such parties hereby expressly disclaim all warranties of originality, accuracy, completeness, merchantability and fitness for a particular purpose with respect to any of such standard or classification. Without limiting any of the foregoing, in no event shall MSCI, S&P, any of their affiliates or any third party involved in making or compiling the GICS or any GICS classifications have any liability for any direct, indirect, special, punitive, consequential or any other damages (including lost profits) even if notified of the possibility of such damages.
The MSCI information may only be used by the reader, may not be reproduced or redisseminated in any form and may not be used to create any financial instruments or products or any indices. The MSCI information is provided on an “as is” basis and the reader of this information assumes the entire risk of any use made of this information. MSCI, each of its affiliates and each other person involved in or related to compiling, computing or creating any MSCI information (collectively, the “MSCI Parties”) expressly disclaims all warranties (including, without limitation, any warranties of originality, accuracy, completeness, timeliness, non-infringement, merchantability and fitness for a particular purpose) with respect to this information. Without limiting any of the foregoing, in no event shall MSCI Parties have any liability for any direct, indirect, special, incidental, punitive, consequential (including, without limitation, lost profits) or any other damages.
PROXY VOTING POLICIES AND PROCEDURES
You may obtain a description of Artisan Funds’ proxy voting policies and procedures, without charge, upon request by calling 866.574.1770. That information also is included in the Fund’s statement of additional information, which is available without charge, upon request, by calling 866.574.1770 and on the Securities and Exchange Commission’s website at www.sec.gov.
Information relating to how the Fund voted proxies relating to portfolio securities held during the twelve-month period ended June 30 is available without charge, on the Fund’s website at www.artisanfunds.com and on the Securities and Exchange Commission’s website at www.sec.gov.
INFORMATION ABOUT PORTFOLIO SECURITIES
Artisan Funds files a complete schedule of portfolio holdings with the Securities and Exchange Commission for the quarters ending December 31 and June 30 (the first and third quarters of the Fund’s fiscal year) on Form N-Q. The Fund’s Forms N-Q are available on the Securities and Exchange Commission’s website at www.sec.gov. You also may review and copy those documents by visiting the Securities and Exchange Commission’s Public Reference Room in Washington, D.C. Information on the operation of the Public Reference Room may be obtained by calling the Securities and Exchange Commission at 800.SEC.0330.
27
DIRECTORS AND OFFICERS
The board of directors has overall responsibility for the conduct of the affairs of Artisan Funds. Each director serves an indefinite term of unlimited duration until the next annual meeting of shareholders and until the election and qualification of his or her successor. The board of directors may fill any vacancy on the board provided that after such appointment at least two-thirds of the directors have been elected by the shareholders. The shareholders may remove a director by a vote of a majority of the outstanding shares of the Funds at any meeting of shareholders called for the purpose of removing such director.
The board of directors elects the officers of Artisan Funds. Each officer serves until the election and qualification of his or her successor, or until he or she sooner dies, resigns, or is removed or disqualified. The board of directors may remove any officer with or without cause at any time.
The names and ages of the directors and officers as of November 13, 2009, the position each holds with Artisan Funds, the date each was first elected to office, their principal business occupations and other directorships they have held during the last five years are shown below. Each director oversees all eleven series of Artisan Funds.
| | | | | | | | |
Name and Age
at 11/13/09 | | Position(s)
Held with
Artisan Funds | | Date First Elected
or Appointed
to Office | | Principal Occupation(s)
during Past 5 Years | | Other Public Company
or Registered Investment
Company Directorships Held |
| Directors who are not “interested persons” of Artisan Funds: |
| David A. Erne – 66 | | Director and Independent Chair of the Board of Directors | | Director since 3/27/95; Independent Chair since 2/4/05 | | Of counsel to the law firm Reinhart Boerner Van Deuren s.c., Milwaukee, WI. | | Trustee, Northwestern Mutual Life Insurance Company (individual life insurance, disability insurance and annuity company). |
| Thomas R. Hefty – 62 | | Director | | 3/27/95 | | Retired; from January 2007 to February 2008, President, Kern Family Foundation (private, grant-making organization); until December 2006, of counsel to the law firm Reinhart Boerner Van Deuren s.c., Milwaukee, WI; until December 2006, Adjunct Faculty, Department of Business and Economics, Ripon College. | | None. |
| Jeffrey A. Joerres – 49 | | Director | | 8/9/01 | | Chairman of the Board, President and Chief Executive Officer of Manpower Inc. (non-governmental employment service organization). | | Director, Johnson Controls, Inc. (manufacturer of automotive systems and building controls). |
| Patrick S. Pittard – 63 | | Director | | 8/9/01 | | Distinguished Executive in Residence (teaching position), University of Georgia. | | Director, Cbeyond, Inc. (telecommunications company, formerly Cbeyond Communications, Inc.); Director, Lincoln National Corporation (insurance and investment management company). |
| Howard B. Witt – 69 | | Director | | 3/27/95 | | Retired; until December 2004, Chairman of the Board, President and Chief Executive Officer of Littelfuse, Inc. (manufacturer of advanced circuit protection devices). | | Director, Franklin Electric Co., Inc. (manufacturer of electric motors). |
28
DIRECTORS AND OFFICERS
| | | | | | | | |
Name and Age
at 11/13/09 | | Position(s)
Held with
Artisan Funds | | Date First Elected
or Appointed
to Office | | Principal Occupation(s)
during Past 5 Years | | Other Public Company
or Registered Investment
Company Directorships Held |
| Director who is an “interested person” of Artisan Funds: |
| Andrew A. Ziegler – 52* | | Director, President and Chief Executive Officer | | Director since 1/5/95; President since 12/19/03 (Chief Executive Officer continuously since 1/5/95) | | Managing Director of Artisan Partners. | | None. |
| Officers: |
| Lawrence A. Totsky – 50 | | Chief Financial Officer and Treasurer | | 1/22/98 | | Managing Director and Chief Financial Officer of Artisan Partners; Vice President, Chief Financial Officer and Treasurer of Artisan Distributors LLC. | | None. |
| Janet D. Olsen – 53 | | General Counsel and Secretary | | 1/18/01 | | Managing Director and General Counsel of Artisan Partners; Vice President and Secretary of Artisan Distributors LLC. | | None. |
| Brooke J. Billick – 55 | | Chief Compliance Officer | | 8/19/04 | | Chief Compliance Officer and Associate Counsel of Artisan Partners; Chief Compliance Officer of Artisan Distributors LLC. | | None. |
| Carlene M. Ziegler – 53 | | Vice President | | 3/27/95 | | Managing Director of Artisan Partners; until April 2008, Portfolio Co-Manager of Artisan small-cap growth strategy, including Artisan Small Cap Fund; until February 2005, Director of Artisan Funds. | | None. |
| Michael C. Roos – 51 | | Vice President | | 12/19/03 | | Managing Director of Artisan Partners; Vice President of Artisan Distributors LLC. | | None. |
| Gregory K. Ramirez – 39 | | Assistant Secretary and Assistant Treasurer | | 1/22/98 | | Managing Director of Artisan Partners; Assistant Treasurer of Artisan Distributors LLC. | | None. |
| Sarah A. Johnson – 37 | | Assistant Secretary | | 2/5/03 | | Associate Counsel of Artisan Partners. | | None. |
| * | Mr. Ziegler is an “interested person” of Artisan Funds, as defined in the Investment Company Act of 1940, because he is a Managing Director of Artisan Partners and an officer of Artisan Investments GP LLC (the general partner of Artisan Partners). Mr. Ziegler and Carlene M. Ziegler (who are married to each other) control Artisan Partners. |
The business address of the officers and directors affiliated with Artisan Partners is 875 E. Wisconsin Avenue, Suite 800, Milwaukee, Wisconsin 53202. The addresses of the other directors are: Mr. Erne – 1000 North Water Street, Suite 2100, Milwaukee, Wisconsin 53202; Mr. Joerres – 100 Manpower Place, Milwaukee, Wisconsin 53212; and Mr. Hefty, Mr. Pittard and Mr. Witt – c/o Artisan Funds, 875 E. Wisconsin Avenue, Suite 800, Milwaukee, Wisconsin 53202.
The Fund’s statement of additional information (SAI) contains further information about the directors. Please call 866.574.1770 for a free copy of the SAI.
29
| | | | |

| | ARTISAN FUNDS P.O. BOX 8412 BOSTON, MA 02266-8412 866.574.1770 | | |
(a) Registrant has adopted a code of ethics (the “Code”) that applies to its principal executive officer, principal financial officer and principal accounting officer (the “Covered Officers”).
(b) No disclosures are required pursuant to this Item 2(b).
(c) During the period covered by the report, registrant did not make any substantive amendments to the Code.
(d) During the period covered by the report, registrant did not grant any waivers, including implicit waivers, from the provisions of the Code.
(e) Not applicable.
(f) A copy of the Code is filed as Exhibit (a)(1) to this Form N-CSR.
| Item 3. | Audit Committee Financial Expert. |
Registrant’s board of directors has determined that Thomas R. Hefty, member and chairman of the registrant’s audit committee, qualifies as an audit committee financial expert, as such term is defined in Instruction 2(b) to Item 3 of Form N-CSR. Mr. Hefty is “independent” as such term is defined in paragraph (a)(2) of Item 3 of Form N-CSR.
Under applicable securities laws, a person who is determined to be an audit committee financial expert will not be deemed an “expert” for any purpose, including, without limitation, for the purposes of Section 11 of the Securities Act of 1933, as a result of being designated or identified as an audit committee financial expert. The designation or identification of a person as an audit committee financial expert does not impose on such person any duties, obligations, or liabilities that are greater than the duties, obligations, and liabilities imposed on such person as a member of the audit committee and board of directors in the absence of such designation or identification.
| Item 4. | Principal Accountant Fees and Services. |
Aggregate fees billed to the registrant for professional services rendered by the registrant’s principal accountant, Ernst & Young LLP, are summarized in the tables below. The tables summarize fees billed (or to be billed) by the registrant’s principal accountant for work performed relating to each applicable period identified below.
Fees:
| | | | |
| | | Fiscal Year Ended
September 30, 2009 | | Fiscal Year Ended
September 30, 2008 |
Audit Fees (a) | | $ 230,500 | | $ 236,000 |
Audit-Related Fees (b) | | $ 44,700 | | $ 40,300 |
Tax Fees (c) | | $ 186,050 | | $ 182,550 |
All Other Fees (d) | | — | | — |
(a) “Audit Fees” include amounts for professional services rendered by the principal accountant for the audit of the registrant’s annual financial statements and services that are normally provided by the accountant in connection with statutory and regulatory filings or engagements, including for 2009, portions of which have not been billed at the time of this filing and fees billed for consents issued in conjunction with the registrant’s post-effective amendments to the Funds’ registration statements filed for each of the last two fiscal years.
(b) “Audit-Related Fees” include amounts for assurance and related services by the principal accountant that are reasonably related to the performance of the audit of the registrant’s financial statements. Audit-related fees have not been reported under the item “audit fees” in the chart above.
The fees billed by Ernst & Young LLP during the fiscal years ended September 30, 2009 and September 30, 2008 include fees incurred for services for review procedures performed in conjunction with the semiannual reports to shareholders as of March 31, 2009 and for certain agreed upon procedures performed in conjunction with the semiannual reports to shareholders as of March 31, 2008.
(c) “Tax Fees” include amounts for professional services rendered by the principal accountant for tax compliance, tax advice and tax planning.
The fees shown in the table above for the fiscal year ended September 30, 2009 include fees for (1) the review and preparation of the Funds’ income tax returns for the fiscal year ended September 30, 2009, which have not been billed as of the time of this filing; (2) the review of excise tax calculations and preparation of excise tax returns for the calendar year ended December 31, 2009, which also have not yet been billed as of the time of this filing; (3) the use of a PFIC database supplied by Ernst & Young LLP for the fiscal year ended September 30, 2008, the excise year ended December 31, 2008, and the semiannual period ended March 31, 2009; and (4) the use of a Qualified Foreign Corporation (QFC) Database supplied by Ernst & Young LLP for the calendar year ended December 31, 2008.
The fees shown in the table above for the fiscal year ended September 30, 2008 include fees for (1) the review and preparation of the Funds’ income tax returns for the fiscal year ended September 30, 2008; (2) the review of excise tax calculations and preparation of excise tax returns for the calendar year ended December 31, 2008; (3) the use of a PFIC database supplied by Ernst & Young LLP for the fiscal year ended September 30, 2007 and the excise year ended December 31, 2007; and (4) the use of a Qualified Foreign Corporation (QFC) Database supplied by Ernst & Young LLP for the calendar year ended December 31, 2007.
(d) None.
(e)(1) During its regularly scheduled periodic meetings, the registrant’s audit committee considers any requests to pre-approve any audit, audit-related, tax and other services to be provided by the principal accountants of the registrant. The audit committee has authorized its chairman to exercise that authority in the intervals between meetings; and the chairman presents any such pre-approvals to the audit committee at its next regularly scheduled meeting. Under paragraph (c)(7)(i)(C) of Rule 2-01 of Regulation S-X, pre-approval of non-audit services may be waived provided that: 1) the aggregate fees for all such services provided constitutes no more than five percent of the total amount of fees paid by the registrant to its principal accountant during the fiscal year in which services are provided, 2) such services were not recognized by the registrant at the time of engagement as non-audit services and 3) such services are promptly brought to the attention of the audit committee of the registrant and approved prior to the completion of the audit.
(e)(2) No services included in Items 4(b) - (d) above were approved pursuant to paragraph (c)(7)(i)(C) of Rule 2-01 of Regulation S-X.
(f) Less than 50 percent of the hours expended on the principal accountant’s engagement to audit the registrant’s financial statements for the most recent fiscal year were attributed to work performed by persons other than the principal accountant’s full-time, permanent employees.
(g) The aggregate fees for the fiscal years ended September 30, 2009 and September 30, 2008 by the registrant’s principal accountant for non-audit services rendered to the registrant are shown in the tables above and described under Items 4(b) – (d) above. For the registrant’s fiscal years ended September 30, 2009 and September 30, 2008, Ernst & Young LLP served as the registrant’s principal accountant and provided no services and billed no fees for non-audit services rendered to the registrant’s adviser or entities controlling, controlled by or under common control with the adviser.
(h) The audit committee of the registrant’s board of directors has considered whether the provision of non-audit services that were rendered to the registrant’s investment adviser, and any entity controlling, controlled by or under common control with the investment adviser that provides ongoing services to the registrant that were not pre-approved pursuant to paragraph (c)(7)(ii) of Rule 2-01 of Regulation S-X is compatible with maintaining the principal accountant’s independence. The provisions of Rule 2-01(c)(7) were effective on May 6, 2003. No such services were rendered on or after May 6, 2003.
| Item 5. | Audit Committee of Listed Registrants. |
Not applicable.
| Item 6. | Schedule of Investments. |
The Schedules of Investments in securities of unaffiliated issuers as of September 30, 2009 are included as part of the annual reports to shareholders filed under Item 1 of this Form N-CSR.
| Item 7. | Disclosure of Proxy Voting Policies and Procedures for Closed-End Management Investment Companies. |
Not applicable.
| Item 8. | Portfolio Managers of Closed-End Management Investment Companies. |
Not applicable.
| Item 9. | Purchases of Equity Securities by Closed-End Management Investment Company and Affiliated Purchasers. |
Not applicable.
| Item 10. | Submission of Matters to a Vote of Security Holders. |
No material changes to report.
| Item 11. | Controls and Procedures. |
(a) The registrant’s principal executive and principal financial officers have concluded, based on an evaluation of the registrant’s disclosure controls and procedures (as defined in Rule 30a-3(c) under the Investment Company Act of 1940, the “Disclosure Controls”) as of a date within 90 days prior to the filing date (the “Filing Date”) of this Form N-CSR (the “Report”), the Disclosure Controls are effectively designed to ensure that information required to be disclosed by the registrant in the Report is recorded, processed, summarized and reported by the Filing Date, including ensuring that information required to be disclosed in the Report is accumulated and communicated to the registrant’s management, including the registrant’s principal executive officer and principal financial officer, as appropriate to allow timely decisions regarding required disclosure.
(b) There were no changes in the registrant’s internal controls over financial reporting (as defined in Rule 30a-3(d) under the Investment Company Act of 1940) that occurred during the registrant’s second fiscal quarter of the period covered by this report that have materially affected, or are reasonably likely to materially affect, the registrant’s internal control over financial reporting.
| | |
| (a) (1) | | Code of Ethics for Principal Executive Officer, Principal Financial Officer and Principal Accounting Officer (as referenced in Item 2 above), attached hereto as Exhibit (a)(1) |
| |
| (2) | | Certifications of (i) Andrew A. Ziegler, Principal Executive Officer and (ii) Lawrence A. Totsky, Principal Financial Officer pursuant to Rule 30a-2(a) under the Investment Company Act of 1940 (17 CFR 270.30a-2(a)), attached hereto as Exhibits (a)(2)(i) and (a)(2)(ii) |
| |
| (b) | | Certification of Andrew A. Ziegler, Principal Executive Officer and Lawrence A. Totsky, Principal Financial Officer pursuant to Section 906 of the Sarbanes-Oxley Act of 2002, attached hereto as Exhibit (b) |
SIGNATURES
Pursuant to the requirements of the Securities Exchange Act of 1934 and the Investment Company Act of 1940, the registrant has duly caused this report to be signed on its behalf by the undersigned, thereunto duly authorized.
Artisan Funds, Inc.
| | |
| |
| By: | | /s/ Andrew A. Ziegler |
| | Andrew A. Ziegler |
| | Principal Executive Officer |
| |
| Date: | | December 3, 2009 |
Pursuant to the requirements of the Securities Exchange Act of 1934 and the Investment Company Act of 1940, this report has been signed below by the following persons on behalf of the registrant and in the capacities and on the dates indicated.
| | |
| |
| By: | | /s/ Andrew A. Ziegler |
| | Andrew A. Ziegler |
| | Principal Executive Officer |
| |
| Date: | | December 3, 2009 |
| |
| By: | | /s/ Lawrence A. Totsky |
| | Lawrence A. Totsky |
| | Principal Financial Officer |
| |
| Date: | | December 3, 2009 |