UNITED STATES
SECURITIES AND EXCHANGE COMMISSION
Washington, D.C. 20549
FORM N-CSR
CERTIFIED SHAREHOLDER REPORT OF REGISTERED
MANAGEMENT INVESTMENT COMPANIES
Investment Company Act file number 811-08932
Artisan Partners Funds, Inc.
(Exact name of registrant as specified in charter)
875 East Wisconsin Avenue, Suite 800
Milwaukee, WI 53202
(Address of principal executive offices) (Zip Code)
| | |
| Sarah A. Johnson | | Alyssa Albertelli |
| Artisan Partners Funds, Inc. | | Ropes & Gray LLP |
| 875 East Wisconsin Avenue, Suite 800 | | One Metro Center |
| Milwaukee, Wisconsin 53202 | | 700 12th Street, N.W., Suite 900 |
| | Washington, D.C. 20005-3948 |
(Name and address of agents for service)
Registrant’s telephone number, including area code: (414) 390-6100
Date of fiscal year end: 9/30/11
Date of reporting period: 9/30/11
Form N-CSR is to be used by management investment companies to file reports with the Commission not later than 10 days after the transmission to stockholders of any report that is required to be transmitted to stockholders under Rule 30e-1 under the Investment Company Act of 1940 (17 CFR 270.30e-1). The Commission may use the information provided on Form N-CSR in its regulatory, disclosure review, inspection, and policymaking roles.
A registrant is required to disclose the information specified by Form N-CSR, and the Commission will make this information public. A registrant is not required to respond to the collection of information contained in Form N-CSR unless the Form displays a currently valid Office of Management and Budget (“OMB”) control number. Please direct comments concerning the accuracy of the information collection burden estimate and any suggestions for reducing the burden to Secretary, Securities and Exchange Commission, 100 F Street, NE, Washington, DC 20549. The OMB has reviewed this collection of information under the clearance requirements of 44 U.S.C. § 3507.
| Item 1. | Reports to Shareholders. |
ANNUAL
REPORT
September 30, 2011
ARTISAN GLOBAL EQUITY FUND
ARTISAN GLOBAL VALUE FUND
ARTISAN GROWTH OPPORTUNITIES FUND
(formerly known as
Artisan Opportunistic Growth Fund)
ARTISAN INTERNATIONAL FUND
ARTISAN INTERNATIONAL SMALL CAP FUND
ARTISAN INTERNATIONAL VALUE FUND
ARTISAN MID CAP FUND
ARTISAN MID CAP VALUE FUND
ARTISAN SMALL CAP FUND
ARTISAN SMALL CAP VALUE FUND
ARTISAN VALUE FUND
(formerly known as Artisan
Opportunistic Value Fund)


ARTISAN FUNDS
INVESTOR SHARES
TABLE OF CONTENTS
ARTISAN FUNDS
P.O. BOX 8412
BOSTON, MA 02266-8412
This report and the audited financial statements contained herein are provided for the general information of the shareholders of Artisan Funds. Before investing, investors should consider carefully each Fund’s investment objective, risks and charges and expenses. For a prospectus, which contains that information and more information about each Fund, please call 800.344.1770 or visit our website at www.artisanfunds.com. Read it carefully before you invest or send money.
Company discussions are for illustration only and are not intended as recommendations of individual stocks. The discussions present information about the companies believed to be accurate, and the views of the portfolio managers, as of September 30, 2011. That information and those views may change, and the Funds disclaim any obligation to advise shareholders of any such changes. Artisan Emerging Markets Fund, Artisan Growth Opportunities Fund, Artisan International Fund, Artisan International Value Fund, Artisan Mid Cap Fund and Artisan Value Fund, offer other classes of shares. Reports on each of the other classes are available under separate cover.
Artisan Funds offered through Artisan Partners Distributors LLC, member FINRA.
ARTISAN GLOBAL EQUITY FUND (ARTHX)
INVESTMENT PROCESS HIGHLIGHTS
Artisan Global Equity Fund employs a fundamental stock selection process focused on identifying long-term growth opportunities. The investment team’s thematic approach identifies catalysts for change and develops investment themes with the objective of capitalizing on them globally.
Themes. Changing demographics, developing technology, privatization of economic resources, outsourcing and infrastructure are among the long-term catalysts for change that currently form the basis for our investment themes. The team incorporates these catalysts along with sector and regional fundamentals into a long-term global framework for investment analysis and decision-making.
Sustainable Growth. The team applies a fundamental approach to identifying the long-term, sustainable growth characteristics of potential investments. The team seeks high quality companies that are well managed, have a dominant or improving market position and competitive advantages compared to industry and regional peers.
Valuation. The team assesses the relationship between its estimate of a company’s sustainable growth prospects and its stock price. The team utilizes multiple valuation metrics to establish price targets.
PERFORMANCE HISTORY
GROWTH OF AN ASSUMED $10,000 INVESTMENT (3/29/2010 to 9/30/2011)
AVERAGE ANNUAL TOTAL RETURNS (as of 9/30/2011)
| | | | | | | | |
| Fund / Index | | 1-Year | | | Since
Inception | |
Artisan Global Equity Fund | | | -2.66 | % | | | -0.28 | % |
MSCI ACWISM (All Country World Index) | | | -6.01 | | | | -3.67 | |
The performance quoted represents past performance, which does not guarantee future results. The investment return and principal value of an investment in the Fund will fluctuate, so that an investor’s shares in the Fund, when redeemed, may be worth more or less than their original cost. Current performance may be lower or higher than the performance quoted. The Fund’s investments in initial public offerings (IPOs) made a material contribution to the Fund’s performance. IPO investments are not an integral component of the Fund’s investment process and may not be available in the future. For current to most recent month-end performance information, visit www.artisanfunds.com or call 800.344.1770. The graph and table above do not reflect the deduction of taxes that a shareholder would pay on distributions or sale of Fund shares. The performance shown does not reflect the deduction of a 2% redemption fee on shares held by an investor for 90 days or less and, if reflected, the fee would reduce the performance quoted. The Fund’s performance information reflects Artisan Partners’ contractual agreement to limit the Fund’s expenses to no more than 1.50%, which has been in effect since the Fund’s inception and has had a material impact on the Fund’s performance, which would have been lower in its absence. See page 113 for a description of the index.
2
INVESTING ENVIRONMENT
Although corporate earnings were generally solid during the period, global equity markets were volatile as various macro events, ranging from sovereign debt woes in Europe and the U.S. to natural disasters in Japan and political turmoil in Egypt, weighed on investor sentiment. Coupled with fears of a slowdown in global growth, the MSCI All Country World IndexSM ended the period in the red with declines across all regions. Buoyed by the U.S., which managed to turn out an approximately 1% gain, the Americas was the best faring region. Sector-wise, the traditionally defensive consumer staples and health care sectors posted gains while the financials, materials and industrials sectors suffered the largest declines.
SECTOR DIVERSIFICATION
| | | | | | | | |
| Sector | | 9/30/10 | | | 9/30/11 | |
Consumer Discretionary | | | 14.0 | % | | | 16.9 | % |
Consumer Staples | | | 15.3 | | | | 21.8 | |
Energy | | | 3.9 | | | | 4.7 | |
Financials | | | 20.9 | | | | 14.5 | |
Healthcare | | | 8.4 | | | | 8.6 | |
Industrials | | | 9.7 | | | | 9.9 | |
Information Technology | | | 21.0 | | | | 12.7 | |
Materials | | | 7.4 | | | | 5.6 | |
Telecommunication Services | | | — | | | | 1.8 | |
Other assets less liabilities | | | (0.6 | ) | | | 3.5 | |
Total | | | 100.0 | % | | | 100.0 | % |
As a percentage of total net assets.
PERFORMANCE DISCUSSION
During the twelve-month period ended September 30, 2011, Artisan Global Equity Fund declined 2.66%, outperforming the MSCI All Country World IndexSM, which fell 6.01% over the same period.
Over the past year, the Fund had several strong performers, including Japanese oil and natural gas holding company INPEX CORPORATION, fast-food restaurant operator McDonald’s Corporation and Hargreaves Lansdown PLC, a provider of investment management products and services in the U.K. Also contributing to our results was the Fund’s participation in initial public offerings, two of which were the top contributors to performance – Chinese internet content and application services provider ChinaCache International Holdings Ltd. and Chinese hypermarket operator Sun Art Retail Group.
Notable detractors over the past year included: Camelot Information Systems, Inc., a provider of enterprise application services and financial industry information technology services; Halliburton Company, an oilfield services company; Akzo Nobel N.V., a manufacturer of paints, coatings and specialty chemicals; MGM Resorts International, an operator of gaming, hospitality and entertainment resorts; and Bayer AG, a producer of health care and agricultural products.
REGION ALLOCATION
| | | | | | | | |
| Region | | 9/30/10 | | | 9/30/11 | |
Europe | | | 40.4 | % | | | 38.7 | % |
Americas | | | 28.5 | | | | 36.7 | |
Pacific Basin | | | 10.3 | | | | 11.7 | |
Emerging Markets | | | 21.4 | | | | 9.4 | |
As a percentage of total net assets.
FUND CHANGES
We identified several new investment opportunities for the portfolio during the period, including food processing company DANONE S.A., insurance and financial services provider AIA Group Ltd., consumer goods company Unilever NV, non-alcoholic beverage manufacturer The Coca-Cola Company, and consumer packaged goods provider The Procter & Gamble Company. We funded these purchases in part by selling our positions in previously mentioned ChinaCache International Holdings Ltd., Cisco Systems Inc., UBS AG, Tesco plc and Agricultural Bank of China Limited.
3
ARTISAN GLOBAL VALUE FUND (ARTGX)
INVESTMENT PROCESS HIGHLIGHTS
Artisan Global Value Fund employs a bottom-up investment process to construct a diversified portfolio of securities of undervalued U.S. and non-U.S. companies. The Fund’s investment process is focused on identifying what the investment team considers to be high quality, undervalued businesses that offer the potential for superior risk/reward outcomes. The team’s in-depth research process focuses on four key investment characteristics:
Undervaluation. Determining the intrinsic value of the business is the heart of the team’s research process. The team believes that intrinsic value represents the amount that a buyer would pay to own a company’s future cash flows. The team seeks to invest at a significant discount to the team’s estimate of the intrinsic value of a business.
Business quality. The team seeks to invest in companies with histories of generating strong free cash flow, improving returns on capital and strong competitive positions in their industries.
Financial strength. The team believes that investing in companies with strong balance sheets helps to reduce the potential for capital risk and provides company management the ability to build value when attractive opportunities are available.
Shareholder-oriented management. The team’s research process attempts to identify management teams with a history of building value for shareholders.
PERFORMANCE HISTORY
GROWTH OF AN ASSUMED $10,000 INVESTMENT (12/10/2007 to 9/30/2011)
AVERAGE ANNUAL TOTAL RETURNS (as of 9/30/2011)
| | | | | | | | | | | | |
| Fund / Index | | 1-Year | | | 3-Year | | | Since
Inception | |
Artisan Global Value Fund | | | -0.23 | % | | | 5.03 | % | | | -0.96 | % |
MSCI ACWISM (All Country World Index) | | | -6.01 | | | | 0.59 | | | | -7.77 | |
The performance quoted represents past performance, which does not guarantee future results. The investment return and principal value of an investment in the Fund will fluctuate, so that an investor’s shares in the Fund, when redeemed, may be worth more or less than their original cost. Current performance may be lower or higher than the performance data quoted. For current to most recent month-end performance information, visit www.artisanfunds.com or call 800.344.1770. The graph and table above do not reflect the deduction of taxes that a shareholder would pay on distributions or sale of Fund shares. The performance shown does not reflect the deduction of a 2% redemption fee on shares held by an investor for 90 days or less and, if reflected, the fee would reduce the performance quoted. The Fund’s performance information reflects Artisan Partners’ contractual agreement to limit the Fund’s expenses to no more than 1.50%, which has been in effect since the Fund’s inception and has had a material impact on the Fund’s performance, which would have been lower in its absence. See page 113 for a description of the index.
4
INVESTING ENVIRONMENT
Global equity markets experienced volatility during the year ended September 30, 2011 stemming from concerns over a global economic slowdown, indecision on the political fronts in the U.S. and Europe, sovereign debt downgrades and worries over contagion from Europe’s debt crisis. The tragic earthquake and tsunami in Japan and turmoil in the Middle East also contributed to market volatility. Despite the fear in the marketplace, many companies continued to report steady earnings results during the period.
SECTOR DIVERSIFICATION
| | | | | | | | |
| Sector | | 9/30/10 | | | 9/30/11 | |
Consumer Discretionary | | | 16.8 | % | | | 17.3 | % |
Consumer Staples | | | 11.5 | | | | 13.2 | |
Energy | | | 2.2 | | | | 2.1 | |
Financials | | | 26.8 | | | | 26.8 | |
Healthcare | | | 8.6 | | | | 7.9 | |
Industrials | | | 17.9 | | | | 11.9 | |
Information Technology | | | 10.1 | | | | 13.7 | |
Materials | | | 1.0 | | | | 1.7 | |
Other assets less liabilities | | | 5.1 | | | | 5.4 | |
Total | | | 100.0 | % | | | 100.0 | % |
As a percentage of total net assets.
PERFORMANCE DISCUSSION
During the twelve-month period ended September 30, 2011, Artisan Global Value Fund declined 0.23%, outperforming the MSCI All Country World IndexSM, which fell 6.01% over the same period.
Performance of the following stocks had a positive impact on the portfolio during the period: MasterCard Incorporated, a payment solutions company; Experian PLC, a credit and marketing services firm; Accenture plc, a provider of management and technology consulting services; Signet Jewelers Ltd., a jewelry retailer in the U.S. and U.K.; and Arch Capital Group Ltd., a provider of reinsurance and insurance products.
Notable detractors included financial services providers Lloyds Banking Group plc, ING Groep N.V., and The Bank of New York Mellon Corporation; medical systems, consumer electronics and lighting manufacturer Koninklijke Philips Electronics N.V.; and aggregates and cement producer HeidelbergCement AG.
REGION ALLOCATION
| | | | | | | | |
| Region | | 9/30/10 | | | 9/30/11 | |
Americas | | | 51.7 | % | | | 54.2 | % |
Europe | | | 37.9 | | | | 32.6 | |
Pacific Basin | | | 5.3 | | | | 7.8 | |
As a percentage of total net assets.
FUND CHANGES
We identified several new investment opportunities for the portfolio during the period, including household goods maker Kao Corporation, discount store operator Target Corporation; home improvement retailer Lowe’s Companies, Inc.; previously mentioned HeidelbergCement AG and previously mentioned Koninklijke Philips Electronics N.V. We funded these purchases in part by selling our positions in Sodexo, Cintas Corporation, The Procter & Gamble Company, Home Retail Group plc and Royal Dutch Shell PLC.
5
ARTISAN GROWTH OPPORTUNITIES FUND (ARTRX)
INVESTMENT PROCESS HIGHLIGHTS
Artisan Growth Opportunities Fund employs a bottom-up investment process to construct a diversified portfolio of growth companies across a broad capitalization range. The Fund’s investment process focuses on two distinct areas – security selection and capital allocation.
The Fund’s investment team attempts to identify companies that possess franchise characteristics that are selling at attractive valuations and benefiting from an accelerating profit cycle.
Franchise characteristics. These are characteristics that the team believes help to protect a company’s stream of cash flow from the effects of competition. The team looks for companies with at least two of the following characteristics: low-cost production capability, possession of a proprietary asset, dominant market share or a defensible brand name.
Attractive valuations. Through its own fundamental research, the team estimates the amount a buyer would pay to buy the entire company (the company’s “intrinsic value” or “private market value”) and considers whether to purchase a stock if it sells at a discount to that estimate.
Accelerating profit cycle. The team tries to invest in companies that are well positioned for long-term growth, at an early enough stage in their profit cycle to benefit from the increased cash flows produced by the profit cycle.
Based on the investment team’s fundamental analysis of a company’s profit cycle, portfolio holdings develop through three stages. GardenSM investments are small positions in the early part of their profit cycle that will warrant a more sizeable allocation once their profit cycle accelerates. CropSM investments are positions that are being increased to a full weight because they are moving through the strongest part of their profit cycle. HarvestSM investments are positions that are being reduced as they near the team’s estimate of full valuation or their profit cycle begins to decelerate.
PERFORMANCE HISTORY
GROWTH OF AN ASSUMED $10,000 INVESTMENT (9/22/2008 to 9/30/2011)
AVERAGE ANNUAL TOTAL RETURNS (as of 9/30/2011)
| | | | | | | | | | | | |
| Fund / Index | | 1-Year | | | 3-Year | | | Since
Inception | |
Artisan Growth Opportunities Fund | | | 0.14 | % | | | 5.70 | % | | | 3.22 | % |
MSCI ACWISM (All Country World Index) | | | -6.01 | | | | 0.59 | | | | -1.65 | |
Russell 1000® Index1 | | | 0.91 | | | | 1.61 | | | | 0.34 | |
| 1 | Effective January 28, 2011, the Fund’s benchmark was changed from the Russell 1000® Index to the MSCI ACWI (All Country World Index) IndexSM, to provide an appropriate comparison in light of the Fund’s investment strategy. |
The performance quoted represents past performance, which does not guarantee future results. The investment return and principal value of an investment in the Fund will fluctuate, so that an investor’s shares in the Fund, when redeemed, may be worth more or less than their original cost. Current performance may be lower or higher than the performance data quoted. For current to most recent month-end performance information, visit www.artisanfunds.com or call 800.344.1770. The graph and table above do not reflect the deduction of taxes that a shareholder would pay on distributions or sale of Fund shares. The performance shown does not reflect the deduction of a 2% redemption fee on shares held by an investor for 90 days or less and, if reflected, the fee would reduce the performance quoted. The Fund’s performance information reflects Artisan Partners’ contractual agreement to limit the Fund’s expenses to no more than 1.50%, which has been in effect since the Fund’s inception and has had a material impact on the Fund’s performance, which would have been lower in its absence. See page 113 for a description of each index.
6
INVESTING ENVIRONMENT
For the one-year period ended September 30, 2011, the global stock markets, as represented by the MSCI All Country World IndexSM, posted negative returns. The best performing sectors included consumer staples and health care, whereas, financials and materials trailed. For much of the period, the economic backdrop was a disappointingly slow global economic recovery with some setbacks along the way including weakening sentiment caused by high sovereign debt levels in developed regions.
SECTOR DIVERSIFICATION
| | | | | | | | |
| Sector | | 9/30/10 | | | 9/30/11 | |
Consumer Discretionary | | | 14.5 | % | | | 13.2 | % |
Consumer Staples | | | — | | | | 2.9 | |
Energy | | | 2.2 | | | | 6.7 | |
Financials | | | 3.3 | | | | 5.4 | |
Healthcare | | | 9.8 | | | | 18.2 | |
Industrials | | | 22.5 | | | | 13.4 | |
Information Technology | | | 42.1 | | | | 28.1 | |
Materials | | | — | | | | 4.1 | |
Other assets less liabilities | | | 5.6 | | | | 8.0 | |
Total | | | 100.0 | % | | | 100.0 | % |
As a percentage of total net assets.
PERFORMANCE DISCUSSION
During the twelve-month period ended September 30, 2011, Artisan Growth Opportunities Fund returned 0.14%, outperforming the MSCI All Country World IndexSM, but underperforming the Russell 1000® Index, which returned -6.01% and 0.91%, respectively, over the same period.
Performance of the following stocks had a positive impact on the portfolio during the period: Cerner Corporation, a health care information technology provider; Apple Inc., a manufacturer of computers and electronic media devices; Starbucks Corporation, a specialty coffee retailer; Polo Ralph Lauren Corporation, an apparel designer and marketer; and Precision Castparts Corp., a manufacturer of complex metal components.
Notable detractors included: Telefonaktiebologet LM Ericsson, a manufacturer of products for wired and mobile communications, Citrix Systems, Inc., a technology solutions provider, Juniper Networks, Inc., a network infrastructure developer, Hexagon AB, an industrial and commercial group, and Baker Hughes Incorporated, a supplier of oil field services.
REGION ALLOCATION
| | | | | | | | |
| Region | | 9/30/10 | | | 9/30/11 | |
Americas | | | 72.3 | % | | | 62.0 | % |
Emerging Markets | | | 9.6 | | | | 17.2 | |
Europe | | | 8.5 | | | | 9.6 | |
Pacific Basin | | | 4.0 | | | | 3.2 | |
As a percentage of total net assets.
FUND CHANGES
We identified several new investment opportunities for the portfolio during the period, including Monsanto Company, a provider of agricultural products for farmers, Discover Financial Services, a payment services provider, Regeneron Pharmaceuticals, Inc., a biopharmaceutical company and Baidu, Inc., an Internet search engine provider. We funded these purchases in part by selling our positions in Cummins Inc., C.H. Robinson Worldwide, Inc., Trimble Navigation Limited and Localiza Rent a Car SA.
7
ARTISAN INTERNATIONAL FUND (ARTIX)
INVESTMENT PROCESS HIGHLIGHTS
Artisan International Fund employs a fundamental stock selection process focused on identifying long-term growth opportunities.
Themes. The investment team’s thematic approach identifies catalysts for change and develops investment themes with the objective of capitalizing on them globally. Changing demographics, developing technology, privatization of economic resources, outsourcing and infrastructure are among the long-term catalysts for change that currently form the basis for the team’s investment themes. The team incorporates these catalysts along with sector and regional fundamentals into a long-term global framework for investment analysis and decision-making.
Sustainable Growth. The team applies a fundamental approach to identifying the long term, sustainable growth characteristics of potential investments. The team seeks high quality companies that are well managed, have a dominant or improving market position and competitive advantages compared to industry and regional peers.
Valuation. The team assesses the relationship between its estimate of a company’s sustainable growth prospects and the company’s stock price. The team uses multiple valuation metrics to establish price targets.
PERFORMANCE HISTORY
GROWTH OF AN ASSUMED $10,000 INVESTMENT (12/28/1995 to 9/30/2011)
AVERAGE ANNUAL TOTAL RETURNS (as of 9/30/2011)
| | | | | | | | | | | | | | | | | | | | |
| Fund / Index | | 1-Year | | | 3-Year | | | 5-Year | | | 10-Year | | | Since
Inception | |
Artisan International Fund | | | -9.95 | % | | | -0.79 | % | | | -2.53 | % | | | 4.64 | % | | | 8.45 | % |
MSCI EAFE® Growth Index | | | -8.79 | | | | -0.63 | | | | -2.16 | | | | 4.86 | | | | 2.11 | |
MSCI EAFE® Index | | | -9.36 | | | | -1.13 | | | | -3.46 | | | | 5.03 | | | | 3.40 | |
The performance quoted represents past performance, which does not guarantee future results. The investment return and principal value of an investment in the Fund will fluctuate, so that an investor’s shares in the Fund, when redeemed, may be worth more or less than their original cost. Current performance may be lower or higher than the performance data quoted. For current to most recent month-end performance information, visit www.artisanfunds.com or call 800.344.1770. The graph and table above do not reflect the deduction of taxes that a shareholder would pay on distributions or sale of Fund shares. The performance shown does not reflect the deduction of a 2% redemption fee on shares held by an investor for 90 days or less and, if reflected, the fee would reduce the performance quoted. See page 113 for a description of each index.
8
INVESTING ENVIRONMENT
Over the past twelve-month period, investors reacted to a plethora of macroeconomic events happening in all parts of the globe, which sent stocks into some dramatic swings that were as abrupt as they were frequent. Developed and emerging markets alike were hard hit with meaningful declines in stock prices. When it came to the debt issues facing the U.S. and Europe, the biggest factor to weigh on stocks seemed to be the lack of decisive action from policymakers in both regions. Political stalemates and ambiguity about next steps for debt-laden countries only added to investor worry. Renewed fears of higher inflation and a hard landing for China’s economy also impacted sentiment across the globe, as China has been a key driver of global growth during this tough economic period. The combination of these events and other macroeconomic concerns resulted in negative returns for the MSCI EAFE® Index.
SECTOR DIVERSIFICATION
| | | | | | | | |
| Sector | | 9/30/10 | | | 9/30/11 | |
Consumer Discretionary | | | 19.2 | % | | | 19.0 | % |
Consumer Staples | | | 15.4 | | | | 28.6 | |
Energy | | | — | | | | 4.4 | |
Financials | | | 24.4 | | | | 14.8 | |
Healthcare | | | 5.3 | | | | 2.2 | |
Industrials | | | 16.4 | | | | 12.9 | |
Information Technology | | | 9.3 | | | | 4.4 | |
Materials | | | 6.6 | | | | 7.6 | |
Telecommunication Services | | | 1.3 | | | | 2.5 | |
Utilities | | | 0.4 | | | | — | |
Other assets less liabilities | | | 1.7 | | | | 3.6 | |
Total | | | 100.0 | % | | | 100.0 | % |
As a percentage of total net assets.
PERFORMANCE DISCUSSION
During the twelve-month period ended September 30, 2011, Artisan International Fund declined 9.95%, underperforming the MSCI EAFE® Growth and MSCI EAFE® indices, which fell 8.79% and 9.36%, respectively, over the same period.
Performance of the following stocks had a positive impact on the portfolio during the period: Netherlands based semiconductor manufacturing equipment developer ASML Holding N.V., Macau casino operators Sands China Ltd. and Wynn Macau, Limited, Japanese cigarette and tobacco products manufacturer JAPAN TOBACCO INC. and U.K. listed credit and marketing services provider Experian PLC.
Notable detractors included: Brazilian oil and gas producer Petroleo Brasileiro S.A., Canadian freight and intermodal services provider Canadian Pacific Railway Limited, Hong Kong based property developer Sun Hung Kai Properties Limited, Italian truck and tractor manufacturer Fiat Industrial SpA, and Chinese flavors and fragrances producer Huabao International Holdings Limited.
REGION ALLOCATION
| | | | | | | | |
| Region | | 9/30/10 | | | 9/30/11 | |
Europe | | | 60.9 | % | | | 52.2 | % |
Pacific Basin | | | 20.2 | | | | 31.2 | |
Emerging Markets | | | 11.0 | | | | 7.9 | |
Americas | | | 6.2 | | | | 5.1 | |
As a percentage of total net assets.
FUND CHANGES
We identified several new investment opportunities for the portfolio during the period, including Japanese cigarette and tobacco products manufacturer JAPAN TOBACCO INC., Netherlands based branded and packaged consumer goods company Unilever NV, Hong Kong based insurance company AIA Group Ltd., Japanese household and chemical products manufacturer Kao Corporation and French food processing company DANONE S.A. We funded these purchases in part by selling our positions in ASML Holding N.V., Tesco plc, Experian PLC, ING Groep N.V. and Kingfisher plc.
9
ARTISAN INTERNATIONAL SMALL CAP FUND (ARTJX)
INVESTMENT PROCESS HIGHLIGHTS
Artisan International Small Cap Fund employs a fundamental stock selection process focused on identifying long-term growth opportunities among small non-U.S. companies.
Themes. The investment team’s thematic approach identifies catalysts for change and develops investment themes with the objective of capitalizing on them globally. Changing demographics, developing technology, privatization of economic resources, outsourcing and infrastructure are among the long-term catalysts for change that currently form the basis for the team’s investment themes. The team incorporates these catalysts along with sector and regional fundamentals into a long-term global framework for investment analysis and decision-making.
Sustainable Growth. The team applies a fundamental approach to identifying the long term, sustainable growth characteristics of potential investments. The team seeks high quality companies that are well managed, have a dominant or improving market position and competitive advantages compared to industry and regional peers.
Valuation. The team assesses the relationship between its estimate of a company’s sustainable growth prospects and the company’s stock price. The team uses multiple valuation metrics to establish price targets.
PERFORMANCE HISTORY
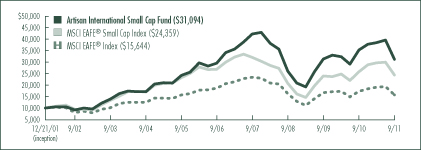
GROWTH OF AN ASSUMED $10,000 INVESTMENT (12/21/2001 to 9/30/2011)
AVERAGE ANNUAL TOTAL RETURNS (as of 9/30/2011)
| | | | | | | | | | | | | | | | |
| Fund / Index | | 1-Year | | | 3-Year | | | 5-Year | | | Since
Inception | |
Artisan International Small Cap Fund | | | -11.70 | % | | | 6.23 | % | | | 1.10 | % | | | 12.31 | % |
MSCI EAFE® Small Cap Index | | | -5.50 | | | | 5.64 | | | | -1.88 | | | | 9.54 | |
MSCI EAFE® Index | | | -9.36 | | | | -1.13 | | | | -3.46 | | | | 4.68 | |
The performance quoted represents past performance, which does not guarantee future results. The investment return and principal value of an investment in the Fund will fluctuate, so that an investor’s shares in the Fund, when redeemed, may be worth more or less than their original cost. Current performance may be lower or higher than the performance data quoted. For current to most recent month-end performance information, visit www.artisanfunds.com or call 800.344.1770. The graph and table above do not reflect the deduction of taxes that a shareholder would pay on distributions or sale of Fund shares. The performance shown does not reflect the deduction of a 2% redemption fee on shares held by an investor for 90 days or less and, if reflected, the fee would reduce the performance quoted. See page 113 for a description of each index.
10
INVESTING ENVIRONMENT
The year ended September 30, 2011 was flecked with geopolitical and natural disasters that left investors jittery about the prospects for a global economic recovery. Escalating sovereign debt concerns in Europe, the downgrading of the U.S. national credit rating and the possibility of an economic hard landing in China only served to heighten investor anxiety over the prospects for global growth. Ultimately, the MSCI EAFE® Small Cap Index posted a loss for the period, with all European markets declining. In the Pacific Basin, a strong showing from Japan (up approximately 12%) helped counter double-digit losses in Hong Kong and Singapore.
SECTOR DIVERSIFICATION
| | | | | | | | |
| Sector | | 9/30/10 | | | 9/30/11 | |
Consumer Discretionary | | | 33.1 | % | | | 26.9 | % |
Consumer Staples | | | 15.6 | | | | 12.8 | |
Financials | | | 6.5 | | | | 2.9 | |
Healthcare | | | 4.4 | | | | 5.0 | |
Industrials | | | 22.5 | | | | 26.2 | |
Information Technology | | | 8.9 | | | | 8.5 | |
Materials | | | 4.0 | | | | 4.1 | |
Utilities | | | 4.2 | | | | 5.2 | |
Other assets less liabilities | | | 0.8 | | | | 8.4 | |
Total | | | 100.0 | % | | | 100.0 | % |
As a percentage of total net assets.
PERFORMANCE DISCUSSION
During the twelve-month period ended September 30, 2011, Artisan International Small Cap Fund declined 11.70%, underperforming the MSCI EAFE® Small Cap and MSCI EAFE® indices, which fell 5.50% and 9.36%, respectively, over the same period.
Performance of the following stocks had a positive impact on the portfolio during the period: Bulgari S.p.A., a luxury goods manufacturer; SJM Holdings Limited, a casino operator in Macau; Melco Crown Entertainment Ltd., a casino operator in Macau; Wirecard AG, a provider of Internet payment and processing services, and Davide Campari – Milano S.p.A., a producer of spirits, wines and soft drinks.
Notable detractors included: Longtop Financial Technologies Limited, a Chinese software application developer; Beijing Enterprises Water Group Limited, a developer of water treatment systems; Smurfit Kappa Group PLC, a packaging products manufacturer; China Gas Holdings Ltd., a natural gas services operator; and Wacker Neuson SE, a manufacturer of light construction equipment and construction machines.
REGION ALLOCATION
| | | | | | | | |
| Region | | 9/30/10 | | | 9/30/11 | |
Europe | | | 58.4 | % | | | 52.7 | % |
Emerging Markets | | | 25.1 | | | | 22.0 | |
Pacific Basin | | | 12.8 | | | | 16.9 | |
Americas | | | 2.9 | | | | — | |
As a percentage of total net assets.
FUND CHANGES
We identified several new investment opportunities for the portfolio during the period, including Alliance Global Group, Inc., a holding company engaged in the food and beverage, real estate development and fast food restaurant business; Rubis, a company engaged in the storage and distribution of petroleum and other liquid products; Eurofins Scientific, a provider of bio-analytical testing services; AUTOBACS SEVEN CO., LTD., a Japanese retailer of automotive related products and services and NTN CORPORATION, a manufacturer of bearings and machinery parts for industrial use. We funded these purchases in part by selling our positions in Finning International Inc., Punch Taverns plc, Mothercare plc, Remy Cointreau SA and Enterprise Inns plc.
11
ARTISAN INTERNATIONAL VALUE FUND (ARTKX)
INVESTMENT PROCESS HIGHLIGHTS
Artisan International Value Fund employs a bottom-up investment process to construct a diversified portfolio of stocks of undervalued non-U.S. companies. The Fund’s investment process is focused on identifying what the investment team believes are high quality, undervalued businesses that offer the potential for superior risk/reward outcomes. The team’s in-depth research process focuses on four key investment characteristics:
Undervaluation. Determining the intrinsic value of the business is the heart of the team’s research process. The team believes that intrinsic value represents the amount that a buyer would pay to own a company’s future cash flows. The team seeks to invest at a significant discount to its estimate of the intrinsic value of a business.
Business quality. The team seeks to invest in companies with histories of generating strong free cash flow, improving returns on capital and strong competitive positions in their industries.
Financial strength. The team believes that investing in companies with strong balance sheets helps to reduce the potential for capital risk and provides company management the ability to build value when attractive opportunities are available.
Shareholder-oriented management. The team’s research process attempts to identify management teams with a history of building value for shareholders.
PERFORMANCE HISTORY
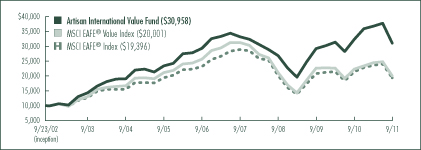
GROWTH OF AN ASSUMED $10,000 INVESTMENT (9/23/2002 to 9/30/2011)
AVERAGE ANNUAL TOTAL RETURNS (as of 9/30/2011)
| | | | | | | | | | | | | | | | |
| Fund / Index | | 1-Year | | | 3-Year | | | 5-Year | | | Since
Inception | |
Artisan International Value Fund | | | -4.01 | % | | | 4.90 | % | | | 1.13 | % | | | 13.35 | % |
MSCI EAFE® Value Index | | | -9.99 | | | | -1.69 | | | | -4.82 | | | | 7.99 | |
MSCI EAFE® Index | | | -9.36 | | | | -1.13 | | | | -3.46 | | | | 7.62 | |
The performance quoted represents past performance, which does not guarantee future results. The investment return and principal value of an investment in the Fund will fluctuate, so that an investor’s shares in the Fund, when redeemed, may be worth more or less than their original cost. Current performance may be lower or higher than the performance data quoted. For current to most recent month-end performance information, visit www.artisanfunds.com or call 800.344.1770. The graph and table above do not reflect the deduction of taxes that a shareholder would pay on distributions or sale of Fund shares. The performance shown does not reflect the deduction of a 2% redemption fee on shares held by an investor for 90 days or less and, if reflected, the fee would reduce the performance quoted. See page 113 for a description of each index.
12
INVESTING ENVIRONMENT
International equity markets experienced volatility during the year ended September 30, 2011 stemming from concerns over a global economic slowdown, indecision on the political fronts in the U.S. and Europe, sovereign debt downgrades and worries over contagion from Europe’s debt crisis. The tragic earthquake and tsunami in Japan and turmoil in the Middle East also contributed to market volatility. Despite fear in the marketplace, many companies continued to report steady earnings results during the period.
SECTOR DIVERSIFICATION
| | | | | | | | |
| Sector | | 9/30/10 | | | 9/30/11 | |
Consumer Discretionary | | | 22.7 | % | | | 23.4 | % |
Consumer Staples | | | 9.2 | | | | 14.9 | |
Energy | | | 4.5 | | | | 2.6 | |
Financials | | | 21.1 | | | | 21.7 | |
Healthcare | | | 7.3 | | | | 7.9 | |
Industrials | | | 18.1 | | | | 15.6 | |
Information Technology | | | 7.7 | | | | 7.0 | |
Materials | | | 3.2 | | | | 2.5 | |
Other assets less liabilities | | | 6.2 | | | | 4.4 | |
Total | | | 100.0 | % | | | 100.0 | % |
As a percentage of total net assets.
PERFORMANCE DISCUSSION
During the twelve-month period ended September 30, 2011, Artisan International Value Fund declined 4.01%, outperforming the MSCI EAFE® Value and MSCI EAFE® indices, which fell 9.99% and 9.36%, respectively, over the same period.
Performance of the following stocks had a positive impact on the portfolio during the period: Credit Saison Co., Ltd., a consumer card company; Experian PLC, a credit and marketing services firm; Accenture plc, a provider of management and technology consulting services; Signet Jewelers Ltd., a jewelry retailer in the U.S. and U.K.; and Arch Capital Group Ltd., a provider of reinsurance and insurance products.
Notable detractors included financial services providers ING Groep N.V. and Lloyds Banking Group plc; medical systems, consumer electronics and lighting manufacturer Koninklijke Philips Electronics N.V.; international brewer Carlsberg A/S; and aggregates and cement producer HeidelbergCement AG.
REGION ALLOCATION
| | | | | | | | |
| Region | | 9/30/10 | | | 9/30/11 | |
Europe | | | 63.8 | % | | | 61.9 | % |
Americas | | | 18.5 | | | | 17.0 | |
Pacific Basin | | | 11.1 | | | | 16.2 | |
Emerging Markets | | | 0.4 | | | | 0.5 | |
As a percentage of total net assets.
FUND CHANGES
We identified some new investment opportunities for the portfolio during the period, including household goods maker Kao Corporation, previously mentioned Koninklijke Philips Electronics N.V., previously mentioned ING Groep N.V., food retailer Koninklijke Ahold NV and lighting equipment manufacturer Stanley Electric Co., Ltd. We funded these purchases in part by selling our positions in Givaudan SA, Royal Dutch Shell PLC and Home Retail Group plc.
13
ARTISAN MID CAP FUND (ARTMX)
INVESTMENT PROCESS HIGHLIGHTS
Artisan Mid Cap Fund employs a bottom-up investment process to construct a diversified portfolio of primarily U.S. mid-cap growth companies. The Fund’s investment process focuses on two distinct areas – security selection and capital allocation.
The Fund’s investment team attempts to identify companies that possess franchise characteristics that are selling at attractive valuations and benefiting from an accelerating profit cycle.
Franchise characteristics. These are characteristics that the team believes help to protect a company’s stream of cash flow from the effects of competition. The team looks for companies with at least two of the following characteristics: low-cost production capability, possession of a proprietary asset, dominant market share or a defensible brand name.
Attractive valuations. Through its own fundamental research, the team estimates the amount a buyer would pay to buy the entire company (the company’s “intrinsic value” or “private market value”) and considers whether to purchase a stock if it sells at a discount to that estimate.
Accelerating profit cycle. The team tries to invest in companies that are well positioned for long-term growth, at an early enough stage in their profit cycle to benefit from the increased cash flows produced by the profit cycle.
Based on the investment team’s fundamental analysis of a company’s profit cycle, portfolio holdings develop through three stages. GardenSM investments are small positions in the early part of their profit cycle that will warrant a more sizeable allocation once their profit cycle accelerates. CropSM investments are positions that are being increased to a full weight because they are moving through the strongest part of their profit cycle. HarvestSM investments are positions that are being reduced as they near the team’s estimate of full valuation or their profit cycle begins to decelerate.
PERFORMANCE HISTORY
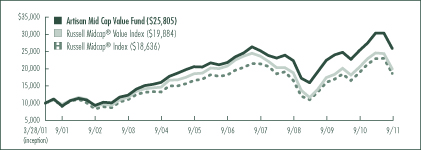
GROWTH OF AN ASSUMED $10,000 INVESTMENT (6/27/1997 to 9/30/2011)

AVERAGE ANNUAL TOTAL RETURNS (as of 9/30/2011)
| | | | | | | | | | | | | | | | | | | | |
| Fund / Index | | 1-Year | | | 3-Year | | | 5-Year | | | 10-Year | | | Since
Inception | |
Artisan Mid Cap Fund | | | 5.38 | % | | | 9.53 | % | | | 5.76 | % | | | 7.90 | % | | | 12.92 | % |
Russell Midcap® Growth Index | | | 0.80 | | | | 5.89 | | | | 1.64 | | | | 6.70 | | | | 5.32 | |
Russell Midcap® Index | | | -0.88 | | | | 3.96 | | | | 0.56 | | | | 7.45 | | | | 7.09 | |
The performance quoted represents past performance, which does not guarantee future results. The investment return and principal value of an investment in the Fund will fluctuate, so that an investor’s shares in the Fund, when redeemed, may be worth more or less than their original cost. Current performance may be lower or higher than the performance data quoted. For current to most recent month-end performance information, visit www.artisanfunds.com or call 800.344.1770. The graph and table above do not reflect the deduction of taxes that a shareholder would pay on distributions or sale of Fund shares. See page 113 for a description of each index.
14
INVESTING ENVIRONMENT
For the one-year period ended September 30, 2011 mid-cap stocks, as represented by the Russell Midcap® Index, finished slightly negative. Mid-cap growth stocks, as represented by the Russell Midcap® Growth Index performed better. The best performing sectors in the Russell Midcap® Growth Index included consumer staples, utilities and consumer discretionary, whereas, telecommunications services and information technology trailed. For much of the period, the economic backdrop was a slower than initially expected economic recovery, but there were also some setbacks along the way including weakening sentiment caused by high sovereign debt levels in developed regions. Overall, corporate earnings remained relatively healthy throughout the period.
SECTOR DIVERSIFICATION
| | | | | | | | |
| Sector | | 9/30/10 | | | 9/30/11 | |
Consumer Discretionary | | | 20.7 | % | | | 19.6 | % |
Consumer Staples | | | — | | | | 2.6 | |
Energy | | | 5.0 | | | | 7.3 | |
Financials | | | 7.4 | | | | 5.1 | |
Healthcare | | | 12.4 | | | | 22.5 | |
Industrials | | | 18.7 | | | | 12.6 | |
Information Technology | | | 33.5 | | | | 25.9 | |
Other assets less liabilities | | | 2.3 | | | | 4.4 | |
Total | | | 100.0 | % | | | 100.0 | % |
As a percentage of total net assets.
PERFORMANCE DISCUSSION
During the twelve-month period ended September 30, 2011, Artisan Mid Cap Fund returned 5.38%, outperforming the Russell Mid Cap® Growth and Russell Mid Cap® indices, which fell 0.80% and 0.88%, respectively, over the same period.
Performance of the following stocks had a positive impact on the portfolio during the period: Cerner Corporation, a health care information technology provider; lululemon athletica inc., a specialty apparel retailer; Regeneron Pharmaceuticals, Inc., a biopharmaceutical company; athenahealth, Inc., an internet-based business services provider; and Polo Ralph Lauren Corporation, an apparel designer and marketer.
Notable detractors included: Comerica Incorporated, a bank holding company; MercadoLibre, Inc., an online trading site operator; Ctrip.com International Ltd., an airline and hotel accommodation consolidator; Citrix Systems, Inc., a technology solutions provider; and Juniper Networks, Inc., a network infrastructure developer.
FUND CHANGES
We identified several new investment opportunities for the portfolio during the period, including Regeneron Pharmaceuticals, Inc., a biopharmaceutical company; Teradata Corporation, an enterprise data warehouse; Discover Financial Services, a payment services provider; and Cepheid, a molecular diagnostics company. We funded these purchases in part by selling our positions in Cummins Inc., C.H. Robinson Worldwide, Inc., GSI Commerce, Inc. and NetApp, Inc.
15
ARTISAN MID CAP VALUE FUND (ARTQX)
INVESTMENT PROCESS HIGHLIGHTS
Artisan Mid Cap Value Fund employs a bottom-up investment process to construct a diversified portfolio of stocks of medium-sized U.S. companies that the investment team believes are undervalued, in solid financial condition and have attractive business economics. The team believes companies with these characteristics are less likely to experience eroding values over the long term.
Attractive valuation. The team values a business using what it believes are reasonable expectations for the long-term earnings power and capitalization rates of that business. This results in a range of values for the company that the team believes would be reasonable. The team generally will purchase a security if the stock price falls below or toward the lower end of that range.
Sound financial condition. The team favors companies with an acceptable level of debt and positive cash flow. At a minimum, the team tries to avoid companies that have so much debt that management may be unable to make decisions that would be in the best interests of the companies’ shareholders.
Attractive business economics. The team favors cash-producing businesses that it believes are capable of earning acceptable returns on capital over the company’s business cycle.
PERFORMANCE HISTORY
GROWTH OF AN ASSUMED $10,000 INVESTMENT (3/28/2001 to 9/30/2011)
AVERAGE ANNUAL TOTAL RETURNS (as of 9/30/2011)
| | | | | | | | | | | | | | | | | | | | |
| Fund / Index | | 1-Year | | | 3-Year | | | 5-Year | | | 10-Year | | | Since
Inception | |
Artisan Mid Cap Value Fund | | | 2.51 | % | | | 4.89 | % | | | 3.51 | % | | | 10.92 | % | | | 9.44 | % |
Russell Midcap® Value Index | | | -2.36 | | | | 1.98 | | | | -0.84 | | | | 7.54 | | | | 6.76 | |
Russell Midcap® Index | | | -0.88 | | | | 3.96 | | | | 0.56 | | | | 7.45 | | | | 6.10 | |
The performance quoted represents past performance, which does not guarantee future results. The investment return and principal value of an investment in the Fund will fluctuate, so that an investor’s shares in the Fund, when redeemed, may be worth more or less than their original cost. Current performance may be lower or higher than the performance data quoted. For current to most recent month-end performance information, visit www.artisanfunds.com or call 800.344.1770. The graph and table above do not reflect the deduction of taxes that a shareholder would pay on distributions or sale of Fund shares. See page 113 for a description of each index.
16
INVESTING ENVIRONMENT
The one-year period ended September 30, 2011 began strongly, with equities turning in solid gains through the first nine months buoyed by steady corporate profits. Equities fell sharply in the final three months of the period due to a variety of macroeconomic concerns, including the stability of the European banking system owing to sovereign debt exposures and slowing economic growth in the U.S. and around the world.
SECTOR DIVERSIFICATION
| | | | | | | | |
| Sector | | 9/30/10 | | | 9/30/11 | |
Consumer Discretionary | | | 7.9 | % | | | 7.3 | % |
Consumer Staples | | | 6.0 | | | | 5.5 | |
Energy | | | 8.4 | | | | 7.1 | |
Financials | | | 18.1 | | | | 21.8 | |
Healthcare | | | 4.2 | | | | 3.2 | |
Industrials | | | 20.6 | | | | 18.9 | |
Information Technology | | | 22.9 | | | | 25.0 | |
Utilities | | | 8.6 | | | | 7.9 | |
Other assets less liabilities | | | 3.3 | | | | 3.3 | |
Total | | | 100.0 | % | | | 100.0 | % |
As a percentage of total net assets.
PERFORMANCE DISCUSSION
During the twelve-month period ended September 30, 2011, Artisan Mid Cap Value Fund returned 2.51%, outperforming the Russell Midcap® Value and Russell Midcap® indices which fell 2.36% and 0.88%, respectively, over the same period.
Performance of the following stocks had a positive impact on the portfolio during the period: National Semiconductor Corporation, a semiconductor manufacturer; Nabors Industries Ltd., a land-based drilling contractor; Range Resources Corporation, an independent exploration and production company; Pride International, Inc., an offshore drilling contractor; and American Water Works Company, Inc., a waste and wastewater services provider.
Notable detractors included: Lexmark International, Inc., a worldwide printer vendor; SAIC, Inc., a research, engineering and technical services firm; Ensco plc, a global offshore driller; Manpower Inc., a provider of temporary staffing services; and The Allstate Corporation, a personal lines insurer.
FUND CHANGES
We identified several new investment opportunities for the portfolio during the period, including previously mentioned Lexmark International, Inc., in addition to Spirit AeroSystems Holdings, Inc., a maker of aerostructures; Loews Corporation, a diversified holding company; Broadridge Financial Solutions, Inc., a provider of investor communication and trade processing services; and Northern Trust Corporation, a provider of financial services. We funded these purchases in part by selling our positions in previously mentioned Nabors Industries Ltd., in addition to Cintas Corporation, Stryker Corporation, Acuity Brands, Inc. and H.J. Heinz Company.
17
ARTISAN SMALL CAP FUND (ARTSX)
INVESTMENT PROCESS HIGHLIGHTS
Artisan Small Cap Fund employs a bottom-up investment process to construct a diversified portfolio of primarily U.S. small-cap growth companies. The Fund’s investment process focuses on two distinct areas – security selection and capital allocation.
The Fund’s investment team attempts to identify companies that possess franchise characteristics that are selling at attractive valuations and benefiting from an accelerating profit cycle.
Franchise characteristics. These are characteristics that the team believes help to protect a company’s stream of cash flow from the effects of competition. The team looks for companies with at least two of the following characteristics: low-cost production capability, possession of a proprietary asset, dominant market share or a defensible brand name.
Attractive valuations. Through its own fundamental research, the team estimates the amount a buyer would pay to buy the entire company (the company’s “intrinsic value” or “private market value”) and considers whether to purchase a stock if it sells at a discount to that estimate.
Accelerating profit cycle. The team tries to invest in companies that are well positioned for long-term growth, at an early enough stage in their profit cycle to benefit from the increased cash flows produced by the profit cycle.
Based on the investment team’s fundamental analysis of a company’s profit cycle, portfolio holdings develop through three stages. GardenSM investments are small positions in the early part of their profit cycle that will warrant a more sizeable allocation once their profit cycle accelerates. CropSM investments are positions that are being increased to a full weight because they are moving through the strongest part of their profit cycle. HarvestSM investments are positions that are being reduced as they near the team’s estimate of full valuation or their profit cycle begins to decelerate.
PERFORMANCE HISTORY
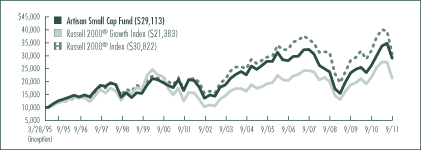
GROWTH OF AN ASSUMED $10,000 INVESTMENT (3/28/1995 to 9/30/2011)
AVERAGE ANNUAL TOTAL RETURNS (as of 9/30/2011)
| | | | | | | | | | | | | | | | | | | | |
| Fund / Index | | 1-Year | | | 3-Year | | | 5-Year | | | 10-Year | | | Since
Inception | |
Artisan Small Cap Fund | | | 11.18 | % | | | 6.90 | % | | | 0.75 | % | | | 5.80 | % | | | 6.69 | % |
Russell 2000® Growth Index | | | -1.12 | | | | 2.07 | | | | 0.96 | | | | 5.45 | | | | 4.71 | |
Russell 2000® Index | | | -3.53 | | | | -0.37 | | | | -1.02 | | | | 6.12 | | | | 7.06 | |
The performance quoted represents past performance, which does not guarantee future results. The investment return and principal value of an investment in the Fund will fluctuate, so that an investor’s shares in the Fund, when redeemed, may be worth more or less than their original cost. Current performance may be lower or higher than the performance data quoted. For current to most recent month-end performance information, visit www.artisanfunds.com or call 800.344.1770. The graph and table above do not reflect the deduction of taxes that a shareholder would pay on distributions or sale of Fund shares. See page 113 for a description of each index.
18
INVESTING ENVIRONMENT
For the one-year period ended September 30, 2011 small-cap stocks, as represented by the Russell 2000® Index, finished negative. Small-cap growth stocks, as represented by the Russell 2000® Growth Index, performed better though still negative. The best performing sector in the Russell 2000® Growth Index was consumer staples, whereas the materials sector trailed. For much of the period, the economic backdrop was a slower than initially expected economic recovery, but there were also some setbacks along the way including weakening sentiment caused by high sovereign debt levels in developed regions. Overall corporate earnings remained relatively healthy throughout the period.
SECTOR DIVERSIFICATION
| | | | | | | | |
| Sector | | 9/30/10 | | | 9/30/11 | |
Consumer Discretionary | | | 13.8 | % | | | 17.7 | % |
Consumer Staples | | | 1.4 | | | | 5.0 | |
Energy | | | 4.7 | | | | 4.0 | |
Financials | | | 9.7 | | | | 4.4 | |
Healthcare | | | 13.4 | | | | 23.5 | |
Industrials | | | 19.5 | | | | 18.9 | |
Information Technology | | | 33.4 | | | | 22.4 | |
Utilities | | | 1.5 | | | | 0.3 | |
Other assets less liabilities | | | 2.6 | | | | 3.8 | |
Total | | | 100.0 | % | | | 100.0 | % |
As a percentage of total net assets.
PERFORMANCE DISCUSSION
During the twelve-month period ended September 30, 2011, Artisan Small Cap Fund returned 11.18%, outperforming the Russell 2000® Growth and Russell 2000® indices, which fell 1.12% and 3.53%, respectively, over the same period.
Performance of the following stocks had a positive impact on the portfolio during the period: Cepheid, a molecular diagnostics provider; Ulta Salon, Cosmetics & Fragrance, Inc., a specialty cosmetics retailer; athenahealth, Inc., an internet-based business services company; Regeneron Pharmaceuticals, Inc., a biopharmaceutical company; and Varian Semiconductor Equipment Associates, Inc., a manufacturer of semiconductor processing equipment.
Notable detractors included: ReachLocal, Inc., an online marketing provider, FirstMerit Corporation, a bank holding company, Acuity Brands, Inc., a manufacturer of lighting equipment, MercadoLibre Inc., an online trading site for Latin American markets and K12 Inc., an online educational company.
FUND CHANGES
We identified several new investment opportunities for the portfolio during the period, including Regeneron Pharmaceuticals, Inc., a biopharmaceutical company; Woodward Governor Company, a manufacturer of energy control solutions; Universal Display Corporation, a manufacturer of organic light emitting diode technologies for displays; and Thomas & Betts Corporation, a manufacturer of electrical components. We funded these purchases in part by selling our positions in Rovi Corporation, Atheros Communications, Inc., GSI Commerce, Inc. and Moog Inc.
19
ARTISAN SMALL CAP VALUE FUND (ARTVX)
INVESTMENT PROCESS HIGHLIGHTS
Artisan Small Cap Value Fund employs a bottom-up investment process to construct a diversified portfolio of small-cap U.S. companies that the team believes are undervalued, in solid financial condition and have attractive business economics. The team believes companies with these characteristics are less likely to experience eroding values over the long term.
Attractive valuation. The team values a business using what it believes are reasonable expectations for the long-term earnings power and capitalization rates of that business. This results in a range of values for the company that the team believes would be reasonable. The team generally will purchase a security if the stock price falls below or toward the lower end of that range.
Sound financial condition. The team favors companies with an acceptable level of debt and positive cash flow. At a minimum, the team tries to avoid companies that have so much debt that management may be unable to make decisions that would be in the best interest of the companies’ shareholders.
Attractive business economics. The team favors cash-producing businesses that it believes are capable of earning acceptable returns on capital over the company’s business cycle.
PERFORMANCE HISTORY
GROWTH OF AN ASSUMED $10,000 INVESTMENT (9/29/1997 to 9/30/2011)
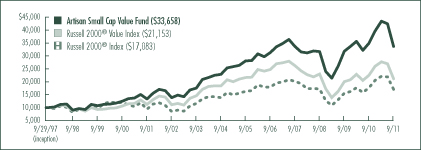
AVERAGE ANNUAL TOTAL RETURNS (as of 9/30/2011)
| | | | | | | | | | | | | | | | | | | | |
| Fund / Index | | 1-Year | | | 3-Year | | | 5-Year | | | 10-Year | | | Since
Inception | |
Artisan Small Cap Value Fund | | | -3.61 | % | | | 2.01 | % | | | 1.46 | % | | | 9.70 | % | | | 9.05 | % |
Russell 2000® Value Index | | | -5.99 | | | | -2.78 | | | | -3.08 | | | | 6.47 | | | | 5.50 | |
Russell 2000® Index | | | -3.53 | | | | -0.37 | | | | -1.02 | | | | 6.12 | | | | 3.90 | |
The performance quoted represents past performance, which does not guarantee future results. The investment return and principal value of an investment in the Fund will fluctuate, so that an investor’s shares in the Fund, when redeemed, may be worth more or less than their original cost. Current performance may be lower or higher than the performance data quoted. For current to most recent month-end performance information, visit www.artisanfunds.com or call 800.344.1770. The graph and table above do not reflect the deduction of taxes that a shareholder would pay on distributions or sale of Fund shares. See page 113 for a description of each index.
20
INVESTING ENVIRONMENT
The one-year period ended September 30, 2011 began strongly, with equities turning in solid gains through the first nine months buoyed by steady corporate profits. Equities fell sharply in the final three months of the period due to a variety of macroeconomic concerns, including the stability of the European banking system owing to sovereign debt exposures and slowing economic growth in the U.S. and around the world.
SECTOR DIVERSIFICATION
| | | | | | | | |
| Sector | | 9/30/10 | | | 9/30/11 | |
Consumer Discretionary | | | 6.4 | % | | | 12.1 | % |
Consumer Staples | | | 2.3 | | | | 1.5 | |
Energy | | | 12.0 | | | | 10.4 | |
Financials | | | 7.8 | | | | 8.9 | |
Healthcare | | | 2.6 | | | | 2.4 | |
Industrials | | | 21.7 | | | | 27.6 | |
Information Technology | | | 29.8 | | | | 23.9 | |
Materials | | | 3.9 | | | | 5.9 | |
Telecommunication Services | | | — | | | | 1.5 | |
Utilities | | | 10.1 | | | | 4.3 | |
Other assets less liabilities | | | 3.4 | | | | 1.5 | |
Total | | | 100.0 | % | | | 100.0 | % |
As a percentage of total net assets.
PERFORMANCE DISCUSSION
During the twelve-month period ended September 30, 2011, Artisan Small Cap Value Fund returned -3.61%, outperforming the Russell 2000® Value Index, but trailing the Russell 2000® Index, which fell 5.99% and 3.53%, respectively, over the same period.
Performance of the following stocks had a positive impact on the portfolio during the period: Patterson-UTI Energy, Inc., an onshore drilling rig contractor; MicroStrategy Incorporated, a provider of business intelligence software; Monster Worldwide, Inc., an internet company; Varian Semiconductor Equipment Associates, Inc., a supplier of semiconductor manufacturing equipment; and Lawson Software, Inc., an enterprise software developer.
Notable detractors included: exploration and production companies Forest Oil Corporation, Comstock Resources, Inc., and Penn Virginia Corporation; Quad/Graphics, Inc., a provider of print solutions; and Atlas Air Worldwide Holdings, Inc., a provider of outsourced wide-body freighter aircraft.
FUND CHANGES
We identified several new investment opportunities for the portfolio during the period, including Intersil Corporation, a manufacturer of analog integrated circuits; Hatteras Financial Corp., a mortgage real estate investment trust; and Cloud Peak Energy Inc., a U.S. coal producer. We funded these purchases in part by selling our positions in previously mentioned Patterson-UTI Energy, Inc. and Varian Semiconductor Equipment Associates, Inc., in addition to Anixter International Inc.
21
ARTISAN VALUE FUND (ARTLX)
INVESTMENT PROCESS HIGHLIGHTS
Artisan Value Fund employs a bottom-up investment process to construct a diversified portfolio of stocks that the team believes are undervalued, in solid financial condition with attractive business economics. The team believes companies with these characteristics are less likely to experience eroding values over the long term.
Attractive valuation. The team values a business using what it believes are reasonable expectations for the long-term earnings power and capitalization rates of that business. This results in a range of values for the company that the team believes would be reasonable. The team generally will purchase a security if the stock price falls below or toward the lower end of that range.
Sound financial condition. The team favors companies with an acceptable level of debt and positive cash flow. At a minimum, the team tries to avoid companies that have so much debt that management may be unable to make decisions that would be in the best interest of the companies’ shareholders.
Attractive business economics. The team favors cash-producing businesses that it believes are capable of earning acceptable returns on capital over the company’s business cycle.
PERFORMANCE HISTORY
GROWTH OF AN ASSUMED $10,000 INVESTMENT (3/27/2006 to 9/30/2011)
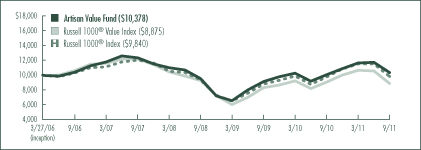
AVERAGE ANNUAL TOTAL RETURNS (as of 9/30/2011)
| | | | | | | | | | | | | | | | |
| Fund / Index | | 1-Year | | | 3-Year | | | 5-Year | | | Since
Inception | |
Artisan Value Fund | | | 3.10 | % | | | 2.90 | % | | | -0.06 | % | | | 0.68 | % |
Russell 1000® Value Index | | | -1.89 | | | | -1.52 | | | | -3.53 | | | | -2.14 | |
Russell 1000® Index | | | 0.91 | | | | 1.61 | | | | -0.91 | | | | -0.29 | |
The performance quoted represents past performance, which does not guarantee future results. The investment return and principal value of an investment in the Fund will fluctuate, so that an investor’s shares in the Fund, when redeemed, may be worth more or less than their original cost. Current performance may be lower or higher than the performance data quoted. For current to most recent month-end performance information, visit www.artisanfunds.com or call 800.344.1770. The graph and table above do not reflect the deduction of taxes that a shareholder would pay on distributions or sale of Fund shares. See page 113 for a description of each index.
22
INVESTING ENVIRONMENT
The one-year period ended September 30, 2011 began strongly, with equities turning in solid gains through the first nine months buoyed by steady corporate profits. Equities fell sharply in the final three months of the period due to a variety of macroeconomic concerns, including the stability of the European banking system owing to sovereign debt exposures and slowing economic growth in the U.S. and around the world.
SECTOR DIVERSIFICATION
| | | | | | | | |
| Sector | | 9/30/10 | | | 9/30/11 | |
Consumer Discretionary | | | — | % | | | 9.1 | % |
Consumer Staples | | | 4.6 | | | | 10.3 | |
Energy | | | 12.8 | | | | 10.8 | |
Financials | | | 23.5 | | | | 27.4 | |
Healthcare | | | 14.5 | | | | 2.9 | |
Industrials | | | 8.2 | | | | 2.6 | |
Information Technology | | | 34.0 | | | | 34.4 | |
Other assets less liabilities | | | 2.4 | | | | 2.5 | |
Total | | | 100.0 | % | | | 100.0 | % |
As a percentage of total net assets.
PERFORMANCE DISCUSSION
During the twelve-month period ended September 30, 2011, Artisan Value Fund returned 3.10%, outperforming the Russell 1000® Value and Russell 1000® indices which returned -1.89% and 0.91%, respectively, over the same period.
Performance of the following stocks had a positive impact on the portfolio during the period: National Semiconductor Corporation, a semiconductor manufacturer; Exxon Mobil Corporation, an integrated oil and gas company; Nabors Industries Ltd., a land-based drilling contractor; Accenture plc, a consulting services provider; and International Business Machines Corporation, an information technology company.
Notable detractors included: Hewlett-Packard Company, a diversified technology company; Cisco Systems, Inc., a communications networking solutions provider; Cimarex Energy Co., an independent oil and gas exploration and production company; and diversified financial services firms The Bank of New York Mellon Corporation and The Goldman Sachs Group, Inc.
REGION ALLOCATION
| | | | | | | | |
| Region | | 9/30/10 | | | 9/30/11 | |
Americas | | | 97.6 | % | | | 91.8 | % |
Europe | | | — | | | | 5.7 | |
As a percentage of total net assets.
FUND CHANGES
We identified several new investment opportunities for the portfolio during the period, including previously mentioned Cisco Systems, Inc., in addition to Apple Inc., a consumer electronics company; Avnet, Inc., a global distributor of electronic components and computer products; and retailers Target Corporation and Tesco plc. We funded these purchases in part by selling our positions in previously mentioned International Business Machines Corporation and Accenture plc, in addition to Baxter International Inc., Pfizer Inc. and Johnson & Johnson.
23
ARTISAN GLOBAL EQUITY FUND
Schedule of Investments – September 30, 2011
Dollar values in thousands
| | | | | | | | |
| | | Shares
Held | | | Value | |
| | | | | | | | |
COMMON AND
PREFERRED STOCKS - 96.5% | | | | | | | | |
| | | | | | | | |
| BELGIUM - 1.9% | | | | | | | | |
Anheuser-Busch InBev NV(1) | | | 3,963 | | | $ | 210 | |
| | | | | | | | |
| BRAZIL - 2.0% | | | | | | | | |
Banco Daycoval SA, Preferred(2) | | | 20,700 | | | | 94 | |
Fleury SA | | | 10,300 | | | | 123 | |
| | | | | | | | |
| | | | | | | 217 | |
| CANADA - 1.1% | | | | | | | | |
Canadian National Railway Company | | | 1,798 | | | | 120 | |
| | | | | | | | |
| DENMARK - 1.1% | | | | | | | | |
Novo Nordisk A/S, Class B(1) | | | 1,195 | | | | 119 | |
| | | | | | | | |
| FRANCE - 9.6% | | | | | | | | |
Air Liquide SA(1) | | | 1,202 | | | | 141 | |
Christian Dior SA(1) | | | 1,112 | | | | 124 | |
DANONE S.A.(1) | | | 4,306 | | | | 265 | |
Ipsos(1) | | | 4,177 | | | | 135 | |
Pernod Ricard SA(1) | | | 1,825 | | | | 143 | |
Schneider Electric SA(1) | | | 4,406 | | | | 237 | |
| | | | | | | | |
| | | | | | | 1,045 | |
| GERMANY - 4.0% | | | | | | | | |
Bayer AG(1) | | | 2,249 | | | | 124 | |
Henkel AG & Co.(1) | | | 3,585 | | | | 157 | |
Linde AG(1) | | | 1,135 | | | | 151 | |
| | | | | | | | |
| | | | | | | 432 | |
| HONG KONG - 6.0% | | | | | | | | |
AIA Group Ltd.(1) | | | 83,195 | | | | 236 | |
Dairy Farm International Holdings Limited(1) | | | 8,900 | | | | 76 | |
Samsonite International SA(1)(3) | | | 79,360 | | | | 111 | |
Sands China Ltd.(1)(3) | | | 99,610 | | | | 229 | |
| | | | | | | | |
| | | | | | | 652 | |
| INDIA - 2.6% | | | | | | | | |
Housing Development Finance Corporation Ltd.(1) | | | 22,165 | | | | 287 | |
| | | | | | | | |
| JAPAN - 5.7% | | | | | | | | |
CANON INC.(1) | | | 2,800 | | | | 127 | |
INPEX CORPORATION(1) | | | 28 | | | | 173 | |
Kao Corporation(1) | | | 5,800 | | | | 161 | |
LAWSON, INC.(1) | | | 2,800 | | | | 158 | |
| | | | | | | | |
| | | | | | | 619 | |
| | | | | | | | |
| KOREA - 1.1% | | | | | | | | |
Samsung Electronics Co., Ltd.(1) | | | 179 | | | $ | 125 | |
| | | | | | | | |
| NETHERLANDS - 3.6% | | | | | | | | |
Akzo Nobel N.V.(1) | | | 3,862 | | | | 171 | |
Unilever NV (DR)(1) | | | 7,201 | | | | 228 | |
| | | | | | | | |
| | | | | | | 399 | |
| PERU - 1.1% | | | | | | | | |
Credicorp Ltd. | | | 1,327 | | | | 122 | |
| | | | | | | | |
| PHILIPPINES - 1.6% | | | | | | | | |
Alliance Global Group, Inc.(1) | | | 618,830 | | | | 131 | |
Puregold Price Club, Inc.(1)(3)(4) | | | 150,000 | | | | 43 | |
| | | | | | | | |
| | | | | | | 174 | |
| RUSSIA - 1.0% | | | | | | | | |
Gazprom (DR)(1) | | | 10,985 | | | | 105 | |
| | | | | | | | |
| SWITZERLAND - 8.1% | | | | | | | | |
Givaudan SA(1) | | | 186 | | | | 145 | |
| Julius Baer Group Ltd.(1) | | | 3,451 | | | | 115 | |
Nestle SA(1) | | | 6,516 | | | | 358 | |
Sonova Holding AG(1) | | | 1,324 | | | | 119 | |
Swatch Group AG - Bearer Shares(1) | | | 436 | | | | 143 | |
| | | | | | | | |
| | | | | | | 880 | |
| UNITED KINGDOM - 10.4% | | | | | | | | |
Experian PLC(1) | | | 9,849 | | | | 111 | |
GlaxoSmithKline PLC(1) | | | 7,260 | | | | 150 | |
HSBC Holdings plc(1) | | | 21,865 | | | | 167 | |
Petrofac Limited(1) | | | 5,224 | | | | 97 | |
Prudential plc(1) | | | 15,025 | | | | 129 | |
Standard Chartered plc(1) | | | 4,841 | | | | 97 | |
Vodafone Group Plc(1) | | | 75,325 | | | | 194 | |
WPP plc(1) | | | 20,676 | | | | 191 | |
| | | | | | | | |
| | | | | | | 1,136 | |
| UNITED STATES - 35.6% | | | | | | | | |
3M Company | | | 2,334 | | | | 168 | |
Abercrombie & Fitch Co. | | | 2,933 | | | | 181 | |
Accenture plc, Class A | | | 2,578 | | | | 136 | |
Allergan, Inc. | | | 1,746 | | | | 144 | |
American Express Company | | | 4,033 | | | | 181 | |
Apple Inc.(3) | | | 431 | | | | 164 | |
CME Group Inc., Class A | | | 645 | | | | 159 | |
The Coca-Cola Company | | | 3,323 | | | | 224 | |
Colgate-Palmolive Company | | | 1,561 | | | | 138 | |
24
| | | | | | | | |
| | | Shares
Held | | | Value | |
| | | | | | | | |
| UNITED STATES (CONTINUED) | | | | | | | | |
The Dun & Bradstreet Corporation | | | 2,826 | | | $ | 173 | |
EMC Corporation(3) | | | 10,678 | | | | 224 | |
Google Inc., Class A(3) | | | 567 | | | | 292 | |
Halliburton Company | | | 4,478 | | | | 137 | |
MasterCard Incorporated, Class A | | | 387 | | | | 123 | |
McDonald’s Corporation | | | 2,306 | | | | 202 | |
Movado Group, Inc. | | | 12,585 | | | | 153 | |
Oracle Corporation | | | 6,656 | | | | 191 | |
The Procter & Gamble Company | | | 3,505 | | | | 221 | |
Thermo Fisher Scientific Inc.(3) | | | 3,234 | | | | 164 | |
United Technologies Corporation | | | 1,926 | | | | 135 | |
The Walt Disney Company | | | 5,851 | | | | 176 | |
YUM! Brands, Inc. | | | 3,943 | | | | 195 | |
| | | | | | | | |
| | | | | | | 3,881 | |
| | | | | | | | |
Total common and preferred stocks
(Cost $10,986) | | | | | | | 10,523 | |
| | |
| | | Par
Amount | | | | |
| SHORT-TERM INVESTMENTS (CASH EQUIVALENTS) - 4.9% | | | | | | | | |
Repurchase agreement with Fixed Income Clearing Corporation, 0.01%, dated 9/30/11, due 10/3/11, maturity value $541
(Cost $541)(5) | | $ | 541 | | | $ | 541 | |
| | | | | | | | |
| | | | | | | | |
Total investments - 101.4%
(Cost $11,527) | | | | | | | 11,064 | |
| | | | | | | | |
Other assets less liabilities - (1.4%) | | | | | | | (156 | ) |
| | | | | | | | |
| | | | | | | | |
Total net assets - 100.0%(6) | | | | | | $ | 10,908 | |
| | | | | | | | |
| (1) | Valued at a fair value in accordance with procedures established by the board of directors of Artisan Funds. In total, securities valued at a fair value were $6,183 or 56.7% of total net assets. See notes 2(a) and 2(b) in Notes to Financial Statements for additional information. |
| (3) | Non-income producing security. |
| (4) | Security has been determined to be illiquid under procedures established by the board of directors of Artisan Funds. In total, the value of securities determined to be illiquid were $43, or 0.4% of total net assets. |
| | | | | | | | | | | | |
Issuer | | Rate | | | Maturity | | | Value | |
U.S. Treasury Bond | | | 4.625 | % | | | 2/15/2040 | | | $ | 557 | |
| (6) | Percentages for the various classifications relate to total net assets. |
Company names are as reported by a data service provider and in some cases are translations; a company’s legal name may be different.
(DR) Depositary Receipt, voting rights may vary.
| | | | | | | | | | | | | | | | | | | | |
| FOREIGN CURRENCY FORWARD CONTRACTS | |
Dollar values in thousands | |
Description | | Counterparty | | Trans-
action
Type | | Settlement
Date | | | Cost on
Origination
Date | | | Value | | | Unrealized
Appreciation
(Depreciation) | |
| Japanese Yen | | State Street Bank and Trust Company | | Buy | | | 11/17/2011 | | | $ | (173 | ) | | $ | (172 | ) | | $ | (1 | ) |
| Japanese Yen | | State Street Bank and Trust Company | | Sell | | | 11/17/2011 | | | | 173 | | | | 172 | | | | 1 | |
| | | | | | | | | | | | | | | | | | | | |
| | | | | | | | | | $ | - | | | $ | - | | | $ | - | |
| | | | | | | | | | | | | | | | | | | | |
| | | | | | | | |
| PORTFOLIO DIVERSIFICATION - September 30, 2011 | |
Dollar values in thousands | |
| | | Value | | | Percentage
of Total
Net Assets | |
Consumer Discretionary | | $ | 1,840 | | | | 16.9 | % |
Consumer Staples | | | 2,382 | | | | 21.8 | |
Energy | | | 512 | | | | 4.7 | |
Financials | | | 1,587 | | | | 14.5 | |
Healthcare | | | 943 | | | | 8.6 | |
Industrials | | | 1,075 | | | | 9.9 | |
Information Technology | | | 1,382 | | | | 12.7 | |
Materials | | | 608 | | | | 5.6 | |
Telecommunication Services | | | 194 | | | | 1.8 | |
| | | | | | | | |
Total common and preferred stocks | | | 10,523 | | | | 96.5 | |
Short-term investments | | | 541 | | | | 4.9 | |
| | | | | | | | |
Total investments | | | 11,064 | | | | 101.4 | |
Other assets less liabilities | | | (156 | ) | | | (1.4 | ) |
| | | | | | | | |
Total net assets | | $ | 10,908 | | | | 100.0 | % |
| | | | | | | | |
| | | | | | | | |
| CURRENCY EXPOSURE - September 30, 2011 | |
Dollar values in thousands | |
| | | Value | | | Percentage
of Total
Investments | |
Brazilian real | | $ | 217 | | | | 2.0 | % |
British pound | | | 1,136 | | | | 10.3 | |
Canadian dollar | | | 120 | | | | 1.1 | |
Danish krone | | | 119 | | | | 1.1 | |
Euro | | | 2,086 | | | | 18.8 | |
Hong Kong dollar | | | 576 | | | | 5.2 | |
Indian rupee | | | 287 | | | | 2.6 | |
Japanese yen | | | 619 | | | | 5.6 | |
Korean won | | | 125 | | | | 1.1 | |
Philippine peso | | | 174 | | | | 1.6 | |
Swiss franc | | | 880 | | | | 7.9 | |
U.S. dollar | | | 4,725 | | | | 42.7 | |
| | | | | | | | |
Total investments | | $ | 11,064 | | | | 100.0 | % |
| | | | | | | | |
25
| | | | | | |
| TOP TEN HOLDINGS - September 30, 2011 | |
Company Name | | Country | | Percentage
of Total
Net Assets | |
Nestle SA | | Switzerland | | | 3.3 | % |
Google Inc. | | United States | | | 2.7 | |
Housing Development Finance Corporation Ltd. | | India | | | 2.6 | |
DANONE S.A. | | France | | | 2.4 | |
Schneider Electric SA | | France | | | 2.2 | |
AIA Group Ltd. | | Hong Kong | | | 2.2 | |
Sands China Ltd. | | Hong Kong | | | 2.1 | |
Unilever NV | | Netherlands | | | 2.1 | |
The Coca-Cola Company | | United States | | | 2.1 | |
EMC Corporation | | United States | | | 2.1 | |
| | | | | | |
Total | | | | | 23.8 | % |
| | | | | | |
For the purpose of determining the Fund’s top ten holdings, securities of the same issuer are aggregated to determine the weight in the Fund.
The accompanying notes are an integral part of the financial statements.
26
ARTISAN GLOBAL VALUE FUND
Schedule of Investments – September 30, 2011
Dollar values in thousands
| | | | | | | | |
| | | Shares
Held | | | Value | |
| | | | | | | | |
| COMMON STOCKS - 94.6% | | | | | | | | |
| | | | | | | | |
| BELGIUM - 1.6% | | | | | | | | |
Groupe Bruxelles Lambert S.A.(1) | | | 15,408 | | | $ | 1,084 | |
| | | | | | | | |
| FRANCE - 4.5% | | | | | | | | |
Publicis Groupe(1) | | | 37,482 | | | | 1,569 | |
Total SA(1) | | | 31,325 | | | | 1,381 | |
| | | | | | | | |
| | | | | | | 2,950 | |
| GERMANY - 1.7% | | | | | | | | |
HeidelbergCement AG(1) | | | 30,482 | | | | 1,102 | |
| | | | | | | | |
| HONG KONG - 0.8% | | | | | | | | |
Guoco Group Limited(1) | | | 56,673 | | | | 513 | |
| | | | | | | | |
| IRELAND - 1.1% | | | | | | | | |
Ryanair Holdings PLC, Equity-Linked Security, 144A(1)(2)(3)(4)(5) | | | 167,027 | | | | 739 | |
| | | | | | | | |
| JAPAN - 7.0% | | | | | | | | |
Credit Saison Co., Ltd.(1) | | | 64,400 | | | | 1,239 | |
Daiwa Securities Group Inc.(1) | | | 119,016 | | | | 444 | |
Kao Corporation(1) | | | 54,200 | | | | 1,508 | |
Mitsubishi UFJ Financial Group, Inc.(1) | | | 131,228 | | | | 590 | |
SANKYO CO., LTD.(1) | | | 13,048 | | | | 704 | |
Stanley Electric Co., Ltd.(1) | | | 9,700 | | | | 146 | |
| | | | | | | | |
| | | | | | | 4,631 | |
| NETHERLANDS - 2.5% | | | | | | | | |
ING Groep N.V.(1)(2) | | | 115,105 | | | | 810 | |
Koninklijke Philips Electronics N.V.(1) | | | 45,857 | | | | 821 | |
| | | | | | | | |
| | | | | | | 1,631 | |
| SWITZERLAND - 7.2% | | | | | | | | |
Adecco SA(1) | | | 24,186 | | | | 948 | |
Novartis AG(1) | | | 36,608 | | | | 2,043 | |
Panalpina Welttransport Holding AG(1)(2) | | | 12,135 | | | | 1,033 | |
Pargesa Holding SA - Bearer Shares(1) | | | 10,203 | | | | 697 | |
| | | | | | | | |
| | | | | | | 4,721 | |
| UNITED KINGDOM - 14.0% | | | | | | | | |
BAE Systems plc(1) | | | 74,494 | | | | 307 | |
Compass Group PLC(1) | | | 336,436 | | | | 2,721 | |
Diageo plc(1) | | | 112,845 | | | | 2,147 | |
Experian PLC(1) | | | 77,733 | | | | 874 | |
Lloyds Banking Group plc(1)(2) | | | 1,696,008 | | | | 899 | |
Unilever PLC (DR) | | | 71,182 | | | | 2,220 | |
| | | | | | | | |
| | | | | | | 9,168 | |
| | | | | | | | |
| UNITED STATES - 54.2% | | | | | | | | |
3M Company | | | 27,037 | | | $ | 1,941 | |
Accenture plc, Class A | | | 12,436 | | | | 655 | |
American Express Company | | | 38,857 | | | | 1,745 | |
Arch Capital Group Ltd.(2)(6) | | | 78,490 | | | | 2,565 | |
The Bank of New York Mellon Corporation | | | 105,516 | | | | 1,962 | |
Becton, Dickinson and Company | | | 11,150 | | | | 818 | |
The Chubb Corporation | | | 36,234 | | | | 2,174 | |
Cisco Systems, Inc. | | | 47,940 | | | | 743 | |
CVS Caremark Corporation | | | 21,347 | | | | 717 | |
Fidelity National Financial, Inc. | | | 43,669 | | | | 663 | |
Google Inc., Class A(2) | | | 4,295 | | | | 2,209 | |
Johnson & Johnson | | | 36,944 | | | | 2,354 | |
Lockheed Martin Corporation | | | 15,402 | | | | 1,119 | |
Lowe’s Companies, Inc. | | | 72,655 | | | | 1,405 | |
Marsh & McLennan Companies, Inc. | | | 84,366 | | | | 2,239 | |
MasterCard Incorporated, Class A | | | 9,719 | | | | 3,082 | |
Mohawk Industries, Inc.(2) | | | 26,416 | | | | 1,133 | |
Signet Jewelers Ltd.(2) | | | 65,252 | | | | 2,206 | |
Target Corporation | | | 29,995 | | | | 1,471 | |
TE Connectivity Ltd. | | | 82,993 | | | | 2,335 | |
Wal-Mart Stores, Inc. | | | 39,908 | | | | 2,071 | |
| | | | | | | | |
| | | | | | | 35,607 | |
| | | | | | | | |
Total common stocks
(Cost $60,555) | | | | | | | 62,146 | |
| | |
| | | Par
Amount | | | | |
SHORT-TERM INVESTMENTS
(CASH EQUIVALENTS) - 7.0% | | | | | |
Repurchase agreement with Fixed Income Clearing Corporation, 0.01%, dated 9/30/11, due 10/3/11, maturity value $4,589
(Cost $4,589)(7) | | $ | 4,589 | | | $ | 4,589 | |
| | | | | | | | |
| | | | | | | | |
Total investments - 101.6%
(Cost $65,144) | | | | | | | 66,735 | |
| | | | | | | | |
Other assets less liabilities - (1.6%) | | | | | | | (1,069 | ) |
| | | | | | | | |
| | | | | | | | |
Total net assets - 100.0%(8) | | | | | | $ | 65,666 | |
| | | | | | | | |
27
| (1) | Valued at a fair value in accordance with procedures established by the board of directors of Artisan Funds. In total, securities valued at a fair value were $24,319 or 37.0% of total net assets. See notes 2(a) and 2(b) in Notes to Financial Statements for additional information. |
| (2) | Non-income producing security. |
| (4) | Security is an equity-linked participation certificate issued by HSBC Bank plc. As described in Note 2(i) in Notes to Financial Statements, equity-linked participation certificates are subject to counterparty risk with respect to the bank or broker-dealer that issues them. |
| (5) | Security is restricted. Ryanair Holdings PLC was acquired in a transaction under Rule 144A of the Securities Act of 1933, as amended. The shares of Ryanair Holdings PLC may be resold in transactions exempt from registration to qualified institutional buyers. |
| | | | | | | | | | | | | | | | |
Security | | Acquisition Dates | | | Cost | | | Value | | | Percentage
of Total
Net Assets | |
Ryanair Holdings PLC | | | 8/26/09-9/22/11 | | | $ | 692 | | | $ | 739 | | | | 1.1 | % |
| (6) | Affiliated company as defined by the Investment Company Act of 1940, as amended. See Note (7) in Notes to Financial Statements. |
| | | | | | | | | | | | |
Issuer | | Rate | | | Maturity | | | Value | |
U.S. Treasury Bond | | | 4.625 | % | | | 2/15/2040 | | | $ | 4,682 | |
| (8) | Percentages for the various classifications relate to total net assets. |
Company names are as reported by a data service provider and in some cases are translations; a company’s legal name may be different.
(DR) Depositary Receipt, voting rights may vary.
| | | | | | | | | | | | | | | | | | | | |
| FOREIGN CURRENCY FORWARD CONTRACTS | |
Dollar values in thousands | |
Description | | Counterparty | | Trans-
action
Type | | Settlement
Date | | | Cost on
Origination
Date | | | Value | | | Unrealized
Appreciation | |
| Japanese Yen | | State Street Bank and Trust Company | | Sell | | | 11/17/2011 | | | $ | 3,350 | | | $ | 3,337 | | | $ | 13 | |
| Japanese Yen | | State Street Bank and Trust Company | | Sell | | | 11/17/2011 | | | | 208 | | | | 208 | | | | - | (1) |
| Japanese Yen | | State Street Bank and Trust Company | | Sell | | | 11/17/2011 | | | | 140 | | | | 138 | | | | 2 | |
| | | | | | | | | | | | | | | | | | | | |
| | | | | | | | | | $ | 3,698 | | | $ | 3,683 | | | $ | 15 | |
| | | | | | | | | | | | | | | | | | | | |
| (1) | Amount rounds to less than $1. |
| | | | | | | | |
| PORTFOLIO DIVERSIFICATION - September 30, 2011 | |
Dollar values in thousands | |
| | | Value | | | Percentage
of Total
Net Assets | |
Consumer Discretionary | | $ | 11,355 | | | | 17.3 | % |
Consumer Staples | | | 8,663 | | | | 13.2 | |
Energy | | | 1,381 | | | | 2.1 | |
Financials | | | 17,624 | | | | 26.8 | |
Healthcare | | | 5,215 | | | | 7.9 | |
Industrials | | | 7,782 | | | | 11.9 | |
Information Technology | | | 9,024 | | | | 13.7 | |
Materials | | | 1,102 | | | | 1.7 | |
| | | | | | | | |
Total common stocks | | | 62,146 | | | | 94.6 | |
Short-term investments | | | 4,589 | | | | 7.0 | |
| | | | | | | | |
Total investments | | | 66,735 | | | | 101.6 | |
Other assets less liabilities | | | (1,069 | ) | | | (1.6 | ) |
| | | | | | | | |
Total net assets | | $ | 65,666 | | | | 100.0 | % |
| | | | | | | | |
| | | | | | | | |
| CURRENCY EXPOSURE - September 30, 2011 | |
Dollar values in thousands | |
| | | Value | | | Percentage
of Total
Investments | |
British pound | | $ | 6,948 | | | | 10.4 | % |
Euro | | | 7,506 | | | | 11.2 | |
Hong Kong dollar | | | 513 | | | | 0.8 | |
Japanese yen | | | 4,631 | | | | 6.9 | |
Swiss franc | | | 4,721 | | | | 7.1 | |
U.S. dollar | | | 42,416 | | | | 63.6 | |
| | | | | | | | |
Total investments | | $ | 66,735 | | | | 100.0 | % |
| | | | | | | | |
| | | | | | |
| TOP TEN HOLDINGS - September 30, 2011 | |
Company Name | | Country | | Percentage
of Total
Net Assets | |
MasterCard Incorporated | | United States | | | 4.7 | % |
Compass Group PLC | | United Kingdom | | | 4.1 | |
Arch Capital Group Ltd. | | United States | | | 3.9 | |
Johnson & Johnson | | United States | | | 3.6 | |
TE Connectivity Ltd | | United States | | | 3.6 | |
Marsh & McLennan Companies, Inc. | | United States | | | 3.4 | |
Unilever PLC | | United Kingdom | | | 3.4 | |
Google Inc. | | United States | | | 3.4 | |
Signet Jewelers Ltd. | | United States | | | 3.4 | |
The Chubb Corporation | | United States | | | 3.3 | |
| | | | | | |
Total | | | | | 36.8 | % |
| | | | | | |
For the purpose of determining the Fund’s top ten holdings, securities of the same issuer are aggregated to determine the weight in the Fund.
The accompanying notes are an integral part of the financial statements.
28
ARTISAN GROWTH OPPORTUNITIES FUND
Schedule of Investments – September 30, 2011
Dollar values in thousands
| | | | | | | | |
| | | Shares
Held | | | Value | |
| | | | | | | | |
| COMMON STOCKS - 92.0% | | | | | | | | |
| | | | | | | | |
| BRAZIL - 6.3% | | | | | | | | |
Anhanguera Educacional Participacoes SA | | | 101,900 | | | $ | 1,312 | |
BR Malls Participacoes | | | 122,500 | | | | 1,252 | |
Mills Estruturas e Servicos de Engenharia SA | | | 375,550 | | | | 3,855 | |
OdontoPrev SA | | | 231,550 | | | | 3,422 | |
| | | | | | | | |
| | | | | | | 9,841 | |
| CANADA - 0.7% | | | | | | | | |
Tourmaline Oil Corp.(1) | | | 39,900 | | | | 1,173 | |
| | | | | | | | |
| CHINA - 5.9% | | | | | | | | |
Baidu, Inc., Class A (DR)(1) | | | 33,100 | | | | 3,539 | |
Ctrip.com International, Ltd. (DR)(1) | | | 61,602 | | | | 1,981 | |
Shandong Weigao Group Medical Polymer Company Limited, H Shares(2) | | | 1,777,900 | | | | 1,986 | |
Tsingtao Brewery Company Limited, H Shares(2) | | | 300,800 | | | | 1,625 | |
| | | | | | | | |
| | | | | | | 9,131 | |
| HONG KONG - 1.3% | | | | | | | | |
Wynn Macau Limited(2) | | | 856,269 | | | | 1,968 | |
| | | | | | | | |
| INDIA - 3.2% | | | | | | | | |
HDFC Bank Limited (DR) | | | 96,900 | | | | 2,825 | |
Jubilant Foodworks Limited(1)(2) | | | 132,325 | | | | 2,139 | |
| | | | | | | | |
| | | | | | | 4,964 | |
| JAPAN - 1.9% | | | | | | | | |
FANUC CORP.(2) | | | 21,200 | | | | 2,919 | |
| | | | | | | | |
| SWEDEN - 3.4% | | | | | | | | |
Hexagon AB, Class B(2) | | | 222,645 | | | | 2,898 | |
Telefonaktiebolaget LM Ericsson (DR), Class B | | | 253,500 | | | | 2,421 | |
| | | | | | | | |
| | | | | | | 5,319 | |
| SWITZERLAND - 1.7% | | | | | | | | |
Compagnie Financiere Richemont SA - Bearer Shares(2) | | | 59,350 | | | | 2,635 | |
| | | | | | | | |
| TURKEY - 1.8% | | | | | | | | |
Coca-Cola Icecek AS(2) | | | 209,367 | | | | 2,843 | |
| | | | | | | | |
| UNITED KINGDOM - 4.5% | | | | | | | | |
ARM Holdings PLC(2) | | | 272,250 | | | | 2,330 | |
Rotork plc(2) | | | 123,600 | | | | 2,975 | |
The Weir Group PLC(2) | | | 73,000 | | | | 1,749 | |
| | | | | | | | |
| | | | | | | 7,054 | |
| | | | | | | | |
| UNITED STATES - 61.3% | | | | | | | | |
Agilent Technologies, Inc.(1) | | | 130,613 | | | $ | 4,082 | |
Allergan, Inc. | | | 83,225 | | | | 6,856 | |
Apple Inc.(1) | | | 20,975 | | | | 7,995 | |
Baker Hughes Incorporated | | | 60,800 | | | | 2,807 | |
Biogen Idec Inc.(1) | | | 31,000 | | | | 2,888 | |
Broadcom Corporation, Class A | | | 105,300 | | | | 3,505 | |
Cerner Corporation(1) | | | 72,058 | | | | 4,937 | |
Citrix Systems, Inc.(1) | | | 62,050 | | | | 3,384 | |
Discover Financial Services | | | 189,800 | | | | 4,354 | |
eBay Inc.(1) | | | 57,600 | | | | 1,699 | |
EMC Corporation(1) | | | 268,700 | | | | 5,640 | |
Google Inc., Class A(1) | | | 13,520 | | | | 6,954 | |
IHS Inc.(1) | | | 72,400 | | | | 5,416 | |
Monsanto Company | | | 105,000 | | | | 6,304 | |
National Oilwell Varco, Inc. | | | 70,750 | | | | 3,624 | |
Occidental Petroleum Corporation | | | 40,450 | | | | 2,892 | |
Polo Ralph Lauren Corporation, Class A | | | 30,050 | | | | 3,897 | |
Precision Castparts Corp. | | | 25,375 | | | | 3,945 | |
Regeneron Pharmaceuticals, Inc.(1) | | | 72,300 | | | | 4,208 | |
salesforce.com, inc.(1) | | | 16,300 | | | | 1,863 | |
Starbucks Corporation | | | 179,202 | | | | 6,682 | |
Teradata Corporation(1) | | | 28,400 | | | | 1,520 | |
| | | | | | | | |
| | | | | | | 95,452 | |
| | | | | | | | |
Total common stocks
(Cost $140,466) | | | | | | | 143,299 | |
| | |
| | | Par
Amount | | | | |
SHORT-TERM INVESTMENTS
(CASH EQUIVALENTS) - 6.6% | | | | | | | | |
Repurchase agreement with Fixed Income Clearing Corporation, 0.01%, dated 9/30/11, due 10/3/11, maturity value $10,298
(Cost $10,298)(3) | | $ | 10,298 | | | $ | 10,298 | |
| | | | | | | | |
| | | | | | | | |
Total investments - 98.6%
(Cost $150,764) | | | | | | | 153,597 | |
| | | | | | | | |
Other assets less liabilities - 1.4% | | | | | | | 2,130 | |
| | | | | | | | |
| | | | | | | | |
Total net assets - 100.0%(4) | | | | | | $ | 155,727 | |
| | | | | | | | |
29
| (1) | Non-income producing security. |
| (2) | Valued at a fair value in accordance with procedures established by the board of directors of Artisan Funds. In total, securities valued at a fair value were $26,067 or 16.7% of total net assets. See notes 2(a) and 2(b) in Notes to Financial Statements for additional information. |
| | | | | | | | | | | | |
Issuer | | Rate | | | Maturity | | | Value | |
U.S. Treasury Bond | | | 4.625 | % | | | 2/15/2040 | | | $ | 10,504 | |
| (4) | Percentages for the various classifications relate to total net assets. |
Company names are as reported by a data service provider and in some cases are translations; a company’s legal name may be different.
(DR) Depositary Receipt, voting rights may vary.
| | | | | | | | | | | | | | | | | | | | |
| FOREIGN CURRENCY FORWARD CONTRACTS | |
Dollar values in thousands | |
Description | | Counterparty | | Trans-
action
Type | | Settlement
Date | | | Cost on
Origination
Date | | | Value | | | Unrealized
Appreciation | |
| Japanese Yen | | State Street Bank and Trust Company | | Sell | | | 11/17/2011 | | | $ | 1,350 | | | $ | 1,345 | | | $ | 5 | |
| | | | | | | | |
| PORTFOLIO DIVERSIFICATION - September 30, 2011 | |
Dollar values in thousands | |
| | | Value | | | Percentage
of Total
Net Assets | |
Consumer Discretionary | | $ | 20,614 | | | | 13.2 | % |
Consumer Staples | | | 4,468 | | | | 2.9 | |
Energy | | | 10,496 | | | | 6.7 | |
Financials | | | 8,431 | | | | 5.4 | |
Healthcare | | | 28,379 | | | | 18.2 | |
Industrials | | | 20,859 | | | | 13.4 | |
Information Technology | | | 43,748 | | | | 28.1 | |
Materials | | | 6,304 | | | | 4.1 | |
| | | | | | | | |
Total common stocks | | | 143,299 | | | | 92.0 | |
Short-term investments | | | 10,298 | | | | 6.6 | |
| | | | | | | | |
Total investments | | | 153,597 | | | | 98.6 | |
Other assets less liabilities | | | 2,130 | | | | 1.4 | |
| | | | | | | | |
Total net assets | | $ | 155,727 | | | | 100.0 | % |
| | | | | | | | |
| | | | | | | | |
| CURRENCY EXPOSURE - September 30, 2011 | |
Dollar values in thousands | |
| | | Value | | | Percentage
of Total
Investments | |
Brazilian real | | $ | 9,841 | | | | 6.4 | % |
British pound | | | 7,054 | | | | 4.6 | |
Canadian dollar | | | 1,173 | | | | 0.8 | |
Hong Kong dollar | | | 5,579 | | | | 3.6 | |
Indian rupee | | | 2,139 | | | | 1.4 | |
Japanese yen | | | 2,919 | | | | 1.9 | |
Swedish krona | | | 2,898 | | | | 1.9 | |
Swiss franc | | | 2,635 | | | | 1.7 | |
Turkish lira | | | 2,843 | | | | 1.8 | |
U.S. dollar | | | 116,516 | | | | 75.9 | |
| | | | | | | | |
Total investments | | $ | 153,597 | | | | 100.0 | % |
| | | | | | | | |
| | | | | | |
| TOP TEN HOLDINGS - September 30, 2011 | |
Company Name | | Country | | Percentage
of Total
Net Assets | |
Apple Inc. | | United States | | | 5.1 | % |
Google Inc. | | United States | | | 4.5 | |
Allergan, Inc. | | United States | | | 4.4 | |
Starbucks Corporation | | United States | | | 4.3 | |
Monsanto Company | | United States | | | 4.0 | |
EMC Corporation | | United States | | | 3.6 | |
IHS Inc. | | United States | | | 3.5 | |
Cerner Corporation | | United States | | | 3.2 | |
Discover Financial Services | | United States | | | 2.8 | |
Regeneron Pharmaceuticals, Inc. | | United States | | | 2.7 | |
| | | | | | |
Total | | | | | 38.1 | % |
| | | | | | |
For the purpose of determining the Fund’s top ten holdings, securities of the same issuer are aggregated to determine the weight in the Fund.
The accompanying notes are an integral part of the financial statements.
30
ARTISAN INTERNATIONAL FUND
Schedule of Investments – September 30, 2011
Dollar values in thousands
| | | | | | | | |
| | | Shares
Held | | | Value | |
| | | | | | | | |
| COMMON STOCKS - 96.4% | | | | | | | | |
| | | | | | | | |
| AUSTRALIA - 3.1% | | | | | | | | |
Asciano Ltd(1) | | | 49,436,719 | | | $ | 68,046 | |
Coca-Cola Amatil Limited(1) | | | 1,052,858 | | | | 12,047 | |
Foster’s Group Limited(1) | | | 25,432,636 | | | | 129,113 | |
Treasury Wine Estates(1) | | | 8,697,648 | | | | 32,163 | |
| | | | | | | | |
| | | | | | | 241,369 | |
| BELGIUM - 4.6% | | | | | | | | |
Anheuser-Busch InBev NV(1) | | | 6,845,441 | | | | 363,037 | |
| | | | | | | | |
| BRAZIL - 1.0% | | | | | | | | |
Petroleo Brasileiro S.A. (DR) | | | 3,455,548 | | | | 77,577 | |
| | | | | | | | |
| CANADA - 3.2% | | | | | | | | |
Canadian National Railway Company | | | 696,160 | | | | 46,350 | |
Canadian Pacific Railway Limited | | | 4,239,583 | | | | 203,882 | |
| | | | | | | | |
| | | | | | | 250,232 | |
| CHINA - 4.1% | | | | | | | | |
Baidu, Inc., Class A (DR)(2) | | | 1,967,771 | | | | 210,374 | |
Beijing Enterprises Holdings Ltd.(1) | | | 7,931,853 | | | | 39,691 | |
China Mobile Limited(1) | | | 1,648,500 | | | | 16,087 | |
China Resources Land Limited(1) | | | 34,262,700 | | | | 35,959 | |
MGM China Holdings Ltd.(1)(2) | | | 16,200,400 | | | | 20,981 | |
| | | | | | | | |
| | | | | | | 323,092 | |
| FRANCE - 11.1% | | | | | | | | |
Air Liquide SA(1) | | | 396,988 | | | | 46,423 | |
BNP Paribas(1) | | | 1,669,512 | | | | 66,083 | |
DANONE S.A.(1) | | | 1,934,859 | | | | 119,074 | |
LVMH Moet Hennessy Louis Vuitton SA(1) | | | 348,730 | | | | 46,244 | |
Pernod Ricard SA(1) | | | 2,346,610 | | | | 183,994 | |
Publicis Groupe(1) | | | 1,346,780 | | | | 56,385 | |
Schneider Electric SA(1) | | | 1,779,804 | | | | 95,822 | |
Societe Generale(1) | | | 63,234 | | | | 1,657 | |
Technip SA(1) | | | 192,686 | | | | 15,420 | |
Unibail-Rodamco(1) | | | 894,650 | | | | 159,446 | |
Vinci SA(1) | | | 1,801,612 | | | | 77,360 | |
| | | | | | | | |
| | | | | | | 867,908 | |
| GERMANY - 10.8% | | | | | | | | |
BASF AG(1) | | | 462,331 | | | | 28,052 | |
Bayer AG(1) | | | 2,786,103 | | | | 153,113 | |
Beiersdorf AG(1) | | | 1,540,904 | | | | 82,520 | |
Brenntag AG(1) | | | 974,859 | | | | 84,769 | |
Daimler AG(1) | | | 2,512,796 | | | | 111,303 | |
| | | | | | | | |
| GERMANY (CONTINUED) | | | | | | | | |
Linde AG(1) | | | 2,176,886 | | | $ | 290,337 | |
Siemens AG(1) | | | 1,018,573 | | | | 92,020 | |
| | | | | | | | |
| | | | | | | 842,114 | |
| HONG KONG - 15.3% | | | | | | | | |
AIA Group Ltd.(1) | | | 76,791,700 | | | | 218,325 | |
BOC Hong Kong (Holdings) Limited(1) | | | 17,464,450 | | | | 36,725 | |
Cheung Kong (Holdings) Limited(1) | | | 6,027,013 | | | | 64,520 | |
Galaxy Entertainment Group Limited(1)(2) | | | 18,992,324 | | | | 26,681 | |
Hang Seng Bank Limited(1) | | | 5,367,677 | | | | 62,899 | |
Henderson Land Development Company Limited(1) | | | 14,134,700 | | | | 62,793 | |
Hongkong Land Holdings Limited(1) | | | 10,162,926 | | | | 44,994 | |
NWS Holdings Limited(1) | | | 35,434,846 | | | | 47,117 | |
Sands China Ltd.(1)(2) | | | 135,974,230 | | | | 312,739 | |
Sino Land Company Limited(1) | | | 71,510,690 | | | | 95,136 | |
Sun Hung Kai Properties Limited(1) | | | 7,827,400 | | | | 88,685 | |
Wynn Macau Limited(1) | | | 58,315,598 | | | | 134,007 | |
| | | | | | | | |
| | | | | | | 1,194,621 | |
| INDIA - 1.1% | | | | | | | | |
Coal India Limited(1) | | | 1,912,534 | | | | 12,876 | |
Housing Development Finance Corporation Ltd.(1) | | | 5,598,354 | | | | 72,392 | |
| | | | | | | | |
| | | | | | | 85,268 | |
| ITALY - 0.9% | | | | | | | | |
Fiat Industrial SpA(1)(2) | | | 10,041,047 | | | | 74,870 | |
| | | | | | | | |
| JAPAN - 11.9% | | | | | | | | |
BRIDGESTONE CORPORATION(1) | | | 3,975,800 | | | | 90,149 | |
HONDA MOTOR CO., LTD.(1) | | | 6,737,200 | | | | 197,535 | |
JAPAN TOBACCO INC.(1) | | | 61,717 | | | | 287,939 | |
Kao Corporation(1) | | | 4,887,500 | | | | 135,953 | |
MITSUI & CO., LTD.(1) | | | 2,717,514 | | | | 39,333 | |
SOFTBANK Corp(1) | | | 6,169,400 | | | | 180,596 | |
| | | | | | | | |
| | | | | | | 931,505 | |
| KOREA - 0.9% | | | | | | | | |
NHN Corp.(1)(2) | | | 391,813 | | | | 73,868 | |
| | | | | | | | |
| NETHERLANDS - 5.4% | | | | | | | | |
Akzo Nobel N.V.(1) | | | 2,721,854 | | | | 120,327 | |
Koninklijke Vopak NV(1) | | | 558,508 | | | | 26,757 | |
Unilever NV (DR)(1) | | | 8,815,121 | | | | 279,210 | |
| | | | | | | | |
| | | | | | | 426,294 | |
31
| | | | | | | | |
| | | Shares
Held | | | Value | |
| | | | | | | | |
| NIGERIA - 0.0%(3) | | | | | | | | |
Nigerian Breweries Plc. | | | 165,343 | | | $ | 83 | |
| | | | | | | | |
| RUSSIA - 0.8% | | | | | | | | |
Gazprom (DR)(1) | | | 6,999,487 | | | | 66,953 | |
| | | | | | | | |
| SINGAPORE - 0.9% | | | | | | | | |
City Developments Limited(1) | | | 2,905,730 | | | | 21,093 | |
Genting Singapore PLC(1)(2) | | | 42,552,571 | | | | 49,451 | |
| | | | | | | | |
| | | | | | | 70,544 | |
| SWEDEN - 0.5% | | | | | | | | |
Sandvik AB(1) | | | 3,245,047 | | | | 37,276 | |
| | | | | | | | |
| SWITZERLAND - 8.9% | | | | | | | | |
Adecco SA(1) | | | 1,983,903 | | | | 77,795 | |
Compagnie Financiere Richemont SA - Bearer Shares(1) | | | 1,788,519 | | | | 79,394 | |
Givaudan SA(1) | | | 87,410 | | | | 68,287 | |
Nestle SA(1) | | | 5,495,819 | | | | 302,107 | |
Swatch Group AG - Bearer Shares(1) | | | 505,302 | | | | 165,596 | |
| | | | | | | | |
| | | | | | | 693,179 | |
| UNITED KINGDOM - 10.0% | | | | | | | | |
BG Group plc(1) | | | 1,985,494 | | | | 37,808 | |
GlaxoSmithKline PLC(1) | | | 1,004,473 | | | | 20,739 | |
Imperial Tobacco Group plc(1) | | | 4,759,812 | | | | 160,741 | |
Johnson Matthey PLC(1) | | | 1,532,331 | | | | 37,507 | |
Land Securities Group plc(1) | | | 5,196,611 | | | | 51,761 | |
Prudential plc(1) | | | 2,695,802 | | | | 23,074 | |
Reckitt Benckiser Group PLC(1) | | | 114,937 | | | | 5,866 | |
Royal Dutch Shell PLC, Class A(1) | | | 1,484,429 | | | | 45,834 | |
SABMiller plc(1) | | | 2,950,553 | | | | 95,899 | |
Standard Chartered plc(1) | | | 2,690,586 | | | | 53,702 | |
Tate & Lyle PLC(1) | | | 4,970,259 | | | | 48,084 | |
WPP plc(1) | | | 21,584,874 | | | | 199,059 | |
| | | | | | | | |
| | | | | | | 780,074 | |
| UNITED STATES - 1.9% | | | | | | | | |
Accenture plc, Class A | | | 1,144,077 | | | | 60,270 | |
Schlumberger Limited | | | 1,459,357 | | | | 87,167 | |
| | | | | | | | |
| | | | | | | 147,437 | |
| | | | | | | | |
Total common stocks
(Cost $7,850,584) | | | | | | | 7,547,301 | |
SHORT-TERM INVESTMENTS
(CASH EQUIVALENTS) - 3.2% | | | | | | | | |
Repurchase agreement with Fixed Income Clearing Corporation, 0.01%, dated 9/30/11, due 10/3/11, maturity value $128,934
(Cost $246,213)(4) | | $ | 246,213 | | | $ | 246,213 | |
| | | | | | | | |
| | | | | | | | |
Total investments - 99.6%
(Cost $8,096,797) | | | | | | | 7,793,514 | |
| | | | | | | | |
Other assets less liabilities - 0.4% | | | | | | | 32,894 | |
| | | | | | | | |
| | | | | | | | |
Total net assets - 100.0%(5) | | | | | | $ | 7,826,408 | |
| | | | | | | | |
| (1) | Valued at a fair value in accordance with procedures established by the board of directors of Artisan Funds. In total, securities valued at a fair value were $6,861,598 or 87.7% of total net assets. See notes 2(a) and 2(b) in Notes to Financial Statements for additional information. |
| (2) | Non-income producing security. |
| (3) | Represents less than 0.1% of total net assets. |
| | | | | | | | | | | | |
lssuer | | Rate | | | Maturity | | | Value | |
U.S. Treasury Bond | | | 4.625 | % | | | 2/15/2040 | | | $ | 251,141 | |
| (5) | Percentages for the various classifications relate to total net assets. |
Company names are as reported by a data service provider and in some cases are translations; a company’s legal name may be different.
(DR) Depositary Receipt, voting rights may vary.
| | | | | | | | |
| PORTFOLIO DIVERSIFICATION - September 30, 2011 | |
Dollar values in thousands | | | | | | | | |
| | | Value | | | Percentage
of Total
Net Assets | |
Consumer Discretionary | | $ | 1,489,524 | | | | 19.0 | % |
Consumer Staples | | | 2,237,830 | | | | 28.6 | |
Energy | | | 343,635 | | | | 4.4 | |
Financials | | | 1,159,244 | | | | 14.8 | |
Healthcare | | | 173,852 | | | | 2.2 | |
Industrials | | | 1,011,088 | | | | 12.9 | |
Information Technology | | | 344,512 | | | | 4.4 | |
Materials | | | 590,933 | | | | 7.6 | |
Telecommunication Services | | | 196,683 | | | | 2.5 | |
| | | | | | | | |
Total common stocks | | | 7,547,301 | | | | 96.4 | |
Short-term investments | | | 246,213 | | | | 3.2 | |
| | | | | | | | |
Total investments | | | 7,793,514 | | | | 99.6 | |
Other assets less liabilities | | | 32,894 | | | | 0.4 | |
| | | | | | | | |
Total net assets | | $ | 7,826,408 | | | | 100.0 | % |
| | | | | | | | |
32
| | | | | | | | |
| CURRENCY EXPOSURE - September 30, 2011 | |
Dollar values in thousands | | | | | | | | |
| | | Value | | | Percentage
of Total
Investments | |
Australian dollar | | $ | 241,369 | | | | 3.1 | % |
British pound | | | 734,240 | | | | 9.4 | |
Euro | | | 2,620,057 | | | | 33.6 | |
Hong Kong dollar | | | 1,262,345 | | | | 16.2 | |
Indian rupee | | | 85,268 | | | | 1.1 | |
Japanese yen | | | 931,505 | | | | 12.0 | |
Korean won | | | 73,868 | | | | 0.9 | |
Nigerian naira | | | 83 | | | | 0.0 | (1) |
Singapore dollar | | | 70,544 | | | | 0.9 | |
Swedish krona | | | 37,276 | | | | 0.5 | |
Swiss franc | | | 693,179 | | | | 8.9 | |
U.S. dollar | | | 1,043,780 | | | | 13.4 | |
| | | | | | | | |
Total investments | | $ | 7,793,514 | | | | 100.0 | % |
| | | | | | | | |
| (1) | Represents less than 0.1% of total investments. |
| | | | | | |
| TOP TEN HOLDINGS - September 30, 2011 | |
Company Name | | Country | | Percentage
of Total
Net Assets | |
Anheuser-Busch InBev NV | | Belgium | | | 4.6 | % |
Sands China Ltd. | | Hong Kong | | | 4.0 | |
Nestle SA | | Switzerland | | | 3.9 | |
Linde AG | | Germany | | | 3.7 | |
JAPAN TOBACCO INC. | | Japan | | | 3.7 | |
Unilever NV | | Netherlands | | | 3.6 | |
AIA Group Ltd. | | Hong Kong | | | 2.8 | |
Baidu, Inc. | | China | | | 2.7 | |
Canadian Pacific Railway Limited | | Canada | | | 2.6 | |
WPP plc | | United Kingdom | | | 2.5 | |
| | | | | | |
Total | | | | | 34.1 | % |
| | | | | | |
For the purpose of determining the Fund’s top ten holdings, securities of the same issuer are aggregated to determine the weight in the Fund.
The accompanying notes are an integral part of the financial statements.
33
ARTISAN INTERNATIONAL SMALL CAP FUND
Schedule of Investments – September 30, 2011
Dollar values in thousands
| | | | | | | | |
| | | Shares
Held | | | Value | |
| | | | | | | | |
| COMMON STOCKS - 91.6% | | | | | | | | |
| | | | | | | | |
| AUSTRALIA - 2.4% | | | | | | | | |
Domino’s Pizza Enterprises Limited(1) | | | 2,140,737 | | | $ | 13,532 | |
| | | | | | | | |
| AUSTRIA - 2.0% | | | | | | | | |
Flughafen Wien AG(1) | | | 255,756 | | | | 10,938 | |
| | | | | | | | |
| BRAZIL - 1.0% | | | | | | | | |
Arcos Dorados Holdings Inc., Class A | | | 50,936 | | | | 1,181 | |
M Dias Branco SA | | | 216,100 | | | | 4,293 | |
| | | | | | | | |
| | | | | | | 5,474 | |
| CHINA - 12.6% | | | | | | | | |
AMVIG Holdings Ltd(1) | | | 9,352,000 | | | | 5,273 | |
Beijing Enterprises Water Group Limited(1)(2) | | | 58,818,000 | | | | 10,628 | |
China Everbright International Limited(1) | | | 18,449,700 | | | | 4,216 | |
China Gas Holdings Ltd.(1) | | | 19,688,000 | | | | 4,837 | |
China Lodging Group Ltd. (DR)(2) | | | 359,774 | | | | 4,925 | |
Hengan International Group Company Limited(1) | | | 892,050 | | | | 7,046 | |
Hengdeli Holdings Limited(1) | | | 14,666,000 | | | | 4,962 | |
Intime Department Store Group Company Limited(1) | | | 11,321,300 | | | | 12,885 | |
New World Department Store China(1) | | | 8,219,000 | | | | 4,545 | |
Parkson Retail Group Ltd.(1) | | | 2,231,000 | | | | 2,637 | |
Yingde Gases(1) | | | 8,815,000 | | | | 8,000 | |
| | | | | | | | |
| | | | | | | 69,954 | |
| FRANCE - 8.8% | | | | | | | | |
Eurofins Scientific(1) | | | 133,063 | | | | 10,064 | |
Gemalto NV(1) | | | 120,799 | | | | 5,759 | |
Havas SA(1) | | | 880,344 | | | | 3,209 | |
Ipsos(1) | | | 503,298 | | | | 16,254 | |
Rubis(1) | | | 268,450 | | | | 13,533 | |
| | | | | | | | |
| | | | | | | 48,819 | |
| GERMANY - 18.1% | | | | | | | | |
Gerresheimer AG(1) | | | 330,840 | | | | 13,702 | |
GfK SE(1) | | | 549,047 | | | | 20,390 | |
Sixt AG(1) | | | 477,070 | | | | 8,996 | |
Wacker Neuson SE(1) | | | 1,398,421 | | | | 15,838 | |
Wirecard AG(1) | | | 2,686,168 | | | | 41,222 | |
| | | | | | | | |
| | | | | | | 100,148 | |
| HONG KONG - 6.1% | | | | | | | | |
Chow Sang Sang Holdings International Limited(1) | | | 2,249,800 | | | | 4,747 | |
| | | | | | | | |
| HONG KONG (CONTINUED) | | | | | | | | |
Galaxy Entertainment Group Limited(1)(2) | | | 1,403,000 | | | $ | 1,971 | |
Oriental Watch Holdings Limited(1) | | | 2,254,000 | | | | 1,032 | |
SJM Holdings Limited(1) | | | 12,749,000 | | | | 22,192 | |
Sun Hung Kai & Co. Limited(1) | | | 7,928,912 | | | | 3,952 | |
| | | | | | | | |
| | | | | | | 33,894 | |
| IRELAND - 1.7% | | | | | | | | |
Smurfit Kappa Group PLC(1)(2) | | | 1,557,927 | | | | 9,279 | |
| | | | | | | | |
| ITALY - 7.2% | | | | | | | | |
Davide Campari - Milano S.p.A.(1) | | | 3,568,180 | | | | 26,024 | |
Marr SpA(1) | | | 1,346,082 | | | | 13,923 | |
| | | | | | | | |
| | | | | | | 39,947 | |
| JAPAN - 2.9% | | | | | | | | |
AUTOBACS SEVEN CO., LTD.(1) | | | 211,700 | | | | 9,468 | |
NTN CORPORATION(1) | | | 1,451,000 | | | | 6,802 | |
| | | | | | | | |
| | | | | | | 16,270 | |
| KENYA - 0.1% | | | | | | | | |
East African Breweries Limited(1) | | | 336,800 | | | | 549 | |
| | | | | | | | |
| NETHERLANDS - 3.5% | | | | | | | | |
Imtech NV(1) | | | 692,996 | | | | 19,479 | |
| | | | | | | | |
| PHILIPPINES - 3.3% | | | | | | | | |
Alliance Global Group, Inc.(1) | | | 87,369,000 | | | | 18,471 | |
| | | | | | | | |
| RUSSIA - 3.1% | | | | | | | | |
Globaltrans Investment PLC (DR)(1) | | | 748,231 | | | | 10,117 | |
Pharmstandard(1)(2) | | | 56,781 | | | | 3,791 | |
TransContainer OAO (DR)(1) | | | 340,793 | | | | 3,230 | |
| | | | | | | | |
| | | | | | | 17,138 | |
| SINGAPORE - 5.5% | | | | | | | | |
City Developments Limited(1) | | | 675,972 | | | | 4,907 | |
Mandarin Oriental International Limited(1) | | | 3,557,000 | | | | 4,819 | |
Petra Foods Limited | | | 2,377,000 | | | | 3,181 | |
SIA Engineering Company(1) | | | 4,022,700 | | | | 11,647 | |
Super Group Ltd.(1) | | | 4,798,000 | | | | 5,719 | |
| | | | | | | | |
| | | | | | | 30,273 | |
| SWITZERLAND - 3.5% | | | | | | | | |
Bank Sarasin & Cie AG, B Shares(1) | | | 242,502 | | | | 7,407 | |
Schindler Holding AG, Participation Certificates(3) | | | 111,214 | | | | 11,908 | |
| | | | | | | | |
| | | | | | | 19,315 | |
34
| | | | | | | | |
| | | Shares
Held | | | Value | |
| | | | | | | | |
| TURKEY - 1.9% | | | | | | | | |
Bizim Toptan Satis Magazalari AS(1) | | | 378,028 | | | $ | 4,427 | |
Coca-Cola Icecek AS(1) | | | 450,724 | | | | 6,120 | |
| | | | | | | | |
| | | | | | | 10,547 | |
| UNITED KINGDOM - 7.9% | | | | | | | | |
Aegis Group plc(1) | | | 7,540,226 | | | | 14,483 | |
Babcock International Group plc(1) | | | 2,317,495 | | | | 23,557 | |
Informa PLC(1) | | | 1,187,894 | | | | 6,040 | |
| | | | | | | | |
| | | | | | | 44,080 | |
| | | | | | | | |
Total common stocks
(Cost $472,057) | | | | | | | 508,107 | |
| | |
| | | Par
Amount | | | | |
SHORT-TERM INVESTMENTS
(CASH EQUIVALENTS) - 9.2% | | | | | | | | |
Repurchase agreement with Fixed Income Clearing Corporation, 0.01%, dated 9/30/11, due 10/3/11, maturity value $50,781
(Cost $50,781)(4) | | $ | 50,781 | | | $ | 50,781 | |
| | | | | | | | |
| | | | | | | | |
Total investments - 100.8%
(Cost $522,838) | | | | | | | 558,888 | |
| | | | | | | | |
Other assets less liabilities - (0.8%) | | | | (4,162 | ) |
| | | | | | | | |
| | | | | | | | |
Total net assets - 100.0%(5) | | | | | | $ | 554,726 | |
| | | | | | | | |
| (1) | Valued at a fair value in accordance with procedures established by the board of directors of Artisan Funds. In total, securities valued at a fair value were $482,619 or 87.0% of total net assets. See notes 2(a) and 2(b) in Notes to Financial Statements for additional information. |
| (2) | Non-income producing security. |
| | | | | | | | | | | | |
lssuer | | Rate | | | Maturity | | | Value | |
U.S. Treasury Bond | | | 4.625 | % | | | 2/15/2040 | | | $ | 51,797 | |
| (5) | Percentages for the various classifications relate to total net assets. |
Company names are as reported by a data service provider and in some cases are translations; a company’s legal name may be different.
(DR) Depositary Receipt, voting rights may vary.
| | | | | | | | |
| PORTFOLIO DIVERSIFICATION - September 30, 2011 | |
Dollar values in thousands | |
| | | Value | | | Percentage
of Total
Net Assets | |
Consumer Discretionary | | $ | 149,272 | | | | 26.9 | % |
Consumer Staples | | | 71,282 | | | | 12.8 | |
Financials | | | 16,266 | | | | 2.9 | |
Healthcare | | | 27,557 | | | | 5.0 | |
Industrials | | | 145,199 | | | | 26.2 | |
Information Technology | | | 46,981 | | | | 8.5 | |
Materials | | | 22,552 | | | | 4.1 | |
Utilities | | | 28,998 | | | | 5.2 | |
| | | | | | | | |
Total common stocks | | | 508,107 | | | | 91.6 | |
Short-term investments | | | 50,781 | | | | 9.2 | |
| | | | | | | | |
Total investments | | | 558,888 | | | | 100.8 | |
Other assets less liabilities | | | (4,162 | ) | | | (0.8 | ) |
| | | | | | | | |
Total net assets | | $ | 554,726 | | | | 100.0 | % |
| | | | | | | | |
| | | | | | | | |
| CURRENCY EXPOSURE - September 30, 2011 | |
Dollar values in thousands | |
| | | Value | | | Percentage
of Total
Investments | |
Australian dollar | | $ | 13,532 | | | | 2.4 | % |
Brazilian real | | | 4,293 | | | | 0.8 | |
British pound | | | 44,080 | | | | 7.9 | |
Euro | | | 228,610 | | | | 40.9 | |
Hong Kong dollar | | | 98,923 | | | | 17.7 | |
Japanese yen | | | 16,270 | | | | 2.9 | |
Kenyan shilling | | | 549 | | | | 0.1 | |
Philippine peso | | | 18,471 | | | | 3.3 | |
Singapore dollar | | | 25,454 | | | | 4.5 | |
Swiss franc | | | 19,315 | | | | 3.5 | |
Turkish lira | | | 10,547 | | | | 1.9 | |
U.S. dollar | | | 78,844 | | | | 14.1 | |
| | | | | | | | |
Total investments | | $ | 558,888 | | | | 100.0 | % |
| | | | | | | | |
35
| | | | | | |
| TOP TEN HOLDINGS - September 30, 2011 | |
Company Name | | Country | | Percentage
of Total
Net Assets | |
Wirecard AG | | Germany | | | 7.4 | % |
Davide Campari - Milano S.p.A. | | Italy | | | 4.7 | |
Babcock International Group plc | | United Kingdom | | | 4.2 | |
SJM Holdings Limited | | Hong Kong | | | 4.0 | |
GfK SE | | Germany | | | 3.7 | |
Imtech NV | | Netherlands | | | 3.5 | |
Alliance Global Group, Inc. | | Philippines | | | 3.3 | |
Ipsos | | France | | | 2.9 | |
Wacker Neuson SE | | Germany | | | 2.9 | |
Aegis Group plc | | United Kingdom | | | 2.6 | |
| | | | | | |
Total | | | | | 39.2 | % |
| | | | | | |
For the purpose of determining the Fund’s top ten holdings, securities of the same issuer are aggregated to determine the weight in the Fund.
The accompanying notes are an integral part of the financial statements.
36
ARTISAN INTERNATIONAL VALUE FUND
Schedule of Investments – September 30, 2011
Dollar values in thousands
| | | | | | | | |
| | | Shares
Held | | | Value | |
| | | | | | | | |
| COMMON STOCKS - 95.6% | | | | | | | | |
| | | | | | | | |
| BELGIUM - 1.9% | | | | | | | | |
Groupe Bruxelles Lambert S.A.(1) | | | 1,144,756 | | | $ | 80,558 | |
| | | | | | | | |
| DENMARK - 1.6% | | | | | | | | |
Carlsberg A/S, Class B(1) | | | 1,160,705 | | | | 68,848 | |
| | | | | | | | |
| FRANCE - 9.8% | | | | | | | | |
Gemalto NV(1) | | | 402,447 | | | | 19,186 | |
Publicis Groupe(1) | | | 3,108,322 | | | | 130,135 | |
Societe Television Francaise 1(1) | | | 2,493,791 | | | | 30,986 | |
Sodexo(1) | | | 650,082 | | | | 42,836 | |
Sodexo - Registered Shares(1)(7) | | | 1,284,779 | | | | 84,659 | |
Total SA(1) | | | 2,532,970 | | | | 111,680 | |
| | | | | | | | |
| | | | | | | 419,482 | |
| GERMANY - 2.5% | | | | | | | | |
HeidelbergCement AG(1) | | | 2,938,597 | | | | 106,206 | |
| | | | | | | | |
| HONG KONG - 1.7% | | | | | | | | |
Guoco Group Limited(1) | | | 7,896,737 | | | | 71,507 | |
| | | | | | | | |
| IRELAND - 3.6% | | | | | | | | |
ICON PLC (DR)(2)(3) | | | 2,871,675 | | | | 46,177 | |
Ryanair Holdings PLC, Equity-Linked Security, 144A(1)(2)(4)(5)(6) | | | 24,712,760 | | | | 109,313 | |
| | | | | | | | |
| | | | | | | 155,490 | |
| JAPAN - 14.5% | | | | | | | | |
Aderans Co., Ltd.(1)(2)(3) | | | 2,420,067 | | | | 22,437 | |
Credit Saison Co., Ltd.(1) | | | 6,929,859 | | | | 133,361 | |
Daiwa Securities Group Inc.(1) | | | 11,011,748 | | | | 41,089 | |
Kao Corporation(1) | | | 5,093,600 | | | | 141,686 | |
Mitsubishi UFJ Financial Group, Inc.(1)(6) | | | 3,654,200 | | | | 16,424 | |
Mitsubishi UFJ Financial Group, Inc.(1) | | | 12,559,582 | | | | 56,450 | |
NIFCO INC.(1) | | | 1,032,900 | | | | 26,473 | |
SANKYO CO., LTD.(1) | | | 1,471,638 | | | | 79,392 | |
SEINO HOLDINGS CO., LTD.(1) | | | 2,550,800 | | | | 20,709 | |
Stanley Electric Co., Ltd.(1) | | | 5,343,300 | | | | 80,710 | |
| | | | | | | | |
| | | | | | | 618,731 | |
| NETHERLANDS - 6.7% | | | | | | | | |
ING Groep N.V.(1)(2) | | | 14,025,601 | | | | 98,712 | |
Koninklijke Ahold NV(1) | | | 6,895,959 | | | | 81,084 | |
Koninklijke Philips Electronics N.V.(1) | | | 6,060,429 | | | | 108,486 | |
| | | | | | | | |
| | | | | | | 288,282 | |
| | | | | | | | |
| SWITZERLAND - 11.2% | | | | | | | | |
Adecco SA(1) | | | 1,769,230 | | | $ | 69,377 | |
Nestle SA(1) | | | 1,055,703 | | | | 58,032 | |
Novartis AG(1) | | | 2,875,346 | | | | 160,472 | |
Panalpina Welttransport Holding AG(1)(2) | | | 1,093,317 | | | | 93,035 | |
Pargesa Holding SA - Bearer Shares(1) | | | 1,359,825 | | | | 92,942 | |
Tamedia AG(1)(2) | | | 29,467 | | | | 3,832 | |
| | | | | | | | |
| | | | | | | 477,690 | |
| THAILAND - 0.5% | | | | | | | | |
Thai Beverage Public Company Limited(1) | | | 112,795,183 | | | | 21,934 | |
| | | | | | | | |
| UNITED KINGDOM - 24.6% | | | | | | | | |
BAE Systems plc(1) | | | 6,016,491 | | | | 24,804 | |
Carpetright PLC(1) | | | 2,956,377 | | | | 22,647 | |
Compass Group PLC(1) | | | 28,032,023 | | | | 226,680 | |
Diageo plc(1) | | | 6,368,535 | | | | 121,166 | |
Experian PLC(1) | | | 7,183,210 | | | | 80,813 | |
Lancashire Holdings Ltd(1) | | | 3,425,355 | | | | 36,678 | |
Lloyds Banking Group plc(1)(2) | | | 140,810,098 | | | | 74,666 | |
Michael Page International plc(1) | | | 7,922,419 | | | | 45,068 | |
Qinetiq Group PLC(1)(3) | | | 62,402,252 | | | | 112,477 | |
Reed Elsevier PLC(1) | | | 18,618,505 | | | | 141,838 | |
| Savills Plc(1)(3) | | | 9,951,406 | | | | 44,068 | |
Unilever PLC (DR) | | | 3,923,853 | | | | 122,385 | |
| | | | | | | | |
| | | | | | | 1,053,290 | |
| UNITED STATES - 17.0% | | | | | | | | |
Accenture plc, Class A | | | 1,633,267 | | | | 86,041 | |
Arch Capital Group Ltd.(2)(3) | | | 5,572,034 | | | | 182,066 | |
Covidien plc | | | 2,988,380 | | | | 131,788 | |
Signet Jewelers Ltd.(2) | | | 3,882,479 | | | | 131,228 | |
TE Connectivity Ltd. | | | 6,920,314 | | | | 194,738 | |
| | | | | | | | |
| | | | | | | 725,861 | |
| | | | | | | | |
Total common stocks
(Cost $4,117,862) | | | | | | | 4,087,879 | |
37
| | | | | | | | |
| | | Par
Amount | | | Value | |
| | | | | | | | |
SHORT-TERM INVESTMENTS
(CASH EQUIVALENTS) - 3.0% | | | | | |
Repurchase agreement with Fixed Income Clearing Corporation, 0.01%, dated 9/30/11, due 10/3/11, maturity value $128,934
(Cost $128,934)(8) | | $ | 128,934 | | | $ | 128,934 | |
| | | | | | | | |
| | | | | | | | |
Total investments - 98.6%
(Cost $4,246,796) | | | | | | | 4,216,813 | |
| | | | | | | | |
Other assets less liabilities - 1.4% | | | | | | | 58,669 | |
| | | | | | | | |
| | | | | | | | |
Total net assets - 100.0%(9) | | | | | | $ | 4,275,482 | |
| | | | | | | | |
| (1) | Valued at a fair value in accordance with procedures established by the board of directors of Artisan Funds. In total, securities valued at a fair value were $3,193,456 or 74.7% of total net assets. See notes 2(a) and 2(b) in Notes to Financial Statements for additional information. |
| (2) | Non-income producing security. |
| (3) | Affiliated company as defined by the Investment Company Act of 1940, as amended. See Note (7) in Notes to Financial Statements. |
| (5) | Security is an equity-linked participation certificate issued by HSBC Bank plc. As described in Note 2(i) in Notes to Financial Statements, equity-linked participation certificates are subject to counterparty risk with respect to the bank or broker-dealer that issues them. |
| (6) | Security is restricted. Ryanair Holdings PLC was acquired in a transaction under Rule 144A of the Securities Act of 1933, as amended. The shares of Ryanair Holdings PLC may be resold in transactions exempt from registration to qualified institutional buyers. The shares of Mitsubishi UFG Financial Group, Inc., were acquired in a private placement and are freely tradeable outside the United States, where the Fund expects to trade them. |
| | | | | | | | | | | | | | | | |
Security | | Acquisition
Dates | | | Cost | | | Value | | | Percentage
of Total
Net Assets | |
Ryanair Holdings
PLC | |
| 9/17/08-
9/26/2011 |
| | $ | 102,300 | | | $ | 109,313 | | | | 2.6 | % |
Mitsubishi UFJ Financial Group,
Inc. | | | 12/14/2009 | | | | 17,639 | | | | 16,424 | | | | 0.4 | |
| | | | | | | | | | | | | | | | |
| | | | | | | | | | $ | 125,737 | | | | 3.0 | % |
| | | | | | | | | | | | | | | | |
| (7) | Shares are registered with the issuing company and not tradable until converted back to bearer shares. |
| | | | | | | | | | | | |
Issuer | | Rate | | | Maturity | | | Value | |
U.S. Treasury Bond | | | 4.625 | % | | | 2/15/2040 | | | $ | 131,519 | |
| (9) | Percentages for the various classifications relate to total net assets. |
Company names are as reported by a data service provider and in some cases are translations; a company’s legal name may be different.
(DR) Depositary Receipt, voting rights may vary.
| | | | | | | | | | | | | | | | | | | | |
| FOREIGN CURRENCY FORWARD CONTRACTS | |
Dollar values in thousands | |
Description | | Counterparty | | Transaction
Type | | Settlement
Date | | | Cost on
Origination
Date | | | Value | | | Unrealized
Appreciation | |
| Japanese Yen | | State Street Bank and Trust Company | | Sell | | | 11/17/2011 | | | $ | 483,128 | | | $ | 481,223 | | | $ | 1,905 | |
| | | | | | | | |
| PORTFOLIO DIVERSIFICATION - September 30, 2011 | |
Dollar values in thousands | |
| | | Value | | | Percentage
of Total
Net Assets | |
Consumer Discretionary | | $ | 1,001,416 | | | | 23.4 | % |
Consumer Staples | | | 637,572 | | | | 14.9 | |
Energy | | | 111,680 | | | | 2.6 | |
Financials | | | 928,521 | | | | 21.7 | |
Healthcare | | | 338,437 | | | | 7.9 | |
Industrials | | | 664,082 | | | | 15.6 | |
Information Technology | | | 299,965 | | | | 7.0 | |
Materials | | | 106,206 | | | | 2.5 | |
| | | | | | | | |
Total common stocks | | | 4,087,879 | | | | 95.6 | |
Short-term investments | | | 128,934 | | | | 3.0 | |
| | | | | | | | |
Total investments | | | 4,216,813 | | | | 98.6 | |
Other assets less liabilities | | | 58,669 | | | | 1.4 | |
| | | | | | | | |
Total net assets | | $ | 4,275,482 | | | | 100.0 | % |
| | | | | | | | |
| | | | | | | | |
| CURRENCY EXPOSURE - September 30, 2011 | |
Dollar values in thousands | |
| | | Value | | | Percentage
of Total
Investments | |
British pound | | $ | 930,905 | | | | 22.1 | % |
Danish krone | | | 68,848 | | | | 1.6 | |
Euro | | | 1,003,841 | | | | 23.8 | |
Hong Kong dollar | | | 71,507 | | | | 1.7 | |
Japanese yen | | | 618,731 | | | | 14.7 | |
Singapore dollar | | | 21,934 | | | | 0.5 | |
Swiss franc | | | 477,690 | | | | 11.3 | |
U.S. dollar | | | 1,023,357 | | | | 24.3 | |
| | | | | | | | |
Total investments | | $ | 4,216,813 | | | | 100.0 | % |
| | | | | | | | |
38
| | | | | | |
| TOP TEN HOLDINGS - September 30, 2011 | |
Company Name | | Country | | Percentage
of Total
Net Assets | |
Compass Group PLC | | United Kingdom | | | 5.3 | % |
TE Connectivity Ltd | | United States | | | 4.6 | |
Arch Capital Group Ltd. | | United States | | | 4.3 | |
Novartis AG | | Switzerland | | | 3.8 | |
Reed Elsevier PLC | | United Kingdom | | | 3.3 | |
Kao Corporation | | Japan | | | 3.3 | |
Credit Saison Co., Ltd. | | Japan | | | 3.1 | |
Covidien plc | | United States | | | 3.1 | |
Signet Jewelers Ltd. | | United States | | | 3.1 | |
Publicis Groupe | | France | | | 3.0 | |
| | | | | | |
Total | | | | | 36.9 | % |
| | | | | | |
For the purpose of determining the Fund’s top ten holdings, securities of the same issuer are aggregated to determine the weight in the Fund.
The Fund owns Pargesa Holding SA (Pargesa), which represents 2.2% of the Fund’s total net assets, and Groupe Bruxelles Lambert SA (GBL), which represents 1.9% of the Fund’s total net assets. Pargesa is the parent company of GBL. If you aggregated the Fund’s holdings of both securities, the aggregated amount would be one of the Fund’s top ten holdings.
The accompanying notes are an integral part of the financial statements.
39
ARTISAN MID CAP FUND
Schedule of Investments – September 30, 2011
Dollar values in thousands
| | | | | | | | |
| | | Shares
Held | | | Value | |
| | | | | | | | |
| COMMON STOCKS - 95.6% | | | | | | | | |
| | | | | | | | |
| CONSUMER DISCRETIONARY - 19.6% | | | | | |
Auto Components - 1.5% | | | | | | | | |
BorgWarner Inc.(1) | | | 1,132,114 | | | $ | 68,527 | |
Gentex Corporation | | | 321,300 | | | | 7,727 | |
| | | | | | | | |
| | | | | | | 76,254 | |
Automobiles - 0.3% | | | | | | | | |
Tesla Motors, Inc.(1) | | | 538,685 | | | | 13,138 | |
| | | | | | | | |
Distributors - 1.5% | | | | | | | | |
LKQ Corporation(1) | | | 3,161,870 | | | | 76,391 | |
| | | | | | | | |
Diversified Consumer Services - 1.0% | | | | | |
New Oriental Education & Technology Group, Inc. (DR)(1)(2) | | | 2,088,400 | | | | 47,970 | |
| | | | | | | | |
Hotels, Restaurants & Leisure - 5.7% | | | | | |
Arcos Dorados Holdings Inc., Class A(2) | | | 1,892,900 | | | | 43,896 | |
Chipotle Mexican Grill, Inc.(1) | | | 236,224 | | | | 71,564 | |
Ctrip.com International, Ltd. (DR)(1)(2) | | | 2,161,831 | | | | 69,524 | |
Starwood Hotels & Resorts Worldwide, Inc. | | | 1,581,999 | | | | 61,413 | |
Wynn Resorts, Limited | | | 333,923 | | | | 38,428 | |
| | | | | | | | |
| | | | | | | 284,825 | |
Internet & Catalog Retail - 0.4% | | | | | | | | |
Netflix, Inc.(1) | | | 164,767 | | | | 18,645 | |
| | | | | | | | |
Specialty Retail - 1.7% | | | | | | | | |
Tractor Supply Company | | | 625,700 | | | | 39,137 | |
Ulta Salon, Cosmetics & Fragrance, Inc.(1) | | | 733,500 | | | | 45,646 | |
| | | | | | | | |
| | | | | | | 84,783 | |
Textiles, Apparel & Luxury Goods - 7.5% | | | | | | | | |
Coach, Inc. | | | 2,130,023 | | | | 110,399 | |
Fossil, Inc.(1) | | | 1,229,135 | | | | 99,634 | |
lululemon athletica inc.(1) | | | 940,716 | | | | 45,766 | |
Polo Ralph Lauren Corporation, Class A | | | 733,522 | | | | 95,138 | |
Under Armour, Inc., Class A(1) | | | 380,800 | | | | 25,289 | |
| | | | | | | | |
| | | | | | | 376,226 | |
| CONSUMER STAPLES - 2.6% | | | | | | | | |
Food Products - 2.6% | | | | | | | | |
Diamond Foods, Inc. | | | 525,800 | | | | 41,954 | |
| | | | | | | | |
| CONSUMER STAPLES (CONTINUED) | | | | | | | | |
Food Products (Continued) | | | | | | | | |
Mead Johnson Nutrition Company | | | 377,100 | | | $ | 25,956 | |
TreeHouse Foods, Inc.(1) | | | 973,800 | | | | 60,220 | |
| | | | | | | | |
| | | | | | | 128,130 | |
| ENERGY - 7.3% | | | | | | | | |
Energy Equipment & Services - 6.0% | | | | | |
Cameron International Corporation(1) | | | 3,174,549 | | | | 131,871 | |
Core Laboratories N.V. | | | 762,510 | | | | 68,496 | |
Dresser-Rand Group Inc.(1) | | | 2,523,327 | | | | 102,270 | |
| | | | | | | | |
| | | | | | | 302,637 | |
Oil, Gas & Consumable Fuels - 1.3% | | | | | |
Cabot Oil & Gas Corporation | | | 474,900 | | | | 29,401 | |
Noble Energy, Inc. | | | 469,700 | | | | 33,255 | |
| | | | | | | | |
| | | | | | | 62,656 | |
| FINANCIALS - 5.1% | | | | | | | | |
Capital Markets - 1.0% | | | | | | | | |
Ares Capital Corporation | | | 3,501,709 | | | | 48,218 | |
| | | | | | | | |
Commercial Banks - 0.8% | | | | | | | | |
HDFC Bank Limited (DR)(2) | | | 1,326,090 | | | | 38,655 | |
| | | | | | | | |
Consumer Finance - 2.1% | | | | | | | | |
Discover Financial Services | | | 4,670,310 | | | | 107,137 | |
| | | | | | | | |
Diversified Financial Services - 1.2% | | | | | | | | |
CME Group Inc., Class A | | | 250,665 | | | | 61,764 | |
| | | | | | | | |
| HEALTHCARE - 22.5% | | | | | | | | |
Biotechnology - 6.5% | | | | | | | | |
Alexion Pharmaceuticals, Inc.(1) | | | 810,500 | | | | 51,921 | |
Cepheid(1) | | | 2,030,600 | | | | 78,848 | |
Incyte Corporation(1) | | | 1,831,682 | | | | 25,589 | |
Pharmasset, Inc.(1) | | | 464,200 | | | | 38,236 | |
Regeneron Pharmaceuticals, Inc.(1) | | | 2,232,613 | | | | 129,938 | |
| | | | | | | | |
| | | | | | | 324,532 | |
Health Care Equipment & Supplies - 2.2% | | | | | | | | |
Edwards Lifesciences Corporation(1) | | | 808,081 | | | | 57,600 | |
Intuitive Surgical, Inc.(1) | | | 142,813 | | | | 52,024 | |
| | | | | | | | |
| | | | | | | 109,624 | |
Health Care Providers & Services - 0.5% | | | | | | | | |
AMERIGROUP Corporation(1) | | | 675,700 | | | | 26,359 | |
40
| | | | | | | | |
| | | Shares
Held | | | Value | |
| | | | | | | | |
| HEALTHCARE (CONTINUED) | | | | | | | | |
Health Care Technology - 6.4% | | | | | | | | |
athenahealth, Inc.(1)(3) | | | 1,956,015 | | | $ | 116,481 | |
Cerner Corporation(1) | | | 2,973,724 | | | | 203,760 | |
| | | | | | | | |
| | | | | | | 320,241 | |
Life Sciences Tools & Services - 4.1% | | | | | |
Agilent Technologies, Inc.(1) | | | 3,437,815 | | | | 107,432 | |
Illumina, Inc.(1) | | | 1,098,183 | | | | 44,938 | |
Mettler-Toledo International Inc.(1) | | | 374,600 | | | | 52,429 | |
| | | | | | | | |
| | | | | | | 204,799 | |
Pharmaceuticals - 2.8% | | | | | | | | |
Allergan, Inc. | | | 1,703,196 | | | | 140,309 | |
| | | | | | | | |
| INDUSTRIALS - 12.6% | | | | | | | | |
Aerospace & Defense - 2.6% | | | | | | | | |
Precision Castparts Corp. | | | 822,596 | | | | 127,881 | |
| | | | | | | | |
Electrical Equipment - 4.0% | | | | | | | | |
Cooper Industries plc | | | 1,596,676 | | | | 73,639 | |
Roper Industries, Inc. | | | 1,864,812 | | | | 128,504 | |
| | | | | | | | |
| | | | | | | 202,143 | |
Machinery - 1.6% | | | | | | | | |
Gardner Denver, Inc. | | | 1,269,334 | | | | 80,666 | |
| | | | | | | | |
Professional Services - 4.4% | | | | | | | | |
IHS Inc.(1) | | | 1,881,617 | | | | 140,764 | |
Verisk Analytics, Inc., Class A(1) | | | 2,357,427 | | | | 81,968 | |
| | | | | | | | |
| | | | | | | 222,732 | |
| INFORMATION TECHNOLOGY - 25.9% | | | | | |
Communications Equipment - 2.1% | | | | | |
Aruba Networks, Inc.(1) | | | 1,676,300 | | | | 35,051 | |
Juniper Networks, Inc.(1) | | | 4,178,785 | | | | 72,126 | |
| | | | | | | | |
| | | | | | | 107,177 | |
Electronic Equipment & Instruments - 4.2% | | | | | | | | |
IPG Photonics Corporation(1) | | | 1,098,500 | | | | 47,719 | |
Trimble Navigation Limited(1) | | | 2,996,165 | | | | 100,521 | |
Universal Display Corporation(1) | | | 1,331,200 | | | | 63,818 | |
| | | | | | | | |
| | | | | | | 212,058 | |
Internet Software & Services - 2.6% | | | | | |
MercadoLibre, Inc. | | | 1,320,763 | | | | 70,991 | |
OpenTable, Inc.(1) | | | 861,966 | | | | 39,659 | |
SINA Corporation(1)(2) | | | 307,000 | | | | 21,984 | |
| | | | | | | | |
| | | | | | | 132,634 | |
IT Services - 2.6% | | | | | | | | |
Teradata Corporation(1) | | | 2,395,204 | | | | 128,215 | |
| | | | | | | | |
Semiconductors & Semiconductor Equipment - 3.9% | | | | | | | | |
Altera Corporation | | | 783,900 | | | | 24,716 | |
ARM Holdings PLC (DR)(2) | | | 2,581,725 | | | | 65,834 | |
| | | | | | | | |
| INFORMATION TECHNOLOGY (CONTINUED) | | | | | | | | |
Semiconductors & Semiconductor Equipment (Continued) | | | | | | | | |
Broadcom Corporation, Class A | | | 3,188,576 | | | $ | 106,148 | |
| | | | | | | | |
| | | | | | | 196,698 | |
Software - 10.5% | | | | | | | | |
ANSYS, Inc.(1) | | | 1,859,118 | | | | 91,171 | |
Citrix Systems, Inc.(1) | | | 1,561,918 | | | | 85,171 | |
Concur Technologies, Inc.(1) | | | 359,365 | | | | 13,375 | |
Qlik Technologies Inc.(1) | | | 2,632,300 | | | | 57,016 | |
Red Hat, Inc.(1) | | | 2,068,141 | | | | 87,400 | |
salesforce.com, inc.(1) | | | 899,911 | | | | 102,842 | |
VMware, Inc., Class A(1) | | | 1,118,868 | | | | 89,935 | |
| | | | | | | | |
| | | | | | | 526,910 | |
| | | | | | | | |
Total common stocks
(Cost $3,651,540) | | | | | | | 4,790,407 | |
| | |
| | | Par
Amount | | | | |
SHORT-TERM INVESTMENTS
(CASH EQUIVALENTS) - 4.8% | | | | | |
Repurchase agreement with Fixed Income Clearing Corporation, 0.01%, dated 9/30/11, due 10/3/11, maturity value $241,658
(Cost $241,658)(4) | | $ | 241,658 | | | $ | 241,658 | |
| | | | | | | | |
| | | | | | | | |
Total investments - 100.4%
(Cost $3,893,198) | | | | | | | 5,032,065 | |
| | | | | | | | |
Other assets less liabilities - (0.4%) | | | | | | | (21,309 | ) |
| | | | | | | | |
| | | | | | | | |
Total net assets - 100.0%(5) | | | | | | $ | 5,010,756 | |
| | | | | | | | |
| (1) | Non-income producing security. |
| (2) | The Fund considers the company to be from outside of the United States. See the Fund’s Statement of Additional Information for information on how a particular country is assigned. |
| | | | |
Security | | Country | | Trading Currency |
Arcos Dorados Holdings Inc., Class A | | Brazil | | US dollar |
ARM Holdings PLC (DR) | | United Kingdom | | US dollar |
Ctrip.com International, Ltd. (DR) | | China | | US dollar |
HDFC Bank Limited (DR) | | India | | US dollar |
New Oriental Education & Technology Group, Inc. (DR) | | China | | US dollar |
SINA Corporation | | China | | US dollar |
41
| (3) | Affiliated company as defined by the Investment Company Act of 1940, as amended. See Note (7) in Notes to Financial Statements. |
| | | | | | | | | | | | |
lssuer | | Rate | | | Maturity | | | Value | |
U.S. Treasury Bond | | | 4.625 | % | | | 2/15/2040 | | | $ | 246,492 | |
| (5) | Percentages for the various classifications relate to total net assets. |
Company names are as reported by a data service provider and in some cases are translations; a company’s legal name may be different.
(DR) Depositary Receipt, voting rights may vary.
| | | | | | |
| TOP TEN HOLDINGS - September 30, 2011 | |
Company Name | | Country | | Percentage
of Total
Net Assets | |
Cerner Corporation | | United States | | | 4.1 | % |
IHS Inc. | | United States | | | 2.8 | |
Allergan, Inc. | | United States | | | 2.8 | |
Cameron International Corporation | | United States | | | 2.6 | |
Regeneron Pharmaceuticals, Inc. | | United States | | | 2.6 | |
Roper Industries, Inc. | | United States | | | 2.6 | |
Teradata Corporation | | United States | | | 2.6 | |
Precision Castparts Corp. | | United States | | | 2.6 | |
athenahealth, Inc. | | United States | | | 2.3 | |
Coach, Inc. | | United States | | | 2.2 | |
| | | | | | |
Total | | | | | 27.2 | % |
| | | | | | |
For the purpose of determining the Fund’s top ten holdings, securities of the same issuer are aggregated to determine the weight in the Fund.
The accompanying notes are an integral part of the financial statements.
42
ARTISAN MID CAP VALUE FUND
Schedule of Investments – September 30, 2011
Dollar values in thousands
| | | | | | | | |
| | | Shares
Held | | | Value | |
| | | | | | | | |
| COMMON STOCKS - 96.7% | | | | | | | | |
| | | | | | | | |
| CONSUMER DISCRETIONARY - 7.3% | | | | | | | | |
Diversified Consumer Services - 1.9% | |
H&R Block, Inc. | | | 8,944,000 | | | $ | 119,045 | |
| | | | | | | | |
Household Durables - 1.3% | |
Mohawk Industries, Inc.(1) | | | 1,857,500 | | | | 79,705 | |
| | | | | | | | |
Leisure Equipment & Products - 2.3% | |
Mattel, Inc. | | | 5,433,300 | | | | 140,668 | |
| | | | | | | | |
Media - 1.8% | |
Omnicom Group Inc. | | | 2,998,200 | | | | 110,454 | |
| | | | | | | | |
| CONSUMER STAPLES - 5.5% | |
Food & Staples Retailing - 4.0% | |
The Kroger Co. | | | 7,151,200 | | | | 157,040 | |
Sysco Corporation | | | 3,492,600 | | | | 90,458 | |
| | | | | | | | |
| | | | | | | 247,498 | |
Food Products - 1.5% | |
Campbell Soup Company | | | 2,804,100 | | | | 90,769 | |
| | | | | | | | |
| ENERGY - 7.1% | |
Energy Equipment & Services - 2.1% | |
Ensco PLC (DR)(2) | | | 2,969,674 | | | | 120,064 | |
Patterson-UTI Energy, Inc. | | | 604,400 | | | | 10,480 | |
| | | | | | | | |
| | | | | | | 130,544 | |
Oil, Gas & Consumable Fuels - 5.0% | |
Cimarex Energy Co. | | | 2,160,790 | | | | 120,356 | |
Range Resources Corporation | | | 1,192,500 | | | | 69,714 | |
Southwestern Energy Company(1) | | | 3,656,500 | | | | 121,871 | |
| | | | | | | | |
| | | | | | | 311,941 | |
| FINANCIALS - 21.8% | |
Capital Markets - 1.6% | |
Northern Trust Corporation | | | 2,856,700 | | | | 99,927 | |
| | | | | | | | |
Insurance - 17.3% | |
Alleghany Corporation(1)(3) | | | 599,507 | | | | 172,958 | |
Allied World Assurance Company Holdings, Ltd | | | 1,171,000 | | | | 62,894 | |
The Allstate Corporation | | | 4,476,400 | | | | 106,046 | |
Aon Corporation | | | 3,504,928 | | | | 147,137 | |
Arch Capital Group Ltd.(1)(3) | | | 4,083,819 | | | | 133,439 | |
Fidelity National Financial, Inc. | | | 6,460,881 | | | | 98,076 | |
| | | | | | | | |
| FINANCIALS (CONTINUED) | |
Insurance (Continued) | |
Loews Corporation | | | 3,128,900 | | | $ | 108,103 | |
The Progressive Corporation | | | 8,506,500 | | | | 151,075 | |
W. R. Berkley Corporation | | | 3,083,700 | | | | 91,555 | |
| | | | | | | | |
| | | | | | | 1,071,283 | |
Real Estate Investment Trusts
(REITS) - 2.9% | |
Annaly Capital Management, Inc. | | | 6,339,700 | | | | 105,429 | |
Hatteras Financial Corp. | | | 3,026,500 | | | | 76,147 | |
| | | | | | | | |
| | | | | | | 181,576 | |
| HEALTHCARE - 3.2% | |
Health Care Providers &
Services - 3.2% | |
CIGNA Corporation | | | 3,841,550 | | | | 161,115 | |
Quest Diagnostics Incorporated | | | 718,400 | | | | 35,460 | |
| | | | | | | | |
| | | | | | | 196,575 | |
| INDUSTRIALS - 18.9% | |
Aerospace & Defense - 5.7% | |
L-3 Communications Holdings, Inc. | | | 1,853,200 | | | | 114,843 | |
Rockwell Collins, Inc. | | | 2,817,453 | | | | 148,649 | |
Spirit AeroSystems Holdings, Inc., Class A(1) | | | 5,795,700 | | | | 92,441 | |
| | | | | | | | |
| | | | | | | 355,933 | |
Construction & Engineering - 2.0% | | | | | |
Jacobs Engineering Group Inc.(1) | | | 3,950,100 | | | | 127,549 | |
| | | | | | | | |
Electrical Equipment - 1.7% | | | | | | | | |
Hubbell Inc., Class B | | | 2,125,000 | | | | 105,272 | |
| | | | | | | | |
Machinery - 1.2% | | | | | | | | |
Flowserve Corporation | | | 1,025,300 | | | | 75,872 | |
| | | | | | | | |
Professional Services - 7.5% | | | | | | | | |
The Dun & Bradstreet Corporation | | | 1,797,200 | | | | 110,096 | |
Equifax Inc. | | | 4,178,000 | | | | 128,432 | |
ManpowerGroup | | | 2,493,500 | | | | 83,831 | |
Towers Watson & Co., Class A | | | 2,382,700 | | | | 142,438 | |
| | | | | | | | |
| | | | | | | 464,797 | |
Road & Rail - 0.8% | | | | | | | | |
Ryder System, Inc. | | | 1,388,000 | | | | 52,064 | |
| | | | | | | | |
| INFORMATION TECHNOLOGY - 25.0% | |
Computers & Peripherals - 1.8% | | | | | | | | |
Lexmark International, Inc.(1)(3) | | | 4,113,200 | | | | 111,180 | |
43
| | | | | | | | |
| | | Shares
Held | | | Value | |
| | | | | | | | |
INFORMATION
TECHNOLOGY (CONTINUED) | |
Electronic Equipment & Instruments - 8.7% | | | | | |
Arrow Electronics, Inc.(1)(3) | | | 4,982,100 | | | $ | 138,403 | |
Avnet, Inc.(1) | | | 6,353,610 | | | | 165,702 | |
FLIR Systems, Inc. | | | 3,144,900 | | | | 78,780 | |
Ingram Micro Inc.(1)(3) | | | 9,752,200 | | | | 157,303 | |
| | | | | | | | |
| | | | | | | 540,188 | |
Internet Software & Services - 0.8% | | | | | |
Open Text Corporation(1)(2) | | | 926,200 | | | | 48,274 | |
| | | | | | | | |
IT Services - 7.6% | | | | | | | | |
Broadridge Financial Solutions, Inc. | | | 4,820,000 | | | | 97,075 | |
SAIC, Inc.(1) | | | 8,820,200 | | | | 104,167 | |
Total System Services, Inc. | | | 7,692,800 | | | | 130,239 | |
The Western Union Company | | | 8,998,600 | | | | 137,589 | |
| | | | | | | | |
| | | | | | | 469,070 | |
Semiconductors & Semiconductor
Equipment - 4.2% | |
Analog Devices, Inc. | | | 4,448,300 | | | | 139,009 | |
Applied Materials, Inc. | | | 11,541,000 | | | | 119,449 | |
| | | | | | | | |
| | | | | | | 258,458 | |
Software - 1.9% | | | | | | | | |
SYNOPSYS, INC.(1) | | | 4,839,300 | | | | 117,885 | |
| | | | | | | | |
| UTILITIES - 7.9% | | | | | | | | |
Electrical Utilities - 0.8% | | | | | | | | |
Westar Energy, Inc. | | | 1,881,600 | | | | 49,712 | |
| | | | | | | | |
Multi-Utilities - 5.3% | | | | | | | | |
DTE Energy Company | | | 899,400 | | | | 44,089 | |
OGE Energy Corp. | | | 1,843,500 | | | | 88,101 | |
SCANA Corporation | | | 2,086,200 | | | | 84,387 | |
Wisconsin Energy Corporation | | | 689,700 | | | | 21,581 | |
Xcel Energy Inc. | | | 3,654,100 | | | | 90,220 | |
| | | | | | | | |
| | | | | | | 328,378 | |
Water Utilities - 1.8% | | | | | | | | |
American Water Works Company, Inc. | | | 3,746,300 | | | | 113,063 | |
| | | | | | | | |
Total common stocks
(Cost $5,968,382) | | | | | | | 5,997,680 | |
| | | | | | | | |
SHORT-TERM INVESTMENTS
(CASH EQUIVALENTS) - 3.4% | | | | | |
Repurchase agreement with Fixed
Income Clearing Corporation, 0.01%, dated 9/30/11, due 10/3/11,
maturity value $208,269 (Cost $208,269)(4) | | $ | 208,269 | | | $ | 208,269 | |
| | | | | | | | |
| | | | | | | | |
Total investments - 100.1%
(Cost $6,176,651) | | | | | | | 6,205,949 | |
| | | | | | | | |
Other assets less liabilities - (0.1%) | | | | | | | (5,485 | ) |
| | | | | | | | |
| | | | | | | | |
Total net assets - 100.0%(5) | | | | | | $ | 6,200,464 | |
| | | | | | | | |
| (1) | Non-income producing security. |
| (2) | The Fund considers the company to be from outside of the United States. See the Fund’s Statement of Additional Information for information on how a particular country is assigned. |
| | | | |
Security | | Country | | Trading Currency |
Ensco PLC (DR) | | United Kingdom | | US dollar |
Open Text Corporation | | Canada | | US dollar |
| (3) | Affiliated company as defined by the Investment Company Act of 1940, as amended. See Note (7) in Notes to Financial Statements. |
| | | | | | | | | | | | |
lssuer | | Rate | | | Maturity | | | Value | |
U.S. Treasury Bond | | | 4.625 | % | | | 2/15/2040 | | | $ | 212,440 | |
| (5) | Percentages for the various classifications relate to total net assets. |
Company names are as reported by a data service provider and in some cases are translations; a company’s legal name may be different.
(DR) Depositary Receipt, voting rights may vary.
44
| | | | | | |
| TOP TEN HOLDINGS - September 30, 2011 | |
Company Name | | Country | | Percentage
of Total
Net Assets | |
Alleghany Corporation | | United States | | | 2.8 | % |
Avnet, Inc. | | United States | | | 2.7 | |
CIGNA Corporation | | United States | | | 2.6 | |
Ingram Micro Inc. | | United States | | | 2.5 | |
The Kroger Co. | | United States | | | 2.5 | |
The Progressive Corporation | | United States | | | 2.4 | |
Rockwell Collins, Inc. | | United States | | | 2.4 | |
Aon Corporation | | United States | | | 2.4 | |
Towers Watson & Co. | | United States | | | 2.3 | |
Mattel, Inc. | | United States | | | 2.3 | |
| | | | | | |
Total | | | | | 24.9 | % |
| | | | | | |
For the purpose of determining the Fund’s top ten holdings, securities of the same issuer are aggregated to determine the weight in the Fund.
The accompanying notes are an integral part of the financial statements.
45
ARTISAN SMALL CAP FUND
Schedule of Investments – September 30, 2011
Dollar values in thousands
| | | | | | | | |
| | | Shares
Held | | | Value | |
| | | | | | | | |
| COMMON STOCKS - 96.2% | |
| | | | | | | | |
| CONSUMER DISCRETIONARY - 17.7% | |
Automobiles - 0.3% | |
Tesla Motors, Inc.(1) | | | 35,000 | | | $ | 854 | |
| | | | | | | | |
Distributors - 3.2% | |
LKQ Corporation(1) | | | 432,400 | | | | 10,447 | |
| | | | | | | | |
Diversified Consumer Services - 2.3% | |
K12 Inc.(1) | | | 297,000 | | | | 7,562 | |
| | | | | | | | |
Hotels, Restaurants & Leisure - 0.9% | |
BJ’s Restaurants, Inc.(1) | | | 18,500 | | | | 816 | |
Dunkin’ Brands Group, Inc.(1) | | | 74,400 | | | | 2,061 | |
| | | | | | | | |
| | | | | | | 2,877 | |
Internet & Catalog Retail - 1.0% | |
HomeAway, Inc.(1) | | | 42,900 | | | | 1,442 | |
MakeMyTrip Limited(1)(2) | | | 84,400 | | | | 1,863 | |
| | | | | | | | |
| | | | | | | 3,305 | |
Media - 0.4% | |
ReachLocal, Inc.(1) | | | 134,000 | | | | 1,457 | |
| | | | | | | | |
Specialty Retail - 5.7% | |
Francesca’s Collections, Inc.(1)(3) | | | 85,800 | | | | 1,820 | |
Monro Muffler Brake, Inc. | | | 147,500 | | | | 4,863 | |
Teavana Holdings, Inc.(1) | | | 80,300 | | | | 1,633 | |
Ulta Salon, Cosmetics & Fragrance, Inc.(1) | | | 163,500 | | | | 10,175 | |
| | | | | | | | |
| | | | | | | 18,491 | |
Textiles, Apparel & Luxury Goods - 3.9% | |
Iconix Brand Group, Inc.(1) | | | 250,700 | | | | 3,961 | |
Vera Bradley, Inc.(1) | | | 113,000 | | | | 4,074 | |
The Warnaco Group, Inc.(1) | | | 104,900 | | | | 4,835 | |
| | | | | | | | |
| | | | | | | 12,870 | |
| CONSUMER STAPLES - 5.0% | |
Food & Staples Retailing - 1.4% | |
The Fresh Market, Inc.(1) | | | 116,300 | | | | 4,438 | |
| | | | | | | | |
Food Products - 3.6% | |
Diamond Foods, Inc. | | | 50,800 | | | | 4,053 | |
TreeHouse Foods, Inc.(1) | | | 127,300 | | | | 7,872 | |
| | | | | | | | |
| | | | | | | 11,925 | |
| | | | | | | | |
| ENERGY - 4.0% | |
Energy Equipment & Services - 2.8% | |
Core Laboratories N.V. | | | 43,900 | | | $ | 3,943 | |
Dril-Quip, Inc.(1) | | | 94,900 | | | | 5,116 | |
| | | | | | | | |
| | | | | | | 9,059 | |
Oil, Gas & Consumable Fuels - 1.2% | |
Oasis Petroleum Inc.(1) | | | 105,400 | | | | 2,354 | |
Rosetta Resources Inc.(1) | | | 43,100 | | | | 1,475 | |
| | | | | | | | |
| | | | | | | 3,829 | |
| FINANCIALS - 4.4% | |
Capital Markets - 3.0% | |
Ares Capital Corporation | | | 702,061 | | | | 9,667 | |
| | | | | | | | |
Commercial Banks - 1.4% | |
FirstMerit Corporation | | | 182,600 | | | | 2,074 | |
MB Financial, Inc. | | | 163,500 | | | | 2,407 | |
| | | | | | | | |
| | | | | | | 4,481 | |
| HEALTHCARE - 23.5% | |
Biotechnology - 8.2% | |
Cepheid(1) | | | 387,400 | | | | 15,043 | |
Incyte Corporation(1) | | | 235,500 | | | | 3,290 | |
Regeneron Pharmaceuticals, Inc.(1) | | | 144,900 | | | | 8,433 | |
| | | | | | | | |
| | | | | | | 26,766 | |
Health Care Equipment & Supplies - 7.2% | |
DexCom Inc.(1) | | | 221,700 | | | | 2,660 | |
HeartWare International, Inc.(1) | | | 67,200 | | | | 4,328 | |
Masimo Corporation | | | 332,300 | | | | 7,194 | |
NxStage Medical, Inc.(1) | | | 211,200 | | | | 4,406 | |
Thoratec Corporation(1) | | | 77,200 | | | | 2,520 | |
ZOLL Medical Corporation(1) | | | 65,000 | | | | 2,453 | |
| | | | | | | | |
| | | | | | | 23,561 | |
Health Care Providers & Services - 4.4% | |
AMERIGROUP Corporation(1) | | | 82,300 | | | | 3,210 | |
HMS Holdings Corp.(1) | | | 461,900 | | | | 11,266 | |
| | | | | | | | |
| | | | | | | 14,476 | |
Health Care Technology - 3.7% | |
athenahealth, Inc.(1)(4) | | | 204,500 | | | | 12,178 | |
| | | | | | | | |
| INDUSTRIALS - 18.9% | |
Aerospace & Defense - 2.9% | |
Hexcel Corporation(1) | | | 417,600 | | | | 9,254 | |
The KEYW Holding Corporation(1) | | | 24,300 | | | | 173 | |
| | | | | | | | |
| | | | | | | 9,427 | |
46
| | | | | | | | |
| | | Shares
Held | | | Value | |
| | | | | | | | |
| INDUSTRIALS (CONTINUED) | |
Electrical Equipment - 7.0% | |
Acuity Brands, Inc. | | | 191,600 | | | $ | 6,905 | |
Regal Beloit Corporation | | | 82,900 | | | | 3,762 | |
Thomas & Betts Corporation(1) | | | 143,000 | | | | 5,707 | |
Woodward, Inc. | | | 235,700 | | | | 6,458 | |
| | | | | | | | |
| | | | | | | 22,832 | |
Machinery - 6.4% | |
Chart Industries, Inc.(1) | | | 74,100 | | | | 3,125 | |
IDEX Corporation | | | 284,100 | | | | 8,853 | |
Robbins & Myers, Inc. | | | 190,200 | | | | 6,602 | |
Titan International, Inc. | | | 165,900 | | | | 2,488 | |
| | | | | | | | |
| | | | | | | 21,068 | |
Professional Services - 0.9% | |
RPX Corporation(1) | | | 147,300 | | | | 3,051 | |
| | | | | | | | |
Trading Companies & Distributors - 1.7% | |
Beacon Roofing Supply, Inc.(1) | | | 352,300 | | | | 5,633 | |
| | | | | | | | |
| INFORMATION TECHNOLOGY - 22.4% | |
Communications Equipment - 1.7% | |
Aruba Networks, Inc.(1) | | | 119,800 | | | | 2,505 | |
Finisar Corporation(1) | | | 181,300 | | | | 3,180 | |
| | | | | | | | |
| | | | | | | 5,685 | |
Electronic Equipment & Instruments - 4.0% | |
Aeroflex Holding Corp.(1) | | | 265,500 | | | | 2,416 | |
Cognex Corporation | | | 166,400 | | | | 4,511 | |
Universal Display Corporation(1) | | | 125,900 | | | | 6,036 | |
| | | | | | | | |
| | | | | | | 12,963 | |
Internet Software & Services - 4.4% | |
LogMeIn, Inc.(1) | | | 130,100 | | | | 4,321 | |
MercadoLibre, Inc. | | | 96,700 | | | | 5,198 | |
OpenTable, Inc.(1) | | | 73,500 | | | | 3,382 | |
Travelzoo Inc.(1) | | | 66,700 | | | | 1,467 | |
| | | | | | | | |
| | | | | | | 14,368 | |
Semiconductors & Semiconductor
Equipment - 1.9% | |
Cavium Networks, Inc.(1) | | | 89,600 | | | | 2,420 | |
Microsemi Corporation(1) | | | 239,300 | | | | 3,824 | |
| | | | | | | | |
| | | | | | | 6,244 | |
Software - 10.4% | |
ANSYS, Inc.(1) | | | 99,600 | | | | 4,884 | |
CommVault Systems, Inc.(1) | | | 209,300 | | | | 7,757 | |
Concur Technologies, Inc.(1) | | | 100,100 | | | | 3,726 | |
Fortinet, Inc.(1) | | | 98,400 | | | | 1,653 | |
Informatica Corporation(1) | | | 109,600 | | | | 4,488 | |
NetSuite Inc.(1) | | | 156,500 | | | | 4,227 | |
OPNET Technologies, Inc. | | | 24,100 | | | | 841 | |
Qlik Technologies Inc.(1) | | | 239,800 | | | | 5,194 | |
RealPage, Inc.(1) | | | 53,200 | | | | 1,088 | |
| | | | | | | | |
| | | | | | | 33,858 | |
| | | | | | | | |
| UTILITIES - 0.3% | | | | | | | | |
Electrical Utilities - 0.3% | | | | | | | | |
ITC Holdings Corp. | | | 10,800 | | | $ | 836 | |
| | | | | | | | |
Total common stocks
(Cost $266,795) | | | | | | | 314,208 | |
| | |
| | | Par
Amount | | | | |
SHORT-TERM INVESTMENTS
(CASH EQUIVALENTS) - 4.3% | | | | | | | | |
Repurchase agreement with Fixed Income Clearing Corporation, 0.01%, dated 9/30/11, due 10/3/11, maturity value $14,180
(Cost $14,180)(5) | | $ | 14,180 | | | $ | 14,180 | |
| | | | | | | | |
| | | | | | | | |
Total investments - 100.5%
(Cost $280,975) | | | | | | | 328,388 | |
| | | | | | | | |
Other assets less liabilities - (0.5%) | | | | | | | (1,688 | ) |
| | | | | | | | |
| | | | | | | | |
Total net assets - 100.0%(6) | | | | | | $ | 326,700 | |
| | | | | | | | |
| (1) | Non-income producing security. |
| (2) | The Fund considers the company to be from India. See the Fund’s Statement of Additional Information for information on how a particular country is assigned. The security trades in U.S. dollars. |
| (4) | Affiliated company as defined by the Investment Company Act of 1940, as amended. See Note (7) in Notes to Financial Statements. |
| | | | | | | | | | | | |
Issuer | | Rate | | | Maturity | | | Value | |
U.S. Treasury Bond | | | 4.625 | % | | | 2/15/2040 | | | $ | 14,469 | |
| (6) | Percentages for the various classifications relate to total net assets. |
Company names are as reported by a data service provider and in some cases are translations; a company’s legal name may be different.
47
| | | | | | |
| TOP TEN HOLDINGS - September 30, 2011 | |
Company Name | | Country | | Percentage
of Total
Net Assets | |
Cepheid | | United States | | | 4.6 | % |
athenahealth, Inc. | | United States | | | 3.7 | |
HMS Holdings Corp. | | United States | | | 3.4 | |
LKQ Corporation | | United States | | | 3.2 | |
Ulta Salon, Cosmetics & Fragrance, Inc. | | United States | | | 3.1 | |
Ares Capital Corporation | | United States | | | 3.0 | |
Hexcel Corporation | | United States | | | 2.8 | |
IDEX Corporation | | United States | | | 2.7 | |
Regeneron Pharmaceuticals, Inc. | | United States | | | 2.6 | |
TreeHouse Foods, Inc. | | United States | | | 2.4 | |
| | | | | | |
Total | | | | | 31.5 | % |
| | | | | | |
For the purpose of determining the Fund’s top ten holdings, securities of the same issuer are aggregated to determine the weight in the Fund.
The accompanying notes are an integral part of the financial statements.
48
ARTISAN SMALL CAP VALUE FUND
Schedule of Investments – September 30, 2011
Dollar values in thousands
| | | | | | | | |
| | | Shares
Held | | | Value | |
| | | | | | | | |
| COMMON STOCKS - 98.5% | | | | | | | | |
| | | | | | | | |
| CONSUMER DISCRETIONARY - 12.1% | | | | | |
Diversified Consumer Services - 3.3% | | | | | |
Coinstar, Inc.(1) | | | 309,200 | | | $ | 12,368 | |
Matthews International Corporation | | | 1,351,113 | | | | 41,560 | |
Regis Corporation | | | 2,268,000 | | | | 31,956 | |
| | | | | | | | |
| | | | | | | 85,884 | |
Hotels, Restaurants & Leisure - 1.1% | | | | | |
Jack in the Box Inc.(1) | | | 1,479,708 | | | | 29,476 | |
| | | | | | | | |
Household Durables - 0.4% | | | | | | | | |
Universal Electronics Inc.(1) | | | 723,400 | | | | 11,856 | |
| | | | | | | | |
Internet & Catalog Retail - 0.3% | | | | | | | | |
PetMed Express, Inc. | | | 832,500 | | | | 7,492 | |
| | | | | | | | |
Media - 2.9% | | | | | | | | |
Arbitron Inc. | | | 513,500 | | | | 16,987 | |
DreamWorks Animation SKG, Inc., Class A(1) | | | 1,659,300 | | | | 30,166 | |
Meredith Corporation | | | 1,225,355 | | | | 27,742 | |
| | | | | | | | |
| | | | | | | 74,895 | |
Specialty Retail - 2.6% | | | | | | | | |
Rent-A-Center, Inc. | | | 2,498,662 | | | | 68,588 | |
| | | | | | | | |
Textiles, Apparel & Luxury
Goods - 1.5% | | | | | |
Skechers U.S.A., Inc., Class A(1) | | | 2,241,100 | | | | 31,443 | |
The Warnaco Group, Inc.(1) | | | 146,100 | | | | 6,734 | |
| | | | | | | | |
| | | | | | | 38,177 | |
| CONSUMER STAPLES - 1.5% | | | | | | | | |
Food Products - 1.5% | | | | | | | | |
Cal-Maine Foods, Inc. | | | 896,900 | | | | 28,190 | |
Darling International Inc.(1) | | | 886,700 | | | | 11,163 | |
| | | | | | | | |
| | | | | | | 39,353 | |
Tobacco - 0.0%(2) | | | | | | | | |
Universal Corporation | | | 31,400 | | | | 1,126 | |
| | | | | | | | |
| ENERGY - 10.4% | | | | | | | | |
Energy Equipment & Services - 4.2% | | | | | |
Cal Dive International, Inc.(1) | | | 1,619,141 | | | | 3,092 | |
GulfMark Offshore, Inc.(1) | | | 657,800 | | | | 23,904 | |
Parker Drilling Company(1) | | | 3,095,347 | | | | 13,589 | |
| | | | | | | | |
| ENERGY (CONTINUED) | | | | | | | | |
Energy Equipment &
Services (Continued) | | | | | |
SEACOR Holdings Inc. | | | 221,600 | | | $ | 17,774 | |
Superior Energy Services, Inc.(1) | | | 541,125 | | | | 14,199 | |
Tidewater Inc. | | | 861,300 | | | | 36,218 | |
| | | | | | | | |
| | | | | | | 108,776 | |
Oil, Gas & Consumable Fuels - 6.2% | | | | | |
Cloud Peak Energy Inc.(1) | | | 2,473,200 | | | | 41,921 | |
Comstock Resources, Inc.(1) | | | 1,957,290 | | | | 30,260 | |
Forest Oil Corporation(1) | | | 2,301,790 | | | | 33,146 | |
Lone Pine Resources Inc.(1)(3)(4) | | | 1,423,000 | | | | 9,392 | |
Penn Virginia Corporation(5) | | | 2,298,900 | | | | 12,805 | |
World Fuel Services Corporation | | | 1,091,800 | | | | 35,647 | |
| | | | | | | | |
| | | | | | | 163,171 | |
| FINANCIALS - 8.9% | | | | | | | | |
Commercial Banks - 0.5% | | | | | | | | |
First Financial Bancorp | | | 939,800 | | | | 12,969 | |
| | | | | | | | |
Diversified Financial Services - 1.0% | | | | | |
PICO Holdings, Inc.(1)(5) | | | 1,323,090 | | | | 27,137 | |
| | | | | | | | |
Insurance - 3.4% | | | | | | | | |
Allied World Assurance Company Holdings, Ltd | | | 342,455 | | | | 18,393 | |
Alterra Capital Holdings Limited | | | 600,975 | | | | 11,400 | |
Endurance Specialty Holdings Ltd. | | | 697,823 | | | | 23,831 | |
Platinum Underwriters Holdings, Ltd. | | | 1,134,500 | | | | 34,886 | |
| | | | | | | | |
| | | | | | | 88,510 | |
Real Estate Investment Trusts
(REITS) - 4.0% | | | | | |
Anworth Mortgage Asset Corporation | | | 1,816,300 | | | | 12,351 | |
Cypress Sharpridge Investments, Inc. | | | 1,322,300 | | | | 15,987 | |
Hatteras Financial Corp.(5) | | | 1,812,500 | | | | 45,602 | |
Pebblebrook Hotel Trust | | | 904,794 | | | | 14,160 | |
Potlatch Corporation | | | 500,501 | | | | 15,776 | |
| | | | | | | | |
| | | | | | | 103,876 | |
| HEALTHCARE - 2.4% | | | | | | | | |
Biotechnology - 0.4% | | | | | | | | |
Enzon Pharmaceuticals, Inc.(1) | | | 1,575,300 | | | | 11,090 | |
| | | | | | | | |
Health Care Equipment &
Supplies - 1.4% | | | | | |
CONMED Corporation(1)(5) | | | 1,574,059 | | | | 36,219 | |
49
| | | | | | | | |
| | | Shares
Held | | | Value | |
| | | | | | | | |
| HEALTHCARE (CONTINUED) | | | | | | | | |
Life Sciences Tools & Services - 0.6% | | | | | |
ICON PLC (DR)(1)(3)(5) | | | 921,041 | | | $ | 14,810 | |
| | | | | | | | |
| INDUSTRIALS - 27.6% | | | | | | | | |
Aerospace & Defense - 2.7% | | | | | | | | |
Curtiss-Wright Corporation | | | 605,400 | | | | 17,454 | |
Spirit AeroSystems Holdings, Inc., Class A(1) | | | 2,045,879 | | | | 32,632 | |
Teledyne Technologies Incorporated(1) | | | 393,572 | | | | 19,230 | |
| | | | | | | | |
| | | | | | | 69,316 | |
Air Freight & Logistics - 1.0% | | | | | | | | |
Atlas Air Worldwide Holdings, Inc.(1) | | | 783,300 | | | | 26,076 | |
| | | | | | | | |
Airlines - 1.1% | | | | | | | | |
Allegiant Travel Company(1) | | | 379,900 | | | | 17,905 | |
Hawaiian Holdings, Inc.(1)(5) | | | 2,548,300 | | | | 10,728 | |
| | | | | | | | |
| | | | | | | 28,633 | |
Building Products - 0.9% | | | | | | | | |
Quanex Building Products Corporation(5) | | | 1,909,726 | | | | 20,911 | |
Simpson Manufacturing Co., Inc. | | | 107,400 | | | | 2,677 | |
| | | | | | | | |
| | | | | | | 23,588 | |
Commercial Services & Supplies - 3.6% | | | | | |
Quad/Graphics, Inc., Class A | | | 920,600 | | | | 16,635 | |
Sykes Enterprises, Incorporated(1)(5) | | | 3,130,694 | | | | 46,804 | |
Tetra Tech, Inc.(1) | | | 1,599,900 | | | | 29,982 | |
| | | | | | | | |
| | | | | | | 93,421 | |
Construction & Engineering - 4.8% | | | | | | | | |
Comfort Systems USA, Inc.(5) | | | 2,698,526 | | | | 22,452 | |
EMCOR Group, Inc.(1) | | | 2,711,862 | | | | 55,132 | |
Granite Construction Incorporated | | | 1,420,662 | | | | 26,666 | |
ORION MARINE GROUP, INC.(1)(5) | | | 1,851,400 | | | | 10,683 | |
Tutor Perini Corporation | | | 868,200 | | | | 9,976 | |
| | | | | | | | |
| | | | | | | 124,909 | |
Electrical Equipment - 1.3% | | | | | | | | |
Encore Wire Corporation | | | 223,600 | | | | 4,602 | |
Woodward, Inc. | | | 1,038,233 | | | | 28,448 | |
| | | | | | | | |
| | | | | | | 33,050 | |
Machinery - 3.6% | | | | | | | | |
Astec Industries, Inc.(1) | | | 967,681 | | | | 28,334 | |
Harsco Corporation | | | 294,800 | | | | 5,716 | |
Kaydon Corporation | | | 687,700 | | | | 19,723 | |
Mueller Industries, Inc. | | | 1,019,824 | | | | 39,355 | |
| | | | | | | | |
| | | | | | | 93,128 | |
Marine - 0.8% | | | | | | | | |
Kirby Corporation(1) | | | 390,902 | | | | 20,577 | |
| | | | | | | | |
Professional Services - 6.4% | | | | | | | | |
CRA International, Inc.(1)(5) | | | 661,700 | | | | 13,241 | |
FTI Consulting, Inc.(1) | | | 1,849,765 | | | | 68,090 | |
Kforce Inc.(1) | | | 1,732,600 | | | | 16,997 | |
| | | | | | | | |
| INDUSTRIALS (CONTINUED) | | | | | | | | |
Professional Services (Continued) | | | | | | | | |
School Specialty, Inc.(1)(5) | | | 1,769,253 | | | $ | 12,615 | |
Towers Watson & Co., Class A | | | 700,987 | | | | 41,905 | |
TrueBlue, Inc.(1) | | | 1,309,688 | | | | 14,839 | |
| | | | | | | | |
| | | | | | | 167,687 | |
Road & Rail - 1.4% | | | | | | | | |
Ryder System, Inc. | | | 981,864 | | | | 36,830 | |
| | | | | | | | |
| INFORMATION TECHNOLOGY - 23.9% | | | | | |
Communications Equipment - 0.5% | | | | | |
Ixia(1) | | | 1,606,300 | | | | 12,320 | |
| | | | | | | | |
Computers & Peripherals - 5.1% | | | | | | | | |
Diebold, Incorporated | | | 2,122,366 | | | | 58,386 | |
Intermec, Inc.(1) | | | 1,618,919 | | | | 10,555 | |
Lexmark International, Inc.(1)(5) | | | 1,471,587 | | | | 39,777 | |
QLogic Corporation(1) | | | 1,896,300 | | | | 24,045 | |
| | | | | | | | |
| | | | | | | 132,763 | |
Electronic Equipment &
Instruments - 4.2% | |
Arrow Electronics, Inc.(1)(5) | | | 1,317,447 | | | | 36,599 | |
AVX Corporation | | | 169,200 | | | | 2,008 | |
Benchmark Electronics, Inc.(1) | | | 1,343,101 | | | | 17,474 | |
Orbotech, Ltd.(1)(3) | | | 713,214 | | | | 6,904 | |
Power-One, Inc.(1) | | | 3,083,600 | | | | 13,876 | |
RadiSys Corporation(1) | | | 1,200,597 | | | | 7,348 | |
Tech Data Corporation(1) | | | 590,000 | | | | 25,506 | |
| | | | | | | | |
| | | | | | | 109,715 | |
Internet Software & Services - 1.2% | | | | | |
EarthLink, Inc. | | | 4,763,540 | | | | 31,106 | |
| | | | | | | | |
IT Services - 3.5% | | | | | | | | |
CACI International Inc(1) | | | 847,650 | | | | 42,332 | |
CoreLogic, Inc.(1) | | | 1,631,500 | | | | 17,408 | |
ManTech International Corporation, Class A | | | 978,168 | | | | 30,695 | |
| | | | | | | | |
| | | | | | | 90,435 | |
Semiconductors & Semiconductor
Equipment - 4.0% | |
Intersil Corporation | | | 4,606,300 | | | | 47,399 | |
Lattice Semiconductor Corporation(1) | | | 2,609,000 | | | | 13,697 | |
Rudolph Technologies, Inc.(1) | | | 1,343,628 | | | | 8,989 | |
Ultratech, Inc.(1)(5) | | | 1,948,353 | | | | 33,414 | |
| | | | | | | | |
| | | | | | | 103,499 | |
Software - 5.4% | | | | | | | | |
Manhattan Associates, Inc.(1)(5) | | | 1,184,624 | | | | 39,187 | |
MicroStrategy Incorporated, Class A(1) | | | 237,571 | | | | 27,100 | |
Progress Software Corporation(1) | | | 2,249,723 | | | | 39,483 | |
Rosetta Stone Inc.(1)(5) | | | 1,179,600 | | | | 10,793 | |
50
| | | | | | | | |
| | | Shares
Held | | | Value | |
| | | | | | | | |
INFORMATION
TECHNOLOGY (CONTINUED) | | | | | |
Software (Continued) | | | | | | | | |
Websense, Inc.(1) | | | 1,417,637 | | | $ | 24,525 | |
| | | | | | | | |
| | | | | | | 141,088 | |
| MATERIALS - 5.9% | | | | | | | | |
Chemicals - 4.9% | | | | | | | | |
H.B. Fuller Company(5) | | | 3,158,433 | | | | 57,547 | |
Minerals Technologies Inc. | | | 503,800 | | | | 24,822 | |
Sensient Technologies Corporation | | | 1,408,815 | | | | 45,857 | |
| | | | | | | | |
| | | | | | | 128,226 | |
Construction Materials - 0.5% | | | | | |
Eagle Materials Inc. | | | 738,019 | | | | 12,288 | |
| | | | | | | | |
Metals & Mining - 0.5% | | | | | | | | |
Schnitzer Steel Industries, Inc., Class A | | | 383,000 | | | | 14,094 | |
| | | | | | | | |
| TELECOMMUNICATION SERVICES - 1.5% | | | | | |
Diversified Telecommunication
Services - 1.5% | |
Atlantic Tele-Network, Inc. | | | 667,700 | | | | 21,954 | |
Neutral Tandem, Inc.(1)(5) | | | 1,850,400 | | | | 17,912 | |
| | | | | | | | |
| | | | | | | 39,866 | |
| UTILITIES - 4.3% | | | | | | | | |
Electrical Utilities - 4.2% | | | | | | | | |
ALLETE, Inc. | | | 601,987 | | | | 22,051 | |
Cleco Corporation | | | 1,216,771 | | | | 41,540 | |
IDACORP, Inc. | | | 152,197 | | | | 5,750 | |
Portland General Electric Company | | | 1,670,980 | | | | 39,585 | |
| | | | | | | | |
| | | | | | | 108,926 | |
Multi-Utilities - 0.1% | | | | | | | | |
NorthWestern Corporation | | | 106,748 | | | | 3,409 | |
| | | | | | | | |
Total common stocks
(Cost $2,816,973) | | | | | | | 2,568,355 | |
| | |
| | | Par
Amount | | | | |
SHORT-TERM INVESTMENTS
(CASH EQUIVALENTS) - 1.6% | | | | | |
Repurchase agreement with Fixed
Income Clearing Corporation, 0.01%, dated 9/30/11, due 10/3/11,
maturity value $41,200
(Cost $41,200)(6) | | $ | 41,200 | | | $ | 41,200 | |
| | | | | | | | |
| | | | | | | | |
Total investments - 100.1%
(Cost $2,858,173) | | | | | | | 2,609,555 | |
| | | | | | | | |
Other assets less liabilities - (0.1%) | | | | | | | (2,292 | ) |
| | | | | | | | |
| | | | | | | | |
Total net assets - 100.0%(7) | | | | | | $ | 2,607,263 | |
| | | | | | | | |
| (1) | Non-income producing security. |
| (2) | Represents less than 0.1% of total net assets. |
| (3) | The Fund considers the company to be from outside of the United States. See the Fund’s Statement of Additional Information for information on how a particular country is assigned. |
| | | | |
Security | | Country | | Trading Currency |
ICON PLC (DR) | | Ireland | | US dollar |
Lone Pine Resources Inc. | | Canada | | US dollar |
Orbotech, Ltd. | | Israel | | US dollar |
| (5) | Affiliated company as defined by the Investment Company Act of 1940, as amended. See Note (7) in Notes to Financial Statements. |
| | | | | | | | | | | | |
Issuer | | Rate | | | Maturity | | | Value | |
U.S. Treasury Bond | | | 4.625 | % | | | 2/15/2040 | | | $ | 42,029 | |
| (7) | Percentages for the various classifications relate to total net assets. |
Company names are as reported by a data service provider and in some cases are translations; a company’s legal name may be different.
(DR) Depositary Receipt, voting rights may vary.
| | | | | | |
| TOP TEN HOLDINGS - September 30, 2011 | |
Company Name | | Country | | Percentage
of Total
Net Assets | |
Rent-A-Center, Inc. | | United States | | | 2.6 | % |
FTI Consulting, Inc. | | United States | | | 2.6 | |
Diebold, Incorporated | | United States | | | 2.2 | |
H.B. Fuller Company | | United States | | | 2.2 | |
EMCOR Group, Inc. | | United States | | | 2.1 | |
Intersil Corporation | | United States | | | 1.8 | |
Sykes Enterprises, Incorporated | | United States | | | 1.8 | |
Sensient Technologies Corporation | | United States | | | 1.8 | |
Hatteras Financial Corp. | | United States | | | 1.7 | |
CACI International Inc | | United States | | | 1.6 | |
| | | | | | |
Total | | | | | 20.4 | % |
| | | | | | |
For the purpose of determining the Fund’s top ten holdings, securities of the same issuer are aggregated to determine the weight in the Fund.
The Fund owns Forest Oil Corp, which represents 1.3% of the Fund’s total net assets, and Lone Pine Resources Inc., which represents 0.4% of the Fund’s total net assets. Forest Oil Corp is the parent company of Lone Pine Resources Inc. If you aggregated the Fund’s holdings of both securities, the aggregated amount would be one of the Fund’s top ten holdings.
The accompanying notes are an integral part of the financial statements.
51
ARTISAN VALUE FUND
Schedule of Investments – September 30, 2011
Dollar values in thousands
| | | | | | | | |
| | | Shares
Held | | | Value | |
| | | | | | | | |
| COMMON STOCKS - 97.5% | | | | | | | | |
| | | | | | | | |
| CONSUMER DISCRETIONARY - 9.1% | | | | | |
Diversified Consumer Services - 2.4% | | | | | |
H&R Block, Inc. | | | 829,900 | | | $ | 11,046 | |
| | | | | | | | |
Hotels, Restaurants & Leisure - 2.8% | |
Carnival Corporation & plc | | | 427,500 | | | | 12,953 | |
| | | | | | | | |
Multiline Retail - 3.9% | | | | | | | | |
Target Corporation | | | 369,900 | | | | 18,140 | |
| | | | | | | | |
| CONSUMER STAPLES - 10.3% | | | | | | | | |
Food & Staples Retailing - 8.2% | | | | | | | | |
Tesco plc(1)(2) | | | 2,901,800 | | | | 16,974 | |
Wal-Mart Stores, Inc. | | | 401,400 | | | | 20,833 | |
| | | | | | | | |
| | | | | | | 37,807 | |
Food Products - 2.1% | | | | | | | | |
Unilever PLC (DR)(2) | | | 303,760 | | | | 9,474 | |
| | | | | | | | |
| ENERGY - 10.8% | | | | | | | | |
Oil, Gas & Consumable Fuels - 10.8% | |
Apache Corporation | | | 203,100 | | | | 16,297 | |
Chesapeake Energy Corporation | | | 366,100 | | | | 9,354 | |
Cimarex Energy Co. | | | 260,700 | | | | 14,521 | |
Exxon Mobil Corporation | | | 130,200 | | | | 9,456 | |
| | | | | | | | |
| | | | | | | 49,628 | |
| FINANCIALS - 27.4% | | | | | | | | |
Capital Markets - 6.4% | | | | | | | | |
The Bank of New York Mellon Corporation | | | 991,500 | | | | 18,432 | |
The Goldman Sachs Group, Inc. | | | 118,300 | | | | 11,185 | |
| | | | | | | | |
| | | | | | | 29,617 | |
Insurance - 18.9% | | | | | | | | |
Aflac Incorporated | | | 292,900 | | | | 10,237 | |
The Allstate Corporation | | | 414,750 | | | | 9,825 | |
Arch Capital Group Ltd.(3)(4) | | | 439,300 | | | | 14,354 | |
Berkshire Hathaway Inc., Class B(3) | | | 346,930 | | | | 24,646 | |
The Chubb Corporation | | | 254,900 | | | | 15,292 | |
The Progressive Corporation | | | 727,600 | | | | 12,922 | |
| | | | | | | | |
| | | | | | | 87,276 | |
| | | | | | | | |
| FINANCIALS (CONTINUED) | | | | | | | | |
Real Estate Investment Trusts
(REITS) - 2.1% | |
Annaly Capital Management, Inc. | | | 580,400 | | | $ | 9,652 | |
| | | | | | | | |
| HEALTHCARE - 2.9% | | | | | | | | |
Health Care Providers & Services - 2.9% | | | | | |
CIGNA Corporation | | | 320,000 | | | | 13,421 | |
| | | | | | | | |
| INDUSTRIALS - 2.6% | | | | | | | | |
Construction & Engineering - 2.6% | | | | | | | | |
Jacobs Engineering Group Inc.(3) | | | 374,300 | | | | 12,086 | |
| | | | | | | | |
| INFORMATION TECHNOLOGY - 34.4% | |
Communications Equipment - 5.3% | | | | | | | | |
Cisco Systems, Inc. | | | 1,586,500 | | | | 24,575 | |
| | | | | | | | |
Computers & Peripherals - 8.7% | | | | | | | | |
Apple Inc.(3) | | | 82,400 | | | | 31,409 | |
Hewlett-Packard Company | | | 396,000 | | | | 8,890 | |
| | | | | | | | |
| | | | | | | 40,299 | |
Electronic Equipment &
Instruments - 6.8% | |
Avnet, Inc.(3) | | | 585,800 | | | | 15,278 | |
Ingram Micro Inc.(3)(4) | | | 1,000,700 | | | | 16,141 | |
| | | | | | | | |
| | | | | | | 31,419 | |
IT Services - 5.0% | | | | | | | | |
Total System Services, Inc. | | | 656,300 | | | | 11,111 | |
The Western Union Company | | | 794,700 | | | | 12,151 | |
| | | | | | | | |
| | | | | | | 23,262 | |
Semiconductors & Semiconductor
Equipment - 3.4% | |
Texas Instruments Incorporated | | | 593,900 | | | $ | 15,828 | |
| | | | | | | | |
Software - 5.2% | | | | | | | | |
Microsoft Corporation | | | 965,500 | | | | 24,031 | |
| | | | | | | | |
Total common stocks
(Cost $474,554) | | | | | | | 450,514 | |
52
| | | | | | | | |
| | | Par
Amount | | | Value | |
SHORT-TERM INVESTMENTS
(CASH EQUIVALENTS) - 2.3% | |
Repurchase agreement with Fixed Income Clearing Corporation, 0.01%, dated 9/30/11, due 10/3/11, maturity value $10,526
(Cost $10,526)(5) | | $ | 10,526 | | | $ | 10,526 | |
| | | | | | | | |
| | | | | | | | |
Total investments - 99.8%
(Cost $485,080) | | | | | | | 461,040 | |
| | | | | | | | |
Other assets less liabilities - 0.2% | | | | | | | 1,122 | |
| | | | | | | | |
| | | | | | | | |
Total net assets - 100.0%(6) | | | | | | $ | 462,162 | |
| | | | | | | | |
| (1) | Valued at a fair value in accordance with procedures established by the board of directors of Artisan Funds. In total, securities valued at a fair value were $16,974 or 3.7% of total net assets. See notes 2(a) and 2(b) in Notes to Financial Statements for additional information. |
| (2) | The Fund considers the company to be from outside of the United States. See the Fund’s Statement of Additional Information for information on how a particular country is assigned. |
| | | | |
Security | | Country | | Trading Currency |
Tesco plc | | United Kingdom | | British pound |
Unilever PLC (DR) | | United Kingdom | | US dollar |
| (3) | Non-income producing security. |
| (4) | Affiliated company as defined by the Investment Company Act of 1940, as amended. See Note (7) in Notes to Financial Statements. |
| | | | | | | | | | | | |
Issuer | | Rate | | | Maturity | | | Value | |
U.S. Treasury Bond | | | 4.625 | % | | | 2/15/2040 | | | $ | 7,460 | |
U.S. Treasury Note | | | 2.375 | % | | | 6/30/2018 | | | | 3,281 | |
| | | | | | | | | | | | |
| | | | | | | | | | $ | 10,741 | |
| | | | | | | | | | | | |
| (6) | Percentages for the various classifications relate to total net assets. |
Company names are as reported by a data service provider and in some cases are translations; a company’s legal name may be different.
(DR) Depositary Receipt, voting rights may vary.
| | | | | | |
| TOP TEN HOLDINGS - September 30, 2011 | |
Company Name | | Country | | Percentage
of Total
Net Assets | |
Apple Inc. | | United States | | | 6.8 | % |
Berkshire Hathaway Inc. | | United States | | | 5.3 | |
Cisco Systems, Inc. | | United States | | | 5.3 | |
Microsoft Corporation | | United States | | | 5.2 | |
Wal-Mart Stores, Inc. | | United States | | | 4.5 | |
The Bank of New York Mellon Corporation | | United States | | | 4.0 | |
Target Corporation | | United States | | | 3.9 | |
Tesco plc | | United Kingdom | | | 3.7 | |
Apache Corporation | | United States | | | 3.5 | |
Ingram Micro Inc. | | United States | | | 3.5 | |
| | | | | | |
Total | | | | | 45.7 | % |
| | | | | | |
For the purpose of determining the Fund’s top ten holdings, securities of the same issuer are aggregated to determine the weight in the Fund.
The accompanying notes are an integral part of the financial statements.
53
ARTISAN FUNDS
Statements of Assets and Liabilities – September 30, 2011
Dollar values in thousands, except per share amounts
| | | | | | | | |
| | | GLOBAL EQUITY | | | GLOBAL VALUE | |
| ASSETS: | | | | | | | | |
Investments in securities, unaffiliated, at value | | $ | 10,523 | | | $ | 59,581 | |
Investments in securities, affiliated, at value | | | - | | | | 2,565 | |
Short-term investments (repurchase agreements), at value | | | 541 | | | | 4,589 | |
| | | | | | | | |
Total investments | | | 11,064 | | | | 66,735 | |
Cash | | | 1 | | | | - | (1) |
Foreign currency | | | 2 | | | | - | (1) |
Unrealized gain on foreign currency contracts | | | 2 | | | | 16 | |
Receivable from investments sold | | | 134 | | | | 317 | |
Receivable from fund shares sold | | | 5 | | | | 262 | |
Dividends and interest receivable | | | 24 | | | | 123 | |
Receivable from Adviser | | | 28 | | | | 21 | |
| | | | | | | | |
Total assets | | | 11,260 | | | | 67,474 | |
| | |
| LIABILITIES: | | | | | | | | |
Unrealized loss on foreign currency contracts | | | 1 | | | | 2 | |
Payable for investments purchased | | | 146 | | | | 1,149 | |
Payable for fund shares redeemed | | | - | | | | 25 | |
Payable for operating expenses | | | 76 | | | | 86 | |
Payable for advisory fees | | | 128 | | | | 543 | |
Payable for foreign taxes | | | 1 | | | | 3 | |
| | | | | | | | |
Total liabilities | | | 352 | | | | 1,808 | |
| | | | | | | | |
Total net assets | | $ | 10,908 | | | $ | 65,666 | |
| | | | | | | | |
| NET ASSETS CONSIST OF: | | | | | | | | |
Fund shares issued and outstanding | | $ | 11,191 | | | $ | 63,473 | |
Net unrealized appreciation (depreciation) on investments and foreign currency related transactions | | | (464 | ) | | | 1,605 | |
Accumulated undistributed net investment income (loss) | | | 27 | | | | (325 | ) |
Accumulated undistributed net realized gains on investments and foreign currency related transactions | | | 154 | | | | 913 | |
| | | | | | | | |
| | $ | 10,908 | | | $ | 65,666 | |
| | | | | | | | |
| SUPPLEMENTARY INFORMATION: | | | | | | | | |
Net assets | | | | | | | | |
Investor Shares | | $ | 10,908 | | | $ | 65,666 | |
Shares outstanding (Indefinite number of shares authorized, $0.01 par value) | | | | | | | | |
Investor Shares | | | 1,109,659 | | | | 7,077,121 | |
Net asset value, offering price and redemption price per share | | | | | | | | |
Investor Shares | | $ | 9.83 | | | $ | 9.28 | |
Cost of securities of unaffiliated issuers held | | $ | 11,527 | | | $ | 63,218 | |
Cost of securities of affiliated issuers held | | $ | - | | | $ | 1,926 | |
Cost of foreign currency | | $ | 2 | | | $ | - | (1) |
| (1) | Amount rounds to less than $1. |
The accompanying notes are an integral part of the financial statements.
54
ARTISAN FUNDS
Statements of Assets and Liabilities – September 30, 2011 (Continued)
Dollar values in thousands, except per share amounts
| | | | | | | | |
| | | GROWTH
OPPORTUNITIES | | | INTERNATIONAL | |
| ASSETS: | | | | | | | | |
Investments in securities, unaffiliated, at value | | $ | 143,299 | | | $ | 7,547,301 | |
Short-term investments (repurchase agreements), at value | | | 10,298 | | | | 246,213 | |
| | | | | | | | |
Total investments | | | 153,597 | | | | 7,793,514 | |
Cash | | | - | (1) | | | 1 | |
Foreign currency | | | 38 | | | | 110 | |
Unrealized gain on foreign currency contracts | | | 7 | | | | 177 | |
Receivable from investments sold | | | 2,973 | | | | 74,930 | |
Receivable from fund shares sold | | | 117 | | | | 78,968 | |
Dividends and interest receivable | | | 96 | | | | 23,509 | |
Receivable from Adviser | | | 17 | | | | - | |
| | | | | | | | |
Total assets | | | 156,845 | | | | 7,971,209 | |
| | |
| LIABILITIES: | | | | | | | | |
Unrealized loss on foreign currency contracts | | | 2 | | | | 317 | |
Payable for investments purchased | | | 950 | | | | 119,321 | |
Payable for fund shares redeemed | | | 27 | | | | 20,304 | |
Payable for operating expenses | | | 115 | | | | 3,519 | |
Payable for foreign taxes | | | 24 | | | | 1,340 | |
| | | | | | | | |
Total liabilities | | | 1,118 | | | | 144,801 | |
| | | | | | | | |
Total net assets | | $ | 155,727 | | | $ | 7,826,408 | |
| | | | | | | | |
| NET ASSETS CONSIST OF: | | | | | | | | |
Fund shares issued and outstanding | | $ | 152,783 | | | $ | 9,921,895 | |
Net unrealized appreciation (depreciation) on investments and foreign currency related transactions | | | 2,822 | | | | (304,086 | ) |
Accumulated undistributed net investment income (loss) | | | (412 | ) | | | 121,055 | |
Accumulated undistributed net realized gains (losses) on investments and foreign currency related transactions | | | 534 | | | | (1,912,456 | ) |
| | | | | | | | |
| | $ | 155,727 | | | $ | 7,826,408 | |
| | | | | | | | |
| SUPPLEMENTARY INFORMATION: | | | | | | | | |
Net assets | | | | | | | | |
Investor Shares | | $ | 142,758 | | | $ | 5,837,067 | |
Institutional Shares | | $ | 12,969 | | | $ | 1,989,341 | |
Shares outstanding (Indefinite number of shares authorized, $0.01 par value) | | | | | | | | |
Investor Shares | | | 13,100,025 | | | | 317,791,282 | |
Institutional Shares | | | 1,191,589 | | | | 107,522,505 | |
Net asset value, offering price and redemption price per share | | | | | | | | |
Investor Shares | | $ | 10.90 | | | $ | 18.37 | |
Institutional Shares | | $ | 10.88 | | | $ | 18.50 | |
Cost of securities of unaffiliated issuers held | | $ | 150,764 | | | $ | 8,096,797 | |
Cost of foreign currency | | $ | 39 | | | $ | 119 | |
| (1) | Amount rounds to less than $1. |
The accompanying notes are an integral part of the financial statements.
55
ARTISAN FUNDS
Statements of Assets and Liabilities – September 30, 2011 (Continued)
Dollar values in thousands, except per share amounts
| | | | | | | | |
| | | INTERNATIONAL
SMALL CAP | | | INTERNATIONAL
VALUE | |
| ASSETS: | | | | | | | | |
Investments in securities, unaffiliated, at value | | $ | 508,107 | | | $ | 3,680,655 | |
Investments in securities, affiliated, at value | | | - | | | | 407,224 | |
Short-term investments (repurchase agreements), at value | | | 50,781 | | | | 128,934 | |
| | | | | | | | |
Total investments | | | 558,888 | | | | 4,216,813 | |
Cash | | | - | (1) | | | 1 | |
Foreign currency | | | 27 | | | | 163 | |
Unrealized gain on foreign currency contracts | | | 1 | | | | 2,107 | |
Receivable from investments sold | | | - | | | | 38,361 | |
Receivable from fund shares sold | | | 758 | | | | 15,990 | |
Dividends and interest receivable | | | 1,200 | | | | 14,949 | |
| | | | | | | | |
Total assets | | | 560,874 | | �� | | 4,288,384 | |
| | |
| LIABILITIES: | | | | | | | | |
Unrealized loss on foreign currency contracts | | | 16 | | | | 69 | |
Payable for investments purchased | | | 3,641 | | | | 6,151 | |
Payable for fund shares redeemed | | | 2,240 | | | | 4,888 | |
Payable for operating expenses | | | 234 | | | | 1,359 | |
Payable for foreign taxes | | | 17 | | | | 435 | |
| | | | | | | | |
Total liabilities | | | 6,148 | | | | 12,902 | |
| | | | | | | | |
Total net assets | | $ | 554,726 | | | $ | 4,275,482 | |
| | | | | | | | |
| | |
| NET ASSETS CONSIST OF: | | | | | | | | |
Fund shares issued and outstanding | | $ | 563,018 | | | $ | 4,347,141 | |
Net unrealized appreciation (depreciation) on investments and foreign currency related transactions | | | 36,026 | | | | (27,868 | ) |
Accumulated undistributed net investment income (loss) | | | 2,367 | | | | (12,850 | ) |
Accumulated undistributed net realized losses on investments and foreign currency related transactions | | | (46,685 | ) | | | (30,941 | ) |
| | | | | | | | |
| | $ | 554,726 | | | $ | 4,275,482 | |
| | | | | | | | |
| | |
| SUPPLEMENTARY INFORMATION: | | | | | | | | |
Net assets | | | | | | | | |
Investor Shares | | $ | 554,726 | | | $ | 3,232,649 | |
Institutional Shares | | | | | | $ | 1,042,833 | |
Shares outstanding (Indefinite number of shares authorized, $0.01 par value) | | | | | | | | |
Investor Shares | | | 33,751,009 | | | | 137,916,092 | |
Institutional Shares | | | | | | | 44,432,407 | |
Net asset value, offering price and redemption price per share | | | | | | | | |
Investor Shares | | $ | 16.44 | | | $ | 23.44 | |
Institutional Shares | | | | | | $ | 23.47 | |
Cost of securities of unaffiliated issuers held | | $ | 522,838 | | | $ | 3,869,535 | |
Cost of securities of affiliated issuers held | | $ | - | | | $ | 377,261 | |
Cost of foreign currency | | $ | 28 | | | $ | 171 | |
| (1) | Amount rounds to less than $1. |
The accompanying notes are an integral part of the financial statements.
56
ARTISAN FUNDS
Statements of Assets and Liabilities – September 30, 2011 (Continued)
Dollar values in thousands, except per share amounts
| | | | | | | | |
| | | MID CAP | | | MID CAP VALUE | |
| ASSETS: | | | | | | | | |
Investments in securities, unaffiliated, at value | | $ | 4,673,926 | | | $ | 5,284,397 | |
Investments in securities, affiliated, at value | | | 116,481 | | | | 713,283 | |
Short-term investments (repurchase agreements), at value | | | 241,658 | | | | 208,269 | |
| | | | | | | | |
Total investments | | | 5,032,065 | | | | 6,205,949 | |
Cash | | | 1 | | | | - | (1) |
Receivable from investments sold | | | 23,902 | | | | 407 | |
Receivable from fund shares sold | | | 6,484 | | | | 23,540 | |
Dividends and interest receivable | | | 1,750 | | | | 18,033 | |
| | | | | | | | |
Total assets | | | 5,064,202 | | | | 6,247,929 | |
| | |
| LIABILITIES: | | | | | | | | |
Payable for investments purchased | | | 46,537 | | | | 9,158 | |
Payable for fund shares redeemed | | | 4,120 | | | | 35,275 | |
Payable for operating expenses | | | 2,789 | | | | 3,032 | |
| | | | | | | | |
Total liabilities | | | 53,446 | | | | 47,465 | |
| | | | | | | | |
Total net assets | | $ | 5,010,756 | | | $ | 6,200,464 | |
| | | | | | | | |
| | |
| NET ASSETS CONSIST OF: | | | | | | | | |
Fund shares issued and outstanding | | $ | 3,982,761 | | | $ | 5,701,978 | |
Net unrealized appreciation on investments and foreign currency related transactions | | | 1,138,867 | | | | 29,298 | |
Accumulated undistributed net investment income | | | - | | | | 24,143 | |
Accumulated undistributed net realized gains (losses) on investments and foreign currency related transactions | | | (110,872 | ) | | | 445,045 | |
| | | | | | | | |
| | $ | 5,010,756 | | | $ | 6,200,464 | |
| | | | | | | | |
| | |
| SUPPLEMENTARY INFORMATION: | | | | | | | | |
Net assets | | | | | | | | |
Investor Shares | | $ | 4,500,786 | | | $ | 6,200,464 | |
Institutional Shares | | $ | 509,970 | | | | | |
Shares outstanding (Indefinite number of shares authorized, $0.01 par value) | | | | | | | | |
Investor Shares | | | 144,527,373 | | | | 328,334,672 | |
Institutional Shares | | | 15,822,765 | | | | | |
Net asset value, offering price and redemption price per share | | | | | | | | |
Investor Shares | | $ | 31.14 | | | $ | 18.88 | |
Institutional Shares | | $ | 32.23 | | | | | |
Cost of securities of unaffiliated issuers held | | $ | 3,813,634 | | | $ | 5,462,114 | |
Cost of securities of affiliated issuers held | | $ | 79,564 | | | $ | 714,537 | |
| (1) | Amount rounds to less than $1. |
The accompanying notes are an integral part of the financial statements.
57
ARTISAN FUNDS
Statements of Assets and Liabilities – September 30, 2011 (Continued)
Dollar values in thousands, except per share amounts
| | | | | | | | |
| | | SMALL CAP | | | SMALL CAP
VALUE | |
| ASSETS: | | | | | | | | |
Investments in securities, unaffiliated, at value | | $ | 302,030 | | | $ | 2,059,119 | |
Investments in securities, affiliated, at value | | | 12,178 | | | | 509,236 | |
Short-term investments (repurchase agreements), at value | | | 14,180 | | | | 41,200 | |
| | | | | | | | |
Total investments | | | 328,388 | | | | 2,609,555 | |
Cash | | | - | (1) | | | 1 | |
Receivable from investments sold | | | 2,787 | | | | 11,349 | |
Receivable from fund shares sold | | | 2,132 | | | | 3,123 | |
Dividends and interest receivable | | | 23 | | | | 3,984 | |
| | | | | | | | |
Total assets | | | 333,330 | | | | 2,628,012 | |
| | |
| LIABILITIES: | | | | | | | | |
Payable for investments purchased | | | 6,235 | | | | 17,670 | |
Payable for fund shares redeemed | | | 129 | | | | 1,702 | |
Payable for operating expenses | | | 266 | | | | 1,377 | |
| | | | | | | | |
Total liabilities | | | 6,630 | | | | 20,749 | |
| | | | | | | | |
Total net assets | | $ | 326,700 | | | $ | 2,607,263 | |
| | | | | | | | |
| | |
| NET ASSETS CONSIST OF: | | | | | | | | |
Fund shares issued and outstanding | | $ | 432,299 | | | $ | 2,625,922 | |
Net unrealized appreciation (depreciation) on investments and foreign currency related transactions | | | 47,413 | | | | (248,618 | ) |
Accumulated undistributed net investment income | | | - | | | | 1,066 | |
Accumulated undistributed net realized gains (losses) on investments and foreign currency related transactions | | | (153,012 | ) | | | 228,893 | |
| | | | | | | | |
| | $ | 326,700 | | | $ | 2,607,263 | |
| | | | | | | | |
| | |
| SUPPLEMENTARY INFORMATION: | | | | | | | | |
Net assets | | | | | | | | |
Investor Shares | | $ | 326,700 | | | $ | 2,607,263 | |
Shares outstanding (Indefinite number of shares authorized, $0.01 par value) | | | | | | | | |
Investor Shares | | | 20,404,347 | | | | 182,376,038 | |
Net asset value, offering price and redemption price per share | | | | | | | | |
Investor Shares | | $ | 16.01 | | | $ | 14.30 | |
Cost of securities of unaffiliated issuers held | | $ | 274,366 | | | $ | 2,244,833 | |
Cost of securities of affiliated issuers held | | $ | 6,609 | | | $ | 613,340 | |
| (1) | Amount rounds to less than $1. |
The accompanying notes are an integral part of the financial statements.
58
ARTISAN FUNDS
Statements of Assets and Liabilities – September 30, 2011 (Continued)
Dollar values in thousands, except per share amounts
| | | | |
| | | VALUE | |
| ASSETS: | | | | |
Investments in securities, unaffiliated, at value | | $ | 420,019 | |
Investments in securities, affiliated, at value | | | 30,495 | |
Short-term investments (repurchase agreements), at value | | | 10,526 | |
| | | | |
Total investments | | | 461,040 | |
Cash | | | 1 | |
Receivable from fund shares sold | | | 805 | |
Dividends and interest receivable | | | 914 | |
| | | | |
Total assets | | | 462,760 | |
| |
| LIABILITIES: | | | | |
Payable for fund shares redeemed | | | 272 | |
Payable for operating expenses | | | 326 | |
| | | | |
Total liabilities | | | 598 | |
| | | | |
Total net assets | | $ | 462,162 | |
| | | | |
| |
| NET ASSETS CONSIST OF: | | | | |
Fund shares issued and outstanding | | $ | 545,229 | |
Net unrealized depreciation on investments and foreign currency related transactions | | | (24,040 | ) |
Accumulated undistributed net investment income | | | 2,606 | |
Accumulated undistributed net realized losses on investments and foreign currency related transactions | | | (61,633 | ) |
| | | | |
| | $ | 462,162 | |
| | | | |
| |
| SUPPLEMENTARY INFORMATION: | | | | |
Net assets | | | | |
Investor Shares | | $ | 408,647 | |
Institutional Shares | | $ | 53,515 | |
Shares outstanding (Indefinite number of shares authorized, $0.01 par value) | | | | |
Investor Shares | | | 44,853,835 | |
Institutional Shares | | | 5,870,145 | |
Net asset value, offering price and redemption price per share | | | | |
Investor Shares | | $ | 9.11 | |
Institutional Shares | | $ | 9.12 | |
Cost of securities of unaffiliated issuers held | | $ | 457,079 | |
Cost of securities of affiliated issuers held | | $ | 28,001 | |
The accompanying notes are an integral part of the financial statements.
59
ARTISAN FUNDS
Statements of Operations – For the Year Ended September 30, 2011
Dollar values in thousands
| | | | | | | | |
| | | GLOBAL EQUITY | | | GLOBAL VALUE | |
| INVESTMENT INCOME: | | | | | | | | |
Dividends, from unaffiliated issuers(1) | | $ | 228 | | | $ | 1,118 | |
Interest | | | - | (2) | | | 1 | |
| | | | | | | | |
Total investment income | | | 228 | | | | 1,119 | |
| | |
| EXPENSES: | | | | | | | | |
Advisory fees | | | 128 | | | | 543 | |
Transfer agent fees | | | | | | | | |
Investor Shares | | | 86 | | | | 193 | |
Shareholder communications | | | | | | | | |
Investor Shares | | | 12 | | | | 19 | |
Custodian fees | | | 23 | | | | 34 | |
Accounting fees | | | 38 | | | | 50 | |
Professional fees | | | 55 | | | | 44 | |
Registration fees | | | | | | | | |
Investor Shares | | | 52 | | | | 41 | |
Directors’ fees | | | 6 | | | | 6 | |
Other operating expenses | | | - | (2) | | | 5 | |
| | | | | | | | |
Total operating expenses | | | 400 | | | | 935 | |
Less amounts waived or paid by the Adviser | | | (208 | ) | | | (120 | ) |
| | | | | | | | |
Net Expenses | | | 192 | | | | 815 | |
| | | | | | | | |
Net investment income | | | 36 | | | | 304 | |
| | |
| NET REALIZED AND UNREALIZED GAINS (LOSSES) ON INVESTMENTS: | | | | | | | | |
Net realized gain (loss) on: | | | | | | | | |
Investments(1) | | | 582 | | | | 1,882 | |
Foreign currency related transactions | | | (7 | ) | | | (140 | ) |
| | | | | | | | |
| | | 575 | | | | 1,742 | |
Net increase (decrease) in unrealized appreciation or depreciation on: | | | | | | | | |
Investments | | | (962 | ) | | | (5,271 | ) |
Foreign currency related transactions | | | 6 | | | | 6 | |
| | | | | | | | |
| | | (956 | ) | | | (5,265 | ) |
| | | | | | | | |
Net loss on investments and foreign currency related transactions | | | (381 | ) | | | (3,523 | ) |
| | | | | | | | |
Net decrease in net assets resulting from operations | | $ | (345 | ) | | $ | (3,219 | ) |
| | | | | | | | |
| | | | | | | | | | |
| (1) | | Fund | | Net of foreign taxes
withheld on dividends,
unaffiliated issuers | | | Including net realized
gain on investments
from affiliated issuers | |
| | Global Equity | | | $21 | | | $ | - | |
| | Global Value | | | 52 | | | | 26 | |
| (2) | Amount rounds to less than $1. |
The accompanying notes are an integral part of the financial statements.
60
ARTISAN FUNDS
Statements of Operations – For the Year Ended September 30, 2011 (Continued)
Dollar values in thousands
| | | | | | | | |
| | | GROWTH
OPPORTUNITIES | | | INTERNATIONAL | |
| INVESTMENT INCOME: | | | | | | | | |
Dividends, from unaffiliated issuers(1) | | $ | 918 | | | $ | 234,572 | |
Interest | | | 1 | | | | 35 | |
Other | | | - | | | | 9 | |
| | | | | | | | |
Total investment income | | | 919 | | | | 234,616 | |
| | |
| EXPENSES: | | | | | | | | |
Advisory fees | | | 1,235 | | | | 90,895 | |
Transfer agent fees | | | | | | | | |
Investor Shares | | | 384 | | | | 16,429 | |
Institutional Shares | | | 4 | | | | 22 | |
Shareholder communications | | | | | | | | |
Investor Shares | | | 26 | | | | 717 | |
Institutional Shares | | | 1 | | | | 34 | |
Custodian fees | | | 42 | | | | 3,992 | |
Accounting fees | | | 39 | | | | 69 | |
Professional fees | | | 110 | | | | 397 | |
Registration fees | | | | | | | | |
Investor Shares | | | 61 | | | | 84 | |
Institutional Shares | | | 22 | | | | 39 | |
Directors’ fees | | | 6 | | | | 311 | |
Other operating expenses | | | 5 | | | | 142 | |
| | | | | | | | |
Total operating expenses | | | 1,935 | | | | 113,131 | |
Less amounts waived or paid by the Adviser | | | (17 | ) | | | - | |
| | | | | | | | |
Net Expenses | | | 1,918 | | | | 113,131 | |
| | | | | | | | |
Net investment income (loss) | | | (999 | ) | | | 121,485 | |
| | |
| NET REALIZED AND UNREALIZED GAINS (LOSSES) ON INVESTMENTS: | | | | | | | | |
Net realized gain (loss) on: | | | | | | | | |
Investments(1) | | | 2,181 | | | | 994,852 | |
Foreign currency related transactions | | | (432 | ) | | | (79 | ) |
| | | | | | | | |
| | | 1,749 | | | | 994,773 | |
Net decrease in unrealized appreciation or depreciation on: | | | | | | | | |
Investments | | | (14,114 | ) | | | (1,875,691 | ) |
Foreign currency related transactions | | | (9 | ) | | | (1,399 | ) |
| | | | | | | | |
| | | (14,123 | ) | | | (1,877,090 | ) |
| | | | | | | | |
Net loss on investments and foreign currency related transactions | | | (12,374 | ) | | | (882,317 | ) |
| | | | | | | | |
Net decrease in net assets resulting from operations | | $ | (13,373 | ) | | $ | (760,832 | ) |
| | | | | | | | |
| | | | | | | | | | |
| (1) | | Fund | | Net of foreign taxes
withheld on dividends,
unaffiliated issuers | | | Including net realized
loss on investments
from affiliated issuers | |
| | Growth Opportunities | | $ | 24 | | | $ | - | |
| | International | | | 18,737 | | | | (4,123 | ) |
The accompanying notes are an integral part of the financial statements.
61
ARTISAN FUNDS
Statements of Operations – For the Year Ended September 30, 2011 (Continued)
Dollar values in thousands
| | | | | | | | |
| | | INTERNATIONAL
SMALL CAP | | | INTERNATIONAL
VALUE | |
| INVESTMENT INCOME: | | | | | | | | |
Dividends, from unaffiliated issuers(1) | | $ | 13,571 | | | $ | 98,683 | |
Dividends, from affiliated issuers(1) | | | - | | | | 3,587 | |
Interest | | | 4 | | | | 49 | |
| | | | | | | | |
Total investment income | | | 13,575 | | | | 102,319 | |
| | |
| EXPENSES: | | | | | | | | |
Advisory fees | | | 9,196 | | | | 42,061 | |
Transfer agent fees | | | | | | | | |
Investor Shares | | | 1,115 | | | | 6,539 | |
Institutional Shares | | | - | | | | 22 | |
Shareholder communications | | | | | | | | |
Investor Shares | | | 64 | | | | 463 | |
Institutional Shares | | | - | | | | 23 | |
Custodian fees | | | 443 | | | | 1,118 | |
Accounting fees | | | 51 | | | | 69 | |
Professional fees | | | 82 | | | | 209 | |
Registration fees | | | | | | | | |
Investor Shares | | | 46 | | | | 218 | |
Institutional Shares | | | - | | | | 80 | |
Directors’ fees | | | 24 | | | | 136 | |
Other operating expenses | | | 15 | | | | 68 | |
| | | | | | | | |
Total operating expenses | | | 11,036 | | | | 51,006 | |
| | | | | | | | |
Net investment income | | | 2,539 | | | | 51,313 | |
| | |
| NET REALIZED AND UNREALIZED GAINS (LOSSES) ON INVESTMENTS: | | | | | | | | |
Net realized gain (loss) on: | | | | | | | | |
Investments(1) | | | 74,403 | | | | 140,973 | |
Foreign currency related transactions | | | (115 | ) | | | (18,918 | ) |
| | | | | | | | |
| | | 74,288 | | | | 122,055 | |
Net increase (decrease) in unrealized appreciation or depreciation on: | | | | | | | | |
Investments | | | (138,137 | ) | | | (483,261 | ) |
Foreign currency related transactions | | | (65 | ) | | | 1,338 | |
| | | | | | | | |
| | | (138,202 | ) | | | (481,923 | ) |
| | | | | | | | |
Net loss on investments and foreign currency related transactions | | | (63,914 | ) | | | (359,868 | ) |
| | | | | | | | |
Net decrease in net assets resulting from operations | | $ | (61,375 | ) | | $ | (308,555 | ) |
| | | | | | | | |
| | | | | | | | | | |
| (1) | | Fund | | Net of foreign taxes
withheld on dividends,
unaffiliated issuers | | | Including net realized
gain on investments
from affiliated issuers | |
| | International Small Cap | | $ | 1,122 | | | $ | - | |
| | International Value | | | 6,735 | | | | 3,755 | |
The accompanying notes are an integral part of the financial statements.
62
ARTISAN FUNDS
Statements of Operations – For the Year Ended September 30, 2011 (Continued)
Dollar values in thousands
| | | | | | | | |
| | | MID CAP | | | MID CAP VALUE | |
| INVESTMENT INCOME: | | | | | | | | |
Dividends, from unaffiliated issuers(1) | | $ | 27,781 | | | $ | 122,105 | |
Dividends, from affiliated issuers(1) | | | - | | | | 3,954 | |
Interest | | | 32 | | | | 44 | |
| | | | | | | | |
Total investment income | | | 27,813 | | | | 126,103 | |
| | |
| EXPENSES: | | | | | | | | |
Advisory fees | | | 53,152 | | | | 62,517 | |
Transfer agent fees | | | | | | | | |
Investor Shares | | | 14,266 | | | | 16,154 | |
Institutional Shares | | | 20 | | | | - | |
Shareholder communications | | | | | | | | |
Investor Shares | | | 437 | | | | 1,029 | |
Institutional Shares | | | 19 | | | | - | |
Custodian fees | | | 202 | | | | 115 | |
Accounting fees | | | 65 | | | | 39 | |
Professional fees | | | 211 | | | | 258 | |
Registration fees | | | | | | | | |
Investor Shares | | | 147 | | | | 189 | |
Institutional Shares | | | 24 | | | | - | |
Directors’ fees | | | 178 | | | | 208 | |
Other operating expenses | | | 77 | | | | 98 | |
| | | | | | | | |
Total operating expenses | | | 68,798 | | | | 80,607 | |
| | | | | | | | |
Net investment income (loss) | | | (40,985 | ) | | | 45,496 | |
| | |
| NET REALIZED AND UNREALIZED GAINS (LOSSES) ON INVESTMENTS: | | | | | | | | |
Net realized gain on: | | | | | | | | |
Investments(1) | | | 665,237 | | | | 585,460 | |
| | | | | | | | |
| | | 665,237 | | | | 585,460 | |
Net decrease in unrealized appreciation or depreciation on: | | | | | | | | |
Investments | | | (348,059 | ) | | | (531,683 | ) |
| | | | | | | | |
| | | (348,059 | ) | | | (531,683 | ) |
| | | | | | | | |
Net gain on investments and foreign currency related transactions | | | 317,178 | | | | 53,777 | |
| | | | | | | | |
Net increase in net assets resulting from operations | | $ | 276,193 | | | $ | 99,273 | |
| | | | | | | | |
| | | | | | | | | | |
| (1) | | Fund | | Net of foreign taxes
withheld on dividends,
unaffiliated issuers | | | Including net realized
gain on investments
from affiliated issuers | |
| | Mid Cap | | $ | 78 | | | $ | 8,059 | |
| | Mid Cap Value | | | - | | | | 60,302 | |
The accompanying notes are an integral part of the financial statements.
63
ARTISAN FUNDS
Statements of Operations – For the Year Ended September 30, 2011 (Continued)
Dollar values in thousands
| | | | | | | | |
| | | SMALL CAP | | | SMALL CAP VALUE | |
| INVESTMENT INCOME: | | | | | | | | |
Dividends, from unaffiliated issuers(1) | | $ | 1,764 | | | $ | 31,543 | |
Dividends, from affiliated issuers(1) | | | 80 | | | | 7,587 | |
Interest | | | 2 | | | | 22 | |
| | | | | | | | |
Total investment income | | | 1,846 | | | | 39,152 | |
| | |
| EXPENSES: | | | | | | | | |
Advisory fees | | | 3,300 | | | | 29,202 | |
Transfer agent fees | | | | | | | | |
Investor Shares | | | 686 | | | | 6,987 | |
Shareholder communications | | | | | | | | |
Investor Shares | | | 89 | | | | 565 | |
Custodian fees | | | 26 | | | | 72 | |
Accounting fees | | | 39 | | | | 40 | |
Professional fees | | | 49 | | | | 147 | |
Registration fees | | | | | | | | |
Investor Shares | | | 49 | | | | 111 | |
Directors’ fees | | | 10 | | | | 98 | |
Other operating expenses | | | 9 | | | | 48 | |
| | | | | | | | |
Total operating expenses | | | 4,257 | | | | 37,270 | |
| | | | | | | | |
Net investment income (loss) | | | (2,411 | ) | | | 1,882 | |
| | |
| NET REALIZED AND UNREALIZED GAINS (LOSSES) ON INVESTMENTS: | | | | | | | | |
Net realized gain on: | | | | | | | | |
Investments(1) | | | 81,909 | | | | 317,544 | |
| | | | | | | | |
| | | 81,909 | | | | 317,544 | |
Net decrease in unrealized appreciation or depreciation on: | | | | | | | | |
Investments | | | (48,672 | ) | | | (422,880 | ) |
| | | | | | | | |
| | | (48,672 | ) | | | (422,880 | ) |
| | | | | | | | |
Net gain (loss) on investments and foreign currency related transactions | | | 33,237 | | | | (105,336 | ) |
| | | | | | | | |
Net increase (decrease) in net assets resulting from operations | | $ | 30,826 | | | $ | (103,454 | ) |
| | | | | | | | |
| | | | | | | | | | |
| (1) | | Fund | | Net of foreign taxes
withheld on dividends,
unaffiliated issuers | | | Including net realized
gain (loss) on investments
from affiliated issuers | |
| | Small Cap | | $ | 7 | | | $ | 3,638 | |
| | Small Cap Value | | | - | | | | (15,261 | ) |
The accompanying notes are an integral part of the financial statements.
64
ARTISAN FUNDS
Statements of Operations – For the Year Ended September 30, 2011 (Continued)
Dollar values in thousands
| | | | |
| | | VALUE | |
| INVESTMENT INCOME: | | | | |
Dividends, from unaffiliated issuers(1) | | $ | 8,062 | |
Interest | | | 3 | |
| | | | |
Total investment income | | | 8,065 | |
| |
| EXPENSES: | | | | |
Advisory fees | | | 2,953 | |
Transfer agent fees | | | | |
Investor Shares | | | 1,033 | |
Institutional Shares | | | 5 | |
Shareholder communications | | | | |
Investor Shares | | | 84 | |
Institutional Shares | | | 2 | |
Custodian fees | | | 21 | |
Accounting fees | | | 39 | |
Professional fees | | | 60 | |
Registration fees | | | | |
Investor Shares | | | 95 | |
Institutional Shares | | | 10 | |
Directors’ fees | | | 11 | |
Other operating expenses | | | 9 | |
| | | | |
Total operating expenses | | | 4,322 | |
| | | | |
Net investment income | | | 3,743 | |
| |
| NET REALIZED AND UNREALIZED GAINS (LOSSES) ON INVESTMENTS: | | | | |
Net realized gain (loss) on: | | | | |
Investments(1) | | | 32,265 | |
Foreign currency related transactions | | | (41 | ) |
| | | | |
| | | 32,224 | |
Net decrease in unrealized appreciation or depreciation on: | | | | |
Investments | | | (42,872 | ) |
Foreign currency related transactions | | | (1 | ) |
| | | | |
| | | (42,873 | ) |
| | | | |
Net loss on investments and foreign currency related transactions | | | (10,649 | ) |
| | | | |
Net decrease in net assets resulting from operations | | $ | (6,906 | ) |
| | | | |
| | | | | | | | | | |
| (1) | | Fund | | Net of foreign taxes
withheld on dividends,
unaffiliated issuers | | | Including net realized
gain on investments
from affiliated issuers | |
| | Value | | $ | 62 | | | $ | 651 | |
The accompanying notes are an integral part of the financial statements.
65
ARTISAN FUNDS
Statements of Changes in Net Assets
Dollar values in thousands
| | | | | | | | | | | | | | | | |
| | | GLOBAL EQUITY | | | GLOBAL VALUE | |
| | | Year Ended
9/30/2011 | | | Period Ended
9/30/2010(1) | | | Year Ended
9/30/2011 | | | Year Ended
9/30/2010 | |
| OPERATIONS: | | | | | | | | | | | | | | | | |
Net investment income | | $ | 36 | | | $ | 32 | | | $ | 304 | | | $ | 223 | |
Net realized gain (loss) on: | | | | | | | | | | | | | | | | |
Investments | | | 582 | | | | (228 | ) | | | 1,882 | | | | 1,683 | |
Foreign currency related transactions | | | (7 | ) | | | (13 | ) | | | (140 | ) | | | (5 | ) |
Net increase (decrease) in unrealized appreciation or depreciation on: | | | | | | | | | | | | | | | | |
Investments | | | (962 | ) | | | 499 | | | | (5,271 | ) | | | 1,326 | |
Foreign currency related transactions | | | 6 | | | | (7 | ) | | | 6 | | | | 5 | |
| | | | | | | | | | | | | | | | |
Net increase (decrease) in net assets resulting from operations | | | (345 | ) | | | 283 | | | | (3,219 | ) | | | 3,232 | |
| | | | |
| DISTRIBUTIONS PAID TO SHAREHOLDERS: | | | | | | | | | | | | | | | | |
Net investment income: | | | | | | | | | | | | | | | | |
Investor Shares | | | (70 | ) | | | - | | | | (313 | ) | | | (689 | ) |
Net realized gains on investment transactions: | | | | | | | | | | | | | | | | |
Investor Shares | | | (88 | ) | | | - | | | | - | | | | - | |
| | | | | | | | | | | | | | | | |
Total distributions paid to shareholders | | | (158 | ) | | | - | | | | (313 | ) | | | (689 | ) |
| | | | |
| FUND SHARE ACTIVITIES: | | | | | | | | | | | | | | | | |
Net increase in net assets resulting from fund share activities | | | 942 | | | | 10,186 | | | | 34,444 | | | | 3,593 | |
| | | | | | | | | | | | | | | | |
Total increase in net assets | | | 439 | | | | 10,469 | | | | 30,912 | | | | 6,136 | |
| | | | | | | | | | | | | | | | |
Net assets, beginning of period | | | 10,469 | | | | - | | | | 34,754 | | | | 28,618 | |
| | | | | | | | | | | | | | | | |
Net assets, end of period | | $ | 10,908 | | | $ | 10,469 | | | $ | 65,666 | | | $ | 34,754 | |
| | | | | | | | | | | | | | | | |
| | | | |
Accumulated undistributed net investment income (loss) | | $ | 27 | | | $ | 80 | | | $ | (325 | ) | | $ | (204 | ) |
| | | | | | | | | | | | | | | | |
| (1) | For the period from commencement of operations March 29, 2010 through September 30, 2010. |
The accompanying notes are an integral part of the financial statements.
66
ARTISAN FUNDS
Statements of Changes in Net Assets (Continued)
Dollar values in thousands
| | | | | | | | | | | | | | | | |
| | | GROWTH OPPORTUNITIES | | | INTERNATIONAL | |
| | | Year Ended
9/30/2011 | | | Year Ended
9/30/2010 | | | Year Ended
9/30/2011 | | | Year Ended
9/30/2010 | |
| OPERATIONS: | | | | | | | | | | | | | | | | |
Net investment income (loss) | | $ | (999 | ) | | $ | (536 | ) | | $ | 121,485 | | | $ | 90,536 | |
Net realized gain (loss) on: | | | | | | | | | | | | | | | | |
Investments | | | 2,181 | | | | 2,089 | | | | 994,852 | | | | (67,630 | ) |
Foreign currency related transactions | | | (432 | ) | | | (74 | ) | | | (79 | ) | | | (3,039 | ) |
Net increase (decrease) in unrealized appreciation or depreciation on: | | | | | | | | | | | | | | | | |
Investments | | | (14,114 | ) | | | 9,555 | | | | (1,875,691 | ) | | | 224,422 | |
Foreign currency related transactions | | | (9 | ) | | | (1 | ) | | | (1,399 | ) | | | 1,804 | |
| | | | | | | | | | | | | | | | |
Net increase (decrease) in net assets resulting from operations | | | (13,373 | ) | | | 11,033 | | | | (760,832 | ) | | | 246,093 | |
| | | | |
| DISTRIBUTIONS PAID TO SHAREHOLDERS: | | | | | | | | | | | | | | | | |
Net investment income: | | | | | | | | | | | | | | | | |
Investor Shares | | | - | | | | - | | | | (61,274 | ) | | | (94,522 | ) |
Institutional Shares | | | - | | | | - | | | | (26,489 | ) | | | (34,566 | ) |
Net realized gains on investment transactions: | | | | | | | | | | | | | | | | |
Investor Shares | | | (1,034 | ) | | | - | | | | - | | | | - | |
| | | | | | | | | | | | | | | | |
Total distributions paid to shareholders | | | (1,034 | ) | | | - | | | | (87,763 | ) | | | (129,088 | ) |
| | | | |
| FUND SHARE ACTIVITIES: | | | | | | | | | | | | | | | | |
Net increase (decrease) in net assets resulting from fund share activities | | | 97,676 | | | | 15,868 | | | | (973,666 | ) | | | (1,096,191 | ) |
| | | | | | | | | | | | | | | | |
Total increase (decrease) in net assets | | | 83,269 | | | | 26,901 | | | | (1,822,261 | ) | | | (979,186 | ) |
| | | | | | | | | | | | | | | | |
Net assets, beginning of period | | | 72,458 | | | | 45,557 | | | | 9,648,669 | | | | 10,627,855 | |
| | | | | | | | | | | | | | | | |
Net assets, end of period | | $ | 155,727 | | | $ | 72,458 | | | $ | 7,826,408 | | | $ | 9,648,669 | |
| | | | | | | | | | | | | | | | |
| | | | |
Accumulated undistributed net investment income (loss) | | $ | (412 | ) | | $ | (1 | ) | | $ | 121,055 | | | $ | 87,458 | |
| | | | | | | | | | | | | | | | |
The accompanying notes are an integral part of the financial statements.
67
ARTISAN FUNDS
Statements of Changes in Net Assets (Continued)
Dollar values in thousands
| | | | | | | | | | | | | | | | |
| | | INTERNATIONAL SMALL CAP | | | INTERNATIONAL VALUE | |
| | | Year Ended
9/30/2011 | | | Year Ended
9/30/2010 | | | Year Ended
9/30/2011 | | | Year Ended
9/30/2010 | |
| OPERATIONS: | | | | | | | | | | | | | | | | |
Net investment income | | $ | 2,539 | | | $ | 1,066 | | | $ | 51,313 | | | $ | 36,645 | |
Net realized gain (loss) on: | | | | | | | | | | | | | | | | |
Investments | | | 74,403 | | | | 12,982 | | | | 140,973 | | | | (19,658 | ) |
Foreign currency related transactions | | | (115 | ) | | | (639 | ) | | | (18,918 | ) | | | (905 | ) |
Net increase (decrease) in unrealized appreciation or depreciation on: | | | | | | | | | | | | | | | | |
Investments | | | (138,137 | ) | | | 70,057 | | | | (483,261 | ) | | | 263,315 | |
Foreign currency related transactions | | | (65 | ) | | | 265 | | | | 1,338 | | | | 715 | |
| | | | | | | | | | | | | | | | |
Net increase (decrease) in net assets resulting from operations | | | (61,375 | ) | | | 83,731 | | | | (308,555 | ) | | | 280,112 | |
| | | | |
| DISTRIBUTIONS PAID TO SHAREHOLDERS: | | | | | | | | | | | | | | | | |
Net investment income: | | | | | | | | | | | | | | | | |
Investor Shares | | | (457 | ) | | | (4,971 | ) | | | (39,445 | ) | | | (34,820 | ) |
Institutional Shares | | | | | | | | | | | (12,501 | ) | | | (7,409 | ) |
| | | | | | | | | | | | | | | | |
Total distributions paid to shareholders | | | (457 | ) | | | (4,971 | ) | | | (51,946 | ) | | | (42,229 | ) |
| | | | |
| FUND SHARE ACTIVITIES: | | | | | | | | | | | | | | | | |
Net increase (decrease) in net assets resulting from fund share activities | | | (180,835 | ) | | | 22,830 | | | | 1,298,269 | | | | 1,080,085 | |
| | | | | | | | | | | | | | | | |
Total increase (decrease) in net assets | | | (242,667 | ) | | | 101,590 | | | | 937,768 | | | | 1,317,968 | |
| | | | | | | | | | | | | | | | |
Net assets, beginning of period | | | 797,393 | | | | 695,803 | | | | 3,337,714 | | | | 2,019,746 | |
| | | | | | | | | | | | | | | | |
Net assets, end of period | | $ | 554,726 | | | $ | 797,393 | | | $ | 4,275,482 | | | $ | 3,337,714 | |
| | | | | | | | | | | | | | | | |
| | | | |
Accumulated undistributed net investment income (loss) | | $ | 2,367 | | | $ | 403 | | | $ | (12,850 | ) | | $ | 7,327 | |
| | | | | | | | | | | | | | | | |
The accompanying notes are an integral part of the financial statements.
68
ARTISAN FUNDS
Statements of Changes in Net Assets (Continued)
Dollar values in thousands
| | | | | | | | | | | | | | | | |
| | | MID CAP | | | MID CAP VALUE | |
| | | Year Ended
9/30/2011 | | | Year Ended
9/30/2010 | | | Year Ended
9/30/2011 | | | Year Ended
9/30/2010 | |
| OPERATIONS: | | | | | | | | | | | | | | | | |
Net investment income (loss) | | $ | (40,985 | ) | | $ | (32,865 | ) | | $ | 45,496 | | | $ | 32,300 | |
Net realized gain on: | | | | | | | | | | | | | | | | |
Investments | | | 665,237 | | | | 94,003 | | | | 585,460 | | | | 405,320 | |
Net increase (decrease) in unrealized appreciation or depreciation on: | | | | | | | | | | | | | | | | |
Investments | | | (348,059 | ) | | | 818,287 | | | | (531,683 | ) | | | 164,927 | |
| | | | | | | | | | | | | | | | |
Net increase in net assets resulting from operations | | | 276,193 | | | | 879,425 | | | | 99,273 | | | | 602,547 | |
| | | | |
| DISTRIBUTIONS PAID TO SHAREHOLDERS: | | | | | | | | | | | | | | | | |
Net investment income: | | | | | | | | | | | | | | | | |
Investor Shares | | | - | | | | - | | | | (48,963 | ) | | | (19,094 | ) |
Net realized gains on investment transactions: | | | | | | | | | | | | | | | | |
Investor Shares | | | - | | | | - | | | | (97,741 | ) | | | - | |
| | | | | | | | | | | | | | | | |
Total distributions paid to shareholders | | | - | | | | - | | | | (146,704 | ) | | | (19,094 | ) |
| | | | |
| FUND SHARE ACTIVITIES: | | | | | | | | | | | | | | | | |
Net increase (decrease) in net assets resulting from fund share activities | | | (143,118 | ) | | | (144,809 | ) | | | 508,268 | | | | 528,218 | |
| | | | | | | | | | | | | | | | |
Total increase in net assets | | | 133,075 | | | | 734,616 | | | | 460,837 | | | | 1,111,671 | |
| | | | | | | | | | | | | | | | |
Net assets, beginning of period | | | 4,877,681 | | | | 4,143,065 | | | | 5,739,627 | | | | 4,627,956 | |
| | | | | | | | | | | | | | | | |
Net assets, end of period | | $ | 5,010,756 | | | $ | 4,877,681 | | | $ | 6,200,464 | | | $ | 5,739,627 | |
| | | | | | | | | | | | | | | | |
| | | | |
Accumulated undistributed net investment income (loss) | | $ | - | | | $ | (133 | ) | | $ | 24,143 | | | $ | 31,569 | |
| | | | | | | | | | | | | | | | |
The accompanying notes are an integral part of the financial statements.
69
ARTISAN FUNDS
Statements of Changes in Net Assets (Continued)
Dollar values in thousands
| | | | | | | | | | | | | | | | |
| | | SMALL CAP | | | SMALL CAP VALUE | |
| | | Year Ended
9/30/2011 | | | Year Ended
9/30/2010 | | | Year Ended
9/30/2011 | | | Year Ended
9/30/2010 | |
| OPERATIONS: | | | | | | | | | | | | | | | | |
Net investment income (loss) | | $ | (2,411 | ) | | $ | (2,483 | ) | | $ | 1,882 | | | $ | 2,778 | |
Net realized gain on: | | | | | | | | | | | | | | | | |
Investments | | | 81,909 | | | | 59,720 | | | | 317,544 | | | | 77,884 | |
Net increase (decrease) in unrealized appreciation or depreciation on: | | | | | | | | | | | | | | | | |
Investments | | | (48,672 | ) | | | (18,183 | ) | | | (422,880 | ) | | | 141,087 | |
| | | | | | | | | | | | | | | | |
Net increase (decrease) in net assets resulting from operations | | | 30,826 | | | | 39,054 | | | | (103,454 | ) | | | 221,749 | |
| | | | |
| DISTRIBUTIONS PAID TO SHAREHOLDERS: | | | | | | | | | | | | | | | | |
Net investment income: | | | | | | | | | | | | | | | | |
Investor Shares | | | - | | | | - | | | | (2,837 | ) | | | (2,598 | ) |
| | | | | | | | | | | | | | | | |
Total distributions paid to shareholders | | | - | | | | - | | | | (2,837 | ) | | | (2,598 | ) |
| | | | |
| FUND SHARE ACTIVITIES: | | | | | | | | | | | | | | | | |
Net increase (decrease) in net assets resulting from fund share activities | | | (26,856 | ) | | | (153,320 | ) | | | 23,138 | | | | 314,770 | |
| | | | | | | | | | | | | | | | |
Total increase (decrease) in net assets | | | 3,970 | | | | (114,266 | ) | | | (83,153 | ) | | | 533,921 | |
| | | | | | | | | | | | | | | | |
Net assets, beginning of period | | | 322,730 | | | | 436,996 | | | | 2,690,416 | | | | 2,156,495 | |
| | | | | | | | | | | | | | | | |
Net assets, end of period | | $ | 326,700 | | | $ | 322,730 | | | $ | 2,607,263 | | | $ | 2,690,416 | |
| | | | | | | | | | | | | | | | |
| | | | |
Accumulated undistributed net investment income (loss) | | $ | - | | | $ | (21 | ) | | $ | 1,066 | | | $ | 2,769 | |
| | | | | | | | | | | | | | | | |
The accompanying notes are an integral part of the financial statements.
70
ARTISAN FUNDS
Statements of Changes in Net Assets (Continued)
Dollar values in thousands
| | | | | | | | |
| | | VALUE | |
| | | Year Ended
9/30/2011 | | | Year Ended
9/30/2010 | |
| OPERATIONS: | | | | | | | | |
Net investment income | | $ | 3,743 | | | $ | 1,996 | |
Net realized gain (loss) on: | | | | | | | | |
Investments | | | 32,265 | | | | 9,335 | |
Foreign currency related transactions | | | (41 | ) | | | 3 | |
Net increase (decrease) in unrealized appreciation or depreciation on: | | | | | | | | |
Investments | | | (42,872 | ) | | | 8,010 | |
Foreign currency related transactions | | | (1 | ) | | | - | |
| | | | | | | | |
Net increase (decrease) in net assets resulting from operations | | | (6,906 | ) | | | 19,344 | |
| | |
| DISTRIBUTIONS PAID TO SHAREHOLDERS: | | | | | | | | |
Net investment income: | | | | | | | | |
Investor Shares | | | (2,455 | ) | | | (840 | ) |
Institutional Shares | | | - | | | | - | |
| | | | | | | | |
Total distributions paid to shareholders | | | (2,455 | ) | | | (840 | ) |
| | |
| FUND SHARE ACTIVITIES: | | | | | | | | |
Net increase in net assets resulting from fund share activities | | | 205,150 | | | | 66,759 | |
| | | | | | | | |
Total increase in net assets | | | 195,789 | | | | 85,263 | |
| | | | | | | | |
Net assets, beginning of period | | | 266,373 | | | | 181,110 | |
| | | | | | | | |
Net assets, end of period | | $ | 462,162 | | | $ | 266,373 | |
| | | | | | | | |
| | |
Accumulated undistributed net investment income | | $ | 2,606 | | | $ | 1,405 | |
| | | | | | | | |
The accompanying notes are an integral part of the financial statements.
71
ARTISAN FUNDS
Financial Highlights – For a share outstanding throughout each period
The financial highlights table is intended to help you understand the Funds’ financial performance for the past 5 years or, if shorter, the period of a Fund’s operations. Certain information reflects financial results for a single Fund share. The total returns in the table represent the rate that an investor would have earned or lost on an investment in the Fund (assuming reinvestment of all dividends and distributions).
| | | | | | | | |
| | | ARTISAN GLOBAL EQUITY FUND | |
| | | Investor Shares | |
| |
| | | Year or Period Ended | |
| | |
| | | 9/30/2011 | | | 9/30/2010(1) | |
| | | | | | | | |
Net Asset Value Beginning of Period | | $ | 10.23 | | | $ | 10.00 | |
Net Investment Income (Loss)(2) | | | (0.03 | ) | | | 0.03 | |
Net Realized and Unrealized Gain (Loss) on Investments | | | (0.23 | ) | | | 0.20 | |
| | | | | | | | |
Total Income (Loss) from Investment Operations | | | (0.26 | ) | | | 0.23 | |
| | | | | | | | |
Dividends from Net Investment Income | | | (0.06 | ) | | | - | |
Distributions from Net Realized Gains | | | (0.08 | ) | | | - | |
| | | | | | | | |
Total Distributions | | | (0.14 | ) | | | - | |
| | | | | | | | |
Net Asset Value End of Period | | $ | 9.83 | | | $ | 10.23 | |
| | | | | | | | |
Total Return(3) | | | (2.66 | )% | | | 2.30 | % |
Net Assets End of Period (millions) | | $ | 10.9 | | | $ | 10.5 | |
Ratio of Expenses to Average Net Assets(4)(5) | | | 1.50 | % | | | 1.50 | % |
Ratio of Net Investment Income to Average Net Assets(4)(5) | | | 0.28 | % | | | 0.69 | % |
Portfolio Turnover Rate(3) | | | 150.01 | % | | | 60.81 | % |
| (1) | For the period from commencement of operations March 29, 2010 through September 30, 2010. |
| (2) | Computed based on average shares outstanding. |
| (3) | Periods less than twelve months (where applicable) are not annualized. |
| (4) | Periods less than twelve months (where applicable) are annualized. |
| (5) | The ratios of expenses to average net assets and net investment income (loss) to average net assets exclude expenses waived or paid by the Adviser. Absent expenses waived or paid by the Adviser, the ratios of expenses to average net assets and net investment income (loss) to average net assets would have been as follows: |
| | | | | | | | | | |
Year or
Period Ended | | | Ratio of Expenses to
Average Net Assets | | | Ratio of Net Investment
Loss to Average Net Assets | |
| | 9/30/2011 | | | | 3.12 | % | | | (1.34 | )% |
| | 9/30/2010 | | | | 3.66 | % | | | (1.47 | )% |
The accompanying notes are an integral part of the financial statements.
72
ARTISAN FUNDS
Financial Highlights – For a share outstanding throughout each period (Continued)
| | | | | | | | | | | | | | | | |
| | | ARTISAN GLOBAL VALUE FUND | |
| | | Investor Shares | |
| |
| | | Year or Period Ended | |
| | | | |
| | | 9/30/2011 | | | 9/30/2010 | | | 9/30/2009 | | | 9/30/2008(1) | |
| | | | | | | | | | | | | | | | |
Net Asset Value Beginning of Period | | $ | 9.37 | | | $ | 8.64 | | | $ | 8.32 | | | $ | 10.00 | |
Net Investment Income(2) | | | 0.06 | | | | 0.06 | | | | 0.08 | | | | 0.10 | |
Net Realized and Unrealized Gain (Loss) on Investments | | | (0.07 | ) | | | 0.87 | | | | 0.29 | | | | (1.78 | ) |
| | | | | | | | | | | | | | | | |
Total Income (Loss) from Investment Operations | | | (0.01 | ) | | | 0.93 | | | | 0.37 | | | | (1.68 | ) |
| | | | | | | | | | | | | | | | |
Dividends from Net Investment Income | | | (0.08 | ) | | | (0.20 | ) | | | (0.05 | ) | | | - | |
| | | | | | | | | | | | | | | | |
Total Distributions | | | (0.08 | ) | | | (0.20 | ) | | | (0.05 | ) | | | - | |
| | | | | | | | | | | | | | | | |
Net Asset Value End of Period | | $ | 9.28 | | | $ | 9.37 | | | $ | 8.64 | | | $ | 8.32 | |
| | | | | | | | | | | | | | | | |
Total Return(3) | | | (0.23 | )% | | | 10.98 | % | | | 4.65 | % | | | (16.80 | )% |
Net Assets End of Period (millions) | | $ | 65.7 | | | $ | 34.8 | | | $ | 28.6 | | | $ | 9.6 | |
Ratio of Expenses to Average Net Assets(4)(5) | | | 1.50 | % | | | 1.50 | % | | | 1.50 | % | | | 1.44 | % |
Ratio of Net Investment Income to Average Net Assets(4)(5) | | | 0.56 | % | | | 0.71 | % | | | 1.11 | % | | | 1.39 | % |
Portfolio Turnover Rate(3) | | | 32.32 | % | | | 34.52 | % | | | 56.57 | % | | | 42.27 | % |
| (1) | For the period from commencement of operations December 10, 2007 through September 30, 2008. |
| (2) | Computed based on average shares outstanding. |
| (3) | Periods less than twelve months (where applicable) are not annualized. |
| (4) | Periods less than twelve months (where applicable) are annualized. |
| (5) | The ratios of expenses to average net assets and net investment income (loss) to average net assets exclude expenses waived or paid by the Adviser or the board of directors. Absent expenses waived or paid by the Adviser or the board of directors, the ratios of expenses to average net assets and net investment income (loss) to average net assets would have been as follows: |
| | | | | | | | | | |
Year or
Period Ended | | | Ratio of Expenses to
Average Net Assets | | | Ratio of Net Investment Income
(Loss) to Average Net Assets | |
| | 9/30/2011 | | | | 1.72 | % | | | 0.34 | % |
| | 9/30/2010 | | | | 1.96 | % | | | 0.26 | % |
| | 9/30/2009 | | | | 2.16 | % | | | 0.45 | % |
| | 9/30/2008 | | | | 3.53 | % | | | (0.70 | )% |
The accompanying notes are an integral part of the financial statements.
73
ARTISAN FUNDS
Financial Highlights – For a share outstanding throughout each period (Continued)
| | | | | | | | | | | | | | | | |
| | | ARTISAN GROWTH OPPORTUNITIES FUND | |
| | | Investor Shares | |
| |
| | | Year or Period Ended | |
| | | | |
| | | 9/30/2011 | | | 9/30/2010 | | | 9/30/2009 | | | 9/30/2008(1) | |
| | | | | | | | | | | | | | | | |
Net Asset Value Beginning of Period | | $ | 10.99 | | | $ | 9.14 | | | $ | 9.32 | | | $ | 10.00 | |
Net Investment Loss(2) | | | (0.09 | ) | | | (0.09 | ) | | | (0.05 | ) | | | - | (4) |
Net Realized and Unrealized Gain (Loss) on Investments | | | 0.13 | | | | 1.94 | | | | (0.13 | ) | | | (0.68 | ) |
| | | | | | | | | | | | | | | | |
Total Income (Loss) from Investment Operations | | | 0.04 | | | | 1.85 | | | | (0.18 | ) | | | (0.68 | ) |
| | | | | | | | | | | | | | | | |
Distributions from Net Realized Gains | | | (0.13 | ) | | | - | | | | - | | | | - | |
| | | | | | | | | | | | | | | | |
Total Distributions | | | (0.13 | ) | | | - | | | | - | | | | - | |
| | | | | | | | | | | | | | | | |
Net Asset Value End of Period | | $ | 10.90 | | | $ | 10.99 | | | $ | 9.14 | | | $ | 9.32 | |
| | | | | | | | | | | | | | | | |
Total Return(4) | | | 0.14 | % | | | 20.24 | % | | | (1.93 | )% | | | (6.80 | )% |
Net Assets End of Period (millions) | | $ | 142.8 | | | $ | 72.5 | | | $ | 45.6 | | | $ | 5.7 | |
Ratio of Expenses to Average Net Assets(5)(6) | | | 1.40 | % | | | 1.50 | % | | | 1.47 | % | | | 1.50 | % |
Ratio of Net Investment Loss to Average Net Assets(5)(6) | | | (0.73 | )% | | | (0.91 | )% | | | (0.59 | )% | | | (0.69 | )% |
Portfolio Turnover Rate(4) | | | 76.18 | % | | | 79.99 | % | | | 101.01 | % | | | 3.05 | % |
| (1) | For the period from commencement of operations September 22, 2008 through September 30, 2008. |
| (2) | Computed based on average shares outstanding. |
| (3) | Amount is between $0.005 and $(0.005) per share. |
| (4) | Periods less than twelve months (where applicable) are not annualized. |
| (5) | Periods less than twelve months (where applicable) are annualized. |
| (6) | The ratios of expenses to average net assets and net investment income (loss) to average net assets exclude expenses waived or paid by the Adviser or the board of directors. Absent expenses waived or paid by the Adviser or the board of directors, the ratios of expenses to average net assets and net investment income (loss) to average net assets would have been as follows: |
| | | | | | | | |
Year or
Period Ended | | Ratio of Expenses to
Average Net Assets | | | Ratio of Net Investment
(Loss) to Average Net Assets | |
| 9/30/2010 | | | 1.54 | % | | | (0.95 | )% |
| 9/30/2009 | | | 2.24 | % | | | (1.36 | )% |
| 9/30/2008 | | | 48.41 | % | | | (47.60 | )% |
The accompanying notes are an integral part of the financial statements.
74
ARTISAN FUNDS
Financial Highlights – For a share outstanding throughout each period (Continued)
| | | | | | | | | | | | | | | | | | | | |
| | | ARTISAN INTERNATIONAL FUND | |
| | | Investor Shares | |
| |
| | | Year Ended | |
| | | | | |
| | | 9/30/2011 | | | 9/30/2010 | | | 9/30/2009 | | | 9/30/2008 | | | 9/30/2007 | |
| | | | | | | | | | | | | | | | | | | | |
Net Asset Value Beginning of Period | | $ | 20.57 | | | $ | 20.16 | | | $ | 20.34 | | | $ | 33.75 | | | $ | 28.75 | |
Net Investment Income(1) | | | 0.26 | | | | 0.17 | | | | 0.23 | | | | 0.36 | | | | 0.31 | |
Net Realized and Unrealized Gain (Loss) on Investments | | | (2.28 | ) | | | 0.49 | | | | 0.48 | | | | (9.10 | ) | | | 7.45 | |
| | | | | | | | | | | | | | | | | | | | |
Total Income (Loss) from Investment Operations | | | (2.02 | ) | | | 0.66 | | | | 0.71 | | | | (8.74 | ) | | | 7.76 | |
| | | | | | | | | | | | | | | | | | | | |
Dividends from Net Investment Income | | | (0.18 | ) | | | (0.25 | ) | | | (0.19 | ) | | | (0.20 | ) | | | (0.43 | ) |
Distributions from Net Realized Gains | | | - | | | | - | | | | (0.70 | ) | | | (4.47 | ) | | | (2.33 | ) |
| | | | | | | | | | | | | | | | | | | | |
Total Distributions | | | (0.18 | ) | | | (0.25 | ) | | | (0.89 | ) | | | (4.67 | ) | | | (2.76 | ) |
| | | | | | | | | | | | | | | | | | | | |
Net Asset Value End of Period | | $ | 18.37 | | | $ | 20.57 | | | $ | 20.16 | | | $ | 20.34 | | | $ | 33.75 | |
| | | | | | | | | | | | | | | | | | | | |
Total Return | | | (9.95 | )% | | | 3.27 | % | | | 5.00 | % | | | (29.99 | )% | | | 28.69 | % |
Net Assets End of Period (millions) | | $ | 5,837.1 | | | $ | 7,294.7 | | | $ | 7,715.1 | | | $ | 8,760.0 | | | $ | 12,810.0 | |
Ratio of Expenses to Average Net Assets | | | 1.22 | % | | | 1.23 | % | | | 1.22 | % | | | 1.22 | % | | | 1.21 | % |
Ratio of Net Investment Income to Average Net Assets | | | 1.18 | % | | | 0.86 | % | | | 1.47 | % | | | 1.28 | % | | | 1.01 | % |
Portfolio Turnover Rate | | | 70.36 | % | | | 70.51 | % | | | 82.38 | % | | | 54.42 | % | | | 66.30 | % |
| (1) | Computed based on average shares outstanding. |
The accompanying notes are an integral part of the financial statements.
75
ARTISAN FUNDS
Financial Highlights – For a share outstanding throughout each period (Continued)
| | | | | | | | | | | | | | | | | | | | |
| | | ARTISAN INTERNATIONAL SMALL CAP FUND | |
| | | Investor Shares | |
| |
| | | Year Ended | |
| | | | | |
| | | 9/30/2011 | | | 9/30/2010 | | | 9/30/2009 | | | 9/30/2008 | | | 9/30/2007 | |
| | | | | | | | | | | | | | | | | | | | |
Net Asset Value Beginning of Period | | $ | 18.63 | | | $ | 16.66 | | | $ | 14.28 | | | $ | 26.96 | | | $ | 22.77 | |
Net Investment Income(1) | | | 0.07 | | | | 0.02 | | | | 0.12 | | | | 0.21 | | | | 0.11 | |
Net Realized and Unrealized Gain (Loss) on Investments | | | (2.25 | ) | | | 2.07 | | | | 2.62 | | | | (9.26 | ) | | | 8.54 | |
| | | | | | | | | | | | | | | | | | | | |
Total Income (Loss) from Investment Operations | | | (2.18 | ) | | | 2.09 | | | | 2.74 | | | | (9.05 | ) | | | 8.65 | |
| | | | | | | | | | | | | | | | | | | | |
Dividends from Net Investment Income | | | (0.01 | ) | | | (0.12 | ) | | | (0.16 | ) | | | (0.20 | ) | | | (0.70 | ) |
Distributions from Net Realized Gains | | | - | | | | - | | | | (0.20 | ) | | | (3.43 | ) | | | (3.76 | ) |
| | | | | | | | | | | | | | | | | | | | |
Total Distributions | | | (0.01 | ) | | | (0.12 | ) | | | (0.36 | ) | | | (3.63 | ) | | | (4.46 | ) |
| | | | | | | | | | | | | | | | | | | | |
Net Asset Value End of Period | | $ | 16.44 | | | $ | 18.63 | | | $ | 16.66 | | | $ | 14.28 | | | $ | 26.96 | |
| | | | | | | | | | | | | | | | | | | | |
Total Return | | | (11.70 | )% | | | 12.60 | % | | | 20.59 | % | | | (38.44 | )% | | | 43.10 | % |
Net Assets End of Period (millions) | | $ | 554.7 | | | $ | 797.4 | | | $ | 695.8 | | | $ | 732.4 | | | $ | 1,356.0 | |
Ratio of Expenses to Average Net Assets | | | 1.50 | % | | | 1.50 | % | | | 1.50 | % | | | 1.51 | % | | | 1.52 | % |
Ratio of Net Investment Income to Average Net Assets | | | 0.35 | % | | | 0.14 | % | | | 0.99 | % | | | 0.96 | % | | | 0.45 | % |
Portfolio Turnover Rate | | | 44.76 | % | | | 73.90 | % | | | 58.42 | % | | | 42.80 | % | | | 49.85 | % |
| (1) | Computed based on average shares outstanding. |
The accompanying notes are an integral part of the financial statements.
76
ARTISAN FUNDS
Financial Highlights – For a share outstanding throughout each period (Continued)
| | | | | | | | | | | | | | | | | | | | |
| | | ARTISAN INTERNATIONAL VALUE FUND | |
| | | Investor Shares | |
| |
| | | Year Ended | |
| | | | | |
| | | 9/30/2011 | | | 9/30/2010 | | | 9/30/2009 | | | 9/30/2008 | | | 9/30/2007 | |
| | | | | | | | | | | | | | | | | | | | |
Net Asset Value Beginning of Period | | $ | 24.74 | | | $ | 22.83 | | | $ | 21.20 | | | $ | 28.49 | | | $ | 26.71 | |
Net Investment Income(1) | | | 0.30 | | | | 0.31 | | | | 0.17 | | | | 0.45 | | | | 0.38 | |
Net Realized and Unrealized Gain (Loss) on Investments | | | (1.25 | ) | | | 2.02 | | | | 1.67 | | | | (5.56 | ) | | | 3.12 | |
| | | | | | | | | | | | | | | | | | | | |
Total Income (Loss) from Investment Operations | | | (0.95 | ) | | | 2.33 | | | | 1.84 | | | | (5.11 | ) | | | 3.50 | |
| | | | | | | | | | | | | | | | | | | | |
Dividends from Net Investment Income | | | (0.35 | ) | | | (0.42 | ) | | | (0.21 | ) | | | (0.51 | ) | | | (0.44 | ) |
Distributions from Net Realized Gains | | | - | | | | - | | | | - | | | | (1.67 | ) | | | (1.28 | ) |
| | | | | | | | | | | | | | | | | | | | |
Total Distributions | | | (0.35 | ) | | | (0.42 | ) | | | (0.21 | ) | | | (2.18 | ) | | | (1.72 | ) |
| | | | | | | | | | | | | | | | | | | | |
Net Asset Value End of Period | | $ | 23.44 | | | $ | 24.74 | | | $ | 22.83 | | | $ | 21.20 | | | $ | 28.49 | |
| | | | | | | | | | | | | | | | | | | | |
Total Return | | | (4.01 | )% | | | 10.39 | % | | | 8.95 | % | | | (19.10 | )% | | | 13.28 | % |
Net Assets End of Period (millions) | | $ | 3,232.6 | | | $ | 2,688.2 | | | $ | 1,739.5 | | | $ | 1,029.4 | | | $ | 1,594.7 | |
Ratio of Expenses to Average Net Assets | | | 1.18 | % | | | 1.21 | % | | | 1.25 | % | | | 1.23 | % | | | 1.23 | % |
Ratio of Net Investment Income to Average Net Assets | | | 1.10 | % | | | 1.34 | % | | | 0.95 | % | | | 1.83 | % | | | 1.34 | % |
Portfolio Turnover Rate | | | 30.90 | % | | | 21.02 | % | | | 55.49 | % | | | 44.72 | % | | | 45.60 | % |
| (1) | Computed based on average shares outstanding. |
The accompanying notes are an integral part of the financial statements.
77
ARTISAN FUNDS
Financial Highlights – For a share outstanding throughout each period (Continued)
| | | | | | | | | | | | | | | | | | | | |
| | | ARTISAN MID CAP FUND | |
| | | Investor Shares | |
| |
| | | Year Ended | |
| | | | | |
| | | 9/30/2011 | | | 9/30/2010 | | | 9/30/2009 | | | 9/30/2008 | | | 9/30/2007 | |
| | | | | | | | | | | | | | | | | | | | |
Net Asset Value Beginning of Period | | $ | 29.55 | | | $ | 24.28 | | | $ | 24.08 | | | $ | 37.06 | | | $ | 31.77 | |
Net Investment Loss(1) | | | (0.26 | ) | | | (0.20 | ) | | | (0.11 | ) | | | (0.22 | ) | | | (0.24 | ) |
Net Realized and Unrealized Gain (Loss) on Investments | | | 1.85 | | | | 5.47 | | | | 0.59 | | | | (6.86 | ) | | | 9.00 | |
| | | | | | | | | | | | | | | | | | | | |
Total Income (Loss) from Investment Operations | | | 1.59 | | | | 5.27 | | | | 0.48 | | | | (7.08 | ) | | | 8.76 | |
| | | | | | | | | | | | | | | | | | | | |
Dividends from Net Investment Income | | | - | | | | - | | | | - | | | | - | | | | - | |
Distributions from Net Realized Gains | | | - | | | | - | | | | (0.28 | ) | | | (5.90 | ) | | | (3.47 | ) |
| | | | | | | | | | | | | | | | | | | | |
Total Distributions | | | - | | | | - | | | | (0.28 | ) | | | (5.90 | ) | | | (3.47 | ) |
| | | | | | | | | | | | | | | | | | | | |
Net Asset Value End of Period | | $ | 31.14 | | | $ | 29.55 | | | $ | 24.28 | | | $ | 24.08 | | | $ | 37.06 | |
| | | | | | | | | | | | | | | | | | | | |
Total Return | | | 5.38 | % | | | 21.71 | % | | | 2.47 | % | | | (22.47 | )% | | | 29.83 | % |
Net Assets End of Period (millions) | | $ | 4,500.8 | | | $ | 4,375.2 | | | $ | 3,688.6 | | | $ | 3,732.3 | | | $ | 5,319.3 | |
Ratio of Expenses to Average Net Assets | | | 1.24 | % | | | 1.23 | % | | | 1.23 | % | | | 1.24 | % | | | 1.22 | % |
Ratio of Net Investment Loss to Average Net Assets | | | (0.75 | )% | | | (0.77 | )% | | | (0.57 | )% | | | (0.75 | )% | | | (0.73 | )% |
Portfolio Turnover Rate | | | 62.87 | % | | | 63.46 | % | | | 68.39 | % | | | 79.76 | % | | | 71.04 | % |
| (1) | Computed based on average shares outstanding. |
The accompanying notes are an integral part of the financial statements.
78
ARTISAN FUNDS
Financial Highlights – For a share outstanding throughout each period (Continued)
| | | | | | | | | | | | | | | | | | | | |
| | | ARTISAN MID CAP VALUE FUND | |
| | | Investor Shares | |
| |
| | | Year Ended | |
| | | | | |
| | | 9/30/2011 | | | 9/30/2010 | | | 9/30/2009 | | | 9/30/2008 | | | 9/30/2007 | |
| | | | | | | | | | | | | | | | | | | | |
Net Asset Value Beginning of Period | | $ | 18.86 | | | $ | 16.85 | | | $ | 17.01 | | | $ | 21.70 | | | $ | 19.87 | |
Net Investment Income(1) | | | 0.14 | | | | 0.11 | | | | 0.08 | | | | 0.03 | | | | 0.09 | |
Net Realized and Unrealized Gain (Loss) on Investments | | | 0.36 | | | | 1.97 | | | | (0.10 | ) | | | (2.31 | ) | | | 2.98 | |
| | | | | | | | | | | | | | | | | | | | |
Total Income (Loss) from Investment Operations | | | 0.50 | | | | 2.08 | | | | (0.02 | ) | | | (2.28 | ) | | | 3.07 | |
| | | | | | | | | | | | | | | | | | | | |
Dividends from Net Investment Income | | | (0.16 | ) | | | (0.07 | ) | | | (0.02 | ) | | | (0.08 | ) | | | (0.06 | ) |
Distributions from Net Realized Gains | | | (0.32 | ) | | | - | | | | (0.12 | ) | | | (2.33 | ) | | | (1.18 | ) |
| | | | | | | | | | | | | | | | | | | | |
Total Distributions | | | (0.48 | ) | | | (0.07 | ) | | | (0.14 | ) | | | (2.41 | ) | | | (1.24 | ) |
| | | | | | | | | | | | | | | | | | | | |
Net Asset Value End of Period | | $ | 18.88 | | | $ | 18.86 | | | $ | 16.85 | | | $ | 17.01 | | | $ | 21.70 | |
| | | | | | | | | | | | | | | | | | | | |
Total Return | | | 2.51 | % | | | 12.35 | % | | | 0.21 | % | | | (11.16 | )% | | | 15.88 | % |
Net Assets End of Period (millions) | | $ | 6,200.5 | | | $ | 5,739.6 | | | $ | 4,628.0 | | | $ | 3,231.5 | | | $ | 3,420.7 | |
Ratio of Expenses to Average Net Assets | | | 1.20 | % | | | 1.21 | % | | | 1.21 | % | | | 1.21 | % | | | 1.20 | % |
Ratio of Net Investment Income to Average Net Assets | | | 0.68 | % | | | 0.60 | % | | | 0.62 | % | | | 0.18 | % | | | 0.41 | % |
Portfolio Turnover Rate | | | 31.85 | % | | | 37.71 | % | | | 53.84 | % | | | 69.77 | % | | | 53.62 | % |
| (1) | Computed based on average shares outstanding. |
The accompanying notes are an integral part of the financial statements.
79
ARTISAN FUNDS
Financial Highlights – For a share outstanding throughout each period (Continued)
| | | | | | | | | | | | | | | | | | | | |
| | | ARTISAN SMALL CAP FUND | |
| | | Investor Shares | |
| |
| | | Year Ended | |
| | | | | |
| | | 9/30/2011 | | | 9/30/2010 | | | 9/30/2009 | | | 9/30/2008 | | | 9/30/2007 | |
| | | | | | | | | | | | | | | | | | | | |
Net Asset Value Beginning of Period | | $ | 14.40 | | | $ | 12.88 | | | $ | 13.13 | | | $ | 19.89 | | | $ | 17.51 | |
Net Investment Loss(1) | | | (0.13 | ) | | | (0.09 | ) | | | (0.05 | ) | | | (0.09 | ) | | | (0.13 | ) |
Net Realized and Unrealized Gain (Loss) on Investments | | | 1.74 | | | | 1.61 | | | | (0.18 | ) | | | (4.82 | ) | | | 2.87 | |
| | | | | | | | | | | | | | | | | | | | |
Total Income (Loss) from Investment Operations | | | 1.61 | | | | 1.52 | | | | (0.23 | ) | | | (4.91 | ) | | | 2.74 | |
| | | | | | | | | | | | | | | | | | | | |
Distributions from Net Realized Gains | | | - | | | | - | | | | - | | | | (1.85 | ) | | | (0.36 | ) |
Distributions from Tax Return of Capital | | | - | | | | - | | | | (0.02 | ) | | | - | | | | - | |
| | | | | | | | | | | | | | �� | | | | | | |
Total Distributions | | | - | | | | - | | | | (0.02 | ) | | | (1.85 | ) | | | (0.36 | ) |
| | | | | | | | | | | | | | | | | | | | |
Net Asset Value End of Period | | $ | 16.01 | | | $ | 14.40 | | | $ | 12.88 | | | $ | 13.13 | | | $ | 19.89 | |
| | | | | | | | | | | | | | | | | | | | |
Total Return | | | 11.18 | % | | | 11.80 | % | | | (1.73 | )% | | | (26.64 | )% | | | 15.84 | % |
Net Assets End of Period (millions) | | $ | 326.7 | | | $ | 322.7 | | | $ | 437.0 | | | $ | 587.1 | | | $ | 1,151.5 | |
Ratio of Expenses to Average Net Assets | | | 1.29 | % | | | 1.31 | % | | | 1.26 | % | | | 1.22 | % | | | 1.18 | % |
Ratio of Net Investment Loss to Average Net Assets | | | (0.73 | )% | | | (0.67 | )% | | | (0.47 | )% | | | (0.58 | )% | | | (0.70 | )% |
Portfolio Turnover Rate | | | 80.26 | % | | | 62.67 | % | | | 80.51 | % | | | 96.90 | % | | | 74.32 | % |
| (1) | Computed based on average shares outstanding. |
The accompanying notes are an integral part of the financial statements.
80
ARTISAN FUNDS
Financial Highlights – For a share outstanding throughout each period (Continued)
| | | | | | | | | | | | | | | | | | | | |
| | | ARTISAN SMALL CAP VALUE FUND | |
| | | Investor Shares | |
| |
| | | Year Ended | |
| | | | | |
| | | 9/30/2011 | | | 9/30/2010 | | | 9/30/2009 | | | 9/30/2008 | | | 9/30/2007 | |
| | | | | | | | | | | | | | | | | | | | |
Net Asset Value Beginning of Period | | $ | 14.85 | | | $ | 13.56 | | | $ | 13.93 | | | $ | 18.13 | | | $ | 19.17 | |
Net Investment Income (Loss)(1) | | | 0.01 | | | | 0.02 | | | | 0.02 | | | | (0.02 | ) | | | (0.01 | ) |
Net Realized and Unrealized Gain (Loss) on Investments | | | (0.54 | ) | | | 1.29 | | | | (0.07 | ) | | | (1.09 | ) | | | 1.44 | |
| | | | | | | | | | | | | | | | | | | | |
Total Income (Loss) from Investment Operations | | | (0.53 | ) | | | 1.31 | | | | (0.05 | ) | | | (1.11 | ) | | | 1.43 | |
| | | | | | | | | | | | | | | | | | | | |
Dividends from Net Investment Income | | | (0.02 | ) | | | (0.02 | ) | | | - | | | | - | | | | - | |
Distributions from Net Realized Gains | | | - | | | | - | | | | (0.32 | ) | | | (3.09 | ) | | | (2.47 | ) |
| | | | | | | | | | | | | | | | | | | | |
Total Distributions | | | (0.02 | ) | | | (0.02 | ) | | | (0.32 | ) | | | (3.09 | ) | | | (2.47 | ) |
| | | | | | | | | | | | | | | | | | | | |
Net Asset Value End of Period | | $ | 14.30 | | | $ | 14.85 | | | $ | 13.56 | | | $ | 13.93 | | | $ | 18.13 | |
| | | | | | | | | | | | | | | | | | | | |
Total Return | | | (3.61 | )% | | | 9.64 | % | | | 0.46 | % | | | (5.77 | )% | | | 7.48 | % |
Net Assets End of Period (millions) | | $ | 2,607.3 | | | $ | 2,690.4 | | | $ | 2,156.5 | | | $ | 1,902.1 | | | $ | 2,151.2 | |
Ratio of Expenses to Average Net Assets | | | 1.20 | % | | | 1.22 | % | | | 1.22 | % | | | 1.20 | % | | | 1.19 | % |
Ratio of Net Investment Income (Loss) to Average Net Assets | | | 0.06 | % | | | 0.11 | % | | | 0.20 | % | | | (0.16 | )% | | | (0.03 | )% |
Portfolio Turnover Rate | | | 47.45 | % | | | 37.14 | % | | | 63.05 | % | | | 75.49 | % | | | 72.38 | % |
| (1) | Computed based on average shares outstanding. |
The accompanying notes are an integral part of the financial statements.
81
ARTISAN FUNDS
Financial Highlights – For a share outstanding throughout each period (Continued)
| | | | | | | | | | | | | | | | | | | | |
| | | ARTISAN VALUE FUND | |
| | | Investor Shares | |
| |
| | | Year Ended | |
| | | | | |
| | | 9/30/2011 | | | 9/30/2010 | | | 9/30/2009 | | | 9/30/2008 | | | 9/30/2007 | |
| | | | | | | | | | | | | | | | | | | | |
Net Asset Value Beginning of Period | | $ | 8.91 | | | $ | 8.12 | | | $ | 8.58 | | | $ | 12.22 | | | $ | 10.41 | |
Net Investment Income(1) | | | 0.09 | | | | 0.07 | | | | 0.06 | | | | 0.08 | | | | 0.20 | |
Net Realized and Unrealized Gain (Loss) on Investments | | | 0.19 | | | | 0.76 | | | | (0.44 | ) | | | (2.70 | ) | | | 1.73 | |
| | | | | | | | | | | | | | | | | | | | |
Total Income (Loss) from Investment Operations | | | 0.28 | | | | 0.83 | | | | (0.38 | ) | | | (2.62 | ) | | | 1.93 | |
| | | | | | | | | | | | | | | | | | | | |
Dividends from Net Investment Income | | | (0.08 | ) | | | (0.04 | ) | | | (0.08 | ) | | | (0.14 | ) | | | (0.03 | ) |
Distributions from Net Realized Gains | | | - | | | | - | | | | - | | | | (0.88 | ) | | | (0.09 | ) |
| | | | | | | | | | | | | | | | | | | | |
Total Distributions | | | (0.08 | ) | | | (0.04 | ) | | | (0.08 | ) | | | (1.02 | ) | | | (0.12 | ) |
| | | | | | | | | | | | | | | | | | | | |
Net Asset Value End of Period | | $ | 9.11 | | | $ | 8.91 | | | $ | 8.12 | | | $ | 8.58 | | | $ | 12.22 | |
| | | | | | | | | | | | | | | | | | | | |
Total Return | | | 3.10 | % | | | 10.19 | % | | | (4.10 | )% | | | (22.88 | )% | | | 18.65 | % |
Net Assets End of Period (millions) | | $ | 408.6 | | | $ | 266.4 | | | $ | 181.1 | | | $ | 230.3 | | | $ | 278.7 | |
Ratio of Expenses to Average Net Assets | | | 1.10 | % | | | 1.27 | % | | | 1.32 | % | | | 1.23 | % | | | 1.24 | % |
Ratio of Net Investment Income to Average Net Assets | | | 0.95 | % | | | 0.86 | % | | | 0.84 | % | | | 0.77 | % | | | 1.71 | % |
Portfolio Turnover Rate | | | 78.36 | % | | | 70.69 | % | | | 85.44 | % | | | 99.24 | % | | | 50.79 | % |
| (1) | Computed based on average shares outstanding. |
The accompanying notes are an integral part of the financial statements.
82
ARTISAN FUNDS
Notes to Financial Statements – September 30, 2011
Artisan Partners Funds, Inc. (“Artisan Funds”) was incorporated on January 5, 1995, as a Wisconsin corporation and is registered under the Investment Company Act of 1940, as amended. Effective July 1, 2011, Artisan Partners Funds, Inc. changed its name from Artisan Funds, Inc. but continues to do business as Artisan Funds. Artisan Funds is a series comprised of twelve open-end, diversified mutual funds. The following funds (each a “Fund” and collectively the “Funds”) are covered by this report:
| | | | |
| Fund Name | | Inception Date | |
Artisan Global Equity Fund (“Global Equity Fund” or “Global Equity”) | | | March 29, 2010 | |
Artisan Global Value Fund (“Global Value Fund” or “Global Value”) | | | December 10, 2007 | |
Artisan Growth Opportunities Fund (“Growth Opportunities Fund” or “Growth Opportunities”) | | | September 22, 2008 | |
Artisan International Fund (“International Fund” or “International”) | | | December 28, 1995 | |
Artisan International Small Cap Fund (“International Small Cap Fund” or “International Small Cap”) | | | December 21, 2001 | |
Artisan International Value Fund (“International Value Fund” or “International Value”) | | | September 23, 2002 | |
Artisan Mid Cap Fund (“Mid Cap Fund” or “Mid Cap”) | | | June 27, 1997 | |
Artisan Mid Cap Value Fund (“Mid Cap Value Fund” or “Mid Cap Value”) | | | March 28, 2001 | |
Artisan Small Cap Fund (“Small Cap Fund” or “Small Cap”) | | | March 28, 1995 | |
Artisan Small Cap Value Fund (“Small Cap Value Fund” or “Small Cap Value”) | | | September 29, 1997 | |
Artisan Value Fund (“Value Fund” or “Value”) | | | March 27, 2006 | |
Artisan Growth Opportunities Fund changed its name from Artisan Opportunistic Growth Fund effective January 28, 2011. Artisan Value Fund changed its name from Artisan Opportunistic Value Fund effective December 1, 2010.
Each Fund’s investment objective is to seek long-term capital growth. Each Fund has offered shares of capital stock of the class designated Investor Shares since the commencement of its operations. Growth Opportunities Fund, International Fund, International Value Fund, Mid Cap Fund and Value Fund began offering Institutional Shares on July 26, 2011, July 1, 1997, October 1, 2006, July 1, 2000 and July 26, 2011, respectively. Institutional Shares are sold to institutional investors meeting certain minimum investment requirements.
Each class of shares has equal rights with respect to portfolio assets and voting privileges. Each class has exclusive voting rights with respect to any matters involving only that class.
Income, expenses not specific to a particular class and realized and unrealized gains and losses were allocated daily to each class of shares based upon the relative net asset value of outstanding shares. Expenses attributable to a particular class of shares, such as transfer agency fees, shareholder communication expenses and registration fees, were allocated directly to that class.
Each Fund is managed by Artisan Partners Limited Partnership (the “Adviser” or “Artisan Partners”). The Adviser is wholly owned by Artisan Partners Holdings LP (“Artisan Holdings”). Artisan Global Equity Fund is subadvised by Artisan Partners UK LLP (“Artisan UK”). A wholly-owned subsidiary of Artisan Holdings is the founding member of Artisan UK.
83
NOTES TO FINANCIAL STATEMENTS
Artisan Emerging Markets Fund, also a series of Artisan Funds, commenced operations on June 26, 2006 and has offered Institutional Shares since inception. It began offering Advisor shares on June 2, 2008. The financial statements of both classes of Artisan Emerging Markets Fund are presented in separate reports.
| (2) | Summary of significant accounting policies: |
The following is a summary of significant accounting policies of the Funds in effect during the period covered by the financial statements, which were in accordance with United States generally accepted accounting principles.
| (a) | Security valuation – The net asset value (“NAV”) of the shares of each class of each Fund was determined as of the close of regular session trading on the New York Stock Exchange (“NYSE”) (usually 4:00 p.m., Eastern Time) each day the NYSE was open for regular session trading. The NAV of each class of shares was determined by dividing the value of each Fund’s securities and other assets attributed to that class, less its liabilities attributed to that class, by the number of outstanding shares of that class of that Fund. |
| | In determining NAV, each equity security traded on a securities exchange, including over-the-counter securities, was valued at the closing price as of the time of valuation on the exchange or market designated as the principal exchange (the “principal exchange”). The closing price provided by the pricing vendor for a principal exchange may differ and may represent information such as last sales price, an official closing price, a closing auction price or other information, depending on exchange or market convention. Absent closing price information from the principal exchange as of the time of valuation, the security was valued using the closing price on another exchange on which the security traded (if such price is made available by the pricing vendor) or the most recent bid quotation on the principal exchange or, if not available, another exchange or in the over-the-counter market. Short-term investments, other than repurchase agreements, maturing within sixty days from the valuation date were valued at amortized cost, which approximates market value. |
| | Exchange traded option contracts were valued at the last sale or official closing price on the exchange where an option is principally traded or, if no sales or closing prices were available, at the mean of the most recent bid and ask quotation on the principal exchange. |
| | Securities for which prices were not readily available were valued by Artisan Funds’ valuation committee (the “valuation committee”) at a fair value determined in good faith under procedures established by and under the general supervision of Artisan Funds’ board of directors (the “board of directors”). A price was considered to be not readily available if, among other things, the valuation committee believed that the price determined as described in the preceding paragraphs did not reflect a fair value of the security. |
| | Global Equity Fund, Global Value Fund, Growth Opportunities Fund, International Fund, International Small Cap Fund and International Value Fund generally invested a significant portion, and perhaps as much as substantially all, of their total assets in securities principally traded in markets outside the U.S. Value Fund had the ability to |
84
NOTES TO FINANCIAL STATEMENTS
| | invest, and did invest, in securities principally traded outside the U.S. The foreign markets in which the Funds invested were sometimes open on days when the NYSE was not open and the Funds did not calculate their NAVs, and sometimes were not open on days when the Funds did calculate their NAVs. Even on days on which both the foreign market and the NYSE were open, several hours may have passed between the time when trading in the foreign market closed and the time as of which the Funds calculated their NAVs. That was generally the case for markets in Europe, Asia, Australia and other far eastern markets; the regular closing time of foreign markets in North and South America was generally the same as the closing time of the NYSE and the time as of which the Funds calculated their NAVs. |
| | The valuation committee concluded that a price determined under the Funds’ valuation procedures was not readily available if, among other things, the valuation committee believed that the value of the security might have been materially affected by events occurring after the close of the market in which the security was principally traded but before the time for determination of NAV (“subsequent event”). A subsequent event might include a company-specific development (for example, announcement of a merger that is made after the close of the foreign market), a development that might affect an entire market or region (for example, imposition of foreign exchange controls by a foreign government), a potentially global development (such as a terrorist attack that may be expected to have an impact on investor expectations worldwide) or a significant change in one or more U.S. securities indices. Artisan Funds monitored for subsequent events using several tools. An indication by any of those tools of a potential material change in the value of securities resulted in either a meeting of the valuation committee, which considered whether a subsequent event had occurred and whether local market closing prices continued to represent fair values for potentially affected non-U.S. securities, and/or a valuation based on information provided by a third party research service. This third party research service was used to assist in determining estimates of fair values for foreign securities. That service utilized statistical data based on historical performance of securities, markets and other data in developing factors used to estimate a fair value. |
| | Estimates of fair values utilized by the Funds as described above may differ from the value realized on the subsequent sale of those securities and from quoted or published prices for those securities. The differences may have been material to the NAV of the applicable Fund or to the information presented. |
| | Foreign stocks, as an asset, class may underperform U.S. stocks, and foreign stocks may be more volatile than U.S. stocks. Risks relating to investment in foreign securities (including, but not limited to, depositary receipts and participation certificates) include: currency exchange rate fluctuation; less available public information about the issuers of securities; less stringent regulatory standards; lack of uniform accounting, auditing and financial reporting standards; and country risks including less liquidity, high inflation rates, unfavorable economic practices and political instability. The risks of foreign investments are typically greater in emerging and less developed markets. |
| (b) | Fair value measurements – Under generally accepted accounting principles for fair value measurement, accounting standards clarify the definition of fair value for financial reporting, establish a framework for measuring fair value and require |
85
NOTES TO FINANCIAL STATEMENTS
| | additional disclosures about the use of fair value measurements. In accordance with this standard, fair value is defined as the price that each Fund would receive upon selling an investment in an orderly transaction to an independent buyer in the principal or most advantageous market of the investment. The standard establishes a three-tier hierarchy to distinguish between (1) inputs that reflect the assumptions market participants would use in pricing an asset or liability developed based on the market data obtained from sources independent of the reporting entity (observable inputs) and (2) inputs that reflect the reporting entity’s own assumptions about the assumptions market participants would use in pricing an asset or liability developed based on the best information available in the circumstances (unobservable inputs) and to establish classification of fair value measurements for disclosure purposes. Various inputs are used in determining the value of the Funds’ investments. The three-tier hierarchy of inputs is summarized in three broad levels: |
| | • | | Level 1 – quoted prices in active markets for identical investments |
| | • | | Level 2 – other significant observable inputs (including but not limited to quoted prices for similar securities, interest rates, credit risks, etc. Securities primarily traded outside the U.S., whose values were adjusted as result of significant market movements, are classified as level 2) |
| | • | | Level 3 – significant unobservable inputs (including the Funds’ own assumptions in determining a fair value of investments) |
| | The inputs or methodology used for valuing securities are not necessarily an indication of the risk or liquidity associated with investing in those securities. |
| | The following table summarizes each Fund’s investments by major security type, based on the inputs used to determine their fair values as of September 30, 2011 (in thousands): |
| | | | | | | | | | | | | | | | |
| Fund | | Level 1 - Quoted
Prices | | | Level 2 - Other Significant
Observable Inputs | | | Level 3 - Significant
Unobservable Inputs | | | Total | |
Global Equity | | | | | | | | | | | | | | | | |
Equity Securities(1): | | | | | | | | | | | | | | | | |
Americas | | $ | 4,001 | | | $ | - | | | $ | - | | | $ | 4,001 | |
Emerging Markets | | | 339 | | | | 691 | | | | - | | | | 1,030 | |
Europe | | | - | | | | 4,221 | | | | - | | | | 4,221 | |
Pacific Basin | | | - | | | | 1,271 | | | | - | | | | 1,271 | |
Repurchase Agreements | | | - | | | | 541 | | | | - | | | | 541 | |
Total Investments in Securities | | | 4,340 | | | | 6,724 | | | | - | | | | 11,064 | |
Derivatives: | | | | | | | | | | | | | | | | |
Foreign Currency Forward Contracts(3) | | | - | | | | - | | | | - | | | | - | |
Total | | $ | 4,340 | | | $ | 6,724 | (2) | | $ | - | | | $ | 11,064 | |
86
NOTES TO FINANCIAL STATEMENTS
| | | | | | | | | | | | | | | | |
| Fund | | Level 1 - Quoted
Prices | | | Level 2 - Other Significant
Observable Inputs | | | Level 3 - Significant
Unobservable Inputs | | | Total | |
Global Value | | | | | | | | | | | | | | | | |
Equity and Equity-Linked Securities(1): | | | | | | | | | | | | | | | | |
Americas | | $ | 35,607 | | | $ | - | | | $ | - | | | $ | 35,607 | |
Europe | | | 2,220 | | | | 19,175 | | | | - | | | | 21,395 | |
Pacific Basin | | | - | | | | 5,144 | | | | - | | | | 5,144 | |
Repurchase Agreements | | | - | | | | 4,589 | | | | - | | | | 4,589 | |
Total Investments in Securities | | | 37,827 | | | | 28,908 | | | | - | | | | 66,735 | |
Derivatives: | | | | | | | | | | | | | | | | |
Foreign Currency Forward Contracts(3) | | | - | | | | 15 | | | | - | | | | 15 | |
Total | | $ | 37,827 | | | $ | 28,923 | (2) | | $ | - | | | $ | 66,750 | |
Growth Opportunities | | | | | | | | | | | | | | | | |
Equity Securities(1): | | | | | | | | | | | | | | | | |
Americas | | $ | 96,625 | | | $ | - | | | $ | - | | | $ | 96,625 | |
Emerging Markets | | | 18,186 | | | | 8,593 | | | | - | | | | 26,779 | |
Europe | | | 2,421 | | | | 12,587 | | | | - | | | | 15,008 | |
Pacific Basin | | | - | | | | 4,887 | | | | - | | | | 4,887 | |
Repurchase Agreements | | | - | | | | 10,298 | | | | - | | | | 10,298 | |
Total Investments in Securities | | | 117,232 | | | | 36,365 | | | | - | | | | 153,597 | |
Derivatives: | | | | | | | | | | | | | | | | |
Foreign Currency Forward Contracts(3) | | | - | | | | 5 | | | | - | | | | 5 | |
Total | | $ | 117,232 | | | $ | 36,370 | (2) | | $ | - | | | $ | 153,602 | |
International | | | | | | | | | | | | | | | | |
Equity Securities(1): | | | | | | | | | | | | | | | | |
Americas | | $ | 397,669 | | | $ | - | | | $ | - | | | $ | 397,669 | |
Emerging Markets | | | 288,034 | | | | 338,807 | | | | - | | | | 626,841 | |
Europe | | | - | | | | 4,084,752 | | | | - | | | | 4,084,752 | |
Middle East | | | - | | | | - | | | | - | | | | - | |
Pacific Basin | | | - | | | | 2,438,039 | | | | - | | | | 2,438,039 | |
Repurchase Agreements | | | - | | | | 246,213 | | | | - | | | | 246,213 | |
Total | | $ | 685,703 | | | $ | 7,107,811 | (2) | | $ | - | | | $ | 7,793,514 | |
International Small Cap | | | | | | | | | | | | | | | | |
Equity Securities(1): | | | | | | | | | | | | | | | | |
Emerging Markets | | $ | 10,399 | | | $ | 111,734 | | | $ | - | | | $ | 122,133 | |
Europe | | | 11,908 | | | | 280,097 | | | | - | | | | 292,005 | |
Pacific Basin | | | 3,181 | | | | 90,788 | | | | - | | | | 93,969 | |
Repurchase Agreements | | | - | | | | 50,781 | | | | - | | | | 50,781 | |
Total | | $ | 25,488 | | | $ | 533,400 | (2) | | $ | - | | | $ | 558,888 | |
87
NOTES TO FINANCIAL STATEMENTS
| | | | | | | | | | | | | | | | |
| Fund | | Level 1 - Quoted
Prices | | | Level 2 - Other Significant
Observable Inputs | | | Level 3 - Significant
Unobservable Inputs | | | Total | |
International Value | | | | | | | | | | | | | | | | |
Equity and Equity-Linked Securities(1): | | | | | | | | | | | | | | | | |
Americas | | $ | 725,861 | | | $ | - | | | $ | - | | | $ | 725,861 | |
Emerging Markets | | | - | | | | 21,934 | | | | - | | | | 21,934 | |
Europe | | | 168,562 | | | | 2,481,284 | | | | - | | | | 2,649,846 | |
Pacific Basin | | | - | | | | 690,238 | | | | - | | | | 690,238 | |
Repurchase Agreements | | | - | | | | 128,934 | | | | - | | | | 128,934 | |
Total Investments in Securities | | | 894,423 | | | | 3,322,390 | | | | - | | | | 4,216,813 | |
Derivatives: | | | | | | | | | | | | | | | | |
Foreign Currency Forward Contracts(3) | | | - | | | | 1,905 | | | | - | | | | 1,905 | |
Total | | $ | 894,423 | | | $ | 3,324,295 | (2) | | $ | - | | | $ | 4,218,718 | |
Mid Cap | | | | | | | | | | | | | | | | |
Equity Securities(1) | | $ | 4,790,407 | | | $ | - | | | $ | - | | | $ | 4,790,407 | |
Repurchase Agreements | | | - | | | | 241,658 | | | | - | | | | 241,658 | |
Total | | $ | 4,790,407 | | | $ | 241,658 | | | $ | - | | | $ | 5,032,065 | |
Mid Cap Value | | | | | | | | | | | | | | | | |
Equity Securities(1) | | $ | 5,997,680 | | | $ | - | | | $ | - | | | $ | 5,997,680 | |
Repurchase Agreements | | | - | | | | 208,269 | | | | - | | | | 208,269 | |
Total | | $ | 5,997,680 | | | $ | 208,269 | | | $ | - | | | $ | 6,205,949 | |
Small Cap Fund | | | | | | | | | | | | | | | | |
Equity Securities(1) | | $ | 314,208 | | | $ | - | | | $ | - | | | $ | 314,208 | |
Repurchase Agreements | | | - | | | | 14,180 | | | | - | | | | 14,180 | |
Total | | $ | 314,208 | | | $ | 14,180 | | | $ | - | | | $ | 328,388 | |
Small Cap Value Fund | | | | | | | | | | | | | | | | |
Equity Securities(1) | | $ | 2,568,355 | | | $ | - | | | $ | - | | | $ | 2,568,355 | |
Repurchase Agreements | | | - | | | | 41,200 | | | | - | | | | 41,200 | |
Total | | $ | 2,568,355 | | | $ | 41,200 | | | $ | - | | | $ | 2,609,555 | |
88
NOTES TO FINANCIAL STATEMENTS
| | | | | | | | | | | | | | | | |
| Fund | | Level 1 - Quoted
Prices | | | Level 2 - Other Significant
Observable Inputs | | | Level 3 - Significant
Unobservable Inputs | | | Total | |
Value | | | | | | | | | | | | | | | | |
Equity Securities(1): | | | | | | | | | | | | | | | | |
Consumer Discretionary | | $ | 42,139 | | | $ | - | | | $ | - | | | $ | 42,139 | |
Consumer Staples | | | 30,307 | | | | 16,974 | | | | - | | | | 47,281 | |
Energy | | | 49,628 | | | | - | | | | - | | | | 49,628 | |
Financials | | | 126,545 | | | | - | | | | - | | | | 126,545 | |
Healthcare | | | 13,421 | | | | - | | | | - | | | | 13,421 | |
Industrials | | | 12,086 | | | | - | | | | - | | | | 12,086 | |
Information Technology | | | 159,414 | | | | - | | | | - | | | | 159,414 | |
Repurchase Agreements | | | - | | | | 10,526 | | | | - | | | | 10,526 | |
Total | | $ | 433,540 | | | $ | 27,500 | (2) | | $ | - | | | $ | 461,040 | |
|
(1)See Fund’s Schedule of Investments for sector or country classifications. | |
(2) Includes securities trading primarily outside the U.S. whose value the Fund adjusted as a result of significant market movements following the close of local trading. | |
(3) Derivative instruments are valued at unrealized appreciation. | |
| | Transfers between investment levels may occur as markets fluctuate and/or the availability of data used in an investment’s valuation changes. The Funds recognize transfers between levels as of the end of the period. At September 30, 2011, the fair market value of certain securities were adjusted, resulting in their Level 2 classification, due to developments that occurred between the time of the close of the foreign markets on which they trade and the close of regular session trading on the NYSE. The following table summarizes security transfers from Level 1 to Level 2 for each Fund as of September 30, 2011 (in thousands): |
| | | | |
| | | Transfers from Level 1 to Level 2 | |
Global Equity | | $ | 4,135 | |
Global Value | | | 19,193 | |
Growth Opportunities Fund | | | 9,831 | |
International | | | 4,297,816 | |
International Small Cap | | | 381,965 | |
International Value | | | 2,395,331 | |
| | As of September 30, 2011, there were no transfers of Level 3 securities. |
| (c) | Taxes – No provision was made for federal income taxes or excise taxes since each Fund intends to (i) comply with the provisions of Subchapter M of the Internal Revenue Code applicable to regulated investment companies and (ii) distribute to its shareholders substantially all of its taxable income as well as net realized gains from the sale of investment securities. The Funds may utilize earnings and profits distributed to shareholders on redemptions of Fund shares as part of the dividends paid deduction. |
| | The Funds have analyzed the tax positions taken on federal income tax returns for all open tax years (fiscal years 2008 through 2010) and have concluded that as of September 30, 2011, no provision for income tax is required in the Funds’ financial |
89
NOTES TO FINANCIAL STATEMENTS
| | statements. The Funds’ federal and state income and federal excise tax returns for tax years for which the applicable statutes of limitations have not expired are subject to examination by the Internal Revenue Service and each state’s department of revenue. |
| | The Funds may be subject to taxes on realized gains from the sale of investment securities imposed by certain countries in which the Funds invest. The foreign tax expense, if any, was recorded on an accrual basis and is included in “Net realized gain (loss) on investments” on the accompanying Statements of Operations. The amount of foreign tax owed, including withholding taxes of foreign dividends, is included in “Payable for foreign taxes” on the accompanying Statements of Assets and Liabilities. |
| (d) | Portfolio transactions – In determining a Fund’s NAV, security transactions and shareholder transactions were accounted for no later than one business day after trade date, in accordance with applicable regulations. However, for financial reporting purposes, security transactions and shareholder transactions were recorded on trade date in accordance with United States generally accepted accounting principles. Net realized gains and losses on securities were computed on specific security lot identification. |
| (e) | Foreign currency translation – Values of foreign investments, open foreign currency forward contracts, payables for capital gains taxes, payables and receivables for securities transactions, dividend and reclaim receivables, other receivables and payables, and cash denominated in a foreign currency were translated into U.S. dollars using a spot market rate of exchange as of the time of determination of each Fund’s NAV on the day of valuation. Purchases and sales of investments and dividend and interest income were translated into U.S. dollars using the current spot market rate of exchange on the date of such transactions. The portion of security gains or losses resulting from changes in foreign exchange rates was included with net realized and unrealized gain or loss from investments, as appropriate, for both financial reporting and tax purposes. |
| | The Funds may enter into (a) foreign currency contracts, and (b) foreign currency forward contracts. Foreign currency contracts are used to facilitate the purchase and sale of non-U.S. securities and generally settle within three business days. Foreign currency forward contracts are used to hedge against foreign currency exchange rate risks on its non-U.S. dollar denominated investment securities. Open foreign currency contracts and foreign currency forward contracts, if any, were recorded at market value and recorded in the Statements of Assets and Liabilities. Realized and unrealized gains and losses were reported as foreign currency related transactions are recorded in the Statement of Operations. |
| | As of September 30, 2011, Global Equity, Global Value, Growth Opportunities and International Value had outstanding foreign currency forward contracts, as shown on the Schedule of Investments. Foreign currency contracts are not separately disclosed in the Schedule of Investments. |
| | For tax purposes, these foreign exchange gains and losses were treated as ordinary income or loss. The Funds could be exposed to loss if the counterparties fail to perform under these contracts. Other foreign currency related transaction gains and losses may result from currency gains and losses realized from the difference between the amounts of dividends and foreign withholding taxes recorded on the Funds’ books |
90
NOTES TO FINANCIAL STATEMENTS
| | and the U.S. dollar equivalent of the amounts actually received or paid. The net increase (decrease) in unrealized appreciation or depreciation on foreign currency related transactions arose from changes in the values of assets and liabilities, other than investments in securities, resulting from changes in foreign exchange rates. |
| (f) | Options – The Funds may purchase and write call or put options on securities and indices and enter into related closing transactions. As a holder of a call option, the Fund has the right, but not the obligation, to purchase a security at the exercise price during the exercise period. As the writer of a call option, the Fund has the obligation to sell the security at the exercise price during the exercise period in the event the option is exercised. As a holder of a put option, the Fund has the right, but not the obligation, to sell a security at the exercise price during the exercise period. As the writer of a put option, the Fund has the obligation to buy the underlying security at the exercise price during the exercise period in the event the option is exercised. |
| | The premium that the Fund pays when purchasing an option or that the Fund receives when writing an option will reflect, among other things, the market price of the security, the relationship of the exercise price to the market price of the security, the relationship of the exercise price to the volatility of the security, the length of the option period and supply and demand factors. The premium is the market value of an option at the time of the trade. |
| | When the Fund writes (sells) an option, an amount equal to the premium received by the Fund is included in the Statements of Assets and Liabilities as an equivalent liability. The amount of the liability is subsequently marked-to-market to reflect the current value of the option written. Premiums received from writing options that expire are treated as realized gains. Premiums received from writing options that are exercised or closed are added to the proceeds or offset against the amounts paid on the underlying security transaction to determine the realized gain or loss. |
| | When the Fund purchases an option, the Fund pays a non-refundable premium to the seller (writer) of the option. The Fund includes the premium paid in the Statements of Assets and Liabilities as an equivalent asset. The amount of the asset is subsequently marked-to-market to reflect the current value of the option purchased. Premiums paid for purchased call and put options that have expired are treated as realized losses on investments in the Statements of Operations. Upon the exercise or closing of a purchased call option, the premium paid is added to the cost of the security or financial instrument. Upon the exercise or closing of a purchased put option, the premium paid is offset against the proceeds on the sale of the underlying security or financial instrument in order to determine the realized gain or loss on investments. |
| | Growth Opportunities Fund entered into written call options during the year ended September 30, 2011 as follows: |
| | | | | | | | |
| | | Number of Contracts | | | Premiums Received
(in thousands) | |
Options outstanding at beginning of period | | | - | | | | - | |
Options written | | | 40 | | | $ | 11 | |
Options terminated in closing transactions | | | (40 | ) | | | (11 | ) |
Options outstanding at end of period | | | - | | | | - | |
91
NOTES TO FINANCIAL STATEMENTS
| (g) | Repurchase agreements – Each Fund may enter into repurchase agreements with institutions that the Adviser determined were creditworthy pursuant to criteria adopted by the board of directors. Repurchase agreements were recorded at cost plus accrued interest and were collateralized in an amount greater than or equal to the repurchase price plus accrued interest. Collateral (in the form of U.S. government securities) was held by the Funds’ custodian and in the event of default on the obligation of the counterparty to repurchase, the Funds had the right to liquidate the collateral and apply the proceeds in satisfaction of the obligation. If the proceeds from any sale of such collateral were less than the repurchase price, the Fund would have suffered a loss. |
| (h) | Depositary receipts – Each of the Funds may invest in depositary receipts. Depositary receipts are typically issued by a financial institution (a “depositary”), evidencing ownership interests in a security issued by an issuer and deposited with the depositary. |
| (i) | Equity-linked participation certificates – Global Equity Fund, Global Value Fund, Growth Opportunities Fund, International Fund, International Small Cap Fund, International Value Fund, and Value Fund may invest in equity-linked participation certificates. Equity-linked participation certificates are derivative securities which are designed to provide synthetic exposure to one or more underlying securities. An investment in an equity-linked participation certificate typically entitles the holder to a return equal to the market return of the underlying security or securities, subject to the credit risk of the issuing financial institution. There is no off-balance sheet risk associated with equity-linked participation certificates and the Funds’ potential loss is limited to the purchase price of the securities. The Funds are exposed to credit risk associated with the counterparty to the transaction, which is monitored by the Funds’ management on a periodic basis. |
| (j) | Transfer agent and authorized agent fees – Each Fund paid fees to, and reimbursed expenses of, the Funds’ transfer agent. In addition, the Funds have authorized certain financial services companies, broker-dealers, banks or other authorized agents, and in some cases, other organizations designated by an authorized agent (with their designees, collectively “authorized agents”) to accept purchase, exchange and redemption orders for Investor Shares on the Funds’ behalf. Many authorized agents charged a fee for accounting and shareholder services that the agent provided to Fund shareholders on the Fund’s behalf. Those services typically included recordkeeping, transaction processing for shareholders’ accounts and other services. The fee was either based on the number of accounts to which the intermediary provided such services, or was a percentage (as of September 30, 2011 up to 0.40% annually) of the average value of Fund shares held in such accounts. Each Fund paid a portion of such fees, which are intended to compensate the authorized agent for its provision of services of the type that would be provided by the Funds’ transfer agent or other service providers if the shares were registered on the books of the Funds’ transfer agent. The balance of the fees incurred was paid by the Adviser. The Funds’ expenses incurred for services provided by authorized agents were included in “Transfer agent fees” in the Statements of Operations. The table below shows the fees and expenses to |
92
NOTES TO FINANCIAL STATEMENTS
| | the Funds’ transfer agent and the fees to authorized agents incurred by each class of each Fund during the year ended September 30, 2011 (in thousands): |
| | | | | | | | | | | | |
| | | Year Ended 9/30/11 | |
| Fund | | Fees and Expenses
to Transfer Agent | | | Fees to
Authorized
Agents | | | Total | |
Global Equity - Investor Shares | | $ | 62 | | | $ | 24 | | | $ | 86 | |
Global Value - Investor Shares | | | 67 | | | | 126 | | | | 193 | |
Growth Opportunities - Investor Shares | | | 68 | | | | 316 | | | | 384 | |
Growth Opportunities - Institutional Shares(1) | | | 4 | | | | - | | | | 4 | |
International - Investor Shares | | | 641 | | | | 15,788 | | | | 16,429 | |
International - Institutional Shares | | | 22 | | | | - | | | | 22 | |
International Small Cap - Investor Shares | | | 77 | | | | 1,038 | | | | 1,115 | |
International Value - Investor Shares | | | 470 | | | | 6,069 | | | | 6,539 | |
International Value - Institutional Shares | | | 22 | | | | - | | | | 22 | |
Mid Cap - Investor Shares | | | 114 | | | | 14,152 | | | | 14,266 | |
Mid Cap - Institutional Shares | | | 20 | | | | - | | | | 20 | |
Mid Cap Value - Investor Shares | | | 556 | | | | 15,598 | | | | 16,154 | |
Small Cap - Investor Shares | | | 98 | | | | 588 | | | | 686 | |
Small Cap Value - Investor Shares | | | 103 | | | | 6,884 | | | | 6,987 | |
Value - Investor Shares | | | 93 | | | | 940 | | | | 1,033 | |
Value - Institutional Shares(1) | | | 5 | | | | - | | | | 5 | |
|
(1)For the period of commencement of operations July 26, 2011 through September 30, 2011. | |
| (k) | Commission recapture – Each of the Funds had the ability to direct portfolio trades to various brokers that have agreed to rebate a portion of the commissions generated. Such cash rebates were made directly to the applicable Fund and were included in net realized gain or loss on investments in the Statements of Operations for the year ended September 30, 2011 as follows (in thousands): |
| | | | |
Global Equity | | $ | - | (1) |
Global Value | | | 1 | |
Growth Opportunities | | | 8 | |
International | | | 554 | |
International Small Cap | | | 46 | |
International Value | | | 116 | |
Mid Cap | | | 353 | |
Mid Cap Value | | | 332 | |
Small Cap | | | 44 | |
Small Cap Value | | | 283 | |
Value | | | 35 | |
| |
(1) Amount rounds to less than $1. | | | | |
93
NOTES TO FINANCIAL STATEMENTS
| (l) | Use of estimates – The preparation of financial statements in conformity with United States generally accepted accounting principles requires management to make estimates and assumptions that affect the reported amounts and disclosures in the financial statements. Actual results could differ from those estimates. |
| (m) | Indemnifications – In the normal course of business, the Funds have entered into contracts in which the Funds agree to indemnify the other party or parties against various potential costs or liabilities. The Funds’ maximum exposure under these arrangements is unknown. No claim has been made for indemnification pursuant to any such agreement of the Funds. |
| (n) | Other – Dividend income less foreign taxes withheld, if any, was generally recorded on the ex-dividend date. In some cases, the information was not available to the Fund on the ex-dividend date. In such cases, which may have included private placements and foreign securities, dividends were recorded as soon after the ex-dividend date as reliable information became available to the Funds. Non-cash dividends included in dividend income, if any, were generally recorded at the fair market value of securities received. Interest income was reported on the accrual basis. Distributions to shareholders were recorded on the ex-dividend date. Expenses attributable to Artisan Funds were generally allocated to each Fund based on net assets. However, other expense allocation methodologies were used, depending on the nature of the expense item. Expenses attributable to a particular Fund or class were allocated directly to that Fund or class. |
| | The character of income and net realized gains and losses may differ in some instances for financial statement and tax purposes and may result in reclassification of permanent differences among certain capital accounts to more appropriately conform financial accounting to tax characterizations of dividend and capital gain distributions. |
| | Global Equity Fund, Global Value Fund, Growth Opportunities Fund, International Fund, International Small Cap Fund and International Value Fund generally imposed a 2% redemption fee on Fund shares held 90 days or less. Those redemption fees were recorded as a reduction in the cost of shares redeemed and had the primary effect of increasing paid-in capital. Each Fund reserved the right to waive or reduce the 2% redemption fee on Fund shares held 90 days or less at its discretion when the Fund believed such waiver was in the best interests of the Fund, including but not limited to when it determined that imposition of the redemption fee was not necessary to protect the Fund from the effects of short-term trading. The Funds waived the fee on redemption of shares held by certain authorized agents or other Fund intermediaries and otherwise in accordance with the Funds’ prospectus. |
| (o) | New accounting pronouncement – In May 2011, the FASB issued Accounting Standards Update (“ASU”) No. 2011-4, “Amendments to Achieve Common Fair Value Measurement and Disclosure Requirements” in GAAP and the International Financial Reporting Standards (“IFRS”). ASU No. 2011-4 amends FASB ASC Topic 820, Fair Value Measurements and Disclosures, to establish common requirements for measuring fair value and disclosing information about fair value measurements in accordance with GAAP and IFRS. ASU No. 2011-4 is effective for fiscal years beginning after December 15, 2011 and for interim periods within those fiscal years. The Funds’ management is currently evaluating the impact these amendments may have on the Funds’ financial statements. |
94
NOTES TO FINANCIAL STATEMENTS
| (3) | Derivative transactions: |
The fair value of derivative instruments as reported in the Statements of Assets and Liabilities as of September 30, 2011 was as follows (in thousands):
| | | | | | | | |
| Fund | | Risk Exposure Category | | Statement of Assets and
Liabilities location | | Value | |
| Global Equity | | Foreign currency forward contracts | | Unrealized gain on foreign currency contracts | | $ | 1 | |
| | | Foreign currency forward contracts | | Unrealized loss on foreign currency contracts | | | (1 | ) |
| Total | | | | | | $ | - | (1) |
| Global Value | | Foreign currency forward contracts | | Unrealized gain on foreign currency contracts | | $ | 15 | |
| Growth Opportunities | | Foreign currency forward contracts | | Unrealized gain on foreign currency contracts | | $ | 5 | |
| International Value | | Foreign currency forward contracts | | Unrealized gain on foreign currency contracts | | $ | 1,905 | |
| (1) | Amount rounds to less than $1. |
The effect of derivative instruments on the Statements of Operations for the year ended September 30, 2011 was as follows (in thousands):
Amount of Realized Gain (Loss) on Derivatives Recognized in Income
| | | | | | | | |
| Fund | | Risk Exposure Category | | Statement of Operations location | | Value | |
| Global Equity | | Foreign currency forward contracts | | Net realized gain (loss) on foreign currency related transactions | | $ | - | (1) |
| Global Value | | Foreign currency forward contracts | | Net realized loss on foreign currency related transactions | | $ | (140 | ) |
| Growth Opportunities | | Foreign currency forward contracts | | Net realized loss on foreign currency related transactions | | $ | (78 | ) |
| | | Purchased Options | | Net realized loss on investments | | $ | (5 | ) |
| | | Written Options | | Net realized gain on investments | | | 9 | |
| Total | | | | | | $ | (74 | ) |
| International Value | | Foreign currency forward contracts | | Net realized gain (loss) on foreign currency related transactions | | $ | (19,617 | ) |
| (1) | Amount rounds to less than $1. |
Change in Unrealized Appreciation (Depreciation) on Derivatives Recognized in Income
| | | | | | | | |
| Fund | | Risk Exposure Category | | Statement of Operations location | | Value | |
| Global Equity | | Foreign currency forward contracts | | Net increase in unrealized appreciation or depreciation on foreign currency related transactions | | $ | - | (1) |
| Global Value | | Foreign currency forward contracts | | Net increase in unrealized appreciation or depreciation on foreign currency related transactions | | | 15 | |
| Growth Opportunities | | Foreign currency forward contracts | | Net increase in unrealized appreciation or depreciation on foreign currency related transactions | | | 5 | |
| International Value | | Foreign currency forward contracts | | Net increase in unrealized appreciation or depreciation on foreign currency related transactions | | | 1,905 | |
| (1) | Amount rounds to less than $1. |
95
NOTES TO FINANCIAL STATEMENTS
Volume of derivative activity
For the year ended September 30, 2011, Global Equity Fund, Global Value Fund and Growth Opportunities Fund each held and closed out of two foreign currency forward contracts in addition to one foreign currency forward contract that is presented on each of the respective Schedules of Investments. International Value Fund held and closed out of three foreign currency forward contracts in addition to one foreign currency forward contract that is presented on the Schedule of Investments.
For the year ended September 30, 2011, Growth Opportunities Fund held and closed out of 40 written call option contracts and 80 purchased put option contracts.
| (4) | Transactions with affiliates: |
The Adviser, with which the officers and a director of Artisan Funds were affiliated, provided investment advisory and administrative services to the Funds. In exchange for those services, International Value Fund, Mid Cap Fund, Mid Cap Value Fund, Small Cap Fund, and Small Cap Value Fund paid a monthly management fee to the Adviser as follows:
| | | | |
Average Daily Net Assets | | Annual Rate | |
Less than $500 million | | | 1.000 | % |
$500 million to $750 million | | | 0.975 | |
$750 million to $1 billion | | | 0.950 | |
Greater than $1 billion | | | 0.925 | |
Global Equity Fund and Global Value Fund paid a monthly management fee to the Adviser as follows:
| | | | |
Average Daily Net Assets | | Annual Rate | |
Less than $1 billion | | | 1.000 | % |
$1 billion to $4 billion | | | 0.975 | |
$4 billion to $8 billion | | | 0.950 | |
$8 billion to $12 billion | | | 0.925 | |
Greater than $12 billion | | | 0.900 | |
International Fund paid a monthly management fee to the Adviser as follows:
| | | | |
Average Daily Net Assets | | Annual Rate | |
Less than $500 million | | | 1.000 | % |
$500 million to $750 million | | | 0.975 | |
$750 million to $1 billion | | | 0.950 | |
$1 billion to $12 billion | | | 0.925 | |
Greater than $12 billion | | | 0.900 | |
International Small Cap Fund paid a monthly management fee to the Adviser at an annual rate of 1.250% of average daily net assets.
96
NOTES TO FINANCIAL STATEMENTS
Growth Opportunities Fund paid and Value Fund (for the period October 1, 2010 to November 30, 2010) paid a monthly management fee to the Adviser as follows:
| | | | |
Average Daily Net Assets | | Annual Rate | |
Less than $1 billion | | | 0.900 | % |
$1 billion to $4 billion | | | 0.875 | |
$4 billion to $8 billion | | | 0.850 | |
$8 billion to $12 billion | | | 0.825 | |
Greater than $12 billion | | | 0.800 | |
Effective December 1, 2010, Value Fund paid a monthly management fee to the Adviser as follows:
| | | | |
Average Daily Net Assets | | Annual Rate | |
Less than $50 million | | | 0.800 | % |
$50 million to $100 million | | | 0.760 | |
$100 million to $500 million | | | 0.720 | |
$500 million to $7.5 billion | | | 0.680 | |
Greater than $7.5 billion | | | 0.640 | |
The Adviser has contractually agreed to waive its management fee, and to the extent that the fee waiver is insufficient, to reimburse Global Equity Fund, Global Value Fund and Growth Opportunities Fund for any ordinary operating expenses in an amount sufficient to cause the Fund’s ordinary operating expenses, including the management fee, to be not more than 1.50% of average daily net assets, annually. This contract continues through February 1, 2013, at which time the Adviser will determine whether to renew, revise or discontinue it. For the year ended September 30, 2011, expenses of approximately $208,000, $120,000 and $17,000 incurred by Global Equity Fund, Global Value Fund and Growth Opportunities Fund, respectively, were waived by the Adviser.
The officers and director of Artisan Funds who are affiliated with the Adviser receive no compensation from the Funds.
Prior to April 1, 2011, each director who was not an affiliated person of the Adviser received an annual retainer of $180,000, payable quarterly, as well as reimbursement of expenses related to his duties as a director of Artisan Funds. The amount of the annual retainer increased by $10,000 with each new series of Artisan Funds. In addition, the non-interested chair of the board of directors received an annual retainer of $60,000, payable quarterly, and each chair of a board committee who was a non-interested director received an annual retainer of $30,000, payable quarterly. Effective April 1, 2011, each director who was not an affiliated person of the Adviser receives an annual retainer of $200,000, payable quarterly, which will increase by $10,000 with each new series of Artisan Funds. The additional annual retainer fees for the non-interested chair of the board of directors and each non-interested chair of a board committee were not changed from the prior period. These fees were generally allocated to each of Artisan Funds based on net assets, subject to a minimum allocation of $1,500 to each Fund per quarter.
Artisan Funds has adopted a deferred compensation plan for directors who are not affiliated persons of the Adviser that enables directors to elect to defer receipt of all or a portion of the annual compensation they are entitled to receive from the Funds. For purposes of determining the amount owed to the directors under the plan, deferred amounts would be
97
NOTES TO FINANCIAL STATEMENTS
invested in shares of Artisan Funds as selected by the individual directors. Each Fund would purchase shares of Artisan Funds selected for deferral by the director in amounts equal to his investment, resulting in a Fund asset equal to the deferred compensation liability. As of September 30, 2011, no current directors have elected to participate in the deferred compensation plan.
Shares of Artisan Funds were offered for sale by Artisan Partners Distributors LLC (“Distributors”). Distributors is wholly owned by Artisan Holdings. All distribution expenses relating to the Funds were paid by the Adviser.
| (5) | Line of credit arrangement: |
Artisan Funds is party to a line of credit agreement with State Street Bank and Trust Company (“SSB”), which expires in August 2012, under which each Fund may borrow up to $75 million, provided that such borrowing does not exceed the least of (a) 33 1/3% of its adjusted net assets, with adjusted net assets being total assets less total liabilities (excluding indebtedness for borrowed money) after giving effect to the loan, (b) the maximum amount the Fund may borrow under applicable law, (c) the limitations included in the Funds’ prospectus, or (d) any limitations on borrowings in any agreement with any governmental authority or regulator; provided that the aggregate borrowings by all Artisan Funds may not exceed $100 million. For the period October 1, 2010 to August 15, 2011, Artisan Funds paid a commitment fee at the annual rate of 0.125% on the unused portion of the line of credit and interest was charged on any borrowings at the current Federal Funds rate plus 1.25%. For the period October 1, 2010 to August 15, 2011, SSB agreed to waive 0.025% of the commitment fee by reducing the Funds’ custody expenses. Effective August 16, 2011, Artisan Funds paid a commitment fee at the annual rate of 0.10% on the unused portion of the line of credit and interest was charged on any borrowings at the current Federal Funds rate plus 1.25%. The commitment fee and the related waiver are allocated to each Fund based on net assets. The use of the line of credit was generally restricted to temporary borrowing for extraordinary or emergency purposes. During the year ended September 30, 2011, there were no borrowings under the line of credit for Global Value Fund, Growth Opportunities Fund, International Fund, International Value Fund, Mid Cap Fund, Mid Cap Value Fund, Small Cap Fund, Small Cap Value Fund and Value Fund. During the year ended September 30, 2011, Global Equity Fund had maximum borrowings of $329,000 and International Small Cap Fund had maximum borrowings of $3,393,000.
| (6) | Investment transactions: |
The cost of securities purchased and the proceeds from the sale of securities (excluding short-term securities) for the year ended September 30, 2011 were as follows (in thousands):
| | | | | | | | |
| Fund | | Security Purchases | | | Security Sales | |
Global Equity | | $ | 19,092 | | | $ | 18,724 | |
Global Value | | | 49,148 | | | | 16,580 | |
Growth Opportunities | | | 184,741 | | | | 97,935 | |
International | | | 6,663,902 | | | | 7,722,484 | |
International Small Cap | | | 316,695 | | | | 535,748 | |
International Value | | | 2,553,612 | | | | 1,271,546 | |
Mid Cap | | | 3,391,387 | | | | 3,563,461 | |
Mid Cap Value | | | 2,531,672 | | | | 2,020,802 | |
Small Cap | | | 254,737 | | | | 287,675 | |
Small Cap Value | | | 1,504,884 | | | | 1,389,424 | |
Value | | | 472,084 | | | | 293,026 | |
98
NOTES TO FINANCIAL STATEMENTS
| (7) | Transactions in securities of affiliates: |
The table below shows information about securities of the Funds’ “affiliates” (as defined below) that were held by the Funds, purchased or sold by the Funds, or from which dividends were received by the Funds during the year ended September 30, 2011 (dollar values in thousands). The Funds identify a company as an affiliate for the purpose of this report if one or more of the Funds owned, in the aggregate, voting securities that it believed represented 5% or more of that company’s outstanding voting securities (as defined by the Investment Company Act of 1940) during the year ended September 30, 2011.
| | | | | | | | | | | | | | | | | | | | | | | | | | | | | | |
| | | | | As of
9/30/10 | | | | | | | | | | | | | | | As of
9/30/11 | |
| Fund | | Security | | Share
Balance | | | Purchase
Cost | | | Sales
Cost | | | Net
Realized
Gain (Loss) | | | Dividend
Income(1) | | | Share
Balance | | | Value | |
| Global Value | | | | | | | | | | | | | | | | | | | | | | | | | | | | | | |
| | | Arch Capital Group Ltd.(2) | | | 14,900 | | | $ | 1,098 | | | $ | 45 | | | $ | 3 | | | $ | - | | | | 78,490 | | | $ | 2,565 | |
| | | Signet Jewelers Ltd.(2)(3) | | | 45,395 | | | | 1,178 | | | | 350 | | | | 23 | | | | - | | | | 65,252 | | | | 2,206 | |
| | | Total(4) | | | | | | $ | 2,276 | | | $ | 395 | | | $ | 26 | | | $ | - | | | | | | | $ | 2,565 | |
| International | | | | | | | | | | | | | | | | | | | | | | | | | | | | | | |
| | | E-Commerce China Dangdang, Inc., Class A (DR)(2)(3) | | | - | | | $ | 30,194 | | | $ | 30,194 | | | $ | (4,123 | ) | | $ | - | | | | - | | | $ | - | |
| | | Total(4) | | | | | | $ | 30,194 | | | $ | 30,194 | | | $ | (4,123 | ) | | $ | - | | | | - | | | $ | - | |
| International Value | | | | | | | | | | | | | | | | | | | | | | | | | | | | |
| | | Aderans Co., Ltd.(5) | | | 1,956,400 | | | $ | 6,353 | | | $ | 1,403 | | | $ | (1 | ) | | $ | - | | | | 2,420,067 | | | $ | 22,437 | |
| | | Arch Capital Group Ltd.(2) | | | 1,543,774 | | | | 37,892 | | | | 8,881 | | | | 666 | | | | - | | | | 5,572,034 | | | | 182,066 | |
| | | ICON PLC (DR)(2)(5) | | | - | | | | 63,891 | | | | 4,787 | | | | 882 | | | | - | | | | 2,871,675 | | | | 46,177 | |
| | | Qinetiq Group PLC | | | 41,112,031 | | | | 41,700 | | | | - | | | | - | | | | 1,616 | | | | 62,402,252 | | | | 112,476 | |
| | | Savills Plc | | | 8,553,847 | | | | 11,700 | | | | 3,325 | | | | 196 | | | | 1,971 | | | | 9,951,406 | | | | 44,068 | |
| | | Signet Jewelers Ltd.(2)(3) | | | 4,397,187 | | | | 19,009 | | | | 35,945 | | | | 2,012 | | | | - | | | | 3,882,479 | | | | 131,228 | |
| | | Total(4) | | | | | | $ | 180,545 | | | $ | 54,341 | | | $ | 3,755 | | | $ | 3,587 | | | | | | | $ | 407,224 | |
| Mid Cap | | | | | | | | | | | | | | | | | | | | | | | | | | | | | | |
| | | athenahealth, Inc.(2) | | | 1,680,000 | | | $ | 18,599 | | | $ | 5,814 | | | $ | 685 | | | $ | - | | | | 1,956,015 | | | $ | 116,481 | |
| | | GSI Commerce, Inc.(3) | | | 3,010,400 | | | | 4,912 | | | | 77,506 | | | | 7,374 | | | | - | | | | - | | | | - | |
| | | Total(4) | | | | | | $ | 23,511 | | | $ | 83,320 | | | $ | 8,059 | | | $ | - | | | | | | | $ | 116,481 | |
| Mid Cap Value | | | | | | | | | | | | | | | | | | | | | | | | | | | | | | |
| | | Acuity Brands, Inc.(3) | | | 1,816,815 | | | $ | - | | | $ | 60,542 | | | $ | 41,750 | | | $ | 380 | | | | - | | | $ | - | |
| | | Alleghany Corporation(2) | | | 560,601 | | | | 9,171 | | | | 0 | | | | 0 | | | | - | | | | 599,507 | | | | 172,958 | |
| | | Arch Capital Group Ltd.(2) | | | 1,667,173 | | | | 3,675 | | | | 24,249 | | | | 6,918 | | | | - | | | | 4,083,819 | | | | 133,439 | |
| | | Arrow Electronics, Inc.(2) | | | 4,584,000 | | | | 14,434 | | | | - | | | | - | | | | - | | | | 4,982,100 | | | | 138,403 | |
| | | Hubbell Inc., Class B(3)(5) | | | 2,635,900 | | | | 1,371 | | | | 25,856 | | | | 11,990 | | | | 3,574 | | | | 2,125,000 | | | | 105,273 | |
| | | Ingram Micro Inc.(2) | | | 8,219,600 | | | | 28,572 | | | | - | | | | - | | | | - | | | | 9,752,200 | | | | 157,303 | |
| | | Lexmark International, Inc.(2)(5) | | | - | | | | 159,080 | | | | 2,658 | | | | (356 | ) | | | - | | | | 4,113,200 | | | | 111,180 | |
| | | Total(4) | | | | | | $ | 216,303 | | | $ | 113,305 | | | $ | 60,302 | | | $ | 3,954 | | | | | | | $ | 713,283 | |
See notes on page 101.
99
NOTES TO FINANCIAL STATEMENTS
| | | | | | | | | | | | | | | | | | | | | | | | | | | | | | |
| | | | | As of
9/30/10 | | | | | | | | | | | | | | | As of
9/30/11 | |
| Fund | | Security | | Share
Balance | | | Purchase
Cost | | | Sales
Cost | | | Net
Realized
Gain (Loss) | | | Dividend
Income(1) | | | Share
Balance | | | Value | |
| Small Cap | | | | | | | | | | | | | | | | | | | | | | | | | | | | | | |
| | | Acuity Brands, Inc.(3)(5) | | | 94,000 | | | $ | 7,599 | | | $ | 2,732 | | | $ | (196 | ) | | $ | 80 | | | | 191,600 | | | $ | 6,905 | |
| | | athenahealth, Inc.(2) | | | 210,300 | | | | 3,518 | | | | 3,380 | | | | 242 | | | | - | | | | 204,500 | | | | 12,178 | |
| | | GSI Commerce, Inc.(3) | | | 356,200 | | | | 94 | | | | 6,501 | | | | 3,592 | | | | - | | | | - | | | | - | |
| | | Total(4) | | | | | | $ | 11,211 | | | $ | 12,613 | | | $ | 3,638 | | | $ | 80 | | | | | | | $ | 12,178 | |
| Small Cap Value | | | | | | | | | | | | | | | | | | | | | | | | | | | | |
| | | Actel Corporation(3) | | | 2,060,954 | | | $ | - | | | $ | 25,259 | | | $ | 17,774 | | | $ | - | | | | - | | | $ | - | |
| | | Acuity Brands, Inc.(3) | | | 552,899 | | | | - | | | | 20,508 | | | | 10,844 | | | | 105 | | | | - | | | | - | |
| | | AMN Healthcare Services, Inc.(3) | | | 1,772,616 | | | | - | | | | 27,832 | | | | (16,117 | ) | | | - | | | | - | | | | - | |
| | | Arrow Electronics, Inc.(2) | | | 1,504,847 | | | | 1,398 | | | | 5,844 | | | | 4,056 | | | | - | | | | 1,317,447 | | | | 36,599 | |
| | | Comfort Systems USA, Inc. | | | 2,815,126 | | | | - | | | | 1,518 | | | | (122 | ) | | | 551 | | | | 2,698,526 | | | | 22,452 | |
| | | CONMED Corporation(2) | | | 1,574,059 | | | | - | | | | - | | | | - | | | | - | | | | 1,574,059 | | | | 36,219 | |
| | | CRA International, Inc.(2) | | | 625,800 | | | | 893 | | | | - | | | | - | | | | - | | | | 661,700 | | | | 13,241 | |
| | | Cross Country Healthcare, Inc.(3) | | | 1,693,026 | | | | - | | | | 23,929 | | | | (11,455 | ) | | | - | | | | - | | | | - | |
| | | H.B. Fuller Company(5) | | | 2,153,533 | | | | 21,200 | | | | - | | | | - | | | | 788 | | | | 3,158,433 | | | | 57,547 | |
| | | Hatteras Financial Corp.(5) | | | - | | | | 53,439 | | | | - | | | | - | | | | 4,909 | | | | 1,812,500 | | | | 45,603 | |
| | | Hawaiian Holdings, Inc.(2)(5) | | | - | | | | 14,138 | | | | - | | | | - | | | | - | | | | 2,548,300 | | | | 10,728 | |
| | | ICON PLC (DR)(2)(5) | | | - | | | | 19,049 | | | | - | | | | - | | | | - | | | | 921,041 | | | | 14,810 | |
| | | Lexmark International, Inc.(2)(5) | | | 591,887 | | | | 30,786 | | | | - | | | | - | | | | - | | | | 1,471,587 | | | | 39,777 | |
| | | Manhattan Associates, Inc.(2) | | | 1,564,924 | | | | - | | | | 9,497 | | | | 4,211 | | | | - | | | | 1,184,624 | | | | 39,187 | |
| | | Neutral Tandem, Inc.(2)(5) | | | - | | | | 28,015 | | | | - | | | | - | | | | - | | | | 1,850,400 | | | | 17,912 | |
| | | Orbotech, Ltd.(2)(3) | | | 2,447,487 | | | | 1,038 | | | | 41,156 | | | | (18,354 | ) | | | - | | | | 713,214 | | | | 6,904 | |
| | | ORION MARINE GROUP, INC.(2)(5) | | | 1,059,900 | | | | 9,625 | | | | - | | | | - | | | | - | | | | 1,851,400 | | | | 10,683 | |
| | | Penn Virginia Corporation(5) | | | 694,800 | | | | 24,275 | | | | - | | | | - | | | | 453 | | | | 2,298,900 | | | | 12,805 | |
| | | PetMed Express, Inc.(3)(5) | | | - | | | | 22,550 | | | | 9,523 | | | | (4,073 | ) | | | 495 | | | | 832,500 | | | | 7,493 | |
| | | PICO Holdings, Inc.(2)(5) | | | 1,105,390 | | | | 6,002 | | | | - | | | | - | | | | - | | | | 1,323,090 | | | | 27,137 | |
| | | Quanex Building Products Corporation(5) | | | 1,659,226 | | | | 4,189 | | | | - | | | | - | | | | 286 | | | | 1,909,726 | | | | 20,912 | |
| | | RadiSys Corporation(2)(3) | | | 1,878,597 | | | | - | | | | 7,793 | | | | (2,509 | ) | | | - | | | | 1,200,597 | | | | 7,348 | |
| | | Rosetta Stone Inc.(2)(5) | | | - | | | | 15,969 | | | | - | | | | - | | | | - | | | | 1,179,600 | | | | 10,793 | |
| | | Rudolph Technologies, Inc.(2)(3) | | | 2,819,378 | | | | 2,903 | | | | 23,403 | | | | (2,767 | ) | | | - | | | | 1,343,628 | | | | 8,989 | |
| | | School Specialty, Inc.(2) | | | 1,769,253 | | | | - | | | | - | | | | - | | | | - | | | | 1,769,253 | | | | 12,615 | |
| | | Sykes Enterprises, Incorporated(2) | | | 2,548,994 | | | | 10,879 | | | | - | | | | - | | | | - | | | | 3,130,694 | | | | 46,804 | |
| | | Ultra Clean Holdings, Inc.(3) | | | 1,558,796 | | | | - | | | | 16,195 | | | | (1,895 | ) | | | - | | | | - | | | | - | |
| | | Ultratech, Inc.(2) | | | 1,944,953 | | | | 10,198 | | | | 6,101 | | | | 5,146 | | | | - | | | | 1,948,353 | | | | 33,414 | |
| | | Total(4) | | | | | | $ | 276,546 | | | $ | 218,558 | | | $ | (15,261 | ) | | $ | 7,587 | | | | | | | $ | 509,238 | |
See notes on page 101.
100
NOTES TO FINANCIAL STATEMENTS
| | | | | | | | | | | | | | | | | | | | | | | | | | | | | | |
| | | | | As of
9/30/10 | | | | | | | | | | | | | | | As of
9/30/11 | |
| Fund | | Security | | Share
Balance | | | Purchase
Cost | | | Sales
Cost | | | Net
Realized
Gain (Loss) | | | Dividend
Income(1) | | | Share
Balance | | | Value | |
| Value | | | | | | | | | | | | | | | | | | | | | | | | | | | | | | |
| | | Arch Capital Group Ltd.(2) | | | 139,500 | | | $ | 5,973 | | | $ | 4,231 | | | $ | 743 | | | $ | - | | | | 439,300 | | | $ | 14,354 | |
| | | Ingram Micro Inc.(2) | | | 540,200 | | | | 9,085 | | | | 595 | | | | (92 | ) | | | - | | | | 1,000,700 | | | | 16,141 | |
| | | Total(4) | | | | | | $ | 15,058 | | | $ | 4,826 | | | $ | 651 | | | $ | - | | | | | | | $ | 30,495 | |
| (1) | Net of foreign taxes withheld, if any. |
| (2) | Non-income producing security. |
| (3) | Issuer was no longer an affiliate as of September 30, 2011. |
| (4) | Total value as of September 30, 2011 is presented for only those issuers that were affiliates as of September 30, 2011. |
| (5) | Issuer was not an affiliate as of September 30, 2010. |
| (8) | Information for Federal income tax purposes: |
For Federal income tax purposes, the cost of investments, gross unrealized appreciation, gross unrealized depreciation and net unrealized appreciation (depreciation) on investments as of September 30, 2011 were as follows (in thousands):
| | | | | | | | | | | | | | | | |
| Fund | | Cost of
Investments | | | Gross Unrealized
Appreciation | | | Gross
Unrealized
Depreciation | | | Net
Unrealized
Appreciation
(Depreciation)
on Investments | |
Global Equity | | $ | 11,564 | | | $ | 408 | | | $ | (908 | ) | | $ | (500 | ) |
Global Value | | | 65,837 | | | | 5,304 | | | | (4,406 | ) | | | 898 | |
Growth Opportunities | | | 151,649 | | | | 15,967 | | | | (14,019 | ) | | | 1,948 | |
International | | | 8,175,187 | | | | 652,241 | | | | (1,033,914 | ) | | | (381,673 | ) |
International Small Cap | | | 528,043 | | | | 95,448 | | | | (64,603 | ) | | | 30,845 | |
International Value | | | 4,300,722 | | | | 357,063 | | | | (440,972 | ) | | | (83,909 | ) |
Mid Cap | | | 3,918,826 | | | | 1,267,624 | | | | (154,385 | ) | | | 1,113,239 | |
Mid Cap Value | | | 6,207,224 | | | | 487,469 | | | | (488,744 | ) | | | (1,275 | ) |
Small Cap | | | 288,142 | | | | 67,246 | | | | (27,000 | ) | | | 40,246 | |
Small Cap Value | | | 2,867,525 | | | | 203,393 | | | | (461,363 | ) | | | (257,970 | ) |
Value | | | 493,964 | | | | 12,658 | | | | (45,582 | ) | | | (32,924 | ) |
The difference between cost of investments for financial reporting and cost of investments for Federal income tax purposes was due primarily to timing differences in recognizing certain gains and losses on security transactions (e.g., wash sale loss deferrals and passive foreign investment company transactions).
101
NOTES TO FINANCIAL STATEMENTS
The tax characterization of ordinary income dividends and long-term capital gain distributions paid during the year ended September 30, 2011 and the year ended September 30, 2010 were as follows (in thousands):
| | | | | | | | | | | | | | | | |
| | | Year Ended 9/30/11 | | | Year Ended 9/30/10 | |
| Fund | | Ordinary
Income
Dividends | | | Long-Term
Capital Gain
Distributions | | | Ordinary
Income
Dividends | | | Long-Term
Capital Gain
Distributions | |
Global Equity | | $ | 158 | | | $ | - | | | $ | - | | | $ | - | |
Global Value | | | 313 | | | | - | | | | 689 | | | | - | |
Growth Opportunities | | | 224 | | | | 810 | | | | - | | | | - | |
International | | | 87,763 | | | | - | | | | 129,088 | | | | - | |
International Small Cap | | | 457 | | | | - | | | | 4,971 | | | | - | |
International Value | | | 51,946 | | | | - | | | | 42,229 | | | | - | |
Mid Cap Value | | | 80,288 | | | | 66,416 | | | | 19,094 | | | | - | |
Small Cap Value | | | 2,837 | | | | - | | | | 2,598 | | | | - | |
Value | | | 2,455 | | | | - | | | | 840 | | | | - | |
Ordinary income dividends and long-term capital gain distributions were determined in accordance with income tax regulations that impose treatment that is different from the treatment that would result from the application of United States generally accepted accounting principles for such items as net short-term gains, wash sale loss deferrals, passive foreign investment company transactions, foreign currency transactions, net investment losses and post-October losses. Gains on redemptions-in-kind for Mid Cap Fund of $78,603,000 were included in net realized gain (loss) on investments in the Statements of Operations for the year ended September 30, 2011, and were not recognized for Federal income tax purposes.
Additional tax information as of and for the year ended September 30, 2011 follows (in thousands):
| | | | | | | | | | | | | | | | |
| | | Undistributed
Ordinary Income | | | Undistributed
Long-Term Gain | | | Post-October
Losses | | | Other Deferred Gains (Losses)(1) | |
Global Equity | | $ | 219 | | | $ | - | | | $ | - | | | $ | (2 | ) |
Global Value | | | - | | | | 1,391 | | | | (96 | ) | | | - | |
Growth Opportunities | | | - | | | | 1,422 | | | | (406 | ) | | | (20 | ) |
International | | | 120,926 | | | | - | | | | - | | | | (1,361 | ) |
International Small Cap | | | 2,353 | | | | - | | | | - | | | | (11 | ) |
International Value | | | - | | | | 12,238 | | | | - | | | | 12 | |
Mid Cap | | | - | | | | - | | | | - | | | | (192 | ) |
Mid Cap Value | | | 137,477 | | | | 362,284 | | | | - | | | | - | |
Small Cap Value | | | 52,049 | | | | 187,262 | | | | - | | | | - | |
Value | | | 2,606 | | | | - | | | | - | | | | (4 | ) |
|
(1) Other deferred gains and losses relate to (a) gains or losses on transactions that occurred subsequent to year end that affected the distributable earnings at September 30, 2011 such as wash sales, (b) unrealized gains and losses on open foreign currency contracts and (c) other items. | |
102
NOTES TO FINANCIAL STATEMENTS
As of September 30, 2011, the Funds had capital loss carryovers as follows (in thousands):
| | | | | | | | | | | | |
| | | Expiring
2017 | | | Expiring
2018 | | | Total | |
International | | $ | 52,715 | | | $ | 1,780,664 | | | $ | 1,833,379 | |
International Small Cap | | | - | | | | 41,479 | | | | 41,479 | |
Mid Cap | | | - | | | | 85,052 | | | | 85,052 | |
Small Cap | | | 12,975 | | | | 132,871 | | | | 145,846 | |
Value | | | 4,793 | | | | 47,952 | | | | 52,745 | |
For the year ended September 30, 2011, the Funds used capital loss carryovers as follows (in thousands):
| | | | |
| | | Capital Loss
Carryovers Used | |
Global Value | | $ | 472 | |
International | | | 793,973 | |
International Small Cap | | | 76,904 | |
International Value | | | 119,740 | |
Mid Cap | | | 550,188 | |
Small Cap | | | 76,989 | |
Small Cap Value | | | 57,835 | |
Value | | | 30,711 | |
103
NOTES TO FINANCIAL STATEMENTS
| (9) | Fund share activities: |
Capital share transactions for the Funds were as follows (dollar values in thousands):
| | | | | | | | | | | | | | | | | | | | | | | | |
| | | GLOBAL
EQUITY | | | GLOBAL
VALUE | | | GROWTH OPPORTUNITIES | | | INTERNATIONAL | |
Year ended September 30, 2011 | | Investor
Shares | | | Investor
Shares | | | Investor
Shares | | | Institutional
Shares(1) | | | Investor
Shares | | | Institutional
Shares | |
Proceeds from shares issued | | $ | 3,476 | | | $ | 42,770 | | | $ | 116,536 | | | $ | 1,599 | | | $ | 1,303,630 | | | $ | 200,095 | |
Net asset value of shares transferred | | | - | | | | - | | | | (14,153 | ) | | | 14,153 | | | | - | | | | - | |
Net asset value of shares issued in reinvestment of dividends and distributions | | | 157 | | | | 308 | | | | 1,027 | | | | - | | | | 54,788 | | | | 25,401 | |
Cost of shares redeemed(2) | | | (2,691 | ) | | | (8,634 | ) | | | (21,486 | ) | | | - | | | | (2,190,720 | ) | | | (366,860 | ) |
| | | | | | | | | | | | | | | | | | | | | | | | |
Net increase (decrease) from fund share transactions | | $ | 942 | | | $ | 34,444 | | | $ | 81,924 | | | $ | 15,752 | | | $ | (832,302 | ) | | $ | (141,364 | ) |
| | | | | | | | | | | | | | | | | | | | | | | | |
| | | | | | |
Shares sold | | | 305,877 | | | | 4,188,478 | | | | 9,228,735 | | | | 133,801 | | | | 60,685,817 | | | | 9,123,456 | |
Shares transferred | | | - | | | | - | | | | (1,057,788 | ) | | | 1,057,788 | | | | - | | | | - | |
Shares issued in reinvestment of dividends and distributions | | | 14,140 | | | | 30,390 | | | | 85,008 | | | | - | | | | 2,556,612 | | | | 1,178,671 | |
Shares redeemed | | | (233,297 | ) | | | (851,645 | ) | | | (1,746,821 | ) | | | - | | | | (100,130,658 | ) | | | (16,394,727 | ) |
| | | | | | | | | | | | | | | | | | | | | | | | |
Net increase (decrease) in capital shares | | | 86,720 | | | | 3,367,223 | | | | 6,509,134 | | | | 1,191,589 | | | | (36,888,229 | ) | | | (6,092,600 | ) |
| | | | | | | | | | | | | | | | | | | | | | | | |
| | | | | |
| | | GLOBAL
EQUITY | | | GLOBAL
VALUE | | | GROWTH
OPPORTUNITIES | | | | | | INTERNATIONAL | |
Year ended September 30, 2010 | | Investor
Shares(3) | | | Investor
Shares | | | Investor
Shares | | | | | | Investor
Shares | | | Institutional
Shares | |
Proceeds from shares issued | | $ | 10,367 | | | $ | 8,653 | | | $ | 30,913 | | | | | | | $ | 1,714,559 | | | $ | 254,936 | |
Net asset value of shares issued in reinvestment of dividends and distributions | | | - | | | | 681 | | | | - | | | | | | | | 85,907 | | | | 32,933 | |
Cost of shares redeemed(2) | | | (181 | ) | | | (5,741 | ) | | | (15,045 | ) | | | | | | | (2,313,013 | ) | | | (871,513 | ) |
| | | | | | | | | | | | | | | | | | | | | | | | |
Net increase (decrease) from fund share transactions | | $ | 10,186 | | | $ | 3,593 | | | $ | 15,868 | | | | | | | $ | (512,547 | ) | | $ | (583,644 | ) |
| | | | | | | | | | | | | | | | | | | | | | | | |
| | | | | | |
Shares sold | | | 1,042,184 | | | | 969,513 | | | | 3,195,776 | | | | | | | | 87,169,342 | | | | 12,936,483 | |
Shares issued in reinvestment of dividends and distributions | | | - | | | | 78,194 | | | | - | | | | | | | | 4,233,932 | | | | 1,614,352 | |
Shares redeemed | | | (19,245 | ) | | | (650,835 | ) | | | (1,589,013 | ) | | | | | | | (119,470,363 | ) | | | (44,484,274 | ) |
| | | | | | | | | | | | | | | | | | | | | | | | |
Net increase (decrease) in capital shares | | | 1,022,939 | | | | 396,872 | | | | 1,606,763 | | | | | | | | (28,067,089 | ) | | | (29,933,439 | ) |
| | | | | | | | | | | | | | | | | | | | | | | | |
| (1) | For the period from commencement of operations July 26, 2011 through September 30, 2011. |
| (2) | Net of redemption fees of: |
| | | | | | | | |
| Fund | | 9/30/2011 | | | 9/30/2010 | |
Global Equity - Investor Shares | | $ | 1 | | | $ | 0 | |
Global Value - Investor Shares | | | 16 | | | | 6 | |
Growth Opportunities - Investor Shares | | | 4 | | | | - | |
Growth Opportunities - Institutional Shares | | | - | | | | - | |
International - Investor Shares | | | 460 | | | | 528 | |
International - Institutional Shares | | | 157 | | | | 168 | |
| (3) | For the period from commencement of operations March 29, 2010 through September 30, 2010. |
104
NOTES TO FINANCIAL STATEMENTS
| | | | | | | | | | | | | | | | | | | | |
| | | INTERNATIONAL
SMALL CAP | | | INTERNATIONAL VALUE | | | MID CAP | |
Year ended September 30, 2011 | | Investor
Shares | | | Investor
Shares | | | Institutional
Shares | | | Investor
Shares | | | Institutional
Shares | |
Proceeds from shares issued | | $ | 134,384 | | | $ | 1,396,183 | | | $ | 547,792 | | | $ | 1,160,346 | | | $ | 66,013 | |
Net asset value of shares issued in reinvestment of dividends and distributions | | | 416 | | | | 32,185 | | | | 11,352 | | | | - | | | | - | |
Cost of shares redeemed(1) | | | (315,635 | ) | | | (617,777 | ) | | | (71,466 | ) | | | (1,278,871 | ) | | | (90,606 | ) |
| | | | | | | | | | | | | | | | | | | | |
Net increase (decrease) from fund share transactions | | $ | (180,835 | ) | | $ | 810,591 | | | $ | 487,678 | | | $ | (118,525 | ) | | $ | (24,593 | ) |
| | | | | | | | | | | | | | | | | | | | |
| | | | | |
Shares sold | | | 6,925,299 | | | | 51,358,305 | | | | 20,384,767 | | | | 33,974,631 | | | | 1,869,251 | |
Shares issued in reinvestment of dividends and distributions | | | 21,365 | | | | 1,197,336 | | | | 422,463 | | | | - | | | | - | |
Shares redeemed | | | (15,988,028 | ) | | | (23,292,083 | ) | | | (2,603,912 | ) | | | (37,508,365 | ) | | | (2,521,038 | ) |
| | | | | | | | | | | | | | | | | | | | |
Net increase (decrease) in capital shares | | | (9,041,364 | ) | | | 29,263,558 | | | | 18,203,318 | | | | (3,533,734 | ) | | | (651,787 | ) |
| | | | | | | | | | | | | | | | | | | | |
| | | |
| | | INTERNATIONAL
SMALL CAP | | | INTERNATIONAL VALUE | | | MID CAP | |
Year ended September 30, 2010 | | Investor
Shares | | | Investor
Shares | | | Institutional
Shares | | | Investor
Shares | | | Institutional
Shares | |
Proceeds from shares issued | | $ | 231,472 | | | $ | 1,211,662 | | | $ | 330,197 | | | $ | 744,135 | | | $ | 19,299 | |
Net asset value of shares issued in reinvestment of dividends and distributions | | | 4,715 | | | | 31,364 | | | | 5,319 | | | | - | | | | - | |
Cost of shares redeemed(1) | | | (213,357 | ) | | | (483,111 | ) | | | (15,346 | ) | | | (842,511 | ) | | | (65,732 | ) |
| | | | | | | | | | | | | | | | | | | | |
Net increase (decrease) from fund share transactions | | $ | 22,830 | | | $ | 759,915 | | | $ | 320,170 | | | $ | (98,376 | ) | | $ | (46,433 | ) |
| | | | | | | | | | | | | | | | | | | | |
| | | | | |
Shares sold | | | 13,620,398 | | | | 52,013,751 | | | | 14,377,757 | | | | 28,632,435 | | | | 694,723 | |
Shares issued in reinvestment of dividends and distributions | | | 280,489 | | | | 1,378,042 | | | | 233,794 | | | | - | | | | - | |
Shares redeemed | | | (12,880,474 | ) | | | (20,943,757 | ) | | | (655,580 | ) | | | (32,462,368 | ) | | | (2,402,397 | ) |
| | | | | | | | | | | | | | | | | | | | |
Net increase (decrease) in capital shares | | | 1,020,413 | | | | 32,448,036 | | | | 13,955,971 | | | | (3,829,933 | ) | | | (1,707,674 | ) |
| | | | | | | | | | | | | | | | | | | | |
| (1) | Net of redemption fees of: |
| | | | | | | | |
| Fund | | 9/30/2011 | | | 9/30/2010 | |
International Small Cap - Investor Shares | | $ | 10 | | | $ | 38 | |
International Value - Investor Shares | | | 279 | | | | 323 | |
International Value - Institutional Shares | | | 84 | | | | 71 | |
105
NOTES TO FINANCIAL STATEMENTS
| | | | | | | | | | | | | | | | | | | | |
| | | MID CAP
VALUE | | | SMALL CAP | | | SMALL CAP
VALUE | | | VALUE | |
Year ended September 30, 2011 | | Investor
Shares | | | Investor
Shares | | | Investor
Shares | | | Investor
Shares | | | Institutional
Shares(1) | |
Proceeds from shares issued | | $ | 1,807,081 | | | $ | 161,710 | | | $ | 661,190 | | | $ | 273,248 | | | $ | 36,577 | |
Net asset value of shares transferred | | | - | | | | - | | | | - | | | | (21,242 | ) | | | 21,242 | |
Net asset value of shares issued in reinvestment of dividends and distributions | | | 137,560 | | | | - | | | | 2,731 | | | | 2,273 | | | | - | |
Cost of shares redeemed | | | (1,436,373 | ) | | | (188,566 | ) | | | (640,783 | ) | | | (106,948 | ) | | | - | |
| | | | | | | | | | | | | | | | | | | | |
Net increase (decrease) from fund share transactions | | $ | 508,268 | | | $ | (26,856 | ) | | $ | 23,138 | | | $ | 147,331 | | | $ | 57,819 | |
| | | | | | | | | | | | | | | | | | | | |
| | | | | |
Shares sold | | | 86,270,818 | | | | 9,258,288 | | | | 39,082,613 | | | | 27,593,098 | | | | 3,866,137 | |
Shares transferred | | | - | | | | - | | | | - | | | | (2,004,008 | ) | | | 2,004,008 | |
Shares issued in reinvestment of dividends and distributions | | | 6,905,600 | | | | - | | | | 162,466 | | | | 241,039 | | | | - | |
Shares redeemed | | | (69,234,568 | ) | | | (11,269,301 | ) | | | (37,996,832 | ) | | | (10,864,145 | ) | | | - | |
| | | | | | | | | | | | | | | | | | | | |
Net increase (decrease) in capital shares | | | 23,941,850 | | | | (2,011,013 | ) | | | 1,248,247 | | | | 14,965,984 | | | | 5,870,145 | |
| | | | | | | | | | | | | | | | | | | | |
| | | | | |
| | | MID CAP
VALUE | | | SMALL CAP | | | SMALL CAP
VALUE | | | VALUE | | | | |
Year ended September 30, 2010 | | Investor
Shares | | | Investor
Shares | | | Investor
Shares | | | Investor
Shares | | | | |
Proceeds from shares issued | | $ | 1,697,862 | | | $ | 78,066 | | | $ | 862,413 | | | $ | 130,447 | | | | | |
Net asset value of shares issued in reinvestment of dividends and distributions | | | 17,788 | | | | - | | | | 2,474 | | | | 811 | | | | | |
Cost of shares redeemed | | | (1,187,432 | ) | | | (231,386 | ) | | | (550,117 | ) | | | (64,499 | ) | | | | |
| | | | | | | | | | | | | | | | | | | | |
Net increase (decrease) from fund share transactions | | $ | 528,218 | | | $ | (153,320 | ) | | $ | 314,770 | | | $ | 66,759 | | | | | |
| | | | | | | | | | | | | | | | | | | | |
| | | | | |
Shares sold | | | 95,065,167 | | | | 5,784,828 | | | | 59,983,122 | | | | 15,026,128 | | | | | |
Shares issued in reinvestment of dividends and distributions | | | 1,003,270 | | | | - | | | | 176,813 | | | | 94,772 | | | | | |
Shares redeemed | | | (66,387,040 | ) | | | (17,293,770 | ) | | | (38,107,726 | ) | | | (7,544,347 | ) | | | | |
| | | | | | | | | | | | | | | | | | | | |
Net increase (decrease) in capital shares | | | 29,681,397 | | | | (11,508,942 | ) | | | 22,052,209 | | | | 7,576,553 | | | | | |
| | | | | | | | | | | | | | | | | | | | |
| (1) | For the period from commencement of operations July 26, 2011 through September 30, 2011. |
The Funds have evaluated subsequent events through the date of issuance of the Funds’ financial statements and have determined there is no impact to the Funds’ financial statements.
106
Report of Independent Registered Public Accounting Firm
The Board of Directors and Shareholders of Artisan Partners Funds, Inc.
We have audited the accompanying statements of assets and liabilities, including the schedules of investments, of Artisan Global Equity Fund, Artisan Global Value Fund, Artisan Growth Opportunities Fund (formerly Artisan Opportunistic Growth Fund), Artisan International Fund, Artisan International Small Cap Fund, Artisan International Value Fund, Artisan Mid Cap Fund, Artisan Mid Cap Value Fund, Artisan Small Cap Fund, Artisan Small Cap Value Fund, and Artisan Value Fund (formerly Artisan Opportunistic Value Fund) (eleven of the twelve portfolios constituting Artisan Partners Funds, Inc. (formerly Artisan Funds, Inc.)) (the “Funds”) as of September 30, 2011, the related statements of operations for the year then ended, and the statements of changes in net assets and the financial highlights for each of the periods indicated therein. These financial statements and financial highlights are the responsibility of the Funds’ management. Our responsibility is to express an opinion on these financial statements and financial highlights based on our audits.
We conducted our audits in accordance with the standards of the Public Company Accounting Oversight Board (United States). Those standards require that we plan and perform the audit to obtain reasonable assurance about whether the financial statements and financial highlights are free of material misstatement. We were not engaged to perform an audit of the Funds’ internal control over financial reporting. Our audits included consideration of internal control over financial reporting as a basis for designing audit procedures that are appropriate in the circumstances, but not for the purpose of expressing an opinion on the effectiveness of the Funds’ internal control over financial reporting. Accordingly, we express no such opinion. An audit also includes examining, on a test basis, evidence supporting the amounts and disclosures in the financial statements and financial highlights, assessing the accounting principles used and significant estimates made by management, and evaluating the overall financial statement presentation. Our procedures included confirmation of securities owned as of September 30, 2011, by correspondence with the custodian and brokers or by other appropriate auditing procedures where replies from brokers were not received. We believe that our audits provide a reasonable basis for our opinion.
In our opinion, the financial statements and financial highlights referred to above present fairly, in all material respects, the financial position of Artisan Global Equity Fund, Artisan Global Value Fund, Artisan Growth Opportunities Fund, Artisan International Fund, Artisan International Small Cap Fund, Artisan International Value Fund, Artisan Mid Cap Fund, Artisan Mid Cap Value Fund, Artisan Small Cap Fund, Artisan Small Cap Value Fund, and Artisan Value Fund of Artisan Partners Funds, Inc. at September 30, 2011, the results of their operations for the year then ended, and the changes in their net assets and the financial highlights for each of the periods indicated therein, in conformity with U.S. generally accepted accounting principles.

Chicago, Illinois
November 21, 2011
107
NOTES TO FINANCIAL STATEMENTS
Other Federal tax information (unaudited):
The Internal Revenue Code requires that shareholders be notified within 60 days of the Funds’ fiscal year-end of certain information regarding long-term capital gains, qualified dividend income and the dividends received deduction for corporate shareholders. This data is informational only. Every year in January, shareholders are sent a Form 1099-DIV which provides the federal tax status of dividends and distributions received during the calendar year. Shareholders are advised to consult their own tax advisor with respect to the specific tax consequences of investment in the Funds.
Each Fund hereby designates the following amounts as (i) long-term capital gain distributions for purposes of the dividends paid deduction (including earnings and profits distributed to shareholders on redemption of Fund shares, in thousands), (ii) the amount of ordinary dividends paid during the fiscal year ended September 30, 2011 that are considered qualified dividend income as defined in the Jobs and Growth Tax Relief Reconciliation Act of 2003, and (iii) the amount of ordinary dividends paid during the fiscal year ended September 30, 2011 that are eligible for the dividends received deduction available to certain corporate shareholders.
| | | | | | | | | | | | |
| Fund | | Long-Term Capital Gains | | | Qualified Dividend Income | | | Dividends Received Deduction | |
Global Equity | | $ | 41 | | | | 81.33 | % | | | 17.21 | % |
Global Value | | | 66 | | | | 100.00 | | | | 100.00 | |
Growth Opportunities | | | 1,498 | | | | 37.06 | | | | 26.19 | |
International | | | - | | | | 100.00 | | | | 7.40 | |
International Small Cap | | | - | | | | 100.00 | | | | - | |
International Value | | | 166 | | | | 100.00 | | | | - | |
Mid Cap | | | - | | | | - | | | | - | |
Mid Cap Value | | | 89,312 | | | | 89.55 | | | | 89.04 | |
Small Cap | | | - | | | | - | | | | - | |
Small Cap Value | | | 10,760 | | | | 99.83 | | | | 99.81 | |
Value | | | - | | | | 100.00 | | | | 100.00 | |
108
SHAREHOLDER EXPENSE EXAMPLE (UNAUDITED)
As a shareholder of Artisan Funds, you may incur transaction costs, including redemption fees, and you will incur ongoing costs, including management fees and other Fund expenses. This example is intended to help you understand your ongoing costs (in dollars) of investing in a Fund and to compare these costs with the ongoing costs of investing in other mutual funds.
The example is based on an investment of $1,000 invested at the beginning of the period and held for the entire period from April 1, 2011 to September 30, 2011.
Actual Expenses
The first line under the name of each Fund in the table below provides information about actual account values and actual expenses. You may use the information in this line, together with the amount you invested, to estimate the expenses that you paid over the period. Simply divide your account value by $1,000 (for example, an $8,600 account value divided by $1,000 = 8.6), then multiply the result by the number in the first line under the name of your Fund under the heading entitled “Expenses Paid During Period” to estimate the expenses you paid on your account during this period.
Hypothetical Example for Comparison Purposes
The second line below each Fund’s name in the table below provides information about hypothetical account values and hypothetical expenses based on each Fund’s actual expense ratio for the six months ended September 30, 2011 and an assumed rate of return of 5% per year before expenses, which is not the Fund’s actual return. The hypothetical account values and expenses may not be used to estimate the actual ending account balances or expenses you paid for the period. You may use this information to compare the ongoing costs of investing in each Fund and other funds. To do so, compare the 5% hypothetical example with the 5% hypothetical examples that appear in the shareholder reports of the other funds.
Please note that the expenses shown in the table are meant to highlight your ongoing costs only and do not reflect any transactional costs, such as redemption fees. Therefore, the second line of the table is useful in comparing ongoing costs only, and will not help you determine the relative costs of owning different funds. If these transactional costs were included, your costs would have been higher.
| | | | | | | | | | | | |
| | | Beginning
Account Value
4/1/2011 | | | Ending
Account Value
9/30/2011 | | | Expenses Paid During
Period
4/1/2011-9/30/2011(1) | |
Artisan Global Equity Fund - Investor Shares | | | | | | | | | | | | |
Actual | | $ | 1,000.00 | | | $ | 850.35 | | | $ | 6.96 | |
Hypothetical (5% return before expenses) | | $ | 1,000.00 | | | $ | 1,017.55 | | | $ | 7.59 | |
Artisan Global Value Fund - Investor Shares | | | | | | | | | | | | |
Actual | | $ | 1,000.00 | | | $ | 890.60 | | | $ | 7.11 | |
Hypothetical (5% return before expenses) | | $ | 1,000.00 | | | $ | 1,017.55 | | | $ | 7.59 | |
Artisan Growth Opportunities Fund - Investor Shares | | | | | | | | | | | | |
Actual | | $ | 1,000.00 | | | $ | 831.90 | | | $ | 6.70 | |
Hypothetical (5% return before expenses) | | $ | 1,000.00 | | | $ | 1,017.75 | | | $ | 7.38 | |
See notes on page 110.
109
SHAREHOLDER EXPENSE EXAMPLE (UNAUDITED)
| | | | | | | | | | | | |
| | | Beginning
Account Value
4/1/2011 | | | Ending
Account Value
9/30/2011 | | | Expenses Paid During
Period
4/1/2011-9/30/2011(1) | |
Artisan International Fund - Investor Shares | | | | | | | | | | | | |
Actual | | $ | 1,000.00 | | | $ | 818.30 | | | $ | 5.52 | |
Hypothetical (5% return before expenses) | | $ | 1,000.00 | | | $ | 1,019.00 | | | $ | 6.12 | |
Artisan International Small Cap Fund - Investor Shares | | | | | | | | | | | | |
Actual | | $ | 1,000.00 | | | $ | 809.50 | | | $ | 6.76 | |
Hypothetical (5% return before expenses) | | $ | 1,000.00 | | | $ | 1,017.60 | | | $ | 7.54 | |
Artisan International Value Fund - Investor Shares | | | | | | | | | | | | |
Actual | | $ | 1,000.00 | | | $ | 842.90 | | | $ | 5.41 | |
Hypothetical (5% return before expenses) | | $ | 1,000.00 | | | $ | 1,019.20 | | | $ | 5.92 | |
Artisan Mid Cap Fund - Investor Shares | | | | | | | | | | | | |
Actual | | $ | 1,000.00 | | | $ | 862.80 | | | $ | 5.65 | |
Hypothetical (5% return before expenses) | | $ | 1,000.00 | | | $ | 1,019.00 | | | $ | 6.12 | |
Artisan Mid Cap Value Fund - Investor Shares | | | | | | | | | | | | |
Actual | | $ | 1,000.00 | | | $ | 852.80 | | | $ | 5.48 | |
Hypothetical (5% return before expenses) | | $ | 1,000.00 | | | $ | 1,019.15 | | | $ | 5.97 | |
Artisan Small Cap Fund - Investor Shares | | | | | | | | | | | | |
Actual | | $ | 1,000.00 | | | $ | 863.10 | | | $ | 6.02 | |
Hypothetical (5% return before expenses) | | $ | 1,000.00 | | | $ | 1,018.60 | | | $ | 6.53 | |
Artisan Small Cap Value Fund - Investor Shares | | | | | | | | | | | | |
Actual | | $ | 1,000.00 | | | $ | 775.50 | | | $ | 5.25 | |
Hypothetical (5% return before expenses) | | $ | 1,000.00 | | | $ | 1,019.15 | | | $ | 5.97 | |
Artisan Value Fund - Investor Shares | | | | | | | | | | | | |
Actual | | $ | 1,000.00 | | | $ | 889.60 | | | $ | 5.21 | |
Hypothetical (5% return before expenses) | | $ | 1,000.00 | | | $ | 1,019.55 | | | $ | 5.57 | |
| (1) | Expenses are equal to the Fund’s ratio of expenses to average net assets for the six-month period ended September 30, 2011 (shown below), multiplied by the average account value over the period, multiplied by 183/366 (to reflect the one-half year period). |
| | | | |
| Fund | | Annualized Ratio of Expenses to Average
Net Assets for the Six-Month
Period Ended September 30, 2011 | |
Artisan Global Equity Fund - Investor Shares(1) | | | 1.50 | % |
Artisan Global Value Fund - Investor Shares(1) | | | 1.50 | % |
Artisan Growth Opportunities Fund - Investor Shares | | | 1.46 | % |
Artisan International Fund - Investor Shares | | | 1.21 | % |
Artisan International Small Cap Fund - Investor Shares | | | 1.49 | % |
Artisan International Value Fund - Investor Shares | | | 1.17 | % |
Artisan Mid Cap Fund - Investor Shares | | | 1.21 | % |
See notes on page 111.
110
SHAREHOLDER EXPENSE EXAMPLE (UNAUDITED)
| | | | |
| Fund | | Annualized Ratio of Expenses to Average
Net Assets for the Six-Month
Period Ended September 30, 2011 | |
Artisan Mid Cap Value Fund - Investor Shares | | | 1.18 | % |
Artisan Small Cap Fund - Investor Shares | | | 1.29 | % |
Artisan Small Cap Value Fund - Investor Shares | | | 1.18 | % |
Artisan Value Fund - Investor Shares | | | 1.10 | % |
|
(1) The annualized ratio of expenses to average net assets excludes expenses waived or paid by the Adviser. | |
111
NOTES ON MANAGEMENT’S DISCUSSION OF FUND PERFORMANCE AND PORTFOLIO HOLDINGS’ CLASSIFICATION
The discussions of each Fund included in this report include statistical information about the portfolios of each of the Funds. Except as otherwise noted, that information is as of September 30, 2011. That information will vary with changes in a Fund’s portfolio investments. The performance information for each Fund relative to its benchmark index discussed in this report was prepared by the Adviser using information reported by FactSet Research Systems, Inc. (“FactSet”). For the purposes of assigning portfolio securities to a particular country, the Adviser considers an issuer to be from a particular country as designated by its securities information vendors. The Adviser currently uses MSCI Inc. as its primary source and FactSet as a secondary source for this information. In the event (i) the Adviser’s securities information vendors do not assign a security to a particular country or if the published classification appears to be clearly erroneous, or (ii) its primary vendor does not assign a security to a particular country and the secondary vendor has assigned a security to a particular country by using a methodology that is not the same as the methodology the primary vendor uses to assign a country, the Adviser assigns the security to a country using the primary vendor’s published criteria (to the extent available) or the Adviser’s own judgment. The primary information vendor’s criteria class currently include the identity of the jurisdiction of the issuer’s incorporation, the main equity trading market for the issuer’s securities, the geographical distribution of the issuer’s operations and the location of the issuer’s headquarters. Country designations may change over time.
For the purposes of assigning portfolio securities to a particular sector and industry, the Adviser assigns securities in accordance with the sector and industry classifications of the Global Industry Classification Standard (GICS®) developed by MSCI Inc. and Standard & Poor’s. In the event the Adviser’s securities information vendors do not classify a security to a particular sector or industry, or if the published classification appears to be clearly erroneous, the Adviser classifies the security according to its own judgment, using other securities information vendors, the company description and other publicly available information about the company’s peer group. Sector and industry classifications may change over time.
The names of portfolio securities reflected in this report are as reported by the Funds’ data providers, may not represent the legal name of the entity and, in some cases, are translations of non-English names.
Definition of Portfolio Statistic
Market Capitalization is the aggregate value of all of a company’s outstanding equity securities.
Descriptions of Indices
Each Fund’s performance is compared in this report to changes in one or more indices, including in all cases a broad-based index of changes in prices of securities in the markets in which the Fund invests. All of the indices are unmanaged and their returns include reinvested dividends. Unlike the Funds’ returns, the returns of each index do not include the payment of sales commissions or other expenses that would be incurred in the purchase or sale of the securities included in that index. An investment cannot be made directly in an index. Fair value pricing is not employed by market indices.
112
NOTES ON MANAGEMENT’S DISCUSSION OF FUND PERFORMANCE AND PORTFOLIO HOLDINGS’ CLASSIFICATION
The indices to which the Funds are compared are:
Artisan Global Equity, Artisan Global Value and Artisan Growth Opportunities Funds – Morgan Stanley Capital International All Country World IndexSM (MSCI ACWISM) is a market-weighted index of global developed and emerging markets.
Artisan Growth Opportunities and Artisan Value Funds – Russell 1000® Index is a market-weighted index of about 1,000 large U.S. companies.
Artisan International, Artisan International Small Cap and Artisan International Value Funds – Morgan Stanley Capital International EAFE® Index (MSCI EAFE®) is a market-weighted index of companies in developed markets, excluding the U.S. and Canada. MSCI EAFE®’s average annual return since inception of the International Fund is based upon a starting date of December 31, 1995.
Artisan International Fund – Morgan Stanley Capital International EAFE® Growth Index (MSCI EAFE® Growth) is a market-weighted index of companies in developed markets, excluding the U.S. and Canada, that exhibits growth investment style characteristics according to MSCI’s methodology. MSCI EAFE® Growth’s average annual return since inception of the International Fund is based upon a starting date of December 31, 1995.
Artisan International Small Cap Fund – Morgan Stanley Capital International EAFE® Small Cap Index (MSCI EAFE® Small Cap) is a market-weighted index of small companies in developed markets, excluding the U.S. and Canada.
Artisan International Value Fund – Morgan Stanley Capital International EAFE® Value Index (MSCI EAFE® Value) is a market-weighted index of companies in developed markets, excluding the U.S. and Canada, that exhibits value investment style characteristics according to MSCI’s methodology.
Artisan Mid Cap and Artisan Mid Cap Value Funds – Russell Midcap® Index is a market-weighted index of about 800 medium-sized U.S. companies.
Artisan Mid Cap Fund – Russell Midcap® Growth Index is a market-weighted index of those medium-sized companies included in the Russell Midcap® Index with higher price-to-book and higher forecasted growth values.
Artisan Mid Cap Value Fund – Russell Midcap® Value Index is a market-weighted index of those medium-sized companies included in the Russell Midcap® Index with lower price-to-book ratios and lower forecasted growth values.
Artisan Small Cap and Artisan Small Cap Value Funds – Russell 2000® Index is a market-weighted index of about 2,000 small U.S. companies.
Artisan Small Cap Fund – Russell 2000® Growth Index is a market-weighted index of those small companies included in the Russell 2000® Index with higher price-to-book ratios and higher forecasted growth values.
Artisan Small Cap Value Fund – Russell 2000® Value Index is a market-weighted index of those small companies included in the Russell 2000® Index with lower price-to-book ratios and lower forecasted growth values.
Artisan Value Fund – Russell 1000® Value Index is a market-weighted index of those large companies included in the Russell 1000® Index with lower price-to-book ratios and lower forecasted growth values.
113
NOTES ON MANAGEMENT’S DISCUSSION OF FUND PERFORMANCE AND PORTFOLIO HOLDINGS’ CLASSIFICATION
Trademarks
Trademarks and copyrights relating to the indices and products of portfolio companies mentioned in this report, if any, are owned by their respective owners. Except as otherwise indicated, the trademarks, including names, logos, slogans and service marks appearing in this report are the property of the Adviser and may not be copied, reproduced, published or in any way used without written permission.
The Global Industry Classification Standard (“GICS”) was developed by and is the exclusive property and a service mark of MSCI Inc. (“MSCI”) and Standard & Poor’s, a division of The McGraw-Hill Companies, Inc. (“S&P”) and is licensed for use by Artisan Partners Limited Partnership. Neither MSCI, S&P nor any third party involved in making or compiling the GICS or any GICS classifications makes any express or implied warranties or representations with respect to such standard or classification (or the results to be obtained by the use thereof), and all such parties hereby expressly disclaim all warranties of originality, accuracy, completeness, merchantability and fitness for a particular purpose with respect to any of such standard or classification. Without limiting any of the foregoing, in no event shall MSCI, S&P, any of their affiliates or any third party involved in making or compiling the GICS or any GICS classifications have any liability for any direct, indirect, special, punitive, consequential or any other damages (including lost profits) even if notified of the possibility of such damages.
The MSCI information may only be used by the reader, may not be reproduced or redisseminated in any form and may not be used as a basis for or a component of any financial instruments or products or any indices. None of the MSCI information is intended to constitute investment advice or a recommendation to make (or refrain from making) any kind of investment decision and may not be relied on as such. Historical data and analysis should not be taken as an indication or guarantee of any future performance analysis, forecast or prediction. The MSCI information is provided on an “as is” basis and the reader of this information assumes the entire risk of any use made of this information. MSCI, each of its affiliates and each other person involved in or related to compiling, computing or creating any MSCI information (collectively, the “MSCI Parties”) expressly disclaims all warranties (including, without limitation, any warranties of originality, accuracy, completeness, timeliness, non-infringement, merchantability and fitness for a particular purpose) with respect to this information. Without limiting any of the foregoing, in no event shall MSCI Parties have any liability for any direct, indirect, special, incidental, punitive, consequential (including, without limitation, lost profits) or any other damages. (www.mscibarra.com)
Russell Investment Group is the source and owner of the Russell Index data contained or reflected in this material and all trademarks and copyrights related thereto. The presentation may contain confidential information and unauthorized use, disclosure, copying, dissemination or redistribution is strictly prohibited. This is a presentation of Artisan Funds. Russell Investment Group is not responsible for the formatting or configuration of this material or for any inaccuracy in Artisan Funds’ presentation thereof.
PROXY VOTING POLICIES AND PROCEDURES
You may obtain a description of Artisan Funds’ proxy voting policies and procedures, without charge, upon request by calling 800.344.1770. That information also is included in Artisan Funds’ statements of additional information, which are available without charge, on the Funds’ website at www.artisanfunds.com and on the Securities and Exchange Commission’s website at www.sec.gov.
114
PROXY VOTING POLICIES AND PROCEDURES
Information relating to how each Artisan Fund voted proxies relating to portfolio securities held during the twelve-month period ended June 30 is available without charge, on the Funds’ website at www.artisanfunds.com and on the Securities and Exchange Commission’s website at www.sec.gov.
INFORMATION ABOUT PORTFOLIO SECURITIES
Artisan Funds files a complete schedule of portfolio holdings with the Securities and Exchange Commission for the quarters ending December 31 and June 30 (the first and third quarters of the Funds’ fiscal year) on Form N-Q. The Funds’ Forms N-Q are available on the Securities and Exchange Commission’s website at www.sec.gov. You also may review and copy those documents by visiting the Securities and Exchange Commission’s Public Reference Room in Washington, D.C. Information on the operation of the Public Reference Room may be obtained by calling the Securities and Exchange Commission at 800.SEC.0330.
115
DIRECTORS AND OFFICERS
The board of directors has overall responsibility for the conduct of the affairs of Artisan Funds. Each director serves an indefinite term of unlimited duration until the next annual meeting of shareholders and until the election and qualification of his or her successor. The board of directors may fill any vacancy on the board provided that after such appointment at least two-thirds of the directors have been elected by the shareholders. The shareholders may remove a director by a vote of a majority of the outstanding shares of the Funds at any meeting of shareholders called for the purpose of removing such director.
The board of directors elects the officers of Artisan Funds. Each officer serves until the election and qualification of his or her successor, or until he or she sooner dies, resigns, or is removed or disqualified. The board of directors may remove any officer with or without cause at any time.
The names and ages of the directors and officers as of November 17, 2011, the position each holds with the Funds, the date each was first elected to office, their principal business occupations and other directorships they have held during at least the last five years are shown below. Each director oversees all twelve series of Artisan Funds.
| | | | | | | | |
| | | | | |
Name and Age at 11/17/11 | | Position(s)
Held with
Artisan Funds | | Date First Elected
or Appointed to Office | | Principal Occupation(s) during at least the
Past 5 Years | | Other Public Company or
Registered Investment
Company Directorships Held |
| Directors who are not “interested persons” of Artisan Funds: |
| David A. Erne – 68 | | Director and Independent Chair of the Board of Directors | | Director since 3/27/95; Independent Chair since 2/4/05 | | Of counsel to the law firm Reinhart Boerner Van Deuren s.c., Milwaukee, WI. | | Trustee, Northwestern Mutual Life Insurance Company (individual life insurance, disability insurance and annuity company). |
| Thomas R. Hefty – 64 | | Director | | 3/27/95 | | Retired; from January 2007 to February 2008, President, Kern Family Foundation (private, grant-making organization); until December 2006, of counsel to the law firm Reinhart Boerner Van Deuren s.c., Milwaukee, WI; until December 2006, Adjunct Professor, Department of Business and Economics, Ripon College; until December 2002, Chairman of the Board and Chief Executive Officer of Cobalt Corporation (provider of managed care and specialty business services). | | None. |
| Patrick S. Pittard – 65 | | Director | | 8/9/01 | | Chief Executive Officer of ACT Bridge, Inc. (enterprise talent management firm); Distinguished Executive in Residence (teaching position), University of Georgia; until October 2001, Chairman of the Board, President and Chief Executive Officer of Heidrick & Struggles International, Inc. (executive search firm). | | Director, Lincoln National Corporation (insurance and investment management company); former Director, Cbeyond, Inc. (telecommunications company, formerly Cbeyond Communications, Inc.). |
116
DIRECTORS AND OFFICERS
| | | | | | | | |
| | | | | |
Name and Age at 11/17/11 | | Position(s)
Held with
Artisan Funds | | Date First Elected
or Appointed to Office | | Principal Occupation(s) during at least the
Past 5 Years | | Other Public Company or
Registered Investment
Company Directorships Held |
| Howard B. Witt – 71 | | Director | | 3/27/95 | | Retired; until December 2004, Chairman of the Board, President and Chief Executive Officer of Littelfuse, Inc. (manufacturer of advanced circuit protection devices). | | Former Director, Franklin Electric Co., Inc. (manufacturer of electric motors). |
| Director who is an “interested person” of Artisan Funds: |
| Andrew A. Ziegler – 54* | | Director | | 1/5/95 | | Managing Director of Artisan Partners; until February 2010, President and Chief Executive Officer of Artisan Funds. | | None. |
| Officers: |
| Eric R. Colson – 41 | | President and Chief Executive Officer | | 2/9/10 | | Managing Director and Chief Executive Officer of Artisan Partners since January 2010; prior thereto, Managing Director and Chief Operating Officer – Investment Operations of Artisan Partners. | | None. |
| Brooke J. Billick – 57 | | Chief Compliance Officer | | 8/19/04 | | Chief Compliance Officer and Associate Counsel of Artisan Partners; Chief Compliance Officer of Artisan Partners Distributors LLC. | | None. |
| Gregory K. Ramirez – 41 | | Chief Financial Officer and Treasurer | | 2/8/11 | | Managing Director and since March 2010 Chief Accounting Officer of Artisan Partners; Assistant Treasurer of Artisan Partners Distributors LLC; until February 2011, Assistant Secretary and Assistant Treasurer of Artisan Funds. | | None. |
| Sarah A. Johnson – 39 | | General Counsel, Vice President and Secretary | | 2/8/11 | | Managing Director (since March 2010) and Associate Counsel of Artisan Partners; until February 2011, Assistant Secretary of Artisan Funds. | | None. |
| James S. Hamman, Jr. – 42 | | Vice President and Assistant Secretary | | 2/8/11 | | Associate Counsel of Artisan Partners since March 2010; from January 2008 until February 2010, Principal of Elite Investment Partners, LLC; prior thereto, Executive Vice President, General Counsel and Secretary of Calamos Asset Management, Inc. | | None. |
| * | Mr. Ziegler is an “interested person” of Artisan Funds, as defined in the Investment Company Act of 1940, because he is a Managing Director of Artisan Partners and an officer of Artisan Investments GP LLC (the general partner of Artisan Partners). Mr. Ziegler and Carlene M. Ziegler (who are married to each other) control Artisan Partners. |
117
DIRECTORS AND OFFICERS
The business address of the officers and director affiliated with Artisan Partners is 875 E. Wisconsin Avenue, Suite 800, Milwaukee, Wisconsin 53202. The address of the other directors is Mr. Erne, Mr. Hefty, Mr. Pittard and Mr. Witt – c/o Artisan Funds, 875 E. Wisconsin Avenue, Suite 800, Milwaukee, Wisconsin 53202.
Artisan Funds’ statement of additional information (SAI) contains further information about the directors. Please call 800.344.1770 or visit our website at www.artisanfunds.com for a free copy of the SAI.
118
| | | | |
 | | ARTISAN FUNDS P.O. BOX 8412 BOSTON, MA 02266-8412 800.344.1770 WWW.ARTISANFUNDS.COM | | |


ANNUAL
REPORT
SEPTEMBER 30, 2011
ARTISAN EMERGING MARKETS FUND
ARTISAN GROWTH OPPORTUNITIES FUND
(formerly known as
Artisan Opportunistic Growth Fund)
ARTISAN INTERNATIONAL FUND
ARTISAN INTERNATIONAL VALUE FUND
ARTISAN MID CAP FUND
ARTISAN VALUE FUND
(formerly known as
Artisan Opportunistic Value Fund)
ARTISAN FUNDS
INSTITUTIONAL SHARES
TABLE OF CONTENTS
ARTISAN FUNDS
P.O. BOX 8412
BOSTON, MA 02266-8412
This report and the audited financial statements contained herein are provided for the general information of the shareholders of the Institutional Shares of Artisan Emerging Markets Fund, Artisan Growth Opportunities Fund, Artisan International Fund, Artisan International Value Fund, Artisan Mid Cap Fund and Artisan Value Fund. Before investing, investors should consider carefully each Fund’s investment objective, risks and charges and expenses. For more complete information on any Fund, including fees and expenses, please call 800.399.1770 for a free prospectus. Read it carefully before you invest or send money.
Company discussions are for illustration only and are not intended as recommendations of individual stocks. The discussions present information about the companies believed to be accurate, and the views of the portfolio managers, as of September 30, 2011. That information and those views may change, and the Funds disclaim any obligation to advise shareholders of any such changes. Each of the Funds offer other classes of shares. A report on each of the other classes is available under separate cover.
Artisan Funds offered through Artisan Partners Distributors LLC, member FINRA.
ARTISAN EMERGING MARKETS FUND
INSTITUTIONAL SHARES
INVESTMENT PROCESS HIGHLIGHTS
Artisan Emerging Markets Fund employs a fundamental research process to construct a diversified portfolio of emerging market companies. The team’s investment process is focused on identifying companies that are priced at a discount relative to the team’s estimate of their sustainable earnings.
| • | | Sustainable Earnings. The team believes that over the long term a stock’s price is directly related to the company’s ability to deliver sustainable earnings. The team determines a company’s sustainable earnings based upon financial and strategic analyses. The financial analysis of a company’s balance sheet, income statement, and statement of cash flows focuses on identifying historical drivers of return on equity. The strategic analysis examines a company’s competitive advantages and financial strength to assess sustainability. |
| • | | Valuation. The team believes that investment opportunities develop when businesses with sustainable earnings are undervalued relative to peers and historical industry, country and regional valuations. The team values a business and develops a price target based on their assessment of the business’s sustainable earnings and cash flow expectations and the team’s risk analysis. |
| • | | Risk Analysis. The team believes that a disciplined risk framework allows greater focus on fundamental stock selection. The team incorporates its assessment of company-specific and macroeconomic risks into its valuation analysis to develop a risk-adjusted target price. The risk-rating assessment includes a review of the currency, interest rate, monetary and fiscal policy and political risks to which a company is exposed. |
PERFORMANCE HISTORY
GROWTH OF AN ASSUMED $1,000,000 INVESTMENT (6/26/2006 to 9/30/2011)
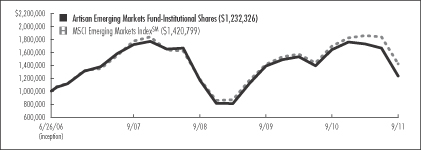
AVERAGE ANNUAL TOTAL RETURNS (as of 9/30/2011)
| | | | | | | | | | | | | | | | |
| Fund / Index | | 1-Year | | | 3-Year | | | 5-Year | | | Since
Inception | |
Artisan Emerging Markets Fund – Institutional Shares | | | -24.67 | % | | | 1.77 | % | | | 2.02 | % | | | 4.05 | % |
MSCI Emerging Markets IndexSM | | | -16.15 | | | | 6.27 | | | | 4.87 | | | | 6.90 | |
The performance quoted represents past performance, which does not guarantee future results. The investment return and principal value of an investment in the Fund will fluctuate, so that an investor’s shares in the Fund, when redeemed, may be worth more or less than their original cost. Current performance may be lower or higher than the performance data quoted. For current to most recent month-end performance information call 800.399.1770. The graph and table above do not reflect the deduction of taxes that a shareholder would pay on distributions or sale of Fund shares. The performance shown does not reflect the deduction of a 2% redemption fee on shares held by an investor for 90 days or less and, if reflected, the fee would reduce the performance quoted. The Fund’s performance information reflects Artisan Partners’ contractual agreement to limit the Fund’s expenses to no more than 1.50%, which has been in effect since the Fund’s inception and has had a material impact on the Fund’s performance. Absent that expense waiver, the Fund’s performance would have been lower. See page 68 for a description of the index.
2
INVESTING ENVIRONMENT
Emerging markets, as measured by the MSCI Emerging Markets IndexSM, advanced in the first half of the period despite inflation concerns in emerging markets and political turmoil in the Middle East and North Africa. However, in the latter half of the period, sovereign debt concerns in the developed world and fears of an economic hard landing in China heightened investor risk aversion and weighed heavily on emerging markets, erasing earlier gains. Emerging Asia held up the best, as many countries in the region had losses confined to single-digits. From a regional perspective, Latin America fared the worst, with Brazil posting losses of approximately 26%. All of the BRIC (Brazil, Russia, India, China) nations posted double-digit declines, with Brazil suffering the largest setback, while Russia, India and China retreated approximately 12%, 25% and 24%, respectively.
SECTOR DIVERSIFICATION
| | | | | | | | |
| Sector | | 9/30/10 | | | 9/30/11 | |
Consumer Discretionary | | | 8.3 | % | | | 12.0 | % |
Consumer Staples | | | 7.3 | | | | 5.2 | |
Energy | | | 11.0 | | | | 10.3 | |
Financials | | | 15.8 | | | | 18.0 | |
Healthcare | | | 2.7 | | | | 3.4 | |
Industrials | | | 9.5 | | | | 7.8 | |
Information Technology | | | 12.5 | | | | 18.3 | |
Materials | | | 14.8 | | | | 13.4 | |
Telecommunication Services | | | 10.5 | | | | 7.7 | |
Utilities | | | 3.0 | | | | 2.0 | |
Other assets less liabilities | | | 4.6 | | | | 1.9 | |
Total | | | 100.0 | % | | | 100.0 | % |
As a percentage of total net assets.
PERFORMANCE DISCUSSION
During the twelve-month period ended September 30, 2011, Artisan Emerging Markets Fund declined 24.67%, underperforming the MSCI Emerging Markets IndexSM, which fell 16.15% over the same period.
Performance of the following stocks had a positive impact on the portfolio during the period: Polski Koncern Naftowy Orlen S.A., a refiner and distributor of petroleum products; Taiwan Semiconductor Manufacturing Company Ltd., a manufacturer of integrated circuits; Fleury SA, a medical services provider; Empresa Nacional de Telecomunicaciones S.A. (ENTEL), a telecommunications services provider in Chile; and Tim Participacoes S.A., a provider of mobile telecommunications services.
Notable detractors included: Petroleo Brasileiro S.A.– Petrobras, an oil and natural gas producer; Hypermarcas SA, a consumer goods manufacturer; China Yurun Food Group Limited, a meat product supplier in China; LSR Group O.J.S.C., a real estate developer; and Vale SA, a metals and mining company.
REGION ALLOCATION
| | | | | | | | |
| Region | | 9/30/10 | | | 9/30/11 | |
Emerging Asia | | | 44.8 | % | | | 48.1 | % |
Latin America | | | 25.0 | | | | 26.4 | |
Europe, Middle East & Africa | | | 23.9 | | | | 20.8 | |
Developed Markets | | | 1 .7 | | | | 2.8 | |
As a percentage of total net assets.
FUND CHANGES
We identified several new investment opportunities for the portfolio during the period, including CNOOC Limited, a producer of crude oil and natural gas; Infosys Limited, an IT consulting and software services provider; KB Financial Group, Inc., the holding company for Kookmin Bank; Mahindra & Mahindra Ltd., a manufacturer of automobiles, farm equipment and automotive components; and Sinopharm Group Co., a pharmacy distribution company. We funded these purchases in part by selling our positions in China Mobile Limited, Siam Commercial Bank Public Company Limited, Companhia de Bebidas das Americas (AmBev), Iguatemi Empresa de Shopping Centers SA, and ABSA Group Limited.
3
ARTISAN GROWTH OPPORTUNITIES FUND
INSTITUTIONAL SHARES
INVESTMENT PROCESS HIGHLIGHTS
Artisan Growth Opportunities Fund employs a bottom-up investment process to construct a diversified portfolio of growth companies across a broad capitalization range. The Fund’s investment process focuses on two distinct areas – security selection and capital allocation.
The Fund’s investment team attempts to identify companies that possess franchise characteristics that are selling at attractive valuations and benefiting from an accelerating profit cycle.
Franchise characteristics. These are characteristics that the team believes help to protect a company’s stream of cash flow from the effects of competition. The team looks for companies with at least two of the following characteristics: low-cost production capability, possession of a proprietary asset, dominant market share or a defensible brand name.
Attractive valuations. Through its own fundamental research, the team estimates the amount a buyer would pay to buy the entire company (the company’s “intrinsic value” or “private market value”) and considers whether to purchase a stock if it sells at a discount to that estimate.
Accelerating profit cycle. The team tries to invest in companies that are well positioned for long-term growth, at an early enough stage in their profit cycle to benefit from the increased cash flows produced by the profit cycle.
Based on the investment team’s fundamental analysis of a company’s profit cycle, portfolio holdings develop through three stages. GardenSM investments are small positions in the early part of their profit cycle that will warrant a more sizeable allocation once their profit cycle accelerates. CropSM investments are positions that are being increased to a full weight because they are moving through the strongest part of their profit cycle. HarvestSM investments are positions that are being reduced as they near the team’s estimate of full valuation or their profit cycle begins to decelerate.
PERFORMANCE HISTORY
GROWTH OF AN ASSUMED $1,000,000 INVESTMENT (7/26/2011 to 9/30/2011)
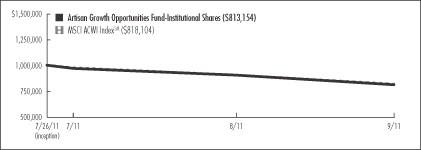
TOTAL RETURNS (as of 9/30/2011)
| | | | |
| Fund / Index | | Since
Inception(1) | |
Artisan Growth Opportunities Fund – Institutional Shares | | | -18.68 | % |
MSCI ACWISM (All Country World Index) | | | -18.19 | |
| (1) | For the period from commencement of operations (July 26, 2011) through September 30, 2011; not annualized. |
The performance quoted represents past performance, which does not guarantee future results. The investment return and principal value of an investment in the Fund will fluctuate, so that an investor’s shares in the Fund, when redeemed, may be worth more or less than their original cost. The Fund’s return may vary greatly over short periods, and current performance may be materially lower or higher than the performance data quoted. For current to most recent month-end performance information call 800.399.1770. The graph and table above do not reflect the deduction of taxes that a shareholder would pay on distributions or sale of Fund shares. The performance shown does not reflect the deduction of a 2% redemption fee on shares held by an investor for 90 days or less and, if reflected, the fee would reduce the performance quoted. The Fund’s performance information reflects Artisan Partners’ contractual agreement to limit the Fund’s expenses to no more than 1.50%, which has been in effect since the Fund’s inception and has had a material impact on the Fund’s performance, which would have been lower in its absence. See page 69 for a description of each index.
4
INVESTING ENVIRONMENT
During the time period since inception through September 30, 2011, global stocks, as represented by the MSCI All Country World Index, posted negative returns. The best relative performing sectors included consumer staples and utilities, whereas, energy and materials trailed. The economic backdrop included signs of a slowing global economic recovery and weakening sentiment caused by high sovereign debt levels in developed regions.
SECTOR DIVERSIFICATION
| | | | | | | | |
| Sector | | 9/30/10 | | | 9/30/11 | |
Consumer Discretionary | | | 14.5 | % | | | 13.2 | % |
Consumer Staples | | | — | | | | 2.9 | |
Energy | | | 2.2 | | | | 6.7 | |
Financials | | | 3.3 | | | | 5.4 | |
Healthcare | | | 9.8 | | | | 18.2 | |
Industrials | | | 22.5 | | | | 13.4 | |
Information Technology | | | 42.1 | | | | 28.1 | |
Materials | | | — | | | | 4.1 | |
Other assets less liabilities | | | 5.6 | | | | 8.0 | |
Total | | | 100.0 | % | | | 100.0 | % |
As a percentage of total net assets.
PERFORMANCE DISCUSSION
During the since-inception period ended September 30, 2011 Artisan Growth Opportunities Fund declined 18.68%, underperforming the MSCI All Country World IndexSM which fell 18.19%.
The following stocks had a positive relative impact on the portfolio’s performance compared to the benchmark during the period: Cerner Corporation, a health care information technology provider, Regeneron Pharmaceuticals, Inc., a biopharmaceutical company, Coca-Cola Icecek AS, a bottler and distributor of beverages and Allergan, Inc., a specialty pharmaceutical company.
Notable detractors included: National Oilwell Varco, Inc., a provider of equipment for drilling rigs, Hexagon AB, an industrial and commercial group, Agilent Technologies, Inc., a provider of test and measurement instrumentation, EMC Corporation, a provider of data storage solutions and Baker Hughes Incorporated, a provider of oilfield products and services.
REGION ALLOCATION
| | | | | | | | |
| Region | | 9/30/10 | | | 9/30/11 | |
Americas | | | 72.3 | % | | | 62.0 | % |
Emerging Markets | | | 9.6 | | | | 17.2 | |
Europe | | | 8.5 | | | | 9.6 | |
Pacific Basin | | | 4.0 | | | | 3.2 | |
As a percentage of total net assets.
FUND CHANGES
We identified several new investment opportunities for the portfolio during the period, including Broadcom Corporation, a producer of products for wired and wireless communication devices, salesforce.com, inc., a provider of on demand customer relationship management services, Tsingtao Brewery Company Limited, a beer producer and Teradata Corporation, a data warehousing company. We funded these purchases in part by selling our positions in Oracle Corporation, ABB Limited, Edwards Lifesciences Corporation and Comerica Incorporated.
5
ARTISAN INTERNATIONAL FUND
INSTITUTIONAL SHARES
INVESTMENT PROCESS HIGHLIGHTS
Artisan International Fund employs a fundamental stock selection process focused on identifying long-term growth opportunities.
Themes. The investment team’s thematic approach identifies catalysts for change and develops investment themes with the objective of capitalizing on them globally. Changing demographics, developing technology, privatization of economic resources, outsourcing and infrastructure are among the long-term catalysts for change that currently form the basis for the team’s investment themes. The team incorporates these catalysts along with sector and regional fundamentals into a long-term global framework for investment analysis and decision-making.
Sustainable Growth. The team applies a fundamental approach to identifying the long term, sustainable growth characteristics of potential investments. The team seeks high quality companies that are well managed, have a dominant or improving market position and competitive advantages compared to industry and regional peers.
Valuation. The team assesses the relationship between its estimate of a company’s sustainable growth prospects and the company’s stock price. The team uses multiple valuation metrics to establish price targets.
PERFORMANCE HISTORY
GROWTH OF AN ASSUMED $1,000,000 INVESTMENT (7/1/1997 to 9/30/2011)
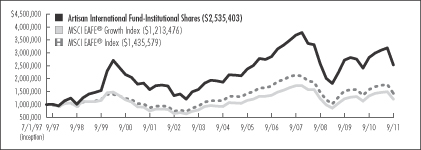
AVERAGE ANNUAL TOTAL RETURNS (as of 9/30/2011)
| | | | | | | | | | | | | | | | | | | | |
| Fund / Index | | 1-Year | | | 3-Year | | | 5-Year | | | 10-Year | | | Since
Inception | |
Artisan International Fund – Institutional Shares | | | -9.76 | % | | | -0.56 | % | | | -2.30 | % | | | 4.86 | % | | | 6.75 | % |
MSCI EAFE® Growth Index | | | -8.79 | | | | -0.63 | | | | -2.16 | | | | 4.86 | | | | 1.37 | |
MSCI EAFE® Index | | | -9.36 | | | | -1.13 | | | | -3.46 | | | | 5.03 | | | | 2.57 | |
The performance quoted represents past performance, which does not guarantee future results. The investment return and principal value of an investment in the Fund will fluctuate, so that an investor’s shares in the Fund, when redeemed, may be worth more or less than their original cost. Current performance may be lower or higher than the performance data quoted. For current to most recent month-end performance information call 800.399.1770. The graph and table above do not reflect the deduction of taxes that a shareholder would pay on distributions or sale of Fund shares. The performance shown does not reflect the deduction of a 2% redemption fee on shares held by an investor for 90 days or less and, if reflected, the fee would reduce the performance quoted. See page 69 for a description of each index.
6
INVESTING ENVIRONMENT
Over the past twelve-month period, investors reacted to a plethora of macroeconomic events happening in all parts of the globe, which sent stocks into some dramatic swings that were as abrupt as they were frequent. Developed and emerging markets alike were hard hit with meaningful declines in stock prices. When it came to the debt issues facing the U.S. and Europe, the biggest factor to weigh on stocks seemed to be the lack of decisive action from policymakers in both regions. Political stalemates and ambiguity about next steps for debt-laden countries only added to investor worry. Renewed fears of higher inflation and a hard landing for China’s economy also impacted sentiment across the globe, as China has been a key driver of global growth during this tough economic period. The combination of these events and other macroeconomic concerns resulted in negative returns for the MSCI EAFE® Index.
SECTOR DIVERSIFICATION
| | | | | | | | |
| Sector | | 9/30/10 | | | 9/30/11 | |
Consumer Discretionary | | | 19.2 | % | | | 19.0 | % |
Consumer Staples | | | 15.4 | | | | 28.6 | |
Energy | | | — | | | | 4.4 | |
Financials | | | 24.4 | | | | 14.8 | |
Healthcare | | | 5.3 | | | | 2.2 | |
Industrials | | | 16.4 | | | | 12.9 | |
Information Technology | | | 9.3 | | | | 4.4 | |
Materials | | | 6.6 | | | | 7.6 | |
Telecommunication Services | | | 1.3 | | | | 2.5 | |
Utilities | | | 0.4 | | | | — | |
Other assets less liabilities | | | 1.7 | | | | 3.6 | |
Total | | | 100.0 | % | | | 100.0 | % |
As a percentage of total net assets.
PERFORMANCE DISCUSSION
During the twelve-month period ended September 30, 2011, Artisan International Fund declined 9.76%, underperforming the MSCI EAFE® Growth and MSCI EAFE® indices, which fell 8.79% and 9.36%, respectively, over the same period.
Performance of the following stocks had a positive impact on the portfolio during the period: Netherlands based semiconductor manufacturing equipment developer ASML Holding N.V., Macau casino operators Sands China Ltd. and Wynn Macau, Limited, Japanese cigarette and tobacco products manufacturer JAPAN TOBACCO INC. and U.K. listed credit and marketing services provider Experian PLC.
Notable detractors included: Brazilian oil and gas producer Petroleo Brasileiro S.A., Canadian freight and intermodal services provider Canadian Pacific Railway Limited, Hong Kong based property developer Sun Hung Kai Properties Limited, Italian truck and tractor manufacturer Fiat Industrial SpA, and Chinese flavors and fragrances producer Huabao International Holdings Limited.
REGION ALLOCATION
| | | | | | | | |
| Region | | 9/30/10 | | | 9/30/11 | |
Europe | | | 60.9 | % | | | 52.2 | % |
Pacific Basin | | | 20.2 | | | | 31.2 | |
Emerging Markets | | | 11.0 | | | | 7.9 | |
Americas | | | 6.2 | | | | 5.1 | |
As a percentage of total net assets.
FUND CHANGES
We identified several new investment opportunities for the portfolio during the period, including Japanese cigarette and tobacco products manufacturer JAPAN TOBACCO INC., Netherlands based branded and packaged consumer goods company Unilever NV, Hong Kong based insurance company AIA Group Ltd., Japanese household and chemical products manufacturer Kao Corporation and French food processing company DANONE S.A. We funded these purchases in part by selling our positions in ASML Holding N.V., Tesco plc, Experian PLC, ING Groep N.V. and Kingfisher plc.
7
ARTISAN INTERNATIONAL VALUE FUND
INSTITUTIONAL SHARES
INVESTMENT PROCESS HIGHLIGHTS
Artisan International Value Fund employs a bottom-up investment process to construct a diversified portfolio of stocks of undervalued non-U.S. companies. The Fund’s investment process is focused on identifying what the investment team believes are high quality, undervalued businesses that offer the potential for superior risk/reward outcomes. The team’s in-depth research process focuses on four key investment characteristics:
Undervaluation. Determining the intrinsic value of the business is the heart of the team’s research process. The team believes that intrinsic value represents the amount that a buyer would pay to own a company’s future cash flows. The team seeks to invest at a significant discount to its estimate of the intrinsic value of a business.
Business quality. The team seeks to invest in companies with histories of generating strong free cash flow, improving returns on capital and strong competitive positions in their industries.
Financial strength. The team believes that investing in companies with strong balance sheets helps to reduce the potential for capital risk and provides company management the ability to build value when attractive opportunities are available.
Shareholder-oriented management. The team’s research process attempts to identify management teams with a history of building value for shareholders.
PERFORMANCE HISTORY
GROWTH OF AN ASSUMED $1,000,000 INVESTMENT (10/1/2006 to 9/30/2011)
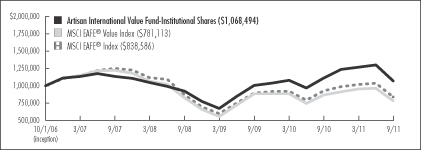
AVERAGE ANNUAL TOTAL RETURNS (as of 9/30/2011)
| | | | | | | | | | | | | | | | |
| Fund / Index | | 1-Year | | | 3-Year | | | 5-Year | | | Since
Inception | |
Artisan International Value Fund – Institutional Shares | | | -3.84 | % | | | 5.11 | % | | | 1.33 | % | | | 1.33 | % |
MSCI EAFE® Value Index | | | -9.99 | | | | -1.69 | | | | -4.82 | | | | -4.82 | |
MSCI EAFE® Index | | | -9.36 | | | | -1.13 | | | | -3.46 | | | | -3.46 | |
The performance quoted represents past performance, which does not guarantee future results. The investment return and principal value of an investment in the Fund will fluctuate, so that an investor’s shares in the Fund, when redeemed, may be worth more or less than their original cost. Current performance may be lower or higher than the performance data quoted. For current to most recent month-end performance information call 800.399.1770. The graph and table above do not reflect the deduction of taxes that a shareholder would pay on distributions or sale of Fund shares. The performance shown does not reflect the deduction of a 2% redemption fee on shares held by an investor for 90 days or less and, if reflected, the fee would reduce the performance quoted. See page 69 for a description of each index.
8
INVESTING ENVIRONMENT
International equity markets experienced volatility during the year ended September 30, 2011 stemming from concerns over a global economic slowdown, indecision on the political fronts in the U.S. and Europe, sovereign debt downgrades and worries over contagion from Europe’s debt crisis. The tragic earthquake and tsunami in Japan and turmoil in the Middle East also contributed to market volatility. Despite fear in the marketplace, many companies continued to report steady earnings results during the period.
SECTOR DIVERSIFICATION
| | | | | | | | |
| Sector | | 9/30/10 | | | 9/30/11 | |
Consumer Discretionary | | | 22.7 | % | | | 23.4 | % |
Consumer Staples | | | 9.2 | | | | 14.9 | |
Energy | | | 4.5 | | | | 2.6 | |
Financials | | | 21.1 | | | | 21.7 | |
Healthcare | | | 7.3 | | | | 7.9 | |
Industrials | | | 18.1 | | | | 15.6 | |
Information Technology | | | 7.7 | | | | 7.0 | |
Materials | | | 3.2 | | | | 2.5 | |
Other assets less liabilities | | | 6.2 | | | | 4.4 | |
Total | | | 100.0 | % | | | 100.0 | % |
As a percentage of total net assets.
PERFORMANCE DISCUSSION
During the twelve-month period ended September 30, 2011, Artisan International Value Fund declined 3.84%, outperforming the MSCI EAFE® Value and MSCI EAFE® indices, which fell 9.99% and 9.36%, respectively, over the same period.
Performance of the following stocks had a positive impact on the portfolio during the period: Credit Saison Co., Ltd., a consumer card company; Experian PLC, a credit and marketing services firm; Accenture plc, a provider of management and technology consulting services; Signet Jewelers Ltd., a jewelry retailer in the U.S. and U.K.; and Arch Capital Group Ltd., a provider of reinsurance and insurance products.
Notable detractors included financial services providers ING Groep N.V. and Lloyds Banking Group plc; medical systems, consumer electronics and lighting manufacturer Koninklijke Philips Electronics N.V.; international brewer Carlsberg A/S; and aggregates and cement producer HeidelbergCement AG.
REGION ALLOCATION
| | | | | | | | |
| Region | | 9/30/10 | | | 9/30/11 | |
Europe | | | 63.8 | % | | | 61.9 | % |
Americas | | | 18.5 | | | | 17.0 | |
Pacific Basin | | | 11.1 | | | | 16.2 | |
Emerging Markets | | | 0.4 | | | | 0.5 | |
As a percentage of total net assets.
FUND CHANGES
We identified some new investment opportunities for the portfolio during the period, including household goods maker Kao Corporation, previously mentioned Koninklijke Philips Electronics N.V., previously mentioned ING Groep N.V., food retailer Koninklijke Ahold NV and lighting equipment manufacturer Stanley Electric Co., Ltd. We funded these purchases in part by selling our positions in Givaudan SA, Royal Dutch Shell PLC and Home Retail Group plc.
9
ARTISAN MID CAP FUND
INSTITUTIONAL SHARES
INVESTMENT PROCESS HIGHLIGHTS
Artisan Mid Cap Fund employs a bottom-up investment process to construct a diversified portfolio of primarily U.S. mid-cap growth companies. The Fund’s investment process focuses on two distinct areas – security selection and capital allocation.
The Fund’s investment team attempts to identify companies that possess franchise characteristics that are selling at attractive valuations and benefiting from an accelerating profit cycle.
Franchise characteristics. These are characteristics that the team believes help to protect a company’s stream of cash flow from the effects of competition. The team looks for companies with at least two of the following characteristics: low-cost production capability, possession of a proprietary asset, dominant market share or a defensible brand name.
Attractive valuations. Through its own fundamental research, the team estimates the amount a buyer would pay to buy the entire company (the company’s “intrinsic value” or “private market value”) and considers whether to purchase a stock if it sells at a discount to that estimate.
Accelerating profit cycle. The team tries to invest in companies that are well positioned for long-term growth, at an early enough stage in their profit cycle to benefit from the increased cash flows produced by the profit cycle.
Based on the investment team’s fundamental analysis of a company’s profit cycle, portfolio holdings develop through three stages. GardenSM investments are small positions in the early part of their profit cycle that will warrant a more sizeable allocation once their profit cycle accelerates. CropSM investments are positions that are being increased to a full weight because they are moving through the strongest part of their profit cycle. HarvestSM investments are positions that are being reduced as they near the team’s estimate of full valuation or their profit cycle begins to decelerate.
PERFORMANCE HISTORY
GROWTH OF AN ASSUMED $1,000,000 INVESTMENT (7/1/2000 to 9/30/2011)
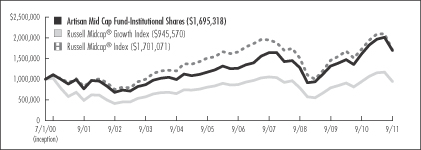
AVERAGE ANNUAL TOTAL RETURNS (as of 9/30/2011)
| | | | | | | | | | | | | | | | | | | | |
| Fund / Index | | 1-Year | | | 3-Year | | | 5-Year | | | 10-Year | | | Since
Inception | |
Artisan Mid Cap Fund – Institutional Shares | | | 5.67 | % | | | 9.83 | % | | | 6.05 | % | | | 8.17 | % | | | 4.80 | % |
Russell Midcap® Growth Index | | | 0.80 | | | | 5.89 | | | | 1.64 | | | | 6.70 | | | | -0.50 | |
Russell Midcap® Index | | | -0.88 | | | | 3.96 | | | | 0.56 | | | | 7.45 | | | | 4.83 | |
The performance quoted represents past performance, which does not guarantee future results. The investment return and principal value of an investment in the Fund will fluctuate, so that an investor’s shares in the Fund, when redeemed, may be worth more or less than their original cost. Current performance may be lower or higher than the performance data quoted. For current to most recent month-end performance information call 800.399.1770. The graph and table above do not reflect the deduction of taxes that a shareholder would pay on distributions or sale of Fund shares. See page 69 for a description of each index.
10
INVESTING ENVIRONMENT
For the one-year period ended September 30, 2011 mid-cap stocks, as represented by the Russell Midcap® Index, finished slightly negative. Mid-cap growth stocks, as represented by the Russell Midcap® Growth Index performed better. The best performing sectors in the Russell Midcap® Growth Index included consumer staples, utilities and consumer discretionary, whereas, telecommunications services and information technology trailed. For much of the period, the economic backdrop was a slower than initially expected economic recovery, but there were also some setbacks along the way including weakening sentiment caused by high sovereign debt levels in developed regions. Overall, corporate earnings remained relatively healthy throughout the period.
SECTOR DIVERSIFICATION
| | | | | | | | |
| Sector | | 9/30/10 | | | 9/30/11 | |
Consumer Discretionary | | | 20.7 | % | | | 19.6 | % |
Consumer Staples | | | — | | | | 2.6 | |
Energy | | | 5.0 | | | | 7.3 | |
Financials | | | 7.4 | | | | 5.1 | |
Healthcare | | | 12.4 | | | | 22.5 | |
Industrials | | | 18.7 | | | | 12.6 | |
Information Technology | | | 33.5 | | | | 25.9 | |
Other assets less liabilities | | | 2.3 | | | | 4.4 | |
Total | | | 100.0 | % | | | 100.0 | % |
As a percentage of total net assets.
PERFORMANCE DISCUSSION
During the twelve-month period ended September 30, 2011, Artisan Mid Cap Fund returned 5.67%, outperforming the Russell Mid Cap® Growth and Russell Mid Cap® indices, which fell 0.80% and 0.88%, respectively, over the same period.
Performance of the following stocks had a positive impact on the portfolio during the period: Cerner Corporation, a health care information technology provider; lululemon athletica inc., a specialty apparel retailer; Regeneron Pharmaceuticals, Inc., a biopharmaceutical company; athenahealth, Inc., an internet-based business services provider; and Polo Ralph Lauren Corporation, an apparel designer and marketer.
Notable detractors included: Comerica Incorporated, a bank holding company; MercadoLibre, Inc., an online trading site operator; Ctrip.com International Ltd., an airline and hotel accommodation consolidator; Citrix Systems, Inc., a technology solutions provider; and Juniper Networks, Inc., a network infrastructure developer.
FUND CHANGES
We identified several new investment opportunities for the portfolio during the period, including Regeneron Pharmaceuticals, Inc., a biopharmaceutical company; Teradata Corporation, an enterprise data warehouse; Discover Financial Services, a payment services provider; and Cepheid, a molecular diagnostics company. We funded these purchases in part by selling our positions in Cummins Inc., C.H. Robinson Worldwide, Inc., GSI Commerce, Inc. and NetApp, Inc.
11
ARTISAN VALUE FUND
INSTITUTIONAL SHARES
INVESTMENT PROCESS HIGHLIGHTS
Artisan Value Fund employs a bottom-up investment process to construct a diversified portfolio of stocks that the team believes are undervalued, in solid financial condition with attractive business economics. The team believes companies with these characteristics are less likely to experience eroding values over the long term.
Attractive valuation. The team values a business using what it believes are reasonable expectations for the long-term earnings power and capitalization rates of that business. This results in a range of values for the company that the team believes would be reasonable. The team generally will purchase a security if the stock price falls below or toward the lower end of that range.
Sound financial condition. The team favors companies with an acceptable level of debt and positive cash flow. At a minimum, the team tries to avoid companies that have so much debt that management may be unable to make decisions that would be in the best interest of the companies’ shareholders.
Attractive business economics. The team favors cash-producing businesses that it believes are capable of earning acceptable returns on capital over the company’s business cycle.
PERFORMANCE HISTORY
GROWTH OF AN ASSUMED $1,000,000 INVESTMENT (7/26/2011 to 9/30/2011)
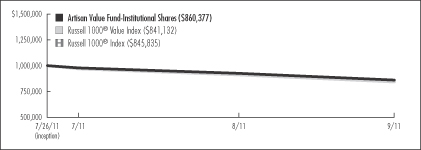
TOTAL RETURNS (as of 9/30/2011)
| | | | |
| Fund / Index | | Since
Inception (1) | |
Artisan Value Fund – Institutional Shares | | | -13.96 | % |
Russell 1000® Value Index | | | -15.89 | |
Russell 1000® Index | | | -15.42 | |
| (1) | For the period from commencement of operations (July 26, 2011) through September 30, 2011; not annualized. |
The performance quoted represents past performance, which does not guarantee future results. The investment return and principal value of an investment in the Fund will fluctuate, so that an investor’s shares in the Fund, when redeemed, may be worth more or less than their original cost. The Fund’s return may vary greatly over short periods, and current performance may be materially lower or higher than the performance data quoted. For current to most recent month-end performance information call 800.399.1770. The graph and table above do not reflect the deduction of taxes that a shareholder would pay on distributions or sale of Fund shares. See page 69 for a description of each index.
12
INVESTING ENVIRONMENT
Equity markets were volatile during the since-inception period ended September 30, 2011. Equities fell sharply due to a variety of macro concerns, including the stability of the European banking system owing to sovereign debt exposures and slowing economic growth in the U.S. and around the world.
SECTOR DIVERSIFICATION
| | | | | | | | |
| Sector | | 9/30/10 | | | 9/30/11 | |
Consumer Discretionary | | | — | % | | | 9.1 | % |
Consumer Staples | | | 4.6 | | | | 10.3 | |
Energy | | | 12.8 | | | | 10.8 | |
Financials | | | 23.5 | | | | 27.4 | |
Healthcare | | | 14.5 | | | | 2.9 | |
Industrials | | | 8.2 | | | | 2.6 | |
Information Technology | | | 34.0 | | | | 34.4 | |
Other assets less liabilities | | | 2.4 | | | | 2.5 | |
Total | | | 100.0 | % | | | 100.0 | % |
As a percentage of total net assets.
PERFORMANCE DISCUSSION
During the since-inception period ended September 30, 2011, Artisan Value Fund declined 13.96%, outperforming the Russell 1000® Value and Russell 1000® indices which fell 15.89% and 15.42%, respectively, over the same period.
While not immune to the market downturn, the following stocks helped the relative performance of the portfolio during the period: Fidelity National Financial, Inc., a title insurance company; Annaly Capital Management, Inc., a real estate investment trust; Nestle SA, a leading food manufacturer; Pfizer Inc., a pharmaceutical company; and Arch Capital Group Ltd., an insurance and reinsurance provider.
Notable detractors included: Hewlett-Packard Company, a diversified technology company; independent oil and gas exploration and production companies Apache Corporation and Cimarex Energy Co.; and diversified financial services firms The Bank of New York Mellon Corporation and The Goldman Sachs Group, Inc.
REGION ALLOCATION
| | | | | | | | |
| Region | | 9/30/10 | | | 9/30/11 | |
Americas | | | 97.6 | % | | | 91.8 | % |
Europe | | | — | | | | 5.7 | |
As a percentage of total net assets.
FUND CHANGES
We identified one new investment opportunity for the portfolio during the period: Carnival Corporation, the largest cruise vacation group in the world. We funded this purchase in part by selling our positions in previously mentioned Nestle SA, Fidelity National Financial, Inc. and Pfizer Inc., in addition to Lockheed Martin Corporation and Applied Materials, Inc.
13
ARTISAN EMERGING MARKETS FUND
Schedule of Investments – September 30, 2011
Dollar values in thousands
| | | | | | | | |
| | | Shares
Held | | | Value | |
| | | | | | | | |
COMMON AND
PREFERRED STOCKS - 98.1% | | | | | | | | |
| | | | | | | | |
| BRAZIL - 18.3% | | | | | | | | |
Anhanguera Educacional Participacoes SA | | | 365,300 | | | $ | 4,702 | |
Banco do Brasil S.A.(1)(2) | | | 107,980 | | | | 1,427 | |
Banco do Brasil S.A. | | | 347,400 | | | | 4,589 | |
BM&F BOVESPA SA | | | 1,623,200 | | | | 7,588 | |
BR Properties SA | | | 738,314 | | | | 6,707 | |
Companhia Energetica de Minas Gerais-CEMIG, Preferred(3) | | | 452,171 | | | | 6,669 | |
Companhia Vale do Rio Doce | | | 973,462 | | | | 22,081 | |
Fibria Celulose S.A. | | | 507,700 | | | | 3,861 | |
Hypermarcas SA | | | 1,289,400 | | | | 6,062 | |
Julio Simoes Logistica SA(1)(2) | | | 293,100 | | | | 1,372 | |
Julio Simoes Logistica SA | | | 462,400 | | | | 2,164 | |
Magazine Luiza SA(4) | | | 488,900 | | | | 3,053 | |
Magnesita Refratarios SA(4) | | | 906,200 | | | | 2,916 | |
PDG Realty SA Empreendimentos e Participacoes | | | 1,821,939 | | | | 5,940 | |
Petroleo Brasileiro S.A. | | | 2,098,245 | | | | 23,323 | |
Randon SA Implementos e Participacoes, Preferred(3) | | | 1,271,017 | | | | 6,875 | |
Tim Participacoes S.A. | | | 1,130,867 | | | | 5,233 | |
Totvs SA | | | 463,700 | | | | 7,892 | |
| | | | | | | | |
| | | | | | | 122,454 | |
| CHILE - 0.8% | | | | | | | | |
Empresa Nacional de Telecomunicaciones S.A. | | | 291,448 | | | | 5,607 | |
| | | | | | | | |
| CHINA - 12.6% | | | | | | | | |
Ajisen China Holdings Limited(5) | | | 6,066,913 | | | | 6,946 | |
Chaoda Modern Agriculture (Holdings) Limited(5) | | | 12,474,536 | | | | 2,243 | |
China High Precision Automation Group Ltd.(5) | | | 9,066,000 | | | | 3,440 | |
China Rongsheng Heavy Industries Group Holdings Limited(5) | | | 14,116,500 | | | | 3,725 | |
China Yurun Food Group Limited(5) | | | 3,466,000 | | | | 3,702 | |
CNOOC Limited(5) | | | 6,141,000 | | | | 9,836 | |
Digital China Holdings Limited(5) | | | 3,186,000 | | | | 4,082 | |
GOME Electrical Appliances Holdings Limited(5) | | | 23,878,881 | | | | 5,494 | |
Huabao International Holdings Limited(5) | | | 9,598,322 | | | | 7,824 | |
Huaneng Power International, Inc., H Shares(5) | | | 9,416,700 | | | | 3,899 | |
| | | | | | | | |
| CHINA (CONTINUED) | | | | | | | | |
Mindray Medical International Limited, Class A (DR) | | | 267,384 | | | $ | 6,313 | |
Noah Holdings Ltd. (DR)(4) | | | 437,025 | | | | 4,021 | |
Sinopharm Group Co(5) | | | 2,646,100 | | | | 6,907 | |
Springland International Holdings Ltd.(5) | | | 8,140,000 | | | | 5,211 | |
Tingyi (Cayman Islands) Holding Corporation(5) | | | 1,873,659 | | | | 4,559 | |
Zhuzhou CSR Times Electric Co., Ltd., H Shares(5) | | | 3,597,200 | | | | 5,868 | |
| | | | | | | | |
| | | | | | | 84,070 | |
| COLOMBIA - 0.8% | | | | | | | | |
Grupo de Inversiones Suramericana | | | 312,217 | | | | 5,371 | |
| | | | | | | | |
| EGYPT - 1.1% | | | | | | | | |
Commercial International Bank Egypt SAE(5) | | | 1,023,353 | | | | 3,940 | |
Egyptian Financial Group-Hermes Holding(4)(5) | | | 1,310,634 | | | | 3,712 | |
| | | | | | | | |
| | | | | | | 7,652 | |
| HONG KONG - 0.8% | | | | | | | | |
AIA Group Ltd.(5) | | | 1,866,465 | | | | 5,306 | |
| | | | | | | | |
| HUNGARY - 0.9% | | | | | | | | |
MOL Hungarian Oil and Gas Nyrt., Class A(4)(5) | | | 85,415 | | | | 5,757 | |
| | | | | | | | |
| INDIA - 5.2% | | | | | | | | |
India Cements Limited(5) | | | 2,797,261 | | | | 4,097 | |
Infosys Limited(5) | | | 191,836 | | | | 9,714 | |
Mahindra & Mahindra Ltd.(5) | | | 445,667 | | | | 7,267 | |
Nagarjuna Construction Company Ltd.(5) | | | 2,427,898 | | | | 2,960 | |
Power Finance Corporation(5) | | | 1,425,551 | | | | 4,294 | |
Reliance Infrastructure Ltd.(5) | | | 407,599 | | | | 3,044 | |
Welspun Corporation Ltd.(5) | | | 1,443,002 | | | | 3,206 | |
| | | | | | | | |
| | | | | | | 34,582 | |
| INDONESIA - 5.8% | | | | | | | | |
Indofood CBP Sukses Makmur TBK PT(5) | | | 7,506,000 | | | | 4,163 | |
PT Astra International Tbk(5) | | | 1,915,500 | | | | 13,529 | |
PT Bank Negara Indonesia Tbk(5) | | | 21,423,018 | | | | 8,815 | |
PT Gudang Garam Tbk(5) | | | 1,140,500 | | | | 6,684 | |
PT Telekomunikasi Indonesia Tbk(5) | | | 6,911,385 | | | | 5,929 | |
| | | | | | | | |
| | | | | | | 39,120 | |
| ITALY - 0.6% | | | | | | | | |
Tenaris S.A. (DR) | | | 145,244 | | | | 3,696 | |
14
| | | | | | | | |
| | | Shares
Held | | | Value | |
| | | | | | | | |
| KAZAKHSTAN - 0.8% | | | | | | | | |
KazMunaiGas Exploration Production (DR)(5) | | | 364,211 | | | $ | 5,323 | |
| | | | | | | | |
| KOREA - 11.4% | | | | | | | | |
Daewoo Shipbuilding & Marine Engineering Co., Ltd.(5) | | | 283,904 | | | | 5,309 | |
E-Mart Co., Ltd.(4)(5) | | | 25,390 | | | | 6,351 | |
KB Financial Group, Inc.(5) | | | 267,162 | | | | 8,725 | |
LOCK&LOCK CO., LTD.(5) | | | 213,470 | | | | 5,747 | |
LOCK&LOCK CO., LTD., Rights(5) | | | 18,259 | | | | 78 | |
Samsung Electronics Co., Ltd.(5) | | | 51,699 | | | | 36,216 | |
Shinhan Financial Group Co., Ltd.(5) | | | 293,320 | | | | 10,257 | |
Shinsegae Co., Ltd.(5) | | | 16,330 | | | | 3,717 | |
| | | | | | | | |
| | | | | | | 76,400 | |
| MEXICO - 6.5% | | | | | | | | |
America Movil SAB de C.V., Series L | | | 13,879,775 | | | | 15,413 | |
Genomma Lab Internacional SA(4) | | | 3,088,226 | | | | 5,093 | |
Grupo Financiero Banorte S.A. de C.V., O Shares | | | 1,948,819 | | | | 5,759 | |
Grupo Televisa S.A., Series CPO | | | 1,755,854 | | | | 6,441 | |
OHL Mexico SAB de CV(4) | | | 3,770,100 | | | | 6,089 | |
Urbi, Desarrollos Urbanos, S.A. de C.V.(4) | | | 3,267,259 | | | | 4,403 | |
| | | | | | | | |
| | | | | | | 43,198 | |
| RUSSIA - 5.7% | | | | | | | | |
Eurasia Drilling Company Ltd. (DR)(5) | | | 157,363 | | | | 2,863 | |
Eurasia Drilling Company Ltd., 144A (DR)(5) | | | 26,670 | | | | 485 | |
Globaltrans Investment PLC (DR)(5) | | | 402,853 | | | | 5,447 | |
LSR Group O.J.S.C. (DR)(5) | | | 1,608,262 | | | | 5,847 | |
LUKOIL (DR)(5) | | | 258,310 | | | | 13,004 | |
Magnitogorsk Iron & Steel Works (DR)(5) | | | 872,734 | | | | 4,119 | |
Mobile TeleSystems (DR) | | | 498,796 | | | | 6,135 | |
| | | | | | | | |
| | | | | | | 37,900 | |
| SOUTH AFRICA - 7.8% | | | | | | | | |
African Bank Investments Limited(5) | | | 2,004,829 | | | | 8,151 | |
Harmony Gold Mining Company Limited(5) | | | 713,275 | | | | 8,376 | |
Impala Platinum Holdings Limited(5) | | | 478,095 | | | | 9,691 | |
Mondi Limited(5) | | | 664,461 | | | | 4,710 | |
Mr. Price Group Limited(5) | | | 1,050,178 | | | | 8,716 | |
MTN Group Limited(5) | | | 782,959 | | | | 12,810 | |
| | | | | | | | |
| | | | | | | 52,454 | |
| SWEDEN - 0.7% | | | | | | | | |
Alliance Oil Company Ltd. (DR)(3)(5) | | | 439,223 | | | | 4,663 | |
| | | | | | | | |
| TAIWAN - 11.6% | | | | | | | | |
Chinatrust Financial Holding Company Ltd.(5) | | | 10,091,136 | | | | 5,739 | |
E Ink Holdings Inc.(5) | | | 5,623,000 | | | | 11,661 | |
Far Eastern Textile Ltd.(5) | | | 5,004,213 | | | | 5,098 | |
Hon Hai Precision Industry Co., Ltd.(5) | | | 4,437,921 | | | | 9,907 | |
HTC Corporation(5) | | | 491,251 | | | | 10,792 | |
MediaTek Incorporation(5) | | | 802,794 | | | | 8,747 | |
Taiwan Fertilizer Co., Ltd.(5) | | | 2,376,000 | | | | 5,753 | |
| | | | | | | | |
| TAIWAN (CONTINUED) | | | | | | | | |
Taiwan Semiconductor Manufacturing Company Ltd.(5) | | | 8,811,647 | | | $ | 19,965 | |
| | | | | | | | |
| | | | | | | 77,662 | |
| THAILAND - 1.5% | | | | | | | | |
Bangkok Bank Public Company Limited (DR)(5) | | | 1,406,800 | | | | 6,294 | |
Bumrungrad Hospital Public Company Limited (DR)(5) | | | 3,295,200 | | | | 4,037 | |
| | | | | | | | |
| | | | | | | 10,331 | |
| TURKEY - 3.9% | | | | | | | | |
Bizim Toptan Satis Magazalari AS(5) | | | 92,628 | | | | 1,085 | |
Cimsa Cimento Sanayi ve Ticaret A.S.(5) | | | 668,518 | | | | 2,695 | |
Emlak Konut Gayrimenkul Yatirim(5) | | | 3,814,768 | | | | 4,895 | |
Ford Otomotiv Sanayi A.S.(5) | | | 736,431 | | | | 5,134 | |
Tekfen Holding A.S.(5) | | | 1,072,086 | | | | 3,274 | |
Turk Ekonomi Bankasi A.S.(5) | | | 3,919,348 | | | | 3,504 | |
Turkiye Sinai Kalkinma Bankasi A.S.(5) | | | 5,422,974 | | | | 5,781 | |
| | | | | | | | |
| | | | | | | 26,368 | |
| UNITED ARAB EMIRATES - 0.6% | | | | | | | | |
Air Arabia(5) | | | 21,440,109 | | | | 3,663 | |
| | | | | | | | |
| UNITED KINGDOM - 0.7% | | | | | | | | |
Antofagasta plc(5) | | | 336,587 | | | | 4,779 | |
| | | | | | | | |
Total common and preferred stocks
(Cost $846,000) | | | | | | | 656,356 | |
| | |
| | | Par
Amount | | | | |
SHORT-TERM INVESTMENTS
(CASH EQUIVALENTS) - 1.1% | | | | | |
Repurchase agreement with Fixed Income Clearing Corporation, 0.01%, dated 9/30/11, due 10/3/11, maturity value $7,346
(Cost $7,346)(6) | | $ | 7,346 | | | $ | 7,346 | |
| | | | | | | | |
| | | | | | | | |
Total investments - 99.2%
(Cost $853,346) | | | | | | | 663,702 | |
| | | | | | | | |
Other assets less liabilities - 0.8% | | | | | | | 5,577 | |
| | | | | | | | |
| | | | | | | | |
Total net assets - 100.0%(7) | | | | | | $ | 669,279 | |
| | | | | | | | |
15
| (1) | The shares of Banco do Brasil S.A. and Julio Simoes Logistica SA were acquired in a private placement and are restricted. The shares of Banco do Brasil S.A. and Julio Simoes Logistica SA are freely tradeable outside the United States, where the Fund expects to trade them. |
| | | | | | | | | | | | | | | | |
Security | | Acquisition
Dates | | | Cost | | | Value | | | Percentage
of Total
Net Assets | |
Banco do Brasil S.A. | | | 7/1/2010 | | | $ | 1,477 | | | $ | 1,427 | | | | 0.2 | % |
Julio Simoes Logistica SA | | | 4/20/2010 | | | | 1,339 | | | | 1,372 | | | | 0.2 | % |
| | | | | | | | | | | | | | | | |
| | | | | | | | | | $ | 2,799 | | | | 0.4 | % |
| | | | | | | | | | | | | | | | |
| (2) | Security has been determined to be illiquid under procedures established by the board of directors of Artisan Funds. In total, the value of securities determined to be illiquid were $2,799, or 0.4% of total net assets. |
| (4) | Non-incoming producing shares. |
| (5) | Valued at fair value in accordance with procedures established by the board of directors of Artisan Funds. In total, securities valued at a fair value were $459,561, or 68.7% of total net assets. See notes 2(a) and 2(b) in Notes to Financial Statements for additional information. |
| | | | | | | | | | | | |
Issuer | | Rate | | | Maturity | | | Value | |
U.S. Treasury Note | | | 2.625 | % | | | 11/15/2020 | | | $ | 7,494 | |
| (7) | Percentages for the various classifications relate to total net assets. |
Company names are as reported by a data service provider and in some cases are translations; a company’s legal name may be different.
(DR) Depositary Receipt, voting rights may vary.
| | | | | | | | |
PORTFOLIO DIVERSIFICATION - September 30, 2011 Dollar values in thousands | |
| | | Value | | | Percentage
of Total
Net Assets | |
Consumer Discretionary | | $ | 80,553 | | | | 12.0 | % |
Consumer Staples | | | 34,849 | | | | 5.2 | |
Energy | | | 68,950 | | | | 10.3 | |
Financials | | | 120,722 | | | | 18.0 | |
Healthcare | | | 22,350 | | | | 3.4 | |
Industrials | | | 51,844 | | | | 7.8 | |
Information Technology | | | 122,416 | | | | 18.3 | |
Materials | | | 89,933 | | | | 13.4 | |
Telecommunication Services | | | 51,127 | | | | 7.7 | |
Utilities | | | 13,612 | | | | 2.0 | |
| | | | | | | | |
Total common and preferred stocks | | | 656,356 | | | | 98.1 | |
Short-term investments | | | 7,346 | | | | 1.1 | |
| | | | | | | | |
Total investments | | | 663,702 | | | | 99.2 | |
Other assets less liabilities | | | 5,577 | | | | 0.8 | |
| | | | | | | | |
Total net assets | | $ | 669,279 | | | | 100.0 | % |
| | | | | | | | |
| | | | | | | | |
CURRENCY EXPOSURE - September 30, 2011 Dollar values in thousands | |
| | | Value | | | Percentage
of Total
Investments | |
Brazilian real | | $ | 122,454 | | | | 18.4 | % |
British pound | | | 4,779 | | | | 0.7 | |
Chilean peso | | | 5,607 | | | | 0.8 | |
Colombian peso | | | 5,371 | | | | 0.8 | |
Egyptian pound | | | 7,652 | | | | 1.2 | |
Hong Kong dollar | | | 79,042 | | | | 11.9 | |
Hungarian forint | | | 5,757 | | | | 0.9 | |
Indian rupee | | | 34,582 | | | | 5.2 | |
Indonesian rupiah | | | 39,120 | | | | 5.9 | |
Korean won | | | 76,400 | | | | 11.5 | |
Mexican peso | | | 43,198 | | | | 6.5 | |
South African rand | | | 52,454 | | | | 7.9 | |
Swedish krona | | | 4,663 | | | | 0.7 | |
Taiwan dollar | | | 77,662 | | | | 11.7 | |
Thai baht | | | 10,331 | | | | 1.6 | |
Turkish lira | | | 26,368 | | | | 4.0 | |
U.S. dollar | | | 64,599 | | | | 9.7 | |
United Arab Emirates dirham | | | 3,663 | | | | 0.6 | |
| | | | | | | | |
Total investments | | $ | 663,702 | | | | 100.0 | % |
| | | | | | | | |
| | | | | | |
| TOP TEN HOLDINGS - September 30, 2011 | |
Company Name | | Country | | Percentage
of Total
Net Assets | |
Samsung Electronics Co., Ltd. | | Korea | | | 5.4 | % |
Petroleo Brasileiro S.A. | | Brazil | | | 3.5 | |
Companhia Vale do Rio Doce | | Brazil | | | 3.3 | |
Taiwan Semiconductor Manufacturing Company Ltd. | | Taiwan | | | 3.0 | |
America Movil SAB de C.V. | | Mexico | | | 2.3 | |
PT Astra International Tbk | | Indonesia | | | 2.0 | |
LUKOIL | | Russia | | | 1.9 | |
MTN Group Limited | | South Africa | | | 1.9 | |
E Ink Holdings Inc. | | Taiwan | | | 1.7 | |
HTC Corporation | | Taiwan | | | 1.6 | |
| | | | | | |
Total | | | | | 26.6 | % |
| | | | | | |
For the purpose of determining the Fund’s top ten holdings, securities of the same issuer are aggregated to determine the weight in the Fund.
The accompanying notes are an integral part of the financial statements.
16
ARTISAN GROWTH OPPORTUNITIES FUND
Schedule of Investments – September 30, 2011
Dollar values in thousands
| | | | | | | | |
| | | Shares
Held | | | Value | |
| | | | | | | | |
| COMMON STOCKS - 92.0% | | | | | | | | |
| | | | | | | | |
| BRAZIL - 6.3% | | | | | | | | |
Anhanguera Educacional Participacoes SA | | | 101,900 | | | $ | 1,312 | |
BR Malls Participacoes | | | 122,500 | | | | 1,252 | |
Mills Estruturas e Servicos de Engenharia SA | | | 375,550 | | | | 3,855 | |
OdontoPrev SA | | | 231,550 | | | | 3,422 | |
| | | | | | | | |
| | | | | | | 9,841 | |
| CANADA - 0.7% | | | | | | | | |
Tourmaline Oil Corp.(1) | | | 39,900 | | | | 1,173 | |
| | | | | | | | |
| CHINA - 5.9% | | | | | | | | |
Baidu, Inc., Class A (DR)(1) | | | 33,100 | | | | 3,539 | |
Ctrip.com International, Ltd. (DR)(1) | | | 61,602 | | | | 1,981 | |
Shandong Weigao Group Medical Polymer Company Limited, H Shares(2) | | | 1,777,900 | | | | 1,986 | |
Tsingtao Brewery Company Limited, H Shares(2) | | | 300,800 | | | | 1,625 | |
| | | | | | | | |
| | | | | | | 9,131 | |
| HONG KONG - 1.3% | | | | | | | | |
Wynn Macau Limited(2) | | | 856,269 | | | | 1,968 | |
| | | | | | | | |
| INDIA - 3.2% | | | | | | | | |
HDFC Bank Limited (DR) | | | 96,900 | | | | 2,825 | |
Jubilant Foodworks Limited(1)(2) | | | 132,325 | | | | 2,139 | |
| | | | | | | | |
| | | | | | | 4,964 | |
| JAPAN - 1.9% | | | | | | | | |
FANUC CORP.(2) | | | 21,200 | | | | 2,919 | |
| | | | | | | | |
| SWEDEN - 3.4% | | | | | | | | |
Hexagon AB, Class B(2) | | | 222,645 | | | | 2,898 | |
Telefonaktiebolaget LM Ericsson (DR), Class B | | | 253,500 | | | | 2,421 | |
| | | | | | | | |
| | | | | | | 5,319 | |
| SWITZERLAND - 1.7% | | | | | | | | |
Compagnie Financiere Richemont SA - Bearer Shares(2) | | | 59,350 | | | | 2,635 | |
| | | | | | | | |
| TURKEY - 1.8% | | | | | | | | |
Coca-Cola Icecek AS(2) | | | 209,367 | | | | 2,843 | |
| | | | | | | | |
| UNITED KINGDOM - 4.5% | | | | | | | | |
ARM Holdings PLC(2) | | | 272,250 | | | | 2,330 | |
Rotork plc(2) | | | 123,600 | | | | 2,975 | |
The Weir Group PLC(2) | | | 73,000 | | | | 1,749 | |
| | | | | | | | |
| | | | | | | 7,054 | |
| | | | | | | | |
| UNITED STATES - 61.3% | | | | | | | | |
Agilent Technologies, Inc.(1) | | | 130,613 | | | $ | 4,082 | |
Allergan, Inc. | | | 83,225 | | | | 6,856 | |
Apple Inc.(1) | | | 20,975 | | | | 7,995 | |
Baker Hughes Incorporated | | | 60,800 | | | | 2,807 | |
Biogen Idec Inc.(1) | | | 31,000 | | | | 2,888 | |
Broadcom Corporation, Class A | | | 105,300 | | | | 3,505 | |
Cerner Corporation(1) | | | 72,058 | | | | 4,937 | |
Citrix Systems, Inc.(1) | | | 62,050 | | | | 3,384 | |
Discover Financial Services | | | 189,800 | | | | 4,354 | |
eBay Inc.(1) | | | 57,600 | | | | 1,699 | |
EMC Corporation(1) | | | 268,700 | | | | 5,640 | |
Google Inc., Class A(1) | | | 13,520 | | | | 6,954 | |
IHS Inc.(1) | | | 72,400 | | | | 5,416 | |
Monsanto Company | | | 105,000 | | | | 6,304 | |
National Oilwell Varco, Inc. | | | 70,750 | | | | 3,624 | |
Occidental Petroleum Corporation | | | 40,450 | | | | 2,892 | |
Polo Ralph Lauren Corporation, Class A | | | 30,050 | | | | 3,897 | |
Precision Castparts Corp. | | | 25,375 | | | | 3,945 | |
Regeneron Pharmaceuticals, Inc.(1) | | | 72,300 | | | | 4,208 | |
salesforce.com, inc.(1) | | | 16,300 | | | | 1,863 | |
Starbucks Corporation | | | 179,202 | | | | 6,682 | |
Teradata Corporation(1) | | | 28,400 | | | | 1,520 | |
| | | | | | | | |
| | | | | | | 95,452 | |
| | | | | | | | |
Total common stocks
(Cost $140,466) | | | | | | | 143,299 | |
| | |
| | | Par
Amount | | | | |
SHORT-TERM INVESTMENTS
(CASH EQUIVALENTS) - 6.6% | | | | | | | | |
Repurchase agreement with Fixed Income Clearing Corporation, 0.01%, dated 9/30/11, due 10/3/11, maturity value $10,298
(Cost $10,298)(3) | | $ | 10,298 | | | $ | 10,298 | |
| | | | | | | | |
| | | | | | | | |
Total investments - 98.6%
(Cost $150,764) | | | | | | | 153,597 | |
| | | | | | | | |
Other assets less liabilities - 1.4% | | | | | | | 2,130 | |
| | | | | | | | |
| | | | | | | | |
Total net assets - 100.0%(4) | | | | | | $ | 155,727 | |
| | | | | | | | |
17
| (1) | Non-income producing security. |
| (2) | Valued at a fair value in accordance with procedures established by the board of directors of Artisan Funds. In total, securities valued at a fair value were $26,067 or 16.7% of total net assets. See notes 2(a) and 2(b) in Notes to Financial Statements for additional information. |
| | | | | | | | | | | | |
Issuer | | Rate | | | Maturity | | | Value | |
U.S. Treasury Bond | | | 4.625 | % | | | 2/15/2040 | | | $ | 10,504 | |
| (4) | Percentages for the various classifications relate to total net assets. |
Company names are as reported by a data service provider and in some cases are translations; a company’s legal name may be different.
(DR) Depositary Receipt, voting rights may vary.
| | | | | | | | | | | | | | | | | | | | |
| FOREIGN CURRENCY FORWARD CONTRACTS | |
Dollar values in thousands | |
Description | | Counterparty | | Trans-
action
Type | | Settlement
Date | | | Cost on
Origination
Date | | | Value | | | Unrealized
Appreciation | |
| Japanese Yen | | State Street Bank and Trust Company | | Sell | | | 11/17/2011 | | | $ | 1,350 | | | $ | 1,345 | | | $ | 5 | |
| | | | | | | | |
| PORTFOLIO DIVERSIFICATION - September 30, 2011 | |
Dollar values in thousands | |
| | | Value | | | Percentage
of Total
Net Assets | |
Consumer Discretionary | | $ | 20,614 | | | | 13.2 | % |
Consumer Staples | | | 4,468 | | | | 2.9 | |
Energy | | | 10,496 | | | | 6.7 | |
Financials | | | 8,431 | | | | 5.4 | |
Healthcare | | | 28,379 | | | | 18.2 | |
Industrials | | | 20,859 | | | | 13.4 | |
Information Technology | | | 43,748 | | | | 28.1 | |
Materials | | | 6,304 | | | | 4.1 | |
| | | | | | | | |
Total common stocks | | | 143,299 | | | | 92.0 | |
Short-term investments | | | 10,298 | | | | 6.6 | |
| | | | | | | | |
Total investments | | | 153,597 | | | | 98.6 | |
Other assets less liabilities | | | 2,130 | | | | 1.4 | |
| | | | | | | | |
Total net assets | | $ | 155,727 | | | | 100.0 | % |
| | | | | | | | |
| | | | | | | | |
| CURRENCY EXPOSURE - September 30, 2011 | |
Dollar values in thousands | |
| | | Value | | | Percentage
of Total
Investments | |
Brazilian real | | $ | 9,841 | | | | 6.4 | % |
British pound | | | 7,054 | | | | 4.6 | |
Canadian dollar | | | 1,173 | | | | 0.8 | |
Hong Kong dollar | | | 5,579 | | | | 3.6 | |
Indian rupee | | | 2,139 | | | | 1.4 | |
Japanese yen | | | 2,919 | | | | 1.9 | |
Swedish krona | | | 2,898 | | | | 1.9 | |
Swiss franc | | | 2,635 | | | | 1.7 | |
Turkish lira | | | 2,843 | | | | 1.8 | |
U.S. dollar | | | 116,516 | | | | 75.9 | |
| | | | | | | | |
Total investments | | $ | 153,597 | | | | 100.0 | % |
| | | | | | | | |
| | | | | | |
| TOP TEN HOLDINGS - September 30, 2011 | |
Company Name | | Country | | Percentage
of Total
Net Assets | |
Apple Inc. | | United States | | | 5.1 | % |
Google Inc. | | United States | | | 4.5 | |
Allergan, Inc. | | United States | | | 4.4 | |
Starbucks Corporation | | United States | | | 4.3 | |
Monsanto Company | | United States | | | 4.0 | |
EMC Corporation | | United States | | | 3.6 | |
IHS Inc. | | United States | | | 3.5 | |
Cerner Corporation | | United States | | | 3.2 | |
Discover Financial Services | | United States | | | 2.8 | |
Regeneron Pharmaceuticals, Inc. | | United States | | | 2.7 | |
| | | | | | |
Total | | | | | 38.1 | % |
| | | | | | |
For the purpose of determining the Fund’s top ten holdings, securities of the same issuer are aggregated to determine the weight in the Fund.
The accompanying notes are an integral part of the financial statements.
18
ARTISAN INTERNATIONAL FUND
Schedule of Investments – September 30, 2011
Dollar values in thousands
| | | | | | | | |
| | | Shares
Held | | | Value | |
| | | | | | | | |
| COMMON STOCKS - 96.4% | | | | | | | | |
| | | | | | | | |
| AUSTRALIA - 3.1% | | | | | | | | |
Asciano Ltd(1) | | | 49,436,719 | | | $ | 68,046 | |
Coca-Cola Amatil Limited(1) | | | 1,052,858 | | | | 12,047 | |
Foster’s Group Limited(1) | | | 25,432,636 | | | | 129,113 | |
Treasury Wine Estates(1) | | | 8,697,648 | | | | 32,163 | |
| | | | | | | | |
| | | | | | | 241,369 | |
| BELGIUM - 4.6% | | | | | | | | |
Anheuser-Busch InBev NV(1) | | | 6,845,441 | | | | 363,037 | |
| | | | | | | | |
| BRAZIL - 1.0% | | | | | | | | |
Petroleo Brasileiro S.A. (DR) | | | 3,455,548 | | | | 77,577 | |
| | | | | | | | |
| CANADA - 3.2% | | | | | | | | |
Canadian National Railway Company | | | 696,160 | | | | 46,350 | |
Canadian Pacific Railway Limited | | | 4,239,583 | | | | 203,882 | |
| | | | | | | | |
| | | | | | | 250,232 | |
| CHINA - 4.1% | | | | | | | | |
Baidu, Inc., Class A (DR)(2) | | | 1,967,771 | | | | 210,374 | |
Beijing Enterprises Holdings Ltd.(1) | | | 7,931,853 | | | | 39,691 | |
China Mobile Limited(1) | | | 1,648,500 | | | | 16,087 | |
China Resources Land Limited(1) | | | 34,262,700 | | | | 35,959 | |
MGM China Holdings Ltd.(1)(2) | | | 16,200,400 | | | | 20,981 | |
| | | | | | | | |
| | | | | | | 323,092 | |
| FRANCE - 11.1% | | | | | | | | |
Air Liquide SA(1) | | | 396,988 | | | | 46,423 | |
BNP Paribas(1) | | | 1,669,512 | | | | 66,083 | |
DANONE S.A.(1) | | | 1,934,859 | | | | 119,074 | |
LVMH Moet Hennessy Louis Vuitton SA(1) | | | 348,730 | | | | 46,244 | |
Pernod Ricard SA(1) | | | 2,346,610 | | | | 183,994 | |
Publicis Groupe(1) | | | 1,346,780 | | | | 56,385 | |
Schneider Electric SA(1) | | | 1,779,804 | | | | 95,822 | |
Societe Generale(1) | | | 63,234 | | | | 1,657 | |
Technip SA(1) | | | 192,686 | | | | 15,420 | |
Unibail-Rodamco(1) | | | 894,650 | | | | 159,446 | |
Vinci SA(1) | | | 1,801,612 | | | | 77,360 | |
| | | | | | | | |
| | | | | | | 867,908 | |
| GERMANY - 10.8% | | | | | | | | |
BASF AG(1) | | | 462,331 | | | | 28,052 | |
Bayer AG(1) | | | 2,786,103 | | | | 153,113 | |
Beiersdorf AG(1) | | | 1,540,904 | | | | 82,520 | |
Brenntag AG(1) | | | 974,859 | | | | 84,769 | |
Daimler AG(1) | | | 2,512,796 | | | | 111,303 | |
| | | | | | | | |
| GERMANY (CONTINUED) | | | | | | | | |
Linde AG(1) | | | 2,176,886 | | | $ | 290,337 | |
Siemens AG(1) | | | 1,018,573 | | | | 92,020 | |
| | | | | | | | |
| | | | | | | 842,114 | |
| HONG KONG - 15.3% | | | | | | | | |
AIA Group Ltd.(1) | | | 76,791,700 | | | | 218,325 | |
BOC Hong Kong (Holdings) Limited(1) | | | 17,464,450 | | | | 36,725 | |
Cheung Kong (Holdings) Limited(1) | | | 6,027,013 | | | | 64,520 | |
Galaxy Entertainment Group Limited(1)(2) | | | 18,992,324 | | | | 26,681 | |
Hang Seng Bank Limited(1) | | | 5,367,677 | | | | 62,899 | |
Henderson Land Development Company Limited(1) | | | 14,134,700 | | | | 62,793 | |
Hongkong Land Holdings Limited(1) | | | 10,162,926 | | | | 44,994 | |
NWS Holdings Limited(1) | | | 35,434,846 | | | | 47,117 | |
Sands China Ltd.(1)(2) | | | 135,974,230 | | | | 312,739 | |
Sino Land Company Limited(1) | | | 71,510,690 | | | | 95,136 | |
Sun Hung Kai Properties Limited(1) | | | 7,827,400 | | | | 88,685 | |
Wynn Macau Limited(1) | | | 58,315,598 | | | | 134,007 | |
| | | | | | | | |
| | | | | | | 1,194,621 | |
| INDIA - 1.1% | | | | | | | | |
Coal India Limited(1) | | | 1,912,534 | | | | 12,876 | |
Housing Development Finance Corporation Ltd.(1) | | | 5,598,354 | | | | 72,392 | |
| | | | | | | | |
| | | | | | | 85,268 | |
| ITALY - 0.9% | | | | | | | | |
Fiat Industrial SpA(1)(2) | | | 10,041,047 | | | | 74,870 | |
| | | | | | | | |
| JAPAN - 11.9% | | | | | | | | |
BRIDGESTONE CORPORATION(1) | | | 3,975,800 | | | | 90,149 | |
HONDA MOTOR CO., LTD.(1) | | | 6,737,200 | | | | 197,535 | |
JAPAN TOBACCO INC.(1) | | | 61,717 | | | | 287,939 | |
Kao Corporation(1) | | | 4,887,500 | | | | 135,953 | |
MITSUI & CO., LTD.(1) | | | 2,717,514 | | | | 39,333 | |
SOFTBANK Corp(1) | | | 6,169,400 | | | | 180,596 | |
| | | | | | | | |
| | | | | | | 931,505 | |
| KOREA - 0.9% | | | | | | | | |
NHN Corp.(1)(2) | | | 391,813 | | | | 73,868 | |
| | | | | | | | |
| NETHERLANDS - 5.4% | | | | | | | | |
Akzo Nobel N.V.(1) | | | 2,721,854 | | | | 120,327 | |
Koninklijke Vopak NV(1) | | | 558,508 | | | | 26,757 | |
Unilever NV (DR)(1) | | | 8,815,121 | | | | 279,210 | |
| | | | | | | | |
| | | | | | | 426,294 | |
19
| | | | | | | | |
| | | Shares
Held | | | Value | |
| | | | | | | | |
| NIGERIA - 0.0%(3) | | | | | | | | |
Nigerian Breweries Plc. | | | 165,343 | | | $ | 83 | |
| | | | | | | | |
| RUSSIA - 0.8% | | | | | | | | |
Gazprom (DR)(1) | | | 6,999,487 | | | | 66,953 | |
| | | | | | | | |
| SINGAPORE - 0.9% | | | | | | | | |
City Developments Limited(1) | | | 2,905,730 | | | | 21,093 | |
Genting Singapore PLC(1)(2) | | | 42,552,571 | | | | 49,451 | |
| | | | | | | | |
| | | | | | | 70,544 | |
| SWEDEN - 0.5% | | | | | | | | |
Sandvik AB(1) | | | 3,245,047 | | | | 37,276 | |
| | | | | | | | |
| SWITZERLAND - 8.9% | | | | | | | | |
Adecco SA(1) | | | 1,983,903 | | | | 77,795 | |
Compagnie Financiere Richemont SA - Bearer Shares(1) | | | 1,788,519 | | | | 79,394 | |
Givaudan SA(1) | | | 87,410 | | | | 68,287 | |
Nestle SA(1) | | | 5,495,819 | | | | 302,107 | |
Swatch Group AG - Bearer Shares(1) | | | 505,302 | | | | 165,596 | |
| | | | | | | | |
| | | | | | | 693,179 | |
| UNITED KINGDOM - 10.0% | | | | | | | | |
BG Group plc(1) | | | 1,985,494 | | | | 37,808 | |
GlaxoSmithKline PLC(1) | | | 1,004,473 | | | | 20,739 | |
Imperial Tobacco Group plc(1) | | | 4,759,812 | | | | 160,741 | |
Johnson Matthey PLC(1) | | | 1,532,331 | | | | 37,507 | |
Land Securities Group plc(1) | | | 5,196,611 | | | | 51,761 | |
Prudential plc(1) | | | 2,695,802 | | | | 23,074 | |
Reckitt Benckiser Group PLC(1) | | | 114,937 | | | | 5,866 | |
Royal Dutch Shell PLC, Class A(1) | | | 1,484,429 | | | | 45,834 | |
SABMiller plc(1) | | | 2,950,553 | | | | 95,899 | |
Standard Chartered plc(1) | | | 2,690,586 | | | | 53,702 | |
Tate & Lyle PLC(1) | | | 4,970,259 | | | | 48,084 | |
WPP plc(1) | | | 21,584,874 | | | | 199,059 | |
| | | | | | | | |
| | | | | | | 780,074 | |
| UNITED STATES - 1.9% | | | | | | | | |
Accenture plc, Class A | | | 1,144,077 | | | | 60,270 | |
Schlumberger Limited | | | 1,459,357 | | | | 87,167 | |
| | | | | | | | |
| | | | | | | 147,437 | |
| | | | | | | | |
Total common stocks
(Cost $7,850,584) | | | | | | | 7,547,301 | |
SHORT-TERM INVESTMENTS
(CASH EQUIVALENTS) - 3.2% | | | | | | | | |
Repurchase agreement with Fixed Income Clearing Corporation, 0.01%, dated 9/30/11, due 10/3/11, maturity value $128,934
(Cost $246,213)(4) | | $ | 246,213 | | | $ | 246,213 | |
| | | | | | | | |
| | | | | | | | |
Total investments - 99.6%
(Cost $8,096,797) | | | | | | | 7,793,514 | |
| | | | | | | | |
Other assets less liabilities - 0.4% | | | | | | | 32,894 | |
| | | | | | | | |
| | | | | | | | |
Total net assets - 100.0%(5) | | | | | | $ | 7,826,408 | |
| | | | | | | | |
| (1) | Valued at a fair value in accordance with procedures established by the board of directors of Artisan Funds. In total, securities valued at a fair value were $6,861,598 or 87.7% of total net assets. See notes 2(a) and 2(b) in Notes to Financial Statements for additional information. |
| (2) | Non-income producing security. |
| (3) | Represents less than 0.1% of total net assets. |
| | | | | | | | | | | | |
lssuer | | Rate | | | Maturity | | | Value | |
U.S. Treasury Bond | | | 4.625 | % | | | 2/15/2040 | | | $ | 251,141 | |
| (5) | Percentages for the various classifications relate to total net assets. |
Company names are as reported by a data service provider and in some cases are translations; a company’s legal name may be different.
(DR) Depositary Receipt, voting rights may vary.
| | | | | | | | |
| PORTFOLIO DIVERSIFICATION - September 30, 2011 | |
Dollar values in thousands | | | | | | | | |
| | | Value | | | Percentage
of Total
Net Assets | |
Consumer Discretionary | | $ | 1,489,524 | | | | 19.0 | % |
Consumer Staples | | | 2,237,830 | | | | 28.6 | |
Energy | | | 343,635 | | | | 4.4 | |
Financials | | | 1,159,244 | | | | 14.8 | |
Healthcare | | | 173,852 | | | | 2.2 | |
Industrials | | | 1,011,088 | | | | 12.9 | |
Information Technology | | | 344,512 | | | | 4.4 | |
Materials | | | 590,933 | | | | 7.6 | |
Telecommunication Services | | | 196,683 | | | | 2.5 | |
| | | | | | | | |
Total common stocks | | | 7,547,301 | | | | 96.4 | |
Short-term investments | | | 246,213 | | | | 3.2 | |
| | | | | | | | |
Total investments | | | 7,793,514 | | | | 99.6 | |
Other assets less liabilities | | | 32,894 | | | | 0.4 | |
| | | | | | | | |
Total net assets | | $ | 7,826,408 | | | | 100.0 | % |
| | | | | | | | |
20
| | | | | | | | |
| CURRENCY EXPOSURE - September 30, 2011 | |
Dollar values in thousands | | | | | | | | |
| | | Value | | | Percentage
of Total
Investments | |
Australian dollar | | $ | 241,369 | | | | 3.1 | % |
British pound | | | 734,240 | | | | 9.4 | |
Euro | | | 2,620,057 | | | | 33.6 | |
Hong Kong dollar | | | 1,262,345 | | | | 16.2 | |
Indian rupee | | | 85,268 | | | | 1.1 | |
Japanese yen | | | 931,505 | | | | 12.0 | |
Korean won | | | 73,868 | | | | 0.9 | |
Nigerian naira | | | 83 | | | | 0.0 | (1) |
Singapore dollar | | | 70,544 | | | | 0.9 | |
Swedish krona | | | 37,276 | | | | 0.5 | |
Swiss franc | | | 693,179 | | | | 8.9 | |
U.S. dollar | | | 1,043,780 | | | | 13.4 | |
| | | | | | | | |
Total investments | | $ | 7,793,514 | | | | 100.0 | % |
| | | | | | | | |
| (1) | Represents less than 0.1% of total investments. |
| | | | | | |
| TOP TEN HOLDINGS - September 30, 2011 | |
Company Name | | Country | | Percentage
of Total
Net Assets | |
Anheuser-Busch InBev NV | | Belgium | | | 4.6 | % |
Sands China Ltd. | | Hong Kong | | | 4.0 | |
Nestle SA | | Switzerland | | | 3.9 | |
Linde AG | | Germany | | | 3.7 | |
JAPAN TOBACCO INC. | | Japan | | | 3.7 | |
Unilever NV | | Netherlands | | | 3.6 | |
AIA Group Ltd. | | Hong Kong | | | 2.8 | |
Baidu, Inc. | | China | | | 2.7 | |
Canadian Pacific Railway Limited | | Canada | | | 2.6 | |
WPP plc | | United Kingdom | | | 2.5 | |
| | | | | | |
Total | | | | | 34.1 | % |
| | | | | | |
For the purpose of determining the Fund’s top ten holdings, securities of the same issuer are aggregated to determine the weight in the Fund.
The accompanying notes are an integral part of the financial statements.
21
ARTISAN INTERNATIONAL VALUE FUND
Schedule of Investments – September 30, 2011
Dollar values in thousands
| | | | | | | | |
| | | Shares
Held | | | Value | |
| | | | | | | | |
| COMMON STOCKS - 95.6% | | | | | | | | |
| | | | | | | | |
| BELGIUM - 1.9% | | | | | | | | |
Groupe Bruxelles Lambert S.A.(1) | | | 1,144,756 | | | $ | 80,558 | |
| | | | | | | | |
| DENMARK - 1.6% | | | | | | | | |
Carlsberg A/S, Class B(1) | | | 1,160,705 | | | | 68,848 | |
| | | | | | | | |
| FRANCE - 9.8% | | | | | | | | |
Gemalto NV(1) | | | 402,447 | | | | 19,186 | |
Publicis Groupe(1) | | | 3,108,322 | | | | 130,135 | |
Societe Television Francaise 1(1) | | | 2,493,791 | | | | 30,986 | |
Sodexo(1) | | | 650,082 | | | | 42,836 | |
Sodexo - Registered Shares(1)(7) | | | 1,284,779 | | | | 84,659 | |
Total SA(1) | | | 2,532,970 | | | | 111,680 | |
| | | | | | | | |
| | | | | | | 419,482 | |
| GERMANY - 2.5% | | | | | | | | |
HeidelbergCement AG(1) | | | 2,938,597 | | | | 106,206 | |
| | | | | | | | |
| HONG KONG - 1.7% | | | | | | | | |
Guoco Group Limited(1) | | | 7,896,737 | | | | 71,507 | |
| | | | | | | | |
| IRELAND - 3.6% | | | | | | | | |
ICON PLC (DR)(2)(3) | | | 2,871,675 | | | | 46,177 | |
Ryanair Holdings PLC, Equity-Linked Security, 144A(1)(2)(4)(5)(6) | | | 24,712,760 | | | | 109,313 | |
| | | | | | | | |
| | | | | | | 155,490 | |
| JAPAN - 14.5% | | | | | | | | |
Aderans Co., Ltd.(1)(2)(3) | | | 2,420,067 | | | | 22,437 | |
Credit Saison Co., Ltd.(1) | | | 6,929,859 | | | | 133,361 | |
Daiwa Securities Group Inc.(1) | | | 11,011,748 | | | | 41,089 | |
Kao Corporation(1) | | | 5,093,600 | | | | 141,686 | |
Mitsubishi UFJ Financial Group, Inc.(1)(6) | | | 3,654,200 | | | | 16,424 | |
Mitsubishi UFJ Financial Group, Inc.(1) | | | 12,559,582 | | | | 56,450 | |
NIFCO INC.(1) | | | 1,032,900 | | | | 26,473 | |
SANKYO CO., LTD.(1) | | | 1,471,638 | | | | 79,392 | |
SEINO HOLDINGS CO., LTD.(1) | | | 2,550,800 | | | | 20,709 | |
Stanley Electric Co., Ltd.(1) | | | 5,343,300 | | | | 80,710 | |
| | | | | | | | |
| | | | | | | 618,731 | |
| NETHERLANDS - 6.7% | | | | | | | | |
ING Groep N.V.(1)(2) | | | 14,025,601 | | | | 98,712 | |
Koninklijke Ahold NV(1) | | | 6,895,959 | | | | 81,084 | |
Koninklijke Philips Electronics N.V.(1) | | | 6,060,429 | | | | 108,486 | |
| | | | | | | | |
| | | | | | | 288,282 | |
| | | | | | | | |
| SWITZERLAND - 11.2% | | | | | | | | |
Adecco SA(1) | | | 1,769,230 | | | $ | 69,377 | |
Nestle SA(1) | | | 1,055,703 | | | | 58,032 | |
Novartis AG(1) | | | 2,875,346 | | | | 160,472 | |
Panalpina Welttransport Holding AG(1)(2) | | | 1,093,317 | | | | 93,035 | |
Pargesa Holding SA - Bearer Shares(1) | | | 1,359,825 | | | | 92,942 | |
Tamedia AG(1)(2) | | | 29,467 | | | | 3,832 | |
| | | | | | | | |
| | | | | | | 477,690 | |
| THAILAND - 0.5% | | | | | | | | |
Thai Beverage Public Company Limited(1) | | | 112,795,183 | | | | 21,934 | |
| | | | | | | | |
| UNITED KINGDOM - 24.6% | | | | | | | | |
BAE Systems plc(1) | | | 6,016,491 | | | | 24,804 | |
Carpetright PLC(1) | | | 2,956,377 | | | | 22,647 | |
Compass Group PLC(1) | | | 28,032,023 | | | | 226,680 | |
Diageo plc(1) | | | 6,368,535 | | | | 121,166 | |
Experian PLC(1) | | | 7,183,210 | | | | 80,813 | |
Lancashire Holdings Ltd(1) | | | 3,425,355 | | | | 36,678 | |
Lloyds Banking Group plc(1)(2) | | | 140,810,098 | | | | 74,666 | |
Michael Page International plc(1) | | | 7,922,419 | | | | 45,068 | |
Qinetiq Group PLC(1)(3) | | | 62,402,252 | | | | 112,477 | |
Reed Elsevier PLC(1) | | | 18,618,505 | | | | 141,838 | |
Savills Plc(1)(3) | | | 9,951,406 | | | | 44,068 | |
Unilever PLC (DR) | | | 3,923,853 | | | | 122,385 | |
| | | | | | | | |
| | | | | | | 1,053,290 | |
| UNITED STATES - 17.0% | | | | | | | | |
Accenture plc, Class A | | | 1,633,267 | | | | 86,041 | |
Arch Capital Group Ltd.(2)(3) | | | 5,572,034 | | | | 182,066 | |
Covidien plc | | | 2,988,380 | | | | 131,788 | |
Signet Jewelers Ltd.(2) | | | 3,882,479 | | | | 131,228 | |
TE Connectivity Ltd. | | | 6,920,314 | | | | 194,738 | |
| | | | | | | | |
| | | | | | | 725,861 | |
| | | | | | | | |
Total common stocks
(Cost $4,117,862) | | | | | | | 4,087,879 | |
22
| | | | | | | | |
| | | Par
Amount | | | Value | |
| | | | | | | | |
SHORT-TERM INVESTMENTS
(CASH EQUIVALENTS) - 3.0% | | | | | |
Repurchase agreement with Fixed Income Clearing Corporation, 0.01%, dated 9/30/11, due 10/3/11, maturity value $128,934
(Cost $128,934)(8) | | $ | 128,934 | | | $ | 128,934 | |
| | | | | | | | |
| | | | | | | | |
Total investments - 98.6%
(Cost $4,246,796) | | | | | | | 4,216,813 | |
| | | | | | | | |
Other assets less liabilities - 1.4% | | | | | | | 58,669 | |
| | | | | | | | |
| | | | | | | | |
Total net assets - 100.0%(9) | | | | | | $ | 4,275,482 | |
| | | | | | | | |
| (1) | Valued at a fair value in accordance with procedures established by the board of directors of Artisan Funds. In total, securities valued at a fair value were $3,193,456 or 74.7% of total net assets. See notes 2(a) and 2(b) in Notes to Financial Statements for additional information. |
| (2) | Non-income producing security. |
| (3) | Affiliated company as defined by the Investment Company Act of 1940, as amended. See Note (7) in Notes to Financial Statements. |
| (5) | Security is an equity-linked participation certificate issued by HSBC Bank plc. As described in Note 2(i) in Notes to Financial Statements, equity-linked participation certificates are subject to counterparty risk with respect to the bank or broker-dealer that issues them. |
| (6) | Security is restricted. Ryanair Holdings PLC was acquired in a transaction under Rule 144A of the Securities Act of 1933, as amended. The shares of Ryanair Holdings PLC may be resold in transactions exempt from registration to qualified institutional buyers. The shares of Mitsubishi UFG Financial Group, Inc., were acquired in a private placement and are freely tradeable outside the United States, where the Fund expects to trade them. |
| | | | | | | | | | | | | | | | |
Security | | Acquisition
Dates | | | Cost | | | Value | | | Percentage
of Total
Net Assets | |
Ryanair Holdings
PLC | |
| 9/17/08-
9/26/2011 |
| | $ | 102,300 | | | $ | 109,313 | | | | 2.6 | % |
Mitsubishi UFJ Financial Group,
Inc. | | | 12/14/2009 | | | | 17,639 | | | | 16,424 | | | | 0.4 | |
| | | | | | | | | | | | | | | | |
| | | | | | | | | | $ | 125,737 | | | | 3.0 | % |
| | | | | | | | | | | | | | | | |
| (7) | Shares are registered with the issuing company and not tradable until converted back to bearer shares. |
| | | | | | | | | | | | |
Issuer | | Rate | | | Maturity | | | Value | |
U.S. Treasury Bond | | | 4.625 | % | | | 2/15/2040 | | | $ | 131,519 | |
| (9) | Percentages for the various classifications relate to total net assets. |
Company names are as reported by a data service provider and in some cases are translations; a company’s legal name may be different.
(DR) Depositary Receipt, voting rights may vary.
| | | | | | | | | | | | | | | | | | | | |
| FOREIGN CURRENCY FORWARD CONTRACTS | |
Dollar values in thousands | |
Description | | Counterparty | | Transaction
Type | | Settlement
Date | | | Cost on
Origination
Date | | | Value | | | Unrealized
Appreciation | |
| Japanese Yen | | State Street Bank and Trust Company | | Sell | | | 11/17/2011 | | | $ | 483,128 | | | $ | 481,223 | | | $ | 1,905 | |
| | | | | | | | |
| PORTFOLIO DIVERSIFICATION - September 30, 2011 | |
Dollar values in thousands | |
| | | Value | | | Percentage
of Total
Net Assets | |
Consumer Discretionary | | $ | 1,001,416 | | | | 23.4 | % |
Consumer Staples | | | 637,572 | | | | 14.9 | |
Energy | | | 111,680 | | | | 2.6 | |
Financials | | | 928,521 | | | | 21.7 | |
Healthcare | | | 338,437 | | | | 7.9 | |
Industrials | | | 664,082 | | | | 15.6 | |
Information Technology | | | 299,965 | | | | 7.0 | |
Materials | | | 106,206 | | | | 2.5 | |
| | | | | | | | |
Total common stocks | | | 4,087,879 | | | | 95.6 | |
Short-term investments | | | 128,934 | | | | 3.0 | |
| | | | | | | | |
Total investments | | | 4,216,813 | | | | 98.6 | |
Other assets less liabilities | | | 58,669 | | | | 1.4 | |
| | | | | | | | |
Total net assets | | $ | 4,275,482 | | | | 100.0 | % |
| | | | | | | | |
| | | | | | | | |
| CURRENCY EXPOSURE - September 30, 2011 | |
Dollar values in thousands | |
| | | Value | | | Percentage
of Total
Investments | |
British pound | | $ | 930,905 | | | | 22.1 | % |
Danish krone | | | 68,848 | | | | 1.6 | |
Euro | | | 1,003,841 | | | | 23.8 | |
Hong Kong dollar | | | 71,507 | | | | 1.7 | |
Japanese yen | | | 618,731 | | | | 14.7 | |
Singapore dollar | | | 21,934 | | | | 0.5 | |
Swiss franc | | | 477,690 | | | | 11.3 | |
U.S. dollar | | | 1,023,357 | | | | 24.3 | |
| | | | | | | | |
Total investments | | $ | 4,216,813 | | | | 100.0 | % |
| | | | | | | | |
23
| | | | | | |
| TOP TEN HOLDINGS - September 30, 2011 | |
Company Name | | Country | | Percentage
of Total
Net Assets | |
Compass Group PLC | | United Kingdom | | | 5.3 | % |
TE Connectivity Ltd | | United States | | | 4.6 | |
Arch Capital Group Ltd. | | United States | | | 4.3 | |
Novartis AG | | Switzerland | | | 3.8 | |
Reed Elsevier PLC | | United Kingdom | | | 3.3 | |
Kao Corporation | | Japan | | | 3.3 | |
Credit Saison Co., Ltd. | | Japan | | | 3.1 | |
Covidien plc | | United States | | | 3.1 | |
Signet Jewelers Ltd. | | United States | | | 3.1 | |
Publicis Groupe | | France | | | 3.0 | |
| | | | | | |
Total | | | | | 36.9 | % |
| | | | | | |
For the purpose of determining the Fund’s top ten holdings, securities of the same issuer are aggregated to determine the weight in the Fund.
The Fund owns Pargesa Holding SA (Pargesa), which represents 2.2% of the Fund’s total net assets, and Groupe Bruxelles Lambert SA (GBL), which represents 1.9% of the Fund’s total net assets. Pargesa is the parent company of GBL. If you aggregated the Fund’s holdings of both securities, the aggregated amount would be one of the Fund’s top ten holdings.
The accompanying notes are an integral part of the financial statements.
24
ARTISAN MID CAP FUND
Schedule of Investments – September 30, 2011
Dollar values in thousands
| | | | | | | | |
| | | Shares
Held | | | Value | |
| | | | | | | | |
| COMMON STOCKS - 95.6% | | | | | | | | |
| | | | | | | | |
| CONSUMER DISCRETIONARY - 19.6% | | | | | |
Auto Components - 1.5% | | | | | | | | |
BorgWarner Inc.(1) | | | 1,132,114 | | | $ | 68,527 | |
Gentex Corporation | | | 321,300 | | | | 7,727 | |
| | | | | | | | |
| | | | | | | 76,254 | |
Automobiles - 0.3% | | | | | | | | |
Tesla Motors, Inc.(1) | | | 538,685 | | | | 13,138 | |
| | | | | | | | |
Distributors - 1.5% | | | | | | | | |
LKQ Corporation(1) | | | 3,161,870 | | | | 76,391 | |
| | | | | | | | |
Diversified Consumer Services - 1.0% | | | | | |
New Oriental Education & Technology Group, Inc. (DR)(1)(2) | | | 2,088,400 | | | | 47,970 | |
| | | | | | | | |
Hotels, Restaurants & Leisure - 5.7% | | | | | |
Arcos Dorados Holdings Inc., Class A(2) | | | 1,892,900 | | | | 43,896 | |
Chipotle Mexican Grill, Inc.(1) | | | 236,224 | | | | 71,564 | |
Ctrip.com International, Ltd. (DR)(1)(2) | | | 2,161,831 | | | | 69,524 | |
Starwood Hotels & Resorts Worldwide, Inc. | | | 1,581,999 | | | | 61,413 | |
Wynn Resorts, Limited | | | 333,923 | | | | 38,428 | |
| | | | | | | | |
| | | | | | | 284,825 | |
Internet & Catalog Retail - 0.4% | | | | | | | | |
Netflix, Inc.(1) | | | 164,767 | | | | 18,645 | |
| | | | | | | | |
Specialty Retail - 1.7% | | | | | | | | |
Tractor Supply Company | | | 625,700 | | | | 39,137 | |
Ulta Salon, Cosmetics & Fragrance, Inc.(1) | | | 733,500 | | | | 45,646 | |
| | | | | | | | |
| | | | | | | 84,783 | |
Textiles, Apparel & Luxury Goods - 7.5% | | | | | | | | |
Coach, Inc. | | | 2,130,023 | | | | 110,399 | |
Fossil, Inc.(1) | | | 1,229,135 | | | | 99,634 | |
lululemon athletica inc.(1) | | | 940,716 | | | | 45,766 | |
Polo Ralph Lauren Corporation, Class A | | | 733,522 | | | | 95,138 | |
Under Armour, Inc., Class A(1) | | | 380,800 | | | | 25,289 | |
| | | | | | | | |
| | | | | | | 376,226 | |
| CONSUMER STAPLES - 2.6% | | | | | | | | |
Food Products - 2.6% | | | | | | | | |
Diamond Foods, Inc. | | | 525,800 | | | | 41,954 | |
| | | | | | | | |
| CONSUMER STAPLES (CONTINUED) | | | | | | | | |
Food Products (Continued) | | | | | | | | |
Mead Johnson Nutrition Company | | | 377,100 | | | $ | 25,956 | |
TreeHouse Foods, Inc.(1) | | | 973,800 | | | | 60,220 | |
| | | | | | | | |
| | | | | | | 128,130 | |
| ENERGY - 7.3% | | | | | | | | |
Energy Equipment & Services - 6.0% | | | | | |
Cameron International Corporation(1) | | | 3,174,549 | | | | 131,871 | |
Core Laboratories N.V. | | | 762,510 | | | | 68,496 | |
Dresser-Rand Group Inc.(1) | | | 2,523,327 | | | | 102,270 | |
| | | | | | | | |
| | | | | | | 302,637 | |
Oil, Gas & Consumable Fuels - 1.3% | | | | | |
Cabot Oil & Gas Corporation | | | 474,900 | | | | 29,401 | |
Noble Energy, Inc. | | | 469,700 | | | | 33,255 | |
| | | | | | | | |
| | | | | | | 62,656 | |
| FINANCIALS - 5.1% | | | | | | | | |
Capital Markets - 1.0% | | | | | | | | |
Ares Capital Corporation | | | 3,501,709 | | | | 48,218 | |
| | | | | | | | |
Commercial Banks - 0.8% | | | | | | | | |
HDFC Bank Limited (DR)(2) | | | 1,326,090 | | | | 38,655 | |
| | | | | | | | |
Consumer Finance - 2.1% | | | | | | | | |
Discover Financial Services | | | 4,670,310 | | | | 107,137 | |
| | | | | | | | |
Diversified Financial Services - 1.2% | | | | | | | | |
CME Group Inc., Class A | | | 250,665 | | | | 61,764 | |
| | | | | | | | |
| HEALTHCARE - 22.5% | | | | | | | | |
Biotechnology - 6.5% | | | | | | | | |
Alexion Pharmaceuticals, Inc.(1) | | | 810,500 | | | | 51,921 | |
Cepheid(1) | | | 2,030,600 | | | | 78,848 | |
Incyte Corporation(1) | | | 1,831,682 | | | | 25,589 | |
Pharmasset, Inc.(1) | | | 464,200 | | | | 38,236 | |
Regeneron Pharmaceuticals, Inc.(1) | | | 2,232,613 | | | | 129,938 | |
| | | | | | | | |
| | | | | | | 324,532 | |
Health Care Equipment & Supplies - 2.2% | | | | | | | | |
Edwards Lifesciences Corporation(1) | | | 808,081 | | | | 57,600 | |
Intuitive Surgical, Inc.(1) | | | 142,813 | | | | 52,024 | |
| | | | | | | | |
| | | | | | | 109,624 | |
Health Care Providers & Services - 0.5% | | | | | | | | |
AMERIGROUP Corporation(1) | | | 675,700 | | | | 26,359 | |
25
| | | | | | | | |
| | | Shares
Held | | | Value | |
| | | | | | | | |
| HEALTHCARE (CONTINUED) | | | | | | | | |
Health Care Technology - 6.4% | | | | | | | | |
athenahealth, Inc.(1)(3) | | | 1,956,015 | | | $ | 116,481 | |
Cerner Corporation(1) | | | 2,973,724 | | | | 203,760 | |
| | | | | | | | |
| | | | | | | 320,241 | |
Life Sciences Tools & Services - 4.1% | | | | | |
Agilent Technologies, Inc.(1) | | | 3,437,815 | | | | 107,432 | |
Illumina, Inc.(1) | | | 1,098,183 | | | | 44,938 | |
Mettler-Toledo International Inc.(1) | | | 374,600 | | | | 52,429 | |
| | | | | | | | |
| | | | | | | 204,799 | |
Pharmaceuticals - 2.8% | | | | | | | | |
Allergan, Inc. | | | 1,703,196 | | | | 140,309 | |
| | | | | | | | |
| INDUSTRIALS - 12.6% | | | | | | | | |
Aerospace & Defense - 2.6% | | | | | | | | |
Precision Castparts Corp. | | | 822,596 | | | | 127,881 | |
| | | | | | | | |
Electrical Equipment - 4.0% | | | | | | | | |
Cooper Industries plc | | | 1,596,676 | | | | 73,639 | |
Roper Industries, Inc. | | | 1,864,812 | | | | 128,504 | |
| | | | | | | | |
| | | | | | | 202,143 | |
Machinery - 1.6% | | | | | | | | |
Gardner Denver, Inc. | | | 1,269,334 | | | | 80,666 | |
| | | | | | | | |
Professional Services - 4.4% | | | | | | | | |
IHS Inc.(1) | | | 1,881,617 | | | | 140,764 | |
Verisk Analytics, Inc., Class A(1) | | | 2,357,427 | | | | 81,968 | |
| | | | | | | | |
| | | | | | | 222,732 | |
| INFORMATION TECHNOLOGY - 25.9% | | | | | |
Communications Equipment - 2.1% | | | | | |
Aruba Networks, Inc.(1) | | | 1,676,300 | | | | 35,051 | |
Juniper Networks, Inc.(1) | | | 4,178,785 | | | | 72,126 | |
| | | | | | | | |
| | | | | | | 107,177 | |
Electronic Equipment & Instruments - 4.2% | | | | | | | | |
IPG Photonics Corporation(1) | | | 1,098,500 | | | | 47,719 | |
Trimble Navigation Limited(1) | | | 2,996,165 | | | | 100,521 | |
Universal Display Corporation(1) | | | 1,331,200 | | | | 63,818 | |
| | | | | | | | |
| | | | | | | 212,058 | |
Internet Software & Services - 2.6% | | | | | |
MercadoLibre, Inc. | | | 1,320,763 | | | | 70,991 | |
OpenTable, Inc.(1) | | | 861,966 | | | | 39,659 | |
SINA Corporation(1)(2) | | | 307,000 | | | | 21,984 | |
| | | | | | | | |
| | | | | | | 132,634 | |
IT Services - 2.6% | | | | | | | | |
Teradata Corporation(1) | | | 2,395,204 | | | | 128,215 | |
| | | | | | | | |
Semiconductors & Semiconductor Equipment - 3.9% | | | | | | | | |
Altera Corporation | | | 783,900 | | | | 24,716 | |
ARM Holdings PLC (DR)(2) | | | 2,581,725 | | | | 65,834 | |
| | | | | | | | |
| INFORMATION TECHNOLOGY (CONTINUED) | | | | | | | | |
Semiconductors & Semiconductor Equipment (Continued) | | | | | | | | |
Broadcom Corporation, Class A | | | 3,188,576 | | | $ | 106,148 | |
| | | | | | | | |
| | | | | | | 196,698 | |
Software - 10.5% | | | | | | | | |
ANSYS, Inc.(1) | | | 1,859,118 | | | | 91,171 | |
Citrix Systems, Inc.(1) | | | 1,561,918 | | | | 85,171 | |
Concur Technologies, Inc.(1) | | | 359,365 | | | | 13,375 | |
Qlik Technologies Inc.(1) | | | 2,632,300 | | | | 57,016 | |
Red Hat, Inc.(1) | | | 2,068,141 | | | | 87,400 | |
salesforce.com, inc.(1) | | | 899,911 | | | | 102,842 | |
VMware, Inc., Class A(1) | | | 1,118,868 | | | | 89,935 | |
| | | | | | | | |
| | | | | | | 526,910 | |
| | | | | | | | |
Total common stocks
(Cost $3,651,540) | | | | | | | 4,790,407 | |
| | |
| | | Par
Amount | | | | |
SHORT-TERM INVESTMENTS
(CASH EQUIVALENTS) - 4.8% | | | | | |
Repurchase agreement with Fixed Income Clearing Corporation, 0.01%, dated 9/30/11, due 10/3/11, maturity value $241,658
(Cost $241,658)(4) | | $ | 241,658 | | | $ | 241,658 | |
| | | | | | | | |
| | | | | | | | |
Total investments - 100.4%
(Cost $3,893,198) | | | | | | | 5,032,065 | |
| | | | | | | | |
Other assets less liabilities - (0.4%) | | | | | | | (21,309 | ) |
| | | | | | | | |
| | | | | | | | |
Total net assets - 100.0%(5) | | | | | | $ | 5,010,756 | |
| | | | | | | | |
| (1) | Non-income producing security. |
| (2) | The Fund considers the company to be from outside of the United States. See the Fund’s Statement of Additional Information for information on how a particular country is assigned. |
| | | | |
Security | | Country | | Trading Currency |
Arcos Dorados Holdings Inc., Class A | | Brazil | | US dollar |
ARM Holdings PLC (DR) | | United Kingdom | | US dollar |
Ctrip.com International, Ltd. (DR) | | China | | US dollar |
HDFC Bank Limited (DR) | | India | | US dollar |
New Oriental Education & Technology Group, Inc. (DR) | | China | | US dollar |
SINA Corporation | | China | | US dollar |
26
| (3) | Affiliated company as defined by the Investment Company Act of 1940, as amended. See Note (7) in Notes to Financial Statements. |
| | | | | | | | | | | | |
lssuer | | Rate | | | Maturity | | | Value | |
U.S. Treasury Bond | | | 4.625 | % | | | 2/15/2040 | | | $ | 246,492 | |
| (5) | Percentages for the various classifications relate to total net assets. |
Company names are as reported by a data service provider and in some cases are translations; a company’s legal name may be different.
(DR) Depositary Receipt, voting rights may vary.
| | | | | | |
| TOP TEN HOLDINGS - September 30, 2011 | |
Company Name | | Country | | Percentage
of Total
Net Assets | |
Cerner Corporation | | United States | | | 4.1 | % |
IHS Inc. | | United States | | | 2.8 | |
Allergan, Inc. | | United States | | | 2.8 | |
Cameron International Corporation | | United States | | | 2.6 | |
Regeneron Pharmaceuticals, Inc. | | United States | | | 2.6 | |
Roper Industries, Inc. | | United States | | | 2.6 | |
Teradata Corporation | | United States | | | 2.6 | |
Precision Castparts Corp. | | United States | | | 2.6 | |
athenahealth, Inc. | | United States | | | 2.3 | |
Coach, Inc. | | United States | | | 2.2 | |
| | | | | | |
Total | | | | | 27.2 | % |
| | | | | | |
For the purpose of determining the Fund’s top ten holdings, securities of the same issuer are aggregated to determine the weight in the Fund.
The accompanying notes are an integral part of the financial statements.
27
ARTISAN VALUE FUND
Schedule of Investments – September 30, 2011
Dollar values in thousands
| | | | | | | | |
| | | Shares
Held | | | Value | |
| | | | | | | | |
| COMMON STOCKS - 97.5% | | | | | | | | |
| | | | | | | | |
| CONSUMER DISCRETIONARY - 9.1% | | | | | |
Diversified Consumer Services - 2.4% | | | | | |
H&R Block, Inc. | | | 829,900 | | | $ | 11,046 | |
| | | | | | | | |
Hotels, Restaurants & Leisure - 2.8% | |
Carnival Corporation & plc | | | 427,500 | | | | 12,953 | |
| | | | | | | | |
Multiline Retail - 3.9% | | | | | | | | |
Target Corporation | | | 369,900 | | | | 18,140 | |
| | | | | | | | |
| CONSUMER STAPLES - 10.3% | | | | | | | | |
Food & Staples Retailing - 8.2% | | | | | | | | |
Tesco plc(1)(2) | | | 2,901,800 | | | | 16,974 | |
Wal-Mart Stores, Inc. | | | 401,400 | | | | 20,833 | |
| | | | | | | | |
| | | | | | | 37,807 | |
Food Products - 2.1% | | | | | | | | |
Unilever PLC (DR)(2) | | | 303,760 | | | | 9,474 | |
| | | | | | | | |
| ENERGY - 10.8% | | | | | | | | |
Oil, Gas & Consumable Fuels - 10.8% | |
Apache Corporation | | | 203,100 | | | | 16,297 | |
Chesapeake Energy Corporation | | | 366,100 | | | | 9,354 | |
Cimarex Energy Co. | | | 260,700 | | | | 14,521 | |
Exxon Mobil Corporation | | | 130,200 | | | | 9,456 | |
| | | | | | | | |
| | | | | | | 49,628 | |
| FINANCIALS - 27.4% | | | | | | | | |
Capital Markets - 6.4% | | | | | | | | |
The Bank of New York Mellon Corporation | | | 991,500 | | | | 18,432 | |
The Goldman Sachs Group, Inc. | | | 118,300 | | | | 11,185 | |
| | | | | | | | |
| | | | | | | 29,617 | |
Insurance - 18.9% | | | | | | | | |
Aflac Incorporated | | | 292,900 | | | | 10,237 | |
The Allstate Corporation | | | 414,750 | | | | 9,825 | |
Arch Capital Group Ltd.(3)(4) | | | 439,300 | | | | 14,354 | |
Berkshire Hathaway Inc., Class B(3) | | | 346,930 | | | | 24,646 | |
The Chubb Corporation | | | 254,900 | | | | 15,292 | |
The Progressive Corporation | | | 727,600 | | | | 12,922 | |
| | | | | | | | |
| | | | | | | 87,276 | |
| | | | | | | | |
| FINANCIALS (CONTINUED) | | | | | | | | |
Real Estate Investment Trusts
(REITS) - 2.1% | |
Annaly Capital Management, Inc. | | | 580,400 | | | $ | 9,652 | |
| | | | | | | | |
| HEALTHCARE - 2.9% | | | | | | | | |
Health Care Providers & Services - 2.9% | | | | | |
CIGNA Corporation | | | 320,000 | | | | 13,421 | |
| | | | | | | | |
| INDUSTRIALS - 2.6% | | | | | | | | |
Construction & Engineering - 2.6% | | | | | | | | |
Jacobs Engineering Group Inc.(3) | | | 374,300 | | | | 12,086 | |
| | | | | | | | |
| INFORMATION TECHNOLOGY - 34.4% | |
Communications Equipment - 5.3% | | | | | | | | |
Cisco Systems, Inc. | | | 1,586,500 | | | | 24,575 | |
| | | | | | | | |
Computers & Peripherals - 8.7% | | | | | | | | |
Apple Inc.(3) | | | 82,400 | | | | 31,409 | |
Hewlett-Packard Company | | | 396,000 | | | | 8,890 | |
| | | | | | | | |
| | | | | | | 40,299 | |
Electronic Equipment &
Instruments - 6.8% | |
Avnet, Inc.(3) | | | 585,800 | | | | 15,278 | |
Ingram Micro Inc.(3)(4) | | | 1,000,700 | | | | 16,141 | |
| | | | | | | | |
| | | | | | | 31,419 | |
IT Services - 5.0% | | | | | | | | |
Total System Services, Inc. | | | 656,300 | | | | 11,111 | |
The Western Union Company | | | 794,700 | | | | 12,151 | |
| | | | | | | | |
| | | | | | | 23,262 | |
Semiconductors & Semiconductor
Equipment - 3.4% | |
Texas Instruments Incorporated | | | 593,900 | | | $ | 15,828 | |
| | | | | | | | |
Software - 5.2% | | | | | | | | |
Microsoft Corporation | | | 965,500 | | | | 24,031 | |
| | | | | | | | |
Total common stocks
(Cost $474,554) | | | | | | | 450,514 | |
28
| | | | | | | | |
| | | Par
Amount | | | Value | |
SHORT-TERM INVESTMENTS
(CASH EQUIVALENTS) - 2.3% | |
Repurchase agreement with Fixed Income Clearing Corporation, 0.01%, dated 9/30/11, due 10/3/11, maturity value $10,526
(Cost $10,526)(5) | | $ | 10,526 | | | $ | 10,526 | |
| | | | | | | | |
| | | | | | | | |
Total investments - 99.8%
(Cost $485,080) | | | | | | | 461,040 | |
| | | | | | | | |
Other assets less liabilities - 0.2% | | | | | | | 1,122 | |
| | | | | | | | |
| | | | | | | | |
Total net assets - 100.0%(6) | | | | | | $ | 462,162 | |
| | | | | | | | |
| (1) | Valued at a fair value in accordance with procedures established by the board of directors of Artisan Funds. In total, securities valued at a fair value were $16,974 or 3.7% of total net assets. See notes 2(a) and 2(b) in Notes to Financial Statements for additional information. |
| (2) | The Fund considers the company to be from outside of the United States. See the Fund’s Statement of Additional Information for information on how a particular country is assigned. |
| | | | |
Security | | Country | | Trading Currency |
Tesco plc | | United Kingdom | | British pound |
Unilever PLC (DR) | | United Kingdom | | US dollar |
| (3) | Non-income producing security. |
| (4) | Affiliated company as defined by the Investment Company Act of 1940, as amended. See Note (7) in Notes to Financial Statements. |
| | | | | | | | | | | | |
Issuer | | Rate | | | Maturity | | | Value | |
U.S. Treasury Bond | | | 4.625 | % | | | 2/15/2040 | | | $ | 7,460 | |
U.S. Treasury Note | | | 2.375 | % | | | 6/30/2018 | | | | 3,281 | |
| | | | | | | | | | | | |
| | | | | | | | | | $ | 10,741 | |
| | | | | | | | | | | | |
| (6) | Percentages for the various classifications relate to total net assets. |
Company names are as reported by a data service provider and in some cases are translations; a company’s legal name may be different.
(DR) Depositary Receipt, voting rights may vary.
| | | | | | |
| TOP TEN HOLDINGS - September 30, 2011 | |
Company Name | | Country | | Percentage
of Total
Net Assets | |
Apple Inc. | | United States | | | 6.8 | % |
Berkshire Hathaway Inc. | | United States | | | 5.3 | |
Cisco Systems, Inc. | | United States | | | 5.3 | |
Microsoft Corporation | | United States | | | 5.2 | |
Wal-Mart Stores, Inc. | | United States | | | 4.5 | |
The Bank of New York Mellon Corporation | | United States | | | 4.0 | |
Target Corporation | | United States | | | 3.9 | |
Tesco plc | | United Kingdom | | | 3.7 | |
Apache Corporation | | United States | | | 3.5 | |
Ingram Micro Inc. | | United States | | | 3.5 | |
| | | | | | |
Total | | | | | 45.7 | % |
| | | | | | |
For the purpose of determining the Fund’s top ten holdings, securities of the same issuer are aggregated to determine the weight in the Fund.
The accompanying notes are an integral part of the financial statements.
29
ARTISAN FUNDS
Statements of Assets and Liabilities – September 30, 2011
Dollar values in thousands, except per share amounts
| | | | | | | | |
| | | EMERGING MARKETS | | | GROWTH
OPPORTUNITIES | |
| ASSETS: | | | | | | | | |
Investments in securities, unaffiliated, at value | | $ | 656,356 | | | $ | 143,299 | |
Short-term investments (repurchase agreements), at value | | | 7,346 | | | | 10,298 | |
| | | | | | | | |
Total investments | | | 663,702 | | | | 153,597 | |
Cash | | | 1 | | | | - | (1) |
Foreign currency | | | 1,709 | | | | 38 | |
Unrealized gain on foreign currency contracts | | | 8 | | | | 7 | |
Receivable from investments sold | | | 1,527 | | | | 2,973 | |
Receivable from fund shares sold | | | 2,818 | | | | 117 | |
Dividends and interest receivable | | | 870 | | | | 96 | |
Receivable from Adviser | | | - | | | | 17 | |
| | | | | | | | |
Total assets | | | 670,635 | | | | 156,845 | |
| | |
| LIABILITIES: | | | | | | | | |
Unrealized loss on foreign currency contracts | | | - | | | | 2 | |
Payable for investments purchased | | | - | | | | 950 | |
Payable for fund shares redeemed | | | 815 | | | | 27 | |
Payable for operating expenses | | | 357 | | | | 115 | |
Payable for foreign taxes | | | 184 | | | | 24 | |
| | | | | | | | |
Total liabilities | | | 1,356 | | | | 1,118 | |
| | | | | | | | |
Total net assets | | $ | 669,279 | | | $ | 155,727 | |
| | | | | | | | |
| NET ASSETS CONSIST OF: | | | | | | | | |
Fund shares issued and outstanding | | $ | 865,018 | | | $ | 152,783 | |
Net unrealized appreciation (depreciation) on investments and foreign currency related transactions | | | (189,873 | ) | | | 2,822 | |
Accumulated undistributed net investment income (loss) | | | 4,668 | | | | (412 | ) |
Accumulated undistributed net realized gains (losses) on investments and foreign currency related transactions | | | (10,534 | ) | | | 534 | |
| | | | | | | | |
| | $ | 669,279 | | | $ | 155,727 | |
| | | | | | | | |
| SUPPLEMENTARY INFORMATION: | | | | | | | | |
Net assets | | | | | | | | |
Investor Shares | | | | | | $ | 142,758 | |
Institutional Shares | | $ | 352,093 | | | $ | 12,969 | |
Advisor Shares | | $ | 317,186 | | | | | |
Shares outstanding (Indefinite number of shares authorized, $0.01 par value) | | | | | | | | |
Investor Shares | | | | | | | 13,100,025 | |
Institutional Shares | | | 30,955,712 | | | | 1,191,589 | |
Advisor Shares | | | 27,871,355 | | | | | |
Net asset value, offering price and redemption price per share | | | | | | | | |
Investor Shares | | | | | | $ | 10.90 | |
Institutional Shares | | $ | 11.37 | | | $ | 10.88 | |
Advisor Shares | | $ | 11.38 | | | | | |
Cost of securities of unaffiliated issuers held | | $ | 853,346 | | | $ | 150,764 | |
Cost of foreign currency | | $ | 1,723 | | | $ | 39 | |
| (1) | Amount rounds to less than $1. |
The accompanying notes are an integral part of the financial statements.
30
ARTISAN FUNDS
Statements of Assets and Liabilities – September 30, 2011 (Continued)
Dollar values in thousands, except per share amounts
| | | | | | | | |
| | | INTERNATIONAL | | | INTERNATIONAL
VALUE | |
| ASSETS: | | | | | | | | |
Investments in securities, unaffiliated, at value | | $ | 7,547,301 | | | $ | 3,680,655 | |
Investments in securities, affiliated, at value | | | - | | | | 407,224 | |
Short-term investments (repurchase agreements), at value | | | 246,213 | | | | 128,934 | |
| | | | | | | | |
Total investments | | | 7,793,514 | | | | 4,216,813 | |
Cash | | | 1 | | | | 1 | |
Foreign currency | | | 110 | | | | 163 | |
Unrealized gain on foreign currency contracts | | | 177 | | | | 2,107 | |
Receivable from investments sold | | | 74,930 | | | | 38,361 | |
Receivable from fund shares sold | | | 78,968 | | | | 15,990 | |
Dividends and interest receivable | | | 23,509 | | | | 14,949 | |
| | | | | | | | |
Total assets | | | 7,971,209 | | | | 4,288,384 | |
| | |
| LIABILITIES: | | | | | | | | |
Unrealized loss on foreign currency contracts | | | 317 | | | | 69 | |
Payable for investments purchased | | | 119,321 | | | | 6,151 | |
Payable for fund shares redeemed | | | 20,304 | | | | 4,888 | |
Payable for operating expenses | | | 3,519 | | | | 1,359 | |
Payable for foreign taxes | | | 1,340 | | | | 435 | |
| | | | | | | | |
Total liabilities | | | 144,801 | | | | 12,902 | |
| | | | | | | | |
Total net assets | | $ | 7,826,408 | | | $ | 4,275,482 | |
| | | | | | | | |
| NET ASSETS CONSIST OF: | | | | | | | | |
Fund shares issued and outstanding | | $ | 9,921,895 | | | $ | 4,347,141 | |
Net unrealized depreciation on investments and foreign currency related transactions | | | (304,086 | ) | | | (27,868 | ) |
Accumulated undistributed net investment income | | | 121,055 | | | | (12,850 | ) |
Accumulated undistributed net realized losses on investments and foreign currency related transactions | | | (1,912,456 | ) | | | (30,941 | ) |
| | | | | | | | |
| | $ | 7,826,408 | | | $ | 4,275,482 | |
| | | | | | | | |
| SUPPLEMENTARY INFORMATION: | | | | | | | | |
Net assets | | | | | | | | |
Investor Shares | | $ | 5,837,067 | | | $ | 3,232,649 | |
Institutional Shares | | $ | 1,989,341 | | | $ | 1,042,833 | |
Shares outstanding (Indefinite number of shares authorized, $0.01 par value) | | | | | | | | |
Investor Shares | | | 317,791,282 | | | | 137,916,092 | |
Institutional Shares | | | 107,522,505 | | | | 44,432,407 | |
Net asset value, offering price and redemption price per share | | | | | | | | |
Investor Shares | | $ | 18.37 | | | $ | 23.44 | |
Institutional Shares | | $ | 18.50 | | | $ | 23.47 | |
Cost of securities of unaffiliated issuers held | | $ | 8,096,797 | | | $ | 3,869,535 | |
Cost of securities of affiliated issuers held | | | - | | | $ | 377,261 | |
Cost of foreign currency | | $ | 119 | | | $ | 171 | |
| (1) | Amount rounds to less than $1. |
The accompanying notes are an integral part of the financial statements.
31
ARTISAN FUNDS
Statements of Assets and Liabilities – September 30, 2011 (Continued)
Dollar values in thousands, except per share amounts
| | | | | | | | |
| | | MID CAP | | | VALUE | |
| ASSETS: | | | | | | | | |
Investments in securities, unaffiliated, at value | | $ | 4,673,926 | | | $ | 420,019 | |
Investments in securities, affiliated, at value | | | 116,481 | | | | 30,495 | |
Short-term investments (repurchase agreements), at value | | | 241,658 | | | | 10,526 | |
| | | | | | | | |
Total investments | | | 5,032,065 | | | | 461,040 | |
Cash | | | 1 | | | | 1 | |
Receivable from investments sold | | | 23,902 | | | | - | |
Receivable from fund shares sold | | | 6,484 | | | | 805 | |
Dividends and interest receivable | | | 1,750 | | | | 914 | |
| | | | | | | | |
Total assets | | | 5,064,202 | | | | 462,760 | |
| | |
| LIABILITIES: | | | | | | | | |
Payable for investments purchased | | | 46,537 | | | | - | |
Payable for fund shares redeemed | | | 4,120 | | | | 272 | |
Payable for operating expenses | | | 2,789 | | | | 326 | |
| | | | | | | | |
Total liabilities | | | 53,446 | | | | 598 | |
| | | | | | | | |
Total net assets | | $ | 5,010,756 | | | $ | 462,162 | |
| | | | | | | | |
| NET ASSETS CONSIST OF: | | | | | | | | |
Fund shares issued and outstanding | | $ | 3,982,761 | | | $ | 545,229 | |
Net unrealized appreciation (depreciation) on investments and foreign currency related transactions | | | 1,138,867 | | | | (24,040 | ) |
Accumulated undistributed net investment income | | | - | | | | 2,606 | |
Accumulated undistributed net realized losses on investments and foreign currency related transactions | | | (110,872 | ) | | | (61,633 | ) |
| | | | | | | | |
| | $ | 5,010,756 | | | $ | 462,162 | |
| | | | | | | | |
| SUPPLEMENTARY INFORMATION: | | | | | | | | |
Net assets | | | | | | | | |
Investor Shares | | $ | 4,500,786 | | | $ | 408,647 | |
Institutional Shares | | $ | 509,970 | | | $ | 53,515 | |
Shares outstanding (Indefinite number of shares authorized, $0.01 par value) | | | | | | | | |
Investor Shares | | | 144,527,373 | | | | 44,853,835 | |
Institutional Shares | | | 15,822,765 | | | | 5,870,145 | |
Net asset value, offering price and redemption price per share | | | | | | | | |
Investor Shares | | $ | 31.14 | | | $ | 9.11 | |
Institutional Shares | | $ | 32.23 | | | $ | 9.12 | |
Cost of securities of unaffiliated issuers held | | $ | 3,813,634 | | | $ | 457,079 | |
Cost of securities of affiliated issuers held | | $ | 79,564 | | | $ | 28,001 | |
| (1) | Amount rounds to less than $1. |
The accompanying notes are an integral part of the financial statements.
32
ARTISAN FUNDS
Statements of Operations – For the Year Ended September 30, 2011
Dollar values in thousands
| | | | | | | | |
| | | EMERGING MARKETS | | | GROWTH
OPPORTUNITIES | |
| INVESTMENT INCOME: | | | | | | | | |
Dividends, from unaffiliated issuers(1) | | $ | 20,809 | | | $ | 918 | |
Interest | | | 3 | | | | 1 | |
| | | | | | | | |
Total investment income | | | 20,812 | | | | 919 | |
| | |
| EXPENSES: | | | | | | | | |
Advisory fees | | | 8,324 | | | | 1,235 | |
Transfer agent fees | | | | | | | | |
Investor Shares | | | | | | | 384 | |
Institutional Shares | | | 20 | | | | 4 | |
Advisor Shares | | | 962 | | | | | |
Shareholder communications | | | | | | | | |
Investor Shares | | | | | | | 26 | |
Institutional Shares | | | 18 | | | | 1 | |
Advisor Shares | | | 36 | | | | | |
Custodian fees | | | 717 | | | | 42 | |
Accounting fees | | | 70 | | | | 39 | |
Professional fees | | | 82 | | | | 110 | |
Registration fees | | | | | | | | |
Investor Shares | | | | | | | 61 | |
Institutional Shares | | | 56 | | | | 22 | |
Advisor Shares | | | 141 | | | | | |
Directors’ fees | | | 24 | | | | 6 | |
Other operating expenses | | | 16 | | | | 5 | |
| | | | | | | | |
Total operating expenses | | | 10,466 | | | | 1,935 | |
Less amounts waived or paid by the Adviser | | | - | | | | (17 | ) |
| | | | | | | | |
Net Expenses | | | - | | | | 1,918 | |
| | | | | | | | |
Net investment income (loss) | | | 10,346 | | | | (999 | ) |
| | |
| NET REALIZED AND UNREALIZED GAINS (LOSSES) ON INVESTMENTS: | | | | | | | | |
Net realized gain (loss) on: | | | | | | | | |
Investments(1) | | | 9,473 | | | | 2,181 | |
Foreign currency related transactions | | | (2,693 | ) | | | (432 | ) |
| | | | | | | | |
| | | 6,780 | | | | 1,749 | |
Net increase (decrease) unrealized appreciation or depreciation on: | | | | | | | | |
Investments | | | (255,535 | ) | | | (14,114 | ) |
Foreign currency related transactions | | | 336 | | | | (9 | ) |
| | | | | | | | |
| | | (255,199 | ) | | | (14,123 | ) |
| | | | | | | | |
Net loss on investments and foreign currency related transactions | | | (248,419 | ) | | | (12,374 | ) |
| | | | | | | | |
Net decrease in net assets resulting from operations | | $ | (238,073 | ) | | $ | (13,373 | ) |
| | | | | | | | |
| | | | | | | | | | |
| (1) | | Fund | | Net of foreign taxes
withheld on dividends,
unaffiliated issuers | | | Including net realized
loss on investments
from affiliated issuers | |
| | Emerging Markets | | $ | 1,704 | | | $ | - | |
| | Growth Opportunities | | | 24 | | | | - | |
The accompanying notes are an integral part of the financial statements.
33
ARTISAN FUNDS
Statements of Operations – For the Year Ended September 30, 2011 (Continued)
Dollar values in thousands
| | | | | | | | |
| | | INTERNATIONAL | | | INTERNATIONAL
VALUE | |
| INVESTMENT INCOME: | | | | | | | | |
Dividends, from unaffiliated issuers(1) | | $ | 234,572 | | | $ | 98,683 | |
Dividends, from affiliated issuers(1) | | | - | | | | 3,587 | |
Interest | | | 35 | | | | 49 | |
Other | | | 9 | | | | - | |
| | | | | | | | |
Total investment income | | | 234,616 | | | | 102,319 | |
| | |
| EXPENSES: | | | | | | | | |
Advisory fees | | | 90,895 | | | | 42,061 | |
Transfer agent fees | | | | | | | | |
Investor Shares | | | 16,429 | | | | 6,539 | |
Institutional Shares | | | 22 | | | | 22 | |
Shareholder communications | | | | | | | | |
Investor Shares | | | 717 | | | | 463 | |
Institutional Shares | | | 34 | | | | 23 | |
Custodian fees | | | 3,992 | | | | 1,118 | |
Accounting fees | | | 69 | | | | 69 | |
Professional fees | | | 397 | | | | 209 | |
Registration fees | | | | | | | | |
Investor Shares | | | 84 | | | | 218 | |
Institutional Shares | | | 39 | | | | 80 | |
Directors’ fees | | | 311 | | | | 136 | |
Other operating expenses | | | 142 | | | | 68 | |
| | | | | | | | |
Total operating expenses | | | 113,131 | | | | 51,006 | |
| | | | | | | | |
Net investment income | | | 121,485 | | | | 51,313 | |
| | |
| NET REALIZED AND UNREALIZED GAINS (LOSSES) ON INVESTMENTS: | | | | | | | | |
Net realized gain (loss) on: | | | | | | | | |
Investments(1) | | | 994,852 | | | | 140,973 | |
Foreign currency related transactions | | | (79 | ) | | | (18,918 | ) |
| | | | | | | | |
| | | 994,773 | | | | 122,055 | |
Net increase (decrease) in unrealized appreciation or depreciation on: | | | | | | | | |
Investments | | | (1,875,691 | ) | | | (483,261 | ) |
Foreign currency related transactions | | | (1,399 | ) | | | 1,338 | |
| | | | | | | | |
| | | (1,877,090 | ) | | | (481,923 | ) |
| | | | | | | | |
Net loss on investments and foreign currency related transactions | | | (882,317 | ) | | | (359,868 | ) |
| | | | | | | | |
Net decrease in net assets resulting from operations | | $ | (760,832 | ) | | $ | (308,555 | ) |
| | | | | | | | |
| | | | | | | | | | |
| (1) | | Fund | | Net of foreign taxes
withheld on dividends,
unaffiliated issuers | | | Including net realized
gain on investments
from affiliated issuers | |
| | International | | $ | 18,737 | | | $ | (4,123 | ) |
| | International Value | | | 6,735 | | | | 3,755 | |
The accompanying notes are an integral part of the financial statements.
34
ARTISAN FUNDS
Statements of Operations – For the Year Ended September 30, 2011 (Continued)
Dollar values in thousands
| | | | | | | | |
| | | MID CAP | | | VALUE | |
| INVESTMENT INCOME: | | | | | | | | |
Dividends, from unaffiliated issuers(1) | | $ | 27,781 | | | $ | 8,062 | |
Interest | | | 32 | | | | 3 | |
| | | | | | | | |
Total investment income | | | 27,813 | | | | 8,065 | |
| | |
| EXPENSES: | | | | | | | | |
Advisory fees | | | 53,152 | | | | 2,953 | |
Transfer agent fees | | | | | | | | |
Investor Shares | | | 14,266 | | | | 1,033 | |
Institutional Shares | | | 20 | | | | 5 | |
Shareholder communications | | | | | | | | |
Investor Shares | | | 437 | | | | 84 | |
Institutional Shares | | | 19 | | | | 2 | |
Custodian fees | | | 202 | | | | 21 | |
Accounting fees | | | 65 | | | | 39 | |
Professional fees | | | 211 | | | | 60 | |
Registration fees | | | | | | | | |
Investor Shares | | | 147 | | | | 95 | |
Institutional Shares | | | 24 | | | | 10 | |
Directors’ fees | | | 178 | | | | 11 | |
Other operating expenses | | | 77 | | | | 9 | |
| | | | | | | | |
Total operating expenses | | | 68,798 | | | | 4,322 | |
| | | | | | | | |
Net investment income (loss) | | | (40,985 | ) | | | 3,743 | |
| | |
| NET REALIZED AND UNREALIZED GAINS (LOSSES) ON INVESTMENTS: | | | | | | | | |
Net realized gain (loss) on: | | | | | | | | |
Investments(1) | | | 665,237 | | | | 32,265 | |
Foreign currency related transactions | | | - | | | | (41 | ) |
| | | | | | | | |
| | | 665,237 | | | | 32,224 | |
Net decrease in unrealized appreciation or depreciation on: | | | | | | | | |
Investments | | | (348,059 | ) | | | (42,872 | ) |
Foreign currency related transactions | | | - | | | | (1 | ) |
| | | | | | | | |
| | | (348,059 | ) | | | (42,873 | ) |
| | | | | | | | |
Net gain (loss) on investments and foreign currency related transactions | | | 317,178 | | | | (10,649 | ) |
| | | | | | | | |
Net increase (decrease) in net assets resulting from operations | | $ | 276,193 | | | $ | (6,906 | ) |
| | | | | | | | |
| | | | | | | | | | |
| (1) | | Fund | | Net of foreign taxes
withheld on dividends,
unaffiliated issuers | | | Including net realized
gain on investments
from affiliated issuers | |
| | Mid Cap | | $ | 78 | | | $ | 8,059 | |
| | Value | | | 62 | | | | 651 | |
The accompanying notes are an integral part of the financial statements.
35
ARTISAN FUNDS
Statements of Changes in Net Assets
Dollar values in thousands
| | | | | | | | | | | | | | | | |
| | | EMERGING MARKETS | | | GROWTH OPPORTUNITIES | |
| | | Year Ended
9/30/2011 | | | Year Ended
9/30/2010 | | | Year Ended
9/30/2011 | | | Year Ended
9/30/2010 | |
| OPERATIONS: | | | | | | | | | | | | | | | | |
Net investment income (loss) | | $ | 10,346 | | | $ | 3,575 | | | $ | (999 | ) | | $ | (536 | ) |
Net realized gain (loss) on: | | | | | | | | | | | | | | | | |
Investments | | | 9,473 | | | | 9,712 | | | | 2,181 | | | | 2,089 | |
Foreign currency related transactions | | | (2,693 | ) | | | (1,401 | ) | | | (432 | ) | | | (74 | ) |
Net increase (decrease) in unrealized appreciation or depreciation on: | | | | | | | | | | | | | | | | |
Investments | | | (255,535 | ) | | | 43,790 | | | | (14,114 | ) | | | 9,555 | |
Foreign currency related transactions | | | 336 | | | | (484 | ) | | | (9 | ) | | | (1 | ) |
| | | | | | | | | | | | | | | | |
Net increase (decrease) in net assets resulting from operations | | | (238,073 | ) | | | 55,192 | | | | (13,373 | ) | | | 11,033 | |
| | | | |
| DISTRIBUTIONS PAID TO SHAREHOLDERS: | | | | | | | | | | | | | | | | |
Net investment income: | | | | | | | | | | | | | | | | |
Investor Shares | | | - | | | | - | | | | - | | | | - | |
Institutional Shares | | | (3,345 | ) | | | (988 | ) | | | - | | | | - | |
Advisor Shares | | | (1,835 | ) | | | (509 | ) | | | - | | | | - | |
Net realized gains on investment transactions: | | | | | | | | | | | | | | | | |
Investor Shares | | | - | | | | - | | | | (1,034 | ) | | | - | |
| | | | | | | | | | | | | | | | |
Total distributions paid to shareholders | | | (5,180 | ) | | | (1,497 | ) | | | (1,034 | ) | | | - | |
| | | | |
| FUND SHARE ACTIVITIES: | | | | | | | | | | | | | | | | |
Net increase in net assets resulting from fund share activities | | | 392,736 | | | | 311,692 | | | | 97,676 | | | | 15,868 | |
| | | | | | | | | | | | | | | | |
Total increase in net assets | | | 149,483 | | | | 365,387 | | | | 83,269 | | | | 26,901 | |
| | | | | | | | | | | | | | | | |
Net assets, beginning of period | | | 519,796 | | | | 154,409 | | | | 72,458 | | | | 45,557 | |
| | | | | | | | | | | | | | | | |
Net assets, end of period | | $ | 669,279 | | | $ | 519,796 | | | $ | 155,727 | | | $ | 72,458 | |
| | | | | | | | | | | | | | | | |
| | | | |
Accumulated undistributed net investment income (loss) | | $ | 4,668 | | | $ | 2,512 | | | $ | (412 | ) | | $ | (1 | ) |
| | | | | | | | | | | | | | | | |
The accompanying notes are an integral part of the financial statements.
36
ARTISAN FUNDS
Statements of Changes in Net Assets (Continued)
Dollar values in thousands
| | | | | | | | | | | | | | | | |
| | | INTERNATIONAL | | | INTERNATIONAL VALUE | |
| | | Year Ended
9/30/2011 | | | Year Ended
9/30/2010 | | | Year Ended
9/30/2011 | | | Year Ended
9/30/2010 | |
| OPERATIONS: | | | | | | | | | | | | | | | | |
Net investment income | | $ | 121,485 | | | $ | 90,536 | | | $ | 51,313 | | | $ | 36,645 | |
Net realized gain (loss) on: | | | | | | | | | | | | | | | | |
Investments | | | 994,852 | | | | (67,630 | ) | | | 140,973 | | | | (19,658 | ) |
Foreign currency related transactions | | | (79 | ) | | | (3,039 | ) | | | (18,918 | ) | | | (905 | ) |
Net increase (decrease) in unrealized appreciation or depreciation on: | | | | | | | | | | | | | | | | |
Investments | | | (1,875,691 | ) | | | 224,422 | | | | (483,261 | ) | | | 263,315 | |
Foreign currency related transactions | | | (1,399 | ) | | | 1,804 | | | | 1,338 | | | | 715 | |
| | | | | | | | | | | | | | | | |
Net increase (decrease) in net assets resulting from operations | | | (760,832 | ) | | | 246,093 | | | | (308,555 | ) | | | 280,112 | |
| | | | |
| DISTRIBUTIONS PAID TO SHAREHOLDERS: | | | | | | | | | | | | | | | | |
Net investment income: | | | | | | | | | | | | | | | | |
Investor Shares | | | (61,274 | ) | | | (94,522 | ) | | | (39,445 | ) | | | (34,820 | ) |
Institutional Shares | | | (26,489 | ) | | | (34,566 | ) | | | (12,501 | ) | | | (7,409 | ) |
Net realized gains on investment transactions: | | | | | | | | | | | | | | | | |
Investor Shares | | | - | | | | - | | | | - | | | | - | |
| | | | | | | | | | | | | | | | |
Total distributions paid to shareholders | | | (87,763 | ) | | | (129,088 | ) | | | (51,946 | ) | | | (42,229 | ) |
| | | | |
| FUND SHARE ACTIVITIES: | | | | | | | | | | | | | | | | |
Net increase (decrease) in net assets resulting from fund share activities | | | (973,666 | ) | | | (1,096,191 | ) | | | 1,298,269 | | | | 1,080,085 | |
| | | | | | | | | | | | | | | | |
Total increase (decrease) in net assets | | | (1,822,261 | ) | | | (979,186 | ) | | | 937,768 | | | | 1,317,968 | |
| | | | | | | | | | | | | | | | |
Net assets, beginning of period | | | 9,648,669 | | | | 10,627,855 | | | | 3,337,714 | | | | 2,019,746 | |
| | | | | | | | | | | | | | | | |
Net assets, end of period | | $ | 7,826,408 | | | $ | 9,648,669 | | | $ | 4,275,482 | | | $ | 3,337,714 | |
| | | | | | | | | | | | | | | | |
| | | | |
Accumulated undistributed net investment income (loss) | | $ | 121,055 | | | $ | 87,458 | | | $ | (12,850 | ) | | $ | 7,327 | |
| | | | | | | | | | | | | | | | |
The accompanying notes are an integral part of the financial statements.
37
ARTISAN FUNDS
Statements of Changes in Net Assets (Continued)
Dollar values in thousands
| | | | | | | | | | | | | | | | |
| | | MID CAP | | | VALUE | |
| | | Year Ended
9/30/2011 | | | Year Ended
9/30/2010 | | | Year Ended
9/30/2011 | | | Year Ended
9/30/2010 | |
| OPERATIONS: | | | | | | | | | | | | | | | | |
Net investment income (loss) | | $ | (40,985 | ) | | $ | (32,865 | ) | | $ | 3,743 | | | $ | 1,996 | |
Net realized gain on: | | | | | | | | | | | | | | | | |
Investments | | | 665,237 | | | | 94,003 | | | | 32,265 | | | | 9,335 | |
Foreign currency related transactions | | | - | | | | - | | | | (41 | ) | | | 3 | |
Net increase (decrease) in unrealized appreciation or depreciation on: | | | | | | | | | | | | | | | | |
Investments | | | (348,059 | ) | | | 818,287 | | | | (42,872 | ) | | | 8,010 | |
Foreign currency related transactions | | | - | | | | - | | | | (1 | ) | | | - | |
| | | | | | | | | | | | | | | | |
Net increase (decrease) in net assets resulting from operations | | | 276,193 | | | | 879,425 | | | | (6,906 | ) | | | 19,344 | |
| | | | |
| DISTRIBUTIONS PAID TO SHAREHOLDERS: | | | | | | | | | | | | | | | | |
Net investment income: | | | | | | | | | | | | | | | | |
Investor Shares | | | - | | | | - | | | | (2,455 | ) | | | (840 | ) |
Net realized gains on investment transactions: | | | | | | | | | | | | | | | | |
Investor Shares | | | - | | | | - | | | | - | | | | - | |
| | | | | | | | | | | | | | | | |
Total distributions paid to shareholders | | | - | | | | - | | | | (2,455 | ) | | | (840 | ) |
| | | | |
| FUND SHARE ACTIVITIES: | | | | | | | | | | | | | | | | |
Net increase (decrease) in net assets resulting from fund share activities | | | (143,118 | ) | | | (144,809 | ) | | | 205,150 | | | | 66,759 | |
| | | | | | | | | | | | | | | | |
Total increase in net assets | | | 133,075 | | | | 734,616 | | | | 195,789 | | | | 85,263 | |
| | | | | | | | | | | | | | | | |
Net assets, beginning of period | | | 4,877,681 | | | | 4,143,065 | | | | 266,373 | | | | 181,110 | |
| | | | | | | | | | | | | | | | |
Net assets, end of period | | $ | 5,010,756 | | | $ | 4,877,681 | | | $ | 462,162 | | | $ | 266,373 | |
| | | | | | | | | | | | | | | | |
| | | | |
Accumulated undistributed net investment income (loss) | | $ | - | | | $ | (133 | ) | | $ | 2,606 | | | $ | 1,405 | |
| | | | | | | | | | | | | | | | |
The accompanying notes are an integral part of the financial statements.
38
ARTISAN FUNDS
Financial Highlights – For a share outstanding throughout each period
The financial highlights table is intended to help you understand the Funds’ financial performance for the past 5 years or, if shorter, the period of a Fund’s operations. Certain information reflects financial results for a single Fund share. The total returns in the table represent the rate that an investor would have earned or lost on an investment in the Fund (assuming reinvestment of all dividends and distributions).
| | | | | | | | | | | | | | | | | | | | |
| | | ARTISAN EMERGING MARKETS FUND | |
| | | Institutional Shares | |
| |
| | | Year Ended | |
| | | | | |
| | | 9/30/2011 | | | 9/30/2010 | | | 9/30/2009 | | | 9/30/2008 | | | 9/30/2007 | |
| | | | | | | | | | | | | | | | | | | | |
Net Asset Value Beginning of Period | | $ | 15.23 | | | $ | 13.02 | | | $ | 11.15 | | | $ | 16.71 | | | $ | 11.15 | |
Net Investment Income(1) | | | 0.21 | | | | 0.17 | | | | 0.09 | | | | 0.18 | | | | 0.09 | |
Net Realized and Unrealized Gain (Loss) on Investments | | | (3.93 | ) | | | 2.15 | | | | 1.91 | | | | (5.41 | ) | | | 5.81 | |
| | | | | | | | | | | | | | | | | | | | |
Total Income (Loss) from Investment Operations | | | (3.72 | ) | | | 2.32 | | | | 2.00 | | | | (5.23 | ) | | | 5.90 | |
| | | | | | | | | | | | | | | | | | | | |
Dividends from Net Investment Income | | | (0.14 | ) | | | (0.11 | ) | | | (0.12 | ) | | | (0.01 | ) | | | (0.03 | ) |
Distributions from Net Realized Gains | | | - | | | | - | | | | (0.01 | ) | | | (0.32 | ) | | | (0.31 | ) |
| | | | | | | | | | | | | | | | | | | | |
Total Distributions | | | (0.14 | ) | | | (0.11 | ) | | | (0.13 | ) | | | (0.33 | ) | | | (0.34 | ) |
| | | | | | | | | | | | | | | | | | | | |
Net Asset Value End of Period | | $ | 11.37 | | | $ | 15.23 | | | $ | 13.02 | | | $ | 11.15 | | | $ | 16.71 | |
| | | | | | | | | | | | | | | | | | | | |
Total Return | | | (24.67 | )% | | | 17.94 | % | | | 18.66 | % | | | (31.91 | )% | | | 53.99 | % |
Net Assets End of Period (millions) | | $ | 352.1 | | | $ | 284.2 | | | $ | 104.0 | | | $ | 69.8 | | | $ | 18.4 | |
Ratio of Expenses to Average Net Assets(2) | | | 1.19 | % | | | 1.31 | % | | | 1.50 | % | | | 1.50 | % | | | 1.44 | % |
Ratio of Net Investment Income to Average Net Assets(2) | | | 1.41 | % | | | 1.25 | % | | | 1.02 | % | | | 1.17 | % | | | 0.67 | % |
Portfolio Turnover Rate | | | 30.86 | % | | | 25.89 | % | | | 56.88 | % | | | 42.24 | % | | | 71.28 | % |
| (1) | Computed based on average shares outstanding. |
| (2) | The ratios of expenses to average net assets and net investment income (loss) to average net assets exclude expenses waived or paid by the Adviser or the board of directors. Absent expenses waived or paid by the Adviser or the board of directors, the ratios of expenses to average net assets and net investment income (loss) to average net assets would have been as follows: |
| | | | | | | | |
Year or
Period Ended | | Ratio of Expenses to
Average Net Assets | | | Ratio of Net Investment Income
(Loss) to Average Net Assets | |
| 9/30/2009 | | | 1.81 | % | | | 0.71 | % |
| 9/30/2008 | | | 1.51 | % | | | 1.16 | % |
| 9/30/2007 | | | 3.19 | % | | | (1.08 | )% |
The accompanying notes are an integral part of the financial statements.
39
ARTISAN FUNDS
Financial Highlights – For a share outstanding throughout each period (Continued)
| | | | |
| | | ARTISAN GROWTH
OPPORTUNITIES FUND | |
| | | Institutional Shares | |
| |
| | | 9/30/2011(1) | |
| | | | |
Net Asset Value Beginning of Period | | $ | 13.38 | |
Net Investment Loss(2) | | | (0.02 | ) |
Net Realized and Unrealized Gain (Loss) on Investments | | | (2.48 | ) |
| | | | |
Total Loss from Investment Operations | | | (2.50 | ) |
| | | | |
Distributions from Net Realized Gains | | | - | |
| | | | |
Total Distributions | | | - | |
| | | | |
Net Asset Value End of Period | | $ | 10.88 | |
| | | | |
Total Return(3) | | | (18.68 | )% |
Net Assets End of Period (millions) | | $ | 13.0 | |
Ratio of Expenses to Average Net Assets(4)(5) | | | 1.50 | % |
Ratio of Net Investment Loss to Average Net Assets(4)(5) | | | (0.72 | )% |
Portfolio Turnover Rate(3) | | | 76.18 | % |
| (1) | For the period from commencement of operations July 26, 2011 through September 30, 2011. |
| (2) | Computed based on average shares outstanding. |
| (3) | Periods less than twelve months (where applicable) are not annualized. |
| (4) | Periods less than twelve months (where applicable) are annualized. |
| (5) | The ratios of expenses to average net assets and net investment income (loss) to average net assets exclude expenses waived or paid by the Adviser. Absent expenses waived or paid by the Adviser, the ratios of expenses to average net assets and net investment income (loss) to average net assets would have been as follows: |
| | | | | | | | |
Year or
Period Ended | | Ratio of Expenses to
Average Net Assets | | | Ratio of Net Investment
(Loss) to Average Net Assets | |
| 9/30/2011 | | | 2.22 | % | | | (1.44 | )% |
The accompanying notes are an integral part of the financial statements.
40
ARTISAN FUNDS
Financial Highlights – For a share outstanding throughout each period (Continued)
| | | | | | | | | | | | | | | | | | | | |
| | | ARTISAN INTERNATIONAL FUND | |
| | | Institutional Shares | |
| |
| | | Year Ended | |
| | | | | |
| | | 9/30/2011 | | | 9/30/2010 | | | 9/30/2009 | | | 9/30/2008 | | | 9/30/2007 | |
| | | | | | | | | | | | | | | | | | | | |
Net Asset Value Beginning of Period | | $ | 20.72 | | | $ | 20.29 | | | $ | 20.51 | | | $ | 33.99 | | | $ | 28.92 | |
Net Investment Income(1) | | | 0.32 | | | | 0.22 | | | | 0.28 | | | | 0.42 | | | | 0.37 | |
Net Realized and Unrealized Gain (Loss) on Investments | | | (2.31 | ) | | | 0.49 | | | | 0.46 | | | | (9.16 | ) | | | 7.52 | |
| | | | | | | | | | | | | | | | | | | | |
Total Income (Loss) from Investment Operations | | | (1.99 | ) | | | 0.71 | | | | 0.74 | | | | (8.74 | ) | | | 7.89 | |
| | | | | | | | | | | | | | | | | | | | |
Dividends from Net Investment Income | | | (0.23 | ) | | | (0.28 | ) | | | (0.26 | ) | | | (0.27 | ) | | | (0.49 | ) |
Distributions from Net Realized Gains | | | - | | | | - | | | | (0.70 | ) | | | (4.47 | ) | | | (2.33 | ) |
| | | | | | | | | | | | | | | | | | | | |
Total Distributions | | | (0.23 | ) | | | (0.28 | ) | | | (0.96 | ) | | | (4.74 | ) | | | (2.82 | ) |
| | | | | | | | | | | | | | | | | | | | |
Net Asset Value End of Period | | $ | 18.50 | | | $ | 20.72 | | | $ | 20.29 | | | $ | 20.51 | | | $ | 33.99 | |
| | | | | | | | | | | | | | | | | | | | |
Total Return | | | (9.76 | )% | | | 3.54 | % | | | 5.25 | % | | | (29.83 | )% | | | 28.99 | % |
Net Assets End of Period (millions) | | $ | 1,989.3 | | | $ | 2,353.9 | | | $ | 2,912.7 | | | $ | 3,043.8 | | | $ | 5,049.3 | |
Ratio of Expenses to Average Net Assets | | | 0.99 | % | | | 0.98 | % | | | 0.99 | % | | | 0.98 | % | | | 0.98 | % |
Ratio of Net Investment Income to Average Net Assets | | | 1.42 | % | | | 1.10 | % | | | 1.76 | % | | | 1.50 | % | | | 1.22 | % |
Portfolio Turnover Rate | | | 70.36 | % | | | 70.51 | % | | | 82.38 | % | | | 54.42 | % | | | 66.30 | % |
| (1) | Computed based on average shares outstanding. |
The accompanying notes are an integral part of the financial statements.
41
ARTISAN FUNDS
Financial Highlights – For a share outstanding throughout each period (Continued)
| | | | | | | | | | | | | | | | | | | | |
| | | ARTISAN INTERNATIONAL VALUE FUND | |
| | | Institutional Shares | |
| |
| | | Year Ended | |
| | | | | |
| | | 9/30/2011 | | | 9/30/2010 | | | 9/30/2009 | | | 9/30/2008 | | | 9/30/2007 | |
| | | | | | | | | | | | | | | | | | | | |
Net Asset Value Beginning of Period | | $ | 24.76 | | | $ | 22.83 | | | $ | 21.22 | | | $ | 28.53 | | | $ | 26.71 | |
Net Investment Income(1) | | | 0.35 | | | | 0.36 | | | | 0.21 | | | | 0.52 | | | | 0.41 | |
Net Realized and Unrealized Gain (Loss) on Investments | | | (1.24 | ) | | | 2.02 | | | | 1.66 | | | | (5.58 | ) | | | 3.14 | |
| | | | | | | | | | | | | | | | | | | | |
Total Income (Loss) from Investment Operations | | | (0.89 | ) | | | 2.38 | | | | 1.87 | | | | (5.06 | ) | | | 3.55 | |
| | | | | | | | | | | | | | | | | | | | |
Dividends from Net Investment Income | | | (0.40 | ) | | | (0.45 | ) | | | (0.26 | ) | | | (0.58 | ) | | | (0.45 | ) |
Distributions from Net Realized Gains | | | - | | | | - | | | | - | | | | (1.67 | ) | | | (1.28 | ) |
| | | | | | | | | | | | | | | | | | | | |
Total Distributions | | | (0.40 | ) | | | (0.45 | ) | | | (0.26 | ) | | | (2.25 | ) | | | (1.73 | ) |
| | | | | | | | | | | | | | | | | | | | |
Net Asset Value End of Period | | $ | 23.47 | | | $ | 24.76 | | | $ | 22.83 | | | $ | 21.22 | | | $ | 28.53 | |
| | | | | | | | | | | | | | | | | | | | |
Total Return | | | (3.84 | )% | | | 10.66 | % | | | 9.14 | % | | | (18.92 | )% | | | 13.48 | % |
Net Assets End of Period (millions) | | $ | 1,042.8 | | | $ | 649.6 | | | $ | 280.2 | | | $ | 186.1 | | | $ | 218.9 | |
Ratio of Expenses to Average Net Assets | | | 0.99 | % | | | 1.01 | % | | | 1.04 | % | | | 1.03 | % | | | 1.06 | % |
Ratio of Net Investment Income to Average Net Assets | | | 1.30 | % | | | 1.57 | % | | | 1.17 | % | | | 2.10 | % | | | 1.47 | % |
Portfolio Turnover Rate | | | 30.90 | % | | | 21.02 | % | | | 55.49 | % | | | 44.72 | % | | | 45.60 | % |
| (1) | Computed based on average shares outstanding. |
The accompanying notes are an integral part of the financial statements.
42
ARTISAN FUNDS
Financial Highlights – For a share outstanding throughout each period (Continued)
| | | | | | | | | | | | | | | | | | | | |
| | | ARTISAN MID CAP FUND | |
| | | Institutional Shares | |
| |
| | | Year Ended | |
| | | | | |
| | | 9/30/2011 | | | 9/30/2010 | | | 9/30/2009 | | | 9/30/2008 | | | 9/30/2007 | |
| | | | | | | | | | | | | | | | | | | | |
Net Asset Value Beginning of Period | | $ | 30.50 | | | $ | 25.00 | | | $ | 24.71 | | | $ | 37.78 | | | $ | 32.24 | |
Net Investment Loss(1) | | | (0.16 | ) | | | (0.14 | ) | | | (0.06 | ) | | | (0.14 | ) | | | (0.16 | ) |
Net Realized and Unrealized Gain (Loss) on Investments | | | 1.89 | | | | 5.64 | | | | 0.63 | | | | (7.03 | ) | | | 9.17 | |
| | | | | | | | | | | | | | | | | | | | |
Total Income (Loss) from Investment Operations | | | 1.73 | | | | 5.50 | | | | 0.57 | | | | (7.17 | ) | | | 9.01 | |
| | | | | | | | | | | | | | | | | | | | |
Dividends from Net Investment Income | | | - | | | | - | | | | - | | | | - | | | | - | |
Distributions from Net Realized Gains | | | - | | | | - | | | | (0.28 | ) | | | (5.90 | ) | | | (3.47 | ) |
| | | | | | | | | | | | | | | | | | | | |
Total Distributions | | | - | | | | - | | | | (0.28 | ) | | | (5.90 | ) | | | (3.47 | ) |
| | | | | | | | | | | | | | | | | | | | |
Net Asset Value End of Period | | $ | 32.23 | | | $ | 30.50 | | | $ | 25.00 | | | $ | 24.71 | | | $ | 37.78 | |
| | | | | | | | | | | | | | | | | | | | |
Total Return | | | 5.67 | % | | | 22.00 | % | | | 2.77 | % | | | (22.23 | )% | | | 30.17 | % |
Net Assets End of Period (millions) | | $ | 510.0 | | | $ | 502.4 | | | $ | 454.5 | | | $ | 537.2 | | | $ | 785.4 | |
Ratio of Expenses to Average Net Assets | | | 0.96 | % | | | 0.96 | % | | | 0.97 | % | | | 0.95 | % | | | 0.95 | % |
Ratio of Net Investment Loss to Average Net Assets | | | (0.47 | )% | | | (0.51 | )% | | | (0.32 | )% | | | (0.46 | )% | | | (0.47 | )% |
Portfolio Turnover Rate | | | 62.87 | % | | | 63.46 | % | | | 68.39 | % | | | 79.76 | % | | | 71.04 | % |
| (1) | Computed based on average shares outstanding. |
The accompanying notes are an integral part of the financial statements.
43
ARTISAN FUNDS
Financial Highlights – For a share outstanding throughout each period (Continued)
| | | | |
| | | ARTISAN VALUE FUND | |
| | | Institutional Shares | |
| |
| | | Year or Period Ended | |
| |
| | | 9/30/2011(1) | |
| | | | |
Net Asset Value Beginning of Period | | $ | 10.60 | |
Net Investment Income(2) | | | 0.02 | |
Net Realized and Unrealized Loss on Investments | | | (1.50 | ) |
| | | | |
Total Loss from Investment Operations | | | (1.48 | ) |
| | | | |
Dividends from Net Investment Income | | | - | |
Distributions from Net Realized Gains | | | - | |
| | | | |
Total Distributions | | | - | |
| | | | |
Net Asset Value End of Period | | $ | 9.12 | |
| | | | |
Total Return(3) | | | (13.96 | )% |
Net Assets End of Period (millions) | | $ | 53.5 | |
Ratio of Expenses to Average Net Assets(4) | | | 1.09 | % |
Ratio of Net Investment Income to Average Net Assets(4) | | | 1.02 | % |
Portfolio Turnover Rate(3) | | | 78.36 | % |
| (1) | For the period from commencement of operations July 26, 2011 through September 30, 2011. |
| (2) | Computed based on average shares outstanding. |
| (3) | Periods less than twelve months (where applicable) are not annualized. |
| (4) | Periods less than twelve months (where applicable) are annualized. |
The accompanying notes are an integral part of the financial statements.
44
ARTISAN FUNDS
Notes to Financial Statements – September 30, 2011
Artisan Partners Funds, Inc. (“Artisan Funds”) was incorporated on January 5, 1995, as a Wisconsin corporation and is registered under the Investment Company Act of 1940, as amended. Effective July 1, 2011, Artisan Partners Funds, Inc. changed its name from Artisan Funds, Inc. but continues to do business as Artisan Funds. Artisan Funds is a series comprised of twelve open-end, diversified mutual funds. Artisan Emerging Markets Fund (“Emerging Markets Fund” or “Emerging Markets”), Artisan Growth Opportunities Fund (“Growth Opportunities Fund” or “Growth Opportunities”), Artisan International Fund (“International Fund” or “International”), Artisan International Value Fund (“International Value Fund” or “International Value”), Artisan Mid Cap Fund (“Mid Cap Fund” or “Mid Cap”) and Artisan Value Fund (“Value Fund” or “Value”), each a series of Artisan Funds (each a “Fund,” and collectively, the “Funds”), commenced operations on June 26, 2006, September 22, 2008, December 28, 1995, September 23, 2002, June 27, 1997 and March 27, 2006, respectively. Each Fund’s investment objective is to seek long-term capital growth.
Artisan Growth Opportunities Fund changed its name from Artisan Opportunistic Growth Fund effective January 28, 2011. Artisan Value Fund changed its name from Artisan Opportunistic Value Fund effective December 1, 2010.
Emerging Markets Fund offers shares of capital stock of two classes – Institutional Shares and Advisor Shares – and has offered Institutional Shares since the commencement of operations and began offering Advisor Shares on June 2, 2008. Advisor Shares are sold to employee benefit plans, clients of financial advisors, clients of sponsored programs and institutional or other investors. All investments and exchanges are subject to approval by the Fund. Growth Opportunities Fund, International Fund, International Value Fund, Mid Cap Fund and Value Fund offer shares of capital stock of two classes – Institutional Shares and Investor Shares – and have offered Investor Shares since the commencement of operations. Growth Opportunities Fund, International Fund, International Value Fund, Mid Cap Fund and Value Fund began offering Institutional Shares on July 26, 2011, July 1, 1997, October 1, 2006, July 1, 2000 and July 26, 2011, respectively.
Each class of shares has equal rights with respect to portfolio assets and voting privileges. Each class has exclusive voting rights with respect to any matters involving only that class.
Income, expenses not specific to a particular class and realized and unrealized gains and losses were allocated daily to each class of shares based upon the relative net asset value of outstanding shares. Expenses attributable to a particular class of shares, such as transfer agency fees, shareholder communication expenses and registration fees, were allocated directly to that class.
Each Fund is managed by Artisan Partners Limited Partnership (the “Adviser” or “Artisan Partners”). The Adviser is wholly owned by Artisan Partners Holdings LP (“Artisan Holdings”).
| (2) | Summary of significant accounting policies: |
The following is a summary of significant accounting policies of the Funds in effect during the period covered by the financial statements, which were in accordance with United States generally accepted accounting principles.
45
NOTES TO FINANCIAL STATEMENTS
| (a) | Security valuation – The net asset value (“NAV”) of the shares of each class of each Fund was determined as of the close of regular session trading on the New York Stock Exchange (“NYSE”) (usually 4:00 p.m., Eastern Time) each day the NYSE was open for regular session trading. The NAV of each class of shares was determined by dividing the value of each Fund’s securities and other assets attributed to that class, less its liabilities attributed to that class, by the number of outstanding shares of that class of that Fund. |
| | In determining NAV, each equity security traded on a securities exchange, including over-the-counter securities, was valued at the closing price as of the time of valuation on the exchange or market designated as the principal exchange (the “principal exchange”). The closing price provided by the pricing vendor for a principal exchange may differ and may represent information such as last sales price, an official closing price, a closing auction price or other information, depending on exchange or market convention. Absent closing price information from the principal exchange as of the time of valuation, the security was valued using the closing price on another exchange on which the security traded (if such price is made available by the pricing vendor) or the most recent bid quotation on the principal exchange or, if not available, another exchange or in the over-the-counter market. Short-term investments, other than repurchase agreements, maturing within sixty days from the valuation date were valued at amortized cost, which approximates market value. |
| | Exchange traded option contracts were valued at the last sale or official closing price on the exchange where an option is principally traded or, if no sales or closing prices were available, at the mean of the most recent bid and ask quotation on the principal exchange. |
| | Securities for which prices were not readily available were valued by Artisan Funds’ valuation committee (the “valuation committee”) at a fair value determined in good faith under procedures established by and under the general supervision of Artisan Funds’ board of directors (the “board of directors”). A price was considered to be not readily available if, among other things, the valuation committee believed that the price determined as described in the preceding paragraphs did not reflect a fair value of the security. |
| | Emerging Markets Fund, Growth Opportunities Fund, International Fund and International Value Fund generally invested a significant portion, and perhaps as much as substantially all, of their total assets in securities principally traded in markets outside the U.S. Value Fund had the ability to invest, and did invest, in securities principally traded outside the U.S. The foreign markets in which the Funds invested were sometimes open on days when the NYSE was not open and the Funds did not calculate their NAVs, and sometimes were not open on days when the Funds did calculate their NAVs. Even on days on which both the foreign market and the NYSE were open, several hours may have passed between the time when trading in the foreign market closed and the time as of which the Funds calculated their NAVs. That was generally the case for markets in Europe, Asia, Australia and other far eastern markets; the regular closing time of foreign markets in North and South America was generally the same as the closing time of the NYSE and the time as of which the Funds calculated their NAVs. |
46
NOTES TO FINANCIAL STATEMENTS
| | The valuation committee concluded that a price determined under the Funds’ valuation procedures was not readily available if, among other things, the valuation committee believed that the value of the security might have been materially affected by events occurring after the close of the market in which the security was principally traded but before the time for determination of NAV (“subsequent event”). A subsequent event might include a company-specific development (for example, announcement of a merger that is made after the close of the foreign market), a development that might affect an entire market or region (for example, imposition of foreign exchange controls by a foreign government), a potentially global development (such as a terrorist attack that may be expected to have an impact on investor expectations worldwide) or a significant change in one or more U.S. securities indices. Artisan Funds monitored for subsequent events using several tools. An indication by any of those tools of a potential material change in the value of securities resulted in either a meeting of the valuation committee, which considered whether a subsequent event had occurred and whether local market closing prices continued to represent fair values for potentially affected non-U.S. securities, and/or a valuation based on information provided by a third party research service. This third party research service was used to assist in determining estimates of fair values for foreign securities. That service utilized statistical data based on historical performance of securities, markets and other data in developing factors used to estimate a fair value. |
| | Estimates of fair values utilized by the Funds as described above may differ from the value realized on the subsequent sale of those securities and from quoted or published prices for those securities. The differences may have been material to the NAV of the applicable Fund or to the information presented. |
| | Foreign stocks, as an asset class, may underperform U.S. stocks, and foreign stocks may be more volatile than U.S. stocks. Risks relating to investment in foreign securities (including, but not limited to, depositary receipts and participation certificates) include: currency exchange rate fluctuation; less available public information about the issuers of securities; less stringent regulatory standards; lack of uniform accounting, auditing and financial reporting standards; and country risks including less liquidity, high inflation rates, unfavorable economic practices and political instability. |
| | The risks of foreign investments typically are greater in emerging and less developed markets. For example, political and economic structures in these less developed countries may be new and changing rapidly, which may cause instability and greater risk of loss. Their securities markets may be less developed, and securities in those markets are generally more volatile and less liquid than those in developed markets. Emerging market countries also are more likely to experience high levels of inflation, deflation or currency devaluations, which could hurt their economies and securities markets. Certain emerging markets also may face other significant internal or external risks, including a heightened risk of war, and ethnic, religious and racial conflicts. In addition, governments in many emerging market countries participate to a significant degree in their economies and securities markets, which may impair investment and economic growth of companies in those markets. High levels of national debt tend to make such markets also heavily reliant on foreign capital and, therefore, vulnerable to capital flight. |
47
NOTES TO FINANCIAL STATEMENTS
| (b) | Fair value measurements – Under generally accepted accounting principles for fair value measurement, accounting standards clarify the definition of fair value for financial reporting, establish a framework for measuring fair value and require additional disclosures about the use of fair value measurements. In accordance with this standard, fair value is defined as the price that each Fund would receive upon selling an investment in an orderly transaction to an independent buyer in the principal or most advantageous market of the investment. The standard establishes a three-tier hierarchy to distinguish between (1) inputs that reflect the assumptions market participants would use in pricing an asset or liability developed based on the market data obtained from sources independent of the reporting entity (observable inputs) and (2) inputs that reflect the reporting entity’s own assumptions about the assumptions market participants would use in pricing an asset or liability developed based on the best information available in the circumstances (unobservable inputs) and to establish classification of fair value measurements for disclosure purposes. Various inputs are used in determining the value of the Funds’ investments. The three-tier hierarchy of inputs is summarized in three broad levels: |
| | • | | Level 1 – quoted prices in active markets for identical investments |
| | • | | Level 2 – other significant observable inputs (including but not limited to quoted prices for similar securities, interest rates, credit risks, etc. Securities primarily traded outside the U.S., whose values were adjusted as result of significant market movements, are classified as level 2) |
| | • | | Level 3 – significant unobservable inputs (including the Funds’ own assumptions in determining a fair value of investments) |
| | The inputs or methodology used for valuing securities are not necessarily an indication of the risk or liquidity associated with investing in those securities. |
| | The following table summarizes each Fund’s investments by major security type, based on the inputs used to determine their fair values as of September 30, 2011 (in thousands): |
| | | | | | | | | | | | | | | | |
| Fund | | Level 1 - Quoted
Prices | | | Level 2 - Other Significant
Observable Inputs | | | Level 3 - Significant
Unobservable Inputs | | | Total | |
Emerging Markets | | | | | | | | | | | | | | | | |
Equity Securities(1) | | | | | | | | | | | | | | | | |
Developed Markets | | $ | 3,696 | | | $ | 14,748 | | | $ | - | | | $ | 18,444 | |
Emerging Asia | | | 10,334 | | | | 311,831 | | | | - | | | | 322,165 | |
Emerging Europe, Middle East & Africa | | | 6,135 | | | | 132,982 | | | | - | | | | 139,117 | |
Latin America | | | 176,630 | | | | - | | | | - | | | | 176,630 | |
Repurchase Agreements | | | - | | | | 7,346 | | | | - | | | | 7,346 | |
Total | | $ | 196,795 | | | $ | 466,907 | (2) | | | - | | | $ | 663,702 | |
48
NOTES TO FINANCIAL STATEMENTS
| | | | | | | | | | | | | | | | |
| Fund | | Level 1 - Quoted
Prices | | | Level 2 - Other Significant
Observable Inputs | | | Level 3 - Significant
Unobservable Inputs | | | Total | |
Growth Opportunities | | | | | | | | | | | | | | | | |
Equity Securities(1): | | | | | | | | | | | | | | | | |
Americas | | $ | 96,625 | | | $ | - | | | $ | - | | | $ | 96,625 | |
Emerging Markets | | | 18,186 | | | | 8,593 | | | | - | | | | 26,779 | |
Europe | | | 2,421 | | | | 12,587 | | | | - | | | | 15,008 | |
Pacific Basin | | | - | | | | 4,887 | | | | - | | | | 4,887 | |
Repurchase Agreements | | | - | | | | 10,298 | | | | - | | | | 10,298 | |
Total Investments in Securities | | | 117,232 | | | | 36,365 | | | | - | | | | 153,597 | |
Derivatives: | | | | | | | | | | | | | | | | |
Foreign Currency Forward Contracts(3) | | | - | | | | 5 | | | | - | | | | 5 | |
Total | | $ | 117,232 | | | $ | 36,370 | (2) | | $ | - | | | $ | 153,602 | |
International | | | | | | | | | | | | | | | | |
Equity Securities(1): | | | | | | | | | | | | | | | | |
Americas | | $ | 397,669 | | | $ | - | | | $ | - | | | $ | 397,669 | |
Emerging Markets | | | 288,034 | | | | 338,807 | | | | - | | | | 626,841 | |
Europe | | | - | | | | 4,084,752 | | | | - | | | | 4,084,752 | |
Middle East | | | - | | | | - | | | | - | | | | - | |
Pacific Basin | | | - | | | | 2,438,039 | | | | - | | | | 2,438,039 | |
Repurchase Agreements | | | - | | | | 246,213 | | | | - | | | | 246,213 | |
Total | | $ | 685,703 | | | $ | 7,107,811 | (2) | | $ | - | | | $ | 7,793,514 | |
International Value | | | | | | | | | | | | | | | | |
Equity and Equity-Linked Securities(1): | | | | | | | | | | | | | | | | |
Americas | | $ | 725,861 | | | $ | - | | | $ | - | | | $ | 725,861 | |
Emerging Markets | | | - | | | | 21,934 | | | | - | | | | 21,934 | |
Europe | | | 168,562 | | | | 2,481,284 | | | | - | | | | 2,649,846 | |
Pacific Basin | | | - | | | | 690,238 | | | | - | | | | 690,238 | |
Repurchase Agreements | | | - | | | | 128,934 | | | | - | | | | 128,934 | |
Total Investments in Securities | | | 894,423 | | | | 3,322,390 | | | | - | | | | 4,216,813 | |
Derivatives: | | | | | | | | | | | | | | | | |
Foreign Currency Forward Contracts(3) | | | - | | | | 1,905 | | | | - | | | | 1,905 | |
Total | | $ | 894,423 | | | $ | 3,324,295 | (2) | | $ | - | | | $ | 4,218,718 | |
Mid Cap | | | | | | | | | | | | | | | | |
Equity Securities(1) | | $ | 4,790,407 | | | $ | - | | | $ | - | | | $ | 4,790,407 | |
Repurchase Agreements | | | - | | | | 241,658 | | | | - | | | | 241,658 | |
Total | | $ | 4,790,407 | | | $ | 241,658 | | | $ | - | | | $ | 5,032,065 | |
49
NOTES TO FINANCIAL STATEMENTS
| | | | | | | | | | | | | | | | |
| Fund | | Level 1 - Quoted
Prices | | | Level 2 - Other Significant
Observable Inputs | | | Level 3 - Significant
Unobservable Inputs | | | Total | |
Value | | | | | | | | | | | | | | | | |
Equity Securities(1): | | | | | | | | | | | | | | | | |
Consumer Discretionary | | $ | 42,139 | | | $ | - | | | $ | - | | | $ | 42,139 | |
Consumer Staples | | | 30,307 | | | | 16,974 | | | | - | | | | 47,281 | |
Energy | | | 49,628 | | | | - | | | | - | | | | 49,628 | |
Financials | | | 126,545 | | | | - | | | | - | | | | 126,545 | |
Healthcare | | | 13,421 | | | | - | | | | - | | | | 13,421 | |
Industrials | | | 12,086 | | | | - | | | | - | | | | 12,086 | |
Information Technology | | | 159,414 | | | | - | | | | - | | | | 159,414 | |
Repurchase Agreements | | | - | | | | 10,526 | | | | - | | | | 10,526 | |
Total | | $ | 433,540 | | | $ | 27,500 | (2) | | $ | - | | | $ | 461,040 | |
(1)See Fund’s Schedule of Investments for sector or country classifications. | |
(2) Includes securities trading primarily outside the U.S. whose value the Fund adjusted as a result of significant market movements following the close of local trading. | |
(3) Derivative instruments are valued at unrealized appreciation. | |
| | Transfers between investment levels may occur as markets fluctuate and/or the availability of data used in an investment’s valuation changes. The Funds recognize transfers between levels as of the end of the period. At September 30, 2011, the fair market value of certain securities were adjusted, resulting in their Level 2 classification, due to developments that occurred between the time of the close of the foreign markets on which they trade and the close of regular session trading on the NYSE. The following table summarizes security transfers from Level 1 to Level 2 for each Fund as of September 30, 2011 (in thousands): |
| | | | |
| | | Transfers from Level 1 to Level 2 | |
Emerging Markets | | $ | 357,984 | |
Growth Opportunities Fund | | | 9,831 | |
International | | | 4,297,816 | |
International Value | | | 2,395,331 | |
| | As of September 30, 2011, there were no transfers of Level 3 securities. |
| (c) | Taxes – No provision was made for federal income taxes or excise taxes since each Fund intends to (i) comply with the provisions of Subchapter M of the Internal Revenue Code applicable to regulated investment companies and (ii) distribute to its shareholders substantially all of its taxable income as well as net realized gains from the sale of investment securities. The Funds may utilize earnings and profits distributed to shareholders on redemptions of Fund shares as part of the dividends paid deduction. |
| | The Funds have analyzed the tax positions taken on federal income tax returns for all open tax years (fiscal years 2008 through 2010) and have concluded that as of September 30, 2011, no provision for income tax is required in the Funds’ financial statements. The Funds’ federal and state income and federal excise tax returns for tax years for which the applicable statutes of limitations have not expired are subject to examination by the Internal Revenue Service and each state’s department of revenue. |
50
NOTES TO FINANCIAL STATEMENTS
| | The Funds may be subject to taxes on realized gains from the sale of investment securities imposed by certain countries in which the Funds invest. The foreign tax expense, if any, was recorded on an accrual basis and is included in “Net realized gain (loss) on investments” on the accompanying Statements of Operations. The amount of foreign tax owed, including withholding taxes of foreign dividends, is included in “Payable for foreign taxes” on the accompanying Statements of Assets and Liabilities. |
| (d) | Portfolio transactions – In determining a Fund’s NAV, security transactions and shareholder transactions were accounted for no later than one business day after trade date, in accordance with applicable regulations. However, for financial reporting purposes, security transactions and shareholder transactions were recorded on trade date in accordance with United States generally accepted accounting principles. Net realized gains and losses on securities were computed on specific security lot identification. |
| (e) | Foreign currency translation – Values of foreign investments, open foreign currency forward contracts, payables for capital gains taxes, payables and receivables for securities transactions, dividend and reclaim receivables, other receivables and payables, and cash denominated in a foreign currency were translated into U.S. dollars using a spot market rate of exchange as of the time of determination of each Fund’s NAV on the day of valuation. Purchases and sales of investments and dividend and interest income were translated into U.S. dollars using the current spot market rate of exchange on the date of such transactions. The portion of security gains or losses resulting from changes in foreign exchange rates was included with net realized and unrealized gain or loss from investments, as appropriate, for both financial reporting and tax purposes. |
| | The Funds may enter into (a) foreign currency contracts, and (b) foreign currency forward contracts. Foreign currency contracts are used to facilitate the purchase and sale of non-U.S. securities and generally settle within three business days. Foreign currency forward contracts are used to hedge against foreign currency exchange rate risks on its non-U.S. dollar denominated investment securities. Open foreign currency contracts and foreign currency forward contracts, if any, were recorded at market value and recorded in the Statements of Assets and Liabilities. Realized and unrealized gains and losses were reported as foreign currency related transactions are recorded in the Statements of Operations. |
| | As of September 30, 2011, Growth Opportunities and International Value had outstanding foreign currency forward contracts, as shown on the Schedules of Investments. Foreign currency contracts are not separately disclosed in the Schedules of Investments. |
| | For tax purposes, these foreign exchange gains and losses were treated as ordinary income or loss. The Funds could be exposed to loss if the counterparties fail to perform under these contracts. Other foreign currency related transaction gains and losses may result from currency gains and losses realized from the difference between the amounts of dividends and foreign withholding taxes recorded on the Funds’ books and the U.S. dollar equivalent of the amounts actually received or paid. The net increase (decrease) in unrealized appreciation or depreciation on foreign currency related transactions arose from changes in the values of assets and liabilities, other than investments in securities, resulting from changes in foreign exchange rates. |
51
NOTES TO FINANCIAL STATEMENTS
| (f) | Options – The Funds may purchase and write call or put options on securities and indices and enter into related closing transactions. As a holder of a call option, the Fund has the right, but not the obligation, to purchase a security at the exercise price during the exercise period. As the writer of a call option, the Fund has the obligation to sell the security at the exercise price during the exercise period in the event the option is exercised. As a holder of a put option, the Fund has the right, but not the obligation, to sell a security at the exercise price during the exercise period. As the writer of a put option, the Fund has the obligation to buy the underlying security at the exercise price during the exercise period in the event the option is exercised. |
| | The premium that the Fund pays when purchasing an option or that the Fund receives when writing an option will reflect, among other things, the market price of the security, the relationship of the exercise price to the market price of the security, the relationship of the exercise price to the volatility of the security, the length of the option period and supply and demand factors. The premium is the market value of an option at the time of the trade. |
| | When the Fund writes (sells) an option, an amount equal to the premium received by the Fund is included in the Statements of Assets and Liabilities as an equivalent liability. The amount of the liability is subsequently marked-to-market to reflect the current value of the option written. Premiums received from writing options that expire are treated as realized gains. Premiums received from writing options that are exercised or closed are added to the proceeds or offset against the amounts paid on the underlying security transaction to determine the realized gain or loss. |
| | When the Fund purchases an option, the Fund pays a non-refundable premium to the seller (writer) of the option. The Fund includes the premium paid in the Statements of Assets and Liabilities as an equivalent asset. The amount of the asset is subsequently marked-to-market to reflect the current value of the option purchased. Premiums paid for purchased call and put options that have expired are treated as realized losses on investments in the Statements of Operations. Upon the exercise or closing of a purchased call option, the premium paid is added to the cost of the security or financial instrument. Upon the exercise or closing of a purchased put option, the premium paid is offset against the proceeds on the sale of the underlying security or financial instrument in order to determine the realized gain or loss on investments. |
| | Growth Opportunities Fund entered into written call options during the year ended September 30, 2011 as follows: |
| | | | | | | | |
| | | Number of Contracts | | | Premiums Received
(in thousands) | |
Options outstanding at beginning of period | | | - | | | | - | |
Options written | | | 40 | | | $ | 11 | |
Options terminated in closing transactions | | | (40 | ) | | | (11 | ) |
Options outstanding at end of period | | | - | | | | - | |
| (g) | Repurchase agreements – Each Fund may enter into repurchase agreements with institutions that the Adviser determined were creditworthy pursuant to criteria adopted by the board of directors. Repurchase agreements were recorded at cost plus |
52
NOTES TO FINANCIAL STATEMENTS
| | accrued interest and were collateralized in an amount greater than or equal to the repurchase price plus accrued interest. Collateral (in the form of U.S. government securities) was held by the Funds’ custodian and in the event of default on the obligation of the counterparty to repurchase, the Funds had the right to liquidate the collateral and apply the proceeds in satisfaction of the obligation. If the proceeds from any sale of such collateral were less than the repurchase price, the Fund would have suffered a loss. |
| (h) | Depositary receipts – Each of the Funds may invest in depositary receipts. Depositary receipts are typically issued by a financial institution (a “depositary”), evidencing ownership interests in a security issued by an issuer and deposited with the depositary. |
| (i) | Equity-linked participation certificates – Emerging Markets Fund, Growth Opportunities Fund, International Fund, International Value Fund, and Value Fund may invest in equity-linked participation certificates. Equity-linked participation certificates are derivative securities which are designed to provide synthetic exposure to one or more underlying securities. An investment in an equity-linked participation certificate typically entitles the holder to a return equal to the market return of the underlying security or securities, subject to the credit risk of the issuing financial institution. There is no off-balance sheet risk associated with equity-linked participation certificates and the Funds’ potential loss is limited to the purchase price of the securities. The Funds are exposed to credit risk associated with the counterparty to the transaction, which is monitored by the Funds’ management on a periodic basis. |
| (j) | Commission recapture – Each of the Funds had the ability to direct portfolio trades to various brokers that have agreed to rebate a portion of the commissions generated. Such cash rebates were made directly to the applicable Fund and were included in net realized gain or loss on investments in the Statements of Operations for the year ended September 30, 2011 as follows (in thousands): |
| | | | |
Emerging Markets | | $ | 6 | |
Growth Opportunities | | | 8 | |
International | | | 554 | |
International Value | | | 116 | |
Mid Cap | | | 353 | |
Value | | | 35 | |
| (k) | Use of estimates – The preparation of financial statements in conformity with United States generally accepted accounting principles requires management to make estimates and assumptions that affect the reported amounts and disclosures in the financial statements. Actual results could differ from those estimates. |
| (l) | Indemnifications – In the normal course of business, the Funds have entered into contracts in which the Funds agree to indemnify the other party or parties against various potential costs or liabilities. The Funds’ maximum exposure under these arrangements is unknown. No claim has been made for indemnification pursuant to any such agreement of the Funds. |
| (m) | Other – Dividend income less foreign taxes withheld, if any, was generally recorded on the ex-dividend date. In some cases, the information was not available to the Fund |
53
NOTES TO FINANCIAL STATEMENTS
| | on the ex-dividend date. In such cases, which may have included private placements and foreign securities, dividends were recorded as soon after the ex-dividend date as reliable information became available to the Funds. Non-cash dividends included in dividend income, if any, were generally recorded at the fair market value of securities received. Interest income was reported on the accrual basis. Distributions to shareholders were recorded on the ex-dividend date. Expenses attributable to Artisan Funds were generally allocated to each Fund based on net assets. However, other expense allocation methodologies were used, depending on the nature of the expense item. Expenses attributable to a particular Fund or class were allocated directly to that Fund or class. |
| | The character of income and net realized gains and losses may differ in some instances for financial statement and tax purposes and may result in reclassification of permanent differences among certain capital accounts to more appropriately conform financial accounting to tax characterizations of dividend and capital gain distributions. |
| | Emerging Markets Fund, Growth Opportunities Fund, International Fund and International Value Fund generally imposed a 2% redemption fee on Fund shares held 90 days or less. Those redemption fees were recorded as a reduction in the cost of shares redeemed and had the primary effect of increasing paid-in capital. Each Fund reserved the right to waive or reduce the 2% redemption fee on Fund shares held 90 days or less at its discretion when the Fund believed such waiver was in the best interests of the Fund, including but not limited to when it determined that imposition of the redemption fee was not necessary to protect the Fund from the effects of short-term trading. The Funds waived the fee on redemption of shares held by certain authorized agents or other Fund intermediaries and otherwise in accordance with the Funds’ prospectus. |
| (n) | New accounting pronouncement – In May 2011, the FASB issued Accounting Standards Update (“ASU”) No. 2011-4, “Amendments to Achieve Common Fair Value Measurement and Disclosure Requirements” in GAAP and the International Financial Reporting Standards (“IFRS”). ASU No. 2011-4 amends FASB ASC Topic 820, Fair Value Measurements and Disclosures, to establish common requirements for measuring fair value and disclosing information about fair value measurements in accordance with GAAP and IFRS. ASU No. 2011-4 is effective for fiscal years beginning after December 15, 2011 and for interim periods within those fiscal years. The Funds’ management is currently evaluating the impact these amendments may have on the Funds’ financial statements. |
| (3) | Derivative transactions: |
The fair value of derivative instruments as reported in the Statements of Assets and Liabilities as of September 30, 2011 was as follows (in thousands):
| | | | | | | | |
| Fund | | Risk Exposure Category | | Statement of Assets and
Liabilities location | | Value | |
| Growth Opportunities | | Foreign currency forward contracts | | Unrealized gain on foreign currency contracts | | $ | 5 | |
| International Value | | Foreign currency forward contracts | | Unrealized gain on foreign currency contracts | | $ | 1,905 | |
| (1) | Amount rounds to less than $1. |
54
NOTES TO FINANCIAL STATEMENTS
The effect of derivative instruments on the Statements of Operations for the year ended September 30, 2011 was as follows (in thousands):
Amount of Realized Gain (Loss) on Derivatives Recognized in Income
| | | | | | | | |
| Fund | | Risk Exposure Category | | Statement of Operations location | | Value | |
| Growth Opportunities | | Foreign currency forward contracts | | Net realized loss on foreign currency related transactions | | $ | (78 | ) |
| | | Purchased Options | | Net realized loss on investments | | $ | (5 | ) |
| | | Written Options | | Net realized gain on investments | | | 9 | |
| Total | | | | | | $ | (74 | ) |
| International Value | | Foreign currency forward contracts | | Net realized gain (loss) on foreign currency related transactions | | $ | (19,617 | ) |
Change in Unrealized Appreciation (Depreciation) on Derivatives Recognized in Income
| | | | | | | | |
| Fund | | Risk Exposure Category | | Statement of Operations location | | Value | |
| Growth Opportunities | | Foreign currency forward contracts | | Net increase in unrealized appreciation or depreciation on foreign currency related transactions | | | 5 | |
| International Value | | Foreign currency forward contracts | | Net increase in unrealized appreciation or depreciation on foreign currency related transactions | | | 1,905 | |
Volume of derivative activity
For the year ended September 30, 2011, Growth Opportunities Fund held and closed out of two foreign currency forward contracts in addition to one foreign currency forward contract that is presented on each of the respective Schedules of Investments. International Value Fund held and closed out of three foreign currency forward contracts in addition to one foreign currency forward contract that is presented on the Schedule of Investments.
For the year ended September 30, 2011, Growth Opportunities Fund held and closed out of 40 written call option contracts and 80 purchased put option contracts.
| (4) | Transactions with affiliates: |
The Adviser, with which the officers and a director of Artisan Funds were affiliated, provided investment advisory and administrative services to the Funds. In exchange for those services, each Fund paid a monthly management fee to the Adviser as follows:
Emerging Markets Fund
| | | | |
Average Daily Net Assets | | Annual Rate | |
All | | | 1.050 | % |
55
NOTES TO FINANCIAL STATEMENTS
International Value Fund and Mid Cap Fund
| | | | |
Average Daily Net Assets | | Annual Rate | |
Less than $500 million | | | 1.000 | % |
$500 million to $750 million | | | 0.975 | |
$750 million to $1 billion | | | 0.950 | |
Greater than $1 billion | | | 0.925 | |
International Fund
| | | | |
Average Daily Net Assets | | Annual Rate | |
Less than $500 million | | | 1.000 | % |
$500 million to $750 million | | | 0.975 | |
$750 million to $1 billion | | | 0.950 | |
$1 billion to $12 billion | | | 0.925 | |
Greater than $12 billion | | | 0.900 | |
Growth Opportunities Fund and Value Fund (for the period October 1, 2010 to November 30, 2010)
| | | | |
Average Daily Net Assets | | Annual Rate | |
Less than $1 billion | | | 0.900 | % |
$1 billion to $4 billion | | | 0.875 | |
$4 billion to $8 billion | | | 0.850 | |
$8 billion to $12 billion | | | 0.825 | |
Greater than $12 billion | | | 0.800 | |
Value Fund (for the period December 1, 2010 to September 30, 2011)
| | | | |
Average Daily Net Assets | | Annual Rate | |
Less than $50 million | | | 0.800 | % |
$50 million to $100 million | | | 0.760 | |
$100 million to $500 million | | | 0.720 | |
$500 million to $7.5 billion | | | 0.680 | |
Greater than $7.5 billion | | | 0.640 | |
The Adviser has contractually agreed to waive its management fee, and to the extent that the fee waiver is insufficient, to reimburse Emerging Markets and Growth Opportunities Fund for any ordinary operating expenses in an amount sufficient to cause the Fund’s ordinary operating expenses, including the management fee, to be not more than 1.50% of average daily net assets, annually. This contract continues through February 1, 2013, at which time the Adviser will determine whether to renew, revise or discontinue it. For the year ended September 30, 2011, expenses of approximately $17 incurred by Growth Opportunities Fund were waived by the Adviser.
The officers and director of Artisan Funds who are affiliated with the Adviser receive no compensation from the Funds.
Prior to April 1, 2011, each director who was not an affiliated person of the Adviser received an annual retainer of $180,000, payable quarterly, as well as reimbursement of expenses related to his duties as a director of Artisan Funds. The amount of the annual retainer increased by $10,000 with each new series of Artisan Funds. In addition, the non-interested chair of the board of directors received an annual retainer of $60,000,
56
NOTES TO FINANCIAL STATEMENTS
payable quarterly, and each chair of a board committee who was a non-interested director received an annual retainer of $30,000, payable quarterly. Effective April 1, 2011, each director who was not an affiliated person of the Adviser receives an annual retainer of $200,000, payable quarterly, which will increase by $10,000 with each new series of Artisan Funds. The additional annual retainer fees for the non-interested chair of the board of directors and each non-interested chair of a board committee were not changed from the prior period. These fees were generally allocated to each of Artisan Funds based on net assets, subject to a minimum allocation of $1,500 to each Fund per quarter.
Artisan Funds has adopted a deferred compensation plan for directors who are not affiliated persons of the Adviser that enables directors to elect to defer receipt of all or a portion of the annual compensation they are entitled to receive from the Funds. For purposes of determining the amount owed to the directors under the plan, deferred amounts would be invested in shares of Artisan Funds as selected by the individual directors. Each Fund would purchase shares of Artisan Funds selected for deferral by the director in amounts equal to his investment, resulting in a Fund asset equal to the deferred compensation liability. As of September 30, 2011, no current directors have elected to participate in the deferred compensation plan.
Shares of Artisan Funds were offered for sale by Artisan Partners Distributors LLC (“Distributors”). Distributors is wholly owned by Artisan Holdings. All distribution expenses relating to the Funds were paid by the Adviser.
| (5) | Line of credit arrangement: |
Artisan Funds is party to a line of credit agreement with State Street Bank and Trust Company (“SSB”), which expires in August 2012, under which each Fund may borrow up to $75 million, provided that such borrowing does not exceed the least of (a) 33 1/3% of its adjusted net assets, with adjusted net assets being total assets less total liabilities (excluding indebtedness for borrowed money) after giving effect to the loan, (b) the maximum amount the Fund may borrow under applicable law, (c) the limitations included in the Funds’ prospectus, or (d) any limitations on borrowings in any agreement with any governmental authority or regulator; provided that the aggregate borrowings by all Artisan Funds may not exceed $100 million. For the period October 1, 2010 to August 15, 2011, Artisan Funds paid a commitment fee at the annual rate of 0.125% on the unused portion of the line of credit and interest was charged on any borrowings at the current Federal Funds rate plus 1.25%. For the period October 1, 2010 to August 15, 2011, SSB agreed to waive 0.025% of the commitment fee by reducing the Funds’ custody expenses. Effective August 16, 2011, Artisan Funds paid a commitment fee at the annual rate of 0.10% on the unused portion of the line of credit and interest was charged on any borrowings at the current Federal Funds rate plus 1.25%. The commitment fee and the related waiver are allocated to each Fund based on net assets. The use of the line of credit was generally restricted to temporary borrowing for extraordinary or emergency purposes. During the year ended September 30, 2011, there were no borrowings under the line of credit for the Funds.
57
NOTES TO FINANCIAL STATEMENTS
| (6) | Investment transactions: |
The cost of securities purchased and the proceeds from the sale of securities (excluding short-term securities) for the year ended September 30, 2011 were as follows (in thousands):
| | | | | | | | |
| Fund | | Security Purchases | | | Security Sales | |
Emerging Markets | | $ | 640,060 | | | $ | 233,805 | |
Growth Opportunities | | | 184,741 | | | | 97,935 | |
International | | | 6,663,902 | | | | 7,722,484 | |
International Value | | | 2,553,612 | | | | 1,271,546 | |
Mid Cap | | | 3,391,387 | | | | 3,563,461 | |
Value | | | 472,084 | | | | 293,026 | |
| (7) | Transactions in securities of affiliates: |
The table below shows information about securities of the Funds’ “affiliates” (as defined below) that were held by the Funds, purchased or sold by the Funds, or from which dividends were received by the Funds during the year ended September 30, 2011 (dollar values in thousands). The Funds identify a company as an affiliate for the purpose of this report if one or more of the Funds owned, in the aggregate, voting securities that it believed represented 5% or more of that company’s outstanding voting securities (as defined by the Investment Company Act of 1940) during the year ended September 30, 2011.
| | | | | | | | | | | | | | | | | | | | | | | | | | | | | | |
| | | | | As of
9/30/10 | | | | | | | | | | | | | | | As of
9/30/11 | |
| Fund | | Security | | Share
Balance | | | Purchase
Cost | | | Sales
Cost | | | Net
Realized
Gain (Loss) | | | Dividend
Income(1) | | | Share
Balance | | | Value | |
| International | | | | | | | | | | | | | | | | | | | | | | | | | | | | | | |
| | | E-Commerce China Dangdang, Inc., Class A (DR)(2)(3) | | | - | | | $ | 30,194 | | | $ | 30,194 | | | $ | (4,123 | ) | | $ | - | | | | - | | | $ | - | |
| | | Total(4) | | | | | | $ | 30,194 | | | $ | 30,194 | | | $ | (4,123 | ) | | $ | - | | | | - | | | $ | - | |
| International Value | | | | | | | | | | | | | | | | | | | | | | | | | | | | |
| | | Aderans Co., Ltd.(5) | | | 1,956,400 | | | $ | 6,353 | | | $ | 1,403 | | | $ | (1 | ) | | $ | - | | | | 2,420,067 | | | $ | 22,437 | |
| | | Arch Capital Group Ltd.(2) | | | 1,543,774 | | | | 37,892 | | | | 8,881 | | | | 666 | | | | - | | | | 5,572,034 | | | | 182,066 | |
| | | ICON PLC (DR)(2)(5) | | | - | | | | 63,891 | | | | 4,787 | | | | 882 | | | | - | | | | 2,871,675 | | | | 46,177 | |
| | | Qinetiq Group PLC | | | 41,112,031 | | | | 41,700 | | | | - | | | | - | | | | 1,616 | | | | 62,402,252 | | | | 112,476 | |
| | | Savills Plc | | | 8,553,847 | | | | 11,700 | | | | 3,325 | | | | 196 | | | | 1,971 | | | | 9,951,406 | | | | 44,068 | |
| | | Signet Jewelers Ltd.(2)(3) | | | 4,397,187 | | | | 19,009 | | | | 35,945 | | | | 2,012 | | | | - | | | | 3,882,479 | | | | 131,228 | |
| | | Total(4) | | | | | | $ | 180,545 | | | $ | 54,341 | | | $ | 3,755 | | | $ | 3,587 | | | | | | | $ | 407,224 | |
| Mid Cap | | | | | | | | | | | | | | | | | | | | | | | | | | | | | | |
| | | athenahealth, Inc.(2) | | | 1,680,000 | | | $ | 18,599 | | | $ | 5,814 | | | $ | 685 | | | $ | - | | | | 1,956,015 | | | $ | 116,481 | |
| | | GSI Commerce, Inc.(3) | | | 3,010,400 | | | | 4,912 | | | | 77,506 | | | | 7,374 | | | | - | | | | - | | | | - | |
| | | Total(4) | | | | | | $ | 23,511 | | | $ | 83,320 | | | $ | 8,059 | | | $ | - | | | | | | | $ | 116,481 | |
| Value | | | | | | | | | | | | | | | | | | | | | | | | | | | | | | |
| | | Arch Capital Group Ltd.(2) | | | 139,500 | | | $ | 5,973 | | | $ | 4,231 | | | $ | 743 | | | $ | - | | | | 439,300 | | | $ | 14,354 | |
| | | Ingram Micro Inc.(2) | | | 540,200 | | | | 9,085 | | | | 595 | | | | (92 | ) | | | - | | | | 1,000,700 | | | | 16,141 | |
| | | Total(4) | | | | | | $ | 15,058 | | | $ | 4,826 | | | $ | 651 | | | $ | - | | | | | | | $ | 30,495 | |
| (1) | Net of foreign taxes withheld, if any. |
| (2) | Non-income producing security. |
| (3) | Issuer was no longer an affiliate as of September 30, 2011. |
| (4) | Total value as of September 30, 2011 is presented for only those issuers that were affiliates as of September 30, 2011. |
| (5) | Issuer was not an affiliate as of September 30, 2010. |
58
NOTES TO FINANCIAL STATEMENTS
| (8) | Information for Federal income tax purposes: |
For Federal income tax purposes, the cost of investments, gross unrealized appreciation, gross unrealized depreciation and net unrealized appreciation (depreciation) on investments as of September 30, 2011 were as follows (in thousands):
| | | | | | | | | | | | | | | | |
| Fund | | Cost of
Investments | | | Gross Unrealized
Appreciation | | | Gross
Unrealized
Depreciation | | | Net
Unrealized
Appreciation
(Depreciation)
on Investments | |
Emerging Markets | | $ | 863,270 | | | $ | 19,069 | | | $ | (218,637 | ) | | $ | (199,568 | ) |
Growth Opportunities | | | 151,649 | | | | 15,967 | | | | (14,019 | ) | | | 1,948 | |
International | | | 8,175,187 | | | | 652,241 | | | | (1,033,914 | ) | | | (381,673 | ) |
International Value | | | 4,300,722 | | | | 357,063 | | | | (440,972 | ) | | | (83,909 | ) |
Mid Cap | | | 3,918,826 | | | | 1,267,624 | | | | (154,385 | ) | | | 1,113,239 | |
Value | | | 493,964 | | | | 12,658 | | | | (45,582 | ) | | | (32,924 | ) |
The difference between cost of investments for financial reporting and cost of investments for Federal income tax purposes was due primarily to timing differences in recognizing certain gains and losses on security transactions (e.g., wash sale loss deferrals and passive foreign investment company transactions).
The tax characterization of ordinary income dividends and long-term capital gain distributions paid during the year ended September 30, 2011 and the year ended September 30, 2010 were as follows (in thousands):
| | | | | | | | | | | | | | | | |
| | | Year Ended 9/30/11 | | | Year Ended 9/30/10 | |
| Fund | | Ordinary
Income
Dividends | | | Long-Term
Capital Gain
Distributions | | | Ordinary
Income
Dividends | | | Long-Term
Capital Gain
Distributions | |
Emerging Markets | | $ | 5,180 | | | $ | - | | | $ | 1,497 | | | $ | - | |
Growth Opportunities | | | 224 | | | | 810 | | | | - | | | | - | |
International | | | 87,763 | | | | - | | | | 129,088 | | | | - | |
International Value | | | 51,946 | | | | - | | | | 42,229 | | | | - | |
Value | | | 2,455 | | | | - | | | | 840 | | | | - | |
Ordinary income dividends and long-term capital gain distributions were determined in accordance with income tax regulations that impose treatment that is different from the treatment that would result from the application of United States generally accepted accounting principles for such items as net short-term gains, passive foreign investment company transactions, foreign currency transactions and net investment losses. Gains on redemptions-in-kind for Mid Cap Fund of $78,603,000 were included in net realized gain (loss) on investments in the Statements of Operations for the year ended September 30, 2011, and were not recognized for Federal income tax purposes.
59
NOTES TO FINANCIAL STATEMENTS
Additional tax information as of and for the year ended September 30, 2011 follows (in thousands):
| | | | | | | | | | | | | | | | |
| | | Undistributed
Ordinary Income | | | Undistributed
Long-Term Gain | | | Post-October
Losses | | | Other Deferred Gains (Losses)(1) | |
Emerging Markets | | $ | 5,629 | | | $ | 1,871 | | | $ | - | | | $ | (3,671 | ) |
Growth Opportunities | | | - | | | | 1,422 | | | | (406 | ) | | | (20 | ) |
International | | | 120,926 | | | | - | | | | - | | | | (1,361 | ) |
International Value | | | - | | | | 12,238 | | | | - | | | | 12 | |
Mid Cap | | | - | | | | - | | | | - | | | | (192 | ) |
Value | | | 2,606 | | | | - | | | | - | | | | (4 | ) |
| (1) | Other deferred gains and losses relate to (a) gains or losses on transactions that occurred subsequent to year end that affected the distributable earnings at September 30, 2011 such as wash sales, (b) unrealized gains and losses on open foreign currency contracts and (c) other items. |
As of September 30, 2011, the Funds had capital loss carryovers as follows (in thousands):
| | | | | | | | | | | | |
| | | Expiring
2017 | | | Expriring
2018 | | | Total | |
International | | $ | 52,715 | | | $ | 1,780,664 | | | $ | 1,833,379 | |
Mid Cap | | | - | | | | 85,052 | | | | 85,052 | |
Value | | | 4,793 | | | | 47,952 | | | | 52,745 | |
For the year ended September 30, 2011, the Funds used capital loss carryovers as follows (in thousands):
| | | | |
| | | Capital Loss
Carryovers Used | |
Emerging Markets | | $ | 10,901 | |
International | | | 793,973 | |
International Value | | | 119,740 | |
Mid Cap | | | 550,188 | |
Value | | | 30,711 | |
60
NOTES TO FINANCIAL STATEMENTS
| (9) | Fund share activities: |
Capital share transactions for the Funds were as follows (dollar values in thousands):
| | | | | | | | | | | | | | | | | | | | | | | | |
| | | EMERGING MARKETS | | | GROWTH OPPORTUNITIES | | | INTERNATIONAL | |
Year ended September 30, 2011 | | Institutional
Shares | | | Advisor
Shares | | | Investor
Shares | | | Institutional
Shares(1) | | | Investor
Shares | | | Institutional
Shares | |
Proceeds from shares issued | | $ | 208,436 | | | $ | 302,182 | | | $ | 116,536 | | | $ | 1,599 | | | $ | 1,303,630 | | | $ | 200,095 | |
Net asset value of shares transferred | | | - | | | | - | | | | (14,153 | ) | | | 14,153 | | | | - | | | | - | |
Net asset value of shares issued in reinvestment of dividends and distributions | | | 3,270 | | | | 1,764 | | | | 1,027 | | | | - | | | | 54,788 | | | | 25,401 | |
Cost of shares redeemed(2) | | | (18,510 | ) | | | (104,406 | ) | | | (21,486 | ) | | | - | | | | (2,190,720 | ) | | | (366,860 | ) |
| | | | | | | | | | | | | | | | | | | | | | | | |
Net increase (decrease) from fund share transactions | | $ | 193,196 | | | $ | 199,540 | | | $ | 81,924 | | | $ | 15,752 | | | $ | (832,302 | ) | | $ | (141,364 | ) |
| | | | | | | | | | | | | | | | | | | | | | | | |
| | | | | | |
Shares sold | | | 13,451,736 | | | | 19,672,672 | | | | 9,228,735 | | | | 133,801 | | | | 60,685,817 | | | | 9,123,456 | |
Shares transferred | | | - | | | | - | | | | (1,057,788 | ) | | | 1,057,788 | | | | - | | | | - | |
Shares issued in reinvestment of dividends and distributions | | | 208,694 | | | | 112,253 | | | | 85,008 | | | | - | | | | 2,556,612 | | | | 1,178,671 | |
Shares redeemed | | | (1,368,082 | ) | | | (7,374,302 | ) | | | (1,746,821 | ) | | | - | | | | (100,130,658 | ) | | | (16,394,727 | ) |
| | | | | | | | | | | | | | | | | | | | | | | | |
Net increase (decrease) in capital shares | | | 12,292,348 | | | | 12,410,623 | | | | 6,509,134 | | | | 1,191,589 | | | | (36,888,229 | ) | | | (6,092,600 | ) |
| | | | | | | | | | | | | | | | | | | | | | | | |
| | | | |
| | | EMERGING MARKETS | | | GROWTH
OPPORTUNITIES | | | | | | INTERNATIONAL | |
Year ended September 30, 2010 | | Institutional
Shares | | | Advisor
Shares | | | Investor
Shares | | | | | | Investor
Shares | | | Institutional
Shares | |
Proceeds from shares issued | | $ | 173,421 | | | $ | 177,493 | | | $ | 30,913 | | | | | | | $ | 1,714,559 | | | $ | 254,936 | |
Net asset value of shares issued in reinvestment of dividends and distributions | | | 984 | | | | 500 | | | | - | | | | | | | | 85,907 | | | | 32,933 | |
Cost of shares redeemed(2) | | | (23,531 | ) | | | (17,173 | ) | | | (15,045 | ) | | | | | | | (2,313,013 | ) | | | (871,513 | ) |
| | | | | | | | | | | | | | | | | | | | | | | | |
Net increase (decrease) from fund share transactions | | $ | 150,873 | | | $ | 160,819 | | | $ | 15,868 | | | | | | | $ | (512,547 | ) | | $ | (583,644 | ) |
| | | | | | | | | | | | | | | | | | | | | | | | |
| | | | | | |
Shares sold | | | 12,304,761 | | | | 12,812,565 | | | | 3,195,776 | | | | | | | | 87,169,342 | | | | 12,936,483 | |
Shares issued in reinvestment of dividends and distributions | | | 73,686 | | | | 37,352 | | | | - | | | | | | | | 4,233,932 | | | | 1,614,352 | |
Shares redeemed | | | (1,700,418 | ) | | | (1,260,856 | ) | | | (1,589,013 | ) | | | | | | | (119,470,363 | ) | | | (44,484,274 | ) |
| | | | | | | | | | | | | | | | | | | | | | | | |
Net increase (decrease) in capital shares | | | 10,678,029 | | | | 11,589,061 | | | | 1,606,763 | | | | | | | | (28,067,089 | ) | | | (29,933,439 | ) |
| | | | | | | | | | | | | | | | | | | | | | | | |
| (1) | For the period from commencement of operations July 26, 2011 through September 30, 2011. |
| (2) | Net of redemption fees of: |
| | | | | | | | |
| Fund | | 9/30/2011 | | | 9/30/2010 | |
Emerging Markets - Institutional Shares | | $ | 29 | | | $ | 2 | |
Emerging Markets - Advisor Shares | | | 26 | | | | 2 | |
Growth Opportunities - Investor Shares | | | 4 | | | | - | |
International - Investor Shares | | | 460 | | | | 528 | |
International - Institutional Shares | | | 157 | | | | 168 | |
61
NOTES TO FINANCIAL STATEMENTS
| | | | | | | | | | | | | | | | |
| | | INTERNATIONAL VALUE | | | MID CAP | |
Year ended September 30, 2011 | | Investor
Shares | | | Institutional
Shares | | | Investor
Shares | | | Institutional
Shares | |
Proceeds from shares issued | | $ | 1,396,183 | | | $ | 547,792 | | | $ | 1,160,346 | | | $ | 66,013 | |
Net asset value of shares issued in reinvestment of dividends and distributions | | | 32,185 | | | | 11,352 | | | | - | | | | - | |
Cost of shares redeemed(1) | | | (617,777 | ) | | | (71,466 | ) | | | (1,278,871 | ) | | | (90,606 | ) |
| | | | | | | | | | | | | | | | |
Net increase (decrease) from fund share transactions | | $ | 810,591 | | | $ | 487,678 | | | $ | (118,525 | ) | | $ | (24,593 | ) |
| | | | | | | | | | | | | | | | |
| | | | |
Shares sold | | | 51,358,305 | | | | 20,384,767 | | | | 33,974,631 | | | | 1,869,251 | |
Shares issued in reinvestment of dividends and distributions | | | 1,197,336 | | | | 422,463 | | | | - | | | | - | |
Shares redeemed | | | (23,292,083 | ) | | | (2,603,912 | ) | | | (37,508,365 | ) | | | (2,521,038 | ) |
| | | | | | | | | | | | | | | | |
Net increase (decrease) in capital shares | | | 29,263,558 | | | | 18,203,318 | | | | (3,533,734 | ) | | | (651,787 | ) |
| | | | | | | | | | | | | | | | |
| | |
| | | INTERNATIONAL VALUE | | | MID CAP | |
Year ended September 30, 2010 | | Investor
Shares | | | Institutional
Shares | | | Investor
Shares | | | Institutional
Shares | |
Proceeds from shares issued | | $ | 1,211,662 | | | $ | 330,197 | | | $ | 744,135 | | | $ | 19,299 | |
Net asset value of shares issued in reinvestment of dividends and distributions | | | 31,364 | | | | 5,319 | | | | - | | | | - | |
Cost of shares redeemed(1) | | | (483,111 | ) | | | (15,346 | ) | | | (842,511 | ) | | | (65,732 | ) |
| | | | | | | | | | | | | | | | |
Net increase (decrease) from fund share transactions | | $ | 759,915 | | | $ | 320,170 | | | $ | (98,376 | ) | | $ | (46,433 | ) |
| | | | | | | | | | | | | | | | |
| | | | |
Shares sold | | | 52,013,751 | | | | 14,377,757 | | | | 28,632,435 | | | | 694,723 | |
Shares issued in reinvestment of dividends and distributions | | | 1,378,042 | | | | 233,794 | | | | - | | | | - | |
Shares redeemed | | | (20,943,757 | ) | | | (655,580 | ) | | | (32,462,368 | ) | | | (2,402,397 | ) |
| | | | | | | | | | | | | | | | |
Net increase (decrease) in capital shares | | | 32,448,036 | | | | 13,955,971 | | | | (3,829,933 | ) | | | (1,707,674 | ) |
| | | | | | | | | | | | | | | | |
| (1) | Net of redemption fees of: |
| | | | | | | | |
| Fund | | 9/30/2011 | | | 9/30/2010 | |
International Value - Investor Shares | | | 279 | | | | 323 | |
International Value - Institutional Shares | | | 84 | | | | 71 | |
62
NOTES TO FINANCIAL STATEMENTS
| | | | | | | | |
| | | VALUE | |
Year ended September 30, 2011 | | Investor
Shares | | | Institutional
Shares(1) | |
Proceeds from shares issued | | $ | 273,248 | | | $ | 36,577 | |
Net asset value of shares transferred | | | (21,242 | ) | | | 21,242 | |
Net asset value of shares issued in reinvestment of dividends and distributions | | | 2,273 | | | | - | |
Cost of shares redeemed | | | (106,948 | ) | | | - | |
| | | | | | | | |
Net increase (decrease) from fund share transactions | | $ | 147,331 | | | $ | 57,819 | |
| | | | | | | | |
| | |
Shares sold | | | 27,593,098 | | | | 3,866,137 | |
Shares transferred | | | (2,004,008 | ) | | | 2,004,008 | |
Shares issued in reinvestment of dividends and distributions | | | 241,039 | | | | - | |
Shares redeemed | | | (10,864,145 | ) | | | - | |
| | | | | | | | |
Net increase (decrease) in capital shares | | | 14,965,984 | | | | 5,870,145 | |
| | | | | | | | |
| | |
| | | VALUE | | | | |
Year ended September 30, 2010 | | Investor
Shares | | | | |
Proceeds from shares issued | | $ | 130,447 | | | | | |
Net asset value of shares issued in reinvestment of dividends and distributions | | | 811 | | | | | |
Cost of shares redeemed | | | (64,499 | ) | | | | |
| | | | | | | | |
Net increase (decrease) from fund share transactions | | $ | 66,759 | | | | | |
| | | | | | | | |
| | |
Shares sold | | | 15,026,128 | | | | | |
Shares issued in reinvestment of dividends and distributions | | | 94,772 | | | | | |
Shares redeemed | | | (7,544,347 | ) | | | | |
| | | | | | | | |
Net increase (decrease) in capital shares | | | 7,576,553 | | | | | |
| | | | | | | | |
| (1) | For the period from commencement of operations July 26, 2011 through September 30, 2011. |
The Funds have evaluated subsequent events through the date of issuance of the Funds’ financial statements and have determined there is no impact to the Funds’ financial statements.
63
Report of Independent Registered Public Accounting Firm
The Board of Directors and Shareholders of Artisan Partners Funds, Inc.
We have audited the accompanying statements of assets and liabilities, including the schedules of investments, of Artisan Emerging Markets Fund, Artisan Growth Opportunities Fund (formerly Artisan Opportunistic Growth Fund), Artisan International Fund, Artisan International Value Fund, Artisan Mid Cap Fund, and Artisan Value Fund (formerly Artisan Opportunistic Value Fund) (six of the twelve portfolios constituting Artisan Partners Funds, Inc. (formerly Artisan Funds, Inc.)) (the “Funds”) as of September 30, 2011, and the related statements of operations for the year then ended, the statements of changes in net assets for each of the two years in the period then ended, and the financial highlights for each of the periods indicated therein. These financial statements and financial highlights are the responsibility of the Funds’ management. Our responsibility is to express an opinion on these financial statements and financial highlights based on our audits.
We conducted our audits in accordance with the standards of the Public Company Accounting Oversight Board (United States). Those standards require that we plan and perform the audit to obtain reasonable assurance about whether the financial statements and financial highlights are free of material misstatement. We were not engaged to perform an audit of the Funds’ internal control over financial reporting. Our audits included consideration of internal control over financial reporting as a basis for designing audit procedures that are appropriate in the circumstances, but not for the purpose of expressing an opinion on the effectiveness of the Funds’ internal control over financial reporting. Accordingly, we express no such opinion. An audit also includes examining, on a test basis, evidence supporting the amounts and disclosures in the financial statements and financial highlights, assessing the accounting principles used and significant estimates made by management, and evaluating the overall financial statement presentation. Our procedures included confirmation of securities owned as of September 30, 2011, by correspondence with the custodian and brokers or by other appropriate auditing procedures where replies from brokers were not received. We believe that our audits provide a reasonable basis for our opinion.
In our opinion, the financial statements and financial highlights referred to above present fairly, in all material respects, the financial position of Artisan Emerging Markets Fund, Artisan Growth Opportunities Fund, Artisan International Fund, Artisan International Value Fund, Artisan Mid Cap Fund, and Artisan Value Fund of Artisan Partners Funds, Inc. at September 30, 2011, the results of their operations for the year then ended, the changes in their net assets for each of the two years in the period then ended, and the financial highlights for each of the periods indicated therein, in conformity with U.S. generally accepted accounting principles.

Chicago, Illinois
November 21, 2011
64
NOTES TO FINANCIAL STATEMENTS
Other Federal tax information (unaudited):
The Internal Revenue Code requires that shareholders be notified within 60 days of the Funds’ fiscal year-end of certain information regarding long-term capital gains, qualified dividend income and the dividends received deduction for corporate shareholders. This data is informational only. Every year in January, shareholders are sent a Form 1099-DIV which provides the federal tax status of dividends and distributions received during the calendar year. Shareholders are advised to consult their own tax advisor with respect to the specific tax consequences of investment in the Funds.
Each Fund hereby designates the following amounts as (i) long-term capital gain distributions for purposes of the dividends paid deduction (including earnings and profits distributed to shareholders on redemption of Fund shares, in thousands), (ii) the amount of ordinary dividends paid during the fiscal year ended September 30, 2011 that are considered qualified dividend income as defined in the Jobs and Growth Tax Relief Reconciliation Act of 2003, and (iii) the amount of ordinary dividends paid during the fiscal year ended September 30, 2011 that are eligible for the dividends received deduction available to certain corporate shareholders.
| | | | | | | | | | | | |
| Fund | | Long-Term Capital Gains | | | Qualified Dividend Income | | | Dividends Received Deduction | |
Emerging Markets | | $ | 297 | | | | 83.00 | % | | | - | % |
Growth Opportunities | | | 1,498 | | | | 37.06 | | | | 26.19 | |
International | | | - | | | | 100.00 | | | | 7.40 | |
International Value | | | 166 | | | | 100.00 | | | | - | |
Mid Cap | | | - | | | | - | | | | - | |
Value | | | - | | | | 100.00 | | | | 100.00 | |
65
SHAREHOLDER EXPENSE EXAMPLE (UNAUDITED)
As a shareholder of Artisan Funds, you may incur transaction costs, including redemption fees, and you will incur ongoing costs, including management fees and other Fund expenses. This example is intended to help you understand your ongoing costs (in dollars) of investing in a Fund and to compare these costs with the ongoing costs of investing in other mutual funds.
The example is based on an investment of $1,000 invested at the beginning of the period and held for the entire period from April 1, 2011 to September 30, 2011.
Actual Expenses
The first line under the name of each Fund in the table below provides information about actual account values and actual expenses. You may use the information in this line, together with the amount you invested, to estimate the expenses that you paid over the period. Simply divide your account value by $1,000 (for example, an $8,600 account value divided by $1,000 = 8.6), then multiply the result by the number in the first line under the name of your Fund under the heading entitled “Expenses Paid During Period” to estimate the expenses you paid on your account during this period.
Hypothetical Example for Comparison Purposes
The second line below each Fund’s name in the table below provides information about hypothetical account values and hypothetical expenses based on each Fund’s actual expense ratio for the six months ended September 30, 2011 and an assumed rate of return of 5% per year before expenses, which is not the Fund’s actual return. The hypothetical account values and expenses may not be used to estimate the actual ending account balances or expenses you paid for the period. You may use this information to compare the ongoing costs of investing in each Fund and other funds. To do so, compare the 5% hypothetical example with the 5% hypothetical examples that appear in the shareholder reports of the other funds.
Please note that the expenses shown in the table are meant to highlight your ongoing costs only and do not reflect any transactional costs, such as redemption fees. Therefore, the second line of the table is useful in comparing ongoing costs only, and will not help you determine the relative costs of owning different funds. If these transactional costs were included, your costs would have been higher.
| | | | | | | | | | | | |
| | | Beginning
Account Value
4/1/2011 | | | Ending
Account Value
9/30/2011 | | | Expenses Paid During
Period
4/1/2011-9/30/2011(1) | |
Artisan Emerging Markets Fund - Institutional Shares | | | | | | | | | | | | |
Actual | | $ | 1,000.00 | | | $ | 713.70 | | | $ | 5.11 | |
Hypothetical (5% return before expenses) | | $ | 1,000.00 | | | $ | 1,019.10 | | | $ | 6.02 | |
Artisan Growth Opportunities Fund - Institutional Shares(2) | | | | | | | | | | | | |
Actual | | $ | 1,000.00 | | | $ | 813.20 | | | $ | 2.42 | |
Hypothetical (5% return before expenses) | | $ | 1,000.00 | | | $ | 1,006.23 | | | $ | 2.68 | |
Artisan International Fund - Institutional Shares | | | | | | | | | | | | |
Actual | | $ | 1,000.00 | | | $ | 818.90 | | | $ | 4.47 | |
Hypothetical (5% return before expenses) | | $ | 1,000.00 | | | $ | 1,020.16 | | | $ | 4.96 | |
See notes on page 67.
66
SHAREHOLDER EXPENSE EXAMPLE (UNAUDITED)
| | | | | | | | | | | | |
| | | Beginning
Account Value
4/1/2011 | | | Ending
Account Value
9/30/2011 | | | Expenses Paid During
Period
4/1/2011-9/30/2011(1) | |
Artisan International Value Fund - Institutional Shares | | | | | | | | | | | | |
Actual | | $ | 1,000.00 | | | $ | 843.90 | | | $ | 4.53 | |
Hypothetical (5% return before expenses) | | $ | 1,000.00 | | | $ | 1,020.16 | | | $ | 4.96 | |
Artisan Mid Cap Fund - Institutional Shares | | | | | | | | | | | | |
Actual | | $ | 1,000.00 | | | $ | 864.10 | | | $ | 4.49 | |
Hypothetical (5% return before expenses) | | $ | 1,000.00 | | | $ | 1,020.26 | | | $ | 4.86 | |
Artisan Value Fund - Institutional Shares(2) | | | | | | | | | | | | |
Actual | | $ | 1,000.00 | | | $ | 860.40 | | | $ | 1.86 | |
Hypothetical (5% return before expenses) | | $ | 1,000.00 | | | $ | 1,007.18 | | | $ | 2.01 | |
| (1) | Expenses are equal to the Fund’s ratio of expenses to average net assets for the six-month period ended September 30, 2011 (shown below), multiplied by the average account value over the period, multiplied by 183/366 (to reflect the one-half year period). |
| (2) | For the period from commencement of operations July 26, 2011 through September 30, 2011. |
| | | | |
| Fund | | Annualized Ratio of Expenses to Average
Net Assets for the Six-Month
Period Ended September 30, 2011 | |
Artisan Emerging Markets Fund - Institutional Shares | | | 1.19 | % |
Artisan Growth Opportunities Fund - Institutional Shares(1)(2) | | | 1.50 | % |
Artisan International Fund - Institutional Shares | | | 0.98 | % |
Artisan International Value Fund - Institutional Shares | | | 0.98 | % |
Artisan Mid Cap Fund - Institutional Shares | | | 0.96 | % |
Artisan Value Fund - Institutional Shares(2) | | | 1.09 | % |
|
(1) The annualized ratio of expenses to average net assets excludes expenses waived or paid by the Adviser. (2) For the period from commencement of operations July 26, 2011 through September 30, 2011. | |
67
NOTES ON MANAGEMENT’S DISCUSSION OF FUND PERFORMANCE AND PORTFOLIO HOLDINGS’ CLASSIFICATION
The discussions of each Fund included in this report include statistical information about the portfolios of each of the Funds. Except as otherwise noted, that information is as of
September 30, 2011. That information will vary with changes in a Fund’s portfolio investments. The performance information for each Fund relative to its benchmark index discussed in this report was prepared by the Adviser using information reported by FactSet Research systems, Inc. (“FactSet”). For the purposes of assigning portfolio securities to a particular country, the Adviser considers an issuer to be from a particular country as designated by its securities information vendors. The Adviser currently uses MSCI Inc. as its primary source and FactSet as a secondary source for this information. In the event (i) the Adviser’s securities information vendors do not assign a security to a particular country or if the published classification appears to be clearly erroneous, or (ii) its primary vendor does not assign a security to a particular country and the secondary vendor has assigned a security to a particular country by using a methodology that is not the same as the methodology the primary vendor uses to assign a country, the Adviser assigns the security to a country using the primary vendor’s published criteria (to the extent available) or the Adviser’s own judgment. The primary information vendor’s criteria currently include the identity of the jurisdiction of the issuer’s incorporation, the main equity trading market for the issuer’s securities, the geographical distribution of the issuer’s operations and the location of the issuer’s headquarters. Country designations may change over time.
For the purposes of assigning portfolio securities to a particular sector and industry, the Adviser assigns securities in accordance with the sector and industry classifications of the Global Industry Classification Standard (GICS®) developed by MSCI Inc. and Standard & Poor’s. In the event the Adviser’s securities information vendors do not classify a security to a particular sector or industry, or if the published classification appears to be clearly erroneous, the Adviser classifies the security according to its own judgment, using other securities information vendors, the company description and other publicly available information about the company’s peer group. Sector and industry classifications may change over time.
The names of portfolio securities reflected in this report are as reported by the Funds’ data providers, may not represent the legal name of the entity and, in some cases, are translations of non-English names.
Descriptions of Indices
Each Fund’s performance is compared in this report to changes in one or more indices, including in all cases a broad-based index of changes in prices of securities in the markets in which the Fund invests. All of the indices are unmanaged and their returns include reinvested dividends. Unlike the Funds’ returns, the returns of each index do not include the payment of sales commissions or other expenses that would be incurred in the purchase or sale of the securities included in that index. An investment cannot be made directly in an index. Fair value pricing is not employed by market indices.
The indices to which the Funds are compared are:
Artisan Emerging Markets Fund – Morgan Stanley Capital International Emerging Markets IndexSM is a market-weighted index of companies in emerging markets.
68
NOTES ON MANAGEMENT’S DISCUSSION OF FUND PERFORMANCE AND PORTFOLIO HOLDINGS’ CLASSIFICATION
Artisan Growth Opportunities Fund – Morgan Stanley Capital International All Country World IndexSM (MSCI ACWISM) is a market-weighted index of global developed and emerging markets.
Artisan International and Artisan International Value Funds – Morgan Stanley Capital International EAFE® Index (MSCI EAFE®) is a market-weighted index of companies in developed markets, excluding the U.S. and Canada. MSCI EAFE®’s average annual return since inception of the International Fund is based upon a starting date of December 31, 1995.
Artisan International Fund – Morgan Stanley Capital International EAFE® Growth Index (MSCI EAFE® Growth) is a market-weighted index of companies in developed markets, excluding the U.S. and Canada, that exhibits growth investment style characteristics according to MSCI’s methodology. MSCI EAFE® Growth’s average annual return since inception of the International Fund is based upon a starting date of December 31, 1995.
Artisan International Value Fund – Morgan Stanley Capital International EAFE® Value Index (MSCI EAFE® Value) is a market-weighted index of companies in developed markets, excluding the U.S. and Canada, that exhibits value investment style characteristics according to MSCI’s methodology.
Artisan Mid Cap Fund – Russell Midcap® Index is a market-weighted index of about 800 medium-sized U.S. companies.
Artisan Mid Cap Fund – Russell Midcap® Growth Index is a market-weighted index of those medium-sized companies included in the Russell Midcap® Index with higher price-to-book and higher forecasted growth values.
Artisan Value Fund – Russell 1000® Index is a market-weighted index of about 1,000 large U.S. companies.
Artisan Value Fund – Russell 1000® Value Index is a market-weighted index of those large companies included in the Russell 1000® Index with lower price-to-book ratios and lower forcasted growth values.
Trademarks
Trademarks and copyrights relating to the indices and products of portfolio companies mentioned in this report, if any, are owned by their respective owners. Except as otherwise indicated, the trademarks, including names, logos, slogans and service marks appearing in this report are the property of the Adviser and may not be copied, reproduced, published or in any way used without written permission.
The Global Industry Classification Standard (“GICS”) was developed by and is the exclusive property and a service mark of MSCI Inc. (“MSCI”) and Standard & Poor’s, a division of The McGraw-Hill Companies, Inc. (“S&P”) and is licensed for use by Artisan Partners Limited Partnership. Neither MSCI, S&P nor any third party involved in making or compiling the GICS or any GICS classifications makes any express or implied warranties or representations with respect to such standard or classification (or the results to be obtained by the use thereof), and all such parties hereby expressly disclaim all warranties of originality, accuracy, completeness, merchantability and fitness for a particular purpose with respect to any of such standard or classification. Without limiting any of the foregoing, in no event shall MSCI, S&P,
69
NOTES ON MANAGEMENT’S DISCUSSION OF FUND PERFORMANCE AND PORTFOLIO HOLDINGS’ CLASSIFICATION
any of their affiliates or any third party involved in making or compiling the GICS or any GICS classifications have any liability for any direct, indirect, special, punitive, consequential or any other damages (including lost profits) even if notified of the possibility of such damages.
The MSCI information may only be used by the reader, may not be reproduced or redisseminated in any form and may not be used as a basis for or a component of any financial instruments or products or any indices. None of the MSCI information is intended to constitute investment advice of a recommendation to make (or refrain from making) any kind of investment decision and may not be relied on as such. Historical data and analysis should not be taken as an indication or guarantee of any future performance analysis, forecast or prediction. The MSCI information is provided on an “as is” basis and the reader of this information assumes the entire risk of any use made of this information. MSCI, each of its affiliates and each other person involved in or related to compiling, computing or creating any MSCI information (collectively, the “MSCI Parties”) expressly disclaims all warranties (including, without limitation, any warranties of originality, accuracy, completeness, timeliness, non-infringement, merchantability and fitness for a particular purpose) with respect to this information. Without limiting any of the foregoing, in no event shall MSCI Parties have any liability for any direct, indirect, special, incidental, punitive, consequential (including, without limitation, lost profits) or any other damages. (www.mscibarra.com)
Russell Investment Group is the source and owner of the Russell Index data contained or reflected in this material and all trademarks and copyrights related thereto. The presentation may contain confidential information and unauthorized use, disclosure, copying, dissemination or redistribution is strictly prohibited. This is a presentation of Artisan Funds. Russell Investment Group is not responsible for the formatting or configuration of this material or for any inaccuracy in Artisan Funds’ presentation thereof.
PROXY VOTING POLICIES AND PROCEDURES
You may obtain a description of Artisan Funds’ proxy voting policies and procedures, without charge, upon request by calling 800.399.1770. That information also is included in Artisan Funds’ statement of additional information, which is available without charge, upon request, by calling 800.399.1770 and on the Securities and Exchange Commission’s website at www.sec.gov.
Information relating to how each Artisan Fund voted proxies relating to portfolio securities held during the twelve-month period ended June 30 is available without charge, on the Funds’ website at www.artisanfunds.com and on the Securities and Exchange Commission’s website at www.sec.gov.
INFORMATION ABOUT PORTFOLIO SECURITIES
Artisan Funds files a complete schedule of portfolio holdings with the Securities and Exchange Commission for the quarters ending December 31 and June 30 (the first and third quarters of the Funds’ fiscal year) on Form N-Q. The Funds’ Forms N-Q are available on the Securities and Exchange Commission’s website at www.sec.gov. You also may review and copy those documents by visiting the Securities and Exchange Commission’s Public Reference Room in Washington, D.C. Information on the operation of the Public Reference Room may be obtained by calling the Securities and Exchange Commission at 800.SEC.0330.
70
DIRECTORS AND OFFICERS
The board of directors has overall responsibility for the conduct of the affairs of Artisan Funds. Each director serves an indefinite term of unlimited duration until the next annual meeting of shareholders and until the election and qualification of his or her successor. The board of directors may fill any vacancy on the board provided that after such appointment at least two-thirds of the directors have been elected by the shareholders. The shareholders may remove a director by a vote of a majority of the outstanding shares of the Funds at any meeting of shareholders called for the purpose of removing such director.
The board of directors elects the officers of Artisan Funds. Each officer serves until the election and qualification of his or her successor, or until he or she sooner dies, resigns, or is removed or disqualified. The board of directors may remove any officer with or without cause at any time.
The names and ages of the directors and officers as of November 17, 2011, the position each holds with the Funds, the date each was first elected to office, their principal business occupations and other directorships they have held during at least the last five years are shown below. Each director oversees all twelve series of Artisan Funds.
| | | | | | | | |
| | | | | |
Name and Age at 11/17/11 | | Position(s)
Held with
Artisan Funds | | Date First Elected
or Appointed to Office | | Principal Occupation(s) during at least the
Past 5 Years | | Other Public Company or
Registered Investment
Company Directorships Held |
| Directors who are not “interested persons” of Artisan Funds: |
| David A. Erne – 68 | | Director and Independent Chair of the Board of Directors | | Director since 3/27/95; Independent Chair since 2/4/05 | | Of counsel to the law firm Reinhart Boerner Van Deuren s.c., Milwaukee, WI. | | Trustee, Northwestern Mutual Life Insurance Company (individual life insurance, disability insurance and annuity company). |
| Thomas R. Hefty – 64 | | Director | | 3/27/95 | | Retired; from January 2007 to February 2008, President, Kern Family Foundation (private, grant-making organization); until December 2006, of counsel to the law firm Reinhart Boerner Van Deuren s.c., Milwaukee, WI; until December 2006, Adjunct Professor, Department of Business and Economics, Ripon College; until December 2002, Chairman of the Board and Chief Executive Officer of Cobalt Corporation (provider of managed care and specialty business services). | | None. |
| Patrick S. Pittard – 65 | | Director | | 8/9/01 | | Chief Executive Officer of ACT Bridge, Inc. (enterprise talent management firm); Distinguished Executive in Residence (teaching position), University of Georgia; until October 2001, Chairman of the Board, President and Chief Executive Officer of Heidrick & Struggles International, Inc. (executive search firm). | | Director, Lincoln National Corporation (insurance and investment management company); former Director, Cbeyond, Inc. (telecommunications company, formerly Cbeyond Communications, Inc.). |
71
DIRECTORS AND OFFICERS
| | | | | | | | |
| | | | | |
Name and Age at 11/17/11 | | Position(s)
Held with
Artisan Funds | | Date First Elected
or Appointed to Office | | Principal Occupation(s) during at least the
Past 5 Years | | Other Public Company or
Registered Investment
Company Directorships Held |
| Howard B. Witt – 71 | | Director | | 3/27/95 | | Retired; until December 2004, Chairman of the Board, President and Chief Executive Officer of Littelfuse, Inc. (manufacturer of advanced circuit protection devices). | | Former Director, Franklin Electric Co., Inc. (manufacturer of electric motors). |
| Director who is an “interested person” of Artisan Funds: |
| Andrew A. Ziegler – 54* | | Director | | 1/5/95 | | Managing Director of Artisan Partners; until February 2010, President and Chief Executive Officer of Artisan Funds. | | None. |
| Officers: |
| Eric R. Colson – 41 | | President and Chief Executive Officer | | 2/9/10 | | Managing Director and Chief Executive Officer of Artisan Partners since January 2010; prior thereto, Managing Director and Chief Operating Officer – Investment Operations of Artisan Partners. | | None. |
| Brooke J. Billick – 57 | | Chief Compliance Officer | | 8/19/04 | | Chief Compliance Officer and Associate Counsel of Artisan Partners; Chief Compliance Officer of Artisan Partners Distributors LLC. | | None. |
| Gregory K. Ramirez – 41 | | Chief Financial Officer and Treasurer | | 2/8/11 | | Managing Director and since March 2010 Chief Accounting Officer of Artisan Partners; Assistant Treasurer of Artisan Partners Distributors LLC; until February 2011, Assistant Secretary and Assistant Treasurer of Artisan Funds. | | None. |
| Sarah A. Johnson – 39 | | General Counsel, Vice President and Secretary | | 2/8/11 | | Managing Director (since March 2010) and Associate Counsel of Artisan Partners; until February 2011, Assistant Secretary of Artisan Funds. | | None. |
| James S. Hamman, Jr. – 42 | | Vice President and Assistant Secretary | | 2/8/11 | | Associate Counsel of Artisan Partners since March 2010; from January 2008 until February 2010, Principal of Elite Investment Partners, LLC; prior thereto, Executive Vice President, General Counsel and Secretary of Calamos Asset Management, Inc. | | None. |
| * | Mr. Ziegler is an “interested person” of Artisan Funds, as defined in the Investment Company Act of 1940, because he is a Managing Director of Artisan Partners and an officer of Artisan Investments GP LLC (the general partner of Artisan Partners). Mr. Ziegler and Carlene M. Ziegler (who are married to each other) control Artisan Partners. |
72
DIRECTORS AND OFFICERS
The business address of the officers and director affiliated with Artisan Partners is 875 E. Wisconsin Avenue, Suite 800, Milwaukee, Wisconsin 53202. The addresses of the other directors are: Mr. Erne, Mr. Hefty, Mr. Pittard and Mr. Witt – c/o Artisan Funds, 875 E. Wisconsin Avenue, Suite 800, Milwaukee, Wisconsin 53202.
Artisan Funds’ statement of additional information (SAI) contains further information about the directors. Please call 800.399.1770 for a free copy of the SAI.
73
| | | | |
 | | ARTISAN FUNDS P.O. BOX 8412 BOSTON, MA 02266-8412 800.399.1770 | | |

ANNUAL
REPORT
SEPTEMBER 30, 2011
ARTISAN EMERGING MARKETS FUND
ARTISAN FUNDS
ADVISOR SHARES
TABLE OF CONTENTS
ARTISAN FUNDS
P.O. BOX 8412
BOSTON, MA 02266-8412
This report and the audited financial statements contained herein are provided for the general information of the shareholders of the Advisor Shares of Artisan Emerging Markets Fund. Before investing, investors should consider carefully the Fund’s investment objective, risks and charges and expenses. For more complete information on the Fund, including fees and expenses, please call 866.574.1770 for a free prospectus. Read it carefully before you invest or send money.
Company discussions are for illustration only and are not intended as recommendations of individual stocks. The discussion presents information about the companies believed to be accurate, and the views of the portfolio manager, as of September 30, 2011. That information and those views may change, and the Fund disclaims any obligation to advise shareholders of any such changes. Artisan Emerging Markets Fund also offers an institutional class of shares for institutional investors meeting certain minimum investment requirements. A report on the institutional class is available under separate cover.
Artisan Funds offered through Artisan Partners Distributors LLC, member FINRA.
ARTISAN EMERGING MARKETS FUND (ARTZX)
INVESTMENT PROCESS HIGHLIGHTS
Artisan Emerging Markets Fund employs a fundamental research process to construct a diversified portfolio of emerging market companies. The team’s investment process is focused on identifying companies that are priced at a discount relative to the team’s estimate of their sustainable earnings.
| • | | Sustainable Earnings. The team believes that over the long term a stock’s price is directly related to the company’s ability to deliver sustainable earnings. The team determines a company’s sustainable earnings based upon financial and strategic analyses. The financial analysis of a company’s balance sheet, income statement, and statement of cash flows focuses on identifying historical drivers of return on equity. The strategic analysis examines a company’s competitive advantages and financial strength to assess sustainability. |
| • | | Valuation. The team believes that investment opportunities develop when businesses with sustainable earnings are undervalued relative to peers and historical industry, country and regional valuations. The team values a business and develops a price target based on their assessment of the business’s sustainable earnings and cash flow expectations and the team’s risk analysis. |
| • | | Risk Analysis. The team believes that a disciplined risk framework allows greater focus on fundamental stock selection. The team incorporates its assessment of company-specific and macroeconomic risks into its valuation analysis to develop a risk-adjusted target price. The risk-rating assessment includes a review of the currency, interest rate, monetary and fiscal policy and political risks to which a company is exposed. |
PERFORMANCE HISTORY
GROWTH OF AN ASSUMED $10,000 INVESTMENT (6/2/2008 to 9/30/2011)
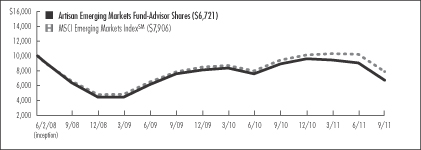
AVERAGE ANNUAL TOTAL RETURNS (as of 9/30/2011)
| | | | | | | | | | | | |
| Fund / Index | | 1-Year | | | 3-Year | | | Since
Inception | |
Artisan Emerging Markets Fund - Advisor Shares | | | -24.86 | % | | | 1.63 | % | | | -11.25 | % |
MSCI Emerging Markets IndexSM | | | -16.15 | | | | 6.27 | | | | -6.82 | |
The performance quoted represents past performance, which does not guarantee future results. The investment return and principal value of an investment in the Fund will fluctuate, so that an investor’s shares in the Fund, when redeemed, may be worth more or less than their original cost. Current performance may be lower or higher than the performance data quoted. For current to most recent month-end performance information call 866.574.1770. The graph and table above do not reflect the deduction of taxes that a shareholder would pay on distributions or sale of Fund shares. The performance shown does not reflect the deduction of a 2% redemption fee on shares held by an investor for 90 days or less and, if reflected, the fee would reduce the performance quoted. The Fund’s performance information reflects Artisan Partners’ contractual agreement to limit the Fund’s expenses to no more than 1.50%, which has been in effect since the Fund’s inception and has had a material impact on the Fund’s performance. Absent that expense waiver, the Fund’s performance would have been lower. See page 25 for a description of the index.
2
INVESTING ENVIRONMENT
Emerging markets, as measured by the MSCI Emerging Markets IndexSM, advanced in the first half of the period despite inflation concerns in emerging markets and political turmoil in the Middle East and North Africa. However, in the latter half of the period, sovereign debt concerns in the developed world and fears of an economic hard landing in China heightened investor risk aversion and weighed heavily on emerging markets, erasing earlier gains. Emerging Asia held up the best, as many countries in the region had losses confined to single-digits. From a regional perspective, Latin America fared the worst, with Brazil posting losses of approximately 26%. All of the BRIC (Brazil, Russia, India, China) nations posted double-digit declines, with Brazil suffering the largest setback, while Russia, India and China retreated approximately 12%, 25% and 24%, respectively.
SECTOR DIVERSIFICATION
| | | | | | | | |
| Sector | | 9/30/10 | | | 9/30/11 | |
Consumer Discretionary | | | 8.3 | % | | | 12.0 | % |
Consumer Staples | | | 7.3 | | | | 5.2 | |
Energy | | | 11.0 | | | | 10.3 | |
Financials | | | 15.8 | | | | 18.0 | |
Healthcare | | | 2.7 | | | | 3.4 | |
Industrials | | | 9.5 | | | | 7.8 | |
Information Technology | | | 12.5 | | | | 18.3 | |
Materials | | | 14.8 | | | | 13.4 | |
Telecommunication Services | | | 10.5 | | | | 7.7 | |
Utilities | | | 3.0 | | | | 2.0 | |
Other assets less liabilities | | | 4.6 | | | | 1.9 | |
Total | | | 100.0 | % | | | 100.0 | % |
As a percentage of total net assets.
PERFORMANCE DISCUSSION
During the twelve-month period ended September 30, 2011, Artisan Emerging Markets Fund declined 24.86%, underperforming the MSCI Emerging Markets IndexSM, which fell 16.15% over the same period.
Performance of the following stocks had a positive impact on the portfolio during the period: Polski Koncern Naftowy Orlen S.A., a refiner and distributor of petroleum products; Taiwan Semiconductor Manufacturing Company Ltd., a manufacturer of integrated circuits; Fleury SA, a medical services provider; Empresa Nacional de Telecomunicaciones S.A. (ENTEL), a telecommunications services provider in Chile; and Tim Participacoes S.A., a provider of mobile telecommunications services.
Notable detractors included: Petroleo Brasileiro S.A.– Petrobras, an oil and natural gas producer; Hypermarcas SA, a consumer goods manufacturer; China Yurun Food Group Limited, a meat product supplier in China; LSR Group O.J.S.C., a real estate developer; and Vale SA, a metals and mining company.
REGION ALLOCATION
| | | | | | | | |
| Region | | 9/30/10 | | | 9/30/11 | |
Emerging Asia | | | 44.8 | % | | | 48.1 | % |
Latin America | | | 25.0 | | | | 26.4 | |
Europe, Middle East & Africa | | | 23.9 | | | | 20.8 | |
Developed Markets | | | 1 .7 | | | | 2.8 | |
As a percentage of total net assets.
FUND CHANGES
We identified several new investment opportunities for the portfolio during the period, including CNOOC Limited, a producer of crude oil and natural gas; Infosys Limited, an IT consulting and software services provider; KB Financial Group, Inc., the holding company for Kookmin Bank; Mahindra & Mahindra Ltd., a manufacturer of automobiles, farm equipment and automotive components; and Sinopharm Group Co., a pharmacy distribution company. We funded these purchases in part by selling our positions in China Mobile Limited, Siam Commercial Bank Public Company Limited, Companhia de Bebidas das Americas (AmBev), Iguatemi Empresa de Shopping Centers SA, and ABSA Group Limited.
3
ARTISAN EMERGING MARKETS FUND
Schedule of Investments – September 30, 2011
Dollar values in thousands
| | | | | | | | |
| | | Shares
Held | | | Value | |
| | | | | | | | |
COMMON AND
PREFERRED STOCKS - 98.1% | | | | | | | | |
| | | | | | | | |
| BRAZIL - 18.3% | | | | | | | | |
Anhanguera Educacional Participacoes SA | | | 365,300 | | | $ | 4,702 | |
Banco do Brasil S.A.(1)(2) | | | 107,980 | | | | 1,427 | |
Banco do Brasil S.A. | | | 347,400 | | | | 4,589 | |
BM&F BOVESPA SA | | | 1,623,200 | | | | 7,588 | |
BR Properties SA | | | 738,314 | | | | 6,707 | |
Companhia Energetica de Minas Gerais-CEMIG, Preferred(3) | | | 452,171 | | | | 6,669 | |
Companhia Vale do Rio Doce | | | 973,462 | | | | 22,081 | |
Fibria Celulose S.A. | | | 507,700 | | | | 3,861 | |
Hypermarcas SA | | | 1,289,400 | | | | 6,062 | |
Julio Simoes Logistica SA(1)(2) | | | 293,100 | | | | 1,372 | |
Julio Simoes Logistica SA | | | 462,400 | | | | 2,164 | |
Magazine Luiza SA(4) | | | 488,900 | | | | 3,053 | |
Magnesita Refratarios SA(4) | | | 906,200 | | | | 2,916 | |
PDG Realty SA Empreendimentos e Participacoes | | | 1,821,939 | | | | 5,940 | |
Petroleo Brasileiro S.A. | | | 2,098,245 | | | | 23,323 | |
Randon SA Implementos e Participacoes, Preferred(3) | | | 1,271,017 | | | | 6,875 | |
Tim Participacoes S.A. | | | 1,130,867 | | | | 5,233 | |
Totvs SA | | | 463,700 | | | | 7,892 | |
| | | | | | | | |
| | | | | | | 122,454 | |
| CHILE - 0.8% | | | | | | | | |
Empresa Nacional de Telecomunicaciones S.A. | | | 291,448 | | | | 5,607 | |
| | | | | | | | |
| CHINA - 12.6% | | | | | | | | |
Ajisen China Holdings Limited(5) | | | 6,066,913 | | | | 6,946 | |
Chaoda Modern Agriculture (Holdings) Limited(5) | | | 12,474,536 | | | | 2,243 | |
China High Precision Automation Group Ltd.(5) | | | 9,066,000 | | | | 3,440 | |
China Rongsheng Heavy Industries Group Holdings Limited(5) | | | 14,116,500 | | | | 3,725 | |
China Yurun Food Group Limited(5) | | | 3,466,000 | | | | 3,702 | |
CNOOC Limited(5) | | | 6,141,000 | | | | 9,836 | |
Digital China Holdings Limited(5) | | | 3,186,000 | | | | 4,082 | |
GOME Electrical Appliances Holdings Limited(5) | | | 23,878,881 | | | | 5,494 | |
Huabao International Holdings Limited(5) | | | 9,598,322 | | | | 7,824 | |
Huaneng Power International, Inc., H Shares(5) | | | 9,416,700 | | | | 3,899 | |
| | | | | | | | |
| CHINA (CONTINUED) | | | | | | | | |
Mindray Medical International Limited, Class A (DR) | | | 267,384 | | | $ | 6,313 | |
Noah Holdings Ltd. (DR)(4) | | | 437,025 | | | | 4,021 | |
Sinopharm Group Co(5) | | | 2,646,100 | | | | 6,907 | |
Springland International Holdings Ltd.(5) | | | 8,140,000 | | | | 5,211 | |
Tingyi (Cayman Islands) Holding Corporation(5) | | | 1,873,659 | | | | 4,559 | |
Zhuzhou CSR Times Electric Co., Ltd., H Shares(5) | | | 3,597,200 | | | | 5,868 | |
| | | | | | | | |
| | | | | | | 84,070 | |
| COLOMBIA - 0.8% | | | | | | | | |
Grupo de Inversiones Suramericana | | | 312,217 | | | | 5,371 | |
| | | | | | | | |
| EGYPT - 1.1% | | | | | | | | |
Commercial International Bank Egypt SAE(5) | | | 1,023,353 | | | | 3,940 | |
Egyptian Financial Group-Hermes Holding(4)(5) | | | 1,310,634 | | | | 3,712 | |
| | | | | | | | |
| | | | | | | 7,652 | |
| HONG KONG - 0.8% | | | | | | | | |
AIA Group Ltd.(5) | | | 1,866,465 | | | | 5,306 | |
| | | | | | | | |
| HUNGARY - 0.9% | | | | | | | | |
MOL Hungarian Oil and Gas Nyrt., Class A(4)(5) | | | 85,415 | | | | 5,757 | |
| | | | | | | | |
| INDIA - 5.2% | | | | | | | | |
India Cements Limited(5) | | | 2,797,261 | | | | 4,097 | |
Infosys Limited(5) | | | 191,836 | | | | 9,714 | |
Mahindra & Mahindra Ltd.(5) | | | 445,667 | | | | 7,267 | |
Nagarjuna Construction Company Ltd.(5) | | | 2,427,898 | | | | 2,960 | |
Power Finance Corporation(5) | | | 1,425,551 | | | | 4,294 | |
Reliance Infrastructure Ltd.(5) | | | 407,599 | | | | 3,044 | |
Welspun Corporation Ltd.(5) | | | 1,443,002 | | | | 3,206 | |
| | | | | | | | |
| | | | | | | 34,582 | |
| INDONESIA - 5.8% | | | | | | | | |
Indofood CBP Sukses Makmur TBK PT(5) | | | 7,506,000 | | | | 4,163 | |
PT Astra International Tbk(5) | | | 1,915,500 | | | | 13,529 | |
PT Bank Negara Indonesia Tbk(5) | | | 21,423,018 | | | | 8,815 | |
PT Gudang Garam Tbk(5) | | | 1,140,500 | | | | 6,684 | |
PT Telekomunikasi Indonesia Tbk(5) | | | 6,911,385 | | | | 5,929 | |
| | | | | | | | |
| | | | | | | 39,120 | |
| ITALY - 0.6% | | | | | | | | |
Tenaris S.A. (DR) | | | 145,244 | | | | 3,696 | |
4
| | | | | | | | |
| | | Shares
Held | | | Value | |
| | | | | | | | |
| KAZAKHSTAN - 0.8% | | | | | | | | |
KazMunaiGas Exploration Production (DR)(5) | | | 364,211 | | | $ | 5,323 | |
| | | | | | | | |
| KOREA - 11.4% | | | | | | | | |
Daewoo Shipbuilding & Marine Engineering Co., Ltd.(5) | | | 283,904 | | | | 5,309 | |
E-Mart Co., Ltd.(4)(5) | | | 25,390 | | | | 6,351 | |
KB Financial Group, Inc.(5) | | | 267,162 | | | | 8,725 | |
LOCK&LOCK CO., LTD.(5) | | | 213,470 | | | | 5,747 | |
LOCK&LOCK CO., LTD., Rights(5) | | | 18,259 | | | | 78 | |
Samsung Electronics Co., Ltd.(5) | | | 51,699 | | | | 36,216 | |
Shinhan Financial Group Co., Ltd.(5) | | | 293,320 | | | | 10,257 | |
Shinsegae Co., Ltd.(5) | | | 16,330 | | | | 3,717 | |
| | | | | | | | |
| | | | | | | 76,400 | |
| MEXICO - 6.5% | | | | | | | | |
America Movil SAB de C.V., Series L | | | 13,879,775 | | | | 15,413 | |
Genomma Lab Internacional SA(4) | | | 3,088,226 | | | | 5,093 | |
Grupo Financiero Banorte S.A. de C.V., O Shares | | | 1,948,819 | | | | 5,759 | |
Grupo Televisa S.A., Series CPO | | | 1,755,854 | | | | 6,441 | |
OHL Mexico SAB de CV(4) | | | 3,770,100 | | | | 6,089 | |
Urbi, Desarrollos Urbanos, S.A. de C.V.(4) | | | 3,267,259 | | | | 4,403 | |
| | | | | | | | |
| | | | | | | 43,198 | |
| RUSSIA - 5.7% | | | | | | | | |
Eurasia Drilling Company Ltd. (DR)(5) | | | 157,363 | | | | 2,863 | |
Eurasia Drilling Company Ltd., 144A (DR)(5) | | | 26,670 | | | | 485 | |
Globaltrans Investment PLC (DR)(5) | | | 402,853 | | | | 5,447 | |
LSR Group O.J.S.C. (DR)(5) | | | 1,608,262 | | | | 5,847 | |
LUKOIL (DR)(5) | | | 258,310 | | | | 13,004 | |
Magnitogorsk Iron & Steel Works (DR)(5) | | | 872,734 | | | | 4,119 | |
Mobile TeleSystems (DR) | | | 498,796 | | | | 6,135 | |
| | | | | | | | |
| | | | | | | 37,900 | |
| SOUTH AFRICA - 7.8% | | | | | | | | |
African Bank Investments Limited(5) | | | 2,004,829 | | | | 8,151 | |
Harmony Gold Mining Company Limited(5) | | | 713,275 | | | | 8,376 | |
Impala Platinum Holdings Limited(5) | | | 478,095 | | | | 9,691 | |
Mondi Limited(5) | | | 664,461 | | | | 4,710 | |
Mr. Price Group Limited(5) | | | 1,050,178 | | | | 8,716 | |
MTN Group Limited(5) | | | 782,959 | | | | 12,810 | |
| | | | | | | | |
| | | | | | | 52,454 | |
| SWEDEN - 0.7% | | | | | | | | |
Alliance Oil Company Ltd. (DR)(3)(5) | | | 439,223 | | | | 4,663 | |
| | | | | | | | |
| TAIWAN - 11.6% | | | | | | | | |
Chinatrust Financial Holding Company Ltd.(5) | | | 10,091,136 | | | | 5,739 | |
E Ink Holdings Inc.(5) | | | 5,623,000 | | | | 11,661 | |
Far Eastern Textile Ltd.(5) | | | 5,004,213 | | | | 5,098 | |
Hon Hai Precision Industry Co., Ltd.(5) | | | 4,437,921 | | | | 9,907 | |
HTC Corporation(5) | | | 491,251 | | | | 10,792 | |
MediaTek Incorporation(5) | | | 802,794 | | | | 8,747 | |
Taiwan Fertilizer Co., Ltd.(5) | | | 2,376,000 | | | | 5,753 | |
| | | | | | | | |
| TAIWAN (CONTINUED) | | | | | | | | |
Taiwan Semiconductor Manufacturing Company Ltd.(5) | | | 8,811,647 | | | $ | 19,965 | |
| | | | | | | | |
| | | | | | | 77,662 | |
| THAILAND - 1.5% | | | | | | | | |
Bangkok Bank Public Company Limited (DR)(5) | | | 1,406,800 | | | | 6,294 | |
Bumrungrad Hospital Public Company Limited (DR)(5) | | | 3,295,200 | | | | 4,037 | |
| | | | | | | | |
| | | | | | | 10,331 | |
| TURKEY - 3.9% | | | | | | | | |
Bizim Toptan Satis Magazalari AS(5) | | | 92,628 | | | | 1,085 | |
Cimsa Cimento Sanayi ve Ticaret A.S.(5) | | | 668,518 | | | | 2,695 | |
Emlak Konut Gayrimenkul Yatirim(5) | | | 3,814,768 | | | | 4,895 | |
Ford Otomotiv Sanayi A.S.(5) | | | 736,431 | | | | 5,134 | |
Tekfen Holding A.S.(5) | | | 1,072,086 | | | | 3,274 | |
Turk Ekonomi Bankasi A.S.(5) | | | 3,919,348 | | | | 3,504 | |
Turkiye Sinai Kalkinma Bankasi A.S.(5) | | | 5,422,974 | | | | 5,781 | |
| | | | | | | | |
| | | | | | | 26,368 | |
| UNITED ARAB EMIRATES - 0.6% | | | | | | | | |
Air Arabia(5) | | | 21,440,109 | | | | 3,663 | |
| | | | | | | | |
| UNITED KINGDOM - 0.7% | | | | | | | | |
Antofagasta plc(5) | | | 336,587 | | | | 4,779 | |
| | | | | | | | |
Total common and preferred stocks
(Cost $846,000) | | | | | | | 656,356 | |
| | |
| | | Par
Amount | | | | |
SHORT-TERM INVESTMENTS
(CASH EQUIVALENTS) - 1.1% | | | | | |
Repurchase agreement with Fixed Income Clearing Corporation, 0.01%, dated 9/30/11, due 10/3/11, maturity value $7,346
(Cost $7,346)(6) | | $ | 7,346 | | | $ | 7,346 | |
| | | | | | | | |
| | | | | | | | |
Total investments - 99.2%
(Cost $853,346) | | | | | | | 663,702 | |
| | | | | | | | |
Other assets less liabilities - 0.8% | | | | | | | 5,577 | |
| | | | | | | | |
| | | | | | | | |
Total net assets - 100.0%(7) | | | | | | $ | 669,279 | |
| | | | | | | | |
5
| (1) | The shares of Banco do Brasil S.A. and Julio Simoes Logistica SA were acquired in a private placement and are restricted. The shares of Banco do Brasil S.A. and Julio Simoes Logistica SA are freely tradeable outside the United States, where the Fund expects to trade them. |
| | | | | | | | | | | | | | | | |
Security | | Acquisition
Dates | | | Cost | | | Value | | | Percentage
of Total
Net Assets | |
Banco do Brasil S.A. | | | 7/1/2010 | | | $ | 1,477 | | | $ | 1,427 | | | | 0.2 | % |
Julio Simoes Logistica SA | | | 4/20/2010 | | | | 1,339 | | | | 1,372 | | | | 0.2 | % |
| | | | | | | | | | | | | | | | |
| | | | | | | | | | $ | 2,799 | | | | 0.4 | % |
| | | | | | | | | | | | | | | | |
| (2) | Security has been determined to be illiquid under procedures established by the board of directors of Artisan Funds. In total, the value of securities determined to be illiquid were $2,799, or 0.4% of total net assets. |
| (4) | Non-incoming producing shares. |
| (5) | Valued at fair value in accordance with procedures established by the board of directors of Artisan Funds. In total, securities valued at a fair value were $459,561, or 68.7% of total net assets. See notes 2(a) in Notes to Financial Statements for additional information. |
| | | | | | | | | | | | |
Issuer | | Rate | | | Maturity | | | Value | |
U.S. Treasury Note | | | 2.625 | % | | | 11/15/2020 | | | $ | 7,494 | |
| (7) | Percentages for the various classifications relate to total net assets. |
Company names are as reported by a data service provider and in some cases are translations; a company’s legal name may be different.
(DR) Depositary Receipt, voting rights may vary.
| | | | | | | | |
PORTFOLIO DIVERSIFICATION - September 30, 2011 Dollar values in thousands | |
| | | Value | | | Percentage
of Total
Net Assets | |
Consumer Discretionary | | $ | 80,553 | | | | 12.0 | % |
Consumer Staples | | | 34,849 | | | | 5.2 | |
Energy | | | 68,950 | | | | 10.3 | |
Financials | | | 120,722 | | | | 18.0 | |
Healthcare | | | 22,350 | | | | 3.4 | |
Industrials | | | 51,844 | | | | 7.8 | |
Information Technology | | | 122,416 | | | | 18.3 | |
Materials | | | 89,933 | | | | 13.4 | |
Telecommunication Services | | | 51,127 | | | | 7.7 | |
Utilities | | | 13,612 | | | | 2.0 | |
| | | | | | | | |
Total common and preferred stocks | | | 656,356 | | | | 98.1 | |
Short-term investments | | | 7,346 | | | | 1.1 | |
| | | | | | | | |
Total investments | | | 663,702 | | | | 99.2 | |
Other assets less liabilities | | | 5,577 | | | | 0.8 | |
| | | | | | | | |
Total net assets | | $ | 669,279 | | | | 100.0 | % |
| | | | | | | | |
| | | | | | | | |
CURRENCY EXPOSURE - September 30, 2011 Dollar values in thousands | |
| | | Value | | | Percentage
of Total
Investments | |
Brazilian real | | $ | 122,454 | | | | 18.4 | % |
British pound | | | 4,779 | | | | 0.7 | |
Chilean peso | | | 5,607 | | | | 0.8 | |
Colombian peso | | | 5,371 | | | | 0.8 | |
Egyptian pound | | | 7,652 | | | | 1.2 | |
Hong Kong dollar | | | 79,042 | | | | 11.9 | |
Hungarian forint | | | 5,757 | | | | 0.9 | |
Indian rupee | | | 34,582 | | | | 5.2 | |
Indonesian rupiah | | | 39,120 | | | | 5.9 | |
Korean won | | | 76,400 | | | | 11.5 | |
Mexican peso | | | 43,198 | | | | 6.5 | |
South African rand | | | 52,454 | | | | 7.9 | |
Swedish krona | | | 4,663 | | | | 0.7 | |
Taiwan dollar | | | 77,662 | | | | 11.7 | |
Thai baht | | | 10,331 | | | | 1.6 | |
Turkish lira | | | 26,368 | | | | 4.0 | |
U.S. dollar | | | 64,599 | | | | 9.7 | |
United Arab Emirates dirham | | | 3,663 | | | | 0.6 | |
| | | | | | | | |
Total investments | | $ | 663,702 | | | | 100.0 | % |
| | | | | | | | |
| | | | | | |
| TOP TEN HOLDINGS - September 30, 2011 | |
Company Name | | Country | | Percentage
of Total
Net Assets | |
Samsung Electronics Co., Ltd. | | Korea | | | 5.4 | % |
Petroleo Brasileiro S.A. | | Brazil | | | 3.5 | |
Companhia Vale do Rio Doce | | Brazil | | | 3.3 | |
Taiwan Semiconductor Manufacturing Company Ltd. | | Taiwan | | | 3.0 | |
America Movil SAB de C.V. | | Mexico | | | 2.3 | |
PT Astra International Tbk | | Indonesia | | | 2.0 | |
LUKOIL | | Russia | | | 1.9 | |
MTN Group Limited | | South Africa | | | 1.9 | |
E Ink Holdings Inc. | | Taiwan | | | 1.7 | |
HTC Corporation | | Taiwan | | | 1.6 | |
| | | | | | |
Total | | | | | 26.6 | % |
| | | | | | |
For the purpose of determining the Fund’s top ten holdings, securities of the same issuer are aggregated to determine the weight in the Fund.
The accompanying notes are an integral part of the financial statements.
6
ARTISAN FUNDS
Statement of Assets and Liabilities – September 30, 2011
Dollar values in thousands, except per share amounts
| | | | |
| | | EMERGING MARKETS | |
| ASSETS: | | | | |
Investments in securities, unaffiliated, at value | | $ | 656,356 | |
Short-term investments (repurchase agreements), at value | | | 7,346 | |
| | | | |
Total investments | | | 663,702 | |
Cash | | | 1 | |
Foreign currency | | | 1,709 | |
Net unrealized gain on foreign currency forward contracts | | | 8 | |
Receivable from investments sold | | | 1,527 | |
Receivable from fund shares sold | | | 2,818 | |
Dividends and interest receivable | | | 870 | |
| | | | |
Total assets | | | 670,635 | |
| |
| LIABILITIES: | | | | |
Payable for fund shares redeemed | | | 815 | |
Payable for operating expenses | | | 357 | |
Payable for foreign taxes | | | 184 | |
| | | | |
Total liabilities | | | 1,356 | |
| | | | |
Total net assets | | $ | 669,279 | |
| | | | |
| NET ASSETS CONSIST OF: | | | | |
Fund shares issued and outstanding | | $ | 865,018 | |
Net unrealized depreciation on investments and foreign currency related transactions | | | (189,873 | ) |
Accumulated undistributed net investment income | | | 4,668 | |
Accumulated undistributed net realized losses on investments and foreign currency related transactions | | | (10,534 | ) |
| | | | |
| | $ | 669,279 | |
| | | | |
| SUPPLEMENTARY INFORMATION: | | | | |
Net assets | | | | |
Institutional Shares | | $ | 352,093 | |
Advisor Shares | | $ | 317,186 | |
Shares outstanding (Indefinite number of shares authorized, $0.01 par value) | | | | |
Institutional Shares | | | 30,955,712 | |
Advisor Shares | | | 27,871,355 | |
Net asset value, offering price and redemption price per share | | | | |
Institutional Shares | | $ | 11.37 | |
Advisor Shares | | $ | 11.38 | |
Cost of securities of unaffiliated issuers held | | $ | 853,346 | |
Cost of foreign currency | | $ | 1,723 | |
The accompanying notes are an integral part of the financial statements.
7
ARTISAN FUNDS
Statement of Operations – For the Year Ended September 30, 2011
Dollar values in thousands
| | | | |
| | | EMERGING MARKETS | |
| INVESTMENT INCOME: | | | | |
Dividends, from unaffiliated issuers(1) | | $ | 20,809 | |
Interest | | | 3 | |
| | | | |
Total investment income | | | 20,812 | |
| |
| EXPENSES: | | | | |
Advisory fees | | | 8,324 | |
Transfer agent fees | | | | |
Institutional Shares | | | 20 | |
Advisor Shares | | | 962 | |
Shareholder communications | | | | |
Institutional Shares | | | 18 | |
Advisor Shares | | | 36 | |
Custodian fees | | | 717 | |
Accounting fees | | | 70 | |
Professional fees | | | 82 | |
Registration fees | | | | |
Institutional Shares | | | 56 | |
Advisor Shares | | | 141 | |
Directors’ fees | | | 24 | |
Other operating expenses | | | 16 | |
| | | | |
Total operating expenses | | | 10,466 | |
| | | | |
Net investment income | | | 10,346 | |
| |
| NET REALIZED AND UNREALIZED GAINS (LOSSES) ON INVESTMENTS: | | | | |
Net realized gain (loss) on: | | | | |
Investments | | | 9,473 | |
Foreign currency related transactions | | | (2,693 | ) |
| | | | |
| | | 6,780 | |
Net increase (decrease) in unrealized appreciation or depreciation on: | | | | |
Investments | | | (255,535 | ) |
Foreign currency related transactions | | | 336 | |
| | | | |
| | | (255,199 | ) |
| | | | |
Net loss on investments and foreign currency related transactions | | | (248,419 | ) |
| | | | |
Net decrease in net assets resulting from operations | | $ | (238,073 | ) |
| | | | |
(1) Net of foreign taxes withheld of $1,704.
The accompanying notes are an integral part of the financial statements.
8
ARTISAN FUNDS
Statement of Changes in Net Assets
Dollar values in thousands
| | | | | | | | |
| | | EMERGING MARKETS | |
| | | Year Ended
9/30/2011 | | | Year Ended
9/30/2010 | |
| OPERATIONS: | | | | | | | | |
Net investment income | | $ | 10,346 | | | $ | 3,575 | |
Net realized gain (loss) on: | | | | | | | | |
Investments | | | 9,473 | | | | 9,712 | |
Foreign currency related transactions | | | (2,693 | ) | | | (1,401 | ) |
Net increase (decrease) in unrealized appreciation or depreciation on: | | | | | | | | |
Investments | | | (255,535 | ) | | | 43,790 | |
Foreign currency related transactions | | | 336 | | | | (484 | ) |
| | | | | | | | |
Net increase (decrease) in net assets resulting from operations | | | (238,073 | ) | | | 55,192 | |
| | |
| DISTRIBUTIONS PAID TO SHAREHOLDERS: | | | | | | | | |
Net investment income: | | | | | | | | |
Institutional Shares | | | (3,345 | ) | | | (988 | ) |
Advisor Shares | | | (1,835 | ) | | | (509 | ) |
| | | | | | | | |
Total distributions paid to shareholders | | | (5,180 | ) | | | (1,497 | ) |
| | |
| FUND SHARE ACTIVITIES: | | | | | | | | |
Net increase in net assets resulting from fund share activities | | | 392,736 | | | | 311,692 | |
| | | | | | | | |
Total increase in net assets | | | 149,483 | | | | 365,387 | |
| | | | | | | | |
Net assets, beginning of period | | | 519,796 | | | | 154,409 | |
| | | | | | | | |
Net assets, end of period | | $ | 669,279 | | | $ | 519,796 | |
| | | | | | | | |
| | |
Accumulated undistributed net investment income | | $ | 4,668 | | | $ | 2,512 | |
| | | | | | | | |
The accompanying notes are an integral part of the financial statements.
9
ARTISAN FUNDS
Financial Highlights – For a share outstanding throughout each period
The financial highlights table is intended to help you understand the Fund’s financial performance for the past 5 years or, if shorter, the period of a Fund’s operations. Certain information reflects financial results for a single Fund share. The total returns in the table represent the rate that an investor would have earned or lost on an investment in the Fund (assuming reinvestment of all dividends and distributions).
| | | | | | | | | | | | | | | | |
| | | ARTISAN EMERGING MARKETS FUND | |
| | | Advisor Shares | |
| |
| | | Year or Period Ended | |
| | | | |
| | | 9/30/2011 | | | 9/30/2010 | | | 9/30/2009 | | | 9/30/2008(1) | |
| | | | | | | | | | | | | | | | |
Net Asset Value Beginning of Period | | $ | 15.24 | | | $ | 13.03 | | | $ | 11.16 | | | $ | 17.43 | |
Net Investment Income(2) | | | 0.18 | | | | 0.18 | | | | 0.07 | | | | 0.04 | |
Net Realized and Unrealized Gain (Loss) on Investments | | | (3.94 | ) | | | 2.12 | | | | 1.93 | | | | (6.31 | ) |
| | | | | | | | | | | | | | | | |
Total Income (Loss) from Investment Operations | | | (3.76 | ) | | | 2.30 | | | | 2.00 | | | | (6.27 | ) |
| | | | | | | | | | | | | | | | |
Dividends from Net Investment Income | | | (0.10 | ) | | | (0.09 | ) | | | (0.12 | ) | | | - | |
Distributions from Net Realized Gains | | | - | | | | - | | | | (0.01 | ) | | | - | |
| | | | | | | | | | | | | | | | |
Total Distributions | | | (0.10 | ) | | | (0.09 | ) | | | (0.13 | ) | | | - | |
| | | | | | | | | | | | | | | | |
Net Asset Value End of Period | | $ | 11.38 | | | $ | 15.24 | | | $ | 13.03 | | | $ | 11.16 | |
| | | | | | | | | | | | | | | | |
Total Return(3) | | | (24.86 | )% | | | 17.75 | % | | | 18.64 | % | | | (35.97 | )% |
Net Assets End of Period (millions) | | $ | 317.2 | | | $ | 235.6 | | | $ | 50.4 | | | $ | 3.2 | |
Ratio of Expenses to Average Net Assets(4)(5) | | | 1.47 | % | | | 1.50 | % | | | 1.50 | % | | | 1.50 | % |
Ratio of Net Investment Income to Average Net Assets(4)(5) | | | 1.19 | % | | | 1.28 | % | | | 0.70 | % | | | 0.93 | % |
Portfolio Turnover Rate(3) | | | 30.86 | % | | | 25.89 | % | | | 56.88 | % | | | 42.24 | % |
| (1) | For the period from commencement of operations June 2, 2008 through September 30, 2008. |
| (2) | Computed based on average shares outstanding. |
| (3) | Periods less than twelve months (where applicable) are not annualized. |
| (4) | Periods less than twelve months (where applicable) are annualized. |
| (5) | The ratios of expenses to average net assets and net investment income (loss) to average net assets exclude expenses waived or paid by the Adviser or the board of directors. Absent expenses waived or paid by the Adviser or the board of directors, the ratios of expenses to average net assets and net investment income (loss) to average net assets would have been as follows: |
| | | | | | | | |
Year or
Period Ended | | Ratio of Expenses to
Average Net Assets | | | Ratio of Net Investment Income
(Loss) to Average Net Assets | |
| 9/30/2010 | | | 1.73 | % | | | 1.04 | % |
| 9/30/2009 | | | 3.00 | % | | | (0.80 | )% |
| 9/30/2008 | | | 9.73 | % | | | (7.30 | )% |
The accompanying notes are an integral part of the financial statements.
10
ARTISAN FUNDS
Notes to Financial Statements – September 30, 2011
Artisan Partners Funds, Inc. (“Artisan Funds”) was incorporated on January 5, 1995, as a Wisconsin corporation and is registered under the Investment Company Act of 1940, as amended. Effective July 1, 2011, Artisan Partners Funds, Inc. changed its name from Artisan Funds, Inc. but will continue to do business as Artisan Funds. Artisan Funds is a series comprised of twelve open-end, diversified mutual funds. Artisan Emerging Markets Fund (the “Fund”) commenced operations on June 26, 2006. The Fund’s investment objective is to seek long-term capital growth.
Emerging Markets Fund offers shares of capital stock of two classes – Institutional Shares and Advisor Shares – and began offering Advisor Shares on June 2, 2008. Advisor Shares are sold to employee benefit plans, clients of financial advisors, clients of sponsored programs and institutional or other investors. All investments and exchanges are subject to approval by the Fund. The financial statements of Institutional Shares are presented in a separate report.
Each class of shares has equal rights with respect to portfolio assets and voting privileges. Each class has exclusive voting rights with respect to any matters involving only that class.
Income, expenses not specific to a particular class and realized and unrealized gains and losses were allocated daily to each class of shares based upon the relative net asset value of outstanding shares. Expenses attributable to a particular class of shares, such as transfer agency fees, shareholder communication expenses and registration fees, were allocated directly to that class.
The Fund is managed by Artisan Partners Limited Partnership (the “Adviser” or “Artisan Partners”). The Adviser is wholly owned by Artisan Partners Holdings LP (“Artisan Holdings”).
| (2) | Summary of significant accounting policies: |
The following is a summary of significant accounting policies of Artisan Funds in effect during the period covered by the financial statements, which were in accordance with United States generally accepted accounting principles.
| (a) | Security valuation – The net asset value (“NAV”) of the shares of each class of the Fund was determined as of the close of regular session trading on the New York Stock Exchange (“NYSE”) (usually 4:00 p.m., Eastern Time) each day the NYSE was open for regular session trading. The NAV of each class of shares was determined by dividing the value of the Fund’s securities and other assets attributed to that class, less its liabilities attributed to that class, by the number of outstanding shares of that class of the Fund. |
In determining NAV, each equity security traded on a securities exchange, including over-the-counter securities, was valued at the closing price as of the time of valuation on the exchange or market designated by the Fund’s accounting agent or pricing vendor as the principal exchange (the “principal exchange”). The closing price provided by the pricing vendor for a principal exchange may differ and may represent information such as last sales price, an official closing price, a closing auction price or other information, depending on exchange or market convention. Absent closing
11
NOTES TO FINANCIAL STATEMENTS
price information from the principal exchange as of the time of valuation, the security was valued using the closing price on another exchange on which the security traded (if such price is made available by the pricing vendor) or the most recent bid quotation on the principal exchange or, if not available, another exchange or in the over-the-counter market. Short-term investments, other than repurchase agreements, maturing within sixty days from the valuation date were valued at amortized cost, which approximates market value.
Exchange traded option contracts were valued at the last sale or official closing price on the exchange where an option is principally traded or, if no sales or closing prices were available, at the mean of the most recent bid and ask quotation on the principal exchange.
Securities for which prices were not readily available were valued by Artisan Funds’ valuation committee (the “valuation committee”) at a fair value determined in good faith under procedures established by and under the general supervision of Artisan Funds’ board of directors (the “board of directors”). A price was considered to be not readily available if, among other things, the valuation committee believed that the price determined as described in the preceding paragraphs did not reflect a fair value of the security.
Emerging Markets Fund generally invested a significant portion, and perhaps as much as substantially all, of its total assets in securities principally traded in markets outside the U.S. The foreign markets in which the Fund invested were sometimes open on days when the NYSE was not open and the Fund did not calculate its NAV, and sometimes were not open on days when the Fund did calculate its NAV. Even on days on which both the foreign market and the NYSE were open, several hours may have passed between the time when trading in the foreign market closed and the time as of which the Fund calculated its NAV. That was generally the case for markets in Europe, Asia, Australia and other far eastern markets; the regular closing time of foreign markets in North and South America was generally the same as the closing time of the NYSE and the time as of which the Fund calculated its NAV.
The valuation committee concluded that a price determined under the Fund’s valuation procedures was not readily available if, among other things, the valuation committee believed that the value of the security might have been materially affected by events occurring after the close of the market in which the security was principally traded but before the time for determination of NAV (“subsequent event”). A subsequent event might include a company-specific development (for example, announcement of a merger that is made after the close of the foreign market), a development that might affect an entire market or region (for example, imposition of foreign exchange controls by a foreign government), a potentially global development (such as a terrorist attack that may be expected to have an impact on investor expectations worldwide) or a significant change in one or more U.S. securities indices. Artisan Funds monitored for subsequent events using several tools. An indication by any of those tools of a potential material change in the value of securities resulted in either a meeting of the valuation committee, which considered whether a subsequent event had occurred and whether local market closing prices continued to represent fair values for potentially affected non-U.S. securities, and/or a valuation based on information provided by a third party research service. This third party research
12
NOTES TO FINANCIAL STATEMENTS
service was used to assist in determining estimates of fair values for foreign securities. That service utilized statistical data based on historical performance of securities, markets and other data in developing factors used to estimate a fair value.
Estimates of fair values utilized by the Fund as described above may differ from the value realized on the subsequent sale of those securities and from quoted or published prices for those securities. The differences may have been material to the NAV of the Fund or to the information presented.
Foreign stocks, as an asset class, may underperform U.S. stocks, and foreign stocks may be more volatile than U.S. stocks. Risks relating to investments in foreign securities (including, but not limited to, depositary receipts and participation certificates) include: currency exchange rate fluctuation; less available public information about the issuers of securities; less stringent regulatory standards; lack of uniform accounting, auditing and financial reporting standards; and country risks including less liquidity, high inflation rates, unfavorable economic practices and political instability.
The risks of foreign investments typically are greater in emerging and less developed markets. For example, political and economic structures in these less developed countries may be new and changing rapidly, which may cause instability and greater risk of loss. Their securities markets may be less developed, and securities in those markets are generally more volatile and less liquid than those in developed markets. Emerging market countries also are more likely to experience high levels of inflation, deflation or currency devaluations, which could hurt their economies and securities markets. Certain emerging markets also may face other significant internal or external risks, including a heightened risk of war, and ethnic, religious and racial conflicts. In addition, governments in many emerging market countries participate to a significant degree in their economies and securities markets, which may impair investment and economic growth of companies in those markets. High levels of national debt tend to make such markets also heavily reliant on foreign capital and, therefore, vulnerable to capital flight.
| (b) | Fair value measurements – Under generally accepted accounting principles for fair value measurement, accounting standards clarify the definition of fair value for financial reporting, establish a framework for measuring fair value and require additional disclosures about the use of fair value measurements. In accordance with this standard, fair value is defined as the price that the Fund would receive upon selling an investment in an orderly transaction to an independent buyer in the principal or most advantageous market of the investment. The standard establishes a three-tier hierarchy to distinguish between (1) inputs that reflect the assumptions market participants would use in pricing an asset or liability developed based on the market data obtained from sources independent of the reporting entity (observable inputs) and (2) inputs that reflect the reporting entity’s own assumptions about the assumptions market participants would use in pricing an asset or liability developed based on the best information available in the circumstances (unobservable inputs) and to establish classification of fair value measurements for disclosure purposes. Various inputs are used in determining the value of the Fund’s investments. The three-tier hierarchy of inputs is summarized in three broad levels: |
| | • | | Level 1 – quoted prices in active markets for identical investments |
13
NOTES TO FINANCIAL STATEMENTS
| | • | | Level 2 – other significant observable inputs (including but not limited to quoted prices for similar securities, interest rates, credit risks, etc. Securities primarily traded outside the U.S., whose values were adjusted as a result of significant market movements, are classified as level 2.) |
| | • | | Level 3 – significant unobservable inputs (including the Fund’s own assumptions in determining a fair value of investments) |
The inputs or methodology used for valuing securities are not necessarily an indication of the risk or liquidity associated with investing in those securities.
The following table summarizes the Fund’s investments, based on the inputs used to determine their fair values as of September 30, 2011 (in thousands):
| | | | | | | | | | | | | | | | |
| Fund | | Level 1 - Quoted
Prices | | | Level 2 - Other Significant
Observable Inputs | | | Level 3 - Significant
Unobservable Inputs | | | Total | |
Emerging Markets | | | | | | | | | | | | | | | | |
Equity Securities(1) | | | | | | | | | | | | | | | | |
Developed Markets | | $ | 3,696 | | | $ | 14,748 | | | | - | | | $ | 18,444 | |
Emerging Asia | | | 10,334 | | | | 311,831 | | | | - | | | | 322,165 | |
Emerging Europe, Middle East & Africa | | | 6,135 | | | | 132,982 | | | | - | | | | 139,117 | |
Latin America | | | 176,630 | | | | - | | | | - | | | | 176,630 | |
Repurchase Agreements | | | - | | | | 7,346 | | | | - | | | | 7,346 | |
Total | | $ | 196,795 | | | $ | 466,907 | (2) | | | - | | | $ | 663,702 | |
| | (1) | See Fund’s Schedule of Investments for sector or country classifications. |
| | (2) | Includes securities trading primarily outside the U.S. whose value the Fund adjusted as result of significant market movements following the close of local trading. |
Transfers between investment levels may occur as markets fluctuate and/or the availability of data used in an investment’s valuation changes. The Fund recognizes transfers between levels as of the end of the period. At September 30, 2011, the fair market values of certain securities were adjusted, resulting in their Level 2 classification, due to developments that occurred between the time of the close of the foreign markets on which they trade and the close of regular session trading on the NYSE. Transfers from Level 1 to Level 2 for the Fund as of September 30, 2011 were approximately $357,984,000.
| (c) | Taxes – No provision was made for federal income taxes or excise taxes since the Fund intends to (i) comply with the provisions of Subchapter M of the Internal Revenue Code applicable to regulated investment companies and (ii) distribute to its shareholders substantially all of its taxable income as well as net realized gains from the sale of investment securities. The Fund may utilize earnings and profits distributed to shareholders on redemptions of Fund shares as part of the dividends paid deduction. |
The Fund has analyzed the tax positions taken on federal income tax returns for all remaining open tax years (fiscal years 2008 through 2011) and has concluded that as of September 30, 2011, no provision for income tax would be required in the Fund’s financial statements. The Fund’s federal and state income and federal excise tax returns
14
NOTES TO FINANCIAL STATEMENTS
for tax years for which the applicable statutes of limitations have not expired are subject to examination by the Internal Revenue Service and state department of revenue.
The Fund may be subject to taxes on realized gains from the sale of investment securities imposed by certain countries in which the Fund invests. The foreign tax expense, if any, was recorded on an accrual basis and is included in “Net realized gain (loss) on investments” on the accompanying Statement of Operations. The amount of foreign tax owed, including withholding taxes of foreign dividends, is included in “Payable for foreign taxes” on the accompanying Statement of Assets and Liabilities.
| (d) | Portfolio transactions – In determining the Fund’s NAV, security transactions and shareholder transactions were accounted for no later than one business day after trade date, in accordance with applicable regulations. However, for financial reporting purposes, security transactions and shareholder transactions were recorded on trade date in accordance with United States generally accepted accounting principles. Net realized gains and losses on securities were computed on specific security lot identification. |
| (e) | Foreign currency translation – Values of foreign investments, open foreign currency forward contracts, payables for capital gains taxes, payables and receivables for securities transactions, dividend and reclaim receivables, other receivables and payables, and cash denominated in a foreign currency were translated into U.S. dollars using a spot market rate of exchange as of the time of determination of the Fund’s NAV on the day of valuation. Purchases and sales of investments and dividend and interest income were translated into U.S. dollars using a current spot market rate of exchange on the date of such transactions. The portion of security gains or losses resulting from changes in foreign exchange rates was included with net realized and unrealized gain or loss from investments, as appropriate, for both financial reporting and tax purposes. |
The Funds may enter into (a) foreign currency contracts, and (b) foreign currency forward contracts. Foreign currency contracts are used to facilitate the purchase and sale of non-U.S. securities and generally settle within three business days. Foreign currency forward contracts are used to hedge against foreign currency exchange rate risks on its non-U.S. dollar denominated investment securities. Open foreign currency contracts and foreign currency forward contracts were recorded at market value and recorded in the Statements of Assets and Liabilities. Realized and unrealized gains and losses were reported as foreign currency related transactions are recorded in the Statement of Operations.
For tax purposes, these foreign exchange gains and losses were treated as ordinary income or loss. The Fund could be exposed to loss if the counterparties fail to perform under these contracts. For the year ended September 30, 2011, the Fund entered only into forward currency contracts. Other foreign currency related transaction gains and losses may result from currency gains and losses realized from the difference between the amounts of dividends and foreign withholding taxes recorded on the Fund’s books and the U.S. dollar equivalent of the amounts actually received or paid. The net increase (decrease) in unrealized appreciation or depreciation on foreign currency related transactions arose from changes in the values of assets and liabilities, other than investments in securities, resulting from changes in foreign exchange rates.
| (f) | Repurchase agreements – The Fund may enter into repurchase agreements with institutions that the Adviser determined were creditworthy pursuant to criteria |
15
NOTES TO FINANCIAL STATEMENTS
| | adopted by the board of directors. Repurchase agreements were recorded at cost plus accrued interest and were collateralized in an amount greater than or equal to the repurchase price plus accrued interest. Collateral (in the form of U.S. government securities) was held by the Fund’s custodian and in the event of default on the obligation of the counterparty to repurchase, the Fund had the right to liquidate the collateral and apply the proceeds in satisfaction of the obligation. If the proceeds from any sale of such collateral were less than the repurchase price, the Fund would have suffered a loss. |
| (g) | Depositary receipts – The Fund may invest in depositary receipts. Depositary receipts are typically issued by a financial institution (a “depositary”), evidencing ownership interests in a security issued by an issuer and deposited with the depositary. |
| (h) | Equity-linked participation certificates – The Fund may invest in equity-linked participation certificates. Equity-linked participation certificates are derivative securities which are designed to provide synthetic exposure to one or more underlying securities. An investment in an equity-linked participation certificate typically entitles the holder to a return equal to the market return of the underlying security or securities, subject to the credit risk of the issuing financial institution. There is no off-balance sheet risk associated with equity-linked participation certificates and the Fund’s potential loss is limited to the purchase price of the securities. The Fund is exposed to credit risk associated with the counterparty to the transaction, which is monitored by Fund management on a periodic basis. |
| (i) | Transfer agent and authorized agent fees – The Fund paid fees to, and reimbursed expenses of, the Fund’s transfer agent. In addition, the Fund has authorized certain financial services companies, broker-dealers, banks or other authorized agents, and in some cases, other organizations designated by an authorized agent (with their designees, collectively “authorized agents”) to accept purchase, exchange and redemption orders for Advisor Shares on the Fund’s behalf. Many authorized agents charged a fee for accounting and shareholder services that the agent provided to Fund shareholders on the Fund’s behalf. Those services typically included recordkeeping, transaction processing for shareholders’ accounts and other services. The fee was either based on the number of accounts to which the authorized agent provided such services, or was a percentage (as of September 30, 2011, up to 0.40% annually) of the average value of Fund shares held in such accounts. The Fund paid a portion of such fees, which are intended to compensate the authorized agent for its provision of services of the type that would be provided by the Fund’s transfer agent or other service providers if the shares were registered on the books of the Fund’s transfer agent. The balance of the fees incurred was paid by the Adviser. The Fund’s expenses incurred for services provided by authorized agents were included in “Transfer agent fees” in the Statement of Operations. The table below shows the portion of the total fees and expenses to the Fund’s transfer agent and the fees to authorized agents incurred by each class of the Fund during the year ended September 30, 2011 (in thousands). |
| | | | | | | | | | | | |
| | | Year Ended 9/30/11 | |
| | | Fees and Expenses
to Transfer Agent | | | Fees to
Authorized
Agents | | | Total | |
Institutional Shares | | $ | 20 | | | $ | - | | | $ | 20 | |
Advisor Shares | | | 64 | | | | 898 | | | | 962 | |
16
NOTES TO FINANCIAL STATEMENTS
| (j) | Commission recapture – The Fund had the ability to direct portfolio trades to various brokers that have agreed to rebate a portion of the commissions generated. Such cash rebates totalled $6,000 and were made directly to the Fund and were included in net realized gain or loss on investments in the Statement of Operations for the year ended September 30, 2011. |
| (k) | Use of estimates – The preparation of financial statements in conformity with United States generally accepted accounting principles requires management to make estimates and assumptions that affect the reported amounts and disclosures in the financial statements. Actual results could differ from those estimates. |
| (l) | Indemnifications – In the normal course of business, the Fund has entered into contracts in which the Fund agrees to indemnify the other party or parties against various potential costs or liabilities. The Fund’s maximum exposure under these arrangements is unknown. No claim has been made for indemnification pursuant to any such agreement of the Fund. |
| (m) | Other – Dividend income less foreign taxes withheld, if any, was generally recorded on the ex-dividend date. In some cases, the information was not available to the Fund on the ex-dividend date. In such cases, which may have included private placements and foreign securities, dividends were recorded as soon after the ex-dividend date as reliable information became available to the Fund. Non-cash dividends included in dividend income, if any, were generally recorded at the fair market value of securities received. Interest income was reported on the accrual basis. Distributions to shareholders were recorded on the ex-dividend date. Expenses attributable to Artisan Funds were generally allocated to each Fund based on net assets. However, other expense allocation methodologies were used, depending on the nature of the expense item. Expenses attributable to a particular Fund or class were allocated directly to that Fund or class. |
The character of income and net realized gains and losses may differ in some instances for financial statement and tax purposes and may result in reclassification of permanent differences among certain capital accounts to more appropriately conform financial accounting to tax characterizations of dividend and capital gain distributions.
Emerging Markets Fund generally imposed a 2% redemption fee on shares held 90 days or less. Those redemption fees were recorded as a reduction in the cost of shares redeemed and had the primary effect of increasing paid-in capital. The Fund reserved the right to waive or reduce the 2% redemption fee on shares held 90 days or less at its discretion when the Fund believed such waiver was in the best interests of the Fund, including but not limited to, when it determined that imposition of the redemption fee was not necessary to protect the Fund from the effects of short-term trading. The Fund waived the fee on redemption of shares held by certain authorized agents or other Fund intermediaries and otherwise in accordance with the Fund’s prospectus.
| (n) | New accounting pronouncement – In May 2011, the FASB issued Accounting Standards Update (“ASU”) No. 2011-4, “Amendments to Achieve Common Fair Value Measurement and Disclosure Requirements” in GAAP and the International Financial Reporting Standards (“IFRS”). ASU No. 2011-4 amends FASB ASC Topic 820, Fair Value Measurements and Disclosures, to establish common requirements for |
17
NOTES TO FINANCIAL STATEMENTS
measuring fair value and disclosing information about fair value measurements in accordance with GAAP and IFRS. ASU No. 2011-4 is effective for fiscal years beginning after December 15, 2011 and for interim periods within those fiscal years. The Fund’s management is currently evaluating the impact these amendments may have on the Fund’s financial statements.
| (3) | Transactions with affiliates: |
The Adviser, with which the officers and a director of Artisan Funds were affiliated, provided investment advisory and administrative services to the Fund. In exchange for those services, Emerging Markets Fund paid a monthly management fee to the Adviser at the annual rate of 1.05% of the Fund’s average daily net assets.
The officers and director of Artisan Funds who are affiliated with the Adviser receive no compensation from Artisan Funds.
Prior to April 1, 2011, each director who was not an affiliated person of the Adviser received an annual retainer of $180,000, payable quarterly, as well as reimbursement of expenses related to his duties as a director of Artisan Funds. The amount of the annual retainer increased by $10,000 with each new series of Artisan Funds. In addition, the non-interested chair of the board of directors received an annual retainer of $60,000, payable quarterly, and each chair of a board committee who was a non-interested director received an annual retainer of $30,000, payable quarterly. Effective April 1, 2011, each director who was not an affiliated person of the Adviser receives an annual retainer of $200,000, payable quarterly, which will increase by $10,000 with each new series of Artisan Funds. The additional annual retainer fees for the non-interested chair of the board of directors and each non-interested chair of a board committee were not changed from the prior period. These fees were generally allocated to each of the Funds based on net assets, subject to a minimum allocation of $1,500 to each Fund per quarter.
Artisan Funds has adopted a deferred compensation plan for directors who are not affiliated persons of the Adviser that enables directors to elect to defer receipt of all or a portion of the annual compensation they are entitled to receive from Artisan Funds. For purposes of determining the amount owed to the directors under the plan, deferred amounts were invested in shares of Artisan Funds as selected by the individual directors. The Fund purchased shares of Artisan Funds selected for deferral by the director in amounts equal to his investment, resulting in a Fund asset equal to the deferred compensation liability. As of September 30, 2011, no current directors have elected to participate in the deferred compensation plan.
Shares of Artisan Funds were offered for sale by Artisan Partners Distributors LLC (“Distributors”). Distributors is wholly owned by Artisan Holdings. All distribution expenses relating to the Fund were paid by the Adviser.
| (4) | Line of credit arrangement: |
Artisan Funds is party to a line of credit agreement with State Street Bank and Trust Company (“SSB”), which expires in August 2012, under which each Fund may borrow up to $75 million, provided that such borrowing does not exceed the least of (a) 33 1/3% of its adjusted net assets, with adjusted net assets being total assets less total liabilities (excluding indebtedness for borrowed money) after giving effect to the loan, (b) the maximum amount
18
NOTES TO FINANCIAL STATEMENTS
the Fund may borrow under applicable law, (c) the limitations included in the Funds’ prospectus, or (d) any limitations on borrowings in any agreement with any governmental authority or regulator; provided that the aggregate borrowings by all Artisan Funds may not exceed $100 million. For the period October 1, 2010 to August 15, 2011, Artisan Funds paid a commitment fee at the annual rate of 0.125% on the unused portion of the line of credit and interest was charged on any borrowings at the current Federal Funds rate plus 1.25%. For the period October 1, 2010 to August 15, 2011, SSB agreed to waive 0.025% of the commitment fee by reducing the Funds’ custody expenses. Effective August 16, 2011, Artisan Funds paid a commitment fee at the annual rate of 0.10% on the unused portion of the line of credit and interest was charged on any borrowings at the current Federal Funds rate plus 1.25%. The commitment fee and the related waiver are allocated to each Fund based on net assets. The use of the line of credit was generally restricted to temporary borrowing for extraordinary or emergency purposes. During the year ended September 30, 2011, there were no borrowings under the line of credit for the Fund.
| (5) | Investment transactions: |
The cost of securities purchased and the proceeds from the sale of securities (excluding short-term securities) for the year ended September 30, 2011 were $640,060,000 and $233,805,000, respectively.
| (6) | Information for Federal income tax purposes: |
For Federal income tax purposes, the cost of investments, gross unrealized appreciation, gross unrealized depreciation and net unrealized depreciation on investments as of September 30, 2011 were as follows (in thousands):
| | | | | | | | | | | | |
Cost of
Investments | | Gross Unrealized
Appreciation | | | Gross
Unrealized
Depreciation | | | Net
Unrealized
Depreciation
on Investments | |
| $863,270 | | $ | 19,069 | | | $ | (218,637 | ) | | $ | (199,568 | ) |
The difference between cost of investments for financial reporting and cost of investments for Federal income tax purposes was due primarily to timing differences in recognizing certain gains and losses on security transactions (e.g., wash sale loss deferrals and passive foreign investment company transactions).
The tax characterization of ordinary income dividends and long-term capital gain distributions paid during the years ending September 30, 2011 and September 30, 2010 were as follows (in thousands):
| | | | | | |
| Year Ended 9/30/11 | | Year Ended 9/30/10 |
Ordinary
Income
Dividends | | Long-Term
Capital Gain
Distributions | | Ordinary
Income
Dividends | | Long-Term
Capital Gain
Distributions |
| $5,180 | | $ - | | $1,497 | | $ - |
| | |
Ordinary income dividends and long-term capital gain distributions were determined in accordance with income tax regulations that impose treatment that is different from the
19
NOTES TO FINANCIAL STATEMENTS
treatment that would result from the application of U.S. generally accepted accounting principles. These differences were due to differing treatments for such items as net short- term gains, passive foreign investment company transactions and foreign currency transactions.
Additional tax information as of and for the year ended September 30, 2011 follows (in thousands):
| | | | | | |
Undistributed Ordinary Income | | Undistributed
Long-Term Gain | | Post-October
Losses | | Other Deferred
Gains (Losses)(1) |
| $5,629 | | $1,871 | | $ - | | $(3,671) |
| (1) | Other deferred gains and losses relate to (a) gains or losses on transactions that occurred subsequent to year end that affected the distributable earnings at September 30, 2011 such as wash sales, (b) unrealized gains and losses on open foreign currency contracts and (c) other items. |
For the year ending September 30, 2011, the Fund used $10,901,000 of capital loss carryovers.
20
NOTES TO FINANCIAL STATEMENTS
| (7) | Fund share activities: |
Capital share transactions for the Fund were as follows (dollar values in thousands):
| | | | | | | | |
| | | EMERGING MARKETS | |
Year ended September 30, 2011 | | Institutional
Shares | | | Advisor
Shares | |
Proceeds from shares issued | | $ | 208,436 | | | $ | 302,182 | |
Net asset value of shares issued in reinvestment of dividends and distributions | | | 3,270 | | | | 1,764 | |
Cost of shares redeemed(1) | | | (18,510 | ) | | | (104,406 | ) |
| | | | | | | | |
Net increase from fund share transactions | | $ | 193,196 | | | $ | 199,540 | |
| | | | | | | | |
| | |
Shares sold | | | 13,451,736 | | | | 19,672,672 | |
Shares issued in reinvestment of dividends and distributions | | | 208,694 | | | | 112,253 | |
Shares redeemed | | | (1,368,082 | ) | | | (7,374,302 | ) |
| | | | | | | | |
Net increase in capital shares | | | 12,292,348 | | | | 12,410,623 | |
| | | | | | | | |
| |
| | | EMERGING MARKETS | |
Year ended September 30, 2010 | | Institutional
Shares | | | Advisor
Shares | |
Proceeds from shares issued | | $ | 173,421 | | | $ | 177,493 | |
Net asset value of shares issued in reinvestment of dividends and distributions | | | 984 | | | | 500 | |
Cost of shares redeemed(1) | | | (23,531 | ) | | | (17,173 | ) |
| | | | | | | | |
Net increase from fund share transactions | | $ | 150,873 | | | $ | 160,819 | |
| | | | | | | | |
| | |
Shares sold | | | 12,304,761 | | | | 12,812,565 | |
Shares issued in reinvestment of dividends and distributions | | | 73,686 | | | | 37,352 | |
Shares redeemed | | | (1,700,418 | ) | | | (1,260,856 | ) |
| | | | | | | | |
Net increase in capital shares | | | 10,678,029 | | | | 11,589,061 | |
| | | | | | | | |
| (1) | Net of redemption fees of: |
| | | | | | | | |
| | | 9/30/2011 | | | 9/30/2010 | |
Emerging Markets - Institutional Shares | | $ | 29 | | | $ | 2 | |
Emerging Markets - Advisor Shares | | $ | 26 | | | $ | 2 | |
The Fund evaluated subsequent events through the issuance of the Fund’s financial statements and has determined there is no impact to the Fund’s financial statements.
21
Report of Independent Registered Public Accounting Firm
The Board of Directors and Shareholders of Artisan Partners Funds, Inc.
We have audited the accompanying statement of assets and liabilities, including the schedule of investments, of Artisan Emerging Markets Fund (one of the twelve portfolios constituting Artisan Partners Funds, Inc. (formerly Artisan Funds, Inc.)) (the “Fund”) as of September 30, 2011, and the related statement of operations for the year then ended, the statements of changes in net assets for each of the two years in the period then ended, and the financial highlights for each of the periods indicated therein. These financial statements and financial highlights are the responsibility of the Fund’s management. Our responsibility is to express an opinion on these financial statements and financial highlights based on our audits.
We conducted our audits in accordance with the standards of the Public Company Accounting Oversight Board (United States). Those standards require that we plan and perform the audit to obtain reasonable assurance about whether the financial statements and financial highlights are free of material misstatement. We were not engaged to perform an audit of the Fund’s internal control over financial reporting. Our audits included consideration of internal control over financial reporting as a basis for designing audit procedures that are appropriate in the circumstances, but not for the purpose of expressing an opinion on the effectiveness of the Fund’s internal control over financial reporting. Accordingly, we express no such opinion. An audit also includes examining, on a test basis, evidence supporting the amounts and disclosures in the financial statements and financial highlights, assessing the accounting principles used and significant estimates made by management, and evaluating the overall financial statement presentation. Our procedures included confirmation of securities owned as of September 30, 2011, by correspondence with the custodian. We believe that our audits provide a reasonable basis for our opinion.
In our opinion, the financial statements and financial highlights referred to above present fairly, in all material respects, the financial position of Artisan Emerging Markets Fund of Artisan Partners Funds, Inc. at September 30, 2011, the results of its operations for the year then ended, the changes in its net assets for each of the two years in the period then ended, and the financial highlights for each of the periods indicated therein, in conformity with U.S. generally accepted accounting principles.

Chicago, Illinois
November 21, 2011
22
NOTES TO FINANCIAL STATEMENTS
Other Federal tax information (unaudited):
The Internal Revenue Code requires that shareholders be notified within 60 days of the Fund’s fiscal year-end of certain information regarding long-term capital gains, qualified dividend income and the dividends received deduction for corporate shareholders. This data is informational only. Every year in January, shareholders are sent a Form 1099-DIV which provides the federal tax status of dividends and distributions received during the calendar year. Shareholders are advised to consult their own tax advisor with respect to the specific tax consequences of investment in the Fund.
The Fund hereby designates the following amounts as (i) long-term capital gain distributions for purposes of the dividends paid deduction (including earnings and profits distributed to shareholders on redemption of Fund shares, in thousands), (ii) the amount of ordinary dividends paid during the fiscal year ended September 30, 2011 that are considered qualified dividend income as defined in the Jobs and Growth Tax Relief Reconciliation Act of 2003, and (iii) the amount of ordinary dividends paid during the fiscal year ended September 30, 2011 that are eligible for the dividends received deduction available to certain corporate shareholders.
| | | | | | | | |
| Long-Term Capital Gains | | Qualified Dividend Income | | | Dividends Received Deduction | |
| $297 | | | 83.00 | % | | | - | % |
23
SHAREHOLDER EXPENSE EXAMPLE (UNAUDITED)
As a shareholder of Artisan Funds, you may incur transaction costs, including redemption fees, and you will incur ongoing costs, including management fees and other Fund expenses. This example is intended to help you understand your ongoing costs (in dollars) of investing in a Fund and to compare these costs with the ongoing costs of investing in other mutual funds.
The example is based on an investment of $1,000 invested at the beginning of the period and held for the entire period from April 1, 2011 to September 30, 2011.
Actual Expenses
The first line below the Fund’s name in the table below provides information about actual account values and actual expenses. You may use the information in this line, together with the amount you invested, to estimate the expenses that you paid over the period. Simply divide your account value by $1,000 (for example, an $8,600 account value divided by $1,000 = 8.6), then multiply the result by the number in the first line under the name of the Fund under the heading entitled “Expenses Paid During Period” to estimate the expenses you paid on your account during this period.
Hypothetical Example for Comparison Purposes
The second line below the Fund’s name in the table below provides information about hypothetical account values and hypothetical expenses based on the Fund’s actual expense ratio for the six months ended September 30, 2011 and an assumed rate of return of 5% per year before expenses, which is not the Fund’s actual return. The hypothetical account values and expenses may not be used to estimate the actual ending account balances or expenses you paid for the period. You may use this information to compare the ongoing costs of investing in the Fund and other funds. To do so, compare the 5% hypothetical example with the 5% hypothetical examples that appear in the shareholder reports of the other funds.
Please note that the expenses shown in the table are meant to highlight your ongoing costs only and do not reflect any transactional costs, such as redemption fees. Therefore, the second line of the table is useful in comparing ongoing costs only, and will not help you determine the relative costs of owning different funds. If these transactional costs were included, your costs would have been higher.
| | | | | | | | | | | | |
| | | Beginning
Account Value
4/1/2011 | | | Ending
Account Value
9/30/2011 | | | Expenses Paid During
Period
4/1/2011-9/30/2011(1) | |
Artisan Emerging Markets Fund - Advisor Shares | | | | | | | | | | | | |
Actual | | $ | 1,000.00 | | | $ | 712.60 | | | $ | 6.31 | |
Hypothetical (5% return before expenses) | | $ | 1,000.00 | | | $ | 1,017.55 | | | $ | 7.44 | |
| (1) | Expenses are equal to the Fund’s ratio of expenses to average net assets for the six-month period ended September 30, 2011 (shown below), multiplied by the average account value over the period, multiplied by 183/365 (to reflect the one-half year period). |
| | | | |
| Fund | | Annualized Ratio of Expenses to Average
Net Assets for the Six-Month
Period Ended September 30, 2011 | |
Artisan Emerging Markets Fund - Advisor Shares | | | 1.47 | % |
24
NOTES ON MANAGEMENT’S DISCUSSION OF FUND PERFORMANCE AND PORTFOLIO HOLDINGS’ CLASSIFICATION
The discussion of the Fund included in this report includes statistical information about the portfolio of the Fund. Except as otherwise noted, that information is as of September 30, 2011. That information will vary with changes in the Fund’s portfolio investments. The performance information for the Fund relative to its benchmark index discussed in this report was prepared by the Adviser using information reported by FactSet Research Systems, Inc. (“FactSet”). For the purposes of assigning portfolio securities to a particular country, the Adviser considers an issuer to be from a particular country as designated by its securities information vendors. The Adviser currently uses MSCI Inc. as its primary source and FactSet as a secondary source for this information. In the event (i) the Adviser’s securities information vendors do not assign a security to a particular country or if the published classification appears to be clearly erroneous, or (ii) its primary vendor does not assign a security to a particular country and the secondary vendor has assigned a security to a particular country by using a methodology that is not the same as the methodology the primary vendor uses to assign a country, the Adviser assigns the security to a country using the primary vendor’s published criteria (to the extent available) or the Adviser’s own judgment. The primary information vendor’s criteria currently include the identity of the jurisdiction of the issuer’s incorporation, the main equity trading market for the issuer’s securities, the geographical distribution of the issuer’s operations and the location of the issuer’s headquarters. Country designations may change over time.
For the purposes of assigning portfolio securities to a particular sector and industry, the Adviser assigns securities in accordance with the sector and industry classifications of the Global Industry Classification Standard (GICS®) developed by MSCI Inc. and Standard & Poor’s. In the event the Adviser’s securities information vendors do not classify a security to a particular sector or industry, or if the published classification appears to be clearly erroneous, the Adviser classifies the security according to its own judgment, using other securities information vendors, the company description and other publicly available information about the company’s peer group. Sector and industry classifications may change over time.
The names of portfolio securities reflected in this report are as reported by the Fund’s data providers, may not represent the legal name of the entity and, in some cases, are translations of non-English names.
Description of Index
The Fund’s performance is compared in this report to changes in a broad-based index of changes in prices of securities in the market in which the Fund invests. This index is unmanaged and its returns include reinvested dividends. Unlike the Fund’s returns, the returns of the index do not include the payment of sales commissions or other expenses that would be incurred in the purchase or sale of the securities included in the index. An investment cannot be made directly in an index. Fair value pricing is not employed by market indices.
The index to which the Fund is compared is the Morgan Stanley Capital International Emerging Markets IndexSM, a market-weighted index of companies in emerging markets.
25
NOTES ON MANAGEMENT’S DISCUSSION OF FUND PERFORMANCE AND PORTFOLIO HOLDINGS’ CLASSIFICATION
Trademarks
Trademarks and copyrights relating to the indices and products of portfolio companies mentioned in this report, if any, are owned by their respective owners. Except as otherwise indicated, the trademarks, including names, logos, slogans and service marks appearing in this report are the property of the Adviser and may not be copied, reproduced, published or in any way used without written permission.
The Global Industry Classification Standard (“GICS”) was developed by and is the exclusive property and a service mark of MSCI Inc. (“MSCI”) and Standard & Poor’s, a division of The McGraw-Hill Companies, Inc. (“S&P”) and is licensed for use by Artisan Partners Limited Partnership. Neither MSCI, S&P nor any third party involved in making or compiling the GICS or any GICS classifications makes any express or implied warranties or representations with respect to such standard or classification (or the results to be obtained by the use thereof), and all such parties hereby expressly disclaim all warranties of originality, accuracy, completeness, merchantability and fitness for a particular purpose with respect to any of such standard or classification. Without limiting any of the foregoing, in no event shall MSCI, S&P, any of their affiliates or any third party involved in making or compiling the GICS or any GICS classifications have any liability for any direct, indirect, special, punitive, consequential or any other damages (including lost profits) even if notified of the possibility of such damages. (www.mscibarra.com)
The MSCI information may only be used by the reader, may not be reproduced or redisseminated in any form and may not be used as a basis for or a component of any financial instruments or products or any indices. None of the MSCI information is intended to constitute investment advice or a recommendation to make (or refrain from making) any kind of investment decision and may not be relied on as such. Historical data and analysis should not be taken as an indication or guarantee of any future performance analysis, forecast or prediction. The MSCI information is provided on an “as is” basis and the reader of this information assumes the entire risk of any use made of this information. MSCI, each of its affiliates and each other person involved in or related to compiling, computing or creating any MSCI information (collectively, the “MSCI Parties”) expressly disclaims all warranties (including, without limitation, any warranties of originality, accuracy, completeness, timeliness, non-infringement, merchantability and fitness for a particular purpose) with respect to this information. Without limiting any of the foregoing, in no event shall MSCI Parties have any liability for any direct, indirect, special, incidental, punitive, consequential (including, without limitation, lost profits) or any other damages.
PROXY VOTING POLICIES AND PROCEDURES
You may obtain a description of Artisan Funds’ proxy voting policies and procedures, without charge, upon request by calling 866.574.1770. That information also is included in Artisan Funds’ statement of additional information, which is available without charge, on the Fund’s website at www.artisanfunds.com and on the Securities and Exchange Commission’s website at www.sec.gov.
Information relating to how the Fund voted proxies relating to portfolio securities held during the twelve-month period ended June 30 is available without charge, on the Fund’s website at www.artisanfunds.com and on the Securities and Exchange Commission’s website at www.sec.gov.
26
INFORMATION ABOUT PORTFOLIO SECURITIES
Artisan Funds files a complete schedule of portfolio holdings with the Securities and Exchange Commission for the quarters ending December 31 and June 30 (the first and third quarters of the Funds’ fiscal year) on Form N-Q. The Fund’s Forms N-Q are available on the Securities and Exchange Commission’s website at www.sec.gov. You also may review and copy those documents by visiting the Securities and Exchange Commission’s Public Reference Room in Washington, D.C. Information on the operation of the Public Reference Room may be obtained by calling the Securities and Exchange Commission at 800.SEC.0330.
27
DIRECTORS AND OFFICERS
The board of directors has overall responsibility for the conduct of the affairs of Artisan Funds. Each director serves an indefinite term of unlimited duration until the next annual meeting of shareholders and until the election and qualification of his or her successor. The board of directors may fill any vacancy on the board provided that after such appointment at least two-thirds of the directors have been elected by the shareholders. The shareholders may remove a director by a vote of a majority of the outstanding shares of the Funds at any meeting of shareholders called for the purpose of removing such director.
The board of directors elects the officers of Artisan Funds. Each officer serves until the election and qualification of his or her successor, or until he or she sooner dies, resigns, or is removed or disqualified. The board of directors may remove any officer with or without cause at any time.
The names and ages of the directors and officers as of November 17, 2011, the position each holds with the Funds, the date each was first elected to office, their principal business occupations and other directorships they have held during at least the last five years are shown below. Each director oversees all twelve series of Artisan Funds.
| | | | | | | | |
| | | | | |
Name and Age at 11/17/11 | | Position(s)
Held with
Artisan Funds | | Date First Elected
or Appointed to Office | | Principal Occupation(s) during at least the
Past 5 Years | | Other Public Company or
Registered Investment
Company Directorships Held |
| Directors who are not “interested persons” of Artisan Funds: |
| David A. Erne – 68 | | Director and Independent Chair of the Board of Directors | | Director since 3/27/95; Independent Chair since 2/4/05 | | Of counsel to the law firm Reinhart Boerner Van Deuren s.c., Milwaukee, WI. | | Trustee, Northwestern Mutual Life Insurance Company (individual life insurance, disability insurance and annuity company). |
| Thomas R. Hefty – 64 | | Director | | 3/27/95 | | Retired; from January 2007 to February 2008, President, Kern Family Foundation (private, grant-making organization); until December 2006, of counsel to the law firm Reinhart Boerner Van Deuren s.c., Milwaukee, WI; until December 2006, Adjunct Professor, Department of Business and Economics, Ripon College; until December 2002, Chairman of the Board and Chief Executive Officer of Cobalt Corporation (provider of managed care and specialty business services). | | None. |
| Patrick S. Pittard – 65 | | Director | | 8/9/01 | | Chief Executive Officer of ACT Bridge, Inc. (enterprise talent management firm); Distinguished Executive in Residence (teaching position), University of Georgia; until October 2001, Chairman of the Board, President and Chief Executive Officer of Heidrick & Struggles International, Inc. (executive search firm). | | Director, Lincoln National Corporation (insurance and investment management company); former Director, Cbeyond, Inc. (telecommunications company, formerly Cbeyond Communications, Inc.). |
28
DIRECTORS AND OFFICERS
| | | | | | | | |
| | | | | |
Name and Age at 11/17/11 | | Position(s)
Held with
Artisan Funds | | Date First Elected
or Appointed to Office | | Principal Occupation(s) during at least the
Past 5 Years | | Other Public Company or
Registered Investment
Company Directorships Held |
| Howard B. Witt – 71 | | Director | | 3/27/95 | | Retired; until December 2004, Chairman of the Board, President and Chief Executive Officer of Littelfuse, Inc. (manufacturer of advanced circuit protection devices). | | Former Director, Franklin Electric Co., Inc. (manufacturer of electric motors). |
| Director who is an “interested person” of Artisan Funds: |
| Andrew A. Ziegler – 54* | | Director | | 1/5/95 | | Managing Director of Artisan Partners; until February 2010, President and Chief Executive Officer of Artisan Funds. | | None. |
| Officers: |
| Eric R. Colson – 41 | | President and Chief Executive Officer | | 2/9/10 | | Managing Director and Chief Executive Officer of Artisan Partners since January 2010; prior thereto, Managing Director and Chief Operating Officer – Investment Operations of Artisan Partners. | | None. |
| Brooke J. Billick – 57 | | Chief Compliance Officer | | 8/19/04 | | Chief Compliance Officer and Associate Counsel of Artisan Partners; Chief Compliance Officer of Artisan Partners Distributors LLC. | | None. |
| Gregory K. Ramirez – 41 | | Chief Financial Officer and Treasurer | | 2/8/11 | | Managing Director and since March 2010 Chief Accounting Officer of Artisan Partners; Assistant Treasurer of Artisan Partners Distributors LLC; until February 2011, Assistant Secretary and Assistant Treasurer of Artisan Funds. | | None. |
| Sarah A. Johnson – 39 | | General Counsel, Vice President and Secretary | | 2/8/11 | | Managing Director (since March 2010) and Associate Counsel of Artisan Partners; until February 2011, Assistant Secretary of Artisan Funds. | | None. |
| James S. Hamman, Jr. – 42 | | Vice President and Assistant Secretary | | 2/8/11 | | Associate Counsel of Artisan Partners since March 2010; from January 2008 until February 2010, Principal of Elite Investment Partners, LLC; prior thereto, Executive Vice President, General Counsel and Secretary of Calamos Asset Management, Inc. | | None. |
| * | Mr. Ziegler is an “interested person” of Artisan Funds, as defined in the Investment Company Act of 1940, because he is a Managing Director of Artisan Partners and an officer of Artisan Investments GP LLC (the general partner of Artisan Partners). Mr. Ziegler and Carlene M. Ziegler (who are married to each other) control Artisan Partners. |
29
DIRECTORS AND OFFICERS
The business address of the officers and director affiliated with Artisan Partners is 875 E. Wisconsin Avenue, Suite 800, Milwaukee, Wisconsin 53202. The addresses of the other directors are: Mr. Erne, Mr. Hefty, Mr. Pittard and Mr. Witt – c/o Artisan Funds, 875 E. Wisconsin Avenue, Suite 800, Milwaukee, Wisconsin 53202.
Artisan Funds’ statement of additional information (SAI) contains further information about the directors. Please call 866.574.1770 or visit our website at www.artisanfunds.com for a free copy of the SAI.
30
| | | | |

| | ARTISAN FUNDS P.O. BOX 8412 BOSTON, MA 02266-8412 866.574.1770 | | |
(a) Registrant has adopted a code of ethics (the “Code”) that applies to its principal executive officer, principal financial officer and principal accounting officer (the “Covered Officers”).
(b) No disclosures are required pursuant to this Item 2(b).
(c) During the period covered by the report, registrant did not make any substantive amendments to the Code.
(d) During the period covered by the report, registrant did not grant any waivers, including implicit waivers, from the provisions of the Code.
(e) Not applicable.
(f) A copy of the Code is filed as Exhibit (a)(1) to this Form N-CSR.
| Item 3. | Audit Committee Financial Expert. |
Registrant’s board of directors has determined that Thomas R. Hefty, member and chairman of the registrant’s audit committee, qualifies as an audit committee financial expert, as such term is defined in Instruction 2(b) to Item 3 of Form N-CSR. Mr. Hefty is “independent” as such term is defined in paragraph (a)(2) of Item 3 of Form N-CSR.
Under applicable securities laws, a person who is determined to be an audit committee financial expert will not be deemed an “expert” for any purpose, including, without limitation, for the purposes of Section 11 of the Securities Act of 1933, as a result of being designated or identified as an audit committee financial expert. The designation or identification of a person as an audit committee financial expert does not impose on such person any duties, obligations, or liabilities that are greater than the duties, obligations, and liabilities imposed on such person as a member of the audit committee and board of directors in the absence of such designation or identification.
Item 4. Principal Accountant Fees and Services.
Aggregate fees billed to the registrant for professional services rendered by the registrant’s principal accountant, Ernst & Young LLP, are summarized in the tables below. The tables summarize fees billed (or to be billed) by the registrant’s principal accountant for work performed relating to each applicable period identified below.
Fees:
| | | | | | | | |
| | | Fiscal Year Ended
September 30, 2011 | | | Fiscal Year Ended
September 30, 2010 | |
Audit Fees (a) | | $ | 257,900 | | | $ | 238,000 | |
Audit-Related Fees (b) | | $ | 48,800 | | | $ | 45,700 | |
Tax Fees (c) | | $ | 212,450 | | | $ | 203,000 | |
All Other Fees (d) | | $ | — | | | | — | |
(a) “Audit Fees” include amounts for professional services rendered by the principal accountant for the audit of the registrant’s annual financial statements and services that are normally provided by the accountant in connection with statutory and regulatory filings or engagements, including for 2011, portions of which have not been billed at the time of this filing and fees billed for consents issued in conjunction with the registrant’s post-effective amendments to the Funds’ registration statements filed for each of the last two fiscal years. The fees billed during the fiscal year ended September 30, 2011 also include consents issued in conjunction with the registrant’s post-effective amendments to the Funds’ registration statements filed in connection with the initial offering of institutional shares of Artisan Growth Opportunities Fund and Artisan Value Fund.
(b) “Audit-Related Fees” include amounts for assurance and related services by the principal accountant that are reasonably related to the performance of the audit of the registrant’s financial statements. Audit-related fees have not been reported under the item “audit fees” in the chart above.
The fees billed by Ernst & Young LLP during the fiscal years ended September 30, 2011 and September 30, 2010 include fees incurred for services for review procedures performed in conjunction with the semiannual reports to shareholders as of March 31, 2011 and March 31, 2010.
(c) “Tax Fees” include amounts for professional services rendered by the principal accountant for tax compliance, tax advice and tax planning.
The fees shown in the table above for the fiscal year ended September 30, 2011 include fees for (1) the review and preparation of the Funds’ income tax returns for the fiscal year ended September 30, 2011, which have not been billed as of the time of this filing; (2) the review of excise tax calculations and preparation of excise tax returns for the calendar year ended December 31, 2011, which also have not yet been billed as of the time of this filing; (3) the use of a PFIC database supplied by Ernst & Young LLP for the fiscal year ended September 30, 2010 and the excise year ended December 31, 2010, and the semiannual period ended March 31, 2011; and (4) the use of a Qualified Foreign Corporation (QFC) Database supplied by Ernst & Young LLP for the calendar year ended December 31, 2010.
The fees shown in the table above for the fiscal year ended September 30, 2010 include fees for (1) the review and preparation of the Funds’ income tax returns for the fiscal year ended September 30, 2010; (2) the review of excise tax calculations and preparation of excise tax returns for the calendar year ended December 31, 2010; (3) the use of a PFIC database supplied by Ernst & Young LLP for the fiscal year ended September 30, 2009 and the excise year ended December 31, 2009, and the semiannual period ended March 31, 2010; and (4) the use of a Qualified Foreign Corporation (QFC) Database supplied by Ernst & Young LLP for the calendar year ended December 31, 2009.
(d) None.
(e)(1) During its regularly scheduled periodic meetings, the registrant’s audit committee considers any requests to pre-approve any audit, audit-related, tax and other services to be provided by the principal accountants of the registrant. The audit committee has authorized its chairman to exercise that authority in the intervals between meetings; and the chairman presents any such pre-approvals to the audit committee at its next regularly scheduled meeting. Under paragraph (c)(7)(i)(C) of Rule 2-01 of Regulation S-X, pre-approval of non-audit services may be waived provided that: 1) the aggregate fees for all such services provided constitutes no more than five percent of the total amount of fees paid by the registrant to its principal accountant during the fiscal year in which services are provided, 2) such services were not recognized by the registrant at the time of engagement as non-audit services and 3) such services are promptly brought to the attention of the audit committee of the registrant and approved prior to the completion of the audit.
(e)(2) No services included in Items 4(b) – (d) above were approved pursuant to paragraph (c)(7)(i)(C) of Rule 2-01 of Regulation S-X.
(f) Less than 50 percent of the hours expended on the principal accountant’s engagement to audit the registrant’s financial statements for the most recent fiscal year were attributed to work performed by persons other than the principal accountant’s full-time, permanent employees.
(g) The aggregate fees for the fiscal years ended September 30, 2011 and September 30, 2010 by the registrant’s principal accountant for non-audit services rendered to the registrant are shown in the tables above and described under Items 4(b) – (d) above. For the registrant’s fiscal years ended September 30, 2011 and September 30, 2010, Ernst & Young LLP served as the registrant’s principal accountant and provided no services and billed no fees for non-audit services rendered to the registrant’s adviser or entities controlling, controlled by or under common control with the adviser.
(h) The audit committee of the registrant’s board of directors has considered whether the provision of non-audit services that were rendered to the registrant’s investment adviser, and any entity controlling, controlled by or under common control with the investment adviser that provides ongoing services to the registrant that were not pre-approved pursuant to paragraph (c)(7)(ii) of Rule 2-01 of Regulation S-X is compatible with maintaining the principal accountant’s independence. The provisions of Rule 2-01(c)(7) were effective on May 6, 2003. No such services were rendered on or after May 6, 2003.
| Item 5. | Audit Committee of Listed Registrants. |
Not applicable.
| Item 6. | Schedule of Investments. |
The Schedules of Investments in securities of unaffiliated issuers as of September 30, 2011 are included as part of the annual reports to shareholders filed under Item 1 of this Form N-CSR.
| Item 7. | Disclosure of Proxy Voting Policies and Procedures for Closed-End Management Investment Companies. |
Not applicable.
| Item 8. | Portfolio Managers of Closed-End Management Investment Companies. |
Not applicable.
| Item 9. | Purchases of Equity Securities by Closed-End Management Investment Company and Affiliated Purchasers. |
Not applicable.
| Item 10. | Submission of Matters to a Vote of Security Holders. |
No material changes to report.
| Item 11. | Controls and Procedures. |
(a) The registrant’s principal executive and principal financial officers have concluded, based on an evaluation of the registrant’s disclosure controls and procedures (as defined in Rule 30a-3(c) under the Investment Company Act of 1940, the “Disclosure Controls”) as of a date within 90 days prior to the filing date (the “Filing Date”) of this Form N-CSR (the “Report”), that the Disclosure Controls are effectively designed to provide reasonable assurance that the information required to be disclosed by the registrant in the Report is recorded, processed, summarized and reported by the Filing Date, including ensuring that information required to be disclosed in the Report is accumulated and communicated to the registrant’s management, including the registrant’s principal executive officer and principal financial officer, as appropriate to allow timely decisions regarding required disclosure.
(b) There were no changes in the registrant’s internal controls over financial reporting (as defined in Rule 30a-3(d) under the Investment Company Act of 1940) that occurred during the second fiscal quarter of the period covered by this report that have materially affected, or are reasonably likely to materially affect, the registrant’s internal control over financial reporting.
| | | | |
| (a) | | (1) | | Code of Ethics for Principal Executive Officer, Principal Financial Officer and Principal Accounting Officer (as referenced in Item 2 above), attached hereto as Exhibit (a)(1) |
| | |
| | (2) | | Certifications of Eric R. Colson, Principal Executive Officer and Gregory K. Ramirez, Principal Financial Officer pursuant to Rule 30a-2(a) under the Investment Company Act of 1940 (17 CFR 270.30a-2(a)), attached hereto as Exhibits (a)(2)(i) and (a)(2)(ii) |
| | |
| (b) | | | | Certification of Eric R. Colson, Principal Executive Officer and Gregory K. Ramirez, Principal Financial Officer pursuant to Section 906 of the Sarbanes-Oxley Act of 2002, attached hereto as Exhibit (b) |
SIGNATURES
Pursuant to the requirements of the Securities Exchange Act of 1934 and the Investment Company Act of 1940, the registrant has duly caused this report to be signed on its behalf by the undersigned, thereunto duly authorized.
Artisan Partners Funds, Inc.
| | |
By: | | /S/ ERIC R. COLSON |
| | Eric R. Colson |
| | Principal Executive Officer |
| |
Date: | | December 2, 2011 |
Pursuant to the requirements of the Securities Exchange Act of 1934 and the Investment Company Act of 1940, this report has been signed below by the following persons on behalf of the registrant and in the capacities and on the dates indicated.
| | |
By: | | /S/ ERIC R. COLSON |
| | Eric R. Colson |
| | Principal Executive Officer |
| |
Date: | | December 2, 2011 |
| | |
By: | | /S/ GREGORY K. RAMIREZ |
| | Gregory K. Ramirez |
| | Principal Financial Officer |
| |
Date: | | December 2, 2011 |