UNITED STATES
SECURITIES AND EXCHANGE COMMISSION
Washington, D.C. 20549
FORM N-CSR
CERTIFIED SHAREHOLDER REPORT OF REGISTERED
MANAGEMENT INVESTMENT COMPANIES
Investment Company Act file number 811-08932
Artisan Partners Funds, Inc.
(Exact name of registrant as specified in charter)
875 East Wisconsin Avenue, Suite 800
Milwaukee, WI 53202
(Address of principal executive offices) (Zip Code)
| | |
Sarah A. Johnson | | Rajib Chanda |
Artisan Partners Funds, Inc. | | Ropes & Gray LLP |
875 East Wisconsin Avenue, Suite 800 | | One Metro Center |
Milwaukee, Wisconsin 53202 | | 700 12th Street, N.W., Suite 900 |
| | Washington, D.C. 20005-3948 |
(Name and address of agents for service)
Registrant’s telephone number, including area code: (414) 390-6100
Date of fiscal year end: 9/30/13
Date of reporting period: 9/30/13
Form N-CSR is to be used by management investment companies to file reports with the Commission not later than 10 days after the transmission to stockholders of any report that is required to be transmitted to stockholders under Rule 30e-1 under the Investment Company Act of 1940 (17 CFR 270.30e-1). The Commission may use the information provided on Form N-CSR in its regulatory, disclosure review, inspection, and policymaking roles.
A registrant is required to disclose the information specified by Form N-CSR, and the Commission will make this information public. A registrant is not required to respond to the collection of information contained in Form N-CSR unless the Form displays a currently valid Office of Management and Budget (“OMB”) control number. Please direct comments concerning the accuracy of the information collection burden estimate and any suggestions for reducing the burden to Secretary, Securities and Exchange Commission, 100 F Street, NE, Washington, DC 20549. The OMB has reviewed this collection of information under the clearance requirements of 44 U.S.C. § 3507.
Item 1. Reports to Shareholders.
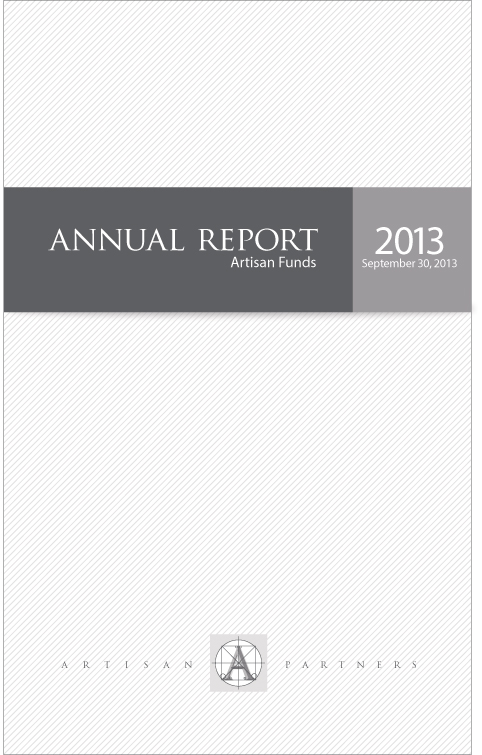
TABLE OF CONTENTS
ARTISAN FUNDS
P.O. BOX 8412
BOSTON, MA 02266-8412
This report and the audited financial statements contained herein are provided for the general information of the shareholders of Artisan Funds. Before investing, investors should consider carefully each Fund’s investment objective, risks and charges and expenses. For a prospectus, which contains that information and more information about each Fund, please call 800.344.1770 or visit our website at www.artisanfunds.com. Read it carefully before you invest or send money.
Company discussions are for illustration only and are not intended as recommendations of individual stocks. The discussions present information about the companies believed to be accurate, and the views of the portfolio managers, as of September 30, 2013. That information and those views may change, and the Funds disclaim any obligation to advise shareholders of any such changes.
Artisan Funds offered through Artisan Partners Distributors LLC, member FINRA.
ARTISAN EMERGING MARKETS FUND
INVESTMENT PROCESS HIGHLIGHTS
Artisan Emerging Markets Fund employs a fundamental research process to construct a diversified portfolio of emerging market companies. The team’s investment process focuses on identifying companies that are priced at a discount relative to the team’s estimate of their sustainable earnings.
Sustainable Earnings. The team believes that over the long term a stock’s price is directly related to the company’s ability to deliver sustainable earnings. The team determines a company’s sustainable earnings based upon financial and strategic analyses. The financial analysis of a company’s balance sheet, income statement, and statement of cash flows focuses on identifying historical drivers of return on equity. The strategic analysis examines a company’s competitive advantages and financial strength to assess sustainability.
Valuation. The team believes that investment opportunities develop when businesses with sustainable earnings are undervalued relative to peers and historical industry, country and regional valuations. The team values a business and develops a price target based on their assessment of the business’s sustainable earnings and cash flow expectations and the team’s risk analysis.
Risk Analysis. The team believes that a disciplined risk framework allows greater focus on fundamental stock selection. The team incorporates its assessment of company-specific and macroeconomic risks into its valuation analysis to develop a risk-adjusted target price. The risk-rating assessment includes a review of the currency, inflation, monetary and fiscal policy and political risks to which a company is exposed.
PERFORMANCE HISTORY
GROWTH OF AN ASSUMED $1,000,000 INVESTMENT (6/26/2006 to 9/30/2013)
AVERAGE ANNUAL TOTAL RETURNS (as of 9/30/2013)
| | | | | | | | | | | | | | | | |
| Fund / Index | | 1-Year | | | 3-Year | | | 5-Year | | | Since
Inception | |
Artisan Emerging Markets Fund – Institutional Shares (6/26/2006) | | | -1.91 | % | | | -5.71 | % | | | 3.25 | % | | | 4.45 | % |
Artisan Emerging Markets Fund – Advisor Shares (6/2/2008) | | | -2.25 | | | | -6.00 | | | | 3.02 | | | | -5.42 | |
MSCI Emerging Markets Index | | | 0.98 | | | | -0.33 | | | | 7.22 | | | | 7.38 | * |
| * | As of Institutional Shares inception date. |
The performance quoted represents past performance, which does not guarantee future results. The investment return and principal value of an investment in the Fund will fluctuate, so that an investor’s shares in the Fund, when redeemed, may be worth more or less than their original cost. Current performance may be lower or higher than the performance data quoted. For current to most recent month-end performance information call 800.399.1770. The graph and table above do not reflect the deduction of taxes that a shareholder would pay on distributions or sale of Fund shares. The performance shown does not reflect the deduction of a 2% redemption fee on shares held by an investor for 90 days or less and, if reflected, the fee would reduce the performance quoted. The Fund’s performance information reflects Artisan Partners Limited Partnership’s (the “Adviser” or “Artisan Partners”) contractual agreement to limit the Fund’s expenses to no more than 1.50%, which has been in effect since the Fund’s inception and has had a material impact on the Fund’s performance, which would have been lower in its absence. See page 130 for a description of the index.
INVESTING ENVIRONMENT
Emerging markets equities substantially underperformed their developed market counterparts over the one-year period ended September 30, 2013. While developed market equities raced ahead in tandem with further accommodative policies from central banks and a gradually improving macroeconomic backdrop, emerging markets equities remained roughly flat. Weak commodity prices and a stronger U.S. dollar contributed to the weakness in emerging market economies over the period as investors showed a preference for dollar-denominated assets.
SECTOR DIVERSIFICATION
| | | | | | | | |
| Sector | | 9/30/2012 | | | 9/30/2013 | |
Consumer Discretionary | | | 12.2 | % | | | 14.0 | % |
Consumer Staples | | | 3.6 | | | | 4.0 | |
Energy | | | 11.8 | | | | 10.1 | |
Financials | | | 21.1 | | | | 22.7 | |
Healthcare | | | 2.2 | | | | 3.5 | |
Industrials | | | 9.0 | | | | 8.6 | |
Information Technology | | | 18.1 | | | | 16.9 | |
Materials | | | 11.0 | | | | 9.5 | |
Telecommunication Services | | | 6.7 | | | | 5.0 | |
Utilities | | | 2.6 | | | | 2.8 | |
Other assets less liabilities | | | 1.7 | | | | 2.9 | |
| | | | 100.0 | % | | | 100.0 | % |
PERFORMANCE DISCUSSION
During the twelve-month period ended September 30, 2013, Artisan Emerging Markets Fund – Advisor Shares declined 2.25% and Artisan Emerging Markets Fund – Institutional Shares declined 1.91%, underperforming the MSCI Emerging Markets Index, which returned 0.98% over the same period.
Performance of the following stocks had a positive impact on the portfolio during the period: Chinese wealth management product distributor Noah Holdings Ltd.; South African media company Naspers Limited; United Arab Emirates budget airline company Air Arabia; Taiwanese integrated circuit manufacturer Taiwan Semiconductor Manufacturing Company Ltd.; and Mexican infrastructure company OHL Mexico SAB de CV.
Notable detractors included: Brazilian oil company Petroleo Brasilerio S.A.; South African gold miner Harmony Gold Mining Company Limited; South African financial services provider African Bank Investments Limited; Mexican wireless communications provider America Movil SAB de C.V.; and Indonesian automobile manufacturer PT Astra International Tbk.
REGION ALLOCATION
| | | | | | | | |
| Region | | 9/30/2012 | | | 9/30/2013 | |
Emerging Asia | | | 51.3 | % | | | 53.6 | % |
Latin America | | | 24.0 | | | | 22.1 | |
Europe, Middle East & Africa | | | 19.7 | | | | 16.3 | |
Developed Markets | | | 3.3 | | | | 5.1 | |
FUND CHANGES
We identified several new investment opportunities for the portfolio during the period, including Korean auto manufacturer Kia Motors Corporation; Chinese oil company China Petroleum and Chemical Corporation (Sinopec); Chinese power generation company China Resources Power Holdings Company Limited; Indian petrochemical manufacturer Reliance Industries Ltd.; and United Arab Emirates healthcare services company Al Noor Hospitals Group Plc. We funded these purchases in part by selling our positions in CNOOC Limited, Infosys Limited, Hyundai Mobis, MOL Hungarian Oil and Gas PLC and African Bank Investments Limited.
ARTISAN GLOBAL EQUITY FUND
INVESTMENT PROCESS HIGHLIGHTS
Artisan Global Equity Fund employs a fundamental stock selection process focused on identifying long-term growth opportunities to build a global (i.e., U.S. and non-U.S.) portfolio of companies of all market capitalizations. The investment team seeks to invest in companies within its preferred themes with sustainable growth characteristics at attractive valuations that do not fully reflect their long-term potential.
Themes. The team identifies long-term secular (as opposed to cyclical) growth trends with the objective of investing in companies that have meaningful exposure to these trends. The team’s fundamental analysis focuses on those industry leaders with attractive growth and valuation characteristics that will be long-term beneficiaries of any structural change and/or trend.
Sustainable Growth. The team applies a fundamental approach to identifying the long-term, sustainable growth characteristics of potential investments. The team seeks high-quality companies that typically have a sustainable competitive advantage, a superior business model and a high-quality management team.
Valuation. The team uses multiple valuation metrics to establish a target price range. The team assesses the relationship between its estimate of a company’s sustainable growth prospects and its current valuation.
PERFORMANCE HISTORY
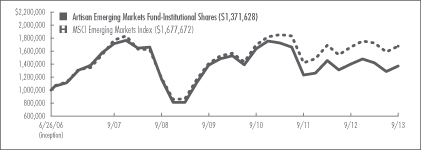
GROWTH OF AN ASSUMED $10,000 INVESTMENT (3/29/2010 to 9/30/2013)
AVERAGE ANNUAL TOTAL RETURNS (as of 9/30/2013)
| | | | | | | | | | | | |
| Fund / Index | | 1-Year | | | 3-Year | | | Since
Inception | |
Artisan Global Equity Fund – Investor Shares (3/29/2010) | | | 25.51 | % | | | 18.28 | % | | | 16.19 | % |
MSCI ACWI Index | | | 17.73 | | | | 10.21 | | | | 8.85 | |
The performance quoted represents past performance, which does not guarantee future results. The investment return and principal value of an investment in the Fund will fluctuate, so that an investor’s shares in the Fund, when redeemed, may be worth more or less than their original cost. Current performance may be lower or higher than the performance data quoted. The Fund’s investments in initial public offerings (IPOs) made a material contribution to the Fund’s performance. IPO investments are not an integral component of the Fund’s investment process and may not be available in the future. For current to most recent month-end performance information, visit www.artisanfunds.com or call 800.344.1770. The graph and table above do not reflect the deduction of taxes that a shareholder would pay on distributions or sale of Fund shares. The performance shown does not reflect the deduction of a 2% redemption fee on shares held by an investor for 90 days or less and, if reflected, the fee would reduce the performance quoted. The Fund’s performance information reflects Artisan Partners’ contractual agreement to limit the Fund’s expenses to no more than 1.50%, which has been in effect since the Fund’s inception and has had a material impact on the Fund’s performance, which would have been lower in its absence. See page 130 for a description of the index.
INVESTING ENVIRONMENT
Global equity markets posted strong gains over the one-year period ended September 30, 2013, as central banks around the globe poured liquidity into the global financial system. Throughout the year, politicians and banks worked to ease the burden, if only temporarily, of the fiscal problems facing Western economies. Yet, long-term fiscally sustainable solutions to the problems facing global equity markets remain outstanding.
SECTOR DIVERSIFICATION
| | | | | | | | |
| Sector | | 9/30/2012 | | | 9/30/2013 | |
Consumer Discretionary | | | 13.1 | % | | | 29.3 | % |
Consumer Staples | | | 25.8 | | | | 16.6 | |
Energy | | | 5.0 | | | | 1.3 | |
Financials | | | 11.9 | | | | 10.6 | |
Healthcare | | | 6.4 | | | | 13.1 | |
Industrials | | | 12.0 | | | | 9.9 | |
Information Technology | | | 15.1 | | | | 8.1 | |
Materials | | | 6.8 | | | | 5.8 | |
Telecommunication Services | | | 1.2 | | | | — | |
Utilities | | | — | | | | 3.0 | |
Other assets less liabilities | | | 2.7 | | | | 2.3 | |
| | | | 100.0 | % | | | 100.0 | % |
PERFORMANCE DISCUSSION
During the twelve-month period ended September 30, 2013, Artisan Global Equity Fund – Investor Shares returned 25.51%, outperforming the MSCI ACWI Index, which returned 17.73% over the same period.
Performance of the following stocks had a positive impact on the portfolio during the period: Chinese Internet data center company 21Vianet Group, Inc.; U.S. nutrition retailer GNC Holdings, Inc.; New Zealand-based online accounting provider Xero Limited; U.S. interior aircraft manufacturer B/E Aerospace, Inc.; and Irish dairy company Glanbia plc.
Notable detractors included: Filipino wine product producer LT Group Inc; Indonesian media holding company PT Global Mediacom Tbk; U.S. technology designer and manufacturer Apple Inc.; Chinese energy business China Oil and Gas Group Ltd.; and Indonesian subscription-based broadcaster PT MNC Sky Vision Tbk.
REGION ALLOCATION
| | | | | | | | |
| Region | | 9/30/2012 | | | 9/30/2013 | |
Americas | | | 40.0 | % | | | 42.7 | % |
Europe | | | 37.1 | | | | 25.4 | |
Emerging Markets | | | 6.3 | | | | 23.2 | |
Pacific Basin | | | 13.9 | | | | 6.4 | |
FUND CHANGES
We identified several new investment opportunities for the portfolio during the period, including U.S. biopharmaceutical company Gilead Sciences, Inc.; U.S. luxury retailer Michael Kors Holdings Limited; U.S. oncology company ARIAD Pharmaceuticals, Inc.; U.S. discount retailer The TJX Companies, Inc.; and Filipino wine product producer LT Group Inc. We funded these purchases in part by selling our positions in CALBEE, Inc., Japan Tobacco, Inc., Apple Inc., Pernod Ricard SA and Housing Development Finance Corporation Ltd.
ARTISAN GLOBAL OPPORTUNITIES FUND
INVESTMENT PROCESS HIGHLIGHTS
Artisan Global Opportunities Fund employs a fundamental investment process to construct a diversified portfolio of U.S. and non-U.S. growth companies across a broad capitalization range. The Fund’s investment process focuses on two distinct areas – security selection and capital allocation.
The Fund’s investment team attempts to identify companies that possess franchise characteristics that are selling at attractive valuations and benefiting from an accelerating profit cycle.
Franchise Characteristics. These are characteristics that the team believes help to protect a company’s stream of cash flow from the effects of competition. The team looks for companies with at least two of the following characteristics: low cost production capability, possession of a proprietary asset, dominant market share, or a defensible brand name.
Attractive Valuations. Through its own fundamental research, the team estimates the amount a private market buyer would pay to buy the entire company (the company’s “intrinsic value” or “private market value”) and considers whether to purchase a stock if it sells at a discount to that estimate.
Accelerating Profit Cycle. The team tries to invest in companies that are well positioned for long-term growth, at an early enough stage in their profit cycle to benefit from the increased cash flows produced by the emerging profit cycle.
Based on the investment team’s fundamental analysis of a company’s profit cycle, portfolio holdings develop through three stages. GardenSM investments are small positions in the early part of their profit cycle that will warrant a more sizeable allocation once their profit cycle accelerates. CropSM investments are positions that are being increased to a full weight because they are moving through the strongest part of their profit cycle. HarvestSM investments are positions that are being reduced as they near the team’s estimate of full valuation or their profit cycle begins to decelerate.
PERFORMANCE HISTORY
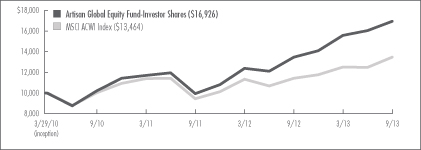
GROWTH OF AN ASSUMED $10,000 INVESTMENT (9/22/2008 to 9/30/2013)
AVERAGE ANNUAL TOTAL RETURNS (as of 9/30/2013)
| | | | | | | | | | | | | | | | |
| Fund / Index | | 1-Year | | | 3-Year | | | 5-Year | | | Since
Inception | |
Artisan Global Opportunities Fund – Investor Shares (9/22/2008) | | | 21.16 | % | | | 17.11 | % | | | 13.62 | % | | | 11.98 | % |
Artisan Global Opportunities Fund – Institutional Shares (7/26/2011) | | | 21.41 | | | | n/a | | | | n/a | | | | 13.18 | |
MSCI ACWI Index | | | 17.73 | | | | 10.21 | | | | 7.71 | | | | 6.23 | * |
| * | As of Investor Shares inception date. |
The performance quoted represents past performance, which does not guarantee future results. The investment return and principal value of an investment in the Fund will fluctuate, so that an investor’s shares in the Fund, when redeemed, may be worth more or less than their original cost. Current performance may be lower or higher than the performance data quoted. For current to most recent month-end performance information, visit www.artisanfunds.com or call 800.344.1770. The graph and table above do not reflect the deduction of taxes that a shareholder would pay on distributions or sale of Fund shares. The performance shown does not reflect the deduction of a 2% redemption fee on shares held by an investor for 90 days or less and, if reflected, the fee would reduce the performance quoted. The Fund’s performance information reflects Artisan Partners’ contractual agreement to limit the Fund’s expenses to no more than 1.50%, which has been in effect since the Fund’s inception and has had a material impact on the Fund’s performance, which would have been lower in its absence. See page 130 for a description of the index.
INVESTING ENVIRONMENT
In the one-year period ended September 30, 2013, global stocks, as represented by the MSCI ACWI Index, posted strong positive returns. Corporate profit growth continued, and economic data, though still tepid, improved and outpaced modest expectations. Conversely, markets were preoccupied with the timing of the cessation of the U.S. Federal Reserve Bank’s long-term bond buying program, as well as concerns over slowed economic growth in emerging markets.
SECTOR DIVERSIFICATION
| | | | | | | | |
| Sector | | 9/30/2012 | | | 9/30/2013 | |
Consumer Discretionary | | | 9.5 | % | | | 10.5 | % |
Consumer Staples | | | 2.0 | | | | 2.7 | |
Energy | | | 6.3 | | | | 4.5 | |
Financials | | | 8.6 | | | | 13.9 | |
Healthcare | | | 17.9 | | | | 19.7 | |
Industrials | | | 10.7 | | | | 12.4 | |
Information Technology | | | 33.6 | | | | 28.3 | |
Materials | | | 6.8 | | | | 3.5 | |
Utilities | | | — | | | | 0.4 | |
Other assets less liabilities | | | 4.6 | | | | 4.1 | |
| | | | 100.0 | % | | | 100.0 | % |
PERFORMANCE DISCUSSION
During the twelve-month period ended September 30, 2013, Artisan Global Opportunities Fund – Investor Shares returned 21.16% and Artisan Global Opportunities Fund – Institutional Shares returned 21.41%, outperforming the MSCI ACWI Index, which returned 17.73% over the same period.
Performance of the following stocks had a positive impact on the portfolio during the period: U.S. biopharmaceutical firm Regeneron Pharmaceuticals, Inc.; U.S. biopharmaceutical firm specializing in neurology, oncology and immunology Biogen Idec Inc.; Swedish provider of design, measurement and visualization technologies Hexagon AB; U.K. provider of intellectual property to the semiconductor market ARM Holdings plc; and U.S. biopharmaceutical firm specializing in HIV/AIDS, liver disease and cardiovascular and respiratory conditions Gilead Sciences, Inc.
Notable detractors included: U.S. technology designer and manufacturer Apple Inc.; U.S. provider of enterprise storage systems, software, network and services EMC Corporation; Brazilian shopping malls operator BR Malls Participacoes; Brazilian retail drugstore chain Raia Drogasil S.A.; and U.S. provider of equipment and components used in oil and gas drilling and production operations National Oilwell Varco, Inc.
REGION ALLOCATION
| | | | | | | | |
| Region | | 9/30/2012 | | | 9/30/2013 | |
Americas | | | 59.9 | % | | | 56.0 | % |
Europe | | | 16.9 | | | | 23.5 | |
Pacific Basin | | | 4.2 | | | | 8.3 | |
Emerging Markets | | | 14.4 | | | | 8.1 | |
FUND CHANGES
We identified several new investment opportunities for the portfolio during the period, including U.S. biopharmaceutical firm Gilead Sciences, Inc.; U.S. diversified financial services holding company Citigroup Inc.; U.S. supplier of semiconductor equipment Applied Materials, Inc.; U.S. independent oil and gas exploration and production company Anadarko Petroleum Corporation; and Japanese search engine and e-commerce site Yahoo Japan Corporation. We funded these purchases in part by selling our positions in Apple Inc., EMC Corporation, National Oilwell Varco, Inc., Occidental Petroleum Corporation and OdontoPrev SA.
ARTISAN GLOBAL SMALL CAP FUND
INVESTMENT PROCESS HIGHLIGHTS
Artisan Global Small Cap Fund employs a fundamental stock selection process focused on identifying long-term growth opportunities to build a global portfolio of small-cap growth companies. The investment team seeks to invest in companies within its preferred themes with sustainable growth characteristics at attractive valuations that do not fully reflect their long-term potential.
Themes. The team identifies long-term secular (as opposed to cyclical) growth trends with the objective of investing in companies that have meaningful exposure to these trends. The team’s fundamental analysis focuses on those industry leaders with attractive growth and valuation characteristics that will be long-term beneficiaries of any structural change and/or trend.
Sustainable Growth. The team applies a fundamental approach to identifying the long-term, sustainable growth characteristics of potential investments. The team seeks high-quality companies that typically have a sustainable competitive advantage, a superior business model and a high-quality management team.
Valuation. The team uses multiple valuation metrics to establish a target price range. The team assesses the relationship between its estimate of a company’s sustainable growth prospects and its current valuation.
PERFORMANCE HISTORY
TOTAL RETURNS (as of 9/30/2013)
| | | | |
| Fund / Index | | Since
Inception(1) | |
Artisan Global Small Cap Fund – Investor Shares (6/25/2013) | | | 6.10 | % |
MSCI ACWI Small Cap Index | | | 13.15 | |
| (1) | For the period from commencement of operations 6/25/2013 through 9/30/2013; not annualized. |
The performance quoted represents past performance, which does not guarantee future results. The investment return and principal value of an investment in the Fund will fluctuate, so that an investor’s shares in the Fund, when redeemed, may be worth more or less than their original cost. Current performance may be lower or higher than the performance data quoted. The Fund’s investments in initial public offerings (IPOs) made a material contribution to the Fund’s performance. IPO investments are not an integral component of the Fund’s investment process and may not be available in the future. For current to most recent month-end performance information, visit www.artisanfunds.com or call 800.344.1770. The table above does not reflect the deduction of taxes that a shareholder would pay on distributions or sale of Fund shares. The performance shown does not reflect the deduction of a 2% redemption fee on shares held by an investor for 90 days or less and, if reflected, the fee would reduce the performance quoted. The Fund’s performance information reflects Artisan Partners’ contractual agreement to limit the Fund’s expenses to no more than 1.50%, which has been in effect since the Fund’s inception and has had a material impact on the Fund’s performance, which would have been lower in its absence. See page 130 for a description of the index. The growth of $10,000 chart has been omitted due to the Fund’s short performance history.
INVESTING ENVIRONMENT
During the period from the Fund’s inception on June 25, 2013 through September 30, 2013, global equity markets posted strong gains as market sentiment took a positive tilt. Investors responded favorably to ongoing signs of economic recovery in Europe and China. The U.K. housing market was a particularly bright spot. Meanwhile, activity in the corporate mergers and acquisitions arena picked up, a positive sign for equity markets. Market sentiment was also boosted by the U.S. Federal Reserve Bank’s decision to maintain the pace of its asset purchases.
SECTOR DIVERSIFICATION
| | | | |
| Sector | | 9/30/2013 | |
Consumer Discretionary | | | 31.4 | % |
Consumer Staples | | | 18.3 | |
Energy | | | 2.4 | |
Financials | | | 2.6 | |
Healthcare | | | 12.7 | |
Industrials | | | 15.5 | |
Information Technology | | | 1.8 | |
Materials | | | 10.1 | |
Utilities | | | 3.4 | |
Other assets less liabilities | | | 1.8 | |
| | | | 100.0 | % |
PERFORMANCE DISCUSSION
During the period June 25, 2013 through September 30, 2013, Artisan Global Small Cap Fund – Investor Shares returned 6.10%, underperforming the MSCI ACWI Small Cap Index, which returned 13.15% over the same period.
Performance of the following stocks had a positive impact on the portfolio during the period: Japanese discount store operator Don Quijote Co., Ltd.; U.K. retailer N Brown Group plc; Netherlands-based supplier of temporary employees Brunel International NV; Chinese pediatric nutrition provider Biostime International Holdings Ltd.; and U.S. financial services company First Republic Bank.
Notable detractors included: Chinese energy company China Oil and Gas Group Ltd.; Canadian natural gas engine producer Westport Innovations Inc.; Hong Kong-based oil field services provider SPT Energy Group Inc.; Indonesian broadcasting company PT MNC Sky Vision Tbk; and Indonesian media company PT Global Mediacom Tbk.
REGION ALLOCATION
| | | | |
| Region | | 9/30/2013 | |
Europe | | | 31.7 | % |
Americas | | | 26.3 | |
Emerging Markets | | | 24.8 | |
Pacific Basin | | | 13.0 | |
Middle East | | | 2.4 | |
FUND CHANGES
We identified several new investment opportunities for the portfolio during the period, including Portuguese television, cable and broadcasting services provider ZON OPTIMUS, SGPS, S.A.; Chinese pediatric nutrition provider Biostime International Holdings Ltd.; German advertising company Stroeer Media AG; Swiss laboratory automation component distributor Tecan AG; and U.S. online advertising company YuMe, Inc. We funded these purchases in part by selling our positions in Noodles & Company and The WhiteWave Foods Company.
ARTISAN GLOBAL VALUE FUND
INVESTMENT PROCESS HIGHLIGHTS
Artisan Global Value Fund employs a fundamental investment process to construct a diversified portfolio of securities of undervalued U.S. and non-U.S. companies. The Fund’s investment process focuses on identifying what the investment team considers to be high- quality, undervalued businesses that offer the potential for superior risk/reward outcomes. The team’s in-depth research process focuses on four key investment characteristics:
Undervaluation. Determining the intrinsic value of the business is the heart of the team’s research process. The team believes that intrinsic value represents the amount that a buyer would pay to own a company’s future cash flows. The team seeks to invest at a significant discount to the team’s estimate of the intrinsic value of a business.
Business Quality. The team seeks to invest in companies with histories of generating strong free cash flow, improving returns on capital and strong competitive positions in their industries.
Financial Strength. The team believes that investing in companies with strong balance sheets helps to reduce the potential for capital risk and provides company management the ability to build value when attractive opportunities are available.
Shareholder-Oriented Management. The team’s research process attempts to identify management teams with a history of building value for shareholders.
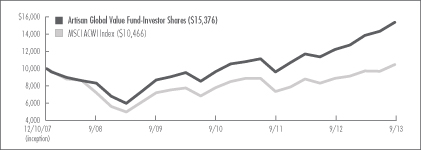
PERFORMANCE HISTORY
GROWTH OF AN ASSUMED $10,000 INVESTMENT (12/10/2007 to 9/30/2013)
AVERAGE ANNUAL TOTAL RETURNS (as of 9/30/2013)
| | | | | | | | | | | | | | | | |
| Fund / Index | | 1-Year | | | 3-Year | | | 5-Year | | | Since
Inception | |
Artisan Global Value Fund – Investor Shares (12/10/2007) | | | 25.68 | % | | | 16.75 | % | | | 13.07 | % | | | 7.69 | % |
Artisan Global Value Fund – Institutional Shares (7/17/2012) | | | 25.98 | | | | n/a | | | | n/a | | | | 28.83 | |
MSCI ACWI Index | | | 17.73 | | | | 10.21 | | | | 7.71 | | | | 0.79 | * |
| * | As of Investor Shares inception date. |
The performance quoted represents past performance, which does not guarantee future results. The investment return and principal value of an investment in the Fund will fluctuate, so that an investor’s shares in the Fund, when redeemed, may be worth more or less than their original cost. Current performance may be lower or higher than the performance data quoted. For current to most recent month-end performance information, visit www.artisanfunds.com or call 800.344.1770. The graph and table above do not reflect the deduction of taxes that a shareholder would pay on distributions or sale of Fund shares. The performance shown does not reflect the deduction of a 2% redemption fee on shares held by an investor for 90 days or less and, if reflected, the fee would reduce the performance quoted. The Fund’s performance information reflects Artisan Partners’ contractual agreement to limit the Fund’s expenses to no more than 1.50%, which has been in effect since the Fund’s inception and has had a material impact on the Fund’s performance, which would have been lower in its absence. See page 130 for a description of the index.
INVESTING ENVIRONMENT
Global equity markets continued their record rise from the dark days of 2008 and 2009. The agony of daily record lows in 2009 seemed to be supplanted in investors’ collective consciousness by the enthusiasm of new highs. Stock markets rose because of – or at least in parallel with – aggressive government intervention in the global economy. Governments, specifically central banks around the world, aggressively managed interest rates, asset prices and exchange rates to try to stimulate economic growth.
SECTOR DIVERSIFICATION
| | | | | | | | |
| Sector | | 9/30/2012 | | | 9/30/2013 | |
Consumer Discretionary | | | 12.1 | % | | | 6.2 | % |
Consumer Staples | | | 11.6 | | | | 8.8 | |
Energy | | | 2.1 | | | | 4.3 | |
Financials | | | 23.2 | | | | 27.9 | |
Healthcare | | | 6.0 | | | | 10.2 | |
Industrials | | | 6.9 | | | | 6.6 | |
Information Technology | | | 15.0 | | | | 21.7 | |
Materials | | | 1.2 | | | | 2.9 | |
Other assets less liabilities | | | 21.9 | | | | 11.4 | |
| | | | 100.0 | % | | | 100.0 | % |
PERFORMANCE DISCUSSION
During the twelve-month period ended September 30, 2013, Artisan Global Value Fund – Investor Shares returned 25.68% and Artisan Global Value Fund – Institutional Shares returned 25.98%, outperforming the MSCI ACWI Index, which returned 17.73% over the same period.
Performance of the following stocks had a positive impact on the portfolio during the period: U.S. electronic component engineer TE Connectivity Limited; U.S. insurance services company Aon PLC; U.S. payment solutions provider MasterCard Incorporated; U.K. financial services provider Lloyds Banking Group plc; and U.S. financial services provider The Bank of New York Mellon Corporation.
Notable detractors included: U.S. pharmacy health care provider CVS Caremark Corporation; Japanese lighting equipment manufacturer Stanley Electric Co., Ltd.; Indian coal producer Coal India Limited; Japanese pachinko manufacturer SANKYO CO., LTD.; and Danish brewing company Carlsberg A/S.
REGION ALLOCATION
| | | | | | | | |
| Region | | 9/30/2012 | | | 9/30/2013 | |
Americas | | | 47.6 | % | | | 53.9 | % |
Europe | | | 27.1 | | | | 30.6 | |
Pacific Basin | | | 3.4 | | | | 2.1 | |
Emerging Markets | | | — | | | | 2.0 | |
FUND CHANGES
We identified several new investment opportunities for the portfolio during the period, including U.S. software developer Microsoft Corporation; U.S. medical product producer Medtronic, Inc.; Canadian oil and gas operator Imperial Oil Ltd.; U.K. financial services company Royal Bank of Scotland Group plc; and Korean car manufacturer Kia Motors Corporation. We funded these purchases in part by selling our positions in Target Corporation, Signet Jewelers Ltd., Wal-Mart Stores, Inc., Fidelity National Financial, Inc. and Publicis Groupe.
ARTISAN INTERNATIONAL FUND
INVESTMENT PROCESS HIGHLIGHTS
Artisan International Fund employs a fundamental stock selection process focused on identifying long-term growth opportunities to build a portfolio of non-U.S. growth companies of all market capitalizations. The investment team seeks to invest in companies within its preferred themes with sustainable growth characteristics at attractive valuations that do not fully reflect their long-term potential.
Themes. The team identifies long-term secular (as opposed to cyclical) growth trends with the objective of investing in companies that have meaningful exposure to these trends. The team’s fundamental analysis focuses on those industry leaders with attractive growth and valuation characteristics that will be long-term beneficiaries any structural change and/or trend.
Sustainable Growth. The team applies a fundamental approach to identifying the long-term, sustainable growth characteristics of potential investments. The team seeks high-quality companies that typically have a sustainable competitive advantage, a superior business model and a high-quality management team.
Valuation. The team uses multiple valuation metrics to establish a target price range. The team assesses the relationship between its estimate of a company’s sustainable growth prospects and its current valuation.
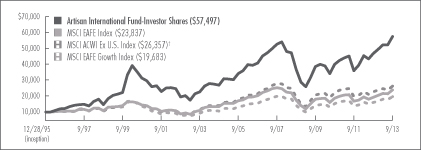
PERFORMANCE HISTORY
GROWTH OF AN ASSUMED $10,000 INVESTMENT (12/28/1995 to 9/30/2013)
AVERAGE ANNUAL TOTAL RETURNS (as of 9/30/2013)
| | | | | | | | | | | | | | | | | | | | |
| Fund / Index | | 1-Year | | | 3-Year | | | 5-Year | | | 10-Year | | | Since
Inception | |
Artisan International Fund – Investor Shares (12/28/1995) | | | 23.11 | % | | | 12.97 | % | | | 9.35 | % | | | 9.72 | % | | | 10.35 | % |
Artisan International Fund – Institutional Shares (7/1/1997) | | | 23.35 | | | | 13.22 | | | | 9.60 | | | | 9.97 | | | | 9.03 | |
MSCI EAFE Index | | | 23.77 | | | | 8.47 | | | | 6.35 | | | | 8.01 | | | | 5.01 | * |
MSCI ACWI Ex U.S. Index† | | | 16.48 | | | | 5.95 | | | | 6.26 | | | | 8.77 | | | | 5.61 | * |
MSCI EAFE Growth Index | | | 23.27 | | | | 8.88 | | | | 6.79 | | | | 8.00 | | | | 3.89 | * |
| * | As of Investor Shares Inception date. |
| † | Effective January 31, 2013, the Fund’s secondary benchmark was changed from the MSCI EAFE Growth Index to the MSCI ACWI Ex U.S. Index, to provide an appropriate comparison in light of the Fund’s investment strategy. |
The performance quoted represents past performance, which does not guarantee future results. The investment return and principal value of an investment in the Fund will fluctuate, so that an investor’s shares in the Fund, when redeemed, may be worth more or less than their original cost. Current performance may be lower or higher than the performance data quoted. For current to most recent month-end performance information, visit www.artisanfunds.com or call 800.344.1770. The graph and table above do not reflect the deduction of taxes that a shareholder would pay on distributions or sale of Fund shares. The performance shown does not reflect the deduction of a 2% redemption fee on shares held by an investor for 90 days or less and, if reflected, the fee would reduce the performance quoted. See page 130 for a description of each index.
INVESTING ENVIRONMENT
International equity markets posted strong gains over the one-year period ended September 30, 2013, as central banks around the globe poured liquidity into the global financial system. Throughout the year, politicians and banks worked to ease the burden, if only temporarily, of the fiscal problems facing Western economies. Yet, long-term fiscally sustainable solutions to the problems facing global equity markets remain outstanding.
SECTOR DIVERSIFICATION
| | | | | | | | |
| Sector | | 9/30/2012 | | | 9/30/2013 | |
Consumer Discretionary | | | 12.4 | % | | | 11.8 | % |
Consumer Staples | | | 28.5 | | | | 22.3 | |
Energy | | | 2.6 | | | | 2.2 | |
Financials | | | 18.4 | | | | 18.8 | |
Healthcare | | | 6.2 | | | | 11.8 | |
Industrials | | | 12.9 | �� | | | 16.0 | |
Information Technology | | | 5.5 | | | | 5.9 | |
Materials | | | 8.0 | | | | 7.6 | |
Telecommunication Services | | | 3.7 | | | | 0.9 | |
Other assets less liabilities | | | 1.8 | | | | 2.7 | |
| | | | 100.0 | % | | | 100.0 | % |
PERFORMANCE DISCUSSION
During the twelve-month period ended September 30, 2013, Artisan International Fund – Investor Shares returned 23.11% and Artisan International Fund – Institutional Shares returned 23.35%. The MSCI EAFE, MSCI EAFE Growth and MSCI ACWI Ex U.S. indices returned 23.77%, 23.27% and 16.48%, respectively, over the same period.
Performance of the following stocks had a positive impact on the portfolio during the period: Canadian freight and intermodal services provider Canadian Pacific Railway Limited; German mail and parcel delivery service company Deutsche Post AG; Japanese automobile and motorcycle manufacturer HONDA MOTOR CO., LTD.; German cable operator Kabel Deutschland Holding AG; and Chinese Internet search engine operator Baidu, Inc.
Notable detractors included: Japanese telecommunications services provider SoftBank Corp; Netherlands-based tank terminal operator Koninklijke Vopak NV; Indonesian commercial banking provider PT Bank Rakyat Indonesia (Persero) Tbk; Japanese manufacturer of household and chemical products Kao Corporation; and Indian coal producer Coal India Limited.
REGION ALLOCATION
| | | | | | | | |
| Region | | 9/30/2012 | | | 9/30/2013 | |
Europe | | | 53.4 | % | | | 64.4 | % |
Pacific Basin | | | 24.8 | | | | 16.3 | |
Emerging Markets | | | 11.0 | | | | 9.9 | |
Americas | | | 9.0 | | | | 6.7 | |
FUND CHANGES
We identified several new investment opportunities for the portfolio during the period, including U.K. turbine manufacturer Rolls-Royce Holdings PLC; Japanese car and truck manufacturer TOYOTA MOTOR CORPORATION; German aggregate manufacturer HeidelbergCement AG; Swiss financial services firm UBS AG; and diversified Chinese company Beijing Enterprises Holdings Ltd. We funded these purchases in part by selling our positions in Brenntag AG, Sun Hung Kai Properties Limited, China Mobile Limited, Kao Corporation and Wynn Macau Limited.
ARTISAN INTERNATIONAL SMALL CAP FUND
INVESTMENT PROCESS HIGHLIGHTS
Artisan International Small Cap Fund employs a fundamental stock selection process focused on identifying long-term growth opportunities to build a portfolio of small non-U.S. growth companies. The investment team seeks to invest in companies within its preferred themes with sustainable growth characteristics at attractive valuations that do not fully reflect their long-term potential.
Themes. The team identifies long-term secular (as opposed to cyclical) growth trends with the objective of investing in companies that have meaningful exposure to these trends. The team’s fundamental analysis focuses on those industry leaders with attractive growth and valuation characteristics that will be long-term beneficiaries of any structural change and/or trend.
Sustainable Growth. The team applies a fundamental approach to identifying the long-term, sustainable growth characteristics of potential investments. The team seeks high-quality companies that typically have a sustainable competitive advantage, a superior business model and a high-quality management team.
Valuation. The team uses multiple valuation metrics to establish a target price range. The team assesses the relationship between its estimate of a company’s sustainable growth prospects and its current valuation.
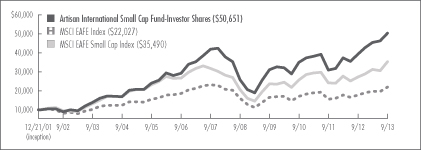
PERFORMANCE HISTORY
GROWTH OF AN ASSUMED $10,000 INVESTMENT (12/21/2001 to 9/30/2013)
AVERAGE ANNUAL TOTAL RETURNS (as of 9/30/2013)
| | | | | | | | | | | | | | | | | | | | |
| Fund / Index | | 1-Year | | | 3-Year | | | 5-Year | | | 10-Year | | | Since
Inception | |
Artisan International Small Cap Fund – Investor Shares (12/21/2001) | | | 28.50 | % | | | 12.88 | % | | | 14.32 | % | | | 13.82 | % | | | 14.77 | % |
MSCI EAFE Index | | | 23.77 | | | | 8.47 | | | | 6.35 | | | | 8.01 | | | | 6.94 | |
MSCI EAFE Small Cap Index | | | 29.43 | | | | 11.25 | | | | 11.43 | | | | 10.29 | | | | 11.36 | |
The performance quoted represents past performance, which does not guarantee future results. The investment return and principal value of an investment in the Fund will fluctuate, so that an investor’s shares in the Fund, when redeemed, may be worth more or less than their original cost. Current performance may be lower or higher than the performance data quoted. For current to most recent month-end performance information, visit www.artisanfunds.com or call 800.344.1770. The graph and table above do not reflect the deduction of taxes that a shareholder would pay on distributions or sale of Fund shares. The performance shown does not reflect the deduction of a 2% redemption fee on shares held by an investor for 90 days or less and, if reflected, the fee would reduce the performance quoted. See page 130 for a description of each index.
INVESTING ENVIRONMENT
International equity markets posted strong gains over the one-year period ended September 30, 2013, as central banks around the globe poured liquidity into the global financial system. Throughout the year, politicians and banks worked to ease the burden, if only temporarily, of the fiscal problems facing Western economies. Yet, long-term fiscally sustainable solutions to the problems facing global equity markets remain outstanding.
SECTOR DIVERSIFICATION
| | | | | | | | |
| Sector | | 9/30/2012 | | | 9/30/2013 | |
Consumer Discretionary | | | 23.6 | % | | | 14.6 | % |
Consumer Staples | | | 25.1 | | | | 29.4 | |
Energy | | | 0.7 | | | | — | |
Financials | | | 2.2 | | | | 3.8 | |
Healthcare | | | 6.2 | | | | 8.1 | |
Industrials | | | 20.1 | | | | 18.6 | |
Information Technology | | | 10.2 | | | | 10.9 | |
Materials | | | 3.0 | | | | 2.5 | |
Utilities | | | 6.9 | | | | 7.9 | |
Other assets less liabilities | | | 2.0 | | | | 4.2 | |
| | | | 100.0 | % | | | 100.0 | % |
PERFORMANCE DISCUSSION
During the twelve-month period ended September 30, 2013, Artisan International Small Cap Fund – Investor Shares returned 28.50%, underperforming the MSCI EAFE Small Cap Index, which returned 29.43%, but outperforming the MSCI EAFE Index, which returned 23.77%, over the same period.
Performance of the following stocks had a positive impact on the portfolio during the period: German Internet payment and processing services provider Wirecard AG; Filippino conglomerate Alliance Global Group, Inc.; French laboratory testing company Eurofins Scientific; Irish nutritional products company Glanbia plc; and Chinese water treatment systems developer Beijing Enterprises Water Group Limited.
Notable detractors included: Canadian fluid management company Poseidon Concepts Corp.; Indonesian media company PT Global Mediacom Tbk; Indonesian broadcasting company PT MNC Sky Vision Tbk; Brazilian casual dining company International Meal Co Holdings SA; and Japanese automobile related products retailer AUTOBACS SEVEN CO., LTD.
REGION ALLOCATION
| | | | | | | | |
| Region | | 9/30/2012 | | | 9/30/2013 | |
Europe | | | 58.6 | % | | | 51.2 | % |
Emerging Markets | | | 21.3 | | | | 30.9 | |
Pacific Basin | | | 16.9 | | | | 10.4 | |
Americas | | | 1.2 | | | | 3.3 | |
FUND CHANGES
We identified several new investment opportunities for the portfolio during the period, including Swiss laboratory automation component manufacturer Tecan AG; Chinese pediatric nutrition company Biostime International Holdings Ltd.; Chinese carrier-neutral Internet data center provider 21Vianet Group, Inc.; U.K. property developer Barratt Developments plc; and U.K. information service provider UBM PLC. We funded these purchases in part by selling our positions in Alliance Global Group, Inc., GfK SE, L’Occitane International SA, AUTOBACS SEVEN CO., LTD. and Intime Department Store Group Company Limited.
ARTISAN INTERNATIONAL VALUE FUND
INVESTMENT PROCESS HIGHLIGHTS
Artisan International Value Fund employs a fundamental investment process to construct a diversified portfolio of stocks of undervalued non-U.S. companies of all sizes. The Fund’s investment process focuses on identifying what the investment team considers to be high-quality, undervalued businesses that offer the potential for superior risk/reward outcomes. The team’s in-depth research process focuses on four key investment characteristics:
Undervaluation. Determining the intrinsic value of the business is the heart of the team’s research process. The team believes that intrinsic value represents the amount that a buyer would pay to own a company’s future cash flows. The team seeks to invest at a significant discount to its estimate of the intrinsic value of a business.
Business Quality. The team seeks to invest in companies with histories of generating strong free cash flow, improving returns on capital and strong competitive positions in their industries.
Financial Strength. The team believes that investing in companies with strong balance sheets helps to reduce the potential for capital risk and provides company management the ability to build value when attractive opportunities are available.
Shareholder-Oriented Management. The team’s research process attempts to identify management teams with a history of building value for shareholders.
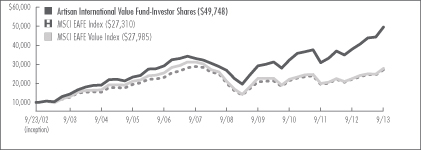
PERFORMANCE HISTORY
GROWTH OF AN ASSUMED $10,000 INVESTMENT (9/23/2002 to 9/30/2013)
AVERAGE ANNUAL TOTAL RETURNS (as of 9/30/2013)
| | | | | | | | | | | | | | | | | | | | |
| Fund / Index | | 1-Year | | | 3-Year | | | 5-Year | | | 10-Year | | | Since
Inception | |
Artisan International Value Fund – Investor Shares (9/23/2002) | | | 30.71 | % | | | 15.54 | % | | | 13.16 | % | | | 13.26 | % | | | 15.67 | % |
Artisan International Value Fund – Institutional Shares (10/1/2006) | | | 30.92 | | | | 15.75 | | | | 13.37 | | | | n/a | | | | 8.08 | |
MSCI EAFE Index | | | 23.77 | | | | 8.47 | | | | 6.35 | | | | 8.01 | | | | 9.55 | * |
MSCI EAFE Value Index | | | 24.27 | | | | 7.99 | | | | 5.86 | | | | 7.94 | | | | 9.79 | * |
| * | As of Investor Shares incption date. |
The performance quoted represents past performance, which does not guarantee future results. The investment return and principal value of an investment in the Fund will fluctuate, so that an investor’s shares in the Fund, when redeemed, may be worth more or less than their original cost. Current performance may be lower or higher than the performance data quoted. For current to most recent month-end performance information, visit www.artisanfunds.com or call 800.344.1770. The graph and table above do not reflect the deduction of taxes that a shareholder would pay on distributions or sale of Fund shares. The performance shown does not reflect the deduction of a 2% redemption fee on shares held by an investor for 90 days or less and, if reflected, the fee would reduce the performance quoted. See page 130 for a description of each index.
INVESTING ENVIRONMENT
Global equity markets continued their record rise from the dark days of 2008 and 2009. The agony of daily record lows in 2009 seemed to be supplanted in investors’ collective consciousness by the enthusiasm of new highs. Stock markets rose because of – or at least in parallel with – aggressive government intervention in the global economy. Governments, specifically central banks around the world, aggressively managed interest rates, asset prices and exchange rates to try to stimulate economic growth.
SECTOR DIVERSIFICATION
| | | | | | | | |
| Sector | | 9/30/2012 | | | 9/30/2013 | |
Consumer Discretionary | | | 20.2 | % | | | 17.3 | % |
Consumer Staples | | | 15.4 | | | | 12.4 | |
Energy | | | 2.5 | | | | 4.2 | |
Financials | | | 19.7 | | | | 21.2 | |
Healthcare | | | 8.3 | | | | 8.6 | |
Industrials | | | 14.5 | | | | 8.7 | |
Information Technology | | | 6.4 | | | | 10.6 | |
Materials | | | 2.2 | | | | 1.0 | |
Telecommunications | | | — | | | | 2.8 | |
Other assets less liabilities | | | 10.8 | | | | 13.2 | |
| | | | 100.0 | % | | | 100.0 | % |
PERFORMANCE DISCUSSION
During the twelve-month period ended September 30, 2013, Artisan International Value Fund – Investor Shares returned 30.71% and Artisan International Value Fund – Institutional Shares returned 30.92%, outperforming the MSCI EAFE and MSCI EAFE Value indices, which returned 23.77% and 24.27%, respectively, over the same period.
Performance of the following stocks had a positive impact on the portfolio during the period: U.S. electronic component engineer TE Connectivity Limited; U.K. financial services provider Lloyds Banking Group plc; U.K. publisher Reed Elsevier PLC; U.K. catering company Compass Group PLC; and U.S. insurance services holding company Aon PLC.
Notable detractors included: U.K. credit and marketing services provider Experian PLC; Korean electronics manufacturer Samsung Electronics Co., Ltd.; Japanese pachinko manufacturer SANKYO CO., LTD.; Japanese transportation and logistics company SEINO HOLDINGS CO., LTD.; and U.K. carpet retailer Carpetright plc.
REGION ALLOCATION
| | | | | | | | |
| Region | | 9/30/2012 | | | 9/30/2013 | |
Europe | | | 59.4 | % | | | 55.0 | % |
Americas | | | 18.7 | | | | 18.5 | |
Pacific Basin | | | 11.1 | | | | 7.4 | |
Emerging Markets | | | 0.0 | | | | 5.9 | |
FUND CHANGES
We identified several new investment opportunities for the portfolio during the period, including Chinese Internet company Baidu, Inc.; U.K. financial services company Royal Bank of Scotland Group plc; Canadian oil and gas operator Imperial Oil Ltd.; Korean car manufacturer Kia Motors Corporation; and U.K. telecommunications company Vodafone Group PLC. We funded these purchases in part by selling our positions in Signet Jewelers Ltd., HeidelbergCement AG, HSBC Holdings plc, Koninklijke Philips N.V. and Experian PLC.
ARTISAN MID CAP FUND
INVESTMENT PROCESS HIGHLIGHTS
Artisan Mid Cap Fund employs a fundamental investment process to construct a diversified portfolio of U.S. mid-cap growth companies. The Fund’s investment process focuses on two distinct areas – security selection and capital allocation.
The Fund’s investment team attempts to identify companies that possess franchise characteristics that are selling at attractive valuations and benefiting from an accelerating profit cycle.
Franchise Characteristics. These are characteristics that the team believes help to protect a company’s stream of cash flow from the effects of competition. The team looks for companies with at least two of the following characteristics: low cost production capability, possession of a proprietary asset, dominant market share, or a defensible brand name.
Attractive Valuations. Through its own fundamental research, the team estimates the amount a private market buyer would pay to buy the entire company (the company’s “intrinsic value” or “private market value”) and considers whether to purchase a stock if it sells at a discount to that estimate.
Accelerating Profit Cycle. The team tries to invest in companies that are well positioned for long-term growth, at an early enough stage in their profit cycle to benefit from the increased cash flows produced by the emerging profit cycle.
Based on the investment team’s fundamental analysis of a company’s profit cycle, portfolio holdings develop through three stages. GardenSM investments are small positions in the early part of their profit cycle that will warrant a more sizeable allocation once their profit cycle accelerates. CropSM investments are positions that are being increased to a full weight because they are moving through the strongest part of their profit cycle. HarvestSM investments are positions that are being reduced as they near the team’s estimate of full valuation or their profit cycle begins to decelerate.
PERFORMANCE HISTORY
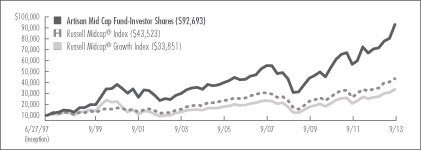
GROWTH OF AN ASSUMED $10,000 INVESTMENT (6/27/1997 to 9/30/2013)
AVERAGE ANNUAL TOTAL RETURNS (as of 9/30/2013)
| | | | | | | | | | | | | | | | | | | | |
| Fund / Index | | 1-Year | | | 3-Year | | | 5-Year | | | 10-Year | | | Since
Inception | |
Artisan Mid Cap Fund – Investor Shares (6/27/1997) | | | 31.53 | % | | | 19.98 | % | | | 16.59 | % | | | 12.01 | % | | | 14.68 | % |
Artisan Mid Cap Fund – Institutional Shares (7/1/2000) | | | 31.89 | | | | 20.31 | | | | 16.90 | | | | 12.30 | | | | 8.06 | |
Russell Midcap® Index | | | 27.91 | | | | 17.53 | | | | 12.97 | | | | 10.78 | | | | 9.47 | * |
Russell Midcap® Growth Index | | | 27.54 | | | | 17.65 | | | | 13.92 | | | | 10.16 | | | | 7.79 | * |
| * | As of Investor Shares inception date. |
The performance quoted represents past performance, which does not guarantee future results. The investment return and principal value of an investment in the Fund will fluctuate, so that an investor’s shares in the Fund, when redeemed, may be worth more or less than their original cost. Current performance may be lower or higher than the performance data quoted. For current to most recent month-end performance information, visit www.artisanfunds.com or call 800.344.1770. The graph and table above do not reflect the deduction of taxes that a shareholder would pay on distributions or sale of Fund shares. See page 130 for a description of each index.
INVESTING ENVIRONMENT
In the one-year period ended September 30, 2013, mid-cap stocks, as represented by the Russell Midcap® and Russell Midcap® Growth indices, posted strong positive returns. Corporate profit growth continued, and economic data, though still tepid, improved and outpaced modest expectations. Conversely, financial markets were preoccupied with the timing of the cessation of the U.S. Federal Reserve Bank’s long-term bond buying program, as well as concerns over slowed economic growth in emerging markets.
SECTOR DIVERSIFICATION
| | | | | | | | |
| Sector | | 9/30/2012 | | | 9/30/2013 | |
Consumer Discretionary | | | 19.5 | % | | | 20.2 | % |
Consumer Staples | | | 1.2 | | | | — | |
Energy | | | 7.7 | | | | 5.6 | |
Financials | | | 5.3 | | | | 4.7 | |
Healthcare | | | 23.7 | | | | 23.4 | |
Industrials | | | 13.0 | | | | 16.7 | |
Information Technology | | | 25.3 | | | | 26.2 | |
Other assets less liabilities | | | 4.3 | | | | 3.2 | |
| | | | 100.0 | % | | | 100.0 | % |
PERFORMANCE DISCUSSION
During the twelve-month period ended September 30, 2013, Artisan Mid Cap Fund –Investor Shares returned 31.53% and Artisan Mid Cap Fund – Institutional Shares returned 31.89%, outperforming both the Russell Midcap® Growth and Russell Midcap® indices, which returned 27.54% and 27.91%, respectively, over the same period.
Performance of the following stocks had a positive impact on the portfolio during the period: biopharmaceutical firm Regeneron Pharmaceuticals, Inc.; professional social networking site LinkedIn Corporation; provider of intellectual property to the semiconductor market ARM Holdings plc; biopharmaceutical firm Isis Pharmaceuticals, Inc.; and group life and health insurance provider Cigna Corporation.
Notable detractors included: data-warehousing firm Teradata Corporation; virtualization software provider VMware, Inc.; open source software and services developer Red Hat, Inc.; biopharmaceutical firm specializing in oncology ARIAD Pharmaceuticals, Inc.; and cosmetics, fragrances, skin and hair products retailer Ulta Salon, Cosmetics & Fragrance, Inc.
FUND CHANGES
We identified several new investment opportunities for the portfolio during the period, including biopharmaceutical firm Isis Pharmaceuticals, Inc.; home and security products provider Fortune Brands Home & Security, Inc.; online travel agency Ctrip.com International, Ltd.; home goods retailer Williams-Sonoma, Inc.; and contract research firm for the pharmaceutical industry Covance Inc. We funded these purchases in part by selling our positions in Agilent Technologies, Inc., Dresser-Rand Group Inc., Coach, Inc., Teradata Corporation and VMware, Inc.
ARTISAN MID CAP VALUE FUND
INVESTMENT PROCESS HIGHLIGHTS
Artisan Mid Cap Value Fund employs a fundamental investment process to construct a diversified portfolio of stocks of medium-sized U.S. companies that the investment team believes are undervalued, in solid financial condition and have attractive business economics. The team believes companies with these characteristics are less likely to experience eroding values over the long term.
Attractive Valuation. The team values a business using what it believes are reasonable expectations for the long-term earnings power and capitalization rates of that business. This results in a range of values for the company that the team believes would be reasonable. The team generally will purchase a security if the stock price falls below or toward the lower end of that range.
Sound Financial Condition. The team favors companies with an acceptable level of debt and positive cash flow. At a minimum, the team tries to avoid companies that have so much debt that management may be unable to make decisions that would be in the best interests of the companies’ shareholders.
Attractive Business Economics. The team favors cash-producing businesses that it believes are capable of earning acceptable returns on capital over the company’s business cycle.
PERFORMANCE HISTORY
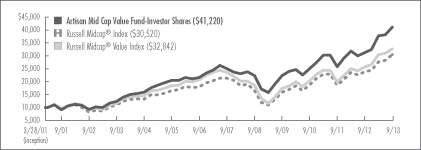
GROWTH OF AN ASSUMED $10,000 INVESTMENT (3/28/2001 to 9/30/2013)
AVERAGE ANNUAL TOTAL RETURNS (as of 9/30/2013)
| | | | | | | | | | | | | | | | | | | | |
| Fund / Index | | 1-Year | | | 3-Year | | | 5-Year | | | 10-Year | | | Since
Inception | |
Artisan Mid Cap Value Fund – Investor Shares (3/28/2001) | | | 31.64 | % | | | 17.87 | % | | | 13.01 | % | | | 12.83 | % | | | 11.99 | % |
Artisan Mid Cap Value Fund – Institutional Shares (2/1/2012) | | | 31.97 | | | | n/a | | | | n/a | | | | n/a | | | | 18.90 | |
Russell Midcap® Index | | | 27.91 | | | | 17.53 | | | | 12.97 | | | | 10.78 | | | | 9.33 | * |
Russell Midcap® Value Index | | | 27.77 | | | | 17.27 | | | | 11.86 | | | | 10.91 | | | | 9.97 | * |
| * | As of Investor Shares inception date. |
The performance quoted represents past performance, which does not guarantee future results. The investment return and principal value of an investment in the Fund will fluctuate, so that an investor’s shares in the Fund, when redeemed, may be worth more or less than their original cost. Current performance may be lower or higher than the performance data quoted. For current to most recent month-end performance information, visit www.artisanfunds.com or call 800.344.1770. The graph and table above do not reflect the deduction of taxes that a shareholder would pay on distributions or sale of Fund shares. See page 130 for a description of each index.
INVESTING ENVIRONMENT
U.S. equity markets posted strong returns during the one-year period ended September 30, 2013, helped by growth in corporate profits and steady improvement in the U.S. economy. Market sentiment benefited from continued monetary stimulus from the U.S. Federal Reserve Bank. U.S. equities also performed well compared to other asset classes, outpacing U.S. fixed income and commodities markets.
SECTOR DIVERSIFICATION
| | | | | | | | |
| Sector | | 9/30/2012 | | | 9/30/2013 | |
Consumer Discretionary | | | 7.9 | % | | | 11.8 | % |
Consumer Staples | | | 3.4 | | | | 2.8 | |
Energy | | | 11.5 | | | | 12.1 | |
Financials | | | 20.1 | | | | 21.2 | |
Healthcare | | | 4.5 | | | | 3.8 | |
Industrials | | | 18.0 | | | | 14.4 | |
Information Technology | | | 25.7 | | | | 24.0 | |
Materials | | | — | | | | 1.2 | |
Utilities | | | 1.9 | | | | 1.7 | |
Other assets less liabilities | | | 7.0 | | | | 7.0 | |
| | | | 100.0 | % | | | 100.0 | % |
PERFORMANCE DISCUSSION
During the twelve-month period ended September 30, 2013, Artisan Mid Cap Value Fund – Investor Shares returned 31.64% and Artisan Mid Cap Value Fund – Institutional Shares returned 31.97%, outperforming the Russell Midcap® and Russell Midcap® Value indices, which returned 27.91% and 27.77%, respectively, over the same period.
Performance of the following stocks had a positive impact on the portfolio during the period: supermarkets operator The Kroger Co.; professional services company Towers Watson & Co.; health insurance provider Cigna Corporation; stock exchange operator NYSE Euronext; and tax services provider H&R Block, Inc.
Notable detractors included: energy services company McDermott International, Inc.; gold mining company Kinross Gold Corporation; mortgage real estate investment trust Hatteras Financial Corp.; aerostructures manufacturer Spirit AeroSystems Holdings, Inc.; and real estate investment trust Annaly Capital Management, Inc.
FUND CHANGES
We identified several new investment opportunities for the portfolio during the period, including stock exchange operator NYSE Euronext; retail store operator Bed Bath & Beyond Inc.; semiconductor equipment manufacturing company KLA-Tencor Corporation; leather goods producer Coach, Inc.; and independent energy company SM Energy Company. We funded these purchases in part by selling our positions in Applied Materials, Inc., Flowserve Corporation, SAIC, Inc., Spirit AeroSystems Holdings, Inc. and Fidelity National Financial, Inc.
ARTISAN SMALL CAP FUND
INVESTMENT PROCESS HIGHLIGHTS
Artisan Small Cap Fund employs a fundamental investment process to construct a diversified portfolio of primarily U.S. small-cap growth companies. The Fund’s investment process focuses on two distinct areas – security selection and capital allocation.
The Fund’s investment team attempts to identify companies that possess franchise characteristics that are selling at attractive valuations and benefiting from an accelerating profit cycle.
Franchise Characteristics. These are characteristics that the team believes help to protect a company’s stream of cash flow from the effects of competition. The team looks for companies with at least two of the following characteristics: low cost production capability, possession of a proprietary asset, dominant market share, or a defensible brand name.
Attractive Valuations. Through its own fundamental research, the team estimates the amount a private market buyer would pay to buy the entire company (the company’s “intrinsic value” or “private market value”) and considers whether to purchase a stock if it sells at a discount to that estimate.
Accelerating Profit Cycle. The team tries to invest in companies that are well positioned for long-term growth, at an early enough stage in their profit cycle to benefit from the increased cash flows produced by the emerging profit cycle.
Based on the investment team’s fundamental analysis of a company’s profit cycle, portfolio holdings develop through three stages. GardenSM investments are small positions in the early part of their profit cycle that will warrant a more sizeable allocation once their profit cycle accelerates. CropSM investments are positions that are being increased to a full weight because they are moving through the strongest part of their profit cycle. HarvestSM investments are positions that are being reduced as they near the team’s estimate of full valuation or their profit cycle begins to decelerate.
PERFORMANCE HISTORY
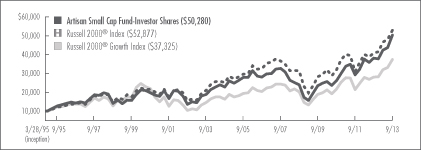
GROWTH OF AN ASSUMED $10,000 INVESTMENT (3/28/1995 to 9/30/2013)
AVERAGE ANNUAL TOTAL RETURNS (as of 9/30/2013)
| | | | | | | | | | | | | | | | | | | | |
| Fund / Index | | 1-Year | | | 3-Year | | | 5-Year | | | 10-Year | | | Since
Inception | |
Artisan Small Cap Fund – Investor Shares (3/28/1995) | | | 32.30 | % | | | 24.29 | % | | | 16.10 | % | | | 10.33 | % | | | 9.12 | % |
Artisan Small Cap Fund – Institutional Shares (5/7/2012) | | | 32.60 | | | | n/a | | | | n/a | | | | n/a | | | | 27.93 | |
Russell 2000® Index | | | 30.06 | | | | 18.29 | | | | 11.15 | | | | 9.64 | | | | 9.41 | * |
Russell 2000® Growth Index | | | 33.07 | | | | 19.96 | | | | 13.17 | | | | 9.85 | | | | 7.37 | * |
| * | As of Investor Shares inception date. |
The performance quoted represents past performance, which does not guarantee future results. The investment return and principal value of an investment in the Fund will fluctuate, so that an investor’s shares in the Fund, when redeemed, may be worth more or less than their original cost. Current performance may be lower or higher than the performance data quoted. For current to most recent month-end performance information, visit www.artisanfunds.com or call 800.344.1770. The graph and table above do not reflect the deduction of taxes that a shareholder would pay on distributions or sale of Fund shares. See page 130 for a description of each index.
INVESTING ENVIRONMENT
In the one-year period ended September 30, 2013, small-cap stocks, as represented by the Russell 2000® and Russell 2000® Growth indices, posted strong positive returns. Corporate profit growth continued, and economic data, though still tepid, improved and outpaced modest expectations. Conversely, financial markets were preoccupied with the timing of the cessation of the U.S. Federal Reserve Bank’s long-term bond buying program, as well as concerns over slowed economic growth in emerging markets.
SECTOR DIVERSIFICATION
| | | | | | | | |
| Sector | | 9/30/2012 | | | 9/30/2013 | |
Consumer Discretionary | | | 14.3 | % | | | 11.7 | % |
Consumer Staples | | | 3.9 | | | | 3.1 | |
Energy | | | 4.9 | | | | 4.5 | |
Financials | | | 2.5 | | | | — | |
Healthcare | | | 19.5 | | | | 20.0 | |
Industrials | | | 19.3 | | | | 18.4 | |
Information Technology | | | 30.4 | | | | 37.2 | |
Other assets less liabilities | | | 5.2 | | | | 5.1 | |
| | | | 100.0 | % | | | 100.0 | % |
PERFORMANCE DISCUSSION
During the twelve-month period ended September 30, 2013, Artisan Small Cap Fund – Investor Shares returned 32.30% and Artisan Small Cap Fund – Institutional Shares gained 32.60%, underperforming the Russell 2000® Growth Index, which returned 33.07%, but outperforming the Russell 2000® Index, which returned 30.06%, over the same period.
Performance of the following stocks had a positive impact on the portfolio during the period: biopharmaceutical firm Isis Pharmaceuticals, Inc.; designer of machine vision systems Cognex Corporation; data backup and recovery software provider CommVault Systems, Inc.; auto collision replacement parts provider LKQ Corporation; and provider of information to the U.S. and U.K. commercial real estate industries CoStar Group, Inc.
Notable detractors included: provider of data processing services to the health care industry HMS Holdings Corp.; supplier of hands-free communication devices in hospitals Vocera Communications, Inc.; women’s apparel and specialty retailer Francesca’s Holdings Corporation; biopharmaceutical firm specializing in oncology ARIAD Pharmaceuticals, Inc.; and network security vendor Fortinet, Inc.
FUND CHANGES
We identified several new investment opportunities for the portfolio during the period, including third-party designer of e-commerce platforms Demandware, Inc.; therapeutics firm Alnylam Pharmaceuticals, Inc.; manufacturer of climate-controlled seats for cars Gentherm Incorporated; supplier of satellite imagery DigitalGlobe, Inc.; and operator of membership-based retail warehouse clubs in Central America and Asia PriceSmart, Inc. We funded these purchases in part by selling our positions in industry HMS Holdings Corp., Ares Capital Corporation, Ulta Salon, Cosmetics & Fragrance, Inc., Woodward, Inc. and TreeHouse Foods, Inc.
ARTISAN SMALL CAP VALUE FUND
INVESTMENT PROCESS HIGHLIGHTS
Artisan Small Cap Value Fund employs a fundamental investment process to construct a diversified portfolio of small-cap U.S. companies that the team believes are undervalued, in solid financial condition and have attractive business economics. The team believes companies with these characteristics are less likely to experience eroding values over the long term.
Attractive Valuation. The team values a business using what it believes are reasonable expectations for the long-term earnings power and capitalization rates of that business. This results in a range of values for the company that the team believes would be reasonable. The team generally will purchase a security if the stock price falls below or toward the lower end of that range.
Sound Financial Condition. The team favors companies with an acceptable level of debt and positive cash flow. At a minimum, the team tries to avoid companies that have so much debt that management may be unable to make decisions that would be in the best interest of the companies’ shareholders.
Attractive Business Economics. The team favors cash-producing businesses that it believes are capable of earning acceptable returns on capital over the company’s business cycle.
PERFORMANCE HISTORY
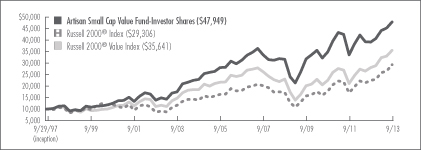
GROWTH OF AN ASSUMED $10,000 INVESTMENT (9/29/1997 to 9/30/2013)
AVERAGE ANNUAL TOTAL RETURNS (as of 9/30/2013)
| | | | | | | | | | | | | | | | | | | | |
| Fund / Index | | 1-Year | | | 3-Year | | | 5-Year | | | 10-Year | | | Since
Inception | |
Artisan Small Cap Value Fund – Investor Shares (9/29/1997) | | | 22.24 | % | | | 11.15 | % | | | 8.63 | % | | | 10.57 | % | | | 10.29 | % |
Artisan Small Cap Value Fund – Institutional Shares (2/1/2012) | | | 22.54 | | | | n/a | | | | n/a | | | | n/a | | | | 9.17 | |
Russell 2000® Index | | | 30.06 | | | | 18.29 | | | | 11.15 | | | | 9.64 | | | | 6.95 | * |
Russell 2000® Value Index | | | 27.04 | | | | 16.57 | | | | 9.13 | | | | 9.29 | | | | 8.27 | * |
| * | As of Investor Shares inception date. |
The performance quoted represents past performance, which does not guarantee future results. The investment return and principal value of an investment in the Fund will fluctuate, so that an investor’s shares in the Fund, when redeemed, may be worth more or less than their original cost. Current performance may be lower or higher than the performance data quoted. For current to most recent month-end performance information, visit www.artisanfunds.com or call 800.344.1770. The graph and table above do not reflect the deduction of taxes that a shareholder would pay on distributions or sale of Fund shares. See page 130 for a description of each index.
INVESTING ENVIRONMENT
U.S. equity markets posted strong returns during the one-year period ended September 30, 2013, helped by growth in corporate profits and steady improvement in the U.S. economy. Market sentiment benefited from continued monetary stimulus from the U.S. Federal Reserve Bank. U.S. equities also performed well compared to other asset classes, outpacing U.S. fixed income and commodities markets.
SECTOR DIVERSIFICATION
| | | | | | | | |
| Sector | | 9/30/2012 | | | 9/30/2013 | |
Consumer Discretionary | | | 14.5 | % | | | 13.1 | % |
Consumer Staples | | | 0.7 | | | | 1.2 | |
Energy | | | 13.8 | | | | 13.9 | |
Financials | | | 6.2 | | | | 6.6 | |
Healthcare | | | 2.7 | | | | 2.8 | |
Industrials | | | 26.2 | | | | 25.6 | |
Information Technology | | | 24.5 | | | | 21.2 | |
Materials | | | 5.9 | | | | 6.4 | |
Telecommunication Services | | | 1.6 | | | | 0.9 | |
Other assets less liabilities | | | 3.9 | | | | 8.3 | |
| | | | 100.0 | % | | | 100.0 | % |
PERFORMANCE DISCUSSION
During the twelve-month period ended September 30, 2013, Artisan Small Cap Value Fund – Investor Shares returned 22.24% and Artisan Small Cap Value Fund – Institutional Shares returned 22.54%, underperforming the Russell 2000® and Russell 2000® Value indices, which returned 30.06% and 27.04%, respectively, over the same period.
Performance of the following stocks had a positive impact on the portfolio during the period: transportation, logistics and supply chain solutions provider Ryder System, Inc.; networking and communications equipment provider ADTRAN, Inc.; industrial adhesives manufacturer H.B. Fuller Company; construction services firm EMCOR Group, Inc.; and business advisory firm FTI Consulting, Inc.
Notable detractors included: business intelligence software provider MicroStrategy Incorporated; exploration and production company Forest Oil Corporation; mortgage real estate investment trust Hatteras Financial Corp.; IT, network and communications services provider EarthLink, Inc.; and aerostructures manufacturer Spirit AeroSystems Holdings, Inc.
FUND CHANGES
We identified several new investment opportunities for the portfolio during the period, including men’s clothing manufacturer Jos. A. Bank Clothiers, Inc.; military defense equipment provider CUBIC CORPORATION; instrument provider MKS Instruments, Inc.; advanced materials company Park Electrochemical Corp.; and aerospace and industrial distribution company Kaman Corporation. We funded these purchases in part by selling our positions in The Warnaco Group, Inc., Intersil Corporation, Spirit AeroSystems Holdings, Inc., Forest Oil Corporation and Harsco Corporation.
ARTISAN VALUE FUND
INVESTMENT PROCESS HIGHLIGHTS
Artisan Value Fund employs a fundamental investment process to construct a diversified portfolio of equity securities across a broad capitalization range that the team believes are undervalued, in solid financial condition and have attractive business economics. The team believes companies with these characteristics are less likely to experience eroding values over the long term.
Attractive Valuation. The team values a business using what it believes are reasonable expectations for the long-term earnings power and capitalization rates of that business. This results in a range of values for the company that the team believes would be reasonable. The team generally will purchase a security if the stock price falls below or toward the lower end of that range.
Sound Financial Condition. The team favors companies with an acceptable level of debt and positive cash flow. At a minimum, the team tries to avoid companies that have so much debt that management may be unable to make decisions that would be in the best interest of the companies’ shareholders.
Attractive Business Economics. The team favors cash-producing businesses that it believes are capable of earning acceptable returns on capital over the company’s business cycle.
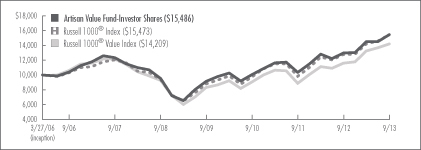
PERFORMANCE HISTORY
GROWTH OF AN ASSUMED $10,000 INVESTMENT (3/27/2006 to 9/30/2013)
AVERAGE ANNUAL TOTAL RETURNS (as of 9/30/2013)
| | | | | | | | | | | | | | | | |
| Fund / Index | | 1-Year | | | 3-Year | | | 5-Year | | | Since
Inception | |
Artisan Value Fund – Investor Shares (3/27/2006) | | | 18.97 | % | | | 15.44 | % | | | 10.21 | % | | | 6.00 | % |
Artisan Value Fund – Institutional Shares (7/26/2011) | | | 19.43 | | | | n/a | | | | n/a | | | | 12.43 | |
Russell 1000® Index | | | 20.91 | | | | 16.64 | | | | 10.53 | | | | 5.98 | * |
Russell 1000® Value Index | | | 22.30 | | | | 16.25 | | | | 8.86 | | | | 4.79 | * |
| * | As of Investor Shares inception date. |
The performance quoted represents past performance, which does not guarantee future results. The investment return and principal value of an investment in the Fund will fluctuate, so that an investor’s shares in the Fund, when redeemed, may be worth more or less than their original cost. Current performance may be lower or higher than the performance data quoted. For current to most recent month-end performance information, visit www.artisanfunds.com or call 800.344.1770. The graph and table above do not reflect the deduction of taxes that a shareholder would pay on distributions or sale of Fund shares. See page 130 for a description of each index.
INVESTING ENVIRONMENT
U.S. equity markets posted strong returns during the one-year period ended September 30, 2013, helped by growth in corporate profits and steady improvement in the U.S. economy. Market sentiment benefited from continued monetary stimulus from the U.S. Federal Reserve Bank. U.S. equities also performed well compared to other asset classes, outpacing U.S. fixed income and commodities markets.
SECTOR DIVERSIFICATION
| | | | | | | | |
| Sector | | 9/30/2012 | | | 9/30/2013 | |
Consumer Discretionary | | | 3.8 | % | | | 3.6 | % |
Consumer Staples | | | 4.7 | | | | 2.0 | |
Energy | | | 14.3 | | | | 17.6 | |
Financials | | | 23.4 | | | | 17.2 | |
Healthcare | | | 6.4 | | | | 3.4 | |
Industrials | | | 2.6 | | | | 3.7 | |
Information Technology | | | 29.2 | | | | 31.0 | |
Materials | | | 3.9 | | | | 11.8 | |
Telecommunication Services | | | 3.1 | | | | — | |
Other assets less liabilities | | | 8.6 | | | | 9.7 | |
| | | | 100.0 | % | | | 100.0 | % |
PERFORMANCE DISCUSSION
During the twelve-month period ended September 30, 2013, Artisan Value Fund – Investor Shares returned 18.97% and Artisan Value Fund – Institutional Shares returned 19.43%, underperforming the Russell 1000® and Russell 1000® Value indices, which returned 20.91% and 22.30%, respectively, over the same period.
Performance of the following stocks had a positive impact on the portfolio during the period: health insurance provider Cigna Corporation; supermarkets operator The Kroger Co.; exploration and production company Cimarex Energy Co.; tax services provider H&R Block, Inc.; and holding company Berkshire Hathaway Inc.
Notable detractors included: mineral property developer Newmont Mining Corporation; technology designer and manufacturer Apple Inc.; potash, phosphate and nitrogen producer Potash Corporation of Saskatchewan Inc.; real estate investment trust Annaly Capital Management, Inc.; and phosphate and potash producer The Mosaic Company.
REGION ALLOCATION
| | | | | | | | |
| Region | | 9/30/2012 | | | 9/30/2013 | |
Americas | | | 80.6 | % | | | 80.0 | % |
Emerging Markets | | | 7.0 | | | | 6.7 | |
Europe | | | 3.8 | | | | 3.6 | |
FUND CHANGES
We identified several new investment opportunities for the portfolio during the period, including tire manufacturer Cie Generale des Etablissements Michelin; U.S. provider of equipment and components used in oil and gas drilling and production operations National Oilwell Varco, Inc.; computer solutions provider International Business Machines Corporation; freight transportation company CSX Corporation; and plastic, chemical and fuel products manufacturer LyondellBasell Industries N.V. We funded these purchases in part by selling our positions in Vodafone Group Plc, Google Inc., Royal Dutch Shell PLC, H&R Block, Inc. and Ingram Micro Inc.
ARTISAN EMERGING MARKETS FUND
Schedule of Investments – September 30, 2013
Dollar values in thousands
| | | | | | | | |
| | | Shares
Held | | | Value | |
| COMMON STOCKS - 95.2% | | | | | | | | |
| | | | | | | | |
| BRAZIL - 11.3% | | | | | | | | |
Anhanguera Educacional Participacoes S.A. | | | 937,900 | | | $ | 5,611 | |
Banco do Brasil S.A.(1)(2) | | | 107,980 | | | | 1,260 | |
Banco do Brasil S.A. | | | 450,100 | | | | 5,250 | |
BM&FBovespa S.A. | | | 1,068,576 | | | | 5,969 | |
BR Properties S.A. | | | 538,320 | | | | 4,785 | |
Cosan S.A. Industria e Comercio | | | 200,800 | | | | 3,871 | |
Hypermarcas S.A. | | | 1,432,838 | | | | 11,559 | |
Magazine Luiza S.A.(3) | | | 779,400 | | | | 2,655 | |
Magnesita Refratarios S.A. | | | 902,300 | | | | 2,565 | |
PDG Realty S.A. Empreendimentos e Participacoes(3) | | | 2,397,451 | | | | 2,661 | |
Petroleo Brasileiro S.A. | | | 1,781,289 | | | | 13,631 | |
Vale S.A. | | | 963,313 | | | | 14,978 | |
| | | | | | | | |
| | | | | | | 74,795 | |
| CHILE - 1.3% | | | | | | | | |
SACI Falabella | | | 470,031 | | | | 4,507 | |
Sonda S.A. | | | 1,564,981 | | | | 4,173 | |
| | | | | | | | |
| | | | | | | 8,680 | |
| CHINA - 13.8% | | | | | | | | |
Ajisen China Holdings Ltd. | | | 7,016,913 | | | | 7,021 | |
Chaoda Modern Agriculture Holdings Ltd.(2)(3)(4) | | | 12,474,536 | | | | 143 | |
China High Precision Automation Group Ltd.(2)(4) | | | 9,066,000 | | | | 145 | |
China Huishan Dairy Holdings Co., Ltd.(3) | | | 8,422,000 | | | | 2,715 | |
China Life Insurance Co., Ltd., Class H | | | 3,226,800 | | | | 8,362 | |
China Petroleum & Chemical Corp., Class H | | | 11,205,453 | | | | 8,770 | |
China Resources Power Holdings Co., Ltd. | | | 2,488,000 | | | | 5,935 | |
China Unicom Hong Kong Ltd. | | | 3,867,500 | | | | 6,054 | |
Digital China Holdings Ltd. | | | 4,200,460 | | | | 5,145 | |
GOME Electrical Appliances Holding Ltd. | | | 39,589,881 | | | | 5,053 | |
Huabao International Holdings Ltd. | | | 12,443,322 | | | | 5,230 | |
Mindray Medical International Ltd. (DR) | | | 165,073 | | | | 6,420 | |
Noah Holdings Ltd. (DR) | | | 407,635 | | | | 6,950 | |
Sino Biopharmaceutical | | | 3,880,000 | | | | 2,636 | |
Sinopharm Group Co., Ltd., Class H | | | 2,124,900 | | | | 5,331 | |
Springland International Holdings Ltd. | | | 5,783,590 | | | | 3,132 | |
Zhuzhou CSR Times Electric Co., Ltd., Class H | | | 3,870,515 | | | | 12,576 | |
| | | | | | | | |
| | | | | | | 91,618 | |
| COLOMBIA - 1.0% | | | | | | | | |
Grupo de Inversiones Suramericana S.A. | | | 327,508 | | | | 6,549 | |
| | | | | | | | |
| EGYPT - 0.3% | | | | | | | | |
Egyptian Financial Group-Hermes Holding(3) | | | 2,002,801 | | | | 2,148 | |
| | | | | | | | |
| HONG KONG - 1.6% | | | | | | | | |
AIA Group Ltd. | | | 1,416,665 | | | $ | 6,658 | |
Chow Tai Fook Jewellery Group Ltd. | | | 2,601,400 | | | | 3,723 | |
| | | | | | | | |
| | | | | | | 10,381 | |
| INDIA - 6.6% | | | | | | | | |
Aurobindo Pharma Ltd. | | | 1,041,401 | | | | 3,357 | |
Hindalco Industries Ltd. | | | 2,530,209 | | | | 4,510 | |
ICICI Bank Ltd. | | | 338,422 | | | | 4,762 | |
India Cements Ltd. | | | 2,106,703 | | | | 1,704 | |
Mahindra & Mahindra Ltd. | | | 287,441 | | | | 3,815 | |
Oil India Ltd.(1)(2) | | | 40,080 | | | | 279 | |
Oil India Ltd. | | | 19,067 | | | | 133 | |
Petronet LNG Ltd. | | | 1,756,354 | | | | 3,333 | |
Power Finance Corp. Ltd. | | | 1,362,510 | | | | 2,827 | |
Reliance Industries Ltd. | | | 436,172 | | | | 5,723 | |
Reliance Infrastructure Ltd. | | | 558,047 | | | | 3,287 | |
Shriram Transport Finance Co., Ltd. | | | 336,375 | | | | 3,052 | |
Tech Mahindra Ltd. | | | 304,756 | | | | 6,489 | |
Welspun Corp. Ltd. | | | 1,263,311 | | | | 599 | |
| | | | | | | | |
| | | | | | | 43,870 | |
| INDONESIA - 3.6% | | | | | | | | |
Astra International Tbk PT | | | 11,817,370 | | | | 6,582 | |
Bank Negara Indonesia Persero Tbk PT | | | 20,821,018 | | | | 7,327 | |
Indofood CBP Sukses Makmur Tbk PT | | | 7,198,000 | | | | 6,371 | |
Media Nusantara Citra Tbk PT | | | 14,227,500 | | | | 3,318 | |
| | | | | | | | |
| | | | | | | 23,598 | |
| ITALY - 1.1% | | | | | | | | |
Tenaris S.A. (DR) | | | 152,432 | | | | 7,131 | |
| | | | | | | | |
| KAZAKHSTAN - 0.6% | | | | | | | | |
KazMunaiGas Exploration Production JSC (DR) | | | 285,888 | | | | 4,245 | |
| | | | | | | | |
| KOREA - 14.8% | | | | | | | | |
Daewoo Shipbuilding & Marine Engineering
Co., Ltd. | | | 292,554 | | | | 9,419 | |
E-Mart Co., Ltd. | | | 26,073 | | | | 5,871 | |
KB Financial Group, Inc. | | | 275,322 | | | | 9,633 | |
Kia Motors Corp. | | | 219,460 | | | | 13,335 | |
Lock & Lock Co., Ltd. | | | 142,704 | | | | 3,413 | |
Samsung Electronics Co., Ltd. | | | 34,833 | | | | 44,308 | |
Shinhan Financial Group Co., Ltd. | | | 302,290 | | | | 12,278 | |
| | | | | | | | |
| | | | | | | 98,257 | |
| MALAYSIA - 0.5% | | | | | | | | |
AirAsia BHD | | | 4,201,800 | | | | 3,300 | |
| | | | | | | | |
| | | | | | | | |
| | | Shares
Held | | | Value | |
| MEXICO - 5.4% | | | | | | | | |
America Movil S.A.B. de C.V., Series L | | | 10,659,230 | | | $ | 10,570 | |
Controladora Vuela Cia de Aviacion S.A.B. de C.V. (DR)(3) | | | 161,292 | | | | 2,339 | |
Credito Real S.A.B. de C.V.(3) | | | 2,878,829 | | | | 4,548 | |
Grupo Financiero Banorte S.A.B. de C.V. | | | 669,508 | | | | 4,172 | |
Grupo Televisa S.A.B., Series CPO | | | 1,188,355 | | | | 6,636 | |
Infraestructura Energetica Nova S.A.B.
de C.V.(3) | | | 1,100,858 | | | | 4,255 | |
OHL Mexico S.A.B. de C.V.(3) | | | 1,291,592 | | | | 3,399 | |
| | | | | | | | |
| | | | | | | 35,919 | |
| PERU - 1.1% | | | | | | | | |
Cementos Pacasmayo SAA | | | 114,853 | | | | 268 | |
Cementos Pacasmayo SAA (DR) | | | 313,020 | | | | 3,662 | |
Grana y Montero S.A. (DR)(3) | | | 178,440 | | | | 3,562 | |
| | | | | | | | |
| | | | | | | 7,492 | |
| PHILIPPINES - 0.6% | | | | | | | | |
Philippine Long Distance Telephone Co. | | | 53,240 | | | | 3,641 | |
| | | | | | | | |
| RUSSIA - 7.3% | | | | | | | | |
Globaltrans Investment plc (DR) | | | 378,841 | | | | 5,493 | |
LSR Group (DR) | | | 1,078,913 | | | | 4,580 | |
Lukoil OAO (DR) | | | 194,743 | | | | 12,347 | |
MMC Norilsk Nickel OJSC (DR) | | | 312,660 | | | | 4,512 | |
Mobile Telesystems OJSC | | | 846,047 | | | | 8,434 | |
Polymetal International plc | | | 371,716 | | | | 3,935 | |
Sberbank of Russia | | | 3,041,484 | | | | 9,186 | |
| | | | | | | | |
| | | | | | | 48,487 | |
| SOUTH AFRICA - 4.3% | | | | | | | | |
FirstRand Ltd. | | | 1,561,074 | | | | 5,209 | |
Harmony Gold Mining Co., Ltd. | | | 778,062 | | | | 2,685 | |
Impala Platinum Holdings Ltd. | | | 424,426 | | | | 5,236 | |
Naspers Ltd., Class N | | | 120,129 | | | | 11,109 | |
Truworths International Ltd. | | | 433,095 | | | | 3,882 | |
| | | | | | | | |
| | | | | | | 28,121 | |
| SWEDEN - 0.5% | | | | | | | | |
Alliance Oil Co., Ltd. (DR)(3) | | | 397,284 | | | | 2,988 | |
| | | | | | | | |
| SWITZERLAND - 0.9% | | | | | | | | |
Dufry AG(3) | | | 40,222 | | | | 6,049 | |
| | | | | | | | |
| TAIWAN - 10.9% | | | | | | | | |
Chinatrust Financial Holding Co., Ltd. | | | 13,871,042 | | | | 9,054 | |
E Ink Holdings, Inc.(3) | | | 4,676,000 | | | | 2,784 | |
Far Eastern New Century Corp. | | | 5,037,105 | | | | 5,554 | |
Hon Hai Precision Industry Co., Ltd. | | | 6,033,534 | | | | 15,488 | |
MediaTek, Inc. | | | 820,794 | | | | 10,147 | |
Taiwan Fertilizer Co., Ltd. | | | 2,438,000 | | | | 5,747 | |
Taiwan Semiconductor Manufacturing Co., Ltd. | | | 6,804,647 | | | | 23,129 | |
| | | | | | | | |
| | | | | | | 71,903 | |
| THAILAND - 2.8% | | | | | | | | |
Advanced Info Service PCL (DR) | | | 554,900 | | | $ | 4,524 | |
Bangkok Bank PCL (DR) | | | 1,562,500 | | | | 9,791 | |
PTT Exploration & Production PCL(4) | | | 136,400 | | | | 713 | |
PTT Exploration & Production PCL (DR) | | | 685,016 | | | | 3,580 | |
| | | | | | | | |
| | | | | | | 18,608 | |
| TURKEY - 2.5% | | | | | | | | |
Emlak Konut Gayrimenkul Yatirim Ortakligi AS | | | 3,404,012 | | | | 4,600 | |
Tekfen Holding AS | | | 896,058 | | | | 2,027 | |
Turkiye Halk Bankasi AS | | | 716,139 | | | | 5,247 | |
Turkiye Sinai Kalkinma Bankasi AS | | | 5,297,725 | | | | 4,695 | |
| | | | | | | | |
| | | | | | | 16,569 | |
| UNITED ARAB EMIRATES - 1.3% | | | | | | | | |
Air Arabia PJSC | | | 9,565,803 | | | | 3,568 | |
Al Noor Hospitals Group plc(3) | | | 396,700 | | | | 5,247 | |
| | | | | | | | |
| | | | | | | 8,815 | |
| UNITED KINGDOM - 0.5% | | | | | | | | |
Antofagasta plc | | | 271,307 | | | | 3,595 | |
| | | | | | | | |
| UNITED STATES - 0.6% | | | | | | | | |
CTC Media, Inc. | | | 344,347 | | | | 3,619 | |
| | | | | | | | |
Total common stocks
(Cost $650,342) | | | | | | | 630,378 | |
| | | | | | | | |
| PREFERRED STOCKS - 1.9% | | | | | | | | |
| | | | | | | | |
| BRAZIL - 1.7% | | | | | | | | |
Cia Energetica de Minas Gerais(5) | | | 589,831 | | | | 5,121 | |
Randon Participacoes S.A.(5) | | | 1,050,524 | | | | 5,868 | |
| | | | | | | | |
| | | | | | | 10,989 | |
| COLOMBIA - 0.2% | | | | | | | | |
Grupo de Inversiones Suramericana S.A.(5) | | | 81,639 | | | | 1,651 | |
| | | | | | | | |
Total preferred stocks
(Cost $13,174) | | | | | | | 12,640 | |
| | | Par
Amount | | | | |
| CONVERTIBLE DEBENTURES - 0.0%† | | | | | | | | |
| | | | | | | | |
| BRAZIL - 0.0%† | | | | | | | | |
PDG Realty S.A. Empreendimentos e Participacoes (0.0%, 9/19/16)(2)(3) | | $ | 372 | | | $ | 5 | |
| | | | | | | | |
Total convertible debentures
(Cost $127) | | | | | | | 5 | |
| | | | | | | | |
SHORT-TERM INVESTMENTS
(CASH EQUIVALENTS) - 4.0% | | | | | | | | |
Repurchase agreement with Fixed Income Clearing Corporation, 0.00%, dated 9/30/13, due 10/1/13, maturity value $26,360
(Cost $26,360)(6) | | | 26,360 | | | | 26,360 | |
| | | | | | | | |
| | | | | | | | |
| | | | | | |
| | | | | Value | |
Total investments - 101.1%
(Cost $690,003) | | | | $ | 669,383 | |
| | | | | | |
Other assets less liabilities - (1.1)% | | | | | (6,992 | ) |
| | | | | | |
| | | | | | |
Total net assets - 100.0%(7) | | | | $ | 662,391 | |
| | | | | | |
| † | Amount rounds to less than 0.1%. |
| (1) | Security was acquired in a private placement. The shares are freely tradable outside the United States where the Fund expects to trade them. |
| | | | | | | | | | | | | | | | |
Security | | Acquisition
Dates | | | Cost | | | Value | | | Percentage
of Total
Net Assets | |
Oil India Ltd. | | | 2/1/2013 | | | $ | 393 | | | $ | 279 | | | | - | %† |
Banco do Brasil S.A. | | | 7/1/2010 | | | | 1,477 | | | | 1,260 | | | | 0.2 | % |
| | † | Amount rounds to less than 0.1%. |
| (2) | Security has been deemed illiquid under procedures established by the board of directors of Artisan Partners Funds, Inc. (“Artisan Funds”). In total, the value of securities deemed illiquid was $1,832, or 0.3% of total net assets. |
| (3) | Non-income producing security. |
| (4) | Valued at a fair value in accordance with procedures established by the board of directors of Artisan Funds. In total, securities valued at a fair value were $1.001, or 0.2% of total net assets. See notes 2(a) and 3 in Notes to Financial Statements for additional information. |
| | | | | | | | | | | | |
Issuer | | Rate | | | Maturity | | | Value | |
U.S. Treasury Bond | | | 3.875 | % | | | 8/15/2040 | | | $ | 26,890 | |
| (7) | Percentages for the various classifications relate to total net assets. |
Company names are as reported by a data service provider and in some cases are translations; a company’s legal name may be different.
(DR) Depositary Receipt, voting rights may vary.
| | | | | | | | |
| PORTFOLIO DIVERSIFICATION - September 30, 2013 | |
Dollar values in thousands | |
| | | Value | | | Percentage
of Total
Net Assets | |
Consumer Discretionary | | $ | 92,713 | | | | 14.1 | % |
Consumer Staples | | | 26,659 | | | | 4.0 | |
Energy | | | 66,744 | | | | 10.0 | |
Financials | | | 150,543 | | | | 22.7 | |
Healthcare | | | 22,991 | | | | 3.5 | |
Industrials | | | 57,105 | | | | 8.6 | |
Information Technology | | | 111,808 | | | | 16.8 | |
Materials | | | 62,639 | | | | 9.5 | |
Telecommunication Services | | | 33,223 | | | | 5.1 | |
Utilities | | | 18,598 | | | | 2.8 | |
Short-term investments | | | 26,360 | | | | 4.0 | |
| | | | | | | | |
Total investments | | $ | 669,383 | | | | 101.1 | % |
| | | | | | | | |
|
| CURRENCY EXPOSURE - September 30, 2013 | |
Dollar values in thousands | |
| | | Value | | | Percentage
of Total
Investments | |
Brazilian real | | $ | 85,789 | | | | 12.8 | % |
British pound | | | 12,777 | | | | 1.9 | |
Chilean peso | | | 8,680 | | | | 1.3 | |
Colombian peso | | | 8,200 | | | | 1.2 | |
Egyptian pound | | | 2,148 | | | | 0.3 | |
Hong Kong dollar | | | 88,629 | | | | 13.2 | |
Indian rupee | | | 43,870 | | | | 6.6 | |
Indonesian rupiah | | | 23,598 | | | | 3.5 | |
Korean won | | | 98,257 | | | | 14.7 | |
Malaysian ringgit | | | 3,300 | | | | 0.5 | |
Mexican peso | | | 33,580 | | | | 5.0 | |
Peruvian nuevo sol | | | 268 | | | | - | (1) |
Philippine peso | | | 3,641 | | | | 0.6 | |
South African rand | | | 28,121 | | | | 4.2 | |
Swedish krona | | | 2,988 | | | | 0.5 | |
Swiss franc | | | 6,049 | | | | 0.9 | |
Taiwan dollar | | | 71,903 | | | | 10.7 | |
Thai baht | | | 18,608 | | | | 2.8 | |
Turkish lira | | | 16,569 | | | | 2.5 | |
U.S. dollar | | | 108,840 | | | | 16.3 | |
UAE dirham | | | 3,568 | | | | 0.5 | |
| | | | | | | | |
Total investments | | $ | 669,383 | | | | 100.0 | % |
| | | | | | | | |
| (1) | Represents less than 0.1% of total investments. |
| | | | | | |
| TOP TEN HOLDINGS - September 30, 2013 | |
Company Name | | Country | | Percentage
of Total
Net Assets | |
Samsung Electronics Co., Ltd. | | Korea | | | 6.7 | % |
Taiwan Semiconductor Manufacturing Co., Ltd. | | Taiwan | | | 3.5 | |
Hon Hai Precision Industry Co., Ltd. | | Taiwan | | | 2.3 | |
Vale S.A. | | Brazil | | | 2.3 | |
Petroleo Brasileiro S.A. | | Brazil | | | 2.1 | |
Kia Motors Corp. | | Korea | | | 2.0 | |
Zhuzhou CSR Times Electric Co., Ltd. | | China | | | 1.9 | |
Lukoil OAO | | Russia | | | 1.8 | |
Shinhan Financial Group Co., Ltd. | | Korea | | | 1.8 | |
Hypermarcas S.A. | | Brazil | | | 1.7 | |
| | | | | | |
Total | | | | | 26.1 | % |
| | | | | | |
For the purpose of determining the Fund’s top ten holdings, securities of the same issuer are aggregated to determine the weight in the Fund.
The accompanying notes are an integral part of the financial statements.
ARTISAN GLOBAL EQUITY FUND
Schedule of Investments – September 30, 2013
Dollar values in thousands
| | | | | | | | |
| | | Shares
Held | | | Value | |
| COMMON STOCKS AND EQUITY-LINKED SECURITIES - 97.8% | | | | | | | | |
| | | | | | | | |
| AUSTRALIA - 1.0% | | | | | | | | |
Tox Free Solutions Ltd. | | | 490,052 | | | $ | 1,490 | |
| | | | | | | | |
| BELGIUM - 1.1% | | | | | | | | |
Anheuser-Busch InBev N.V. | | | 16,826 | | | | 1,675 | |
| | | | | | | | |
| BRAZIL - 0.8% | | | | | | | | |
International Meal Co. Holdings S.A.(1) | | | 142,800 | | | | 1,289 | |
| | | | | | | | |
| CAMBODIA - 2.1% | | | | | | | | |
NagaCorp Ltd. | | | 3,964,000 | | | | 3,348 | |
| | | | | | | | |
| CANADA - 1.1% | | | | | | | | |
CAE, Inc. | | | 153,851 | | | | 1,685 | |
| | | | | | | | |
| CHINA - 8.5% | | | | | | | | |
21Vianet Group, Inc. (DR)(1) | | | 124,662 | | | | 2,056 | |
Beijing Enterprises Water Group Ltd. | | | 4,746,000 | | | | 1,970 | |
China Everbright International Ltd. | | | 1,614,000 | | | | 1,426 | |
China Oil & Gas Group Ltd. | | | 19,638,000 | | | | 2,785 | |
Dukang Distillers Holdings Ltd.(1) | | | 6,124,261 | | | | 2,294 | |
Labixiaoxin Snacks Group Ltd. | | | 5,456,557 | | | | 2,772 | |
| | | | | | | | |
| | | | | | | 13,303 | |
| FINLAND - 1.0% | | | | | | | | |
Huhtamaki Oyj | | | 72,426 | | | | 1,552 | |
| | | | | | | | |
| FRANCE - 2.2% | | | | | | | | |
Eurofins Scientific | | | 7,352 | | | | 1,853 | |
Naturex | | | 19,615 | | | | 1,578 | |
| | | | | | | | |
| | | | | | | 3,431 | |
| GERMANY - 5.4% | | | | | | | | |
Draegerwerk AG & Co. KGaA | | | 6,642 | | | | 697 | |
Linde AG | | | 11,679 | | | | 2,313 | |
MTU Aero Engines AG | | | 15,378 | | | | 1,437 | |
Sky Deutschland AG(1) | | | 168,239 | | | | 1,550 | |
Wirecard AG | | | 70,699 | | | | 2,418 | |
| | | | | | | | |
| | | | | | | 8,415 | |
| HONG KONG - 3.9% | | | | | | | | |
AIA Group Ltd. | | | 731,395 | | | | 3,437 | |
Sands China Ltd. | | | 98,400 | | | | 609 | |
SPT Energy Group, Inc. | | | 4,142,000 | | | | 2,099 | |
| | | | | | | | |
| | | | | | | 6,145 | |
| INDIA - 0.9% | | | | | | | | |
Kaveri Seed Co., Ltd., Equity-Linked Security, 144A(2)(3)(4)(5) | | | 61,386 | | | $ | 1,412 | |
| | | | | | | | |
| INDONESIA - 3.2% | | | | | | | | |
Bank Rakyat Indonesia Persero Tbk PT | | | 2,428,500 | | | | 1,521 | |
Global Mediacom Tbk PT | | | 16,361,500 | | | | 2,727 | |
MNC Sky Vision Tbk PT(1) | | | 5,100,354 | | | | 788 | |
| | | | | | | | |
| | | | | | | 5,036 | |
| IRELAND - 1.1% | | | | | | | | |
Glanbia plc | | | 135,590 | | | | 1,776 | |
| | | | | | | | |
| JAPAN - 1.6% | | | | | | | | |
Sugi Holdings Co., Ltd. | | | 48,700 | | | | 2,086 | |
Toyota Motor Corp. | | | 6,000 | | | | 383 | |
| | | | | | | | |
| | | | | | | 2,469 | |
| KOREA - 0.2% | | | | | | | | |
Hyundai Development Co.-Engineering & Construction | | | 14,010 | | | | 313 | |
| | | | | | | | |
| NETHERLANDS - 1.1% | | | | | | | | |
Unilever N.V. (DR) | | | 45,938 | | | | 1,787 | |
| | | | | | | | |
| NIGERIA - 2.4% | | | | | | | | |
Dangote Cement plc | | | 3,128,718 | | | | 3,686 | |
| | | | | | | | |
| PHILIPPINES - 5.0% | | | | | | | | |
ABS-CBN Holdings Corp. (DR) | | | 4,112,424 | | | | 3,306 | |
LT Group, Inc. | | | 10,903,600 | | | | 4,507 | |
| | | | | | | | |
| | | | | | | 7,813 | |
| SWITZERLAND - 6.9% | | | | | | | | |
AFG Arbonia-Forster Holding AG(1) | | | 48,479 | | | | 1,654 | |
Nestle S.A. | | | 38,514 | | | | 2,693 | |
Tecan Group AG | | | 21,346 | | | | 2,254 | |
UBS AG | | | 202,269 | | | | 4,138 | |
| | | | | | | | |
| | | | | | | 10,739 | |
| UNITED KINGDOM - 6.6% | | | | | | | | |
AZ Electronic Materials S.A. | | | 310,538 | | | | 1,483 | |
Intertek Group plc | | | 29,190 | | | | 1,562 | |
Rolls-Royce Holdings plc | | | 43,570 | | | | 784 | |
SABMiller plc | | | 66,206 | | | | 3,369 | |
Synergy Health plc | | | 175,980 | | | | 3,123 | |
| | | | | | | | |
| | | | | | | 10,321 | |
| | | | | | | | |
| | | Shares
Held | | | Value | |
| UNITED STATES - 41.7% | | | | | | | | |
American Express Co. | | | 54,637 | | | $ | 4,126 | |
Ariad Pharmaceuticals, Inc.(1) | | | 254,270 | | | | 4,679 | |
B/E Aerospace, Inc.(1) | | | 48,789 | | | | 3,602 | |
Comcast Corp., Class A | | | 123,954 | | | | 5,596 | |
Dollar Tree, Inc.(1) | | | 60,741 | | | | 3,472 | |
EVERTEC, Inc. | | | 65,305 | | | | 1,450 | |
Gilead Sciences, Inc.(1) | | | 83,719 | | | | 5,261 | |
Google, Inc., Class A(1) | | | 3,859 | | | | 3,380 | |
Interpublic Group of Cos., Inc. | | | 178,936 | | | | 3,074 | |
Marsh & McLennan Cos., Inc. | | | 76,262 | | | | 3,321 | |
Mastercard, Inc., Class A | | | 5,012 | | | | 3,372 | |
Medivation, Inc.(1) | | | 12,559 | | | | 753 | |
Michael Kors Holdings Ltd.(1) | | | 66,648 | | | | 4,967 | |
PetSmart, Inc. | | | 56,659 | | | | 4,321 | |
Premier, Inc., Class A(1) | | | 55,911 | | | | 1,772 | |
TJX Cos., Inc. | | | 82,099 | | | | 4,630 | |
Walt Disney Co. | | | 37,222 | | | | 2,400 | |
Wesco Aircraft Holdings, Inc.(1) | | | 74,570 | | | | 1,561 | |
Yum! Brands, Inc. | | | 45,849 | | | | 3,273 | |
| | | | | | | | |
| | | | | | | 65,010 | |
| | | | | | | | |
Total common stocks and equity-linked securities
(Cost $144,684) | | | | | | | 152,695 | |
| | | Par
Amount | | | | |
SHORT-TERM INVESTMENTS
(CASH EQUIVALENTS) - 1.2% | | | | | | | | |
Repurchase agreement with Fixed Income Clearing Corporation, 0.00%, dated 9/30/13, due 10/1/13, maturity value $1,896
(Cost $1,896)(6) | | $ | 1,896 | | | $ | 1,896 | |
| | | | | | | | |
| | | | | | | | |
Total investments - 99.0%
(Cost $146,580) | | | | | | | 154,591 | |
| | | | | | | | |
Other assets less liabilities - 1.0% | | | | | | | 1,500 | |
| | | | | | | | |
| | | | | | | | |
Total net assets - 100.0%(7) | | | | | | $ | 156,091 | |
| | | | | | | | |
| (1) | Non-income producing security. |
| (2) | Valued at a fair value in accordance with procedures established by the board of directors of Artisan Funds. In total, securities valued at a fair value were $1,412, or 0.9% of total net assets. See notes 2(a) and 3 in Notes to Financial Statements for additional information. |
| (3) | Security is an equity-linked participation certificate issued by HSBC Bank plc. As described in note 2(g) in Notes to Financial Statements, equity-linked participation certificates are subject to counterparty risk with respect to the bank or broker-dealer that issues them. |
| (5) | Security is restricted. Kaveri Seed Co., Ltd. was acquired in a transaction under Rule 144A of the Securities Act of 1933, as amended. The shares of Kaveri Seed Co., Ltd. may be resold in transactions exempt from registration to qualified institutional buyers. |
| | | | | | | | | | | | | | | | |
Security | | Acquisition
Dates | | | Cost | | | Value | | | Percentage
of Total
Net Assets | |
Kaveri Seed Co., Ltd. | |
| 8/14/13-
9/11/13 |
| | $ | 1,499 | | | $ | 1,412 | | | | 0.5 | % |
| | | | | | | | | | | | |
Issuer | | Rate | | | Maturity | | | Value | |
U.S. Treasury Bond | | | 4.625 | % | | | 2/15/2040 | | | $ | 1,937 | |
| (7) | Percentages for the various classifications relate to total net assets. |
Company names are as reported by a data service provider and in some cases are translations; a company’s legal name may be different.
(DR) Depositary Receipt, voting rights may vary.
| | | | | | | | |
| PORTFOLIO DIVERSIFICATION - September 30, 2013 | |
Dollar values in thousands | | | | | | | | |
| | | Value | | | Percentage
of Total
Net Assets | |
Consumer Discretionary | | $ | 45,733 | | | | 29.3 | % |
Consumer Staples | | | 25,949 | | | | 16.6 | |
Energy | | | 2,099 | | | | 1.3 | |
Financials | | | 16,543 | | | | 10.6 | |
Healthcare | | | 20,392 | | | | 13.0 | |
Industrials | | | 15,514 | | | | 10.0 | |
Information Technology | | | 12,676 | | | | 8.2 | |
Materials | | | 9,034 | | | | 5.8 | |
Utilities | | | 4,755 | | | | 3.0 | |
Short-term investments | | | 1,896 | | | | 1.2 | |
| | | | | | | | |
Total investments | | $ | 154,591 | | | | 99.0 | % |
| | | | | | | | |
| | | | | | | | |
| CURRENCY EXPOSURE - September 30, 2013 | |
Dollar values in thousands | | | | | | | | |
| | | Value | | | Percentage
of Total
Investments | |
Australian dollar | | $ | 1,490 | | | | 1.0 | % |
Brazilian real | | | 1,289 | | | | 0.8 | |
British pound | | | 10,321 | | | | 6.7 | |
Canadian dollar | | | 1,685 | | | | 1.1 | |
Euro | | | 18,636 | | | | 12.1 | |
Hong Kong dollar | | | 18,446 | | | | 11.9 | |
Indonesian rupiah | | | 5,036 | | | | 3.3 | |
Japanese yen | | | 2,469 | | | | 1.6 | |
Korean won | | | 313 | | | | 0.2 | |
Nigerian naira | | | 3,686 | | | | 2.4 | |
Philippine peso | | | 7,813 | | | | 5.0 | |
Singapore dollar | | | 2,294 | | | | 1.5 | |
Swiss franc | | | 10,739 | | | | 6.9 | |
U.S. dollar | | | 70,374 | | | | 45.5 | |
| | | | | | | | |
Total investments | | $ | 154,591 | | | | 100.0 | % |
| | | | | | | | |
| | | | | | |
| TOP TEN HOLDINGS - September 30, 2013 | |
Company Name | | Country | | Percentage
of Total
Net Assets | |
Comcast Corp. | | United States | | | 3.6 | % |
Gilead Sciences, Inc. | | United States | | | 3.4 | |
Michael Kors Holdings Ltd. | | United States | | | 3.2 | |
Ariad Pharmaceuticals, Inc. | | United States | | | 3.0 | |
TJX Cos., Inc. | | United States | | | 3.0 | |
LT Group, Inc. | | Philippines | | | 2.9 | |
PetSmart, Inc. | | United States | | | 2.8 | |
UBS AG | | Switzerland | | | 2.6 | |
American Express Co. | | United States | | | 2.6 | |
Dangote Cement plc | | Nigeria | | | 2.3 | |
| | | | | | |
Total | | | | | 29.4 | % |
| | | | | | |
For the purpose of determining the Fund’s top ten holdings, securities of the same issuer are aggregated to determine the weight in the Fund.
The accompanying notes are an integral part of the financial statements.
ARTISAN GLOBAL OPPORTUNITIES FUND
Schedule of Investments – September 30, 2013
Dollar values in thousands
| | | | | | | | |
| | | Shares
Held | | | Value | |
| COMMON STOCKS - 96.1% | | | | | | | | |
| | | | | | | | |
| AUSTRALIA - 1.1% | | | | | | | | |
James Hardie Industries plc (DR) | | | 797,162 | | | $ | 7,942 | |
| | | | | | | | |
| BRAZIL - 2.3% | | | | | | | | |
Anhanguera Educacional Participacoes S.A. | | | 891,188 | | | | 5,332 | |
BR Malls Participacoes S.A. | | | 602,600 | | | | 5,465 | |
Raia Drogasil S.A. | | | 791,000 | | | | 6,542 | |
| | | | | | | | |
| | | | | | | 17,339 | |
| CANADA - 1.5% | | | | | | | | |
Tourmaline Oil Corp.(1) | | | 281,128 | | | | 11,422 | |
| | | | | | | | |
| CHINA - 2.7% | | | | | | | | |
Baidu, Inc. (DR)(1) | | | 37,500 | | | | 5,819 | |
Great Wall Motor Co., Ltd., Class H | | | 2,046,400 | | | | 11,082 | |
Tsingtao Brewery Co., Ltd., Class H | | | 465,929 | | | | 3,553 | |
| | | | | | | | |
| | | | | | | 20,454 | |
| DENMARK - 0.7% | | | | | | | | |
SAP AG (DR) | | | 75,266 | | | | 5,564 | |
| | | | | | | | |
| FRANCE - 5.0% | | | | | | | | |
Eurofins Scientific | | | 39,500 | | | | 9,956 | |
Ingenico | | | 103,634 | | | | 7,471 | |
Sanofi | | | 195,980 | | | | 19,877 | |
| | | | | | | | |
| | | | | | | 37,304 | |
| GERMANY - 1.2% | | | | | | | | |
Adidas AG | | | 85,700 | | | | 9,296 | |
| | | | | | | | |
| HONG KONG - 1.2% | | | | | | | | |
Hong Kong Exchanges and Clearing Ltd. | | | 568,877 | | | | 9,125 | |
| | | | | | | | |
| JAPAN - 6.1% | | | | | | | | |
FANUC Corp. | | | 134,702 | | | | 22,214 | |
Rakuten, Inc. | | | 747,800 | | | | 11,297 | |
Yahoo Japan Corp. | | | 2,220,000 | | | | 12,580 | |
| | | | | | | | |
| | | | | | | 46,091 | |
| MEXICO - 1.6% | | | | | | | | |
Infraestructura Energetica Nova S.A.B. de C.V.(1) | | | 855,558 | | | | 3,307 | |
TF Administradora Industrial S de RL de C.V. | | | 4,527,662 | | | | 8,993 | |
| | | | | | | | |
| | | | | | | 12,300 | |
| PORTUGAL - 1.4% | | | | | | | | |
Jeronimo Martins SGPS S.A. | | | 498,900 | | | | 10,246 | |
| | | | | | | | |
| SWEDEN - 5.8% | | | | | | | | |
Hexagon AB, Class B | | | 1,145,082 | | | $ | 34,530 | |
Volvo AB, Class B | | | 620,500 | | | | 9,293 | |
| | | | | | | | |
| | | | | | | 43,823 | |
| TAIWAN - 1.5% | | | | | | | | |
MediaTek, Inc. | | | 907,600 | | | | 11,220 | |
| | | | | | | | |
| UNITED KINGDOM - 9.5% | | | | | | | | |
ARM Holdings plc | | | 963,436 | | | | 15,379 | |
Direct Line Insurance Group plc | | | 3,588,481 | | | | 12,386 | |
Intertek Group plc | | | 267,178 | | | | 14,295 | |
Rotork plc | | | 392,923 | | | | 17,346 | |
Standard Chartered plc | | | 492,631 | | | | 11,811 | |
| | | | | | | | |
| | | | | | | 71,217 | |
| UNITED STATES - 54.5% | | | | | | | | |
Amazon.com, Inc.(1) | | | 52,100 | | | | 16,288 | |
Anadarko Petroleum Corp. | | | 199,200 | | | | 18,524 | |
Applied Materials, Inc. | | | 1,245,800 | | | | 21,851 | |
Biogen Idec, Inc.(1) | | | 81,092 | | | | 19,524 | |
Bristol-Myers Squibb Co. | | | 83,900 | | | | 3,883 | |
Cerner Corp.(1) | | | 345,209 | | | | 18,141 | |
Citigroup, Inc. | | | 546,400 | | | | 26,506 | |
Discover Financial Services | | | 605,285 | | | | 30,591 | |
eBay, Inc.(1) | | | 545,093 | | | | 30,411 | |
EQT Corp. | | | 40,800 | | | | 3,620 | |
Facebook, Inc., Class A(1) | | | 290,213 | | | | 14,580 | |
Gilead Sciences, Inc.(1) | | | 425,400 | �� | | | 26,732 | |
Google, Inc., Class A(1) | | | 47,812 | | | | 41,879 | |
IHS, Inc., Class A(1) | | | 268,357 | | | | 30,641 | |
Monsanto Co. | | | 179,566 | | | | 18,741 | |
Ralph Lauren Corp. | | | 72,834 | | | | 11,998 | |
Regeneron Pharmaceuticals, Inc.(1) | | | 161,961 | | | | 50,673 | |
Salesforce.com, Inc.(1) | | | 237,828 | | | | 12,346 | |
Starbucks Corp. | | | 184,790 | | | | 14,223 | |
| | | | | | | | |
| | | | | | | 411,152 | |
| | | | | | | | |
Total common stocks
(Cost $582,239) | | | | | | | 724,495 | |
| | | | | | | | |
| | | Par
Amount | | | Value | |
SHORT-TERM INVESTMENTS
(CASH EQUIVALENTS) - 4.1% | | | | | | | | |
Repurchase agreement with Fixed Income Clearing Corporation, 0.00%, dated 9/30/13, due 10/1/13, maturity value $31,256
(Cost $31,256)(2) | | $ | 31,256 | | | $ | 31,256 | |
| | | | | | | | |
| | | | | | | | |
Total investments - 100.2%
(Cost $613,495) | | | | | | | 755,751 | |
| | | | | | | | |
Other assets less liabilities - (0.2)% | | | | | | | (1,602 | ) |
| | | | | | | | |
| | | | | | | | |
Total net assets - 100.0%(3) | | | | | | $ | 754,149 | |
| | | | | | | | |
| (1) | Non-income producing security. |
| | | | | | | | | | | | |
Issuer | | Rate | | | Maturity | | | Value | |
U.S. Treasury Note | | | 0.875 | % | | | 1/31/2018 | | | $ | 31,882 | |
| (3) | Percentages for the various classifications relate to total net assets. |
Company names are as reported by a data service provider and in some cases are translations; a company’s legal name may be different.
(DR) Depositary Receipt, voting rights may vary.
| | | | | | | | |
| PORTFOLIO DIVERSIFICATION - September 30, 2013 | |
Dollar values in thousands | |
| | | Value | | | Percentage
of Total
Net Assets | |
Consumer Discretionary | | $ | 79,516 | | | | 10.5 | % |
Consumer Staples | | | 20,341 | | | | 2.8 | |
Energy | | | 33,566 | | | | 4.5 | |
Financials | | | 104,877 | | | | 14.0 | |
Healthcare | | | 148,786 | | | | 19.7 | |
Industrials | | | 93,789 | | | | 12.4 | |
Information Technology | | | 213,630 | | | | 28.2 | |
Materials | | | 26,683 | | | | 3.6 | |
Utilities | | | 3,307 | | | | 0.4 | |
Short-term investments | | | 31,256 | | | | 4.1 | |
| | | | | | | | |
Total investments | | $ | 755,751 | | | | 100.2 | % |
| | | | | | | | |
| | | | | | | | |
| CURRENCY EXPOSURE - September 30, 2013 | |
Dollar values in thousands | |
| | | Value | | | Percentage
of Total
Investments | |
Australian dollar | | $ | 7,942 | | | | 1.1 | % |
Brazilian real | | | 17,339 | | | | 2.3 | |
British pound | | | 71,217 | | | | 9.4 | |
Canadian dollar | | | 11,422 | | | | 1.5 | |
Euro | | | 56,846 | | | | 7.5 | |
Hong Kong dollar | | | 23,760 | | | | 3.1 | |
Japanese yen | | | 46,091 | * | | | 6.1 | |
Mexican peso | | | 12,300 | | | | 1.6 | |
Swedish krona | | | 43,823 | | | | 5.8 | |
Taiwan dollar | | | 11,220 | | | | 1.5 | |
U.S. dollar | | | 453,791 | | | | 60.1 | |
| | | | | | | | |
Total investments | | $ | 755,751 | | | | 100.0 | % |
| | | | | | | | |
| * | Currency exposure is offset by foreign currency forward contracts noted in the table below: |
| | | | | | | | | | | | | | | | | | | | |
Counterparty | | Contract
Settlement
Date | | Contract Amount | | | Unrealized
Appreciation/
(Depreciation) | |
| | | Deliver | | | Receive | | |
| State Street Bank and Trust Company | | 2/14/2014 | | JPY | | | 1,947,808 | | | | USD | | | | 19,858 | | | $ | 23 | |
| State Street Bank and Trust Company | | 2/14/2014 | | JPY | | | 253,105 | | | | USD | | | | 2,534 | | | | (44 | ) |
| | | | | | | | | | | | | |
| | | | | | | | | | | | | | | | | | $ | (21 | ) |
| | | | | | | | | | | | | |
JPY - Japanese Yen
USD - U.S. Dollar
| | | | | | |
| TOP TEN HOLDINGS - September 30, 2013 | |
Company Name | | Country | | Percentage
of Total
Net Assets | |
Regeneron Pharmaceuticals, Inc. | | United States | | | 6.7 | % |
Google, Inc. | | United States | | | 5.5 | |
Hexagon AB | | Sweden | | | 4.6 | |
IHS, Inc. | | United States | | | 4.1 | |
Discover Financial Services | | United States | | | 4.1 | |
eBay, Inc. | | United States | | | 4.0 | |
Gilead Sciences, Inc. | | United States | | | 3.5 | |
Citigroup, Inc. | | United States | | | 3.5 | |
FANUC Corp. | | Japan | | | 2.9 | |
Applied Materials, Inc. | | United States | | | 2.9 | |
| | | | | | |
Total | | | | | 41.8 | % |
| | | | | | |
For the purpose of determining the Fund’s top ten holdings, securities of the same issuer are aggregated to determine the weight in the Fund.
The accompanying notes are an integral part of the financial statements.
ARTISAN GLOBAL SMALL CAP FUND
Schedule of Investments – September 30, 2013
Dollar values in thousands
| | | | | | | | |
| | | Shares
Held | | | Value | |
| COMMON STOCKS AND EQUITY-LINKED SECURITIES - 98.2% | | | | | | | | |
| | | | | | | | |
| AUSTRALIA - 2.3% | | | | | | | | |
Tox Free Solutions Ltd. | | | 301,878 | | | $ | 918 | |
| | | | | | | | |
| BELGIUM - 1.1% | | | | | | | | |
Warehouses De Pauw SCA | | | 5,960 | | | | 418 | |
| | | | | | | | |
| CAMBODIA - 3.4% | | | | | | | | |
NagaCorp Ltd. | | | 1,578,000 | | | | 1,333 | |
| | | | | | | | |
| CANADA - 2.1% | | | | | | | | |
Westport Innovations, Inc.(1) | | | 34,787 | | | | 841 | |
| | | | | | | | |
| CHINA - 9.8% | | | | | | | | |
Biostime International Holdings Ltd. | | | 119,000 | | | | 900 | |
China Oil & Gas Group Ltd. | | | 9,480,000 | | | | 1,345 | |
Dukang Distillers Holdings Ltd.(1) | | | 1,458,000 | | | | 546 | |
Labixiaoxin Snacks Group Ltd. | | | 2,152,000 | | | | 1,093 | |
| | | | | | | | |
| | | | | | | 3,884 | |
| FINLAND - 3.9% | | | | | | | | |
Huhtamaki Oyj | | | 72,732 | | | | 1,559 | |
| | | | | | | | |
| FRANCE - 2.7% | | | | | | | | |
Naturex | | | 13,132 | | | | 1,057 | |
| | | | | | | | |
| GERMANY - 3.7% | | | | | | | | |
Draegerwerk AG & Co. KGaA | | | 2,154 | | | | 226 | |
Sky Deutschland AG(1) | | | 42,339 | | | | 390 | |
Stroeer Media AG(1) | | | 53,598 | | | | 863 | |
| | | | | | | | |
| | | | | | | 1,479 | |
| HONG KONG - 2.4% | | | | | | | | |
SPT Energy Group, Inc. | | | 1,904,000 | | | | 965 | |
| | | | | | | | |
| INDIA - 2.8% | | | | | | | | |
Kaveri Seed Co., Ltd., Equity-Linked Security, 144A(2)(3)(4)(5) | | | 48,933 | | | | 1,125 | |
| | | | | | | | |
| INDONESIA - 3.9% | | | | | | | | |
Global Mediacom Tbk PT | | | 5,991,500 | | | | 998 | |
MNC Sky Vision Tbk PT(1) | | | 3,512,500 | | | | 543 | |
| | | | | | | | |
| | | | | | | 1,541 | |
| JAPAN - 5.8% | | | | | | | | |
Don Quijote Co., Ltd. | | | 18,900 | | | | 1,183 | |
Sugi Holdings Co., Ltd. | | | 26,200 | | | | 1,122 | |
| | | | | | | | |
| | | | | | | 2,305 | |
| MALAYSIA - 4.7% | | | | | | | | |
JobStreet Corp. Bhd | | | 783,800 | | | $ | 551 | |
Oldtown Bhd | | | 1,071,400 | | | | 887 | |
Power Root Bhd | | | 734,500 | | | | 439 | |
| | | | | | | | |
| | | | | | | 1,877 | |
| NETHERLANDS - 3.3% | | | | | | | | |
Brunel International N.V. | | | 23,984 | | | | 1,290 | |
| | | | | | | | |
| PORTUGAL - 3.1% | | | | | | | | |
ZON OPTIMUS SGPS S.A. | | | 204,517 | | | | 1,217 | |
| | | | | | | | |
| SINGAPORE - 4.8% | | | | | | | | |
Overseas Education Ltd. | | | 1,632,000 | | | | 976 | |
Sarin Technologies Ltd. | | | 742,000 | | | | 931 | |
| | | | | | | | |
| | | | | | | 1,907 | |
| SWITZERLAND - 2.0% | | | | | | | | |
Tecan Group AG | | | 7,417 | | | | 783 | |
| | | | | | | | |
| THAILAND - 0.2% | | | | | | | | |
Big C Supercenter PCL (DR) | | | 11,100 | | | | 71 | |
| | | | | | | | |
| UNITED KINGDOM - 12.0% | | | | | | | | |
AZ Electronic Materials S.A. | | | 186,521 | | | | 891 | |
N Brown Group plc | | | 150,765 | | | | 1,281 | |
Synergy Health plc | | | 57,895 | | | | 1,027 | |
Victrex plc | | | 59,235 | | | | 1,532 | |
| | | | | | | | |
| | | | | | | 4,731 | |
| UNITED STATES - 24.2% | | | | | | | | |
Ariad Pharmaceuticals, Inc.(1) | | | 58,226 | | | | 1,072 | |
First Republic Bank | | | 12,743 | | | | 594 | |
Gilead Sciences, Inc.(1) | | | 5,241 | | | | 329 | |
Interpublic Group of Cos., Inc. | | | 70,309 | | | | 1,208 | |
PerkinElmer, Inc. | | | 30,698 | | | | 1,159 | |
PetSmart, Inc. | | | 19,553 | | | | 1,491 | |
Premier, Inc., Class A(1) | | | 14,089 | | | | 447 | |
Vitamin Shoppe, Inc.(1) | | | 21,722 | | | | 950 | |
Wesco Aircraft Holdings, Inc.(1) | | | 76,985 | | | | 1,611 | |
YuMe, Inc.(1) | | | 67,536 | | | | 716 | |
| | | | | | | | |
| | | | | | | 9,577 | |
| | | | | | | | |
Total common stocks and equity-linked securities
(Cost $38,112) | | | | | | | 38,878 | |
| | | | | | | | |
| | |
| | | Par
Amount | | | Value | |
SHORT-TERM INVESTMENTS
(CASH EQUIVALENTS) - 3.6% | | | | | | | | |
Repurchase agreement with Fixed Income
Clearing Corporation, 0.00%, dated 9/30/13, due 10/1/13, maturity value $1,415
(Cost $1,415)(6) | | $ | 1,415 | | | $ | 1,415 | |
| | | | | | | | |
| | | | | | | | |
Total investments - 101.8%
(Cost $39,527) | | | | | | | 40,293 | |
| | | | | | | | |
Other assets less liabilities - (1.8)% | | | | | | | (715 | ) |
| | | | | | | | |
| | | | | | | | |
Total net assets - 100.0%(7) | | | | | | $ | 39,578 | |
| | | | | | | | |
| (1) | Non-income producing security. |
| (2) | Valued at a fair value in accordance with procedures established by the board of directors of Artisan Funds. In total, securities valued at a fair value were $1,125, or 2.8% of total net assets. See notes 2(a) and 3 in Notes to Financial Statements for additional information. |
| (3) | Security is an equity-linked participation certificate issued by HSBC Bank plc. As described in note 2(g) in Notes to Financial Statements, equity-linked participation certificates are subject to counterparty risk with respect to the bank or broker-dealer that issues them. |
| (5) | Security is restricted. Kaveri Seed Co., Ltd. was acquired in a transaction under Rule 144A of the Securities Act of 1933, as amended. The shares of Kaveri Seed Co., Ltd. may be resold in transactions exempt from registration to qualified institutional buyers. |
| | | | | | | | | | | | | | | | |
Security | | Acquisition
Dates | | | Cost | | | Value | | | Percentage
of Total
Net Assets | |
Kaveri Seed Co., Ltd. | |
| 6/26/13-
9/30/13 |
| | $ | 1,249 | | | $ | 1,125 | | | | 2.8 | % |
| | | | | | | | | | | | |
Issuer | | Rate | | | Maturity | | | Value | |
U.S. Treasury Bond | | | 2.750 | % | | | 11/15/2042 | | | $ | 1,445 | |
| (7) | Percentages for the various classifications relate to total net assets. |
Company names are as reported by a data service provider and in some cases are translations; a company’s legal name may be different.
(DR) Depositary Receipt, voting rights may vary.
| | | | | | | | |
| PORTFOLIO DIVERSIFICATION - September 30, 2013 | |
Dollar values in thousands | | | | | | | | |
| | | Value | | | Percentage
of Total
Net Assets | |
Consumer Discretionary | | $ | 12,433 | | | | 31.6 | % |
Consumer Staples | | | 7,240 | | | | 18.2 | |
Energy | | | 965 | | | | 2.4 | |
Financials | | | 1,012 | | | | 2.6 | |
Healthcare | | | 5,043 | | | | 12.6 | |
Industrials | | | 6,142 | | | | 15.5 | |
Information Technology | | | 716 | | | | 1.8 | |
Materials | | | 3,982 | | | | 10.1 | |
Utilities | | | 1,345 | | | | 3.4 | |
Short-term investments | | | 1,415 | | | | 3.6 | |
| | | | | | | | |
Total investments | | $ | 40,293 | | | | 101.8 | % |
| | | | | | | | |
| | | | | | | | |
| CURRENCY EXPOSURE - September 30, 2013 | |
Dollar values in thousands | | | | | | | | |
| | | Value | | | Percentage
of Total
Investments | |
Australian dollar | | $ | 918 | | | | 2.3 | % |
British pound | | | 4,731 | | | | 11.7 | |
Euro | | | 7,020 | | | | 17.4 | |
Hong Kong dollar | | | 5,636 | | | | 14.0 | |
Indonesian rupiah | | | 1,541 | | | | 3.8 | |
Japanese yen | | | 2,305 | | | | 5.7 | |
Malaysian ringgit | | | 1,877 | | | | 4.7 | |
Singapore dollar | | | 2,453 | | | | 6.1 | |
Swiss franc | | | 783 | | | | 1.9 | |
Thai baht | | | 71 | | | | 0.2 | |
U.S. dollar | | | 12,958 | | | | 32.2 | |
| | | | | | | | |
Total investments | | $ | 40,293 | | | | 100.0 | % |
| | | | | | | | |
| | | | | | |
| TOP TEN HOLDINGS - September 30, 2013 | |
Company Name | | Country | | Percentage
of Total
Net Assets | |
Wesco Aircraft Holdings, Inc. | | United States | | | 4.1 | % |
Huhtamaki Oyj | | Finland | | | 3.9 | |
Victrex plc | | United Kingdom | | | 3.9 | |
PetSmart, Inc. | | United States | | | 3.8 | |
China Oil & Gas Group Ltd. | | China | | | 3.4 | |
NagaCorp Ltd. | | Cambodia | | | 3.4 | |
Brunel International N.V. | | Netherlands | | | 3.2 | |
N Brown Group plc | | United Kingdom | | | 3.2 | |
ZON OPTIMUS SGPS S.A. | | Portugal | | | 3.1 | |
Interpublic Group of Cos., Inc. | | United States | | | 3.0 | |
| | | | | | |
Total | | | | | 35.0 | % |
| | | | | | |
For the purpose of determining the Fund’s top ten holdings, securities of the same issuer are aggregated to determine the weight in the Fund.
The accompanying notes are an integral part of the financial statements.
ARTISAN GLOBAL VALUE FUND
Schedule of Investments – September 30, 2013
Dollar values in thousands
| | | | | | | | |
| | | Shares
Held | | | Value | |
| COMMON STOCKS - 88.6% | | | | | | | | |
| | | | | | | | |
| BELGIUM - 1.9% | | | | | | | | |
Groupe Bruxelles Lambert S.A. | | | 252,383 | | | $ | 21,466 | |
| | | | | | | | |
| CANADA - 2.5% | | | | | | | | |
Imperial Oil Ltd. | | | 658,602 | | | | 28,919 | |
| | | | | | | | |
| DENMARK - 0.3% | | | | | | | | |
Carlsberg AS, Class B | | | 33,682 | | | | 3,470 | |
| | | | | | | | |
| FRANCE - 2.0% | | | | | | | | |
Total S.A. | | | 163,509 | | | | 9,489 | |
Vivendi S.A. | | | 593,655 | | | | 13,657 | |
| | | | | | | | |
| | | | | | | 23,146 | |
| INDIA - 0.1% | | | | | | | | |
Coal India Ltd. | | | 162,490 | | | | 763 | |
| | | | | | | | |
| JAPAN - 2.1% | | | | | | | | |
Kao Corp. | | | 642,900 | | | | 20,014 | |
Sankyo Co., Ltd. | | | 79,600 | | | | 3,883 | |
| | | | | | | | |
| | | | | | | 23,897 | |
| KOREA - 1.9% | | | | | | | | |
Kia Motors Corp. | | | 358,811 | | | | 21,802 | |
| | | | | | | | |
| NETHERLANDS - 2.3% | | | | | | | | |
ING Groep N.V. (DR)(1) | | | 1,980,173 | | | | 22,372 | |
TNT Express N.V. | | | 429,425 | | | | 3,920 | |
| | | | | | | | |
| | | | | | | 26,292 | |
| NORWAY - 1.2% | | | | | | | | |
Orkla ASA | | | 1,805,258 | | | | 13,149 | |
| | | | | | | | |
| SWITZERLAND - 5.0% | | | | | | | | |
Adecco S.A. | | | 350,681 | | | | 24,972 | |
Novartis AG | | | 419,450 | | | | 32,235 | |
Pargesa Holding S.A. | | | 7,583 | | | | 569 | |
| | | | | | | | |
| | | | | | | 57,776 | |
| UNITED KINGDOM - 17.9% | | | | | |
AMEC plc | | | 554,473 | | | | 9,641 | |
AstraZeneca plc | | | 372,451 | | | | 19,388 | |
Compass Group plc | | | 2,286,758 | | | | 31,468 | |
Diageo plc | | | 528,114 | | | | 16,800 | |
Direct Line Insurance Group plc | | | 2,060,050 | | | | 7,110 | |
Lloyds Banking Group plc(1) | | | 21,979,901 | | | | 26,182 | |
Royal Bank of Scotland Group plc(1) | | | 4,843,826 | | | | 28,222 | |
TESCO plc | | | 5,435,278 | | | | 31,589 | |
| UNITED KINGDOM (CONTINUED) | | | | | |
Unilever plc (DR) | | | 414,000 | | | $ | 15,972 | |
Vodafone Group plc | | | 5,432,653 | | | | 18,997 | |
| | | | | | | | |
| | | | | | | 205,369 | |
| UNITED STATES - 51.4% | | | | | | | | |
3M Co. | | | 262,699 | | | | 31,369 | |
Accenture plc, Class A | | | 157,224 | | | | 11,578 | |
American Express Co. | | | 378,417 | | | | 28,578 | |
Aon plc | | | 468,529 | | | | 34,877 | |
Apple, Inc. | | | 37,062 | | | | 17,669 | |
Arch Capital Group Ltd.(1)(2) | | | 645,320 | | | | 34,931 | |
Bank of New York Mellon Corp. | | | 1,262,307 | | | | 38,109 | |
Chubb Corp. | | | 244,634 | | | | 21,836 | |
Cisco Systems, Inc. | | | 936,649 | | | | 21,936 | |
Flextronics International Ltd.(1) | | | 1,065,910 | | | | 9,689 | |
Google, Inc., Class A(1) | | | 38,386 | | | | 33,623 | |
Hasbro, Inc. | | | 283,953 | | | | 13,386 | |
Johnson & Johnson | | | 394,456 | | | | 34,195 | |
Marsh & McLennan Cos., Inc. | | | 794,022 | | | | 34,580 | |
Mastercard, Inc., Class A | | | 49,608 | | | | 33,375 | |
Medtronic, Inc. | | | 581,795 | | | | 30,981 | |
Microsoft Corp. | | | 1,060,814 | | | | 35,336 | |
Oracle Corp. | | | 1,546,536 | | | | 51,299 | |
Parker Hannifin Corp. | | | 145,057 | | | | 15,771 | |
Progressive Corp. | | | 769,074 | | | | 20,942 | |
TE Connectivity Ltd. | | | 656,246 | | | | 33,980 | |
| | | | | | | | |
| | | | | | | 588,040 | |
| | | | | | | | |
Total common stocks
(Cost $881,343) | | | | | | | 1,014,089 | |
| | |
| | | Par
Amount | | | | |
SHORT-TERM INVESTMENTS
(CASH EQUIVALENTS) - 11.8% | | | | | | | | |
Repurchase agreement with Fixed Income Clearing Corporation, 0.00%, dated 9/30/13, due 10/1/13, maturity value $135,568
(Cost $135,568)(3) | | $ | 135,568 | | | $ | 135,568 | |
| | | | | | | | |
Total investments - 100.4%
(Cost $1,016,911) | | | | | | | 1,149,657 | |
| | | | | | | | |
Other assets less liabilities - (0.4)% | | | | | | | (4,836 | ) |
| | | | | | | | |
| | | | | | | | |
Total net assets - 100.0%(4) | | | | | | $ | 1,144,821 | |
| | | | | | | | |
| (1) | Non-income producing security. |
| (2) | Affiliated company as defined by the Investment Company Act of 1940, as amended (the “1940 Act”). See note 11 in Notes to Financial Statements for additional information. |
| | | | | | | | | | | | |
Issuer | | Rate | | | Maturity | | | Value | |
U.S. Treasury Note | | | 0.625 | % | | | 8/31/2017 | | | $ | 138,284 | |
| (4) | Percentages for the various classifications relate to total net assets. |
Company names are as reported by a data service provider and in some cases are translations; a company’s legal name may be different.
(DR) Depositary Receipt, voting rights may vary.
| | | | | | | | |
| PORTFOLIO DIVERSIFICATION - September 30, 2013 | |
Dollar values in thousands | |
| | | Value | | | Percentage
of Total
Net Assets | |
Consumer Discretionary | | $ | 70,539 | | | | 6.1 | % |
Consumer Staples | | | 100,994 | | | | 8.9 | |
Energy | | | 48,812 | | | | 4.2 | |
Financials | | | 319,774 | | | | 28.0 | |
Healthcare | | | 116,799 | | | | 10.2 | |
Industrials | | | 76,032 | | | | 6.6 | |
Information Technology | | | 248,485 | | | | 21.7 | |
Telecommunication Services | | | 32,654 | | | | 2.9 | |
Short-term investments | | | 135,568 | | | | 11.8 | |
| | | | | | | | |
Total investments | | $ | 1,149,657 | | | | 100.4 | % |
| | | | | | | | |
| | | | | | | | |
| CURRENCY EXPOSURE - September 30, 2013 | |
Dollar values in thousands | | | | | | | | |
| | | Value | | | Percentage
of Total
Investments | |
British pound | | $ | 189,397 | | | | 16.5 | % |
Canadian dollar | | | 28,919 | | | | 2.5 | |
Danish krone | | | 3,470 | | | | 0.3 | |
Euro | | | 70,904 | | | | 6.2 | |
Indian rupee | | | 763 | | | | 0.1 | |
Japanese yen | | | 23,897 | * | | | 2.1 | |
Korean won | | | 21,802 | | | | 1.9 | |
Norwegian krone | | | 13,149 | | | | 1.1 | |
Swiss franc | | | 57,776 | | | | 5.0 | |
U.S. dollar | | | 739,580 | | | | 64.3 | |
| | | | | | | | |
Total investments | | $ | 1,149,657 | | | | 100.0 | % |
| | | | | | | | |
| * | Currency exposure is offset by foreign currency forward contracts noted in the table below: |
| | | | | | | | | | | | | | | | | | | | |
Counterparty | | Contract Settlement Date | | Contract Amount | | | Unrealized
Appreciation/
(Depreciation) | |
| | | Deliver | | | Receive | | |
| State Street Bank and Trust Company | | 2/14/2014 | | JPY | | | 1,846,410 | | | | USD | | | | 18,824 | | | $ | 22 | |
| State Street Bank and Trust Company | | 2/14/2014 | | JPY | | | 134,479 | | | | USD | | | | 1,365 | | | | (4 | ) |
| State Street Bank and Trust Company | | 2/14/2014 | | JPY | | | 123,763 | | | | USD | | | | 1,247 | | | | (14 | ) |
| State Street Bank and Trust Company | | 2/14/2014 | | USD | | | 1,215 | | | | JPY | | | | 120,380 | | | | 11 | |
| | | | | | | | | | | | | |
| | | | | | | | | | | | | | | | | | $ | 15 | |
| | | | | | | | | | | | | |
JPY - Japanese yen
USD - U.S. dollar
| | | | | | |
| TOP TEN HOLDINGS - September 30, 2013 | |
Company Name | | Country | | Percentage
of Total
Net Assets | |
Oracle Corp. | | United States | | | 4.5 | % |
Bank of New York Mellon Corp. | | United States | | | 3.3 | |
Microsoft Corp. | | United States | | | 3.1 | |
Arch Capital Group Ltd. | | United States | | | 3.1 | |
Aon plc | | United States | | | 3.1 | |
Marsh & McLennan Cos., Inc. | | United States | | | 3.0 | |
Johnson & Johnson | | United States | | | 3.0 | |
TE Connectivity Ltd. | | United States | | | 3.0 | |
Google, Inc. | | United States | | | 2.9 | |
Mastercard, Inc. | | United States | | | 2.9 | |
| | | | | | |
Total | | | | | 31.9 | % |
| | | | | | |
For the purpose of determining the Fund’s top ten holdings, securities of the same issuer are aggregated to determine the weight in the Fund.
The accompanying notes are an integral part of the financial statements.
ARTISAN INTERNATIONAL FUND
Schedule of Investments – September 30, 2013
Dollar values in thousands
| | | | | | | | |
| | | Shares
Held | | | Value | |
| COMMON STOCKS - 96.0% | | | | | | | | |
| | | | | | | | |
| BELGIUM - 4.0% | | | | | | | | |
Anheuser-Busch InBev N.V. | | | 3,389,533 | | | $ | 337,403 | |
Telenet Group Holding N.V. | | | 2,066,243 | | | | 102,882 | |
UCB S.A. | | | 1,601,014 | | | | 97,445 | |
| | | | | | | | |
| | | | | | | 537,730 | |
| BRAZIL - 0.3% | | | | | | | | |
BM&FBovespa S.A. | | | 6,939,100 | | | | 38,761 | |
| | | | | | | | |
| CANADA - 1.2% | | | | | | | | |
Canadian Pacific Railway Ltd. | | | 1,273,856 | | | | 157,066 | |
| | | | | | | | |
| CHINA - 7.6% | | | | | | | | |
Baidu, Inc. (DR)(1) | | | 3,613,714 | | | | 560,776 | |
Beijing Enterprises Holdings Ltd. | | | 22,224,025 | | | | 160,465 | |
China Resources Land Ltd. | | | 47,400,364 | | | | 135,370 | |
Tencent Holdings Ltd. | | | 3,124,037 | | | | 163,857 | |
| | | | | | | | |
| | | | | | | 1,020,468 | |
| DENMARK - 0.3% | | | | | | | | |
Rockwool International AS, Class B | | | 256,871 | | | | 41,607 | |
| | | | | | | | |
| FRANCE - 7.9% | | | | | | | | |
LVMH Moet Hennessy Louis Vuitton S.A. | | | 356,243 | | | | 70,171 | |
Pernod-Ricard S.A. | | | 1,616,778 | | | | 200,769 | |
Sanofi | | | 627,691 | | | | 63,662 | |
Schneider Electric S.A. | | | 3,480,659 | | | | 294,348 | |
Unibail-Rodamco SE | | | 758,429 | | | | 188,176 | |
Zodiac Aerospace | | | 1,548,082 | | | | 246,397 | |
| | | | | | | | |
| | | | | | | 1,063,523 | |
| GERMANY - 18.5% | | | | | | | | |
Allianz SE | | | 837,645 | | | | 131,679 | |
Bayer AG | | | 3,621,877 | | | | 427,072 | |
Beiersdorf AG | | | 2,219,790 | | | | 197,120 | |
Deutsche Post AG | | | 11,187,639 | | | | 371,266 | |
HeidelbergCement AG | | | 2,582,567 | | | | 199,183 | |
Kabel Deutschland Holding AG | | | 1,510,187 | | | | 177,542 | |
Linde AG | | | 2,693,972 | | | | 533,561 | |
MTU Aero Engines AG | | | 1,515,636 | | | | 141,602 | |
Muenchener Rueckversicherungs AG | | | 1,571,472 | | | | 307,096 | |
| | | | | | | | |
| | | | | | | 2,486,121 | |
| HONG KONG - 4.3% | | | | | | | | |
AIA Group Ltd. | | | 91,642,396 | | | | 430,687 | |
Hongkong Land Holdings Ltd. | | | 10,726,724 | | | | 70,796 | |
Sands China Ltd. | | | 11,960,000 | | | | 74,019 | |
| | | | | | | | |
| | | | | | | 575,502 | |
| INDIA - 0.3% | | | | | | | | |
Coal India Ltd. | | | 7,370,351 | | | $ | 34,588 | |
| | | | | | | | |
| INDONESIA - 0.6% | | | | | | | | |
Bank Rakyat Indonesia Persero Tbk PT | | | 127,053,762 | | | | 79,546 | |
| | | | | | | | |
| JAPAN - 11.4% | | | | | | | | |
Honda Motor Co., Ltd. | | | 7,936,843 | | | | 301,583 | |
IHI Corp. | | | 24,638,540 | | | | 103,522 | |
Japan Tobacco, Inc. | | | 10,707,802 | | | | 384,542 | |
NGK Insulators Ltd. | | | 13,578,677 | | | | 205,555 | |
Nissan Motor Co., Ltd. | | | 12,191,118 | | | | 122,041 | |
Ono Pharmaceutical Co., Ltd. | | | 1,111,688 | | | | 68,198 | |
ORIX Corp. | | | 1,353,507 | | | | 21,963 | |
Takeda Pharmaceutical Co., Ltd. | | | 1,385,078 | | | | 65,312 | |
Toyota Motor Corp. | | | 4,111,051 | | | | 262,234 | |
| | | | | | | | |
| | | | | | | 1,534,950 | |
| KOREA - 0.5% | | | | | | | | |
Samsung Electronics Co., Ltd. | | | 56,997 | | | | 72,501 | |
| | | | | | | | |
| MALAYSIA - 0.1% | | | | | | | | |
Astro Malaysia Holdings Bhd | | | 18,196,600 | | | | 16,301 | |
| | | | | | | | |
| NETHERLANDS - 3.8% | | | | | | | | |
Unilever N.V. (DR) | | | 9,917,063 | | | | 385,786 | |
Ziggo N.V. | | | 2,880,454 | | | | 116,671 | |
| | | | | | | | |
| | | | | | | 502,457 | |
| NIGERIA - 0.5% | | | | | | | | |
Nigerian Breweries plc | | | 62,918,225 | | | | 64,371 | |
| | | | | | | | |
| SINGAPORE - 0.5% | | | | | | | | |
Global Logistic Properties Ltd. | | | 29,729,335 | | | | 68,485 | |
| | | | | | | | |
| SPAIN - 0.5% | | | | | | | | |
Grifols S.A. | | | 1,683,592 | | | | 69,127 | |
Grifols S.A., Class B(2) | | | 99,241 | | | | 3,044 | |
| | | | | | | | |
| | | | | | | 72,171 | |
| SWITZERLAND - 11.4% | | | | | | | | |
Actelion Ltd. | | | 417,453 | | | | 29,635 | |
Credit Suisse Group AG | | | 4,710,494 | | | | 143,864 | |
Holcim Ltd. | | | 1,816,386 | | | | 135,172 | |
Nestle S.A. | | | 5,965,694 | | | | 417,239 | |
Novartis AG | | | 856,436 | | | | 65,818 | |
Roche Holding AG(2) | | | 1,433,841 | | | | 386,702 | |
Swatch Group AG | | | 42,008 | | | | 27,035 | |
Swiss Re AG | | | 1,617,312 | | | | 133,770 | |
UBS AG | | | 9,477,437 | | | | 193,877 | |
| | | | | | | | |
| | | | | | | 1,533,112 | |
| | | | | | | | |
| | | Shares
Held | | | Value | |
| UNITED KINGDOM - 16.7% | | | | | | | | |
Diageo plc | | | 2,262,379 | | | $ | 71,969 | |
HSBC Holdings plc | | | 22,333,512 | | | | 242,026 | |
Imperial Tobacco Group plc | | | 7,706,936 | | | | 285,344 | |
InterContinental Hotels Group plc | | | 1,847,722 | | | | 53,903 | |
Johnson Matthey plc | | | 3,391,638 | | | | 154,180 | |
Land Securities Group plc | | | 11,324,880 | | | | 168,488 | |
Meggitt plc | | | 16,343,390 | | | | 145,256 | |
Prudential plc | | | 3,998,629 | | | | 74,509 | |
Rolls-Royce Holdings plc | | | 15,437,664 | | | | 277,912 | |
SABMiller plc | | | 6,852,627 | | | | 348,731 | |
Standard Chartered plc | | | 3,922,509 | | | | 94,046 | |
TESCO plc | | | 22,777,684 | | | | 132,380 | |
WPP plc | | | 9,305,753 | | | | 191,327 | |
| | | | | | | | |
| | | | | | | 2,240,071 | |
| UNITED STATES - 5.6% | | | | | | | | |
Covidien plc | | | 5,036,980 | | | | 306,954 | |
Liberty Global plc, Class A(1) | | | 2,079,018 | | | | 164,970 | |
Liberty Global plc, Series C(1)(2) | | | 215,664 | | | | 16,267 | |
Schlumberger Ltd. | | | 2,920,175 | | | | 258,027 | |
| | | | | | | | |
| | | | | | | 746,218 | |
| | | | | | | | |
Total common stocks
(Cost $9,722,819) | | | | | | | 12,885,549 | |
| | | | | | | | |
| PREFERRED STOCKS - 1.2% | | | | | | | | |
| | | | | | | | |
| GERMANY - 1.2% | | | | | | | | |
Henkel AG & Co. KGaA(2) | | | 1,558,496 | | | | 160,598 | |
| | | | | | | | |
Total preferred stocks
(Cost $108,955) | | | | | | | 160,598 | |
| | | Par
Amount | | | | |
SHORT-TERM INVESTMENTS (CASH EQUIVALENTS) - 2.3% | | | | | | | | |
Repurchase agreement with Fixed Income Clearing Corporation, 0.00%, dated 9/30/13, due 10/1/13, maturity value $302,475
(Cost $302,475)(3) | | $ | 302,475 | | | $ | 302,475 | |
| | | | | | | | |
| | | | | | | | |
Total investments - 99.5%
(Cost $10,134,249) | | | | | | | 13,348,622 | |
| | | | | | | | |
Other assets less liabilities - 0.5% | | | | | | | 72,602 | |
| | | | | | | | |
| | | | | | | | |
Total net assets - 100.0%(4) | | | | | | $ | 13,421,224 | |
| | | | | | | | |
| (1) | Non-income producing security. |
| | | | | | | | | | | | |
Issuer | | Rate | | | Maturity | | | Value | |
U.S. Treasury Bond | | | 3.125 | % | | | 2/15/2042 | | | $ | 305,879 | |
U.S. Treasury Bond | | | 4.500 | % | | | 8/15/2039 | | | | 2,650 | |
| | | | | | | | | | | | |
| | | | | | | | | | $ | 308,529 | |
| | | | | | | | | | | | |
| (4) | Percentages for the various classifications relate to total net assets. |
Company names are as reported by a data service provider and in some cases are translations; a company’s legal name may be different.
(DR) Depositary Receipt, voting rights may vary.
| | | | | | | | |
| PORTFOLIO DIVERSIFICATION - September 30, 2013 | |
Dollar values in thousands | | | | | | | | |
| | | Value | | | Percentage
of Total
Net Assets | |
Consumer Discretionary | | $ | 1,580,275 | | | | 11.7 | % |
Consumer Staples | | | 2,986,252 | | | | 22.3 | |
Energy | | | 292,615 | | | | 2.2 | |
Financials | | | 2,523,139 | | | | 18.9 | |
Healthcare | | | 1,582,969 | | | | 11.8 | |
Industrials | | | 2,144,996 | | | | 15.9 | |
Information Technology | | | 797,134 | | | | 5.9 | |
Materials | | | 1,022,096 | | | | 7.6 | |
Telecommunication Services | | | 116,671 | | | | 0.9 | |
Short-term investments | | | 302,475 | | | | 2.3 | |
| | | | | | | | |
Total investments | | $ | 13,348,622 | | | | 99.5 | % |
| | | | | | | | |
| | | | | | | | |
| CURRENCY EXPOSURE - September 30, 2013 | |
Dollar values in thousands | | | | | | | | |
| | | Value | | | Percentage
of Total
Investments | |
Brazilian real | | $ | 38,761 | | | | 0.3 | % |
British pound | | | 2,240,071 | | | | 16.8 | |
Danish krone | | | 41,607 | | | | 0.3 | |
Euro | | | 4,822,600 | | | | 36.1 | |
Hong Kong dollar | | | 964,398 | | | | 7.2 | |
Indian rupee | | | 34,588 | | | | 0.3 | |
Indonesian rupiah | | | 79,546 | | | | 0.6 | |
Japanese yen | | | 1,534,950 | | | | 11.5 | |
Korean won | | | 72,501 | | | | 0.5 | |
Malaysian ringgit | | | 16,301 | | | | 0.1 | |
Nigerian naira | | | 64,371 | | | | 0.5 | |
Singapore dollar | | | 68,485 | | | | 0.5 | |
Swiss franc | | | 1,533,112 | | | | 11.5 | |
U.S. dollar | | | 1,837,331 | | | | 13.8 | |
| | | | | | | | |
Total investments | | $ | 13,348,622 | | | | 100.0 | % |
| | | | | | | | |
| | | | | | |
| TOP TEN HOLDINGS - September 30, 2013 | |
Company Name | | Country | | Percentage
of Total
Net Assets | |
Baidu, Inc. | | China | | | 4.2 | % |
Linde AG | | Germany | | | 4.0 | |
AIA Group Ltd. | | Hong Kong | | | 3.2 | |
Bayer AG | | Germany | | | 3.2 | |
Nestle S.A. | | Switzerland | | | 3.1 | |
Roche Holding AG | | Switzerland | | | 2.9 | |
Unilever N.V. | | Netherlands | | | 2.9 | |
Japan Tobacco, Inc. | | Japan | | | 2.9 | |
Deutsche Post AG | | Germany | | | 2.7 | |
SABMiller plc | | United Kingdom | | | 2.6 | |
| | | | | | |
Total | | | | | 31.7 | % |
| | | | | | |
For the purpose of determining the Fund’s top ten holdings, securities of the same issuer are aggregated to determine the weight in the Fund.
The accompanying notes are an integral part of the financial statements.
ARTISAN INTERNATIONAL SMALL CAP FUND
Schedule of Investments – September 30, 2013
Dollar values in thousands
| | | | | | | | |
| | | Shares
Held | | | Value | |
| COMMON STOCKS - 95.8% | | | | | | | | |
| | | | | | | | |
| BRAZIL - 4.5% | | | | | | | | |
International Meal Co. Holdings S.A.(1) | | | 1,847,800 | | | $ | 16,675 | |
M Dias Branco S.A. | | | 476,600 | | | | 21,934 | |
Raia Drogasil S.A. | | | 795,300 | | | | 6,578 | |
| | | | | | | | |
| | | | | | | 45,187 | |
| CANADA - 3.3% | | | | | | | | |
CAE, Inc. | | | 3,002,453 | | | | 32,880 | |
| | | | | | | | |
| CHINA - 15.7% | | | | | | | | |
21Vianet Group, Inc. (DR)(1) | | | 1,286,243 | | | | 21,210 | |
AMVIG Holdings Ltd. | | | 12,636,000 | | | | 5,360 | |
Beijing Enterprises Water Group Ltd. | | | 115,902,000 | | | | 48,119 | |
Biostime International Holdings Ltd. | | | 2,809,000 | | | | 21,241 | |
China Everbright International Ltd. | | | 32,126,000 | | | | 28,374 | |
China Oil & Gas Group Ltd. | | | 67,060,000 | | | | 9,511 | |
Labixiaoxin Snacks Group Ltd. | | | 17,576,000 | | | | 8,928 | |
New World Department Store China Ltd. | | | 5,993,000 | | | | 3,145 | |
Yingde Gases Group Co., Ltd. | | | 10,436,500 | | | | 10,227 | |
| | | | | | | | |
| | | | | | | 156,115 | |
| DENMARK - 2.0% | | | | | | | | |
Rockwool International AS, Class B | | | 22,388 | | | | 3,627 | |
Royal Unibrew AS | | | 141,432 | | | | 16,803 | |
| | | | | | | | |
| | | | | | | 20,430 | |
| FRANCE - 6.6% | | | | | | | | |
Eurofins Scientific | | | 173,295 | | | | 43,677 | |
IPSOS | | | 339,779 | | | | 12,770 | |
Rubis SCA | | | 148,034 | | | | 9,348 | |
| | | | | | | | |
| | | | | | | 65,795 | |
| GERMANY - 11.9% | | | | | | | | |
Deutz AG (1) | | | 3,069,340 | | | | 27,738 | |
Draegerwerk AG & Co. KGaA | | | 31,968 | | | | 3,354 | |
Wirecard AG | | | 2,565,241 | | | | 87,749 | |
| | | | | | | | |
| | | | | | | 118,841 | |
| HONG KONG - 1.8% | | | | | | | | |
SJM Holdings Ltd. | | | 6,399,932 | | | | 17,989 | |
| | | | | | | | |
| INDONESIA - 5.9% | | | | | | | | |
Ace Hardware Indonesia Tbk PT | | | 200,666,300 | | | | 12,130 | |
Global Mediacom Tbk PT | | | 80,076,000 | | | | 13,346 | |
Mayora Indah Tbk PT | | | 2,313,000 | | | | 6,322 | |
MNC Sky Vision Tbk PT(1) | | | 60,873,304 | | | | 9,409 | |
Nippon Indosari Corpindo Tbk PT | | | 13,836,000 | | | | 7,647 | |
Tempo Scan Pacific Tbk PT | | | 31,028,900 | | | | 10,182 | |
| | | | | | | | |
| | | | | | | 59,036 | |
| IRELAND - 4.5% | | | | | | | | |
Glanbia plc | | | 3,459,517 | | | $ | 45,309 | |
| | | | | | | | |
| ITALY - 4.1% | | | | | | | | |
Davide Campari-Milano S.p.A. | | | 1,704,824 | | | | 14,784 | |
MARR S.p.A. | | | 1,194,790 | | | | 16,244 | |
Prada S.p.A. | | | 1,021,300 | | | | 9,626 | |
| | | | | | | | |
| | | | | | | 40,654 | |
| JAPAN - 2.9% | | | | | | | | |
Sugi Holdings Co., Ltd. | | | 686,200 | | | | 29,390 | |
| | | | | | | | |
| KENYA - 1.2% | | | | | | | | |
East African Breweries Ltd. | | | 3,134,900 | | | | 11,901 | |
| | | | | | | | |
| KOREA - 1.4% | | | | | | | | |
Hyundai Development Co.-Engineering & Construction | | | 272,400 | | | | 6,096 | |
S1 Corp. | | | 124,816 | | | | 7,514 | |
| | | | | | | | |
| | | | | | | 13,610 | |
| MALAYSIA - 1.1% | | | | | | | | |
Oldtown Bhd | | | 12,755,200 | | | | 10,566 | |
| | | | | | | | |
| PHILIPPINES - 1.2% | | | | | | | | |
Megaworld Corp. | | | 153,658,000 | | | | 11,505 | |
| | | | | | | | |
| SINGAPORE - 5.7% | | | | | | | | |
Petra Foods Ltd. | | | 5,016,000 | | | | 13,834 | |
SIA Engineering Co., Ltd. | | | 4,014,700 | | | | 15,552 | |
Super Group Ltd. | | | 8,000,000 | | | | 27,038 | |
| | | | | | | | |
| | | | | | | 56,424 | |
| SWITZERLAND - 4.0% | | | | | | | | |
Schindler Holding AG(2) | | | 110,535 | | | | 16,598 | |
Tecan Group AG | | | 219,971 | | | | 23,229 | |
| | | | | | | | |
| | | | | | | 39,827 | |
| UNITED KINGDOM - 18.0% | | | | | | | | |
APR Energy plc | | | 775,081 | | | | 12,190 | |
AZ Electronic Materials S.A. | | | 1,974,828 | | | | 9,431 | |
Babcock International Group plc | | | 2,418,449 | | | | 46,826 | |
Barratt Developments plc(1) | | | 4,079,864 | | | | 20,383 | |
Big Yellow Group plc | | | 3,661,924 | | | | 26,085 | |
Britvic plc | | | 3,679,935 | | | | 34,107 | |
Dignity plc | | | 459,061 | | | | 10,776 | |
UBM plc | | | 1,668,473 | | | | 19,299 | |
| | | | | | | | |
| | | | | | | 179,097 | |
| | | | | | | | |
Total common stocks
(Cost $670,168) | | | | | | | 954,556 | |
| | | | | | | | |
| | | Par
Amount | | | Value | |
SHORT-TERM INVESTMENTS
(CASH EQUIVALENTS) - 3.5% | | | | | | | | |
Repurchase agreement with Fixed Income Clearing Corporation, 0.00%, dated 9/30/13, due 10/1/13, maturity value $34,870
(Cost $34,870)(3) | | $ | 34,870 | | | $ | 34,870 | |
| | | | | | | | |
| | | | | | | | |
Total investments - 99.3%
(Cost $705,038) | | | | | | | 989,426 | |
| | | | | | | | |
Other assets less liabilities - 0.7% | | | | | | | 6,724 | |
| | | | | | | | |
| | | | | | | | |
Total net assets - 100.0%(4) | | | | | | $ | 996,150 | |
| | | | | | | | |
| (1) | Non-income producing security. |
| | | | | | | | | | | | |
Issuer | | Rate | | | Maturity | | | Value | |
U.S. Treasury Note | | | 0.875 | % | | | 1/31/2018 | | | $ | 35,570 | |
| (4) | Percentages for the various classifications relate to total net assets. |
Company names are as reported by a data service provider and in some cases are translations; a company’s legal name may be different.
(DR) Depositary Receipt, voting rights may vary.
| | | | | | | | |
| PORTFOLIO DIVERSIFICATION - September 30, 2013 | |
Dollar values in thousands | |
| | | Value | | | Percentage
of Total
Net Assets | |
Consumer Discretionary | | $ | 145,548 | | | | 14.7 | % |
Consumer Staples | | | 292,626 | | | | 29.2 | |
Financials | | | 37,590 | | | | 3.8 | |
Healthcare | | | 80,442 | | | | 8.0 | |
Industrials | | | 185,205 | | | | 18.7 | |
Information Technology | | | 108,959 | | | | 10.9 | |
Materials | | | 25,018 | | | | 2.6 | |
Utilities | | | 79,168 | | | | 7.9 | |
Short-term investments | | | 34,870 | | | | 3.5 | |
| | | | | | | | |
Total investments | | $ | 989,426 | | | | 99.3 | % |
| | | | | | | | |
| | | | | | | | |
| CURRENCY EXPOSURE - September 30, 2013 | |
Dollar values in thousands | |
| | | Value | | | Percentage
of Total
Investments | |
Brazilian real | | $ | 45,187 | | | | 4.6 | % |
British pound | | | 179,097 | | | | 18.1 | |
Canadian dollar | | | 32,880 | | | | 3.3 | |
Danish krone | | | 20,430 | | | | 2.0 | |
Euro | | | 260,973 | | | | 26.4 | |
Hong Kong dollar | | | 162,520 | | | | 16.4 | |
Indonesian rupiah | | | 59,036 | | | | 6.0 | |
Japanese yen | | | 29,390 | | | | 3.0 | |
Kenyan shilling | | | 11,901 | | | | 1.2 | |
Korean won | | | 13,610 | | | | 1.4 | |
Malaysian ringgit | | | 10,566 | | | | 1.1 | |
Philippine peso | | | 11,505 | | | | 1.1 | |
Singapore dollar | | | 56,424 | | | | 5.7 | |
Swiss franc | | | 39,827 | | | | 4.0 | |
U.S. dollar | | | 56,080 | | | | 5.7 | |
| | | | | | | | |
Total investments | | $ | 989,426 | | | | 100.0 | % |
| | | | | | | | |
| | | | | | |
| TOP TEN HOLDINGS - September 30, 2013 | |
Company Name | | Country | | Percentage
of Total
Net Assets | |
Wirecard AG | | Germany | | | 8.8 | % |
Beijing Enterprises Water Group Ltd. | | China | | | 4.8 | |
Babcock International Group plc | | United Kingdom | | | 4.7 | |
Glanbia plc | | Ireland | | | 4.5 | |
Eurofins Scientific | | France | | | 4.4 | |
Britvic plc | | United Kingdom | | | 3.4 | |
CAE, Inc. | | Canada | | | 3.3 | |
Sugi Holdings Co., Ltd. | | Japan | | | 2.9 | |
China Everbright International Ltd. | | China | | | 2.9 | |
Deutz AG | | Germany | | | 2.8 | |
| | | | | | |
Total | | | | | 42.5 | % |
| | | | | | |
For the purpose of determining the Fund’s top ten holdings, securities of the same issuer are aggregated to determine the weight in the Fund.
The accompanying notes are an integral part of the financial statements.
ARTISAN INTERNATIONAL VALUE FUND
Schedule of Investments – September 30, 2013
Dollar values in thousands
| | | | | | | | |
| | | Shares
Held | | | Value | |
| COMMON STOCKS - 86.7% | | | | | | | | |
| | | | | | | | |
| BELGIUM - 1.9% | | | | | | | | |
Groupe Bruxelles Lambert S.A. | | | 2,331,395 | | | $ | 198,294 | |
| | | | | | | | |
| CANADA - 2.5% | | | | | | | | |
Imperial Oil Ltd. | | | 5,857,911 | | | | 257,224 | |
| | | | | | | | |
| CHINA - 2.5% | | | | | | | | |
Baidu, Inc. (DR)(1) | | | 1,691,979 | | | | 262,561 | |
| | | | | | | | |
| DENMARK - 1.6% | | | | | | | | |
Carlsberg AS, Class B | | | 1,682,779 | | | | 173,372 | |
| | | | | | | | |
| FRANCE - 5.1% | | | | | | | | |
Societe Television Francaise 1 | | | 5,100,364 | | | | 88,769 | |
Sodexo | | | 1,388,287 | | | | 129,535 | |
Sodexo Prime De Fidelite Common Stock(2) | | | 1,284,779 | | | | 119,878 | |
Total S.A. | | | 1,437,620 | | | | 83,426 | |
Vivendi S.A. | | | 4,962,250 | | | | 114,158 | |
| | | | | | | | |
| | | | | | | 535,766 | |
| GERMANY - 1.9% | | | | | | | | |
Deutsche Boerse AG | | | 1,901,931 | | | | 143,086 | |
Wincor Nixdorf AG | | | 853,185 | | | | 53,280 | |
| | | | | | | | |
| | | | | | | 196,366 | |
| INDIA - 0.1% | | | | | | | | |
Coal India Ltd. | | | 1,549,375 | | | | 7,271 | |
| | | | | | | | |
| JAPAN - 7.4% | | | | | | | | |
Aderans Co., Ltd. | | | 904,100 | | | | 13,024 | |
Credit Saison Co., Ltd. | | | 6,108,859 | | | | 165,252 | |
Kao Corp. | | | 8,504,300 | | | | 264,745 | |
Nifco, Inc. | | | 2,023,100 | | | | 54,007 | |
Sankyo Co., Ltd. | | | 1,446,480 | | | | 70,562 | |
Stanley Electric Co., Ltd.(3) | | | 9,759,300 | | | | 207,011 | |
| | | | | | | | |
| | | | | | | 774,601 | |
| KOREA - 3.2% | | | | | | | | |
Kia Motors Corp. | | | 2,970,958 | | | | 180,523 | |
Samsung Electronics Co., Ltd. | | | 118,338 | | | | 150,527 | |
| | | | | | | | |
| | | | | | | 331,050 | |
| NETHERLANDS - 4.1% | | | | | | | | |
ING Groep N.V. (DR)(1) | | | 26,721,897 | | | | 301,895 | |
Reed Elsevier N.V. | | | 1,924,184 | | | | 38,696 | |
TNT Express N.V. | | | 9,171,441 | | | | 83,726 | |
| | | | | | | | |
| | | | | | | 424,317 | |
| NORWAY - 1.2% | | | | | | | | |
Orkla ASA | | | 16,793,796 | | | $ | 122,325 | |
| | | | | | | | |
| SWITZERLAND - 8.2% | | | | | | | | |
Adecco S.A. | | | 2,614,056 | | | | 186,150 | |
Novartis AG | | | 4,277,888 | | | | 328,759 | |
Panalpina Welttransport Holding AG(3) | | | 1,669,654 | | | | 246,105 | |
Pargesa Holding S.A. | | | 1,344,272 | | | | 100,856 | |
| | | | | | | | |
| | | | | | | 861,870 | |
| UNITED KINGDOM - 31.0% | | | | | | | | |
Alent plc(3) | | | 17,387,295 | | | | 99,927 | |
AMEC plc | | | 5,371,720 | | | | 93,398 | |
AstraZeneca plc | | | 3,263,071 | | | | 169,862 | |
Carpetright plc(1) | | | 2,764,443 | | | | 29,023 | |
Compass Group plc | | | 37,572,268 | | | | 517,019 | |
Diageo plc | | | 4,716,991 | | | | 150,054 | |
Direct Line Insurance Group plc | | | 18,981,124 | | | | 65,513 | |
Lloyds Banking Group plc(1) | | | 240,456,027 | | | | 286,428 | |
Michael Page International plc | | | 10,403,141 | | | | 82,911 | |
QinetiQ Group plc(3) | | | 55,999,571 | | | | 173,700 | |
Reed Elsevier plc | | | 27,744,444 | | | | 374,146 | |
Royal Bank of Scotland Group plc(1) | | | 44,404,012 | | | | 258,717 | |
Savills plc | | | 5,188,110 | | | | 51,906 | |
TESCO plc | | | 64,433,727 | | | | 374,479 | |
Unilever plc (DR) | | | 5,096,423 | | | | 196,620 | |
Vesuvius plc(3) | | | 18,827,331 | | | | 136,183 | |
Vodafone Group plc | | | 51,514,587 | | | | 180,138 | |
| | | | | | | | |
| | | | | | | 3,240,024 | |
| UNITED STATES - 16.0% | | | | | | | | |
Accenture plc, Class A | | | 1,898,151 | | | | 139,780 | |
Aon plc | | | 4,500,983 | | | | 335,053 | |
Arch Capital Group Ltd.(1)(3) | | | 5,768,633 | | | | 312,256 | |
Covidien plc | | | 4,606,432 | | | | 280,716 | |
Flextronics International Ltd.(1) | | | 10,173,091 | | | | 92,473 | |
Mallinckrodt plc(1) | | | 2,824,187 | | | | 124,519 | |
TE Connectivity Ltd. | | | 7,505,434 | | | | 388,631 | |
| | | | | | | | |
| | | | | | | 1,673,428 | |
| | | | | | | | |
Total common stocks
(Cost $6,621,257) | | | | | | | 9,058,469 | |
| | | | | | | | |
| PREFERRED STOCKS - 0.2% | | | | | | | | |
| | | | | | | | |
| KOREA - 0.2% | | | | | | | | |
Samsung Electronics Co., Ltd.(4) | | | 20,928 | | | | 17,059 | |
| | | | | | | | |
Total preferred stocks
(Cost $17,448) | | | | | | | 17,059 | |
| | | | | | | | |
| | | Par
Amount | | | Value | |
SHORT-TERM INVESTMENTS
(CASH EQUIVALENTS) - 13.0% | | | | | | | | |
Repurchase agreement with Fixed Income Clearing Corporation, 0.00%, dated 9/30/13, due 10/1/13, maturity value $1,364,272
(Cost $1,364,272)(5) | | $ | 1,364,272 | | | $ | 1,364,272 | |
| | | | | | | | |
| | | | | | | | |
Total investments - 99.9%
(Cost $8,002,977) | | | | | | | 10,439,800 | |
| | | | | | | | |
Other assets less liabilities - 0.1% | | | | | | | 10,342 | |
| | | | | | | | |
| | | | | | | | |
Total net assets - 100.0%(6) | | | | | | $ | 10,450,142 | |
| | | | | | | | |
| (1) | Non-income producing security. |
| (2) | Shares are registered with the issuing company and not tradable until converted back to bearer shares. |
| (3) | Affiliated company as defined by the 1940 Act. See note 11 in Notes to Financial Statements for additional information. |
| | | | | | | | | | | | |
Issuer | | Rate | | | Maturity | | | Value | |
U.S. Treasury Note | | | 0.500 | % | | | 7/31/2017 | | | $ | 153,290 | |
U.S. Treasury Note | | | 0.625 | % | | | 8/31/2017 | | | | 599,776 | |
U.S. Treasury Note | | | 0.875 | % | | | 2/28/2017 | | | | 459,361 | |
U.S. Treasury Note | | | 1.000 | % | | | 3/31/2017 | | | | 175,793 | |
U.S. Treasury Bond | | | 4.500 | % | | | 8/15/2039 | | | | 3,343 | |
| | | | | | | | | | | | |
| | | | | | | | | | $ | 1,391,563 | |
| | | | | | | | | | | | |
| (6) | Percentages for the various classifications relate to total net assets. |
Company names are as reported by a data service provider and in some cases are translations; a company’s legal name may be different.
(DR) Depositary Receipt, voting rights may vary.
| | | | | | | | |
| PORTFOLIO DIVERSIFICATION - September 30, 2013 | |
Dollar values in thousands | | | | | | | | |
| | | Value | | | Percentage
of Total
Net Assets | |
Consumer Discretionary | | $ | 1,809,169 | | | | 17.3 | % |
Consumer Staples | | | 1,294,619 | | | | 12.3 | |
Energy | | | 441,319 | | | | 4.3 | |
Financials | | | 2,219,256 | | | | 21.3 | |
Healthcare | | | 903,856 | | | | 8.6 | |
Industrials | | | 908,775 | | | | 8.7 | |
Information Technology | | | 1,104,311 | | | | 10.6 | |
Materials | | | 99,927 | | | | 1.0 | |
Telecommunication Services | | | 294,296 | | | | 2.8 | |
Short-term investments | | | 1,364,272 | | | | 13.0 | |
| | | | | | | | |
Total investments | | $ | 10,439,800 | | | | 99.9 | % |
| | | | | | | | |
| | | | | | | | |
| CURRENCY EXPOSURE - September 30, 2013 | |
Dollar values in thousands | | | | | | | | |
| | | Value | | | Percentage
of Total
Investments | |
British pound | | $ | 3,043,404 | | | | 29.1 | % |
Canadian dollar | | | 257,224 | | | | 2.5 | |
Danish krone | | | 173,372 | | | | 1.7 | |
Euro | | | 1,354,743 | | | | 13.0 | |
Indian rupee | | | 7,271 | | | | 0.1 | |
Japanese yen | | | 774,601 | * | | | 7.4 | |
Korean won | | | 348,109 | | | | 3.3 | |
Norwegian krone | | | 122,325 | | | | 1.2 | |
Swiss franc | | | 861,870 | | | | 8.2 | |
U.S. dollar | | | 3,496,881 | | | | 33.5 | |
| | | | | | | | |
Total investments | | $ | 10,439,800 | | | | 100.0 | % |
| | | | | | | | |
| * | Currency exposure is offset by foreign currency forward contracts noted in the table below: |
| | | | | | | | | | | | | | | | | | | | |
| | | Contract Settlement Date | | Contract Amount | | | Unrealized
Appreciation/
(Depreciation) | |
Counterparty | | | Deliver | | | Receive | | |
| State Street Bank and Trust Company | | 2/14/2014 | | JPY | | | 58,950,416 | | | | USD | | | | 601,008 | | | $ | 693 | |
| State Street Bank and Trust Company | | 2/14/2014 | | JPY | | | 3,764,025 | | | | USD | | | | 37,594 | | | | (736 | ) |
| State Street Bank and Trust Company | | 2/14/2014 | | USD | | | 34,072 | | | | JPY | | | | 3,343,076 | | | | (29 | ) |
| State Street Bank and Trust Company | | 2/14/2014 | | JPY | | | 1,544,744 | | | | USD | | | | 15,784 | | | | 53 | |
| | | | | | | | | | | | | | | | | | | | |
| | | | | | | | | | | | | | | | | | $ | (19 | ) |
| | | | | | | | | | | | | | | | | | | | |
JPY - Japanese yen
USD - U.S. dollar
| | | | | | |
| TOP TEN HOLDINGS - September 30, 2013 | |
Company Name | | Country | | Percentage
of Total
Net Assets | |
Compass Group plc | | United Kingdom | | | 4.9 | % |
TE Connectivity Ltd. | | United States | | | 3.7 | |
TESCO plc | | United Kingdom | | | 3.6 | |
Reed Elsevier plc | | United Kingdom | | | 3.6 | |
Aon plc | | United States | | | 3.2 | |
Novartis AG | | Switzerland | | | 3.1 | |
Arch Capital Group Ltd. | | United States | | | 3.0 | |
ING Groep N.V. | | Netherlands | | | 2.9 | |
Lloyds Banking Group plc | | United Kingdom | | | 2.7 | |
Covidien plc | | United States | | | 2.7 | |
| | | | | | |
Total | | | | | 33.4 | % |
| | | | | | |
For the purpose of determining the Fund’s top ten holdings, securities of the same issuer are aggregated to determine the weight in the Fund.
The accompanying notes are an integral part of the financial statements.
ARTISAN MID CAP FUND
Schedule of Investments – September 30, 2013
Dollar values in thousands
| | | | | | | | |
| | | Shares
Held | | | Value | |
| COMMON STOCKS - 96.7% | | | | | | | | |
| | | | | | | | |
| CONSUMER DISCRETIONARY - 20.2% | | | | | |
Auto Components - 2.8% | | | | | | | | |
BorgWarner, Inc. | | | 2,467,314 | | | $ | 250,161 | |
| | | | | | | | |
Automobiles - 0.6% | | | | | | | | |
Tesla Motors, Inc.(1) | | | 263,611 | | | | 50,988 | |
| | | | | | | | |
Distributors - 1.8% | | | | | | | | |
LKQ Corp.(1) | | | 5,267,018 | | | | 167,807 | |
| | | | | | | | |
Hotels, Restaurants & Leisure - 1.7% | | | | | | | | |
Chipotle Mexican Grill, Inc.(1) | | | 357,324 | | | | 153,185 | |
Melco Crown Entertainment Ltd. (DR)(1)(2) | | | 169,209 | | | | 5,386 | |
| | | | | | | | |
| | | | | | | 158,571 | |
Household Durables - 0.7% | | | | | |
Garmin Ltd. | | | 1,433,420 | | | | 64,776 | |
| | | | | | | | |
Internet & Catalog Retail - 2.4% | | | | | | | | |
Ctrip.com International Ltd. (DR)(1)(2) | | | 2,552,900 | | | | 149,166 | |
TripAdvisor, Inc.(1) | | | 893,475 | | | | 67,761 | |
| | | | | | | | |
| | | | | | | 216,927 | |
Specialty Retail - 5.7% | | | | | | | | |
Cabela’s, Inc.(1) | | | 1,012,700 | | | | 63,831 | |
L Brands, Inc. | | | 1,447,381 | | | | 88,435 | |
Tractor Supply Co. | | | 2,593,038 | | | | 174,174 | |
Urban Outfitters, Inc.(1) | | | 1,614,100 | | | | 59,351 | |
Williams-Sonoma, Inc. | | | 2,292,871 | | | | 128,859 | |
| | | | | | | | |
| | | | | | | 514,650 | |
Textiles, Apparel & Luxury Goods - 4.5% | | | | | |
Fossil Group, Inc.(1) | | | 958,032 | | | | 111,362 | |
Lululemon Athletica, Inc.(1) | | | 895,356 | | | | 65,441 | |
Ralph Lauren Corp. | | | 788,622 | | | | 129,910 | |
Under Armour, Inc., Class A(1) | | | 1,327,100 | | | | 105,438 | |
| | | | | | | | |
| | | | | | | 412,151 | |
| ENERGY - 5.6% | | | | | | | | |
Energy Equipment & Services - 2.8% | | | | | | | | |
Core Laboratories N.V. | | | 544,810 | | | | 92,188 | |
Oceaneering International, Inc. | | | 1,969,623 | | | | 160,012 | |
| | | | | | | | |
| | | | | | | 252,200 | |
Oil, Gas & Consumable Fuels - 2.8% | | | | | | | | |
Cabot Oil & Gas Corp. | | | 2,663,538 | | | | 99,403 | |
Noble Energy, Inc. | | | 2,306,674 | | | | 154,570 | |
| | | | | | | | |
| | | | | | | 253,973 | |
| FINANCIALS - 4.7% | | | | | | | | |
Capital Markets - 0.5% | | | | | | | | |
LPL Financial Holdings, Inc. | | | 1,102,500 | | | $ | 42,237 | |
| | | | | | | | |
Consumer Finance - 3.3% | | | | | |
Discover Financial Services | | | 6,003,947 | | | | 303,440 | |
| | | | | | | | |
Diversified Financial Services - 0.9% | | | | | |
IntercontinentalExchange, Inc.(1) | | | 458,419 | | | | 83,166 | |
| | | | | | | | |
| HEALTHCARE - 23.4% | | | | | | | | |
Biotechnology - 12.0% | | | | | | | | |
Alexion Pharmaceuticals, Inc.(1) | | | 1,327,815 | | | | 154,239 | |
Ariad Pharmaceuticals, Inc.(1) | | | 827,087 | | | | 15,218 | |
Cepheid, Inc.(1)(3) | | | 3,719,402 | | | | 145,206 | |
Incyte Corp. Ltd.(1) | | | 2,378,193 | | | | 90,728 | |
Isis Pharmaceuticals, Inc.(1)(3) | | | 4,726,216 | | | | 177,422 | |
Regeneron Pharmaceuticals, Inc.(1) | | | 1,495,013 | | | | 467,745 | |
Vertex Pharmaceuticals, Inc.(1) | | | 474,200 | | | | 35,954 | |
| | | | | | | | |
| | | | | | | 1,086,512 | |
Health Care Providers & Services - 2.4% | | | | | |
Cigna Corp. | | | 2,816,348 | | | | 216,464 | |
| | | | | | | | |
Health Care Technology - 4.5% | | | | | | | | |
athenahealth, Inc.(1)(3) | | | 1,482,981 | | | | 160,992 | |
Cerner Corp.(1) | | | 4,773,754 | | | | 250,861 | |
| | | | | | | | |
| | | | | | | 411,853 | |
Life Sciences Tools & Services - 4.5% | | | | | |
Covance, Inc.(1) | | | 1,487,866 | | | | 128,641 | |
Illumina, Inc.(1) | | | 1,672,275 | | | | 135,170 | |
Mettler-Toledo International, Inc.(1) | | | 606,656 | | | | 145,652 | |
| | | | | | | | |
| | | | | | | 409,463 | |
| INDUSTRIALS - 16.6% | | | | | | | | |
Building Products - 2.9% | | | | | | | | |
Fortune Brands Home & Security, Inc. | | | 3,844,600 | | | | 160,050 | |
Owens Corning(1) | | | 2,815,319 | | | | 106,926 | |
| | | | | | | | |
| | | | | | | 266,976 | |
Commercial Services & Supplies - 0.7% | | | | | |
Waste Connections, Inc. | | | 1,432,898 | | | | 65,068 | |
| | | | | | | | |
Electrical Equipment - 3.0% | | | | | | | | |
AMETEK, Inc. | | | 2,260,494 | | | | 104,028 | |
Rockwell Automation, Inc. | | | 1,597,942 | | | | 170,884 | |
| | | | | | | | |
| | | | | | | 274,912 | |
Machinery - 2.5% | | | | | | | | |
Chart Industries, Inc.(1) | | | 1,072,941 | | | | 132,015 | |
| | | | | | | | |
| | | Shares
Held | | | Value | |
| INDUSTRIALS (CONTINUED) | | | | | | | | |
| Machinery (Continued) | | | | | | | | |
Pall Corp. | | | 1,217,908 | | | $ | 93,827 | |
| | | | | | | | |
| | | | | | | 225,842 | |
Professional Services - 5.9% | | | | | | | | |
IHS, Inc., Class A(1) | | | 2,739,717 | | | | 312,821 | |
Verisk Analytics, Inc., Class A(1) | | | 3,389,791 | | | | 220,201 | |
| | | | | | | | |
| | | | | | | 533,022 | |
Road & Rail - 1.3% | | | | | | | | |
Kansas City Southern | | | 1,039,800 | | | | 113,713 | |
| | | | | | | | |
Trading Companies &
Distributors - 0.3% | | | | | | | | |
WW Grainger, Inc. | | | 115,900 | | | | 30,332 | |
| | | | | | | | |
| INFORMATION TECHNOLOGY - 26.2% | | | | | |
Electronic Equipment, Instruments & Components - 5.0% | | | | | | | | |
FLIR Systems, Inc.(3) | | | 3,598,959 | | | | 113,007 | |
IPG Photonics Corp.(3) | | | 2,228,158 | | | | 125,468 | |
Trimble Navigation Ltd.(1) | | | 7,285,569 | | | | 216,454 | |
| | | | | | | | |
| | | | | | | 454,929 | |
Internet Software &
Services - 5.3% | | | | | | | | |
LinkedIn Corp., Class A(1) | | | 1,095,000 | | | | 269,436 | |
MercadoLibre, Inc. | | | 802,438 | | | | 108,257 | |
Pandora Media, Inc.(1) | | | 3,957,500 | | | | 99,452 | |
| | | | | | | | |
| | | | | | | 477,145 | |
IT Services - 0.5% | | | | | | | | |
Gartner, Inc.(1) | | | 763,669 | | | | 45,820 | |
| | | | | | | | |
Semiconductors & Semiconductor Equipment - 6.7% | | | | | | | | |
Altera Corp. | | | 194,051 | | | | 7,211 | |
Applied Materials, Inc. | | | 12,594,463 | | | | 220,907 | |
ARM Holdings plc (DR)(2) | | | 3,600,516 | | | | 173,257 | |
Cree, Inc.(1) | | | 1,550,400 | | | | 93,318 | |
Freescale Semiconductor Ltd.(1) | | | 6,806,182 | | | | 113,323 | |
| | | | | | | | |
| | | | | | | 608,016 | |
Software - 8.7% | | | | | | | | |
ANSYS, Inc.(1) | | | 1,202,287 | | | | 104,022 | |
Autodesk, Inc.(1) | | | 1,168,075 | | | | 48,090 | |
CommVault Systems, Inc.(1) | | | 597,441 | | | | 52,473 | |
Concur Technologies, Inc.(1) | | | 1,830,430 | | | | 202,262 | |
Red Hat, Inc.(1) | | | 2,494,898 | | | | 115,115 | |
Salesforce.com, Inc.(1) | | | 3,030,592 | | | | 157,318 | |
ServiceNow, Inc.(1) | | | 1,466,300 | | | | 76,174 | |
Workday, Inc., Class A(1) | | | 454,320 | | | | 36,768 | |
| | | | | | | | |
| | | | | | | 792,222 | |
| | | | | | | | |
Total common stocks
(Cost $5,225,589) | | | | | | | 8,783,336 | |
| | | | | | | | |
| | | Par
Amount | | | Value | |
SHORT-TERM INVESTMENTS
(CASH EQUIVALENTS) - 3.3% | | | | | | | | |
Repurchase agreement with Fixed Income Clearing Corporation, 0.00%, dated 9/30/13, due 10/1/13, maturity value $296,956
(Cost $296,956)(4) | | $ | 296,956 | | | $ | 296,956 | |
| | | | | | | | |
| | | | | | | | |
Total investments - 100.0%
(Cost $5,522,545) | | | | | | | 9,080,292 | |
| | | | | | | | |
Other assets less liabilities - (0.0)%† | | | | | | | (3,523 | ) |
| | | | | | | | |
| | | | | | | | |
Total net assets - 100.0%(5) | | | | | | $ | 9,076,769 | |
| | | | | | | | |
| † | Amount rounds to less than 0.1%. |
| (1) | Non-income producing security. |
| (2) | The Fund considers the company to be from outside of the United States. See the Fund’s Statement of Additional Information for information on how a particular country is assigned. |
| | | | | | |
Security | | Country | | Trading Currency | |
ARM Holdings plc (DR) | | United Kingdom | | | U.S. dollar | |
Ctrip.com International Ltd. (DR) | | China | | | U.S. dollar | |
Melco Crown Entertainment Ltd. (DR) | | Hong Kong | | | U.S. dollar | |
| (3) | Affiliated company as defined by the 1940 Act. See note 11 in Notes to Financial Statements for additional information. |
| | | | | | | | | | | | |
Issuer | | Rate | | | Maturity | | | Value | |
U.S. Treasury Note | | | 0.875 | % | | | 1/31/2018 | | | $ | 145,327 | |
U.S. Treasury Note | | | 2.625 | % | | | 11/15/2020 | | | | 157,570 | |
| | | | | | | | | | | | |
| | | | | | | | | | $ | 302,897 | |
| | | | | | | | | | | | |
| (5) | Percentages for the various classifications relate to total net assets. |
Company names are as reported by a data service provider and in some cases are translations; a company’s legal name may be different.
(DR) Depositary Receipt, voting rights may vary.
| | | | | | |
| TOP TEN HOLDINGS - September 30, 2013 | |
Company Name | | Country | | Percentage
of Total
Net Assets | |
Regeneron Pharmaceuticals, Inc. | | United States | | | 5.1 | % |
IHS, Inc. | | United States | | | 3.5 | |
Discover Financial Services | | United States | | | 3.3 | |
LinkedIn Corp. | | United States | | | 3.0 | |
Cerner Corp. | | United States | | | 2.8 | |
BorgWarner, Inc. | | United States | | | 2.7 | |
Applied Materials, Inc. | | United States | | | 2.4 | |
Verisk Analytics, Inc. | | United States | | | 2.4 | |
Cigna Corp. | | United States | | | 2.4 | |
Trimble Navigation Ltd. | | United States | | | 2.4 | |
| | | | | | |
Total | | | | | 30.0 | % |
| | | | | | |
For the purpose of determining the Fund’s top ten holdings, securities of the same issuer are aggregated to determine the weight in the Fund.
The accompanying notes are an integral part of the financial statements.
ARTISAN MID CAP VALUE FUND
Schedule of Investments — September 30, 2013
Dollar values in thousands
| | | | | | | | |
| | | Shares
Held | | | Value | |
| COMMON STOCKS - 93.0% | | | | | | | | |
| | | | | | | | |
| CONSUMER DISCRETIONARY - 11.8% | | | | | | | | |
Diversified Consumer
Services - 1.8% | | | | | | | | |
H&R Block, Inc. | | | 7,130,315 | | | $ | 190,094 | |
| | | | | | | | |
Internet & Catalog Retail - 1.1% | | | | | | | | |
Liberty Interactive Corp., Class A(1) | | | 5,197,037 | | | | 121,974 | |
| | | | | | | | |
Leisure Equipment &
Products - 1.7% | | | | | | | | |
Mattel, Inc. | | | 4,489,170 | | | | 187,917 | |
| | | | | | | | |
Media - 1.7% | | | | | | | | |
Omnicom Group, Inc. | | | 2,913,595 | | | | 184,838 | |
| | | | | | | | |
Multiline Retail - 1.1% | | | | | | | | |
Nordstrom, Inc. | | | 2,006,290 | | | | 112,754 | |
| | | | | | | | |
Specialty Retail - 2.7% | | | | | | | | |
Aaron’s, Inc. | | | 2,775,869 | | | | 76,892 | |
Bed Bath & Beyond, Inc.(1) | | | 2,729,200 | | | | 211,131 | |
| | | | | | | | |
| | | | | | | 288,023 | |
Textiles, Apparel & Luxury
Goods - 1.7% | | | | | | | | |
Coach, Inc. | | | 3,368,500 | | | | 183,684 | |
| | | | | | | | |
| CONSUMER STAPLES - 2.8% | | | | | | | | |
Food & Staples Retailing - 2.8% | | | | | | | | |
Kroger Co. | | | 7,105,728 | | | | 286,645 | |
Sysco Corp. | | | 658,853 | | | | 20,971 | |
| | | | | | | | |
| | | | | | | 307,616 | |
| | | | | | | | |
| ENERGY - 12.1% | | | | | | | | |
Energy Equipment &
Services - 4.3% | | | | | | | | |
Ensco plc, Class A | | | 3,259,840 | | | | 175,216 | |
McDermott International, Inc.(1)(2) | | | 13,830,400 | | | | 102,760 | |
Patterson-UTI Energy, Inc.(2) | | | 8,617,874 | | | | 184,250 | |
| | | | | | | | |
| | | | | | | 462,226 | |
Oil, Gas & Consumable Fuels - 7.8% | | | | | | | | |
Cimarex Energy Co. | | | 3,294,695 | | | | 317,609 | |
Hess Corp. | | | 2,704,566 | | | | 209,171 | |
SM Energy Co. | | | 2,274,300 | | | | 175,553 | |
Southwestern Energy Co.(1) | | | 3,860,268 | | | | 140,437 | |
| | | | | | | | |
| | | | | | | 842,770 | |
| FINANCIALS - 21.2% | | | | | | | | |
Capital Markets - 0.8% | | | | | | | | |
Northern Trust Corp. | | | 1,696,538 | | | $ | 92,275 | |
| | | | | | | | |
Commercial Banks - 1.0% | | | | | | | | |
M&T Bank Corp. | | | 944,522 | | | | 105,711 | |
| | | | | | | | |
Diversified Financial Services - 2.5% | | | | | | | | |
NYSE Euronext | | | 6,368,100 | | | | 267,333 | |
| | | | | | | | |
Insurance - 14.9% | | | | | | | | |
Alleghany Corp.(1) | | | 649,551 | | | | 266,089 | |
Allied World Assurance Co. Holdings AG | | | 1,266,243 | | | | 125,852 | |
Allstate Corp. | | | 4,892,873 | | | | 247,335 | |
Aon plc | | | 2,546,128 | | | | 189,534 | |
Arch Capital Group Ltd.(1)(2) | | | 3,963,486 | | | | 214,543 | |
Loews Corp. | | | 3,886,661 | | | | 181,662 | |
Progressive Corp. | | | 7,732,696 | | | | 210,561 | |
Torchmark Corp. | | | 2,428,682 | | | | 175,715 | |
| | | | | | | | |
| | | | | | | 1,611,291 | |
Real Estate Investment Trusts (REITs) - 2.0% | | | | | | | | |
Annaly Capital Management, Inc. | | | 6,314,694 | | | | 73,124 | |
Hatteras Financial Corp.(2) | | | 7,493,455 | | | | 140,203 | |
| | | | | | | | |
| | | | | | | 213,327 | |
| HEALTHCARE - 3.8% | | | | | | | | |
Health Care Equipment &
Supplies - 1.0% | | | | | | | | |
Becton Dickinson and Co. | | | 1,032,708 | | | | 103,291 | |
| | | | | | | | |
Health Care Providers &
Services - 2.8% | | | | | | | | |
Cigna Corp. | | | 3,984,399 | | | | 306,241 | |
| | | | | | | | |
| INDUSTRIALS - 14.4% | | | | | | | | |
Aerospace & Defense - 3.0% | | | | | | | | |
L-3 Communications Holdings, Inc. | | | 1,708,837 | | | | 161,485 | |
Rockwell Collins, Inc. | | | 2,360,426 | | | | 160,179 | |
| | | | | | | | |
| | | | | | | 321,664 | |
Commercial Services & Supplies - 1.0% | | | | | |
Republic Services, Inc. | | | 3,417,641 | | | | 114,012 | |
| | | | | | | | |
Construction & Engineering - 2.1% | | | | | | | | |
Jacobs Engineering Group, Inc.(1) | | | 3,827,596 | | | | 222,690 | |
| | | | | | | | |
Electrical Equipment - 1.5% | | | | | | | | |
Hubbell, Inc., Class B | | | 1,523,480 | | | | 159,569 | |
| | | | | | | | |
| | | Shares
Held | | | Value | |
| INDUSTRIALS (CONTINUED) | | | | | | | | |
Machinery - 1.3% | | | | | | | | |
Joy Global, Inc. | | | 2,781,500 | | | $ | 141,968 | |
| | | | | | | | |
Professional Services - 4.5% | | | | | | | | |
Dun & Bradstreet Corp. | | | 604,126 | | | | 62,738 | |
Manpower, Inc. | | | 2,291,873 | | | | 166,711 | |
Towers Watson & Co., Class A | | | 2,446,475 | | | | 261,675 | |
| | | | | | | | |
| | | | | | | 491,124 | |
Road & Rail - 1.0% | | | | | | | | |
Ryder System, Inc.(2) | | | 1,770,323 | | | | 105,688 | |
| | | | | | | | |
| INFORMATION TECHNOLOGY - 24.0% | | | | | |
Computers & Peripherals - 1.0% | | | | | | | | |
Lexmark International, Inc., Class A(2) | | | 3,344,312 | | | | 110,362 | |
| | | | | | | | |
Electronic Equipment, Instruments & Components - 9.7% | | | | | |
Arrow Electronics, Inc.(1)(2) | | | 5,482,961 | | | | 266,088 | |
Avnet, Inc.(2) | | | 7,204,079 | | | | 300,482 | |
FLIR Systems, Inc.(2) | | | 8,224,522 | | | | 258,250 | |
Ingram Micro, Inc., Class A(1)(2) | | | 9,307,460 | | | | 214,537 | |
| | | | | | | | |
| | | | | | | 1,039,357 | |
IT Services - 3.2% | | | | | | | | |
Broadridge Financial Solutions, Inc. | | | 3,663,292 | | | | 116,310 | |
Western Union Co. | | | 12,379,750 | | | | 231,006 | |
| | | | | | | | |
| | | | | | | 347,316 | |
Semiconductors & Semiconductor
Equipment - 6.5% | | | | | |
Analog Devices, Inc. | | | 5,323,173 | | | | 250,455 | |
KLA-Tencor Corp. | | | 3,073,400 | | | | 187,016 | |
Lam Research Corp.(1) | | | 5,175,632 | | | | 264,941 | |
| | | | | | | | |
| | | | | | | 702,412 | |
Software - 3.6% | | | | | | | | |
Autodesk, Inc.(1) | | | 2,458,780 | | | | 101,228 | |
Open Text Corp.(3) | | | 2,507,898 | | | | 187,215 | |
Synopsys, Inc.(1) | | | 2,692,355 | | | | 101,502 | |
| | | | | | | | |
| | | | | | | 389,945 | |
| MATERIALS - 1.2% | | | | | | | | |
Metals & Mining - 1.2% | | | | | | | | |
Kinross Gold Corp.(3) | | | 25,927,400 | | | | 130,934 | |
| | | | | | | | |
| UTILITIES - 1.7% | | | | | | | | |
Electric Utilities - 1.4% | | | | | | | | |
Edison International | | | 3,270,100 | | | | 150,621 | |
| | | | | | | | |
Multi-Utilities - 0.3% | | | | | | | | |
SCANA Corp. | | | 614,695 | | | | 28,300 | |
| | | | | | | | |
| | | | | | | | |
Total common stocks
(Cost $7,236,673) | | | | | | | 10,037,327 | |
SHORT-TERM INVESTMENTS
(CASH EQUIVALENTS) - 7.2% | | | | | | | | |
Repurchase agreement with Fixed Income Clearing Corporation, 0.00%, dated 9/30/13, due 10/1/13, maturity value $784,678
(Cost $784,678)(4) | | $ | 784,678 | | | $ | 784,678 | |
| | | | | | | | |
| | | | | | | | |
Total investments - 100.2%
(Cost $8,021,351) | | | | | | | 10,822,005 | |
| | | | | | | | |
Other assets less liabilities - (0.2)% | | | | | | | (25,965 | ) |
| | | | | | | | |
| | | | | | | | |
| | | | | | | | |
Total net assets - 100.0%(5) | | | | | | $ | 10,796,040 | |
| | | | | | | | |
| (1) | Non-income producing security. |
| (2) | Affiliated company as defined by the 1940 Act. See note 11 in Notes to Financial Statements for additional information. |
| (3) | The Fund considers the company to be from outside of the United States. See the Fund’s Statement of Additional Information for information on how a particular country is assigned. |
| | | | | | | | |
Security | | Country | | | Trading Currency | |
Kinross Gold Corp. | | | Canada | | | | U.S. dollar | |
Open Text Corp. | | | Canada | | | | U.S. dollar | |
| | | | | | | | | | | | |
Issuer | | Rate | | | Maturity | | | Value | |
U.S. Treasury Note | | | 0.250 | % | | | 9/30/2015 | | | $ | 704,638 | |
U.S. Treasury Note | | | 0.875 | % | | | 2/28/2017 | | | | 95,734 | |
| | | | | | | | | | | | |
| | | | | | | | | | $ | 800,372 | |
| | | | | | | | | | | | |
| (5) | Percentages for the various classifications relate to total net assets. |
Company names are as reported by a data service provider and in some cases are translations; a company’s legal name may be different.
| | | | | | |
TOP TEN HOLDINGS - September 30, 2013 | |
Company Name | | Country | | Percentage
of Total
Net Assets | |
Cimarex Energy Co. | | United States | | | 3.0 | % |
Cigna Corp. | | United States | | | 2.8 | |
Avnet, Inc. | | United States | | | 2.8 | |
Kroger Co. | | United States | | | 2.6 | |
NYSE Euronext | | United States | | | 2.5 | |
Alleghany Corp. | | United States | | | 2.5 | |
Arrow Electronics, Inc. | | United States | | | 2.5 | |
Lam Research Corp. | | United States | | | 2.5 | |
Towers Watson & Co. | | United States | | | 2.4 | |
FLIR Systems, Inc. | | United States | | | 2.4 | |
| | | | | | |
Total | | | | | 26.0 | % |
| | | | | | |
For the purpose of determining the Fund’s top ten holdings, securities of the same issuer are aggregated to determine the weight in the Fund.
The accompanying notes are an integral part of the financial statements.
ARTISAN SMALL CAP FUND
Schedule of Investments – September 30, 2013
Dollar values in thousands
| | | | | | | | |
| | | Shares
Held | | | Value | |
| COMMON STOCKS - 95.1% | | | | | | | | |
| | | | | | | | |
| CONSUMER DISCRETIONARY - 11.7% | | | | | |
Auto Components - 0.9% | | | | | | | | |
Gentherm, Inc.(1) | | | 782,500 | | | $ | 14,930 | |
| | | | | | | | |
Distributors - 1.7% | | | | | | | | |
LKQ Corp.(1) | | | 842,100 | | | | 26,829 | |
| | | | | | | | |
Hotels, Restaurants & Leisure - 3.0% | | | | | |
Dunkin’ Brands Group, Inc. | | | 1,032,500 | | | | 46,731 | |
| | | | | | | | |
Internet & Catalog Retail - 0.9% | | | | | |
HomeAway, Inc.(1) | | | 502,900 | | | | 14,081 | |
| | | | | | | | |
Media - 0.5% | | | | | | | | |
Imax Corp.(1)(2) | | | 255,683 | | | | 7,732 | |
| | | | | | | | |
Specialty Retail - 3.0% | | | | | | | | |
Five Below, Inc.(1) | | | 234,470 | | | | 10,258 | |
Francesca’s Holdings Corp.(1) | | | 793,900 | | | | 14,799 | |
Hibbett Sports, Inc.(1) | | | 177,600 | | | | 9,972 | |
Restoration Hardware Holdings, Inc.(1) | | | 177,600 | | | | 11,251 | |
| | | | | | | | |
| | | | | | | 46,280 | |
Textiles, Apparel & Luxury Goods - 1.7% | | | | | |
Deckers Outdoor Corp.(1) | | | 261,000 | | | | 17,205 | |
Tumi Holdings, Inc.(1) | | | 430,400 | | | | 8,673 | |
| | | | | | | | |
| | | | | | | 25,878 | |
| CONSUMER STAPLES - 3.1% | | | | | | | | |
Food & Staples Retailing - 2.3% | | | | | | | | |
Fresh Market, Inc.(1) | | | 497,400 | | | | 23,532 | |
PriceSmart, Inc. | | | 126,579 | | | | 12,055 | |
| | | | | | | | |
| | | | | | | 35,587 | |
Food Products - 0.8% | | | | | | | | |
Annie’s, Inc.(1) | | | 263,700 | | | | 12,948 | |
| | | | | | | | |
| ENERGY - 4.5% | | | | | | | | |
Energy Equipment & Services - 1.9% | | | | | |
Dril-Quip, Inc.(1) | | | 194,000 | | | | 22,261 | |
Geospace Technologies Corp.(1) | | | 91,600 | | | | 7,722 | |
| | | | | | | | |
| | | | | | | 29,983 | |
Oil, Gas & Consumable Fuels - 2.6% | | | | | | | | |
Oasis Petroleum, Inc.(1) | | | 398,205 | | | | 19,564 | |
Rosetta Resources, Inc.(1) | | | 338,900 | | | | 18,456 | |
Solazyme, Inc.(1) | | | 231,000 | | | | 2,488 | |
| | | | | | | | |
| | | | | | | 40,508 | |
| HEALTHCARE - 20.0% | | | | | | | | |
Biotechnology - 10.1% | | | | | | | | |
Alnylam Pharmaceuticals, Inc.(1) | | | 243,200 | | | $ | 15,567 | |
Ariad Pharmaceuticals, Inc.(1) | | | 555,983 | | | | 10,230 | |
Cepheid, Inc.(1)(3) | | | 1,071,300 | | | | 41,824 | |
Foundation Medicine, Inc.(1) | | | 119,841 | | | | 4,750 | |
Incyte Corp. Ltd.(1) | | | 915,400 | | | | 34,923 | |
Isis Pharmaceuticals, Inc.(1)(3) | | | 1,326,300 | | | | 49,789 | |
| | | | | | | | |
| | | | | | | 157,083 | |
Health Care Equipment &
Supplies - 4.1% | | | | | |
DexCom, Inc.(1) | | | 1,558,581 | | | | 43,999 | |
Endologix, Inc.(1) | | | 392,200 | | | | 6,326 | |
GenMark Diagnostics, Inc.(1) | | | 1,020,041 | | | | 12,393 | |
| | | | | | | | |
| | | | | | | 62,718 | |
Health Care Providers &
Services - 1.3% | | | | | |
Acadia Healthcare Co., Inc.(1) | | | 237,800 | | | | 9,377 | |
Healthways, Inc.(1) | | | 590,300 | | | | 10,926 | |
| | | | | | | | |
| | | | | | | 20,303 | |
Health Care Technology - 2.5% | | | | | | | | |
athenahealth, Inc.(1)(3) | | | 361,200 | | | | 39,212 | |
| | | | | | | | |
Life Sciences Tools & Services - 2.0% | | | | | | | | |
Bruker Corp.(1) | | | 1,527,900 | | | | 31,551 | |
| | | | | | | | |
| INDUSTRIALS - 18.5% | | | | | | | | |
Aerospace & Defense - 3.5% | | | | | | | | |
DigitalGlobe, Inc.(1) | | | 460,200 | | | | 14,551 | |
Teledyne Technologies, Inc.(1) | | | 460,800 | | | | 39,136 | |
| | | | | | | | |
| | | | | | | 53,687 | |
Commercial Services & Supplies - 0.6% | | | | | |
Team, Inc.(1) | | | 246,000 | | | | 9,779 | |
| | | | | | | | |
Electrical Equipment - 3.1% | | | | | | | | |
Acuity Brands, Inc. | | | 516,500 | | | | 47,528 | |
| | | | | | | | |
Machinery - 6.2% | | | | | | | | |
Chart Industries, Inc.(1) | | | 311,600 | | | | 38,339 | |
ExOne Co.(1) | | | 183,206 | | | | 7,805 | |
IDEX Corp. | | | 414,200 | | | | 27,027 | |
Proto Labs, Inc.(1) | | | 232,300 | | | | 17,745 | |
Westport Innovations, Inc.(1)(2) | | | 203,600 | | | | 4,925 | |
| | | | | | | | |
| | | | | | | 95,841 | |
Professional Services - 1.8% | | | | | | | | |
Advisory Board Co.(1) | | | 475,500 | | | | 28,283 | |
| | | | | | | | |
| | | | | | | | |
| | | Shares
Held | | | Value | |
INDUSTRIALS (CONTINUED) | | | | | |
Trading Companies &
Distributors - 3.3% | | | | | |
Beacon Roofing Supply, Inc.(1) | | | 1,400,600 | | | $ | 51,640 | |
| | | | | | | | |
| INFORMATION TECHNOLOGY - 37.3% | | | | | |
Electronic Equipment, Instruments & Components - 7.1% | | | | | | | | |
Cognex Corp. | | | 1,888,400 | | | | 59,220 | |
Control4 Corp.(1) | | | 196,800 | | | | 3,409 | |
FEI Co. | | | 265,100 | | | | 23,276 | |
IPG Photonics Corp.(3) | | | 426,300 | | | | 24,005 | |
| | | | | | | | |
| | | | | | | 109,910 | |
Internet Software & Services - 9.5% | | | | | |
Benefitfocus, Inc.(1) | | | 157,400 | | | | 7,738 | |
CoStar Group, Inc.(1) | | | 240,600 | | | | 40,397 | |
Demandware, Inc.(1) | | | 445,500 | | | | 20,640 | |
MercadoLibre, Inc. | | | 139,400 | | | | 18,806 | |
Pandora Media, Inc.(1) | | | 1,821,700 | | | | 45,779 | |
Rocket Fuel, Inc.(1) | | | 33,548 | | | | 1,803 | |
Shutterstock, Inc.(1) | | | 46,722 | | | | 3,398 | |
Textura Corp.(1) | | | 212,254 | | | | 9,144 | |
| | | | | | | | |
| | | | | | | 147,705 | |
Semiconductors & Semiconductor
Equipment - 2.0% | | | | | |
Cavium, Inc.(1) | | | 496,000 | | | | 20,435 | |
Ultratech, Inc.(1)(3) | | | 356,600 | | | | 10,805 | |
| | | | | | | | |
| | | | | | | 31,240 | |
Software - 18.7% | | | | | | | | |
CommVault Systems, Inc.(1) | | | 661,400 | | | | 58,091 | |
Concur Technologies, Inc.(1) | | | 427,700 | | | | 47,261 | |
FireEye, Inc.(1) | | | 42,212 | | | | 1,753 | |
Fortinet, Inc.(1) | | | 1,310,400 | | | | 26,549 | |
Guidewire Software, Inc.(1) | | | 836,200 | | | | 39,393 | |
Informatica Corp.(1) | | | 996,200 | | | | 38,822 | |
NetSuite, Inc.(1) | | | 143,000 | | | | 15,435 | |
PROS Holdings, Inc.(1) | | | 236,400 | | | | 8,083 | |
RealPage, Inc.(1) | | | 1,149,200 | | | | 26,615 | |
Tableau Software, Inc., Class A(1) | | | 51,400 | | | | 3,662 | |
Tyler Technologies, Inc.(1) | | | 181,700 | | | | 15,893 | |
Ultimate Software Group, Inc.(1) | | | 58,800 | | | | 8,667 | |
| | | | | | | | |
| | | | | | | 290,224 | |
| | | | | | | | |
Total common stocks
(Cost $1,019,695) | | | | | | | 1,478,191 | |
| | | Par
Amount | | | | |
SHORT-TERM INVESTMENTS (CASH EQUIVALENTS) - 4.5% | | | | | | | | |
Repurchase agreement with Fixed Income Clearing Corporation, 0.00%, dated 9/30/13, due 10/1/13, maturity value $70,646
(Cost $70,646)(4) | | $ | 70,646 | | | $ | 70,646 | |
| | | | | | | | |
Total investments - 99.6%
(Cost $1,090,341) | | | | | | $ | 1,548,837 | |
| | | | | | | | |
Other assets less liabilities - 0.4% | | | | | | | 6,121 | |
| | | | | | | | |
| | | | | | | | |
Total net assets - 100.0%(5) | | | | | | $ | 1,554,958 | |
| | | | | | | | |
| (1) | Non-income producing security. |
| (2) | The Fund considers the company to be from outside of the United States. See the Fund’s Statement of Additional Information for information on how a particular country is assigned. |
| | | | |
Security | | Country | | Trading Currency |
Imax Corp. | | Canada | | U.S. dollar |
Westport Innovations, Inc. | | Canada | | U.S. dollar |
| (3) | Affiliated company as defined by the 1940 Act. See note 11 in Notes to Financial Statements for additional information. Use on securities that weren’t affiliated at the beginning of period. |
| | | | | | | | | | | | |
Issuer | | Rate | | | Maturity | | | Value | |
U.S. Treasury Bond | | | 3.125 | % | | | 2/15/2042 | | | $ | 72,062 | |
| (5) | Percentages for the various classifications relate to total net assets. |
Company names are as reported by a data service provider and in some cases are translations; a company’s legal name may be different.
| | | | | | |
TOP TEN HOLDINGS - September 30, 2013 | |
Company Name | | Country | | Percentage
of Total
Net Assets | |
Cognex Corp. | | United States | | | 3.8 | % |
CommVault Systems, Inc. | | United States | | | 3.7 | |
Beacon Roofing Supply, Inc. | | United States | | | 3.3 | |
Isis Pharmaceuticals, Inc. | | United States | | | 3.2 | |
Acuity Brands, Inc. | | United States | | | 3.1 | |
Concur Technologies, Inc. | | United States | | | 3.0 | |
Dunkin’ Brands Group, Inc. | | United States | | | 3.0 | |
Pandora Media, Inc. | | United States | | | 3.0 | |
DexCom, Inc. | | United States | | | 2.8 | |
Cepheid, Inc. | | United States | | | 2.7 | |
| | | | | | |
Total | | | | | 31.6 | % |
| | | | | | |
For the purpose of determining the Fund’s top ten holdings, securities of the same issuer are aggregated to determine the weight in the Fund.
The accompanying notes are an integral part of the financial statements.
ARTISAN SMALL CAP VALUE FUND
Schedule of Investments – September 30, 2013
Dollar values in thousands
| | | | | | | | |
| | | Shares
Held | | | Value | |
| COMMON STOCKS - 91.7% | | | | | | | | |
| | | | | | | | |
| CONSUMER DISCRETIONARY - 13.1% | | | | | |
Auto Components - 0.3% | | | | | | | | |
Remy International, Inc. | | | 384,200 | | | $ | 7,776 | |
| | | | | | | | |
Diversified Consumer Services - 3.4% | | | | | |
Matthews International Corp., Class A | | | 665,605 | | | | 25,346 | |
Outerwall Inc.(1) | | | 980,550 | | | | 49,018 | |
Regis Corp. | | | 1,282,250 | | | | 18,824 | |
| | | | | | | | |
| | | | | | | 93,188 | |
Hotels, Restaurants & Leisure - 1.6% | | | | | |
WMS Industries, Inc.(1) | | | 1,721,200 | | | | 44,665 | |
| | | | | | | | |
Household Durables - 0.6% | | | | | |
Universal Electronics, Inc.(1) | | | 458,650 | | | | 16,525 | |
| | | | | | | | |
Media - 2.2% | | | | | | | | |
DreamWorks Animation SKG, Inc., Class A(1) | | | 1,978,700 | | | | 56,314 | |
Meredith Corp. | | | 125,650 | | | | 5,983 | |
| | | | | | | | |
| | | | | | | 62,297 | |
Specialty Retail - 3.7% | | | | | | | | |
Jos A Bank Clothiers, Inc.(1) | | | 657,900 | | | | 28,921 | |
Men’s Wearhouse, Inc. | | | 361,450 | | | | 12,307 | |
Rent-A-Center, Inc. | | | 1,579,700 | | | | 60,187 | |
| | | | | | | | |
| | | | | | | 101,415 | |
Textiles, Apparel & Luxury Goods - 1.3% | | | | | |
Skechers U.S.A., Inc., Class A(1) | | | 735,100 | | | | 22,869 | |
Vera Bradley, Inc.(1) | | | 660,350 | | | | 13,577 | |
| | | | | | | | |
| | | | | | | 36,446 | |
| CONSUMER STAPLES - 1.2% | | | | | | | | |
Beverages - 0.5% | | | | | | | | |
Cott Corp.(2) | | | 1,721,900 | | | | 13,241 | |
| | | | | | | | |
Food Products - 0.7% | | | | | |
Darling International, Inc.(1) | | | 904,250 | | | | 19,134 | |
| | | | | | | | |
| ENERGY - 13.9% | | | | | | | | |
Energy Equipment & Services - 9.5% | | | | | |
C&J Energy Services, Inc.(1) | | | 684,600 | | | | 13,747 | |
Era Group, Inc.(1) | | | 292,742 | | | | 7,957 | |
Gulfmark Offshore, Inc., Class A | | | 995,350 | | | | 50,653 | |
Key Energy Services, Inc.(1) | | | 2,523,250 | | | | 18,394 | |
Newpark Resources, Inc.(1) | | | 1,944,450 | | | | 24,617 | |
| ENERGY (CONTINUED) | | | | | | | | |
Energy Equipment & Services (Continued) | | | | | | | | |
Parker Drilling Co.(1) | | | 3,271,150 | | | $ | 18,646 | |
SEACOR Holdings, Inc. | | | 177,700 | | | | 16,071 | |
Superior Energy Services, Inc.(1) | | | 635,500 | | | | 15,913 | |
Tesco Corp.(1) | | | 472,900 | | | | 7,836 | |
Tidewater, Inc. | | | 780,100 | | | | 46,252 | |
Unit Corp.(1) | | | 877,350 | | | | 40,788 | |
| | | | | | | | |
| | | | | | | 260,874 | |
Oil, Gas & Consumable Fuels - 4.4% | | | | | | | | |
Cloud Peak Energy, Inc.(1) | | | 2,564,850 | | | | 37,626 | |
Comstock Resources, Inc. | | | 1,429,900 | | | | 22,750 | |
World Fuel Services Corp. | | | 1,660,450 | | | | 61,951 | |
| | | | | | | | |
| | | | | | | 122,327 | |
| FINANCIALS - 6.6% | | | | | | | | |
Diversified Financial Services - 0.9% | | | | | | | | |
PICO Holdings, Inc.(1)(3) | | | 1,150,450 | | | | 24,919 | |
| | | | | | | | |
Insurance - 2.0% | | | | | | | | |
Allied World Assurance Co. Holdings AG | | | 212,500 | | | | 21,120 | |
Platinum Underwriters Holdings Ltd. | | | 594,100 | | | | 35,486 | |
| | | | | | | | |
| | | | | | | 56,606 | |
Real Estate Investment Trusts
(REITs) - 2.9% | | | | | | | | |
Anworth Mortgage Asset Corp. | | | 3,846,850 | | | | 18,580 | |
Campus Crest Communities, Inc. | | | 1,272,159 | | | | 13,739 | |
CYS Investments, Inc. | | | 1,963,400 | | | | 15,963 | |
Hatteras Financial Corp.(3) | | | 1,706,900 | | | | 31,936 | |
| | | | | | | | |
| | | | | | | 80,218 | |
Thrifts & Mortgage Finance - 0.8% | | | | | | | | |
Berkshire Hills Bancorp, Inc. | | | 531,000 | | | | 13,333 | |
Dime Community Bancshares, Inc. | | | 472,550 | | | | 7,868 | |
| | | | | | | | |
| | | | | | | 21,201 | |
| HEALTHCARE - 2.8% | | | | | | | | |
Health Care Equipment &
Supplies -1.3% | | | | | | | | |
CONMED Corp. | | | 555,000 | | | | 18,864 | |
Merit Medical Systems, Inc.(1) | | | 1,295,300 | | | | 15,712 | |
| | | | | | | | |
| | | | | | | 34,576 | |
Health Care Providers &
Services -1.0% | | | | | | | | |
Landauer, Inc. | | | 276,300 | | | | 14,161 | |
Owens & Minor, Inc. | | | 414,200 | | | | 14,327 | |
| | | | | | | | |
| | | | | | | 28,488 | |
Life Sciences Tools &
Services - 0.5% | | | | | | | | |
ICON plc(1)(2) | | | 343,650 | | | | 14,066 | |
| | | | | | | | |
| | | Shares
Held | | | Value | |
| INDUSTRIALS - 25.6% | | | | | | | | |
Aerospace & Defense - 2.1% | | | | | | | | |
Cubic Corp. | | | 504,500 | | | $ | 27,082 | |
Curtiss-Wright Corp. | | | 635,950 | | | | 29,864 | |
| | | | | | | | |
| | | | | | | 56,946 | |
Air Freight & Logistics - 1.1% | | | | | | | | |
Atlas Air Worldwide Holdings, Inc.(1) | | | 686,700 | | | | 31,664 | |
| | | | | | | | |
Airlines - 0.7% | | | | | | | | |
Hawaiian Holdings, Inc.(1)(3) | | | 2,625,450 | | | | 19,533 | |
| | | | | | | | |
Building Products - 0.3% | | | | | | | | |
Quanex Building Products Corp. | | | 374,861 | | | | 7,059 | |
| | | | | | | | |
Commercial Services & Supplies - 1.7% | | | | | | | | |
Quad/Graphics, Inc. | | | 418,600 | | | | 12,709 | |
Tetra Tech, Inc.(1) | | | 1,365,250 | | | | 35,346 | |
| | | | | | | | |
| | | | | | | 48,055 | |
Construction & Engineering - 5.3% | | | | | | | | |
Comfort Systems USA, Inc. | | | 870,650 | | | | 14,635 | |
EMCOR Group, Inc. | | | 1,964,650 | | | | 76,877 | |
Granite Construction, Inc. | | | 754,700 | | | | 23,094 | |
Orion Marine Group, Inc.(1)(3) | | | 1,371,750 | | | | 14,280 | |
Tutor Perini Corp.(1) | | | 771,200 | | | | 16,442 | |
| | | | | | | | |
| | | | | | | 145,328 | |
Electrical Equipment - 1.0% | | | | | | | | |
AZZ, Inc. | | | 225,234 | | | | 9,428 | |
Encore Wire Corp. | | | 460,835 | | | | 18,175 | |
| | | | | | | | |
| | | | | | | 27,603 | |
Machinery - 4.1% | | | | | | | | |
Astec Industries, Inc. | | | 606,000 | | | | 21,792 | |
Global Brass & Copper Holdings, Inc.(1) | | | 716,900 | | | | 12,574 | |
Kaydon Corp. | | | 1,186,000 | | | | 42,127 | |
Mueller Industries, Inc. | | | 137,930 | | | | 7,679 | |
Woodward, Inc. | | | 693,200 | | | | 28,303 | |
| | | | | | | | |
| | | | | | | 112,475 | |
Professional Services - 4.7% | | | | | | | | |
CDI Corp. | | | 64,157 | | | | 982 | |
CRA International, Inc.(1)(3) | | | 602,200 | | | | 11,213 | |
FTI Consulting, Inc.(1) | | | 1,735,450 | | | | 65,600 | |
Towers Watson & Co., Class A | | | 322,350 | | | | 34,478 | |
TrueBlue, Inc.(1) | | | 796,650 | | | | 19,128 | |
| | | | | | | | |
| | | | | | | 131,401 | |
Road & Rail - 3.2% | | | | | | | | |
Celadon Group, Inc. | | | 562,513 | | | | 10,502 | |
Ryder System, Inc.(3) | | | 1,286,750 | | | | 76,819 | |
| | | | | | | | |
| | | | | | | 87,321 | |
Trading Companies & Distributors - 1.4% | | | | | | | | |
Kaman Corp. | | | 482,050 | | | | 18,250 | |
TAL International Group, Inc. | | | 316,000 | | | | 14,767 | |
Textainer Group Holdings Ltd. | | | 180,900 | | | | 6,851 | |
| | | | | | | | |
| | | | | | | 39,868 | |
| INFORMATION TECHNOLOGY - 21.2% | | | | | | | | |
Communications Equipment - 2.7% | | | | | | | | |
ADTRAN, Inc. | | | 2,877,150 | | | $ | 76,647 | |
| | | | | | | | |
Computers & Peripherals - 2.9% | | | | | | | | |
Diebold, Inc. | | | 1,015,097 | | | | 29,803 | |
Lexmark International, Inc., Class A(3) | | | 587,350 | | | | 19,383 | |
QLogic Corp.(1) | | | 2,792,400 | | | | 30,549 | |
| | | | | | | | |
| | | | | | | 79,735 | |
Electronic Equipment, Instruments &
Components - 5.3% | | | | | | | | |
Arrow Electronics, Inc.(1)(3) | | | 961,450 | | | | 46,659 | |
Benchmark Electronics, Inc.(1) | | | 894,700 | | | | 20,480 | |
FARO Technologies, Inc.(1) | | | 212,000 | | | | 8,940 | |
Park Electrochemical Corp. | | | 749,700 | | | | 21,479 | |
Tech Data Corp.(1) | | | 975,950 | | | | 48,709 | |
| | | | | | | | |
| | | | | | | 146,267 | |
Internet Software & Services - 1.3% | | | | | |
Blucora, Inc.(1) | | | 442,861 | | | | 10,177 | |
EarthLink, Inc.(3) | | | 5,406,400 | | | | 26,762 | |
| | | | | | | | |
| | | | | | | 36,939 | |
IT Services - 1.8% | | | | | |
CACI International, Inc., Class A (1) | | | 198,200 | | | | 13,698 | |
Sykes Enterprises, Inc.(1) | | | 1,979,000 | | | | 35,444 | |
| | | | | | | | |
| | | | | | | 49,142 | |
Semiconductors & Semiconductor Equipment - 4.0% | | | | | | | | |
MKS Instruments, Inc. | | | 827,600 | | | | 22,006 | |
Nanometrics, Inc.(1)(3) | | | 1,286,750 | | | | 20,742 | |
Rudolph Technologies, Inc.(1) | | | 1,521,450 | | | | 17,345 | |
Ultratech, Inc.(1)(3) | | | 1,651,500 | | | | 50,040 | |
| | | | | | | | |
| | | | | | | 110,133 | |
Software - 3.2% | | | | | |
MicroStrategy, Inc., Class A (1) | | | 392,450 | | | | 40,721 | |
Progress Software Corp.(1) | | | 1,816,500 | | | | 47,011 | |
| | | | | | | | |
| | | | | | | 87,732 | |
| MATERIALS - 6.4% | | | | | | | | |
Chemicals - 4.6% | | | | | | | | |
American Vanguard Corp. | | | 398,300 | | | | 10,722 | |
HB Fuller Co. | | | 1,719,100 | | | | 77,686 | |
Intrepid Potash, Inc. | | | 1,080,650 | | | | 16,945 | |
Minerals Technologies, Inc. | | | 169,400 | | | | 8,363 | |
Sensient Technologies Corp. | | | 310,200 | | | | 14,856 | |
| | | | | | | | |
| | | | | | | 128,572 | |
Metals & Mining - 1.8% | | | | | | | | |
AuRico Gold, Inc.(2) | | | 2,920,150 | | | | 11,126 | |
Schnitzer Steel Industries, Inc., Class A | | | 1,360,100 | | | | 37,457 | |
| | | | | | | | |
| | | | | | | 48,583 | |
| | | | | | | | |
| | | Shares
Held | | | Value | |
| TELECOMMUNICATION SERVICES - 0.9% | | | | | |
Diversified Telecommunication Services - 0.9% | | | | | | | | |
Atlantic Tele-Network, Inc. | | | 500,800 | | | $ | 26,107 | |
| | | | | | | | |
| | | | | | | | |
Total common stocks
(Cost $1,967,314) | | | | | | | 2,535,072 | |
| | | | | | | | |
| | |
| | | Par
Amount | | | | |
SHORT-TERM INVESTMENTS
(CASH EQUIVALENTS) - 9.3% | | | | | | | | |
Repurchase agreement with Fixed Income Clearing Corporation, 0.00%, dated 9/30/13, due 10/1/13, maturity value $257,835
(Cost $257,835)(4) | | $ | 257,835 | | | $ | 257,835 | |
| | | | | | | | |
| | | | | | | | |
Total investments - 101.0%
(Cost $2,225,149) | | | | | | | 2,792,907 | |
| | | | | | | | |
Other assets less liabilities - (1.0)% | | | | | | | (28,764 | ) |
| | | | | | | | |
| | | | | | | | |
Total net assets - 100.0%(5) | | | | | | $ | 2,764,143 | |
| | | | | | | | |
| (1) | Non-income producing security. |
| (2) | The Fund considers the company to be from outside of the United States. See the Fund’s Statement of Additional Information for information on how a particular country is assigned. |
| | | | | | | | |
Security | | Country | | | Trading Currency | |
AuRico Gold, Inc. | | | Canada | | | | U.S. dollar | |
Cott Corp. | | | Canada | | | | U.S. dollar | |
ICON plc | | | Ireland | | | | U.S. dollar | |
| (3) | Affiliated company as defined by the 1940 Act. See note 11 in Notes to Financial Statements for additional information. |
| | | | | | | | | | | | |
Issuer | | Rate | | | Maturity | | | Value | |
U.S. Treasury Note | | | 3.125 | % | | | 2/15/2042 | | | $ | 75,966 | |
U.S. Treasury Note | | | 8.125 | % | | | 5/15/2021 | | | | 187,026 | |
| | | | | | | | | | | | |
| | | | | | | | | | $ | 262,992 | |
| | | | | | | | | | | | |
| (5) | Percentages for the various classifications relate to total net assets. |
Company names are as reported by a data service provider and in some cases are translations; a company’s legal name may be different.
| | | | | | |
| TOP TEN HOLDINGS - September 30, 2013 | |
Company Name | | Country | | Percentage
of Total
Net Assets | |
HB Fuller Co. | | United States | | | 2.8 | % |
EMCOR Group, Inc. | | United States | | | 2.8 | |
Ryder System, Inc. | | United States | | | 2.8 | |
ADTRAN, Inc. | | United States | | | 2.7 | |
FTI Consulting, Inc. | | United States | | | 2.4 | |
World Fuel Services Corp. | | United States | | | 2.2 | |
Rent-A-Center, Inc. | | United States | | | 2.2 | |
DreamWorks Animation SKG, Inc. | | United States | | | 2.0 | |
Gulfmark Offshore, Inc. | | United States | | | 1.8 | |
Ultratech, Inc. | | United States | | | 1.8 | |
| | | | | | |
Total | | | | | 23.5 | % |
| | | | | | |
For the purpose of determining the Fund’s top ten holdings, securities of the same issuer are aggregated to determine the weight in the Fund.
The accompanying notes are an integral part of the financial statements.
ARTISAN VALUE FUND
Schedule of Investments – September 30, 2013
Dollar values in thousands
| | | | | | | | |
| | | Shares
Held | | | Value | |
| COMMON STOCKS - 83.7% | | | | | | | | |
| | | | | | | | |
| CONSUMER DISCRETIONARY - 3.6% | | | | | | | | |
Auto Components - 3.6% | | | | | | | | |
Cie Generale des Etablissements Michelin(1) | | | 455,100 | | | $ | 50,467 | |
| | | | | | | | |
| CONSUMER STAPLES - 2.0% | | | | | | | | |
Food & Staples Retailing - 2.0% | | | | | | | | |
Kroger Co. | | | 705,665 | | | | 28,466 | |
| | | | | | | | |
| ENERGY - 17.6% | | | | | | | | |
Energy Equipment & Services - 8.6% | | | | | |
Baker Hughes, Inc. | | | 843,580 | | | | 41,420 | |
National Oilwell Varco, Inc. | | | 616,000 | | | | 48,115 | |
Noble Corp. | | | 871,215 | | | | 32,906 | |
| | | | | | | | |
| | | | | | | 122,441 | |
Oil, Gas & Consumable Fuels - 9.0% | | | | | |
Apache Corp. | | | 697,257 | | | | 59,365 | |
Chevron Corp. | | | 263,229 | | | | 31,982 | |
Cimarex Energy Co. | | | 366,677 | | | | 35,348 | |
| | | | | | | | |
| | | | | | | 126,695 | |
| FINANCIALS - 17.2% | | | | | | | | |
Capital Markets - 2.0% | | | | | | | | |
Bank of New York Mellon Corp. | | | 912,745 | | | | 27,556 | |
| | | | | | | | |
Diversified Financial Services - 2.3% | | | | | | | | |
Berkshire Hathaway, Inc., Class B(2) | | | 289,185 | | | | 32,825 | |
| | | | | | | | |
Insurance - 10.8% | | | | | | | | |
Alleghany Corp.(2) | | | 87,141 | | | | 35,697 | |
Allstate Corp. | | | 570,795 | | | | 28,854 | |
Arch Capital Group Ltd.(2)(3) | | | 510,519 | | | | 27,635 | |
Chubb Corp. | | | 359,780 | | | | 32,114 | |
Progressive Corp. | | | 1,047,710 | | | | 28,529 | |
| | | | | | | | |
| | | | | | | 152,829 | |
Real Estate Investment Trusts
(REITs) - 2.1% | | | | | | | | |
Annaly Capital Management, Inc. | | | 2,595,167 | | | | 30,052 | |
| | | | | | | | |
| HEALTHCARE - 3.4% | | | | | | | | |
Health Care Providers & Services - 3.4% | | | | | | | | |
Cigna Corp. | | | 619,290 | | | | 47,599 | |
| | | | | | | | |
| INDUSTRIALS - 3.7% | | | | | | | | |
Construction & Engineering - 1.1% | | | | | |
Jacobs Engineering Group, Inc.(2) | | | 259,627 | | | | 15,105 | |
| | | | | | | | |
Road & Rail - 2.6% | | | | | | | | |
CSX Corp. | | | 1,450,400 | | | | 37,333 | |
| INFORMATION TECHNOLOGY - 24.4% | | | | | | | | |
Communications Equipment - 2.1% | | | | | | | | |
Cisco Systems, Inc. | | | 1,277,830 | | | $ | 29,927 | |
| | | | | | | | |
Computers & Peripherals - 6.4% | | | | | | | | |
Apple, Inc. | | | 188,022 | | | | 89,639 | |
| | | | | | | | |
Electronic Equipment, Instruments & Components - 2.1% | | | | | | | | |
Avnet, Inc.(3) | | | 714,180 | | | | 29,788 | |
| | | | | | | | |
IT Services - 5.9% | | | | | | | | |
International Business Machines Corp. | | | 237,749 | | | | 44,027 | |
Western Union Co. | | | 2,129,055 | | | | 39,728 | |
| | | | | | | | |
| | | | | | | 83,755 | |
Semiconductors & Semiconductor Equipment - 0.8% | | | | | | | | |
Texas Instruments, Inc. | | | 264,731 | | | | 10,661 | |
| | | | | | | | |
Software - 7.1% | | | | | | | | |
Microsoft Corp. | | | 1,289,178 | | | | 42,943 | |
Oracle Corp. | | | 1,742,160 | | | | 57,787 | |
| | | | | | | | |
| | | | | | | 100,730 | |
| MATERIALS - 11.8% | | | | | | | | |
Chemicals - 7.6% | | | | | | | | |
EI du Pont de Nemours & Co. | | | 238,373 | | | | 13,959 | |
LyondellBasell Industries N.V., Class A | | | 480,400 | | | | 35,180 | |
Mosaic Co. | | | 666,630 | | | | 28,678 | |
Potash Corp. of Saskatchewan, Inc.(1) | | | 951,600 | | | | 29,766 | |
| | | | | | | | |
| | | | | | | 107,583 | |
Metals & Mining - 4.2% | | | | | | | | |
Kinross Gold Corp.(1) | | | 5,675,400 | | | | 28,661 | |
Newmont Mining Corp. | | | 1,086,834 | | | | 30,540 | |
| | | | | | | | |
| | | | | | | 59,201 | |
| | | | | | | | |
Total common stocks
(Cost $1,025,753) | | | | | | | 1,182,652 | |
| | | | | | | | |
| PREFERRED STOCKS - 6.6% | | | | | | | | |
| | | | | | | | |
| INFORMATION TECHNOLOGY - 6.6% | | | | | | | | |
Semiconductors & Semiconductor Equipment - 6.6% | | | | | | | | |
Samsung Electronics Co., Ltd.(1)(4) | | | 115,489 | | | | 94,139 | |
| | | | | | | | |
Total preferred stocks
(Cost $82,665) | | | | | | | 94,139 | |
| | | | | | | | |
| | | Par
Amount | | | Value | |
SHORT-TERM INVESTMENTS
(CASH EQUIVALENTS) - 10.3% | | | | | | | | |
Repurchase agreement with Fixed Income Clearing Corporation, 0.00%, dated 9/30/13, due 10/1/13,
maturity value $145,062
(Cost $145,062)(5) | | $ | 145,062 | | | $ | 145,062 | |
| | | | | | | | |
| | | | | | | | |
Total investments - 100.6%
(Cost $1,253,480) | | | | | | | 1,421,853 | |
| | | | | | | | |
Other assets less liabilities - (0.6)% | | | | | | | (8,223 | ) |
| | | | | | | | |
| | | | | | | | |
Total net assets - 100.0%(6) | | | | | | $ | 1,413,630 | |
| | | | | | | | |
| (1) | The Fund considers the company to be from outside of the United States. See the Fund’s Statement of Additional Information for information on how a particular country is assigned. |
| | | | |
Security | | Country | | Trading Currency |
Cie Generale des Etablissements Michelin | | France | | Euro |
Kinross Gold Corp. | | Canada | | U.S. dollar |
Potash Corp. of Saskatchewan, Inc. | | Canada | | U.S. dollar |
Samsung Electronics Co., Ltd. | | Korea | | Korean won |
| (2) | Non-income producing security. |
| (3) | Affiliated company as defined by the 1940 Act. See note 11 in Notes to Financial Statements for additional information. |
| | | | | | | | | | | | |
Issuer | | Rate | | | Maturity | | | Value | |
U.S. Treasury Note | | | 0.750 | % | | | 12/31/2017 | | | $ | 112,844 | |
U.S. Treasury Note | | | 0.875 | % | | | 1/31/2018 | | | | 5,532 | |
U.S. Treasury Note | | | 2.750 | % | | | 11/15/2042 | | | | 18,312 | |
U.S. Treasury Note | | | 8.125 | % | | | 5/15/2021 | | | | 11,279 | |
| | | | | | | | | | | | |
| | | | | | | | | | $ | 147,967 | |
| | | | | | | | | | | | |
| (6) | Percentages for the various classifications relate to total net assets. |
Company names are as reported by a data service provider and in some cases are translations; a company’s legal name may be different.
| | | | | | |
| TOP TEN HOLDINGS - September 30, 2013 | |
Company Name | | Country | | Percentage
of Total
Net Assets | |
Samsung Electronics Co., Ltd. | | Korea | | | 6.6 | % |
Apple, Inc. | | United States | | | 6.4 | |
Apache Corp. | | United States | | | 4.2 | |
Oracle Corp. | | United States | | | 4.1 | |
Cie Generale des Etablissements Michelin | | France | | | 3.6 | |
National Oilwell Varco, Inc. | | United States | | | 3.4 | |
Cigna Corp. | | United States | | | 3.4 | |
International Business Machines Corp. | | United States | | | 3.1 | |
Microsoft Corp. | | United States | | | 3.0 | |
Baker Hughes, Inc. | | United States | | | 2.9 | |
| | | | | | |
Total | | | | | 40.7 | % |
| | | | | | |
For the purpose of determining the Fund’s top ten holdings, securities of the same issuer are aggregated to determine the weight in the Fund.
The accompanying notes are an integral part of the financial statements.
ARTISAN FUNDS
Statements of Assets and Liabilities – September 30, 2013
Dollar values in thousands
| | | | | | | | | | | | | | | | |
| | | EMERGING
MARKETS | | | GLOBAL EQUITY | | | GLOBAL
OPPORTUNITIES | | | GLOBAL
SMALL CAP | |
| ASSETS: | | | | | | | | | | | | | | | | |
Investments in securities, unaffiliated, at value | | $ | 643,023 | | | $ | 152,695 | | | $ | 724,495 | | | $ | 38,878 | |
Short-term investments (repurchase agreements), at value | | | 26,360 | | | | 1,896 | | | | 31,256 | | | | 1,415 | |
Total investments | | | 669,383 | | | | 154,591 | | | | 755,751 | | | | 40,293 | |
Cash | | | 1 | | | | 1 | | | | – | (1) | | | 1 | |
Foreign currency | | | 2,518 | | | | 119 | | | | 387 | | | | 50 | |
Unrealized gain on foreign currency forward contracts | | | – | | | | – | | | | 23 | | | | – | |
Receivable from investments sold | | | 2,247 | | | | 1,902 | | | | 1,299 | | | | – | (1) |
Receivable from fund shares sold | | | 478 | | | | 1,551 | | | | 1,131 | | | | 552 | |
Dividends and interest receivable | | | 1,182 | | | | 127 | | | | 577 | | | | 17 | |
Prepaid offering costs | | | – | | | | – | | | | – | | | | 20 | |
Prepaid expenses | | | 1 | | | | – | (1) | | | – | (1) | | | – | |
Total assets | | | 675,810 | | | | 158,291 | | | | 759,168 | | | | 40,933 | |
| LIABILITIES: | | | | | | | | | | | | | | | | |
Unrealized loss on foreign currency forward contracts | | | – | | | | – | | | | 44 | | | | – | |
Payable for investments purchased | | | 12,650 | | | | 1,973 | | | | 4,305 | | | | 1,273 | |
Payable for fund shares redeemed | | | 365 | | | | 95 | | | | 384 | | | | 20 | |
Payable for operating expenses | | | 287 | | | | 130 | | | | 276 | | | | 62 | |
Payable for foreign taxes | | | 117 | | | | 2 | | | | 10 | | | | – | (1) |
Total liabilities | | | 13,419 | | | | 2,200 | | | | 5,019 | | | | 1,355 | |
Total net assets | | $ | 662,391 | | | $ | 156,091 | | | $ | 754,149 | | | $ | 39,578 | |
| NET ASSETS CONSIST OF: | | | | | | | | | | | | | | | | |
Fund shares issued and outstanding | | $ | 794,866 | | | $ | 141,093 | | | $ | 618,836 | | | $ | 38,693 | |
Net unrealized appreciation (depreciation) on investments and foreign currency related transactions | | | (20,641 | ) | | | 8,009 | | | | 142,247 | | | | 765 | |
Accumulated undistributed net investment income (loss) | | | 2,799 | | | | 2 | | | | (28 | ) | | | 38 | |
Accumulated undistributed net realized gains (losses) on investments and foreign currency related transactions | | | (114,633 | ) | | | 6,987 | | | | (6,906 | ) | | | 82 | |
Total net assets | | $ | 662,391 | | | $ | 156,091 | | | $ | 754,149 | | | $ | 39,578 | |
| SUPPLEMENTARY INFORMATION: | | | | | | | | | | | | | | | | |
Net assets | | | | | | | | | | | | | | | | |
Investor Shares | | | | | | $ | 156,091 | | | $ | 542,242 | | | $ | 39,578 | |
Institutional Shares | | $ | 462,471 | | | | | | | $ | 211,907 | | | | | |
Advisor Shares | | $ | 199,920 | | | | | | | | | | | | | |
Shares outstanding (Indefinite number of shares authorized, $0.01 par value) | | | | | | | | | | | | | | | | |
Investor Shares | | | | | | | 9,931,337 | | | | 31,365,709 | | | | 3,729,145 | |
Institutional Shares | | | 37,549,902 | | | | | | | | 12,213,651 | | | | | |
Advisor Shares | | | 16,229,726 | | | | | | | | | | | | | |
Net asset value per share | | | | | | | | | | | | | | | | |
Investor Shares | | | | | | $ | 15.72 | | | $ | 17.29 | | | $ | 10.61 | |
Institutional Shares | | $ | 12.32 | | | | | | | $ | 17.35 | | | | | |
Advisor Shares | | $ | 12.32 | | | | | | | | | | | | | |
Cost of securities of unaffiliated issuers held | | $ | 690,003 | | | $ | 146,580 | | | $ | 613,495 | | | $ | 39,527 | |
Cost of foreign currency | | $ | 2,518 | | | $ | 119 | | | $ | 384 | | | $ | 50 | |
| (1) | Amount rounds to less than $1 |
The accompanying notes are an integral part of the financial statements.
ARTISAN FUNDS
Statements of Assets and Liabilities – September 30, 2013 (Continued)
Dollar values in thousands
| | | | | | | | | | | | |
| | | GLOBAL VALUE | | | INTERNATIONAL | | | INTERNATIONAL SMALL CAP | |
| ASSETS: | | | | | | | | | | | | |
Investments in securities, unaffiliated, at value | | $ | 979,158 | | | $ | 13,046,147 | | | $ | 954,556 | |
Investments in securities, affiliated, at value | | | 34,931 | | | | – | | | | – | |
Short-term investments (repurchase agreements), at value | | | 135,568 | | | | 302,475 | | | | 34,870 | |
Total investments | | | 1,149,657 | | | | 13,348,622 | | | | 989,426 | |
Cash | | | 1 | | | | – | (1) | | | – | (1) |
Foreign currency | | | 241 | | | | 1,589 | | | | 649 | |
Unrealized gain on foreign currency forward contracts | | | 33 | | | | – | | | | – | |
Receivable from investments sold | | | 1,643 | | | | 31,450 | | | | 6,128 | |
Receivable from fund shares sold | | | 5,760 | | | | 35,829 | | | | 1,429 | |
Dividends and interest receivable | | | 701 | | | | 39,607 | | | | 1,699 | |
Prepaid expenses | | | – | (1) | | | 14 | | | | 1 | |
Total assets | | | 1,158,036 | | | | 13,457,111 | | | | 999,332 | |
| LIABILITIES: | | | | | | | | | | | | |
Unrealized loss on foreign currency forward contracts | | | 18 | | | | – | | | | – | |
Payable for investments purchased | | | 12,343 | | | | 23,213 | | | | 1,613 | |
Payable for fund shares redeemed | | | 445 | | | | 8,110 | | | | 1,255 | |
Payable for operating expenses | | | 385 | | | | 3,482 | | | | 294 | |
Payable for foreign taxes* | | | 24 | | | | 1,082 | | | | 20 | |
Total liabilities | | | 13,215 | | | | 35,887 | | | | 3,182 | |
Total net assets | | $ | 1,144,821 | | | $ | 13,421,224 | | | $ | 996,150 | |
| NET ASSETS CONSIST OF: | | | | | | | | | | | | |
Fund shares issued and outstanding | | $ | 992,768 | | | $ | 11,173,456 | | | $ | 665,588 | |
Net unrealized appreciation on investments and foreign currency related transactions | | | 132,770 | | | | 3,215,206 | | | | 284,404 | |
Accumulated undistributed net investment income | | | 3,187 | | | | 142,206 | | | | 2,616 | |
Accumulated undistributed net realized gains (losses) on investments and foreign currency related transactions | | | 16,096 | | | | (1,109,644 | ) | | | 43,542 | |
Total net assets | | $ | 1,144,821 | | | $ | 13,421,224 | | | $ | 996,150 | |
| SUPPLEMENTARY INFORMATION: | | | | | | | | | | | | |
Net assets | | | | | | | | | | | | |
Investor Shares | | $ | 783,265 | | | $ | 9,829,540 | | | $ | 996,150 | |
Institutional Shares | | $ | 361,556 | | | $ | 3,591,684 | | | | | |
Shares outstanding (Indefinite number of shares authorized, $0.01 par value) | | | | | | | | | | | | |
Investor Shares | | | 54,229,822 | | | | 343,008,822 | | | | 37,746,034 | |
Institutional Shares | | | 25,005,087 | | | | 124,442,227 | | | | | |
Net asset value per share | | | | | | | | | | | | |
Investor Shares | | $ | 14.44 | | | $ | 28.66 | | | $ | 26.39 | |
Institutional Shares | | $ | 14.46 | | | $ | 28.86 | | | | | |
Cost of securities of unaffiliated issuers held | | $ | 987,691 | | | $ | 10,134,249 | | | $ | 705,038 | |
Cost of securities of affiliated issuers held | | $ | 29,220 | | | $ | – | | | $ | – | |
Cost of foreign currency | | $ | 239 | | | $ | 1,556 | | | $ | 649 | |
| | | |
*Including foreign taxes on unrealized gains | | $ | 9 | | | $ | – | | | $ | – | |
| (1) | Amount rounds to less than $1 |
The accompanying notes are an integral part of the financial statements.
ARTISAN FUNDS
Statements of Assets and Liabilities – September 30, 2013 (Continued)
Dollar values in thousands
| | | | | | | | | | | | |
| | | INTERNATIONAL
VALUE | | | MID CAP | | | MID CAP VALUE | |
| ASSETS: | | | | | | | | | | | | |
Investments in securities, unaffiliated, at value | | $ | 7,900,346 | | | $ | 8,061,241 | | | $ | 8,140,164 | |
Investments in securities, affiliated, at value | | | 1,175,182 | | | | 722,095 | | | | 1,897,163 | |
Short-term investments (repurchase agreements), at value | | | 1,364,272 | | | | 296,956 | | | | 784,678 | |
Total investments | | | 10,439,800 | | | | 9,080,292 | | | | 10,822,005 | |
Cash | | | 1 | | | | 51 | | | | 1 | |
Foreign currency | | | 2,456 | | | | – | | | | – | |
Unrealized gain on foreign currency forward contracts | | | 746 | | | | – | | | | – | |
Receivable from investments sold | | | 25,539 | | | | 46,739 | | | | 35,176 | |
Receivable from fund shares sold | | | 24,246 | | | | 66,124 | | | | 76,056 | |
Dividends and interest receivable | | | 19,527 | | | | 947 | | | | 14,311 | |
Prepaid expenses | | | 12 | | | | 10 | | | | 11 | |
Total assets | | | 10,512,327 | | | | 9,194,163 | | | | 10,947,560 | |
| LIABILITIES: | | | | | | | | | | | | |
Unrealized loss on foreign currency forward contracts | | | 765 | | | | – | | | | – | |
Payable for investments purchased | | | 44,870 | | | | 64,470 | | | | 74,074 | |
Payable for fund shares redeemed | | | 13,482 | | | | 50,375 | | | | 73,685 | |
Payable for operating expenses | | | 2,655 | | | | 2,549 | | | | 3,761 | |
Payable for foreign taxes* | | | 413 | | | | – | | | | – | |
Total liabilities | | | 62,185 | | | | 117,394 | | | | 151,520 | |
Total net assets | | $ | 10,450,142 | | | $ | 9,076,769 | | | $ | 10,796,040 | |
| NET ASSETS CONSIST OF: | | | | | | | | | | | | |
Fund shares issued and outstanding | | $ | 7,316,118 | | | $ | 4,978,421 | | | $ | 7,568,548 | |
Net unrealized appreciation on investments and foreign currency related transactions | | | 2,437,201 | | | | 3,557,747 | | | | 2,800,654 | |
Accumulated undistributed net investment income (loss) | | | 159,263 | | | | (39,542 | ) | | | 35,226 | |
Accumulated undistributed net realized gains on investments and foreign currency related transactions | | | 537,560 | | | | 580,143 | | | | 391,612 | |
Total net assets | | $ | 10,450,142 | | | $ | 9,076,769 | | | $ | 10,796,040 | |
| SUPPLEMENTARY INFORMATION: | | | | | | | | | | | | |
Net assets | | | | | | | | | | | | |
Investor Shares | | $ | 8,158,057 | | | $ | 5,525,387 | | | $ | 9,429,674 | |
Institutional Shares | | $ | 2,292,085 | | | $ | 3,551,382 | | | $ | 1,366,366 | |
Shares outstanding (Indefinite number of shares authorized, $0.01 par value) | | | | | | | | | | | | |
Investor Shares | | | 220,436,610 | | | | 113,471,442 | | | | 357,953,097 | |
Institutional Shares | | | 61,740,363 | | | | 69,974,278 | | | | 51,791,224 | |
Net asset value per share | | | | | | | | | | | | |
Investor Shares | | $ | 37.01 | | | $ | 48.69 | | | $ | 26.34 | |
Institutional Shares | | $ | 37.12 | | | $ | 50.75 | | | $ | 26.38 | |
Cost of securities of unaffiliated issuers held | | $ | 7,289,549 | | | $ | 5,049,591 | | | $ | 6,527,934 | |
Cost of securities of affiliated issuers held | | $ | 713,428 | | | $ | 472,954 | | | $ | 1,493,417 | |
Cost of foreign currency | | $ | 2,443 | | | $ | – | | | $ | – | |
| | | |
*Including foreign taxes on unrealized gains | | $ | 93 | | | $ | – | | | $ | – | |
The accompanying notes are an integral part of the financial statements.
ARTISAN FUNDS
Statements of Assets and Liabilities – September 30, 2013 (Continued)
Dollar values in thousands
| | | | | | | | | | | | |
| | | SMALL CAP | | | SMALL CAP VALUE | | | VALUE | |
| ASSETS: | | | | | | | | | | | | |
Investments in securities, unaffiliated, at value | | $ | 1,312,556 | | | $ | 2,192,786 | | | $ | 1,219,368 | |
Investments in securities, affiliated, at value | | | 165,635 | | | | 342,286 | | | | 57,423 | |
Short-term investments (repurchase agreements), at value | | | 70,646 | | | | 257,835 | | | | 145,062 | |
Total investments | | | 1,548,837 | | | | 2,792,907 | | | | 1,421,853 | |
Cash | | | – | (1) | | | 1 | | | | 1 | |
Foreign currency | | | – | | | | – | | | | – | (1) |
Receivable from investments sold | | | 4,808 | | | | 2,223 | | | | 9,485 | |
Receivable from fund shares sold | | | 10,264 | | | | 2,203 | | | | 3,093 | |
Dividends and interest receivable | | | 20 | | | | 2,657 | | | | 1,339 | |
Prepaid expenses | | | 1 | | | | 4 | | | | 2 | |
Total assets | | | 1,563,930 | | | | 2,799,995 | | | | 1,435,773 | |
| LIABILITIES: | | | | | | | | | | | | |
Payable for investments purchased | | | 6,222 | | | | 13,921 | | | | 19,794 | |
Payable for fund shares redeemed | | | 2,251 | | | | 20,706 | | | | 1,847 | |
Payable for operating expenses | | | 499 | | | | 1,225 | | | | 473 | |
Payable for foreign taxes | | | – | | | | – | | | | 29 | |
Total liabilities | | | 8,972 | | | | 35,852 | | | | 22,143 | |
Total net assets | | $ | 1,554,958 | | | $ | 2,764,143 | | | $ | 1,413,630 | |
| NET ASSETS CONSIST OF: | | | | | | | | | | | | |
Fund shares issued and outstanding | | $ | 1,200,591 | | | $ | 2,168,639 | | | $ | 1,206,341 | |
Net unrealized appreciation on investments and foreign currency related transactions | | | 458,496 | | | | 567,758 | | | | 168,373 | |
Accumulated undistributed net investment income (loss) | | | (8,571 | ) | | | – | | | | 4,908 | |
Accumulated undistributed net realized gains (losses) on investments and foreign currency related transactions | | | (95,558 | ) | | | 27,746 | | | | 34,008 | |
Total net assets | | $ | 1,554,958 | | | $ | 2,764,143 | | | $ | 1,413,630 | |
| SUPPLEMENTARY INFORMATION: | | | | | | | | | | | | |
Net assets | | | | | | | | | | | | |
Investor Shares | | $ | 1,330,188 | | | $ | 2,421,658 | | | $ | 1,164,460 | |
Institutional Shares | | $ | 224,770 | | | $ | 342,485 | | | $ | 249,170 | |
Shares outstanding (Indefinite number of shares authorized, $0.01 par value) | | | | | | | | | | | | |
Investor Shares | | | 48,100,730 | | | | 134,114,633 | | | | 87,015,141 | |
Institutional Shares | | | 8,115,895 | | | | 18,946,606 | | | | 18,573,226 | |
Net asset value per share | | | | | | | | | | | | |
Investor Shares | | $ | 27.65 | | | $ | 18.06 | | | $ | 13.38 | |
Institutional Shares | | $ | 27.70 | | | $ | 18.08 | | | $ | 13.42 | |
Cost of securities of unaffiliated issuers held | | $ | 984,171 | | | $ | 1,967,511 | | | $ | 1,215,349 | |
Cost of securities of affiliated issuers held | | $ | 106,170 | | | $ | 257,638 | | | $ | 38,131 | |
Cost of foreign currency | | $ | – | | | $ | – | | | $ | – | (1) |
| (1) | Amount rounds to less than $1 |
The accompanying notes are an integral part of the financial statements.
ARTISAN FUNDS
Statements of Operations – For the Year Ended September 30, 2013
Dollar values in thousands
| | | | | | | | | | | | | | | | |
| | | EMERGING
MARKETS | | | GLOBAL EQUITY | | | GLOBAL
OPPORTUNITIES | | | GLOBAL SMALL
CAP(1) | |
| INVESTMENT INCOME: | | | | | | | | | | | | | | | | |
Dividends, from unaffiliated issuers(3) | | $ | 15,967 | | | $ | 1,095 | | | $ | 5,133 | | | $ | 126 | |
Interest | | | 2 | | | | – | (2) | | | 2 | | | | – | (2) |
Total investment income | | | 15,969 | | | | 1,095 | | | | 5,135 | | | | 126 | |
| EXPENSES: | | | | | | | | | | | | | | | | |
Advisory fees | | | 7,295 | | | | 772 | | | | 4,692 | | | | 67 | |
Transfer agent fees | | | | | | | | | | | | | | | | |
Investor Shares | | | | | | | 261 | | | | 1,031 | | | | 24 | |
Institutional Shares | | | 20 | | | | | | | | 19 | | | | | |
Advisor Shares | | | 653 | | | | | | | | | | | | | |
Shareholder communications | | | | | | | | | | | | | | | | |
Investor Shares | | | | | | | 22 | | | | 105 | | | | 6 | |
Institutional Shares | | | 13 | | | | | | | | 18 | | | | | |
Advisor Shares | | | 51 | | | | | | | | | | | | | |
Custodian fees | | | 571 | | | | 121 | | | | 143 | | | | 20 | |
Accounting fees | | | 69 | | | | 53 | | | | 69 | | | | 8 | |
Professional fees | | | 141 | | | | 54 | | | | 65 | | | | 27 | |
Offering fees | | | – | | | | – | | | | – | | | | 7 | |
Registration fees | | | | | | | | | | | | | | | | |
Investor Shares | | | | | | | 66 | | | | 87 | | | | 8 | |
Institutional Shares | | | 32 | | | | | | | | 61 | | | | | |
Advisor Shares | | | 33 | | | | | | | | | | | | | |
Directors’ fees | | | 20 | | | | 6 | | | | 12 | | | | 1 | |
Other operating expenses | | | 25 | | | | 7 | | | | 17 | | | | 1 | |
Total operating expenses | | | 8,923 | | | | 1,362 | | | | 6,319 | | | | 169 | |
Less amounts waived or paid by the Advisor | | | – | | | | (205 | ) | | | – | | | | (68 | ) |
Net expenses | | | 8,923 | | | | 1,157 | | | | 6,319 | | | | 101 | |
Net investment income (loss) | | | 7,046 | | | | (62 | ) | | | (1,184 | ) | | | 25 | |
| NET REALIZED AND UNREALIZED GAINS (LOSSES) ON INVESTMENTS: | |
Net realized gain (loss) on: | | | | | | | | | | | | | | | | |
Investments, from unaffiliated issuers(4) | | | (21,185 | ) | | | 7,643 | | | | (22 | ) | | | 81 | |
Foreign currency related transactions | | | (663 | ) | | | 6 | | | | 762 | | | | 13 | |
Total realized gain (loss) | | | (21,848 | ) | | | 7,649 | | | | 740 | | | | 94 | |
Net increase (decrease) in unrealized appreciation or depreciation on: | | | | | | | | | | | | | | | | |
Investments, from unaffiliated issuers(5) | | | 5,799 | | | | 5,538 | | | | 102,667 | | | | 766 | |
Foreign currency related transactions | | | (23 | ) | | | 1 | | | | 16 | | | | (1 | ) |
Total increase in unrealized appreciation or depreciation | | | 5,776 | | | | 5,539 | | | | 102,683 | | | | 765 | |
Net gain (loss) on investments and foreign currency related transactions | | | (16,072 | ) | | | 13,188 | | | | 103,423 | | | | 859 | |
Net increase (decrease) in net assets resulting from operations | | $ | (9,026 | ) | | $ | 13,126 | | | $ | 102,239 | | | $ | 884 | |
(1) For the period from commencement of operations (June 25, 2013) through September 30, 2013 | | | | | | | | | | | | | | | | |
(2) Amount rounds to less than $1 | | | | | | | | | | | | | | | | |
| | | | |
(3) Net of foreign taxes withheld on dividends, unaffiliated issuers | | $ | 1,654 | | | $ | 57 | | | $ | 134 | | | $ | 6 | |
(4) Net of foreign taxes on realized gains | | | 223 | | | | 13 | | | | – | | | | – | |
(5) Net of increase (decrease) in foreign taxes on unrealized gains | | | (1,066 | ) | | | – | | | | (33 | ) | | | – | |
The accompanying notes are an integral part of the financial statements.
ARTISAN FUNDS
Statements of Operations – For the Year Ended September 30, 2013 (Continued)
Dollar values in thousands
| | | | | | | | | | | | |
| | | GLOBAL VALUE | | | INTERNATIONAL | | | INTERNATIONAL
SMALL CAP | |
| INVESTMENT INCOME: | | | | | | | | | | | | |
Dividends, from unaffiliated issuers(1) | | $ | 10,433 | | | $ | 276,095 | | | $ | 14,502 | |
Interest | | | 5 | | | | 18 | | | | 3 | |
Total investment income | | | 10,438 | | | | 276,113 | | | | 14,505 | |
| EXPENSES: | | | | | | | | | | | | |
Advisory fees | | | 5,894 | | | | 106,608 | | | | 10,668 | |
Transfer agent fees | | | | | | | | | | | | |
Investor Shares | | | 1,165 | | | | 17,513 | | | | 1,479 | |
Institutional Shares | | | 16 | | | | 26 | | | | | |
Shareholder communications | | | | | | | | | | | | |
Investor Shares | | | 97 | | | | 1,333 | | | | 79 | |
Institutional Shares | | | 12 | | | | 94 | | | | | |
Custodian fees | | | 121 | | | | 3,536 | | | | 396 | |
Accounting fees | | | 70 | | | | 70 | | | | 51 | |
Professional fees | | | 54 | | | | 425 | | | | 92 | |
Registration fees | | | | | | | | | | | | |
Investor Shares | | | 136 | | | | 233 | | | | 62 | |
Institutional Shares | | | 59 | | | | 63 | | | | | |
Directors’ fees | | | 13 | | | | 300 | | | | 23 | |
Other operating expenses | | | 13 | | | | 196 | | | | 20 | |
Total operating expenses | | | 7,650 | | | | 130,397 | | | | 12,870 | |
Net investment income | | | 2,788 | | | | 145,716 | | | | 1,635 | |
| NET REALIZED AND UNREALIZED GAINS (LOSSES) ON INVESTMENTS: | | | | | |
Net realized gain (loss) on: | | | | | | | | | | | | |
Investments, from unaffiliated issuers | | | 17,750 | | | | 697,841 | | | | 79,981 | |
Investments, from affiliated issuers | | | (29 | ) | | | – | | | | – | |
Foreign currency related transactions | | | 1,979 | | | | (1,814 | ) | | | 268 | |
Total realized gain | | | 19,700 | | | | 696,027 | | | | 80,249 | |
Net increase in unrealized appreciation or depreciation on: | | | | | | | | | | | | |
Investments, from unaffiliated issuers(2) | | | 100,398 | | | | 1,546,232 | | | | 126,463 | |
Investments, from affiliated issuers | | | 3,981 | | | | – | | | | – | |
Foreign currency related transactions | | | 96 | | | | 908 | | | | 27 | |
Total increase in unrealized appreciation or depreciation | | | 104,475 | | | | 1,547,140 | | | | 126,490 | |
Net gain on investments and foreign currency related transactions | | | 124,175 | | | | 2,243,167 | | | | 206,739 | |
Net increase in net assets resulting from operations | | $ | 126,963 | | | $ | 2,388,883 | | | $ | 208,374 | |
(1) Net of foreign taxes withheld on dividends, unaffiliated issuers | | $ | 303 | | | $ | 20,011 | | | $ | 823 | |
(2) Net of increase (decrease) in foreign taxes on unrealized gains | | | 9 | | | | (87 | ) | | | – | |
The accompanying notes are an integral part of the financial statements.
artisan funds
Statements of Operations – For the Year Ended September 30, 2013 (Continued)
Dollar values in thousands
| | | | | | | | | | | | |
| | | INTERNATIONAL
VALUE | | | MID CAP | | | MID CAP VALUE | |
| INVESTMENT INCOME: | | | | | | | | | | | | |
Dividends, from unaffiliated issuers(1) | | $ | 151,015 | | | $ | 41,191 | | | $ | 143,784 | |
Dividends, from affiliated issuers(2) | | | 20,103 | | | | 2,412 | | | | 27,106 | |
Interest | | | 71 | | | | 26 | | | | 42 | |
Total investment income | | | 171,189 | | | | 43,629 | | | | 170,932 | |
| EXPENSES: | | | | | | | | | | | | |
Advisory fees | | | 79,573 | | | | 70,115 | | | | 86,012 | |
Transfer agent fees | | | | | | | | | | | | |
Investor Shares | | | 11,761 | | | | 12,966 | | | | 19,447 | |
Institutional Shares | | | 24 | | | | 30 | | | | 24 | |
Shareholder communications | | | | | | | | | | | | |
Investor Shares | | | 938 | | | | 1,085 | | | | 2,581 | |
Institutional Shares | | | 62 | | | | 119 | | | | 21 | |
Custodian fees | | | 1,783 | | | | 151 | | | | 162 | |
Accounting fees | | | 69 | | | | 57 | | | | 57 | |
Professional fees | | | 300 | | | | 256 | | | | 333 | |
Registration fees | | | | | | | | | | | | |
Investor Shares | | | 311 | | | | 123 | | | | 195 | |
Institutional Shares | | | 66 | | | | 229 | | | | 221 | |
Directors’ fees | | | 219 | | | | 198 | | | | 243 | |
Other operating expenses | | | 132 | | | | 131 | | | | 160 | |
Total operating expenses | | | 95,238 | | | | 85,460 | | | | 109,456 | |
Net investment income (loss) | | | 75,951 | | | | (41,831 | ) | | | 61,476 | |
| NET REALIZED AND UNREALIZED GAINS (LOSSES) ON INVESTMENTS: | |
Net realized gain (loss) on: | | | | | | | | | | | | |
Investments, from unaffiliated issuers | | | 521,533 | | | | 717,544 | | | | 478,655 | |
Investments, from affiliated issuers | | | 92,212 | | | | 17,313 | | | | (3,029 | ) |
Foreign currency related transactions | | | 114,018 | | | | – | | | | – | |
Total realized gain | | | 727,763 | | | | 734,857 | | | | 475,626 | |
Net increase in unrealized appreciation or depreciation on: | | | | | | | | | | | | |
Investments, from unaffiliated issuers(3) | | | 1,241,780 | | | | 1,294,858 | | | | 1,540,909 | |
Investments, from affiliated issuers | | | 234,472 | | | | 160,282 | | | | 421,781 | |
Foreign currency related transactions | | | 5,442 | | | | – | | | | – | |
Total increase in unrealized appreciation or depreciation | | | 1,481,694 | | | | 1,455,140 | | | | 1,962,690 | |
Net gain on investments and foreign currency related transactions | | | 2,209,457 | | | | 2,189,997 | | | | 2,438,316 | |
Net increase in net assets resulting from operations | | $ | 2,285,408 | | | $ | 2,148,166 | | | $ | 2,499,792 | |
(1) Net of foreign taxes withheld on dividends, unaffiliated issuers | | $ | 8,900 | | | $ | 87 | | | $ | 407 | |
(2) Net of foreign taxes withheld on dividends, affiliated issuers | | | 760 | | | | – | | | | – | |
(3) Net of increase in foreign taxes on unrealized gains | | | 93 | | | | – | | | | – | |
The accompanying notes are an integral part of the financial statements.
ARTISAN FUNDS
Statements of Operations – For the Year Ended September 30, 2013 (Continued)
Dollar values in thousands
| | | | | | | | | | | | |
| | | SMALL CAP | | | SMALL CAP
VALUE | | | VALUE | |
| INVESTMENT INCOME: | | | | | | | | | | | | |
Dividends, from unaffiliated issuers(1) | | $ | 3,604 | | | $ | 29,701 | | | $ | 19,566 | |
Dividends, from affiliated issuers | | | 203 | | | | 14,972 | | | | 85 | |
Interest | | | 4 | | | | 13 | | | | 5 | |
Total investment income | | | 3,811 | | | | 44,686 | | | | 19,656 | |
| EXPENSES: | | | | | | | | | | | | |
Advisory fees | | | 10,341 | | | | 24,930 | | | | 7,012 | |
Transfer agent fees | | | | | | | | | | | | |
Investor Shares | | | 1,999 | | | | 5,604 | | | | 2,132 | |
Institutional Shares | | | 18 | | | | 19 | | | | 20 | |
Shareholder communications | | | | | | | | | | | | |
Investor Shares | | | 247 | | | | 660 | | | | 185 | |
Institutional Shares | | | 10 | | | | 59 | | | | 22 | |
Custodian fees | | | 39 | | | | 67 | | | | 57 | |
Accounting fees | | | 58 | | | | 58 | | | | 68 | |
Professional fees | | | 77 | | | | 118 | | | | 64 | |
Registration fees | | | | | | | | | | | | |
Investor Shares | | | 110 | | | | 93 | | | | 91 | |
Institutional Shares | | | 48 | | | | 34 | | | | 31 | |
Directors’ fees | | | 26 | | | | 73 | | | | 26 | |
Other operating expenses | | | 21 | | | | 61 | | | | 23 | |
Total operating expenses | | | 12,994 | | | | 31,776 | | | | 9,731 | |
Net investment income (loss) | | | (9,183 | ) | | | 12,910 | | | | 9,925 | |
| NET REALIZED AND UNREALIZED GAINS (LOSSES) ON INVESTMENTS: | |
Net realized gain (loss) on: | | | | | | | | | | | | |
Investments, from unaffiliated issuers | | | 34,660 | | | | 52,159 | | | | 75,032 | |
Investments, from affiliated issuers | | | (1,438 | ) | | | 1,966 | | | | 2,872 | |
Foreign currency related transactions | | | – | | | | 1 | | | | (54 | ) |
Total realized gain | | | 33,222 | | | | 54,126 | | | | 77,850 | |
Net increase in unrealized appreciation or depreciation on: | | | | | | | | | | | | |
Investments, from unaffiliated issuers | | | 274,668 | | | | 392,532 | | | | 70,099 | |
Investments, from affiliated issuers | | | 40,875 | | | | 64,885 | | | | 13,619 | |
Foreign currency related transactions | | | – | | | | – | | | | 3 | |
Total increase in unrealized appreciation or depreciation | | | 315,543 | | | | 457,417 | | | | 83,721 | |
Net gain on investments and foreign currency related transactions | | | 348,765 | | | | 511,543 | | | | 161,571 | |
Net increase in net assets resulting from operations | | $ | 339,582 | | | $ | 524,453 | | | $ | 171,496 | |
(1) Net of foreign taxes withheld on dividends, unaffiliated issuers | | $ | – | | | $ | 21 | | | $ | 311 | |
The accompanying notes are an integral part of the financial statements.
ARTISAN FUNDS
Statements of Changes in Net Assets
Dollar values in thousands
| | | | | | | | | | | | | | | | |
| | | EMERGING MARKETS | | | GLOBAL EQUITY | |
| | | Year Ended
9/30/2013 | | | Year Ended
9/30/2012 | | | Year Ended
9/30/2013 | | | Year Ended
9/30/2012 | |
| OPERATIONS: | | | | | | | | | | | | | | | | |
Net investment income (loss) | | $ | 7,046 | | | $ | 8,746 | | | $ | (62 | ) | | $ | 53 | |
Net realized gain (loss) on: | | | | | | | | | | | | | | | | |
Investments, from unaffiliated issuers | | | (21,185 | ) | | | (80,098 | ) | | | 7,643 | | | | 684 | |
Foreign currency related transactions | | | (663 | ) | | | (735 | ) | | | 6 | | | | (1 | ) |
Net increase (decrease) in unrealized appreciation or depreciation on: | | | | | | | | | | | | | | | | |
Investments, from unaffiliated issuers | | | 5,799 | | | | 163,379 | | | | 5,538 | | | | 2,936 | |
Foreign currency related transactions | | | (23 | ) | | | 77 | | | | 1 | | | | (2 | ) |
Net increase (decrease) in net assets resulting from operations | | | (9,026 | ) | | | 91,369 | | | | 13,126 | | | | 3,670 | |
| DISTRIBUTIONS PAID TO SHAREHOLDERS: | | | | | | | | | | | | | | | | |
Net investment income: | | | | | | | | | | | | | | | | |
Investor Shares | | | | | | | | | | | (47 | ) | | | (28 | ) |
Institutional Shares | | | (7,538 | ) | | | (3,946 | ) | | | | | | | | |
Advisor Shares | | | (3,431 | ) | | | (1,843 | ) | | | | | | | | |
Net realized gains on investment transactions: | | | | | | | | | | | | | | | | |
Investor Shares | | | | | | | | | | | (857 | ) | | | (191 | ) |
Institutional Shares | | | – | | | | (1,096 | ) | | | | | | | | |
Advisor Shares | | | – | | | | (777 | ) | | | | | | | | |
Total distributions paid to shareholders | | | (10,969 | ) | | | (7,662 | ) | | | (904 | ) | | | (219 | ) |
| FUND SHARE ACTIVITIES: | | | | | | | | | | | | | | | | |
Net increase (decrease) in net assets resulting from fund share activities | | | (104,870 | ) | | | 34,270 | | | | 128,331 | | | | 1,179 | |
Total increase (decrease) in net assets | | | (124,865 | ) | | | 117,977 | | | | 140,553 | | | | 4,630 | |
Net assets, beginning of period | | | 787,256 | | | | 669,279 | | | | 15,538 | | | | 10,908 | |
Net assets, end of period | | $ | 662,391 | | | $ | 787,256 | | | $ | 156,091 | | | $ | 15,538 | |
Accumulated undistributed net investment income (loss) | | $ | 2,799 | | | $ | 6,546 | | | $ | 2 | | | $ | 47 | |
The accompanying notes are an integral part of the financial statements.
ARTISAN FUNDS
Statements of Changes in Net Assets (Continued)
Dollar values in thousands
| | | | | | | | | | | | |
| | | GLOBAL OPPORTUNITIES | | | GLOBAL SMALL CAP | |
| | | Year Ended
9/30/2013 | | | Year Ended
9/30/2012 | | | Period Ended
9/30/2013(1) | |
| OPERATIONS: | | | | | | | | | | | | |
Net investment income (loss) | | $ | (1,184 | ) | | $ | (716 | ) | | $ | 25 | |
Net realized gain (loss) on: | | | | | | | | | | | | |
Investments, from unaffiliated issuers | | | (22 | ) | | | 16,957 | | | | 81 | |
Foreign currency related transactions | | | 762 | | | | (88 | ) | | | 13 | |
Net increase (decrease) in unrealized appreciation or depreciation on: | | | | | | | | | | | | |
Investments, from unaffiliated issuers | | | 102,667 | | | | 36,773 | | | | 766 | |
Foreign currency related transactions | | | 16 | | | | (32 | ) | | | (1 | ) |
Net increase in net assets resulting from operations | | | 102,239 | | | | 52,894 | | | | 884 | |
| DISTRIBUTIONS PAID TO SHAREHOLDERS: | | | | | | | | | | | | |
Net realized gains on investment transactions: | | | | | | | | | | | | |
Investor Shares | | | – | | | | (1,240 | ) | | | – | |
Institutional Shares | | | – | | | | (371 | ) | | | | |
Total distributions paid to shareholders | | | – | | | | (1,611 | ) | | | – | |
| FUND SHARE ACTIVITIES: | | | | | | | | | | | | |
Net increase in net assets resulting from fund share activities | | | 339,637 | | | | 105,263 | | | | 38,694 | |
Total increase in net assets | | | 441,876 | | | | 156,546 | | | | 39,578 | |
Net assets, beginning of period | | | 312,273 | | | | 155,727 | | | | – | |
Net assets, end of period | | $ | 754,149 | | | $ | 312,273 | | | $ | 39,578 | |
Accumulated undistributed net investment income (loss) | | $ | (28 | ) | | $ | (531 | ) | | $ | 38 | |
| (1) | For the period from commencement of operations (June 25, 2013) through September 30, 2013 |
The accompanying notes are an integral part of the financial statements.
ARTISAN FUNDS
Statements of Changes in Net Assets (Continued)
Dollar values in thousands
| | | | | | | | | | | | | | | | |
| | | GLOBAL VALUE | | | INTERNATIONAL | |
| | | Year Ended
9/30/2013 | | | Year Ended
9/30/2012 | | | Year Ended
9/30/2013 | | | Year Ended
9/30/2012 | |
| OPERATIONS: | | | | | | | | | | | | | | | | |
Net investment income | | $ | 2,788 | | | $ | 683 | | | $ | 145,716 | | | $ | 121,639 | |
Net realized gain (loss) on: | | | | | | | | | | | | | | | | |
Investments, from unaffiliated issuers | | | 17,750 | | | | 502 | | | | 697,841 | | | | 179,992 | |
Investments, from affiliated issuers | | | (29 | ) | | | (14 | ) | | | – | | | | – | |
Foreign currency related transactions | | | 1,979 | | | | 5 | | | | (1,814 | ) | | | (3,404 | ) |
Net increase in unrealized appreciation or depreciation on: | | | | | | | | | | | | | | | | |
Investments, from unaffiliated issuers | | | 100,398 | | | | 25,676 | | | | 1,546,232 | | | | 1,971,511 | |
Investments, from affiliated issuers | | | 3,981 | | | | 1,091 | | | | – | | | | – | |
Foreign currency related transactions | | | 96 | | | | (77 | ) | | | 908 | | | | 641 | |
Net increase in net assets resulting from operations | | | 126,963 | | | | 27,866 | | | | 2,388,883 | | | | 2,270,379 | |
| DISTRIBUTIONS PAID TO SHAREHOLDERS: | | | | | | | | | | | | | | | | |
Net investment income: | | | | | | | | | | | | | | | | |
Investor Shares | | | (1,216 | ) | | | – | | | | (82,687 | ) | | | (87,816 | ) |
Institutional Shares | | | (386 | ) | | | – | | | | (37,967 | ) | | | (33,126 | ) |
Net realized gains on investment transactions: | | | | | | | | | | | | | | | | |
Investor Shares | | | (639 | ) | | | (1,393 | ) | | | – | | | | – | |
Institutional Shares | | | (169 | ) | | | – | | | | – | | | | – | |
Total distributions paid to shareholders | | | (2,410 | ) | | | (1,393 | ) | | | (120,654 | ) | | | (120,942 | ) |
| FUND SHARE ACTIVITIES: | | | | | | | | | | | | | | | | |
Net increase (decrease) in net assets resulting from fund share activities | | | 754,362 | | | | 173,767 | | | | 1,502,705 | | | | (325,555 | ) |
Total increase in net assets | | | 878,915 | | | | 200,240 | | | | 3,770,934 | | | | 1,823,882 | |
Net assets, beginning of period | | | 265,906 | | | | 65,666 | | | | 9,650,290 | | | | 7,826,408 | |
Net assets, end of period | | $ | 1,144,821 | | | $ | 265,906 | | | $ | 13,421,224 | | | $ | 9,650,290 | |
Accumulated undistributed net investment income | | $ | 3,187 | | | $ | 321 | | | $ | 142,206 | | | $ | 118,396 | |
The accompanying notes are an integral part of the financial statements.
ARTISAN FUNDS
Statements of Changes in Net Assets (Continued)
Dollar values in thousands
| | | | | | | | | | | | | | | | |
| | | INTERNATIONAL SMALL CAP | | | INTERNATIONAL VALUE | |
| | | Year Ended
9/30/2013 | | | Year Ended
9/30/2012 | | | Year Ended
9/30/2013 | | | Year Ended
9/30/2012 | |
| OPERATIONS: | | | | | | | | | | | | | | | | |
Net investment income | | $ | 1,635 | | | $ | 7,836 | | | $ | 75,951 | | | $ | 59,429 | |
Net realized gain on: | | | | | | | | | | | | | | | | |
Investments, from unaffiliated issuers | | | 79,981 | | | | 14,946 | | | | 521,533 | | | | 20,969 | |
Investments, from affiliated issuers | | | – | | | | – | | | | 92,212 | | | | 994 | |
Foreign currency related transactions | | | 268 | | | | (122 | ) | | | 114,018 | | | | 10,327 | |
Net increase (decrease) in unrealized appreciation or depreciation on: | | | | | | | | | | | | | | | | |
Investments, from unaffiliated issuers | | | 126,463 | | | | 121,874 | | | | 1,241,779 | | | | 226,062 | |
Investments, from affiliated issuers | | | – | | | | – | | | | 234,473 | | | | 764,492 | |
Foreign currency related transactions | | | 27 | | | | 14 | | | | 5,442 | | | | (7,179 | ) |
Net increase in net assets resulting from operations | | | 208,374 | | | | 144,548 | | | | 2,285,408 | | | | 1,075,094 | |
| DISTRIBUTIONS PAID TO SHAREHOLDERS: | | | | | | | | | | | | | | | | |
Net investment income: | | | | | | | | | | | | | | | | |
Investor Shares | | | (7,730 | ) | | | (2,354 | ) | | | (53,270 | ) | | | (1,955 | ) |
Institutional Shares | | | | | | | | | | | (19,853 | ) | | | (1,195 | ) |
Net realized gains on investment transactions: | | | | | | | | | | | | | | | | |
Investor Shares | | | – | | | | – | | | | (25,891 | ) | | | (9,181 | ) |
Institutional Shares | | | | | | | | | | | (8,359 | ) | | | (3,059 | ) |
Total distributions paid to shareholders | | | (7,730 | ) | | | (2,354 | ) | | | (107,373 | ) | | | (15,390 | ) |
| FUND SHARE ACTIVITIES: | | | | | | | | | | | | | | | | |
Net increase in net assets resulting from fund share activities | | | 79,457 | | | | 19,129 | | | | 1,632,872 | | | | 1,304,049 | |
Total increase in net assets | | | 280,101 | | | | 161,323 | | | | 3,810,907 | | | | 2,363,753 | |
Net assets, beginning of period | | | 716,049 | | | | 554,726 | | | | 6,639,235 | | | | 4,275,482 | |
Net assets, end of period | | $ | 996,150 | | | $ | 716,049 | | | $ | 10,450,142 | | | $ | 6,639,235 | |
Accumulated undistributed net investment income | | $ | 2,616 | | | $ | 7,727 | | | $ | 159,263 | | | $ | 50,909 | |
The accompanying notes are an integral part of the financial statements.
ARTISAN FUNDS
Statements of Changes in Net Assets (Continued)
Dollar values in thousands
| | | | | | | | | | | | | | | | |
| | | MID CAP | | | MID CAP VALUE | |
| | | Year Ended
9/30/2013 | | | Year Ended
9/30/2012 | | | Year Ended
9/30/2013 | | | Year Ended
9/30/2012 | |
| OPERATIONS: | | | | | | | | | | | | | | | | |
Net investment income (loss) | | $ | (41,831 | ) | | $ | (44,869 | ) | | $ | 61,476 | | | $ | 51,496 | |
Net realized gain (loss) on: | | | | | | | | | | | | | | | | |
Investments, from unaffiliated issuers | | | 717,544 | | | | 309,531 | | | | 478,655 | | | | 453,876 | |
Investments, from affiliated issuers | | | 17,313 | | | | 13,853 | | | | (3,029 | ) | | | 15,545 | |
Net increase (decrease) in unrealized appreciation or depreciation on: | | | | | | | | | | | | | | | | |
Investments, from unaffiliated issuers | | | 1,294,858 | | | | 911,798 | | | | 1,540,909 | | | | 825,447 | |
Investments, from affiliated issuers | | | 160,282 | | | | 51,943 | | | | 421,781 | | | | (16,781 | ) |
Net increase in net assets resulting from operations | | | 2,148,166 | | | | 1,242,256 | | | | 2,499,792 | | | | 1,329,583 | |
| DISTRIBUTIONS PAID TO SHAREHOLDERS: | | | | | | | | | | | | | | | | |
Net investment income: | | | | | | | | | | | | | | | | |
Investor Shares | | | – | | | | – | | | | (43,589 | ) | | | (43,082 | ) |
Institutional Shares | | | – | | | | – | | | | (3,530 | ) | | | – | |
Net realized gains on investment transactions: | | | | | | | | | | | | | | | | |
Investor Shares | | | (225,704 | ) | | | – | | | | (361,177 | ) | | | (499,737 | ) |
Institutional Shares | | | (83,801 | ) | | | – | | | | (20,573 | ) | | | – | |
Total distributions paid to shareholders | | | (309,505 | ) | | | – | | | | (428,869 | ) | | | (542,819 | ) |
| FUND SHARE ACTIVITIES: | | | | | | | | | | | | | | | | |
Net increase in net assets resulting from fund share activities | | | 520,163 | | | | 464,933 | | | | 695,576 | | | | 1,042,313 | |
Total increase in net assets | | | 2,358,824 | | | | 1,707,189 | | | | 2,766,499 | | | | 1,829,077 | |
Net assets, beginning of period | | | 6,717,945 | | | | 5,010,756 | | | | 8,029,541 | | | | 6,200,464 | |
Net assets, end of period | | $ | 9,076,769 | | | $ | 6,717,945 | | | $ | 10,796,040 | | | $ | 8,029,541 | |
Accumulated undistributed net investment income (loss) | | $ | (39,542 | ) | | $ | (37,201 | ) | | $ | 35,226 | | | $ | 28,090 | |
The accompanying notes are an integral part of the financial statements.
ARTISAN FUNDS
Statements of Changes in Net Assets (Continued)
Dollar values in thousands
| | | | | | | | | | | | | | | | |
| | | SMALL CAP | | | SMALL CAP VALUE | |
| | | Year Ended
9/30/2013 | | | Year Ended
9/30/2012 | | | Year Ended
9/30/2013 | | | Year Ended
9/30/2012 | |
| OPERATIONS: | | | | | | | | | | | | | | | | |
Net investment income (loss) | | $ | (9,183 | ) | | $ | (3,774 | ) | | $ | 12,910 | | | $ | 9,195 | |
Net realized gain (loss) on: | | | | | | | | | | | | | | | | |
Investments, from unaffiliated issuers | | | 34,660 | | | | 22,381 | | | | 52,159 | | | | 101,642 | |
Investments, from affiliated issuers | | | (1,438 | ) | | | 1,624 | | | | 1,966 | | | | (50,502 | ) |
Foreign currency related transactions | | | – | | | | – | | | | 1 | | | | – | |
Net increase in unrealized appreciation or depreciation on: | | | | | | | | | | | | | | | | |
Investments, from unaffiliated issuers | | | 274,668 | | | | 82,519 | | | | 392,532 | | | | 235,092 | |
Investments, from affiliated issuers | | | 40,875 | | | | 13,021 | | | | 64,885 | | | | 123,867 | |
Net increase in net assets resulting from operations | | | 339,582 | | | | 115,771 | | | | 524,453 | | | | 419,294 | |
| DISTRIBUTIONS PAID TO SHAREHOLDERS: | | | | | | | | | | | | | | | | |
Net investment income: | | | | | | | | | | | | | | | | |
Investor Shares | | | – | | | | – | | | | (17,878 | ) | | | (1,078 | ) |
Institutional Shares | | | – | | | | – | | | | (3,395 | ) | | | – | |
Net realized gains on investment transactions: | | | | | | | | | | | | | | | | |
Investor Shares | | | – | | | | – | | | | (51,396 | ) | | | (238,253 | ) |
Institutional Shares | | | – | | | | – | | | | (7,307 | ) | | | – | |
Total distributions paid to shareholders | | | – | | | | – | | | | (79,976 | ) | | | (239,331 | ) |
| FUND SHARE ACTIVITIES: | | | | | | | | | | | | | | | | |
Net increase (decrease) in net assets resulting from fund share activities | | | 488,483 | | | | 284,422 | | | | (335,404 | ) | | | (132,156 | ) |
Total increase in net assets | | | 828,065 | | | | 400,193 | | | | 109,073 | | | | 47,807 | |
Net assets, beginning of period | | | 726,893 | | | | 326,700 | | | | 2,655,070 | | | | 2,607,263 | |
Net assets, end of period | | $ | 1,554,958 | | | $ | 726,893 | | | $ | 2,764,143 | | | $ | 2,655,070 | |
Accumulated undistributed net investment income (loss) | | $ | (8,571 | ) | | $ | (3,241 | ) | | $ | – | | | $ | 7,607 | |
The accompanying notes are an integral part of the financial statements.
ARTISAN FUNDS
Statements of Changes in Net Assets (Continued)
Dollar values in thousands
| | | | | | | | |
| | | VALUE | |
| | | Year Ended
9/30/2013 | | | Year Ended
9/30/2012 | |
| OPERATIONS: | | | | | | | | |
Net investment income | | $ | 9,925 | | | $ | 5,333 | |
Net realized gain (loss) on: | | | | | | | | |
Investments, from unaffiliated issuers | | | 75,032 | | | | 20,478 | |
Investments, from affiliated issuers | | | 2,872 | | | | (298 | ) |
Foreign currency related transactions | | | (54 | ) | | | (37 | ) |
Net increase in unrealized appreciation or depreciation on: | | | | | | | | |
Investments, from unaffiliated issuers | | | 70,099 | | | | 105,516 | |
Investments, from affiliated issuers | | | 13,619 | | | | 3,179 | |
Foreign currency related transactions | | | 3 | | | | (3 | ) |
Net increase in net assets resulting from operations | | | 171,496 | | | | 134,168 | |
| DISTRIBUTIONS PAID TO SHAREHOLDERS: | | | | | | | | |
Net investment income: | | | | | | | | |
Investor Shares | | | (5,169 | ) | | | (3,915 | ) |
Institutional Shares | | | (1,901 | ) | | | (682 | ) |
Total distributions paid to shareholders | | | (7,070 | ) | | | (4,597 | ) |
| FUND SHARE ACTIVITIES: | | | | | | | | |
Net increase in net assets resulting from fund share activities | | | 413,724 | | | | 243,747 | |
Total increase in net assets | | | 578,150 | | | | 373,318 | |
Net assets, beginning of period | | | 835,480 | | | | 462,162 | |
Net assets, end of period | | $ | 1,413,630 | | | $ | 835,480 | |
Accumulated undistributed net investment income | | $ | 4,908 | | | $ | 3,244 | |
The accompanying notes are an integral part of the financial statements.
[THIS PAGE INTENTIONALLY LEFT BLANK]
ARTISAN FUNDS
Financial Highlights – For a share outstanding throughout each period
The financial highlights tables are intended to help you understand the Funds’ financial performance for the past 5 years or, if shorter, the period of a Fund’s operations. Certain information reflects financial results for a single Fund share. The total returns in the tables represent the rate that an investor would have earned or lost on an investment in a Fund (assuming reinvestment of all dividends and distributions).
| | | | | | | | | | | | | | | | | | | | | | | | | | | | | | | | | | | | |
| | | | | | | |
| | | | | | | | | | | | | | | Less Distributions From | | | | | | | |
| | | Net
Asset
Value,
Beginning
of Period | | | Net Investment
Income (Loss)(1) | | | Net Realized
and Unrealized
Gain (Loss) on
Investments | | | Total
from
Operations | | | Net
Investment
Income | | | Net
Realized
Gains | | | Tax
Return of
Capital | | | Total
Distributions | | | Net
Asset
Value,
End of Period | |
| EMERGING MARKETS FUND | | | | | | | | | | | | | | | | | | | | | | | | | | | | | |
Institutional Shares | | | | | | | | | | | | | | | | | | | | | | | | | | | | | | | | | | | | |
9/30/2013 | | $ | 12.75 | | | | 0.14 | | | | (0.37 | ) | | | (0.23 | ) | | | (0.20 | ) | | | — | | | | — | | | | (0.20 | ) | | $ | 12.32 | |
9/30/2012 | | $ | 11.37 | | | | 0.15 | | | | 1.36 | | | | 1.51 | | | | (0.10 | ) | | | (0.03 | ) | | | — | | | | (0.13 | ) | | $ | 12.75 | |
9/30/2011 | | $ | 15.23 | | | | 0.21 | | | | (3.93 | ) | | | (3.72 | ) | | | (0.14 | ) | | | — | | | | — | | | | (0.14 | ) | | $ | 11.37 | |
9/30/2010 | | $ | 13.02 | | | | 0.17 | | | | 2.15 | | | | 2.32 | | | | (0.11 | ) | | | — | | | | — | | | | (0.11 | ) | | $ | 15.23 | |
9/30/2009 | | $ | 11.15 | | | | 0.09 | | | | 1.91 | | | | 2.00 | | | | (0.12 | ) | | | (0.01 | ) | | | — | | | | (0.13 | ) | | $ | 13.02 | |
Advisor Shares | | | | | | | | | | | | | | | | | | | | | | | | | | | | | | | | | | | | |
9/30/2013 | | $ | 12.76 | | | | 0.10 | | | | (0.38 | ) | | | (0.28 | ) | | | (0.16 | ) | | | — | | | | — | | | | (0.16 | ) | | $ | 12.32 | |
9/30/2012 | | $ | 11.38 | | | | 0.10 | | | | 1.38 | | | | 1.48 | | | | (0.07 | ) | | | (0.03 | ) | | | — | | | | (0.10 | ) | | $ | 12.76 | |
9/30/2011 | | $ | 15.24 | | | | 0.18 | | | | (3.94 | ) | | | (3.76 | ) | | | (0.10 | ) | | | — | | | | — | | | | (0.10 | ) | | $ | 11.38 | |
9/30/2010 | | $ | 13.03 | | | | 0.18 | | | | 2.12 | | | | 2.30 | | | | (0.09 | ) | | | — | | | | — | | | | (0.09 | ) | | $ | 15.24 | |
9/30/2009 | | $ | 11.16 | | | | 0.07 | | | | 1.93 | | | | 2.00 | | | | (0.12 | ) | | | (0.01 | ) | | | — | | | | (0.13 | ) | | $ | 13.03 | |
| GLOBAL EQUITY FUND | | | | | | | | | | | | | | | | | | | | | | | | | | | | | |
Investor Shares | | | | | | | | | | | | | | | | | | | | | | | | | | | | | | | | | | | | |
9/30/2013 | | $ | 13.05 | | | | (0.01 | ) | | | 3.23 | | | | 3.22 | | | | (0.03 | ) | | | (0.52 | ) | | | — | | | | (0.55 | ) | | $ | 15.72 | |
9/30/2012 | | $ | 9.83 | | | | 0.05 | | | | 3.38 | | | | 3.43 | | | | (0.03 | ) | | | (0.18 | ) | | | — | | | | (0.21 | ) | | $ | 13.05 | |
9/30/2011 | | $ | 10.23 | | | | (0.03 | ) | | | (0.23 | ) | | | (0.26 | ) | | | (0.06 | ) | | | (0.08 | ) | | | — | | | | (0.14 | ) | | $ | 9.83 | |
9/30/2010(5) | | $ | 10.00 | | | | 0.03 | | | | 0.20 | | | | 0.23 | | | | — | | | | — | | | | — | | | | — | | | $ | 10.23 | |
| GLOBAL OPPORTUNITIES FUND | | | | | | | | | | | | | | | | | | | | | | | | | | | | | |
Investor Shares | | | | | | | | | | | | | | | | | | | | | | | | | | | | | | | | | | | | |
9/30/2013 | | $ | 14.27 | | | | (0.05 | ) | | | 3.07 | | | | 3.02 | | | | — | | | | — | | | | — | | | | — | | | $ | 17.29 | |
9/30/2012 | | $ | 10.90 | | | | (0.06 | ) | | | 3.54 | | | | 3.48 | | | | — | | | | (0.11 | ) | | | — | | | | (0.11 | ) | | $ | 14.27 | |
9/30/2011 | | $ | 10.99 | | | | (0.09 | ) | | | 0.13 | | | | 0.04 | | | | — | | | | (0.13 | ) | | | — | | | | (0.13 | ) | | $ | 10.90 | |
9/30/2010 | | $ | 9.14 | | | | (0.09 | ) | | | 1.94 | | | | 1.85 | | | | — | | | | — | | | | — | | | | — | | | $ | 10.99 | |
9/30/2009 | | $ | 9.32 | | | | (0.05 | ) | | | (0.13 | ) | | | (0.18 | ) | | | — | | | | — | | | | — | | | | — | | | $ | 9.14 | |
Institutional Shares | | | | | | | | | | | | | | | | | | | | | | | | | | | | | | | | | | | | |
9/30/2013 | | $ | 14.29 | | | | (0.01 | ) | | | 3.07 | | | | 3.06 | | | | — | | | | — | | | | — | | | | — | | | $ | 17.35 | |
9/30/2012 | | $ | 10.88 | | | | 0.01 | | | | 3.51 | | | | 3.52 | | | | — | | | | (0.11 | ) | | | — | | | | (0.11 | ) | | $ | 14.29 | |
9/30/2011(6) | | $ | 13.38 | | | | (0.02 | ) | | | (2.48 | ) | | | (2.50 | ) | | | — | | | | — | | | | — | | | | — | | | $ | 10.88 | |
Footnotes are presented on Page 85.
The accompanying notes are an integral part of the financial statements.
ARTISAN FUNDS
Financial Highlights – continued
| | | | | | | | | | | | | | | | | | | | | | | | |
| | | Total
Return(2) | | | Net Assets,
End
of Period
(000) | | | Ratio of
Expenses
to Average
Net Assets(3) | | | Ratio of
Expenses
to Average
Net Assets
Excluding
Waivers(3)(4) | | | Ratio
of Net
Investment
Income
to Average
Net Assets(3) | | | Portfolio
Turnover
Rate(2) | |
| EMERGING MARKETS FUND | | | | | | | | | | | | | | | | | | | | | | | | |
Institutional Shares | | | | | | | | | | | | | | | | | | | | | | | | |
9/30/2013 | | | (1.91 | )% | | $ | 462,471 | | | | 1.18 | % | | | n/a | | | | 1.15 | % | | | 35.89 | % |
9/30/2012 | | | 13.47 | % | | $ | 494,836 | | | | 1.16 | % | | | n/a | | | | 1.25 | % | | | 38.19 | % |
9/30/2011 | | | (24.67 | )% | | $ | 352,093 | | | | 1.19 | % | | | n/a | | | | 1.41 | % | | | 30.86 | % |
9/30/2010 | | | 17.94 | % | | $ | 284,187 | | | | 1.31 | % | | | n/a | | | | 1.25 | % | | | 25.89 | % |
9/30/2009 | | | 18.66 | % | | $ | 103,963 | | | | 1.50 | % | | | 1.81 | % | | | 1.02 | % | | | 56.88 | % |
Advisor Shares | | | | | | | | | | | | | | | | | | | | | | | | |
9/30/2013 | | | (2.25 | )% | | $ | 199,920 | | | | 1.48 | % | | | n/a | | | | 0.76 | % | | | 35.89 | % |
9/30/2012 | | | 13.10 | % | | $ | 292,420 | | | | 1.48 | % | | | n/a | | | | 0.85 | % | | | 38.19 | % |
9/30/2011 | | | (24.86 | )% | | $ | 317,186 | | | | 1.47 | % | | | n/a | | | | 1.19 | % | | | 30.86 | % |
9/30/2010 | | | 17.75 | % | | $ | 235,609 | | | | 1.50 | % | | | 1.73 | % | | | 1.28 | % | | | 25.89 | % |
9/30/2009 | | | 18.64 | % | | $ | 50,446 | | | | 1.50 | % | | | 3.00 | % | | | 0.70 | % | | | 56.88 | % |
| GLOBAL EQUITY FUND | | | | | | | | | | | | | | | | | | | | | | | | |
Investor Shares | | | | | | | | | | | | | | | | | | | | | | | | |
9/30/2013 | | | 25.51 | % | | $ | 156,091 | | | | 1.50 | % | | | 1.77 | % | | | (0.08 | )% | | | 126.40 | % |
9/30/2012 | | | 35.43 | % | | $ | 15,538 | | | | 1.50 | % | | | 3.05 | % | | | 0.43 | % | | | 98.03 | % |
9/30/2011 | | | (2.66 | )% | | $ | 10,908 | | | | 1.50 | % | | | 3.12 | % | | | 0.28 | % | | | 150.01 | % |
9/30/2010(5) | | | 2.30 | % | | $ | 10,469 | | | | 1.50 | % | | | 3.66 | % | | | 0.69 | % | | | 60.81 | % |
| GLOBAL OPPORTUNITIES FUND | | | | | | | | | | | | | | | | | | | | | | | | |
Investor Shares | | | | | | | | | | | | | | | | | | | | | | | | |
9/30/2013 | | | 21.16 | % | | $ | 542,242 | | | | 1.28 | % | | | n/a | | | | (0.29 | )% | | | 41.76 | % |
9/30/2012 | | | 32.37 | % | | $ | 228,090 | | | | 1.34 | % | | | n/a | | | | (0.46 | )% | | | 43.30 | % |
9/30/2011 | | | 0.14 | % | | $ | 142,758 | | | | 1.40 | % | | | n/a | | | | (0.73 | )% | | | 76.18 | % |
9/30/2010 | | | 20.24 | % | | $ | 72,458 | | | | 1.50 | % | | | 1.54 | % | | | (0.91 | )% | | | 79.99 | % |
9/30/2009 | | | (1.93 | )% | | $ | 45,557 | | | | 1.47 | % | | | 2.24 | % | | | (0.59 | )% | | | 101.01 | % |
Institutional Shares | | | | | | | | | | | | | | | | | | | | | | | | |
9/30/2013 | | | 21.41 | % | | $ | 211,907 | | | | 1.03 | % | | | n/a | | | | (0.05 | )% | | | 41.76 | % |
9/30/2012 | | | 32.68 | % | | $ | 84,183 | | | | 1.08 | % | | | n/a | | | | 0.07 | % | | | 43.30 | % |
9/30/2011(6) | | | (18.68 | )% | | $ | 12,969 | | | | 1.50 | % | | | 2.22 | % | | | (1.42 | )% | | | 76.18 | % |
Footnotes are presented on Page 85.
The accompanying notes are an integral part of the financial statements.
ARTISAN FUNDS
Financial Highlights – For a share outstanding throughout each period
| | | | | | | | | | | | | | | | | | | | | | | | | | | | | | | | | | | | |
| | | | | | | | | | | | | | | Less Distributions From | | | | | | | |
| | | Net
Asset
Value,
Beginning
of Period | | | Net Investment
Income (Loss)(1) | | | Net Realized
and Unrealized
Gain (Loss) on
Investments | | | Total
from
Operations | | | Net
Investment
Income | | | Net
Realized
Gains | | | Tax
Return of
Capital | | | Total
Distributions | | | Net
Asset
Value,
End
of Period | |
| GLOBAL SMALL CAP FUND | | | | | | | | | | | | | | | | | | | | | | | | | | | | | |
Investor Shares | | | | | | | | | | | | | | | | | | | | | | | | | | | | | | | | | | | | |
9/30/2013(7) | | $ | 10.00 | | | | 0.01 | | | | 0.60 | | | | 0.61 | | | | — | | | | — | | | | — | | | | — | | | $ | 10.61 | |
| GLOBAL VALUE FUND | | | | | | | | | | | | | | | | | | | | | | | | | | | | | |
Investor Shares | | | | | | | | | | | | | | | | | | | | | | | | | | | | | | | | | | | | |
9/30/2013 | | $ | 11.58 | | | | 0.06 | | | | 2.89 | | | | 2.95 | | | | (0.06 | ) | | | (0.03 | ) | | | — | | | | (0.09 | ) | | $ | 14.44 | |
9/30/2012 | | $ | 9.28 | | | | 0.05 | | | | 2.42 | | | | 2.47 | | | | — | | | | (0.17 | ) | | | — | | | | (0.17 | ) | | $ | 11.58 | |
9/30/2011 | | $ | 9.37 | | | | 0.06 | | | | (0.07 | ) | | | (0.01 | ) | | | (0.08 | ) | | | — | | | | — | | | | (0.08 | ) | | $ | 9.28 | |
9/30/2010 | | $ | 8.64 | | | | 0.06 | | | | 0.87 | | | | 0.93 | | | | (0.20 | ) | | | — | | | | — | | | | (0.20 | ) | | $ | 9.37 | |
9/30/2009 | | $ | 8.32 | | | | 0.08 | | | | 0.29 | | | | 0.37 | | | | (0.05 | ) | | | — | | | | — | | | | (0.05 | ) | | $ | 8.64 | |
Institutional Shares | | | | | | | | | | | | | | | | | | | | | | | | | | | | | | | | | | | | |
9/30/2013 | | $ | 11.58 | | | | 0.07 | | | | 2.91 | | | | 2.98 | | | | (0.07 | ) | | | (0.03 | ) | | | — | | | | (0.10 | ) | | $ | 14.46 | |
9/30/2012(8) | | $ | 10.75 | | | | 0.01 | | | | 0.82 | | | | 0.83 | | | | — | | | | — | | | | — | | | | — | | | $ | 11.58 | |
| INTERNATIONAL FUND | | | | | | | | | | | | | | | | | | | | | | | | | | | | | |
Investor Shares | | | | | | | | | | | | | | | | | | | | | | | | | | | | | | | | | | | | |
9/30/2013 | | $ | 23.54 | | | | 0.31 | | | | 5.08 | | | | 5.39 | | | | (0.27 | ) | | | — | | | | — | | | | (0.27 | ) | | $ | 28.66 | |
9/30/2012 | | $ | 18.37 | | | | 0.28 | | | | 5.17 | | | | 5.45 | | | | (0.28 | ) | | | — | | | | — | | | | (0.28 | ) | | $ | 23.54 | |
9/30/2011 | | $ | 20.57 | | | | 0.26 | | | | (2.28 | ) | | | (2.02 | ) | | | (0.18 | ) | | | — | | | | — | | | | (0.18 | ) | | $ | 18.37 | |
9/30/2010 | | $ | 20.16 | | | | 0.17 | | | | 0.49 | | | | 0.66 | | | | (0.25 | ) | | | — | | | | — | | | | (0.25 | ) | | $ | 20.57 | |
9/30/2009 | | $ | 20.34 | | | | 0.23 | | | | 0.48 | | | | 0.71 | | | | (0.19 | ) | | | (0.70 | ) | | | — | | | | (0.89 | ) | | $ | 20.16 | |
Institutional Shares | | | | | | | | | | | | | | | | | | | | | | | | | | | | | | | | | | | | |
9/30/2013 | | $ | 23.70 | | | | 0.38 | | | | 5.10 | | | | 5.48 | | | | (0.32 | ) | | | — | | | | — | | | | (0.32 | ) | | $ | 28.86 | |
9/30/2012 | | $ | 18.50 | | | | 0.33 | | | | 5.21 | | | | 5.54 | | | | (0.34 | ) | | | — | | | | — | | | | (0.34 | ) | | $ | 23.70 | |
9/30/2011 | | $ | 20.72 | | | | 0.32 | | | | (2.31 | ) | | | (1.99 | ) | | | (0.23 | ) | | | — | | | | — | | | | (0.23 | ) | | $ | 18.50 | |
9/30/2010 | | $ | 20.29 | | | | 0.22 | | | | 0.49 | | | | 0.71 | | | | (0.28 | ) | | | — | | | | — | | | | (0.28 | ) | | $ | 20.72 | |
9/30/2009 | | $ | 20.51 | | | | 0.28 | | | | 0.46 | | | | 0.74 | | | | (0.26 | ) | | | (0.70 | ) | | | — | | | | (0.96 | ) | | $ | 20.29 | |
| INTERNATIONAL SMALL CAP FUND | | | | | | | | | | | | | | | | | | | | | | | | | |
Investor Shares | | | | | | | | | | | | | | | | | | | | | | | | | | | | | | | | | | | | |
9/30/2013 | | $ | 20.75 | | | | 0.05 | | | | 5.82 | | | | 5.87 | | | | (0.23 | ) | | | — | | | | — | | | | (0.23 | ) | | $ | 26.39 | |
9/30/2012 | | $ | 16.44 | | | | 0.24 | | | | 4.14 | | | | 4.38 | | | | (0.07 | ) | | | — | | | | — | | | | (0.07 | ) | | $ | 20.75 | |
9/30/2011 | | $ | 18.63 | | | | 0.07 | | | | (2.25 | ) | | | (2.18 | ) | | | (0.01 | ) | | | — | | | | — | | | | (0.01 | ) | | $ | 16.44 | |
9/30/2010 | | $ | 16.66 | | | | 0.02 | | | | 2.07 | | | | 2.09 | | | | (0.12 | ) | | | — | | | | — | | | | (0.12 | ) | | $ | 18.63 | |
9/30/2009 | | $ | 14.28 | | | | 0.12 | | | | 2.62 | | | | 2.74 | | | | (0.16 | ) | | | (0.20 | ) | | | — | | | | (0.36 | ) | | $ | 16.66 | |
Footnotes are presented on Page 85.
The accompanying notes are an integral part of the financial statements.
ARTISAN FUNDS
Financial Highlights – continued
| | | | | | | | | | | | | | | | | | | | | | | | |
| | | | | | |
| | | Total
Return(2) | | | Net Assets,
End
of Period
(000) | | | Ratio of
Expenses
to Average
Net Assets(3) | | | Ratio of
Expenses
to Average
Net Assets
Excluding
Waivers(3)(4) | | | Ratio
of Net
Investment
Income
to Average
Net Assets(3) | | | Portfolio
Turnover
Rate(2) | |
| GLOBAL SMALL CAP FUND | | | | | | | | | | | | | | | | | | | | | | | | |
Investor Shares | | | | | | | | | | | | | | | | | | | | | | | | |
9/30/2013(7) | | | 6.10 | % | | $ | 39,578 | | | | 1.50 | % | | | 2.51 | % | | | 0.37 | % | | | 9.98 | % |
| GLOBAL VALUE FUND | | | | | | | | | | | | | | | | | | | | | | | | |
Investor Shares | | | | | | | | | | | | | | | | | | | | | | | | |
9/30/2013 | | | 25.68 | % | | $ | 783,265 | | | | 1.37 | % | | | n/a | | | | 0.45 | % | | | 30.79 | % |
9/30/2012 | | | 26.90 | % | | $ | 217,057 | | | | 1.50 | % | | | 1.51 | % | | | 0.50 | % | | | 22.34 | % |
9/30/2011 | | | (0.23 | )% | | $ | 65,666 | | | | 1.50 | % | | | 1.72 | % | | | 0.56 | % | | | 32.32 | % |
9/30/2010 | | | 10.98 | % | | $ | 34,754 | | | | 1.50 | % | | | 1.96 | % | | | 0.71 | % | | | 34.52 | % |
9/30/2009 | | | 4.65 | % | | $ | 28,618 | | | | 1.50 | % | | | 2.16 | % | | | 1.11 | % | | | 56.57 | % |
Institutional Shares | | | | | | | | | | | | | | | | | | | | | | | | |
9/30/2013 | | | 25.98 | % | | $ | 361,556 | | | | 1.10 | % | | | n/a | | | | 0.54 | % | | | 30.79 | % |
9/30/2012(8) | | | 7.72 | % | | $ | 48,849 | | | | 1.50 | % | | | 2.43 | % | | | 0.32 | % | | | 22.34 | % |
| INTERNATIONAL FUND | | | | | | | | | | | | | | | | | |
Investor Shares | | | | | | | | | | | | | | | | | | | | | | | | |
9/30/2013 | | | 23.11 | % | | $ | 9,829,540 | | | | 1.20 | % | | | n/a | | | | 1.21 | % | | | 42.00 | % |
9/30/2012 | | | 30.05 | % | | $ | 6,877,615 | | | | 1.19 | % | | | n/a | | | | 1.32 | % | | | 55.39 | % |
9/30/2011 | | | (9.95 | )% | | $ | 5,837,067 | | | | 1.22 | % | | | n/a | | | | 1.18 | % | | | 70.36 | % |
9/30/2010 | | | 3.27 | % | | $ | 7,294,721 | | | | 1.23 | % | | | n/a | | | | 0.86 | % | | | 70.51 | % |
9/30/2009 | | | 5.00 | % | | $ | 7,715,113 | | | | 1.22 | % | | | n/a | | | | 1.47 | % | | | 82.38 | % |
Institutional Shares | | | | | | | | | | | | | | | | | | | | | | | | |
9/30/2013 | | | 23.35 | % | | $ | 3,591,684 | | | | 0.97 | % | | | n/a | | | | 1.43 | % | | | 42.00 | % |
9/30/2012 | | | 30.37 | % | | $ | 2,772,675 | | | | 0.98 | % | | | n/a | | | | 1.52 | % | | | 55.39 | % |
9/30/2011 | | | (9.76 | )% | | $ | 1,989,341 | | | | 0.99 | % | | | n/a | | | | 1.42 | % | | | 70.36 | % |
9/30/2010 | | | 3.54 | % | | $ | 2,353,948 | | | | 0.98 | % | | | n/a | | | | 1.10 | % | | | 70.51 | % |
9/30/2009 | | | 5.25 | % | | $ | 2,912,742 | | | | 0.99 | % | | | n/a | | | | 1.76 | % | | | 82.38 | % |
| INTERNATIONAL SMALL CAP FUND | | | | | | | | | | | | | | | | | |
Investor Shares | | | | | | | | | | | | | | | | | | | | | | | | |
9/30/2013 | | | 28.50 | % | | $ | 996,150 | | | | 1.51 | % | | | n/a | | | | 0.19 | % | | | 59.47 | % |
9/30/2012 | | | 26.77 | % | | $ | 716,049 | | | | 1.50 | % | | | n/a | | | | 1.27 | % | | | 42.01 | % |
9/30/2011 | | | (11.70 | )% | | $ | 554,726 | | | | 1.50 | % | | | n/a | | | | 0.35 | % | | | 44.76 | % |
9/30/2010 | | | 12.60 | % | | $ | 797,393 | | | | 1.50 | % | | | n/a | | | | 0.14 | % | | | 73.90 | % |
9/30/2009 | | | 20.59 | % | | $ | 695,803 | | | | 1.50 | % | | | n/a | | | | 0.99 | % | | | 58.42 | % |
Footnotes are presented on Page 85.
The accompanying notes are an integral part of the financial statements.
ARTISAN FUNDS
Financial Highlights – For a share outstanding throughout each period
| | | | | | | | | | | | | | | | | | | | | | | | | | | | | | | | | | | | |
| | | | | | | | | | | | | | | Less Distributions From | | | | | | | |
| | | Net Asset
Value,
Beginning
of Period | | | Net Investment
Income (Loss)(1) | | | Net Realized
and Unrealized
Gain (Loss) on
Investments | | | Total
from
Operations | | | Net
Investment
Income | | | Net
Realized
Gains | | | Tax
Return of
Capital | | | Total
Distributions | | | Net
Asset
Value,
End
of Period | |
| INTERNATIONAL VALUE FUND | | | | | | | | | | | | | | | | | | | | | | | | | | | | | |
Investor Shares | | | | | | | | | | | | | | | | | | | | | | | | | | | | | | | | | | | | |
9/30/2013 | | $ | 28.72 | | | | 0.28 | | | | 8.44 | | | | 8.72 | | | | (0.29 | ) | | | (0.14 | ) | | | — | | | | (0.43 | ) | | $ | 37.01 | |
9/30/2012 | | $ | 23.44 | | | | 0.29 | | | | 5.07 | | | | 5.36 | | | | (0.01 | ) | | | (0.07 | ) | | | — | | | | (0.08 | ) | | $ | 28.72 | |
9/30/2011 | | $ | 24.74 | | | | 0.30 | | | | (1.25 | ) | | | (0.95 | ) | | | (0.35 | ) | | | — | | | | — | | | | (0.35 | ) | | $ | 23.44 | |
9/30/2010 | | $ | 22.83 | | | | 0.31 | | | | 2.02 | | | | 2.33 | | | | (0.42 | ) | | | — | | | | — | | | | (0.42 | ) | | $ | 24.74 | |
9/30/2009 | | $ | 21.20 | | | | 0.17 | | | | 1.67 | | | | 1.84 | | | | (0.21 | ) | | | — | | | | — | | | | (0.21 | ) | | $ | 22.83 | |
Institutional Shares | | | | | | | | | | | | | | | | | | | | | | | | | | | | | | | | | | | | |
9/30/2013 | | $ | 28.80 | | | | 0.34 | | | | 8.46 | | | | 8.80 | | | | (0.34 | ) | | | (0.14 | ) | | | — | | | | (0.48 | ) | | $ | 37.12 | |
9/30/2012 | | $ | 23.47 | | | | 0.34 | | | | 5.09 | | | | 5.43 | | | | (0.03 | ) | | | (0.07 | ) | | | — | | | | (0.10 | ) | | $ | 28.80 | |
9/30/2011 | | $ | 24.76 | | | | 0.35 | | | | (1.24 | ) | | | (0.89 | ) | | | (0.40 | ) | | | — | | | | — | | | | (0.40 | ) | | $ | 23.47 | |
9/30/2010 | | $ | 22.83 | | | | 0.36 | | | | 2.02 | | | | 2.38 | | | | (0.45 | ) | | | — | �� | | | — | | | | (0.45 | ) | | $ | 24.76 | |
9/30/2009 | | $ | 21.22 | | | | 0.21 | | | | 1.66 | | | | 1.87 | | | | (0.26 | ) | | | — | | | | — | | | | (0.26 | ) | | $ | 22.83 | |
| MID CAP FUND | | | | | | | | | | | | | | | | | | | | | | | | | | | | | |
Investor Shares | | | | | | | | | | | | | | | | | | | | | | | | | | | | | | | | | | | | |
9/30/2013 | | $ | 38.80 | | | | (0.26 | ) | | | 11.97 | | | | 11.71 | | | | — | | | | (1.82 | ) | | | — | | | | (1.82 | ) | | $ | 48.69 | |
9/30/2012 | | $ | 31.14 | | | | (0.28 | ) | | | 7.94 | | | | 7.66 | | | | — | | | | — | | | | — | | | | — | | | $ | 38.80 | |
9/30/2011 | | $ | 29.55 | | | | (0.26 | ) | | | 1.85 | | | | 1.59 | | | | — | | | | — | | | | — | | | | — | | | $ | 31.14 | |
9/30/2010 | | $ | 24.28 | | | | (0.20 | ) | | | 5.47 | | | | 5.27 | | | | — | | | | — | | | | — | | | | — | | | $ | 29.55 | |
9/30/2009 | | $ | 24.08 | | | | (0.11 | ) | | | 0.59 | | | | 0.48 | | | | — | | | | (0.28 | ) | | | — | | | | (0.28 | ) | | $ | 24.28 | |
Institutional Shares | | | | | | | | | | | | | | | | | | | | | | | | | | | | | | | | | | | | |
9/30/2013 | | $ | 40.27 | | | | (0.17 | ) | | | 12.47 | | | | 12.30 | | | | — | | | | (1.82 | ) | | | — | | | | (1.82 | ) | | $ | 50.75 | |
9/30/2012 | | $ | 32.23 | | | | (0.20 | ) | | | 8.24 | | | | 8.04 | | | | — | | | | — | | | | — | | | | — | | | $ | 40.27 | |
9/30/2011 | | $ | 30.50 | | | | (0.16 | ) | | | 1.89 | | | | 1.73 | | | | — | | | | — | | | | — | | | | — | | | $ | 32.23 | |
9/30/2010 | | $ | 25.00 | | | | (0.14 | ) | | | 5.64 | | | | 5.50 | | | | — | | | | — | | | | — | | | | — | | | $ | 30.50 | |
9/30/2009 | | $ | 24.71 | | | | (0.06 | ) | | | 0.63 | | | | 0.57 | | | | — | | | | (0.28 | ) | | | — | | | | (0.28 | ) | | $ | 25.00 | |
| MID CAP VALUE FUND | | | | | | | | | | | | | | | | | | | | | | | | | | | | | |
Investor Shares | | | | | | | | | | | | | | | | | | | | | | | | | | | | | | | | | | | | |
9/30/2013 | | $ | 21.12 | | | | 0.15 | | | | 6.22 | | | | 6.37 | | | | (0.12 | ) | | | (1.03 | ) | | | — | | | | (1.15 | ) | | $ | 26.34 | |
9/30/2012 | | $ | 18.88 | | | | 0.14 | | | | 3.72 | | | | 3.86 | | | | (0.13 | ) | | | (1.49 | ) | | | — | | | | (1.62 | ) | | $ | 21.12 | |
9/30/2011 | | $ | 18.86 | | | | 0.14 | | | | 0.36 | | | | 0.50 | | | | (0.16 | ) | | | (0.32 | ) | | | — | | | | (0.48 | ) | | $ | 18.88 | |
9/30/2010 | | $ | 16.85 | | | | 0.11 | | | | 1.97 | | | | 2.08 | | | | (0.07 | ) | | | — | | | | — | | | | (0.07 | ) | | $ | 18.86 | |
9/30/2009 | | $ | 17.01 | | | | 0.08 | | | | (0.10 | ) | | | (0.02 | ) | | | (0.02 | ) | | | (0.12 | ) | | | — | | | | (0.14 | ) | | $ | 16.85 | |
Institutional Shares | | | | | | | | | | | | | | | | | | | | | | | | | | | | | | | | | | | | |
9/30/2013 | | $ | 21.15 | | | | 0.21 | | | | 6.23 | | | | 6.44 | | | | (0.18 | ) | | | (1.03 | ) | | | — | | | | (1.21 | ) | | $ | 26.38 | |
9/30/2012(9) | | $ | 20.93 | | | | 0.21 | | | | 0.01 | | | | 0.22 | | | | — | | | | — | | | | — | | | | — | | | $ | 21.15 | |
Footnotes are presented on Page 85.
The accompanying notes are an integral part of the financial statements.
ARTISAN FUNDS
Financial Highlights – continued
| | | | | | | | | | | | | | | | | | | | | | | | |
| | | Total
Return(2) | | | Net Assets,
End
of Period
(000) | | | Ratio of
Expenses
to Average
Net Assets(3) | | | Ratio of
Expenses
to Average
Net Assets
Excluding
Waivers(3)(4) | | | Ratio
of Net
Investment
Income
to Average
Net Assets(3) | | | Portfolio
Turnover
Rate(2) | |
| INTERNATIONAL VALUE FUND | | | | | | | | | | | | | | | | | |
Investor Shares | | | | | | | | | | | | | | | | | | | | | | | | |
9/30/2013 | | | 30.71 | % | | $ | 8,158,057 | | | | 1.16 | % | | | n/a | | | | 0.85 | % | | | 32.99 | % |
9/30/2012 | | | 22.94 | % | | $ | 5,081,735 | | | | 1.17 | % | | | n/a | | | | 1.08 | % | | | 20.42 | % |
9/30/2011 | | | (4.01 | )% | | $ | 3,232,649 | | | | 1.18 | % | | | n/a | | | | 1.10 | % | | | 30.90 | % |
9/30/2010 | | | 10.39 | % | | $ | 2,688,156 | | | | 1.21 | % | | | n/a | | | | 1.34 | % | | | 21.02 | % |
9/30/2009 | | | 8.95 | % | | $ | 1,739,545 | | | | 1.25 | % | | | n/a | | | | 0.95 | % | | | 55.49 | % |
Institutional Shares | | | | | | | | | | | | | | | | | | | | | | | | |
9/30/2013 | | | 30.92 | % | | $ | 2,292,085 | | | | 0.97 | % | | | n/a | | | | 1.03 | % | | | 32.99 | % |
9/30/2012 | | | 23.19 | % | | $ | 1,557,500 | | | | 0.98 | % | | | n/a | | | | 1.29 | % | | | 20.42 | % |
9/30/2011 | | | (3.84 | )% | | $ | 1,042,833 | | | | 0.99 | % | | | n/a | | | | 1.30 | % | | | 30.90 | % |
9/30/2010 | | | 10.66 | % | | $ | 649,558 | | | | 1.01 | % | | | n/a | | | | 1.57 | % | | | 21.02 | % |
9/30/2009 | | | 9.14 | % | | $ | 280,201 | | | | 1.04 | % | | | n/a | | | | 1.17 | % | | | 55.49 | % |
| MID CAP FUND | | | | | | | | | | | | | | | | | |
Investor Shares | | | | | | | | | | | | | | | | | | | | | | | | |
9/30/2013 | | | 31.53 | % | | $ | 5,525,387 | | | | 1.22 | % | | | n/a | | | | (0.64 | )% | | | 43.72 | % |
9/30/2012 | | | 24.63 | % | | $ | 5,115,836 | | | | 1.22 | % | | | n/a | | | | (0.78 | )% | | | 46.21 | % |
9/30/2011 | | | 5.38 | % | | $ | 4,500,786 | | | | 1.24 | % | | | n/a | | | | (0.75 | )% | | | 62.87 | % |
9/30/2010 | | | 21.71 | % | | $ | 4,375,235 | | | | 1.23 | % | | | n/a | | | | (0.77 | )% | | | 63.46 | % |
9/30/2009 | | | 2.47 | % | | $ | 3,688,552 | | | | 1.23 | % | | | n/a | | | | (0.57 | )% | | | 68.39 | % |
Institutional Shares | | | | | | | | | | | | | | | | | | | | | | | | |
9/30/2013 | | | 31.89 | % | | $ | 3,551,382 | | | | 0.96 | % | | | n/a | | | | (0.39 | )% | | | 43.72 | % |
9/30/2012 | | | 24.95 | % | | $ | 1,602,109 | | | | 0.97 | % | | | n/a | | | | (0.51 | )% | | | 46.21 | % |
9/30/2011 | | | 5.67 | % | | $ | 509,970 | | | | 0.96 | % | | | n/a | | | | (0.47 | )% | | | 62.87 | % |
9/30/2010 | | | 22.00 | % | | $ | 502,446 | | | | 0.96 | % | | | n/a | | | | (0.51 | )% | | | 63.46 | % |
9/30/2009 | | | 2.77 | % | | $ | 454,514 | | | | 0.97 | % | | | n/a | | | | (0.32 | )% | | | 68.39 | % |
| MID CAP VALUE FUND | | | | | | | | | | | | | | | | | |
Investor Shares | | | | | | | | | | | | | | | | | | | | | | | | |
9/30/2013 | | | 31.64 | % | | $ | 9,429,674 | | | | 1.20 | % | | | n/a | | | | 0.65 | % | | | 25.73 | % |
9/30/2012 | | | 21.35 | % | | $ | 7,753,814 | | | | 1.20 | % | | | n/a | | | | 0.67 | % | | | 27.86 | % |
9/30/2011 | | | 2.51 | % | | $ | 6,200,464 | | | | 1.20 | % | | | n/a | | | | 0.68 | % | | | 31.85 | % |
9/30/2010 | | | 12.35 | % | | $ | 5,739,627 | | | | 1.21 | % | | | n/a | | | | 0.60 | % | | | 37.71 | % |
9/30/2009 | | | 0.21 | % | | $ | 4,627,956 | | | | 1.21 | % | | | n/a | | | | 0.62 | % | | | 53.84 | % |
Institutional Shares | | | | | | | | | | | | | | | | | | | | | | | | |
9/30/2013 | | | 31.97 | % | | $ | 1,366,366 | | | | 0.98 | % | | | n/a | | | | 0.86 | % | | | 25.73 | % |
9/30/2012(9) | | | 1.05 | % | | $ | 275,727 | | | | 1.01 | % | | | n/a | | | | 1.04 | % | | | 27.86 | % |
Footnotes are presented on Page 85.
The accompanying notes are an integral part of the financial statements.
ARTISAN FUNDS
Financial Highlights – For a share outstanding throughout each period
| | | | | | | | | | | | | | | | | | | | | | | | | | | | | | | | | | | | |
| | | | | | | | | | | | | | | Less Distributions From | | | | | | | |
| | | Net
Asset
Value,
Beginning
of Period | | | Net
Investment
Income (Loss)(1) | | | Net Realized
and Unrealized
Gain (Loss) on
Investments | | | Total
from
Operations | | | Net
Investment
Income | | | Net
Realized
Gains | | | Tax
Return of
Capital | | | Total
Distributions | | | Net
Asset
Value,
End
of Period | |
| SMALL CAP FUND | | | | | | | | | | | | | | | | | | | | | | | | | | | | | |
Investor Shares | | | | | | | | | | | | | | | | | | | | | | | | | | | | | | | | | | | | |
9/30/2013 | | $ | 20.90 | | | | (0.20) | | | | 6.95 | | | | 6.75 | | | | — | | | | — | | | | — | | | | — | | | $ | 27.65 | |
9/30/2012 | | $ | 16.01 | | | | (0.15) | | | | 5.04 | | | | 4.89 | | | | — | | | | — | | | | — | | | | — | | | $ | 20.90 | |
9/30/2011 | | $ | 14.40 | | | | (0.13) | | | | 1.74 | | | | 1.61 | | | | — | | | | — | | | | — | | | | — | | | $ | 16.01 | |
9/30/2010 | | $ | 12.88 | | | | (0.09) | | | | 1.61 | | | | 1.52 | | | | — | | | | — | | | | — | | | | — | | | $ | 14.40 | |
9/30/2009 | | $ | 13.13 | | | | (0.05) | | | | (0.18) | | | | (0.23) | | | | — | | | | — | | | | (0.02) | | | | (0.02) | | | $ | 12.88 | |
Institutional Shares | | | | | | | | | | | | | | | | | | | | | | | | | | | | | | | | | | | | |
9/30/2013 | | $ | 20.89 | | | | (0.17) | | | | 6.98 | | | | 6.81 | | | | — | | | | — | | | | — | | | | — | | | $ | 27.70 | |
9/30/2012(10) | | $ | 19.62 | | | | (0.18) | | | | 1.45 | | | | 1.27 | | | | — | | | | — | | | | — | | | | — | | | $ | 20.89 | |
| SMALL CAP VALUE FUND | | | | | | | | | | | | | | | | | | | | | | | | | | | | | |
Investor Shares | | | | | | | | | | | | | | | | | | | | | | | | | | | | | | | | | | | | |
9/30/2013 | | $ | 15.24 | | | | 0.08 | | | | 3.23 | | | | 3.31 | | | | (0.13) | | | | (0.36) | | | | — | | | | (0.49) | | | $ | 18.06 | |
9/30/2012 | | $ | 14.30 | | | | 0.05 | | | | 2.25 | | | | 2.30 | | | | (0.01) | | | | (1.35) | | | | — | | | | (1.36) | | | $ | 15.24 | |
9/30/2011 | | $ | 14.85 | | | | 0.01 | | | | (0.54) | | | | (0.53) | | | | (0.02) | | | | — | | | | — | | | | (0.02) | | | $ | 14.30 | |
9/30/2010 | | $ | 13.56 | | | | 0.02 | | | | 1.29 | | | | 1.31 | | | | (0.02) | | | | — | | | | — | | | | (0.02) | | | $ | 14.85 | |
9/30/2009 | | $ | 13.93 | | | | 0.02 | | | | (0.07) | | | | (0.05) | | | | — | | | | (0.32) | | | | — | | | | (0.32) | | | $ | 13.56 | |
Institutional Shares | | | | | | | | | | | | | | | | | | | | | | | | | | | | | | | | | | | | |
9/30/2013 | | $ | 15.26 | | | | 0.11 | | | | 3.24 | | | | 3.35 | | | | (0.17) | | | | (0.36) | | | | — | | | | (0.53) | | | $ | 18.08 | |
9/30/2012(9) | | $ | 16.16 | | | | 0.06 | | | | (0.96) | | | | (0.90) | | | | — | | | | — | | | | — | | | | — | | | $ | 15.26 | |
| VALUE FUND | | | | | | | | | | | | | | | | | | | | | | | | | | | | | | | | | | | | |
Investor Shares | | | | | | | | | | | | | | | | | | | | | | | | | | | | | | | | | | | | |
9/30/2013 | | $ | 11.32 | | | | 0.12 | | | | 2.02 | | | | 2.14 | | | | (0.08) | | | | — | | | | — | | | | (0.08) | | | $ | 13.38 | |
9/30/2012 | | $ | 9.11 | | | | 0.08 | | | | 2.21 | | | | 2.29 | | | | (0.08) | | | | — | | | | — | | | | (0.08) | | | $ | 11.32 | |
9/30/2011 | | $ | 8.91 | | | | 0.09 | | | | 0.19 | | | | 0.28 | | | | (0.08) | | | | — | | | | — | | | | (0.08) | | | $ | 9.11 | |
9/30/2010 | | $ | 8.12 | | | | 0.07 | | | | 0.76 | | | | 0.83 | | | | (0.04) | | | | — | | | | — | | | | (0.04) | | | $ | 8.91 | |
9/30/2009 | | $ | 8.58 | | | | 0.06 | | | | (0.44) | | | | (0.38) | | | | (0.08) | | | | — | | | | — | | | | (0.08) | | | $ | 8.12 | |
Institutional Shares | | | | | | | | | | | | | | | | | | | | | | | | | | | | | | | | | | | | |
9/30/2013 | | $ | 11.35 | | | | 0.15 | | | | 2.03 | | | | 2.18 | | | | (0.11) | | | | — | | | | — | | | | (0.11) | | | $ | 13.42 | |
9/30/2012 | | $ | 9.12 | | | | 0.11 | | | | 2.21 | | | | 2.32 | | | | (0.09) | | | | — | | | | — | | | | (0.09) | | | $ | 11.35 | |
9/30/2011(6) | | $ | 10.60 | | | | 0.02 | | | | (1.50) | | | | (1.48) | | | | — | | | | — | | | | — | | | | — | | | $ | 9.12 | |
Footnotes are presented on Page 85.
The accompanying notes are an integral part of the financial statements.
ARTISAN FUNDS
Financial Highlights – continued
| | | | | | | | | | | | | | | | | | | | | | | | |
| | | | | | |
| | | Total
Return(2) | | | Net Assets,
End
of Period
(000) | | | Ratio of
Expenses
to Average
Net Assets(3) | | | Ratio of
Expenses
to Average
Net Assets
Excluding
Waivers(3)(4) | | | Ratio
of Net
Investment
Income
to Average
Net Assets(3) | | | Portfolio
Turnover
Rate(2) | |
| SMALL CAP FUND | | | | | | | | | | | | | | | | | |
Investor Shares | | | | | | | | | | | | | | | | | | | | | | | | |
9/30/2013 | | | 32.30 | % | | $ | 1,330,188 | | | | 1.25 | % | | | n/a | | | | (0.88 | )% | | | 42.43 | % |
9/30/2012 | | | 30.54 | % | | $ | 676,139 | | | | 1.28 | % | | | n/a | | | | (0.77 | )% | | | 69.56 | % |
9/30/2011 | | | 11.18 | % | | $ | 326,700 | | | | 1.29 | % | | | n/a | | | | (0.73 | )% | | | 80.26 | % |
9/30/2010 | | | 11.80 | % | | $ | 322,730 | | | | 1.31 | % | | | n/a | | | | (0.67 | )% | | | 62.67 | % |
9/30/2009 | | | (1.73 | )% | | $ | 436,996 | | | | 1.26 | % | | | n/a | | | | (0.47 | )% | | | 80.51 | % |
Institutional Shares | | | | | | | | | | | | | | | | | | | | | | | | |
9/30/2013 | | | 32.60 | % | | $ | 224,770 | | | | 1.06 | % | | | n/a | | | | (0.74 | )% | | | 42.43 | % |
9/30/2012(10) | | | 6.47 | % | | $ | 50,754 | | | | 1.42 | % | | | n/a | | | | (0.93 | )% | | | 69.56 | % |
| SMALL CAP VALUE FUND | | | | | | | | | | | | | | | | | |
Investor Shares | | | | | | | | | | | | | | | | | | | | | | | | |
9/30/2013 | | | 22.24 | % | | $ | 2,421,658 | | | | 1.24 | % | | | n/a | | | | 0.46 | % | | | 26.66 | % |
9/30/2012 | | | 16.54 | % | | $ | 2,348,847 | | | | 1.22 | % | | | n/a | | | | 0.31 | % | | | 28.17 | % |
9/30/2011 | | | (3.61 | )% | | $ | 2,607,263 | | | | 1.20 | % | | | n/a | | | | 0.06 | % | | | 47.45 | % |
9/30/2010 | | | 9.64 | % | | $ | 2,690,416 | | | | 1.22 | % | | | n/a | | | | 0.11 | % | | | 37.14 | % |
9/30/2009 | | | 0.46 | % | | $ | 2,156,495 | | | | 1.22 | % | | | n/a | | | | 0.20 | % | | | 63.05 | % |
Institutional Shares | | | | | | | | | | | | | | | | | | | | | | | | |
9/30/2013 | | | 22.54 | % | | $ | 342,485 | | | | 1.00 | % | | | n/a | | | | 0.70 | % | | | 26.66 | % |
9/30/2012(9) | | | (5.57 | )% | | $ | 306,223 | | | | 1.00 | % | | | n/a | | | | 0.56 | % | | | 28.17 | % |
| VALUE FUND | | | | | | | | | | | | | | | | | | | | | | | | |
Investor Shares | | | | | | | | | | | | | | | | | | | | | | | | |
9/30/2013 | | | 18.97 | % | | $ | 1,164,460 | | | | 1.04 | % | | | n/a | | | | 0.94 | % | | | 57.90 | % |
9/30/2012 | | | 25.42 | % | | $ | 677,753 | | | | 1.06 | % | | | n/a | | | | 0.74 | % | | | 66.13 | % |
9/30/2011 | | | 3.10 | % | | $ | 408,647 | | | | 1.10 | % | | | n/a | | | | 0.95 | % | | | 78.36 | % |
9/30/2010 | | | 10.19 | % | | $ | 266,373 | | | | 1.27 | % | | | n/a | | | | 0.86 | % | | | 70.69 | % |
9/30/2009 | | | (4.10 | )% | | $ | 181,110 | | | | 1.32 | % | | | n/a | | | | 0.84 | % | | | 85.44 | % |
Institutional Shares | | | | | | | | | | | | | | | | | | | | | | | | |
9/30/2013 | | | 19.43 | % | | $ | 249,170 | | | | 0.76 | % | | | n/a | | | | 1.21 | % | | | 57.90 | % |
9/30/2012 | | | 25.64 | % | | $ | 157,727 | | | | 0.79 | % | | | n/a | | | | 1.02 | % | | | 66.13 | % |
9/30/2011(6) | | | (13.96 | )% | | $ | 53,515 | | | | 1.09 | % | | | n/a | | | | 1.02 | % | | | 78.36 | % |
| (1) | Computed based on average shares outstanding. |
| (2) | Periods less than twelve months (where applicable) are not annualized. |
| (3) | Periods less than twelve months (where applicable) are annualized. |
| (4) | The ratios of expenses to average net assets exclude expenses waived or paid by Artisan Partners Limited Partnership. For period ending September 30, 2009, also excludes expenses waived by the board of directors. |
| (5) | For the period from commencement of operations (March 29, 2010) through September 30, 2010. |
| (6) | For the period from commencement of operations (July 26, 2011) through September 30, 2011. |
| (7) | For the period from commencement of operations (June 25, 2013) through September 30, 2013 |
| (8) | For the period from commencement of operations (July 17, 2012) through September 30, 2012. |
| (9) | For the period from commencement of operations (February 1, 2012) through September 30, 2012. |
| (10) | For the period from commencement of operations (May 7, 2012) through September 30, 2012. |
The accompanying notes are an integral part of the financial statements.
ARTISAN FUNDS
Notes to Financial Statements – September 30, 2013
Artisan Partners Funds, Inc. (“Artisan Funds”) was incorporated on January 5, 1995, as a Wisconsin corporation and is registered under the Investment Company Act of 1940, as amended (the “1940 Act”). Artisan Funds is a series company comprised of thirteen open-end, diversified mutual funds. The following funds (each a “Fund” and collectively the “Funds”) are included in this report:
| | | | | | | | | | | | |
| Fund Name | | Investor Share Inception Date | | | Institutional Share Inception Date | | | Advisor Share Inception Date | |
Artisan Emerging Markets Fund (“Emerging Markets Fund” or “Emerging Markets”) | | | N/A | | | | June 26, 2006 | | | | June 2, 2008 | |
Artisan Global Equity Fund (“Global Equity Fund” or “Global Equity”) | | | March 29, 2010 | | | | N/A | | | | N/A | |
Artisan Global Opportunities Fund (“Global Opportunities Fund” or “Global Opportunities”) | | | September 22, 2008 | | | | July 26, 2011 | | | | N/A | |
Artisan Global Small Cap Fund (“Global Small Cap Fund” or “Global Small Cap”) | | | June 25, 2013 | | | | N/A | | | | N/A | |
Artisan Global Value Fund (“Global Value Fund” or “Global Value”) | | | December 10, 2007 | | | | July 17, 2012 | | | | N/A | |
Artisan International Fund (“International Fund” or “International”) | | | December 28, 1995 | | | | July 1, 1997 | | | | N/A | |
Artisan International Small Cap Fund (“International Small Cap Fund” or “International Small Cap”) | | | December 21, 2001 | | | | N/A | | | | N/A | |
Artisan International Value Fund (“International Value Fund” or “International Value”) | | | September 23, 2002 | | | | October 1, 2006 | | | | N/A | |
Artisan Mid Cap Fund (“Mid Cap Fund” or “Mid Cap”) | | | June 27, 1997 | | | | July 1, 2000 | | | | N/A | |
Artisan Mid Cap Value Fund (“Mid Cap Value Fund” or “Mid Cap Value”) | | | March 28, 2001 | | | | February 1, 2012 | | | | N/A | |
Artisan Small Cap Fund (“Small Cap Fund” or “Small Cap”) | | | March 28, 1995 | | | | May 7, 2012 | | | | N/A | |
Artisan Small Cap Value Fund (“Small Cap Value Fund” or “Small Cap Value”) | | | September 29, 1997 | | | | February 1, 2012 | | | | N/A | |
Artisan Value Fund (“Value Fund” or “Value”) | | | March 27, 2006 | | | | July 26, 2011 | | | | N/A | |
Each Fund’s investment objective is to seek long-term capital growth. Each Fund has offered shares of capital stock of the classes designated Investor Shares, Institutional Shares and Advisor Shares, as applicable, since the inception dates listed above. Institutional Shares are sold to investors meeting certain minimum investment requirements. Advisor Shares are sold to employee benefit plans, clients of financial advisors, clients of sponsored programs and institutional or other investors.
Each class of shares has equal rights with respect to portfolio assets and voting privileges. Each class of shares has exclusive voting rights with respect to any matters involving only that class.
Income, expenses not specific to a particular class and realized and unrealized gains and losses were allocated daily to each class of shares based upon the relative net asset value of outstanding shares. Expenses attributable to a particular class of shares, such as transfer agency fees, shareholder communication expenses and registration fees, were allocated directly to that class.
NOTES TO FINANCIAL STATEMENTS
The investment adviser for each Fund is Artisan Partners Limited Partnership (the “Adviser” or “Artisan Partners”). The Adviser is wholly owned by Artisan Partners Holdings LP (“Artisan Holdings”). Prior to January 11, 2013, Artisan Global Equity Fund was subadvised by Artisan Partners UK LLP (“Artisan UK”). A wholly-owned subsidiary of Artisan Holdings was the founding member of Artisan UK. Artisan UK was terminated as subadviser of Global Equity Fund as of January 11, 2013.
| (2) | Summary of significant accounting policies: |
The following is a summary of significant accounting policies of Artisan Funds in effect during the period covered by the financial statements, which were in accordance with United States generally accepted accounting principles (“US GAAP”).
| (a) | Security valuation – The net asset value (“NAV”) of the shares of each class of each Fund was determined as of the close of regular session trading on the New York Stock Exchange (“NYSE”) (usually 4:00 p.m., Eastern Time) each day the NYSE was open for regular session trading. For financial reporting purposes, information available subsequent to the close of NYSE trading and up to the date of the financial statements was considered in determining a fair value for investments held in each Fund and the resulting NAV presented. The NAV of each class of shares was determined by dividing the value of each Fund’s securities and other assets attributed to that class, less its liabilities attributed to that class, by the number of outstanding shares of that class of that Fund. |
| | In determining NAV, each security traded on a securities exchange, including the Nasdaq Stock Market, or over-the-counter was valued at the closing price as of the time of valuation on the exchange or market designated by the Funds’ accounting agent or pricing vendor as the principal exchange (each, a “principal exchange”). The closing price provided by the pricing vendor for an exchange may differ from the price quoted elsewhere and may represent information such as last sales price, an official closing price, a closing auction price or other information, depending on exchange or market convention. Absent closing price information for a security from the principal exchange as of the time of valuation, the security was valued using (i) the closing price on another exchange on which the security traded (if such price was made available by a pricing vendor) or (ii) the most recent bid quotation on the principal exchange or, if such bid was not available, from a secondary exchange or in the over-the-counter market. |
| | Global Equity Fund, Global Opportunities Fund, Global Small Cap Fund, and Global Value Fund generally invested a significant portion of their total assets in securities principally traded in markets outside the U.S. Emerging Markets Fund, International Fund, International Small Cap Fund and International Value Fund generally invested a significant portion, and perhaps as much as substantially all of their total assets, in securities principally traded in markets outside the U.S. Each of the other Funds had the ability to invest, and some did invest, in securities principally traded outside the U.S. The foreign markets in which the Funds invested were sometimes open on days when the NYSE was not open and the Funds did not calculate their NAVs, and sometimes were not open on days when the Funds did calculate their NAVs. Even on days on which both the foreign market and the NYSE were open, several hours may have passed |
NOTES TO FINANCIAL STATEMENTS
| | between the time when trading in the foreign market closed and the time as of which the Funds calculated their NAVs. That was generally the case for markets in Europe, Asia, the Middle East, Australia and other Far Eastern markets. The regular closing time of foreign markets in North and South America was generally the same as the closing time of the NYSE and the time as of which the Funds calculated their NAVs. |
| | Securities for which prices were not readily available were valued by Artisan Funds’ valuation committee (the “valuation committee”) at a fair value determined in good faith under procedures established by and under the general supervision of Artisan Funds’ board of directors (the “board of directors”). A price was considered to be not readily available, and a Fund may therefore have used fair value pricing, if, among other things, the valuation committee believed that the price determined did not reflect a fair value of the security or that the value of the security might have been materially affected by events occurring after the close of the market in which the security was principally traded but before the time for determination of NAV (a “subsequent event”). A subsequent event might include a company-specific development (for example, announcement of a merger that is made after the close of the foreign market), a development that might affect an entire market or region (for example, imposition of foreign exchange controls by a foreign government), a potentially global development (such as a terrorist attack that may be expected to have an impact on investor expectations worldwide) or a significant change in values of market indices, exchange traded funds or other financial instruments in the U.S. or other markets. Artisan Funds monitored for subsequent events using several tools, including the use of a third party research service to assist in determining estimates of fair values for foreign securities. That service utilized statistical data based on historical performance of securities, markets and other data in developing factors used to estimate a fair value. An indication by any of those tools of a potential material change in the value of securities resulted in either a meeting of the valuation committee, which considered whether a subsequent event had occurred and whether local market closing prices continued to represent fair values for potentially affected non-U.S. securities, and/or a valuation based on information provided by the third party research service. |
| | When fair value pricing is employed, the value of a portfolio security used by a Fund to calculate its NAV may differ from quoted or published prices for the same security. Estimates of fair values utilized by the Funds as described above may differ from the value realized on the sale of those securities and the differences may have been material to the NAV of the applicable Fund. |
| | Foreign stocks as an asset class may underperform U.S. stocks, and foreign stocks may be more volatile than U.S. stocks. Risks relating to investments in foreign securities (including, but not limited to, depositary receipts and participation certificates) include: currency exchange rate fluctuation; less available public information about the issuers of securities; less stringent regulatory standards; lack of uniform accounting, auditing and financial reporting standards; and country risks including less liquidity, high inflation rates, unfavorable economic practices, political instability and expropriation and nationalization risks. |
| | The risks of foreign investments typically are greater in emerging and less developed markets. For example, political and economic structures in these less developed |
NOTES TO FINANCIAL STATEMENTS
| | countries may be new and changing rapidly, which may cause instability and greater risk of loss. These securities markets may be less developed and securities in those markets are generally more volatile and less liquid than those in developed markets. Emerging market countries also are more likely to experience high levels of inflation, deflation or currency devaluations, which could hurt their economies and securities markets. Certain emerging markets also may face other significant internal or external risks, including a heightened risk of war and ethnic, religious and racial conflicts. In addition, governments in many emerging market countries participate to a significant degree in their economies and securities markets, which may impair investment and economic growth of companies in those markets. High levels of national debt tend to make these markets heavily reliant on foreign capital and, therefore, vulnerable to capital flight. |
| (b) | Taxes – No provision was made for federal income taxes or excise taxes since each Fund intends to (i) comply with the provisions of Subchapter M of the Internal Revenue Code applicable to regulated investment companies and (ii) distribute to its shareholders substantially all of its taxable income as well as net realized gains from the sale of investment securities. The Funds may utilize earnings and profits distributed to shareholders on redemptions of Fund shares as part of the dividends paid deduction. |
| | The Funds have analyzed the tax positions taken on federal income tax returns for all remaining open tax years (fiscal years 2008 through 2013) and have concluded that as of September 30, 2013, no provision for income tax would be required in the Funds’ financial statements. The Funds’ federal and state income and federal excise tax returns for tax years for which the applicable statutes of limitations have not expired are subject to examination by the Internal Revenue Service and each state’s department of revenue. |
| | As of and during the year ended September 30, 2013, the Funds did not have any liabilities for any unrecognized tax benefits. The Funds recognize interest and penalties, if any, related to unrecognized tax benefits as income tax expense in the Statements of Operations. During the year ended September 30, 2013, the Funds did not incur any interest or penalties. |
| | The Funds may be subject to taxes imposed on realized and unrealized gains on securities of certain foreign countries in which the Funds invest. The foreign tax expense, if any, was recorded on an accrual basis and is included in “Net realized gain (loss) on investments” and “Net increase (decrease) in unrealized appreciation or depreciation on investments” on the accompanying Statements of Operations. The amount of foreign tax owed, if any, is included in “Payable for foreign taxes” on the accompanying Statements of Assets and Liabilities. That amount is comprised of withholding taxes on foreign dividends and taxes on unrealized gains. |
| (c) | Portfolio transactions – In determining a Fund’s NAV, security transactions and shareholder transactions were accounted for no later than one business day after trade date, in accordance with applicable regulations. However, for financial reporting purposes, security transactions and shareholder transactions were recorded on trade date in accordance with US GAAP. Net realized gains and losses on securities were computed on specific security lot identification. |
NOTES TO FINANCIAL STATEMENTS
| (d) | Foreign currency translation – Values of foreign investments, open foreign currency forward contracts, payables for capital gains taxes, payables and receivables for securities transactions, dividend and reclaim receivables, other receivables and payables, and cash denominated in a foreign currency were translated into U.S. dollars using a spot market rate of exchange as of the time of determination of each Fund’s NAV on the day of valuation. Purchases and sales of investments and dividend and interest income were translated into U.S. dollars using the current spot market rate of exchange on the date of such transactions. The portion of security gains or losses resulting from changes in foreign exchange rates was included with net realized and unrealized gain or loss from investments, as appropriate, for both financial reporting and tax purposes. |
| | The Funds may enter into (a) foreign currency spot contracts and (b) foreign currency forward contracts. Foreign currency spot contracts are used to facilitate the purchase and sale of non-U.S. securities and generally settle within three business days. Foreign currency forward contracts are used to hedge against foreign currency exchange rate risks on non-U.S. dollar denominated investment securities. The Funds could be exposed to loss if the counterparties fail to perform under these contracts. Open foreign currency spot contracts and foreign currency forward contracts, if any, were recorded at market value and recorded in the Statements of Assets and Liabilities. Realized and unrealized gains and losses were reported as foreign currency related transactions and are recorded in the Statements of Operations. For tax purposes, these foreign exchange gains and losses were treated as ordinary income or loss. |
| | As of September 30, 2013, Global Opportunities, Global Value and International Value had outstanding foreign currency forward contracts, as shown on the Schedules of Investments. Foreign currency spot contracts are not separately disclosed in the Schedules of Investments. |
| | Other foreign currency related transaction gains and losses may result from currency gains and losses realized on the difference between the amounts of dividends and foreign withholding taxes recorded on the Funds’ books and the U.S. dollar equivalent of the amounts actually received or paid. The net increase (decrease) in unrealized appreciation or depreciation on foreign currency related transactions arose from changes in the values of assets and liabilities, other than investments in securities, resulting from changes in foreign exchange rates. |
| (e) | Repurchase agreements – Each Fund may enter into repurchase agreements with institutions that the Adviser determined were creditworthy pursuant to criteria adopted by the board of directors. Repurchase agreements were recorded at cost plus accrued interest and were collateralized in an amount greater than or equal to the repurchase price plus accrued interest. Collateral (in the form of U.S. government securities) was held by the Funds’ custodian and in the event of default on the obligation of the counterparty to repurchase, the Funds had the right to liquidate the collateral and apply the proceeds in satisfaction of the obligation. If the proceeds from any sale of such collateral were less than the repurchase price, the Fund would have suffered a loss. |
| (f) | Depositary receipts – Each Fund may invest in depositary receipts. Depositary receipts are typically issued by a financial institution (a “depositary”), evidencing ownership interests in a security issued by an issuer and deposited with the depositary. |
NOTES TO FINANCIAL STATEMENTS
| (g) | Equity-linked participation certificates – Emerging Markets Fund, Global Equity Fund, Global Opportunities Fund, Global Small Cap Fund, Global Value Fund, International Fund, International Small Cap Fund, International Value Fund and Value Fund may invest in equity-linked participation certificates. Equity-linked participation certificates are designed to provide synthetic exposure to one or more underlying securities. An investment in an equity-linked participation certificate typically entitles the holder to a return equal to the market return of the underlying security or securities. There is no off-balance sheet risk associated with equity-linked participation certificates and the Funds’ potential loss is limited to the purchase price of the securities. The Funds are exposed to credit risk associated with the counterparty to the transaction, which is monitored by the Adviser on a periodic basis. |
| (h) | Use of estimates – The preparation of financial statements in conformity with US GAAP requires management to make estimates and assumptions that affect the reported amounts and disclosures in the financial statements. Actual results could differ from those estimates. |
| (i) | Indemnifications – In the normal course of business, the Funds have entered into contracts in which the Funds agree to indemnify the other party or parties against various potential costs or liabilities. The Funds’ maximum exposure under these arrangements is unknown. No claim has been made for indemnification pursuant to any such agreement of the Funds. |
| (j) | Other – Dividend income less foreign taxes withheld, if any, was generally recorded on the ex-dividend date. In some cases, the information was not available to the Fund on the ex-dividend date. In such cases, which may have included private placements and foreign securities, dividends were recorded as soon after the ex-dividend date as reliable information became available to the Funds. Non-cash dividends included in dividend income, if any, were generally recorded at the fair market value of securities received. Interest income was reported on the accrual basis. Distributions to shareholders were recorded on the ex-dividend date. Expenses attributable to Artisan Funds were generally allocated to each Fund based on net assets. However, other expense allocation methodologies were used, depending on the nature of the expense item. Expenses attributable to a particular Fund or class were allocated directly to that Fund or class. |
| | The character of income and net realized gains and losses may differ in some instances for financial statement and tax purposes and may result in reclassification of permanent differences among certain capital accounts to more appropriately conform financial accounting to tax characterizations of dividend and capital gain distributions. |
| | Emerging Markets Fund, Global Equity Fund, Global Opportunities Fund, Global Small Cap Fund, Global Value Fund, International Fund, International Small Cap Fund and International Value Fund generally imposed a 2% redemption fee on shares held 90 days or less. Those redemption fees were recorded as a reduction in the cost of shares redeemed and had the primary effect of increasing paid-in capital. Each Fund reserved the right to waive or reduce the 2% redemption fee on shares held 90 days or less at its discretion when the Fund believed such waiver was in the best interests of the Fund, including, but not limited to, when it determined that imposition of the redemption fee |
NOTES TO FINANCIAL STATEMENTS
| | was not necessary to protect the Fund from the effects of short-term trading. The Funds waived the fee on redemption of shares held by certain authorized agents or other Fund intermediaries and otherwise in accordance with the Funds’ prospectus. |
| (3) | Fair value measurements: |
Under US GAAP for fair value measurement, accounting standards clarify the definition of fair value for financial reporting, establish a framework for measuring fair value and require additional disclosures about the use of fair value measurements. In accordance with this standard, fair value is defined as the price that each Fund would receive upon selling an investment in an orderly transaction to an independent buyer in the principal or most advantageous market of the investment. The standard establishes a three-tier hierarchy to distinguish between (1) inputs that reflect the assumptions market participants would use in pricing an asset or liability developed based on the market data obtained from sources independent of the reporting entity (observable inputs) and (2) inputs that reflect the reporting entity’s own assumptions about the assumptions market participants would use in pricing an asset or liability developed based on the best information available in the circumstances (unobservable inputs) and to establish classification of fair value measurements for disclosure purposes. Various inputs are used in determining the value of the Funds’ investments. The three-tier hierarchy of inputs is summarized in three broad levels:
| | • | | Level 1 – quoted prices in active markets for identical investments |
| | • | | Level 2 – other significant observable inputs (including but not limited to quoted prices for similar securities, interest rates, credit risks and securities trading primarily outside the U.S. whose value the Fund adjusted as a result of significant market movements following the close of local trading) |
| | • | | Level 3 – significant unobservable inputs (including the Funds’ own assumptions in determining a fair value of investments) |
The inputs or methodology used for valuing securities are not necessarily an indication of the risk or liquidity associated with investing in those securities.
NOTES TO FINANCIAL STATEMENTS
The following table summarizes each Fund’s investments by major security type, based on the inputs used to determine their fair values as of September 30, 2013 (in thousands):
| | | | | | | | | | | | | | | | |
| Fund | | Level 1 - Quoted
Prices | | | Level 2 - Other Significant
Observable Inputs | | | Level 3 - Significant
Unobservable Inputs | | | Total | |
Emerging Markets | | | | | | | | | | | | | | | | |
Common Stocks(1) | | | | | | | | | | | | | | | | |
Developed Markets | | $ | 33,763 | | | $ | - | | | $ | - | | | $ | 33,763 | |
Emerging Asia | | | 353,794 | | | | 713 | | | | 288 | | | | 354,795 | |
Europe, Middle East & Africa | | | 108,385 | | | | - | | | | - | | | | 108,385 | |
Latin America | | | 133,435 | | | | - | | | | - | | | | 133,435 | |
Preferred Stocks(1) | | | | | | | | | | | | | | | | |
Latin America | | | 12,640 | | | | - | | | | - | | | | 12,640 | |
Convertible Debentures(1) | | | | | | | | | | | | | | | | |
Latin America | | | 5 | | | | - | | | | - | | | | 5 | |
Repurchase Agreement | | | - | | | | 26,360 | | | | - | | | | 26,360 | |
Total Investments | | $ | 642,022 | | | $ | 27,073 | | | $ | 288 | | | $ | 669,383 | |
Global Equity | | | | | | | | | | | | | | | | |
Common Stocks(1) | | | | | | | | | | | | | | | | |
Americas | | $ | 66,695 | | | $ | - | | | $ | - | | | $ | 66,695 | |
Emerging Markets | | | 34,788 | | | | - | | | | - | | | | 34,788 | |
Europe | | | 39,696 | | | | - | | | | - | | | | 39,696 | |
Pacific Basin | | | 10,104 | | | | - | | | | - | | | | 10,104 | |
Equity-Linked Securities(1) | | | | | | | | | | | | | | | | |
Emerging Markets | | | - | | | | 1,412 | | | | - | | | | 1,412 | |
Repurchase Agreement | | | - | | | | 1,896 | | | | - | | | | 1,896 | |
Total Investments | | $ | 151,283 | | | $ | 3,308 | | | $ | - | | | $ | 154,591 | |
Global Opportunities | | | | | | | | | | | | | | | | |
Common Stocks(1) | | | | | | | | | | | | | | | | |
Americas | | $ | 422,574 | | | $ | - | | | $ | - | | | $ | 422,574 | |
Emerging Markets | | | 61,313 | | | | - | | | | - | | | | 61,313 | |
Europe | | | 177,450 | | | | - | | | | - | | | | 177,450 | |
Pacific Basin | | | 63,158 | | | | - | | | | - | | | | 63,158 | |
Repurchase Agreement | | | - | | | | 31,256 | | | | - | | | | 31,256 | |
Total Investments | | | 724,495 | | | | 31,256 | | | | - | | | | 755,751 | |
Foreign Currency Forward Contracts(2) | | | - | | | | (21 | ) | | | - | | | | (21 | ) |
Total | | $ | 724,495 | | | $ | 31,235 | | | $ | - | | | $ | 755,730 | |
NOTES TO FINANCIAL STATEMENTS
| | | | | | | | | | | | | | | | |
| Fund | | Level 1 - Quoted
Prices | | | Level 2 - Other Significant
Observable Inputs | | | Level 3 - Significant
Unobservable Inputs | | | Total | |
Global Small Cap | | | | | | | | | | | | | | | | |
Common Stocks(1) | | | | | | | | | | | | | | | | |
Americas | | $ | 10,418 | | | $ | - | | | $ | - | | | $ | 10,418 | |
Emerging Markets | | | 8,706 | | | | - | | | | - | | | | 8,706 | |
Europe | | | 12,534 | | | | - | | | | - | | | | 12,534 | |
Pacific Basin | | | 6,095 | | | | - | | | | - | | | | 6,095 | |
Equity-Linked Securities(1) | | | | | | | | | | | | | | | | |
Emerging Markets | | | - | | | | 1,125 | | | | - | | | | 1,125 | |
Repurchase Agreement | | | - | | | | 1,415 | | | | - | | | | 1,415 | |
Total Investments | | $ | 37,753 | | | $ | 2,540 | | | $ | - | | | $ | 40,293 | |
Global Value | | | | | | | | | | | | | | | | |
Common Stocks(1) | | | | | | | | | | | | | | | | |
Americas | | $ | 616,959 | | | $ | - | | | $ | - | | | $ | 616,959 | |
Emerging Markets | | | 22,565 | | | | - | | | | - | | | | 22,565 | |
Europe | | | 350,668 | | | | - | | | | - | | | | 350,668 | |
Pacific Basin | | | 23,897 | | | | - | | | | - | | | | 23,897 | |
Repurchase Agreement | | | - | | | | 135,568 | | | | - | | | | 135,568 | |
Total Investments | | | 1,014,089 | | | | 135,568 | | | | - | | | | 1,149,657 | |
Foreign Currency Forward Contracts(2) | | | - | | | | 15 | | | | - | | | | 15 | |
Total | | $ | 1,014,089 | | | $ | 135,583 | | | $ | - | | | $ | 1,149,672 | |
International | | | | | | | | | | | | | | | | |
Common Stocks(1) | | | | | | | | | | | | | | | | |
Americas | | $ | 903,284 | | | $ | - | | | $ | - | | | $ | 903,284 | |
Emerging Markets | | | 1,326,536 | | | | - | | | | - | | | | 1,326,536 | |
Europe | | | 8,476,792 | | | | - | | | | - | | | | 8,476,792 | |
Pacific Basin | | | 2,178,937 | | | | - | | | | - | | | | 2,178,937 | |
Preferred Stocks(1) | | | | | | | | | | | | | | | | |
Europe | | | 160,598 | | | | - | | | | - | | | | 160,598 | |
Repurchase Agreement | | | - | | | | 302,475 | | | | - | | | | 302,475 | |
Total Investments | | $ | 13,046,147 | | | $ | 302,475 | | | $ | - | | | $ | 13,348,622 | |
International Small Cap | | | | | | | | | | | | | | | | |
Common Stocks(1) | | | | | | | | | | | | | | | | |
Americas | | $ | 32,880 | | | $ | - | | | $ | - | | | $ | 32,880 | |
Emerging Markets | | | 307,920 | | | | - | | | | - | | | | 307,920 | |
Europe | | | 509,953 | | | | - | | | | - | | | | 509,953 | |
Pacific Basin | | | 103,803 | | | | - | | | | - | | | | 103,803 | |
Repurchase Agreement | | | - | | | | 34,870 | | | | - | | | | 34,870 | |
Total Investments | | $ | 954,556 | | | $ | 34,870 | | | $ | - | | | $ | 989,426 | |
NOTES TO FINANCIAL STATEMENTS
| | | | | | | | | | | | | | | | |
| Fund | | Level 1 - Quoted
Prices | | | Level 2 - Other Significant
Observable Inputs | | | Level 3 - Significant
Unobservable Inputs | | | Total | |
International Value | | | | | | | | | | | | | | | | |
Common Stocks(1) | | | | | | | | | | | | | | | | |
Americas | | $ | 1,930,652 | | | $ | - | | | $ | - | | | $ | 1,930,652 | |
Emerging Markets | | | 600,882 | | | | - | | | | - | | | | 600,882 | |
Europe | | | 5,752,334 | | | | - | | | | - | | | | 5,752,334 | |
Pacific Basin | | | 774,601 | | | | - | | | | - | | | | 774,601 | |
Preferred Stocks(1) | | | | | | | | | | | | | | | | |
Emerging Markets | | | 17,059 | | | | - | | | | - | | | | 17,059 | |
Repurchase Agreement | | | - | | | | 1,364,272 | | | | - | | | | 1,364,272 | |
Total Investments | | | 9,075,528 | | | | 1,364,272 | | | | - | | | | 10,439,800 | |
Foreign Currency Forward Contracts(2) | | | - | | | | (19 | ) | | | - | | | | (19 | ) |
Total | | $ | 9,075,528 | | | $ | 1,364,253 | | | $ | - | | | $ | 10,439,781 | |
Mid Cap | | | | | | | | | | | | | | | | |
Common Stocks(1) | | $ | 8,783,336 | | | $ | - | | | $ | - | | | $ | 8,783,336 | |
Repurchase Agreement | | | - | | | | 296,956 | | | | - | | | | 296,956 | |
Total Investments | | $ | 8,783,336 | | | $ | 296,956 | | | $ | - | | | $ | 9,080,292 | |
Mid Cap Value | | | | | | | | | | | | | | | | |
Common Stocks(1) | | $ | 10,037,327 | | | $ | - | | | $ | - | | | $ | 10,037,327 | |
Repurchase Agreement | | | - | | | | 784,678 | | | | - | | | | 784,678 | |
Total Investments | | $ | 10,037,327 | | | $ | 784,678 | | | $ | - | | | $ | 10,822,005 | |
Small Cap | | | | | | | | | | | | | | | | |
Common Stocks(1) | | $ | 1,478,191 | | | $ | - | | | $ | - | | | $ | 1,478,191 | |
Repurchase Agreement | | | - | | | | 70,646 | | | | - | | | | 70,646 | |
Total Investments | | $ | 1,478,191 | | | $ | 70,646 | | | $ | - | | | $ | 1,548,837 | |
Small Cap Value | | | | | | | | | | | | | | | | |
Common Stocks(1) | | $ | 2,535,072 | | | $ | - | | | $ | - | | | $ | 2,535,072 | |
Repurchase Agreement | | | - | | | | 257,835 | | | | - | | | | 257,835 | |
Total Investments | | $ | 2,535,072 | | | $ | 257,835 | | | $ | - | | | $ | 2,792,907 | |
Value | | | | | | | | | | | | | | | | |
Common Stocks(1) | | $ | 1,182,652 | | | $ | - | | | $ | - | | | $ | 1,182,652 | |
Preferred Stocks(1) | | | 94,139 | | | | - | | | | - | | | | 94,139 | |
Repurchase Agreement | | | - | | | | 145,062 | | | | - | | | | 145,062 | |
Total Investments | | $ | 1,276,791 | | | $ | 145,062 | | | $ | - | | | $ | 1,421,853 | |
|
(1) See the Fund’s Schedule of Investments for sector or country classifications. | |
(2) Foreign currency forward contracts are valued at unrealized appreciation (depreciation). | |
Transfers between investment levels may occur as the markets fluctuate and/or the availability of data used in an investment’s valuation changes. The Funds recognize transfers between the levels as of the end of the period. At September 30, 2013 the fair value of certain securities was determined based on other observable inputs, such as quoted prices for securities of the
NOTES TO FINANCIAL STATEMENTS
same issuer that trade on a different exchange, which resulted in their Level 2 classification. The following table summarizes security transfers from Level 2 to Level 1 and from Level 1 to Level 2 for each applicable Fund as of September 30, 2013 (in thousands):
| | | | | | | | |
| | | Transfers from Level 2 to Level 1 | | | Transfers from Level 1 to Level 2 | |
Emerging Markets | | $ | 5,721 | | | $ | - | |
At September 30, 2012, two equity securities held in Emerging Markets Fund were classified as Level 3 due to halts in trading. As of September 30, 2013, those securities were still held by the Fund and continue to be classified as Level 3 due to trading halts. Due to the lack of observable market data for these securities, fair market values were determined in good faith by the valuation committee using various inputs, including unobservable inputs of discounts for illiquidity and uncertainty of 90%. Increasing or decreasing the discounts for illiquidity and uncertainty would decrease or increase the calculated fair market value for these prices, respectively. As of September 30, 2012, one equity security held in International Fund was classified as Level 3 due to a significant event that occurred after local market close. This security transferred from Level 3 to Level 1 at September 30, 2013 because observable market data became available. As of September 30, 2013, the reconciliation of assets in which significant unobservable inputs (Level 3) were used in determining fair value, is as follows (in thousands):
| | | | | | | | |
| | | Emerging Markets Fund(1) | | | International Fund(2) | |
Balance as of September 30, 2012 | | $ | 773 | | | $ | 119,725 | |
Transfers into Level 3 | | | - | | | | - | |
Net change in unrealized appreciation (depreciation) for investments held as of September 30, 2013 | | | (485 | ) | | | 48,854 | |
Purchases | | | - | | | | 37,550 | |
Sales | | | - | | | | (673 | ) |
Realized Gain/Loss | | | - | | | | 100 | |
Transfers out of Level 3 | | | - | | | | (205,556 | ) |
| | | | | | | | |
Balance as of September 30, 2013 | | $ | 288 | | | $ | - | |
| | | | | | | | |
(1) Both Level 3 securities in Emerging Markets Fund were equity securities with a regional classification of Emerging Asia. | |
(2) The Level 3 security in International Fund was an equity security with a regional classification of Pacific Basin and transferred into Level 1 at September 30, 2013. | |
Each Fund is a party to various master netting agreements. While the terms and conditions of these agreements may vary, all transactions under any such agreement constitute a single contractual relationship, and each party’s obligation to make any payments, deliveries or other transfers in respect of any transaction under such an agreement may be applied against the other party’s obligations under such agreement and netted. A default by a party in performance with respect to one transaction under such an agreement would give the other party the right to terminate all transactions under such agreement and calculate one net amount owed from one party to the other.
NOTES TO FINANCIAL STATEMENTS
The following tables present information about financial instruments that are subject to enforceable master netting arrangements as of September 30, 2013 (in thousands):
| | | | | | | | | | | | | | | | | | |
| Repurchase agreements | | | | | | | | | | | | | |
| | | Gross Amounts Not Offset in the Statement of Assets and Liabilities | |
| Portfolio | | Counterparty | | Gross Asset Amounts
Presented in Statement of
Assets and Liabilities | | | Financial
Instrument | | | Collateral
Received(1) | | | Net Amount
(Not Less Than 0) | |
Emerging Markets | | State Street Bank and Trust Company | | $ | 26,360 | | | $ | - | | | $ | (26,360 | ) | | $ | - | |
Global Equity | | State Street Bank and Trust Company | | | 1,896 | | | | - | | | | (1,896 | ) | | | - | |
Global Opportunities | | State Street Bank and Trust Company | | | 31,256 | | | | - | | | | (31,256 | ) | | | - | |
Global Small Cap | | State Street Bank and Trust Company | | | 1,415 | | | | - | | | | (1,415 | ) | | | - | |
Global Value | | State Street Bank and Trust Company | | | 135,568 | | | | - | | | | (135,568 | ) | | | - | |
International | | State Street Bank and Trust Company | | | 302,475 | | | | - | | | | (302,475 | ) | | | - | |
International Small Cap | | State Street Bank and Trust Company | | | 34,870 | | | | - | | | | (34,870 | ) | | | - | |
International Value | | State Street Bank and Trust Company | | | 1,364,272 | | | | - | | | | (1,364,272 | ) | | | - | |
Mid Cap | | State Street Bank and Trust Company | | | 296,956 | | | | - | | | | (296,956 | ) | | | - | |
Mid Cap Value | | State Street Bank and Trust Company | | | 784,678 | | | | - | | | | (784,678 | ) | | | - | |
Small Cap | | State Street Bank and Trust Company | | | 70,646 | | | | - | | | | (70,646 | ) | | | - | |
Small Cap Value | | State Street Bank and Trust Company | | | 257,835 | | | | - | | | | (257,835 | ) | | | - | |
Value | | State Street Bank and Trust Company | | | 145,062 | | | | - | | | | (145,062 | ) | | | - | |
| (1) | Repurchase agreements are classified as short-term investments in the Statements of Assets and Liabilities. The market value of the collateral received is greater than the amounts indicated in the table. For further information, see Note 2(e) and the Schedules of Investments. |
NOTES TO FINANCIAL STATEMENTS
| | | | | | | | | | | | | | | | | | |
| Foreign currency forward contracts | |
| | | Gross Amounts Not Offset in the Statement of Assets and Liabilities | |
| Portfolio | | Counterparty | | Gross Asset Amounts
Presented in Statement of
Assets and Liabilities | | | Financial
Instrument | | | Collateral
Pledged | | | Net Amount
(Not Less Than 0) | |
Global Opportunities | | State Street Bank and Trust Company | | $ | 23 | | | $ | (23 | ) | | $ | - | | | $ | - | |
Global Value | | State Street Bank and Trust Company | | | 33 | | | | (18 | ) | | | - | | | | 15 | |
International Value | | State Street Bank and Trust Company | | | 746 | | | | (746 | ) | | | - | | | | - | |
| | | Gross Amounts Not Offset in the Statement of Assets and Liabilities | |
| Portfolio | | Counterparty | | Gross Liability Amounts
Presented in Statement of
Assets and Liabilities | | | Financial
Instrument | | | Collateral
Pledged | | | Net Amount
(Not Less Than 0) | |
Global Opportunities | | State Street Bank and Trust Company | | $ | 44 | | | $ | (23 | ) | | $ | - | | | $ | 21 | |
Global Value | | State Street Bank and Trust Company | | | 18 | | | | (18 | ) | | | - | | | | - | |
International Value | | State Street Bank and Trust Company | | | 765 | | | | (746 | ) | | | - | | | | 19 | |
| (5) | Transfer agent and authorized agent fees: |
Each Fund paid fees to, and reimbursed expenses of, the Funds’ transfer agent. In addition, the Funds have authorized certain financial services companies, broker-dealers, banks or other authorized agents, and in some cases, other organizations designated by an authorized agent (with their designees, collectively “authorized agents”) to accept purchase, exchange and redemption orders for Investor Shares and Advisor Shares on the Funds’ behalf. Many authorized agents charged a fee for accounting and shareholder services that the agent provided to Fund shareholders on the Fund’s behalf. Those services typically included recordkeeping, transaction processing for shareholders’ accounts and other services. The fee was either a per account charge based on the number of accounts to which the authorized agent provided such services, or was a percentage (as of September 30, 2013 up to 0.40% annually) of the average value of Fund shares held in such accounts. Each Fund paid a portion of such fees, which are intended to compensate the authorized agent for its provision of services of the type that would be provided by the Funds’ transfer agent or other service providers if the shares were registered on the books of the Funds’ transfer agent. The balance of the fees incurred was paid by the Adviser. The Funds’ expenses incurred for services provided by authorized agents were included in “Transfer agent fees” in the Statements of Operations. The table below shows the fees and expenses to the Funds’
NOTES TO FINANCIAL STATEMENTS
transfer agent and the fees to authorized agents incurred by each class of each Fund during the year ended September 30, 2013 (in thousands):
| | | | | | | | | | | | |
| | | Year Ended 9/30/2013 | |
| Fund | | Fees and Expenses
to Transfer Agent | | | Fees to
Authorized
Agents | | | Total | |
Emerging Markets - Institutional Shares | | $ | 20 | | | $ | - | | | $ | 20 | |
Emerging Markets - Advisor Shares | | | 67 | | | | 586 | | | | 653 | |
Global Equity - Investor Shares | | | 67 | | | | 194 | | | | 261 | |
Global Opportunities - Investor Shares | | | 76 | | | | 955 | | | | 1,031 | |
Global Opportunities - Institutional Shares | | | 19 | | | | - | | | | 19 | |
Global Small Cap - Investor Shares(1) | | | 10 | | | | 14 | | | | 24 | |
Global Value - Investor Shares | | | 80 | | | | 1,085 | | | | 1,165 | |
Global Value - Institutional Shares | | | 16 | | | | - | | | | 16 | |
International - Investor Shares | | | 794 | | | | 16,719 | | | | 17,513 | |
International - Institutional Shares | | | 26 | | | | - | | | | 26 | |
International Small Cap - Investor Shares | | | 84 | | | | 1,395 | | | | 1,479 | |
International Value - Investor Shares | | | 473 | | | | 11,288 | | | | 11,761 | |
International Value - Institutional Shares | | | 24 | | | | - | | | | 24 | |
Mid Cap - Investor Shares | | | 137 | | | | 12,829 | | | | 12,966 | |
Mid Cap - Institutional Shares | | | 30 | | | | - | | | | 30 | |
Mid Cap Value - Investor Shares | | | 471 | | | | 18,976 | | | | 19,447 | |
Mid Cap Value - Institutional Shares | | | 24 | | | | - | | | | 24 | |
Small Cap - Investor Shares | | | 121 | | | | 1,878 | | | | 1,999 | |
Small Cap - Institutional Shares | | | 18 | | | | - | | | | 18 | |
Small Cap Value - Investor Shares | | | 92 | | | | 5,512 | | | | 5,604 | |
Small Cap Value - Institutional Shares | | | 19 | | | | - | | | | 19 | |
Value - Investor Shares | | | 81 | | | | 2,051 | | | | 2,132 | |
Value - Institutional Shares | | | 20 | | | | - | | | | 20 | |
| | (1) | For the period from commencement of operations (June 25, 2013) through September 30, 2013 |
Each Fund had the ability to direct portfolio trades to various brokers that have agreed to rebate a portion of the commissions generated. Such cash rebates were made directly to the applicable Fund and were included in net realized gain or loss on investments in the Statements of Operations for the year ended September 30, 2013 as follows (in thousands):
| | | | |
Emerging Markets | | $ | 7 | |
Global Equity | | | - | (1) |
Global Opportunities | | | 23 | |
Global Value | | | 4 | |
International | | | 87 | |
NOTES TO FINANCIAL STATEMENTS
| | | | |
International Small Cap | | $ | 2 | |
International Value | | | 31 | |
Mid Cap | | | 160 | |
Mid Cap Value | | | 205 | |
Small Cap | | | 40 | |
Small Cap Value | | | 167 | |
Value | | | 40 | |
| |
(1) Amount rounds to less than $1 | | | | |
| (7) | Derivative Transactions: |
The fair value of derivative instruments as reported in the Statements of Assets and Liabilities as of September 30, 2013 was as follows (in thousands):
| | | | | | | | |
| Fund | | Risk Exposure Category | | Statement of Assets and
Liabilities location | | Value | |
| Global Opportunities | | Foreign currency forward contracts | | Unrealized gain on foreign currency forward contracts | | $ | 23 | |
| | | Foreign currency forward contracts | | Unrealized loss on foreign currency forward contracts | | $ | (44 | ) |
| Global Value | | Foreign currency forward contracts | | Unrealized gain on foreign currency forward contracts | | $ | 33 | |
| | | Foreign currency forward contracts | | Unrealized loss on foreign currency forward contracts | | $ | (18 | ) |
| International Value | | Foreign currency forward contracts | | Unrealized gain on foreign currency forward contracts | | $ | 746 | |
| | | Foreign currency forward contracts | | Unrealized loss on foreign currency forward contracts | | $ | (765 | ) |
The effect of derivative instruments on the Statements of Operations for the year ended September 30, 2013 was as follows (in thousands):
Amount of Realized Gain on Derivatives Recognized in Income
| | | | | | | | |
| Fund | | Risk Exposure Category | | Statement of Operations location | | Value | |
| Global Opportunities | | Foreign currency forward contracts | | Net realized gain on foreign currency related transactions | | $ | 866 | |
| Global Value | | Foreign currency forward contracts | | Net realized gain on foreign currency related transactions | | $ | 129 | |
| International Value | | Foreign currency forward contracts | | Net realized gain on foreign currency related transactions | | $ | 116,338 | |
Change in Unrealized Appreciation (Depreciation) on Derivatives Recognized in Income
| | | | | | | | |
| Fund | | Risk Exposure Category | | Statement of Operations location | | Value | |
| Global Opportunities | | Foreign currency forward contracts | | Net increase in unrealized appreciation or depreciation on foreign currency related transactions | | $ | 2 | |
| Global Value | | Foreign currency forward contracts | | Net increase in unrealized appreciation or depreciation on foreign currency related transactions | | $ | 78 | |
| International Value | | Foreign currency forward contracts | | Net increase in unrealized appreciation or depreciation on foreign currency related transactions | | $ | 4,744 | |
NOTES TO FINANCIAL STATEMENTS
Volume of derivative activity
| | | | | | | | | | | | |
| Fund | | Contracts Closed(1) | | | Contracts Opened(1) | | | Contracts Open at September 30, 2013 | |
Global Opportunities | | | 3 | | | | 2 | | | | 2 | |
Global Value | | | 2 | | | | 4 | | | | 4 | |
International Value | | | 3 | | | | 4 | | | | 4 | |
| (1) | During the year ended September 30, 2013. |
| (8) | Transactions with affiliates: |
The Adviser, with which the officers and a director of Artisan Funds were affiliated, provided investment advisory and administrative services to the Funds. In exchange for those services, each Fund paid a monthly management fee to the Adviser as follows:
Emerging Markets Fund*
| | | | |
Average Daily Net Assets | | Annual Rate | |
Less than $1 billion | | | 1.050 | % |
$1 billion to $2 billion | | | 1.025 | |
$2 billion to $3.5 billion | | | 1.000 | |
$3.5 billion to $5 billion | | | 0.975 | |
Greater than $5 billion | | | 0.950 | |
| * | Effective February 1, 2013; prior thereto, the annual fee was determined as a percentage of average daily net assets and paid monthly at the annual rate of 1.050%. |
Global Equity Fund and Global Value Fund
| | | | |
Average Daily Net Assets | | Annual Rate | |
Less than $1 billion | | | 1.000 | % |
$1 billion to $4 billion | | | 0.975 | |
$4 billion to $8 billion | | | 0.950 | |
$8 billion to $12 billion | | | 0.925 | |
Greater than $12 billion | | | 0.900 | |
Global Opportunities Fund
| | | | |
Average Daily Net Assets | | Annual Rate | |
Less than $1 billion | | | 0.900 | % |
$1 billion to $4 billion | | | 0.875 | |
$4 billion to $8 billion | | | 0.850 | |
$8 billion to $12 billion | | | 0.825 | |
Greater than $12 billion | | | 0.800 | |
Global Small Cap Fund
| | | | |
Average Daily Net Assets | | Annual Rate | |
All | | | 1.000 | % |
NOTES TO FINANCIAL STATEMENTS
International Fund
| | | | |
Average Daily Net Assets | | Annual Rate | |
Less than $500 million | | | 1.000 | % |
$500 million to $750 million | | | 0.975 | |
$750 million to $1 billion | | | 0.950 | |
$1 billion to $12 billion | | | 0.925 | |
Greater than $12 billion | | | 0.900 | |
International Small Cap Fund
| | | | |
Average Daily Net Assets | | Annual Rate | |
All | | | 1.250 | % |
International Value Fund, Mid Cap Fund, Mid Cap Value Fund, Small Cap Fund, and Small Cap Value Fund
| | | | |
Average Daily Net Assets | | Annual Rate | |
Less than $500 million | | | 1.000 | % |
$500 million to $750 million | | | 0.975 | |
$750 million to $1 billion | | | 0.950 | |
Greater than $1 billion | | | 0.925 | |
Value Fund
| | | | |
Average Daily Net Assets | | Annual Rate | |
Less than $50 million | | | 0.800 | % |
$50 million to $100 million | | | 0.760 | |
$100 million to $500 million | | | 0.720 | |
$500 million to $7.5 billion | | | 0.680 | |
Greater than $7.5 billion | | | 0.640 | |
The Adviser has contractually agreed to waive its management fee, and to the extent that the fee waiver is insufficient, to reimburse Emerging Markets Fund, Global Equity Fund and Global Small Cap Fund for any ordinary operating expenses in an amount sufficient to cause the Fund’s ordinary operating expenses, including the management fee, to be not more than 1.50% of average daily net assets, annually. This contract continues through February 1, 2015, at which time the Adviser will determine whether to renew, revise or discontinue it. For the year ended September 30, 2013, the Adviser waived management fees of approximately $205,000 and $67,000 for Global Equity Fund and Global Small Cap Fund, respectively. For the year ended September 30, 2013, Global Small Cap Fund incurred operating expenses of approximately $1,000 that were reimbursed by the Adviser.
The officers and director of Artisan Funds who are affiliated with the Adviser receive no compensation from the Funds. Prior to July 1, 2013, each director who was not an affiliated person of the Adviser received an annual retainer of $200,000, payable quarterly, subject to an additional increase of $10,000 upon commencement of operations of any new series of Artisan Funds. Effective July 1, 2013, for each director, the amount of the annual retainer increased by $10,000 to $210,000, due to the commencement of operations of Global Small Cap Fund, a new series of Artisan Funds. Additionally, each director is entitled to reimbursement of expenses related to his or her duties as a director of Artisan Funds.
NOTES TO FINANCIAL STATEMENTS
In addition, the non-interested chair of the board of directors received an annual retainer of $60,000, payable quarterly, and each chair of a board committee who was a non-interested director received an annual retainer of $30,000, payable quarterly. These fees were generally allocated to each of the Artisan Funds based on net assets, subject to a minimum allocation of $1,500 to each Fund per quarter.
Artisan Funds has adopted a deferred compensation plan for directors who are not affiliated persons of the Adviser that enables directors to elect to defer receipt of all or a portion of the annual compensation they are entitled to receive from the Funds. For purposes of determining the amount owed to the directors under the plan, deferred amounts would be invested in shares of Artisan Funds as selected by the individual directors. Each Fund would purchase shares of Artisan Funds selected for deferral by the director in amounts equal to his investment, resulting in a Fund asset equal to the deferred compensation liability. As of September 30, 2013, no directors have elected to participate in the deferred compensation plan.
Shares of Artisan Funds were offered for sale by Artisan Partners Distributors LLC (“Distributors”). Distributors is wholly owned by Artisan Holdings. All distribution expenses relating to the Funds were paid by the Adviser.
| (9) | Line of credit arrangement: |
Artisan Funds is party to a line of credit agreement with State Street Bank and Trust Company (“SSB”), which expires in August 2014, under which each Fund may borrow up to $75 million, provided that such borrowing does not exceed the lesser of (a) 33 1/3% of its adjusted net assets, with adjusted net assets being total assets less total liabilities (excluding indebtedness for borrowed money) after giving effect to the borrowing, and (b) the maximum amount the Fund is permitted to borrow pursuant to applicable law, pursuant to the Fund’s prospectus limitations on indebtedness, pursuant to any vote of the shareholders of the Fund, or pursuant to any limitation on borrowings in any applicable agreement with any governmental authority or regulator or any other applicable agreement or document to which such Fund is a party; provided that the aggregate borrowings by all Artisan Funds may not exceed $100 million. Artisan Funds paid a commitment fee at the annual rate of 0.10% on the unused portion of the line of credit and interest was charged on any borrowings at the higher of the current Federal Funds or overnight LIBOR rates plus 1.25%. The commitment fee is allocated to each Fund based on net assets. The use of the line of credit was generally restricted to temporary borrowing for extraordinary or emergency purposes. During the year ended September 30, 2013, there were no borrowings under the line of credit for any of the Funds, except for Emerging Markets Fund which had maximum borrowings of approximately $9,401,000.
| (10) | Investment transactions: |
The cost of securities purchased and the proceeds from the sale of securities (excluding short-term securities) for the year ended September 30, 2013 were as follows (in thousands):
| | | | | | | | |
| Fund | | Security Purchases | | | Security Sales | |
Emerging Markets | | $ | 242,147 | | | $ | 357,848 | |
Global Equity | | | 221,199 | | | | 96,808 | |
Global Opportunities | | | 530,829 | | | | 206,879 | |
NOTES TO FINANCIAL STATEMENTS
| | | | | | | | |
| Fund | | Security Purchases | | | Security Sales | |
Global Small Cap(1) | | $ | 40,487 | | | $ | 2,456 | |
Global Value | | | 845,601 | | | | 161,265 | |
International | | | 6,089,743 | | | | 4,690,574 | |
International Small Cap | | | 532,379 | | | | 486,090 | |
International Value | | | 3,553,899 | | | | 2,486,261 | |
Mid Cap | | | 3,322,406 | | | | 3,155,627 | |
Mid Cap Value | | | 2,359,031 | | | | 2,231,475 | |
Small Cap | | | 872,378 | | | | 431,296 | |
Small Cap Value | | | 658,465 | | | | 1,186,765 | |
Value | | | 891,558 | | | | 539,783 | |
| (1) | For the period from commencement of operations (June 25, 2013) through September 30, 2013 |
| (11) | Transactions in securities of affiliates: |
The table below shows information about securities of the Funds’ “affiliates” (as defined below) that were held by the Funds, purchased or sold by the Funds, or from which dividends were received by the Funds during the year ended September 30, 2013 (dollar values in thousands). The Funds identify a company as an affiliate for the purpose of this report if one or more of the Funds owned, in the aggregate, voting securities that it believed represented 5% or more of that company’s outstanding voting securities (as defined by the 1940 Act) during the year ended September 30, 2013.
| | | | | | | | | | | | | | | | | | | | | | | | | | | | | | |
| | | | | As of
9/30/12 | | | | | | | | | Net
Realized
Gain (Loss) | | | | | | As of
9/30/13 | |
| Fund | | Security | | Share
Balance | | | Purchase
Cost | | | Sales
Cost | | | | Dividend
Income@ | | | Share
Balance | | | Value | |
| Global Value | | | | | | | | | | | | | | | | | | | | | | | | | | | | |
| | | Arch Capital Group Ltd. | | | 186,146 | | | $ | 25,776 | | | $ | 2,585 | | | $ | 5 | | | $ | - | | | | 645,320 | | | $ | 34,931 | |
| | | Stanley Electric Co., Ltd.† | | | 41,700 | | | | 102 | | | | 733 | | | | (34 | ) | | | - | | | | - | | | | - | |
| | | Total# | | | | | | $ | 25,878 | | | $ | 3,318 | | | $ | (29 | ) | | $ | - | | | | | | | $ | 34,931 | |
| International Value | | | | | | | | | | | | | | | | | | | | | | | | | | | | |
| | | Aderans Co., Ltd.§ | | | 2,612,467 | | | $ | 4,284 | | | $ | 25,116 | | | $ | 8,475 | | | $ | 293 | | | | 904,100 | | | $ | 13,024 | |
| | | Alent plc† | | | - | | | | 30,626 | | | | - | | | | - | | | | 2,216 | | | | 17,387,295 | | | | 99,927 | |
| | | Arch Capital Group Ltd. | | | 6,040,912 | | | | 55,885 | | | | 66,904 | | | | 10,803 | | | | - | | | | 5,768,633 | | | | 312,256 | |
| | | ICON PLC*§ | | | 4,501,487 | | | | 1,928 | | | | 63,611 | | | | 37,695 | | | | - | | | | - | | | | - | |
| | | Mallinckrodt plc§† | | | - | | | | 96,354 | | | | - | | | | - | | | | - | | | | 2,824,187 | | | | 124,519 | |
| | | Michael Page International plc§† | | | 13,071,936 | | | | 17,430 | | | | 33,947 | | | | 8,683 | | | | 2,339 | | | | 10,403,141 | | | | 82,911 | |
| | | Panalpina Welttransport Holding AG | | | 1,471,407 | | | | 37,279 | | | | 21,802 | | | | 2,539 | | | | 3,047 | | | | 1,669,654 | | | | 246,105 | |
| | | QinetiQ Group plc | | | 61,299,386 | | | | 20,503 | | | | 33,713 | | | | 1,119 | | | | 3,496 | | | | 55,999,571 | | | | 173,700 | |
| | | Savills plc§ | | | 10,727,785 | | | | 3,852 | | | | 33,203 | | | | 22,727 | | | | 2,217 | | | | 5,188,110 | | | | 51,906 | |
| | | Stanley Electric Co., Ltd.† | | | 8,160,600 | | | | 35,748 | | | | 8,239 | | | | 171 | | | | 2,598 | | | | 9,759,300 | | | | 207,011 | |
| | | Vesuvius plc† | | | - | | | | 41,699 | | | | - | | | | - | | | | 3,897 | | | | 18,827,331 | | | | 136,183 | |
| | | Total# | | | | | | $ | 345,588 | | | $ | 286,535 | | | $ | 92,212 | | | $ | 20,103 | | | | | | | $ | 1,175,182 | |
NOTES TO FINANCIAL STATEMENTS
| | | | | | | | | | | | | | | | | | | | | | | | | | | | | | |
| | | | | As of
9/30/12 | | | | | | | | | Net
Realized
Gain (Loss) | | | | | | As of
9/30/13 | |
| Fund | | Security | | Share
Balance | | | Purchase
Cost | | | Sales
Cost | | | | Dividend
Income@ | | | Share
Balance | | | Value | |
| Mid Cap | | | | | | | | | | | | | | | | | | | | | | | | | | | | |
| | | athenahealth, Inc. | | | 1,827,315 | | | $ | 39,637 | | | $ | 48,601 | | | $ | 18,775 | | | $ | - | | | | 1,482,981 | | | $ | 160,992 | |
| | | Cepheid, Inc. | | | 3,459,600 | | | | 11,569 | | | | 2,872 | | | | (568 | ) | | | - | | | | 3,719,402 | | | | 145,206 | |
| | | FLIR Systems, Inc. | | | 1,702,200 | | | | 49,167 | | | | 1,239 | | | | (214 | ) | | | 993 | | | | 3,598,959 | | | | 113,007 | |
| | | IPG Photonics Corp.† | | | 2,207,100 | | | | 4,618 | | | | 3,529 | | | | (754 | ) | | | 1,419 | | | | 2,228,158 | | | | 125,468 | |
| | | Isis Pharmaceuticals, Inc.† | | | - | | | | 70,804 | | | | 821 | | | | 74 | | | | - | | | | 4,726,216 | | | | 177,422 | |
| | | Total# | | | | | | $ | 175,795 | | | $ | 57,062 | | | $ | 17,313 | | | $ | 2,412 | | | | | | | $ | 722,095 | |
| Mid Cap Value | | | | | | | | | | | | | | | | | | | | | | | | | | | | |
| | | Arch Capital Group Ltd. | | | 3,865,186 | | | $ | 10,127 | | | $ | 3,570 | | | $ | 514 | | | $ | - | | | | 3,963,486 | | | $ | 214,543 | |
| | | Arrow Electronics, Inc. | | | 5,329,061 | | | | 11,989 | | | | 5,420 | | | | (565 | ) | | | - | | | | 5,482,961 | | | | 266,088 | |
| | | Avnet, Inc. | | | 6,754,379 | | | | 20,165 | | | | 6,108 | | | | (971 | ) | | | 1,080 | | | | 7,204,079 | | | | 300,482 | |
| | | FLIR Systems, Inc. | | | 7,992,622 | | | | 12,042 | | | | 4,912 | | | | (641 | ) | | | 2,702 | | | | 8,224,522 | | | | 258,250 | |
| | | Hatteras Financial Corp.† | | | 2,592,155 | | | | 125,453 | | | | 1,794 | | | | (142 | ) | | | 14,557 | | | | 7,493,455 | | | | 140,203 | |
| | | Ingram Micro, Inc., Class A | | | 10,362,660 | | | | 6,867 | | | | 27,097 | | | | 3,725 | | | | - | | | | 9,307,460 | | | | 214,537 | |
| | | Lexmark International, Inc., Class A | | | 4,391,595 | | | | 4,512 | | | | 47,024 | | | | (4,071 | ) | | | 4,984 | | | | 3,344,312 | | | | 110,362 | |
| | | McDermott International, Inc.† | | | 10,876,288 | | | | 30,846 | | | | 3,479 | | | | (583 | ) | | | - | | | | 13,830,400 | | | | 102,760 | |
| | | Patterson-UTI Energy, Inc. | | | 7,961,374 | | | | 17,528 | | | | 3,702 | | | | (153 | ) | | | 1,609 | | | | 8,617,874 | | | | 184,250 | |
| | | Ryder System, Inc. | | | 1,720,723 | | | | 5,490 | | | | 2,241 | | | | (142 | ) | | | 2,174 | | | | 1,770,323 | | | | 105,688 | |
| | | Total# | | | | | | $ | 245,019 | | | $ | 105,347 | | | $ | (3,029 | ) | | $ | 27,106 | | | | | | | $ | 1,897,163 | |
| Small Cap | | | | | | | | | | | | | | | | | | | | | | | | | | | | |
| | | athenahealth, Inc. | | | 239,900 | | | $ | 20,450 | | | $ | 8,738 | | | $ | (1,052 | ) | | $ | - | | | | 361,200 | | | $ | 39,212 | |
| | | Cepheid, Inc. | | | 647,200 | | | | 16,233 | | | | 1,621 | | | | (299 | ) | | | - | | | | 1,071,300 | | | | 41,824 | |
| | | IPG Photonics Corp.† | | | 264,600 | | | | 10,937 | | | | 1,000 | | | | (17 | ) | | | 203 | | | | 426,300 | | | | 24,005 | |
| | | Isis Pharmaceuticals, Inc.† | | | 375,900 | | | | 14,481 | | | | 672 | | | | (70 | ) | | | - | | | | 1,326,300 | | | | 49,789 | |
| | | Ultratech, Inc.† | | | - | | | | 12,165 | | | | - | | | | - | | | | - | | | | 356,600 | | | | 10,805 | |
| | | Total# | | | | | | $ | 74,266 | | | $ | 12,031 | | | $ | (1,438 | ) | | $ | 203 | | | | | | | $ | 165,635 | |
| Small Cap Value | | | | | | | | | | | | | | | | | | | | | | | | | | | | |
| | | ADTRAN, Inc.§† | | | 2,786,200 | | | $ | 10,826 | | | $ | 15,232 | | | $ | (5,325 | ) | | $ | 1,078 | | | | 2,877,150 | | | $ | 76,647 | |
| | | Arrow Electronics, Inc. | | | 1,130,647 | | | | 765 | | | | 4,460 | | | | 2,750 | | | | - | | | | 961,450 | | | | 46,659 | |
| | | Comfort Systems USA, Inc.§ | | | 2,214,426 | | | | 223 | | | | 15,550 | | | | 2,226 | | | | 282 | | | | 870,650 | | | | 14,635 | |
| | | CRA International, Inc. | | | 709,779 | | | | 201 | | | | 2,900 | | | | (690 | ) | | | - | | | | 602,200 | | | | 11,213 | |
| | | EarthLink, Inc.† | | | 5,009,540 | | | | 6,195 | | | | 6,843 | | | | (2,097 | ) | | | 966 | | | | 5,406,400 | | | | 26,762 | |
| | | Hatteras Financial Corp.† | | | 833,500 | | | | 24,582 | | | | 3,322 | | | | (407 | ) | | | 3,343 | | | | 1,706,900 | | | | 31,936 | |
| | | Hawaiian Holdings, Inc. | | | 2,896,800 | | | | 1,117 | | | | 2,854 | | | | (63 | ) | | | - | | | | 2,625,450 | | | | 19,533 | |
| | | ICON plc*§ | | | 1,343,941 | | | | - | | | | 21,313 | | | | 13,567 | | | | - | | | | 343,650 | | | | 14,066 | |
| | | Lexmark International, Inc., Class A | | | 1,295,687 | | | | 433 | | | | 20,160 | | | | 2,680 | | | | 1,234 | | | | 587,350 | | | | 19,383 | |
| | | Matthews International Corp., Class A§ | | | 1,419,500 | | | | - | | | | 25,624 | | | | 2,259 | | | | 506 | | | | 665,605 | | | | 25,346 | |
| | | Nanometrics, Inc.† | | | 722,900 | | | | 8,661 | | | | 1,030 | | | | (21 | ) | | | - | | | | 1,286,750 | | | | 20,742 | |
| | | Neutral Tandem Inc§ | | | 1,988,900 | | | | - | | | | 28,357 | | | | (21,919 | ) | | | 5,818 | | | | - | | | | - | |
| | | Orion Marine Group, Inc. | | | 1,601,100 | | | | 512 | | | | 3,596 | | | | (1,209 | ) | | | - | | | | 1,371,750 | | | | 14,280 | |
| | | PICO Holdings, Inc. | | | 1,138,890 | | | | 4,018 | | | | 6,172 | | | | (1,847 | ) | | | - | | | | 1,150,450 | | | | 24,919 | |
NOTES TO FINANCIAL STATEMENTS
| | | | | | | | | | | | | | | | | | | | | | | | | | | | | | |
| | | | | As of
9/30/12 | | | | | | | | | Net
Realized
Gain (Loss) | | | | | | As of
9/30/13 | |
| Fund | | Security | | Share
Balance | | | Purchase
Cost | | | Sales
Cost | | | | Dividend
Income@ | | | Share
Balance | | | Value | |
| | | Ryder System, Inc. | | | 1,601,064 | | | $ | 1,393 | | | $ | 15,161 | | | $ | 2,871 | | | $ | 1,745 | | | | 1,286,750 | | | $ | 76,819 | |
| | | Sykes Enterprises, Inc.§ | | | 2,723,494 | | | | 543 | | | | 17,494 | | | | (5,411 | ) | | | - | | | | 1,979,000 | | | | 35,444 | |
| | | Ultratech, Inc. | | | 1,757,837 | | | | 5,011 | | | | 6,722 | | | | 2,457 | | | | - | | | | 1,651,500 | | | | 50,040 | |
| | | Websense Inc§ | | | 1,914,637 | | | | 1,367 | | | | 34,777 | | | | 12,145 | | | | - | | | | - | | | | - | |
| | | Total# | | | | | | $ | 65,847 | | | $ | 231,567 | | | $ | 1,966 | | | $ | 14,972 | | | | | | | $ | 342,286 | |
| Value | | | | | | | | | | | | | | | | | | | | | | | | | | | | |
| | | Arch Capital Group Ltd. | | | 561,300 | | | $ | 8,907 | | | $ | 9,125 | | | $ | 2,936 | | | $ | - | | | | 510,519 | | | $ | 27,635 | |
| | | Avnet, Inc. | | | 709,300 | | | | 21,147 | | | | 18,660 | | | | 1,675 | | | | 85 | | | | 714,180 | | | | 29,788 | |
| | | Ingram Micro Inc§ | | | 1,252,000 | | | | 883 | | | | 22,445 | | | | (1,739 | ) | | | - | | | | - | | | | - | |
| | | Total# | | | | | | $ | 30,937 | | | $ | 50,230 | | | $ | 2,872 | | | $ | 85 | | | | | | | $ | 57,423 | |
| | |
| @ | | Net of foreign taxes withheld, if any. |
| # | | Total value as of September 30, 2013 is presented for only those issuers that were affiliates as of September 30, 2013. |
| § | | Issuer was no longer an affiliate as of September 30, 2013. |
| † | | Issuer was not an affiliate as of September 30, 2012. |
| * | | As of September 30, 2013, shares were held through a depositary receipt. |
| (12) | Information for Federal income tax purposes: |
For Federal income tax purposes, the cost of investments, gross unrealized appreciation, gross unrealized depreciation and net unrealized appreciation (depreciation) on investments as of September 30, 2013 was as follows (in thousands):
| | | | | | | | | | | | | | | | |
| Fund | | Cost of Investments | | | Gross Unrealized Appreciation | | | Gross Unrealized Depreciation | | | Net
Unrealized Appreciation (Depreciation) on Investments | |
Emerging Markets | | $ | 729,339 | | | $ | 75,080 | | | $ | (135,036 | ) | | $ | (59,956 | ) |
Global Equity | | | 147,068 | | | | 13,373 | | | | (5,850 | ) | | | 7,523 | |
Global Opportunities | | | 615,303 | | | | 146,897 | | | | (6,449 | ) | | | 140,448 | |
Global Small Cap | | | 39,531 | | | | 2,105 | | | | (1,343 | ) | | | 762 | |
Global Value | | | 1,020,382 | | | | 130,398 | | | | (1,123 | ) | | | 129,275 | |
International | | | 10,179,290 | | | | 3,256,342 | | | | (87,010 | ) | | | 3,169,332 | |
International Small Cap | | | 710,553 | | | | 306,330 | | | | (27,457 | ) | | | 278,873 | |
International Value | | | 8,061,232 | | | | 2,392,689 | | | | (14,121 | ) | | | 2,378,568 | |
Mid Cap | | | 5,526,349 | | | | 3,566,839 | | | | (12,896 | ) | | | 3,553,943 | |
Mid Cap Value | | | 8,049,557 | | | | 2,956,392 | | | | (183,944 | ) | | | 2,772,448 | |
Small Cap | | | 1,099,322 | | | | 461,951 | | | | (12,436 | ) | | | 449,515 | |
Small Cap Value | | | 2,255,718 | | | | 629,601 | | | | (92,412 | ) | | | 537,189 | |
Value | | | 1,267,198 | | | | 180,684 | | | | (26,029 | ) | | | 154,655 | |
NOTES TO FINANCIAL STATEMENTS
The difference between cost of investments for financial reporting and cost of investments for Federal income tax purposes was due primarily to timing differences in recognizing certain gains and losses on security transactions (e.g., wash sale loss deferrals and passive foreign investment company transactions).
The tax characterization of ordinary income dividends and long-term capital gain distributions paid during the year ended September 30, 2013 and the year ended September 30, 2012 were as follows (in thousands):
| | | | | | | | | | | | | | | | |
| | | Year Ended 9/30/2013 | | | Year Ended 9/30/2012 | |
| Fund | | Ordinary Income Dividends | | | Long-Term Capital Gain Distributions | | | Ordinary Income Dividends | | | Long-Term Capital Gain Distributions | |
Emerging Markets | | $ | 10,969 | | | $ | - | | | $ | 5,791 | | | $ | 1,871 | |
Global Equity | | | 490 | | | | 413 | | | | 219 | | | | - | |
Global Opportunities | | | - | | | | - | | | | - | | | | 1,611 | |
Global Small Cap(1) | | | - | | | | - | | | | | | | | | |
Global Value | | | 2,220 | | | | 190 | | | | - | | | | 1,393 | |
International | | | 120,654 | | | | - | | | | 120,942 | | | | - | |
International Small Cap | | | 7,730 | | | | - | | | | 2,354 | | | | - | |
International Value | | | 76,579 | | | | 30,794 | | | | 3,150 | | | | 12,240 | |
Mid Cap | | | - | | | | 309,505 | | | | - | | | | - | |
Mid Cap Value | | | 98,001 | | | | 330,867 | | | | 165,166 | | | | 377,653 | |
Small Cap | | | - | | | | - | | | | - | | | | - | |
Small Cap Value | | | 41,904 | | | | 38,071 | | | | 52,068 | | | | 187,263 | |
Value | | | 7,069 | | | | - | | | | 4,597 | | | | - | |
| (1) | For the period from commencement of operations (June 25, 2013) through September 30, 2013 |
Ordinary income dividends and long-term capital gain distributions were determined in accordance with income tax regulations that impose treatment that is different from the treatment that would result from the application of US GAAP for such items as net short-term gains, wash sale loss deferrals, passive foreign investment company transactions, foreign currency transactions, net investment losses and qualified late year ordinary losses.
Gains on redemptions-in-kind for International Fund of $16,612,328 were included in net realized gain (loss) on investments in the Statements of Operations for the year ended September 30, 2013, and were not recognized for Federal income tax purposes. These net realized gains represented permanent book/tax differences and were reclassified to “Fund shares issued and outstanding” on the accompanying Statements of Assets and Liabilities.
In order to meet certain excise tax distribution requirements, the Funds are required to measure and distribute annually, net capital gains realized during a twelve-month period ending October 31 and net investment income earned during a twelve-month period ending December 31. In connection with these requirements, the Funds are permitted for tax purposes to defer into their next fiscal year qualified late year losses. Qualified late year capital losses are any net capital losses incurred between November 1 and the end of the
NOTES TO FINANCIAL STATEMENTS
Funds’ fiscal year, September 30, 2013. Qualified late year ordinary losses are specified losses generally incurred between January 1 and the end of the Funds’ fiscal year, September 30, 2013.
Additional tax information as of and for the year ended September 30, 2013 follows (in thousands):
| | | | | | | | | | | | | | | | | | | | |
| | | Undistributed Ordinary Income | | | Undistributed Long-Term Gain | | | Qualified Late Year Capital Losses | | | Late Year Ordinary Losses | | | Other Deferred Gains (Losses)(1) | |
Emerging Markets | | $ | 4,870 | | | $ | - | | | $ | 35,970 | | | $ | - | | | $ | (40 | ) |
Global Equity | | | 5,756 | | | | 1,727 | | | | - | | | | - | | | | (8 | ) |
Global Opportunities | | | - | | | | - | | | | 2,919 | | | | - | | | | 5 | |
Global Small Cap | | | 122 | | | | - | | | | - | (2) | | | - | (2) | | | 1 | (2) |
Global Value | | | 9,851 | | | | 12,958 | | | | - | | | | - | | | | (31 | ) |
International | | | 147,801 | | | | - | | | | - | | | | - | | | | 829 | |
International Small Cap | | | 4,980 | | | | 46,672 | | | | - | | | | - | | | | 37 | |
International Value | | | 263,898 | | | | 491,188 | | | | - | | | | - | | | | 370 | |
Mid Cap | | | - | | | | 583,948 | | | | - | | | | 39,542 | | | | (1 | ) |
Mid Cap Value | | | 75,874 | | | | 379,168 | | | | - | | | | - | | | | 2 | |
Small Cap | | | - | | | | - | | | | 939 | | | | 8,571 | | | | - | |
Small Cap Value | | | 11,976 | | | | 46,473 | | | | - | | | | - | | | | (134 | ) |
Value | | | 12,899 | | | | 39,734 | | | | - | | | | - | | | | 1 | |
| (1) | Other deferred gains and losses relate to (a) gains or losses on transactions that occurred subsequent to year end that affected the distributable earnings at September 30, 2013 such as wash sales, (b) unrealized gains and losses on open foreign currency contracts and (c) other items. |
| (2) | For the period from commencement of operations (June 25, 2013) through September 30, 2013. |
On December 22, 2010, the Regulated Investment Company Modernization Act of 2010 (the “Act”) was enacted, which changed various technical rules governing the tax treatment of regulated investment companies. The changes are generally effective for taxable years beginning after the date of enactment. Under the Act, each Fund is permitted to carry forward capital losses incurred in taxable years beginning after the date of enactment for an unlimited period. However, any losses incurred during those future taxable years must be utilized prior to the losses incurred in pre-enactment taxable years, which carry an expiration date. As a result, pre-enactment capital loss carryforwards may be more likely to expire unused. Additionally, post-enactment capital loss carryforwards will retain their character as either short-term or long-term capital losses rather than being considered all short-term, as permitted under previous law. Thus, such losses must be used first to offset gains of the same character; for example, long-term carryforward losses will first offset long-term gains, before they can be used to offset short-term gains.
NOTES TO FINANCIAL STATEMENTS
As of September 30, 2013, the Funds had capital loss carryovers as follows (in thousands):
| | | | | | | | | | | | |
| | | Expiration Dates | |
| | | 2018 | | | Unlimited – ST | | | Unlimited – LT | |
Emerging Markets | | $ | - | | | $ | - | | | $ | 41,379 | |
Global Opportunities | | | - | | | | 2,221 | | | | - | |
International | | | 1,070,194 | | | | - | | | | - | |
Small Cap | | | 85,638 | | | | - | | | | - | |
To the extent the Funds realize future net capital gains, those gains will be offset by any unused capital loss carryover.
| (13) | Fund share activities: |
Capital share transactions for the Funds were as follows (dollar values in thousands):
| | | | | | | | | | | | | | | | |
| | | EMERGING MARKETS | |
| | | Year Ended
9/30/2013 | | | Year Ended
9/30/2012 | |
| | | Shares | | | Amount | | | Shares | | | Amount | |
Proceeds from shares issued | | | | | | | | | | | | | | | | |
Institutional Shares | | | 8,220,620 | | | $ | 100,176 | | | | 16,979,081 | | | $ | 204,774 | |
Advisor Shares | | | 4,922,388 | | | | 62,365 | | | | 8,026,342 | | | | 99,599 | |
Net asset value of shares transferred | | | | | | | | | | | | | | | | |
Institutional Shares | | | 101,670 | | | | 1,275 | | | | - | | | | - | |
Advisor Shares | | | (101,508 | ) | | | (1,275 | ) | | | - | | | | - | |
Net asset value of shares issued in reinvestment of dividends and distributions | | | | | | | | | | | | | | | | |
Institutional Shares | | | 568,438 | | | | 7,458 | | | | 440,061 | | | | 4,973 | |
Advisor Shares | | | 228,979 | | | | 3,013 | | | | 182,171 | | | | 2,064 | |
Cost of shares redeemed(1) | | | | | | | | | | | | | | | | |
Institutional Shares | | | (10,136,596 | ) | | | (129,368 | ) | | | (9,579,084 | ) | | | (115,493 | ) |
Advisor Shares | | | (11,733,152 | ) | | | (148,514 | ) | | | (13,166,849 | ) | | | (161,647 | ) |
Net increase from fund share transactions | | | | | | | | | | | | | | | | |
Institutional Shares | | | (1,245,868 | ) | | | (20,459 | ) | | | 7,840,058 | | | | 94,254 | |
Advisor Shares | | | (6,683,293 | ) | | | (84,411 | ) | | | (4,958,336 | ) | | | (59,984 | ) |
Redemption Fee | | | | | | | | | | | | | | | | |
Institutional Shares | | | - | | | | 15 | | | | - | | | | 25 | |
Advisor Shares | | | - | | | | 8 | | | | - | | | | 17 | |
NOTES TO FINANCIAL STATEMENTS
| | | | | | | | | | | | | | | | |
| | | GLOBAL EQUITY | |
| | | Year Ended
9/30/2013 | | | Year Ended
9/30/2012 | |
| | | Shares | | | Amount | | | Shares | | | Amount | |
Proceeds from shares issued | | | | | | | | | | | | | | | | |
Investor Shares | | | 9,800,824 | | | $ | 144,151 | | | | 257,601 | | | $ | 3,116 | |
Net asset value of shares issued in reinvestment of dividends and distributions | | | | | | | | | | | | | | | | |
Investor Shares | | | 68,502 | | | | 899 | | | | 21,609 | | | | 218 | |
Cost of shares redeemed(1) | | | | | | | | | | | | | | | | |
Investor Shares | | | (1,128,819 | ) | | | (16,719 | ) | | | (198,039 | ) | | | (2,155 | ) |
Net increase from fund share transactions | | | | | | | | | | | | | | | | |
Investor Shares | | | 8,740,507 | | | | 128,331 | | | | 81,171 | | | | 1,179 | |
Redemption Fee | | | | | | | | | | | | | | | | |
Investor Shares | | | - | | | | 32 | | | | - | | | | 3 | |
| |
| | | GLOBAL OPPORTUNITIES | |
| | | Year Ended
9/30/2013 | | | Year Ended
9/30/2012 | |
| | | Shares | | | Amount | | | Shares | | | Amount | |
Proceeds from shares issued | | | | | | | | | | | | | | | | |
Investor Shares | | | 22,229,796 | | | $ | 345,742 | | | | 6,799,049 | | | $ | 90,608 | |
Institutional Shares | | | 6,688,076 | | | | 106,606 | | | | 11,563,211 | | | | 151,140 | |
Net asset value of shares issued in reinvestment of dividends and distributions | | | | | | | | | | | | | | | | |
Investor Shares | | | - | | | | - | | | | 110,071 | | | | 1,207 | |
Institutional Shares | | | - | | | | - | | | | 32,475 | | | | 356 | |
Cost of shares redeemed(1) | | | | | | | | | | | | | | | | |
Investor Shares | | | (6,852,525 | ) | | | (107,009 | ) | | | (4,020,707 | ) | | | (48,137 | ) |
Institutional Shares | | | (366,302 | ) | | | (5,702 | ) | | | (6,895,398 | ) | | | (89,911 | ) |
Net increase from fund share transactions | | | | | | | | | | | | | | | | |
Investor Shares | | | 15,377,271 | | | | 238,733 | | | | 2,888,413 | | | | 43,678 | |
Institutional Shares | | | 6,321,774 | | | | 100,904 | | | | 4,700,288 | | | | 61,585 | |
Redemption Fee | | | | | | | | | | | | | | | | |
Investor Shares | | | - | | | | 135 | | | | - | | | | 28 | |
Institutional Shares | | | - | | | | 48 | | | | - | | | | 10 | |
| | | |
| | | GLOBAL SMALL CAP | | | | | | | |
| | | Period Ended
9/30/2013(2) | | | | | | | |
| | | Shares | | | Amount | | | | | | | |
Proceeds from shares issued | | | | | | | | | | | | | | | | |
Investor Shares | | | 3,755,886 | | | $ | 38,973 | | | | | | | | | |
Cost of shares redeemed(1) | | | | | | | | | | | | | | | | |
Investor Shares | | | (26,741 | ) | | | (279 | ) | | | | | | | | |
Institutional Shares | | | - | | | | - | | | | | | | | | |
Net increase from fund share transactions | | | | | | | | | | | | | | | | |
Investor Shares | | | 3,729,145 | | | | 38,694 | | | | | | | | | |
Redemption Fee | | | | | | | | | | | | | | | | |
Investor Shares | | | - | | | | 3 | | | | | | | | | |
NOTES TO FINANCIAL STATEMENTS
| | | | | | | | | | | | | | | | |
| | | GLOBAL VALUE | |
| | | Year Ended
9/30/2013 | | | Year Ended
9/30/2012(3) | |
| | | Shares | | | Amount | | | Shares | | | Amount | |
Proceeds from shares issued | | | | | | | | | | | | | | | | |
Investor Shares | | | 44,718,397 | | | $ | 592,098 | | | | 14,877,779 | | | $ | 160,470 | |
Institutional Shares | | | 20,461,108 | | | | 276,444 | | | | 3,123,045 | | | | 36,100 | |
Net asset value of shares transferred | | | | | | | | | | | | | | | | |
Investor Shares | | | (281,489 | ) | | | (3,966 | ) | | | (1,095,110 | ) | | | (12,120 | ) |
Institutional Shares | | | 281,289 | | | | 3,966 | | | | 1,095,110 | | | | 12,120 | |
Net asset value of shares issued in reinvestment of dividends and distributions | | | | | | | | | | | | | | | | |
Investor Shares | | | 148,706 | | | | 1,795 | | | | 138,584 | | | | 1,360 | |
Institutional Shares | | | 46,061 | | | | 555 | | | | - | | | | - | |
Cost of shares redeemed(1) | | | | | | | | | | | | | | | | |
Investor Shares | | | (9,092,702 | ) | | | (116,509 | ) | | | (2,261,464 | ) | | | (24,163 | ) |
Institutional Shares | | | (1,526 | ) | | | (22 | ) | | | - | | | | - | |
Net increase from fund share transactions | | | | | | | | | | | | | | | | |
Investor Shares | | | 35,492,912 | | | | 473,418 | | | | 11,659,789 | | | | 125,547 | |
Institutional Shares | | | 20,786,932 | | | | 280,943 | | | | 4,218,155 | | | | 48,220 | |
Redemption Fee | | | | | | | | | | | | | | | | |
Investor Shares | | | - | | | | 128 | | | | - | | | | 57 | |
Institutional Shares | | | - | | | | - | (4) | | | - | | | | - | (4) |
| |
| | | INTERNATIONAL | |
| | | Year Ended
9/30/2013 | | | Year Ended
9/30/2012 | |
| | | Shares | | | Amount | | | Shares | | | Amount | |
Proceeds from shares issued | | | | | | | | | | | | | | | | |
Investor Shares | | | 111,618,614 | | | $ | 2,902,018 | | | | 70,913,146 | | | $ | 1,536,392 | |
Institutional Shares | | | 25,548,356 | | | | 661,789 | | | | 24,010,141 | | | | 517,584 | |
Net asset value of shares transferred | | | | | | | | | | | | | | | | |
Investor Shares | | | (2,290,722 | ) | | | (62,631 | ) | | | (10,618,754 | ) | | | (231,344 | ) |
Institutional Shares | | | 2,276,010 | | | | 62,631 | | | | 10,618,754 | | | | 231,344 | |
Net asset value of shares issued in reinvestment of dividends and distributions | | | | | | | | | | | | | | | | |
Investor Shares | | | 2,754,623 | | | | 67,764 | | | | 3,910,352 | | | | 74,375 | |
Institutional Shares | | | 1,481,920 | | | | 36,648 | | | | 1,660,721 | | | | 31,736 | |
Cost of shares redeemed(1) | | | | | | | | | | | | | | | | |
Investor Shares | | | (61,269,730 | ) | | | (1,586,473 | ) | | | (89,799,989 | ) | | | (1,918,403 | ) |
Institutional Shares | | | (21,872,919 | ) | | | (579,041 | ) | | | (26,803,261 | ) | | | (567,239 | ) |
Net increase from fund share transactions | | | | | | | | | | | | | | | | |
Investor Shares | | | 50,812,785 | | | | 1,320,678 | | | | (25,595,245 | ) | | | (538,980 | ) |
Institutional Shares | | | 7,433,367 | | | | 182,027 | | | | 9,486,355 | | | | 213,425 | |
Redemption Fee | | | | | | | | | | | | | | | | |
Investor Shares | | | - | | | | 515 | | | | - | | | | 365 | |
Institutional Shares | | | - | | | | 203 | | | | - | | | | 133 | |
NOTES TO FINANCIAL STATEMENTS
| | | | | | | | | | | | | | | | |
| | | INTERNATIONAL SMALL CAP | |
| | | Year Ended
9/30/2013 | | | Year Ended
9/30/2012 | |
| | | Shares | | | Amount | | | Shares | | | Amount | |
Proceeds from shares issued | | | | | | | | | | | | | | | | |
Investor Shares | | | 11,009,834 | | | $ | 262,667 | | | | 9,033,146 | | | $ | 170,836 | |
Net asset value of shares issued in reinvestment of dividends and distributions | | | | | | | | | | | | | | | | |
Investor Shares | | | 325,418 | | | | 7,218 | | | | 133,547 | | | | 2,186 | |
Cost of shares redeemed(1) | | | | | | | | | | | | | | | | |
Investor Shares | | | (8,105,415 | ) | | | (190,428 | ) | | | (8,401,505 | ) | | | (153,893 | ) |
Net increase from fund share transactions | | | | | | | | | | | | | | | | |
Investor Shares | | | 3,229,837 | | | | 79,457 | | | | 765,188 | | | | 19,129 | |
Redemption Fee | | | | | | | | | | | | | | | | |
Investor Shares | | | - | | | | 64 | | | | - | | | | 12 | |
| |
| | | INTERNATIONAL VALUE | |
| | | Year Ended
9/30/2013 | | | Year Ended
9/30/2012 | |
| | | Shares | | | Amount | | | Shares | | | Amount | |
Proceeds from shares issued | | | | | | | | | | | | | | | | |
Investor Shares | | | 75,456,094 | | | $ | 2,442,536 | | | | 68,937,456 | | | $ | 1,825,446 | |
Institutional Shares | | | 11,772,260 | | | | 366,591 | | | | 11,249,703 | | | | 300,203 | |
Net asset value of shares transferred | | | | | | | | | | | | | | | | |
Investor Shares | | | (753,122 | ) | | | (25,812 | ) | | | (1,713,146 | ) | | | (46,004 | ) |
Institutional Shares | | | 751,264 | | | | 25,812 | | | | 1,713,146 | | | | 46,004 | |
Net asset value of shares issued in reinvestment of dividends and distributions | | | | | | | | | | | | | | | | |
Investor Shares | | | 1,840,385 | | | | 56,132 | | | | 361,475 | | | | 8,766 | |
Institutional Shares | | | 860,425 | | | | 26,286 | | | | 168,689 | | | | 4,096 | |
Cost of shares redeemed(1) | | | | | | | | | | | | | | | | |
Investor Shares | | | (33,058,608 | ) | | | (1,071,632 | ) | | | (28,550,016 | ) | | | (742,078 | ) |
Institutional Shares | | | (5,731,295 | ) | | | (187,041 | ) | | | (3,476,236 | ) | | | (92,384 | ) |
Net increase from fund share transactions | | | | | | | | | | | | | | | | |
Investor Shares | | | 43,484,749 | | | | 1,401,224 | | | | 39,035,769 | | | | 1,046,130 | |
Institutional Shares | | | 7,652,654 | | | | 231,648 | | | | 9,655,302 | | | | 257,919 | |
Redemption Fee | | | | | | | | | | | | | | | | |
Investor Shares | | | - | | | | 466 | | | | - | | | | 168 | |
Institutional Shares | | | - | | | | 141 | | | | - | | | | 55 | |
NOTES TO FINANCIAL STATEMENTS
| | | | | | | | | | | | | | | | |
| | | MID CAP | |
| | | Year Ended
9/30/2013 | | | Year Ended
9/30/2012 | |
| | | Shares | | | Amount | | | Shares | | | Amount | |
Proceeds from shares issued | | | | | | | | | | | | | | | | |
Investor Shares | | | 23,124,699 | | | $ | 953,489 | | | | 30,911,938 | | | $ | 1,134,545 | |
Institutional Shares | | | 23,287,764 | | | | 1,020,596 | | | | 23,673,124 | | | | 913,389 | |
Net asset value of shares transferred | | | | | | | | | | | | | | | | |
Investor Shares | | | (12,610,564 | ) | | | (507,744 | ) | | | (4,530,994 | ) | | | (174,556 | ) |
Institutional Shares | | | 12,610,564 | | | | 507,744 | | | | 4,530,994 | | | | 174,556 | |
Net asset value of shares issued in reinvestment of dividends and distributions | | | | | | | | | | | | | | | | |
Investor Shares | | | 5,921,843 | | | | 223,076 | | | | - | | | | - | |
Institutional Shares | | | 1,721,450 | | | | 67,463 | | | | - | | | | - | |
Cost of shares redeemed(1) | | | | | | | | | | | | | | | | |
Investor Shares | | | (34,800,770 | ) | | | (1,418,304 | ) | | | (39,072,083 | ) | | | (1,419,234 | ) |
Institutional Shares | | | (7,434,144 | ) | | | (326,157 | ) | | | (4,238,239 | ) | | | (163,767 | ) |
Net increase from fund share transactions | | | | | | | | | | | | | | | | |
Investor Shares | | | (18,364,792 | ) | | | (749,483 | ) | | | (12,691,139 | ) | | | (459,245 | ) |
Institutional Shares | | | 30,185,634 | | | | 1,269,646 | | | | 23,965,879 | | | | 924,178 | |
Redemption Fee | | | | | | | | | | | | | | | | |
Institutional Shares | | | - | | | | - | | | | - | | | | - | |
| |
| | | MID CAP VALUE | |
| | | Year Ended
9/30/2013 | | | Year Ended
9/30/2012(5) | |
| | | Shares | | | Amount | | | Shares | | | Amount | |
Proceeds from shares issued | | | | | | | | | | | | | | | | |
Investor Shares | | | 88,154,110 | | | $ | 2,092,450 | | | | 108,982,585 | | | $ | 2,256,209 | |
Institutional Shares | | | 22,489,399 | | | | 525,196 | | | | 5,633,636 | | | | 117,734 | |
Net asset value of shares transferred | | | | | | | | | | | | | | | | |
Investor Shares | | | (21,247,449 | ) | | | (515,712 | ) | | | (8,625,472 | ) | | | (176,084 | ) |
Institutional Shares | | | 21,231,889 | | | | 515,712 | | | | 8,625,472 | | | | 176,084 | |
Net asset value of shares issued in reinvestment of dividends and distributions | | | | | | | | | | | | | | | | |
Investor Shares | | | 18,470,144 | | | | 384,733 | | | | 26,809,143 | | | | 510,446 | |
Institutional Shares | | | 984,258 | | | | 20,502 | | | | - | | | | - | |
Cost of shares redeemed(2) | | | | | | | | | | | | | | | | |
Investor Shares | | | (94,574,520 | ) | | | (2,184,695 | ) | | | (88,350,116 | ) | | | (1,817,057 | ) |
Institutional Shares | | | (5,950,328 | ) | | | (142,610 | ) | | | (1,223,102 | ) | | | (25,019 | ) |
Net increase from fund share transactions | | | | | | | | | | | | | | | | |
Investor Shares | | | (9,197,715 | ) | | | (223,224 | ) | | | 38,816,140 | | | | 773,514 | |
Institutional Shares | | | 38,755,218 | | | | 918,800 | | | | 13,036,006 | | | | 268,799 | |
NOTES TO FINANCIAL STATEMENTS
| | | | | | | | | | | | | | | | |
| | | SMALL CAP | |
| | | Year Ended
9/30/2013 | | | Year Ended
9/30/2012(6) | |
| | | Shares | | | Amount | | | Shares | | | Amount | |
Proceeds from shares issued | | | | | | | | | | | | | | | | |
Investor Shares | | | 32,253,075 | | | $ | 723,927 | | | | 26,347,093 | | | $ | 518,831 | |
Institutional Shares | | | 6,293,870 | | | | 148,315 | | | | 2,169,494 | | | | 41,497 | |
Net asset value of shares transferred | | | | | | | | | | | | | | | | |
Investor Shares | | | (105,328 | ) | | | (2,418 | ) | | | (291,535 | ) | | | (7,672 | ) |
Institutional Shares | | | 105,282 | | | | 2,418 | | | | 291,535 | | | | 7,672 | |
Cost of shares redeemed(1) | | | | | | | | | | | | | | | | |
Investor Shares | | | (16,402,173 | ) | | | (365,993 | ) | | | (14,104,749 | ) | | | (275,282 | ) |
Institutional Shares | | | (712,370 | ) | | | (17,766 | ) | | | (31,916 | ) | | | (624 | ) |
Net increase from fund share transactions | | | | | | | | | | | | | | | | |
Investor Shares | | | 15,745,574 | | | | 355,516 | | | | 11,950,809 | | | | 235,877 | |
Institutional Shares | | | 5,686,782 | | | | 132,967 | | | | 2,429,113 | | | | 48,545 | |
| |
| | | SMALL CAP VALUE | |
| | | Year Ended
9/30/2013 | | | Year Ended
9/30/2012(7) | |
| | | Shares | | | Amount | | | Shares | | | Amount | |
Proceeds from shares issued | | | | | | | | | | | | | | | | |
Investor Shares | | | 27,625,555 | | | $ | 459,764 | | | | 30,580,060 | | | $ | 477,485 | |
Institutional Shares | | | 2,235,363 | | | | 35,595 | | | | 1,430,115 | | | | 21,930 | |
Net asset value of shares transferred | | | | | | | | | | | | | | | | |
Investor Shares | | | (1,620,952 | ) | | | (27,664 | ) | | | (20,221,662 | ) | | | (316,629 | ) |
Institutional Shares | | | 1,620,780 | | | | 27,664 | | | | 20,221,662 | | | | 316,629 | |
Net asset value of shares issued in reinvestment of dividends and distributions | | | | | | | | | | | | | | | | |
Investor Shares | | | 4,326,262 | | | | 66,754 | | | | 16,041,566 | | | | 232,282 | |
Institutional Shares | | | 661,328 | | | | 10,198 | | | | - | | | | - | |
Cost of shares redeemed(2) | | | | | | | | | | | | | | | | |
Investor Shares | | | (50,372,111 | ) | | | (815,911 | ) | | | (54,620,123 | ) | | | (839,074 | ) |
Institutional Shares | | | (5,640,992 | ) | | | (91,804 | ) | | | (1,581,650 | ) | | | (24,779 | ) |
Net increase from fund share transactions | | | | | | | | | | | | | | | | |
Investor Shares | | | (20,041,246 | ) | | | (317,057 | ) | | | (28,220,159 | ) | | | (445,936 | ) |
Institutional Shares | | | (1,123,521 | ) | | | (18,347 | ) | | | 20,070,127 | | | | 313,780 | |
NOTES TO FINANCIAL STATEMENTS
| | | | | | | | | | | | | | | | |
| | | VALUE | |
| | | Year Ended
9/30/2013 | | | Year Ended
9/30/2012 | |
| | | Shares | | | Amount | | | Shares | | | Amount | |
Proceeds from shares issued | | | | | | | | | | | | | | | | |
Investor Shares | | | 48,278,121 | | | $ | 619,978 | | | | 36,033,224 | | | $ | 381,736 | |
Institutional Shares | | | 7,472,022 | | | | 89,339 | | | | 6,432,287 | | | | 67,740 | |
Net asset value of shares transferred | | | | | | | | | | | | | | | | |
Investor Shares | | | (142,652 | ) | | | (1,799 | ) | | | (2,578,646 | ) | | | (28,493 | ) |
Institutional Shares | | | 142,426 | | | | 1,799 | | | | 2,578,646 | | | | 28,493 | |
Net asset value of shares issued in reinvestment of dividends and distributions | | | | | | | | | | | | | | | | |
Investor Shares | | | 451,150 | | | | 5,121 | | | | 369,799 | | | | 3,598 | |
Institutional Shares | | | 159,218 | | | | 1,807 | | | | 70,062 | | | | 682 | |
Cost of shares redeemed(1) | | | | | | | | | | | | | | | | |
Investor Shares | | | (21,418,031 | ) | | | (263,577 | ) | | | (18,831,659 | ) | | | (198,942 | ) |
Institutional Shares | | | (3,097,184 | ) | | | (38,944 | ) | | | (1,054,396 | ) | | | (11,067 | ) |
Net increase from fund share transactions | | | | | | | | | | | | | | | | |
Investor Shares | | | 27,168,588 | | | | 359,723 | | | | 14,992,718 | | | | 157,899 | |
Institutional Shares | | | 4,676,482 | | | | 54,001 | | | | 8,026,599 | | | | 85,848 | |
| (1) | Net of redemption fees. |
| (2) | Artisan Global Small Cap, Investor Shares: For the period from commencement of operations (June 25, 2013) through September 30, 2013. |
| (3) | Artisan Global Value Fund, Institutional Shares: For the period from commencement of operations July 17, 2012 through September 30, 2012. |
| (4) | Amount rounds to less than $1. |
| (5) | Artisan Mid Cap Value Fund, Institutional Shares: For the period from commencement of operations February 1, 2012 through September 30, 2012. |
| (6) | Artisan Small Cap Fund, Institutional Shares: For the period from commencement of operations May 7, 2012 through September 30, 2012. |
| (7) | Artisan Small Cap Value Fund, Institutional Shares: For the period from commencement of operations February 1, 2012 through September 30, 2012. |
The Funds have evaluated subsequent events through the date of issuance of the Funds’ financial statements and have determined there is no impact to the Funds’ financial statements.
Report of Independent Registered Public Accounting Firm
The Board of Directors and Shareholders of Artisan Partners Funds, Inc.
We have audited the accompanying statements of assets and liabilities, including the schedules of investments, of Artisan Partners Funds, Inc. (comprising, respectively, Artisan Emerging Markets Fund, Artisan Global Equity Fund, Artisan Global Opportunities Fund, Artisan Global Small Cap Fund, Artisan Global Value Fund, Artisan International Fund, Artisan International Small Cap Fund, Artisan International Value Fund, Artisan Mid Cap Fund, Artisan Mid Cap Value Fund, Artisan Small Cap Fund, Artisan Small Cap Value Fund, and Artisan Value Fund (the “Funds”)) as of September 30, 2013, and the related statements of operations, statements of changes in net assets, and the financials highlights for each of the periods indicated therein. These financial statements and financial highlights are the responsibility of the Funds’ management. Our responsibility is to express an opinion on these financial statements and financial highlights based on our audits.
We conducted our audits in accordance with the standards of the Public Company Accounting Oversight Board (United States). Those standards require that we plan and perform the audit to obtain reasonable assurance about whether the financial statements and financial highlights are free of material misstatement. We were not engaged to perform an audit of the Funds’ internal control over financial reporting. Our audits included consideration of internal control over financial reporting as a basis for designing audit procedures that are appropriate in the circumstances, but not for the purpose of expressing an opinion on the effectiveness of the Funds’ internal control over financial reporting. Accordingly, we express no such opinion. An audit also includes examining, on a test basis, evidence supporting the amounts and disclosures in the financial statements and financial highlights, assessing the accounting principles used and significant estimates made by management, and evaluating the overall financial statement presentation. Our procedures included confirmation of securities owned as of September 30, 2013, by correspondence with the custodian and brokers or by other appropriate auditing procedures where replies from brokers were not received. We believe that our audits provide a reasonable basis for our opinion.
In our opinion, the financial statements and financial highlights referred to above present fairly, in all material respects, the financial position of each of the respective portfolios of Artisan Partners Funds, Inc. at September 30, 2013, and the results of their operations, changes in their net assets, and the financial highlights for each of the periods indicated therein, in conformity with U.S. generally accepted accounting principles.

Chicago, Illinois
November 25, 2013
NOTES TO FINANCIAL STATEMENTS
Other Federal tax information (unaudited):
The Internal Revenue Code requires that shareholders be notified within 60 days of the Funds’ fiscal year-end of certain information regarding long-term capital gains, qualified dividend income and the dividends received deduction for corporate shareholders. This data is informational only. Every year in January, shareholders are sent a Form 1099-DIV which provides the federal tax status of dividends and distributions received during the calendar year. Shareholders are advised to consult their own tax advisor with respect to the specific tax consequences of investment in the Funds.
Each Fund hereby designates the following amounts as (i) long-term capital gain distributions for purposes of the dividends paid deduction (including earnings and profits distributed to shareholders on redemption of Fund shares, in thousands), (ii) the amount of ordinary dividends paid during the fiscal year ended September 30, 2013 that are considered qualified dividend income as defined in the Jobs and Growth Tax Relief Reconciliation Act of 2003, and (iii) the amount of ordinary dividends paid during the fiscal year ended September 30, 2013 that are eligible for the dividends received deduction available to certain corporate shareholders.
| | | | | | | | | | | | |
| Fund | | Long-Term Capital Gains | | | Qualified Dividend Income | | | Dividends Received Deduction | |
Emerging Markets | | $ | - | | | | 79.90 | % | | | - | % |
Global Equity | | | 413 | | | | 46.32 | | | | 13.34 | |
Global Opportunities | | | - | | | | - | | | | - | |
Global Small Cap | | | - | | | | - | | | | - | |
Global Value | | | 406 | | | | 93.68 | | | | 62.89 | |
International | | | - | | | | 100.00 | | | | - | |
International Small Cap | | | 3,609 | | | | 100.00 | | | | - | |
International Value | | | 38,639 | | | | 88.90 | | | | - | |
Mid Cap | | | 352,654 | | | | - | | | | - | |
Mid Cap Value | | | 364,296 | | | | 100.00 | | | | 95.49 | |
Small Cap | | | - | | | | - | | | | - | |
Small Cap Value | | | 39,583 | | | | 100.00 | | | | 100.00 | |
Value | | | 2,134 | | | | 94.78 | | | | 84.19 | |
SHAREHOLDER EXPENSE EXAMPLE (UNAUDITED)
As a shareholder of Artisan Funds, you may incur transaction costs, including redemption fees, and you will incur ongoing costs, including management fees and other Fund expenses. This example is intended to help you understand your ongoing costs (in dollars) of investing in a Fund and to compare these costs with the ongoing costs of investing in other mutual funds.
The example is based on an investment of $1,000 invested at the beginning of the period and held for the entire period from April 1, 2013 to September 30, 2013.
Actual Expenses
The first line under the name of each Fund in the table below provides information about actual account values and actual expenses. You may use the information in this line, together with the amount you invested, to estimate the expenses that you paid over the period. Simply divide your account value by $1,000 (for example, an $8,600 account value divided by $1,000 = 8.6), then multiply the result by the number in the first line under the name of your Fund under the heading entitled “Expenses Paid During Period” to estimate the expenses you paid on your account during this period.
Hypothetical Example for Comparison Purposes
The second line under each Fund’s name in the table below provides information about hypothetical account values and hypothetical expenses based on each Fund’s actual expense ratio for the six months ended September 30, 2013 and an assumed rate of return of 5% per year before expenses, which is not the Fund’s actual return. The hypothetical account values and expenses may not be used to estimate the actual ending account balances or expenses you paid for the period. You may use this information to compare the ongoing costs of investing in each Fund and other funds. To do so, compare the 5% hypothetical example with the 5% hypothetical examples that appear in the shareholder reports of the other funds.
Please note that the expenses shown in the table are meant to highlight your ongoing costs only and do not reflect any transactional costs, such as redemption fees. Therefore, the second line of the table is useful in comparing ongoing costs only, and will not help you determine the relative costs of owning different funds. If these transactional costs were included, your costs would have been higher.
| | | | | | | | | | | | | | | | |
| | | Beginning
Account Value
4/1/2013 | | | Ending
Account Value
9/30/2013 | | | Expenses Paid During
Period
4/1/2013-9/30/2013 | | | Expense
Ratio | |
Artisan Emerging Markets Fund | | | | | | | | | | | | | | | | |
Institutional Shares | | | | | | | | | | | | | | | | |
Actual | | $ | 1,000.00 | | | $ | 967.00 | | | $ | 5.77 | | | | 1.17 | % |
Hypothetical (5% return before expenses) | | $ | 1,000.00 | | | $ | 1,019.20 | | | $ | 5.92 | | | | 1.17 | % |
Advisor Shares | | | | | | | | | | | | | | | | |
Actual | | $ | 1,000.00 | | | $ | 965.50 | | | $ | 7.49 | | | | 1.52 | % |
Hypothetical (5% return before expenses) | | $ | 1,000.00 | | | $ | 1,017.45 | | | $ | 7.69 | | | | 1.52 | % |
SHAREHOLDER EXPENSE EXAMPLE (UNAUDITED)
| | | | | | | | | | | | | | | | |
| | | Beginning
Account Value
4/1/2013 | | | Ending
Account Value
9/30/2013 | | | Expenses Paid During
Period
4/1/2013-9/30/2013 | | | Expense
Ratio | |
Artisan Global Equity Fund | | | | | | | | | | | | | | | | |
Investor Shares | | | | | | | | | | | | | | | | |
Actual | | $ | 1,000.00 | | | $ | 1,086.40 | | | $ | 7.85 | | | | 1.50 | % |
Hypothetical (5% return before expenses) | | $ | 1,000.00 | | | $ | 1,017.55 | | | $ | 7.59 | | | | 1.50 | % |
Artisan Global Opportunities Fund | | | | | | | | | | | | | |
Investor Shares | | | | | | | | | | | | | | | | |
Actual | | $ | 1,000.00 | | | $ | 1,109.80 | | | $ | 6.66 | | | | 1.26 | % |
Hypothetical (5% return before expenses) | | $ | 1,000.00 | | | $ | 1,018.75 | | | $ | 6.38 | | | | 1.26 | % |
Institutional Shares | | | | | | | | | | | | | | | | |
Actual | | $ | 1,000.00 | | | $ | 1,110.80 | | | $ | 5.24 | | | | 0.99 | % |
Hypothetical (5% return before expenses) | | $ | 1,000.00 | | | $ | 1,020.10 | | | $ | 5.01 | | | | 0.99 | % |
Artisan Global Small Cap Fund(1) | | | | | | | | | | | | | | | | |
Investor Shares | | | | | | | | | | | | | | | | |
Actual | | $ | 1,000.00 | | | $ | 1,061.00 | | | $ | 4.11 | | | | 1.50 | % |
Hypothetical (5% return before expenses) | | $ | 1,000.00 | | | $ | 1,009.30 | | | $ | 4.00 | | | | 1.50 | % |
Artisan Global Value Fund | | | | | | | | | | | | | | | | |
Investor Shares | | | | | | | | | | | | | | | | |
Actual | | $ | 1,000.00 | | | $ | 1,109.10 | | | $ | 7.19 | | | | 1.36 | % |
Hypothetical (5% return before expenses) | | $ | 1,000.00 | | | $ | 1,018.25 | | | $ | 6.88 | | | | 1.36 | % |
Institutional Shares | | | | | | | | | | | | | | | | |
Actual | | $ | 1,000.00 | | | $ | 1,111.50 | | | $ | 5.72 | | | | 1.08 | % |
Hypothetical (5% return before expenses) | | $ | 1,000.00 | | | $ | 1,019.65 | | | $ | 5.47 | | | | 1.08 | % |
Artisan International Fund | | | | | | | | | | | | | | | | |
Investor Shares | | | | | | | | | | | | | | | | |
Actual | | $ | 1,000.00 | | | $ | 1,099.30 | | | $ | 6.37 | | | | 1.21 | % |
Hypothetical (5% return before expenses) | | $ | 1,000.00 | | | $ | 1,019.00 | | | $ | 6.12 | | | | 1.21 | % |
Institutional Shares | | | | | | | | | | | | | | | | |
Actual | | $ | 1,000.00 | | | $ | 1,100.30 | | | $ | 5.11 | | | | 0.97 | % |
Hypothetical (5% return before expenses) | | $ | 1,000.00 | | | $ | 1,020.21 | | | $ | 4.91 | | | | 0.97 | % |
Artisan International Small Cap Fund | | | | | | | | | | | | | | | | |
Investor Shares | | | | | | | | | | | | | | | | |
Actual | | $ | 1,000.00 | | | $ | 1,108.40 | | | $ | 7.93 | | | | 1.50 | % |
Hypothetical (5% return before expenses) | | $ | 1,000.00 | | | $ | 1,017.55 | | | $ | 7.59 | | | | 1.50 | % |
SHAREHOLDER EXPENSE EXAMPLE (UNAUDITED)
| | | | | | | | | | | | | | | | |
| | | Beginning
Account Value
4/1/2013 | | | Ending
Account Value
9/30/2013 | | | Expenses Paid During
Period
4/1/2013-9/30/2013 | | | Expense
Ratio | |
Artisan International Value Fund | | | | | | | | | | | | | | | | |
Investor Shares | | | | | | | | | | | | | | | | |
Actual | | $ | 1,000.00 | | | $ | 1,132.80 | | | $ | 6.20 | | | | 1.16 | % |
Hypothetical (5% return before expenses) | | $ | 1,000.00 | | | $ | 1,019.25 | | | $ | 5.87 | | | | 1.16 | % |
Institutional Shares | | | | | | | | | | | | | | | | |
Actual | | $ | 1,000.00 | | | $ | 1,133.80 | | | $ | 5.14 | | | | 0.96 | % |
Hypothetical (5% return before expenses) | | $ | 1,000.00 | | | $ | 1,020.26 | | | $ | 4.86 | | | | 0.96 | % |
Artisan Mid Cap Fund | | | | | | | | | | | | | | | | |
Investor Shares | | | | | | | | | | | | | | | | |
Actual | | $ | 1,000.00 | | | $ | 1,193.10 | | | $ | 6.76 | | | | 1.23 | % |
Hypothetical (5% return before expenses) | | $ | 1,000.00 | | | $ | 1,018.90 | | | $ | 6.23 | | | | 1.23 | % |
Institutional Shares | | | | | | | | | | | | | | | | |
Actual | | $ | 1,000.00 | | | $ | 1,194.70 | | | $ | 5.28 | | | | 0.96 | % |
Hypothetical (5% return before expenses) | | $ | 1,000.00 | | | $ | 1,020.26 | | | $ | 4.86 | | | | 0.96 | % |
Artisan Mid Cap Value Fund | | | | | | | | | | | | | | | | |
Investor Shares | | | | | | | | | | | | | | | | |
Actual | | $ | 1,000.00 | | | $ | 1,089.30 | | | $ | 6.34 | | | | 1.21 | % |
Hypothetical (5% return before expenses) | | $ | 1,000.00 | | | $ | 1,019.00 | | | $ | 6.12 | | | | 1.21 | % |
Institutional Shares | | | | | | | | | | | | | | | | |
Actual | | $ | 1,000.00 | | | $ | 1,090.50 | | | $ | 5.14 | | | | 0.98 | % |
Hypothetical (5% return before expenses) | | $ | 1,000.00 | | | $ | 1,020.16 | | | $ | 4.96 | | | | 0.98 | % |
Artisan Small Cap Fund | | | | | | | | | | | | | | | | |
Investor Shares | | | | | | | | | | | | | | | | |
Actual | | $ | 1,000.00 | | | $ | 1,191.80 | | | $ | 6.87 | | | | 1.25 | % |
Hypothetical (5% return before expenses) | | $ | 1,000.00 | | | $ | 1,018.80 | | | $ | 6.33 | | | | 1.25 | % |
Institutional Shares | | | | | | | | | | | | | | | | |
Actual | | $ | 1,000.00 | | | $ | 1,193.50 | | | $ | 5.72 | | | | 1.04 | % |
Hypothetical (5% return before expenses) | | $ | 1,000.00 | | | $ | 1,019.85 | | | $ | 5.27 | | | | 1.04 | % |
Artisan Small Cap Value Fund | | | | | | | | | | | | | | | | |
Investor Shares | | | | | | | | | | | | | | | | |
Actual | | $ | 1,000.00 | | | $ | 1,085.30 | | | $ | 6.59 | | | | 1.26 | % |
Hypothetical (5% return before expenses) | | $ | 1,000.00 | | | $ | 1,018.75 | | | $ | 6.38 | | | | 1.26 | % |
Institutional Shares | | | | | | | | | | | | | | | | |
Actual | | $ | 1,000.00 | | | $ | 1,086.50 | | | $ | 5.23 | | | | 1.00 | % |
Hypothetical (5% return before expenses) | | $ | 1,000.00 | | | $ | 1,020.05 | | | $ | 5.06 | | | | 1.00 | % |
SHAREHOLDER EXPENSE EXAMPLE (UNAUDITED)
| | | | | | | | | | | | | | | | |
| | | Beginning
Account Value
4/1/2013 | | | Ending
Account Value
9/30/2013 | | | Expenses Paid During
Period
4/1/2013-9/30/2013 | | | Expense
Ratio | |
Artisan Value Fund | | | | | | | | | | | | | | | | |
Investor Shares | | | | | | | | | | | | | | | | |
Actual | | $ | 1,000.00 | | | $ | 1,067.00 | | | $ | 5.39 | | | | 1.04 | % |
Hypothetical (5% return before expenses) | | $ | 1,000.00 | | | $ | 1,019.85 | | | $ | 5.27 | | | | 1.04 | % |
Institutional Shares | | | | | | | | | | | | | | | | |
Actual | | $ | 1,000.00 | | | $ | 1,068.50 | | | $ | 3.94 | | | | 0.76 | % |
Hypothetical (5% return before expenses) | | $ | 1,000.00 | | | $ | 1,021.26 | | | $ | 3.85 | | | | 0.76 | % |
| (1) | The account value and the expenses paid for Global Small Cap Fund have been presented for the period from commencement of operations (June 25, 2013) through September 30, 2013. Assuming a six month period, the actual account value as of September 30, 2013 and the expenses paid during period 4/1/2013-9/30/2013 would have been as follows: |
| | | | | | | | | | | | |
| | | Beginning
Account Value
4/1/2013 | | | Ending
Account Value
9/30/2013 | | | Expenses Paid During
Period
4/1/2013-9/30/2013 | |
Artisan Global Small Cap Fund - Investor Shares | | | | | | | | | | | | |
Actual | | $ | 1,000.00 | | | $ | 1,061.00 | | | $ | 7.75 | |
Hypothetical (5% return before expenses) | | $ | 1,000.00 | | | $ | 1,017.55 | | | $ | 7.59 | |
FACTORS CONSIDERED IN APPROVING ARTISAN GLOBAL SMALL CAP FUND’S ADVISORY AGREEMENT
Artisan Global Small Cap Fund’s (the “Fund”) board of directors, including a quorum of the independent directors, formally considered the initial approval of an investment advisory agreement (the “Advisory Agreement”) between Artisan Partners Funds, Inc. (“Artisan Funds”), on behalf of the Fund, and Artisan Partners Limited Partnership (“Artisan Partners”) at a meeting held on February 12, 2013 (the “Meeting”).
Prior to the Meeting, independent counsel to the independent directors sent Artisan Partners a request for information to be provided to the directors in connection with their consideration of the initial approval of the Advisory Agreement. Artisan Partners provided materials to the directors in response to that request, other information Artisan Partners believed was useful in evaluating the Advisory Agreement and reports prepared by Lipper Inc. (“Lipper”), an independent source of investment company data, relating to the Fund’s management fees and projected expenses compared to the management fees and expenses of a peer group determined by Lipper to be comparable. The directors also received and reviewed a memorandum from their independent counsel regarding the directors’ responsibilities in evaluating the Fund’s Advisory Agreement. In addition, the directors considered information Artisan Partners provided in connection with the proposed continuation of the advisory agreements between Artisan Partners and Artisan Funds on behalf of each of the other series of Artisan Funds at the board’s October and November 2012 meetings.
In evaluating the Advisory Agreement, the directors reviewed the information provided and discussed with representatives of Artisan Partners the nature, extent and quality of the advisory and other services to be provided by Artisan Partners to the Fund, the anticipated overall expense ratio of the Fund, and the prospect for economies of scale and other benefits being derived by Artisan Partners from its relationship with the Fund. In addition to the third-party reports by Lipper and the memorandum from independent counsel, the directors reviewed information provided prior to the Meeting concerning, among other things, the following:
| • | | Artisan Partners’ personnel and methods, including Artisan Partners’ assessment of its ability to attract and retain capable research, advisory and administrative personnel, including incentive plans and retirement policies, and Artisan Partners’ assessment of recent hiring and retention experience; the compensation structure for Artisan Partners’ personnel with primary responsibility for managing the Fund; the time and attention of Artisan Partners’ investment personnel to be devoted to the Fund, and other demands on their time relating to managing portfolios for both mutual fund and non-mutual fund clients; Artisan Partners’ research and decision-making processes, including methods adopted to ensure compliance with investment objectives, policies and restrictions of the Fund; the policies relating to the assignment of Artisan Partners’ personnel to Artisan Funds’ portfolios and other accounts advised or sub-advised by Artisan Partners; the adequacy and sophistication of Artisan Partners’ technology and systems with respect to investment and administrative matters; and the education, experience and number of Artisan Partners’ personnel who are expected to provide services to the Fund; |
| • | | The terms of the Advisory Agreement, including a list of services performed by Artisan Partners; how the services performed by Artisan Partners differ from (a) the services performed by Artisan Partners under other advisory agreements with registered investment companies or other accounts, and (b) the services typically performed by an |
FACTORS CONSIDERED IN APPROVING ARTISAN GLOBAL SMALL CAP FUND’S ADVISORY AGREEMENT
| | investment adviser for registered investment companies and other accounts; Artisan Partners’ responsibility for making investment decisions and for observing investment objectives, policies and restrictions of the Fund; Artisan Partners’ standard of care; and termination provisions; |
| • | | Any litigation pending, threatened or settled involving Artisan Partners, and the results of any audits, investigations or examinations by the Securities and Exchange Commission (the “SEC”) or other governmental or regulatory authorities; |
| • | | Information regarding fee arrangements, including a comparison of the estimated total expense ratio of the Fund with the total expense ratios of other mutual funds (taking into account factors bearing on comparability, such as size, account-level charges, and investment objective); the structure of the proposed advisory fees, including the method of computing fees, and the frequency of payment of fees; a comparison of the proposed advisory fees charged by Artisan Partners to the Fund with the advisory fees charged by other advisory organizations for managing mutual funds and other accounts, especially funds and accounts having similar investment goals and providing similar service; voluntary or contractual advisory fee limitations or reductions and the relationship of fees to any fee limitation; the possible cost savings by Artisan Partners, incentives to effect savings, and sharing of savings with the Fund; whether Artisan Partners expects to realize any economies of scale in providing services to the Fund and, if so, whether the economies of scale are expected to be shared with the Fund; a comparison of fees proposed to be charged by Artisan Partners to the Fund with the fees that could be expected to be charged by Artisan Partners for managing other accounts, including separate accounts and other mutual funds to which Artisan Partners provides sub-advisory services, with similar investment goals, including an explanation of any material differences, as well as any differences attributable to differences in the nature or scope of services provided; information regarding other expenses, including expenses expected to be incurred by each of (a) Artisan Partners, as adviser and administrator, (b) Artisan Partners Distributors LLC, as the principal underwriter, and (c) the Fund; custodian, shareholder servicing and transfer agent fees; and information regarding payments to financial intermediaries; |
| • | | Potential “fall-out” benefits to Artisan Partners or its affiliates from their proposed relationship with the Fund, in addition to the proposed advisory fees; benefits to Artisan Partners or its affiliates in selling other products or attracting and retaining other clients and receipt of research paid for with commissions; and the method of estimating other benefits; |
| • | | Matters relating to brokerage and portfolio transactions, including Artisan Partners’ obligation to seek best execution of portfolio transactions and the quality of execution it has achieved in the management of other accounts; Artisan Partners’ policies relating to allocation of brokerage for research and other services (“soft dollars”); Artisan Partners’ practices in light of SEC guidance under Section 28(e) of the Securities Exchange Act of 1934; research purchased with Artisan Partners’ cash; research available for purchase by cash; and Artisan Partners’ policies relating to the execution of portfolio transactions through brokers who sell Artisan Funds’ shares and steps taken to comply with Rule 12b-1(h) under the Investment Company Act of 1940; |
FACTORS CONSIDERED IN APPROVING ARTISAN GLOBAL SMALL CAP FUND’S ADVISORY AGREEMENT
| • | | Artisan Partners’ financial condition and stability and financial arrangements between Artisan Partners and its parent organization; any material changes (financial or otherwise) that have occurred during the past year or that are anticipated to occur during the next 12 months in the business of Artisan Partners or its parent; whether and how any such changes are expected to affect the services to be performed by Artisan Partners for the Fund; and succession planning with respect to key portfolio management and other personnel; |
| • | | The potential profitability to Artisan Partners of its relationship with the Fund; and |
| • | | Potential conflicts of interest between the Fund and Artisan Partners and circumstances and actions addressing or bearing on potential conflicts of interest, including: the type and number of other clients served by Artisan Partners; the basis of sharing personnel, services, research and advice among clients; Artisan Partners’ policies relating to decisions to buy or sell securities for the Fund and other clients where the same security might be bought or sold for a number of clients; Artisan Partners’ policies relating to allocating purchases and sales of the same security, including initial public offerings, among the Fund and other clients of Artisan Partners; the possible advantages, including economies of scale, and disadvantages in having an investment adviser that has other clients; any relevant investments by Artisan Partners on its own behalf and possible related conflicts of interest with the Fund; and Artisan Partners’ code of ethics. |
At the Meeting, after discussion and consideration of the information presented, the independent directors met in executive session with their independent counsel to discuss the materials presented. The independent directors and their independent counsel reviewed with the full board the information discussed at the Meeting and during the executive session. The directors then considered whether any further discussion or review was necessary, concluding that the information reviewed by the independent directors at the Meeting and at the October and November 2012 meetings provided a strong basis for considering the initial approval of the Advisory Agreement. The directors then reviewed and affirmed each of the following conclusions:
The nature, extent, and quality of Artisan Partners’ services. The directors concluded that the nature and extent of Artisan Partners’ services proposed to be provided to the Fund would be appropriate and consistent with, and in some cases more advantageous to the Fund than, the terms of the Advisory Agreement. The directors concluded that Artisan Partners has sufficient and well-qualified personnel, with appropriate education and experience, to serve the Fund effectively and that key personnel, including the proposed investment management team, would not be undesirably overextended in assuming management responsibilities for the Fund.
The investment performance of the Fund. Because the Fund was not yet in operation, the directors noted that the Fund has no performance history of its own. However, the directors reviewed the performance history of the proposed investment management team and concluded that the proposed investment management team had produced successful historical results. In particular, the directors noted that the proposed co-portfolio managers of the Fund had produced successful historical results for Artisan International Fund and Artisan International Small Cap Fund over the long term and for Artisan Global Equity Fund since its inception in 2010.
FACTORS CONSIDERED IN APPROVING ARTISAN GLOBAL SMALL CAP FUND’S ADVISORY AGREEMENT
Cost of services, economies of scale and benefits derived by Artisan Partners. The directors concluded that the overall estimated expense ratio of the Fund (after giving effect to Artisan Partners’ contractual undertaking to reimburse the Fund for ordinary operating expenses in excess of 1.50% of the Fund’s average net assets annually) was reasonable in relation to the nature, extent and quality of services to be provided to the Fund and in comparison to (i) the fees charged by mutual funds considered by Lipper to be within the same peer category or universe as the Fund and (ii) the fees charged and the array of services offered to other Artisan Partners clients, including its separate account clients. The directors also concluded that since the Fund does not currently have any assets, Artisan Partners is not realizing any material benefits from economies of scale with respect to the Fund. The directors also noted Artisan Partners’ representations that economies of scale were not expected for the Fund because of capacity constraints in the Fund’s investment strategy.
Other benefits derived by the Fund or Artisan Partners. The directors concluded that, other than the services provided by Artisan Partners pursuant to the Advisory Agreement and the proposed management fees to be paid in return, the Fund and Artisan Partners may potentially benefit from their relationship with each other in several ways. For Artisan Partners, the directors concluded there were potentially two primary fall-out benefits: (1) the potential conversion of Fund shareholders to separate account clients; and (2) the acquisition of research products and services in return for commissions paid by the Fund on portfolio transactions (“soft dollars”). The directors concluded that, although Artisan Partners may derive those additional benefits, the Fund also could benefit from potential institutional shareholders who might choose to invest in the Fund because they want Artisan Partners’ services, but do not meet Artisan Partners’ minimum separate account size requirements. The directors also concluded that the Fund could benefit from Artisan Partners’ use of soft dollars generated with respect to its separate account clients.
Following those discussions, the board approved the Fund’s Advisory Agreement, dated February 12, 2013, through November 30, 2014 by the unanimous vote of all directors and also by the unanimous vote of all the “non-interested” directors.
FACTORS CONSIDERED IN APPROVING THE FUNDS’ AMENDED AND RESTATED INVESTMENT ADVISORY AGREEMENT
Artisan Funds’ board of directors, including a quorum of the independent directors, formally considered and unanimously approved the amended and restated investment advisory agreement (the “Amended and Restated Advisory Agreement”) between Artisan Funds, on behalf of each Fund, and Artisan Partners at a meeting held on August 13, 2013. On the basis of the considerations discussed below, the Board concluded that the approval of the Amended and Restated Advisory Agreement would be in the best interests of each Fund.
The Board recommended to shareholders of each Fund that they approve the Amended and Restated Advisory Agreement at the special meeting of shareholders to be held on November 12, 2013. The Amended and Restated Advisory Agreement would be effective upon shareholder approval and the expected change of control of Artisan Partners resulting from transition arrangements triggered by Artisan Partners Asset Management Inc.’s (“APAM”) (the general partner of the parent company of Artisan Partners) initial public offering (the “Transition”). The Amended and Restated Advisory Agreement would continue in effect through June 30, 2015.
In determining to approve the Amended and Restated Advisory Agreement between Artisan Funds, on behalf of each Fund, and Artisan Partners, the directors considered and reviewed all the information provided to them in connection with this matter by Artisan Partners prior to and at their August 13, 2013 meeting. In all of their deliberations, the independent directors were advised by independent counsel to the independent directors.
The directors focused on the fact that, in connection with APAM’s initial public offering (“IPO”) and as a result of the Transition, Artisan Partners is expected to undergo a change of control no later than March 12, 2014. The directors noted that such change of control would constitute an assignment of the current investment advisory agreements (the “Current Advisory Agreements”) for each Fund and, therefore, result in the automatic termination of each of those agreements under the 1940 Act. The directors considered that the Amended and Restated Advisory Agreement is being proposed primarily in response to the Transition. The directors also considered that, given the need for new investment advisory agreements to replace the Current Advisory Agreements upon their termination, Artisan Partners took the opportunity to standardize, clarify and modernize various provisions of the Current Advisory Agreements and combine all thirteen agreements, one for each of the thirteen series of Artisan Funds, into a single Amended and Restated Advisory Agreement for all Funds. The directors considered that the Current Advisory Agreements were implemented at different times over the course of many years and therefore differ in some respects from Fund to Fund and contain some outdated provisions. The Board concluded that the standardization and combination of all the Current Advisory Agreements into a single Amended and Restated Advisory Agreement would benefit the Funds by eliminating outdated provisions, making the administration of the Funds more efficient and providing more flexibility for the operations of the Funds, within the limits of the applicable law.
The directors recognized the benefit of Artisan Partners’ continued management of the Funds following the Transition. In this regard, the directors noted that the IPO had not resulted in any changes in the management or operation of the investment advisory functions performed by Artisan Partners with respect to the Funds, including any changes in the personnel engaged in the day-to-day investment management of the Funds or the investment style, philosophy or strategy of the Funds. The directors also noted that the IPO
FACTORS CONSIDERED IN APPROVING THE FUNDS’ AMENDED AND RESTATED INVESTMENT ADVISORY AGREEMENT
had not caused any reduction in the quality of services provided to the Funds and did not have any effect on Artisan Partners’ ability to fulfill its obligations to the Funds under the Current Advisory Agreements. Similarly, the directors noted that the Transition is not expected to have a material effect on Artisan Partners or result in any changes in the personnel engaged in the day-to-day investment management of the Funds or the investment style, philosophy or strategy of the Funds. The directors concluded that providing for the continued management of the Funds by Artisan Partners following the Transition would benefit the Funds.
The directors evaluated the terms of the proposed Amended and Restated Advisory Agreement, in comparison with the terms of the Current Advisory Agreements. The directors noted that there would be no change in the rate of the advisory fees that the Funds would pay to Artisan Partners under the Amended and Restated Advisory Agreement. The directors determined that the differences between the Current Advisory Agreements and the Amended and Restated Advisory Agreement would not appreciably change the scope or quality of the services to be provided by Artisan Partners to the Funds. The directors also noted that Artisan Partners’ standard of care under the Amended and Restated Advisory Agreement, which states that Artisan Partners is not liable to a Fund or to any shareholder of a Fund for any loss suffered by a Fund or any shareholder of a Fund from or as a consequence of any act or omission of Artisan Partners, or any of its partners, employees or agents, in the course of, or in connection with, rendering services under the agreement, unless there is willful misfeasance, bad faith or gross negligence on the part of Artisan Partners or reckless disregard of its obligations and duties, would remain unchanged.
The directors also considered that, in connection with the preparation of a single Amended and Restated Advisory Agreement for all Funds, Artisan Partners proposed to reallocate certain expenses to the Funds for which Artisan Partners is contractually responsible under the Current Advisory Agreements for certain, but not all, Funds.
Certain expenses relating to the determination of daily price computations borne by Artisan Partners on behalf of Artisan Emerging Markets Fund, Artisan Global Value Fund, Artisan International Fund, Artisan Small Cap Fund and Artisan Value Fund (the “Five Funds”) under the Current Advisory Agreements would be borne by those Funds under the Amended and Restated Advisory Agreement. The directors noted that the Current Advisory Agreements for each of the other Funds already state that the Funds bear such expenses. The directors considered that the reallocation of such expenses to the Five Funds would increase the gross expense ratio of each of the Five Funds by less than 0.01%. The directors determined that this increase in expenses of the Five Funds is immaterial. The directors further noted that Artisan Partners has, in a separate contract, agreed to reimburse Artisan Global Value Fund, one of the Five Funds, for its management fee and any other ordinary operating expenses (excluding taxes, interest, all commissions and other normal charges incident to the purchase and sale of portfolio securities, and extraordinary charges such as litigation costs) in excess of 1.50% of its average daily net assets through February 1, 2014, such that shareholders of such Fund would not experience any increase in expenses at least through such date.
The directors also noted that the Amended and Restated Advisory Agreement provides that each Fund shall bear all expenses of maintaining the registration of such Fund under the 1933 Act and the 1940 Act. By contrast, the Current Advisory Agreements for Artisan
FACTORS CONSIDERED IN APPROVING THE FUNDS’ AMENDED AND RESTATED INVESTMENT ADVISORY AGREEMENT
International Fund and Artisan Small Cap Fund provide that Artisan Partners shall bear all expenses relating to maintaining registration of those Funds under the 1933 Act. The directors noted that this change would not in fact result in any increase of expenses to those Funds because the only expenses relating to maintaining registration of those Funds which the Funds have historically borne are filing fees payable pursuant to Rule 24f-2 under the 1940 Act, which the Funds and Artisan Partners have regarded as expenses under the 1940 Act, rather than under the 1933 Act. Those expenses would continue to be borne by the Funds under the Amended and Restated Advisory Agreement.
The directors also took into account their deliberations and conclusions, including the extensive materials that they reviewed, in connection with their most recent approval of the Current Advisory Agreements. The directors noted that they had approved the renewal of each of the Current Advisory Agreements for the Funds, except Artisan Global Small Cap Fund, for a one-year period commencing December 1, 2012, at their November 13, 2012 meeting, after conducting an extensive review of all materials provided in connection with the approval process at their October 26, 2012 and November 12-13, 2012 meetings. The directors also noted that they had approved the Current Advisory Agreement for Artisan Global Small Cap Fund, which commenced operations on June 25, 2013, for a one-year period commencing June 21, 2013, at their February 12, 2013 meeting, after conducting an extensive review of all materials provided in connection with the approval process at their February 12, 2013 meeting. Although they did not conduct a detailed review of each factor, at their August 13, 2013 meeting, the directors noted that, at each of these earlier meetings, they had considered various factors in connection with the approval process, as applicable, including: (i) the nature, extent and quality of Artisan Partners’ services; (ii) the investment performance of each existing Fund; (iii) the costs of the services to be provided and profits realized or expected to be realized by Artisan Partners; (iv) the extent to which economies of scale would be realized as each Fund grows and whether fee levels reflect these economies of scale for the benefit of Fund investors; (v) the services to be rendered and the amounts to be paid under the investment advisory agreements in comparison to the amounts paid by other mutual funds considered by Lipper to be within the same category or universe as each existing Fund and the array of services offered and fees charged to other clients of Artisan Partners, including separate account clients and mutual funds for which it serves as sub-adviser; and (vi) other benefits derived by the Funds or Artisan Partners from their relationship with each other.
Finally, the directors requested and received information from Artisan Partners regarding any material changes to any of the information they considered at the October 2012, November 2012 and February 2013 meetings in connection with their approvals of the Current Advisory Agreements. In this regard, the directors noted that the officers of the Funds believed that there were no material updates to Artisan Partners’ responses that had not otherwise been previously reported to the directors.
Based on the foregoing considerations, on August 13, 2013, the directors present, including a majority of the independent directors, unanimously approved the Amended and Restated Advisory Agreement and determined to recommend its approval to the shareholders of the Funds.
NOTES ON MANAGEMENT’S DISCUSSION OF FUND PERFORMANCE AND PORTFOLIO HOLDINGS’ CLASSIFICATION
The discussions of each Fund included in this report include statistical information about the portfolios of each of the Funds. Except as otherwise noted, that information is as of September 30, 2013. That information will vary with changes in a Fund’s portfolio investments. The performance information for each Fund relative to its benchmark index discussed in this report was prepared by the Adviser using information reported by FactSet Research Systems, Inc. (“FactSet”). For the purposes of assigning portfolio securities to a particular country in this report, the Adviser considers an issuer to be from a particular country as designated by its securities information vendors. However, the Adviser in its own judgment may consider an issuer to be from a country other than the country designated by the securities information vendors. The Adviser currently uses MSCI Inc. as its primary source and FactSet as a secondary source for this information. The primary information vendor’s criteria include the identity of the jurisdiction of the issuer’s incorporation, the main equity trading market for the issuer’s securities, the geographical distribution of the issuer’s operations and the location of the issuer’s headquarters. The Adviser may also consider other criteria such as the source of a company’s revenues. Over time, country designations may change.
For the purposes of assigning portfolio securities to a particular sector and industry, the Adviser assigns securities in accordance with the sector and industry classifications of the Global Industry Classification Standard (GICS®) developed by MSCI Inc. and Standard & Poor’s (to the extent available) as primary sources and FactSet (to the extent available) as a secondary source for this information. In the event the Adviser’s securities information vendors do not classify a security to a particular sector or industry, or if the published classification appears to be erroneous, the Adviser classifies the security according to its own judgment, using other securities information vendors, the company description and other publicly available information about the company’s peer group. Sector and industry classifications may change over time.
The names of portfolio securities reflected in this report are as reported by the Funds’ data providers, may not represent the legal name of the entity and, in some cases, are translations of non-English names.
Definition of Portfolio Statistic
Market Capitalization is the aggregate value of all of a company’s outstanding equity securities.
Descriptions of Indices
Each Fund’s performance is compared in this report to changes in one or more indices, including in all cases a broad-based index of changes in prices of securities in the markets in which the Fund invests. All of the indices are unmanaged and their returns include reinvested dividends. Unlike the Funds’ returns, the returns of each index do not include the payment of sales commissions or other expenses that would be incurred in the purchase or sale of the securities included in that index. An investment cannot be made directly in an index. Fair value pricing is not employed by market indices.
NOTES ON MANAGEMENT’S DISCUSSION OF FUND PERFORMANCE AND PORTFOLIO HOLDINGS’ CLASSIFICATION
The indices to which the Funds are compared are:
Artisan Emerging Markets Fund – Morgan Stanley Capital International Emerging Markets Index is a market-weighted index of companies in emerging markets.
Artisan Global Equity, Artisan Global Opportunities and Artisan Global Value Funds – Morgan Stanley Capital International All Country World Index (MSCI ACWI) is a market-weighted index of global developed and emerging markets.
Artisan Global Small Cap Fund – Morgan Stanley Capital International All Country World Small Cap Index (MSCI ACWI Small Cap) – is a market-weighted index of small cap securities of global developed and emerging markets.
Artisan International, Artisan International Small Cap and Artisan International Value Funds – Morgan Stanley Capital International EAFE Index (MSCI EAFE) is a market-weighted index of companies in developed markets, excluding the U.S. and Canada. MSCI EAFE’s average annual return since inception of the International Fund is based upon a starting date of December 31, 1995.
Artisan International Fund – Morgan Stanley Capital International EAFE Growth Index (MSCI EAFE Growth) is a market-weighted index of companies in developed markets, excluding the U.S. and Canada, that exhibits growth investment style characteristics according to MSCI’s methodology. MSCI EAFE Growth’s average annual return since inception of the International Fund is based upon a starting date of December 31, 1995.
Artisan International Fund – Morgan Stanley Capital All Country World Index Ex U.S. (MSCI ACWI Ex U.S.) is a market-weighted index of global developed and emerging markets, excluding the U.S.
Artisan International Small Cap Fund – Morgan Stanley Capital International EAFE Small Cap Index (MSCI EAFE Small Cap) is a market-weighted index of small companies in developed markets, excluding the U.S. and Canada.
Artisan International Value Fund – Morgan Stanley Capital International EAFE Value Index (MSCI EAFE Value) is a market-weighted index of companies in developed markets, excluding the U.S. and Canada, that exhibits value investment style characteristics according to MSCI’s methodology.
Artisan Mid Cap and Artisan Mid Cap Value Funds – Russell Midcap® Index is a market-weighted index of about 800 medium-sized U.S. companies.
Artisan Mid Cap Fund – Russell Midcap® Growth Index is a market-weighted index of those medium-sized companies included in the Russell Midcap® Index with higher price-to-book and higher forecasted growth values.
Artisan Mid Cap Value Fund – Russell Midcap® Value Index is a market-weighted index of those medium-sized companies included in the Russell Midcap® Index with lower price-to-book ratios and lower forecasted growth values.
Artisan Small Cap and Artisan Small Cap Value Funds – Russell 2000® Index is a market-weighted index of about 2,000 small U.S. companies.
NOTES ON MANAGEMENT’S DISCUSSION OF FUND PERFORMANCE AND PORTFOLIO HOLDINGS’ CLASSIFICATION
Artisan Small Cap Fund – Russell 2000® Growth Index is a market-weighted index of those small companies included in the Russell 2000® Index with higher price-to-book ratios and higher forecasted growth values.
Artisan Small Cap Value Fund – Russell 2000® Value Index is a market-weighted index of those small companies included in the Russell 2000® Index with lower price-to-book ratios and lower forecasted growth values.
Artisan Value Fund – Russell 1000® Index is a market-weighted index of about 1,000 large U.S. companies.
Artisan Value Fund – Russell 1000® Value Index is a market-weighted index of those large companies included in the Russell 1000® Index with lower price-to-book ratios and lower forecasted growth values.
Trademarks
Trademarks and copyrights relating to the indices and products of portfolio companies mentioned in this report, if any, are owned by their respective owners. Except as otherwise indicated, the trademarks, including names, logos, slogans and service marks appearing in this report are the property of the Adviser and may not be copied, reproduced, published or in any way used without written permission.
The Global Industry Classification Standard (“GICS”) was developed by and is the exclusive property and a service mark of MSCI Inc. (“MSCI”) and Standard & Poor’s, a division of The McGraw-Hill Companies, Inc. (“S&P”) and is licensed for use by the Adviser. Neither MSCI, S&P nor any third party involved in making or compiling the GICS or any GICS classifications makes any express or implied warranties or representations with respect to such standard or classification (or the results to be obtained by the use thereof), and all such parties hereby expressly disclaim all warranties of originality, accuracy, completeness, merchantability and fitness for a particular purpose with respect to any of such standard or classification. Without limiting any of the foregoing, in no event shall MSCI, S&P, any of their affiliates or any third party involved in making or compiling the GICS or any GICS classifications have any liability for any direct, indirect, special, punitive, consequential or any other damages (including lost profits) even if notified of the possibility of such damages.
The MSCI information may only be used by the reader, may not be reproduced or redisseminated in any form and may not be used to create any financial instruments or products or any indices. None of the MSCI information is intended to constitute investment advice or a recommendation to make (or refrain from making) any kind of investment decision and may not be relied on as such. Historical data and analysis should not be taken as an indication or guarantee of any future performance analysis, forecast or prediction. The MSCI information is provided on an “as is” basis and the reader of this information assumes the entire risk of any use made of this information. MSCI, each of its affiliates and each other person involved in or related to compiling, computing or creating any MSCI information (collectively, the “MSCI Parties”) expressly disclaims all warranties (including, without limitation, any warranties of originality, accuracy, completeness, timeliness, non-infringement, merchantability and fitness for a particular purpose) with respect to this information. Without limiting any of the foregoing, in no event shall MSCI Parties have any liability for any direct, indirect, special, incidental, punitive, consequential (including, without limitation, lost profits) or any other damages.
NOTES ON MANAGEMENT’S DISCUSSION OF FUND PERFORMANCE AND PORTFOLIO HOLDINGS’ CLASSIFICATION
Russell Investment Group is the source and owner of the Russell Index data contained or reflected in this material and all trademarks and copyrights related thereto. The presentation may contain confidential information and unauthorized use, disclosure, copying, dissemination or redistribution is strictly prohibited. This is a presentation of Artisan Funds. Russell Investment Group is not responsible for the formatting or configuration of this material or for any inaccuracy in Artisan Funds’ presentation thereof.
PROXY VOTING POLICIES AND PROCEDURES
You may obtain a description of Artisan Funds’ proxy voting policies and procedures, without charge, upon request by calling 800.344.1770. That information also is included in Artisan Funds’ statement of additional information, which is available without charge, on Artisan Funds’ website at www.artisanfunds.com and on the Securities and Exchange Commission’s website at www.sec.gov.
Information relating to how each Artisan Fund voted proxies relating to portfolio securities held during the twelve-month period ended June 30 is available without charge, on Artisan Funds’ website at www.artisanfunds.com and on the Securities and Exchange Commission’s website at www.sec.gov.
INFORMATION ABOUT PORTFOLIO SECURITIES
Artisan Funds files a complete schedule of portfolio holdings with the Securities and Exchange Commission for the quarters ending December 31 and June 30 (the first and third quarters of the Funds’ fiscal year) on Form N-Q. The Funds’ Forms N-Q are available on the Securities and Exchange Commission’s website at www.sec.gov. You also may review and copy those documents by visiting the Securities and Exchange Commission’s Public Reference Room in Washington, D.C. Information on the operation of the Public Reference Room may be obtained by calling the Securities and Exchange Commission at 800.SEC.0330.
DIRECTORS AND OFFICERS
The board of directors has overall responsibility for the conduct of the affairs of Artisan Funds. Each director serves an indefinite term of unlimited duration until the next annual meeting of shareholders and until the election and qualification of his or her successor or until he or she retires, resigns or is removed from office. Artisan Funds’ bylaws further provide that each director must retire by the end of the calendar year in which he or she attains the age of 72. The board of directors may fill any vacancy on the board provided that after such appointment at least two-thirds of the directors have been elected by the shareholders. The shareholders may remove a director by a vote of a majority of the outstanding shares of the Funds at any meeting of shareholders called for the purpose of removing such director.
The board of directors elects the officers of Artisan Funds. Each officer serves until the election and qualification of his or her successor, or until he or she sooner dies, resigns, or is removed or disqualified. The board of directors may remove any officer with or without cause at any time.
The names and ages of the directors and officers as of November 15, 2013, the position each holds with the Funds, the date each was first elected to office, their principal business occupations and other directorships they have held during at least the last five years are shown below.1 Each director oversees all thirteen series of Artisan Funds.
| | | | | | | | |
| | | | | |
Name and Age at 11/15/13 | | Position(s)
Held with
Artisan Funds | | Date First Elected
or Appointed to Office | | Principal Occupation(s) during at least the
Past 5 Years | | Other Public Company or
Registered Investment
Company Directorships Held |
| Directors who are not “interested persons” of Artisan Funds: |
| David A. Erne – 70 | | Director and Independent Chair of the Board of Directors | | Director since 3/27/95; Independent Chair since 2/4/05 | | Of counsel to the law firm Reinhart Boerner Van Deuren s.c., Milwaukee, WI. | | Former Trustee, Northwestern Mutual Life Insurance Company (individual life insurance, disability insurance and annuity company). |
| Gail L. Hanson – 57 | | Director | | 1/1/12 | | Chief Financial Officer, Aurora Health Care (not for profit health care provider); from September 2004 to February 2011, Deputy Executive Director, State of Wisconsin Investment Board. | | Director, Northwestern Mutual Series Fund, Inc. (investment company) (28 portfolios). |
| Thomas R. Hefty – 66 | | Director | | 3/27/95 | | Retired; from January 2007 to February 2008, President, Kern Family Foundation (private, grant-making organization); until December 2006, of counsel to the law firm Reinhart Boerner Van Deuren s.c., Milwaukee, WI; until December 2006, Adjunct Professor, Department of Business and Economics, Ripon College; until December 2002, Chairman of the Board and Chief Executive Officer of Cobalt Corporation (provider of managed care and specialty business services). | | None. |
DIRECTORS AND OFFICERS
| | | | | | | | |
| | | | | |
Name and Age at 11/15/13 | | Position(s)
Held with
Artisan Funds | | Date First Elected
or Appointed to Office | | Principal Occupation(s) during at least the
Past 5 Years | | Other Public Company or
Registered Investment
Company Directorships Held |
| Patrick S. Pittard – 67 | | Director | | 8/9/01 | | Distinguished Executive in Residence (teaching position), University of Georgia; until December 2012, Chairman and Chief Executive Officer, ACT Bridge, Inc. (enterprise talent management firm); until October 2001, Chairman of the Board, President and Chief Executive Officer of Heidrick & Struggles International, Inc. (executive search firm). | | Director, Lincoln National Corporation (insurance and investment management company); former Director, Cbeyond, Inc. (telecommunications company, formerly Cbeyond Communications, Inc.). |
| R. Scott Trumbull – 65 | | Director | | 11/13/12 | | Chairman, Chief Executive Officer and Director, Franklin Electric Co., Inc. (manufacturer of water and fuel pumping systems). | | Director, Health Care REIT (investor in health care real estate). |
| Director who is an “interested person” of Artisan Funds and Officer: |
| Eric R. Colson – 44* | | Director, President and Chief Executive Officer | | President and Chief Executive Officer since 2/9/10; Director since 11/12/13 | | President, Chief Executive Officer and Director of Artisan Partners Asset Management Inc. (since March 2013); Managing Director, Chief Executive Officer (since January 2010) and President (since April 2013) of Artisan Partners; prior thereto, Managing Director and Chief Operating Officer – Investment Operations of Artisan Partners. | | None. |
| Officers: |
| Brooke J. Billick – 59 | | Chief Compliance Officer | | 8/19/04 | | Chief Compliance Officer – U.S. Mutual Funds and Associate Counsel of Artisan Partners; Chief Compliance Officer of Artisan Partners Distributors LLC; until January 2012, Chief Compliance Officer of Artisan Partners. | | None. |
| Gregory K. Ramirez – 43 | | Chief Financial Officer, Vice President and Treasurer | | 2/8/11 | | Managing Director and since April 2013 Vice President and Assistant Treasurer of Artisan Partners; Vice President, Treasurer and Chief Financial Officer of Artisan Partners Distributors LLC since July 2012; prior thereto, Assistant Treasurer of Artisan Partners Distributors LLC; until February 2011, Assistant Secretary and Assistant Treasurer of Artisan Funds. | | None. |
DIRECTORS AND OFFICERS
| | | | | | | | |
| | | | | |
Name and Age at 11/15/13 | | Position(s)
Held with
Artisan Funds | | Date First Elected
or Appointed to Office | | Principal Occupation(s) during at least the
Past 5 Years | | Other Public Company or
Registered Investment
Company Directorships Held |
| Sarah A. Johnson – 41 | | General Counsel, Vice President and Secretary | | 2/8/11 | | Managing Director (since March 2010), Vice President (since April 2013), Secretary (since October 2013), Chief Compliance Officer (January 2012–September 2013) and General Counsel (since October 2013) of Artisan Partners; prior thereto Associate Counsel of Artisan Partners; Vice President and Secretary of Artisan Partners Distributors, LLC; until February 2011, Assistant Secretary of Artisan Funds. | | None. |
| James S. Hamman, Jr. – 44 | | Vice President and Assistant Secretary | | 2/8/11 | | Associate Counsel (since March 2010), Vice President (since April 2013) and Assistant Secretary (since October 2013) of Artisan Partners; from January 2008 until February 2010, Principal of Elite Investment Partners, LLC; prior thereto, Executive Vice President, General Counsel and Secretary of Calamos Asset Management, Inc. | | None. |
| Stephen W. Hlavach – 45 | | Assistant Treasurer | | 2/14/12 | | Tax Director (since January 2011) and Assistant Treasurer (since April 2013) of Artisan Partners; prior thereto, Tax Lead, Mergers & Acquisitions of The Boeing Company. | | None. |
| Shannon K. Jagodinski – 36 | | Assistant Treasurer | | 2/14/12 | | Senior Manager of Investment Accounting of Artisan Partners. | | None. |
| 1 | Andrew A. Ziegler retired as an interested director of Artisan Funds effective November 12, 2013. |
| * | Mr. Colson is an “interested person” of Artisan Funds, as defined in the 1940 Act, because he is President and Chief Executive Officer of Artisan Funds and a Managing Director, President and Chief Executive Officer of Artisan Partners. Mr. Colson also serves as President and Chief Executive Officer of Artisan Investments GP LLC (the general partner of Artisan Partners) and Artisan Partners Holdings LP (the parent company of Artisan Partners) and President, Chief Executive Officer and Director of Artisan Partners Asset Management Inc. (the general partner of Artisan Partners Holdings LP). |
The business address of the officers and the director affiliated with Artisan Partners is 875 E. Wisconsin Avenue, Suite 800, Milwaukee, Wisconsin 53202. The address of the other directors is c/o Artisan Funds, 875 E. Wisconsin Avenue, Suite 800, Milwaukee, Wisconsin 53202.
Artisan Funds’ statement of additional information (SAI) contains further information about the directors. Please call 800.344.1770 or visit our website at www.artisanfunds.com for a free copy of the SAI.

ARTISAN FUNDS
P.O. BOX 8412
BOSTON, MA 02266-8412

Item 2. Code of Ethics.
(a) Registrant has adopted a code of ethics (the “Code”) that applies to its principal executive officer, principal financial officer and principal accounting officer (the “Covered Officers”).
(b) No disclosures are required pursuant to this Item 2(b).
(c) During the period covered by the report, registrant did not make any substantive amendments to the Code.
(d) During the period covered by the report, registrant did not grant any waivers, including implicit waivers, from the provisions of the Code.
(e) Not applicable.
(f) A copy of the Code is filed as Exhibit (a)(1) to this Form N-CSR.
Item 3. Audit Committee Financial Expert.
Registrant’s board of directors has determined that Thomas R. Hefty, member and chairman of the registrant’s audit committee, Gail L. Hanson, member of the registrant’s audit committee, and R. Scott Trumbull, member of the registrant’s audit committee, each qualify as an audit committee financial expert, as such term is defined in Instruction 2(b) to Item 3 of Form N-CSR. Mr. Hefty, Ms. Hanson and Mr. Trumbull are “independent” as such term is defined in paragraph (a)(2) of Item 3 of Form N-CSR.
Under applicable securities laws, a person who is determined to be an audit committee financial expert will not be deemed an “expert” for any purpose, including, without limitation, for the purposes of Section 11 of the Securities Act of 1933, as a result of being designated or identified as an audit committee financial expert. The designation or identification of a person as an audit committee financial expert does not impose on such person any duties, obligations, or liabilities that are greater than the duties, obligations, and liabilities imposed on such person as a member of the audit committee and board of directors in the absence of such designation or identification.
Item 4. Principal Accountant Fees and Services.
Aggregate fees billed to the registrant for professional services rendered by the registrant’s principal accountant, Ernst & Young LLP, are summarized in the tables below. The tables summarize fees billed (or to be billed) by the registrant’s principal accountant for work performed relating to each applicable period identified below.
Fees:
| | | | | | | | |
| | | Fiscal Year Ended
September 30, 2013 | | | Fiscal Year Ended
September 30, 2012 | |
Audit Fees (a) | | $ | 284,400 | | | $ | 265,500 | |
Audit-Related Fees (b) | | $ | 52,260 | | | $ | 50,200 | |
Tax Fees (c) | | $ | 252,454 | | | $ | 323,650 | |
All Other Fees (d) | | $ | — | | | | — | |
(a) “Audit Fees” include amounts for professional services rendered by the principal accountant for the audit of the registrant’s annual financial statements and services that are normally provided by the accountant in connection with statutory and regulatory filings or engagements, including for 2013, portions of which have not been billed at the time of this filing and fees billed for consents issued in conjunction with the registrant’s post-effective amendments to the Funds’ registration statements filed for each of the last two fiscal years. The fees billed during the fiscal year ended September 30, 2013 also include the consent issued in conjunction with the
registrant’s post-effective amendments to the Funds’ registration statements filed in connection with the initial offering of investor shares of Artisan Global Small Cap Fund. The fees billed during the fiscal year ended September 30, 2012 also include consents issued in conjunction with the registrant’s post-effective amendments to the Funds’ registration statements filed in connection with the name change of Artisan Global Opportunities Fund (formerly Artisan Growth Opportunities Fund) and the initial offering of institutional shares of Artisan Global Value Fund, Artisan Mid Cap Value Fund, Artisan Small Cap Fund and Artisan Small Cap Value Fund.
(b) “Audit-Related Fees” include amounts for assurance and related services by the principal accountant that are reasonably related to the performance of the audit of the registrant’s financial statements. Audit-related fees have not been reported under the item “audit fees” in the chart above.
The fees billed by Ernst & Young LLP during the fiscal years ended September 30, 2013 and September 30, 2012 include fees incurred for services for review procedures performed in conjunction with the semiannual reports to shareholders as of March 31, 2013 and March 31, 2012.
(c) “Tax Fees” include amounts for professional services rendered by the principal accountant for tax compliance, tax advice and tax planning.
The fees shown in the table above for the fiscal year ended September 30, 2013 include fees for (1) the review and preparation of the Funds’ income tax returns for the fiscal year ended September 30, 2013, which have not been billed as of the time of this filing; (2) the review of excise tax calculations and preparation of excise tax returns for the calendar year ended December 31, 2013, which also have not yet been billed as of the time of this filing; (3) the use of a PFIC database supplied by Ernst & Young LLP for the fiscal year ended September 30, 2012 and the excise year ended December 31, 2012, and the semiannual period ended March 31, 2013; (4) the use of a Qualified Foreign Corporation (QFC) Database supplied by Ernst & Young LLP for the calendar year ended December 31, 2012; (5) the use of a Global Withholding Tax Reporter Database supplied by Ernst & Young LLP for the fiscal year ended September 30, 2013; and (6) the filing of reclaims of tax amounts withheld by European Union member countries.
The fees shown in the table above for the fiscal year ended September 30, 2012 include fees for (1) the review and preparation of the Funds’ income tax returns for the fiscal year ended September 30, 2012;(2) the review of excise tax calculations and preparation of excise tax returns for the calendar year ended December 31, 2012; (3) the use of a PFIC database supplied by Ernst & Young LLP for the fiscal year ended September 30, 2011 and the excise year ended December 31, 2011, and the semiannual period ended March 31, 2012; (4) the use of a Qualified Foreign Corporation (QFC) Database supplied by Ernst & Young LLP for the calendar year ended December 31, 2011; (5) the use of a Global Withholding Tax Reporter Database supplied by Ernst & Young LLP for the fiscal year ended September 30, 2012; and (6) the filing of reclaims of tax amounts withheld by European Union member countries.
(d) None.
(e)(1) During its regularly scheduled periodic meetings, the registrant’s audit committee considers any requests to pre-approve any audit, audit-related, tax and other services to be provided by the principal accountants of the registrant. The audit committee has authorized its chairman to exercise that authority in the intervals between meetings; and the chairman presents any such pre-approvals to the audit committee at its next regularly scheduled meeting. Under paragraph (c)(7)(i)(C) of Rule 2-01 of Regulation S-X, pre-approval of non-audit services may be waived provided that: 1) the aggregate fees for all such services provided constitutes no more than five percent of the total amount of fees paid by the registrant to its principal accountant during the fiscal year in which services are provided, 2) such services were not recognized by the registrant at the time of engagement as non-audit services and 3) such services are promptly brought to the attention of the audit committee of the registrant and approved prior to the completion of the audit.
(e)(2) No services included in Items 4(b) – (d) above were approved pursuant to paragraph (c)(7)(i)(C) of Rule 2-01 of Regulation S-X.
(f) Not applicable.
(g) The aggregate fees for the fiscal years ended September 30, 2013 and September 30, 2012 by the registrant’s principal accountant for non-audit services rendered to the registrant are shown in the tables above and described
under Items 4(b) – (d) above. For the registrant’s fiscal years ended September 30, 2013 and September 30, 2012, Ernst & Young LLP served as the registrant’s principal accountant and provided no services and billed no fees for non-audit services rendered to the registrant’s adviser or entities controlling, controlled by or under common control with the adviser.
(h) The audit committee of the registrant’s board of directors has considered whether the provision of non-audit services that were rendered to the registrant’s investment adviser, and any entity controlling, controlled by or under common control with the investment adviser that provides ongoing services to the registrant that were not pre-approved pursuant to paragraph (c)(7)(ii) of Rule 2-01 of Regulation S-X is compatible with maintaining the principal accountant’s independence. The provisions of Rule 2-01(c)(7) were effective on May 6, 2003. No such services were rendered on or after May 6, 2003.
Item 5. Audit Committee of Listed Registrants.
Not applicable.
Item 6. Schedule of Investments.
The Schedules of Investments in securities of unaffiliated issuers as of September 30, 2013 are included as part of the annual reports to shareholders filed under Item 1 of this Form N-CSR.
Item 7. Disclosure of Proxy Voting Policies and Procedures for Closed-End Management Investment Companies.
Not applicable.
Item 8. Portfolio Managers of Closed-End Management Investment Companies.
Not applicable.
Item 9. Purchases of Equity Securities by Closed-End Management Investment Company and Affiliated Purchasers.
Not applicable.
Item 10. Submission of Matters to a Vote of Security Holders.
No material changes to report.
Item 11. Controls and Procedures.
(a) The registrant’s principal executive and principal financial officers have concluded, based on an evaluation of the registrant’s disclosure controls and procedures (as defined in Rule 30a-3(c) under the Investment Company Act of 1940, the “Disclosure Controls”) as of a date within 90 days prior to the filing date (the “Filing Date”) of this Form N-CSR (the “Report”), that the Disclosure Controls are effectively designed to provide reasonable assurance that the information required to be disclosed by the registrant in the Report is recorded, processed, summarized and reported by the Filing Date, including ensuring that information required to be disclosed in the Report is accumulated and communicated to the registrant’s management, including the registrant’s principal executive officer and principal financial officer, as appropriate to allow timely decisions regarding required disclosure.
(b) There were no changes in the registrant’s internal controls over financial reporting (as defined in Rule 30a-3(d) under the Investment Company Act of 1940) that occurred during the second fiscal quarter of the period covered by this report that have materially affected, or are reasonably likely to materially affect, the registrant’s internal control over financial reporting.
Item 12. Exhibits.
| | | | |
(a) | | (1) | | Code of Ethics for Principal Executive Officer, Principal Financial Officer and Principal Accounting Officer (as referenced in Item 2 above), attached hereto as Exhibit (a)(1) |
| | |
| | (2) | | Certifications of Eric R. Colson, Principal Executive Officer and Gregory K. Ramirez, Principal Financial Officer pursuant to Rule 30a-2(a) under the Investment Company Act of 1940 (17 CFR 270.30a-2(a)), attached hereto as Exhibits (a)(2)(i) and (a)(2)(ii) |
| | |
(b) | | | | Certification of Eric R. Colson, Principal Executive Officer and Gregory K. Ramirez, Principal Financial Officer pursuant to Section 906 of the Sarbanes-Oxley Act of 2002, attached hereto as Exhibit (b) |
SIGNATURES
Pursuant to the requirements of the Securities Exchange Act of 1934 and the Investment Company Act of 1940, the registrant has duly caused this report to be signed on its behalf by the undersigned, thereunto duly authorized.
| | |
| Artisan Partners Funds, Inc. |
| |
| By: | | /s/ Eric R. Colson |
| | Eric R. Colson |
| | Principal Executive Officer |
| |
| Date: | | December 5, 2013 |
Pursuant to the requirements of the Securities Exchange Act of 1934 and the Investment Company Act of 1940, this report has been signed below by the following persons on behalf of the registrant and in the capacities and on the dates indicated.
| | |
|
| |
| By: | | /s/ Eric R. Colson |
| | Eric R. Colson |
| | Principal Executive Officer |
| |
| Date: | | December 5, 2013 |
| | |
|
| |
| By: | | /s/ Gregory K. Ramirez |
| | Gregory K. Ramirez |
| | Principal Financial Officer |
| |
| Date: | | December 5, 2013 |