UNITED STATES
SECURITIES AND EXCHANGE COMMISSION
Washington, D.C. 20549
FORM N-CSR
CERTIFIED SHAREHOLDER REPORT OF REGISTERED
MANAGEMENT INVESTMENT COMPANIES
Investment Company Act file number 811-08932
Artisan Partners Funds, Inc.
(Exact name of registrant as specified in charter)
875 East Wisconsin Avenue, Suite 800
Milwaukee, Wisconsin 53202
(Address of principal executive offices) (Zip Code)
| | |
Sarah A. Johnson | | John M. Loder |
Artisan Partners Funds, Inc. | | Ropes & Gray LLP |
875 East Wisconsin Avenue, Suite 800 | | Prudential Tower, 800 Boylston Street |
Milwaukee, Wisconsin 53202 | | Boston, Massachusetts 02199 |
(Name and address of agents for service)
Registrant’s telephone number, including area code: (414) 390-6100
Date of fiscal year end: 9/30
Date of reporting period: 9/30/15
Form N-CSR is to be used by management investment companies to file reports with the Commission not later than 10 days after the transmission to stockholders of any report that is required to be transmitted to stockholders under Rule 30e-1 under the Investment Company Act of 1940 (17 CFR 270.30e-1). The Commission may use the information provided on Form N-CSR in its regulatory, disclosure review, inspection, and policymaking roles.
A registrant is required to disclose the information specified by Form N-CSR, and the Commission will make this information public. A registrant is not required to respond to the collection of information contained in Form N-CSR unless the Form displays a currently valid Office of Management and Budget (“OMB”) control number. Please direct comments concerning the accuracy of the information collection burden estimate and any suggestions for reducing the burden to Secretary, Securities and Exchange Commission, 100 F Street, NE, Washington, DC 20549. The OMB has reviewed this collection of information under the clearance requirements of 44 U.S.C. § 3507.
Item 1. Reports to Shareholders.
ARTISAN PARTNERS FUNDS
| | | | | | |
| | | Share Class |
| | | Investor | | Institutional | | Advisor |
Artisan Developing World Fund | | ARTYX | | APHYX | | APDYX |
Artisan Emerging Markets Fund | | ARTZX | | APHEX | | N/A |
Artisan Global Equity Fund | | ARTHX | | N/A | | N/A |
Artisan Global Small Cap Fund | | ARTWX | | N/A | | N/A |
Artisan Global Opportunities Fund | | ARTRX | | APHRX | | APDRX |
Artisan Global Value Fund | | ARTGX | | APHGX | | APDGX |
Artisan High Income Fund | | ARTFX | | N/A | | APDFX |
Artisan International Fund | | ARTIX | | APHIX | | APDIX |
Artisan International Small Cap Fund | | ARTJX | | N/A | | N/A |
Artisan International Value Fund | | ARTKX | | APHKX | | APDKX |
Artisan Mid Cap Fund | | ARTMX | | APHMX | | APDMX |
Artisan Mid Cap Value Fund | | ARTQX | | APHQX | | APDQX |
Artisan Small Cap Fund | | ARTSX | | APHSX | | N/A |
Artisan Small Cap Value Fund | | ARTVX | | APHVX | | N/A |
Artisan Value Fund | | ARTLX | | APHLX | | APDLX |
TABLE OF CONTENTS
ARTISAN PARTNERS FUNDS
P.O. BOX 8412
BOSTON, MA 02266-8412
This report and the audited financial statements contained herein are provided for the general information of the shareholders of Artisan Partners Funds. Before investing, investors should consider carefully each Fund’s investment objective, risks and charges and expenses. For a prospectus or summary prospectus, which contain that information and more information about each Fund, please call 800.344.1770 or visit our website at www.artisanpartners.com. Read it carefully before you invest or send money.
Company discussions are for illustration only and are not intended as recommendations of individual stocks. The discussions present information about the companies believed to be accurate, and the views of the portfolio managers, as of September 30, 2015. That information and those views may change, and the Funds disclaim any obligation to advise shareholders of any such changes.
Artisan Partners Funds offered through Artisan Partners Distributors LLC, member FINRA.
ARTISAN DEVELOPING WORLD FUND
INVESTMENT PROCESS HIGHLIGHTS
Artisan Developing World Fund employs a fundamental investment process to construct a diversified portfolio of securities that offer exposure to developing world economies. In pursuit of this goal, the investment team generally invests substantially in companies domiciled in or economically tied to countries that it considers to have characteristics typical of the developing world. The team seeks to emphasize self-funding companies (as described below) that are exposed to the growth potential of developing world economies with limited dependence on foreign capital. The team believes that a portfolio of companies with these characteristics will be well positioned to deliver attractive risk-adjusted returns over the long-term.
Fundamental Stock Selection. The team seeks to focus its analysis on businesses that are economically tied to the developing world irrespective of domicile. The team believes that a focus on a company’s underlying economic exposure should result in investments that over time position the portfolio to benefit from the true drivers of the opportunity set in developing world economies. The team believes those drivers include increasing domestic demand, low penetration of basic goods and low levels of household debt, among other factors.
The team seeks to emphasize financially sound, self-funding companies in its stock selection process. The team generally considers self-funding companies to include those that exhibit low absolute or relative debt levels, limited capital intensity or visibility into free cash flow or capital generation. The team believes that these businesses are less likely to impair capital during periods of duress and may compound earnings per share and book value per share at above average rates. The team believes this approach has the potential to create a compelling risk-adjusted return.
Risk Management. The team believes that investments exposed to the developing world have unique risks that leave them vulnerable to capital flight during periods of market duress, and in turn capital impairment or constrained fundamental development. In an effort to mitigate these risks, the team seeks to emphasize investments in markets with limited dependence on foreign capital. The team believes this macro-economic framework benefits stock selection because capital flight can be inflationary and lead to tighter monetary policy which can impact economic growth and earnings growth.
PERFORMANCE HISTORY
TOTAL RETURNS (as of 9/30/2015)
| | | | |
| Fund / Index | | Since
Inception(1) | |
Artisan Developing World Fund – Investor Shares (6/29/2015) | | | -16.10 | % |
Artisan Developing World Fund – Institutional Shares (6/29/2015) | | | -16.10 | |
Artisan Developing World Fund – Advisor Shares (6/29/2015) | | | -16.10 | |
MSCI Emerging Markets Index | | | -16.77 | * |
| (1) | For the period from commencement of operations 6/29/2015 through 9/30/2015; not annualized. |
| * | As of Investor, Institutional and Advisor Shares inception date. |
The performance quoted represents past performance, which does not guarantee future results. The investment return and principal value of an investment in the Fund will fluctuate, so that an investor’s shares in the Fund, when redeemed, may be worth more or less than their original cost. Current performance may be lower or higher than the performance data quoted. For current to most recent month-end performance, visit www.artisanpartners.com or call 800.344.1770. The table above does not reflect the deduction of taxes that a shareholder would pay on distributions or sale of Fund shares. The performance shown does not reflect the deduction of a 2% redemption fee on shares held by an investor for 90 days or less and, if reflected, the fee would reduce the performance quoted. The Fund’s performance reflects Artisan Partners Limited Partnership’s (the “Adviser” or “Artisan Partners”) contractual agreement to limit the Fund’s expenses to no more than 1.50%, of the average daily net assets of Investor Shares, 1.40% of the average daily net assets of Advisor Shares and 1.40% of the average daily net assets of Institutional Shares, which has been in effect since the Fund’s inception and has had a material impact on performance, which would have been lower in its absence. See Notes on Management’s Discussion of Fund Performance and Portfolio Holdings’ Classification for a description of the index. The growth of $10,000 chart has been omitted due to the Fund’s short performance history.
INVESTING ENVIRONMENT
During the period June 29, 2015 through September 30, 2015, emerging markets equities sold off. While emerging markets headwinds, including Chinese deleveraging and dollar strength, were visible for some time, a key trigger for the selloff seems to have been the Chinese central bank’s decision to devalue its currency, which caused investors to reconsider the depth of the Chinese economic slowdown and potential for competitive devaluations across Asia and emerging markets.
SECTOR DIVERSIFICATION
| | | | |
| Sector | | 9/30/2015 | |
Consumer Discretionary | | | 15.2 | % |
Consumer Staples | | | 13.7 | |
Financials | | | 23.9 | |
Health Care | | | 3.6 | |
Industrials | | | 4.3 | |
Information Technology | | | 25.5 | |
Materials | | | 1.0 | |
Telecommunication Services | | | 1.8 | |
Other assets less liabilities | | | 11.0 | |
| | | | 100.0 | % |
PERFORMANCE DISCUSSION
During the period June 29, 2015 through September 30, 2015, Artisan Developing World Fund – Investor Shares declined 16.10%, Artisan Developing World Fund – Advisor Shares declined 16.10% and Artisan Developing World Fund – Institutional Shares declined 16.10%, outperforming the MSCI Emerging Markets Index, which declined 16.77% over the same period.
Performance of the following stocks had a positive impact on the portfolio during the period: Mexican dairy products company Grupo Lala, S.A.B. de C.V.; Taiwanese auto components supplier Tung Thih Electronic Co., Ltd.; US global payments network operator Visa, Inc.; Indian decorative paints company Asian Paints Ltd.; and Indian banking and financial services provider HDFC Bank Ltd.
Notable detractors included: Brazilian education company Kroton Educacional S.A.; Mexican media company Grupo Televisa, S.A.B.; Brazilian insurance broker BB Seguridade Participacoes S.A.; Chinese Internet company Baidu, Inc.; and Hong Kong life insurance company AIA Group Ltd.
REGION ALLOCATION
| | | | |
| Region | | 9/30/2015 | |
Emerging Asia | | | 39.5 | % |
Developed Markets | | | 24.3 | |
Europe, Middle East and Africa | | | 13.9 | |
Latin America | | | 11.3 | |
PORTFOLIO CHANGES
Notable additions to the portfolio since the Fund’s launch on June 29, 2015 included the following: Taiwanese integrated circuit manufacturer Taiwan Semiconductor Manufacturing Co., Ltd., Brazilian electronic payment solutions company Cielo S.A., Russian Internet search engine operator Yandex N.V. and Panamanian airline Copa Holdings S.A. We funded these purchases in part by selling our positions in Hengan International Group Co. Ltd., Hermes Microvision, Inc. and Smiles SA.
ARTISAN EMERGING MARKETS FUND
INVESTMENT PROCESS HIGHLIGHTS
Artisan Emerging Markets Fund employs a fundamental research process to construct a diversified portfolio of emerging market companies. The investment team seeks to invest in companies that it believes are uniquely positioned to benefit from the growth potential in emerging markets and possess a sustainable global competitive advantage.
Sustainable Earnings. The team believes that over the long term a stock’s price is directly related to the company’s ability to deliver sustainable earnings. The team determines a company’s sustainable earnings based upon financial and strategic analyses. The financial analysis of a company’s balance sheet, income statement, and statement of cash flows focuses on identifying historical drivers of return on equity. The strategic analysis examines a company’s competitive advantages and financial strength to assess sustainability.
Valuation. The team believes that investment opportunities develop when businesses with sustainable earnings are undervalued relative to peers and historical industry, country and regional valuations. The team values a business and develops a price target based on their assessment of the business’s sustainable earnings and cash flow expectations and the team’s risk analysis.
Risk Analysis. The team believes that a disciplined risk framework allows greater focus on fundamental stock selection. The team incorporates its assessment of company-specific and macroeconomic risks into its valuation analysis to develop a risk-adjusted target price. The risk-rating assessment includes a review of the currency, inflation, monetary and fiscal policy and political risks to which a company is exposed.
PERFORMANCE HISTORY
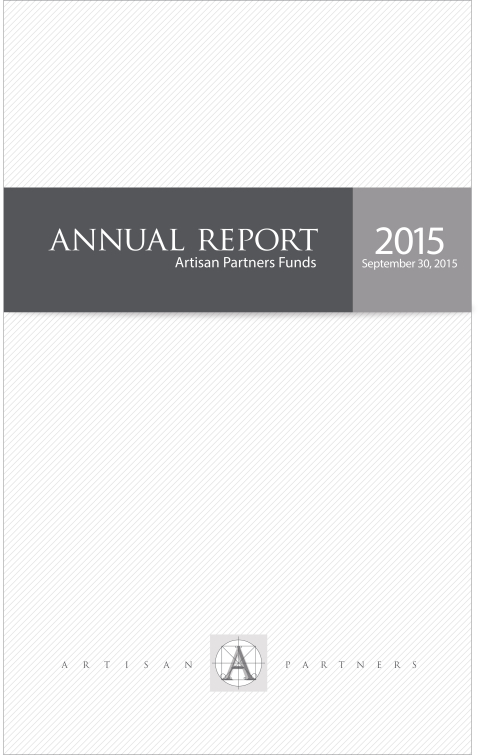
GROWTH OF AN ASSUMED $1,000,000 INVESTMENT (6/26/2006 to 9/30/2015)
AVERAGE ANNUAL TOTAL RETURNS (as of 9/30/2015)
| | | | | | | | | | | | | | | | |
| Fund / Index | | 1-Year | | | 3-Year | | | 5-Year | | | Since
Inception | |
Artisan Emerging Markets Fund – Institutional Shares (6/26/2006) | | | -20.43 | % | | | -7.12 | % | | | -7.29 | % | | | 1.23 | % |
Artisan Emerging Markets Fund – Investor Shares (6/2/2008)1 | | | -20.44 | | | | -7.34 | | | | -7.53 | | | | -6.63 | |
MSCI Emerging Markets Index | | | -19.28 | | | | -5.27 | | | | -3.58 | | | | 3.80 | * |
| 1 | Effective February 14, 2014, Emerging Markets Fund’s Advisor Shares were redesignated as Investor Shares. |
| * | As of Institutional Shares inception date. |
The performance quoted represents past performance, which does not guarantee future results. The investment return and principal value of an investment in the Fund will fluctuate, so that an investor’s shares in the Fund, when redeemed, may be worth more or less than their original cost. Current performance may be lower or higher than the performance data quoted. For current to most recent month-end performance, visit www.artisanpartners.com or call 800.344.1770. The graph and table above do not reflect the deduction of taxes that a shareholder would pay on distributions or sale of Fund shares. The performance shown does not reflect the deduction of a 2% redemption fee on shares held by an investor for 90 days or less and, if reflected, the fee would reduce the performance quoted. The Fund’s performance reflects Artisan Partners’ contractual agreement to limit the Fund’s expenses to no more than 1.50%, which has been in effect since the Fund’s inception and has had a material impact on performance, which would have been lower in its absence. See Notes on Management’s Discussion of Fund Performance and Portfolio Holdings’ Classification for a description of the index.
INVESTING ENVIRONMENT
Emerging markets faced serious structural headwinds over the past twelve months, contributing to a decline in emerging markets stocks of nearly 20% in USD terms. Concerns about the slowing pace of growth in China and a host of macroeconomic and political headwinds in Brazil caused investors to seek the safety of other asset classes. China’s surprise devaluation of the yuan in August 2015 only added to investors’ worry and contributed to the heightened volatility in equity markets. Commodity prices fell, dragged down by China’s outlook, and hurt large players in Russia and Brazil. Currency headwinds persisted throughout the period as the US dollar appreciated relative to most major EM currencies, leaving USD-based investors with magnified losses.
SECTOR DIVERSIFICATION
| | | | | | | | |
| Sector | | 9/30/2014 | | | 9/30/2015 | |
Consumer Discretionary | | | 14.3 | % | | | 14.8 | % |
Consumer Staples | | | 4.8 | | | | 4.9 | |
Energy | | | 9.0 | | | | 6.4 | |
Financials | | | 22.4 | | | | 24.4 | |
Health Care | | | 5.3 | | | | 7.9 | |
Industrials | | | 8.5 | | | | 7.0 | |
Information Technology | | | 20.4 | | | | 21.5 | |
Materials | | | 8.3 | | | | 5.9 | |
Telecommunication Services | | | 4.1 | | | | 2.6 | |
Utilities | | | 1.1 | | | | 1.1 | |
Other assets less liabilities | | | 1.8 | | | | 3.5 | |
| | | | 100.0 | % | | | 100.0 | % |
PERFORMANCE DISCUSSION
During the twelve-month period ended September 30, 2015, Artisan Emerging Markets Fund – Investor Shares declined 20.44% and Artisan Emerging Markets Fund – Institutional Shares declined 20.43%, underperforming the MSCI Emerging Markets Index, which declined 19.28% over the same period.
Performance of the following stocks had a positive impact on the portfolio during the period: Chinese train-borne electrical systems provider ZhuZhou CSR Times Electric Co., Ltd.; Indian antibiotic manufacturer and marketer Aurobindo Pharma Ltd.; Chinese insurance provider China Life Insurance Co., Ltd.; Chinese wealth management product distributor Noah Holdings Ltd.; and South African media company Naspers Ltd.
Notable detractors included: Brazilian oil and gas company Petroleo Brasileiro S.A.; Argentinian integrated oil and gas exploration and production company YPF S.A.; Chinese flavors and fragrance company Huabao International Holdings Ltd.; Taiwanese integrated chipset supplier MediaTek, Inc.; and Brazilian iron ore producer Vale S.A.
REGION ALLOCATION
| | | | | | | | |
| Sector | | 9/30/2014 | | | 9/30/2015 | |
Emerging Asia | | | 59.1 | % | | | 60.0 | % |
Europe, Middle East and Africa | | | 16.2 | | | | 17.0 | |
Latin America | | | 17.9 | | | | 14.9 | |
Developed Markets | | | 5.0 | | | | 4.6 | |
PORTFOLIO CHANGES
We identified several new investment opportunities for the portfolio during the period, including UK mining services company Randgold Resources Ltd.; Chinese Internet company Baidu, Inc.; Korean chemical company LG Chem Ltd.; Russian discount supermarket chain operator Magnit PJSC; and Turkey-based commercial vehicle manufacturer, importer and distributor Ford Otomotiv Sanayi AS. We funded these purchases in part by selling our positions in Mahindra & Mahindra Ltd., Tenaris S.A., Raia Drogasil S.A., OHL Mexico S.A.B. de C.V. and Hindalco Industries Ltd.
ARTISAN GLOBAL EQUITY FUND
INVESTMENT PROCESS HIGHLIGHTS
Artisan Global Equity Fund employs a fundamental stock selection process focused on identifying long-term growth opportunities to build a global (i.e., U.S. and non-U.S.) portfolio of companies of all market capitalizations. The investment team seeks to invest in companies within its preferred themes with sustainable growth characteristics at attractive valuations that do not fully reflect their long-term potential.
Themes. The team identifies long-term secular growth trends with the objective of investing in companies that have meaningful exposure to these trends. The team’s fundamental analysis focuses on those industry leaders with attractive growth and valuation characteristics that will be long-term beneficiaries of any structural change and/or trend.
Sustainable Growth. The team applies a fundamental approach to identifying the long-term, sustainable growth characteristics of potential investments. The team seeks high-quality companies that typically have a sustainable competitive advantage, a superior business model and a high-quality management team.
Valuation. The team uses multiple valuation metrics to establish a target price range. The team assesses the relationship between its estimate of a company’s sustainable growth prospects and its current valuation.
PERFORMANCE HISTORY
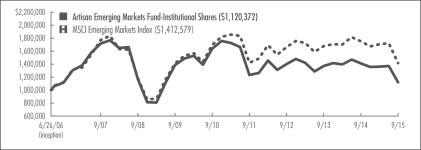
GROWTH OF AN ASSUMED $10,000 INVESTMENT (3/29/2010 to 9/30/2015)
AVERAGE ANNUAL TOTAL RETURNS (as of 9/30/2015)
| | | | | | | | | | | | | | | | |
| Fund / Index | | 1-Year | | | 3-Year | | | 5-Year | | | Since
Inception | |
Artisan Global Equity Fund – Investor Shares (3/29/2010) | | | 0.20 | % | | | 10.72 | % | | | 12.34 | % | | | 11.61 | % |
MSCI ACWI Index | | | -6.66 | | | | 6.95 | | | | 6.82 | | | | 6.29 | * |
| * | As of Investor Shares inception date. |
The performance quoted represents past performance, which does not guarantee future results. The investment return and principal value of an investment in the Fund will fluctuate, so that an investor’s shares in the Fund, when redeemed, may be worth more or less than their original cost. Current performance may be lower or higher than the performance data quoted. The Fund’s investments in initial public offerings (IPOs) made a material contribution to the Fund’s performance. IPO investments are not an integral component of the Fund’s investment process and may not be available in the future. For current to most recent month-end performance, visit www.artisanpartners.com or call 800.344.1770. The graph and table above do not reflect the deduction of taxes that a shareholder would pay on distributions or sale of Fund shares. The performance shown does not reflect the deduction of a 2% redemption fee on shares held by an investor for 90 days or less and, if reflected, the fee would reduce the performance quoted. The Fund’s performance reflects Artisan Partners’ contractual agreement to limit the Fund’s expenses to no more than 1.50%, which has been in effect since the Fund’s inception and has had a material impact on performance, which would have been lower in its absence. See Notes on Management’s Discussion of Fund Performance and Portfolio Holdings’ Classification for a description of the index.
INVESTING ENVIRONMENT
For the twelve-month period ended September 30, 2015, the MSCI All Country World Index was down 1.47% in local currency terms, but down 6.66% in USD terms as an appreciating USD served as a headwind for USD-based investors. Volatility increased in the later part of the period, partly on fears over slowing growth in China and the Federal Reserve’s decision to maintain historically low interest rates.
SECTOR DIVERSIFICATION
| | | | | | | | |
| Sector | | 9/30/2014 | | | 9/30/2015 | |
Consumer Discretionary | | | 27.1 | % | | | 24.4 | % |
Consumer Staples | | | 6.6 | | | | 1.4 | |
Energy | | | 1.5 | | | | — | |
Financials | | | 12.7 | | | | 13.9 | |
Health Care | | | 23.8 | | | | 28.2 | |
Industrials | | | 2.7 | | | | 6.6 | |
Information Technology | | | 10.6 | | | | 14.5 | |
Materials | | | 4.6 | | | | 4.0 | |
Telecommunication Services | | | 2.7 | | | | 1.9 | |
Utilities | | | 4.9 | | | | 2.2 | |
Other assets less liabilities | | | 2.8 | | | | 2.9 | |
| | | | 100.0 | % | | | 100.0 | % |
PERFORMANCE DISCUSSION
During the twelve-month period ended September 30, 2015, Artisan Global Equity Fund – Investor Shares gained 0.20%, outperforming the MSCI All Country World Index, which declined 6.66% over the same period.
Performance of the following stocks had a positive impact on the portfolio during the period: US biopharmaceutical firm Incyte Corp.; UK hospital outsourcing company Synergy Health Plc; US auto parts and accessories retailer Advance Auto Parts, Inc.; US biopharmaceutical firm Celgene Corp.; and US payment solutions company MasterCard, Inc.
Notable detractors included: US biopharmaceutical firm PTC Therapeutics, Inc.; Chinese gas utility company China Oil & Gas Group Ltd.; Chinese Internet company Baidu, Inc.; German car manufacturer Porsche Automobil Holding SE; and Taiwanese contact lens manufacturer Ginko International Co., Ltd.
REGION ALLOCATION
| | | | | | | | |
| Region | | 9/30/2014 | | | 9/30/2015 | |
Americas | | | 49.0 | % | | | 57.9 | % |
Europe | | | 22.4 | | | | 24.3 | |
Emerging Markets | | | 19.6 | | | | 12.3 | |
Pacific Basin | | | 6.2 | | | | 2.6 | |
PORTFOLIO CHANGES
We identified several new investment opportunities for the portfolio during the period, including US scientific instruments, consumables and chemicals manufacturer Thermo Fisher Scientific, Inc.; US medical holding company Envision Healthcare Holdings, Inc.; German mobile and fixed-line service provider Telefonica Deutschland Holding AG; US mattress and pillow manufacturer Tempur Sealy International, Inc.; and US vehicle components manufacturer Delphi Automotive plc. We funded these purchases in part by selling our positions in Marsh & McLennan Cos., Inc., Michael Kors Holdings Ltd., TJX Cos., Inc., Synergy Health plc and Church & Dwight Co., Inc.
ARTISAN GLOBAL OPPORTUNITIES FUND
INVESTMENT PROCESS HIGHLIGHTS
Artisan Global Opportunities Fund employs a fundamental investment process to construct a diversified portfolio of U.S. and non-U.S. growth companies across a broad capitalization range. The Fund’s investment team seeks to invest in companies that it believes possess franchise characteristics, are benefiting from an accelerating profit cycle and are trading at a discount to its estimate of private market value. The Fund’s investment process focuses on two distinct elements – security selection and capital allocation. The team overlays its investment process with broad knowledge of the global economy.
Security Selection. The team seeks to identify companies that have franchise characteristics (e.g. low cost production capability, possession of a proprietary asset, dominant market share or a defensible brand name), are benefiting from an accelerating profit cycle and are trading at a discount to its estimate of private market value. The team looks for companies that are well positioned for long-term growth, which is driven by demand for their products and services at an early enough stage in their profit cycle to benefit from the increased cash flows produced by the emerging profit cycle.
Capital Allocation. Based on the investment team’s fundamental analysis of a company’s profit cycle, it divides the portfolio into three parts. GardenSM investments are small positions in the early part of their profit cycle that will warrant more sizeable allocations as their profit cycle accelerates. CropSM investments are positions that are being increased to a full weight because the team believes they are moving through the strongest part of their profit cycles. HarvestSM investments are positions that are being reduced as they near the team’s estimates of full valuation or their profit cycles begin to decelerate.
Broad Knowledge. The team overlays the security selection and capital allocation elements of its investment process with a desire to invest opportunistically across the entire global economy. The team seeks broad knowledge of the global economy in order to position it to find growth wherever it occurs.
PERFORMANCE HISTORY
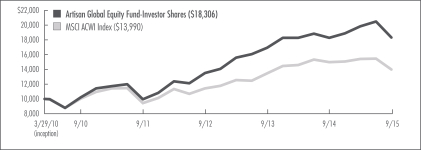
GROWTH OF AN ASSUMED $10,000 INVESTMENT (9/22/2008 to 9/30/2015)
AVERAGE ANNUAL TOTAL RETURNS (as of 9/30/2015)
| | | | | | | | | | | | | | | | |
| Fund / Index | | 1-Year | | | 3-Year | | | 5-Year | | | Since
Inception | |
Artisan Global Opportunities Fund – Investor Shares (9/22/2008) | | | -0.46 | % | | | 9.69 | % | | | 11.83 | % | | | 9.76 | % |
Artisan Global Opportunities Fund – Institutional Shares (7/26/2011) | | | -0.23 | | | | 9.96 | | | | n/a | | | | 9.01 | |
Artisan Global Opportunities Fund – Advisor Shares (4/1/2015) | | | n/a | | | | n/a | | | | n/a | | | | -4.12 | (1) |
MSCI ACWI Index | | | -6.66 | | | | 6.95 | | | | 6.82 | | | | 4.99 | * |
| (1) | For the period from commencement of operations 4/1/2015 through 9/30/2015; not annualized. |
| * | As of Investor Shares inception date. |
The performance quoted represents past performance, which does not guarantee future results. The investment return and principal value of an investment in the Fund will fluctuate, so that an investor’s shares in the Fund, when redeemed, may be worth more or less than their original cost. Current performance may be lower or higher than the performance data quoted. For current to most recent month-end performance, visit www.artisanpartners.com or call 800.344.1770. The graph and table above do not reflect the deduction of taxes that a shareholder would pay on distributions or sale of Fund shares. The performance shown does not reflect the deduction of a 2% redemption fee on shares held by an investor for 90 days or less and, if reflected, the fee would reduce the performance quoted. The Investor Shares’ performance reflects Artisan Partners’ contractual agreement, in effect from the inception of the Investor Shares through January 31, 2014, to limit the Investor Shares’ expenses to no more than 1.50%, which has had a material impact on performance, which would have been lower in its absence. The Advisor Shares performance reflects Artisan Partners’ contractual agreement to limit the expenses of the Advisor Shares to no more than 1.10%, of the average daily net assets of Advisor Shares, which has been in effect since the inception of the Advisor Shares and has had a material impact on performance, which would have been lower in its absence. See Notes on Management’s Discussion of Fund Performance and Portfolio Holdings’ Classification for a description of the index.
INVESTING ENVIRONMENT
For the twelve-month period ended September 30, 2015, the MSCI All Country World Index (ACWI) returned -6.66% (all returns in USD). The US dollar strengthened through the year, serving as a headwind for USD-based investors. The MSCI USA Index outperformed developed world stocks (as measured by the MSCI World Index), on signs the US economy was reaccelerating. The MSCI Emerging Markets Index trailed ACWI, returning -19.28% on concerns of decelerating growth in emerging markets, particularly in China. US small-cap stocks outpaced mid-caps, which outpaced large-caps during the period.
SECTOR DIVERSIFICATION
| | | | | | | | |
| Sector | | 9/30/2014 | | | 9/30/2015 | |
Consumer Discretionary | | | 8.8 | % | | | 16.5 | % |
Consumer Staples | | | 4.5 | | | | 5.0 | |
Energy | | | 5.3 | | | | 1.5 | |
Financials | | | 9.9 | | | | 6.9 | |
Health Care | | | 16.9 | | | | 16.6 | |
Industrials | | | 12.9 | | | | 10.1 | |
Information Technology | | | 30.7 | | | | 31.9 | |
Materials | | | 3.7 | | | | 2.1 | |
Utilities | | | 1.5 | | | | 1.5 | |
Other assets less liabilities | | | 5.8 | | | | 7.9 | |
| | | | 100.0 | % | | | 100.0 | % |
PERFORMANCE DISCUSSION
During the twelve-month period ended September 30, 2015, Artisan Global Opportunities Fund – Investor Shares declined 0.46% and Artisan Global Opportunities Fund – Institutional Shares declined 0.23%, outperforming the MSCI All Country World Index, which declined 6.66% over the same period. During the period April 1, 2015 through September 30, 2015, Artisan Global Opportunities Fund – Advisor Shares declined 4.12%, outperforming the MSCI All Country World Index, which declined 9.10% over the same period.
Performance of the following stocks had a positive impact on the portfolio during the period: US biopharmaceutical firm Regeneron Pharmaceuticals, Inc.; Denmark biotechnology firm Genmab AS; US roaster and retailer of specialty coffee Starbucks Corp.; US global payments network operator Visa, Inc.; and Korean cosmetics retailer Amorepacific Corp.
Notable detractors included: UK engineered pump and valve manufacturer Weir Group plc; US energy exploration and production company Anadarko Petroleum Corp.; Chinese e-commerce company Alibaba Group Holding Ltd.; US specialty coffee and coffee-brewer provider Keurig Green Mountain, Inc.; and Mexican natural gas pipeline operator Infraestructura Energetica Nova S.A.B. de C.V.
REGION ALLOCATION
| | | | | | | | |
| Region | | 9/30/2014 | | | 9/30/2015 | |
Americas | | | 56.0 | % | | | 52.9 | % |
Europe | | | 17.2 | | | | 21.1 | |
Pacific Basin | | | 8.2 | | | | 10.3 | |
Emerging Markets | | | 12.8 | | | | 7.8 | |
PORTFOLIO CHANGES
We identified several new investment opportunities for the portfolio during the period, including Denmark biotechnology firm Genmab AS; US video game publisher Electronic Arts, Inc.; US financial information and analytics company McGraw Hill Financial, Inc.; US computer software company Adobe Systems, Inc.; and Japanese video game developer Nintendo Co., Ltd. We funded these purchases in part by selling our positions in Applied Materials, Inc., Discover Financial Services, Sanofi, Rotork plc and Baidu, Inc.
ARTISAN GLOBAL SMALL CAP FUND
INVESTMENT PROCESS HIGHLIGHTS
Artisan Global Small Cap Fund employs a fundamental stock selection process focused on identifying long-term growth opportunities to build a global portfolio of small-cap growth companies. The investment team seeks to invest in companies within its preferred themes with sustainable growth characteristics at attractive valuations that do not fully reflect their long-term potential.
Themes. The team identifies long-term secular growth trends with the objective of investing in companies that have meaningful exposure to these trends. The team’s fundamental analysis focuses on those industry leaders with attractive growth and valuation characteristics that will be long-term beneficiaries of any structural change and/or trend.
Sustainable Growth. The team applies a fundamental approach to identifying the long-term, sustainable growth characteristics of potential investments. The team seeks high-quality companies that typically have a sustainable competitive advantage, a superior business model and a high-quality management team.
Valuation. The team uses multiple valuation metrics to establish a target price range. The team assesses the relationship between its estimate of a company’s sustainable growth prospects and its current valuation.
PERFORMANCE HISTORY
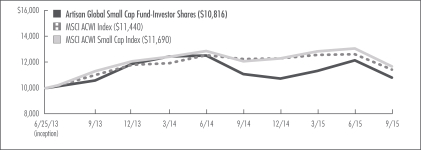
GROWTH OF AN ASSUMED $10,000 INVESTMENT (6/25/2013 to 9/30/2015)
Average annual TOTAL RETURNS (as of 9/30/2015)
| | | | | | | | |
| Fund / Index | | 1-Year | | | Since
Inception | |
Artisan Global Small Cap Fund – Investor Shares (6/25/2013) | | | -2.56 | % | | | 3.52 | % |
MSCI AWCI Index | | | -6.66 | | | | 6.12 | |
MSCI ACWI Small Cap Index | | | -3.28 | | | | 7.13 | * |
| * | As of Investor Shares inception date. |
The performance quoted represents past performance, which does not guarantee future results. The investment return and principal value of an investment in the Fund will fluctuate, so that an investor’s shares in the Fund, when redeemed, may be worth more or less than their original cost. Current performance may be lower or higher than the performance data quoted. The Fund’s investments in initial public offerings (IPOs) made a material contribution to the Fund’s performance. IPO investments are not an integral component of the Fund’s investment process and may not be available in the future. For current to most recent month-end performance, visit www.artisanpartners.com or call 800.344.1770. The graph and table above does not reflect the deduction of taxes that a shareholder would pay on distributions or sale of Fund shares. The performance shown does not reflect the deduction of a 2% redemption fee on shares held by an investor for 90 days or less and, if reflected, the fee would reduce the performance quoted. The Fund’s performance reflects Artisan Partners’ contractual agreement to limit the Fund’s expenses to no more than 1.50%, which has been in effect since the Fund’s inception and has had a material impact on performance, which would have been lower in its absence. See Notes on Management’s Discussion of Fund Performance and Portfolio Holdings’ Classification for a description of the index.
| | |
| 10 | | Artisan Partners Funds |
INVESTING ENVIRONMENT
For the twelve-month period ended September 30, 2015, the MSCI All Country World Small Cap Index was up 1.64% in local currency terms, but down 3.28% in USD terms as an appreciating USD served as a headwind for USD-based investors. Volatility increased in the later part of the period, partly on fears over slowing growth in China and the Federal Reserve’s decision to maintain historically low interest rates. Overall, small-cap stocks outpaced large-cap stocks. Within the small-cap universe, emerging markets significantly trailed developed markets.
SECTOR DIVERSIFICATION
| | | | | | | | |
| Sector | | 9/30/2014 | | | 9/30/2015 | |
Consumer Discretionary | | | 18.6 | % | | | 18.6 | % |
Consumer Staples | | | 12.5 | | | | 4.0 | |
Energy | | | 1.3 | | | | — | |
Financials | | | 5.3 | | | | 9.5 | |
Health Care | | | 14.9 | | | | 20.0 | |
Industrials | | | 13.4 | | | | 7.6 | |
Information Technology | | | 3.4 | | | | 8.5 | |
Materials | | | 10.4 | | | | 6.3 | |
Telecommunication Services | | | — | | | | 6.3 | |
Utilities | | | 10.1 | | | | 10.5 | |
Other assets less liabilities | | | 10.1 | | | | 8.7 | |
| | | | 100.0 | % | | | 100.0 | % |
PERFORMANCE DISCUSSION
During the twelve-month period ended September 30, 2015, Artisan Global Small Cap Fund – Investor Shares declined 2.56%, outperforming the MSCI All Country World Small Cap Index, which declined 3.28% over the same period.
Performance of the following stocks had a positive impact on the portfolio during the period: German advertising company Stroeer Media AG; UK hospital outsourcing company Synergy Health Plc; Chinese pediatric nutrition company Biostime International Holdings Ltd.; French biopharmaceutical firm Innate Pharma S.A.; and Finland-based packaging products manufacturer Huhtamaki Oyj.
Notable detractors included: US nutritional supplement company MusclePharm Corp.; Chinese gas utility company China Oil & Gas Group Ltd.; US biopharmaceutical firm PTC Therapeutics, Inc.; Taiwanese contact lens manufacturer Ginko International Co., Ltd.; and US hotel company La Quinta Holdings, Inc.
REGION ALLOCATION
| | | | | | | | |
| Region | | 9/30/2014 | | | 9/30/2015 | |
Europe | | | 37.9 | % | | | 50.7 | % |
Emerging Markets | | | 25.7 | | | | 21.6 | |
Americas | | | 13.7 | | | | 13.6 | |
Pacific Basin | | | 9.6 | | | | 5.4 | |
Middle East | | | 3.0 | | | | — | |
PORTFOLIO CHANGES
We identified several new investment opportunities for the portfolio during the period, including Italian broadcast tower operator RAI Way S.p.A.; German cable service provider Tele Columbus AG; Italian electronic communications infrastructure company Infrastrutture Wireless Italiane S.p.A.; French linen and uniform rental company Elis SA; and Italian broadcast tower operator Ei Towers S.p.A. We funded these purchases in part by selling our positions in Stroeer Media AG, Victrex plc, Overseas Education Ltd., Sarine Technologies Ltd. and Naturex.
| | |
| Artisan Partners Funds | | 11 |
ARTISAN GLOBAL VALUE FUND
INVESTMENT PROCESS HIGHLIGHTS
Artisan Global Value Fund employs a fundamental investment process to construct a diversified portfolio of securities of undervalued U.S. and non-U.S. companies. The investment team seeks to invest in what it considers to be high-quality, undervalued companies with strong balance sheets and shareholder-oriented management teams. The team’s investment research process focuses on four key characteristics:
Undervaluation. Determining the intrinsic value of a business is the heart of the team’s research process. The team believes that intrinsic value represents the amount that a buyer would pay to own a company’s future cash flows. The team seeks to invest at a significant discount to the team’s estimate of the intrinsic value of a business.
Business Quality. The team seeks to invest in companies with histories of generating strong free cash flow, improving returns on capital and strong competitive positions in their industries.
Financial Strength. The team believes that investing in companies with strong balance sheets helps to reduce the potential for capital risk and provides company management the ability to build value when attractive opportunities are available.
Shareholder-Oriented Management. The team’s research process attempts to identify management teams with a history of building value for shareholders.
PERFORMANCE HISTORY
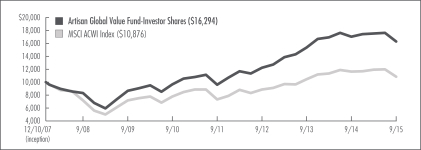
GROWTH OF AN ASSUMED $10,000 INVESTMENT (12/10/2007 to 9/30/2015)
AVERAGE ANNUAL TOTAL RETURNS (as of 9/30/2015)
| | | | | | | | | | | | | | | | |
| Fund / Index | | 1-Year | | | 3-Year | | | 5-Year | | | Since
Inception | |
Artisan Global Value Fund – Investor Shares (12/10/2007) | | | -4.32 | % | | | 10.02 | % | | | 11.02 | % | | | 6.45 | % |
Artisan Global Value Fund – Institutional Shares (7/17/2012) | | | -4.16 | | | | 10.27 | | | | n/a | | | | 12.15 | |
Artisan Global Value Fund – Advisor Shares (4/1/2015) | | | n/a | | | | n/a | | | | n/a | | | | -7.18 | (1) |
MSCI ACWI Index | | | -6.66 | | | | 6.95 | | | | 6.82 | | | | 1.08 | * |
| (1) | For the period from commencement of operations 4/1/2015 through 9/30/2015; not annualized. |
| * | As of Investor Shares inception date. |
The performance quoted represents past performance, which does not guarantee future results. The investment return and principal value of an investment in the Fund will fluctuate, so that an investor’s shares in the Fund, when redeemed, may be worth more or less than their original cost. Current performance may be lower or higher than the performance data quoted. For current to most recent month-end performance information, visit www.artisanpartners.com or call 800.344.1770. The graph and table above do not reflect the deduction of taxes that a shareholder would pay on distributions or sale of Fund shares. The performance shown does not reflect the deduction of a 2% redemption fee on shares held by an investor for 90 days or less and, if reflected, the fee would reduce the performance quoted. The Investor Shares’ performance reflects Artisan Partners’ contractual agreement, in effect from the inception of the Investor Shares through January 31, 2014, to limit the expenses to no more than 1.50%, which has had a material impact on performance, which would have been lower in its absence. The Advisor Shares performance reflects Artisan Partners’ contractual agreement to limit the expenses of the Advisor Shares to no more than 1.20%, of the average daily net assets of Advisor Shares, which has been in effect since the inception of the Advisor Shares and has had a material impact on performance, which would have been lower in its absence. See Notes on Management’s Discussion of Fund Performance and Portfolio Holdings’ Classification for a description of the index.
| | |
| 12 | | Artisan Partners Funds |
INVESTING ENVIRONMENT
Global equity markets declined during the third quarter of 2015, dragging returns into negative territory for the twelve-month period ended September 30, 2015. Numerous factors contributed to the decline including negative sentiment around the slowing global economy, particularly slowing growth in China. Amid these concerns, commodities prices and emerging markets currencies fell. Meanwhile, the US dollar strengthened throughout the year, which was a headwind for US dollar-based investors.
SECTOR DIVERSIFICATION
| | | | | | | | |
| Sector | | 9/30/2014 | | | 9/30/2015 | |
Consumer Discretionary | | | 3.9 | % | | | 3.9 | % |
Consumer Staples | | | 8.5 | | | | 7.1 | |
Energy | | | 4.0 | | | | 2.8 | |
Financials | | | 32.1 | | | | 37.1 | |
Health Care | | | 9.1 | | | | 7.9 | |
Industrials | | | 4.4 | | | | 7.7 | |
Information Technology | | | 26.5 | | | | 23.3 | |
Materials | | | 0.4 | | | | — | |
Telecommunication Services | | | 1.0 | | | | 1.9 | |
Other assets less liabilities | | | 10.1 | | | | 8.3 | |
| | | | 100.0 | % | | | 100.0 | % |
PERFORMANCE DISCUSSION
During the twelve-month period ended September 30, 2015, Artisan Global Value Fund – Investor Shares declined 4.32% and Artisan Global Value Fund – Institutional Shares declined 4.16%, outperforming the MSCI All Country World Index, which declined 6.66% over the same period. During the period April 1, 2015 through September 30, 2015, Artisan Global Value Fund – Advisor Shares declined 7.18%, outperforming the MSCI All Country World Index, which declined 9.10% over the same period.
Performance of the following stocks had a positive impact on the portfolio during the period: US insurance and re-insurance company Arch Capital Group Ltd.; US property and casualty insurance provider Chubb Corp.; US payment solutions company MasterCard, Inc.; US electronic components provider TE Connectivity Ltd.; and Denmark-based facility services provider ISS AS.
Notable detractors included: US wireless communications equipment manufacturer QUALCOMM, Inc.; UK-based retail and commercial banking franchise Royal Bank of Scotland Group plc; US mining equipment manufacturer Joy Global, Inc.; Canadian energy company Imperial Oil Ltd.; and Brazilian telecommunications company Telefonica Brasil S.A.
REGION ALLOCATION
| | | | | | | | |
| Region | | 9/30/2014 | | | 9/30/2015 | |
Americas | | | 55.0 | % | | | 55.2 | % |
Europe | | | 29.4 | | | | 28.9 | |
Emerging Markets | | | 4.4 | | | | 7.5 | |
Pacific Basin | | | 1.1 | | | | 0.1 | |
PORTFOLIO CHANGES
We identified several new investment opportunities for the portfolio during the period, including Swiss financial services provider UBS Group AG; Brazilian telecommunications company Telefonica Brasil S.A.; US technology product and support provider United Technologies Corp.; UK consulting and engineering company Amec Foster Wheeler plc; and Chinese education services provider New Oriental Education & Technology Group, Inc. We funded these purchases in part by selling our positions in MasterCard Inc., Unilever plc, Kao Corp., Vivendi S.A. and Tianhe Chemicals Group Ltd.
| | |
| Artisan Partners Funds | | 13 |
ARTISAN HIGH INCOME FUND
INVESTMENT PROCESS HIGHLIGHTS
Artisan High Income Fund employs a fundamental investment process to construct a diversified portfolio of attractively valued high yield corporate bonds (often referred to as “junk bonds”) and secured and unsecured loans, including, without limitation, bridge financing, senior and subordinated loans, delayed funding loans and revolving credit facilities, and loan participations and assignments. The Fund’s investment team’s research process has four primary pillars:
Business Quality. The team analyzes the general health of the industry in which an issuer operates, the issuer’s competitive position, the dynamics of industry participants, and the decision-making history of the issuer’s management.
Financial Strength and Flexibility. The team believes that analyzing the history and trend of free cash flow generation is critical to understanding an issuer’s financial health.
Downside Analysis. The team believes that credit instruments by their nature have an asymmetric risk profile. The risk of loss is often greater than the potential for gain, particularly when looking at below investment grade issuers. The team seeks to manage this risk with what it believes to be conservative financial projections that account for industry position, competitive dynamics and positioning within the capital structure.
Value Identification. The team looks for credit improvement potential, relative value within an issuer’s capital structure, catalysts for business improvement and potential value stemming from market or industry dislocations.
PERFORMANCE HISTORY
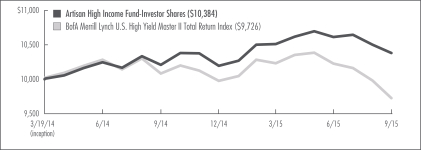
GROWTH OF AN ASSUMED $10,000 INVESTMENT (3/19/2014 to 9/30/2015)
AVERAGE ANNUAL TOTAL RETURNS (as of 9/30/2015)
| | | | | | | | |
| Fund / Index | | 1-Year | | | Since
Inception | |
Artisan High Income Fund – Investor Shares (3/19/2014) | | | 1.73 | % | | | 2.49 | % |
Artisan High Income Fund – Advisor Shares (3/19/2014) | | | 1.88 | | | | 2.61 | |
BofA Merrill Lynch U.S. High Yield Master II Total Return | | | -3.57 | | | | -1.80 | * |
| * | As of Investor and Advisor Shares inception date. |
The performance quoted represents past performance, which does not guarantee future results. The investment return and principal value of an investment in the Fund will fluctuate, so that an investor’s shares in the Fund, when redeemed, may be worth more or less than their original cost. Current performance may be lower or higher than the performance data quoted. For current to most recent month-end performance, visit www.artisanpartners.com or call 800.344.1770. The graph and table above does not reflect the deduction of taxes that a shareholder would pay on distributions or sale of Fund shares. The performance shown does not reflect the deduction of a 2% redemption fee on shares held by an investor for 90 days or less and, if reflected, the fee would reduce the performance quoted. The Fund’s performance reflects Artisan Partners’ contractual agreement to limit the Fund’s expenses to no more than 1.25%, which has been in effect since the Fund’s inception and has had a material impact on performance, which would have been lower in its absence. Unlike the Index, the Fund may hold loans and other security types. At times, this can cause material differences in relative performance. See Notes on Management’s Discussion of Fund Performance and Portfolio Holdings’ Classification for a description of the index.
| | |
| 14 | | Artisan Partners Funds |
INVESTING ENVIRONMENT
During the twelve-month period ended September 30, 2015, the non-investment grade credit market experienced choppy market conditions. Risk aversion increased late in the period on signs of economic slowing in China, the world’s largest consumer of commodities. Driven in part by the declines in commodity prices, much of the pain was felt in the energy and metals/mining sectors.
PERFORMANCE DISCUSSION
During the twelve-month period ended September 30, 2015, Artisan High Income Fund – Investor Shares advanced 1.73% and Artisan High Income Fund – Advisor Shares advanced 1.88%, outperforming the BofA Merrill Lynch U.S. High Yield Master II Index, which declined 3.57% over the same period.
Performance of the following holdings had a positive impact on the portfolio during the period: Renaissance Learning, Inc.; Roofing Supply Group LLC/Roofing Supply Finance, Inc.; WP Mustang Holdings LLC; Zebra Technologies Corp.; and Ascend Learning LLC.
Performance of the following holdings had a negative impact on the portfolio during the period: RGL Reservoir Operations, Inc.; Midstates Petroleum Co., Inc./Midstates Petroleum Co. LLC; Warren Resources, Inc.; Paramount Resources Ltd.; and York Risk Services Holding Corp.
PORTFOLIO COMPOSITION
| | | | | | | | |
| Type | | 9/30/2014 | | | 9/30/2015 | |
Corporate Bonds | | | 67.4 | | | | 73.2 | |
Bank Loans | | | 28.3 | | | | 21.0 | |
Cash and Equivalents | | | 4.3 | | | | 5.8 | |
PORTFOLIO CHANGES
We identified several new investment opportunities for the portfolio during the period, including VEREIT, Inc., Charter Communications, Inc., Callon Petroleum Co., Range Resources Corp. and National Financial Partners Corp. We funded these purchases in part by selling our positions in CCO Holdings LLC/CCO Holdings Capital Corp., Anna Merger Sub, Inc., Zebra Technologies Corp., Rayonier AM Products, Inc. and Play Topco S.A.
| | |
| Artisan Partners Funds | | 15 |
ARTISAN INTERNATIONAL FUND
INVESTMENT PROCESS HIGHLIGHTS
Artisan International Fund employs a fundamental stock selection process focused on identifying long-term growth opportunities to build a portfolio of non-U.S. growth companies of all market capitalizations. The investment team seeks to invest in companies within its preferred themes with sustainable growth characteristics at attractive valuations that do not fully reflect their long-term potential.
Themes. The team identifies long-term secular growth trends with the objective of investing in companies that have meaningful exposure to these trends. The team’s fundamental analysis focuses on those industry leaders with attractive growth and valuation characteristics that will be long-term beneficiaries any structural change and/or trend.
Sustainable Growth. The team applies a fundamental approach to identifying the long-term, sustainable growth characteristics of potential investments. The team seeks high-quality companies that typically have a sustainable competitive advantage, a superior business model and a high-quality management team.
Valuation. The team uses multiple valuation metrics to establish a target price range. The team assesses the relationship between its estimate of a company’s sustainable growth prospects and its current valuation.
PERFORMANCE HISTORY
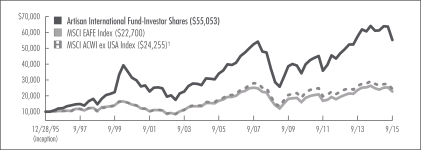
GROWTH OF AN ASSUMED $10,000 INVESTMENT (12/28/1995 to 9/30/2015)
AVERAGE ANNUAL TOTAL RETURNS (as of 9/30/2015)
| | | | | | | | | | | | | | | | | | | | |
| Fund / Index | | 1-Year | | | 3-Year | | | 5-Year | | | 10-Year | | | Since
Inception | |
Artisan International Fund – Investor Shares (12/28/1995) | | | -9.55 | % | | | 5.64 | % | | | 6.66 | % | | | 4.92 | % | | | 9.02 | % |
Artisan International Fund – Institutional Shares (7/1/1997) | | | -9.34 | | | | 5.87 | | | | 6.90 | | | | 5.16 | | | | 7.78 | |
Artisan International Fund – Advisor Shares (4/1/2015) | | | n/a | | | | n/a | | | | n/a | | | | n/a | | | | -13.60 | (1) |
MSCI EAFE Index | | | -8.66 | | | | 5.63 | | | | 3.98 | | | | 2.97 | | | | 4.24 | * |
MSCI ACWI ex USA Index† | | | -12.16 | | | | 2.34 | | | | 1.82 | | | | 3.03 | | | | 4.59 | * |
| (1) | For the period from commencement of operations 4/1/2015 through 9/30/2015; not annualized. |
| * | As of Investor Shares inception date. |
| † | The performance of the Index represents linked performance data for the MSCI ACWI ex USA (Gross) Index from inception to 12/31/2000 and the MSCI ACWI ex USA (Net) Index from 1/1/2001 forward. |
The performance quoted represents past performance, which does not guarantee future results. The investment return and principal value of an investment in the Fund will fluctuate, so that an investor’s shares in the Fund, when redeemed, may be worth more or less than their original cost. Current performance may be lower or higher than the performance data quoted. For current to most recent month-end performance, visit www.artisanpartners.com or call 800.344.1770. The graph and table above do not reflect the deduction of taxes that a shareholder would pay on distributions or sale of Fund shares. The performance shown does not reflect the deduction of a 2% redemption fee on shares held by an investor for 90 days or less and, if reflected, the fee would reduce the performance quoted. See Notes on Management’s Discussion of Fund Performance and Portfolio Holdings’ Classification for a description of each index.
| | |
| 16 | | Artisan Partners Funds |
INVESTING ENVIRONMENT
For the twelve-month period ended September 30, 2015, the MSCI EAFE Index was up 0.80% in local currency terms, but down 8.66% in USD terms as an appreciating USD served as a headwind for USD-based investors. Volatility increased in the later part of the period, partly on fears over slowing growth in China and the Federal Reserve’s decision to maintain historically low interest rates.
SECTOR DIVERSIFICATION
| | | | | | | | |
| Sector | | 9/30/2014 | | | 9/30/2015 | |
Consumer Discretionary | | | 15.6 | % | | | 21.2 | % |
Consumer Staples | | | 12.0 | | | | 10.0 | |
Energy | | | 1.9 | | | | — | |
Financials | | | 5.7 | | | | 12.3 | |
Health Care | | | 16.5 | | | | 19.3 | |
Industrials | | | 17.4 | | | | 9.9 | |
Information Technology | | | 11.8 | | | | 12.5 | |
Materials | | | 7.9 | | | | 8.0 | |
Telecommunication Services | | | 7.1 | | | | 3.1 | |
Utilities | | | — | | | | 0.1 | |
Other assets less liabilities | | | 4.1 | | | | 3.6 | |
| | | | 100.0 | % | | | 100.0 | % |
PERFORMANCE DISCUSSION
During the twelve-month period ended September 30, 2015, Artisan International Fund – Investor Shares declined 9.55% and Artisan International Fund – Institutional Shares declined 9.34%, underperforming the MSCI EAFE Index and outperforming the MSCI All Country World ex USA Index, which declined 8.66% and 12.16%, respectively over the same period. During the period April 1, 2015 through September 30, 2015, Artisan International Fund – Advisor Shares declined 13.60%, underperforming the MSCI EAFE Index and the MSCI All Country World ex USA Index, which declined 9.81% and 11.98%, respectively, over the same period.
Performance of the following stocks had a positive impact on the portfolio during the period: US health care products developer Covidien plc; US IT service provider Cognizant Technology Solutions Corp.; Ireland-based discount airline Ryanair Holdings plc; UK chemical manufacturer Croda International plc; and Chinese telecom services provider China Mobile Ltd.
Notable detractors included: Chinese Internet company Baidu, Inc.; Japanese heavy machinery manufacturer IHI Corp.; Mexican media company Grupo Televisa S.A.B.; German car manufacturer Porsche Automobil Holding SE; and US medical products company Medtronic plc.
REGION ALLOCATION
| | | | | | | | |
| Region | | 9/30/2014 | | | 9/30/2015 | |
Europe | | | 51.7 | % | | | 56.4 | % |
Americas | | | 7.9 | | | | 16.2 | |
Emerging Markets | | | 16.3 | | | | 12.8 | |
Pacific Basin | | | 20.0 | | | | 11.0 | |
PORTFOLIO CHANGES
We identified several new investment opportunities for the portfolio during the period, including US vehicle components manufacturer Delphi Automotive plc; UK transportation service provider International Consolidated Airlines Group S.A.; UK financial services provider Lloyds Banking Group plc; UK cruise ship company Carnival plc; Swiss pharmaceutical and consumer healthcare products manufacturer Novartis AG. We funded these purchases in part by selling our positions in Rolls-Royce Holdings plc, China Mobile Ltd., SABMiller plc, SoftBank Group Corp. and Sands China Ltd.
| | |
| Artisan Partners Funds | | 17 |
ARTISAN INTERNATIONAL SMALL CAP FUND
INVESTMENT PROCESS HIGHLIGHTS
Artisan International Small Cap Fund employs a fundamental stock selection process focused on identifying long-term growth opportunities to build a portfolio of small non-U.S. growth companies. The investment team seeks to invest in companies within its preferred themes with sustainable growth characteristics at attractive valuations that do not fully reflect their long-term potential.
Themes. The team identifies long-term secular growth trends with the objective of investing in companies that have meaningful exposure to these trends. The team’s fundamental analysis focuses on those industry leaders with attractive growth and valuation characteristics that will be long-term beneficiaries of any structural change and/or trend.
Sustainable Growth. The team applies a fundamental approach to identifying the long-term, sustainable growth characteristics of potential investments. The team seeks high-quality companies that typically have a sustainable competitive advantage, a superior business model and a high-quality management team.
Valuation. The team uses multiple valuation metrics to establish a target price range. The team assesses the relationship between its estimate of a company’s sustainable growth prospects and its current valuation.
PERFORMANCE HISTORY
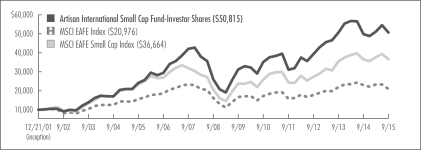
GROWTH OF AN ASSUMED $10,000 INVESTMENT (12/21/2001 to 9/30/2015)
AVERAGE ANNUAL TOTAL RETURNS (as of 9/30/2015)
| | | | | | | | | | | | | | | | | | | | |
| Fund / Index | | 1-Year | | | 3-Year | | | 5-Year | | | 10-Year | | | Since
Inception | |
Artisan International Small Cap Fund – Investor Shares (12/21/2001) | | | 2.02 | % | | | 8.83 | % | | | 7.61 | % | | | 7.70 | % | | | 12.53 | % |
MSCI EAFE Index | | | -8.66 | | | | 5.63 | | | | 3.98 | | | | 2.97 | | | | 5.52 | * |
MSCI EAFE Small Cap Index | | | 0.30 | | | | 10.17 | | | | 7.30 | | | | 4.65 | | | | 9.89 | * |
| * | As of Investor Shares inception date. |
The performance quoted represents past performance, which does not guarantee future results. The investment return and principal value of an investment in the Fund will fluctuate, so that an investor’s shares in the Fund, when redeemed, may be worth more or less than their original cost. Current performance may be lower or higher than the performance data quoted. For current to most recent month-end performance, visit www.artisanpartners.com or call 800.344.1770. The graph and table above do not reflect the deduction of taxes that a shareholder would pay on distributions or sale of Fund shares. The performance shown does not reflect the deduction of a 2% redemption fee on shares held by an investor for 90 days or less and, if reflected, the fee would reduce the performance quoted. See Notes on Management’s Discussion of Fund Performance and Portfolio Holdings’ Classification for a description of each index.
| | |
| 18 | | Artisan Partners Funds |
INVESTING ENVIRONMENT
For the twelve-month period ended September 30, 2015, the MSCI EAFE Small Cap Index was up 10.91% in local currency terms, but up just 0.30% in USD terms as an appreciating USD served as a headwind for USD-based investors. Volatility increased in the later part of the period, partly on fears over slowing growth in China and the Federal Reserve’s decision to maintain historically low interest rates. Overall, small-cap stocks outpaced large-cap stocks. Within the small-cap universe, emerging markets significantly trailed developed markets.
SECTOR DIVERSIFICATION
| | | | | | | | |
| Sector | | 9/30/2014 | | | 9/30/2015 | |
Consumer Discretionary | | | 9.2 | % | | | 7.4 | % |
Consumer Staples | | | 15.7 | | | | 12.6 | |
Financials | | | 4.7 | | | | 2.1 | |
Health Care | | | 10.9 | | | | 12.8 | |
Industrials | | | 20.6 | | | | 17.0 | |
Information Technology | | | 12.9 | | | | 18.5 | |
Materials | | | 5.7 | | | | 4.3 | |
Telecommunication Services | | | — | | | | 7.6 | |
Utilities | | | 11.0 | | | | 8.9 | |
Other assets less liabilities | | | 9.3 | | | | 8.8 | |
| | | | 100.0 | % | | | 100.0 | % |
PERFORMANCE DISCUSSION
During the twelve-month period ended September 30, 2015, Artisan International Small Cap Fund – Investor Shares gained 2.02%, outperforming the MSCI EAFE Small Cap and MSCI EAFE Indices, which gained 0.30% and declined 8.66%, respectively, over the same period.
Performance of the following stocks had a positive impact on the portfolio during the period: German Internet payment company Wirecard AG; Chinese pediatric nutrition company Biostime International Holdings Ltd.; Irish nutritional products company Glanbia plc; UK hospital outsourcing company Synergy Health plc; and Swiss laboratory equipment provider Tecan Group AG.
Notable detractors included: Chinese gas utility company China Oil & Gas Group Ltd.; Taiwanese contact lens manufacturer Ginko International Co., Ltd.; Singapore-based confectionary products producer Petra Foods Ltd.; UK engineering outsourcing company Babcock International Group plc; and Brazilian fast food restaurant operator International Meal Co. Holdings S.A.
REGION ALLOCATION
| | | | | | | | |
| Region | | 9/30/2014 | | | 9/30/2015 | |
Europe | | | 45.1 | % | | | 64.7 | % |
Emerging Markets | | | 37.2 | | | | 23.2 | |
Pacific Basin | | | 4.3 | | | | 2.1 | |
Americas | | | 4.1 | | | | 1.2 | |
PORTFOLIO CHANGES
We identified several new investment opportunities for the portfolio during the period, including Italian electronic communications infrastructure company Infrastrutture Wireless Italiane S.p.A.; Italian broadcast tower operator Ei Towers S.p.A.; French linen and uniform rental company Elis S.A.; Spanish pharmaceutical company Almirall S.A.; and Spanish wireless telecommunications infrastructure provider Cellnex Telecom SAU. We funded these purchases in part by selling our positions in Cembra Money Bank AG, Eurofins Scientific SE, S-1 Corp., Yingde Gases Group Co., Ltd. and Barratt Developments plc.
| | |
| Artisan Partners Funds | | 19 |
ARTISAN INTERNATIONAL VALUE FUND
INVESTMENT PROCESS HIGHLIGHTS
Artisan International Value Fund employs a fundamental investment process to construct a diversified portfolio of securities of undervalued non-U.S. companies of all sizes. The investment team seeks to invest in what it considers to be high-quality, undervalued companies with strong balance sheets and shareholder-oriented management teams. The team’s investment process focuses on four key characteristics:
Undervaluation. Determining the intrinsic value of a business is the heart of the team’s research process. The team believes that intrinsic value represents the amount that a buyer would pay to own a company’s future cash flows. The team seeks to invest at a significant discount to its estimate of the intrinsic value of a business.
Business Quality. The team seeks to invest in companies with histories of generating strong free cash flow, improving returns on capital and strong competitive positions in their industries.
Financial Strength. The team believes that investing in companies with strong balance sheets helps to reduce the potential for capital risk and provides company management the ability to build value when attractive opportunities are available.
Shareholder-Oriented Management. The team’s research process attempts to identify management teams with a history of building value for shareholders.
PERFORMANCE HISTORY
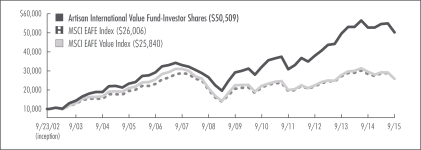
GROWTH OF AN ASSUMED $10,000 INVESTMENT (9/23/2002 to 9/30/2015)
AVERAGE ANNUAL TOTAL RETURNS (as of 9/30/2015)
| | | | | | | | | | | | | | | | | | | | |
| Fund / Index | | 1-Year | | | 3-Year | | | 5-Year | | | 10-Year | | | Since
Inception | |
Artisan International Value Fund – Investor Shares (9/23/2002) | | | -4.67 | % | | | 9.89 | % | | | 9.39 | % | | | 8.03 | % | | | 13.25 | % |
Artisan International Value Fund – Institutional Shares (10/1/2006) | | | -4.44 | | | | 10.12 | | | | 9.60 | | | | n/a | | | | 6.47 | |
Artisan International Value Fund – Advisor Shares (4/1/2015) | | | n/a | | | | n/a | | | | n/a | | | | n/a | | | | -8.10 | (1) |
MSCI EAFE Index | | | -8.66 | | | | 5.63 | | | | 3.98 | | | | 2.97 | | | | 7.62 | * |
MSCI EAFE Value Index | | | -12.60 | | | | 4.69 | | | | 3.06 | | | | 2.07 | | | | 7.56 | * |
| (1) | For the period from commencement of operations 4/1/2015 through 9/30/2015, not annualized. |
| * | As of Investor Shares inception date. |
The performance quoted represents past performance, which does not guarantee future results. The investment return and principal value of an investment in the Fund will fluctuate, so that an investor’s shares in the Fund, when redeemed, may be worth more or less than their original cost. Current performance may be lower or higher than the performance data quoted. For current to most recent month-end performance, visit www.artisanpartners.com or call 800.344.1770. The graph and table above do not reflect the deduction of taxes that a shareholder would pay on distributions or sale of Fund shares. The performance shown does not reflect the deduction of a 2% redemption fee on shares held by an investor for 90 days or less and, if reflected, the fee would reduce the performance quoted. See Notes on Management’s Discussion of Fund Performance and Portfolio Holdings’ Classification for a description of each index.
| | |
| 20 | | Artisan Partners Funds |
INVESTING ENVIRONMENT
Global equity markets declined during the third quarter of 2015, dragging returns into negative territory for the twelve-month period ended September 30, 2015. Numerous factors contributed to the decline including negative sentiment around the slowing global economy, particularly slowing growth in China. Amid these concerns, commodities prices and emerging markets currencies fell. Meanwhile, the US dollar strengthened throughout the year, which was a headwind for US dollar-based investors.
SECTOR DIVERSIFICATION
| | | | | | | | |
| Sector | | 9/30/2014 | | | 9/30/2015 | |
Consumer Discretionary | | | 15.6 | % | | | 15.0 | % |
Consumer Staples | | | 10.8 | | | | 8.8 | |
Energy | | | 5.6 | | | | 3.5 | |
Financials | | | 20.9 | | | | 24.4 | |
Health Care | | | 7.2 | | | | 5.4 | |
Industrials | | | 9.3 | | | | 13.2 | |
Information Technology | | | 15.4 | | | | 14.2 | |
Materials | | | 1.2 | | | | — | |
Telecommunication Services | | | 1.0 | | | | 1.8 | |
Other assets less liabilities | | | 13.0 | | | | 13.7 | |
| | | | 100.0 | % | | | 100.0 | % |
PERFORMANCE DISCUSSION
During the twelve-month period ended September 30, 2015, Artisan International Value Fund – Investor Shares declined 4.67% and Artisan International Value Fund – Institutional Shares declined 4.44%, outperforming the MSCI EAFE and MSCI EAFE Value Indices, which declined 8.66% and 12.60%, respectively, over the same period. During the period April 1, 2015 through September 30, 2015, Artisan International Value Fund – Advisor Shares declined 8.10%, outperforming the MSCI EAFE and MSCI EAFE Value Indices, which declined 9.81% and 11.75%, respectively, over the same period.
Performance of the following stocks had a positive impact on the portfolio during the period: US insurance and re-insurance company Arch Capital Group Ltd.; US health care products developer Covidien plc; US electronic components provider TE Connectivity Ltd.; Denmark-based facility services provider ISS AS; and French television channel operator Societe Television Francaise 1.
Notable detractors included: Chinese Internet company Baidu, Inc.; Norwegian oil and gas services and equipment company Aker Solutions ASA; UK-based retail and commercial banking franchise Royal Bank of Scotland Group plc; Canadian energy company Imperial Oil Ltd.; and Brazilian telecommunications company Telefonica Brasil S.A.
REGION ALLOCATION
| | | | | | | | |
| Region | | 9/30/2014 | | | 9/30/2015 | |
Europe | | | 52.2 | % | | | 55.7 | % |
Americas | | | 20.3 | | | | 14.9 | |
Emerging Markets | | | 8.0 | | | | 10.8 | |
Pacific Basin | | | 6.5 | | | | 4.9 | |
PORTFOLIO CHANGES
We identified several new investment opportunities for the portfolio during the period, including Swiss financial services provider UBS Group AG; Brazilian telecommunications company Telefonica Brasil S.A.; UK consulting and engineering company Amec Foster Wheeler plc; and Chinese education services provider New Oriental Education & Technology Group, Inc. We funded these purchases in part by selling our positions in Applied Materials, Inc., Aon plc, Societe Television Francaise 1, Alent plc and Nifco, Inc.
| | |
| Artisan Partners Funds | | 21 |
ARTISAN MID CAP FUND
INVESTMENT PROCESS HIGHLIGHTS
Artisan Mid Cap Fund employs a fundamental investment process to construct a diversified portfolio of U.S. mid-cap growth companies. The Fund’s investment team seeks to invest in companies that it believes possess franchise characteristics, are benefiting from an accelerating profit cycle and are trading at a discount to its estimate of private market value. The Fund’s investment process focuses on two distinct elements – security selection and capital allocation. The team overlays its investment process with broad knowledge of the global economy.
Security Selection. The team seeks to identify companies that have franchise characteristics (e.g. low cost production capability, possession of a proprietary asset, dominant market share or a defensible brand name), are benefiting from an accelerating profit cycle and are trading at a discount to its estimate of private market value. The team looks for companies that are well positioned for long-term growth, which is driven by demand for their products and services at an early enough stage in their profit cycle to benefit from the increased cash flows produced by the emerging profit cycle.
Capital Allocation. Based on the investment team’s fundamental analysis of a company’s profit cycle, it divides the portfolio into three parts. GardenSM investments are small positions in the early part of their profit cycle that will warrant more sizeable allocations as their profit cycle accelerates. CropSM investments are positions that are being increased to a full weight because the team believes they are moving through the strongest part of their profit cycles. HarvestSM investments are positions that are being reduced as they near the team’s estimates of full valuation or their profit cycles begin to decelerate.
Broad Knowledge. The team overlays the security selection and capital allocation elements of its investment process with a desire to invest opportunistically across the entire global economy. The team seeks broad knowledge of the global economy in order to position it to find growth wherever it occurs.
PERFORMANCE HISTORY
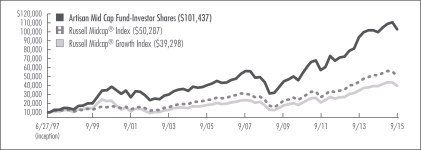
GROWTH OF AN ASSUMED $10,000 INVESTMENT (6/27/1997 to 9/30/2015)
AVERAGE ANNUAL TOTAL RETURNS (as of 9/30/2015)
| | | | | | | | | | | | | | | | | | | | |
| Fund / Index | | 1-Year | | | 3-Year | | | 5-Year | | | 10-Year | | | Since
Inception | |
Artisan Mid Cap Fund – Investor Shares (6/27/1997) | | | 3.20 | % | | | 12.91 | % | | | 13.58 | % | | | 9.81 | % | | | 13.53 | % |
Artisan Mid Cap Fund – Institutional Shares (7/1/2000) | | | 3.45 | | | | 13.20 | | | | 13.88 | | | | 10.10 | | | | 7.64 | |
Artisan Mid Cap Fund – Advisor Shares (4/1/2015) | | | n/a | | | | n/a | | | | n/a | | | | n/a | | | | -5.16 | (1) |
Russell Midcap® Index | | | -0.25 | | | | 13.91 | | | | 13.40 | | | | 7.87 | | | | 9.25 | * |
Russell Midcap® Growth Index | | | 1.45 | | | | 13.98 | | | | 13.58 | | | | 8.09 | | | | 7.78 | * |
| (1) | For the period from commencement of operations 4/1/2015 through 9/30/2015; not annualized. |
| * | As of Investor Shares inception date. |
The performance quoted represents past performance, which does not guarantee future results. The investment return and principal value of an investment in the Fund will fluctuate, so that an investor’s shares in the Fund, when redeemed, may be worth more or less than their original cost. Current performance may be lower or higher than the performance data quoted. For current to most recent month-end performance, visit www.artisanpartners.com or call 800.344.1770. The graph and table above do not reflect the deduction of taxes that a shareholder would pay on distributions or sale of Fund shares. See Notes on Management’s Discussion of Fund Performance and Portfolio Holdings’ Classification for a description of each index.
| | |
| 22 | | Artisan Partners Funds |
INVESTING ENVIRONMENT
During the twelve-month period ended September 30, 2015, equity markets in the US were relatively flat in spite of heightened volatility that resulted from economic growth concerns in China and uncertainty around when the US Federal Reserve would raise interest rates from their record lows. Growth-oriented stocks advanced across all market capitalizations, though mid-caps trailed their small- and large-cap counterparts.
SECTOR DIVERSIFICATION
| | | | | | | | |
| Sector | | 9/30/2014 | | | 9/30/2015 | |
Consumer Discretionary | | | 19.3 | % | | | 20.8 | % |
Consumer Staples | | | 2.4 | | | | 2.4 | |
Energy | | | 3.7 | | | | 1.7 | |
Financials | | | 6.1 | | | | 6.4 | |
Health Care | | | 21.4 | | | | 23.7 | |
Industrials | | | 18.5 | | | | 16.8 | |
Information Technology | | | 23.8 | | | | 20.8 | |
Materials | | | — | | | | 1.3 | |
Telecommunication Services | | | 0.8 | | | | 1.0 | |
Other assets less liabilities | | | 4.0 | | | | 5.1 | |
| | | | 100.0 | % | | | 100.0 | % |
PERFORMANCE DISCUSSION
During the twelve-month period ended September 30, 2015, Artisan Mid Cap Fund – Investor Shares gained 3.20% and Artisan Mid Cap Fund – Institutional Shares gained 3.45%, outperforming the Russell Midcap® Growth and Russell Midcap® Indices, which gained 1.45% and declined 0.25%, respectively, over the same period. During the period April 1, 2015 through September 30, 2015, Artisan Mid Cap Fund – Advisor Shares declined 5.16%, outperforming the Russell Midcap® Growth and Russell Midcap® Indices, which declined 8.61% and 9.09%, respectively, over the same period.
Performance of the following stocks had a positive impact on the portfolio during the period: video game publisher Electronic Arts, Inc.; biopharmaceutical firm Regeneron Pharmaceuticals, Inc.; biopharmaceutical firm Incyte Corp.; health insurance provider Cigna Corp.; and biopharmaceutical firm Isis Pharmaceuticals, Inc.
Notable detractors included: onshore oil and natural gas exploration and production company Noble Energy, Inc.; US specialty coffee and coffee-brewer provider Keurig Green Mountain, Inc.; multimedia messaging service Twitter, Inc.; US semiconductor equipment provider Applied Materials, Inc.; and retail grocery store operator Sprouts Farmers Markets, Inc.
PORTFOLIO CHANGES
We identified several new investment opportunities for the portfolio during the period, including electronic transaction processing provider Global Payments, Inc.; multi-industry company Textron, Inc.; medical device manufacturer Boston Scientific Corp.; global medical technology company Becton Dickinson & Co.; and US network security company Palo Alto Networks, Inc. We funded these purchases in part by selling our positions in Discover Financial Services, Concur Technologies, Inc., Noble Energy, Inc., Keurig Green Mountain, Inc. and Cabela’s, Inc.
| | |
| Artisan Partners Funds | | 23 |
ARTISAN MID CAP VALUE FUND
INVESTMENT PROCESS HIGHLIGHTS
Artisan Mid Cap Value Fund employs a fundamental investment process to construct a diversified portfolio of medium-sized U.S. companies. The investment team seeks to invest in companies that are undervalued, in solid financial condition and have attractive business economics. The team believes that companies with these characteristics are less likely to experience eroding values over the long term.
Attractive Valuation. The team values a business using what it believes are reasonable expectations for the long-term earnings power and capitalization rates of that business. This results in a range of values for the company that the team believes would be reasonable. The team generally will purchase a security if the stock price falls below or toward the lower end of that range.
Sound Financial Condition. The team prefers companies with an acceptable level of debt and positive cash flow. At a minimum, the team seeks to avoid companies that have so much debt that management may be unable to make decisions that would be in the best interests of the companies’ shareholders.
Attractive Business Economics. The team favors cash-producing businesses that it believes are capable of earning acceptable returns on capital over the company’s business cycle.
PERFORMANCE HISTORY
GROWTH OF AN ASSUMED $10,000 INVESTMENT (3/28/2001 to 9/30/2015)
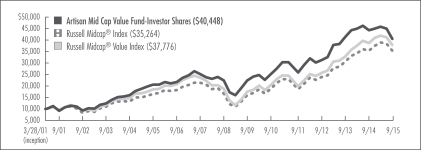
AVERAGE ANNUAL TOTAL RETURNS (as of 9/30/2015)
| | | | | | | | | | | | | | | | | | | | |
| Fund / Index | | 1-Year | | | 3-Year | | | 5-Year | | | 10-Year | | | Since
Inception | |
Artisan Mid Cap Value Fund – Investor Shares (3/28/2001) | | | -8.45 | % | | | 8.91 | % | | | 9.95 | % | | | 7.02 | % | | | 10.11 | % |
Artisan Mid Cap Value Fund – Institutional Shares (2/1/2012) | | | -8.25 | | | | 9.16 | | | | n/a | | | | n/a | | | | 7.75 | |
Artisan Mid Cap Value Fund – Advisor Shares (4/1/2015) | | | n/a | | | | n/a | | | | n/a | | | | n/a | | | | -11.50 | (1) |
Russell Midcap® Index | | | -0.25 | | | | 13.91 | | | | 13.40 | | | | 7.87 | | | | 9.07 | * |
Russell Midcap® Value Index | | | -2.07 | | | | 13.69 | | | | 13.15 | | | | 7.42 | | | | 9.59 | * |
| (1) | For the period from commencement of operations 4/1/2015 through 9/30/2015; not annualized. |
| * | As of Investor Shares inception date. |
The performance quoted represents past performance, which does not guarantee future results. The investment return and principal value of an investment in the Fund will fluctuate, so that an investor’s shares in the Fund, when redeemed, may be worth more or less than their original cost. Current performance may be lower or higher than the performance data quoted. For current to most recent month-end performance, visit www.artisanpartners.com or call 800.344.1770. The graph and table above do not reflect the deduction of taxes that a shareholder would pay on distributions or sale of Fund shares. See Notes on Management’s Discussion of Fund Performance and Portfolio Holdings’ Classification for a description of each index.
| | |
| 24 | | Artisan Partners Funds |
INVESTING ENVIRONMENT
During the twelve-month period ended September 30, 2015, stocks in the US traded sideways for the most part. Concerns surrounding slowing growth in China, the world’s second-largest economy, weighed on markets around the globe. Investors also continued to wait for clarity on when the US Federal Reserve would eventually raise interest rates. Growth stocks in the US ended the period in positive territory. Value stocks not only trailed but traded downward – small-cap stocks fared best during the period with mid-caps and large-caps trailing.
SECTOR DIVERSIFICATION
| | | | | | | | |
| Sector | | 9/30/2014 | | | 9/30/2015 | |
Consumer Discretionary | | | 13.5 | % | | | 17.6 | % |
Consumer Staples | | | 3.2 | | | | 1.5 | |
Energy | | | 10.5 | | | | 6.2 | |
Financials | | | 21.8 | | | | 24.6 | |
Healthcare | | | 3.2 | | | | — | |
Industrials | | | 12.7 | | | | 14.7 | |
Information Technology | | | 21.6 | | | | 17.0 | |
Materials | | | 1.0 | | | | 7.5 | |
Utilities | | | 4.9 | | | | 5.1 | |
Other assets less liabilities | | | 7.6 | | | | 5.8 | |
| | | | 100.0 | % | | | 100.00 | % |
PERFORMANCE DISCUSSION
During the twelve-month period ended September 30, 2015, Artisan Mid Cap Value Fund – Investor Shares declined 8.45% and Artisan Mid Cap Value Fund – Institutional Shares declined 8.25%, underperforming the Russell Midcap® and Russell Midcap® Value Indices, which declined 0.25% and 2.07%, respectively, over the same period. During the period April 1, 2015 through September 30, 2015, Artisan Mid Cap Value Fund – Advisor Shares declined 11.50%, underperforming the Russell Midcap® and Russell Midcap® Value Indices, which declined 9.09% and 9.61%, respectively, over the same period.
Performance of the following stocks had a positive impact on the portfolio during the period: health insurance provider Cigna Corp.; food retailer Kroger Co.; insurance and re-insurance company Arch Capital Group Ltd.; semiconductor company Analog Devices, Inc.; and tax preparation company H&R Block, Inc.
Notable detractors included: oil and gas producer Denbury Resources, Inc.; mining equipment manufacturer Joy Global, Inc.; oil and gas exploration and production company SM Energy Co.; natural gas exploration and production company Southwestern Energy Co.; and offshore driller Ensco plc.
PORTFOLIO CHANGES
We identified several new investment opportunities for the portfolio during the period, including chemicals producer Celanese Corp.; motorcycle manufacturer and marketer Harley-Davidson, Inc.; specialty contracting service provider Quanta Services, Inc.; video and Internet commerce business Liberty Interactive Corp.; and network and cable television broadcaster Liberty Ventures. We funded these purchases in part by selling our positions in Cigna Corp., Lam Research Corp., Ensco plc, Xcel Energy, Inc. and Patterson-UTI Energy, Inc.
| | |
| Artisan Partners Funds | | 25 |
ARTISAN SMALL CAP FUND
INVESTMENT PROCESS HIGHLIGHTS
Artisan Small Cap Fund employs a fundamental investment process to construct a diversified portfolio of U.S. small-cap growth companies. The Fund’s investment team seeks to invest in companies that it believes possess franchise characteristics, are benefiting from an accelerating profit cycle and are trading at a discount to its estimate of private market value. The Fund’s investment process focuses on two distinct elements – security selection and capital allocation. The team overlays its investment process with broad knowledge of the global economy.
Security Selection. The team seeks to identify companies that have franchise characteristics (e.g. low cost production capability, possession of a proprietary asset, dominant market share or a defensible brand name), are benefiting from an accelerating profit cycle and are trading at a discount to its estimate of private market value. The team looks for companies that are well positioned for long-term growth, which is driven by demand for their products and services at an early enough stage in their profit cycle to benefit from the increased cash flows produced by the emerging profit cycle.
Capital Allocation. Based on the investment team’s fundamental analysis of a company’s profit cycle, it divides the portfolio into three parts. GardenSM investments are small positions in the early part of their profit cycle that will warrant more sizeable allocations as their profit cycle accelerates. CropSM investments are positions that are being increased to a full weight because the team believes they are moving through the strongest part of their profit cycles. HarvestSM investments are positions that are being reduced as they near the team’s estimates of full valuation or their profit cycles begin to decelerate.
Broad Knowledge. The team overlays the security selection and capital allocation elements of its investment process with a desire to invest opportunistically across the entire global economy. The team seeks broad knowledge of the global economy in order to position it to find growth wherever it occurs.
PERFORMANCE HISTORY
GROWTH OF AN ASSUMED $10,000 INVESTMENT (3/28/1995 to 9/30/2015)
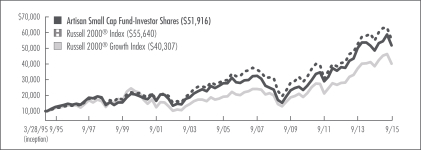
AVERAGE ANNUAL TOTAL RETURNS (as of 9/30/2015)
| | | | | | | | | | | | | | | | | | | | |
| Fund / Index | | 1-Year | | | 3-Year | | | 5-Year | | | 10-Year | | | Since
Inception | |
Artisan Small Cap Fund – Investor Shares (3/28/1995) | | | 6.69 | % | | | 10.96 | % | | | 14.67 | % | | | 6.43 | % | | | 8.36 | % |
Artisan Small Cap Fund – Institutional Shares (5/7/2012) | | | 6.96 | | | | 11.19 | | | | n/a | | | | n/a | | | | 11.86 | |
Russell 2000® Index | | | 1.25 | | | | 11.02 | | | | 11.73 | | | | 6.55 | | | | 8.73 | * |
Russell 2000® Growth Index | | | 4.04 | | | | 12.85 | | | | 13.26 | | | | 7.67 | | | | 7.03 | * |
| * | As of Investor Shares inception date. |
The performance quoted represents past performance, which does not guarantee future results. The investment return and principal value of an investment in the Fund will fluctuate, so that an investor’s shares in the Fund, when redeemed, may be worth more or less than their original cost. Current performance may be lower or higher than the performance data quoted. For current to most recent month-end performance, visit www.artisanpartners.com or call 800.344.1770. The graph and table above do not reflect the deduction of taxes that a shareholder would pay on distributions or sale of Fund shares. See Notes on Management’s Discussion of Fund Performance and Portfolio Holdings’ Classification for a description of each index.
| | |
| 26 | | Artisan Partners Funds |
INVESTING ENVIRONMENT
During the twelve-month period ended September 30, 2015, equity markets in the US were relatively flat in spite of heightened volatility that resulted from economic growth concerns in China and uncertainty around when the US Federal Reserve would raise interest rates from their record lows. Growth-oriented stocks advanced across all market capitalizations, though mid-caps trailed their small- and large-cap counterparts.
SECTOR DIVERSIFICATION
| | | | | | | | |
| Sector | | 9/30/2014 | | | 9/30/2015 | |
Consumer Discretionary | | | 17.2 | % | | | 14.9 | % |
Consumer Staples | | | 1.1 | | | | 1.0 | |
Energy | | | 3.5 | | | | 1.4 | |
Health Care | | | 21.0 | | | | 22.6 | |
Industrials | | | 16.5 | | | | 16.9 | |
Information Technology | | | 35.8 | | | | 38.1 | |
Other assets less liabilities | | | 4.9 | | | | 5.1 | |
| | | | 100.0 | % | | | 100.0 | % |
PERFORMANCE DISCUSSION
During the twelve-month period ended September 30, 2015, Artisan Small Cap Fund – Investor Shares gained 6.69% and Artisan Small Cap Fund – Institutional Shares gained 6.96%, outperforming the Russell 2000® Growth and Russell 2000® Indices, which gained 4.04% and 1.25%, respectively, over the same period.
Performance of the following stocks had a positive impact on the portfolio during the period: medical device firm DexCom, Inc.; lighting fixture supplier Acuity Brands, Inc.; biopharmaceutical firm Incyte Corp.; biopharmaceutical firm Isis Pharmaceuticals, Inc.; information management solutions and services provider Tyler Technologies, Inc.
Notable detractors included: exploratory oil and gas company Oasis Petroleum, Inc.; branded footwear and accessories marketer Deckers Outdoor Corp.; energy exploration and production firm Rosetta Resources, Inc.; identity theft protection services provider LifeLock, Inc.; and Internet radio company Pandora Media, Inc.
PORTFOLIO CHANGES
We identified several new investment opportunities for the portfolio during the period, including child-care and early-education center provider Bright Horizons Family Solutions, Inc.; software solutions provider to the non-profit industry Blackbaud, Inc.; technology solutions provider John Bean Technologies Corp.; health care outsourcing provider Team Health Holdings, Inc.; and cloud based virtual banking provider Q2 Holdings, Inc. We funded these purchases in part by selling our positions in Concur Technologies, Inc., Bruker Corp., Beacon Roofing Supply, Inc., Advisory Board Co. and Rosetta Resources, Inc.
| | |
| Artisan Partners Funds | | 27 |
ARTISAN SMALL CAP VALUE FUND
INVESTMENT PROCESS HIGHLIGHTS
Artisan Small Cap Value Fund employs a fundamental investment process to construct a diversified portfolio of small-cap U.S. companies. The team seeks to invest in companies that are undervalued, in solid financial condition and have attractive business economics. The team believes that companies with these characteristics are less likely to experience eroding values over the long term.
Attractive Valuation. The team values a business using what it believes are reasonable expectations for the long-term earnings power and capitalization rates of that business. This results in a range of values for the company that the team believes would be reasonable. The team generally will purchase a security if the stock price falls below or toward the lower end of that range.
Sound Financial Condition. The team prefers companies with an acceptable level of debt and positive cash flow. At a minimum, the team seeks to avoid companies that have so much debt that management may be unable to make decisions that would be in the best interest of the companies’ shareholders.
Attractive Business Economics. The team favors cash-producing businesses that it believes are capable of earning acceptable returns on capital over the company’s business cycle.
PERFORMANCE HISTORY
GROWTH OF AN ASSUMED $10,000 INVESTMENT (9/29/1997 to 9/30/2015)
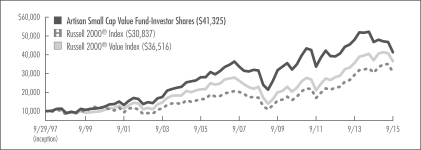
AVERAGE ANNUAL TOTAL RETURNS (as of 9/30/2015)
| | | | | | | | | | | | | | | | | | | | |
| Fund / Index | | 1-Year | | | 3-Year | | | 5-Year | | | 10-Year | | | Since
Inception | |
Artisan Small Cap Value Fund – Investor Shares (9/29/1997) | | | -11.76 | % | | | 1.75 | % | | | 3.43 | % | | | 3.93 | | | | 8.20 | % |
Artisan Small Cap Value Fund – Institutional Shares (2/1/2012) | | | -11.59 | | | | 1.98 | | | | n/a | | | | n/a | | | | 0.04 | |
Russell 2000® Index | | | 1.25 | | | | 11.02 | | | | 11.73 | | | | 6.55 | | | | 6.46 | * |
Russell 2000® Value Index | | | -1.60 | | | | 9.18 | | | | 10.17 | | | | 5.35 | | | | 7.46 | * |
| * | As of Investor Shares inception date. |
The performance quoted represents past performance, which does not guarantee future results. The investment return and principal value of an investment in the Fund will fluctuate, so that an investor’s shares in the Fund, when redeemed, may be worth more or less than their original cost. Current performance may be lower or higher than the performance data quoted. For current to most recent month-end performance, visit www.artisanpartners.com or call 800.344.1770. The graph and table above do not reflect the deduction of taxes that a shareholder would pay on distributions or sale of Fund shares. See Notes on Management’s Discussion of Fund Performance and Portfolio Holdings’ Classification for a description of each index.
| | |
| 28 | | Artisan Partners Funds |
INVESTING ENVIRONMENT
During the twelve-month period ended September 30, 2015, stocks in the US traded sideways for the most part. Concerns surrounding slowing growth in China, the world’s second-largest economy, weighed on markets around the globe. Investors also continued to wait for clarity on when the US Federal Reserve would eventually raise interest rates. Growth stocks in the US ended the period in positive territory. Value stocks not only trailed but traded downward – small-cap stocks fared best during the period with mid-caps and large-caps trailing.
SECTOR DIVERSIFICATION
| | | | | | | | |
| Sector | | 9/30/2014 | | | 9/30/2015 | |
Consumer Discretionary | | | 6.5 | % | | | 7.5 | % |
Consumer Staples | | | 3.2 | | | | 3.1 | |
Energy | | | 17.1 | | | | 7.8 | |
Financials | | | 9.9 | | | | 16.8 | |
Health Care | | | 3.0 | | | | 2.1 | |
Industrials | | | 24.3 | | | | 32.9 | |
Information Technology | | | 18.4 | | | | 16.4 | |
Materials | | | 8.4 | | | | 6.4 | |
Telecommunication Services | | | 1.2 | | | | 1.2 | |
Utilities | | | 0.1 | | | | 1.2 | |
Other assets less liabilities | | | 7.9 | | | | 4.6 | |
| | | | 100.0 | % | | | 100.0 | % |
PERFORMANCE DISCUSSION
During the twelve-month period ended September 30, 2015, Artisan Small Cap Value Fund – Investor Shares declined 11.76% and Artisan Small Cap Value Fund – Institutional Shares declined 11.59%, underperforming the Russell 2000® and Russell 2000® Value Indices, which gained 1.25% and declined 1.60%, respectively, over the same period.
Performance of the following stocks had a positive impact on the portfolio during the period: network and communications provider EarthLink Holdings Corp.; business intelligence software provider MicroStrategy, Inc.; heating, ventilation and air conditioning provider Comfort Systems USA, Inc.; mechanical and electrical construction and facilities firm EMCOR Group, Inc.; and telecommunications services provider Atlantic Tele-Network, Inc.
Notable detractors included: oil and gas producer Unit Corp.; specialty cellulose fibers producer Rayonier Advanced Materials, Inc.; coal producer Cloud Peak Energy Inc.; offshore energy services company Gulfmark Offshore, Inc.; and environmental service provider Newpark Resources, Inc.
PORTFOLIO CHANGES
We identified several new investment opportunities for the portfolio during the period, including aircraft leasing company Air Lease Corp.; bearings manufacturer Timken Co.; metal products manufacturer Valmont Industries, Inc.; tank barge operator Kirby Corp.; and business development company Capital Southwest Corp. We funded these purchases in part by selling our positions in Tidewater, Inc., Gulfmark Offshore, Inc., Progress Software Corp., Schnitzer Steel Industries, Inc. and Approach Resources, Inc.
| | |
| Artisan Partners Funds | | 29 |
ARTISAN VALUE FUND
INVESTMENT PROCESS HIGHLIGHTS
Artisan Value Fund employs a fundamental investment process to construct a diversified portfolio of equity securities across a broad capitalization range. The team seeks to invest in companies that are undervalued, in solid financial condition and have attractive business economics. The team believes that companies with these characteristics are less likely to experience eroding values over the long term.
Attractive Valuation. The team values a business using what it believes are reasonable expectations for the long-term earnings power and capitalization rates of that business. This results in a range of values for the company that the team believes would be reasonable. The team generally will purchase a security if the stock price falls below or toward the lower end of that range.
Sound Financial Condition. The team prefers companies with an acceptable level of debt and positive cash flow. At a minimum, the team seeks to avoid companies that have so much debt that management may be unable to make decisions that would be in the best interest of the companies’ shareholders.
Attractive Business Economics. The team favors cash-producing businesses that it believes are capable of earning acceptable returns on capital over the company’s business cycle.
PERFORMANCE HISTORY
GROWTH OF AN ASSUMED $10,000 INVESTMENT (3/27/2006 to 9/30/2015)
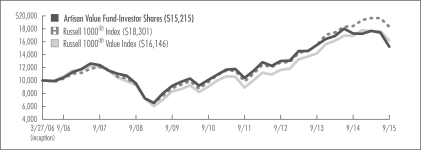
AVERAGE ANNUAL TOTAL RETURNS (as of 9/30/2015)
| | | | | | | | | | | | | | | | |
| Fund / Index | | 1-Year | | | 3-Year | | | 5-Year | | | Since
Inception | |
Artisan Value Fund – Investor Shares (3/27/2006) | | | -11.90 | % | | | 5.34 | % | | | 8.61 | % | | | 4.51 | % |
Artisan Value Fund – Institutional Shares (7/26/2011) | | | -11.69 | | | | 5.64 | | | | n/a | | | | 5.97 | |
Artisan Value Fund – Advisor Shares (4/1/2015) | | | n/a | | | | n/a | | | | n/a | | | | -13.72 | (1) |
Russell 1000® Index | | | -0.61 | | | | 12.66 | | | | 13.42 | | | | 6.56 | * |
Russell 1000® Value Index | | | -4.42 | | | | 11.59 | | | | 12.29 | | | | 5.17 | * |
| (1) | For the period from commencement of operations 4/1/2015 through 9/30/2015; not annualized. |
| * | As of Investor Shares inception date. |
The performance quoted represents past performance, which does not guarantee future results. The investment return and principal value of an investment in the Fund will fluctuate, so that an investor’s shares in the Fund, when redeemed, may be worth more or less than their original cost. Current performance may be lower or higher than the performance data quoted. For current to most recent month-end performance, visit www.artisanpartners.com or call 800.344.1770. The graph and table above do not reflect the deduction of taxes that a shareholder would pay on distributions or sale of Fund shares. See Notes on Management’s Discussion of Fund Performance and Portfolio Holdings’ Classification for a description of each index.
| | |
| 30 | | Artisan Partners Funds |
INVESTING ENVIRONMENT
During the twelve-month period ended September 30, 2015, stocks in the US traded sideways for the most part. Concerns surrounding slowing growth in China, the world’s second-largest economy, weighed on markets around the globe. Investors also continued to wait for clarity on when the US Federal Reserve would eventually raise interest rates. Growth stocks in the US ended the period in positive territory. Value stocks not only trailed but traded downward – small-cap stocks fared best during the period with mid-caps and large-caps trailing.
SECTOR DIVERSIFICATION
| | | | | | | | |
| Sector | | 9/30/2014 | | | 9/30/2015 | |
Consumer Discretionary | | | 4.9 | % | | | 5.5 | % |
Consumer Staples | | | 4.7 | | | | — | |
Energy | | | 16.1 | | | | 13.4 | |
Financials | | | 20.3 | | | | 24.2 | |
Health Care | | | 6.1 | | | | 1.3 | |
Industrials | | | 2.3 | | | | 12.4 | |
Information Technology | | | 27.9 | | | | 26.6 | |
Materials | | | 9.3 | | | | 12.4 | |
Telecommunication Services | | | — | | | | 2.0 | |
Other assets less liabilities | | | 8.4 | | | | 2.2 | |
| | | | 100.0 | % | | | 100.0 | % |
PERFORMANCE DISCUSSION
During the twelve-month period ended September 30, 2015, Artisan Value Fund – Investor Shares declined 11.90% and Artisan Value Fund – Institutional Shares declined 11.69%, underperforming the Russell 1000® and Russell 1000® Value Indices, which declined 0.61% and 4.42%, respectively, over the same period. During the period April 1, 2015 through September 30, 2015, Artisan Value Fund – Advisor Shares declined 13.72%, underperforming the Russell 1000® and Russell 1000® Value, which declined 6.36% and 7.96%, respectively, over the same period.
Performance of the following stocks had a positive impact on the portfolio during the period: health insurance provider Cigna Corp.; US property and casualty insurance provider Chubb Corp.; consumer electronics company Apple, Inc.; global technology company Google, Inc.; and insurance and re-insurance company Arch Capital Group Ltd.
Notable detractors included: oil and gas producer Denbury Resources, Inc.; mining equipment manufacturer Joy Global, Inc.; oil and gas exploration and production company Apache Corp.; oil and gas exploration and production company Devon Energy Corp.; and gold producer Goldcorp, Inc.
REGION ALLOCATION
| | | | | | | | |
| Region | | 9/30/2014 | | | 9/30/2015 | |
Americas | | | 81.4 | % | | | 87.7 | % |
Emerging Markets | | | 4.6 | | | | 5.6 | |
Europe | | | 5.6 | | | | 2.5 | |
Pacific Basin | | | — | | | | 2.0 | |
PORTFOLIO CHANGES
We identified several new investment opportunities for the portfolio during the period, including construction services provider Jacobs Engineering Group, Inc.; multimedia company CBS Corp.; diversified financial services provider Citigroup, Inc.; mining equipment manufacturer Joy Global, Inc.; and metal products manufacturer Precision Castparts Corp. We funded these purchases in part by selling our positions in Cigna Corp., Noble Corp. plc, National Oilwell Varco, Inc., Kroger Co. and Wal-Mart Stores, Inc.
| | |
| Artisan Partners Funds | | 31 |
ARTISAN DEVELOPING WORLD FUND
Schedule of Investments – September 30, 2015
Dollar values in thousands
| | | | | | | | |
| | | Shares
Held | | | Value | |
| COMMON STOCKS AND EQUITY-LINKED SECURITIES - 89.0% | | | | | | | | |
| | | | | | | | |
| BRAZIL - 4.3% | | | | | | | | |
BB Seguridade Participacoes S.A. | | | 354,100 | | | $ | 2,216 | |
Cielo S.A. | | | 188,231 | | | | 1,740 | |
Kroton Educacional S.A. | | | 613,900 | | | | 1,194 | |
| | | | | | | | |
| | | | | | | 5,150 | |
| CHINA - 14.7% | | | | | | | | |
Alibaba Group Holding Ltd. (DR)(1) | | | 37,560 | | | | 2,215 | |
Baidu, Inc. (DR)(1) | | | 19,551 | | | | 2,686 | |
China Life Insurance Co., Ltd., Class H(2) | | | 803,000 | | | | 2,803 | |
Kweichow Moutai Co., Ltd., Class A(2) | | | 71,793 | | | | 2,160 | |
Sinopharm Group Co., Ltd., Class H(2) | | | 735,200 | | | | 2,591 | |
Tencent Holdings Ltd.(2) | | | 297,700 | | | | 5,015 | |
| | | | | | | | |
| | | | | | | 17,470 | |
| EGYPT - 1.5% | | | | | | | | |
Commercial International Bank Egypt S.A.E.(2) | | | 264,517 | | | | 1,779 | |
| | | | | | | | |
| HONG KONG - 5.9% | | | | | | | | |
AIA Group Ltd.(2) | | | 960,400 | | | | 5,000 | |
Sands China Ltd.(2) | | | 666,400 | | | | 2,023 | |
| | | | | | | | |
| | | | | | | 7,023 | |
| INDIA - 11.6% | | | | | | | | |
Asian Paints Ltd.(2) | | | 89,847 | | | | 1,154 | |
Bharti Infratel Ltd.(2) | | | 403,336 | | | | 2,189 | |
Dish TV India Ltd.(1)(2) | | | 1,550,798 | | | | 2,522 | |
Eicher Motors Ltd.(2) | | | 3,925 | | | | 1,067 | |
HDFC Bank Ltd. (DR) | | | 85,209 | | | | 5,205 | |
Sun Pharmaceutical Industries Ltd.(2) | | | 122,109 | | | | 1,625 | |
| | | | | | | | |
| | | | | | | 13,762 | |
| INDONESIA - 2.7% | | | | | | | | |
Bank Mandiri Persero Tbk PT(2) | | | 3,855,000 | | | | 2,092 | |
Matahari Department Store Tbk PT(2) | | | 949,700 | | | | 1,046 | |
| | | | | | | | |
| | | | | | | 3,138 | |
| KOREA - 2.0% | | | | | | | | |
SK Hynix, Inc.(2) | | | 83,015 | | | | 2,372 | |
| | | | | | | | |
| MALAYSIA - 0.5% | | | | | | | | |
My EG Services Bhd(2) | | | 909,100 | | | | 583 | |
| | | | | | | | |
| MEXICO - 3.8% | | | | | | | | |
Alsea S.A.B. de C.V. | | | 205,700 | | | | 607 | |
Grupo Lala S.A.B. de C.V. | | | 484,100 | | | | 1,145 | |
Grupo Televisa S.A.B. (DR) | | | 106,418 | | | | 2,769 | |
| | | | | | | | |
| | | | | | | 4,521 | |
| NETHERLANDS - 3.1% | | | | | | | | |
Unilever N.V. (DR)(2) | | | 92,407 | | | | 3,719 | |
| | | | | | | | |
| PANAMA - 0.5% | | | | | | | | |
Copa Holdings S.A., Class A(3) | | | 14,118 | | | | 592 | |
| | | | | | | | |
| PERU - 2.6% | | | | | | | | |
Credicorp Ltd. | | | 29,161 | | | | 3,102 | |
| | | | | | | | |
| PHILIPPINES - 1.0% | | | | | | | | |
Universal Robina Corp.(2) | | | 271,440 | | | | 1,117 | |
| | | | | | | | |
| RUSSIA - 4.6% | | | | | | | | |
Magnit PJSC (DR)(2) | | | 77,147 | | | | 3,693 | |
QIWI plc (DR) | | | 74,972 | | | | 1,209 | |
Yandex N.V., Class A(1) | | | 55,432 | | | | 595 | |
| | | | | | | | |
| | | | | | | 5,497 | |
| SAUDI ARABIA - 1.7% | | | | | | | | |
Al Tayyar Travel Group, Equity-Linked Security(2)(4)(5) | | | 99,191 | | | | 2,025 | |
| | | | | | | | |
| SOUTH AFRICA - 2.7% | | | | | | | | |
Clicks Group Ltd.(2) | | | 183,772 | | | | 1,192 | |
Mr Price Group Ltd.(2) | | | 143,737 | | | | 2,006 | |
| | | | | | | | |
| | | | | | | 3,198 | |
| SWEDEN - 2.0% | | | | | | | | |
Hexagon AB, Class B(2) | | | 75,851 | | | | 2,321 | |
| | | | | | | | |
| TAIWAN - 4.4% | | | | | | | | |
Eclat Textile Co., Ltd.(2) | | | 35,000 | | | | 554 | |
Largan Precision Co., Ltd.(2) | | | 20,000 | | | | 1,570 | |
Taiwan Semiconductor Manufacturing Co., Ltd. (DR) | | | 121,560 | | | | 2,522 | |
Tung Thih Electronic Co., Ltd.(2) | | | 91,000 | | | | 630 | |
| | | | | | | | |
| | | | | | | 5,276 | |
| THAILAND - 2.7% | | | | | | | | |
Airports of Thailand PCL(2) | | | 141,400 | | | | 1,095 | |
Siam Commercial Bank PCL(2) | | | 561,700 | | | | 2,081 | |
| | | | | | | | |
| | | | | | | 3,176 | |
| UNITED ARAB EMIRATES - 3.4% | | | | | | | | |
Emaar Properties PJSC(2) | | | 1,165,756 | | | | 2,053 | |
First Gulf Bank PJSC(2) | | | 530,083 | | | | 2,015 | |
| | | | | | | | |
| | | | | | | 4,068 | |
| UNITED KINGDOM - 2.8% | | | | | | | | |
Diageo plc(2) | | | 121,907 | | | | 3,281 | |
| | |
| 32 | | Artisan Partners Funds |
| | | | | | | | |
| | | Shares
Held | | | Value | |
| UNITED STATES - 10.5% | | | | | | | | |
Delphi Automotive plc | | | 34,841 | | | $ | 2,649 | |
EPAM Systems, Inc.(1) | | | 8,684 | | | | 647 | |
Facebook, Inc., Class A(1) | | | 26,890 | | | | 2,418 | |
Kansas City Southern | | | 26,475 | | | �� | 2,406 | |
MercadoLibre, Inc. | | | 13,747 | | | | 1,252 | |
Visa, Inc., Class A | | | 45,219 | | | | 3,150 | |
| | | | | | | | |
| | | | | | | 12,522 | |
| | | | | | | | |
Total common stocks and equity-linked securities
(Cost $114,460) | | | | | | | 105,692 | |
| | | Principal
Amount | | | | |
SHORT-TERM INVESTMENTS
(CASH EQUIVALENTS) - 11.0% | | | | | | | | |
Repurchase agreement with State Street Corporation, 0.00%, dated 9/30/15, due 10/1/15, maturity value $13,083
(Cost $13,083)(6) | | $ | 13,083 | | | $ | 13,083 | |
| | | | | | | | |
| | | | | | | | |
Total investments - 100.0%
(Cost $127,543) | | | | | | | 118,775 | |
| | | | | | | | |
Other assets less liabilities - 0.0%† | | | | | | | 56 | |
| | | | | | | | |
| | | | | | | | |
Total net assets - 100.0%(7) | | | | | | $ | 118,831 | |
| | | | | | | | |
| † | Amount rounds to less than 0.1%. |
| (1) | Non-income producing security. |
| (2) | Valued at a fair value in accordance with procedures established by the board of directors of Artisan Partners Funds. In total, securities valued at a fair value were $65,373, or 55.0% of total net assets. See notes 2(a) and 3 in Notes to Financial Statements for additional information. |
| (4) | Security is restricted. The security was acquired in a transaction pursuant to Rule 144A of the Securities Act of 1933 on the date or during the period noted below. The shares of the security may be resold in transactions exempt from registration to qualified institutional buyers. |
| | | | | | | | | | | | | | | | |
Security | | Acquisition
Date(s) | | | Cost | | | Value | | | Percentage
of Total
Net Assets | |
Al Tayyar Travel Group | |
| 7/9/2015-
9/30/2015 |
| | $ | 2,307 | | | $ | 2,025 | | | | 1.7 | % |
| (5) | Security is an equity-linked participation certificate issued by HSBC Bank plc. As described in 2(h) in Notes to Financial Statements, equity-linked participation certificates are subject to counterparty risk with respect to the bank or broker-dealer that issues them. |
| | | | | | | | | | | | |
Issuer | | Rate | | | Maturity | | | Value | |
U.S. Treasury Note | | | 2.500 | % | | | 8/15/2023 | | | $ | 13,345 | |
| (7) | Percentages for the various classifications relate to total net assets. |
Company names are as reported by a data service provider and in some cases are translations; a company’s legal name may be different.
(DR) Depositary Receipt, voting rights may vary.
| | | | | | | | |
| PORTFOLIO DIVERSIFICATION - September 30, 2015 | |
Dollar values in thousands | | | | | | | | |
| | | Value | | | Percentage
of Total
Investments | |
Consumer Discretionary | | $ | 18,025 | | | | 15.2 | % |
Consumer Staples | | | 16,307 | | | | 13.7 | |
Financials | | | 28,346 | | | | 23.9 | |
Health Care | | | 4,216 | | | | 3.6 | |
Industrials | | | 5,160 | | | | 4.3 | |
Information Technology | | | 30,295 | | | | 25.5 | |
Materials | | | 1,154 | | | | 1.0 | |
Telecommunication Services | | | 2,189 | | | | 1.8 | |
Short-term investments | | | 13,083 | | | | 11.0 | |
| | | | | | | | |
Total investments | | $ | 118,775 | | | | 100.0 | % |
| | | | | | | | |
| | | | | | | | |
| CURRENCY EXPOSURE - September 30, 2015 | |
Dollar values in thousands | | | | | | | | |
| | | Value | | | Percentage
of Total
Investments | |
Brazilian real | | $ | 5,150 | | | | 4.3 | % |
British pound | | | 3,281 | | | | 2.8 | |
Chinese Yuan renminbi | | | 2,160 | | | | 1.8 | |
Egyptian pound | | | 1,779 | | | | 1.5 | |
Euro | | | 3,719 | | | | 3.1 | |
Hong Kong dollar | | | 17,432 | | | | 14.7 | |
Indian rupee | | | 8,557 | | | | 7.2 | |
Indonesian rupiah | | | 3,138 | | | | 2.6 | |
Korean won | | | 2,372 | | | | 2.0 | |
Malaysian ringgit | | | 583 | | | | 0.5 | |
Mexican peso | | | 1,752 | | | | 1.5 | |
Philippine peso | | | 1,117 | | | | 0.9 | |
South African rand | | | 3,198 | | | | 2.7 | |
Swedish krona | | | 2,321 | | | | 2.0 | |
Taiwan dollar | | | 2,754 | | | | 2.3 | |
Thai baht | | | 3,176 | | | | 2.7 | |
U.S. dollar | | | 52,218 | | | | 44.0 | |
UAE dirham | | | 4,068 | | | | 3.4 | |
| | | | | | | | |
Total investments | | $ | 118,775 | | | | 100.0 | % |
| | | | | | | | |
| | |
| Artisan Partners Funds | | 33 |
| | | | | | |
| TOP TEN HOLDINGS - September 30, 2015 | |
Company Name | | Country | | Percentage
of Total
Net Assets | |
HDFC Bank Ltd. | | India | | | 4.4 | % |
Tencent Holdings Ltd. | | China | | | 4.2 | |
AIA Group Ltd. | | Hong Kong | | | 4.2 | |
Unilever N.V. | | Netherlands | | | 3.1 | |
Magnit PJSC | | Russia | | | 3.1 | |
Diageo plc | | United Kingdom | | | 2.8 | |
Visa, Inc. | | United States | | | 2.7 | |
Credicorp Ltd. | | Peru | | | 2.6 | |
China Life Insurance Co., Ltd. | | China | | | 2.3 | |
Grupo Televisa S.A.B. | | Mexico | | | 2.3 | |
| | | | | | |
Total | | | | | 31.7 | % |
| | | | | | |
For the purpose of determining the Fund’s top ten holdings, securities of the same issuer are aggregated to determine the weight in the Fund.
The accompanying notes are an integral part of the financial statements.
| | |
| 34 | | Artisan Partners Funds |
ARTISAN EMERGING MARKETS FUND
Schedule of Investments – September 30, 2015
Dollar values in thousands
| | | | | | | | |
| | | Shares
Held | | | Value | |
| COMMON STOCKS AND EQUITY-LINKED SECURITIES - 89.3% | | | | | | | | |
| | | | | | | | |
| ARGENTINA - 2.8% | | | | | | | | |
Grupo Financiero Galicia S.A. (DR) | | | 38,208 | | | $ | 681 | |
Pampa Energia S.A. (DR)(1) | | | 17,891 | | | | 273 | |
YPF S.A. (DR) | | | 32,005 | | | | 488 | |
| | | | | | | | |
| | | | | | | 1,442 | |
| BRAZIL - 4.0% | | | | | | | | |
BR Properties S.A. | | | 80,520 | | | | 217 | |
Cosan S.A. Industria e Comercio | | | 26,600 | | | | 135 | |
GAEC Educacao S.A.(2) | | | 65,800 | | | | 161 | |
Hypermarcas S.A.(1) | | | 95,538 | | | | 368 | |
Linx S.A. | | | 29,100 | | | | 323 | |
Petroleo Brasileiro S.A.(1) | | | 191,789 | | | | 413 | |
Vale S.A. | | | 92,913 | | | | 389 | |
| | | | | | | | |
| | | | | | | 2,006 | |
| CHILE - 1.9% | | | | | | | | |
Empresa Nacional de Telecomunicaciones S.A. | | | 32,938 | | | | 310 | |
SACI Falabella | | | 105,657 | | | | 655 | |
| | | | | | | | |
| | | | | | | 965 | |
| CHINA - 19.7% | | | | | | | | |
Ajisen China Holdings Ltd.(3) | | | 798,913 | | | | 358 | |
Alibaba Group Holding Ltd. (DR)(1) | | | 13,299 | | | | 784 | |
Baidu, Inc. (DR)(1) | | | 4,106 | | | | 564 | |
China High Precision Automation Group Ltd.(1)(3)(4) | | | 9,066,000 | | | | 73 | |
China Life Insurance Co., Ltd., Class H(3) | | | 196,800 | | | | 687 | |
China Petroleum & Chemical Corp., Class H(3) | | | 1,155,453 | | | | 714 | |
China Unicom Hong Kong Ltd.(3) | | | 407,500 | | | | 517 | |
Digital China Holdings Ltd.(3) | | | 737,460 | | | | 689 | |
GOME Electrical Appliances Holding Ltd.(3) | | | 2,670,288 | | | | 418 | |
Huabao International Holdings Ltd.(3) | | | 1,238,322 | | | | 391 | |
Mindray Medical International Ltd. (DR) | | | 9,298 | | | | 203 | |
Noah Holdings Ltd. (DR)(1) | | | 35,874 | | | | 843 | |
PW Medtech Group Ltd.(1)(3) | | | 1,005,000 | | | | 212 | |
Sino Biopharmaceutical Ltd.(3) | | | 560,000 | | | | 696 | |
Sinopharm Group Co., Ltd., Class H(3) | | | 218,900 | | | | 771 | |
Zhuzhou CSR Times Electric Co., Ltd., Class H(3) | | | 282,515 | | | | 2,108 | |
| | | | | | | | |
| | | | | | | 10,028 | |
| EGYPT - 0.8% | | | | | | | | |
Integrated Diagnostics Holdings plc(1)(3) | | | 64,457 | | | | 402 | |
| | | | | | | | |
| GREECE - 0.8% | | | | | | | | |
JUMBO S.A.(3) | | | 48,287 | | | | 425 | |
| | | | | | | | |
| HONG KONG - 1.5% | | | | | | | | |
AIA Group Ltd.(3) | | | 143,265 | | | | 746 | |
| | | | | | | | |
| INDIA - 10.4% | | | | | | | | |
Aurobindo Pharma Ltd.(3) | | | 98,894 | | | | 1,164 | |
Godrej Consumer Products Ltd.(3) | | | 23,344 | | | | 434 | |
Havells India Ltd.(3) | | | 65,967 | | | | 254 | |
ICICI Bank Ltd.(3) | | | 315,305 | | | | 1,300 | |
Kajaria Ceramics Ltd.(3) | | | 25,709 | | | | 313 | |
Reliance Industries Ltd.(3) | | | 67,349 | | | | 886 | |
Tata Motors Ltd.(1)(3) | | | 77,859 | | | | 355 | |
Tech Mahindra Ltd.(3) | | | 66,085 | | | | 565 | |
| | | | | | | | |
| | | | | | | 5,271 | |
| INDONESIA - 2.7% | | | | | | | | |
Astra International Tbk PT(3) | | | 1,071,470 | | | | 384 | |
Bank Negara Indonesia Persero Tbk PT(3) | | | 1,782,718 | | | | 505 | |
Indofood CBP Sukses Makmur Tbk PT(3) | | | 588,900 | | | | 500 | |
| | | | | | | | |
| | | | | | | 1,389 | |
| KAZAKHSTAN - 0.4% | | | | | | | | |
KCell JSC (DR)(3) | | | 36,739 | | | | 192 | |
| | | | | | | | |
| KENYA - 0.6% | | | | | | | | |
Safaricom Ltd.(3) | | | 2,192,400 | | | | 317 | |
| | | | | | | | |
| KOREA - 7.6% | | | | | | | | |
E-Mart Co., Ltd.(3) | | | 1,818 | | | | 354 | |
KB Financial Group, Inc.(3) | | | 29,524 | | | | 876 | |
Kia Motors Corp.(3) | | | 22,652 | | | | 1,028 | |
LG Chem Ltd.(3) | | | 2,117 | | | | 514 | |
Shinhan Financial Group Co., Ltd.(3) | | | 31,102 | | | | 1,087 | |
| | | | | | | | |
| | | | | | | 3,859 | |
| MALAYSIA - 0.5% | | | | | | | | |
AirAsia BHD(3) | | | 803,400 | | | | 235 | |
| | | | | | | | |
| MEXICO - 3.4% | | | | | | | | |
Alsea S.A.B. de C.V. | | | 184,752 | | | | 545 | |
Cemex S.A.B. de C.V., UNIT(1) | | | 544,919 | | | | 380 | |
Grupo Televisa S.A.B., Series CPO | | | 95,374 | | | | 497 | |
Infraestructura Energetica Nova S.A.B. de C.V. | | | 73,980 | | | | 303 | |
| | | | | | | | |
| | | | | | | 1,725 | |
| PAKISTAN - 0.8% | | | | | | | | |
Habib Bank Ltd., Equity-Linked Security(1)(3)(5)(6)(7) | | | 211,800 | | | | 400 | |
| | | | | | | | |
| PANAMA - 0.6% | | | | | | | | |
Copa Holdings S.A., Class A(7) | | | 6,868 | | | | 288 | |
| | |
| Artisan Partners Funds | | 35 |
| | | | | | | | |
| | | Shares
Held | | | Value | |
| PERU - 1.1% | | | | | | | | |
Credicorp Ltd. | | | 4,158 | | | $ | 442 | |
Grana y Montero S.A. (DR) | | | 31,946 | | | | 127 | |
| | | | | | | | |
| | | | | | | 569 | |
| POLAND - 0.8% | | | | | | | | |
Eurocash S.A.(3) | | | 33,004 | | | | 389 | |
| | | | | | | | |
| RUSSIA - 5.8% | | | | | | | | |
Lukoil PJSC (DR)(3) | | | 18,341 | | | | 624 | |
Magnit PJSC(1)(3) | | | 2,586 | | | | 460 | |
MMC Norilsk Nickel PJSC (DR)(3) | | | 36,486 | | | | 524 | |
Moscow Exchange MICEX-RTS PJSC(3) | | | 319,630 | | | | 392 | |
Sberbank of Russia(3) | | | 663,443 | | | | 767 | |
Yandex N.V., Class A(1) | | | 18,764 | | | | 201 | |
| | | | | | | | |
| | | | | | | 2,968 | |
| SOUTH AFRICA - 5.0% | | | | | | | | |
FirstRand Ltd.(3) | | | 152,591 | | | | 542 | |
Mota-Engil Africa N.V.(3) | | | 63,338 | | | | 252 | |
Naspers Ltd., Class N(3) | | | 10,407 | | | | 1,306 | |
Woolworths Holdings Ltd.(3) | | | 60,904 | | | | 426 | |
| | | | | | | | |
| | | | | | | 2,526 | |
| SWITZERLAND - 0.9% | | | | | | | | |
Dufry AG(1)(3) | | | 4,075 | | | | 478 | |
| | | | | | | | |
| TAIWAN - 11.2% | | | | | | | | |
CTBC Financial Holding Co., Ltd.(3) | | | 1,653,370 | | | | 853 | |
E Ink Holdings, Inc.(1)(3) | | | 490,000 | | | | 231 | |
Hon Hai Precision Industry Co., Ltd.(3) | | | 417,099 | | | | 1,091 | |
MediaTek, Inc.(3) | | | 95,794 | | | | 715 | |
Taiwan Fertilizer Co., Ltd.(3) | | | 192,000 | | | | 240 | |
Taiwan Semiconductor Manufacturing Co., Ltd.(3) | | | 642,647 | | | | 2,564 | |
| | | | | | | | |
| | | | | | | 5,694 | |
| THAILAND - 1.0% | | | | | | | | |
Bangkok Bank PCL (DR)(3) | | | 115,700 | | | | 511 | |
| | | | | | | | |
| TURKEY - 1.7% | | | | | | | | |
Ford Otomotiv Sanayi AS(3) | | | 42,945 | | | | 459 | |
Turkiye Sinai Kalkinma Bankasi AS(3) | | | 883,725 | | | | 412 | |
| | | | | | | | |
| | | | | | | 871 | |
| UNITED ARAB EMIRATES - 1.1% | | | | | | | | |
Emaar Malls Group PJSC(1)(3) | | | 650,879 | | | | 548 | |
| | | | | | | | |
| UNITED KINGDOM - 2.2% | | | | | | | | |
Al Noor Hospitals Group plc(3) | | | 45,134 | | | | 571 | |
Randgold Resources Ltd.(3) | | | 9,632 | | | | 567 | |
| | | | | | | | |
| | | | | | | 1,138 | |
| | | | | | | | |
Total common stocks and equity-linked securities
(Cost $50,315) | | | | | | | 45,382 | |
| | | | | | | | |
| PREFERRED STOCKS - 7.2% | | | | | | | | |
| | | | | | | | |
| BRAZIL - 1.1% | | | | | | | | |
Itau Unibanco Holding S.A.(7) | | | 84,205 | | | | 563 | |
| | | | | | | | |
| KOREA - 6.1% | | | | | | | | |
Samsung Electronics Co., Ltd.(3)(7) | | | 3,976 | | | | 3,098 | |
| | | | | | | | |
Total preferred stocks
(Cost $4,515) | | | | | | | 3,661 | |
| | | Principal
Amount | | | | |
| CONVERTIBLE DEBENTURES - 0.0%† | | | | | | | | |
| | | | | | | | |
| BRAZIL - 0.0%† | | | | | | | | |
PDG Realty S.A. Empreendimentos e Participacoes (0.0%, 9/19/16)(1)(3)(4) | | $ | 372 | | | $ | 1 | |
| | | | | | | | |
Total convertible debentures
(Cost $127) | | | | | | | 1 | |
| | | | | | | | |
| SHORT-TERM INVESTMENTS (CASH EQUIVALENTS) - 2.8% | | | | | | | | |
Repurchase agreement with Fixed Income Clearing Corporation, 0.00%, dated 9/30/15, due 10/1/15, maturity value $1,392
(Cost $1,392)(8) | | | 1,392 | | | | 1,392 | |
| | | | | | | | |
Total investments - 99.3%
(Cost $56,349) | | | | | | | 50,436 | |
| | | | | | | | |
Other assets less liabilities - 0.7% | | | | | | | 367 | |
| | | | | | | | |
| | | | | | | | |
Total net assets - 100.0%(9) | | | | | | $ | 50,803 | |
| | | | | | | | |
| † | Amount rounds to less than 0.1%. |
| (1) | Non-income producing security. |
| (2) | Security was acquired in a private placement. The shares are freely tradable outside the United States where the Fund expects to trade them. |
| | | | | | | | | | | | | | | | |
Security | | Acquisition
Date(s) | | | Cost | | | Value | | | Percentage
of Total
Net Assets | |
GAEC Educacao S.A. | |
| 10/25/2013-
8/6/2015 |
| | $ | 478 | | | $ | 161 | | | | 0.3 | % |
| (3) | Valued at a fair value in accordance with procedures established by the board of directors of Artisan Partners Funds. In total, securities valued at a fair value were $38,891, or 76.6% of total net assets. See notes 2(a) and 3 in Notes to Financial Statements for additional information. |
| (4) | Security has been deemed illiquid under procedures established by the board of directors of Artisan Partners Funds. In total, the value of securities deemed illiquid was $74, or 0.1% of total net assets. |
| | |
| 36 | | Artisan Partners Funds |
| (5) | Security is restricted. The security was acquired in a transaction pursuant to Rule 144A of the Securities Act of 1933 on the date or during the period noted below. The shares of the security may be resold in transactions exempt from registration to qualified institutional buyers. |
| | | | | | | | | | | | | | | | |
Security | | Acquisition
Date(s) | | | Cost | | | Value | | | Percentage
of Total
Net Assets | |
Habib Bank Ltd. | |
| 4/13/2015
8/6/2015 | -
| | $ | 358 | | | $ | 400 | | | | 0.8 | % |
| (6) | Security is an equity-linked participation certificate issued by Deutsche Bank AG London. As described in 2(h) in Notes to Financial Statements, equity-linked participation certificates are subject to counterparty risk with respect to the bank or broker-dealer that issues them. |
| | | | | | | | | | | | |
Issuer | | Rate | | | Maturity | | | Value | |
U.S. Treasury Note | | | 2.500 | % | | | 8/15/2023 | | | $ | 1,423 | |
| (9) | Percentages for the various classifications relate to total net assets. |
Company names are as reported by a data service provider and in some cases are translations; a company’s legal name may be different.
(DR) Depositary Receipt, voting rights may vary.
| | | | | | | | |
| PORTFOLIO DIVERSIFICATION - September 30, 2015 | |
Dollar values in thousands | | | | | | | | |
| | | Value | | | Percentage
of Total
Investments | |
Consumer Discretionary | | $ | 7,496 | | | | 14.9 | % |
Consumer Staples | | | 2,505 | | | | 5.0 | |
Energy | | | 3,260 | | | | 6.5 | |
Financials | | | 12,372 | | | | 24.5 | |
Health Care | | | 4,019 | | | | 8.0 | |
Industrials | | | 3,577 | | | | 7.1 | |
Information Technology | | | 10,898 | | | | 21.6 | |
Materials | | | 3,005 | | | | 5.9 | |
Telecommunication Services | | | 1,336 | | | | 2.6 | |
Utilities | | | 576 | | | | 1.1 | |
Short-term investments | | | 1,392 | | | | 2.8 | |
| | | | | | | | |
Total investments | | $ | 50,436 | | | | 100.0 | % |
| | | | | | | | |
| | | | | | | | |
| CURRENCY EXPOSURE - September 30, 2015 | |
Dollar values in thousands | | | | | | | | |
| | | Value | | | Percentage
of Total
Investments | |
Brazilian real | | $ | 2,570 | | | | 5.1 | % |
British pound | | | 1,138 | | | | 2.3 | |
Chilean peso | | | 965 | | | | 1.9 | |
Euro | | | 677 | | | | 1.3 | |
Hong Kong dollar | | | 8,380 | | | | 16.6 | |
Indian rupee | | | 5,271 | | | | 10.5 | |
Indonesian rupiah | | | 1,389 | | | | 2.8 | |
Kenyan shilling | | | 317 | | | | 0.6 | |
Korean won | | | 6,957 | | | | 13.8 | |
Malaysian ringgit | | | 235 | | | | 0.5 | |
Mexican peso | | | 1,725 | | | | 3.4 | |
Polish zloty | | | 389 | | | | 0.8 | |
South African rand | | | 2,274 | | | | 4.5 | |
Swiss franc | | | 478 | | | | 0.9 | |
Taiwan dollar | | | 5,694 | | | | 11.3 | |
Thai baht | | | 511 | | | | 1.0 | |
Turkish lira | | | 871 | | | | 1.7 | |
U.S. dollar | | | 10,047 | | | | 19.9 | |
UAE dirham | | | 548 | | | | 1.1 | |
| | | | | | | | |
Total investments | | $ | 50,436 | | | | 100.0 | % |
| | | | | | | | |
| | | | | | |
| TOP TEN HOLDINGS - September 30, 2015 | |
Company Name | | Country | | Percentage
of Total
Net Assets | |
Samsung Electronics Co., Ltd. | | Korea | | | 6.1 | % |
Taiwan Semiconductor Manufacturing Co., Ltd. | | Taiwan | | | 5.0 | |
Zhuzhou CSR Times Electric Co., Ltd. | | China | | | 4.1 | |
Naspers Ltd. | | South Africa | | | 2.6 | |
ICICI Bank Ltd. | | India | | | 2.6 | |
Aurobindo Pharma Ltd. | | India | | | 2.3 | |
Hon Hai Precision Industry Co., Ltd. | | Taiwan | | | 2.2 | |
Shinhan Financial Group Co., Ltd. | | Korea | | | 2.1 | |
Kia Motors Corp. | | Korea | | | 2.0 | |
Reliance Industries Ltd. | | India | | | 1.7 | |
| | | | | | |
Total | | | | | 30.7 | % |
| | | | | | |
For the purpose of determining the Fund’s top ten holdings, securities of the same issuer are aggregated to determine the weight in the Fund.
The accompanying notes are an integral part of the financial statements.
| | |
| Artisan Partners Funds | | 37 |
ARTISAN GLOBAL EQUITY FUND
Schedule of Investments – September 30, 2015
Dollar values in thousands
| | | | | | | | |
| | | Shares
Held | | | Value | |
| COMMON STOCKS - 96.6% | | | | | | | | |
| | | | | | | | |
| CHINA - 5.9% | | | | | | | | |
Baidu, Inc. (DR)(1) | | | 47,369 | | | $ | 6,509 | |
Beijing Enterprises Water Group Ltd.(1)(2) | | | 7,134,000 | | | | 5,044 | |
China Everbright International Ltd.(2) | | | 3,187,000 | | | | 4,517 | |
China Oil & Gas Group Ltd.(1)(2) | | | 23,840,000 | | | | 1,492 | |
| | | | | | | | |
| | | | | | | 17,562 | |
| FINLAND - 3.0% | | | | | | | | |
Huhtamaki Oyj(2) | | | 291,227 | | | | 8,907 | |
| | | | | | | | |
| FRANCE - 1.7% | | | | | | | | |
Elis S.A.(2) | | | 313,716 | | | | 4,891 | |
| | | | | | | | |
| GERMANY - 8.0% | | | | | | | | |
Bayer AG(2) | | | 26,446 | | | | 3,380 | |
CTS Eventim AG & Co., KGaA(2) | | | 150,847 | | | | 5,584 | |
Telefonica Deutschland Holding AG(2) | | | 904,408 | | | | 5,520 | |
Vonovia SE(2) | | | 137,693 | | | | 4,426 | |
Wirecard AG(2) | | | 98,055 | | | | 4,688 | |
| | | | | | | | |
| | | | | | | 23,598 | |
| HONG KONG - 1.9% | | | | | | | | |
AIA Group Ltd.(2) | | | 1,082,795 | | | | 5,638 | |
| | | | | | | | |
| INDIA - 2.0% | | | | | | | | |
Adani Ports & Special Economic Zone Ltd.(2) | | | 631,535 | | | | 2,887 | |
Housing Development Finance Corp. Ltd.(2) | | | 169,036 | | | | 3,130 | |
| | | | | | | | |
| | | | | | | 6,017 | |
| ITALY - 0.9% | | | | | | | | |
Mediaset S.p.A.(2) | | | 563,585 | | | | 2,598 | |
| | | | | | | | |
| JAPAN - 0.7% | | | | | | | | |
Nitori Holdings Co., Ltd.(2) | | | 9,778 | | | | 770 | |
Sumitomo Mitsui Financial Group, Inc.(2) | | | 33,000 | | | | 1,256 | |
| | | | | | | | |
| | | | | | | 2,026 | |
| MEXICO - 1.6% | | | | | | | | |
Grupo Televisa S.A.B. (DR) | | | 185,424 | | | | 4,825 | |
| | | | | | | | |
| NETHERLANDS - 1.8% | | | | | | | | |
ASML Holding N.V.(2) | | | 61,707 | | | | 5,410 | |
| | | | | | | | |
| SWITZERLAND - 4.7% | | | | | | | | |
Adecco S.A.(1)(2) | | | 51,592 | | | | 3,783 | |
Credit Suisse Group AG(1)(2) | | | 100,843 | | | | 2,426 | |
Nestle S.A.(2) | | | 31,239 | | | | 2,352 | |
Novartis AG(2) | | | 38,595 | | | | 3,555 | |
| SWITZERLAND (CONTINUED) | | | | | | | | |
Roche Holding AG(2)(3) | | | 6,861 | | | | 1,814 | |
| | | | | | | | |
| | | | | | | 13,930 | |
| TAIWAN - 2.7% | | | | | | | | |
Ginko International Co., Ltd.(2)(4) | | | 791,000 | | | | 8,008 | |
| | | | | | | | |
| UNITED KINGDOM - 3.8% | | | | | | | | |
Barclays plc(2) | | | 504,500 | | | | 1,865 | |
Carnival plc(2) | | | 68,557 | | | | 3,539 | |
Johnson Matthey plc(2) | | | 60,657 | | | | 2,253 | |
Lloyds Banking Group plc(2) | | | 3,268,110 | | | | 3,726 | |
| | | | | | | | |
| | | | | | | 11,383 | |
| UNITED STATES - 57.9% | | | | | | | | |
Advance Auto Parts, Inc. | | | 49,730 | | | | 9,425 | |
American Express Co. | | | 110,032 | | | | 8,157 | |
Celgene Corp.(1) | | | 51,607 | | | | 5,582 | |
Charter Communications, Inc., Class A(1) | | | 19,833 | | | | 3,488 | |
Cigna Corp. | | | 33,656 | | | | 4,544 | |
Citigroup, Inc. | | | 63,955 | | | | 3,173 | |
Cognizant Technology Solutions Corp., Class A(1) | | | 71,205 | | | | 4,458 | |
Comcast Corp., Class A | | | 171,159 | | | | 9,736 | |
Community Health Systems, Inc.(1) | | | 105,609 | | | | 4,517 | |
comScore, Inc.(1) | | | 31,610 | | | | 1,459 | |
CSX Corp. | | | 122,845 | | | | 3,305 | |
Delphi Automotive plc | | | 71,383 | | | | 5,428 | |
Dollar General Corp. | | | 41,857 | | | | 3,032 | |
Envision Healthcare Holdings, Inc.(1) | | | 161,820 | | | | 5,953 | |
Gilead Sciences, Inc. | | | 77,857 | | | | 7,645 | |
Google, Inc., Class A(1) | | | 5,898 | | | | 3,765 | |
Google, Inc., Class C(1)(3) | | | 11,395 | | | | 6,933 | |
Incyte Corp.(1) | | | 41,682 | | | | 4,599 | |
JPMorgan Chase & Co. | | | 121,802 | | | | 7,426 | |
Liberty Global plc LiLAC, Class A(1) | | | 1,677 | | | | 57 | |
Liberty Global plc LiLAC, Class C(1)(3) | | | 2,634 | | | | 90 | |
Liberty Global plc, Class A(1) | | | 79,524 | | | | 3,415 | |
Liberty Global plc, Series C(1)(3) | | | 97,657 | | | | 4,006 | |
MasterCard, Inc., Class A | | | 108,819 | | | | 9,807 | |
Medivation, Inc.(1) | | | 92,446 | | | | 3,929 | |
Medtronic plc | | | 155,018 | | | | 10,377 | |
Monster Beverage Corp.(1) | | | 13,537 | | | | 1,829 | |
Nektar Therapeutics(1) | | | 195,172 | | | | 2,139 | |
NewMarket Corp. | | | 1,878 | | | | 670 | |
Portola Pharmaceuticals, Inc.(1) | | | 64,547 | | | | 2,751 | |
Priceline Group, Inc.(1) | | | 3,434 | | | | 4,247 | |
PTC Therapeutics, Inc.(1) | | | 125,546 | | | | 3,352 | |
Royal Caribbean Cruises Ltd. | | | 27,764 | | | | 2,474 | |
Seattle Genetics, Inc.(1) | | | 73,339 | | | | 2,828 | |
| | |
| 38 | | Artisan Partners Funds |
| | | | | | | | |
| | | Shares
Held | | | Value | |
| UNITED STATES (CONTINUED) | | | | | | | | |
Tempur Sealy International, Inc.(1) | | | 77,005 | | | $ | 5,500 | |
Thermo Fisher Scientific, Inc. | | | 49,930 | | | | 6,105 | |
Vertex Pharmaceuticals, Inc.(1) | | | 24,729 | | | | 2,575 | |
VF Corp. | | | 40,952 | | | | 2,793 | |
| | | | | | | | |
| | | | | | | 171,569 | |
| | | | | | | | |
Total common stocks
(Cost $285,709) | | | | | | | 286,362 | |
| | | | | | | | |
| PREFERRED STOCKS - 0.5% | | | | | | | | |
| | | | | | | | |
| GERMANY - 0.5% | | | | | | | | |
Porsche Automobil Holding SE(2)(3) | | | 30,474 | | | | 1,297 | |
| | | | | | | | |
Total preferred stocks
(Cost $2,586) | | | | | | | 1,297 | |
| | | Principal
Amount | | | | |
| SHORT-TERM INVESTMENTS (CASH EQUIVALENTS) - 3.2% | | | | | | | | |
Repurchase agreement with Fixed Income Clearing Corporation, 0.00%, dated 9/30/15, due 10/1/15, maturity value $9,555
(Cost $9,555)(5) | | $ | 9,555 | | | $ | 9,555 | |
| | | | | | | | |
| | | | | | | | |
Total investments - 100.3%
(Cost $297,850) | | | | | | | 297,214 | |
| | | | | | | | |
Other assets less liabilities - (0.3)% | | | | | | | (834 | ) |
| | | | | | | | |
| | | | | | | | |
Total net assets - 100.0%(6) | | | | | | $ | 296,380 | |
| | | | | | | | |
| (1) | Non-income producing security. |
| (2) | Valued at a fair value in accordance with procedures established by the board of directors of Artisan Partners Funds. In total, securities valued at a fair value were $104,756, or 35.3% of total net assets. See notes 2(a) and 3 in Notes to Financial Statements for additional information. |
| (4) | Affiliated company as defined by the Investment Company Act of 1940, as amended. See note 11 in Notes to Financial Statements for additional information. |
| | | | | | | | | | | | |
Issuer | | Rate | | | Maturity | | | Value | |
U.S. Treasury Note | | | 2.500 | % | | | 8/15/2023 | | | $ | 9,751 | |
| (6) | Percentages for the various classifications relate to total net assets. |
Company names are as reported by a data service provider and in some cases are translations; a company’s legal name may be different.
(DR) Depositary Receipt, voting rights may vary.
| | | | | | | | |
| PORTFOLIO DIVERSIFICATION - September 30, 2015 | |
Dollar values in thousands | | | | | | | | |
| | | Value | | | Percentage
of Total
Investments | |
Consumer Discretionary | | $ | 72,304 | | | | 24.3 | % |
Consumer Staples | | | 4,181 | | | | 1.4 | |
Financials | | | 41,223 | | | | 13.9 | |
Health Care | | | 83,653 | | | | 28.1 | |
Industrials | | | 19,383 | | | | 6.5 | |
Information Technology | | | 43,029 | | | | 14.5 | |
Materials | | | 11,830 | | | | 4.0 | |
Telecommunication Services | | | 5,520 | | | | 1.9 | |
Utilities | | | 6,536 | | | | 2.2 | |
Short-term investments | | | 9,555 | | | | 3.2 | |
| | | | | | | | |
Total investments | | $ | 297,214 | | | | 100.0 | % |
| | | | | | | | |
| | | | | | | | |
| CURRENCY EXPOSURE - September 30, 2015 | |
Dollar values in thousands | | | | | | | | |
| | | Value | | | Percentage
of Total
Investments | |
British pound | | $ | 11,383 | | | | 3.8 | % |
Euro | | | 46,701 | | | | 15.7 | |
Hong Kong dollar | | | 16,691 | | | | 5.6 | |
Indian rupee | | | 6,017 | | | | 2.0 | |
Japanese yen | | | 2,026 | | | | 0.7 | |
Swiss franc | | | 13,930 | | | | 4.7 | |
Taiwan dollar | | | 8,008 | | | | 2.7 | |
U.S. dollar | | | 192,458 | | | | 64.8 | |
| | | | | | | | |
Total investments | | $ | 297,214 | | | | 100.0 | % |
| | | | | | | | |
| | | | | | |
| TOP TEN HOLDINGS - September 30, 2015 | |
Company Name | | Country | | Percentage
of Total
Net Assets | |
Google, Inc. | | United States | | | 3.6 | % |
Medtronic plc | | United States | | | 3.5 | |
MasterCard, Inc. | | United States | | | 3.3 | |
Comcast Corp. | | United States | | | 3.3 | |
Advance Auto Parts, Inc. | | United States | | | 3.2 | |
Huhtamaki Oyj | | Finland | | | 3.0 | |
American Express Co. | | United States | | | 2.8 | |
Ginko International Co., Ltd. | | Taiwan | | | 2.7 | |
Gilead Sciences, Inc. | | United States | | | 2.6 | |
Liberty Global plc | | United States | | | 2.6 | |
| | | | | | |
Total | | | | | 30.6 | % |
| | | | | | |
For the purpose of determining the Fund’s top ten holdings, securities of the same issuer are aggregated to determine the weight in the Fund.
The accompanying notes are an integral part of the financial statements.
| | |
| Artisan Partners Funds | | 39 |
ARTISAN GLOBAL OPPORTUNITIES FUND
Schedule of Investments – September 30, 2015
Dollar values in thousands
| | | | | | | | |
| | | Shares
Held | | | Value | |
| COMMON STOCKS - 92.1% | | | | | | | | |
| | | | | | | | |
| AUSTRALIA - 2.0% | | | | | | | | |
James Hardie Industries plc (DR)(1) | | | 2,293,243 | | | $ | 27,678 | |
| | | | | | | | |
| BRAZIL - 1.3% | | | | | | | | |
Raia Drogasil S.A. | | | 1,771,200 | | | | 17,469 | |
| | | | | | | | |
| CHINA - 3.3% | | | | | | | | |
Tencent Holdings Ltd.(1) | | | 2,654,300 | | | | 44,711 | |
| | | | | | | | |
| DENMARK - 2.9% | | | | | | | | |
Genmab AS(1)(2) | | | 435,555 | | | | 40,039 | |
| | | | | | | | |
| FRANCE - 1.8% | | | | | | | | |
Eurofins Scientific SE(1) | | | 80,978 | | | | 24,911 | |
| | | | | | | | |
| GERMANY - 3.4% | | | | | | | | |
Brenntag AG(1) | | | 442,264 | | | | 23,801 | |
Zalando SE(1)(2) | | | 657,339 | | | | 21,772 | |
| | | | | | | | |
| | | | | | | 45,573 | |
| HONG KONG - 0.9% | | | | | | | | |
Hong Kong Exchanges and Clearing Ltd.(1) | | | 551,177 | | | | 12,675 | |
| | | | | | | | |
| ITALY - 1.3% | | | | | | | | |
Moncler S.p.A.(1) | | | 948,674 | | | | 17,011 | |
| | | | | | | | |
| JAPAN - 7.4% | | | | | | | | |
FANUC Corp.(1) | | | 180,702 | | | | 27,859 | |
Harmonic Drive Systems, Inc.(1) | | | 637,182 | | | | 9,158 | |
Nintendo Co., Ltd.(1) | | | 153,042 | | | | 25,855 | |
Shiseido Co., Ltd.(1) | | | 1,080,122 | | | | 23,673 | |
Stanley Electric Co., Ltd.(1)(3) | | | 686,400 | | | | 13,750 | |
| | | | | | | | |
| | | | | | | 100,295 | |
| KOREA - 0.9% | | | | | | | | |
Amorepacific Corp.(1) | | | 36,672 | | | | 11,969 | |
| | | | | | | | |
| MEXICO - 1.5% | | | | | | | | |
Infraestructura Energetica Nova S.A.B. de C.V. | | | 4,962,135 | | | | 20,312 | |
| | | | | | | | |
| SWEDEN - 2.1% | | | | | | | | |
Electrolux AB, Class B(1) | | | 265,722 | | | | 7,518 | |
Hexagon AB, Class B(1) | | | 669,310 | | | | 20,484 | |
| | | | | | | | |
| | | | | | | 28,002 | |
| TAIWAN - 0.8% | | | | | | | | |
Hermes Microvision, Inc.(1) | | | 293,000 | | | | 11,205 | |
| UNITED KINGDOM - 9.6% | | | | | | | | |
ASOS plc(1)(2) | | | 444,744 | | | | 18,644 | |
Associated British Foods plc(1) | | | 296,675 | | | | 15,036 | |
Direct Line Insurance Group plc(1) | | | 7,668,630 | | | | 43,583 | |
Markit Ltd.(2) | | | 1,528,638 | | | | 44,331 | |
Weir Group plc(1) | | | 502,999 | | | | 8,922 | |
| | | | | | | | |
| | | | | | | 130,516 | |
| UNITED STATES - 52.9% | | | | | | | | |
Abbott Laboratories | | | 934,972 | | | | 37,605 | |
Adobe Systems, Inc.(2) | | | 336,902 | | | | 27,700 | |
Anadarko Petroleum Corp. | | | 131,989 | | | | 7,971 | |
Anthem, Inc. | | | 99,836 | | | | 13,977 | |
Apple, Inc. | | | 245,763 | | | | 27,108 | |
Biogen, Inc.(2) | | | 46,443 | | | | 13,552 | |
Chipotle Mexican Grill, Inc.(2) | | | 38,466 | | | | 27,705 | |
Electronic Arts, Inc.(2) | | | 590,478 | | | | 40,005 | |
EQT Corp. | | | 195,567 | | | | 12,667 | |
Facebook, Inc., Class A(2) | | | 619,599 | | | | 55,702 | |
Google, Inc., Class A(2) | | | 77,869 | | | | 49,709 | |
Google, Inc., Class C(2)(4) | | | 49,936 | | | | 30,382 | |
IHS, Inc., Class A(2)(3) | | | 581,487 | | | | 67,452 | |
Illumina, Inc.(2) | | | 208,364 | | | | 36,635 | |
LKQ Corp.(2) | | | 580,283 | | | | 16,457 | |
McGraw Hill Financial, Inc. | | | 433,047 | | | | 37,459 | |
Regeneron Pharmaceuticals, Inc.(2) | | | 126,161 | | | | 58,682 | |
Salesforce.com, Inc.(2) | | | 287,508 | | | | 19,962 | |
Starbucks Corp. | | | 500,719 | | | | 28,461 | |
Visa, Inc., Class A | | | 901,973 | | | | 62,831 | |
Walt Disney Co. | | | 273,307 | | | | 27,932 | |
Workday, Inc., Class A(2) | | | 251,241 | | | | 17,300 | |
| | | | | | | | |
| | | | | | | 717,254 | |
| | | | | | | | |
Total common stocks
(Cost $1,085,434) | | | | | | | 1,249,620 | |
| | | Principal
Amount | | | | |
| SHORT-TERM INVESTMENTS (CASH EQUIVALENTS) - 8.0% | | | | | | | | |
Repurchase agreement with Fixed Income Clearing Corporation, 0.00%, dated 9/30/15, due 10/1/15, maturity value $108,124
(Cost $108,124)(5) | | $ | 108,124 | | | $ | 108,124 | |
| | | | | | | | |
| | | | | | | | |
Total investments - 100.1% (Cost $1,193,558) | | | | | | | 1,357,744 | |
| | | | | | | | |
Other assets less liabilities - (0.1)% | | | | | | | (1,822 | ) |
| | | | | | | | |
| | | | | | | | |
Total net assets - 100.0%(6) | | | | | | $ | 1,355,922 | |
| | | | | | | | |
| | |
| 40 | | Artisan Partners Funds |
| (1) | Valued at a fair value in accordance with procedures established by the board of directors of Artisan Partners Funds. In total, securities valued at a fair value were $450,254, or 33.2% of total net assets. See notes 2(a) and 3 in Notes to Financial Statements for additional information. |
| (2) | Non-income producing security. |
| (3) | Affiliated company as defined by the Investment Company Act of 1940, as amended. See note 11 in Notes to Financial Statements for additional information. |
| | | | | | | | | | | | |
Issuer | | Rate | | | Maturity | | | Value | |
U.S. Treasury Note | | | 2.125 | % | | | 12/31/2021 | | | $ | 110,287 | |
| (6) | Percentages for the various classifications relate to total net assets. |
Company names are as reported by a data service provider and in some cases are translations; a company’s legal name may be different.
(DR) Depositary Receipt, voting rights may vary.
| | | | | | | | |
| PORTFOLIO DIVERSIFICATION - September 30, 2015 | |
Dollar values in thousands | |
| | | Value | | | Percentage
of Total
Investments | |
Consumer Discretionary | | $ | 223,581 | | | | 16.5 | % |
Consumer Staples | | | 68,147 | | | | 5.0 | |
Energy | | | 20,638 | | | | 1.5 | |
Financials | | | 93,717 | | | | 6.9 | |
Health Care | | | 225,401 | | | | 16.6 | |
Industrials | | | 137,192 | | | | 10.1 | |
Information Technology | | | 432,954 | | | | 31.9 | |
Materials | | | 27,678 | | | | 2.0 | |
Utilities | | | 20,312 | | | | 1.5 | |
Short-term investments | | | 108,124 | | | | 8.0 | |
| | | | | | | | |
Total investments | | $ | 1,357,744 | | | | 100.0 | % |
| | | | | | | | |
| | | | | | | | |
| CURRENCY EXPOSURE - September 30, 2015 | |
Dollar values in thousands | |
| | | Value | | | Percentage
of Total
Investments | |
Australian dollar | | $ | 27,678 | | | | 2.0 | % |
Brazilian real | | | 17,469 | | | | 1.3 | |
British pound | | | 86,185 | | | | 6.3 | |
Danish krone | | | 40,039 | | | | 3.0 | |
Euro | | | 87,495 | | | | 6.4 | |
Hong Kong dollar | | | 57,386 | | | | 4.2 | |
Japanese yen* | | | 100,295 | | | | 7.4 | |
Korean won | | | 11,969 | | | | 0.9 | |
Mexican peso | | | 20,312 | | | | 1.5 | |
Swedish krona | | | 28,002 | | | | 2.1 | |
Taiwan dollar | | | 11,205 | | | | 0.8 | |
U.S. dollar | | | 869,709 | | | | 64.1 | |
| | | | | | | | |
Total investments | | $ | 1,357,744 | | | | 100.0 | % |
| | | | | | | | |
| * | Currency exposure is offset by foreign currency forward contracts noted in the table below (in thousands): |
| | | | | | | | | | | | | | | | | | | | |
Counterparty | | Contract
Settlement
Date | | Contract Amount | | | Unrealized
Depreciation | |
| | | Deliver | | | Receive | | |
| State Street Bank and Trust Company | | 2/10/2016 | | JPY | | | 4,514,481 | | | | USD | | | | 36,276 | | | $ | (1,460 | ) |
JPY - Japanese yen
USD - U.S. dollar
| | | | | | |
| TOP TEN HOLDINGS - September 30, 2015 | |
Company Name | | Country | | Percentage
of Total
Net Assets | |
Google, Inc. | | United States | | | 5.9 | % |
IHS, Inc. | | United States | | | 5.0 | |
Visa, Inc. | | United States | | | 4.6 | |
Regeneron Pharmaceuticals, Inc. | | United States | | | 4.3 | |
Facebook, Inc. | | United States | | | 4.1 | |
Tencent Holdings Ltd. | | China | | | 3.3 | |
Markit Ltd. | | United Kingdom | | | 3.3 | |
Direct Line Insurance Group plc | | United��Kingdom | | | 3.2 | |
Genmab AS | | Denmark | | | 2.9 | |
Electronic Arts, Inc. | | United States | | | 2.9 | |
| | | | | | |
Total | | | | | 39.5 | % |
| | | | | | |
For the purpose of determining the Fund’s top ten holdings, securities of the same issuer are aggregated to determine the weight in the Fund.
The accompanying notes are an integral part of the financial statements.
| | |
| Artisan Partners Funds | | 41 |
ARTISAN GLOBAL SMALL CAP FUND
Schedule of Investments – September 30, 2015
Dollar values in thousands
| | | | | | | | |
| | | Shares
Held | | | Value | |
| COMMON STOCKS - 91.3% | | | | | | | | |
| | | | | | | | |
| CANADA - 2.6% | | | | | | | | |
Cogeco Cable, Inc. | | | 70,971 | | | $ | 3,430 | |
| | | | | | | | |
| CHINA - 13.1% | | | | | | | | |
21Vianet Group, Inc. (DR)(1) | | | 306,429 | | | | 5,602 | |
Beijing Enterprises Water Group Ltd.(1)(2) | | | 2,636,000 | | | | 1,864 | |
China Aircraft Leasing Group Holdings Ltd.(2) | | | 1,698,000 | | | | 1,706 | |
China Everbright Water Ltd.(1)(2) | | | 2,163,600 | | | | 921 | |
China Oil & Gas Group Ltd.(1)(2) | | | 17,020,000 | | | | 1,065 | |
CT Environmental Group Ltd.(2) | | | 10,170,520 | | | | 3,177 | |
iKang Healthcare Group, Inc. (DR)(1) | | | 49,754 | | | | 736 | |
Kangda International Environmental Co., Ltd.(1)(2) | | | 2,824,207 | | | | 750 | |
Wasion Group Holdings Ltd.(2) | | | 1,220,000 | | | | 1,267 | |
| | | | | | | | |
| | | | | | | 17,088 | |
| FINLAND - 4.1% | | | | | | | | |
Huhtamaki Oyj(2) | | | 175,080 | | | | 5,355 | |
| | | | | | | | |
| FRANCE - 4.7% | | | | | | | | |
Elis S.A.(2) | | | 250,793 | | | | 3,910 | |
Innate Pharma S.A.(1)(2) | | | 145,956 | | | | 2,195 | |
| | | | | | | | |
| | | | | | | 6,105 | |
| GERMANY - 3.2% | | | | | | | | |
Tele Columbus AG(1)(2) | | | 328,779 | | | | 4,118 | |
| | | | | | | | |
| GREECE - 1.2% | | | | | | | | |
JUMBO S.A.(2) | | | 169,364 | | | | 1,489 | |
| | | | | | | | |
| HONG KONG - 0.9% | | | | | | | | |
CITIC Telecom International Holdings Ltd.(2) | | | 3,524,811 | | | | 1,209 | |
| | | | | | | | |
| INDIA - 3.8% | | | | | | | | |
Cera Sanitaryware Ltd.(2) | | | 89,848 | | | | 2,769 | |
Credit Analysis & Research Ltd.(2) | | | 51,272 | | | | 874 | |
Vinati Organics Ltd.(2) | | | 132,874 | | | | 925 | |
Voltas Ltd.(2) | | | 98,182 | | | | 402 | |
| | | | | | | | |
| | | | | | | 4,970 | |
| ITALY - 11.1% | | | | | | | | |
Banca Sistema S.p.A.(1)(2) | | | 473,500 | | | | 2,129 | |
Ei Towers S.p.A.(2) | | | 57,129 | | | | 3,518 | |
Infrastrutture Wireless Italiane S.p.A.(1)(2) | | | 816,827 | | | | 4,005 | |
RAI Way S.p.A.(2) | | | 897,954 | | | | 4,298 | |
RCS MediaGroup S.p.A.(1)(2) | | | 541,391 | | | | 542 | |
| | | | | | | | |
| | | | | | | 14,492 | |
| SINGAPORE - 4.5% | | | | | | | | |
SIIC Environment Holdings, Ltd.(1)(2) | | | 9,940,760 | | | | 5,873 | |
| | | | | | | | |
| SPAIN - 8.2% | | | | | | | | |
Cellnex Telecom SAU(1)(2) | | | 177,961 | | | | 3,028 | |
Ebro Foods S.A.(2) | | | 104,301 | | | | 2,051 | |
Inmobiliaria Colonial S.A.(1)(2) | | | 5,038,378 | | | | 3,506 | |
Melia Hotels International S.A.(2) | | | 149,296 | | | | 2,079 | |
| | | | | | | | |
| | | | | | | 10,664 | |
| SWEDEN - 4.5% | | | | | | | | |
Cloetta AB, Class B(1)(2) | | | 1,070,669 | | | | 3,061 | |
Haldex AB(2) | | | 102,433 | | | | 1,081 | |
Meda AB, Class A(2) | | | 118,473 | | | | 1,696 | |
| | | | | | | | |
| | | | | | | 5,838 | |
| TAIWAN - 3.5% | | | | | | | | |
Ginko International Co., Ltd.(2)(3) | | | 444,000 | | | | 4,495 | |
| | | | | | | | |
| THAILAND - 0.1% | | | | | | | | |
Big C Supercenter PCL (DR)(2) | | | 22,500 | | | | 125 | |
| | | | | | | | |
| UNITED KINGDOM - 14.9% | | | | | | | | |
Cambian Group plc(2) | | | 1,124,204 | | | | 4,790 | |
Essentra plc(2) | | | 166,037 | | | | 1,979 | |
GW Pharmaceuticals plc (DR)(1) | | | 12,729 | | | | 1,163 | |
Mitchells & Butlers plc(1)(2) | | | 242,029 | | | | 1,157 | |
Rathbone Brothers plc(2) | | | 77,880 | | | | 2,430 | |
Shawbrook Group plc(1)(2) | | | 239,821 | | | | 1,151 | |
Spire Healthcare Group plc(2) | | | 182,724 | | | | 997 | |
Synergy Health plc(1)(2) | | | 127,252 | | | | 4,183 | |
Virgin Money Holdings UK plc(2) | | | 254,377 | | | | 1,490 | |
| | | | | | | | |
| | | | | | | 19,340 | |
| UNITED STATES - 10.9% | | | | | | | | |
Cable One, Inc.(1) | | | 855 | | | | 359 | |
comScore, Inc.(1) | | | 13,606 | | | | 628 | |
Interpublic Group of Cos., Inc. | | | 115,215 | | | | 2,204 | |
La Quinta Holdings, Inc.(1) | | | 139,662 | | | | 2,204 | |
Nektar Therapeutics(1) | | | 145,924 | | | | 1,599 | |
Otonomy, Inc.(1) | | | 55,879 | | | | 995 | |
Penumbra, Inc.(1) | | | 5,000 | | | | 200 | |
Portola Pharmaceuticals, Inc.(1) | | | 43,291 | | | | 1,845 | |
PTC Therapeutics, Inc.(1) | | | 42,214 | | | | 1,127 | |
SLM Corp.(1) | | | 104,751 | | | | 775 | |
Tempur Sealy International, Inc.(1) | | | 32,151 | | | | 2,297 | |
| | | | | | | | |
| | | | | | | 14,233 | |
| | | | | | | | |
Total common stocks
(Cost $126,632) | | | | | | | 118,824 | |
| | |
| 42 | | Artisan Partners Funds |
| | | | | | | | |
| | | Principal
Amount | | | Value | |
SHORT-TERM INVESTMENTS
(CASH EQUIVALENTS) - 7.8% | | | | | | | | |
Repurchase agreement with Fixed Income Clearing Corporation, 0.00%, dated 9/30/15, due 10/1/15, maturity value $10,148
(Cost $10,148)(4) | | $ | 10,148 | | | $ | 10,148 | |
| | | | | | | | |
| | | | | | | | |
Total investments - 99.1%
(Cost $136,780) | | | | | | | 128,972 | |
| | | | | | | | |
Other assets less liabilities - 0.9% | | | | | | | 1,123 | |
| | | | | | | | |
| | | | | | | | |
Total net assets - 100.0%(5) | | | | | | $ | 130,095 | |
| | | | | | | | |
| (1) | Non-income producing security. |
| (2) | Valued at a fair value in accordance with procedures established by the board of directors of Artisan Partners Funds. In total, securities valued at a fair value were $93,660, or 72.0% of total net assets. See notes 2(a) and 3 in Notes to Financial Statements for additional information. |
| (3) | Affiliated company as defined by the Investment Company Act of 1940, as amended. See note 11 in Notes to Financial Statements for additional information. |
| | | | | | | | | | | | |
Issuer | | Rate | | | Maturity | | | Value | |
U.S. Treasury Note | | | 2.500 | % | | | 8/15/2023 | | | $ | 10,353 | |
| (5) | Percentages for the various classifications relate to total net assets. |
Company names are as reported by a data service provider and in some cases are translations; a company’s legal name may be different.
(DR) Depositary Receipt, voting rights may vary.
| | | | | | | | |
| PORTFOLIO DIVERSIFICATION - September 30, 2015 | |
Dollar values in thousands | | | | | | | | |
| | | Value | | | Percentage
of Total
Investments | |
Consumer Discretionary | | $ | 24,177 | | | | 18.7 | % |
Consumer Staples | | | 5,237 | | | | 4.1 | |
Financials | | | 12,355 | | | | 9.6 | |
Health Care | | | 26,021 | | | | 20.2 | |
Industrials | | | 9,868 | | | | 7.6 | |
Information Technology | | | 11,015 | | | | 8.5 | |
Materials | | | 8,259 | | | | 6.4 | |
Telecommunication Services | | | 8,242 | | | | 6.4 | |
Utilities | | | 13,650 | | | | 10.6 | |
Short-term investments | | | 10,148 | | | | 7.9 | |
| | | | | | | | |
Total investments | | $ | 128,972 | | | | 100.0 | % |
| | | | | | | | |
| | | | | | | | |
| CURRENCY EXPOSURE - September 30, 2015 | |
Dollar values in thousands | | | | | | | | |
| | | Value | | | Percentage
of Total
Investments | |
British pound | | $ | 18,177 | | | | 14.1 | % |
Canadian dollar | | | 3,430 | | | | 2.7 | |
Euro | | | 42,223 | | | | 32.7 | |
Hong Kong dollar | | | 11,038 | | | | 8.6 | |
Indian rupee | | | 4,970 | | | | 3.8 | |
Singapore dollar | | | 6,794 | | | | 5.3 | |
Swedish krona | | | 5,838 | | | | 4.5 | |
Taiwan dollar | | | 4,495 | | | | 3.5 | |
Thai baht | | | 125 | | | | 0.1 | |
U.S. dollar | | | 31,882 | | | | 24.7 | |
| | | | | | | | |
Total investments | | $ | 128,972 | | | | 100.0 | % |
| | | | | | | | |
| | | | | | |
| TOP TEN HOLDINGS - September 30, 2015 | |
Company Name | | Country | | Percentage
of Total
Net Assets | |
SIIC Environment Holdings, Ltd. | | Singapore | | | 4.5 | % |
21Vianet Group, Inc. | | China | | | 4.3 | |
Huhtamaki Oyj | | Finland | | | 4.1 | |
Cambian Group plc | | United Kingdom | | | 3.7 | |
Ginko International Co., Ltd. | | Taiwan | | | 3.5 | |
RAI Way S.p.A. | | Italy | | | 3.3 | |
Synergy Health plc | | United Kingdom | | | 3.2 | |
Tele Columbus AG | | Germany | | | 3.2 | |
Infrastrutture Wireless Italiane S.p.A. | | Italy | | | 3.1 | |
Elis S.A. | | France | | | 3.0 | |
| | | | | | |
Total | | | | | 35.9 | % |
| | | | | | |
For the purpose of determining the Fund’s top ten holdings, securities of the same issuer are aggregated to determine the weight in the Fund.
The accompanying notes are an integral part of the financial statements.
| | |
| Artisan Partners Funds | | 43 |
ARTISAN GLOBAL VALUE FUND
Schedule of Investments – September 30, 2015
Dollar values in thousands
| | | | | | | | |
| | | Shares
Held | | | Value | |
| COMMON STOCKS - 91.5% | | | | | | | | |
| | | | | | | | |
| BELGIUM - 1.7% | | | | | | | | |
Groupe Bruxelles Lambert S.A.(1) | | | 334,352 | | | $ | 25,254 | |
| | | | | | | | |
| BRAZIL - 1.7% | | | | | | | | |
Telefonica Brasil S.A. (DR) | | | 2,873,880 | | | | 26,238 | |
| | | | | | | | |
| CANADA - 1.8% | | | | | | | | |
Imperial Oil Ltd. | | | 849,913 | | | | 26,927 | |
| | | | | | | | |
| CHINA - 0.9% | | | | | | | | |
New Oriental Education & Technology Group, Inc. (DR) | | | 698,384 | | | | 14,114 | |
| | | | | | | | |
| DENMARK - 4.3% | | | | | | | | |
Carlsberg AS, Class B(1) | | | 349,181 | | | | 26,872 | |
ISS AS(1)(2) | | | 1,159,246 | | | | 38,560 | |
| | | | | | | | |
| | | | | | | 65,432 | |
| JAPAN - 0.1% | | | | | | | | |
Tokyo Electron Ltd.(1) | | | 30,800 | | | | 1,456 | |
| | | | | | | | |
| KOREA - 4.6% | | | | | | | | |
Kia Motors Corp.(1) | | | 529,150 | | | | 24,002 | |
Samsung Electronics Co., Ltd.(1) | | | 48,751 | | | | 46,884 | |
| | | | | | | | |
| | | | | | | 70,886 | |
| NETHERLANDS - 2.1% | | | | | | | | |
ING Groep N.V. (DR)(1) | | | 2,263,567 | | | | 32,133 | |
| | | | | | | | |
| NORWAY - 1.1% | | | | | | | | |
Orkla ASA(1) | | | 2,243,261 | | | | 16,664 | |
| | | | | | | | |
| SWITZERLAND - 7.0% | | | | | | | | |
ABB Ltd.(1)(3) | | | 2,325,888 | | | | 41,190 | |
Adecco S.A.(1)(3) | | | 20,964 | | | | 1,537 | |
Novartis AG(1) | | | 251,880 | | | | 23,202 | |
Pargesa Holding S.A.(1) | | | 7,516 | | | | 442 | |
UBS Group AG(1) | | | 2,140,434 | | | | 39,665 | |
| | | | | | | | |
| | | | | | | 106,036 | |
| UNITED KINGDOM - 12.8% | | | | | | | | |
Amec Foster Wheeler plc(1) | | | 1,465,421 | | | | 15,923 | |
Compass Group plc(1) | | | 1,304,675 | | | | 20,829 | |
Diageo plc(1) | | | 679,451 | | | | 18,284 | |
Lloyds Banking Group plc(1) | | | 25,594,312 | | | | 29,177 | |
Royal Bank of Scotland Group plc(1)(3) | | | 12,749,196 | | | | 60,923 | |
Serco Group plc(1)(3) | | | 1,751,230 | | | | 2,705 | |
| UNITED KINGDOM (CONTINUED) | | | | | | | | |
TESCO plc(1) | | | 16,867,474 | | | | 46,870 | |
| | | | | | | | |
| | | | | | | 194,711 | |
| UNITED STATES - 53.4% | | | | | | | | |
Accenture plc, Class A | | | 19,120 | | | | 1,879 | |
American Express Co. | | | 443,527 | | | | 32,879 | |
Aon plc | | | 226,484 | | | | 20,069 | |
Applied Materials, Inc. | | | 1,661,940 | | | | 24,414 | |
Arch Capital Group Ltd.(2)(3) | | | 824,053 | | | | 60,543 | |
Bank of New York Mellon Corp. | | | 1,637,319 | | | | 64,101 | |
Chubb Corp. | | | 375,830 | | | | 46,096 | |
Cisco Systems, Inc. | | | 1,750,218 | | | | 45,943 | |
Citigroup, Inc. | | | 1,107,645 | | | | 54,950 | |
Citizens Financial Group, Inc. | | | 1,131,031 | | | | 26,986 | |
Flextronics International Ltd.(3) | | | 1,186,015 | | | | 12,501 | |
Google, Inc., Class A(3) | | | 25,949 | | | | 16,565 | |
Google, Inc., Class C(3)(4) | | | 18,931 | | | | 11,518 | |
Johnson & Johnson | | | 536,851 | | | | 50,115 | |
Joy Global, Inc.(2) | | | 603,577 | | | | 9,011 | |
Marsh & McLennan Cos., Inc. | | | 820,456 | | | | 42,844 | |
Medtronic plc | | | 713,704 | | | | 47,775 | |
Microsoft Corp. | | | 1,197,132 | | | | 52,985 | |
Oracle Corp. | | | 2,029,483 | | | | 73,305 | |
Progressive Corp. | | | 974,586 | | | | 29,861 | |
QUALCOMM, Inc. | | | 837,017 | | | | 44,973 | |
TE Connectivity Ltd. | | | 369,019 | | | | 22,101 | |
United Technologies Corp. | | | 268,285 | | | | 23,875 | |
| | | | | | | | |
| | | | | | | 815,289 | |
| | | | | | | | |
Total common stocks
(Cost $1,346,097) | | | | | | | 1,395,140 | |
| | | | | | | | |
| PREFERRED STOCKS - 0.2% | | | | | | | | |
| | | | | | | | |
| BRAZIL - 0.2% | | | | | | | | |
Telefonica Brasil S.A.(4) | | | 285,379 | | | | 2,640 | |
| | | | | | | | |
Total preferred stocks
(Cost $3,801) | | | | | | | 2,640 | |
| | |
| 44 | | Artisan Partners Funds |
| | | | | | | | |
| | | Principal
Amount | | | Value | |
| SHORT-TERM INVESTMENTS (CASH EQUIVALENTS) - 7.9% | | | | | | | | |
Repurchase agreement with Fixed Income Clearing Corporation, 0.00%, dated 9/30/15, due 10/1/15, maturity value $120,798
(Cost $120,798)(5) | | $ | 120,798 | | | $ | 120,798 | |
| | | | | | | | |
| | | | | | | | |
Total investments - 99.6%
(Cost $1,470,696) | | | | | | | 1,518,578 | |
| | | | | | | | |
Other assets less liabilities - 0.4% | | | | | | | 6,728 | |
| | | | | | | | |
| | | | | | | | |
Total net assets - 100.0%(6) | | | | | | $ | 1,525,306 | |
| | | | | | | | |
| (1) | Valued at a fair value in accordance with procedures established by the board of directors of Artisan Partners Funds. In total, securities valued at a fair value were $512,572, or 33.6% of total net assets. See notes 2(a) and 3 in Notes to Financial Statements for additional information. |
| (2) | Affiliated company as defined by the Investment Company Act of 1940, as amended. See note 11 in Notes to Financial Statements for additional information. |
| (3) | Non-income producing security. |
| | | | | | | | | | | | |
Issuer | | Rate | | | Maturity | | | Value | |
U.S. Treasury Note | | | 2.125 | % | | | 12/31/2021 | | | $ | 123,219 | |
| (6) | Percentages for the various classifications relate to total net assets. |
Company names are as reported by a data service provider and in some cases are translations; a company’s legal name may be different.
(DR) Depositary Receipt, voting rights may vary.
| | | | | | | | |
| PORTFOLIO DIVERSIFICATION - September 30, 2015 | |
Dollar values in thousands | | | | | | | | |
| | | Value | | | Percentage
of Total
Investments | |
Consumer Discretionary | | $ | 58,945 | | | | 3.9 | % |
Consumer Staples | | | 108,690 | | | | 7.2 | |
Energy | | | 42,850 | | | | 2.8 | |
Financials | | | 565,923 | | | | 37.3 | |
Health Care | | | 121,092 | | | | 8.0 | |
Industrials | | | 116,878 | | | | 7.7 | |
Information Technology | | | 354,524 | | | | 23.3 | |
Telecommunication Services | | | 28,878 | | | | 1.9 | |
Short-term investments | | | 120,798 | | | | 7.9 | |
| | | | | | | | |
Total investments | | $ | 1,518,578 | | | | 100.0 | % |
| | | | | | | | |
| | | | | | | | |
| CURRENCY EXPOSURE - September 30, 2015 | |
Dollar values in thousands | | | | | | | | |
| | | Value | | | Percentage
of Total
Investments | |
Brazilian real | | $ | 2,640 | | | | 0.2 | % |
British pound | | | 194,711 | | | | 12.8 | |
Canadian dollar | | | 26,927 | | | | 1.8 | |
Danish krone | | | 65,432 | | | | 4.3 | |
Euro | | | 57,387 | | | | 3.8 | |
Japanese yen | | | 1,456 | | | | 0.1 | |
Korean won | | | 70,886 | | | | 4.6 | |
Norwegian krone | | | 16,664 | | | | 1.1 | |
Swiss franc | | | 106,036 | | | | 7.0 | |
U.S. dollar | | | 976,439 | | | | 64.3 | |
| | | | | | | | |
Total investments | | $ | 1,518,578 | | | | 100.0 | % |
| | | | | | | | |
| | | | | | |
| TOP TEN HOLDINGS - September 30, 2015 | |
Company Name | | Country | | Percentage
of Total
Net Assets | |
Oracle Corp. | | United States | | | 4.8 | % |
Bank of New York Mellon Corp. | | United States | | | 4.2 | |
Royal Bank of Scotland Group plc | | United Kingdom | | | 4.0 | |
Arch Capital Group Ltd. | | United States | | | 4.0 | |
Citigroup, Inc. | | United States | | | 3.6 | |
Microsoft Corp. | | United States | | | 3.5 | |
Johnson & Johnson | | United States | | | 3.3 | |
Medtronic plc | | United States | | | 3.1 | |
Samsung Electronics Co., Ltd. | | Korea | | | 3.1 | |
TESCO plc | | United Kingdom | | | 3.1 | |
| | | | | | |
Total | | | | | 36.7 | % |
| | | | | | |
For the purpose of determining the Fund’s top ten holdings, securities of the same issuer are aggregated to determine the weight in the Fund.
The accompanying notes are an integral part of the financial statements.
| | |
| Artisan Partners Funds | | 45 |
ARTISAN HIGH INCOME FUND
Schedule of Investments – September 30, 2015
Dollar values in thousands
| | | | | | | | |
| | | Principal
Amount
(000s) | | | Value | |
| CORPORATE BONDS - 70.3% | | | | | | | | |
| | | | | | | | |
| AGRICULTURE - 1.9% | | | | | | | | |
Pinnacle Operating Corp., 9.00%, 11/15/2020(1) | | $ | 17,859 | | | $ | 17,323 | |
| | | | | | | | |
| AUTO PARTS & EQUIPMENT - 1.5% | | | | | | | | |
Schaeffler Finance BV,
4.75%, 5/15/2023(1)(2) | | | 3,500 | | | | 3,378 | |
Schaeffler Holding Finance BV, PIK
6.25%, 11/15/2019(1)(2) | | | 5,000 | | | | 5,300 | |
6.75%, 11/15/2022(1)(2) | | | 4,500 | | | | 4,837 | |
| | | | | | | | |
| | | | | | | 13,515 | |
| BEVERAGES - 0.4% | | | | | | | | |
Constellation Brands, Inc., 6.00%, 5/1/2022 | | | 3,000 | | | | 3,278 | |
| | | | | | | | |
| BUILDING MATERIALS - 1.2% | | | | | | | | |
Ply Gem Industries, Inc., 6.50%, 2/1/2022 | | | 4,000 | | | | 3,760 | |
Roofing Supply Group LLC / Roofing Supply Finance, Inc., 10.00%, 6/1/2020(1) | | | 6,845 | | | | 7,358 | |
| | | | | | | | |
| | | | | | | 11,118 | |
| CHEMICALS - 2.6% | | | | | | | | |
A Schulman, Inc., 6.88%, 6/1/2023(1) | | | 8,000 | | | | 7,540 | |
Momentive Performance Materials, Inc., escrow, 10.00%, 10/15/2020(3)(4)(5) | | | 2,000 | | | | – | (6) |
Platform Specialty Products Corp., 6.50%, 2/1/2022(1) | | | 9,000 | | | | 7,740 | |
TPC Group, Inc., 8.75%, 12/15/2020(1) | | | 7,735 | | | | 6,614 | |
WR Grace & Co-Conn, 5.13%, 10/1/202 (1) | | | 2,000 | | | | 1,975 | |
| | | | | | | | |
| | | | | | | 23,869 | |
| COMMERCIAL SERVICES - 0.4% | | | | | | | | |
Cimpress N.V., 7.00%, 4/1/2022(1)(2) | | | 4,000 | | | | 3,860 | |
| | | | | | | | |
| COMPUTERS - 0.3% | | | | | | | | |
IHS, Inc., 5.00%, 11/1/2022 | | | 2,474 | | | | 2,375 | |
| | | | | | | | |
| DISTRIBUTION/WHOLESALE - 0.5% | | | | | | | | |
Beacon Roofing Supply, Inc., 6.38%, 10/1/2023(1) | | | 5,000 | | | | 5,013 | |
| | | | | | | | |
| DIVERSIFIED FINANCIAL SERVICES - 8.1% | | | | | | | | |
Alliance Data Systems Corp.,
5.38%, 8/1/2022(1) | | | 7,000 | | | | 6,825 | |
6.38%, 4/1/2020 (1) | | | 9,000 | | | | 9,157 | |
| DIVERSIFIED FINANCIAL SERVICES (CONTINUED) | | | | | | | | |
Cogent Communications Finance, Inc., 5.63%, 4/15/2021(1) | | $ | 3,500 | | | $ | 3,290 | |
Infinity Acquisition LLC / Infinity Acquisition Finance Corp., 7.25%, 8/1/2022(1) | | | 33,880 | | | | 30,323 | |
National Financial Partners Corp., 9.00%, 7/15/2021(1) | | | 21,515 | | | | 20,762 | |
Quicken Loans, Inc., 5.75%, 5/1/2025(1) | | | 4,000 | | | | 3,790 | |
| | | | | | | | |
| | | | | | | 74,147 | |
| HEALTHCARE-PRODUCTS - 0.2% | | | | | | | | |
Hill-Rom Holdings, Inc., 5.75%, 9/1/2023(1) | | | 1,000 | | | | 1,002 | |
Mallinckrodt International Finance S.A. / Mallinckrodt CB LLC, 5.63%, 10/15/2023(1)(2) | | | 1,250 | | | | 1,141 | |
| | | | | | | | |
| | | | | | | 2,143 | |
| HEALTHCARE-SERVICES - 0.8% | | | | | | | | |
Acadia Healthcare Co., Inc.,
5.63%, 2/15/2023(1) | | | 2,000 | | | | 2,010 | |
HCA, Inc., 5.38%, 2/1/2025 | | | 5,000 | | | | 4,963 | |
| | | | | | | | |
| | | | | | | 6,973 | |
| HOLDING COMPANIES-DIVERSIFIED - 4.8% | | | | | | | | |
Opal Acquisition, Inc., 8.88%, 12/15/2021(1) | | | 46,315 | | | | 43,594 | |
| | | | | | | | |
| INSURANCE - 9.7% | | | | | | | | |
USI, Inc., 7.75%, 1/15/2021(1) | | | 56,569 | | | | 55,367 | |
Wayne Merger Sub LLC, 8.25%, 8/1/2023(1) | | | 8,250 | | | | 7,899 | |
York Risk Services Holding Corp., 8.50%, 10/1/2022(1) | | | 30,000 | | | | 25,500 | |
| | | | | | | | |
| | | | | | | 88,766 | |
| MACHINERY-DIVERSIFIED - 1.6% | | | | | | | | |
Gardner Denver, Inc., 6.88%, 8/15/2021(1) | | | 16,975 | | | | 15,023 | |
| | | | | | | | |
| MEDIA - 11.5% | | | | | | | | |
Altice Financing S.A., 6.63%, 2/15/2023(1)(2) | | | 1,000 | | | | 960 | |
Altice Finco S.A., 7.63%, 2/15/2025(1)(2) | | | 4,040 | | | | 3,767 | |
Altice US Finance I Corp., 5.38%, 7/15/2023(1) | | | 3,000 | | | | 2,880 | |
Altice US Finance S.A., 7.75%, 7/15/2025(1)(2) | | | 2,000 | | | | 1,765 | |
Cablevision Systems Corp., 8.00%, 4/15/2020 | | | 7,000 | | | | 6,213 | |
CCO Holdings LLC / CCO Holdings Capital Corp., | | | | | | | | |
5.13%, 5/1/2023(1) | | | 5,000 | | | | 4,603 | |
5.25%, 3/15/2021 | | | 5,500 | | | | 5,417 | |
5.75%, 9/1/2023 | | | 3,020 | | | | 2,873 | |
6.50%, 4/30/2021 | | | 2,000 | | | | 2,010 | |
| | |
| 46 | | Artisan Partners Funds |
| | | | | | | | |
| | | Principal
Amount
(000s) | | | Value | |
| MEDIA (CONTINUED) | | | | | | | | |
CCO Safari II LLC, | | | | | | | | |
4.46%, 7/23/2022(1) | | $ | 7,500 | | | $ | 7,500 | |
4.91%, 7/23/2025(1) | | | 6,000 | | | | 5,974 | |
DISH DBS Corp., | | | | | | | | |
5.00%, 3/15/2023 | | | 2,000 | | | | 1,675 | |
5.88%, 7/15/2022 | | | 9,000 | | | | 7,942 | |
5.88%, 11/15/2024 | | | 4,000 | | | | 3,400 | |
6.75%, 6/1/2021 | | | 1,000 | | | | 955 | |
Midcontinent Communications & Midcontinent Finance Corp., 6.88%, 8/15/2023(1) | | | 4,000 | | | | 3,985 | |
Neptune Finco Corp., | | | | | | | | |
6.63%, 10/15/2025(1) | | | 7,000 | | | | 7,035 | |
10.13%, 1/15/2023(1) | | | 7,000 | | | | 7,061 | |
10.88%, 10/15/2025(1) | | | 21,000 | | | | 21,210 | |
Time Warner Cable, Inc., 4.50%, 9/15/2042 | | | 10,000 | | | | 7,910 | |
| | | | | | | | |
| | | | | | | 105,135 | |
| MISCELLANEOUS MANUFACTURING - 2.0% | | | | | | | | |
Gates Global LLC / Gates Global Co., 6.00%, 7/15/2022(1) | | | 23,000 | | | | 18,515 | |
| | | | | | | | |
| OIL & GAS - 8.9% | | | | | | | | |
Clayton Williams Energy, Inc., 7.75%, 4/1/2019 | | | 13,850 | | | | 11,721 | |
Endeavor Energy Resources L.P. / EER Finance, Inc.,
7.00%, 8/15/2021(1) | | | 2,311 | | | | 2,138 | |
Midstates Petroleum Co., Inc. / Midstates Petroleum Co. LLC, 10.00%, 6/1/2020(1) | | | 13,300 | | | | 9,642 | |
Paramount Resources Ltd., 6.88%, 6/30/2023(1)(2) | | | 11,000 | | | | 9,460 | |
Parsley Energy LLC / Parsley Finance Corp.,
7.50%, 2/15/2022(1) | | | 15,218 | | | | 14,761 | |
Range Resources Corp., | | | | | | | | |
4.88%, 5/15/2025(1) | | | 7,500 | | | | 6,675 | |
5.00%, 8/15/2022 | | | 18,150 | | | | 16,063 | |
RSP Permian, Inc., 6.63%, 10/1/2022(1) | | | 500 | | | | 480 | |
Warren Resources, Inc., 9.00%, 8/1/2022 | | | 4,000 | | | | 880 | |
Whiting Petroleum Corp., | | | | | | | | |
5.00%, 3/15/2019 | | | 3,000 | | | | 2,610 | |
6.25%, 4/1/2023 | | | 8,000 | | | | 6,920 | |
| | | | | | | | |
| | | | | | | 81,350 | |
| PHARMACEUTICALS - 1.9% | | | | | | | | |
Endo Finance LLC / Endo Ltd. / Endo Finco, Inc.,
6.00%, 7/15/2023(1)(2) | | | 3,500 | | | | 3,465 | |
Valeant Pharmaceuticals International, Inc., | | | | | | | | |
5.88%, 5/15/2023(1)(2) | | | 2,000 | | | | 1,917 | |
6.13%, 4/15/2025(1)(2) | | | 4,000 | | | | 3,832 | |
6.38%, 10/15/2020(1) | | | 8,500 | | | | 8,452 | |
| | | | | | | | |
| | | | | | | 17,666 | |
| REAL ESTATE INVESTMENT TRUSTS (REITS) - 1.8% | | | | | | | | |
Vereit Operating Partnership L.P., 4.60%, 2/6/2024 | | $ | 17,100 | | | $ | 16,416 | |
| | | | | | | | |
| RETAIL - 1.5% | | | | | | | | |
Dollar Tree, Inc., 5.75%, 3/1/2023(1) | | | 13,000 | | | | 13,488 | |
| | | | | | | | |
| SOFTWARE - 4.6% | | | | | | | | |
Ensemble S Merger Sub, Inc., 9.00%, 9/30/2023(1) | | | 6,000 | | | | 5,805 | |
Infor Software Parent LLC / Infor Software Parent, Inc., PIK, 7.13%, 5/1/2021(1) | | | 14,500 | | | | 12,470 | |
Infor US, Inc., 6.50%, 5/15/2022(1) | | | 7,000 | | | | 6,422 | |
Italics Merger Sub, Inc., 7.13%, 7/15/2023(1) | | | 18,000 | | | | 17,190 | |
| | | | | | | | |
| | | | | | | 41,887 | |
| TELECOMMUNICATIONS - 4.1% | | | | | | | | |
Frontier Communications Corp., | | | | | | | | |
8.88%, 9/15/2020(1) | | | 2,000 | | | | 1,960 | |
10.50%, 9/15/2022(1) | | | 4,000 | | | | 3,890 | |
11.00%, 9/15/2025(1) | | | 12,000 | | | | 11,610 | |
T-Mobile USA, Inc., | | | | | | | | |
6.00%, 3/1/2023 | | | 2,000 | | | | 1,930 | |
6.38%, 3/1/2025 | | | 4,500 | | | | 4,297 | |
Virgin Media Secured Finance plc, 5.25%, 1/15/2026(1)(2) | | | 15,000 | | | | 13,800 | |
| | | | | | | | |
| | | | | | | 37,487 | |
| | | | | | | | |
Total Corporate Bonds
(Cost $681,495) | | | | | | | 642,941 | |
| | | | | | | | |
| BANK LOANS - 21.0%(7) | | | | | | | | |
| | | | | | | | |
| AEROSPACE/DEFENSE - 0.7% | | | | | | | | |
Jazz Acquisition, Inc. Second Lien Term Loan, 7.75%, 6/19/2022 | | | 7,000 | | | | 6,720 | |
| | | | | | | | |
| AUTO PARTS & EQUIPMENT - 0.7% | | | | | | | | |
BBB Industries US Holdings, Inc. Second Lien Term Loan, 9.75%, 11/3/2022 | | | 6,500 | | | | 6,240 | |
| | | | | | | | |
| CHEMICALS - 0.4% | | | | | | | | |
Chemours Company Term Loan B, 3.75%, 5/12/2022 | | | 1,995 | | | | 1,745 | |
Emerald Performance Materials, LLC Second Lien Term Loan, 7.75%, 8/1/2022 | | | 2,000 | | | | 1,977 | |
| | | | | | | | |
| | | | | | | 3,722 | |
| COMMERCIAL SERVICES - 0.8% | | | | | | | | |
Concentra Inc. Second Lien Term Loan, 9.00%, 6/1/2023(4) | | | 7,000 | | | | 7,000 | |
| | | | | | | | |
| | |
| Artisan Partners Funds | | 47 |
| | | | | | | | |
| | | Principal
Amount
(000s) | | | Value | |
| DIVERSIFIED FINANCIAL SERVICES - 4.3% | | | | | | | | |
LBM Borrower LLC Second Lien Term Loan, 10.25%, 8/20/2023 | | $ | 10,000 | | | $ | 9,600 | |
TransFirst, Inc. Second Lien Term Loan, 9.00%, 11/12/2022 | | | 10,000 | | | | 9,837 | |
WP Mustang Holdings LLC Second Lien Term Loan B, 8.50%, 5/29/2022 | | | 20,645 | | | | 19,716 | |
| | | | | | | | |
| | | | | | | 39,153 | |
| ENGINEERING & CONSTRUCTION - 1.1% | | | | | | | | |
Pike Corp. Second Lien Term Loan, 9.50%, 6/22/2022 | | | 10,000 | | | | 9,792 | |
| | | | | | | | |
| FOOD - 0.7% | | | | | | | | |
Hostess Brands LLC Second Lien Term Loan, 8.50%, 8/3/2023 | | | 6,328 | | | | 6,320 | |
| | | | | | | | |
| HEALTHCARE-SERVICES - 0.8% | | | | | | | | |
Heartland Dental LLC Second Lien Term Loan, 9.75%, 6/21/2019 | | | 7,755 | | | | 7,765 | |
| | | | | | | | |
| INTERNET - 1.5% | | | | | | | | |
iParadigms Holdings LLC Second Lien Term Loan, 8.25%, 7/31/2022(4) | | | 8,972 | | | | 8,882 | |
The Active Network, Inc. Second Lien Term Loan, 9.50%, 11/15/2021 | | | 5,467 | | | | 5,153 | |
| | | | | | | | |
| | | | | | | 14,035 | |
| MISCELLANEOUS MANUFACTURING - 0.1% | | | | | | | | |
Ascend Performance Materials Operations LLC Term Loan B, 6.75%, 4/10/2018 | | | 708 | | | | 639 | |
| | | | | | | | |
| OIL & GAS - 2.6% | | | | | | | | |
Callon Petroleum Co. Second Lien Term Loan, 8.50%, 10/8/2021 | | | 24,500 | | | | 23,581 | |
| | | | | | | | |
| OIL & GAS SERVICES - 1.0% | | | | | | | | |
Cactus Wellhead LLC Term Loan, 7.00%, 7/31/2020(4) | | | 7,920 | | | | 5,940 | |
RGL Reservoir Operations, Inc. First Lien Term Loan, 6.00%, 8/14/2021(2) | | | 8,910 | | | | 3,475 | |
| | | | | | | | |
| | | | | | | 9,415 | |
| PACKAGING & CONTAINERS - 0.3% | | | | | | | | |
CD&R Millennium Holdco 6 S.a.r.l. Second Lien Term Loan, 8.75%, 7/31/2022(2) | | | 3,000 | | | | 2,948 | |
| | | | | | | | |
| PHARMACEUTICALS - 0.5% | | | | | | | | |
PharMedium Healthcare Corp. Second Lien Term Loan, 7.75%, 1/28/2022 | | | 4,180 | | | | 4,117 | |
| | | | | | | | |
| SOFTWARE - 5.5% | | | | | | | | |
Ascend Learning LLC Second Lien Term Loan, 9.50%, 11/30/2020 | | $ | 13,642 | | | $ | 13,505 | |
Renaissance Learning, Inc. Second Lien Term Loan, 8.00%, 4/11/2022 | | | 38,055 | | | | 36,850 | |
| | | | | | | | |
| | | | | | | 50,355 | |
| | | | | | | | |
Total Bank Loans
(Cost $200,602) | | | | | | | 191,802 | |
| | | | | | | | |
| CONVERTIBLE DEBENTURES - 2.9% | | | | | | | | |
| | | | | | | | |
| REAL ESTATE INVESTMENT TRUSTS (REITS) - 2.9% | | | | | | | | |
VEREIT, Inc., 3.00%, 8/1/2018 | | | 8,000 | | | | 7,590 | |
VEREIT, Inc., 3.75%, 12/15/2020 | | | 20,000 | | | | 18,475 | |
| | | | | | | | |
Total convertible debentures
(Cost $26,596) | | | | | | | 26,065 | |
| | | | | | | | |
SHORT-TERM INVESTMENTS
(CASH EQUIVALENTS) - 10.3% | | | | | | | | |
Repurchase agreement with State Street Corporation, 0.00%, dated 9/30/15, due 10/1/15, maturity value $94,577
(Cost $94,577)(8) | | | 94,577 | | | | 94,577 | |
| | | | | | | | |
| | | | | | | | |
Total investments - 104.5%
(Cost $1,003,270) | | | | | | | 955,385 | |
| | | | | | | | |
Other assets less liabilities - (4.5)% | | | | | | | (41,326 | ) |
| | | | | | | | |
| | | | | | | | |
Total net assets - 100.0%(9) | | | | | | $ | 914,059 | |
| | | | | | | | |
| (1) | Security is restricted. The security was acquired in a transaction pursuant to Rule 144A of the Securities Act of 1933 on the date or during the period noted below. The shares of the security may be resold in transactions exempt from registration to qualified institutional buyers. |
| | | | | | | | | | | | | | | | |
Security | | Acquisition
Date(s) | | | Cost | | | Value | | | Percentage
of Total
Net Assets | |
A Schulman, Inc. 6.88% 6/1/2023 | |
| 5/7/15-
9/18/15 |
| | $ | 8,086 | | | $ | 7,540 | | | | 0.8 | % |
Acadia Healthcare Co., Inc. 5.63% 2/15/2023 | | | 9/14/15 | | | | 2,010 | | | | 2,010 | | | | 0.2 | |
Alliance Data Systems Corp. 5.38% 8/1/2022 | |
| 7/24/14-
1/28/15 |
| | | 6,902 | | | | 6,825 | | | | 0.8 | |
6.38% 4/1/2020 | |
| 8/14/14-
3/24/15 |
| | | 9,351 | | | | 9,157 | | | | 1.0 | |
| | |
| 48 | | Artisan Partners Funds |
| | | | | | | | | | | | | | | | |
Security | | Acquisition
Date(s) | | | Cost | | | Value | | | Percentage
of Total
Net Assets | |
Altice Financing S.A. 6.63% 2/15/2023 | | | 1/30/15 | | | $ | 1,000 | | | $ | 960 | | | | 0.1 | % |
Altice Finco S.A. 7.63% 2/15/2025 | |
| 1/30/15-
4/1/15 |
| | | 4,139 | | | | 3,767 | | | | 0.4 | |
Altice US Finance I Corp. 5.38% 7/15/2023 | | | 5/29/15 | | | | 3,000 | | | | 2,880 | | | | 0.3 | |
Altice US Finance S.A. 7.75% 7/15/2025 | | | 5/29/15 | | | | 1,966 | | | | 1,765 | | | | 0.2 | |
Beacon Roofing Supply, Inc. 6.38% 10/1/2023 | | | 9/24/15 | | | | 5,000 | | | | 5,013 | | | | 0.5 | |
CCO Holdings LLC / CCO Holdings Capital Corp. 5.13% 5/1/2023 | |
| 4/13/15-
9/29/15 |
| | | 4,756 | | | | 4,603 | | | | 0.5 | |
CCO Safari II LLC | | | | | | | | | | | | | | | | |
4.46% 7/23/2022 | |
| 7/9/15-
8/6/15 |
| | | 7,467 | | | | 7,500 | | | | 0.8 | |
4.91% 7/23/2025 | |
| 7/9/15-
7/13/15 |
| | | 5,958 | | | | 5,974 | | | | 0.6 | |
Cimpress N.V. 7.00% 4/1/2022 | | | 3/13/15 | | | | 4,000 | | | | 3,860 | | | | 0.4 | |
Cogent Communications Finance, Inc. 5.63% 4/15/2021 | | | 7/20/15 | | | | 3,364 | | | | 3,290 | | | | 0.4 | |
Dollar Tree, Inc. 5.75% 3/1/2023 | |
| 2/6/15-
9/8/15 |
| | | 13,000 | | | | 13,487 | | | | 1.5 | |
Endeavor Energy Resources L.P. / EER Finance, Inc. 7.00% 8/15/2021 | | | 8/28/15 | | | | 2,162 | | | | 2,138 | | | | 0.2 | |
Endo Finance LLC / Endo Ltd. / Endo Finco, Inc. 6.00% 7/15/2023 | | | 6/24/15 | | | | 3,500 | | | | 3,465 | | | | 0.4 | |
Ensemble S Merger Sub, Inc. 9.00% 9/30/2023 | | | 9/21/15 | | | | 5,794 | | | | 5,805 | | | | 0.7 | |
Frontier Communications Corp. | | | | | | | | | | | | | | | | |
8.88% 9/15/2020 | | | 9/11/15 | | | | 2,000 | | | | 1,960 | | | | 0.2 | |
10.50% 9/15/2022 | | | 9/11/15 | | | | 4,000 | | | | 3,890 | | | | 0.4 | |
11.00% 9/15/2025 | |
| 9/11/15-
9/29/15 |
| | | 11,920 | | | | 11,610 | | | | 1.3 | |
Gardner Denver, Inc. 6.88% 8/15/2021 | |
| 7/31/15-
9/17/15 |
| | | 15,311 | | | | 15,023 | | | | 1.6 | |
Gates Global LLC / Gates Global Co. 6.00% 7/15/2022 | |
| 7/28/15-
9/14/15 |
| | | 19,601 | | | | 18,515 | | | | 2.0 | |
Hill-Rom Holdings, Inc. 5.75% 9/1/2023 | | | 8/18/15 | | | | 1,000 | | | | 1,002 | | | | 0.1 | |
Infinity Acquisition LLC / Infinity Acquisition Finance Corp. 7.25% 8/1/2022 | |
| 7/15/14-
9/18/15 |
| | $ | 31,862 | | | $ | 30,323 | | | | 3.3 | % |
Infor Software Parent LLC / Infor Software Parent, Inc. 7.13% 5/1/2021 | |
| 4/3/14-
8/12/15 |
| | | 14,321 | | | | 12,470 | | | | 1.4 | |
Infor US, Inc. 6.50% 5/15/2022 | |
| 3/18/15-
9/17/15 |
| | | 6,930 | | | | 6,422 | | | | 0.7 | |
Italics Merger Sub, Inc. 7.13% 7/15/2023 | |
| 6/2/15-
9/16/15 |
| | | 17,806 | | | | 17,190 | | | | 1.9 | |
Mallinckrodt International Finance S.A. / Mallinckrodt CB LLC 5.63% 10/15/2023 | | | 9/9/15 | | | | 1,250 | | | | 1,141 | | | | 0.1 | |
Midcontinent Communications & Midcontinent Finance Corp. 6.88% 8/15/2023 | |
| 8/11/15-
8/31/15 |
| | | 4,010 | | | | 3,985 | | | | 0.4 | |
Midstates Petroleum Co., Inc. / Midstates Petroleum Co. LLC 10.00% 6/1/2020 | |
| 5/22/15-
6/30/15 |
| | | 13,477 | | | | 9,642 | | | | 1.1 | |
National Financial Partners Corp. 9.00% 7/15/2021 | |
| 5/12/15-
8/28/15 |
| | | 21,627 | | | | 20,762 | | | | 2.3 | |
Neptune Finco Corp. | | | | | | | | | | | | | | | | |
6.63% 10/15/2025 | | | 9/25/15 | | | | 7,000 | | | | 7,035 | | | | 0.8 | |
10.13% 1/15/2023 | | | 9/25/15 | | | | 7,000 | | | | 7,061 | | | | 0.8 | |
10.88% 10/15/2025 | |
| 9/25/15-
9/30/15 |
| | | 21,052 | | | | 21,210 | | | | 2.3 | |
Opal Acquisition, Inc. 8.88% 12/15/2021 | |
| 4/15/14-
8/5/15 |
| | | 47,644 | | | | 43,594 | | | | 4.8 | |
Paramount Resources Ltd. 6.88% 6/30/2023 | |
| 5/21/15-
6/3/15 |
| | | 11,047 | | | | 9,460 | | | | 1.0 | |
Parsley Energy LLC / Parsley Finance Corp. 7.50% 2/15/2022 | |
| 1/15/15-
9/18/15 |
| | | 15,536 | | | | 14,761 | | | | 1.6 | |
Pinnacle Operating Corp. 9.00% 11/15/2020 | |
| 3/28/14-
6/22/15 |
| | | 18,373 | | | | 17,323 | | | | 1.9 | |
Platform Specialty Products Corp. 6.50% 2/1/2022 | |
| 9/9/15-
9/22/15 |
| | | 8,758 | | | | 7,740 | | | | 0.9 | |
Quicken Loans, Inc. 5.75% 5/1/2025 | | | 5/1/15 | | | | 4,030 | | | | 3,790 | | | | 0.4 | |
Range Resources Corp. 4.88% 5/15/2025 | |
| 5/7/15-
7/7/15 |
| | | 7,408 | | | | 6,675 | | | | 0.7 | |
| | |
| Artisan Partners Funds | | 49 |
| | | | | | | | | | | | | | | | |
Security | | Acquisition
Date(s) | | | Cost | | | Value | | | Percentage
of Total
Net Assets | |
Roofing Supply Group LLC / Roofing Supply Finance, Inc. 10.00% 6/1/2020 | |
| 6/10/14-
7/14/15 |
| | $ | 6,879 | | | $ | 7,358 | | | | 0.8 | % |
RSP Permian, Inc. 6.63% 10/1/2022 | | | 8/5/15 | | | | 496 | | | | 480 | | | | 0.1 | |
Schaeffler Finance BV 4.75% 5/15/2023 | |
| 3/27/15-
7/1/15 |
| | | 3,474 | | | | 3,378 | | | | 0.4 | |
Schaeffler Holding Finance BV 6.25% 11/15/2019 | |
| 10/21/14-
4/1/15 |
| | | 5,126 | | | | 5,300 | | | | 0.6 | |
6.75% 11/15/2022 | |
| 10/21/14-
12/19/14 |
| | | 4,588 | | | | 4,837 | | | | 0.5 | |
TPC Group, Inc. 8.75% 12/15/2020 | |
| 7/15/15-
9/14/15 |
| | | 7,061 | | | | 6,614 | | | | 0.7 | |
USI, Inc. 7.75% 1/15/2021 | |
| 3/20/14-
9/30/15 |
| | | 56,617 | | | | 55,367 | | | | 6.1 | |
Valeant Pharmaceuticals International, Inc. | | | | | | | | | | | | | | | | |
5.88% 5/15/2023 | | | 3/13/15 | | | | 2,000 | | | | 1,917 | | | | 0.2 | |
6.13% 4/15/2025 | |
| 3/13/15-
6/18/15 |
| | | 4,066 | | | | 3,832 | | | | 0.4 | |
6.38% 10/15/2020 | |
| 4/29/14-
5/11/15 |
| | | 8,873 | | | | 8,452 | | | | 0.9 | |
Virgin Media Secured Finance plc 5.25% 1/15/2026 | |
| 3/17/15-
9/14/15 |
| | | 14,756 | | | | 13,800 | | | | 1.5 | |
Wayne Merger Sub LLC 8.25% 8/1/2023 | |
| 7/30/15-
8/5/15 |
| | | 8,249 | | | | 7,899 | | | | 0.9 | |
WR Grace & Co-Conn 5.13% 10/1/2021 | | | 7/8/15 | | | | 2,024 | | | | 1,975 | | | | 0.2 | |
York Risk Services Holding Corp. 8.50% 10/1/2022 | |
| 9/17/14-
7/23/15 |
| | | 29,451 | | | | 25,500 | | | | 2.8 | |
| | | | | | | | | | | | | | | | |
Total | | | | | | | | | | $ | 529,332 | | | | 57.9 | % |
| | | | | | | | | | | | | | | | |
| (2) | The Fund considers the company to be from outside of the United States. See the Fund’s Statement of Additional Information for a description of the methodology used for issuer country classifications. |
| | | | | | |
Security | | Country | | Trading Currency | |
Altice Financing S.A. | | Luxembourg | | | U.S. dollar | |
Altice Finco S.A. | | Luxembourg | | | U.S. dollar | |
Altice US Finance S.A. | | Luxembourg | | | U.S. dollar | |
CD&R Millennium Holdco 6 S.a.r.l., Second Lien Term Loan | | Germany | | | U.S. dollar | |
Cimpress N.V. | | Netherlands | | | U.S. dollar | |
Endo Finance LLC / Endo Ltd. / Endo Finco, Inc. | | Ireland | | | U.S. dollar | |
Mallinckrodt International Finance S.A. / Mallinckrodt CB LLC | | Luxembourg | | | U.S. dollar | |
Paramount Resources Ltd. | | Canada | | | U.S. dollar | |
RGL Reservoir Operations, Inc., First Lien Term Loan | | Canada | | | U.S. dollar | |
Schaeffler Finance BV | | Netherlands | | | U.S. dollar | |
Schaeffler Holding Finance BV, PIK | | Netherlands | | | U.S. dollar | |
Valeant Pharmaceuticals International, Inc. | | Canada | | | U.S. dollar | |
Virgin Media Secured Finance plc | | United Kingdom | | | U.S. dollar | |
| (3) | Valued at a fair value in accordance with procedures established by the board of directors of Artisan Partners Funds. In total, securities valued at a fair value rounds to less than $1, or less than 0.1% of total net assets. See notes 2(a) and 3 in Notes to Financial Statements for additional information. |
| (4) | Security has been deemed illiquid under procedures established by the board of directors of Artisan Partners Funds. In total, the value of securities deemed illiquid was $21,822, or 2.4% of total net assets. |
| (5) | Represents escrow for past due interest. |
| (6) | Amount rounds to less than $1. |
| (7) | Floating rate instruments, the rate disclosed was as of September 30, 2015. |
| | | | | | | | | | | | |
Issuer | | Rate | | | Maturity | | | Value | |
U.S. Treasury Note | | | 1.750 | % | | | 5/15/2022 | | | $ | 93,909 | |
U.S. Treasury Note | | | 2.125 | % | | | 1/31/2021 | | | | 2,566 | |
| | | | | | | | | | | | |
| | | | | | | | | | $ | 96,475 | |
| | | | | | | | | | | | |
| (9) | Percentages for the various classifications relate to total net assets. |
Company names are as reported by a data service provider and in some cases are translations; a company’s legal name may be different.
(PIK) Payment-in-kind security, may pay interest/dividend in additional par/shares.
Pursuant to the terms of the following bank loan agreements, the portfolio had unfunded loan commitments of $85,000 or 9.3% of the total net assets as of September 30, 2015, which could be extended at the option of the borrower:
| | | | | | | | |
Borrower | | Unfunded
Principal
Amount | | | Unrealized
Appreciation
(Depreciation) | |
Beacon Roofing Supply, Inc. Bridge Term Loan | | $ | 45,000 | | | | - | |
Concordia Healthcare Corp. Bridge Term Loan | | | 25,000 | | | | - | |
Team Finance LLC Bridge Term Loan | | | 15,000 | | | | - | |
| | | | | | | | |
| | $ | 85,000 | | | | - | |
| | | | | | | | |
| | |
| 50 | | Artisan Partners Funds |
| | | | |
CREDIT DIVERSIFICATION - September 30, 2015 (Unaudited) | |
| | | Percentage
of Total
Investments | |
BBB | | | 2.4 | % |
BB | | | 18.6 | |
B | | | 19.8 | |
CCC | | | 42.4 | |
Unrated | | | 6.9 | |
Short-term investments | | | 9.9 | |
| | | | |
| | | 100.0 | % |
| | | | |
Credit quality ratings apply to the underlying holdings of the Fund and not the Fund itself. The credit quality ratings shown above reflect the highest rating assigned by either Standard & Poor’s or Moody’s Investor Services (shown using the rating scale of Standard & Poor’s). Investments designated as unrated are not rated by either rating agency. Credit quality ratings are subjective opinions, not statements of fact, and are subject to change.
High income securities are speculative, have a higher degree of default risk than higher-rate bonds and may increase the Fund’s volatility. The Fund typically invests a significant portion of its assets in lower-rated high income securities (e.g. CCC).
| | | | | | |
| TOP TEN HOLDINGS - September 30, 2015 | |
Company Name | | Country | | Percentage
of Total
Net Assets | |
USI, Inc. | | United States | | | 6.1 | % |
Altice S.A. | | Luxembourg | | | 4.9 | |
Opal Acquisition, Inc. | | United States | | | 4.8 | |
VEREIT, Inc. | | United States | | | 4.6 | |
Renaissance Learning, Inc. | | United States | | | 4.0 | |
Infinity Acquisition LLC / Infinity Acquisition Finance Corp. | | United States | | | 3.3 | |
Charter Communications, Inc. | | United States | | | 3.1 | |
York Risk Services Holding Corp. | | United States | | | 2.8 | |
Callon Petroleum Co. | | United States | | | 2.6 | |
Range Resources Corp. | | United States | | | 2.5 | |
| | | | | | |
Total | | | | | 38.7 | % |
| | | | | | |
For the purpose of determining the Fund’s top ten holdings, securities of the same issuer are aggregated to determine the weight in the Fund.
The accompanying notes are an integral part of the financial statements.
| | |
| Artisan Partners Funds | | 51 |
ARTISAN INTERNATIONAL FUND
Schedule of Investments – September 30, 2015
Dollar values in thousands
| | | | | | | | |
| | | Shares
Held | | | Value | |
| COMMON STOCKS AND EQUITY-LINKED SECURITIES - 95.1% | | | | | | | | |
| | | | | | | | |
| BELGIUM - 3.5% | | | | | | | | |
Anheuser-Busch InBev N.V.(1) | | | 2,921,468 | | | $ | 310,301 | |
Telenet Group Holding N.V.(1)(2) | | | 2,784,876 | | | | 159,684 | |
UCB S.A.(1) | | | 1,909,441 | | | | 149,447 | |
| | | | | | | | |
| | | | | | | 619,432 | |
| CHINA - 7.9% | | | | | | | | |
Baidu, Inc. (DR)(2) | | | 4,982,967 | | | | 684,710 | |
Beijing Enterprises Holdings Ltd.(1) | | | 7,227,000 | | | | 43,656 | |
Beijing Enterprises Water Group Ltd.(1)(2) | | | 25,373,000 | | | | 17,938 | |
Ping An Insurance Group Co. of China Ltd., Class H(1) | | | 39,827,452 | | | | 198,783 | |
Tencent Holdings Ltd.(1) | | | 26,465,977 | | | | 445,807 | |
| | | | | | | | |
| | | | | | | 1,390,894 | |
| FRANCE - 5.1% | | | | | | | | |
L’Oreal S.A.(1) | | | 834,171 | | | | 145,051 | |
LVMH Moet Hennessy Louis Vuitton SE(1) | | | 965,264 | | | | 164,715 | |
Orange S.A.(1) | | | 9,340,218 | | | | 141,253 | |
Pernod Ricard S.A.(1) | | | 1,530,613 | | | | 154,555 | |
Zodiac Aerospace(1) | | | 12,663,986 | | | | 289,876 | |
| | | | | | | | |
| | | | | | | 895,450 | |
| GERMANY - 10.9% | | | | | | | | |
Allianz SE(1) | | | 1,245,131 | | | | 195,156 | |
Bayer AG(1) | | | 6,428,066 | | | | 821,560 | |
Beiersdorf AG(1) | | | 3,027,329 | | | | 267,867 | |
Deutsche Post AG(1) | | | 895,742 | | | | 24,791 | |
Linde AG(1) | | | 3,003,331 | | | | 486,493 | |
Vonovia SE(1) | | | 3,036,296 | | | | 97,597 | |
Wirecard AG(1) | | | 657,781 | | | | 31,447 | |
| | | | | | | | |
| | | | | | | 1,924,911 | |
| HONG KONG - 3.4% | | | | | | | | |
AIA Group Ltd.(1) | | | 112,916,532 | | | | 587,905 | |
| | | | | | | | |
| INDIA - 2.3% | | | | | | | | |
Adani Ports & Special Economic Zone Ltd.(1) | | | 4,015,360 | | | | 18,360 | |
Housing Development Finance Corp. Ltd.(1) | | | 12,548,732 | | | | 232,343 | |
Infosys Ltd. (DR) | | | 7,916,055 | | | | 151,117 | |
| | | | | | | | |
| | | | | | | 401,820 | |
| IRELAND - 1.2% | | | | | | | | |
Ryanair Holdings plc, Equity-Linked Security(1)(3)(4)(5) | | | 14,798,334 | | | | 216,563 | |
| ITALY - 1.7% | | | | | | | | |
Mediaset S.p.A.(1) | | | 29,957,854 | | | $ | 138,082 | |
Telecom Italia S.p.A.(1)(2) | | | 134,312,202 | | | | 165,138 | |
| | | | | | | | |
| | | | | | | 303,220 | |
| JAPAN - 7.7% | | | | | | | | |
IHI Corp.(1) | | | 63,733,422 | | | | 164,099 | |
NGK Insulators Ltd.(1) | | | 12,110,861 | | | | 232,444 | |
Olympus Corp.(1) | | | 11,353,613 | | | | 353,560 | |
Ono Pharmaceutical Co., Ltd.(1) | | | 245,676 | | | | 29,221 | |
Sumitomo Mitsui Financial Group, Inc.(1) | | | 2,114,876 | | | | 80,508 | |
Toyota Motor Corp.(1) | | | 8,405,581 | | | | 494,369 | |
| | | | | | | | |
| | | | | | | 1,354,201 | |
| KOREA - 0.0%† | | | | | | | | |
Orion Corp.(1) | | | 2,079 | | | | 1,659 | |
| | | | | | | | |
| MEXICO - 2.6% | | | | | | | | |
Grupo Televisa S.A.B. (DR) | | | 17,606,674 | | | | 458,126 | |
| | | | | | | | |
| NETHERLANDS - 2.7% | | | | | | | | |
ASML Holding N.V.(1) | | | 5,468,032 | | | | 479,397 | |
| | | | | | | | |
| SPAIN - 1.2% | | | | | | | | |
Grifols S.A.(1) | | | 2,618,171 | | | | 108,298 | |
Grifols S.A. (DR) | | | 3,213,464 | | | | 97,689 | |
| | | | | | | | |
| | | | | | | 205,987 | |
| SWEDEN - 1.0% | | | | | | | | |
Swedbank AB, Class A(1) | | | 7,951,459 | | | | 175,867 | |
| | | | | | | | |
| SWITZERLAND - 13.5% | | | | | | | | |
Actelion Ltd.(1)(2) | | | 2,063,821 | | | | 262,533 | |
Adecco S.A.(1)(2) | | | 3,117,738 | | | | 228,608 | |
Credit Suisse Group AG(1)(2) | | | 7,829,215 | | | | 188,353 | |
Nestle S.A.(1) | | | 7,146,562 | | | | 538,182 | |
Novartis AG(1) | | | 2,694,560 | | | | 248,209 | |
Roche Holding AG(1)(5) | | | 1,943,046 | | | | 513,652 | |
Syngenta AG(1) | | | 1,243,737 | | | | 399,468 | |
| | | | | | | | |
| | | | | | | 2,379,005 | |
| UNITED KINGDOM - 14.2% | | | | | | | | |
Babcock International Group plc(1) | | | 6,578,411 | | | | 91,003 | |
Barclays plc(1) | | | 40,036,936 | | | | 148,019 | |
BT Group plc(1) | | | 37,743,373 | | | | 240,173 | |
Carnival plc(1) | | | 4,891,080 | | | | 252,461 | |
Croda International plc(1) | | | 4,733,690 | | | | 194,426 | |
Diageo plc(1) | | | 204,896 | | | | 5,514 | |
Imperial Tobacco Group plc(1) | | | 3,540,014 | | | | 183,225 | |
InterContinental Hotels Group plc(1) | | | 4,638,469 | | | | 160,412 | |
| | |
| 52 | | Artisan Partners Funds |
| | | | | | | | |
| | | Shares
Held | | | Value | |
| UNITED KINGDOM (CONTINUED) | | | | | |
International Consolidated Airlines Group S.A.(1)(2) | | | 36,611,708 | | | $ | 326,732 | |
Johnson Matthey plc(1) | | | 8,752,085 | | | | 325,104 | |
Lloyds Banking Group plc(1) | | | 222,151,976 | | | | 253,247 | |
WPP plc(1) | | | 14,962,129 | | | | 311,584 | |
| | | | | | | | |
| | | | | | | 2,491,900 | |
| UNITED STATES - 16.2% | | | | | | | | |
Autoliv, Inc. (DR)(1) | | | 1,854,247 | | | | 201,725 | |
Cognizant Technology Solutions Corp., Class A(2) | | | 5,003,427 | | | | 313,265 | |
Delphi Automotive plc | | | 4,666,735 | | | | 354,858 | |
Liberty Global plc, Class A(2) | | | 6,878,312 | | | | 295,355 | |
Liberty Global plc, Series C(2)(5) | | | 11,425,608 | | | | 468,678 | |
Liberty Global plc LiLAC, Class A(2) | | | 161,880 | | | | 5,454 | |
Liberty Global plc LiLAC, Class C(2)(5) | | | 354,965 | | | | 12,154 | |
Medtronic plc | | | 12,069,025 | | | | 807,901 | |
Royal Caribbean Cruises Ltd. | | | 2,050,707 | | | | 182,697 | |
TE Connectivity Ltd. | | | 1,528,203 | | | | 91,524 | |
WABCO Holdings, Inc.(2) | | | 1,039,890 | | | | 109,012 | |
| | | | | | | | |
| | | | | | | 2,842,623 | |
| | | | | | | | |
Total common stocks and equity-linked securities
(Cost $15,774,199) | | | | | | | 16,728,960 | |
| | | | | | | | |
| PREFERRED STOCKS - 1.3% | | | | | | | | |
| | | | | | | | |
| GERMANY - 1.3% | | | | | | | | |
Henkel AG & Co. KGaA(1)(5) | | | 1,491,630 | | | | 153,259 | |
Porsche Automobil Holding SE(1)(5) | | | 1,837,748 | | | | 78,219 | |
| | | | | | | | |
| | | | | | | 231,478 | |
| | | | | | | | |
Total preferred stocks
(Cost $262,274) | | | | | | | 231,478 | |
| | | Principal
Amount | | | | |
SHORT-TERM INVESTMENTS
(CASH EQUIVALENTS) - 3.5% | | | | | | | | |
| Repurchase agreement with Fixed Income Clearing Corporation, 0.00%, dated 9/30/15, due 10/1/15, maturity value $619,768 (Cost $619,768)(6) | | $ | 619,768 | | | $ | 619,768 | |
| | | | | | | | |
| | | | | | | | |
Total investments - 99.9%
(Cost $16,656,241) | | | | | | | 17,580,206 | |
| | | | | | | | |
Other assets less liabilities - 0.1% | | | | | | | 14,877 | |
| | | | | | | | |
| | | | | | | | |
Total net assets - 100.0%(7) | | | | | | $ | 17,595,083 | |
| | | | | | | | |
| † | Amount rounds to less than 0.1%. |
| (1) | Valued at a fair value in accordance with procedures established by the board of directors of Artisan Partners Funds. In total, securities valued at a fair value were $12,927,898, or 73.5% of total net assets. See notes 2(a) and 3 in Notes to Financial Statements for additional information. |
| (2) | Non-income producing security. |
| (3) | Security is restricted. The security was acquired in a transaction pursuant to Rule 144A of the Securities Act of 1933 on the date or during the period noted below. The shares of the security may be resold in transactions exempt from registration to qualified institutional buyers. |
| | | | | | | | | | | | | | | | |
Security | | Acquisition
Date(s) | | | Cost | | | Value | | | Percentage
of Total
Net Assets | |
Ryanair Holdings plc | |
| 11/14/2013-
7/15/2015 |
| | $ | 131,712 | | | $ | 216,563 | | | | 1.2 | % |
| (4) | Security is an equity-linked participation certificate issued by HSBC Bank plc. As described in 2(h) in Notes to Financial Statements, equity-linked participation certificates are subject to counterparty risk with respect to the bank or broker-dealer that issues them. |
| | | | | | | | | | | | |
Issuer | | Rate | | | Maturity | | | Value | |
U.S. Treasury Note | | | 2.125 | % | | | 12/31/2021 | | | $ | 87,148 | |
U.S. Treasury Bond | | | 3.125 | % | | | 2/15/2043 | | | | 545,020 | |
| | | | | | | | | | | | |
| | | | | | | | | | $ | 632,168 | |
| | | | | | | | | | | | |
| (7) | Percentages for the various classifications relate to total net assets. |
Company names are as reported by a data service provider and in some cases are translations; a company’s legal name may be different.
(DR) Depositary Receipt, voting rights may vary.
| | | | | | | | |
| PORTFOLIO DIVERSIFICATION - September 30, 2015 | |
Dollar values in thousands | | | | | | | | |
| | | Value | | | Percentage
of Total
Investments | |
Consumer Discretionary | | $ | 3,738,573 | | | | 21.3 | % |
Consumer Staples | | | 1,759,613 | | | | 10.0 | |
Financials | | | 2,157,778 | | | | 12.3 | |
Health Care | | | 3,392,070 | | | | 19.3 | |
Industrials | | | 1,745,144 | | | | 9.9 | |
Information Technology | | | 2,197,267 | | | | 12.5 | |
Materials | | | 1,405,491 | | | | 8.0 | |
Telecommunication Services | | | 546,564 | | | | 3.1 | |
Utilities | | | 17,938 | | | | 0.1 | |
Short-term investments | | | 619,768 | | | | 3.5 | |
| | | | | | | | |
Total investments | | $ | 17,580,206 | | | | 100.0 | % |
| | | | | | | | |
| | |
| Artisan Partners Funds | | 53 |
| | | | | | | | |
| CURRENCY EXPOSURE - September 30, 2015 | |
Dollar values in thousands | | | | | | | | |
| | | Value | | | Percentage
of Total
Investments | |
British pound | | $ | 2,491,900 | | | | 14.2 | % |
Euro | | | 4,562,186 | | | | 26.0 | |
Hong Kong dollar | | | 1,294,089 | | | | 7.4 | |
Indian rupee | | | 250,703 | | | | 1.4 | |
Japanese yen | | | 1,354,201 | | | | 7.7 | |
Korean won | | | 1,659 | | | | — | (1) |
Swedish krona | | | 377,592 | | | | 2.1 | |
Swiss franc | | | 2,379,005 | | | | 13.5 | |
U.S. dollar | | | 4,868,871 | | | | 27.7 | |
| | | | | | | | |
Total investments | | $ | 17,580,206 | | | | 100.0 | % |
| | | | | | | | |
| (1) | Represents less than 0.1% of total investments. |
| | | | | | |
| TOP TEN HOLDINGS - September 30, 2015 | |
Company Name | | Country | | Percentage
of Total
Net Assets | |
Bayer AG | | Germany | | | 4.7 | % |
Medtronic plc | | United States | | | 4.6 | |
Liberty Global plc | | United States | | | 4.4 | |
Baidu, Inc. | | China | | | 3.9 | |
AIA Group Ltd. | | Hong Kong | | | 3.4 | |
Nestle S.A. | | Switzerland | | | 3.0 | |
Roche Holding AG | | Switzerland | | | 2.9 | |
Toyota Motor Corp. | | Japan | | | 2.8 | |
Linde AG | | Germany | | | 2.8 | |
ASML Holding N.V. | | Netherlands | | | 2.7 | |
| | | | | | |
Total | | | | | 35.2 | % |
| | | | | | |
For the purpose of determining the Fund’s top ten holdings, securities of the same issuer are aggregated to determine the weight in the Fund.
The accompanying notes are an integral part of the financial statements.
| | |
| 54 | | Artisan Partners Funds |
ARTISAN INTERNATIONAL SMALL CAP FUND
Schedule of Investments – September 30, 2015
Dollar values in thousands
| | | | | | | | |
| | | Shares
Held | | | Value | |
| COMMON STOCKS - 91.2% | | | | | | | | |
| | | | | | | | |
| CANADA - 1.2% | | | | | | | | |
CAE, Inc. | | | 1,075,211 | | | $ | 11,393 | |
| | | | | | | | |
| CHINA - 17.9% | | | | | | | | |
21Vianet Group, Inc. (DR)(1) | | | 2,323,899 | | | | 42,481 | |
Beijing Enterprises Water Group Ltd.(1)(2) | | | 74,166,000 | | | | 52,433 | |
China Everbright International Ltd.(2) | | | 33,717,000 | | | | 47,792 | |
China Oil & Gas Group Ltd.(1)(2) | | | 141,720,000 | | | | 8,869 | |
CT Environmental Group Ltd.(2) | | | 64,600,000 | | | | 20,181 | |
| | | | | | | | |
| | | | | | | 171,756 | |
| DENMARK - 3.1% | | | | | | | | |
Royal Unibrew AS(2) | | | 799,730 | | | | 29,986 | |
| | | | | | | | |
| FINLAND - 2.4% | | | | | | | | |
Huhtamaki Oyj(2) | | | 764,429 | | | | 23,379 | |
| | | | | | | | |
| FRANCE - 3.0% | | | | | | | | |
Elis S.A.(2) | | | 1,822,833 | | | | 28,420 | |
| | | | | | | | |
| GERMANY - 11.6% | | | | | | | | |
CompuGroup Medical AG(2) | | | 301,251 | | | | 9,951 | |
CTS Eventim AG & Co., KGaA(2) | | | 133,822 | | | | 4,954 | |
Norma Group SE(2) | | | 388,411 | | | | 19,062 | |
Wirecard AG(2) | | | 1,621,708 | | | | 77,531 | |
| | | | | | | | |
| | | | | | | 111,498 | |
| GREECE - 1.1% | | | | | | | | |
JUMBO S.A.(2) | | | 1,215,835 | | | | 10,692 | |
| | | | | | | | |
| IRELAND - 1.3% | | | | | | | | |
Glanbia plc(2) | | | 697,035 | | | | 12,978 | |
| | | | | | | | |
| ITALY - 10.6% | | | | | | | | |
Davide Campari-Milano S.p.A.(2) | | | 1,612,413 | | | | 12,865 | |
Ei Towers S.p.A.(2) | | | 492,863 | | | | 30,345 | |
Hera S.p.A.(2) | | | 1,637,053 | | | | 4,254 | |
Infrastrutture Wireless Italiane S.p.A.(1)(2) | | | 6,459,191 | | | | 31,674 | |
RAI Way S.p.A.(2) | | | 4,685,890 | | | | 22,429 | |
| | | | | | | | |
| | | | | | | 101,567 | |
| JAPAN - 0.8% | | | | | | | | |
Sugi Holdings Co., Ltd.(2) | | | 164,800 | | | | 7,425 | |
| | | | | | | | |
| SINGAPORE - 1.3% | | | | | | | | |
Petra Foods Ltd.(2) | | | 6,976,900 | | | | 12,314 | |
| SPAIN - 9.4% | | | | | | | | |
Almirall S.A.(2) | | | 1,452,236 | | | $ | 25,916 | |
Cellnex Telecom SAU(1)(2) | | | 1,487,419 | | | | 25,312 | |
Ebro Foods S.A.(2) | | | 1,070,953 | | | | 21,058 | |
Inmobiliaria Colonial S.A.(1)(2) | | | 3,860,023 | | | | 2,686 | |
Melia Hotels International S.A.(2) | | | 1,081,665 | | | | 15,061 | |
| | | | | | | | |
| | | | | | | 90,033 | |
| SWEDEN - 3.0% | | | | | | | | |
Cloetta AB, Class B(1)(2) | | | 8,656,323 | | | | 24,745 | |
Meda AB, Class A(2) | | | 306,393 | | | | 4,387 | |
| | | | | | | | |
| | | | | | | 29,132 | |
| SWITZERLAND - 4.7% | | | | | | | | |
Comet Holding AG(1)(2)(3) | | | 40,085 | | | | 27,745 | |
Tecan Group AG(2) | | | 126,478 | | | | 17,845 | |
| | | | | | | | |
| | | | | | | 45,590 | |
| TAIWAN - 4.3% | | | | | | | | |
Ginko International Co., Ltd.(2)(3) | | | 4,043,000 | | | | 40,930 | |
| | | | | | | | |
| UNITED KINGDOM - 15.5% | | | | | | | | |
Babcock International Group plc(2) | | | 2,287,357 | | | | 31,642 | |
Cable & Wireless Communications plc(2) | | | 19,331,681 | | | | 16,243 | |
Dignity plc(2) | | | 498,058 | | | | 17,950 | |
Essentra plc(2) | | | 1,462,380 | | | | 17,430 | |
Hays plc(2) | | | 10,744,455 | | | | 24,978 | |
Rathbone Brothers plc(2) | | | 559,329 | | | | 17,453 | |
Spire Healthcare Group plc(2) | | | 1,317,955 | | | | 7,193 | |
Synergy Health plc(1)(2) | | | 503,914 | | | | 16,565 | |
| | | | | | | | |
| | | | | | | 149,454 | |
| | | | | | | | |
Total common stocks
(Cost $720,567) | | | | | | | 876,547 | |
| | | Principal
Amount | | | | |
SHORT-TERM INVESTMENTS
(CASH EQUIVALENTS) - 8.2% | | | | | | | | |
| Repurchase agreement with Fixed Income Clearing Corporation, 0.00%, dated 9/30/15, due 10/1/15, maturity value $78,327 (Cost $78,327)(4) | | $ | 78,327 | | | $ | 78,327 | |
| | | | | | | | |
| | | | | | | | |
Total investments - 99.4%
(Cost $798,894) | | | | | | | 954,874 | |
| | | | | | | | |
Other assets less liabilities - 0.6% | | | | | | | 6,161 | |
| | | | | | | | |
| | | | | | | | |
Total net assets - 100.0%(5) | | | | | | $ | 961,035 | |
| | | | | | | | |
| | |
| Artisan Partners Funds | | 55 |
| (1) | Non-income producing security. |
| (2) | Valued at a fair value in accordance with procedures established by the board of directors of Artisan Partners Funds. In total, securities valued at a fair value were $822,673, or 85.6% of total net assets. See notes 2(a) and 3 in Notes to Financial Statements for additional information. |
| (3) | Affiliated company as defined by the Investment Company Act of 1940, as amended. See note 11 in Notes to Financial Statements for additional information. |
| | | | | | | | | | | | |
Issuer | | Rate | | | Maturity | | | Value | |
U.S. Treasury Notes | | | 2.125 | % | | | 6/30/2022 | | | $ | 79,898 | |
| (5) | Percentages for the various classifications relate to total net assets. |
Company names are as reported by a data service provider and in some cases are translations; a company’s legal name may be different.
(DR) Depositary Receipt, voting rights may vary.
| | | | | | | | |
| PORTFOLIO DIVERSIFICATION - September 30, 2015 | |
Dollar values in thousands | |
| | | Value | | | Percentage
of Total
Investments | |
Consumer Discretionary | | $ | 71,086 | | | | 7.4 | % |
Consumer Staples | | | 121,371 | | | | 12.7 | |
Financials | | | 20,139 | | | | 2.1 | |
Health Care | | | 122,787 | | | | 12.9 | |
Industrials | | | 163,287 | | | | 17.1 | |
Information Technology | | | 178,102 | | | | 18.6 | |
Materials | | | 40,809 | | | | 4.3 | |
Telecommunication Services | | | 73,229 | | | | 7.7 | |
Utilities | | | 85,737 | | | | 9.0 | |
Short-term investments | | | 78,327 | | | | 8.2 | |
| | | | | | | | |
Total investments | | $ | 954,874 | | | | 100.0 | % |
| | | | | | | | |
| | | | | | | | |
| CURRENCY EXPOSURE - September 30, 2015 | |
Dollar values in thousands | |
| | | Value | | | Percentage
of Total
Investments | |
British pound | | $ | 149,454 | | | | 15.7 | % |
Canadian dollar | | | 11,393 | | | | 1.2 | |
Danish krone | | | 29,986 | | | | 3.1 | |
Euro | | | 378,567 | | | | 39.6 | |
Hong Kong dollar | | | 129,275 | | | | 13.5 | |
Japanese yen | | | 7,425 | | | | 0.8 | |
Singapore dollar | | | 12,314 | | | | 1.3 | |
Swedish krona | | | 29,132 | | | | 3.0 | |
Swiss franc | | | 45,590 | | | | 4.8 | |
Taiwan dollar | | | 40,930 | | | | 4.3 | |
U.S. dollar | | | 120,808 | | | | 12.7 | |
| | | | | | | | |
Total investments | | $ | 954,874 | | | | 100.0 | % |
| | | | | | | | |
| | | | | | |
| TOP TEN HOLDINGS - September 30, 2015 | |
Company Name | | Country | | Percentage
of Total
Net Assets | |
Wirecard AG | | Germany | | | 8.1 | % |
Beijing Enterprises Water Group Ltd. | | China | | | 5.5 | |
China Everbright International Ltd. | | China | | | 5.0 | |
21Vianet Group, Inc. | | China | | | 4.4 | |
Ginko International Co., Ltd. | | Taiwan | | | 4.3 | |
Infrastrutture Wireless Italiane S.p.A. | | Italy | | | 3.3 | |
Babcock International Group plc | | United Kingdom | | | 3.3 | |
Ei Towers S.p.A. | | Italy | | | 3.2 | |
Royal Unibrew AS | | Denmark | | | 3.1 | |
Elis S.A. | | France | | | 3.0 | |
| | | | | | |
Total | | | | | 43.2 | % |
| | | | | | |
For the purpose of determining the Fund’s top ten holdings, securities of the same issuer are aggregated to determine the weight in the Fund.
The accompanying notes are an integral part of the financial statements.
| | |
| 56 | | Artisan Partners Funds |
ARTISAN INTERNATIONAL VALUE FUND
Schedule of Investments – September 30, 2015
Dollar values in thousands
| | | | | | | | |
| | | Shares
Held | | | Value | |
| COMMON STOCKS - 85.9% | | | | | | | | |
| | | | | | | | |
| BELGIUM - 2.1% | | | | | | | | |
Groupe Bruxelles Lambert S.A.(1) | | | 3,022,945 | | | $ | 228,327 | |
| | | | | | | | |
| BRAZIL - 1.6% | | | | | | | | |
Telefonica Brasil S.A. (DR) | | | 18,793,447 | | | | 171,584 | |
| | | | | | | | |
| CANADA - 1.9% | | | | | | | | |
Imperial Oil Ltd. | | | 6,427,899 | | | | 203,650 | |
| | | | | | | | |
| CHINA - 3.4% | | | | | | | | |
Baidu, Inc. (DR)(2) | | | 1,921,888 | | | | 264,087 | |
New Oriental Education & Technology Group, Inc. (DR) | | | 4,849,157 | | | | 98,001 | |
| | | | | | | | |
| | | | | | | 362,088 | |
| DENMARK - 4.7% | | | | | | | | |
Carlsberg AS, Class B(1) | | | 2,750,049 | | | | 211,638 | |
ISS AS(1)(3) | | | 8,567,470 | | | | 284,979 | |
| | | | | | | | |
| | | | | | | 496,617 | |
| FRANCE - 1.6% | | | | | | | | |
Sodexo S.A.(1) | | | 619,018 | | | | 51,345 | |
Vivendi S.A.(1) | | | 5,089,061 | | | | 120,483 | |
| | | | | | | | |
| | | | | | | 171,828 | |
| GERMANY - 1.4% | | | | | | | | |
Deutsche Boerse AG(1) | | | 1,740,514 | | | | 149,832 | |
| | | | | | | | |
| JAPAN - 4.8% | | | | | | | | |
Credit Saison Co., Ltd.(1) | | | 6,621,947 | | | | 120,517 | |
Kao Corp.(1) | | | 555,723 | | | | 25,249 | |
Stanley Electric Co., Ltd.(1)(3) | | | 9,306,804 | | | | 186,432 | |
Tokyo Electron Ltd.(1) | | | 3,866,435 | | | | 182,752 | |
| | | | | | | | |
| | | | | | | 514,950 | |
| KOREA - 5.4% | | | | | | | | |
Kia Motors Corp.(1) | | | 3,282,069 | | | | 148,875 | |
Samsung Electronics Co., Ltd.(1) | | | 439,407 | | | | 422,576 | |
| | | | | | | | |
| | | | | | | 571,451 | |
| NETHERLANDS - 6.0% | | | | | | | | |
ING Groep N.V. (DR)(1) | | | 29,806,293 | | | | 423,121 | |
RELX N.V.(1) | | | 3,754,955 | | | | 61,305 | |
TNT Express N.V.(1) | | | 19,487,155 | | | | 148,468 | |
| | | | | | | | |
| | | | | | | 632,894 | |
| NORWAY - 1.7% | | | | | | | | |
Aker Solutions ASA(1)(3) | | | 17,389,284 | | | $ | 60,172 | |
Orkla ASA(1) | | | 15,900,871 | | | | 118,117 | |
| | | | | | | | |
| | | | | | | 178,289 | |
| SWITZERLAND - 14.4% | | | | | | | | |
ABB Ltd.(1)(2) | | | 19,604,065 | | | | 347,179 | |
Adecco S.A.(1)(2) | | | 2,063,523 | | | | 151,308 | |
Novartis AG(1) | | | 2,838,705 | | | | 261,487 | |
Panalpina Welttransport Holding AG(1)(3) | | | 1,988,088 | | | | 217,607 | |
Pargesa Holding S.A.(1) | | | 1,335,129 | | | | 78,443 | |
UBS Group AG(1) | | | 25,253,504 | | | | 467,976 | |
| | | | | | | | |
| | | | | | | 1,524,000 | |
| UNITED KINGDOM - 23.9% | | | | | | | | |
Amec Foster Wheeler plc(1) | | | 9,614,979 | | | | 104,478 | |
Compass Group plc(1) | | | 32,149,323 | | | | 513,267 | |
Diageo plc(1) | | | 5,030,653 | | | | 135,377 | |
Lloyds Banking Group plc(1) | | | 212,233,209 | | | | 241,940 | |
QinetiQ Group plc(1) | | | 25,117,294 | | | | 85,824 | |
RELX plc(1) | | | 24,496,427 | | | | 420,374 | |
Royal Bank of Scotland Group plc(1)(2) | | | 88,535,074 | | | | 423,069 | |
Serco Group plc(1)(2) | | | 23,525,317 | | | | 36,337 | |
TESCO plc(1) | | | 121,640,045 | | | | 338,003 | |
Unilever plc(DR) | | | 2,652,066 | | | | 108,151 | |
Vesuvius plc(1)(3) | | | 23,945,533 | | | | 127,891 | |
| | | | | | | | |
| | | | | | | 2,534,711 | |
| UNITED STATES - 13.0% | | | | | | | | |
Accenture plc, Class A | | | 1,280,895 | | | | 125,861 | |
Arch Capital Group Ltd.(2)(3) | | | 6,225,338 | | | | 457,376 | |
Flextronics International Ltd.(2) | | | 18,656,741 | | | | 196,642 | |
Medtronic plc | | | 4,656,429 | | | | 311,701 | |
TE Connectivity Ltd. | | | 4,783,724 | | | | 286,497 | |
| | | | | | | | |
| | | | | | | 1,378,077 | |
| | | | | | | | |
Total common stocks
(Cost $8,156,937) | | | | | | | 9,118,298 | |
| | | | | | | | |
| PREFERRED STOCKS - 0.4% | | | | | | | | |
| | | | | | | | |
| BRAZIL - 0.1% | | | | | | | | |
Telefonica Brasil S.A.(4) | | | 1,874,694 | | | | 17,340 | |
| | | | | | | | |
| KOREA - 0.3% | | | | | | | | |
Samsung Electronics Co., Ltd.(1)(4) | | | 37,841 | | | | 29,485 | |
| | | | | | | | |
Total preferred stocks
(Cost $58,350) | | | | | | | 46,825 | |
| | |
| Artisan Partners Funds | | 57 |
| | | | | | | | |
| | | Principal
Amount | | | Value | |
SHORT-TERM INVESTMENTS
(CASH EQUIVALENTS) - 13.6% | | | | | | | | |
| Repurchase agreement with Fixed Income Clearing Corporation, 0.00%, dated 9/30/15, due 10/1/15, maturity value $1,440,116 (Cost $1,440,116)(5) | | $ | 1,440,116 | | | $ | 1,440,116 | |
| | | | | | | | |
| | | | | | | | |
Total investments - 99.9%
(Cost $9,655,403) | | | | | | | 10,605,239 | |
| | | | | | | | |
Other assets less liabilities - 0.1% | | | | | | | 13,750 | |
| | | | | | | | |
| | | | | | | | |
Total net assets - 100.0%(6) | | | | | | $ | 10,618,989 | |
| | | | | | | | |
| (1) | Valued at a fair value in accordance with procedures established by the board of directors of Artisan Partners Funds. In total, securities valued at a fair value were $6,924,233, or 65.2% of total net assets. See notes 2(a) and 3 in Notes to Financial Statements for additional information. |
| (2) | Non-income producing security. |
| (3) | Affiliated company as defined by the Investment Company Act of 1940, as amended. See note 11 in Notes to Financial Statements for additional information. |
| | | | | | | | | | | | |
Issuer | | Rate | | | Maturity | | | Value | |
U.S. Treasury Note | | | 1.750 | % | | | 4/30/2022 | | | $ | 45,640 | |
U.S. Treasury Note | | | 1.875 | % | | | 5/31/2022 | | | | 44,605 | |
U.S. Treasury Note | | | 2.000 | % | | | 8/31/2021 | | | | 153,375 | |
U.S. Treasury Note | | | 2.125 | % | | | 1/31/2021 | | | | 266,345 | |
U.S. Treasury Note | | | 2.125 | % | | | 8/15/2021 | | | | 180,442 | |
U.S. Treasury Note | | | 2.125 | % | | | 9/30/2021 | | | | 128,281 | |
U.S. Treasury Note | | | 2.125 | % | | | 12/31/2021 | | | | 396,226 | |
U.S. Treasury Note | | | 2.500 | % | | | 8/15/2023 | | | | 1,868 | |
U.S. Treasury Note | | | 3.125 | % | | | 5/15/2021 | | | | 164,320 | |
U.S. Treasury Bond | | | 3.625 | % | | | 8/15/2043 | | | | 37,365 | |
U.S. Treasury Bond | | | 8.000 | % | | | 11/15/2021 | | | | 50,456 | |
| | | | | | | | | | | | |
| | | | | | | | | | $ | 1,468,923 | |
| | | | | | | | | | | | |
| (6) | Percentages for the various classifications relate to total net assets. |
Company names are as reported by a data service provider and in some cases are translations; a company’s legal name may be different.
| (DR) | Depositary Receipt, voting rights may vary. |
| | | | | | | | |
| PORTFOLIO DIVERSIFICATION - September 30, 2015 | |
Dollar values in thousands | | | | | | | | |
| | | Value | | | Percentage
of Total
Investments | |
Consumer Discretionary | | $ | 1,600,082 | | | | 15.1 | % |
Consumer Staples | | | 936,535 | | | | 8.8 | |
Energy | | | 368,300 | | | | 3.5 | |
Financials | | | 2,590,601 | | | | 24.4 | |
Health Care | | | 573,188 | | | | 5.4 | |
Industrials | | | 1,399,593 | | | | 13.2 | |
Information Technology | | | 1,507,900 | | | | 14.2 | |
Telecommunication Services | | | 188,924 | | | | 1.8 | |
Short-term investments | | | 1,440,116 | | | | 13.6 | |
| | | | | | | | |
Total investments | | $ | 10,605,239 | | | | 100.0 | % |
| | | | | | | | |
| | | | | | | | |
| CURRENCY EXPOSURE - September 30, 2015 | |
Dollar values in thousands | | | | | | | | |
| | | Value | | | Percentage
of Total
Investments | |
Brazilian real | | $ | 17,340 | | | | 0.2 | % |
British pound | | | 2,426,560 | | | | 22.9 | |
Canadian dollar | | | 203,650 | | | | 1.9 | |
Danish krone | | | 496,617 | | | | 4.7 | |
Euro | | | 1,182,881 | | | | 11.1 | |
Japanese yen* | | | 514,950 | | | | 4.8 | |
Korean won | | | 600,936 | | | | 5.7 | |
Norwegian krone | | | 178,289 | | | | 1.7 | |
Swiss franc | | | 1,524,000 | | | | 14.4 | |
U.S. dollar | | | 3,460,016 | | | | 32.6 | |
| | | | | | | | |
Total investments | | $ | 10,605,239 | | | | 100.0 | % |
| | | | | | | | |
| * | Currency exposure is offset by foreign currency forward contracts noted in the table below (in thousands): |
| | | | | | | | | | | | | | | | | | | | |
Counterparty | | Contract
Settlement
Date | | Contract Amount | | | Unrealized
Depreciation | |
| | | Deliver | | | Receive | | |
| State Street Bank and Trust Company | | 2/10/2016 | | JPY | | | 28,655,327 | | | | USD | | | | 230,258 | | | $ | (9,267 | ) |
JPY - Japanese yen
USD - U.S. dollar
| | |
| 58 | | Artisan Partners Funds |
| | | | | | |
| TOP TEN HOLDINGS - September 30, 2015 | |
Company Name | | Country | | Percentage
of Total
Net Assets | |
Compass Group plc | | United Kingdom | | | 4.8 | % |
UBS Group AG | | Switzerland | | | 4.4 | |
Arch Capital Group Ltd. | | United States | | | 4.3 | |
Samsung Electronics Co., Ltd. | | Korea | | | 4.3 | |
ING Groep N.V. | | Netherlands | | | 4.0 | |
Royal Bank of Scotland Group plc | | United Kingdom | | | 4.0 | |
RELX plc | | United Kingdom | | | 4.0 | |
ABB Ltd. | | Switzerland | | | 3.3 | |
TESCO plc | | United Kingdom | | | 3.2 | |
Medtronic plc | | United States | | | 2.9 | |
| | | | | | |
Total | | | | | 39.2 | % |
| | | | | | |
For the purpose of determining the Fund’s top ten holdings, securities of the same issuer are aggregated to determine the weight in the Fund.
The accompanying notes are an integral part of the financial statements.
| | |
| Artisan Partners Funds | | 59 |
ARTISAN MID CAP FUND
Schedule of Investments – September 30, 2015
Dollar values in thousands
| | | | | | | | |
| | | Shares
Held | | | Value | |
| COMMON STOCKS - 94.9% | | | | | | | | |
| | | | | | | | |
| CONSUMER DISCRETIONARY - 20.8% | | | | | | | | |
Distributors - 3.8% | | | | | | | | |
LKQ Corp.(1) | | | 11,791,744 | | | $ | 334,414 | |
| | | | | | | | |
Hotels, Restaurants & Leisure - 3.2% | | | | | | | | |
ARAMARK | | | 1,452,258 | | | | 43,045 | |
Chipotle Mexican Grill, Inc.(1) | | | 338,811 | | | | 244,029 | |
| | | | | | | | |
| | | | | | | 287,074 | |
Household Durables - 0.3% | | | | | | | | |
Harman International Industries, Inc. | | | 244,436 | | | | 23,463 | |
| | | | | | | | |
Internet & Catalog Retail - 2.2% | | | | | | | | |
Ctrip.com International Ltd. (DR)(1)(2) | | | 464,173 | | | | 29,326 | |
JD.com, Inc. (DR)(1)(2) | | | 3,595,885 | | | | 93,709 | |
Netflix, Inc.(1) | | | 701,777 | | | | 72,466 | |
| | | | | | | | |
| | | | | | | 195,501 | |
Multiline Retail - 1.1% | | | | | | | | |
Dollar Tree, Inc.(1) | | | 1,411,695 | | | | 94,104 | |
| | | | | | | | |
Specialty Retail - 9.0% | | | | | | | | |
CarMax, Inc.(1) | | | 384,859 | | | | 22,830 | |
Michaels Cos., Inc.(1) | | | 3,014,132 | | | | 69,627 | |
Signet Jewelers Ltd. | | | 1,784,369 | | | | 242,906 | |
Tiffany & Co. | | | 755,164 | | | | 58,314 | |
Tractor Supply Co. | | | 2,264,686 | | | | 190,958 | |
Ulta Salon Cosmetics & Fragrance, Inc.(1) | | | 732,826 | | | | 119,707 | |
Williams-Sonoma, Inc. | | | 1,178,421 | | | | 89,972 | |
| | | | | | | | |
| | | | | | | 794,314 | |
Textiles, Apparel & Luxury Goods - 1.2% | | | | | | | | |
Lululemon Athletica, Inc.(1) | | | 877,074 | | | | 44,424 | |
Under Armour, Inc., Class A(1) | | | 679,236 | | | | 65,736 | |
| | | | | | | | |
| | | | | | | 110,160 | |
| CONSUMER STAPLES - 2.4% | | | | | | | | |
Beverages - 1.1% | | | | | | | | |
Monster Beverage Corp.(1) | | | 697,609 | | | | 94,275 | |
| | | | | | | | |
Food Products - 1.3% | | | | | | | | |
WhiteWave Foods Co., Class A(1) | | | 2,826,613 | | | | 113,488 | |
| ENERGY - 1.7% | | | | | | | | |
Oil, Gas & Consumable Fuels - 1.7% | | | | | | | | |
Cimarex Energy Co. | | | 981,269 | | | $ | 100,560 | |
Concho Resources, Inc.(1) | | | 473,587 | | | | 46,554 | |
| | | | | | | | |
| | | | | | | 147,114 | |
| FINANCIALS - 6.4% | | | | | | | | |
Banks - 1.1% | | | | | | | | |
PacWest Bancorp | | | 2,180,628 | | | | 93,353 | |
| | | | | | | | |
Capital Markets - 1.9% | | | | | | | | |
TD Ameritrade Holding Corp. | | | 5,393,454 | | | | 171,727 | |
| | | | | | | | |
Diversified Financial Services - 3.4% | | | | | | | | |
Intercontinental Exchange, Inc. | | | 225,251 | | | | 52,932 | |
McGraw Hill Financial, Inc. | | | 2,841,202 | | | | 245,764 | |
| | | | | | | | |
| | | | | | | 298,696 | |
| HEALTH CARE - 23.7% | | | | | | | | |
Biotechnology - 9.3% | | | | | | | | |
Alkermes plc(1) | | | 1,976,860 | | | | 115,982 | |
Cepheid, Inc.(1) | | | 2,626,212 | | | | 118,705 | |
Incyte Corp.(1) | | | 1,101,403 | | | | 121,518 | |
Regeneron Pharmaceuticals, Inc.(1) | | | 870,114 | | | | 404,725 | |
Seattle Genetics, Inc.(1) | | | 1,671,216 | | | | 64,442 | |
| | | | | | | | |
| | | | | | | 825,372 | |
Health Care Equipment & Supplies - 4.4% | | | | | | | | |
Becton Dickinson & Co. | | | 1,029,187 | | | | 136,532 | |
Boston Scientific Corp.(1) | | | 8,338,487 | | | | 136,834 | |
DexCom, Inc.(1) | | | 1,293,838 | | | | 111,089 | |
| | | | | | | | |
| | | | | | | 384,455 | |
Health Care Providers & Services - 3.5% | | | | | | | | |
Cigna Corp. | | | 1,470,835 | | | | 198,592 | |
Envision Healthcare Holdings, Inc.(1) | | | 3,004,284 | | | | 110,528 | |
| | | | | | | | |
| | | | | | | 309,120 | |
Health Care Technology - 3.6% | | | | | | | | |
athenahealth, Inc.(1) | | | 1,263,487 | | | | 168,486 | |
Cerner Corp.(1) | | | 2,507,201 | | | | 150,332 | |
| | | | | | | | |
| | | | | | | 318,818 | |
Life Sciences Tools & Services - 2.9% | | | | | | | | |
Illumina, Inc.(1) | | | 1,450,311 | | | | 254,994 | |
| | | | | | | | |
| INDUSTRIALS - 16.8% | | | | | | | | |
Aerospace & Defense - 1.6% | | | | | | | | |
Textron, Inc. | | | 3,825,892 | | | | 144,006 | |
| | |
| 60 | | Artisan Partners Funds |
| | | | | | | | |
| | | Shares
Held | | | Value | |
| INDUSTRIALS (CONTINUED) | | | | | | | | |
Building Products - 3.0% | | | | | | | | |
Fortune Brands Home & Security, Inc. | | | 5,503,647 | | | $ | 261,258 | |
| | | | | | | | |
Commercial Services & Supplies - 1.6% | | | | | | | | |
Waste Connections, Inc. | | | 2,900,200 | | | | 140,892 | |
| | | | | | | | |
Electrical Equipment - 4.7% | | | | | | | | |
AMETEK, Inc. | | | 6,058,607 | | | | 316,986 | |
Hubbell, Inc., Class B | | | 418,009 | | | | 35,510 | |
Sensata Technologies Holding N.V.(1) | | | 1,481,404 | | | | 65,686 | |
| | | | | | | | |
| | | | | | | 418,182 | |
Professional Services - 5.9% | | | | | | | | |
IHS, Inc., Class A(1)(3) | | | 3,101,243 | | | | 359,744 | |
Verisk Analytics, Inc., Class A(1) | | | 2,125,371 | | | | 157,086 | |
| | | | | | | | |
| | | | | | | 516,830 | |
| INFORMATION TECHNOLOGY - 20.8% | | | | | | | | |
Communications Equipment - 1.4% | | | | | | | | |
Palo Alto Networks, Inc.(1) | | | 726,573 | | | | 124,970 | |
| | | | | | | | |
Internet Software & Services - 2.4% | | | | | | | | |
LinkedIn Corp., Class A(1) | | | 482,138 | | | | 91,669 | |
Pandora Media, Inc.(1) | | | 4,034,469 | | | | 86,095 | |
Twitter, Inc.(1) | | | 1,301,483 | | | | 35,062 | |
| | | | | | | | |
| | | | | | | 212,826 | |
IT Services - 4.1% | | | | | | | | |
Gartner, Inc.(1) | | | 1,881,523 | | | | 157,916 | |
Global Payments, Inc. | | | 1,736,273 | | | | 199,203 | |
| | | | | | | | |
| | | | | | | 357,119 | |
Semiconductors & Semiconductor Equipment - 2.0% | | | | | | | | |
Applied Materials, Inc. | | | 1,751,737 | | | | 25,733 | |
Freescale Semiconductor Ltd.(1) | | | 1,817,181 | | | | 66,473 | |
NXP Semiconductors N.V.(1) | | | 945,678 | | | | 82,340 | |
| | | | | | | | |
| | | | | | | 174,546 | |
Software - 10.9% | | | | | | | | |
Activision Blizzard, Inc. | | | 979,418 | | | | 30,254 | |
Aspen Technology, Inc.(1) | | | 3,123,153 | | | | 118,399 | |
Autodesk, Inc.(1) | | | 1,954,716 | | | | 86,281 | |
Electronic Arts, Inc.(1) | | | 4,048,951 | | | | 274,316 | |
Guidewire Software, Inc.(1) | | | 1,473,293 | | | | 77,466 | |
Intuit, Inc. | | | 531,895 | | | | 47,206 | |
Mobileye N.V.(1)(2) | | | 1,336,219 | | | | 60,771 | |
ServiceNow, Inc.(1) | | | 2,224,788 | | | | 154,512 | |
Workday, Inc., Class A(1) | | | 1,673,891 | | | | 115,264 | |
| | | | | | | | |
| | | | | | | 964,469 | |
| MATERIALS - 1.3% | | | | | | | | |
Chemicals - 1.3% | | | | | | | | |
RPM International, Inc. | | | 2,737,047 | | | $ | 114,655 | |
| | | | | | | | |
| TELECOMMUNICATION SERVICES - 1.0% | | | | | | | | |
Diversified Telecommunication Services - 1.0% | | | | | | | | |
Level 3 Communications, Inc.(1) | | | 2,072,485 | | | | 90,547 | |
| | | | | | | | |
Total common stocks
(Cost $6,298,174) | | | | | | | 8,370,742 | |
| | | Principal
Amount | | | | |
SHORT-TERM INVESTMENTS
(CASH EQUIVALENTS) - 5.7% | | | | | | | | |
Repurchase agreement with Fixed Income Clearing Corporation, 0.00%, dated 9/30/15, due 10/1/15, maturity value $501,889
(Cost $501,889)(4) | | $ | 501,889 | | | $ | 501,889 | |
| | | | | | | | |
| | | | | | | | |
Total investments - 100.6%
(Cost $6,800,063) | | | | | | | 8,872,631 | |
| | | | | | | | |
Other assets less liabilities - (0.6)% | | | | | | | (48,823 | ) |
| | | | | | | | |
| | | | | | | | |
Total net assets - 100.0%(5) | | | | | | $ | 8,823,808 | |
| | | | | | | | |
| (1) | Non-income producing security. |
| (2) | The Fund considers the company to be from outside of the United States. See the Fund’s Statement of Additional Information for a description of the methodology used for issuer country classifications. |
| | | | | | |
Security | | Country | | Trading Currency | |
Ctrip.com International Ltd. (DR) | | China | | | U.S. dollar | |
JD.com, Inc. (DR) | | China | | | U.S. dollar | |
Mobileye N.V. | | Israel | | | U.S. dollar | |
| (3) | Affiliated company as defined by the Investment Company Act of 1940, as amended. See note 11 in Notes to Financial Statements for additional information. |
| | | | | | | | | | | | |
Issuer | | Rate | | | Maturity | | | Value | |
U.S. Treasury Bond | | | 3.625 | % | | | 8/15/2043 | | | $ | 511,929 | |
| (5) | Percentages for the various classifications relate to total net assets. |
Company names are as reported by a data service provider and in some cases are translations; a company’s legal name may be different.
(DR) Depositary Receipt, voting rights may vary.
| | |
| Artisan Partners Funds | | 61 |
| | | | | | |
| TOP TEN HOLDINGS - September 30, 2015 | |
Company Name | | Country | | Percentage
of Total
Net Assets | |
Regeneron Pharmaceuticals, Inc. | | United States | | | 4.6 | % |
IHS, Inc. | | United States | | | 4.1 | |
LKQ Corp. | | United States | | | 3.8 | |
AMETEK, Inc. | | United States | | | 3.6 | |
Electronic Arts, Inc. | | United States | | | 3.1 | |
Fortune Brands Home & Security, Inc. | | United States | | | 3.0 | |
Illumina, Inc. | | United States | | | 2.9 | |
McGraw Hill Financial, Inc. | | United States | | | 2.8 | |
Chipotle Mexican Grill, Inc. | | United States | | | 2.7 | |
Signet Jewelers Ltd. | | United States | | | 2.7 | |
| | | | | | |
Total | | | | | 33.3 | % |
| | | | | | |
For the purpose of determining the Fund’s top ten holdings, securities of the same issuer are aggregated to determine the weight in the Fund.
The accompanying notes are an integral part of the financial statements.
| | |
| 62 | | Artisan Partners Funds |
ARTISAN MID CAP VALUE FUND
Schedule of Investments – September 30, 2015
Dollar values in thousands
| | | | | | | | |
| | | Shares
Held | | | Value | |
| COMMON STOCKS - 94.3% | | | | | | | | |
| | | | | | | | |
| CONSUMER DISCRETIONARY - 17.6% | | | | | |
Auto Components - 1.6% | | | | | | | | |
Gentex Corp. | | | 6,551,642 | | | $ | 101,551 | |
| | | | | | | | |
Automobiles - 2.1% | | | | | | | | |
Harley-Davidson, Inc. | | | 2,483,122 | | | | 136,323 | |
| | | | | | | | |
Diversified Consumer Services - 2.0% | | | | | | | | |
H&R Block, Inc. | | | 3,679,070 | | | | 133,182 | |
| | | | | | | | |
Internet & Catalog Retail - 3.9% | | | | | | | | |
Liberty Interactive Corp., Class A(1) | | | 4,968,729 | | | | 130,330 | |
Liberty Ventures, Class A(1) | | | 3,003,197 | | | | 121,179 | |
| | | | | | | | |
| | | | | | | 251,509 | |
Leisure Equipment & Products - 0.9% | | | | | | | | |
Mattel, Inc. | | | 2,658,789 | | | | 55,994 | |
| | | | | | | | |
Media - 3.3% | | | | | | | | |
Omnicom Group, Inc. | | | 1,975,010 | | | | 130,153 | |
TEGNA, Inc. | | | 3,865,160 | | | | 86,541 | |
| | | | | | | | |
| | | | | | | 216,694 | |
Multiline Retail - 0.8% | | | | | | | | |
Nordstrom, Inc. | | | 743,803 | | | | 53,338 | |
| | | | | | | | |
Specialty Retail - 1.8% | | | | | | | | |
Bed Bath & Beyond, Inc.(1) | | | 2,086,595 | | | | 118,978 | |
| | | | | | | | |
Textiles, Apparel & Luxury Goods - 1.2% | | | | | | | | |
Coach, Inc. | | | 2,728,888 | | | | 78,947 | |
| | | | | | | | |
| CONSUMER STAPLES - 1.5% | | | | | | | | |
Food & Staples Retailing - 1.5% | | | | | | | | |
Kroger Co. | | | 2,744,417 | | | | 98,991 | |
| | | | | | | | |
| ENERGY - 6.3% | | | | | | | | |
Energy Equipment & Services - 1.2% | | | | | | | | |
Helmerich & Payne, Inc. | | | 782,211 | | | | 36,967 | |
McDermott International, Inc.(1) | | | 8,521,556 | | | | 36,643 | |
| | | | | | | | |
| | | | | | | 73,610 | |
| ENERGY (CONTINUED) | | | | | | | | |
Oil, Gas & Consumable Fuels - 5.1% | | | | | | | | |
Apache Corp. | | | 2,381,402 | | | $ | 93,256 | |
Denbury Resources, Inc. | | | 12,419,877 | | | | 30,305 | |
Hess Corp. | | | 1,633,681 | | | | 81,782 | |
SM Energy Co. | | | 2,205,315 | | | | 70,658 | |
Southwestern Energy Co.(1) | | | 4,555,655 | | | | 57,811 | |
| | | | | | | | |
| | | | | | | 333,812 | |
| FINANCIALS - 24.6% | | | | | | | | |
Banks - 3.3% | | | | | | | | |
Fifth Third Bancorp | | | 6,177,176 | | | | 116,811 | |
M&T Bank Corp. | | | 815,721 | | | | 99,477 | |
| | | | | | | | |
| | | | | | | 216,288 | |
Diversified Financial
Services - 1.7% | | | | | | | | |
Intercontinental Exchange, Inc. | | | 475,021 | | | | 111,625 | |
| | | | | | | | |
Insurance - 17.4% | | | | | | | | |
Alleghany Corp.(1) | | | 413,466 | | | | 193,547 | |
Allied World Assurance Co. Holdings AG | | | 2,791,011 | | | | 106,533 | |
Allstate Corp. | | | 2,569,521 | | | | 149,649 | |
Aon plc | | | 1,568,829 | | | | 139,014 | |
Arch Capital Group Ltd.(1)(2) | | | 2,442,126 | | | | 179,423 | |
Loews Corp. | | | 2,517,332 | | | | 90,976 | |
Progressive Corp. | | | 4,285,823 | | | | 131,318 | |
Torchmark Corp. | | | 2,585,472 | | | | 145,821 | |
| | | | | | | | |
| | | | | | | 1,136,281 | |
Real Estate Investment Trusts (REITs) - 2.2% | | | | | | | | |
American Capital Agency Corp. | | | 3,964,292 | | | | 74,132 | |
Hatteras Financial Corp. | | | 4,400,276 | | | | 66,664 | |
| | | | | | | | |
| | | | | | | 140,796 | |
| INDUSTRIALS - 14.7% | | | | | | | | |
Aerospace & Defense - 2.5% | | | | | | | | |
L-3 Communications Holdings, Inc. | | | 441,931 | | | | 46,191 | |
Rockwell Collins, Inc. | | | 1,454,376 | | | | 119,026 | |
| | | | | | | | |
| | | | | | | 165,217 | |
Commercial Services & Supplies - 1.6% | | | | | | | | |
Republic Services, Inc. | | | 2,550,702 | | | | 105,089 | |
| | | | | | | | |
Construction & Engineering - 5.7% | | | | | | | | |
Fluor Corp. | | | 2,508,587 | | | | 106,239 | |
Jacobs Engineering Group, Inc.(1) | | | 3,438,971 | | | | 128,721 | |
| | |
| Artisan Partners Funds | | 63 |
| | | | | | | | |
| | | Shares
Held | | | Value | |
| INDUSTRIALS (CONTINUED) | | | | | | | | |
Construction & Engineering (Continued) | | | | | | | | |
Quanta Services, Inc.(1) | | | 5,585,520 | | | $ | 135,225 | |
| | | | | | | | |
| | | | | | | 370,185 | |
Electrical Equipment - 1.0% | | | | | | | | |
Hubbell, Inc., Class B | | | 781,791 | | | | 66,413 | |
| | | | | | | | |
Machinery - 2.3% | | | | | | | | |
Joy Global, Inc.(2) | | | 4,199,074 | | | | 62,692 | |
Kennametal, Inc. | | | 3,588,403 | | | | 89,315 | |
| | | | | | | | |
| | | | | | | 152,007 | |
Professional Services - 1.0% | | | | | | | | |
ManpowerGroup, Inc. | | | 751,918 | | | | 61,574 | |
| | | | | | | | |
Road & Rail - 0.6% | | | | | | | | |
Ryder System, Inc. | | | 490,972 | | | | 36,352 | |
| | | | | | | | |
| INFORMATION TECHNOLOGY - 17.0% | | | | | | | | |
Electronic Equipment, Instruments & Components - 9.9% | | | | | | | | |
Arrow Electronics, Inc.(1) | | | 3,378,316 | | | | 186,753 | |
Avnet, Inc. | | | 4,920,841 | | | | 210,022 | |
FLIR Systems, Inc. | | | 5,067,474 | | | | 141,839 | |
Keysight Technologies, Inc.(1) | | | 3,387,691 | | | | 104,476 | |
| | | | | | | | |
| | | | | | | 643,090 | |
Internet Software & Services - 1.7% | | | | | | | | |
IAC/InterActiveCorp | | | 1,674,117 | | | | 109,270 | |
| | | | | | | | |
IT Services - 1.6% | | | | | | | | |
Teradata Corp.(1) | | | 3,586,024 | | | | 103,851 | |
| | | | | | | | |
Semiconductors & Semiconductor Equipment - 2.4% | | | | | | | | |
Analog Devices, Inc. | | | 2,203,006 | | | | 124,272 | |
KLA-Tencor Corp. | | | 630,330 | | | | 31,516 | |
| | | | | | | | |
| | | | | | | 155,788 | |
Software - 1.4% | | | | | | | | |
Synopsys, Inc.(1) | | | 2,052,805 | | | | 94,798 | |
| | | | | | | | |
| MATERIALS - 7.5% | | | | | | | | |
Chemicals - 3.8% | | | | | | | | |
Celanese Corp., Class A | | | 2,321,727 | | | | 137,377 | |
Mosaic Co. | | | 3,559,177 | | | | 110,726 | |
| | | | | | | | |
| | | | | | | 248,103 | |
Metals & Mining - 3.7% | | | | | | | | |
Goldcorp, Inc.(3) | | | 9,033,795 | | | | 113,103 | |
Kinross Gold Corp.(1)(3) | | | 21,630,389 | | | | 37,204 | |
| MATERIALS (CONTINUED) | | | | | | | | |
Metals & Mining (Continued) | | | | | | | | |
Nucor Corp. | | | 2,496,694 | | | $ | 93,751 | |
| | | | | | | | |
| | | | | | | 244,058 | |
| UTILITIES - 5.1% | | | | | | | | |
Electric Utilities - 2.9% | | | | | | | | |
Edison International | | | 1,502,005 | | | | 94,731 | |
OGE Energy Corp. | | | 3,479,267 | | | | 95,193 | |
| | | | | | | | |
| | | | | | | 189,924 | |
Multi-Utilities - 2.2% | | | | | | | | |
SCANA Corp. | | | 2,566,373 | | | | 144,384 | |
| | | | | | | | |
Total common stocks
(Cost $5,519,263) | | | | | | | 6,148,022 | |
| | | Principal
Amount | | | | |
SHORT-TERM INVESTMENTS
(CASH EQUIVALENTS) - 6.2% | | | | | | | | |
Repurchase agreement with Fixed Income Clearing Corporation, 0.00%, dated 9/30/15, due 10/1/15, maturity value $405,627
(Cost $405,627)(4) | | $ | 405,627 | | | $ | 405,627 | |
| | | | | | | | |
| | | | | | | | |
Total investments - 100.5%
(Cost $5,924,890) | | | | | | | 6,553,649 | |
| | | | | | | | |
Other assets less liabilities - (0.5)% | | | | | | | (33,889 | ) |
| | | | | | | | |
| | | | | | | | |
Total net assets - 100.0%(5) | | | | | | $ | 6,519,760 | |
| | | | | | | | |
| (1) | Non-income producing security. |
| (2) | Affiliated company as defined by the Investment Company Act of 1940, as amended. See note 11 in Notes to Financial Statements for additional information. |
| (3) | The Fund considers the company to be from outside of the United States. See the Fund’s Statement of Additional Information for a description of the methodology used for issuer country classifications. |
| | | | | | | | |
Security | | Country | | | Trading Currency | |
Goldcorp, Inc. | | | Canada | | | | U.S. dollar | |
Kinross Gold Corp. | | | Canada | | | | U.S. dollar | |
| | | | | | | | | | | | |
Issuer | | Rate | | | Maturity | | | Value | |
U.S. Treasury Note | | | 1.750 | % | | | 4/30/2022 | | | $ | 252,580 | |
U.S. Treasury Note | | | 1.750 | % | | | 5/15/2022 | | | | 80,173 | |
U.S. Treasury Note | | | 2.125 | % | | | 6/30/2022 | | | | 80,989 | |
| | | | | | | | | | | | |
| | | | | | | | | | $ | 413,742 | |
| | | | | | | | | | | | |
| (5) | Percentages for the various classifications relate to total net assets. |
| | |
| 64 | | Artisan Partners Funds |
Company names are as reported by a data service provider and in some cases are translations; a company’s legal name may be different.
| | | | | | | | |
| TOP TEN HOLDINGS - September 30, 2015 | |
Company Name | | Country | | | Percentage
of Total
Net Assets | |
Avnet, Inc. | | | United States | | | | 3.2 | % |
Alleghany Corp. | | | United States | | | | 3.0 | |
Arrow Electronics, Inc. | | | United States | | | | 2.9 | |
Arch Capital Group Ltd. | | | United States | | | | 2.8 | |
Allstate Corp. | | | United States | | | | 2.3 | |
Torchmark Corp. | | | United States | | | | 2.2 | |
SCANA Corp. | | | United States | | | | 2.2 | |
FLIR Systems, Inc. | | | United States | | | | 2.2 | |
Aon plc | | | United States | | | | 2.1 | |
Celanese Corp. | | | United States | | | | 2.1 | |
| | | | | | | | |
Total | | | | | | | 25.0 | % |
| | | | | | | | |
For the purpose of determining the Fund’s top ten holdings, securities of the same issuer are aggregated to determine the weight in the Fund.
The accompanying notes are an integral part of the financial statements.
| | |
| Artisan Partners Funds | | 65 |
ARTISAN SMALL CAP FUND
Schedule of Investments – September 30, 2015
Dollar values in thousands
| | | | | | | | |
| | | Shares
Held | | | Value | |
| COMMON STOCKS - 94.8% | | | | | | | | |
| | | | | | | | |
| CONSUMER DISCRETIONARY - 14.8% | | | | | | | | |
Auto Components - 1.8% | | | | | | | | |
Gentherm, Inc.(1) | | | 516,682 | | | $ | 23,209 | |
| | | | | | | | |
Distributors - 2.1% | | | | | | | | |
LKQ Corp.(1) | | | 953,900 | | | | 27,053 | |
| | | | | | | | |
Diversified Consumer Services - 2.7% | | | | | | | | |
Bright Horizons Family Solutions, Inc.(1) | | | 428,755 | | | | 27,543 | |
Nord Anglia Education, Inc.(1) | | | 289,346 | | | | 5,883 | |
| | | | | | | | |
| | | | | | | 33,426 | |
Hotels, Restaurants & Leisure - 3.2% | | | | | | | | |
Dunkin’ Brands Group, Inc. | | | 811,259 | | | | 39,752 | |
| | | | | | | | |
Internet & Catalog Retail - 0.3% | | | | | | | | |
MakeMyTrip Ltd.(1)(2) | | | 322,407 | | | | 4,433 | |
| | | | | | | | |
Media - 0.7% | | | | | | | | |
Imax Corp.(1) | | | 246,912 | | | | 8,343 | |
| | | | | | | | |
Multiline Retail - 0.9% | | | | | | | | |
Burlington Stores, Inc.(1) | | | 216,778 | | | | 11,064 | |
| | | | | | | | |
Specialty Retail - 2.2% | | | | | | | | |
Boot Barn Holdings, Inc.(1) | | | 203,042 | | | | 3,742 | |
Restoration Hardware Holdings, Inc.(1) | | | 253,186 | | | | 23,625 | |
| | | | | | | | |
| | | | | | | 27,367 | |
Textiles, Apparel & Luxury Goods - 0.9% | | | | | | | | |
Deckers Outdoor Corp.(1) | | | 199,818 | | | | 11,601 | |
| | | | | | | | |
| CONSUMER STAPLES - 1.0% | | | | | | | | |
Food & Staples Retailing - 1.0% | | | | | | | | |
PriceSmart, Inc. | | | 159,099 | | | | 12,305 | |
| | | | | | | | |
| ENERGY - 1.4% | | | | | | | | |
Oil, Gas & Consumable Fuels - 1.4% | | | | | | | | |
Diamondback Energy, Inc.(1) | | | 103,600 | | | | 6,692 | |
Oasis Petroleum, Inc.(1) | | | 494,897 | | | | 4,296 | |
SemGroup Corp., Class A | | | 150,237 | | | | 6,496 | |
| | | | | | | | |
| | | | | | | 17,484 | |
| HEALTH CARE - 22.6% | | | | | | | | |
Biotechnology - 8.0% | | | | | | | | |
Agios Pharmaceuticals, Inc.(1) | | | 36,996 | | | | 2,612 | |
| HEALTH CARE (CONTINUED) | | | | | | | | |
Biotechnology (Continued) | | | | | | | | |
Alnylam Pharmaceuticals, Inc.(1) | | | 135,843 | | | $ | 10,916 | |
Bluebird Bio, Inc.(1) | | | 54,670 | | | | 4,677 | |
Cepheid, Inc.(1) | | | 823,167 | | | | 37,207 | |
Exact Sciences Corp.(1) | | | 816,141 | | | | 14,682 | |
Incyte Corp.(1) | | | 173,767 | | | | 19,172 | |
Isis Pharmaceuticals, Inc.(1) | | | 41,726 | | | | 1,687 | |
Seattle Genetics, Inc.(1) | | | 249,052 | | | | 9,603 | |
| | | | | | | | |
| | | | | | | 100,556 | |
Health Care Equipment & Supplies - 7.7% | | | | | | | | |
DexCom, Inc.(1) | | | 796,694 | | | | 68,404 | |
GenMark Diagnostics, Inc.(1) | | | 1,265,403 | | | | 9,959 | |
K2M Group Holdings, Inc.(1) | | | 284,077 | | | | 5,284 | |
Nevro Corp.(1) | | | 139,286 | | | | 6,461 | |
NuVasive, Inc.(1) | | | 135,524 | | | | 6,535 | |
| | | | | | | | |
| | | | | | | 96,643 | |
Health Care Providers & Services - 2.2% | | | | | | | | |
Surgical Care Affiliates, Inc.(1) | | | 291,851 | | | | 9,541 | |
Team Health Holdings, Inc.(1) | | | 339,147 | | | | 18,324 | |
| | | | | | | | |
| | | | | | | 27,865 | |
Health Care Technology - 3.9% | | | | | | | | |
athenahealth, Inc.(1) | | | 326,491 | | | | 43,538 | |
Inovalon Holdings, Inc., Class A(1) | | | 235,674 | | | | 4,909 | |
| | | | | | | | |
| | | | | | | 48,447 | |
Life Sciences Tools & Services - 0.8% | | | | | | | | |
NeoGenomics, Inc.(1) | | | 1,724,783 | | | | 9,883 | |
| | | | | | | | |
| INDUSTRIALS - 16.9% | | | | | | | | |
Aerospace & Defense - 5.2% | | | | | | | | |
Taser International, Inc.(1) | | | 1,705,153 | | | | 37,556 | |
Teledyne Technologies, Inc.(1) | | | 304,500 | | | | 27,496 | |
| | | | | | | | |
| | | | | | | 65,052 | |
Air Freight & Logistics - 1.3% | | | | | | | | |
Forward Air Corp. | | | 399,750 | | | | 16,586 | |
| | | | | | | | |
Commercial Services & Supplies - 0.3% | | | | | | | | |
Brady Corp., Class A(3) | | | 179,012 | | | | 3,519 | |
| | | | | | | | |
Electrical Equipment - 5.9% | | | | | | | | |
Acuity Brands, Inc. | | | 394,093 | | | | 69,195 | |
Generac Holdings, Inc.(1) | | | 162,415 | | | | 4,887 | |
| | | | | | | | |
| | | | | | | 74,082 | |
| | |
| 66 | | Artisan Partners Funds |
| | | | | | | | |
| | | Shares
Held | | | Value | |
| INDUSTRIALS (CONTINUED) | | | | | | | | |
Machinery - 4.2% | | | | | | | | |
IDEX Corp. | | | 329,798 | | | $ | 23,515 | |
John Bean Technologies Corp. | | | 484,928 | | | | 18,548 | |
Proto Labs, Inc.(1) | | | 151,800 | | | | 10,171 | |
| | | | | | | | |
| | | | | | | 52,234 | |
| INFORMATION TECHNOLOGY - 38.1% | | | | | | | | |
Electronic Equipment, Instruments & Components - 3.7% | | | | | | | | |
Cognex Corp. | | | 936,917 | | | | 32,202 | |
FEI Co. | | | 93,573 | | | | 6,835 | |
National Instruments Corp. | | | 256,505 | | | | 7,128 | |
| | | | | | | | |
| | | | | | | 46,165 | |
Internet Software & Services - 15.2% | | | | | | | | |
Benefitfocus, Inc.(1) | | | 397,721 | | | | 12,429 | |
comScore, Inc.(1) | | | 170,596 | | | | 7,873 | |
CoStar Group, Inc.(1) | | | 229,131 | | | | 39,653 | |
Demandware, Inc.(1) | | | 345,937 | | | | 17,878 | |
GrubHub, Inc.(1) | | | 104,940 | | | | 2,554 | |
HomeAway, Inc.(1) | | | 589,884 | | | | 15,655 | |
MercadoLibre, Inc. | | | 158,232 | | | | 14,409 | |
Pandora Media, Inc.(1) | | | 1,390,821 | | | | 29,680 | |
Q2 Holdings, Inc.(1) | | | 623,611 | | | | 15,416 | |
SPS Commerce, Inc.(1) | | | 276,739 | | | | 18,788 | |
Textura Corp.(1) | | | 626,702 | | | | 16,194 | |
| | | | | | | | |
| | | | | | | 190,529 | |
IT Services - 1.8% | | | | | | | | |
Acxiom Corp.(1) | | | 503,965 | | | | 9,958 | |
WEX, Inc.(1) | | | 143,884 | | | | 12,495 | |
| | | | | | | | |
| | | | | | | 22,453 | |
Semiconductors & Semiconductor Equipment - 1.0% | | | | | | | | |
Cavium, Inc.(1) | | | 207,665 | | | | 12,745 | |
| | | | | | | | |
Software - 16.4% | | | | | | | | |
ACI Worldwide, Inc.(1) | | | 441,609 | | | | 9,327 | |
Aspen Technology, Inc.(1) | | | 315,051 | | | | 11,943 | |
Blackbaud, Inc. | | | 342,835 | | | | 19,240 | |
Ellie Mae, Inc.(1) | | | 173,653 | | | | 11,560 | |
Guidewire Software, Inc.(1) | | | 756,922 | | | | 39,799 | |
Proofpoint, Inc.(1) | | | 109,349 | | | | 6,596 | |
Solera Holdings, Inc. | | | 177,463 | | | | 9,583 | |
Tableau Software, Inc., Class A(1) | | | 176,470 | | | | 14,079 | |
Take-Two Interactive Software, Inc.(1) | | | 376,836 | | | | 10,826 | |
Tyler Technologies, Inc.(1) | | | 209,068 | | | | 31,216 | |
Ultimate Software Group, Inc.(1) | | | 230,785 | | | | 41,313 | |
| | | | | | | | |
| | | | | | | 205,482 | |
| | | | | | | | |
Total common stocks
(Cost $854,002) | | | | | | | 1,188,278 | |
| SHORT-TERM INVESTMENTS (CASH EQUIVALENTS) - 7.1% | | | | | | | | |
Repurchase agreement with Fixed Income Clearing Corporation, 0.00%, dated 9/30/15, due 10/1/15, maturity value $88,644
(Cost $88,644)(4) | | $ | 88,644 | | | $ | 88,644 | |
| | | | | | | | |
| | | | | | | | |
Total investments - 101.9%
(Cost $942,646) | | | | | | | 1,276,922 | |
| | | | | | | | |
Other assets less liabilities - (1.9)% | | | | | | | (23,662 | ) |
| | | | | | | | |
| | | | | | | | |
Total net assets - 100.0%(5) | | | | | | $ | 1,253,260 | |
| | | | | | | | |
| (1) | Non-income producing security. |
| (2) | The Fund considers the company to be from outside of the United States. See the Fund’s Statement of Additional Information for a description of the methodology used for issuer country classifications. |
| | | | | | | | |
Security | | Country | | | Trading Currency | |
MakeMyTrip Ltd. | | | India | | | | U.S. dollar | |
| | | | | | | | | | | | |
Issuer | | Rate | | | Maturity | | | Value | |
U.S. Treasury Note | | | 2.125 | % | | | 6/30/2022 | | | $ | 90,422 | |
| (5) | Percentages for the various classifications relate to total net assets. |
Company names are as reported by a data service provider and in some cases are translations; a company’s legal name may be different.
| | | | | | |
| TOP TEN HOLDINGS - September 30, 2015 | |
Company Name | | Country | | Percentage
of Total
Net Assets | |
Acuity Brands, Inc. | | United States | | | 5.5 | % |
DexCom, Inc. | | United States | | | 5.5 | |
athenahealth, Inc. | | United States | | | 3.5 | |
Ultimate Software Group, Inc. | | United States | | | 3.3 | |
Guidewire Software, Inc. | | United States | | | 3.2 | |
Dunkin’ Brands Group, Inc. | | United States | | | 3.2 | |
CoStar Group, Inc. | | United States | | | 3.2 | |
Taser International, Inc. | | United States | | | 3.0 | |
Cepheid, Inc. | | United States | | | 3.0 | |
Cognex Corp. | | United States | | | 2.6 | |
| | | | | | |
Total | | | | | 36.0 | % |
| | | | | | |
For the purpose of determining the Fund’s top ten holdings, securities of the same issuer are aggregated to determine the weight in the Fund.
The accompanying notes are an integral part of the financial statements.
| | |
| Artisan Partners Funds | | 67 |
ARTISAN SMALL CAP VALUE FUND
Schedule of Investments – September 30, 2015
Dollar values in thousands
| | | | | | | | |
| | | Shares
Held | | | Value | |
| COMMON STOCKS - 95.4% | | | | | | | | |
| | | | | | | | |
| CONSUMER DISCRETIONARY - 7.5% | | | | | | | | |
Auto Components - 1.4% | | | | | | | | |
Remy International, Inc. | | | 226,572 | | | $ | 6,627 | |
| | | | | | | | |
Hotels, Restaurants & Leisure - 0.1% | | | | | | | | |
J Alexander’s Holdings, Inc.(1) | | | 66,577 | | | | 664 | |
| | | | | | | | |
Household Durables - 0.6% | | | | | | | | |
NACCO Industries, Inc., Class A | | | 64,288 | | | | 3,057 | |
| | | | | | | | |
Media - 1.5% | | | | | | | | |
DreamWorks Animation SKG, Inc., Class A(1) | | | 234,791 | | | | 4,097 | |
Starz, Class A(1) | | | 82,725 | | | | 3,089 | |
| | | | | | | | |
| | | | | | | 7,186 | |
Specialty Retail - 3.9% | | | | | | | | |
America’s Car-Mart, Inc.(1) | | | 119,131 | | | | 3,942 | |
Finish Line, Inc., Class A | | | 114,734 | | | | 2,214 | |
Guess?, Inc. | | | 139,441 | | | | 2,978 | |
Rent-A-Center, Inc. | | | 421,595 | | | | 10,224 | |
| | | | | | | | |
| | | | | | | 19,358 | |
| CONSUMER STAPLES - 3.1% | | | | | | | | |
Beverages - 0.2% | | | | | | | | |
National Beverage Corp.(1) | | | 28,374 | | | | 872 | |
| | | | | | | | |
Food Products - 2.9% | | | | | | | | |
Dean Foods Co. | | | 253,099 | | | | 4,181 | |
Fresh Del Monte Produce, Inc. | | | 122,000 | | | | 4,820 | |
Sanderson Farms, Inc. | | | 78,161 | | | | 5,360 | |
| | | | | | | | |
| | | | | | | 14,361 | |
| ENERGY - 7.8% | | | | | | | | |
Energy Equipment & Services - 4.4% | | | | | | | | |
Era Group, Inc.(1) | | | 398,348 | | | | 5,963 | |
McDermott International, Inc.(1) | | | 237,871 | | | | 1,023 | |
Newpark Resources, Inc.(1) | | | 578,251 | | | | 2,961 | |
Patterson-UTI Energy, Inc. | | | 280,869 | | | | 3,690 | |
Superior Energy Services, Inc. | | | 308,205 | | | | 3,893 | |
Unit Corp.(1) | | | 378,163 | | | | 4,258 | |
| | | | | | | | |
| | | | | | | 21,788 | |
Oil, Gas & Consumable Fuels - 3.4% | | | | | | | | |
Cloud Peak Energy, Inc.(1) | | | 475,240 | | | | 1,250 | |
World Fuel Services Corp. | | | 437,616 | | | | 15,667 | |
| | | | | | | | |
| | | | | | | 16,917 | |
| FINANCIALS - 16.8% | | | | | | | | |
Banks - 2.2% | | | | | | | | |
Berkshire Hills Bancorp, Inc. | | | 191,835 | | | $ | 5,283 | |
Great Western Bancorp, Inc. | | | 215,258 | | | | 5,461 | |
| | | | | | | | |
| | | | | | | 10,744 | |
Capital Markets - 1.5% | | | | | | | | |
Capital Southwest Corp. | | | 117,846 | | | | 5,586 | |
Manning & Napier, Inc. | | | 245,906 | | | | 1,810 | |
| | | | | | | | |
| | | | | | | 7,396 | |
Diversified Financial
Services - 1.5% | | | | | | | | |
FNFV Group(1) | | | 385,464 | | | | 4,518 | |
PICO Holdings, Inc.(1) | | | 287,452 | | | | 2,782 | |
| | | | | | | | |
| | | | | | | 7,300 | |
Insurance - 3.5% | | | | | | | | |
Allied World Assurance Co. Holdings AG | | | 166,660 | | | | 6,361 | |
Enstar Group Ltd.(1) | | | 29,180 | | | | 4,377 | |
RenaissanceRe Holdings Ltd. | | | 62,148 | | | | 6,608 | |
| | | | | | | | |
| | | | | | | 17,346 | |
Real Estate Investment Trusts (REITs) - 6.4% | | | | | | | | |
Anworth Mortgage Asset Corp. | | | 861,347 | | | | 4,255 | |
Campus Crest Communities, Inc. | | | 500,448 | | | | 2,662 | |
CYS Investments, Inc. | | | 397,914 | | | | 2,889 | |
Hatteras Financial Corp. | | | 367,499 | | | | 5,568 | |
Post Properties, Inc. | | | 75,524 | | | | 4,402 | |
Potlatch Corp. | | | 76,859 | | | | 2,213 | |
PS Business Parks, Inc. | | | 53,053 | | | | 4,211 | |
STORE Capital Corp. | | | 260,700 | | | | 5,386 | |
| | | | | | | | |
| | | | | | | 31,586 | |
Thrifts & Mortgage
Finance - 1.7% | | | | | | | | |
Dime Community Bancshares, Inc. | | | 218,670 | | | | 3,696 | |
Oritani Financial Corp. | | | 304,308 | | | | 4,753 | |
| | | | | | | | |
| | | | | | | 8,449 | |
| HEALTH CARE - 2.1% | | | | | | | | |
Health Care Providers &
Services - 1.1% | | | | | | | | |
Owens & Minor, Inc. | | | 168,421 | | | | 5,379 | |
| | | | | | | | |
Health Care Technology - 1.0% | | | | | | | | |
Vocera Communications, Inc.(1) | | | 444,475 | | | | 5,072 | |
| | | | | | | | |
| INDUSTRIALS - 32.9% | | | | | | | | |
Aerospace & Defense - 2.8% | | | | | | | | |
Cubic Corp. | | | 325,861 | | | | 13,667 | |
| | |
| 68 | | Artisan Partners Funds |
| | | | | | | | |
| | | Shares
Held | | | Value | |
| INDUSTRIALS (CONTINUED) | | | | | | | | |
Building Products - 1.7% | | | | | | | | |
Quanex Building Products Corp. | | | 462,866 | | | $ | 8,410 | |
| | | | | | | | |
Commercial Services &
Supplies - 3.2% | | | | | | | | |
ABM Industries, Inc. | | | 48,247 | | | | 1,318 | |
Quad/Graphics, Inc. | | | 180,320 | | | | 2,182 | |
Team, Inc.(1) | | | 201,653 | | | | 6,477 | |
Tetra Tech, Inc. | | | 233,949 | | | | 5,687 | |
| | | | | | | | |
| | | | | | | 15,664 | |
Construction & Engineering - 5.4% | | | | | | | | |
Aegion Corp.(1) | | | 288,021 | | | | 4,747 | |
EMCOR Group, Inc. | | | 392,282 | | | | 17,358 | |
MYR Group, Inc.(1) | | | 169,492 | | | | 4,441 | |
| | | | | | | | |
| | | | | | | 26,546 | |
Electrical Equipment - 6.0% | | | | | | | | |
AZZ, Inc. | | | 166,519 | | | | 8,108 | |
Encore Wire Corp. | | | 246,131 | | | | 8,041 | |
Franklin Electric Co., Inc. | | | 199,504 | | | | 5,432 | |
Powell Industries, Inc. | | | 268,402 | | | | 8,079 | |
| | | | | | | | |
| | | | | | | 29,660 | |
Machinery - 6.1% | | | | | | | | |
CLARCOR, Inc. | | | 54,340 | | | | 2,591 | |
Dynamic Materials Corp. | | | 151,148 | | | | 1,442 | |
Hyster-Yale Materials Handling, Inc. | | | 43,119 | | | | 2,493 | |
Kennametal, Inc. | | | 216,134 | | | | 5,380 | |
Mueller Industries, Inc. | | | 84,486 | | | | 2,499 | |
Timken Co. | | | 239,998 | | | | 6,597 | |
Valmont Industries, Inc. | | | 64,958 | | | | 6,164 | |
Woodward, Inc. | | | 78,887 | | | | 3,211 | |
| | | | | | | | |
| | | | | | | 30,377 | |
Marine - 1.2% | | | | | | | | |
Kirby Corp.(1) | | | 97,391 | | | | 6,033 | |
| | | | | | | | |
Professional Services - 0.5% | | | | | | | | |
FTI Consulting, Inc.(1) | | | 55,298 | | | | 2,295 | |
| | | | | | | | |
Road & Rail - 1.3% | | | | | | | | |
Celadon Group, Inc. | | | 128,786 | | | | 2,063 | |
Ryder System, Inc. | | | 60,221 | | | | 4,459 | |
| | | | | | | | |
| | | | | | | 6,522 | |
Trading Companies & Distributors - 4.7% | | | | | | | | |
Air Lease Corp. | | | 245,061 | | | | 7,577 | |
Applied Industrial Technologies, Inc. | | | 65,277 | | | | 2,491 | |
Kaman Corp. | | | 241,417 | | | | 8,655 | |
NOW, Inc.(1) | | | 308,046 | | | | 4,559 | |
| | | | | | | | |
| | | | | | | 23,282 | |
| INFORMATION TECHNOLOGY - 16.4% | | | | | | | | |
Communications Equipment - 0.5% | | | | | | | | |
ADTRAN, Inc. | | | 171,317 | | | $ | 2,501 | |
| | | | | | | | |
Electronic Equipment, Instruments & Components - 10.0% | | | | | | | | |
Anixter International, Inc.(1) | | | 87,064 | | | | 5,031 | |
Arrow Electronics, Inc.(1) | | | 220,431 | | | | 12,185 | |
Benchmark Electronics, Inc.(1) | | | 130,563 | | | | 2,841 | |
Dolby Laboratories, Inc., Class A | | | 51,743 | | | | 1,687 | |
FARO Technologies, Inc.(1) | | | 85,838 | | | | 3,004 | |
Knowles Corp.(1) | | | 221,007 | | | | 4,073 | |
Park Electrochemical Corp. | | | 433,310 | | | | 7,622 | |
Tech Data Corp.(1) | | | 189,065 | | | | 12,951 | |
| | | | | | | | |
| | | | | | | 49,394 | |
Internet Software & Services - 0.6% | | | | | | | | |
Blucora, Inc.(1) | | | 117,671 | | | | 1,620 | |
EarthLink Holdings Corp. | | | 144,406 | | | | 1,124 | |
| | | | | | | | |
| | | | | | | 2,744 | |
Semiconductors & Semiconductor Equipment - 4.0% | | | | | | | | |
MKS Instruments, Inc. | | | 215,491 | | | | 7,225 | |
Nanometrics, Inc.(1) | | | 446,853 | | | | 5,425 | |
Ultratech, Inc.(1) | | | 450,483 | | | | 7,217 | |
| | | | | | | | |
| | | | | | | 19,867 | |
Software - 1.3% | | | | | | | | |
MicroStrategy, Inc., Class A(1) | | | 31,575 | | | | 6,204 | |
| | | | | | | | |
| MATERIALS - 6.4% | | | | | | | | |
Chemicals - 4.1% | | | | | | | | |
American Vanguard Corp. | | | 281,970 | | | | 3,260 | |
HB Fuller Co. | | | 420,969 | | | | 14,288 | |
Rayonier Advanced Materials, Inc. | | | 208,515 | | | | 1,276 | |
Sensient Technologies Corp. | | | 22,972 | | | | 1,408 | |
| | | | | | | | |
| | | | | | | 20,232 | |
Metals & Mining - 2.3% | | | | | | | | |
Alamos Gold, Inc., Class A(2) | | | 855,598 | | | | 3,157 | |
Carpenter Technology Corp. | | | 74,005 | | | | 2,203 | |
Globe Specialty Metals, Inc. | | | 212,896 | | | | 2,582 | |
TimkenSteel Corp. | | | 310,945 | | | | 3,147 | |
| | | | | | | | |
| | | | | | | 11,089 | |
| TELECOMMUNICATION SERVICES - 1.2% | | | | | | | | |
Diversified Telecommunication Services -1.2% | | | | | | | | |
Atlantic Tele-Network, Inc. | | | 83,142 | | | | 6,147 | |
| | | | | | | | |
| UTILITIES - 1.2% | | | | | | | | |
Electric Utilities - 1.2% | | | | | | | | |
ALLETE, Inc. | | | 56,299 | | | | 2,843 | |
| | |
| Artisan Partners Funds | | 69 |
| | | | | | | | |
| | | Shares
Held | | | Value | |
| UTILITIES (CONTINUED) | | | | | | | | |
Electric Utilities (Continued) | | | | | | | | |
Portland General Electric Co. | | | 79,321 | | | $ | 2,932 | |
| | | | | | | | |
| | | | | | | 5,775 | |
| | | | | | | | |
Total common stocks
(Cost $450,908) | | | | | | | 470,511 | |
| | | Principal
Amount | | | | |
SHORT-TERM INVESTMENTS
(CASH EQUIVALENTS) - 5.3% | | | | | | | | |
Repurchase agreement with Fixed Income Clearing Corporation, 0.00%, dated 9/30/15, due 10/1/15, maturity value $26,117
(Cost $26,117)(3) | | $ | 26,117 | | | $ | 26,117 | |
| | | | | | | | |
| | | | | | | | |
Total investments - 100.7%
(Cost $477,025) | | | | | | | 496,628 | |
| | | | | | | | |
Other assets less liabilities - (0.7)% | | | | | | | (3,442 | ) |
| | | | | | | | |
| | | | | | | | |
Total net assets - 100.0%(4) | | | | | | $ | 493,186 | |
| | | | | | | | |
| (1) | Non-income producing security. |
| (2) | The Fund considers the company to be from outside of the United States. See the Fund’s Statement of Additional Information for a description of the methodology used for issuer country classifications. |
| | | | | | | | |
Security | | Country | | | Trading Currency | |
Alamos Gold, Inc., Class A | | | Canada | | | | U.S. dollar | |
| | | | | | | | | | | | |
Issuer | | Rate | | | Maturity | | | Value | |
U.S. Treasury Note | | | 2.500 | % | | | 8/15/2023 | | | $ | 26,643 | |
| (4) | Percentages for the various classifications relate to total net assets. |
Company names are as reported by a data service provider and in some cases are translations; a company’s legal name may be different.
| | | | | | |
| TOP TEN HOLDINGS - September 30, 2015 | |
Company Name | | Country | | Percentage
of Total
Net Assets | |
EMCOR Group, Inc. | | United States | | | 3.5 | % |
World Fuel Services Corp. | | United States | | | 3.2 | |
HB Fuller Co. | | United States | | | 2.9 | |
Cubic Corp. | | United States | | | 2.8 | |
Tech Data Corp. | | United States | | | 2.6 | |
Arrow Electronics, Inc. | | United States | | | 2.5 | |
Rent-A-Center, Inc. | | United States | | | 2.1 | |
Kaman Corp. | | United States | | | 1.8 | |
Quanex Building Products Corp. | | United States | | | 1.7 | |
AZZ, Inc. | | United States | | | 1.7 | |
| | | | | | |
Total | | | | | 24.8 | % |
| | | | | | |
For the purpose of determining the Fund’s top ten holdings, securities of the same issuer are aggregated to determine the weight in the Fund.
The accompanying notes are an integral part of the financial statements.
| | |
| 70 | | Artisan Partners Funds |
ARTISAN VALUE FUND
Schedule of Investments – September 30, 2015
Dollar values in thousands
| | | | | | | | |
| | | Shares
Held | | | Value | |
| COMMON STOCKS - 92.2% | | | | | | | | |
| | | | | | | | |
| CONSUMER DISCRETIONARY - 5.5% | | | | | |
Auto Components - 2.5% | | | | | | | | |
Cie Generale des Etablissements Michelin(1)(2) | | | 270,361 | | | $ | 24,671 | |
| | | | | | | | |
Media - 3.0% | | | | | | | | |
CBS Corp., Class B(3) | | | 739,010 | | | | 29,486 | |
| | | | | | | | |
| ENERGY - 13.4% | | | | | | | | |
Oil, Gas &
Consumable Fuels - 13.4% | | | | | | | | |
Apache Corp. | | | 1,036,955 | | | | 40,607 | |
Denbury Resources, Inc. | | | 4,203,525 | | | | 10,257 | |
Devon Energy Corp. | | | 963,339 | | | | 35,730 | |
EOG Resources, Inc. | | | 301,569 | | | | 21,954 | |
Hess Corp. | | | 478,623 | | | | 23,960 | |
| | | | | | | | |
| | | | | | | 132,508 | |
| FINANCIALS - 24.2% | | | | | | | | |
Banks - 2.8% | | | | | | | | |
Citigroup, Inc. | | | 557,786 | | | | 27,672 | |
| | | | | | | | |
Capital Markets - 2.0% | | | | | | | | |
Goldman Sachs Group, Inc. | | | 112,480 | | | | 19,545 | |
| | | | | | | | |
Diversified Financial
Services - 3.4% | | | | | | | | |
Berkshire Hathaway, Inc., Class B(4) | | | 260,769 | | | | 34,004 | |
| | | | | | | | |
Insurance - 12.6% | | | | | | | | |
Alleghany Corp.(4) | | | 63,248 | | | | 29,607 | |
Allstate Corp. | | | 350,328 | | | | 20,403 | |
Arch Capital Group Ltd.(4)(5) | | | 361,651 | | | | 26,570 | |
Chubb Corp. | | | 220,820 | | | | 27,084 | |
Progressive Corp. | | | 669,346 | | | | 20,509 | |
| | | | | | | | |
| | | | | | | 124,173 | |
Real Estate Investment Trusts (REITs) - 3.4% | | | | | | | | |
American Capital Agency Corp. | | | 867,010 | | | | 16,213 | |
Annaly Capital Management, Inc. | | | 1,761,400 | | | | 17,385 | |
| | | | | | | | |
| | | | | | | 33,598 | |
| HEALTH CARE - 1.3% | | | | | | | | |
Health Care Providers &
Services - 1.3% | | | | | | | | |
Express Scripts Holding Co.(4) | | | 154,657 | | | | 12,521 | |
| INDUSTRIALS - 12.4% | | | | | | | | |
Aerospace & Defense - 2.5% | | | | | | | | |
Precision Castparts Corp. | | | 108,332 | | | $ | 24,885 | |
| | | | | | | | |
Construction & Engineering - 4.0% | | | | | | | | |
Jacobs Engineering Group, Inc.(4) | | | 1,054,912 | | | | 39,485 | |
| | | | | | | | |
Machinery - 2.5% | | | | | | | | |
Joy Global, Inc.(5) | | | 1,677,990 | | | | 25,053 | |
| | | | | | | | |
Road & Rail - 3.4% | | | | | | | | |
Union Pacific Corp. | | | 379,554 | | | | 33,556 | |
| | | | | | | | |
| INFORMATION TECHNOLOGY - 21.0% | | | | | | | | |
Communications Equipment - 2.7% | | | | | | | | |
Cisco Systems, Inc. | | | 1,037,610 | | | | 27,237 | |
| | | | | | | | |
Electronic Equipment, Instruments & Components - 4.1% | | | | | | | | |
Avnet, Inc. | | | 942,923 | | | | 40,244 | |
| | | | | | | | |
Internet Software & Services - 2.3% | | | | | | | | |
Google, Inc., Class C(3)(4) | | | 38,024 | | | | 23,135 | |
| | | | | | | | |
IT Services - 2.1% | | | | | | | | |
International Business Machines Corp. | | | 141,458 | | | | 20,507 | |
| | | | | | | | |
Software - 3.7% | | | | | | | | |
Oracle Corp. | | | 1,015,790 | | | | 36,690 | |
| | | | | | | | |
Technology Hardware, Storage & Peripherals - 6.1% | | | | | | | | |
Apple, Inc. | | | 267,621 | | | | 29,519 | |
EMC Corp./MA | | | 1,272,902 | | | | 30,753 | |
| | | | | | | | |
| | | | | | | 60,272 | |
| MATERIALS - 12.4% | | | | | | | | |
Chemicals - 4.9% | | | | | | | | |
Celanese Corp., Class A | | | 324,419 | | | | 19,196 | |
Mosaic Co. | | | 932,199 | | | | 29,001 | |
| | | | | | | | |
| | | | | | | 48,197 | |
Metals & Mining - 7.5% | | | | | | | | |
Goldcorp, Inc.(1) | | | 3,236,642 | | | | 40,522 | |
Kinross Gold Corp.(1)(4) | | | 9,051,620 | | | | 15,569 | |
Nucor Corp. | | | 488,305 | | | | 18,336 | |
| | | | | | | | |
| | | | | | | 74,427 | |
| | |
| Artisan Partners Funds | | 71 |
| | | | | | | | |
| | | Shares
Held | | | Value | |
| TELECOMMUNICATION SERVICES - 2.0% | | | | | | | | |
Wireless Telecommunication Services - 2.0% | | | | | | | | |
SoftBank Corp.(1)(2) | | | 438,200 | | | $ | 20,162 | |
| | | | | | | | |
Total common stocks
(Cost $984,937) | | | | | | | 912,028 | |
| | | | | | | | |
| PREFERRED STOCKS - 5.6% | | | | | | | | |
| | | | | | | | |
| INFORMATION TECHNOLOGY - 5.6% | | | | | | | | |
Technology Hardware, Storage & Peripherals - 5.6% | | | | | | | | |
Samsung Electronics Co., Ltd.(1)(2) | | | 70,466 | | | | 54,906 | |
| | | | | | | | |
Total preferred stocks
(Cost $48,942) | | | | | | | 54,906 | |
| | | Principal
Amount | | | | |
SHORT-TERM INVESTMENTS
(CASH EQUIVALENTS) - 1.9% | | | | | | | | |
Repurchase agreement with Fixed Income Clearing Corporation, 0.00%, dated 9/30/15, due 10/1/15, maturity value $19,159
(Cost $19,159)(6) | | $ | 19,159 | | | $ | 19,159 | |
| | | | | | | | |
| | | | | | | | |
Total investments - 99.7%
(Cost $1,053,038) | | | | | | | 986,093 | |
| | | | | | | | |
Other assets less liabilities - 0.3% | | | | | | | 2,604 | |
| | | | | | | | |
| | | | | | | | |
Total net assets - 100.0%(7) | | | | | | $ | 988,697 | |
| | | | | | | | |
| (1) | The Fund considers the company to be from outside of the United States. See the Fund’s Statement of Additional Information for a description of the methodology used for issuer country classifications. |
| | | | |
Security | | Country | | Trading Currency |
Cie Generale des Etablissements Michelin | | France | | Euro |
Goldcorp, Inc. | | Canada | | U.S. dollar |
Kinross Gold Corp. | | Canada | | U.S. dollar |
Samsung Electronics Co., Ltd. | | Korea | | Korean won |
SoftBank Corp. | | Japan | | Japanese yen |
| (2) | Valued at a fair value in accordance with procedures established by the board of directors of Artisan Partners Funds. In total, securities valued at a fair value were $99,739, or 10.1% of total net assets. See notes 2(a) and 3 in Notes to Financial Statements for additional information. |
| (4) | Non-income producing security. |
| (5) | Affiliated company as defined by the Investment Company Act of 1940, as amended. See note 11 in Notes to Financial Statements for additional information. |
| | | | | | | | | | | | |
Issuer | | Rate | | | Maturity | | | Value | |
U.S. Treasury Note | | | 2.500 | % | | | 8/15/2023 | | | $ | 19,544 | |
| (7) | Percentages for the various classifications relate to total net assets. |
Company names are as reported by a data service provider and in some cases are translations; a company’s legal name may be different.
| | | | | | | | |
| CURRENCY EXPOSURE - September 30, 2015 | |
Dollar values in thousands | | | | | | | | |
| | | Value | | | Percentage
of Total
Investments | |
Euro | | $ | 24,671 | | | | 2.5 | % |
Japanese yen | | | 20,162 | | | | 2.0 | |
Korean won | | | 54,906 | | | | 5.6 | |
U.S. dollar | | | 886,354 | | | | 89.9 | |
| | | | | | | | |
Total investments | | $ | 986,093 | | | | 100.0 | % |
| | | | | | | | |
| | | | | | |
| TOP TEN HOLDINGS - September 30, 2015 | |
Company Name | | Country | | Percentage
of Total
Net Assets | |
Samsung Electronics Co., Ltd. | | Korea | | | 5.6 | % |
Apache Corp. | | United States | | | 4.1 | |
Goldcorp, Inc. | | Canada | | | 4.1 | |
Avnet, Inc. | | United States | | | 4.1 | |
Jacobs Engineering Group, Inc. | | United States | | | 4.0 | |
Oracle Corp. | | United States | | | 3.7 | |
Devon Energy Corp. | | United States | | | 3.6 | |
Berkshire Hathaway, Inc. | | United States | | | 3.4 | |
Union Pacific Corp. | | United States | | | 3.4 | |
EMC Corp./MA | | United States | | | 3.1 | |
| | | | | | |
Total | | | | | 39.1 | % |
| | | | | | |
For the purpose of determining the Fund’s top ten holdings, securities of the same issuer are aggregated to determine the weight in the Fund.
The accompanying notes are an integral part of the financial statements.
| | |
| 72 | | Artisan Partners Funds |
ARTISAN PARTNERS FUNDS
Statements of Assets and Liabilities – September 30, 2015
Dollar values in thousands
| | | | | | | | | | | | | | | | |
| | | DEVELOPING
WORLD | | | EMERGING
MARKETS | | | GLOBAL EQUITY | | | GLOBAL
OPPORTUNITIES | |
| ASSETS: | | | | | | | | | | | | | | | | |
Investments in securities, unaffiliated, at value | | $ | 105,692 | | | $ | 49,044 | | | $ | 279,651 | | | $ | 1,168,418 | |
Investments in securities, affiliated, at value | | | – | | | | – | | | | 8,008 | | | | 81,202 | |
Short-term investments (repurchase agreements), at value | | | 13,083 | | | | 1,392 | | | | 9,555 | | | | 108,124 | |
Total investments | | | 118,775 | | | | 50,436 | | | | 297,214 | | | | 1,357,744 | |
Cash | | | – | (1) | | | 177 | | | | – | (1) | | | – | (1) |
Foreign currency | | | 1,580 | | | | 190 | | | | 236 | | | | 232 | |
Receivable from investments sold | | | 16 | | | | 15 | | | | 804 | | | | 1,475 | |
Receivable from fund shares sold | | | 17,814 | | | | 123 | | | | 212 | | | | 1,419 | |
Dividends and interest receivable | | | 28 | | | | 114 | | | | 251 | | | | 1,510 | |
Prepaid offering costs | | | 42 | | | | – | | | | – | | | | – | |
Other assets | | | – | (1) | | | 1 | | | | 1 | | | | 7 | |
Total assets | | | 138,255 | | | | 51,056 | | | | 298,718 | | | | 1,362,387 | |
| LIABILITIES: | | | | | | | | | | | | | | | | |
Unrealized loss on foreign currency forward contracts | | | – | | | | – | | | | – | | | | 1,460 | |
Payable for investments purchased | | | 19,320 | | | | 54 | | | | 1,673 | | | | 4,135 | |
Payable for fund shares redeemed | | | 3 | | | | – | | | | 483 | | | | 378 | |
Payable for operating expenses | | | 101 | | | | 132 | | | | 179 | | | | 398 | |
Payable for deferred director’s compensation | | | – | (1) | | | 1 | | | | 1 | | | | 5 | |
Payable for foreign taxes* | | | – | | | | 66 | | | | 2 | | | | 89 | |
Total liabilities | | | 19,424 | | | | 253 | | | | 2,338 | | | | 6,465 | |
Total net assets | | $ | 118,831 | | | $ | 50,803 | | | $ | 296,380 | | | $ | 1,355,922 | |
| NET ASSETS CONSIST OF: | | | | | | | | | | | | | | | | |
Fund shares issued and outstanding | | $ | 129,104 | | | $ | 193,808 | | | $ | 290,657 | | | $ | 1,190,301 | |
Net unrealized appreciation (depreciation) on investments and foreign currency related transactions | | | (8,776 | ) | | | (5,947 | ) | | | (643 | ) | | | 162,571 | |
Accumulated undistributed net investment loss | | | (48 | ) | | | (425 | ) | | | (1 | ) | | | 3,948 | |
Accumulated undistributed net realized gains (losses) on investments and foreign currency related transactions | | | (1,449 | ) | | | (136,633 | ) | | | 6,367 | | | | (898 | ) |
Total net assets | | $ | 118,831 | | | $ | 50,803 | | | $ | 296,380 | | | $ | 1,355,922 | |
| SUPPLEMENTARY INFORMATION: | | | | | | | | | | | | | | | | |
Net assets | | | | | | | | | | | | | | | | |
Investor Shares | | $ | 20,642 | | | $ | 22,842 | | | $ | 296,380 | | | $ | 669,846 | |
Institutional Shares | | $ | 39,993 | | | $ | 27,961 | | | | | | | $ | 631,904 | |
Advisor Shares | | $ | 58,196 | | | | | | | | | | | $ | 54,172 | |
Shares outstanding (Indefinite number of shares authorized, $0.01 par value) | | | | | | | | | | | | | | | | |
Investor Shares | | | 2,460,966 | | | | 2,307,385 | | | | 18,838,672 | | | | 36,500,097 | |
Institutional Shares | | | 4,765,974 | | | | 2,845,758 | | | | | | | | 34,227,847 | |
Advisor Shares | | | 6,938,374 | | | | | | | | | | | | 2,949,014 | |
Net asset value per share | | | | | | | | | | | | | | | | |
Investor Shares | | $ | 8.39 | | | $ | 9.90 | | | $ | 15.73 | | | $ | 18.35 | |
Institutional Shares | | $ | 8.39 | | | $ | 9.83 | | | | | | | $ | 18.46 | |
Advisor Shares | | $ | 8.39 | | | | | | | | | | | $ | 18.37 | |
Cost of securities of unaffiliated issuers held | | $ | 127,543 | | | $ | 56,349 | | | $ | 286,752 | | | $ | 1,115,807 | |
Cost of securities of affiliated issuers held | | $ | – | | | $ | – | | | $ | 11,098 | | | $ | 77,751 | |
Cost of foreign currency | | $ | 1,582 | | | $ | 194 | | | $ | 238 | | | $ | 235 | |
| | | | |
*Including foreign taxes on unrealized gains | | $ | – | | | $ | 26 | | | $ | – | | | $ | – | |
| (1) | Amount rounds to less than $1. |
The accompanying notes are an integral part of the financial statements.
| | |
| Artisan Partners Funds | | 73 |
ARTISAN PARTNERS FUNDS
Statements of Assets and Liabilities – September 30, 2015 (Continued)
Dollar values in thousands
| | | | | | | | | | | | | | | | |
| | | GLOBAL
SMALL CAP | | | GLOBAL VALUE | | | HIGH INCOME | | | INTERNATIONAL | |
| ASSETS: | | | | | | | | | | | | | | | | |
Investments in securities, unaffiliated, at value | | $ | 114,329 | | | $ | 1,289,666 | | | $ | 860,808 | | | $ | 16,960,438 | |
Investments in securities, affiliated, at value | | | 4,495 | | | | 108,114 | | | | – | | | | – | |
Short-term investments (repurchase agreements), at value | | | 10,148 | | | | 120,798 | | | | 94,577 | | | | 619,768 | |
Total investments | | | 128,972 | | | | 1,518,578 | | | | 955,385 | | | | 17,580,206 | |
Cash | | | – | (1) | | | 1 | | | | 25 | | | | – | (1) |
Foreign currency | | | 102 | | | | 309 | | | | – | | | | 7,539 | |
Receivable from investments sold | | | 893 | | | | 25,919 | | | | 1,509 | | | | 29,484 | |
Receivable from fund shares sold | | | 164 | | | | 1,859 | | | | 5,633 | | | | 29,581 | |
Dividends and interest receivable | | | 118 | | | | 2,553 | | | | 14,136 | | | | 49,835 | |
Other assets | | | 1 | | | | 8 | | | | 3 | | | | 89 | |
Total assets | | | 130,250 | | | | 1,549,227 | | | | 976,691 | | | | 17,696,734 | |
| LIABILITIES: | | | | | | | | | | | | | | | | |
Dividends declared | | | – | | | | – | | | | 514 | | | | – | |
Payable for investments purchased | | | – | | | | 1,611 | | | | 57,322 | | | | 61,573 | |
Payable for fund shares redeemed | | | 12 | | | | 21,587 | | | | 4,434 | | | | 33,125 | |
Payable for operating expenses | | | 142 | | | | 662 | | | | 360 | | | | 5,810 | |
Payable for deferred director’s compensation | | | 1 | | | | 7 | | | | 2 | | | | 69 | |
Payable for foreign taxes | | | – | | | | 54 | | | | – | | | | 1,074 | |
Total liabilities | | | 155 | | | | 23,921 | | | | 62,632 | | | | 101,651 | |
Total net assets | | $ | 130,095 | | | $ | 1,525,306 | | | $ | 914,059 | | | $ | 17,595,083 | |
| NET ASSETS CONSIST OF: | | | | | | | | | | | | | | | | |
Fund shares issued and outstanding | | $ | 145,312 | | | $ | 1,402,378 | | | $ | 959,037 | | | $ | 16,923,402 | |
Net unrealized appreciation (depreciation) on investments and foreign currency related transactions | | | (7,814 | ) | | | 47,826 | | | | (47,885 | ) | | | 921,702 | |
Accumulated undistributed net investment income (loss) | | | (311 | ) | | | 7,501 | | | | (3 | ) | | | 103,515 | |
Accumulated undistributed net realized gains (losses) on investments and foreign currency related transactions | | | (7,092 | ) | | | 67,601 | | | | 2,910 | | | | (353,536 | ) |
Total net assets | | $ | 130,095 | | | $ | 1,525,306 | | | $ | 914,059 | | | $ | 17,595,083 | |
| SUPPLEMENTARY INFORMATION: | | | | | | | | | | | | | | | | |
Net assets | | | | | | | | | | | | | | | | |
Investor Shares | | $ | 130,095 | | | $ | 826,965 | | | $ | 424,685 | | | $ | 10,156,292 | |
Institutional Shares | | | | | | $ | 512,600 | | | | | | | $ | 4,973,656 | |
Advisor Shares | | | | | | $ | 185,741 | | | $ | 489,374 | | | $ | 2,465,135 | |
Shares outstanding (Indefinite number of shares authorized, $0.01 par value) | | | | | | | | | | | | | | | | |
Investor Shares | | | 12,233,592 | | | | 57,155,382 | | | | 44,761,167 | | | | 376,517,704 | |
Institutional Shares | | | | | | | 35,341,640 | | | | | | | | 182,912,657 | |
Advisor Shares | | | | | | | 12,831,343 | | | | 51,588,142 | | | | 91,286,220 | |
Net asset value per share | | | | | | | | | | | | | | | | |
Investor Shares | | $ | 10.63 | | | $ | 14.47 | | | $ | 9.49 | | | $ | 26.97 | |
Institutional Shares | | | | | | $ | 14.50 | | | | | | | $ | 27.19 | |
Advisor Shares | | | | | | $ | 14.48 | | | $ | 9.49 | | | $ | 27.00 | |
Cost of securities of unaffiliated issuers held | | $ | 130,255 | | | $ | 1,375,157 | | | $ | 1,003,270 | | | $ | 16,656,241 | |
Cost of securities of affiliated issuers held | | $ | 6,525 | | | $ | 95,539 | | | $ | – | | | $ | – | |
Cost of foreign currency | | $ | 103 | | | $ | 310 | | | $ | – | | | $ | 7,565 | |
| (1) | Amount rounds to less than $1. |
The accompanying notes are an integral part of the financial statements.
| | |
| 74 | | Artisan Partners Funds |
ARTISAN PARTNERS FUNDS
Statements of Assets and Liabilities – September 30, 2015 (Continued)
Dollar values in thousands
| | | | | | | | | | | | | | | | |
| | | INTERNATIONAL
SMALL CAP | | | INTERNATIONAL
VALUE | | | MID CAP | | | MID CAP VALUE | |
| ASSETS: | | | | | | | | | | | | | | | | |
Investments in securities, unaffiliated, at value | | $ | 807,872 | | | $ | 7,830,666 | | | $ | 8,010,998 | | | $ | 5,905,907 | |
Investments in securities, affiliated, at value | | | 68,675 | | | | 1,334,457 | | | | 359,744 | | | | 242,115 | |
Short-term investments (repurchase agreements), at value | | | 78,327 | | | | 1,440,116 | | | | 501,889 | | | | 405,627 | |
Total investments | | | 954,874 | | | | 10,605,239 | | | | 8,872,631 | | | | 6,553,649 | |
Cash | | | – | (1) | | | – | (1) | | | 1 | | | | 1 | |
Foreign currency | | | 2,180 | | | | 4,203 | | | | – | | | | – | |
Receivable from investments sold | | | 2,784 | | | | 3,256 | | | | 35,721 | | | | 36,715 | |
Receivable from fund shares sold | | | 653 | | | | 25,333 | | | | 9,068 | | | | 4,503 | |
Dividends and interest receivable | | | 1,371 | | | | 29,627 | | | | 379 | | | | 12,637 | |
Other assets | | | 5 | | | | 54 | | | | 46 | | | | 46 | |
Total assets | | | 961,867 | | | | 10,667,712 | | | | 8,917,846 | | | | 6,607,551 | |
| LIABILITIES: | | | | | | | | | | | | | | | | |
Unrealized loss on foreign currency forward contracts | | | – | | | | 9,267 | | | | – | | | | – | |
Payable for investments purchased | | | – | | | | 25,076 | | | | 62,738 | | | | 10,846 | |
Payable for fund shares redeemed | | | 469 | | | | 9,961 | | | | 28,813 | | | | 73,542 | |
Payable for operating expenses | | | 356 | | | | 3,570 | | | | 2,452 | | | | 3,369 | |
Payable for deferred director’s compensation | | | 4 | | | | 41 | | | | 35 | | | | 34 | |
Payable for foreign taxes | | | 3 | | | | 808 | | | | – | | | | – | |
Total liabilities | | | 832 | | | | 48,723 | | | | 94,038 | | | | 87,791 | |
Total net assets | | $ | 961,035 | | | $ | 10,618,989 | | | $ | 8,823,808 | | | $ | 6,519,760 | |
| NET ASSETS CONSIST OF: | | | | | | | | | | | | | | | | |
Fund shares issued and outstanding | | $ | 775,612 | | | $ | 9,066,441 | | | $ | 5,783,706 | | | $ | 5,024,491 | |
Net unrealized appreciation on investments and foreign currency related transactions | | | 155,926 | | | | 939,187 | | | | 2,072,568 | | | | 628,759 | |
Accumulated undistributed net investment income (loss) | | | 983 | | | | 103,892 | | | | (48,099 | ) | | | 30,984 | |
Accumulated undistributed net realized gains on investments and foreign currency related transactions | | | 28,514 | | | | 509,469 | | | | 1,015,633 | | | | 835,526 | |
Total net assets | | $ | 961,035 | | | $ | 10,618,989 | | | $ | 8,823,808 | | | $ | 6,519,760 | |
| SUPPLEMENTARY INFORMATION: | | | | | | | | | | | | | | | | |
Net assets | | | | | | | | | | | | | | | | |
Investor Shares | | $ | 961,035 | | | $ | 5,229,869 | | | $ | 3,909,986 | | | $ | 4,345,131 | |
Institutional Shares | | | | | | $ | 2,606,468 | | | $ | 4,482,164 | | | $ | 1,236,240 | |
Advisor Shares | | | | | | $ | 2,782,652 | | | $ | 431,658 | | | $ | 938,389 | |
Shares outstanding (Indefinite number of shares authorized, $0.01 par value) | | | | | | | | | | | | | | | | |
Investor Shares | | | 41,128,658 | | | | 160,302,522 | | | | 88,015,790 | | | | 195,551,340 | |
Institutional Shares | | | | | | | 79,533,193 | | | | 95,523,076 | | | | 55,557,075 | |
Advisor Shares | | | | | | | 85,200,871 | | | | 9,709,312 | | | | 42,203,794 | |
Net asset value per share | | | | | | | | | | | | | | | | |
Investor Shares | | $ | 23.37 | | | $ | 32.62 | | | $ | 44.42 | | | $ | 22.22 | |
Institutional Shares | | | | | | $ | 32.77 | | | $ | 46.92 | | | $ | 22.25 | |
Advisor Shares | | | | | | $ | 32.66 | | | $ | 44.46 | | | $ | 22.23 | |
Cost of securities of unaffiliated issuers held | | $ | 715,299 | | | $ | 8,596,461 | | | $ | 6,547,849 | | | $ | 5,704,836 | |
Cost of securities of affiliated issuers held | | $ | 83,595 | | | $ | 1,058,942 | | | $ | 252,214 | | | $ | 220,054 | |
Cost of foreign currency | | $ | 2,187 | | | $ | 4,218 | | | $ | – | | | $ | – | |
| (1) | Amount rounds to less than $1. |
The accompanying notes are an integral part of the financial statements.
| | |
| Artisan Partners Funds | | 75 |
ARTISAN PARTNERS FUNDS
Statements of Assets and Liabilities – September 30, 2015 (Continued)
Dollar values in thousands
| | | | | | | | | | | | |
| | | SMALL CAP | | | SMALL CAP
VALUE | | | VALUE | |
| ASSETS: | | | | | | | | | | | | |
Investments in securities, unaffiliated, at value | | $ | 1,188,278 | | | $ | 470,511 | | | $ | 915,311 | |
Investments in securities, affiliated, at value | | | – | | | | – | | | | 51,623 | |
Short-term investments (repurchase agreements), at value | | | 88,644 | | | | 26,117 | | | | 19,159 | |
Total investments | | | 1,276,922 | | | | 496,628 | | | | 986,093 | |
Cash | | | – | (1) | | | 1 | | | | 1 | |
Foreign currency | | | – | | | | – | | | | – | (1) |
Receivable from investments sold | | | – | | | | 918 | | | | 1,274 | |
Receivable from fund shares sold | | | 1,168 | | | | 186 | | | | 2,639 | |
Dividends and interest receivable | | | 16 | | | | 885 | | | | 1,724 | |
Other assets | | | 7 | | | | 4 | | | | 6 | |
Total assets | | | 1,278,113 | | | | 498,622 | | | | 991,737 | |
| LIABILITIES: | | | | | | | | | | | | |
Unrealized loss on foreign currency forward contracts | | | – | | | | – | | | | – | |
Payable for investments purchased | | | 21,304 | | | | 4,191 | | | | 774 | |
Payable for fund shares redeemed | | | 3,007 | | | | 795 | | | | 1,642 | |
Payable for operating expenses | | | 537 | | | | 447 | | | | 612 | |
Payable for deferred director’s compensation | | | 5 | | | | 3 | | | | 5 | |
Payable for foreign taxes | | | – | | | | – | | | | 7 | |
Total liabilities | | | 24,853 | | | | 5,436 | | | | 3,040 | |
Total net assets | | $ | 1,253,260 | | | $ | 493,186 | | | $ | 988,697 | |
| NET ASSETS CONSIST OF: | | | | | | | | | | | | |
Fund shares issued and outstanding | | $ | 825,171 | | | $ | 405,881 | | | $ | 979,017 | |
Net unrealized appreciation (depreciation) on investments and foreign currency related transactions | | | 334,276 | | | | 19,603 | | | | (66,976 | ) |
Accumulated undistributed net investment income (loss) | | | (10,074 | ) | | | 4,431 | | | | 7,097 | |
Accumulated undistributed net realized gains on investments and foreign currency related transactions | | | 103,887 | | | | 63,271 | | | | 69,559 | |
Total net assets | | $ | 1,253,260 | | | $ | 493,186 | | | $ | 988,697 | |
| SUPPLEMENTARY INFORMATION: | | | | | | | | | | | | |
Net assets | | | | | | | | | | | | |
Investor Shares | | $ | 863,536 | | | $ | 458,673 | | | $ | 341,852 | |
Institutional Shares | | $ | 389,724 | | | $ | 34,513 | | | $ | 180,143 | |
Advisor Shares | | | | | | | | | | $ | 466,702 | |
Shares outstanding (Indefinite number of shares authorized, $0.01 par value) | | | | | | | | | | | | |
Investor Shares | | | 30,241,790 | | | | 37,631,389 | | | | 29,567,331 | |
Institutional Shares | | | 13,570,375 | | | | 2,815,204 | | | | 15,531,944 | |
Advisor Shares | | | | | | | | | | | 40,345,163 | |
Net asset value per share | | | | | | | | | | | | |
Investor Shares | | $ | 28.55 | | | $ | 12.19 | | | $ | 11.56 | |
Institutional Shares | | $ | 28.72 | | | $ | 12.26 | | | $ | 11.60 | |
Advisor Shares | | | | | | | | | | $ | 11.57 | |
Cost of securities of unaffiliated issuers held | | $ | 942,646 | | | $ | 477,025 | | | $ | 987,896 | |
Cost of securities of affiliated issuers held | | $ | – | | | $ | – | | | $ | 65,142 | |
Cost of foreign currency | | $ | – | | | $ | – | | | $ | – | (1) |
| (1) | Amount rounds to less than $1. |
The accompanying notes are an integral part of the financial statements.
| | |
| 76 | | Artisan Partners Funds |
ARTISAN PARTNERS FUNDS
Statements of Operations – For the Year Ended September 30, 2015
Dollar values in thousands
| | | | | | | | | | | | | | | | |
| | | DEVELOPING
WORLD(1) | | | EMERGING
MARKETS | | | GLOBAL EQUITY | | | GLOBAL
OPPORTUNITIES | |
| INVESTMENT INCOME: | | | | | | | | | | | | | | | | |
Dividends, from unaffiliated issuers(3) | | $ | 153 | | | $ | 2,395 | | | $ | 3,064 | | | $ | 16,382 | |
Dividends, from affiliated issuers(4) | | | – | | | | – | | | | 163 | | | | 88 | |
Interest | | | – | | | | – | | | | – | | | | – | (2) |
Total investment income | | | 153 | | | | 2,395 | | | | 3,227 | | | | 16,470 | |
| EXPENSES: | | | | | | | | | | | | | | | | |
Management fees | | | 147 | | | | 1,624 | | | | 2,735 | | | | 11,524 | |
Transfer agent fees | | | | | | | | | | | | | | | | |
Investor Shares | | | 15 | | | | 122 | | | | 670 | | | | 1,608 | |
Institutional Shares | | | 8 | | | | 20 | | | | | | | | 21 | |
Advisor Shares | | | 11 | | | | | | | | | | | | 22 | |
Shareholder communications | | | | | | | | | | | | | | | | |
Investor Shares | | | 10 | | | | 13 | | | | 35 | | | | 149 | |
Institutional Shares | | | 10 | | | | 15 | | | | | | | | 16 | |
Advisor Shares | | | 10 | | | | | | | | | | | | 11 | |
Custodian fees | | | 6 | | | | 221 | | | | 95 | | | | 225 | |
Accounting fees | | | 11 | | | | 92 | | | | 72 | | | | 89 | |
Professional fees | | | 30 | | | | 60 | | | | 67 | | | | 82 | |
Offering fees | | | 14 | | | | – | | | | – | | | | – | |
Registration fees | | | | | | | | | | | | | | | | |
Investor Shares | | | 3 | | | | 21 | | | | 56 | | | | 47 | |
Institutional Shares | | | 3 | | | | 38 | | | | | | | | 53 | |
Advisor Shares | | | 7 | | | | | | | | | | | | 25 | |
Director’s fees | | | 2 | | | | 8 | | | | 8 | | | | 36 | |
Other operating expenses | | | 2 | | | | 22 | | | | 7 | | | | 25 | |
Total operating expenses | | | 289 | | | | 2,256 | | | | 3,745 | | | | 13,933 | |
Less amounts waived or paid by the Advisor | | | (88 | ) | | | (103 | ) | | | – | | | | (42 | ) |
Net expenses | | | 201 | | | | 2,153 | | | | 3,745 | | | | 13,891 | |
Net investment income (loss) | | | (48 | ) | | | 242 | | | | (518 | ) | | | 2,579 | |
| NET REALIZED AND UNREALIZED GAINS (LOSSES) ON INVESTMENTS: | |
Net realized gain (loss) on: | | | | | | | | | | | | | | | | |
Investments, from unaffiliated issuers(5) | | | (1,448 | ) | | | 19,178 | | | | 10,712 | | | | 6,414 | |
Investments, from affiliated issuers | | | – | | | | – | | | | (2,210 | ) | | | (500 | ) |
Foreign currency related transactions | | | (1 | ) | | | (532 | ) | | | (51 | ) | | | 4,037 | |
Total realized gain (loss) | | | (1,449 | ) | | | 18,646 | | | | 8,451 | | | | 9,951 | |
Net increase (decrease) in unrealized appreciation or depreciation on: | | | | | | | | | | | | | | | | |
Investments, from unaffiliated issuers(6) | | | (8,768 | ) | | | (38,593 | ) | | | (12,053 | ) | | | (24,156 | ) |
Investments, from affiliated issuers | | | – | | | | – | | | | (2,496 | ) | | | (5,162 | ) |
Foreign currency related transactions | | | (8 | ) | | | 3 | | | | 10 | | | | (2,924 | ) |
Total decrease in unrealized appreciation or depreciation | | | (8,776 | ) | | | (38,590 | ) | | | (14,539 | ) | | | (32,242 | ) |
Net loss on investments and foreign currency related transactions | | | (10,225 | ) | | | (19,944 | ) | | | (6,088 | ) | | | (22,291 | ) |
Net decrease in net assets resulting from operations | | $ | (10,273 | ) | | $ | (19,702 | ) | | $ | (6,606 | ) | | $ | (19,712 | ) |
(1) For the period from commencement of operations (June 29, 2015) through September 30, 2015. | |
(2)Amount rounds to less than $1. | | | | | | | | | | | | | | | | |
(3)Net of foreign taxes withheld on dividends, unaffiliated issuers | | $ | 11 | | | $ | 348 | | | $ | 95 | | | $ | 491 | |
(4)Net of foreign taxes withheld on dividends, affiliated issuers | | | – | | | | – | | | | – | | | | 10 | |
(5)Net of foreign taxes on realized gains | | | – | | | | 256 | | | | 30 | | | | – | |
(6)Net of decrease in foreign taxes on unrealized gains | | | – | | | | (684 | ) | | | (16 | ) | | | – | |
The accompanying notes are an integral part of the financial statements.
| | |
| Artisan Partners Funds | | 77 |
ARTISAN PARTNERS FUNDS
Statements of Operations – For the Year Ended September 30, 2015 (Continued)
Dollar values in thousands
| | | | | | | | | | | | | | | | |
| | | GLOBAL
SMALL CAP | | | GLOBAL VALUE | | | HIGH INCOME | | | INTERNATIONAL | |
| INVESTMENT INCOME: | | | | | | | | | | | | | | | | |
Dividends, from unaffiliated issuers(1) | | $ | 1,525 | | | $ | 30,756 | | | $ | – | | | $ | 315,109 | |
Dividends, from affiliated issuers(2) | | | 91 | | | | 970 | | | | – | | | | 6,025 | |
Interest | | | – | | | | – | | | | 48,459 | | | | – | |
Total investment income | | | 1,616 | | | | 31,726 | | | | 48,459 | | | | 321,134 | |
| EXPENSES: | | | | | | | | | | | | | | | | |
Management fees | | | 1,415 | | | | 17,892 | | | | 4,814 | | | | 174,861 | |
Transfer agent fees | | | | | | | | | | | | | | | | |
Investor Shares | | | 384 | | | | 2,763 | | | | 1,032 | | | | 29,288 | |
Institutional Shares | | | | | | | 22 | | | | | | | | 30 | |
Advisor Shares | | | | | | | 62 | | | | 250 | | | | 477 | |
Shareholder communications | | | | | | | | | | | | | | | | |
Investor Shares | | | 62 | | | | 219 | | | | 98 | | | | 1,326 | |
Institutional Shares | | | | | | | 16 | | | | | | | | 40 | |
Advisor Shares | | | | | | | 11 | | | | 42 | | | | 12 | |
Custodian fees | | | 103 | | | | 223 | | | | 14 | | | | 3,531 | |
Accounting fees | | | 91 | | | | 89 | | | | 85 | | | | 92 | |
Professional fees | | | 47 | | | | 101 | | | | 269 | | | | 596 | |
Offering fees | | | – | | | | – | | | | 17 | | | | – | |
Registration fees | | | | | | | | | | | | | | | | |
Investor Shares | | | 46 | | | | 50 | | | | 73 | | | | 282 | |
Institutional Shares | | | | | | | 51 | | | | | | | | 213 | |
Advisor Shares | | | | | | | 41 | | | | 79 | | | | 320 | |
Director’s fees | | | 6 | | | | 53 | | | | 18 | | | | 545 | |
Other operating expenses | | | 10 | | | | 38 | | | | 18 | | | | 326 | |
Total operating expenses | | | 2,164 | | | | 21,631 | | | | 6,809 | | | | 211,939 | |
Less amounts waived or paid by the Advisor | | | (41 | ) | | | (16 | ) | | | – | | | | (8 | ) |
Net expenses | | | 2,123 | | | | 21,615 | | | | 6,809 | | | | 211,931 | |
Net investment income (loss) | | | (507 | ) | | | 10,111 | | | | 41,650 | | | | 109,203 | |
| NET REALIZED AND UNREALIZED GAINS (LOSSES) ON INVESTMENTS: | |
Net realized gain (loss) on: | | | | | | | | | | | | | | | | |
Investments, from unaffiliated issuers(3) | | | (3,750 | ) | | | 87,706 | | | | 4,468 | | | | (102,009 | ) |
Investments, from affiliated issuers | | | (3,309 | ) | | | (4,067 | ) | | | – | | | | 56,701 | |
Foreign currency related transactions | | | (53 | ) | | | 3,022 | | | | (216 | ) | | | (5,379 | ) |
Total realized gain (loss) | | | (7,112 | ) | | | 86,661 | | | | 4,252 | | | | (50,687 | ) |
Net increase (decrease) in unrealized appreciation or depreciation on: | | | | | | | | | | | | | | | | |
Investments, from unaffiliated issuers | | | 3,374 | | | | (166,279 | ) | | | (40,918 | ) | | | (1,738,726 | ) |
Investments, from affiliated issuers | | | (1,259 | ) | | | 7,112 | | | | – | | | | (260,710 | ) |
Foreign currency related transactions | | | 2 | | | | (1,437 | ) | | | (222 | ) | | | (672 | ) |
Total increase (decrease) in unrealized appreciation or depreciation | | | 2,117 | | | | (160,604 | ) | | | (41,140 | ) | | | (2,000,108 | ) |
Net loss on investments and foreign currency related transactions | | | (4,995 | ) | | | (73,943 | ) | | | (36,888 | ) | | | (2,050,795 | ) |
Net increase (decrease) in net assets resulting from operations | | $ | (5,502 | ) | | $ | (63,832 | ) | | $ | 4,762 | | | $ | (1,941,592 | ) |
(1)Net of foreign taxes withheld on dividends, unaffiliated issuers | | $ | 95 | | | $ | 1,100 | | | $ | – | | | $ | 22,899 | |
(2)Net of foreign taxes withheld on dividends, affiliated issuers | | | – | | | | 132 | | | | – | | | | 669 | |
(3)Net of foreign taxes on realized gains | | | 4 | | | | – | | | | – | | | | – | |
The accompanying notes are an integral part of the financial statements.
| | |
| 78 | | Artisan Partners Funds |
ARTISAN PARTNERS FUNDS
Statements of Operations – For the Year Ended September 30, 2015 (Continued)
Dollar values in thousands
| | | | | | | | | | | | |
| | | INTERNATIONAL
SMALL CAP | | | INTERNATIONAL
VALUE | | | MID CAP | |
| INVESTMENT INCOME: | | | | | | | | | | | | |
Dividends, from unaffiliated issuers(1) | | $ | 15,527 | | | $ | 174,686 | | | $ | 39,873 | |
Dividends, from affiliated issuers(2) | | | 1,269 | | | | 31,270 | | | | 1,267 | |
Total investment income | | | 16,796 | | | | 205,956 | | | | 41,140 | |
| EXPENSES: | | | | | | | | | | | | |
Management fees | | | 12,692 | | | | 106,428 | | | | 90,018 | |
Transfer agent fees | | | | | | | | | | | | |
Investor Shares | | | 1,978 | | | | 16,252 | | | | 11,194 | |
Institutional Shares | | | | | | | 25 | | | | 36 | |
Advisor Shares | | | | | | | 696 | | | | 95 | |
Shareholder communications | | | | | | | | | | | | |
Investor Shares | | | 78 | | | | 645 | | | | 669 | |
Institutional Shares | | | | | | | 18 | | | | 144 | |
Advisor Shares | | | | | | | 16 | | | | 11 | |
Custodian fees | | | 412 | | | | 1,880 | | | | 312 | |
Accounting fees | | | 71 | | | | 89 | | | | 60 | |
Professional fees | | | 97 | | | | 376 | | | | 277 | |
Registration fees | | | | | | | | | | | | |
Investor Shares | | | 58 | | | | 86 | | | | 98 | |
Institutional Shares | | | | | | | 57 | | | | 156 | |
Advisor Shares | | | | | | | 369 | | | | 50 | |
Director’s fees | | | 29 | | | | 332 | | | | 280 | |
Other operating expenses | | | 21 | | | | 212 | | | | 180 | |
Total operating expenses | | | 15,436 | | | | 127,481 | | | | 103,580 | |
Less amounts waived or paid by the Advisor | | | – | | | | (87 | ) | | | (26 | ) |
Net expenses | | | 15,436 | | | | 127,394 | | | | 103,554 | |
Net investment income (loss) | | | 1,360 | | | | 78,562 | | | | (62,414 | ) |
| NET REALIZED AND UNREALIZED GAINS (LOSSES) ON INVESTMENTS: | |
Net realized gain (loss) on: | | | | | | | | | | | | |
Investments, from unaffiliated issuers | | | 58,434 | | | | 812,186 | | | | 1,278,012 | |
Investments, from affiliated issuers | | | (16,392 | ) | | | (16,011 | ) | | | 8,468 | |
Foreign currency related transactions | | | (293 | ) | | | 117,893 | | | | – | |
Total realized gain | | | 41,749 | | | | 914,068 | | | | 1,286,480 | |
Net increase (decrease) in unrealized appreciation or depreciation on: | | | | | | | | | | | | |
Investments, from unaffiliated issuers | | | (12,675 | ) | | | (1,369,714 | ) | | | (824,223 | ) |
Investments, from affiliated issuers | | | (11,030 | ) | | | (71,468 | ) | | | (47,458 | ) |
Foreign currency related transactions | | | 44 | | | | (56,314 | ) | | | – | |
Total decrease in unrealized appreciation or depreciation | | | (23,661 | ) | | | (1,497,496 | ) | | | (871,681 | ) |
Net gain (loss) on investments and foreign currency related transactions | | | 18,088 | | | | (583,428 | ) | | | 414,799 | |
Net increase (decrease) in net assets resulting from operations | | $ | 19,448 | | | $ | (504,866 | ) | | $ | 352,385 | |
(1) Net of foreign taxes withheld on dividends, unaffiliated issuers | | $ | 883 | | | $ | 11,227 | | | $ | 44 | |
(2) Net of foreign taxes withheld on dividends, affiliated issuers | | | – | | | | 2,792 | | | | – | |
The accompanying notes are an integral part of the financial statements.
| | |
| Artisan Partners Funds | | 79 |
ARTISAN PARTNERS FUNDS
Statements of Operations – For the Year Ended September 30, 2015 (Continued)
Dollar values in thousands
| | | | | | | | | | | | |
| | | MID CAP VALUE | | | SMALL CAP | | | SMALL CAP
VALUE | |
| INVESTMENT INCOME: | | | | | | | | | | | | |
Dividends, from unaffiliated issuers(1) | | $ | 156,288 | | | $ | 3,103 | | | $ | 15,634 | |
Dividends, from affiliated issuers | | | 26,932 | | | | – | | | | 1,206 | |
Total investment income | | | 183,220 | | | | 3,103 | | | | 16,840 | |
| EXPENSES: | | | | | | | | | | | | |
Management fees | | | 85,503 | | | | 13,943 | | | | 9,442 | |
Transfer agent fees | | | | | | | | | | | | |
Investor Shares | | | 15,894 | | | | 2,398 | | | | 1,708 | |
Institutional Shares | | | 24 | | | | 20 | | | | 21 | |
Advisor Shares | | | 160 | | | | | | | | | |
Shareholder communications | | | | | | | | | | | | |
Investor Shares | | | 2,079 | | | | 319 | | | | 262 | |
Institutional Shares | | | 101 | | | | 27 | | | | 41 | |
Advisor Shares | | | 13 | | | | | | | | | |
Custodian fees | | | 179 | | | | 55 | | | | 50 | |
Accounting fees | | | 61 | | | | 60 | | | | 64 | |
Professional fees | | | 350 | | | | 78 | | | | 71 | |
Registration fees | | | | | | | | | | | | |
Investor Shares | | | 103 | | | | 57 | | | | 56 | |
Institutional Shares | | | 72 | | | | 47 | | | | 26 | |
Advisor Shares | | | 91 | | | | | | | | | |
Director’s fees | | | 282 | | | | 42 | | | | 31 | |
Other operating expenses | | | 192 | | | | 32 | | | | 34 | |
Total operating expenses | | | 105,104 | | | | 17,078 | | | | 11,806 | |
Less amounts waived or paid by the Advisor | | | (34 | ) | | | – | | | | – | |
Net expenses | | | 105,070 | | | | 17,078 | | | | 11,806 | |
Net investment income (loss) | | | 78,150 | | | | (13,975 | ) | | | 5,034 | |
| NET REALIZED AND UNREALIZED GAINS (LOSSES) ON INVESTMENTS: | | | | | |
Net realized gain (loss) on: | | | | | | | | | | | | |
Investments, from unaffiliated issuers | | | 1,364,322 | | | | 190,485 | | | | 127,678 | |
Investments, from affiliated issuers | | | (107,549 | ) | | | (5,281 | ) | | | 13,451 | |
Total realized gain | | | 1,256,773 | | | | 185,204 | | | | 141,129 | |
Net increase (decrease) in unrealized appreciation or depreciation on: | | | | | | | | | | | | |
Investments, from unaffiliated issuers | | | (1,696,969 | ) | | | (55,269 | ) | | | (175,970 | ) |
Investments, from affiliated issuers | | | (201,469 | ) | | | 3,813 | | | | (31,263 | ) |
Foreign currency related transactions | | | – | | | | – | | | | – | |
Total decrease in unrealized appreciation or depreciation | | | (1,898,438 | ) | | | (51,456 | ) | | | (207,233 | ) |
Net gain (loss) on investments and foreign currency related transactions | | | (641,665 | ) | | | 133,748 | | | | (66,104 | ) |
Net increase (decrease) in net assets resulting from operations | | $ | (563,515 | ) | | $ | 119,773 | | | $ | (61,070 | ) |
(1) Net of foreign taxes withheld on dividends, unaffiliated issuers | | $ | 738 | | | $ | – | | | $ | 37 | |
The accompanying notes are an integral part of the financial statements.
| | |
| 80 | | Artisan Partners Funds |
ARTISAN PARTNERS FUNDS
Statements of Operations – For the Year Ended September 30, 2015 (Continued)
Dollar values in thousands
| | | | |
| | | VALUE | |
| INVESTMENT INCOME: | | | | |
Dividends, from unaffiliated issuers(1) | | $ | 21,090 | |
Dividends, from affiliated issuers | | | 2,312 | |
Total investment income | | | 23,402 | |
| EXPENSES: | | | | |
Management fees | | | 8,979 | |
Transfer agent fees | | | | |
Investor Shares | | | 1,960 | |
Institutional Shares | | | 20 | |
Advisor Shares | | | 162 | |
Shareholder communications | | | | |
Investor Shares | | | 350 | |
Institutional Shares | | | 16 | |
Advisor Shares | | | 13 | |
Custodian fees | | | 101 | |
Accounting fees | | | 58 | |
Professional fees | | | 72 | |
Registration fees | | | | |
Investor Shares | | | 50 | |
Institutional Shares | | | 38 | |
Advisor Shares | | | 82 | |
Director’s fees | | | 39 | |
Other operating expenses | | | 29 | |
Total operating expenses | | | 11,969 | |
Net investment income | | | 11,433 | |
| NET REALIZED AND UNREALIZED GAINS (LOSSES) ON INVESTMENTS: | |
Net realized gain (loss) on: | | | | |
Investments, from unaffiliated issuers | | | 144,073 | |
Investments, from affiliated issuers | | | (11,716 | ) |
Foreign currency related transactions | | | (109 | ) |
Total realized gain | | | 132,248 | |
Net decrease in unrealized appreciation or depreciation on: | | | | |
Investments, from unaffiliated issuers | | | (241,201 | ) |
Investments, from affiliated issuers | | | (32,727 | ) |
Foreign currency related transactions | | | (16 | ) |
Total decrease in unrealized appreciation or depreciation | | | (273,944 | ) |
Net loss on investments and foreign currency related transactions | | | (141,696 | ) |
Net decrease in net assets resulting from operations | | $ | (130,263 | ) |
(1) Net of foreign taxes withheld on dividends, unaffiliated issuers | | $ | 393 | |
The accompanying notes are an integral part of the financial statements.
| | |
| Artisan Partners Funds | | 81 |
ARTISAN PARTNERS FUNDS
Statements of Changes in Net Assets
Dollar values in thousands
| | | | | | | | | | | | | | | |
| | | DEVELOPING WORLD | | EMERGING MARKETS |
| | | Period Ended
9/30/2015(1) | | Year Ended
9/30/2015 | | Year Ended
9/30/2014(2) |
| OPERATIONS: | | | | | | | | | | | | | | | |
Net investment income (loss) | | | $ | (48 | ) | | | $ | 242 | | | | $ | 4,955 | |
Net realized gain (loss) on: | | | | | | | | | | | | | | | |
Investments, from unaffiliated issuers | | | | (1,448 | ) | | | | 19,178 | | | | | (40,579 | ) |
Foreign currency related transactions | | | | (1 | ) | | | | (532 | ) | | | | (154 | ) |
Net increase (decrease) in unrealized appreciation or depreciation on: | | | | | | | | | | | | | | | |
Investments, from unaffiliated issuers | | | | (8,768 | ) | | | | (38,593 | ) | | | | 53,274 | |
Foreign currency related transactions | | | | (8 | ) | | | | 3 | | | | | 10 | |
Net increase (decrease) in net assets resulting from operations | | | | (10,273 | ) | | | | (19,702 | ) | | | | 17,506 | |
| DISTRIBUTIONS PAID TO SHAREHOLDERS: | | | | | | | | | | | | | | | |
Net investment income: | | | | | | | | | | | | | | | |
Investor Shares | | | | – | | | | | (405 | ) | | | | (1,021 | ) |
Institutional Shares | | | | – | | | | | (3,071 | ) | | | | (4,377 | ) |
Total distributions paid to shareholders | | | | – | | | | | (3,476 | ) | | | | (5,398 | ) |
| FUND SHARE ACTIVITIES: | | | | | | | | | | | | | | | |
Net increase (decrease) in net assets resulting from fund share activities | | | | 129,104 | | | | | (331,370 | ) | | | | (269,148 | ) |
Total increase (decrease) in net assets | | | | 118,831 | | | | | (354,548 | ) | | | | (257,040 | ) |
Net assets, beginning of period | | | | – | | | | | 405,351 | | | | | 662,391 | |
Net assets, end of period | | | $ | 118,831 | | | | $ | 50,803 | | | | $ | 405,351 | |
Accumulated undistributed net investment income (loss) | | | $ | (48 | ) | | | $ | (425 | ) | | | $ | 1,649 | |
| (1) | For the period from commencement of operations (June 29, 2015) through September 30, 2015. |
| (2) | Effective February 14, 2014, the Emerging Markets Fund’s Advisor Shares were redesignated as Investor Shares. |
The accompanying notes are an integral part of the financial statements.
| | |
| 82 | | Artisan Partners Funds |
ARTISAN PARTNERS FUNDS
Statements of Changes in Net Assets (Continued)
Dollar values in thousands
| | | | | | | | | | | | | | | | |
| | | GLOBAL EQUITY | | | GLOBAL OPPORTUNITIES | |
| | | Year Ended
9/30/2015 | | | Year Ended
9/30/2014 | | | Year Ended
9/30/2015 | | | Year Ended
9/30/2014 | |
| OPERATIONS: | | | | | | | | | | | | | | | | |
Net investment income (loss) | | $ | (518 | ) | | $ | (297 | ) | | $ | 2,579 | | | $ | 1,598 | |
Net realized gain (loss) on: | | | | | | | | | | | | | | | | |
Investments, from unaffiliated issuers | | | 10,712 | | | | 7,333 | | | | 6,414 | | | | 28,167 | |
Investments, from affiliated issuers | | | (2,210 | ) | | | (34 | ) | | | (500 | ) | | | (1 | ) |
Foreign currency related transactions | | | (51 | ) | | | (35 | ) | | | 4,037 | | | | 841 | |
Net increase (decrease) in unrealized appreciation or depreciation on: | | | | | | | | | | | | | | | | |
Investments, from unaffiliated issuers | | | (12,053 | ) | | | 6,496 | | | | (24,156 | ) | | | 42,635 | |
Investments, from affiliated issuers | | | (2,496 | ) | | | (594 | ) | | | (5,162 | ) | | | 8,613 | |
Foreign currency related transactions | | | 10 | | | | (15 | ) | | | (2,924 | ) | | | 1,318 | |
Net increase (decrease) in net assets resulting from operations | | | (6,606 | ) | | | 12,854 | | | | (19,712 | ) | | | 83,171 | |
| DISTRIBUTIONS PAID TO SHAREHOLDERS: | | | | | | | | | | | | | | | | |
Net investment income: | | | | | | | | | | | | | | | | |
Investor Shares | | | – | | | | – | | | | (2,108 | ) | | | – | |
Institutional Shares | | | | | | | | | | | (2,576 | ) | | | – | |
Net realized gains on investment transactions: | | | | | | | | | | | | | | | | |
Investor Shares | | | (7,233 | ) | | | (7,484 | ) | | | (16,250 | ) | | | – | |
Institutional Shares | | | | | | | | | | | (10,211 | ) | | | – | |
Total distributions paid to shareholders | | | (7,233 | ) | | | (7,484 | ) | | | (31,145 | ) | | | – | |
| FUND SHARE ACTIVITIES: | | | | | | | | | | | | | | | | |
Net increase in net assets resulting from fund share activities | | | 73,949 | | | | 74,809 | | | | 247,071 | | | | 322,388 | |
Total increase in net assets | | | 60,110 | | | | 80,179 | | | | 196,214 | | | | 405,559 | |
Net assets, beginning of period | | | 236,270 | | | | 156,091 | | | | 1,159,708 | | | | 754,149 | |
Net assets, end of period | | $ | 296,380 | | | $ | 236,270 | | | $ | 1,355,922 | | | $ | 1,159,708 | |
Accumulated undistributed net investment income (loss) | | $ | (1 | ) | | $ | – | | | $ | 3,948 | | | $ | 2,097 | |
The accompanying notes are an integral part of the financial statements.
| | |
| Artisan Partners Funds | | 83 |
ARTISAN PARTNERS FUNDS
Statements of Changes in Net Assets (Continued)
Dollar values in thousands
| | | | | | | | | | | | | | | | |
| | | GLOBAL SMALL CAP | | | GLOBAL VALUE | |
| | | Year Ended
9/30/2015 | | | Year Ended
9/30/2014 | | | Year Ended
9/30/2015 | | | Year Ended
9/30/2014 | |
| OPERATIONS: | | | | | | | | | | | | | | | | |
Net investment income (loss) | | $ | (507 | ) | | $ | 108 | | | $ | 10,111 | | | $ | 10,935 | |
Net realized gain (loss) on: | | | | | | | | | | | | | | | | |
Investments, from unaffiliated issuers | | | (3,750 | ) | | | 2,895 | | | | 87,706 | | | | 58,251 | |
Investments, from affiliated issuers | | | (3,309 | ) | | | (763 | ) | | | (4,067 | ) | | | – | |
Foreign currency related transactions | | | (53 | ) | | | (67 | ) | | | 3,022 | | | | 717 | |
Net increase (decrease) in unrealized appreciation or depreciation on: | | | | | | | | | | | | | | | | |
Investments, from unaffiliated issuers | | | 3,374 | | | | (9,918 | ) | | | (166,279 | ) | | | 74,560 | |
Investments, from affiliated issuers | | | (1,259 | ) | | | (771 | ) | | | 7,112 | | | | (248 | ) |
Foreign currency related transactions | | | 2 | | | | (7 | ) | | | (1,437 | ) | | | 1,348 | |
Net increase (decrease) in net assets resulting from operations | | | (5,502 | ) | | | (8,523 | ) | | | (63,832 | ) | | | 145,563 | |
| DISTRIBUTIONS PAID TO SHAREHOLDERS: | | | | | | | | | | | | | | | | |
Net investment income: | | | | | | | | | | | | | | | | |
Investor Shares | | | (250 | ) | | | (38 | ) | | | (6,402 | ) | | | (5,322 | ) |
Institutional Shares | | | | | | | | | | | (3,909 | ) | | | (3,036 | ) |
Net realized gains on investment transactions: | | | | | | | | | | | | | | | | |
Investor Shares | | | (2,100 | ) | | | (85 | ) | | | (35,854 | ) | | | (15,793 | ) |
Institutional Shares | | | | | | | | | | | (15,333 | ) | | | (7,056 | ) |
Total distributions paid to shareholders | | | (2,350 | ) | | | (123 | ) | | | (61,498 | ) | | | (31,207 | ) |
| FUND SHARE ACTIVITIES: | | | | | | | | | | | | | | | | |
Net increase (decrease) in net assets resulting from fund share activities | | | (28,165 | ) | | | 135,180 | | | | (216,544 | ) | | | 608,003 | |
Total increase (decrease) in net assets | | | (36,017 | ) | | | 126,534 | | | | (341,874 | ) | | | 722,359 | |
Net assets, beginning of period | | | 166,112 | | | | 39,578 | | | | 1,867,180 | | | | 1,144,821 | |
Net assets, end of period | | $ | 130,095 | | | $ | 166,112 | | | $ | 1,525,306 | | | $ | 1,867,180 | |
Accumulated undistributed net investment income (loss) | | $ | (311 | ) | | $ | 22 | | | $ | 7,501 | | | $ | 5,262 | |
The accompanying notes are an integral part of the financial statements.
| | |
| 84 | | Artisan Partners Funds |
ARTISAN PARTNERS FUNDS
Statements of Changes in Net Assets (Continued)
Dollar values in thousands
| | | | | | | | | | | | | | | | |
| | | HIGH INCOME | | | INTERNATIONAL | |
| | | Year Ended
9/30/2015 | | | Period Ended
9/30/2014(1) | | | Year Ended
9/30/2015 | | | Year Ended
9/30/2014 | |
| OPERATIONS: | | | | | | | | | | | | | | | | |
Net investment income | | $ | 41,650 | | | $ | 8,296 | | | $ | 109,203 | | | $ | 144,872 | |
Net realized gain (loss) on: | | | | | | | | | | | | | | | | |
Investments, from unaffiliated issuers | | | 4,468 | | | | 1,286 | | | | (102,009 | ) | | | 944,468 | |
Investments, from affiliated issuers | | | – | | | | – | | | | 56,701 | | | | 12,235 | |
Foreign currency related transactions | | | (216 | ) | | | 288 | | | | (5,379 | ) | | | (3,296 | ) |
Net increase (decrease) in unrealized appreciation or depreciation on: | | | | | | | | | | | | | | | | |
Investments, from unaffiliated issuers | | | (40,918 | ) | | | (6,967 | ) | | | (1,738,726 | ) | | | (551,682 | ) |
Investments, from affiliated issuers | | | – | | | | – | | | | (260,710 | ) | | | 260,710 | |
Foreign currency related transactions | | | (222 | ) | | | 222 | | | | (672 | ) | | | (2,425 | ) |
Net increase (decrease) in net assets resulting from operations | | | 4,762 | | | | 3,125 | | | | (1,941,592 | ) | | | 804,882 | |
| DISTRIBUTIONS PAID TO SHAREHOLDERS: | | | | | | | | | | | | | | | | |
Net investment income: | | | | | | | | | | | | | | | | |
Investor Shares | | | (24,905 | ) | | | (4,561 | ) | | | (104,597 | ) | | | (104,230 | ) |
Institutional Shares | | | | | | | | | | | (35,466 | ) | | | (42,531 | ) |
Advisor Shares | | | (16,745 | ) | | | (3,737 | ) | | | – | | | | | |
Net realized gains on investment transactions: | | | | | | | | | | | | | | | | |
Investor Shares | | | (1,377 | ) | | | – | | | | – | | | | – | |
Advisor Shares | | | (1,005 | ) | | | – | | | | – | | | | | |
Total distributions paid to shareholders | | | (44,032 | ) | | | (8,298 | ) | | | (140,063 | ) | | | (146,761 | ) |
| FUND SHARE ACTIVITIES: | | | | | | | | | | | | | | | | |
Net increase in net assets resulting from fund share activities | | | 447,338 | | | | 511,164 | | | | 2,142,912 | | | | 3,454,481 | |
Total increase in net assets | | | 408,068 | | | | 505,991 | | | | 61,257 | | | | 4,112,602 | |
Net assets, beginning of period | | | 505,991 | | | | – | | | | 17,533,826 | | | | 13,421,224 | |
Net assets, end of period | | $ | 914,059 | | | $ | 505,991 | | | $ | 17,595,083 | | | $ | 17,533,826 | |
Accumulated undistributed net investment income | | $ | (3 | ) | | $ | 110 | | | $ | 103,515 | | | $ | 137,589 | |
| (1) | For the period from commencement of operations (March 19, 2014) through September 30, 2014 |
The accompanying notes are an integral part of the financial statements.
| | |
| Artisan Partners Funds | | 85 |
ARTISAN PARTNERS FUNDS
Statements of Changes in Net Assets (Continued)
Dollar values in thousands
| | | | | | | | | | | | | | | | |
| | | INTERNATIONAL SMALL CAP | | | INTERNATIONAL VALUE | |
| | | Year Ended
9/30/2015 | | | Year Ended
9/30/2014 | | | Year Ended
9/30/2015 | | | Year Ended
9/30/2014 | |
| OPERATIONS: | | | | | | | | | | | | | | | | |
Net investment income (loss) | | $ | 1,360 | | | $ | (535 | ) | | $ | 78,562 | | | $ | 105,165 | |
Net realized gain (loss) on: | | | | | | | | | | | | | | | | |
Investments, from unaffiliated issuers | | | 58,434 | | | | 78,161 | | | | 812,186 | | | | 516,896 | |
Investments, from affiliated issuers | | | (16,392 | ) | | | (735 | ) | | | (16,011 | ) | | | 51,690 | |
Foreign currency related transactions | | | (293 | ) | | | (430 | ) | | | 117,893 | | | | 24,383 | |
Net increase (decrease) in unrealized appreciation or depreciation on: | | | | | | | | | | | | | | | | |
Investments, from unaffiliated issuers | | | (12,675 | ) | | | (100,813 | ) | | | (1,369,714 | ) | | | 68,965 | |
Investments, from affiliated issuers | | | (11,030 | ) | | | (3,890 | ) | | | (71,468 | ) | | | (114,770 | ) |
Foreign currency related transactions | | | 44 | | | | (114 | ) | | | (56,314 | ) | | | 45,286 | |
Net increase (decrease) in net assets resulting from operations | | | 19,448 | | | | (28,356 | ) | | | (504,866 | ) | | | 697,615 | |
| DISTRIBUTIONS PAID TO SHAREHOLDERS: | | | | | | | | | | | | | | | | |
Net investment income: | | | | | | | | | | | | | | | | |
Investor Shares | | | – | | | | (4,981 | ) | | | (132,953 | ) | | | (141,848 | ) |
Institutional Shares | | | | | | | | | | | (44,007 | ) | | | (41,492 | ) |
Net realized gains on investment transactions: | | | | | | | | | | | | | | | | |
Investor Shares | | | (59,359 | ) | | | (64,140 | ) | | | (440,577 | ) | | | (484,885 | ) |
Institutional Shares | | | | | | | | | | | (128,108 | ) | | | (132,447 | ) |
Total distributions paid to shareholders | | | (59,359 | ) | | | (69,121 | ) | | | (745,645 | ) | | | (800,672 | ) |
| FUND SHARE ACTIVITIES: | | | | | | | | | | | | | | | | |
Net increase (decrease) in net assets resulting from fund share activities | | | (89,145 | ) | | | 191,418 | | | | 459,664 | | | | 1,062,751 | |
Total increase (decrease) in net assets | | | (129,056 | ) | | | 93,941 | | | | (790,847 | ) | | | 959,694 | |
Net assets, beginning of period | | | 1,090,091 | | | | 996,150 | | | | 11,409,836 | | | | 10,450,142 | |
Net assets, end of period | | $ | 961,035 | | | $ | 1,090,091 | | | $ | 10,618,989 | | | $ | 11,409,836 | |
Accumulated undistributed net investment income (loss) | | $ | 983 | | | $ | (8 | ) | | $ | 103,892 | | | $ | 91,816 | |
The accompanying notes are an integral part of the financial statements.
| | |
| 86 | | Artisan Partners Funds |
ARTISAN PARTNERS FUNDS
Statements of Changes in Net Assets (Continued)
Dollar values in thousands
| | | | | | | | | | | | | | | | |
| | | MID CAP | | | MID CAP VALUE | |
| | | Year Ended
9/30/2015 | | | Year Ended
9/30/2014 | | | Year Ended
9/30/2015 | | | Year Ended
9/30/2014 | |
| OPERATIONS: | | | | | | | | | | | | | | | | |
Net investment income (loss) | | $ | (62,414 | ) | | $ | (61,306 | ) | | $ | 78,150 | | | $ | 57,588 | |
Net realized gain (loss) on: | | | | | | | | | | | | | | | | |
Investments, from unaffiliated issuers | | | 1,278,012 | | | | 1,172,744 | | | | 1,364,322 | | | | 841,487 | |
Investments, from affiliated issuers | | | 8,468 | | | | 49,467 | | | | (107,549 | ) | | | 186,104 | |
Foreign currency related transactions | | | – | | | | – | | | | – | | | | – | |
Net increase (decrease) in unrealized appreciation or depreciation on: | | | | | | | | | | | | | | | | |
Investments, from unaffiliated issuers | | | (824,223 | ) | | | (519,345 | ) | | | (1,696,969 | ) | | | (93,241 | ) |
Investments, from affiliated issuers | | | (47,458 | ) | | | (94,153 | ) | | | (201,469 | ) | | | (180,216 | ) |
Foreign currency related transactions | | | – | | | | – | | | | – | | | | – | (1) |
Net increase (decrease) in net assets resulting from operations | | | 352,385 | | | | 547,407 | | | | (563,515 | ) | | | 811,722 | |
| DISTRIBUTIONS PAID TO SHAREHOLDERS: | | | | | | | | | | | | | | | | |
Net investment income: | | | | | | | | | | | | | | | | |
Investor Shares | | | – | | | | – | | | | (56,887 | ) | | | (40,163 | ) |
Institutional Shares | | | – | | | | – | | | | (15,736 | ) | | | (9,155 | ) |
Net realized gains on investment transactions: | | | | | | | | | | | | | | | | |
Investor Shares | | | (525,174 | ) | | | (435,868 | ) | | | (856,469 | ) | | | (400,451 | ) |
Institutional Shares | | | (429,114 | ) | | | (268,248 | ) | | | (163,097 | ) | | | (60,467 | ) |
Total distributions paid to shareholders | | | (954,288 | ) | | | (704,116 | ) | | | (1,092,189 | ) | | | (510,236 | ) |
| FUND SHARE ACTIVITIES: | | | | | | | | | | | | | | | | |
Net increase (decrease) in net assets resulting from fund share activities | | | (75,706 | ) | | | 581,357 | | | | (2,832,587 | ) | | | (89,475 | ) |
Total increase (decrease) in net assets | | | (677,609 | ) | | | 424,648 | | | | (4,488,291 | ) | | | 212,011 | |
Net assets, beginning of period | | | 9,501,417 | | | | 9,076,769 | | | | 11,008,051 | | | | 10,796,040 | |
Net assets, end of period | | $ | 8,823,808 | | | $ | 9,501,417 | | | $ | 6,519,760 | | | $ | 11,008,051 | |
Accumulated undistributed net investment income (loss) | | $ | (48,099 | ) | | $ | (45,474 | ) | | $ | 30,984 | | | $ | 39,180 | |
| (1) | Amount rounds to less than $1. |
The accompanying notes are an integral part of the financial statements.
| | |
| Artisan Partners Funds | | 87 |
ARTISAN PARTNERS FUNDS
Statements of Changes in Net Assets (Continued)
Dollar values in thousands
| | | | | | | | | | | | | | | | |
| | | SMALL CAP | | | SMALL CAP VALUE | |
| | | Year Ended
9/30/2015 | | | Year Ended
9/30/2014 | | | Year Ended
9/30/2015 | | | Year Ended
9/30/2014 | |
| OPERATIONS: | | | | | | | | | | | | | | | | |
Net investment income (loss) | | $ | (13,975 | ) | | $ | (17,290 | ) | | $ | 5,034 | | | $ | 1,541 | |
Net realized gain (loss) on: | | | | | | | | | | | | | | | | |
Investments, from unaffiliated issuers | | | 190,485 | | | | 19,466 | | | | 127,678 | | | | 288,938 | |
Investments, from affiliated issuers | | | (5,281 | ) | | | 10,002 | | | | 13,451 | | | | 81,839 | |
Foreign currency related transactions | | | – | | | | – | | | | – | | | | – | (1) |
Net increase (decrease) in unrealized appreciation or depreciation on: | | | | | | | | | | | | | | | | |
Investments, from unaffiliated issuers | | | (55,269 | ) | | | (9,486 | ) | | | (175,970 | ) | | | (287,537 | ) |
Investments, from affiliated issuers | | | 3,813 | | | | (63,278 | ) | | | (31,263 | ) | | | (53,385 | ) |
Foreign currency related transactions | | | – | | | | – | | | | – | | | | – | |
Net increase (decrease) in net assets resulting from operations | | | 119,773 | | | | (60,586 | ) | | | (61,070 | ) | | | 31,396 | |
| DISTRIBUTIONS PAID TO SHAREHOLDERS: | | | | | | | | | | | | | | | | |
Net investment income: | | | | | | | | | | | | | | | | |
Investor Shares | | | – | | | | – | | | | – | | | | (5,806 | ) |
Institutional Shares | | | – | | | | – | | | | – | | | | (1,030 | ) |
Net realized gains on investment transactions: | | | | | | | | | | | | | | | | |
Investor Shares | | | – | | | | – | | | | (210,711 | ) | | | (86,756 | ) |
Institutional Shares | | | – | | | | – | | | | (50,568 | ) | | | (12,496 | ) |
Total distributions paid to shareholders | | | – | | | | – | | | | (261,279 | ) | | | (106,088 | ) |
| FUND SHARE ACTIVITIES: | | | | | | | | | | | | | | | | |
Net decrease in net assets resulting from fund share activities | | | (326,206 | ) | | | (34,679 | ) | | | (770,621 | ) | | | (1,103,295 | ) |
Total decrease in net assets | | | (206,433 | ) | | | (95,265 | ) | | | (1,092,970 | ) | | | (1,177,987 | ) |
Net assets, beginning of period | | | 1,459,693 | | | | 1,554,958 | | | | 1,586,156 | | | | 2,764,143 | |
Net assets, end of period | | $ | 1,253,260 | | | $ | 1,459,693 | | | $ | 493,186 | | | $ | 1,586,156 | |
Accumulated undistributed net investment income (loss) | | $ | (10,074 | ) | | $ | (13,057 | ) | | $ | 4,431 | | | $ | – | |
| (1) | Amount rounds to less than $1. |
The accompanying notes are an integral part of the financial statements.
| | |
| 88 | | Artisan Partners Funds |
ARTISAN PARTNERS FUNDS
Statements of Changes in Net Assets (Continued)
Dollar values in thousands
| | | | | | | | |
| | | VALUE | |
| | | Year Ended
9/30/2015 | | | Year Ended
9/30/2014 | |
| OPERATIONS: | | | | | | | | |
Net investment income | | $ | 11,433 | | | $ | 15,700 | |
Net realized gain (loss) on: | | | | | | | | |
Investments, from unaffiliated issuers | | | 144,073 | | | | 95,846 | |
Investments, from affiliated issuers | | | (11,716 | ) | | | 279 | |
Foreign currency related transactions | | | (109 | ) | | | (46 | ) |
Net increase (decrease) in unrealized appreciation or depreciation on: | | | | | | | | |
Investments, from unaffiliated issuers | | | (241,201 | ) | | | 38,694 | |
Investments, from affiliated issuers | | | (32,727 | ) | | | (84 | ) |
Foreign currency related transactions | | | (16 | ) | | | (15 | ) |
Net increase (decrease) in net assets resulting from operations | | | (130,263 | ) | | | 150,374 | |
| DISTRIBUTIONS PAID TO SHAREHOLDERS: | | | | | | | | |
Net investment income: | | | | | | | | |
Investor Shares | | | (9,207 | ) | | | (7,502 | ) |
Institutional Shares | | | (3,246 | ) | | | (2,037 | ) |
Net realized gains on investment transactions: | | | | | | | | |
Investor Shares | | | (74,612 | ) | | | (56,730 | ) |
Institutional Shares | | | (19,962 | ) | | | (11,945 | ) |
Total distributions paid to shareholders | | | (107,027 | ) | | | (78,214 | ) |
| FUND SHARE ACTIVITIES: | | | | | | | | |
Net decrease in net assets resulting from fund share activities | | | (250,633 | ) | | | (9,170 | ) |
Total increase (decrease) in net assets | | | (487,923 | ) | | | 62,990 | |
Net assets, beginning of period | | | 1,476,620 | | | | 1,413,630 | |
Net assets, end of period | | $ | 988,697 | | | $ | 1,476,620 | |
Accumulated undistributed net investment income | | $ | 7,097 | | | $ | 9,687 | |
The accompanying notes are an integral part of the financial statements.
| | |
| Artisan Partners Funds | | 89 |
ARTISAN PARTNERS FUNDS
Financial Highlights – For a share outstanding throughout each period
The financial highlights tables are intended to help you understand the Fund’s financial performance for the past 5 years or, if shorter, the period of a Fund’s operations. Certain information reflects financial results for a single Fund share. The total returns in the table represent the rate that an investor would have earned or lost on an investment in the Fund (assuming reinvestment of all dividends and distributions).
| | | | | | | | | | | | | | | | | | | | | | | | | | | | | | | | |
| | | | | | |
| | | | | | | | | | | | | | | Less Distributions From | | | | |
| | | Net
Asset
Value,
Beginning
of Period | | | Net
Investment
Income (Loss)(1) | | | Net Realized
and Unrealized
Gain (Loss) on
Investments | | | Total
from
Operations | | | Net
Investment
Income | | | Net
Realized
Gains | | | Total
Distributions | | | Net
Asset
Value,
End
of Period | |
| DEVELOPING WORLD FUND | | | | | | | | | | | | | | | | | | | | | | | | | |
Investor Shares | | | | | | | | | | | | | | | | | | | | | | | | | | | | | | | | |
9/30/2015(5) | | $ | 10.00 | | | | — | (6) | | | (1.61 | ) | | | (1.61 | ) | | | — | | | | — | | | | — | | | $ | 8.39 | |
Institutional Shares | | | | | | | | | | | | | | | | | | | | | | | | | | | | | | | | |
9/30/2015(5) | | $ | 10.00 | | | | (0.01 | ) | | | (1.60 | ) | | | (1.61 | ) | | | — | | | | — | | | | — | | | $ | 8.39 | |
Advisor Shares | | | | | | | | | | | | | | | | | | | | | | | | | | | | | | | | |
9/30/2015(5) | | $ | 10.00 | | | | (0.01 | ) | | | (1.60 | ) | | | (1.61 | ) | | | — | | | | — | | | | — | | | $ | 8.39 | |
| EMERGING MARKETS FUND | | | | | | | | | | | | | | | | | | | | | | | | | |
Investor Shares(7) | | | | | | | | | | | | | | | | | | | | | | | | | | | | | | | | |
9/30/2015 | | $ | 12.54 | | | | 0.02 | | | | (2.56 | ) | | | (2.54 | ) | | | (0.10 | ) | | | — | | | | (0.10 | ) | | $ | 9.90 | |
9/30/2014 | | $ | 12.32 | | | | 0.08 | | | | 0.20 | | | | 0.28 | | | | (0.06 | ) | | | — | | | | (0.06 | ) | | $ | 12.54 | |
9/30/2013 | | $ | 12.76 | | | | 0.10 | | | | (0.38 | ) | | | (0.28 | ) | | | (0.16 | ) | | | — | | | | (0.16 | ) | | $ | 12.32 | |
9/30/2012 | | $ | 11.38 | | | | 0.10 | | | | 1.38 | | | | 1.48 | | | | (0.07 | ) | | | (0.03 | ) | | | (0.10 | ) | | $ | 12.76 | |
9/30/2011 | | $ | 15.24 | | | | 0.18 | | | | (3.94 | ) | | | (3.76 | ) | | | (0.10 | ) | | | — | | | | (0.10 | ) | | $ | 11.38 | |
Institutional Shares | | | | | | | | | | | | | | | | | | | | | | | | | | | | | | | | |
9/30/2015 | | $ | 12.52 | | | | 0.02 | | | | (2.53 | ) | | | (2.51 | ) | | | (0.18 | ) | | | — | | | | (0.18 | ) | | $ | 9.83 | |
9/30/2014 | | $ | 12.32 | | | | 0.12 | | | | 0.20 | | | | 0.32 | | | | (0.12 | ) | | | — | | | | (0.12 | ) | | $ | 12.52 | |
9/30/2013 | | $ | 12.75 | | | | 0.14 | | | | (0.37 | ) | | | (0.23 | ) | | | (0.20 | ) | | | — | | | | (0.20 | ) | | $ | 12.32 | |
9/30/2012 | | $ | 11.37 | | | | 0.15 | | | | 1.36 | | | | 1.51 | | | | (0.10 | ) | | | (0.03 | ) | | | (0.13 | ) | | $ | 12.75 | |
9/30/2011 | | $ | 15.23 | | | | 0.21 | | | | (3.93 | ) | | | (3.72 | ) | | | (0.14 | ) | | | — | | | | (0.14 | ) | | $ | 11.37 | |
| GLOBAL EQUITY FUND | | | | | | | | | | | | | | | | | | | | | | | | | |
Investor Shares | | | | | | | | | | | | | | | | | | | | | | | | | | | | | | | | |
9/30/2015 | | $ | 16.18 | | | | (0.03 | ) | | | 0.07 | | | | 0.04 | | | | — | | | | (0.49 | ) | | | (0.49 | ) | | $ | 15.73 | |
9/30/2014 | | $ | 15.72 | | | | (0.02 | ) | | | 1.23 | | | | 1.21 | | | | — | | | | (0.75 | ) | | | (0.75 | ) | | $ | 16.18 | |
9/30/2013 | | $ | 13.05 | | | | (0.01 | ) | | | 3.23 | | | | 3.22 | | | | (0.03 | ) | | | (0.52 | ) | | | (0.55 | ) | | $ | 15.72 | |
9/30/2012 | | $ | 9.83 | | | | 0.05 | | | | 3.38 | | | | 3.43 | | | | (0.03 | ) | | | (0.18 | ) | | | (0.21 | ) | | $ | 13.05 | |
9/30/2011 | | $ | 10.23 | | | | (0.03 | ) | | | (0.23 | ) | | | (0.26 | ) | | | (0.06 | ) | | | (0.08 | ) | | | (0.14 | ) | | $ | 9.83 | |
Footnotes are presented on Page 101.
The accompanying notes are an integral part of the financial statements.
| | |
| 90 | | Artisan Partners Funds |
ARTISAN PARTNERS FUNDS
Financial Highlights (Continued)
| | | | | | | | | | | | | | | | | | | | | | | | |
| | | Total
Return(2) | | | Net Assets,
End
of Period
(000) | | | Ratio of
Expenses
to Average
Net Assets(3) | | | Ratio of
Expenses
to Average
Net Assets
Excluding
Waivers(3)(4) | | | Ratio
of Net
Investment
Income (Loss)
to Average
Net Assets(3)(4) | | | Portfolio
Turnover
Rate(2) | |
| DEVELOPING WORLD FUND | | | | | | | | | | | | | | | | | |
Investor Shares | | | | | | | | | | | | | | | | | | | | | | | | |
9/30/2015(5) | | | (16.10 | )% | | $ | 20,642 | | | | 1.50 | % | | | 2.23 | % | | | (0.20 | )% | | | 9.00 | % |
Institutional Shares | | | | | | | | | | | | | | | | | | | | | | | | |
9/30/2015(5) | | | (16.10 | )% | | $ | 39,993 | | | | 1.40 | % | | | 2.03 | % | | | (0.44 | )% | | | 9.00 | % |
Advisor Shares | | | | | | | | | | | | | | | | | | | | | | | | |
9/30/2015(5) | | | (16.10 | )% | | $ | 58,196 | | | | 1.40 | % | | | 1.96 | % | | | (0.37 | )% | | | 9.00 | % |
| EMERGING MARKETS FUND | | | | | | | | | | | | | | | | | |
Investor Shares(7) | | | | | | | | | | | | | | | | | | | | | | | | |
9/30/2015 | | | (20.44 | )% | | $ | 22,842 | | | | 1.50 | % | | | 1.79 | % | | | 0.16 | % | | | 28.03 | % |
9/30/2014 | | | 2.29 | % | | $ | 67,065 | | | | 1.50 | % | | | 1.51 | % | | | 0.64 | % | | | 32.26 | % |
9/30/2013 | | | (2.25 | )% | | $ | 199,920 | | | | 1.48 | % | | | n/a | | | | 0.76 | % | | | 35.89 | % |
9/30/2012 | | | 13.10 | % | | $ | 292,420 | | | | 1.48 | % | | | n/a | | | | 0.85 | % | | | 38.19 | % |
9/30/2011 | | | (24.86 | )% | | $ | 317,186 | | | | 1.47 | % | | | n/a | | | | 1.19 | % | | | 30.86 | % |
Institutional Shares | | | | | | | | | | | | | | | | | | | | | | | | |
9/30/2015 | | | (20.43 | )% | | $ | 27,961 | | | | 1.36 | % | | | n/a | | | | 0.16 | % | | | 28.03 | % |
9/30/2014 | | | 2.65 | % | | $ | 338,286 | | | | 1.19 | % | | | n/a | | | | 0.96 | % | | | 32.26 | % |
9/30/2013 | | | (1.91 | )% | | $ | 462,471 | | | | 1.18 | % | | | n/a | | | | 1.15 | % | | | 35.89 | % |
9/30/2012 | | | 13.47 | % | | $ | 494,836 | | | | 1.16 | % | | | n/a | | | | 1.25 | % | | | 38.19 | % |
9/30/2011 | | | (24.67 | )% | | $ | 352,093 | | | | 1.19 | % | | | n/a | | | | 1.41 | % | | | 30.86 | % |
| GLOBAL EQUITY FUND | | | | | | | | | | | | | | | | | |
Investor Shares | | | | | | | | | | | | | | | | | | | | | | | | |
9/30/2015 | | | 0.20 | % | | $ | 296,380 | | | | 1.37 | % | | | n/a | | | | (0.19 | )% | | | 78.44 | % |
9/30/2014 | | | 7.94 | % | | $ | 236,270 | | | | 1.46 | % | | | n/a | | | | (0.14 | )% | | | 89.24 | % |
9/30/2013 | | | 25.51 | % | | $ | 156,091 | | | | 1.50 | % | | | 1.77 | % | | | (0.08 | )% | | | 126.40 | % |
9/30/2012 | | | 35.43 | % | | $ | 15,538 | | | | 1.50 | % | | | 3.05 | % | | | 0.43 | % | | | 98.03 | % |
9/30/2011 | | | (2.66 | )% | | $ | 10,908 | | | | 1.50 | % | | | 3.12 | % | | | 0.28 | % | | | 150.01 | % |
Footnotes are presented on Page 101.
The accompanying notes are an integral part of the financial statements.
| | |
| Artisan Partners Funds | | 91 |
ARTISAN PARTNERS FUNDS
Financial Highlights – For a share outstanding throughout each period
| | | | | | | | | | | | | | | | | | | | | | | | | | | | | | | | |
| | | | | | | | | | | | | | | Less Distributions From | | | | |
| | | Net
Asset
Value,
Beginning
of Period | | | Net Investment
Income (Loss)(1) | | | Net Realized
and Unrealized
Gain (Loss) on
Investments | | | Total
from
Operations | | | Net
Investment
Income | | | Net
Realized
Gains | | | Total
Distributions | | | Net
Asset
Value,
End
of Period | |
| GLOBAL OPPORTUNITIES FUND | | | | | | | | | | | | | | | | | | | | | | | | | |
Investor Shares | | | | | | | | | | | | | | | | | | | | | | | | | | | | | | | | |
9/30/2015 | | $ | 18.92 | | | | 0.01 | | | | (0.09 | ) | | | (0.08 | ) | | | (0.06 | ) | | | (0.43 | ) | | | (0.49 | ) | | $ | 18.35 | |
9/30/2014 | | $ | 17.29 | | | | 0.01 | | | | 1.62 | | | | 1.63 | | | | — | | | | — | | | | — | | | $ | 18.92 | |
9/30/2013 | | $ | 14.27 | | | | (0.05 | ) | | | 3.07 | | | | 3.02 | | | | — | | | | — | | | | — | | | $ | 17.29 | |
9/30/2012 | | $ | 10.90 | | | | (0.06 | ) | | | 3.54 | | | | 3.48 | | | | — | | | | (0.11 | ) | | | (0.11 | ) | | $ | 14.27 | |
9/30/2011 | | $ | 10.99 | | | | (0.09 | ) | | | 0.13 | | | | 0.04 | | | | — | | | | (0.13 | ) | | | (0.13 | ) | | $ | 10.90 | |
Institutional Shares | | | | | | | | | | | | | | | | | | | | | | | | | | | | | | | | |
9/30/2015 | | $ | 19.04 | | | | 0.07 | | | | (0.11 | ) | | | (0.04 | ) | | | (0.11 | ) | | | (0.43 | ) | | | (0.54 | ) | | $ | 18.46 | |
9/30/2014 | | $ | 17.35 | | | | 0.07 | | | | 1.62 | | | | 1.69 | | | | — | | | | — | | | | — | | | $ | 19.04 | |
9/30/2013 | | $ | 14.29 | | | | (0.01 | ) | | | 3.07 | | | | 3.06 | | | | — | | | | — | | | | — | | | $ | 17.35 | |
9/30/2012 | | $ | 10.88 | | | | 0.01 | | | | 3.51 | | | | 3.52 | | | | — | | | | (0.11 | ) | | | (0.11 | ) | | $ | 14.29 | |
9/30/2011(8) | | $ | 13.38 | | | | (0.02 | ) | | | (2.48 | ) | | | (2.50 | ) | | | — | | | | — | | | | — | | | $ | 10.88 | |
Advisor Shares | | | | | | | | | | | | | | | | | | | | | | | | | | | | | | | | |
9/30/2015(9) | | $ | 19.16 | | | | 0.02 | | | | (0.81 | ) | | | (0.79 | ) | | | — | | | | — | | | | — | | | $ | 18.37 | |
| GLOBAL SMALL CAP FUND | | | | | | | | | | | | | | | | | | | | | | | | | |
Investor Shares | | | | | | | | | | | | | | | | | | | | | | | | | | | | | | | | |
9/30/2015 | | $ | 11.07 | | | | (0.04 | ) | | | (0.24 | ) | | | (0.28 | ) | | | (0.02 | ) | | | (0.14 | ) | | | (0.16 | ) | | $ | 10.63 | |
9/30/2014 | | $ | 10.61 | | | | 0.01 | | | | 0.48 | | | | 0.49 | | | | (0.01 | ) | | | (0.02 | ) | | | (0.03 | ) | | $ | 11.07 | |
9/30/2013(10) | | $ | 10.00 | | | | 0.01 | | | | 0.60 | | | | 0.61 | | | | — | | | | — | | | | — | | | $ | 10.61 | |
| GLOBAL VALUE FUND | | | | | | | | | | | | | | | | | | | | | | | | | |
Investor Shares | | | | | | | | | | | | | | | | | | | | | | | | | | | | | | | | |
9/30/2015 | | $ | 15.63 | | | | 0.07 | | | | (0.71 | ) | | | (0.64 | ) | | | (0.08 | ) | | | (0.44 | ) | | | (0.52 | ) | | $ | 14.47 | |
9/30/2014 | | $ | 14.44 | | | | 0.09 | | | | 1.45 | | | | 1.54 | | | | (0.09 | ) | | | (0.26 | ) | | | (0.35 | ) | | $ | 15.63 | |
9/30/2013 | | $ | 11.58 | | | | 0.06 | | | | 2.89 | | | | 2.95 | | | | (0.06 | ) | | | (0.03 | ) | | | (0.09 | ) | | $ | 14.44 | |
9/30/2012 | | $ | 9.28 | | | | 0.05 | | | | 2.42 | | | | 2.47 | | | | — | | | | (0.17 | ) | | | (0.17 | ) | | $ | 11.58 | |
9/30/2011 | | $ | 9.37 | | | | 0.06 | | | | (0.07 | ) | | | (0.01 | ) | | | (0.08 | ) | | | — | | | | (0.08 | ) | | $ | 9.28 | |
Institutional Shares | | | | | | | | | | | | | | | | | | | | | | | | | | | | | | | | |
9/30/2015 | | $ | 15.67 | | | | 0.11 | | | | (0.73 | ) | | | (0.62 | ) | | | (0.11 | ) | | | (0.44 | ) | | | (0.55 | ) | | $ | 14.50 | |
9/30/2014 | | $ | 14.46 | | | | 0.13 | | | | 1.45 | | | | 1.58 | | | | (0.11 | ) | | | (0.26 | ) | | | (0.37 | ) | | $ | 15.67 | |
9/30/2013 | | $ | 11.58 | | | | 0.07 | | | | 2.91 | | | | 2.98 | | | | (0.07 | ) | | | (0.03 | ) | | | (0.10 | ) | | $ | 14.46 | |
9/30/2012(11) | | $ | 10.75 | | | | 0.01 | | | | 0.82 | | | | 0.83 | | | | — | | | | — | | | | — | | | $ | 11.58 | |
Advisor Shares | | | | | | | | | | | | | | | | | | | | | | | | | | | | | | | | |
9/30/2015(9) | | $ | 15.60 | | | | 0.05 | | | | (1.17 | ) | | | (1.12 | ) | | | — | | | | — | | | | — | | | $ | 14.48 | |
Footnotes are presented on Page 101.
The accompanying notes are an integral part of the financial statements.
| | |
| 92 | | Artisan Partners Funds |
ARTISAN PARTNERS FUNDS
Financial Highlights (Continued)
| | | | | | | | | | | | | | | | | | | | | | | | |
| | | Total
Return(2) | | | Net Assets,
End
of Period
(000) | | | Ratio of
Expenses
to Average
Net Assets(3) | | | Ratio of
Expenses
to Average
Net Assets
Excluding
Waivers(3)(4) | | | Ratio
of Net
Investment
Income
(Loss)
to Average
Net Assets(3)(4) | | | Portfolio
Turnover
Rate(2) | |
| GLOBAL OPPORTUNITIES FUND | | | | | | | | | | | | | | | | | | | | | |
Investor Shares | | | | | | | | | | | | | | | | | | | | | | | | |
9/30/2015 | | | (0.46 | )% | | $ | 669,846 | | | | 1.19 | % | | | n/a | | | | 0.07 | % | | | 55.53 | % |
9/30/2014 | | | 9.43 | % | | $ | 724,237 | | | | 1.20 | % | | | n/a | | | | 0.07 | % | | | 45.14 | % |
9/30/2013 | | | 21.16 | % | | $ | 542,242 | | | | 1.28 | % | | | n/a | | | | (0.29 | )% | | | 41.76 | % |
9/30/2012 | | | 32.37 | % | | $ | 228,090 | | | | 1.34 | % | | | n/a | | | | (0.46 | )% | | | 43.30 | % |
9/30/2011 | | | 0.14 | % | | $ | 142,758 | | | | 1.40 | % | | | n/a | | | | (0.73 | )% | | | 76.18 | % |
Institutional Shares | | | | | | | | | | | | | | | | | | | | | | | | |
9/30/2015 | | | (0.23 | )% | | $ | 631,904 | | | | 0.95 | % | | | n/a | | | | 0.36 | % | | | 55.53 | % |
9/30/2014 | | | 9.74 | % | | $ | 435,471 | | | | 0.97 | % | | | n/a | | | | 0.35 | % | | | 45.14 | % |
9/30/2013 | | | 21.41 | % | | $ | 211,907 | | | | 1.03 | % | | | n/a | | | | (0.05 | )% | | | 41.76 | % |
9/30/2012 | | | 32.68 | % | | $ | 84,183 | | | | 1.08 | % | | | n/a | | | | 0.07 | % | | | 43.30 | % |
9/30/2011(8) | | | (18.68 | )% | | $ | 12,969 | | | | 1.50 | % | | | 2.22 | % | | | (1.42 | )% | | | 76.18 | % |
Advisor Shares | | | | | | | | | | | | | | | | | | | | | | | | |
9/30/2015(9) | | | (4.12 | )% | | $ | 54,172 | | | | 1.10 | % | | | 1.46 | % | | | 0.24 | % | | | 55.53 | % |
| GLOBAL SMALL CAP FUND | | | | | | | | | | | | | | | | | |
Investor Shares | | | | | | | | | | | | | | | | | | | | | | | | |
9/30/2015 | | | (2.56 | )% | | $ | 130,095 | | | | 1.50 | % | | | 1.53 | % | | | (0.36 | )% | | | 89.66 | % |
9/30/2014 | | | 4.62 | % | | $ | 166,112 | | | | 1.50 | % | | | 1.55 | % | | | 0.09 | % | | | 72.15 | % |
9/30/2013(10) | | | 6.10 | % | | $ | 39,578 | | | | 1.50 | % | | | 2.51 | % | | | 0.37 | % | | | 9.98 | % |
| GLOBAL VALUE FUND | | | | | | | | | | | | | | | | | |
Investor Shares | | | | | | | | | | | | | | | | | | | | | | | | |
9/30/2015 | | | (4.32 | )% | | $ | 826,965 | | | | 1.28 | % | | | n/a | | | | 0.46 | % | | | 19.41 | % |
9/30/2014 | | | 10.75 | % | | $ | 1,308,060 | | | | 1.30 | % | | | n/a | | | | 0.59 | % | | | 25.41 | % |
9/30/2013 | | | 25.68 | % | | $ | 783,265 | | | | 1.37 | % | | | n/a | | | | 0.45 | % | | | 30.79 | % |
9/30/2012 | | | 26.90 | % | | $ | 217,057 | | | | 1.50 | % | | | 1.51 | % | | | 0.50 | % | | | 22.34 | % |
9/30/2011 | | | (0.23 | )% | | $ | 65,666 | | | | 1.50 | % | | | 1.72 | % | | | 0.56 | % | | | 32.32 | % |
Institutional Shares | | | | | | | | | | | | | | | | | | | | | | | | |
9/30/2015 | | | (4.16 | )% | | $ | 512,600 | | | | 1.03 | % | | | n/a | | | | 0.73 | % | | | 19.41 | % |
9/30/2014 | | | 11.05 | % | | $ | 559,120 | | | | 1.04 | % | | | n/a | | | | 0.82 | % | | | 25.41 | % |
9/30/2013 | | | 25.98 | % | | $ | 361,556 | | | | 1.10 | % | | | n/a | | | | 0.54 | % | | | 30.79 | % |
9/30/2012(11) | | | 7.72 | % | | $ | 48,849 | | | | 1.50 | % | | | 2.43 | % | | | 0.32 | % | | | 22.34 | % |
Advisor Shares | | | | | | | | | | | | | | | | | | | | | | | | |
9/30/2015(9) | | | (7.18 | )% | | $ | 185,741 | | | | 1.20 | % | | | 1.23 | % | | | 0.70 | % | | | 19.41 | % |
Footnotes are presented on Page 101.
The accompanying notes are an integral part of the financial statements.
| | |
| Artisan Partners Funds | | 93 |
ARTISAN PARTNERS FUNDS
Financial Highlights – For a share outstanding throughout each period
| | | | | | | | | | | | | | | | | | | | | | | | | | | | | | | | | | | | |
| | | | | | | | | | | | | | | Less Distributions From | | | | | | | |
| | | Net
Asset
Value,
Beginning
of Period | | | Net Investment
Income (Loss)(1) | | | Net Realized
and Unrealized
Gain (Loss) on
Investments | | | Total
from
Operations | | | Net
Investment
Income | | | Net
Realized
Gains | | | Total
Distributions | | | Redemption
Fees | | | Net
Asset
Value,
End
of Period | |
| HIGH INCOME FUND | | | | | | | | | | | | | | | | | | | | | | | | | | | | | |
Investor Shares | | | | | | | | | | | | | | | | | | | | | | | | | | | | | | | | | | | | |
9/30/2015 | | $ | 9.97 | | | | 0.61 | | | | (0.44 | ) | | | 0.17 | | | | (0.61 | ) | | | (0.04 | ) | | | (0.65 | ) | | | — | | | $ | 9.49 | |
9/30/2014(12) | | $ | 10.00 | | | | 0.27 | | | | (0.07 | ) | | | 0.20 | | | | (0.24 | ) | | | — | | | | (0.24 | ) | | | 0.01 | | | $ | 9.97 | |
Advisor Shares | | | | | | | | | | | | | | | | | | | | | | | | | | | | | | | | | | | | |
9/30/2015 | | $ | 9.97 | | | | 0.63 | | | | (0.44 | ) | | | 0.19 | | | | (0.63 | ) | | | (0.04 | ) | | | (0.67 | ) | | | — | | | $ | 9.49 | |
9/30/2014(12) | | $ | 10.00 | | | | 0.28 | | | | (0.08 | ) | | | 0.20 | | | | (0.24 | ) | | | — | | | | (0.24 | ) | | | 0.01 | | | $ | 9.97 | |
| INTERNATIONAL FUND | | | | | | | | | | | | | | | | | | | | | | | | | | | | | |
Investor Shares | | | | | | | | | | | | | | | | | | | | | | | | | | | | | | | | | | | | |
9/30/2015 | | $ | 30.04 | | | | 0.17 | | | | (3.01 | ) | | | (2.84 | ) | | | (0.23 | ) | | | — | | | | (0.23 | ) | | | — | | | $ | 26.97 | |
9/30/2014 | | $ | 28.66 | | | | 0.26 | | | | 1.41 | | | | 1.67 | | | | (0.29 | ) | | | — | | | | (0.29 | ) | | | — | | | $ | 30.04 | |
9/30/2013 | | $ | 23.54 | | | | 0.31 | | | | 5.08 | | | | 5.39 | | | | (0.27 | ) | | | — | | | | (0.27 | ) | | | — | | | $ | 28.66 | |
9/30/2012 | | $ | 18.37 | | | | 0.28 | | | | 5.17 | | | | 5.45 | | | | (0.28 | ) | | | — | | | | (0.28 | ) | | | — | | | $ | 23.54 | |
9/30/2011 | | $ | 20.57 | | | | 0.26 | | | | (2.28 | ) | | | (2.02 | ) | | | (0.18 | ) | | | — | | | | (0.18 | ) | | | — | | | $ | 18.37 | |
Institutional Shares | | | | | | | | | | | | | | | | | | | | | | | | | | | | | | | | | | | | |
9/30/2015 | | $ | 30.27 | | | | 0.21 | | | | (3.00 | ) | | | (2.79 | ) | | | (0.29 | ) | | | — | | | | (0.29 | ) | | | — | | | $ | 27.19 | |
9/30/2014 | | $ | 28.86 | | | | 0.32 | | | | 1.43 | | | | 1.75 | | | | (0.34 | ) | | | — | | | | (0.34 | ) | | | — | | | $ | 30.27 | |
9/30/2013 | | $ | 23.70 | | | | 0.38 | | | | 5.10 | | | | 5.48 | | | | (0.32 | ) | | | — | | | | (0.32 | ) | | | — | | | $ | 28.86 | |
9/30/2012 | | $ | 18.50 | | | | 0.33 | | | | 5.21 | | | | 5.54 | | | | (0.34 | ) | | | — | | | | (0.34 | ) | | | — | | | $ | 23.70 | |
9/30/2011 | | $ | 20.72 | | | | 0.32 | | | | (2.31 | ) | | | (1.99 | ) | | | (0.23 | ) | | | — | | | | (0.23 | ) | | | — | | | $ | 18.50 | |
Advisor Shares | | | | | | | | | | | | | | | | | | | | | | | | | | | | | | | | | | | | |
9/30/2015(9) | | $ | 31.25 | | | | 0.07 | | | | (4.32 | ) | | | (4.25 | ) | | | — | | | | — | | | | — | | | | — | | | $ | 27.00 | |
| INTERNATIONAL SMALL CAP FUND | | | | | | | | | | | | | | | | | | | | | | | | | | | | | |
Investor Shares | | | | | | | | | | | | | | | | | | | | | | | | | | | | | | | | | | | | |
9/30/2015 | | $ | 24.30 | | | | 0.03 | | | | 0.42 | | | | 0.45 | | | | — | | | | (1.38 | ) | | | (1.38 | ) | | | — | | | $ | 23.37 | |
9/30/2014 | | $ | 26.39 | | | | (0.01 | ) | | | (0.35 | ) | | | (0.36 | ) | | | (0.12 | ) | | | (1.61 | ) | | | (1.73 | ) | | | — | | | $ | 24.30 | |
9/30/2013 | | $ | 20.75 | | | | 0.05 | | | | 5.82 | | | | 5.87 | | | | (0.23 | ) | | | — | | | | (0.23 | ) | | | — | | | $ | 26.39 | |
9/30/2012 | | $ | 16.44 | | | | 0.24 | | | | 4.14 | | | | 4.38 | | | | (0.07 | ) | | | — | | | | (0.07 | ) | | | — | | | $ | 20.75 | |
9/30/2011 | | $ | 18.63 | | | | 0.07 | | | | (2.25 | ) | | | (2.18 | ) | | | (0.01 | ) | | | — | | | | (0.01 | ) | | | — | | | $ | 16.44 | |
Footnotes are presented on Page 101.
The accompanying notes are an integral part of the financial statements.
| | |
| 94 | | Artisan Partners Funds |
ARTISAN PARTNERS FUNDS
Financial Highlights (Continued)
| | | | | | | | | | | | | | | | | | | | | | | | |
| | | Total
Return(2) | | | Net Assets,
End
of Period
(000) | | | Ratio of
Expenses
to Average
Net Assets(3) | | | Ratio of
Expenses
to Average
Net Assets
Excluding
Waivers(3)(4) | | | Ratio
of Net
Investment
Income
(Loss)
to Average
Net Assets(3)(4) | | | Portfolio
Turnover
Rate(2) | |
| HIGH INCOME FUND | | | | | | | | | | | | | | | | | | | | | |
Investor Shares | | | | | | | | | | | | | | | | | | | | | | | | |
9/30/2015 | | | 1.73 | % | | $ | 424,685 | | | | 1.09 | % | | | n/a | | | | 6.20 | % | | | 91.33 | % |
9/30/2014(12) | | | 2.08 | % | | $ | 278,360 | | | | 1.11 | % | | | n/a | | | | 5.01 | % | | | 56.46 | % |
Advisor Shares | | | | | | | | | | | | | | | | | | | | | | | | |
9/30/2015 | | | 1.88 | % | | $ | 489,374 | | | | 0.93 | % | | | n/a | | | | 6.38 | % | | | 91.33 | % |
9/30/2014(12) | | | 2.12 | % | | $ | 227,631 | | | | 0.99 | % | | | n/a | | | | 5.20 | % | | | 56.46 | % |
| INTERNATIONAL FUND | | | | | | | | | | | | | | | | | | | | | |
Investor Shares | | | | | | | | | | | | | | | | | | | | | | | | |
9/30/2015 | | | (9.55 | )% | | $ | 10,156,292 | | | | 1.17 | % | | | n/a | | | | 0.54 | % | | | 45.02 | % |
9/30/2014 | | | 5.85 | % | | $ | 13,607,488 | | | | 1.17 | % | | | n/a | | | | 0.85 | % | | | 46.49 | % |
9/30/2013 | | | 23.11 | % | | $ | 9,829,540 | | | | 1.20 | % | | | n/a | | | | 1.21 | % | | | 42.00 | % |
9/30/2012 | | | 30.05 | % | | $ | 6,877,615 | | | | 1.19 | % | | | n/a | | | | 1.32 | % | | | 55.39 | % |
9/30/2011 | | | (9.95 | )% | | $ | 5,837,067 | | | | 1.22 | % | | | n/a | | | | 1.18 | % | | | 70.36 | % |
Institutional Shares | | | | | | | | | | | | | | | | | | | | | | | | |
9/30/2015 | | | (9.34 | )% | | $ | 4,973,656 | | | | 0.95 | % | | | n/a | | | | 0.70 | % | | | 45.02 | % |
9/30/2014 | | | 6.10 | % | | $ | 3,926,338 | | | | 0.95 | % | | | n/a | | | | 1.05 | % | | | 46.49 | % |
9/30/2013 | | | 23.35 | % | | $ | 3,591,684 | | | | 0.97 | % | | | n/a | | | | 1.43 | % | | | 42.00 | % |
9/30/2012 | | | 30.37 | % | | $ | 2,772,675 | | | | 0.98 | % | | | n/a | | | | 1.52 | % | | | 55.39 | % |
9/30/2011 | | | (9.76 | )% | | $ | 1,989,341 | | | | 0.99 | % | | | n/a | | | | 1.42 | % | | | 70.36 | % |
Advisor Shares | | | | | | | | | | | | | | | | | | | | | | | | |
9/30/2015(9) | | | (13.60 | )% | | $ | 2,465,135 | | | | 1.07 | % | | | 1.07 | % | | | 0.47 | % | | | 45.02 | % |
| INTERNATIONAL SMALL CAP FUND | | | | | | | | | |
Investor Shares | | | | | | | | | | | | | | | | | | | | | | | | |
9/30/2015 | | | 2.02 | % | | $ | 961,035 | | | | 1.52 | % | | | n/a | | | | 0.13 | % | | | 43.84 | % |
9/30/2014 | | | (1.66 | )% | | $ | 1,090,091 | | | | 1.50 | % | | | n/a | | | | (0.05 | )% | | | 57.94 | % |
9/30/2013 | | | 28.50 | % | | $ | 996,150 | | | | 1.51 | % | | | n/a | | | | 0.19 | % | | | 59.47 | % |
9/30/2012 | | | 26.77 | % | | $ | 716,049 | | | | 1.50 | % | | | n/a | | | | 1.27 | % | | | 42.01 | % |
9/30/2011 | | | (11.70 | )% | | $ | 554,726 | | | | 1.50 | % | | | n/a | | | | 0.35 | % | | | 44.76 | % |
Footnotes are presented on Page 101.
The accompanying notes are an integral part of the financial statements.
| | |
| Artisan Partners Funds | | 95 |
ARTISAN PARTNERS FUNDS
Financial Highlights – For a share outstanding throughout each period
| | | | | | | | | | | | | | | | | | | | | | | | | | | | | | | | |
| | | | | | | | | | | | | | | Less Distributions From | | | | |
| | | Net
Asset
Value,
Beginning
of Period | | | Net
Investment
Income (Loss)(1) | | | Net Realized
and Unrealized
Gain (Loss) on
Investments | | | Total
from
Operations | | | Net
Investment
Income | | | Net
Realized
Gains | | | Total
Distributions | | | Net
Asset
Value,
End
of Period | |
| INTERNATIONAL VALUE FUND | | | | | | | | | | | | | | | | | | | | | | | | | |
Investor Shares | | | | | | | | | | | | | | | | | | | | | | | | | | | | | | | | |
9/30/2015 | | $ | 36.56 | | | | 0.21 | | | | (1.79 | ) | | | (1.58 | ) | | | (0.55 | ) | | | (1.81 | ) | | | (2.36 | ) | | $ | 32.62 | |
9/30/2014 | | $ | 37.01 | | | | 0.32 | | | | 2.01 | | | | 2.33 | | | | (0.63 | ) | | | (2.15 | ) | | | (2.78 | ) | | $ | 36.56 | |
9/30/2013 | | $ | 28.72 | | | | 0.28 | | | | 8.44 | | | | 8.72 | | | | (0.29 | ) | | | (0.14 | ) | | | (0.43 | ) | | $ | 37.01 | |
9/30/2012 | | $ | 23.44 | | | | 0.29 | | | | 5.07 | | | | 5.36 | | | | (0.01 | ) | | | (0.07 | ) | | | (0.08 | ) | | $ | 28.72 | |
9/30/2011 | | $ | 24.74 | | | | 0.30 | | | | (1.25 | ) | | | (0.95 | ) | | | (0.35 | ) | | | — | | | | (0.35 | ) | | $ | 23.44 | |
Institutional Shares | | | | | | | | | | | | | | | | | | | | | | | | | | | | | | | | |
9/30/2015 | | $ | 36.71 | | | | 0.30 | | | | (1.81 | ) | | | (1.51 | ) | | | (0.62 | ) | | | (1.81 | ) | | | (2.43 | ) | | $ | 32.77 | |
9/30/2014 | | $ | 37.12 | | | | 0.41 | | | | 2.00 | | | | 2.41 | | | | (0.67 | ) | | | (2.15 | ) | | | (2.82 | ) | | $ | 36.71 | |
9/30/2013 | | $ | 28.80 | | | | 0.34 | | | | 8.46 | | | | 8.80 | | | | (0.34 | ) | | | (0.14 | ) | | | (0.48 | ) | | $ | 37.12 | |
9/30/2012 | | $ | 23.47 | | | | 0.34 | | | | 5.09 | | | | 5.43 | | | | (0.03 | ) | | | (0.07 | ) | | | (0.10 | ) | | $ | 28.80 | |
9/30/2011 | | $ | 24.76 | | | | 0.35 | | | | (1.24 | ) | | | (0.89 | ) | | | (0.40 | ) | | | — | | | | (0.40 | ) | | $ | 23.47 | |
Advisor Shares | | | | | | | | | | | | | | | | | | | | | | | | | | | | | | | | |
9/30/2015(9) | | $ | 35.54 | | | | 0.15 | | | | (3.03 | ) | | | (2.88 | ) | | | — | | | | — | | | | — | | | $ | 32.66 | |
| MID CAP FUND | | | | | | | | | | | | | | | | | | | | | | | | | | | | | | | | |
Investor Shares | | | | | | | | | | | | | | | | | | | | | | | | | | | | | | | | |
9/30/2015 | | $ | 47.67 | | | | (0.36 | ) | | | 1.99 | | | | 1.63 | | | | — | | | | (4.88 | ) | | | (4.88 | ) | | $ | 44.42 | |
9/30/2014 | | $ | 48.69 | | | | (0.36 | ) | | | 3.14 | | | | 2.78 | | | | — | | | | (3.80 | ) | | | (3.80 | ) | | $ | 47.67 | |
9/30/2013 | | $ | 38.80 | | | | (0.26 | ) | | | 11.97 | | | | 11.71 | | | | — | | | | (1.82 | ) | | | (1.82 | ) | | $ | 48.69 | |
9/30/2012 | | $ | 31.14 | | | | (0.28 | ) | | | 7.94 | | | | 7.66 | | | | — | | | | — | | | | — | | | $ | 38.80 | |
9/30/2011 | | $ | 29.55 | | | | (0.26 | ) | | | 1.85 | | | | 1.59 | | | | — | | | | — | | | | — | | | $ | 31.14 | |
Institutional Shares | | | | | | | | | | | | | | | | | | | | | | | | | | | | | | | | |
9/30/2015 | | $ | 49.98 | | | | (0.26 | ) | | | 2.08 | | | | 1.82 | | | | — | | | | (4.88 | ) | | | (4.88 | ) | | $ | 46.92 | |
9/30/2014 | | $ | 50.75 | | | | (0.24 | ) | | | 3.27 | | | | 3.03 | | | | — | | | | (3.80 | ) | | | (3.80 | ) | | $ | 49.98 | |
9/30/2013 | | $ | 40.27 | | | | (0.17 | ) | | | 12.47 | | | | 12.30 | | | | — | | | | (1.82 | ) | | | (1.82 | ) | | $ | 50.75 | |
9/30/2012 | | $ | 32.23 | | | | (0.20 | ) | | | 8.24 | | | | 8.04 | | | | — | | | | — | | | | — | | | $ | 40.27 | |
9/30/2011 | | $ | 30.50 | | | | (0.16 | ) | | | 1.89 | | | | 1.73 | | | | — | | | | — | | | | — | | | $ | 32.23 | |
Advisor Shares | | | | | | | | | | | | | | | | | | | | | | | | | | | | | | | | |
9/30/2015(9) | | $ | 46.88 | | | | (0.17 | ) | | | (2.25 | ) | | | (2.42 | ) | | | — | | | | — | | | | — | | | $ | 44.46 | |
Footnotes are presented on Page 101.
The accompanying notes are an integral part of the financial statements.
| | |
| 96 | | Artisan Partners Funds |
ARTISAN PARTNERS FUNDS
Financial Highlights (Continued)
| | | | | | | | | | | | | | | | | | | | | | | | |
| | | Total
Return(2) | | | Net Assets,
End
of Period
(000) | | | Ratio of
Expenses
to Average
Net Assets(3) | | | Ratio of
Expenses
to Average
Net Assets
Excluding
Waivers(3)(4) | | | Ratio
of Net
Investment
Income
(Loss)
to Average
Net Assets(3)(4) | | | Portfolio
Turnover
Rate(2) | |
| INTERNATIONAL VALUE FUND | | | | | | | | | | | | | | | | | |
Investor Shares | | | | | | | | | | | | | | | | | | | | | | | | |
9/30/2015 | | | (4.67 | )% | | $ | 5,229,869 | | | | 1.17 | % | | | n/a | | | | 0.60 | % | | | 23.74 | % |
9/30/2014 | | | 6.50 | % | | $ | 8,953,691 | | | | 1.16 | % | | | n/a | | | | 0.86 | % | | | 20.45 | % |
9/30/2013 | | | 30.71 | % | | $ | 8,158,057 | | | | 1.16 | % | | | n/a | | | | 0.85 | % | | | 32.99 | % |
9/30/2012 | | | 22.94 | % | | $ | 5,081,735 | | | | 1.17 | % | | | n/a | | | | 1.08 | % | | | 20.42 | % |
9/30/2011 | | | (4.01 | )% | | $ | 3,232,649 | | | | 1.18 | % | | | n/a | | | | 1.10 | % | | | 30.90 | % |
Institutional Shares | | | | | | | | | | | | | | | | | | | | | | | | |
9/30/2015 | | | (4.44 | )% | | $ | 2,606,468 | | | | 0.96 | % | | | n/a | | | | 0.86 | % | | | 23.74 | % |
9/30/2014 | | | 6.73 | % | | $ | 2,456,145 | | | | 0.96 | % | | | n/a | | | | 1.09 | % | | | 20.45 | % |
9/30/2013 | | | 30.92 | % | | $ | 2,292,085 | | | | 0.97 | % | | | n/a | | | | 1.03 | % | | | 32.99 | % |
9/30/2012 | | | 23.19 | % | | $ | 1,557,500 | | | | 0.98 | % | | | n/a | | | | 1.29 | % | | | 20.42 | % |
9/30/2011 | | | (3.84 | )% | | $ | 1,042,833 | | | | 0.99 | % | | | n/a | | | | 1.30 | % | | | 30.90 | % |
Advisor Shares | | | | | | | | | | | | | | | | | | | | | | | | |
9/30/2015(9) | | | (8.10 | )% | | $ | 2,782,652 | | | | 1.06 | % | | | 1.07 | % | | | 0.87 | % | | | 23.74 | % |
| MID CAP FUND | | | | | | | | | | | | | | | | | | | | | | | | |
Investor Shares | | | | | | | | | | | | | | | | | | | | | | | | |
9/30/2015 | | | 3.20 | % | | $ | 3,909,986 | | | | 1.19 | % | | | n/a | | | | (0.76 | )% | | | 51.39 | % |
9/30/2014 | | | 6.04 | % | | $ | 5,220,973 | | | | 1.20 | % | | | n/a | | | | (0.74 | )% | | | 55.19 | % |
9/30/2013 | | | 31.53 | % | | $ | 5,525,387 | | | | 1.22 | % | | | n/a | | | | (0.64 | )% | | | 43.72 | % |
9/30/2012 | | | 24.63 | % | | $ | 5,115,836 | | | | 1.22 | % | | | n/a | | | | (0.78 | )% | | | 46.21 | % |
9/30/2011 | | | 5.38 | % | | $ | 4,500,786 | | | | 1.24 | % | | | n/a | | | | (0.75 | )% | | | 62.87 | % |
Institutional Shares | | | | | | | | | | | | | | | | | | | | | | | | |
9/30/2015 | | | 3.45 | % | | $ | 4,482,164 | | | | 0.95 | % | | | n/a | | | | (0.53 | )% | | | 51.39 | % |
9/30/2014 | | | 6.30 | % | | $ | 4,280,444 | | | | 0.95 | % | | | n/a | | | | (0.49 | )% | | | 55.19 | % |
9/30/2013 | | | 31.89 | % | | $ | 3,551,382 | | | | 0.96 | % | | | n/a | | | | (0.39 | )% | | | 43.72 | % |
9/30/2012 | | | 24.95 | % | | $ | 1,602,109 | | | | 0.97 | % | | | n/a | | | | (0.51 | )% | | | 46.21 | % |
9/30/2011 | | | 5.67 | % | | $ | 509,970 | | | | 0.96 | % | | | n/a | | | | (0.47 | )% | | | 62.87 | % |
Advisor Shares | | | | | | | | | | | | | | | | | | | | | | | | |
9/30/2015(9) | | | (5.16 | )% | | $ | 431,658 | | | | 1.10 | % | | | 1.12 | % | | | (0.73 | )% | | | 51.39 | % |
Footnotes are presented on Page 101.
The accompanying notes are an integral part of the financial statements.
| | |
| Artisan Partners Funds | | 97 |
ARTISAN PARTNERS FUNDS
Financial Highlights – For a share outstanding throughout each period
| | | | | | | | | | | | | | | | | | | | | | | | | | | | | | | | |
| | | | | | | | | | | | | | | Less Distributions From | | | | |
| | | Net
Asset
Value,
Beginning
of Period | | | Net
Investment
Income (Loss)(1) | | | Net Realized
and Unrealized
Gain (Loss) on
Investments | | | Total
from
Operations | | | Net
Investment
Income | | | Net
Realized
Gains | | | Total
Distributions | | | Net
Asset
Value,
End
of Period | |
| MID CAP VALUE FUND | | | | | | | | | | | | | | | | | | | | | | | | | |
Investor Shares | | | | | | | | | | | | | | | | | | | | | | | | | | | | | | | | |
9/30/2015 | | $ | 27.00 | | | | 0.20 | | | | (2.21 | ) | | | (2.01 | ) | | | (0.17 | ) | | | (2.60 | ) | | | (2.77 | ) | | $ | 22.22 | |
9/30/2014 | | $ | 26.34 | | | | 0.12 | | | | 1.74 | | | | 1.86 | | | | (0.11 | ) | | | (1.09 | ) | | | (1.20 | ) | | $ | 27.00 | |
9/30/2013 | | $ | 21.12 | | | | 0.15 | | | | 6.22 | | | | 6.37 | | | | (0.12 | ) | | | (1.03 | ) | | | (1.15 | ) | | $ | 26.34 | |
9/30/2012 | | $ | 18.88 | | | | 0.14 | | | | 3.72 | | | | 3.86 | | | | (0.13 | ) | | | (1.49 | ) | | | (1.62 | ) | | $ | 21.12 | |
9/30/2011 | | $ | 18.86 | | | | 0.14 | | | | 0.36 | | | | 0.50 | | | | (0.16 | ) | | | (0.32 | ) | | | (0.48 | ) | | $ | 18.88 | |
Institutional Shares | | | | | | | | | | | | | | | | | | | | | | | | | | | | | | | | |
9/30/2015 | | $ | 27.05 | | | | 0.26 | | | | (2.22 | ) | | | (1.96 | ) | | | (0.24 | ) | | | (2.60 | ) | | | (2.84 | ) | | $ | 22.25 | |
9/30/2014 | | $ | 26.38 | | | | 0.20 | | | | 1.73 | | | | 1.93 | | | | (0.17 | ) | | | (1.09 | ) | | | (1.26 | ) | | $ | 27.05 | |
9/30/2013 | | $ | 21.15 | | | | 0.21 | | | | 6.23 | | | | 6.44 | | | | (0.18 | ) | | | (1.03 | ) | | | (1.21 | ) | | $ | 26.38 | |
9/30/2012(13) | | $ | 20.93 | | | | 0.21 | | | | 0.01 | | | | 0.22 | | | | — | | | | — | | | | — | | | $ | 21.15 | |
Advisor Shares | | | | | | | | | | | | | | | | | | | | | | | | | | | | | | | | |
9/30/2015(9) | | $ | 25.12 | | | | 0.12 | | | | (3.01 | ) | | | (2.89 | ) | | | — | | | | — | | | | — | | | $ | 22.23 | |
| SMALL CAP FUND | | | | | | | | | | | | | | | | | | | | | | | | | |
Investor Shares | | | | | | | | | | | | | | | | | | | | | | | | | | | | | | | | |
9/30/2015 | | $ | 26.76 | | | | (0.30 | ) | | | 2.09 | | | | 1.79 | | | | — | | | | — | | | | — | | | $ | 28.55 | |
9/30/2014 | | $ | 27.65 | | | | (0.31 | ) | | | (0.58 | ) | | | (0.89 | ) | | | — | | | | — | | | | — | | | $ | 26.76 | |
9/30/2013 | | $ | 20.90 | | | | (0.20 | ) | | | 6.95 | | | | 6.75 | | | | — | | | | — | | | | — | | | $ | 27.65 | |
9/30/2012 | | $ | 16.01 | | | | (0.15 | ) | | | 5.04 | | | | 4.89 | | | | — | | | | — | | | | — | | | $ | 20.90 | |
9/30/2011 | | $ | 14.40 | | | | (0.13 | ) | | | 1.74 | | | | 1.61 | | | | — | | | | — | | | | — | | | $ | 16.01 | |
Institutional Shares | | | | | | | | | | | | | | | | | | | | | | | | | | | | | | | | |
9/30/2015 | | $ | 26.85 | | | | (0.24 | ) | | | 2.11 | | | | 1.87 | | | | — | | | | — | | | | — | | | $ | 28.72 | |
9/30/2014 | | $ | 27.70 | | | | (0.25 | ) | | | (0.60 | ) | | | (0.85 | ) | | | — | | | | — | | | | — | | | $ | 26.85 | |
9/30/2013 | | $ | 20.89 | | | | (0.17 | ) | | | 6.98 | | | | 6.81 | | | | — | | | | — | | | | — | | | $ | 27.70 | |
9/30/2012(14) | | $ | 19.62 | | | | (0.18 | ) | | | 1.45 | | | | 1.27 | | | | — | | | | — | | | | — | | | $ | 20.89 | |
| SMALL CAP VALUE FUND | | | | | | | | | | | | | | | | | | | | | | | | | |
Investor Shares | | | | | | | | | | | | | | | | | | | | | | | | | | | | | | | | |
9/30/2015 | | $ | 16.99 | | | | 0.07 | | | | (1.64 | ) | | | (1.57 | ) | | | — | | | | (3.23 | ) | | | (3.23 | ) | | $ | 12.19 | |
9/30/2014 | | $ | 18.06 | | | | — | (6) | | | (0.37 | ) | | | (0.37 | ) | | | (0.04 | ) | | | (0.66 | ) | | | (0.70 | ) | | $ | 16.99 | |
9/30/2013 | | $ | 15.24 | | | | 0.08 | | | | 3.23 | | | | 3.31 | | | | (0.13 | ) | | | (0.36 | ) | | | (0.49 | ) | | $ | 18.06 | |
9/30/2012 | | $ | 14.30 | | | | 0.05 | | | | 2.25 | | | | 2.30 | | | | (0.01 | ) | | | (1.35 | ) | | | (1.36 | ) | | $ | 15.24 | |
9/30/2011 | | $ | 14.85 | | | | 0.01 | | | | (0.54 | ) | | | (0.53 | ) | | | (0.02 | ) | | | — | | | | (0.02 | ) | | $ | 14.30 | |
Institutional Shares | | | | | | | | | | | | | | | | | | | | | | | | | | | | | | | | |
9/30/2015 | | $ | 17.04 | | | | 0.10 | | | | (1.65 | ) | | | (1.55 | ) | | | — | | | | (3.23 | ) | | | (3.23 | ) | | $ | 12.26 | |
9/30/2014 | | $ | 18.08 | | | | 0.05 | | | | (0.38 | ) | | | (0.33 | ) | | | (0.05 | ) | | | (0.66 | ) | | | (0.71 | ) | | $ | 17.04 | |
9/30/2013 | | $ | 15.26 | | | | 0.11 | | | | 3.24 | | | | 3.35 | | | | (0.17 | ) | | | (0.36 | ) | | | (0.53 | ) | | $ | 18.08 | |
9/30/2012(13) | | $ | 16.16 | | | | 0.06 | | | | (0.96 | ) | | | (0.90 | ) | | | — | | | | — | | | | — | | | $ | 15.26 | |
Footnotes are presented on Page 101.
The accompanying notes are an integral part of the financial statements.
| | |
| 98 | | Artisan Partners Funds |
ARTISAN PARTNERS FUNDS
Financial Highlights (Continued)
| | | | | | | | | | | | | | | | | | | | | | | | |
| | | Total
Return(2) | | | Net Assets,
End
of Period
(000) | | | Ratio of
Expenses
to Average
Net Assets(3) | | | Ratio of
Expenses
to Average
Net Assets
Excluding
Waivers(3)(4) | | | Ratio
of Net
Investment
Income
(Loss)
to Average
Net Assets(3)(4) | | | Portfolio
Turnover
Rate(2) | |
| MID CAP VALUE FUND | | | | | | | | | | | | | | | | | | | | | |
Investor Shares | | | | | | | | | | | | | | | | | | | | | | | | |
9/30/2015 | | | (8.45 | )% | | $ | 4,345,131 | | | | 1.19 | % | | | n/a | | | | 0.81 | % | | | 31.18 | % |
9/30/2014 | | | 7.18 | % | | $ | 9,305,582 | | | | 1.19 | % | | | n/a | | | | 0.46 | % | | | 25.67 | % |
9/30/2013 | | | 31.64 | % | | $ | 9,429,674 | | | | 1.20 | % | | | n/a | | | | 0.65 | % | | | 25.73 | % |
9/30/2012 | | | 21.35 | % | | $ | 7,753,814 | | | | 1.20 | % | | | n/a | | | | 0.67 | % | | | 27.86 | % |
9/30/2011 | | | 2.51 | % | | $ | 6,200,464 | | | | 1.20 | % | | | n/a | | | | 0.68 | % | | | 31.85 | % |
Institutional Shares | | | | | | | | | | | | | | | | | | | | | | | | |
9/30/2015 | | | (8.25 | )% | | $ | 1,236,240 | | | | 0.96 | % | | | n/a | | | | 1.03 | % | | | 31.18 | % |
9/30/2014 | | | 7.44 | % | | $ | 1,702,469 | | | | 0.95 | % | | | n/a | | | | 0.72 | % | | | 25.67 | % |
9/30/2013 | | | 31.97 | % | | $ | 1,366,366 | | | | 0.98 | % | | | n/a | | | | 0.86 | % | | | 25.73 | % |
9/30/2012(13) | | | 1.05 | % | | $ | 275,727 | | | | 1.01 | % | | | n/a | | | | 1.04 | % | | | 27.86 | % |
Advisor Shares | | | | | | | | | | | | | | | | | | | | | | | | |
9/30/2015(9) | | | (11.50 | )% | | $ | 938,389 | | | | 1.09 | % | | | 1.11 | % | | | 1.00 | % | | | 31.18 | % |
| SMALL CAP FUND | | | | | | | | | | | | | | | | | | | | | | | | |
Investor Shares | | | | | | | | | | | | | | | | | | | | | | | | |
9/30/2015 | | | 6.69 | % | | $ | 863,536 | | | | 1.23 | % | | | n/a | | | | (1.01 | )% | | | 45.31 | % |
9/30/2014 | | | (3.22 | )% | | $ | 1,231,921 | | | | 1.21 | % | | | n/a | | | | (1.09 | )% | | | 38.67 | % |
9/30/2013 | | | 32.30 | % | | $ | 1,330,188 | | | | 1.25 | % | | | n/a | | | | (0.88 | )% | | | 42.43 | % |
9/30/2012 | | | 30.54 | % | | $ | 676,139 | | | | 1.28 | % | | | n/a | | | | (0.77 | )% | | | 69.56 | % |
9/30/2011 | | | 11.18 | % | | $ | 326,700 | | | | 1.29 | % | | | n/a | | | | (0.73 | )% | | | 80.26 | % |
Institutional Shares | | | | | | | | | | | | | | | | | | | | | | | | |
9/30/2015 | | | 6.96 | % | | $ | 389,724 | | | | 1.02 | % | | | n/a | | | | (0.79 | )% | | | 45.31 | % |
9/30/2014 | | | (3.07 | )% | | $ | 227,772 | | | | 1.00 | % | | | n/a | | | | (0.88 | )% | | | 38.67 | % |
9/30/2013 | | | 32.60 | % | | $ | 224,770 | | | | 1.06 | % | | | n/a | | | | (0.74 | )% | | | 42.43 | % |
9/30/2012(14) | | | 6.47 | % | | $ | 50,754 | | | | 1.42 | % | | | n/a | | | | (0.93 | )% | | | 69.56 | % |
| SMALL CAP VALUE FUND | | | | | | | | | | | | | | | | | | | | | |
Investor Shares | | | | | | | | | | | | | | | | | | | | | | | | |
9/30/2015 | | | (11.76 | )% | | $ | 458,673 | | | | 1.26 | % | | | n/a | | | | 0.48 | % | | | 39.79 | % |
9/30/2014 | | | (2.33 | )% | | $ | 1,279,518 | | | | 1.23 | % | | | n/a | | | | 0.02 | % | | | 30.72 | % |
9/30/2013 | | | 22.24 | % | | $ | 2,421,658 | | | | 1.24 | % | | | n/a | | | | 0.46 | % | | | 26.66 | % |
9/30/2012 | | | 16.54 | % | | $ | 2,348,847 | | | | 1.22 | % | | | n/a | | | | 0.31 | % | | | 28.17 | % |
9/30/2011 | | | (3.61 | )% | | $ | 2,607,263 | | | | 1.20 | % | | | n/a | | | | 0.06 | % | | | 47.45 | % |
Institutional Shares | | | | | | | | | | | | | | | | | | | | | | | | |
9/30/2015 | | | (11.59 | )% | | $ | 34,513 | | | | 1.05 | % | | | n/a | | | | 0.70 | % | | | 39.79 | % |
9/30/2014 | | | (2.11 | )% | | $ | 306,638 | | | | 0.99 | % | | | n/a | | | | 0.30 | % | | | 30.72 | % |
9/30/2013 | | | 22.54 | % | | $ | 342,485 | | | | 1.00 | % | | | n/a | | | | 0.70 | % | | | 26.66 | % |
9/30/2012(13) | | | (5.57 | )% | | $ | 306,223 | | | | 1.00 | % | | | n/a | | | | 0.56 | % | | | 28.17 | % |
Footnotes are presented on Page 101.
The accompanying notes are an integral part of the financial statements.
| | |
| Artisan Partners Funds | | 99 |
ARTISAN PARTNERS FUNDS
Financial Highlights – For a share outstanding throughout each period
| | | | | | | | | | | | | | | | | | | | | | | | | | | | | | | | |
| | | | | | | | | | | | | | | Less Distributions From | | | | |
| | | Net
Asset
Value,
Beginning
of Period | | | Net
Investment
Income(1) | | | Net Realized
and Unrealized
Gain (Loss) on
Investments | | | Total
from
Operations | | | Net
Investment
Income | | | Net
Realized
Gains | | | Total
Distributions | | | Net
Asset
Value,
End
of Period | |
| VALUE FUND | | | | | | | | | | | | | | | | | | | | | | | | | | | | | | | | |
Investor Shares | | | | | | | | | | | | | | | | | | | | | | | | | | | | | | | | |
9/30/2015 | | $ | 14.14 | | | | 0.11 | | | | (1.66 | ) | | | (1.55 | ) | | | (0.11 | ) | | | (0.92 | ) | | | (1.03 | ) | | $ | 11.56 | |
9/30/2014 | | $ | 13.38 | | | | 0.15 | | | | 1.35 | | | | 1.50 | | | | (0.09 | ) | | | (0.65 | ) | | | (0.74 | ) | | $ | 14.14 | |
9/30/2013 | | $ | 11.32 | | | | 0.12 | | | | 2.02 | | | | 2.14 | | | | (0.08 | ) | | | — | | | | (0.08 | ) | | $ | 13.38 | |
9/30/2012 | | $ | 9.11 | | | | 0.08 | | | | 2.21 | | | | 2.29 | | | | (0.08 | ) | | | — | | | | (0.08 | ) | | $ | 11.32 | |
9/30/2011 | | $ | 8.91 | | | | 0.09 | | | | 0.19 | | | | 0.28 | | | | (0.08 | ) | | | — | | | | (0.08 | ) | | $ | 9.11 | |
Institutional Shares | | | | | | | | | | | | | | | | | | | | | | | | | | | | | | | | |
9/30/2015 | | $ | 14.19 | | | | 0.14 | | | | (1.66 | ) | | | (1.52 | ) | | | (0.15 | ) | | | (0.92 | ) | | | (1.07 | ) | | $ | 11.60 | |
9/30/2014 | | $ | 13.42 | | | | 0.18 | | | | 1.35 | | | | 1.53 | | | | (0.11 | ) | | | (0.65 | ) | | | (0.76 | ) | | $ | 14.19 | |
9/30/2013 | | $ | 11.35 | | | | 0.15 | | | | 2.03 | | | | 2.18 | | | | (0.11 | ) | | | — | | | | (0.11 | ) | | $ | 13.42 | |
9/30/2012 | | $ | 9.12 | | | | 0.11 | | | | 2.21 | | | | 2.32 | | | | (0.09 | ) | | | — | | | | (0.09 | ) | | $ | 11.35 | |
9/30/2011(8) | | $ | 10.60 | | | | 0.02 | | | | (1.50 | ) | | | (1.48 | ) | | | — | | | | — | | | | — | | | $ | 9.12 | |
Advisor Shares | | | | | | | | | | | | | | | | | | | | | | | | | | | | | | | | |
9/30/2015(9) | | $ | 13.41 | | | | 0.07 | | | | (1.91 | ) | | | (1.84 | ) | | | — | | | | — | | | | — | | | $ | 11.57 | |
Footnotes are presented on Page 101.
The accompanying notes are an integral part of the financial statements.
| | |
| 100 | | Artisan Partners Funds |
ARTISAN PARTNERS FUNDS
Financial Highlights (Continued)
| | | | | | | | | | | | | | | | | | | | | | | | |
| | | Total
Return(2) | | | Net Assets,
End
of Period
(000) | | | Ratio of
Expenses
to Average
Net Assets(3) | | | Ratio of
Expenses
to Average
Net Assets
Excluding
Waivers(3) | | | Ratio
of Net
Investment
Income
to Average
Net Assets(3)(4) | | | Portfolio
Turnover
Rate(2) | |
| VALUE FUND | | | | | | | | | | | | | | | | | | | | | | | | |
Investor Shares | | | | | | | | | | | | | | | | | | | | | | | | |
9/30/2015 | | | (11.90 | )% | | $ | 341,852 | | | | 1.00 | % | | | n/a | | | | 0.78 | % | | | 74.07 | % |
9/30/2014 | | | 11.52 | % | | $ | 1,172,529 | | | | 0.98 | % | | | n/a | | | | 1.06 | % | | | 53.36 | % |
9/30/2013 | | | 18.97 | % | | $ | 1,164,460 | | | | 1.04 | % | | | n/a | | | | 0.94 | % | | | 57.90 | % |
9/30/2012 | | | 25.42 | % | | $ | 677,753 | | | | 1.06 | % | | | n/a | | | | 0.74 | % | | | 66.13 | % |
9/30/2011 | | | 3.10 | % | | $ | 408,647 | | | | 1.10 | % | | | n/a | | | | 0.95 | % | | | 78.36 | % |
Institutional Shares | | | | | | | | | | | | | | | | | | | | | | | | |
9/30/2015 | | | (11.69 | )% | | $ | 180,143 | | | | 0.75 | % | | | n/a | | | | 1.07 | % | | | 74.07 | % |
9/30/2014 | | | 11.77 | % | | $ | 304,091 | | | | 0.74 | % | | | n/a | | | | 1.31 | % | | | 53.36 | % |
9/30/2013 | | | 19.43 | % | | $ | 249,170 | | | | 0.76 | % | | | n/a | | | | 1.21 | % | | | 57.90 | % |
9/30/2012 | | | 25.64 | % | | $ | 157,727 | | | | 0.79 | % | | | n/a | | | | 1.02 | % | | | 66.13 | % |
9/30/2011(8) | | | (13.96 | )% | | $ | 53,515 | | | | 1.09 | % | | | n/a | | | | 1.02 | % | | | 78.36 | % |
Advisor Shares | | | | | | | | | | | | | | | | | | | | | | | | |
9/30/2015(9) | | | (13.72 | )% | | $ | 466,702 | | | | 0.86 | % | | | n/a | | | | 1.12 | % | | | 74.07 | % |
| (1) | Computed based on average shares outstanding. |
| (2) | Periods less than twelve months (where applicable) are not annualized. |
| (3) | Periods less than twelve months (where applicable) are annualized. |
| (4) | The ratios exclude expenses waived or paid by Artisan Partners Limited Partnership, if applicable. |
| (5) | For the period from commencement of operations (June 29, 2015) through September 30, 2015. |
| (6) | Amount is between $0.005 and $(0.005) per share. |
| (7) | Effective February 14, 2014, the Emerging Markets Fund’s Advisor Shares were redesignated as Investor Shares. |
| (8) | For the period from commencement of operations (July 26, 2011) through September 30, 2011. |
| (9) | For the period from commencement of operations (April 1, 2015) through September 30, 2015. |
| (10) | For the period from commencement of operations (June 25, 2013) through September 30, 2013. |
| (11) | For the period from commencement of operations (July 17, 2012) through September 30, 2012. |
| (12) | For the period from commencement of operations (March 19, 2014) through September 30, 2014 |
| (13) | For the period from commencement of operations (February 1, 2012) through September 30, 2012. |
| (14) | For the period from commencement of operations (May 7, 2012) through September 30, 2012. |
The accompanying notes are an integral part of the financial statements.
| | |
| Artisan Partners Funds | | 101 |
ARTISAN PARTNERS FUNDS
Notes to Financial Statements – September 30, 2015
Artisan Partners Funds, Inc. (“Artisan Partners Funds”) was incorporated on January 5, 1995, as a Wisconsin corporation and is registered under the Investment Company Act of 1940, as amended (the “1940 Act”). Artisan Partners Funds is a series company comprised of fifteen open-end, diversified mutual funds which follows specialized accounting and reporting under Accounting Standards Codification Topic 946, Financial Services – Investment Companies. The following funds (each a “Fund” and collectively the “Funds”) are included in this report:
| | | | | | | | | | | | |
| Fund Name | | Investor Shares Inception Date | | | Institutional Shares Inception Date | | | Advisor Shares Inception Date | |
Artisan Developing World Fund (“Developing World Fund” or “Developing World”) | | | June 29, 2015 | | | | June 29, 2015 | | | | June 29, 2015 | |
Artisan Emerging Markets Fund (“Emerging Markets Fund” or “Emerging Markets”) | | | June 2, 2008 | | | | June 26, 2006 | | | | N/A | |
Artisan Global Equity Fund (“Global Equity Fund” or “Global Equity”) | | | March 29, 2010 | | | | N/A | | | | N/A | |
Artisan Global Opportunities Fund (“Global Opportunities Fund” or “Global Opportunities”) | | | September 22, 2008 | | | | July 26, 2011 | | | | April 1, 2015 | |
Artisan Global Small Cap Fund (“Global Small Cap Fund” or “Global Small Cap”) | | | June 25, 2013 | | | | N/A | | | | N/A | |
Artisan Global Value Fund (“Global Value Fund” or “Global Value”) | | | December 10, 2007 | | | | July 17, 2012 | | | | April 1, 2015 | |
Artisan High Income Fund (“High Income Fund” or “High Income”) | | | March 19, 2014 | | | | N/A | | | | March 19, 2014 | |
Artisan International Fund (“International Fund” or “International”) | | | December 28, 1995 | | | | July 1, 1997 | | | | April 1, 2015 | |
Artisan International Small Cap Fund (“International Small Cap Fund” or “International Small Cap”) | | | December 21, 2001 | | | | N/A | | | | N/A | |
Artisan International Value Fund (“International Value Fund” or “International Value”) | | | September 23, 2002 | | | | October 1, 2006 | | | | April 1, 2015 | |
Artisan Mid Cap Fund (“Mid Cap Fund” or “Mid Cap”) | | | June 27, 1997 | | | | July 1, 2000 | | | | April 1, 2015 | |
Artisan Mid Cap Value Fund (“Mid Cap Value Fund” or “Mid Cap Value”) | | | March 28, 2001 | | | | February 1, 2012 | | | | April 1, 2015 | |
Artisan Small Cap Fund (“Small Cap Fund” or “Small Cap”) | | | March 28, 1995 | | | | May 7, 2012 | | | | N/A | |
Artisan Small Cap Value Fund (“Small Cap Value Fund” or “Small Cap Value”) | | | September 29, 1997 | | | | February 1, 2012 | | | | N/A | |
Artisan Value Fund (“Value Fund” or “Value”) | | | March 27, 2006 | | | | July 26, 2011 | | | | April 1, 2015 | |
The investment objective of each Fund (except Developing World Fund, High Income Fund and Small Cap Value Fund) is to seek maximum long-term capital growth. Developing World Fund’s investment objective is to seek long-term capital appreciation. High Income Fund’s investment objective is to seek to provide total return through a combination of current income and capital appreciation. Small Cap Value Fund’s investment objective is to seek long-term capital growth. Each Fund has offered shares of capital stock of the classes designated Investor Shares, Institutional Shares and Advisor Shares, as applicable, since the inception dates listed above. Institutional Shares are sold to investors meeting certain minimum investment requirements. Advisor Shares are sold to employee benefit plans, clients of financial advisors, clients of sponsored fee-based programs and other investors that meet the minimum investment requirements.
| | |
| 102 | | Artisan Partners Funds |
NOTES TO FINANCIAL STATEMENTS
Each class of shares has equal rights with respect to portfolio assets and voting privileges with respect to the Fund in general. Each class of shares has exclusive voting rights with respect to any matters involving only that class.
Income, expenses not specific to a particular class and realized and unrealized gains and losses were allocated daily to each class of shares based upon the relative net asset value of outstanding shares. Expenses attributable to a particular class of shares, such as transfer agency fees, shareholder communication expenses and registration fees, were allocated directly to that class.
The investment adviser for each Fund is Artisan Partners Limited Partnership (the “Adviser” or “Artisan Partners”). The Adviser is wholly owned by Artisan Partners Holdings LP (“Artisan Holdings”).
| (2) | Summary of significant accounting policies: |
The following is a summary of significant accounting policies of Artisan Partners Funds in effect during the period covered by the financial statements, which were in accordance with United States generally accepted accounting principles (“US GAAP”).
| (a) | Valuation – The net asset value (“NAV”) of the shares of each class of each Fund was determined as of the close of regular session trading on the New York Stock Exchange (“NYSE”) (usually 4:00 p.m., Eastern Time) each day the NYSE was open for regular session trading. For financial reporting purposes, information available subsequent to the close of NYSE trading and up to the date of the financial statements was considered in determining a fair value for investments held in each Fund and the resulting NAV presented. The NAV of each class of shares was determined by dividing the value of each Fund’s securities and other assets attributed to that class, less its liabilities attributed to that class, by the number of outstanding shares of that class of that Fund. |
| | In determining NAV, each equity security traded on a securities exchange, including the Nasdaq Stock Market, or over-the-counter was valued at the closing price as of the time of valuation on the exchange or market designated by the Funds’ accounting agent or pricing vendor as the principal exchange (each, a “principal exchange”). The closing price provided by the pricing vendor for an exchange may differ from the price quoted elsewhere and may represent information such as last sales price, an official closing price, a closing auction price or other information, depending on exchange or market convention. Absent closing price information for a security from the principal exchange as of the time of valuation, the security was valued using (i) the closing price on another exchange on which the security traded (if such price was made available by a pricing vendor) or (ii) the most recent bid quotation on the principal exchange or, if such bid was not available, from a secondary exchange or in the over-the-counter market. Fixed income securities were valued at market value. Market values were generally evaluations based on the judgment of the Funds’ pricing services, which may consider the prices at which securities actually trade, broker-dealer quotations, pricing formulas, estimates of market values obtained from yield data relating to securities with similar characteristics and/or discounted cash flow models that might be applicable. Securities that cannot be priced by the Funds’ pricing vendors may be valued using quotes from dealers that make markets in the securities or |
| | |
| Artisan Partners Funds | | 103 |
NOTES TO FINANCIAL STATEMENTS
| | pricing models as approved by Artisan Partners Funds’ valuation committee (the “valuation committee”) under procedures established by and under general supervision of Artisan Partners Funds’ board of directors (the “board of directors”). |
| | Securities for which market quotations were not readily available were valued by the valuation committee at a fair value determined in good faith under procedures established by and under the general supervision of the board of directors. A market quotation was considered to be not available, and a Fund may therefore have used fair value pricing, if, among other things, there are no quotations, pricing data is not provided by an approved pricing vendor, the valuation committee believed that the quotation, price or market value resulting from the Funds’ valuation procedures did not reflect a fair value of the security, or the value of the security might have been materially affected by events occurring after the close of the market in which the security was principally traded but before the time for determination of NAV (a “subsequent event”). A subsequent event might include a company-specific development, a development that might affect an entire market or region, a potentially global development or a significant change in values of market indices, exchange traded funds or other financial instruments in the U.S. or other markets. Artisan Partners Funds monitored for subsequent events using several tools, including for equity securities, the use of a third party research service to assist in determining estimates of fair values for foreign securities. That service utilized statistical data based on historical performance of securities, markets and other data in developing factors used to estimate a fair value. An indication by any of those tools of a potential material change in the value of securities resulted in either a meeting of the valuation committee, which considered whether a subsequent event had occurred and whether local market closing prices continued to represent fair values for potentially affected non-U.S. securities, and/or a valuation based on information provided by the third party research service. |
| | When fair value pricing is employed, the value of a security used by a Fund to calculate its NAV may differ from quoted or published prices for the same security. Estimates of fair values utilized by the Funds as described above may differ from the value realized on the sale of those securities and the differences may have been material to the NAV of the applicable Fund. |
| (b) | Risks – Markets may perform poorly and the returns from the securities in which a Fund invests may underperform returns from the general securities markets. Securities markets may experience periods of high volatility and reduced liquidity in response to governmental actions or intervention, economic or market developments, or other external factors. The value of a company’s securities may rise or fall in response to company, market, economic or other news. |
| | Foreign securities may underperform U.S. securities and may be more volatile than U.S. securities. Risks relating to investments in foreign securities (including, but not limited to, depository receipts and participation certificates) and to securities of issuers with significant exposure to foreign markets include: currency exchange rate fluctuation; less available public information about the issuers of securities; less stringent regulatory standards; lack of uniform accounting, auditing and financial reporting standards; and country risks including less liquidity, high inflation rates, unfavorable economic practices, political instability and expropriation and nationalization risks. |
| | |
| 104 | | Artisan Partners Funds |
NOTES TO FINANCIAL STATEMENTS
| | The risks of foreign securities typically are greater in emerging and less developed markets. For example, in addition to the risks associated with investments in any foreign country, political, legal and economic structures in these less developed countries may be new and changing rapidly, which may cause instability and greater risk of loss. These securities markets may be less developed, and securities in those markets are generally more volatile and less liquid than those in developed markets. Investing in emerging market countries may involve substantial risk due to, among other reasons, limited information; higher brokerage costs; different accounting, auditing and financial reporting standards; less developed legal systems and thinner trading markets as compared to those in developed countries; different clearing and settlement procedures and custodial services; and currency blockages or transfer restrictions. Emerging market countries also are more likely to experience high levels of inflation, deflation or currency devaluations, which could hurt their economies and securities markets. Certain emerging markets also may face other significant internal or external risks, including a heightened risk of war and ethnic, religious and racial conflicts. In addition, governments in many emerging market countries participate to a significant degree in their economies and securities markets, which may impair investment and economic growth of companies in those markets. Such markets may also be heavily reliant on foreign capital and, therefore, vulnerable to capital flight. |
| | The values of debt securities held by a Fund may fall in response to increases in interest rates. The value of a security with a longer duration will be more sensitive to changes in interest rates than a similar security with a shorter duration. Given the current historically low interest rate environment, risks associated with rising rates are heightened. If interest rates rise, repayments of principal on certain debt securities, including loans, may occur at a slower rate than expected and the expected length of repayment of those securities could increase as a result. |
| | An issuer or counterparty may fail to pay its obligations to a Fund when they are due. Financial strength and solvency (or the perceived financial strength or solvency) of an issuer are the primary factors influencing credit risk. Changes in the financial condition of an issuer or counterparty, changes in specific economic, social or political conditions that affect a particular type of security or an issuer, and changes in economic, social or political conditions generally can increase the risk of default by an issuer or counterparty, which can affect a security’s credit quality or value and an issuer’s or counterparty’s ability to pay interest and principal when due. The values of lower quality debt, including loans, tend to be particularly sensitive to these changes. |
| | Debt securities rated below investment grade, or unrated securities that are determined by the Adviser to be of comparable quality, are high yield, high risk bonds, commonly known as “junk bonds.” These bonds are predominantly speculative. They are usually issued by companies without long track records of sales and earnings, or by companies with questionable credit strength. These bonds have a higher degree of default risk and may be less liquid than higher-rated bonds. These securities may be subject to greater price volatility due to such factors as specific corporate developments, interest rate sensitivity, negative perceptions of junk bonds generally, and less secondary market liquidity. This potential lack of liquidity may make it more difficult for the Fund to accurately value these securities. |
| | |
| Artisan Partners Funds | | 105 |
NOTES TO FINANCIAL STATEMENTS
| | Investments in loans are generally subject to the same risks as investments in other types of debt obligations, including, among others, the credit risk of nonpayment of principal and interest. In addition, in many cases loans are subject to the risks associated with below investment grade securities. Because there is typically limited public information available regarding loan investments, High Income Fund is particularly dependent on the analytical abilities of the Adviser. High Income Fund may invest in loans made in connection with highly leveraged transactions, which are subject to greater credit and liquidity risks than other types of loans. Although the senior loans in which High Income Fund invests may be secured by specific collateral, there can be no assurance that liquidation of such collateral would satisfy the borrower’s obligation in the event of nonpayment of scheduled interest or principal, or that such collateral could be readily liquidated. In the event of the bankruptcy of a borrower, High Income Fund could experience delays or limitations with respect to its ability to realize the benefits of the collateral securing a loan or could recover nothing of what it is owed on the loan. Uncollateralized (i.e., non-secured) loans are subject to greater risk of loss (i.e., nonpayment) in the event of default than secured loans since they do not afford the Fund recourse to collateral. Investments in loans may be difficult to value and may be illiquid, including due to legal or contractual restrictions on resale. Transactions in many loans settle on a delayed basis, and High Income Fund may not receive the proceeds from the sale of a loan for a substantial period after the sale. As a result, sale proceeds related to the sale of loans may not be available to make additional investments until a substantial period after the sale of the loans. It is unclear whether the protections of the securities laws against fraud and misrepresentation extend to loans and other forms of direct indebtedness. |
| | See the Funds’ Prospectus and Statement of Additional Information regarding the risks of investing in shares of the Funds. |
| (c) | Taxes – No provision was made for federal income taxes or excise taxes since each Fund intends to (i) comply with the provisions of Subchapter M of the Internal Revenue Code applicable to regulated investment companies and (ii) distribute to its shareholders substantially all of its taxable income as well as net realized gains from the sale of investment securities. The Funds may utilize earnings and profits distributed to shareholders on redemptions of Fund shares as part of the dividends paid deduction. |
| | The Funds have analyzed the tax positions taken on federal income tax returns for all remaining open tax years (fiscal years 2009 through 2015) and have concluded that, as of September 30, 2015, no provision for income tax would be required in the Funds’ financial statements. The Funds’ federal and state income and federal excise tax returns for tax years for which the applicable statutes of limitations have not expired are subject to examination by the Internal Revenue Service and each state’s department of revenue. |
| | As of and during the year ended September 30, 2015, the Funds did not have any liabilities for any unrecognized tax benefits. The Funds recognize interest and penalties, if any, related to unrecognized tax benefits as income tax expense in the Statements of Operations. During the year ended September 30, 2015, the Funds did not incur any interest or penalties. |
| | |
| 106 | | Artisan Partners Funds |
NOTES TO FINANCIAL STATEMENTS
| | The Funds may be subject to taxes imposed on realized and unrealized gains on securities of certain foreign countries in which the Funds invest. The foreign tax expense, if any, was recorded on an accrual basis and is included in “Net realized gain (loss) on investments” and “Net increase (decrease) in unrealized appreciation or depreciation on investments” on the accompanying Statements of Operations. The amount of foreign tax owed, if any, is included in “Payable for foreign taxes” on the accompanying Statements of Assets and Liabilities and is comprised of withholding taxes on foreign dividends and taxes on unrealized gains. |
| (d) | Portfolio transactions – For financial reporting purposes, security transactions and shareholder transactions were recorded on trade date in accordance with US GAAP. Net realized gains and losses on securities were computed on specific security lot identification. |
| (e) | Foreign currency translation – Values of foreign investments, open foreign currency forward contracts, payables for capital gains taxes, payables and receivables for securities transactions, dividend and reclaim receivables, other receivables and payables, and cash denominated in a foreign currency were translated into U.S. dollars using a spot market rate of exchange as of the time of determination of each Fund’s NAV on the day of valuation. Purchases and sales of investments and dividend and interest income were translated into U.S. dollars using the current spot market rate of exchange on the date of such transactions. The portion of security gains or losses resulting from changes in foreign exchange rates was included with net realized and unrealized gain or loss from investments, as appropriate, for both financial reporting and tax purposes. |
| | The Funds may enter into foreign currency spot contracts and foreign currency forward contracts. Foreign currency spot contracts are typically used to facilitate the purchase and sale of non-U.S. securities and generally settle within three business days. Foreign currency forward contracts are typically used to hedge against foreign currency exchange rate risks. The Funds could be exposed to loss if the counterparties fail to perform under these contracts. Open foreign currency spot contracts and foreign currency forward contracts, if any, were recorded at market value and recorded in the Statements of Assets and Liabilities. Realized and unrealized gains and losses were reported as foreign currency related transactions and are recorded in the Statements of Operations. For tax purposes, these foreign exchange gains and losses were treated as ordinary income or loss. |
| | As of September 30, 2015, Global Opportunities and International Value had outstanding foreign currency forward contracts, as shown on the Schedules of Investments. Foreign currency spot contracts are not separately disclosed in the Schedules of Investments. |
| | Other foreign currency related transaction gains and losses may result from currency gains and losses realized on the difference between the amounts of dividends and foreign withholding taxes recorded on the Funds’ books and the U.S. dollar equivalent of the amounts actually received or paid. The net increase (decrease) in unrealized appreciation or depreciation on foreign currency related transactions arose from changes in the values of assets and liabilities, other than investments in securities, resulting from changes in foreign exchange rates. |
| | |
| Artisan Partners Funds | | 107 |
NOTES TO FINANCIAL STATEMENTS
| (f) | Repurchase agreements – Each Fund may enter into repurchase agreements with institutions that the Adviser determines are creditworthy pursuant to criteria adopted by the board of directors. Repurchase agreements were recorded at repurchase price plus accrued interest and were collateralized in an amount greater than or equal to the repurchase price plus accrued interest. Collateral (in the form of U.S. government securities) was held by the Funds’ custodian and, in the event of default on the obligation of the counterparty to repurchase, the Funds had the right to liquidate the collateral and apply the proceeds in satisfaction of the obligation. |
| | Repurchase agreements shown on the Schedules of Investments are presented at gross value. At September 30, 2015, the value of the related collateral exceeded the value of the repurchase agreements, reducing the net settlement amount to zero. Details of the collateral are included within the Schedules of Investments. |
| (g) | Depositary receipts – Each Fund may invest in depositary receipts. Depositary receipts are typically issued by a financial institution (a “depositary”), evidencing ownership interests in a security issued by an issuer and deposited with the depositary. |
| (h) | Equity-linked participation certificates – Developing World Fund, Emerging Markets Fund, Global Equity Fund, Global Opportunities Fund, Global Small Cap Fund, Global Value Fund, International Fund, International Small Cap Fund, International Value Fund and Value Fund may invest in equity-linked participation certificates. Equity-linked participation certificates are designed to provide synthetic exposure to one or more underlying securities. An investment in an equity-linked participation certificate typically entitles the holder to a return equal to the market return of the underlying security or securities. There is no off-balance sheet risk associated with equity-linked participation certificates and the Funds’ potential loss is limited to the purchase price of the securities. The Funds are exposed to credit risk associated with the counterparty to the transaction. |
| (i) | Use of estimates – The preparation of financial statements in conformity with US GAAP requires management to make estimates and assumptions that affect the reported amounts and disclosures in the financial statements. Actual results could differ from those estimates. |
| (j) | Indemnifications – In the normal course of business, the Funds may enter into contracts in which the Funds agree to indemnify the other party or parties against various potential costs or liabilities. A Fund’s maximum exposure under such arrangements is unknown. As of the date of this Report, no claim has been made for indemnification pursuant to any such agreement of the Funds. |
| (k) | When-Issued/Delayed Delivery Securities – Each Fund may purchase or sell when-issued and delayed delivery securities. Securities purchased on a when-issued or delayed delivery basis are purchased for delivery beyond the normal settlement date at a stated price, and no income accrues to the Fund on such securities prior to delivery date. Payment and delivery for when-issued and delayed delivery securities can take place a month or more after the date of the transaction. When a Fund enters into a purchase transaction on a when-issued or delayed delivery basis, the Fund will hold liquid investments in an amount at least equal in value to the Fund’s commitments to |
| | |
| 108 | | Artisan Partners Funds |
NOTES TO FINANCIAL STATEMENTS
| | purchase such securities. Purchasing securities on a when issued or delayed delivery basis may involve a risk that the market price at the time of delivery may be lower than the agreed upon purchase price. |
| (l) | Other – Dividend income less foreign taxes withheld, if any, was generally recorded on the ex-dividend date. In some cases, the information was not available to the Fund on the ex-dividend date. In such cases, which may have included private placements and foreign securities, dividends were recorded as soon after the ex-dividend date as reliable information became available to the Funds. Non-cash dividends included in dividend income, if any, were generally recorded at the fair market value of securities received. Interest income was recorded on the accrual basis and includes accretion of discounts and amortization of premiums. Distributions to shareholders were recorded on the ex-dividend date. Expenses attributable to Artisan Partners Funds were generally allocated to each Fund based on net assets. However, other expense allocation methodologies were also used, depending on the nature of the expense item. Expenses attributable to a particular Fund or class were allocated directly to that Fund or class, respectively. |
| | The character of income and net realized gains and losses may differ in some instances for financial statement and tax purposes and may result in reclassification of permanent differences among certain capital accounts to more appropriately conform financial accounting to tax characterizations of dividend and capital gain distributions. |
| | Developing World Fund, Emerging Markets Fund, Global Equity Fund, Global Opportunities Fund, Global Small Cap Fund, Global Value Fund, High Income Fund, International Fund, International Small Cap Fund and International Value Fund generally imposed a 2% redemption fee on shares held 90 days or less. Those redemption fees were recorded as a reduction in the cost of shares redeemed and had the primary effect of increasing paid-in capital. Each Fund reserved the right to waive or reduce the 2% redemption fee on shares held 90 days or less at its discretion when the Fund believed such waiver was in the best interests of the Fund, including, but not limited to, when it determined that imposition of the redemption fee was not necessary to protect the Fund from the effects of short-term trading. The Funds waived the fee on redemption of shares held by certain authorized agents or other Fund intermediaries and otherwise in accordance with the Funds’ prospectus. |
| (m) | Unfunded Commitments – Pursuant to the terms of certain Term Loan agreements, High Income Fund held unfunded loan commitments as of September 30, 2015. High Income Fund is obligated to fund these loan commitments at the borrower’s discretion. High Income Fund reserves against such contingent obligations by segregating cash and/or other liquid assets. As of September 30, 2015 the total amount segregated in connection with unfunded commitments was $85,000,000. |
| (3) | Fair value measurements: |
Under US GAAP for fair value measurement, accounting standards clarify the definition of fair value for financial reporting, establish a framework for measuring fair value and require additional disclosures about the use of fair value measurements. In accordance with this standard, fair value is defined as the price that each Fund would receive upon selling an investment in an orderly transaction to an independent buyer in the principal or most
| | |
| Artisan Partners Funds | | 109 |
NOTES TO FINANCIAL STATEMENTS
advantageous market of the investment. The standard establishes a three-tier hierarchy to distinguish between (1) inputs that reflect the assumptions market participants would use in pricing an asset or liability developed based on the market data obtained from sources independent of the reporting entity (observable inputs) and (2) inputs that reflect the reporting entity’s own assumptions about the assumptions market participants would use in pricing an asset or liability developed based on the best information available in the circumstances (unobservable inputs) and to establish classification of fair value measurements for disclosure purposes. Various inputs are used in determining the value of the Funds’ investments. The three-tier hierarchy of inputs is summarized in three broad levels:
| | • | | Level 1 – quoted prices in active markets for identical investments |
| | • | | Level 2 – other significant observable inputs (including but not limited to quoted prices for similar securities, interest rates, credit risks and securities trading primarily outside the U.S. whose value the Fund adjusted as a result of significant market movements following the close of local trading) |
| | • | | Level 3 – significant unobservable inputs (including the Funds’ own assumptions in determining a fair value of investments) |
The inputs or methodology used for valuing securities are not necessarily an indication of the risk or liquidity associated with investing in those securities. A description of the valuation techniques and fair value leveling applied to the Funds’ major classes of assets are as follows:
Bank Loans & Corporate Bonds – Prices obtained from pricing vendors may use various observable and unobservable inputs, including, but not limited to, recent trading activity, broker-dealers quotations, pricing formulas, estimates of market values obtained from yield data relating to investments with similar characteristics and/or discounted cash flow models that might be applicable. When the approved pricing vendors do not provide an evaluated price, or the provided price is determined by the valuation committee to not represent a fair value, securities may be valued using quotes from dealers that make markets in the securities or pricing models as approved by the valuation committee, or the valuation committee will determine a fair value in accordance with the Funds’ fair value procedures. Bank loans and corporate bonds are generally categorized as Level 2 of the fair value hierarchy unless key inputs are unobservable, in which case they would be categorized as Level 3.
Equity Securities – Exchange-traded equity securities are valued using the last reported trade on the primary exchange in which the security trades. Absent a current trade price, the securities are valued using the closing price from another exchange on which the security is traded or the most recent bid quotation on the principal exchange. If the valuation committee determines the resulting price does not represent a fair value, the valuation committee will determine a fair value based on the information available.
Foreign equity securities prices may be adjusted for significant events such as company-specific news, regional events or significant market movement subsequent to the close of the local exchange on which the security is traded. The Funds utilize a third party research service to assist in determining fair values of foreign equity securities. Equity securities
| | |
| 110 | | Artisan Partners Funds |
NOTES TO FINANCIAL STATEMENTS
valued at a current day reported last trade or bid quotation are generally categorized as Level 1 of the fair value hierarchy. Foreign equity securities in which the last trade or bid quotation are adjusted for significant events, or local market holidays, are generally categorized as Level 2. Equity securities fair valued in good faith by the valuation committee are generally categorized as Level 2 or 3, depending on the observability of the inputs utilized.
Other Instruments – Foreign currency forward contracts are valued based upon forward currency exchange rates as of the close of regular session trading on the NYSE. Repurchase agreements are valued at cost plus accrued interest. Foreign currency forward contracts and repurchase agreements are generally categorized as Level 2.
The following table summarizes each Fund’s investments by major security type, based on the inputs used to determine their fair values as of September 30, 2015 (in thousands):
| | | | | | | | | | | | | | | | | | | | |
| Fund | | Level 1 - Quoted
Prices | | Level 2 - Other Significant
Observable Inputs | | Level 3 - Significant
Unobservable Inputs | | Total |
Developing World | | | | | | | | | | | | | | | | | | | | |
Common Stocks(1) | | | | | | | | | | | | | | | | | | | | |
Developed Markets | | | $ | 12,522 | | | | $ | 16,344 | | | | $ | - | | | | $ | 28,866 | |
Emerging Asia | | | | 12,628 | | | | | 34,266 | | | | | - | | | | | 46,894 | |
Europe, Middle East & Africa | | | | 1,804 | | | | | 12,738 | | | | | - | | | | | 14,542 | |
Latin America | | | | 13,365 | | | | | - | | | | | - | | | | | 13,365 | |
Equity-Linked Securities(1) | | | | | | | | | | | | | | | | | | | | |
Europe, Middle East & Africa | | | | - | | | | | 2,025 | | | | | - | | | | | 2,025 | |
Repurchase Agreement | | | | - | | | | | 13,083 | | | | | - | | | | | 13,083 | |
Total Investments | | | $ | 40,319 | | | | $ | 78,456 | | | | $ | - | | | | $ | 118,775 | |
Emerging Markets | | | | | | | | | | | | | | | | | | | | |
Common Stocks(1) | | | | | | | | | | | | | | | | | | | | |
Developed Markets | | | $ | - | | | | $ | 2,362 | | | | $ | - | | | | $ | 2,362 | |
Emerging Asia | | | | 2,394 | | | | | 24,520 | | | | | 73 | | | | | 26,987 | |
Europe, Middle East & Africa | | | | 201 | | | | | 8,437 | | | | | - | | | | | 8,638 | |
Latin America | | | | 6,995 | | | | | - | | | | | - | | | | | 6,995 | |
Equity-Linked Securities(1) | | | | | | | | | | | | | | | | | | | | |
Emerging Asia | | | | - | | | | | 400 | | | | | - | | | | | 400 | |
Preferred Stocks(1) | | | | | | | | | | | | | | | | | | | | |
Emerging Asia | | | | - | | | | | 3,098 | | | | | - | | | | | 3,098 | |
Latin America | | | | 563 | | | | | - | | | | | - | | | | | 563 | |
Convertible Debentures(1) | | | | | | | | | | | | | | | | | | | | |
Latin America | | | | - | | | | | - | | | | | 1 | | | | | 1 | |
Repurchase Agreement | | | | - | | | | | 1,392 | | | | | - | | | | | 1,392 | |
Total Investments | | | $ | 10,153 | | | | $ | 40,209 | | | | $ | 74 | | | | $ | 50,436 | |
| | |
| Artisan Partners Funds | | 111 |
NOTES TO FINANCIAL STATEMENTS
| | | | | | | | | | | | | | | | | | | | |
| Fund | | Level 1 - Quoted
Prices | | Level 2 - Other Significant
Observable Inputs | | Level 3 - Significant
Unobservable Inputs | | Total |
Global Equity | | | | | | | | | | | | | | | | | | | | |
Common Stocks(1) | | | | | | | | | | | | | | | | | | | | |
Americas | | | $ | 171,569 | | | | $ | - | | | | $ | - | | | | $ | 171,569 | |
Emerging Markets | | | | 11,334 | | | | | 25,078 | | | | | - | | | | | 36,412 | |
Europe | | | | - | | | | | 70,717 | | | | | - | | | | | 70,717 | |
Pacific Basin | | | | - | | | | | 7,664 | | | | | - | | | | | 7,664 | |
Preferred Stocks(1) | | | | | | | | | | | | | | | | | | | | |
Europe | | | | - | | | | | 1,297 | | | | | - | | | | | 1,297 | |
Repurchase Agreement | | | | - | | | | | 9,555 | | | | | - | | | | | 9,555 | |
Total Investments | | | $ | 182,903 | | | | $ | 114,311 | | | | $ | - | | | | $ | 297,214 | |
Global Opportunities | | | | | | | | | | | | | | | | | | | | |
Common Stocks(1) | | | | | | | | | | | | | | | | | | | | |
Americas | | | $ | 717,254 | | | | $ | - | | | | $ | - | | | | $ | 717,254 | |
Emerging Markets | | | | 37,781 | | | | | 67,885 | | | | | - | | | | | 105,666 | |
Europe | | | | 44,331 | | | | | 241,721 | | | | | - | | | | | 286,052 | |
Pacific Basin | | | | - | | | | | 140,648 | | | | | - | | | | | 140,648 | |
Repurchase Agreement | | | | - | | | | | 108,124 | | | | | - | | | | | 108,124 | |
Total Investments | | | | 799,366 | | | | | 558,378 | | | | | - | | | | | 1,357,744 | |
Foreign Currency Forward Contracts(2) | | | | - | | | | | (1,460 | ) | | | | - | | | | | (1,460 | ) |
Total | | | $ | 799,366 | | | | $ | 556,918 | | | | $ | - | | | | $ | 1,356,284 | |
Global Small Cap | | | | | | | | | | | | | | | | | | | | |
Common Stocks(1) | | | | | | | | | | | | | | | | | | | | |
Americas | | | $ | 17,663 | | | | $ | - | | | | $ | - | | | | $ | 17,663 | |
Emerging Markets | | | | 6,338 | | | | | 21,829 | | | | | - | | | | | 28,167 | |
Europe | | | | 1,163 | | | | | 64,749 | | | | | - | | | | | 65,912 | |
Pacific Basin | | | | - | | | | | 7,082 | | | | | - | | | | | 7,082 | |
Repurchase Agreement | | | | - | | | | | 10,148 | | | | | - | | | | | 10,148 | |
Total Investments | | | $ | 25,164 | | | | $ | 103,808 | | | | $ | - | | | | $ | 128,972 | |
Global Value | | | | | | | | | | | | | | | | | | | | |
Common Stocks(1) | | | | | | | | | | | | | | | | | | | | |
Americas | | | $ | 842,216 | | | | $ | - | | | | $ | - | | | | $ | 842,216 | |
Emerging Markets | | | | 40,352 | | | | | 70,886 | | | | | - | | | | | 111,238 | |
Europe | | | | - | | | | | 440,230 | | | | | - | | | | | 440,230 | |
Pacific Basin | | | | - | | | | | 1,456 | | | | | - | | | | | 1,456 | |
Preferred Stocks(1) | | | | | | | | | | | | | | | | | | | | |
Emerging Markets | | | | 2,640 | | | | | - | | | | | - | | | | | 2,640 | |
Repurchase Agreement | | | | - | | | | | 120,798 | | | | | - | | | | | 120,798 | |
Total Investments | | | $ | 885,208 | | | | $ | 633,370 | | | | $ | - | | | | $ | 1,518,578 | |
| | |
| 112 | | Artisan Partners Funds |
NOTES TO FINANCIAL STATEMENTS
| | | | | | | | | | | | | | | | | | | | |
| Fund | | Level 1 - Quoted
Prices | | Level 2 - Other Significant
Observable Inputs | | Level 3 - Significant
Unobservable Inputs | | Total |
High Income | | | | | | | | | | | | | | | | | | | | |
Corporate Bonds(1) | | | $ | - | | | | $ | 642,941 | | | | $ | - | | | | $ | 642,941 | |
Bank Loans(1) | | | | - | | | | | 191,802 | | | | | - | | | | | 191,802 | |
Convertible Debentures(1) | | | | - | | | | | 26,065 | | | | | - | | | | | 26,065 | |
Repurchase Agreement | | | | - | | | | | 94,577 | | | | | - | | | | | 94,577 | |
Total Investments | | | $ | - | | | | $ | 955,385 | | | | $ | - | | | | $ | 955,385 | |
International | | | | | | | | | | | | | | | | | | | | |
Common Stocks(1) | | | | | | | | | | | | | | | | | | | | |
Americas | | | $ | 2,640,898 | | | | $ | 201,725 | | | | $ | - | | | | $ | 2,842,623 | |
Emerging Markets | | | | 1,293,953 | | | | | 958,546 | | | | | - | | | | | 2,252,499 | |
Europe | | | | 97,689 | | | | | 9,377,480 | | | | | - | | | | | 9,475,169 | |
Pacific Basin | | | | - | | | | | 1,942,106 | | | | | - | | | | | 1,942,106 | |
Equity-Linked Securities(1) | | | | | | | | | | | | | | | | | | | | |
Europe | | | | - | | | | | 216,563 | | | | | - | | | | | 216,563 | |
Preferred Stocks(1) | | | | | | | | | | | | | | | | | | | | |
Europe | | | | - | | | | | 231,478 | | | | | - | | | | | 231,478 | |
Repurchase Agreement | | | | - | | | | | 619,768 | | | | | - | | | | | 619,768 | |
Total Investments | | | $ | 4,032,540 | | | | $ | 13,547,666 | | | | $ | - | | | | $ | 17,580,206 | |
International Small Cap | | | | | | | | | | | | | | | | | | | | |
Common Stocks(1) | | | | | | | | | | | | | | | | | | | | |
Americas | | | $ | 11,393 | | | | $ | - | | | | $ | - | | | | $ | 11,393 | |
Emerging Markets | | | | 42,481 | | | | | 180,897 | | | | | - | | | | | 223,378 | |
Europe | | | | - | | | | | 622,037 | | | | | - | | | | | 622,037 | |
Pacific Basin | | | | - | | | | | 19,739 | | | | | - | | | | | 19,739 | |
Repurchase Agreement | | | | - | | | | | 78,327 | | | | | - | | | | | 78,327 | |
Total Investments | | | $ | 53,874 | | | | $ | 901,000 | | | | $ | - | | | | $ | 954,874 | |
International Value | | | | | | | | | | | | | | | | | | | | |
Common Stocks(1) | | | | | | | | | | | | | | | | | | | | |
Americas | | | $ | 1,581,727 | | | | $ | - | | | | $ | - | | | | $ | 1,581,727 | |
Emerging Markets | | | | 533,672 | | | | | 571,451 | | | | | - | | | | | 1,105,123 | |
Europe | | | | 108,151 | | | | | 5,808,347 | | | | | - | | | | | 5,916,498 | |
Pacific Basin | | | | - | | | | | 514,950 | | | | | - | | | | | 514,950 | |
Preferred Stocks(1) | | | | | | | | | | | | | | | | | | | | |
Emerging Markets | | | | 17,340 | | | | | 29,485 | | | | | - | | | | | 46,825 | |
Repurchase Agreement | | | | - | | | | | 1,440,116 | | | | | - | | | | | 1,440,116 | |
Total Investments | | | | 2,240,890 | | | | | 8,364,349 | | | | | - | | | | | 10,605,239 | |
Foreign Currency Forward Contracts(2) | | | | - | | | | | (9,267 | ) | | | | - | | | | | (9,267 | ) |
Total | | | $ | 2,240,890 | | | | $ | 8,355,082 | | | | $ | - | | | | $ | 10,595,972 | |
| | |
| Artisan Partners Funds | | 113 |
NOTES TO FINANCIAL STATEMENTS
| | | | | | | | | | | | | | | | | | | | |
| Fund | | Level 1 - Quoted
Prices | | Level 2 - Other Significant
Observable Inputs | | Level 3 - Significant
Unobservable Inputs | | Total |
Mid Cap | | | | | | | | | | | | | | | | | | | | |
Common Stocks(1) | | | $ | 8,370,742 | | | | $ | - | | | | $ | - | | | | $ | 8,370,742 | |
Repurchase Agreement | | | | - | | | | | 501,889 | | | | | - | | | | | 501,889 | |
Total Investments | | | $ | 8,370,742 | | | | $ | 501,889 | | | | $ | - | | | | $ | 8,872,631 | |
Mid Cap Value | | | | | | | | | | | | | | | | | | | | |
Common Stocks(1) | | | $ | 6,148,022 | | | | $ | - | | | | $ | - | | | | $ | 6,148,022 | |
Repurchase Agreement | | | | - | | | | | 405,627 | | | | | - | | | | | 405,627 | |
Total Investments | | | $ | 6,148,022 | | | | $ | 405,627 | | | | $ | - | | | | $ | 6,553,649 | |
Small Cap | | | | | | | | | | | | | | | | | | | | |
Common Stocks(1) | | | $ | 1,188,278 | | | | $ | - | | | | $ | - | | | | $ | 1,188,278 | |
Repurchase Agreement | | | | - | | | | | 88,644 | | | | | - | | | | | 88,644 | |
Total Investments | | | $ | 1,188,278 | | | | $ | 88,644 | | | | $ | - | | | | $ | 1,276,922 | |
Small Cap Value | | | | | | | | | | | | | | | | | | | | |
Common Stocks(1) | | | $ | 470,511 | | | | $ | - | | | | $ | - | | | | $ | 470,511 | |
Repurchase Agreement | | | | - | | | | | 26,117 | | | | | - | | | | | 26,117 | |
Total Investments | | | $ | 470,511 | | | | $ | 26,117 | | | | $ | - | | | | $ | 496,628 | |
Value | | | | | | | | | | | | | | | | | | | | |
Common Stocks(1) | | | $ | 867,195 | | | | $ | 44,833 | | | | $ | - | | | | $ | 912,028 | |
Preferred Stocks(1) | | | | - | | | | | 54,906 | | | | | - | | | | | 54,906 | |
Repurchase Agreement | | | | - | | | | | 19,159 | | | | | - | | | | | 19,159 | |
Total Investments | | | $ | 867,195 | | | | $ | 118,898 | | | | $ | - | | | | $ | 986,093 | |
|
| (1)See the Fund’s Schedule of Investments for sector or country classifications. | |
| (2)Foreign currency forward contracts are valued at unrealized appreciation (depreciation). | |
Transfers between investment levels may occur as the markets fluctuate and/or the availability of data used in an investment’s valuation changes. The Funds recognize transfers between the levels as of the end of the period. At September 30, 2015, the fair value of certain securities was determined based on other observable inputs, such as quoted prices for securities of the same issuer that trade on a different exchange, or were adjusted due to developments that occurred between the time of the close of foreign markets on which they trade and the close of regular session trading on the NYSE, which resulted in their Level 2 classification. There were no transfers from Level 2 to Level 1 during the period. The following table summarizes security transfers from Level 1 to Level 2 for each applicable Fund as of September 30, 2015 (in thousands):
| | | | | |
| | | Transfers from Level 1 to Level 2 |
Emerging Markets | | | $ | 30,497 | |
Global Equity | | | | 57,273 | |
Global Opportunities | | | | 210,491 | |
Global Small Cap | | | | 27,990 | |
Global Value | | | | 472,907 | |
International | | | | 9,110,066 | |
International Small Cap | | | | 496,327 | |
International Value | | | | 6,456,256 | |
Value | | | | 79,576 | |
| | |
| 114 | | Artisan Partners Funds |
NOTES TO FINANCIAL STATEMENTS
Information about Level 3 fair value measurements (dollar values in thousands):
| | | | | | | | | | | | | | |
| Assets | | Fair Value at
September 30, 2015 | | Valuation
Technique(s) | | Unobservable
Input(s) | | Impact to Fair
Value from an
Increase in
Input |
| Emerging Markets Fund | | | | | | | | | | | |
Common Stocks | | | $ | 73 | | | Discounts for illiquidity and uncertainty | | Last trade in inactive market less 95% discount | | Decrease |
Convertible Debentures | | | | 1 | | | Last Trade | | Last trade in inactive market | | Increase |
As of September 30, 2015, the reconciliation of assets in which significant unobservable inputs (Level 3) were used in determining fair value, is as follows (in thousands):
| | | | | | | | | | |
| | | Emerging Markets Fund | | Global Value Fund |
Balance as of September 30, 2014 | | | | $ 93 | | | | | $7,116 | |
Transfers into Level 3 | | | | - | | | | | - | |
Net change in unrealized appreciation (depreciation) for investments held as of September 30, 2015 | | | | 9,426 | | | | | 1,667 | |
Purchases | | | | - | | | | | - | |
Sales | | | | (1,000 | ) | | | | (5,454 | ) |
Realized Gain/Loss | | | | (8,445 | ) | | | | (3,329 | ) |
Transfers out of Level 3 | | | | - | | | | | - | |
| | | | | | | | | | |
Balance as of September 30, 2015 | | | | $ 74 | | | | | $ - | |
| | | | | | | | | | |
| | | | | |
| | | International Value Fund |
Balance as of September 30, 2014 | | | | $ 44,852 | |
Transfers into Level 3 | | | | - | |
Net change in unrealized appreciation (depreciation) for investments held as of September 30, 2015 | | | | 10,504 | |
Purchases | | | | - | |
Sales | | | | (34,347 | ) |
Realized Gain/Loss | | | | (21,009 | ) |
Transfers out of Level 3 | | | | - | |
| | | | | |
Balance as of September 30, 2015 | | | | $ - | |
| | | | | |
Each Fund is a party to various master netting agreements. While the terms and conditions of these agreements may vary, all transactions under any such agreement constitute a single contractual relationship. Each party’s obligation to make any payments, deliveries or other transfers in respect of any transaction under such an agreement may be netted against the other party’s obligations under such agreement. A default by a party in performance with respect to one transaction under such an agreement would give the other party the right to terminate all transactions under such agreement and calculate one net amount owed from one party to the other.
| | |
| Artisan Partners Funds | | 115 |
NOTES TO FINANCIAL STATEMENTS
The following tables present information about the offsetting of derivative instruments and collateral amounts (in thousands):
| | | | | | | | | | | | |
| Foreign currency forward contracts | | | | | | | | | |
| | | Gross Amounts Not Offset in the Statements of Assets and Liabilities |
| Portfolio | | Counterparty | | | Gross Liability Amounts
Presented in Statement of
Assets and Liabilities | | Financial
Instrument | | Collateral
Pledged | | Net Amount
(Not Less Than $0) |
Global Opportunities | | | State Street Bank and Trust Company | | | $1,460 | | $- | | $- | | $1,460 |
International Value | | | State Street Bank and Trust Company | | | 9,267 | | - | | - | | 9267 |
| (5) | Transfer agent and authorized agent fees: |
Each Fund paid fees to, and reimbursed certain expenses of, the Funds’ transfer agent during the period. In addition, the Funds have authorized certain financial services companies, broker-dealers, banks or other authorized agents, and in some cases, other organizations designated by an authorized agent (with their designees, collectively “authorized agents”) to accept purchase, exchange and redemption orders for Investor Shares and Advisor Shares, as applicable, on the Funds’ behalf. Many authorized agents charged a fee for accounting and shareholder services that the agent provided to Fund shareholders on the Fund’s behalf. Those services typically included recordkeeping, transaction processing for shareholders’ accounts and other services. Generally, the fee was either a per account charge based on the number of accounts to which the authorized agent provided such services, or was a percentage (as of September 30, 2015 up to 0.40% annually for Investor Shares and 0.15% annually for Advisor Shares) of the average value of Fund shares held in such accounts. Each Fund paid a portion of such fees, which are intended to compensate the authorized agent for its provision of services of the type that would be provided by the Funds’ transfer agent or other service providers if the shares were registered on the books of the Funds’ transfer agent. The balance of the fees incurred during the period was paid by the Adviser. The Funds’ expenses incurred for services provided by authorized agents were included in “Transfer agent fees” in the Statements of Operations. The table below shows the fees and expenses to the Funds’ transfer agent and the fees to authorized agents incurred by each class of each Fund during the year ended September 30, 2015 (in thousands):
| | | | | | | | | | | | |
| | | Year Ended 9/30/2015 | |
| Fund | | Fees and Expenses
to Transfer Agent | | | Fees to
Authorized
Agents | | | Total | |
Artisan Developing World Fund - Investor Shares(1) | | | $ 8 | | | | $ 7 | | | | $ 15 | |
Artisan Developing World Fund - Institutional Shares(1) | | | 8 | | | | - | | | | 8 | |
Artisan Developing World Fund - Advisor Shares(1) | | | 8 | | | | 3 | | | | 11 | |
Artisan Emerging Markets Fund - Investor Shares | | | 63 | | | | 59 | | | | 122 | |
Artisan Emerging Markets Fund - Institutional Shares | | | 20 | | | | - | | | | 20 | |
Artisan Global Equity Fund - Investor Shares | | | 69 | | | | 601 | | | | 670 | |
Artisan Global Opportunities Fund - Investor Shares | | | 79 | | | | 1,529 | | | | 1,608 | |
Artisan Global Opportunities Fund - Institutional Shares | | | 21 | | | | - | | | | 21 | |
| | |
| 116 | | Artisan Partners Funds |
NOTES TO FINANCIAL STATEMENTS
| | | | | | | | | | | | | | | |
| | | Year Ended 9/30/2015 |
| Fund | | Fees and Expenses
to Transfer Agent | | Fees to
Authorized
Agents | | Total |
Artisan Global Opportunities Fund - Advisor Shares(2) | | | $ | 18 | | | | $ | 4 | | | | $ | 22 | |
Artisan Global Small Cap Fund - Investor Shares | | | | 67 | | | | | 317 | | | | | 384 | |
Artisan Global Value Fund - Investor Shares | | | | 85 | | | | | 2,678 | | | | | 2,763 | |
Artisan Global Value Fund - Institutional Shares | | | | 22 | | | | | - | | | | | 22 | |
Artisan Global Value Fund - Advisor Shares(2) | | | | 18 | | | | | 44 | | | | | 62 | |
Artisan High Income Fund - Investor Shares | | | | 66 | | | | | 966 | | | | | 1,032 | |
Artisan High Income Fund - Advisor Shares | | | | 63 | | | | | 187 | | | | | 250 | |
Artisan International Fund - Investor Shares | | | | 770 | | | | | 28,518 | | | | | 29,288 | |
Artisan International Fund - Institutional Shares | | | | 30 | | | | | - | | | | | 30 | |
Artisan International Fund - Advisor Shares(2) | | | | 81 | | | | | 396 | | | | | 477 | |
Artisan International Small Cap Fund - Investor Shares | | | | 87 | | | | | 1,891 | | | | | 1,978 | |
Artisan International Value Fund - Investor Shares | | | | 301 | | | | | 15,951 | | | | | 16,252 | |
Artisan International Value Fund - Institutional Shares | | | | 25 | | | | | - | | | | | 25 | |
Artisan International Value Fund - Advisor Shares(2) | | | | 92 | | | | | 604 | | | | | 696 | |
Artisan Mid Cap Fund - Investor Shares | | | | 131 | | | | | 11,063 | | | | | 11,194 | |
Artisan Mid Cap Fund - Institutional Shares | | | | 36 | | | | | - | | | | | 36 | |
Artisan Mid Cap Fund - Advisor Shares(2) | | | | 19 | | | | | 76 | | | | | 95 | |
Artisan Mid Cap Value Fund - Investor Shares | | | | 238 | | | | | 15,656 | | | | | 15,894 | |
Artisan Mid Cap Value Fund - Institutional Shares | | | | 24 | | | | | - | | | | | 24 | |
Artisan Mid Cap Value Fund - Advisor Shares(2) | | | | 19 | | | | | 141 | | | | | 160 | |
Artisan Small Cap Fund - Investor Shares | | | | 110 | | | | | 2,288 | | | | | 2,398 | |
Artisan Small Cap Fund - Institutional Shares | | | | 20 | | | | | - | | | | | 20 | |
Artisan Small Cap Value Fund - Investor Shares | | | | 84 | | | | | 1,624 | | | | | 1,708 | |
Artisan Small Cap Value Fund - Institutional Shares | | | | 21 | | | | | - | | | | | 21 | |
Artisan Value Fund - Investor Shares | | | | 82 | | | | | 1,878 | | | | | 1,960 | |
Artisan Value Fund - Institutional Shares | | | | 20 | | | | | - | | | | | 20 | |
Artisan Value Fund - Advisor Shares(2) | | | | 19 | | | | | 143 | | | | | 162 | |
| | (1) | For the period from commencement of operations (June 29, 2015) through September 30, 2015. |
| | (2) | For the period from commencement of operations (April 1, 2015) through September 30, 2015. |
Each Fund except High Income Fund has the ability to direct transactions in equity securities to various brokers that have agreed to rebate a portion of the commissions generated. During the period, such cash rebates were made directly to the applicable Fund and were included in net realized gain or loss on investments in the Statements of Operations for the year ended September 30, 2015 as follows (in thousands):
| | | | |
Emerging Markets | | $ | 45 | |
Global Equity | | | 1 | |
Global Opportunities | | | 19 | |
| | |
| Artisan Partners Funds | | 117 |
NOTES TO FINANCIAL STATEMENTS
| | | | |
Global Value | | $ | - | (1) |
International | | | 62 | |
International Small Cap | | | 1 | |
International Value | | | 1 | |
Mid Cap | | | 161 | |
Mid Cap Value | | | 254 | |
Small Cap | | | 34 | |
Small Cap Value | | | 115 | |
Value | | | 69 | |
| |
(1) Amount rounds to less than $1. | | | | |
| (7) | Derivative Transactions: |
The fair value of derivative instruments as reported in the Statements of Assets and Liabilities as of September 30, 2015 was as follows (in thousands):
| | | | | | | | |
| Fund | | Risk Exposure Category | | Statement of Assets and
Liabilities location | | Value | |
| Global Opportunities | | Foreign currency forward contracts | | Unrealized loss on foreign currency forward contracts | | $ | (1,460 | ) |
| International Value | | Foreign currency forward contracts | | Unrealized loss on foreign currency forward contracts | | $ | (9,267 | ) |
The effect of derivative instruments on the Statements of Operations for the year ended September 30, 2015 was as follows (in thousands):
Amount of Realized Gain on Derivatives Recognized in Income
| | | | | | | | |
| Fund | | Risk Exposure Category | | Statement of Operations location | | Value | |
| Global Opportunities | | Foreign currency forward contracts | | Net realized gain on foreign currency related transactions | | $ | 4,328 | |
| Global Value | | Foreign currency forward contracts | | Net realized gain on foreign currency related transactions | | $ | 2,953 | |
| High Income | | Foreign currency forward contracts | | Net realized gain on foreign currency related transactions | | $ | 1,009 | |
| International Value | | Foreign currency forward contracts | | Net realized gain on foreign currency related transactions | | $ | 118,033 | |
Change in Unrealized Appreciation (Depreciation) on Derivatives Recognized in Income
| | | | | | | | |
| Fund | | Risk Exposure Category | | Statement of Operations location | | Value | |
| Global Opportunities | | Foreign currency forward contracts | | Net decrease in unrealized appreciation or depreciation on foreign currency related transactions | | $ | (2,802 | ) |
| Global Value | | Foreign currency forward contracts | | Net decrease in unrealized appreciation or depreciation on foreign currency related transactions | | $ | (1,429 | ) |
| High Income | | Foreign currency forward contracts | | Net decrease in unrealized appreciation or depreciation on foreign currency related transactions | | $ | (225 | ) |
| International Value | | Foreign currency forward contracts | | Net decrease in unrealized appreciation or depreciation on foreign currency related transactions | | $ | (55,756 | ) |
| | |
| 118 | | Artisan Partners Funds |
NOTES TO FINANCIAL STATEMENTS
Volume of derivative activity
| | | | | | | | | | | | |
| Fund | | Contracts Closed(1) | | | Contracts Opened(1) | | | Contracts Open at September 30, 2015 | |
Global Opportunities | | | 3 | | | | 2 | | | | 1 | |
Global Value | | | 5 | | | | 1 | | | | - | |
High Income | | | 1 | | | | 1 | | | | - | |
International Value | | | 3 | | | | 2 | | | | 1 | |
| (1) | During the year ended September 30, 2015. |
| (8) | Transactions with affiliates: |
The Adviser, with which the officers and a director of Artisan Partners Funds are affiliated, provided investment advisory and administrative services to the Funds. In exchange for those services, each Fund pays a monthly management fee to the Adviser as follows:
Developing World Fund and Emerging Markets Fund
| | | | |
Average Daily Net Assets | | Annual Rate | |
Less than $1 billion | | | 1.050 | % |
$1 billion to $2 billion | | | 1.025 | |
$2 billion to $3.5 billion | | | 1.000 | |
$3.5 billion to $5 billion | | | 0.975 | |
Greater than $5 billion | | | 0.950 | |
Global Equity Fund and Global Value Fund
| | | | |
Average Daily Net Assets | | Annual Rate | |
Less than $1 billion | | | 1.000 | % |
$1 billion to $4 billion | | | 0.975 | |
$4 billion to $8 billion | | | 0.950 | |
$8 billion to $12 billion | | | 0.925 | |
Greater than $12 billion | | | 0.900 | |
Global Opportunities Fund
| | | | |
Average Daily Net Assets | | Annual Rate | |
Less than $1 billion | | | 0.900 | % |
$1 billion to $4 billion | | | 0.875 | |
$4 billion to $8 billion | | | 0.850 | |
$8 billion to $12 billion | | | 0.825 | |
Greater than $12 billion | | | 0.800 | |
Global Small Cap Fund
| | | | |
Average Daily Net Assets | | Annual Rate | |
All | | | 1.000 | % |
| | |
| Artisan Partners Funds | | 119 |
NOTES TO FINANCIAL STATEMENTS
High Income Fund
| | | | |
Average Daily Net Assets | | Annual Rate | |
Less than $1 billion | | | 0.725 | % |
$1 billion to $2 billion | | | 0.700 | |
$2 billion to $3.5 billion | | | 0.675 | |
$3.5 billion to $10 billion | | | 0.650 | |
Greater than $10 billion | | | 0.625 | |
International Fund
| | | | |
Average Daily Net Assets | | Annual Rate | |
Less than $500 million | | | 1.000 | % |
$500 million to $750 million | | | 0.975 | |
$750 million to $1 billion | | | 0.950 | |
$1 billion to $12 billion | | | 0.925 | |
Greater than $12 billion | | | 0.900 | |
International Small Cap Fund
| | | | |
Average Daily Net Assets | | Annual Rate | |
All | | | 1.250 | % |
International Value Fund, Mid Cap Fund, Mid Cap Value Fund, Small Cap Fund, and Small Cap Value Fund
| | | | |
Average Daily Net Assets | | Annual Rate | |
Less than $500 million | | | 1.000 | % |
$500 million to $750 million | | | 0.975 | |
$750 million to $1 billion | | | 0.950 | |
Greater than $1 billion | | | 0.925 | |
Value Fund
| | | | |
Average Daily Net Assets | | Annual Rate | |
Less than $50 million | | | 0.800 | % |
$50 million to $100 million | | | 0.760 | |
$100 million to $500 million | | | 0.720 | |
$500 million to $7.5 billion | | | 0.680 | |
Greater than $7.5 billion | | | 0.640 | |
The Adviser has contractually agreed to reimburse the Funds for their management fees and any other ordinary operating expenses (excluding taxes, interest, all commissions and other normal charges incident to the purchase and sale of portfolio securities, and extraordinary charges such as litigation costs) as follows:
| | | | | | | | | | |
| Fund | | Expense Limit as a % of
Average Daily Net Assets | | Expiration Date | | | Expenses
Waived | |
Developing World Fund - Investor Shares | | 1.50% | | | February 1, 2017 | | | $ | 30,000 | |
Developing World Fund - Institutional Shares | | 1.40% | | | February 1, 2017 | | | | 24,000 | |
| | |
| 120 | | Artisan Partners Funds |
NOTES TO FINANCIAL STATEMENTS
| | | | | | | | | | |
| Fund | | Expense Limit as a % of
Average Daily Net Assets | | Expiration Date | | | Expenses
Waived | |
Developing World Fund - Advisor Shares | | 1.40% | | | February 1, 2017 | | | $ | 34,000 | |
Emerging Markets Fund - Investor Shares | | 1.50% | | | February 1, 2017 | | | | 103,000 | |
Emerging Markets Fund - Institutional Shares | | 1.50% | | | February 1, 2017 | | | | - | |
Global Equity Fund | | 1.50% | | | February 1, 2017 | | | | - | |
Global Opportunities Fund - Advisor Shares | | 1.10% | | | February 1, 2017 | | | | 42,000 | |
Global Small Cap Fund | | 1.50% | | | February 1, 2017 | | | | 41,000 | |
Global Value Fund - Advisor Shares | | 1.20% | | | February 1, 2017 | | | | 16,000 | |
High Income Fund - Investor Shares | | 1.25% | | | February 1, 2017 | | | | - | |
High Income Fund - Advisor Shares | | 1.25% | | | February 1, 2017 | | | | - | |
International Fund - Advisor Shares | | 1.07% | | | February 1, 2017 | | | | 8,000 | |
International Value Fund - Advisor Shares | | 1.06% | | | February 1, 2017 | | | | 87,000 | |
Mid Cap Fund - Advisor Shares | | 1.10% | | | February 1, 2017 | | | | 26,000 | |
Mid Cap Value Fund - Advisor Shares | | 1.09% | | | February 1, 2017 | | | | 34,000 | |
Value Fund - Advisor Shares | | 0.88% | | | February 1, 2017 | | | | - | |
For the period ended September 30, 2015, no operating expenses were reimbursed by the Adviser. The Funds had no receivables from or payables to the Adviser as of September 30, 2015.
The officers and director of Artisan Partners Funds who are affiliated with the Adviser receive no compensation from the Funds. Prior to July 1, 2015, compensation paid to the directors of Artisan Partners Funds who are not affiliated persons of the Adviser for their services as such was based on an annual fee of $260,000, payable quarterly, subject to an additional increase of $10,000 upon commencement of operations of any new series of Artisan Partners Funds. In addition, the independent chair of the board of directors receives an additional $60,000 annually, payable quarterly, the independent chair of the audit committee receives an additional $45,000 annually, payable quarterly and the independent chair of the governance and nominating committee receives an additional $30,000 annually, payable quarterly. Effective July 1, 2015, for each director, the amount of the annual retainer increased by $10,000 to $270,000, due to the commencement of operations of Developing World Fund. Additionally, each director is entitled to reimbursement of expenses related to his or her duties as a director of Artisan Partners Funds. These fees were generally allocated to each of the Artisan Partners Funds based on net assets, subject to a minimum allocation of $1,500 to each Fund per quarter.
Artisan Partners Funds has adopted a deferred compensation plan for directors who are not affiliated persons of the Adviser that enables directors to elect to defer receipt of all or a portion of the annual compensation they are entitled to receive from the Funds. For purposes of determining the amount owed to the directors under the plan, deferred amounts were invested in shares of Artisan Partners Funds as selected by the individual directors. Each Fund purchased shares of Artisan Partners Funds selected for deferral by the directors in amounts equal to their investment, resulting in a Fund asset equal to the deferred compensation liability. Such assets were included as a component of “Other assets” on the Statement of Assets and Liabilities. Deferral of directors’ fees under the plan did not affect the net assets of the Funds, and did not materially affect the Funds’ assets, liabilities or net investment income per share. Amounts will be deferred until distributed in accordance with the plan.
| | |
| Artisan Partners Funds | | 121 |
NOTES TO FINANCIAL STATEMENTS
Shares of Artisan Partners Funds are offered for sale by Artisan Partners Distributors LLC (“Distributors”). Distributors is wholly owned by Artisan Holdings. All distribution expenses relating to the Funds are paid by the Adviser.
| (9) | Line of credit arrangement: |
Prior to June 17, 2015, Artisan Partners Funds was party to a line of credit agreement with State Street Bank and Trust Company (“SSB”), under which each Fund could have borrowed up to $75 million, provided that such borrowing did not exceed the lesser of (a) 33 1/3% of its adjusted net assets, with adjusted net assets being total assets less total liabilities (excluding indebtedness for borrowed money) after giving effect to the borrowing, and (b) the maximum amount the Fund is permitted to borrow pursuant to applicable law, pursuant to the Fund’s prospectus limitations on indebtedness, pursuant to any vote of the shareholders of the Fund, or pursuant to any limitation on borrowings in any applicable agreement with any governmental authority or regulator or any other applicable agreement or document to which such Fund is a party; provided that the aggregate borrowings by all Artisan Partners Funds may not exceed $100 million. Effective, June 17, 2015, Artisan Partners Funds was party to a line of credit agreement with a syndicate of financial institutions, including SSB, as lenders and SSB as administrative agent that expires in June 2016. Under this new line of credit, each Fund can borrow an amount that shall not exceed the lesser of a) 33 1/3% of its adjusted net assets, with adjusted net assets being total assets less total liabilities (excluding indebtedness for borrowed money) after giving effect to the borrowing, and (b) the maximum amount the Fund is permitted to borrow pursuant to applicable law, pursuant to the Fund’s prospectus limitations on indebtedness, pursuant to any vote of the shareholders of the Fund, or pursuant to any limitation on borrowings in any applicable agreement with any governmental authority or regulator or any other applicable agreement or document to which such Fund is a party; provided that the aggregate borrowings by all Artisan Partners Funds may not exceed $150 million. Artisan Partners Funds paid a commitment fee at the annual rate of 0.125% on the unused portion of the line of credit and interest was charged on any borrowings at the higher of the current Federal Funds or overnight LIBOR rates plus 1.25%. The commitment fee is allocated to each Fund based on net assets. The use of the line of credit was generally restricted to temporary borrowing for extraordinary or emergency purposes. During the year ended September 30, 2015, there were no borrowings under the line of credit for any of the Funds, except for Emerging Markets Fund, Global Equity Fund and Global Small Cap Fund, which had maximum borrowings of approximately $43,168,000, $4,095,000 and $3,457,000, respectively.
| (10) | Investment transactions: |
The cost of securities purchased and the proceeds from the sale of securities (excluding short-term securities) for the year ended September 30, 2015 were as follows (in thousands):
| | | | | | | | | | |
| Fund | | Security Purchases | | Security Sales |
Developing World(1) | | | $ | 120,873 | | | | $ | 4,964 | |
Emerging Markets | | | | 44,246 | | | | | 373,407 | |
Global Equity | | | | 275,638 | | | | | 208,495 | |
Global Opportunities | | | | 842,476 | | | | | 661,919 | |
Global Small Cap | | | | 120,281 | | | | | 145,778 | |
| | |
| 122 | | Artisan Partners Funds |
NOTES TO FINANCIAL STATEMENTS
| | | | | | | | | | |
| Fund | | Security Purchases | | Security Sales |
Global Value | | | $ | 313,023 | | | | $ | 517,550 | |
High Income | | | | 992,271 | | | | | 581,786 | |
International | | | | 10,951,147 | | | | | 8,263,059 | |
International Small Cap | | | | 420,029 | | | | | 550,791 | |
International Value | | | | 2,416,109 | | | | | 2,322,343 | |
Mid Cap | | | | 4,727,481 | | | | | 5,821,627 | |
Mid Cap Value | | | | 2,643,497 | | | | | 5,982,553 | |
Small Cap | | | | 615,978 | | | | | 949,783 | |
Small Cap Value | | | | 352,852 | | | | | 1,270,165 | |
Value | | | | 876,504 | | | | | 1,119,796 | |
| (1) | For the period from commencement of operations (June 29, 2015) through September 30, 2015. |
| (11) | Transactions in securities of affiliates: |
The table below shows information about securities of the Funds’ “affiliates” (as defined below) that were held by the Funds, purchased or sold by the Funds, or from which dividends were received by the Funds during the year ended September 30, 2015 (dollar values in thousands). The Funds identify a company as an affiliate for the purpose of this report if one or more of the Funds owned, in the aggregate, voting securities that it believed represented 5% or more of that company’s outstanding voting securities (as defined by the 1940 Act) during the year ended September 30, 2015.
| | | | | | | | | | | | | | | | | | | | | | | | | | | | | | |
| | | | | As of
9/30/14 | | | | | | | | | Net
Realized
Gain (Loss) | | | | | | As of
9/30/15 | |
| Fund | | Security | | Share
Balance | | | Purchase
Cost | | | Sales
Proceeds | | | | Dividend
Income@ | | | Share
Balance | | | Value | |
| Global Equity | | | | | | | | | | | | | | | | | | | | | | | | | | | | |
| | | China Oil & Gas Group Ltd.§ | | | 44,698,000 | | | $ | 73 | | | $ | 2,372 | | | $ | (2,017 | ) | | $ | - | | | | 23,840,000 | | | $ | 1,492 | |
| | | Ginko International Co., Ltd.† | | | 602,000 | | | | 2,824 | | | | 710 | | | | (193 | ) | | | 163 | | | | 791,000 | | | | 8,008 | |
| | | Total# | | | | | | $ | 2,897 | | | $ | 3,082 | | | $ | (2,210 | ) | | $ | 163 | | | | | | | $ | 8,008 | |
| Global Opportunities | | | | | | | | | | | | | | | | | | | | | | | | | | | | |
| | | IHS, Inc., Class A | | | 496,795 | | | $ | 14,724 | | | $ | 4,347 | | | $ | (500 | ) | | $ | - | | | | 581,487 | | | $ | 67,452 | |
| | | Stanley Electric Co., Ltd. | | | - | | | | 14,293 | | | | - | | | | - | | | | 88 | | | | 686,400 | | | | 13,750 | |
| | | Total# | | | | | | $ | 29,017 | | | $ | 4,347 | | | $ | (500 | ) | | $ | 88 | | | | | | | $ | 81,202 | |
| Global Small Cap | | | | | | | | | | | | | | | | | | | | | | | | | | | | |
| | | China Oil & Gas Group Ltd.§ | | | 39,460,000 | | | $ | - | | | $ | 2,637 | | | $ | (1,614 | ) | | $ | - | | | | 17,020,000 | | | $ | 1,065 | |
| | | Ginko International Co., Ltd.† | | | 494,000 | | | | 683 | | | | 1,254 | | | | (733 | ) | | | 91 | | | | 444,000 | | | | 4,495 | |
| | | Oldtown Bhd§ | | | 4,636,475 | | | | - | | | | 1,967 | | | | (962 | ) | | | - | | | | - | | | | - | |
| | | Total# | | | | | | $ | 683 | | | $ | 5,858 | | | $ | (3,309 | ) | | $ | 91 | | | | | | | $ | 4,495 | |
| Global Value | | | | | | | | | | | | | | | | | | | | | | | | | | | | |
| | | Arch Capital Group Ltd. | | | 958,157 | | | $ | - | | | $ | 8,568 | | | $ | 763 | | | $ | - | | | | 824,053 | | | $ | 60,543 | |
| | | ISS AS† | | | 984,056 | | | | 8,484 | | | | 4,531 | | | | (91 | ) | | | 748 | | | | 1,159,246 | | | | 38,560 | |
| | | Joy Global, Inc.† | | | - | | | | 23,743 | | | | 582 | | | | (278 | ) | | | 222 | | | | 603,577 | | | | 9,011 | |
| | | Serco Group plc§† | | | 1,395,590 | | | | 1,553 | | | | 3,682 | | | | (4,461 | ) | | | - | | | | 1,751,230 | | | | 2,705 | |
| | | Total# | | | | | | $ | 33,780 | | | $ | 17,363 | | | $ | (4,067 | ) | | $ | 970 | | | | | | | $ | 108,114 | |
| | |
| Artisan Partners Funds | | 123 |
NOTES TO FINANCIAL STATEMENTS
| | | | | | | | | | | | | | | | | | | | | | | | | | | | | | |
| | | | | As of
9/30/14 | | | | | | | | | Net
Realized
Gain (Loss) | | | | | | As of
9/30/15 | |
| Fund | | Security | | Share
Balance | | | Purchase
Cost | | | Sales
Proceeds | | | | Dividend
Income@ | | | Share
Balance | | | Value | |
| International | | | | | | | | | | | | | | | | | | | | | | | | | | | | |
| | | IHI Corp.§ | | | 81,032,963 | | | $ | 47,679 | | | $ | 124,772 | | | $ | 1,397 | | | $ | 2,950 | | | | 63,733,422 | | | $ | 164,099 | |
| | | NGK Insulators Ltd.§ | | | 17,247,482 | | | | 76,694 | | | | 206,207 | | | | 55,304 | | | | 3,075 | | | | 12,110,861 | | | | 232,444 | |
| | | Total# | | | | | | $ | 124,373 | | | $ | 330,979 | | | $ | 56,701 | | | $ | 6,025 | | | | | | | $ | - | |
| International Small Cap | | | | | | | | | | | | | | | | | | | | | | | | | | | | |
| | | China Oil & Gas Group Ltd.§ | | | 261,120,000 | | | $ | - | | | $ | 13,410 | | | $ | (10,319 | ) | | $ | - | | | | 141,720,000 | | | $ | 8,869 | |
| | | Comet Holding AG† | | | 35,808 | | | | 4,532 | | | | 948 | | | | (112 | ) | | | 418 | | | | 40,085 | | | | 27,745 | |
| | | Ginko International Co., Ltd.† | | | 3,349,000 | | | | 11,379 | | | | 3,791 | | | | (1,598 | ) | | | 851 | | | | 4,043,000 | | | | 40,930 | |
| | | Oldtown Bhd§ | | | 20,419,525 | | | | - | | | | 8,916 | | | | (4,363 | ) | | | - | | | | - | | | | - | |
| | | Total# | | | | | | $ | 15,911 | | | $ | 27,065 | | | $ | (16,392 | ) | | $ | 1,269 | | | | | | | $ | 68,675 | |
| International Value | | | | | | | | | | | | | | | | | | | | | | | | | | | | |
| | | Akastor ASA§ | | | 14,415,446 | | | $ | - | | | $ | 19,887 | | | $ | (39,624 | ) | | $ | - | | | | - | | | $ | - | |
| | | Aker Solutions ASA† | | | 14,415,446 | | | | 24,040 | | | | 2,383 | | | | (2,806 | ) | | | 2,260 | | | | 17,389,284 | | | | 60,172 | |
| | | Alent plc§ | | | 18,377,001 | | | | 735 | | | | 134,270 | | | | 40,209 | | | | 1,699 | | | | - | | | | - | |
| | | Arch Capital Group Ltd. | | | 6,031,602 | | | | 19,262 | | | | 7,401 | | | | 910 | | | | - | | | | 6,225,338 | | | | 457,376 | |
| | | ISS AS† | | | 6,841,635 | | | | 53,900 | | | | 7,753 | | | | (807 | ) | | | 5,135 | | | | 8,567,470 | | | | 284,979 | |
| | | Panalpina Welttransport Holding AG† | | | 1,722,398 | | | | 32,970 | | | | 622 | | | | 459 | | | | 4,960 | | | | 1,988,088 | | | | 217,607 | |
| | | Serco Group plc§† | | | 13,333,597 | | | | 50,910 | | | | 47,149 | | | | (59,402 | ) | | | - | | | | 23,525,317 | | | | 36,337 | |
| | | Societe Television Francaise 1§† | | | 9,831,366 | | | | 10,853 | | | | 186,868 | | | | 43,789 | | | | 9,575 | | | | - | | | | - | |
| | | Stanley Electric Co., Ltd. | | | 9,993,200 | | | | 1,679 | | | | 17,080 | | | | 1,660 | | | | 2,316 | | | | 9,306,804 | | | | 186,432 | |
| | | Vesuvius plc | | | 20,662,360 | | | | 24,916 | | | | 4,223 | | | | (399 | ) | | | 5,325 | | | | 23,945,533 | | | | 127,891 | |
| | | Total# | | | | | | $ | 219,265 | | | $ | 427,636 | | | $ | (16,011 | ) | | $ | 31,270 | | | | | | | $ | 1,334,457 | |
| Mid Cap | | | | | | | | | | | | | | | | | | | | | | | | | | | | |
| | | FLIR Systems, Inc.§ | | | 2,753,836 | | | $ | 24,062 | | | $ | 102,139 | | | $ | 6,957 | | | $ | 1,267 | | | | - | | | $ | - | |
| | | IHS, Inc., Class A | | | 3,450,813 | | | | 2,926 | | | | 44,426 | | | | 1,511 | | | | - | | | | 3,101,243 | | | | 359,744 | |
| | | Total# | | | | | | $ | 26,988 | | | $ | 146,565 | | | $ | 8,468 | | | $ | 1,267 | | | | | | | $ | 359,744 | |
| Mid Cap Value | | | | | | | | | | | | | | | | | | | | | | | | | | | | |
| | | Arch Capital Group Ltd. | | | 3,818,624 | | | $ | - | | | $ | 87,388 | | | $ | 54,730 | | | $ | - | | | | 2,442,126 | | | $ | 179,423 | |
| | | Arrow Electronics, Inc.§ | | | 5,282,526 | | | | - | | | | 110,552 | | | | 38,905 | | | | - | | | | 3,378,316 | | | | 186,753 | |
| | | Avnet, Inc.§ | | | 6,940,710 | | | | 20,078 | | | | 106,810 | | | | 21,051 | | | | 3,841 | | | | 4,920,841 | | | | 210,022 | |
| | | Denbury Resources, Inc.§† | | | 13,918,877 | | | | 43,450 | | | | 39,293 | | | | (60,558 | ) | | | 3,844 | | | | 12,419,877 | | | | 30,305 | |
| | | FLIR Systems, Inc.§ | | | 7,923,855 | | | | - | | | | 88,200 | | | | 17,366 | | | | 2,821 | | | | 5,067,474 | | | | 141,839 | |
| | | Hatteras Financial Corp.§ | | | 7,662,175 | | | | 11,771 | | | | 70,742 | | | | (35,546 | ) | | | 10,268 | | | | 4,400,276 | | | | 66,664 | |
| | | Joy Global, Inc.† | | | 2,759,243 | | | | 101,660 | | | | 39,107 | | | | (21,414 | ) | | | 2,940 | | | | 4,199,074 | | | | 62,692 | |
| | | Kennametal, Inc.§† | | | 3,128,658 | | | | 74,241 | | | | 52,891 | | | | (16,612 | ) | | | 3,218 | | | | 3,588,403 | | | | 89,315 | |
| | | McDermott International, Inc.§ | | | 13,345,344 | | | | - | | | | 19,063 | | | | (34,897 | ) | | | - | | | | 8,521,556 | | | | 36,643 | |
| | | NeuStar, Inc., Class A§ | | | 3,539,006 | | | | - | | | | 98,674 | | | | (70,574 | ) | | | - | | | | - | | | | - | |
| | | Total# | | | | | | $ | 251,200 | | | $ | 712,720 | | | $ | (107,549 | ) | | $ | 26,932 | | | | | | | $ | 242,115 | |
| Small Cap | | | | | | | | | | | | | | | | | | | | | | | | | | | | |
| | | Ultratech, Inc.§ | | | 440,409 | | | $ | - | | | $ | 8,551 | | | $ | (5,281 | ) | | $ | - | | | | - | | | $ | - | |
| | | Total# | | | | | | $ | - | | | $ | 8,551 | | | $ | (5,281 | ) | | $ | - | | | | - | | | $ | - | |
| | |
| 124 | | Artisan Partners Funds |
NOTES TO FINANCIAL STATEMENTS
| | | | | | | | | | | | | | | | | | | | | | | | | | | | | | |
| | | | | As of
9/30/14 | | | | | | | | | Net
Realized
Gain (Loss) | | | | | | As of
9/30/15 | |
| Fund | | Security | | Share
Balance | | | Purchase
Cost | | | Sales
Proceeds | | | | Dividend
Income@ | | | Share
Balance | | | Value | |
| Small Cap Value | | | | | | | | | | | | | | | | | | | | | | | | | | | | |
| | | Arrow Electronics, Inc.§ | | | 629,017 | | | $ | - | | | $ | 23,534 | | | $ | 16,789 | | | $ | - | | | | 220,431 | | | $ | 12,185 | |
| | | Hatteras Financial Corp.§ | | | 1,215,213 | | | | 1,419 | | | | 16,958 | | | | (7,181 | ) | | | 1,053 | | | | 367,499 | | | | 5,568 | |
| | | Kennametal, Inc.§† | | | - | | | | 14,748 | | | | 6,483 | | | | (996 | ) | | | 153 | | | | 216,134 | | | | 5,380 | |
| | | McDermott International, Inc.§ | | | 549,697 | | | | - | | | | 1,180 | | | | (1,155 | ) | | | - | | | | 237,871 | | | | 1,023 | |
| | | Ultratech, Inc.§ | | | 1,328,650 | | | | - | | | | 16,024 | | | | 5,994 | | | | - | | | | 450,483 | | | | 7,217 | |
| | | Total# | | | | | | $ | 16,167 | | | $ | 64,179 | | | $ | 13,451 | | | $ | 1,206 | | | | | | | $ | - | |
| Value | | | | | | | | | | | | | | | | | | | | | | | | | | | | |
| | | Arch Capital Group Ltd. | | | 476,794 | | | $ | - | | | $ | 7,127 | | | $ | 1,845 | | | $ | - | | | | 361,651 | | | $ | 26,570 | |
| | | Avnet, Inc.§ | | | 988,293 | | | | 9,539 | | | | 13,177 | | | | 444 | | | | 696 | | | | 942,923 | | | | 40,244 | |
| | | Denbury Resources, Inc.§† | | | 3,025,951 | | | | 28,277 | | | | 9,215 | | | | (13,181 | ) | | | 1,166 | | | | 4,203,525 | | | | 10,257 | |
| | | Joy Global, Inc.† | | | - | | | | 60,000 | | | | 2,207 | | | | (824 | ) | | | 450 | | | | 1,677,990 | | | | 25,053 | |
| | | Total# | | | | | | $ | 97,816 | | | $ | 31,726 | | | $ | (11,716 | ) | | $ | 2,312 | | | | | | | $ | 51,623 | |
| | |
| @ | | Net of foreign taxes withheld, if any. |
| # | | Total value as of September 30, 2015 is presented for only those issuers that were affiliates as of September 30, 2015. |
| § | | Issuer was no longer an affiliate as of September 30, 2015. |
| † | | Issuer was not an affiliate as of September 30, 2014. |
| (12) | Information for Federal income tax purposes: |
For Federal income tax purposes, the cost of investments, gross unrealized appreciation, gross unrealized depreciation and net unrealized appreciation (depreciation) on investments as of September 30, 2015 was as follows (in thousands):
| | | | | | | | | | | | | | | | |
| Fund | | Cost of
Investments | | | Gross
Unrealized
Appreciation | | | Gross
Unrealized
Depreciation | | | Net
Unrealized
Appreciation
(Depreciation)
on Investments | |
Developing World | | $ | 128,038 | | | $ | 451 | | | $ | (9,714 | ) | | $ | (9,263 | ) |
Emerging Markets | | | 60,087 | | | | 9,507 | �� | | | (19,158 | ) | | | (9,651 | ) |
Global Equity | | | 298,343 | | | | 25,659 | | | | (26,788 | ) | | | (1,129 | ) |
Global Opportunities | | | 1,200,813 | | | | 203,910 | | | | (46,979 | ) | | | 156,931 | |
Global Small Cap | | | 137,395 | | | | 8,277 | | | | (16,700 | ) | | | (8,423 | ) |
Global Value | | | 1,478,564 | | | | 190,597 | | | | (150,583 | ) | | | 40,014 | |
High Income | | | 1,003,487 | | | | 2,097 | | | | (50,199 | ) | | | (48,102 | ) |
International | | | 16,677,684 | | | | 1,886,686 | | | | (984,164 | ) | | | 902,522 | |
International Small Cap | | | 799,891 | | | | 207,199 | | | | (52,216 | ) | | | 154,983 | |
International Value | | | 9,692,080 | | | | 1,897,741 | | | | (984,582 | ) | | | 913,159 | |
Mid Cap | | | 6,813,232 | | | | 2,301,209 | | | | (241,810 | ) | | | 2,059,399 | |
Mid Cap Value | | | 5,994,891 | | | | 1,528,286 | | | | (969,528 | ) | | | 558,758 | |
Small Cap | | | 954,025 | | | | 381,020 | | | | (58,123 | ) | | | 322,897 | |
Small Cap Value | | | 488,485 | | | | 81,786 | | | | (73,643 | ) | | | 8,143 | |
Value | | | 1,072,874 | | | | 137,375 | | | | (224,156 | ) | | | (86,781 | ) |
| | |
| Artisan Partners Funds | | 125 |
NOTES TO FINANCIAL STATEMENTS
The difference between cost of investments for financial reporting and cost of investments for Federal income tax purposes was due primarily to timing differences in recognizing certain gains and losses on security transactions (e.g., wash sale loss deferrals and passive foreign investment company transactions).
The tax characterization of ordinary income dividends and long-term capital gain distributions paid during the year ended September 30, 2015 and the year ended September 30, 2014 were as follows (in thousands):
| | | | | | | | | | | | | | | | |
| | | Year or Period Ended
9/30/2015 | | | Year or Period Ended
9/30/2014 | |
| Fund | | Ordinary
Income
Dividends | | | Long-Term
Capital Gain
Distributions | | | Ordinary
Income
Dividends | | | Long-Term
Capital Gain
Distributions | |
Developing World | | $ | - | (1) | | $ | - | (1) | | $ | n/a | | | $ | n/a | |
Emerging Markets | | | 3,476 | | | | - | | | | 5,398 | | | | - | |
Global Equity | | | 5,271 | | | | 1,962 | | | | 5,757 | | | | 1,727 | |
Global Opportunities | | | 4,684 | | | | 26,461 | | | | - | | | | - | |
Global Small Cap | | | 1,155 | | | | 1,195 | | | | 123 | | | | - | |
Global Value | | | 44,958 | | | | 16,540 | | | | 17,231 | | | | 13,976 | |
High Income | | | 44,032 | | | | - | | | | 8,298 | (2) | | | - | (2) |
International | | | 140,063 | | | | - | | | | 146,761 | | | | - | |
International Small Cap | | | 249 | | | | 59,110 | | | | 4,979 | | | | 64,142 | |
International Value | | | 303,204 | | | | 442,441 | | | | 270,940 | | | | 529,732 | |
Mid Cap | | | - | | | | 954,288 | | | | - | | | | 704,116 | |
Mid Cap Value | | | 163,488 | | | | 928,701 | | | | 99,168 | | | | 411,068 | |
Small Cap | | | - | | | | - | | | | - | | | | - | |
Small Cap Value | | | 22,246 | | | | 239,033 | | | | 28,513 | | | | 77,575 | |
Value | | | 38,081 | | | | 68,946 | | | | 23,724 | | | | 54,490 | |
| (1) | For the period from commencement of operations (June 29, 2015) through September 30, 2015. |
| (2) | For the period from commencement of operations (March 19, 2014) through September 30, 2014. |
Ordinary income dividends and long-term capital gain distributions were determined in accordance with income tax regulations that impose treatment that is different from the treatment that would result from the application of US GAAP for such items as net short-term gains, wash sale loss deferrals, passive foreign investment company transactions, foreign currency transactions, net investment losses and qualified late year ordinary losses.
Gains on redemptions in-kind for International Fund, International Value Fund, Mid Cap Fund and Mid Cap Value Fund, of approximately $95,868,000, $8,403,000, $32,607,000 and $15,209,000, respectively, were included in net realized gain on investments in the Statements of Operations for the year ended September 30, 2015, and were not recognized for Federal income tax purposes. These net realized gains represented permanent book/tax differences and were reclassified to “Fund shares issued and outstanding” on the accompanying Statements of Assets and Liabilities.
| | |
| 126 | | Artisan Partners Funds |
NOTES TO FINANCIAL STATEMENTS
In order to meet certain excise tax distribution requirements, the Funds are required to measure and distribute annually, net capital gains realized during a twelve-month period ending October 31 and net investment income earned during a twelve-month period ending December 31. In connection with these requirements, the Funds are permitted for tax purposes to defer into their next fiscal year qualified late year losses. Qualified late year capital losses are any net capital losses incurred between November 1 and the end of the Funds’ fiscal year, September 30, 2015. Qualified late year ordinary losses are specified losses generally incurred between January 1 and the end of the Funds’ fiscal year, September 30, 2015.
Additional tax information as of and for the year ended September 30, 2015 follows (in thousands):
| | | | | | | | | | | | | | | | | | | | |
| | | Undistributed
Ordinary
Income | | | Undistributed
Long-Term
Gain | | | Qualified
Late Year
Capital
Losses | | | Qualified
Late Year
Ordinary
Losses | | | Other
Deferred
Gains
(Losses)(1) | |
Developing World | | $ | - | | | $ | - | | | $ | - (2) | | | $ | 36 | (2) | | $ | (21 | )(2) |
Emerging Markets | | | - | | | | - | | | | - | | | | - | | | | (113 | ) |
Global Equity | | | 5,311 | | | | 1,549 | | | | - | | | | - | | | | (8 | ) |
Global Opportunities | | | 2,530 | | | | 6,359 | | | | - | | | | - | | | | (198 | ) |
Global Small Cap | | | - | | | | - | | | | - | | | | 61 | | | | (7 | ) |
Global Value | | | 9,880 | | | | 73,133 | | | | - | | | | - | | | | (98 | ) |
High Income | | | 2,918 | | | | 208 | | | | - | | | | - | | | | - | |
International | | | 103,869 | | | | - | | | | 314,412 | | | | - | | | | (20,298 | ) |
International Small Cap | | | 1,274 | | | | 29,223 | | | | - | | | | - | | | | (58 | ) |
International Value | | | 100,376 | | | | 540,443 | | | | - | | | | - | | | | (1,430 | ) |
Mid Cap | | | - | | | | 1,028,802 | | | | - | | | | 48,061 | | | | (38 | ) |
Mid Cap Value | | | 31,021 | | | | 906,191 | | | | - | | | | - | | | | (701 | ) |
Small Cap | | | - | | | | 115,267 | | | | - | | | | 10,068 | | | | (6 | ) |
Small Cap Value | | | 4,435 | | | | 74,731 | | | | - | | | | - | | | | (4 | ) |
Value | | | 7,103 | | | | 89,395 | | | | - | | | | - | | | | (36 | ) |
| (1) | Other deferred gains and losses relate to (a) gains or losses on transactions that occurred subsequent to year end that affected the distributable earnings at September 30, 2015 such as wash sales, (b) unrealized gains and losses on open foreign currency contracts and (c) other items. |
| (2) | For the period from commencement of operations (June 29, 2015) through September 30, 2015. |
Under the Regulated Investment Company Modernization Act of 2010, each Fund is permitted to carry forward capital losses incurred in taxable years beginning after the date of enactment for an unlimited period. However, any losses incurred during those future taxable years must be utilized prior to the losses incurred in pre-enactment taxable years, which carry an expiration date. As a result, pre-enactment capital loss carryforwards may be more likely to expire unused. Additionally, post-enactment capital loss carryforwards will retain their character as either short-term or long-term capital losses rather than being considered all short-term, as permitted under previous law. Thus, such losses must be used first to offset gains of the same character; for example, long-term carryforward losses will first offset long-term gains, before they can be used to offset short-term gains.
| | |
| Artisan Partners Funds | | 127 |
NOTES TO FINANCIAL STATEMENTS
As of September 30, 2015, the Funds had capital loss carryovers shown in the table below (in thousands). To the extent the Funds realize future net capital gains, those gains will be offset by any unused capital loss carryover.
| | | | | | | | |
| | | Expiration Dates | |
| | | Unlimited – ST | | | Unlimited – LT | |
Developing World | | $ | 954 | | | $ | - | |
Emerging Markets | | | 4,286 | | | | 128,955 | (1) |
Global Small Cap | | | 6,726 | | | | - | |
| (1) | Due to an equity shift in the ordinary course of business, the utilization of certain capital loss carryovers is subject to annual limitations of $1,815, pursuant to IRC Section 382-383. |
| (13) | Fund share activities: |
Capital share transactions for the Funds were as follows (dollar values in thousands):
| | | | | | | | |
| | | DEVELOPING WORLD | |
| | | Period Ended
9/30/2015(1) | |
| | | Shares | | | Amount | |
Proceeds from shares issued | | | | | | | | |
Investor Shares | | | 2,482,172 | | | $ | 24,067 | |
Institutional Shares | | | 4,770,304 | | | | 42,512 | |
Advisor Shares | | | 7,039,240 | | | | 63,619 | |
Cost of shares redeemed(2) | | | | | | | | |
Investor Shares | | | (21,206 | ) | | | (187 | ) |
Institutional Shares | | | (4,330 | ) | | | (41 | ) |
Advisor Shares | | | (100,866 | ) | | | (866 | ) |
Net increase from fund share transactions | | | | | | | | |
Investor Shares | | | 2,460,966 | | | | 23,880 | |
Institutional Shares | | | 4,765,974 | | | | 42,471 | |
Advisor Shares | | | 6,938,374 | | | | 62,753 | |
Redemption Fee | | | | | | | | |
Investor Shares | | | - | | | | - | |
Institutional Shares | | | - | | | | 1 | |
Advisor Shares | | | - | | | | 1 | |
Footnotes are presented on Page 135.
| | |
| 128 | | Artisan Partners Funds |
NOTES TO FINANCIAL STATEMENTS
| | | | | | | | | | | | | | | | |
| | | EMERGING MARKETS | |
| | | Year Ended
9/30/2015 | | | Year Ended
9/30/2014(3) | |
| | | Shares | | | Amount | | | Shares | | | Amount | |
Proceeds from shares issued | | | | | | | | | | | | | | | | |
Investor Shares | | | 725,726 | | | $ | 8,420 | | | | 2,090,983 | | | $ | 26,121 | |
Institutional Shares | | | 192,586 | | | | 2,260 | | | | 994,491 | | | | 12,292 | |
Net asset value of shares issued in reinvestment of dividends and distributions | | | | | | | | | | | | | | | | |
Investor Shares | | | 26,044 | | | | 323 | | | | 67,766 | | | | 858 | |
Institutional Shares | | | 246,662 | | | | 3,036 | | | | 344,914 | | | | 4,349 | |
Cost of shares redeemed(2) | | | | | | | | | | | | | | | | |
Investor Shares | | | (3,793,631 | ) | | | (46,053 | ) | | | (13,039,229 | ) | | | (165,880 | ) |
Institutional Shares | | | (24,604,592 | ) | | | (299,356 | ) | | | (11,878,205 | ) | | | (146,888 | ) |
Net decrease from fund share transactions | | | | | | | | | | | | | | | | |
Investor Shares | | | (3,041,861 | ) | | | (37,310 | ) | | | (10,880,480 | ) | | | (138,901 | ) |
Institutional Shares | | | (24,165,344 | ) | | | (294,060 | ) | | | (10,538,800 | ) | | | (130,247 | ) |
Redemption Fee | | | | | | | | | | | | | | | | |
Investor Shares | | | - | | | | 1 | | | | - | | | | 9 | |
Institutional Shares | | | - | | | | 1 | | | | - | | | | 24 | |
| |
| | | GLOBAL EQUITY | |
| | | Year Ended
9/30/2015 | | | Year Ended
9/30/2014 | |
| | | Shares | | | Amount | | | Shares | | | Amount | |
Proceeds from shares issued | | | | | | | | | | | | | | | | |
Investor Shares | | | 5,990,024 | | | $ | 103,286 | | | | 6,864,248 | | | $ | 110,666 | |
Net asset value of shares issued in reinvestment of dividends and distributions | | | | | | | | | | | | | | | | |
Investor Shares | | | 426,772 | | | | 6,888 | | | | 485,266 | | | | 7,468 | |
Cost of shares redeemed(2) | | | | | | | | | | | | | | | | |
Investor Shares | | | (2,177,979 | ) | | | (36,225 | ) | | | (2,680,996 | ) | | | (43,325 | ) |
Net increase from fund share transactions | | | | | | | | | | | | | | | | |
Investor Shares | | | 4,238,817 | | | | 73,949 | | | | 4,668,518 | | | | 74,809 | |
Redemption Fee | | | | | | | | | | | | | | | | |
Investor Shares | | | - | | | | 15 | | | | - | | | | 41 | |
Footnotes are presented on Page 135.
| | |
| Artisan Partners Funds | | 129 |
NOTES TO FINANCIAL STATEMENTS
| | | | | | | | | | | | | | | | |
| | | GLOBAL OPPORTUNITIES | |
| | | Year Ended
9/30/2015 | | | Year Ended
9/30/2014 | |
| | | Shares | | | Amount | | | Shares | | | Amount | |
Proceeds from shares issued | | | | | | | | | | | | | | | | |
Investor Shares | | | 11,483,092 | | | $ | 222,023 | | | | 15,513,993 | | | $ | 284,419 | |
Institutional Shares | | | 15,093,830 | | | | 291,773 | | | | 11,119,747 | | | | 204,278 | |
Advisor Shares(4) | | | 3,060,198 | | | | 60,686 | | | | | | | | | |
Net asset value of shares issued in reinvestment of dividends and distributions | | | | | | | | | | | | | | | | |
Investor Shares | | | 870,398 | | | | 16,233 | | | | - | | | | - | |
Institutional Shares | | | 663,613 | | | | 12,423 | | | | - | | | | - | |
Cost of shares redeemed(2) | | | | | | | | | | | | | | | | |
Investor Shares | | | (14,131,841 | ) | | | (268,712 | ) | | | (8,601,254 | ) | | | (157,661 | ) |
Institutional Shares | | | (4,405,311 | ) | | | (85,275 | ) | | | (457,683 | ) | | | (8,648 | ) |
Advisor Shares(4) | | | (111,184 | ) | | | (2,080 | ) | | | | | | | | |
Net increase (decrease) from fund share transactions | | | | | | | | | | | | | | | | |
Investor Shares | | | (1,778,351 | ) | | | (30,456 | ) | | | 6,912,739 | | | | 126,758 | |
Institutional Shares | | | 11,352,132 | | | | 218,921 | | | | 10,662,064 | | | | 195,630 | |
Advisor Shares(4) | | | 2,949,014 | | | | 58,606 | | | | | | | | | |
Redemption Fee | | | | | | | | | | | | | | | | |
Investor Shares | | | - | | | | 47 | | | | - | | | | 76 | |
Institutional Shares | | | - | | | | 37 | | | | - | | | | 37 | |
Advisor Shares(4) | | | - | | | | 1 | | | | | | | | | |
| |
| | | GLOBAL SMALL CAP | |
| | | Year Ended
9/30/2015 | | | Year Ended
9/30/2014 | |
| | | Shares | | | Amount | | | Shares | | | Amount | |
Proceeds from shares issued | | | | | | | | | | | | | | | | |
Investor Shares | | | 3,486,318 | | | $ | 39,736 | | | | 13,020,988 | | | $ | 155,869 | |
Net asset value of shares issued in reinvestment of dividends and distributions | | | | | | | | | | | | | | | | |
Investor Shares | | | 207,315 | | | | 2,258 | | | | 11,178 | | | | 123 | |
Cost of shares redeemed(2) | | | | | | | | | | | | | | | | |
Investor Shares | | | (6,469,894 | ) | | | (70,159 | ) | | | (1,751,458 | ) | | | (20,812 | ) |
Net increase (decrease) from fund share transactions | | | | | | | | | | | | | | | | |
Investor Shares | | | (2,776,261 | ) | | | (28,165 | ) | | | 11,280,708 | | | | 135,180 | |
Redemption Fee | | | | | | | | | | | | | | | | |
Investor Shares | | | - | | | | 23 | | | | - | | | | 19 | |
Footnotes are presented on Page 135.
| | |
| 130 | | Artisan Partners Funds |
NOTES TO FINANCIAL STATEMENTS
| | | | | | | | | | | | | | | | |
| | | GLOBAL VALUE | |
| | | Year Ended
9/30/2015 | | | Year Ended
9/30/2014 | |
| | | Shares | | | Amount | | | Shares | | | Amount | |
Proceeds from shares issued | | | | | | | | | | | | | | | | |
Investor Shares | | | 13,065,129 | | | $ | 203,547 | | | | 46,332,675 | | | $ | 705,527 | |
Institutional Shares | | | 6,841,958 | | | | 107,154 | | | | 15,616,060 | | | | 240,343 | |
Advisor Shares(4) | | | 15,119,397 | | | | 239,218 | | | | | | | | | |
Net asset value of shares issued in reinvestment of dividends and distributions | | | | | | | | | | | | | | | | |
Investor Shares | | | 2,495,215 | | | | 38,676 | | | | 1,261,422 | | | | 18,720 | |
Institutional Shares | | | 1,142,541 | | | | 17,709 | | | | 662,757 | | | | 9,835 | |
Cost of shares redeemed(2) | | | | | | | | | | | | | | | | |
Investor Shares | | | (42,080,729 | ) | | | (660,169 | ) | | | (18,148,152 | ) | | | (281,898 | ) |
Institutional Shares | | | (8,334,147 | ) | | | (127,347 | ) | | | (5,592,616 | ) | | | (84,524 | ) |
Advisor Shares(4) | | | (2,288,054 | ) | | | (35,332 | ) | | | | | | | | |
Net increase (decrease) from fund share transactions | | | | | | | | | | | | | | | | |
Investor Shares | | | (26,520,385 | ) | | | (417,946 | ) | | | 29,445,945 | | | | 442,349 | |
Institutional Shares | | | (349,648 | ) | | | (2,484 | ) | | | 10,686,201 | | | | 165,654 | |
Advisor Shares(4) | | | 12,831,343 | | | | 203,886 | | | | | | | | | |
Redemption Fee | | | | | | | | | | | | | | | | |
Investor Shares | | | - | | | | 22 | | | | - | | | | 170 | |
Institutional Shares | | | - | | | | 10 | | | | - | | | | 69 | |
Advisor Shares(4) | | | - | | | | 1 | | | | | | | | | |
| |
| | | HIGH INCOME | |
| | | Year Ended
9/30/2015 | | | Period Ended
9/30/2014(5) | |
| | | Shares | | | Amount | | | Shares | | | Amount | |
Proceeds from shares issued | | | | | | | | | | | | | | | | |
Investor Shares | | | 36,305,325 | | | $ | 357,528 | | | | 28,784,054 | | | $ | 289,469 | |
Advisor Shares | | | 34,913,905 | | | | 340,359 | | | | 24,356,075 | | | | 245,301 | |
Net asset value of shares issued in reinvestment of dividends and distributions | | | | | | | | | | | | | | | | |
Investor Shares | | | 2,462,806 | | | | 24,265 | | | | 426,571 | | | | 4,295 | |
Advisor Shares | | | 1,718,353 | | | | 16,903 | | | | 347,182 | | | | 3,494 | |
Cost of shares redeemed(2) | | | | | | | | | | | | | | | | |
Investor Shares | | | (21,933,691 | ) | | | (214,101 | ) | | | (1,283,898 | ) | | | (12,808 | ) |
Advisor Shares | | | (7,881,274 | ) | | | (77,616 | ) | | | (1,866,099 | ) | | | (18,587 | ) |
Net increase from fund share transactions | | | | | | | | | | | | | | | | |
Investor Shares | | | 16,834,440 | | | | 167,692 | | | | 27,926,727 | | | | 280,956 | |
Advisor Shares | | | 28,750,984 | | | | 279,646 | | | | 22,837,158 | | | | 230,208 | |
Redemption Fee | | | | | | | | | | | | | | | | |
Investor Shares | | | - | | | | 55 | | | | - | | | | 147 | |
Advisor Shares | | | - | | | | 37 | | | | - | | | | 138 | |
Footnotes are presented on Page 135.
| | |
| Artisan Partners Funds | | 131 |
NOTES TO FINANCIAL STATEMENTS
| | | | | | | | | | | | | | | | |
| | | INTERNATIONAL | |
| | | Year Ended
9/30/2015 | | | Year Ended
9/30/2014 | |
| | | Shares | | | Amount | | | Shares | | | Amount | |
Proceeds from shares issued | | | | | | | | | | | | | | | | |
Investor Shares | | | 147,055,771 | | | $ | 4,507,517 | | | | 172,830,197 | | | $ | 5,193,412 | |
Institutional Shares | | | 77,326,034 | | | | 2,444,786 | | | | 31,933,961 | | | | 974,844 | |
Advisor Shares(4) | | | 96,826,212 | | | | 2,962,302 | | | | | | | | | |
Net asset value of shares issued in reinvestment of dividends and distributions | | | | | | | | | | | | | | | | |
Investor Shares | | | 2,544,638 | | | | 77,510 | | | | 2,776,776 | | | | 81,887 | |
Institutional Shares | | | 1,100,365 | | | | 33,727 | | | | 1,387,270 | | | | 41,146 | |
Advisor Shares(4) | | | - | | | | - | | | | | | | | | |
Cost of shares redeemed(2) | | | | | | | | | | | | | | | | |
Investor Shares | | | (226,093,060 | ) | | | (6,957,199 | ) | | | (65,605,440 | ) | | | (1,979,559 | ) |
Institutional Shares | | | (25,232,697 | ) | | | (764,161 | ) | | | (28,044,503 | ) | | | (857,249 | ) |
Advisor Shares(4) | | | (5,539,992 | ) | | | (161,570 | ) | | | | | | | | |
Net increase (decrease) from fund share transactions | | | | | | | | | | | | | | | | |
Investor Shares | | | (76,492,651 | ) | | | (2,372,172 | ) | | | 110,001,533 | | | | 3,295,740 | |
Institutional Shares | | | 53,193,702 | | | | 1,714,352 | | | | 5,276,728 | | | | 158,741 | |
Advisor Shares(4) | | | 91,286,220 | | | | 2,800,732 | | | | | | | | | |
Redemption Fee | | | | | | | | | | | | | | | | |
Investor Shares | | | - | | | | 632 | | | | - | | | | 565 | |
Institutional Shares | | | - | | | | 221 | | | | - | | | | 185 | |
Advisor Shares(4) | | | - | | | | 48 | | | | | | | | | |
| |
| | | INTERNATIONAL SMALL CAP | |
| | | Year Ended
9/30/2015 | | | Year Ended
9/30/2014 | |
| | | Shares | | | Amount | | | Shares | | | Amount | |
Proceeds from shares issued | | | | | | | | | | | | | | | | |
Investor Shares | | | 9,139,826 | | | $ | 216,914 | | | | 13,167,082 | | | $ | 354,804 | |
Net asset value of shares issued in reinvestment of dividends and distributions | | | | | | | | | | | | | | | | |
Investor Shares | | | 2,307,280 | | | | 52,352 | | | | 2,422,159 | | | | 61,717 | |
Cost of shares redeemed(2) | | | | | | | | | | | | | | | | |
Investor Shares | | | (15,184,996 | ) | | | (358,411 | ) | | | (8,468,727 | ) | | | (225,103 | ) |
Net increase (decrease) from fund share transactions | | | | | | | | | | | | | | | | |
Investor Shares | | | (3,737,890 | ) | | | (89,145 | ) | | | 7,120,514 | | | | 191,418 | |
Redemption Fee | | | | | | | | | | | | | | | | |
Investor Shares | | | - | | | | 100 | | | | - | | | | 30 | |
Footnotes are presented on Page 135.
| | |
| 132 | | Artisan Partners Funds |
NOTES TO FINANCIAL STATEMENTS
| | | | | | | | | | | | | | | | |
| | | INTERNATIONAL VALUE | |
| | | Year Ended
9/30/2015 | | | Year Ended
9/30/2014 | |
| | | Shares | | | Amount | | | Shares | | | Amount | |
Proceeds from shares issued | | | | | | | | | | | | | | | | |
Investor Shares | | | 31,255,164 | | | $ | 1,094,030 | | | | 48,279,252 | | | $ | 1,788,517 | |
Institutional Shares | | | 13,743,888 | | | | 488,598 | | | | 13,233,553 | | | | 490,586 | |
Advisor Shares(4) | | | 88,342,651 | | | | 3,201,754 | | | | | | | | | |
Net asset value of shares issued in reinvestment of dividends and distributions | | | | | | | | | | | | | | | | |
Investor Shares | | | 12,755,664 | | | | 439,815 | | | | 13,168,838 | | | | 468,812 | |
Institutional Shares | | | 4,718,738 | | | | 163,127 | | | | 4,702,044 | | | | 167,768 | |
Advisor Shares(4) | | | - | | | | - | | | | | | | | | |
Cost of shares redeemed(2) | | | | | | | | | | | | | | | | |
Investor Shares | | | (128,639,622 | ) | | | (4,610,540 | ) | | | (36,953,384 | ) | | | (1,376,242 | ) |
Institutional Shares | | | (5,839,111 | ) | | | (206,519 | ) | | | (12,766,282 | ) | | | (476,690 | ) |
Advisor Shares(4) | | | (3,141,780 | ) | | | (110,601 | ) | | | | | | | | |
Net increase (decrease) from fund share transactions | | | | | | | | | | | | | | | | |
Investor Shares | | | (84,628,794 | ) | | | (3,076,695 | ) | | | 24,494,706 | | | | 881,087 | |
Institutional Shares | | | 12,623,515 | | | | 445,206 | | | | 5,169,315 | | | | 181,664 | |
Advisor Shares(4) | | | 85,200,871 | | | | 3,091,153 | | | | | | | | | |
Redemption Fee | | | | | | | | | | | | | | | | |
Investor Shares | | | - | | | | 258 | | | | - | | | | 305 | |
Institutional Shares | | | - | | | | 84 | | | | - | | | | 86 | |
Advisor Shares(4) | | | - | | | | 17 | | | | | | | | | |
| |
| | | MID CAP | |
| | | Year Ended
9/30/2015 | | | Year Ended
9/30/2014 | |
| | | Shares | | | Amount | | | Shares | | | Amount | |
Proceeds from shares issued | | | | | | | | | | | | | | | | |
Investor Shares | | | 15,426,811 | | | $ | 725,344 | | | | 25,145,236 | | | $ | 1,211,460 | |
Institutional Shares | | | 22,831,337 | | | | 1,139,342 | | | | 25,449,982 | | | | 1,278,426 | |
Advisor Shares(4) | | | 10,165,671 | | | | 477,696 | | | | | | | | | |
Net asset value of shares issued in reinvestment of dividends and distributions | | | | | | | | | | | | | | | | |
Investor Shares | | | 11,374,388 | | | | 516,511 | | | | 9,388,265 | | | | 429,325 | |
Institutional Shares | | | 7,427,509 | | | | 355,555 | | | | 4,662,566 | | | | 223,057 | |
Cost of shares redeemed(2) | | | | | | | | | | | | | | | | |
Investor Shares | | | (48,310,957 | ) | | | (2,268,772 | ) | | | (38,479,395 | ) | | | (1,839,289 | ) |
Institutional Shares | | | (20,378,837 | ) | | | (999,829 | ) | | | (14,443,759 | ) | | | (721,622 | ) |
Advisor Shares(4) | | | (456,359 | ) | | | (21,553 | ) | | | | | | | | |
Net increase (decrease) from fund share transactions | | | | | | | | | | | | | | | | |
Investor Shares | | | (21,509,758 | ) | | | (1,026,917 | ) | | | (3,945,894 | ) | | | (198,504 | ) |
Institutional Shares | | | 9,880,009 | | | | 495,068 | | | | 15,668,789 | | | | 779,861 | |
Advisor Shares(4) | | | 9,709,312 | | | | 456,143 | | | | | | | | | |
Footnotes are presented on Page 135.
| | |
| Artisan Partners Funds | | 133 |
NOTES TO FINANCIAL STATEMENTS
| | | | | | | | | | | | | | | | |
| | | MID CAP VALUE | |
| | | Year Ended
9/30/2015 | | | Year Ended
9/30/2014 | |
| | | Shares | | | Amount | | | Shares | | | Amount | |
Proceeds from shares issued | | | | | | | | | | | | | | | | |
Investor Shares | | | 31,813,156 | | | $ | 793,122 | | | | 65,185,071 | | | $ | 1,761,179 | |
Institutional Shares | | | 12,667,895 | | | | 316,894 | | | | 20,369,732 | | | | 552,567 | |
Advisor Shares(4) | | | 45,158,916 | | | | 1,089,164 | | | | | | | | | |
Net asset value of shares issued in reinvestment of dividends and distributions | | | | | | | | | | | | | | | | |
Investor Shares | | | 34,608,529 | | | | 856,326 | | | | 15,817,357 | | | | 417,104 | |
Institutional Shares | | | 6,672,374 | | | | 165,029 | | | | 2,374,000 | | | | 62,602 | |
Cost of shares redeemed | | | | | | | | | | | | | | | | |
Investor Shares | | | (215,480,203 | ) | | | (5,321,117 | ) | | | (94,345,667 | ) | | | (2,565,756 | ) |
Institutional Shares | | | (26,713,793 | ) | | | (662,487 | ) | | | (11,604,357 | ) | | | (317,171 | ) |
Advisor Shares(4) | | | (2,955,122 | ) | | | (69,518 | ) | | | | | | | | |
Net increase (decrease) from fund share transactions | | | | | | | | | | | | | | | | |
Investor Shares | | | (149,058,518 | ) | | | (3,671,669 | ) | | | (13,343,239 | ) | | | (387,473 | ) |
Institutional Shares | | | (7,373,524 | ) | | | (180,564 | ) | | | 11,139,375 | | | | 297,998 | |
Advisor Shares(4) | | | 42,203,794 | | | | 1,019,646 | | | | | | | | | |
| |
| | | SMALL CAP | |
| | | Year Ended
9/30/2015 | | | Year Ended
9/30/2014 | |
| | | Shares | | | Amount | | | Shares | | | Amount | |
Proceeds from shares issued | | | | | | | | | | | | | | | | |
Investor Shares | | | 7,647,814 | | | $ | 224,751 | | | | 15,199,873 | | | $ | 439,604 | |
Institutional Shares | | | 6,778,115 | | | | 212,353 | | | | 2,431,667 | | | | 69,700 | |
Cost of shares redeemed | | | | | | | | | | | | | | | | |
Investor Shares | | | (23,445,692 | ) | | | (712,457 | ) | | | (17,260,935 | ) | | | (483,655 | ) |
Institutional Shares | | | (1,689,913 | ) | | | (50,853 | ) | | | (2,065,389 | ) | | | (60,328 | ) |
Net increase (decrease) from fund share transactions | | | | | | | | | | | | | | | | |
Investor Shares | | | (15,797,878 | ) | | | (487,706 | ) | | | (2,061,062 | ) | | | (44,051 | ) |
Institutional Shares | | | 5,088,202 | | | | 161,500 | | | | 366,278 | | | | 9,372 | |
| |
| | | SMALL CAP VALUE | |
| | | Year Ended
9/30/2015 | | | Year Ended
9/30/2014 | |
| | | Shares | | | Amount | | | Shares | | | Amount | |
Proceeds from shares issued | | | | | | | | | | | | | | | | |
Investor Shares | | | 5,542,831 | | | $ | 81,276 | | | | 15,636,504 | | | $ | 288,653 | |
Institutional Shares | | | 2,913,322 | | | | 41,639 | | | | 3,549,900 | | | | 65,892 | |
Net asset value of shares issued in reinvestment of dividends and distributions | | | | | | | | | | | | | | | | |
Investor Shares | | | 14,560,067 | | | | 204,423 | | | | 4,883,076 | | | | 89,751 | |
Institutional Shares | | | 3,567,563 | | | | 50,338 | | | | 691,272 | | | | 12,719 | |
Cost of shares redeemed | | | | | | | | | | | | | | | | |
Investor Shares | | | (57,782,501 | ) | | | (834,924 | ) | | | (79,323,221 | ) | | | (1,464,478 | ) |
Institutional Shares | | | (21,658,338 | ) | | | (313,373 | ) | | | (5,195,121 | ) | | | (95,832 | ) |
Net decrease from fund share transactions | | | | | | | | | | | | | | | | |
Investor Shares | | | (37,679,603 | ) | | | (549,225 | ) | | | (58,803,641 | ) | | | (1,086,074 | ) |
Institutional Shares | | | (15,177,453 | ) | | | (221,396 | ) | | | (953,949 | ) | | | (17,221 | ) |
Footnotes are presented on Page 135.
| | |
| 134 | | Artisan Partners Funds |
NOTES TO FINANCIAL STATEMENTS
| | | | | | | | | | | | | | | | |
| | | VALUE | |
| | | Year Ended
9/30/2015 | | | Year Ended
9/30/2014 | |
| | | Shares | | | Amount | | | Shares | | | Amount | |
Proceeds from shares issued | | | | | | | | | | | | | | | | |
Investor Shares | | | 11,665,383 | | | $ | 156,568 | | | | 25,923,680 | | | $ | 361,086 | |
Institutional Shares | | | 2,476,950 | | | | 33,068 | | | | 6,611,778 | | | | 94,116 | |
Advisor Shares(4) | | | 42,917,968 | | | | 586,042 | | | | | | | | | |
Net asset value of shares issued in reinvestment of dividends and distributions | | | | | | | | | | | | | | | | |
Investor Shares | | | 6,223,025 | | | | 82,455 | | | | 4,735,743 | | | | 62,843 | |
Institutional Shares | | | 1,579,906 | | | | 20,950 | | | | 974,463 | | | | 12,941 | |
Cost of shares redeemed | | | | | | | | | | | | | | | | |
Investor Shares | | | (71,220,630 | ) | | | (963,970 | ) | | | (34,775,011 | ) | | | (475,888 | ) |
Institutional Shares | | | (9,955,117 | ) | | | (132,456 | ) | | | (4,729,262 | ) | | | (64,268 | ) |
Advisor Shares(4) | | | (2,572,805 | ) | | | (33,290 | ) | | | | | | | | |
Net increase (decrease) from fund share transactions | | | | | | | | | | | | | | | | |
Investor Shares | | | (53,332,222 | ) | | | (724,947 | ) | | | (4,115,588 | ) | | | (51,959 | ) |
Institutional Shares | | | (5,898,261 | ) | | | (78,438 | ) | | | 2,856,979 | | | | 42,789 | |
Advisor Shares(4) | | | 40,345,163 | | | | 552,752 | | | | | | | | | |
| (1) | For the period from commencement of operations (June 29, 2015) through September 30, 2015. |
| (2) | Net of redemption fees. |
| (3) | Effective February 14, 2014, the Emerging Markets Fund’s Advisor Shares were redesignated as Investor Shares. |
| (4) | For the period from commencement of operations (April 1, 2015) through September 30, 2015. |
| (5) | For the period from commencement of operations (March 19, 2014) through September 30, 2014. |
| (6) | Amount rounds to less than $1. |
The Funds have evaluated subsequent events through the date of issuance of the Funds’ financial statements and have determined there is no impact to the Funds’ financial statements.
| | |
| Artisan Partners Funds | | 135 |
Report of Independent Registered Public Accounting Firm
The Board of Directors and Shareholders of Artisan Partners Funds, Inc.
We have audited the accompanying statements of assets and liabilities, including the schedules of investments, of Artisan Partners Funds, Inc. (comprising, respectively, Artisan Developing World Fund, Artisan Emerging Markets Fund, Artisan Global Equity Fund, Artisan Global Opportunities Fund, Artisan Global Small Cap Fund, Artisan Global Value Fund, Artisan High Income Fund, Artisan International Fund, Artisan International Small Cap Fund, Artisan International Value Fund, Artisan Mid Cap Fund, Artisan Mid Cap Value Fund, Artisan Small Cap Fund, Artisan Small Cap Value Fund, and Artisan Value Fund (the “Funds”)) as of September 30, 2015, and the related statements of operations, statements of changes in net assets, and the financials highlights for each of the periods indicated therein. These financial statements and financial highlights are the responsibility of the Funds’ management. Our responsibility is to express an opinion on these financial statements and financial highlights based on our audits.
We conducted our audits in accordance with the standards of the Public Company Accounting Oversight Board (United States). Those standards require that we plan and perform the audit to obtain reasonable assurance about whether the financial statements and financial highlights are free of material misstatement. We were not engaged to perform an audit of the Funds’ internal control over financial reporting. Our audits included consideration of internal control over financial reporting as a basis for designing audit procedures that are appropriate in the circumstances, but not for the purpose of expressing an opinion on the effectiveness of the Funds’ internal control over financial reporting. Accordingly, we express no such opinion. An audit also includes examining, on a test basis, evidence supporting the amounts and disclosures in the financial statements and financial highlights, assessing the accounting principles used and significant estimates made by management, and evaluating the overall financial statement presentation. Our procedures included confirmation of securities owned as of September 30, 2015, by correspondence with the custodian, brokers, and agent banks or by other appropriate auditing procedures where replies from brokers and agent banks were not received. We believe that our audits provide a reasonable basis for our opinion.
In our opinion, the financial statements and financial highlights referred to above present fairly, in all material respects, the financial position of each of the respective portfolios of Artisan Partners Funds, Inc. at September 30, 2015, and the results of their operations, changes in their net assets, and the financial highlights for each of the periods indicated therein, in conformity with U.S. generally accepted accounting principles.

Minneapolis, Minnesota
November 20, 2015
| | |
| 136 | | Artisan Partners Funds |
NOTES TO FINANCIAL STATEMENTS
Other Federal tax information (unaudited):
The Internal Revenue Code requires that shareholders be notified of certain information regarding long-term capital gains, qualified dividend income and the dividends received deduction for corporate shareholders. This data is informational only. Every year in January, shareholders are sent a Form 1099-DIV which provides the federal tax status of dividends and distributions received during the calendar year. Shareholders are advised to consult their own tax advisor with respect to the specific tax consequences of investment in the Funds.
Each Fund hereby designates the following amounts as (i) long-term capital gain distributions for purposes of the dividends paid deduction (including earnings and profits distributed to shareholders on redemption of Fund shares, in thousands), (ii) the amount of ordinary dividends paid during the fiscal year ended September 30, 2015 that are considered qualified dividend income as defined in the Jobs and Growth Tax Relief Reconciliation Act of 2003, and (iii) the amount of ordinary dividends paid during the fiscal year ended September 30, 2015 that are eligible for the dividends received deduction available to certain corporate shareholders.
| | | | | | | | | | | | | | | |
| Fund | | Long-Term Capital Gains | | Qualified Dividend Income | | Dividends Received Deduction |
Developing World | | | | $ - | (1) | | | | n/a | | | | | n/a | |
Emerging Markets | | | | - | | | | | 100.00 | % | | | | 1.52 | % |
Global Equity | | | | 2,002 | | | | | 32.39 | % | | | | 12.34 | % |
Global Opportunities | | | | 27,395 | | | | | 100.00 | % | | | | 65.33 | % |
Global Small Cap | | | | 1,195 | | | | | 83.99 | % | | | | 8.25 | % |
Global Value | | | | 30,734 | | | | | 100.00 | % | | | | 23.74 | % |
High Income | | | | - | | | | | - | | | | | - | |
International | | | | - | | | | | 100.00 | % | | | | 0.00 | % |
International Small Cap | | | | 63,717 | | | | | 100.00 | % | | | | 0.00 | % |
International Value | | | | 601,276 | | | | | 69.46 | % | | | | 1.18 | % |
Mid Cap | | | | 1,091,416 | | | | | n/a | | | | | n/a | |
Mid Cap Value | | | | 1,198,439 | | | | | 97.91 | % | | | | 89.29 | % |
Small Cap | | | | 15,206 | | | | | n/a | | | | | n/a | |
Small Cap Value | | | | 273,754 | | | | | 52.13 | % | | | | 47.34 | % |
Value | | | | 96,560 | | | | | 50.97 | % | | | | 40.91 | % |
| (1) | For the period from commencement of operations (June 29, 2015) through September 30, 2015. |
| | |
| Artisan Partners Funds | | 137 |
SHAREHOLDER EXPENSE EXAMPLE (UNAUDITED)
As a shareholder of Artisan Partners Funds, you may incur transaction costs, including redemption fees, and you will incur ongoing costs, including management fees and other Fund expenses. This example is intended to help you understand your ongoing costs (in dollars) of investing in a Fund and to compare these costs with the ongoing costs of investing in other mutual funds.
The example is based on an investment of $1,000 invested at the beginning of the period and held for the entire period from April 1, 2015 to September 30, 2015.
Actual Expenses
The first line under the name of each Fund in the table below provides information about actual account values and actual expenses. You may use the information in this line, together with the amount you invested, to estimate the expenses that you paid over the period. Simply divide your account value by $1,000 (for example, an $8,600 account value divided by $1,000 = 8.6), then multiply the result by the number in the first line under the name of your Fund under the heading entitled “Expenses Paid During Period” to estimate the expenses you paid on your account during this period.
Hypothetical Example for Comparison Purposes
The second line under each Fund’s name in the table below provides information about hypothetical account values and hypothetical expenses based on each Fund’s actual expense ratio for the six months ended September 30, 2015 and an assumed rate of return of 5% per year before expenses, which is not the Fund’s actual return. The hypothetical account values and expenses may not be used to estimate the actual ending account balances or expenses you paid for the period. You may use this information to compare the ongoing costs of investing in each Fund and other funds. To do so, compare the 5% hypothetical example with the 5% hypothetical examples that appear in the shareholder reports of the other funds.
Please note that the expenses shown in the table are meant to highlight your ongoing costs only and do not reflect any transactional costs, such as redemption fees. Therefore, the second line of the table is useful in comparing ongoing costs only, and will not help you determine the relative costs of owning different funds. If these transactional costs were included, your costs would have been higher.
| | | | | | | | |
| | | Beginning
Account Value
4/1/2015 | | Ending
Account Value
9/30/2015 | | Expenses Paid During
Period
4/1/2015-9/30/2015(1) | | Expense
Ratio(2) |
Artisan Developing World Fund(4) | | | | | | | | |
Investor Shares(3) | | | | | | | | |
Actual | | $1,000.00 | | $ 839.00 | | $3.51 | | 1.50% |
Hypothetical (5% return before expenses) | | $1,000.00 | | $1,008.92 | | $3.84 | | 1.50% |
Institutional Shares(3) | | | | | | | | |
Actual | | $1,000.00 | | $ 839.00 | | $3.28 | | 1.40% |
Hypothetical (5% return before expenses) | | $1,000.00 | | $1,009.17 | | $3.58 | | 1.40% |
Advisor Shares(3) | | | | | | | | |
Actual | | $1,000.00 | | $ 839.00 | | $3.28 | | 1.40% |
Hypothetical (5% return before expenses) | | $1,000.00 | | $1,009.17 | | $3.58 | | 1.40% |
| | |
| 138 | | Artisan Partners Funds |
SHAREHOLDER EXPENSE EXAMPLE (UNAUDITED)
| | | | | | | | |
| | | Beginning
Account Value
4/1/2015 | | Ending
Account Value
9/30/2015 | | Expenses Paid During
Period
4/1/2015-9/30/2015(1) | | Expense
Ratio(2) |
Artisan Emerging Markets Fund | | | | | | | | |
Investor Shares(3) | | | | | | | | |
Actual | | $1,000.00 | | $ 816.20 | | $6.83 | | 1.50% |
Hypothetical (5% return before expenses) | | $1,000.00 | | $1,017.55 | | $7.59 | | 1.50% |
Institutional Shares | | | | | | | | |
Actual | | $1,000.00 | | $ 815.80 | | $7.47 | | 1.64% |
Hypothetical (5% return before expenses) | | $1,000.00 | | $1,016.85 | | $8.29 | | 1.64% |
Artisan Global Equity Fund | | | | | | | | |
Investor Shares | | | | | | | | |
Actual | | $1,000.00 | | $ 922.60 | | $6.60 | | 1.37% |
Hypothetical (5% return before expenses) | | $1,000.00 | | $1,018.20 | | $6.93 | | 1.37% |
Artisan Global Opportunities Fund | | | | | | | | |
Investor Shares | | | | | | | | |
Actual | | $1,000.00 | | $ 957.70 | | $5.84 | | 1.19% |
Hypothetical (5% return before expenses) | | $1,000.00 | | $1,019.10 | | $6.02 | | 1.19% |
Institutional Shares | | | | | | | | |
Actual | | $1,000.00 | | $ 959.00 | | $4.62 | | 0.94% |
Hypothetical (5% return before expenses) | | $1,000.00 | | $1,020.36 | | $4.76 | | 0.94% |
Advisor Shares(3)(5) | | | | | | | | |
Actual | | $1,000.00 | | $ 958.80 | | $5.37 | | 1.10% |
Hypothetical (5% return before expenses) | | $1,000.00 | | $1,019.45 | | $5.54 | | 1.10% |
Artisan Global Small Cap Fund | | | | | | | | |
Investor Shares(3) | | | | | | | | |
Actual | | $1,000.00 | | $ 947.40 | | $7.32 | | 1.50% |
Hypothetical (5% return before expenses) | | $1,000.00 | | $1,017.55 | | $7.59 | | 1.50% |
Artisan Global Value Fund | | | | | | | | |
Investor Shares | | | | | | | | |
Actual | | $1,000.00 | | $ 927.60 | | $6.23 | | 1.29% |
Hypothetical (5% return before expenses) | | $1,000.00 | | $1,018.60 | | $6.53 | | 1.29% |
Institutional Shares | | | | | | | | |
Actual | | $1,000.00 | | $ 928.30 | | $5.03 | | 1.04% |
Hypothetical (5% return before expenses) | | $1,000.00 | | $1,019.85 | | $5.27 | | 1.04% |
Advisor Shares(3)(5) | | | | | | | | |
Actual | | $1,000.00 | | $ 928.20 | | $5.77 | | 1.20% |
Hypothetical (5% return before expenses) | | $1,000.00 | | $1,018.95 | | $6.04 | | 1.20% |
| | |
| Artisan Partners Funds | | 139 |
SHAREHOLDER EXPENSE EXAMPLE (UNAUDITED)
| | | | | | | | |
| | | Beginning
Account Value
4/1/2015 | | Ending
Account Value
9/30/2015 | | Expenses Paid During
Period
4/1/2015-9/30/2015(1) | | Expense
Ratio(2) |
Artisan High Income Fund | | | | | | | | |
Investor Shares | | | | | | | | |
Actual | | $1,000.00 | | $ 986.80 | | $5.68 | | 1.14% |
Hypothetical (5% return before expenses) | | $1,000.00 | | $1,019.35 | | $5.77 | | 1.14% |
Advisor Shares | | | | | | | | |
Actual | | $1,000.00 | | $ 987.70 | | $4.78 | | 0.96% |
Hypothetical (5% return before expenses) | | $1,000.00 | | $1,020.26 | | $4.86 | | 0.96% |
Artisan International Fund | | | | | | | | |
Investor Shares | | | | | | | | |
Actual | | $1,000.00 | | $ 863.00 | | $5.56 | | 1.19% |
Hypothetical (5% return before expenses) | | $1,000.00 | | $1,019.10 | | $6.02 | | 1.19% |
Institutional Shares | | | | | | | | |
Actual | | $1,000.00 | | $ 864.30 | | $4.49 | | 0.96% |
Hypothetical (5% return before expenses) | | $1,000.00 | | $1,020.26 | | $4.86 | | 0.96% |
Advisor Shares(3)(5) | | | | | | | | |
Actual | | $1,000.00 | | $ 864.00 | | $5.00 | | 1.07% |
Hypothetical (5% return before expenses) | | $1,000.00 | | $1,019.60 | | $5.39 | | 1.07% |
Artisan International Small Cap Fund | | | | | | | | |
Investor Shares | | | | | | | | |
Actual | | $1,000.00 | | $ 987.30 | | $7.52 | | 1.51% |
Hypothetical (5% return before expenses) | | $1,000.00 | | $1,017.50 | | $7.64 | | 1.51% |
Artisan International Value Fund | | | | | | | | |
Investor Shares | | | | | | | | |
Actual | | $1,000.00 | | $ 917.80 | | $5.72 | | 1.19% |
Hypothetical (5% return before expenses) | | $1,000.00 | | $1,019.10 | | $6.02 | | 1.19% |
Institutional Shares | | | | | | | | |
Actual | | $1,000.00 | | $ 919.00 | | $4.62 | | 0.96% |
Hypothetical (5% return before expenses) | | $1,000.00 | | $1,020.26 | | $4.86 | | 0.96% |
Advisor Shares(3)(5) | | | | | | | | |
Actual | | $1,000.00 | | $ 919.00 | | $5.07 | | 1.06% |
Hypothetical (5% return before expenses) | | $1,000.00 | | $1,019.65 | | $5.34 | | 1.06% |
Artisan Mid Cap Fund | | | | | | | | |
Investor Shares | | | | | | | | |
Actual | | $1,000.00 | | $ 947.50 | | $5.81 | | 1.19% |
Hypothetical (5% return before expenses) | | $1,000.00 | | $1,019.10 | | $6.02 | | 1.19% |
Institutional Shares | | | | | | | | |
Actual | | $1,000.00 | | $ 948.80 | | $4.64 | | 0.95% |
Hypothetical (5% return before expenses) | | $1,000.00 | | $1,020.31 | | $4.81 | | 0.95% |
Advisor Shares(3)(5) | | | | | | | | |
Actual | | $1,000.00 | | $ 948.40 | | $5.34 | | 1.10% |
Hypothetical (5% return before expenses) | | $1,000.00 | | $1,019.45 | | $5.54 | | 1.10% |
| | |
| 140 | | Artisan Partners Funds |
SHAREHOLDER EXPENSE EXAMPLE (UNAUDITED)
| | | | | | | | |
| | | Beginning
Account Value
4/1/2015 | | Ending
Account Value
9/30/2015 | | Expenses Paid During
Period
4/1/2015-9/30/2015(1) | | Expense
Ratio(2) |
Artisan Mid Cap Value Fund | | | | | | | | |
Investor Shares | | | | | | | | |
Actual | | $1,000.00 | | $ 884.60 | | $ - | | 1.17% |
Hypothetical (5% return before expenses) | | $1,000.00 | | $1,019.20 | | $5.92 | | 1.17% |
Institutional Shares | | | | | | | | |
Actual | | $1,000.00 | | $ 885.70 | | $ - | | 0.96% |
Hypothetical (5% return before expenses) | | $1,000.00 | | $1,020.26 | | $4.86 | | 0.96% |
Advisor Shares(3)(5) | | | | | | | | |
Actual | | $1,000.00 | | $ 885.00 | | $ - | | 1.09% |
Hypothetical (5% return before expenses) | | $1,000.00 | | $1,019.50 | | $5.49 | | 1.09% |
Artisan Small Cap Fund | | | | | | | | |
Investor Shares | | | | | | | | |
Actual | | $1,000.00 | | $ 953.90 | | $6.07 | | 1.24% |
Hypothetical (5% return before expenses) | | $1,000.00 | | $1,018.85 | | $6.28 | | 1.24% |
Institutional Shares | | | | | | | | |
Actual | | $1,000.00 | | $ 955.10 | | $5.05 | | 1.03% |
Hypothetical (5% return before expenses) | | $1,000.00 | | $1,019.90 | | $5.22 | | 1.03% |
Artisan Small Cap Value Fund | | | | | | | | |
Investor Shares | | | | | | | | |
Actual | | $1,000.00 | | $ 876.30 | | $5.83 | | 1.24% |
Hypothetical (5% return before expenses) | | $1,000.00 | | $1,018.85 | | $6.28 | | 1.24% |
Institutional Shares | | | | | | | | |
Actual | | $1,000.00 | | $ 877.00 | | $5.13 | | 1.09% |
Hypothetical (5% return before expenses) | | $1,000.00 | | $1,019.60 | | $5.52 | | 1.09% |
Artisan Value Fund | | | | | | | | |
Investor Shares | | | | | | | | |
Actual | | $1,000.00 | | $ 862.00 | | $4.90 | | 1.05% |
Hypothetical (5% return before expenses) | | $1,000.00 | | $1,019.80 | | $5.32 | | 1.05% |
Institutional Shares | | | | | | | | |
Actual | | $1,000.00 | | $ 863.70 | | $3.60 | | 0.77% |
Hypothetical (5% return before expenses) | | $1,000.00 | | $1,021.21 | | $3.90 | | 0.77% |
Advisor Shares(5) | | | | | | | | |
Actual | | $1,000.00 | | $ 862.80 | | $3.99 | | 0.86% |
Hypothetical (5% return before expenses) | | $1,000.00 | | $1,020.64 | | $4.33 | | 0.86% |
| (1) | Expenses are equal to the Fund’s ratio of expenses to average net assets for the six month period ended September 30, 2015, multiplied by the average account value over the period, multiplied by 183/365 (to reflect the one-half year period). |
| (2) | Annualized ratio of expenses to average net assets for the six-month period ended September 30, 2015. |
| (3) | The annualized ratio of expenses to average net assets excludes expenses waived or paid by the Adviser. |
| | |
| Artisan Partners Funds | | 141 |
SHAREHOLDER EXPENSE EXAMPLE (UNAUDITED)
| (4) | The account value and the expenses paid for Developing World Fund have been presented for the period from commencement of operations (June 29, 2015) through September 30, 2015. Assuming a six-month period, the account values as of September 30, 2015 and the expenses paid during the period 4/1/2015-9/30/2015 would have been as follows: |
| | | | | | |
| | | Beginning
Account Value
4/1/2015 | | Ending
Account Value
9/30/2015 | | Expenses Paid During
Period
4/1/2015-9/30/2015 |
Artisan Developing World Fund | | | | | | |
Investor Shares | | | | | | |
Actual | | $1,000.00 | | $ 839.00 | | $6.92 |
Hypothetical (5% return before expenses) | | $1,000.00 | | $1,017.55 | | $7.55 |
Institutional Shares | | | | | | |
Actual | | $1,000.00 | | $ 839.00 | | $6.45 |
Hypothetical (5% return before expenses) | | $1,000.00 | | $1,018.05 | | $7.05 |
Advisor Shares | | | | | | |
Actual | | $1,000.00 | | $ 839.00 | | $6.45 |
Hypothetical (5% return before expenses) | | $1,000.00 | | $1,018.05 | | $7.05 |
| (5) | For the period from commencement of operations (April 1, 2015) through September 30, 2015. |
| | |
| 142 | | Artisan Partners Funds |
FACTORS CONSIDERED IN RENEWING THE FUNDS’ ADVISORY AGREEMENTS
Artisan Partners is responsible for management of the Funds’ investment portfolios and for overall management of the Funds’ business and affairs pursuant to an investment advisory agreement (the “Advisory Agreement”) between Artisan Partners Funds, on behalf of each Fund, and Artisan Partners. With respect to each Fund, the Advisory Agreement, after an initial two-year term, may be continued from year to year only so long as the continuance is approved annually (a) by the vote of a majority of the directors of Artisan Partners Funds who are not “interested persons” of Artisan Partners Funds or Artisan Partners (the “independent directors”) cast in person at a meeting called for the purpose of voting on such approval, and (b) by the board of directors or by the vote of a majority (as defined in the 1940 Act) of the outstanding shares of the Fund.
The directors of Artisan Partners Funds held a special meeting of the board on April 28, 2015 (the “Special Meeting”) at which meeting they gave preliminary consideration to information bearing on the continuation of the Advisory Agreement with respect to the Funds other than Developing World Fund (the “Current Funds”) for the period from July 1, 2015 through June 30, 2016 and the approval of the Advisory Agreement with respect to Developing World Fund for an initial two-year term from May 12, 2015 through May 12, 2017. The primary purpose of the Special Meeting was to allow the directors ample opportunity to consider matters they deemed relevant in considering the approval of the Advisory Agreement, and to request any additional information they considered reasonably necessary to their deliberations, without undue time constraints. The board of directors, including the independent directors, considered and unanimously approved the Advisory Agreement with respect to all Funds at a meeting held on May 12, 2015 (the “May 12 Meeting”) in a restated form that did not alter any of the substantive provisions, but modified the structure of the agreement to facilitate the addition of future newly organized Funds. The independent directors were assisted in their evaluation of the Advisory Agreement and the factors that they deemed to be material, including those factors described below, by independent legal counsel, from whom they received separate legal advice and with whom they met separately from Artisan Partners in connection with the contract review meetings.
Prior to the Special Meeting, independent counsel to the independent directors sent to Artisan Partners requests for information to be provided to the directors in connection with their consideration of the Advisory Agreement. Artisan Partners provided materials to the directors in response to those requests, other information Artisan Partners believed was useful in evaluating the approval of Advisory Agreement and extensive reports prepared by Lipper Inc. (“Lipper”), an independent source of investment company data. The Lipper reports included information relating to each Current Fund’s performance and expenses compared to the performance and expenses of a relatively small peer group and a larger peer universe of funds determined by Lipper to be comparable, as well as relating to Developing World Fund’s proposed management fees and projected expenses compared to the management fees and expenses of a peer group of other mutual funds determined by Lipper to be comparable to Developing World Fund. Artisan Partners also provided additional reports prepared by Lipper comparing certain of the Funds’ performance and expenses to peer groups and peer universes with a different style classification that Artisan Partners believed was more appropriate for comparative purposes than the style classification originally selected by Lipper. These supplemental reports were provided for Global Equity Fund, Global Value Fund, International Fund, International Value Fund,
| | |
| Artisan Partners Funds | | 143 |
FACTORS CONSIDERED IN RENEWING THE FUNDS’ ADVISORY AGREEMENTS
Mid Cap Fund, Mid Cap Value Fund and Value Fund. The directors also received and reviewed a memorandum from their independent counsel regarding the directors’ responsibilities in evaluating the Advisory Agreement. The directors recognized that the management and fee arrangements for the Current Funds are the result of years of review and discussion between the independent directors and Artisan Partners, that certain aspects of such arrangements may receive greater scrutiny in some years than in others and that the directors’ conclusions may be based, in part, on their consideration of these same arrangements and information received during the course of the year and in prior years.
In evaluating the Advisory Agreement, the directors reviewed the available information and discussed with representatives of Artisan Partners each Current Fund’s operations; the nature, extent and quality of the advisory and other services provided by Artisan Partners to the Current Funds and proposed to be provided to Developing World Fund; the overall expense ratios of each class of shares of the Current Funds and the anticipated overall expense ratio of Developing World Fund; economies of scale or, with respect to Developing World Fund, the prospect thereof; and other benefits (in addition to advisory fee revenues) derived or potentially derived by Artisan Partners from its relationship with the Funds. In addition to the third-party reports by Lipper and the memorandum from independent counsel, the directors reviewed information provided prior to and presented at the Special Meeting and the May 12 Meeting, concerning, among other things, the following:
| • | | Artisan Partners’ organization and operations, financial condition and stability and ownership structure; |
| • | | Artisan Partners’ personnel and methods, including Artisan Partners’ assessment of its ability to attract and retain capable personnel; Artisan Partners’ research and decision-making processes; the adequacy and sophistication of technology and systems with respect to investment and administrative matters; and Artisan Partners’ ability to provide investment management and back-office services to fixed-income funds; |
| • | | The terms of the Advisory Agreement, including a list of services performed by Artisan Partners; and how the services performed by Artisan Partners under the Advisory Agreement differ from those performed for other investment companies and accounts; |
| • | | Each Current Fund’s short- and long-term investment performance (including past 1-, 3-, 5- and 10-year and since-inception periods, as applicable), including comparisons for various time periods with (a) other Artisan Partners client accounts managed with similar investment objectives, (b) other mutual funds having similar investment objectives and (c) appropriate market indices; and information regarding the investment performance achieved by Developing World Fund’s proposed portfolio manager in managing mutual funds or other accounts prior to his affiliation with Artisan Partners; |
| • | | The Funds’ experience applying valuation procedures, including fair valuation policies and procedures, and any anticipated or proposed changes to the procedures; |
| • | | Any litigation pending, threatened or settled involving Artisan Partners, and the results of any audits, investigations or examinations of the Securities and Exchange Commission or other governmental or regulatory authorities; |
| | |
| 144 | | Artisan Partners Funds |
FACTORS CONSIDERED IN RENEWING THE FUNDS’ ADVISORY AGREEMENTS
| • | | Information regarding fee arrangements, including a comparison of the Current Funds’ total expenses and the total expense ratio of each share class of each Current Fund with other mutual funds, and a comparison of Developing World Fund’s estimated expense ratio of each share class of the Fund with other mutual funds (with respect to each Fund, accounting for factors such as, without limitation, size, account-level charges and investment objective); the structure of the advisory fees or, with respect to Developing World Fund, the proposed advisory fees, including the method of computing fees and the frequency of payment of fees; and a comparison of the advisory fees with fees charged by other advisory organizations for managing similar mutual funds; |
| • | | Artisan Partners’ assessment of whether it is realizing economies of scale in providing services to the Funds and, if so, whether, how and, if quantifiable, to what extent the economies of scale are shared with the Funds, and the adequacy of existing breakpoints in advisory fees and whether further breakpoints are appropriate; |
| • | | A comparison of the Current Funds’ existing and, with respect to Developing World Fund, proposed advisory fees with fees charged by Artisan Partners for managing other mutual funds and other accounts; |
| • | | Information regarding other expenses for the Current Funds and estimated other expenses for Developing World Fund; |
| • | | Information on amounts paid to financial intermediaries during the year ended December 31, 2014 by any of the Current Funds, Artisan Partners or any affiliate of Artisan Partners; |
| • | | Potential “fall-out” benefits to Artisan Partners or its affiliates from their relationship with the Funds, in addition to advisory fees, including any float income received by Artisan Partners or its affiliates on Fund share purchase and redemption amounts, benefits to Artisan Partners or its affiliates in selling other products and any other fall-out benefits to Artisan Partners or its affiliates from their relationships with the Funds; and the method of estimating the value of any such benefits; |
| • | | Matters relating to brokerage and portfolio transactions, including Artisan Partners’ practices regarding selection of brokers and dealers to execute portfolio transactions and regarding negotiation of commission rates and allocation of brokerage for research and other services; |
| • | | The profitability to Artisan Partners of its relationship with each Current Fund, including unaudited financial statements showing Artisan Partners’ revenue, expenses and profits in providing services to the Current Funds on a Fund-by-Fund basis for the three most recent 12-month periods; the assumptions and allocation methodologies utilized for such profitability analysis and changes to such methodologies over the past year; Artisan Partners’ profit margins; comparisons with Artisan Partners’ profit margins on other accounts managed by Artisan Partners; and, with respect to Developing World Fund, projections of Artisan Partners’ costs and profit arising from the Advisory Agreement; |
| • | | Potential for conflicts of interest between the Funds and Artisan Partners and circumstances and actions addressing or bearing on potential conflicts of interest; and |
| | |
| Artisan Partners Funds | | 145 |
FACTORS CONSIDERED IN RENEWING THE FUNDS’ ADVISORY AGREEMENTS
| • | | Compliance and related matters, including Artisan Partners’ programs for monitoring compliance with federal and state securities and other applicable laws and regulations, the investment policies and restrictions of registered investment company clients and Subchapter M of the Internal Revenue Code; and information regarding personnel who perform significant compliance and legal services for the Funds. |
Following the Special Meeting and executive sessions with their independent counsel, the independent directors requested certain follow-up information from Artisan Partners. Artisan Partners provided this follow-up information prior to the May 12 Meeting. At the May 12 Meeting, Artisan Partners presented certain additional information to the directors regarding the Funds, including information relating to Developing World Fund, and the independent directors and their independent counsel reviewed with the full board the information discussed at the Special Meeting and during their executive sessions. The directors then considered whether any further discussion or review was necessary, concluding that the Special Meeting and the information reviewed by the independent directors prior to and at the May 12 Meeting provided a strong basis for considering the approval of the Advisory Agreement with respect to each Fund. The directors then reviewed and affirmed each of the following conclusions:
The nature, extent and quality of Artisan Partners’ services. The directors concluded that the nature and extent of Artisan Partners’ services to the Current Funds and the proposed services to be provided to Developing World Fund were appropriate and consistent with, and in some cases more advantageous to the Funds than, the terms of the Advisory Agreement. The directors concluded that the quality of Artisan Partners’ services with respect to the Current Funds has been consistently high, with no material deficiencies. The directors considered that Artisan Partners had hired new investment personnel in preparation for managing Developing World Fund, and that it otherwise contemplates providing the same service level for Developing World Fund as it provides for the Current Funds.
The investment performance of each Fund. With respect to each Current Fund, the directors concluded that the Fund’s performance (including absolute performance and, where applicable, outperformance of peers and relevant benchmarks over long-term periods) or other relevant factors supported continuation of the Fund’s advisory arrangements under the Advisory Agreement. In the case of each Current Fund that had performance that lagged that of a relevant peer group or benchmark for certain (although not necessarily all) periods, the directors concluded that other factors relevant to performance supported continuation of the advisory arrangements. These factors included one or more of the following: (1) that underperformance was attributable, to a significant extent, to investment decisions (such as security selection, sector allocation or risk mitigation) by Artisan Partners that were reasonable and consistent with the Fund’s investment objective and policies; (2) that the Fund’s more recent or long-term performance, as applicable, was competitive when compared to relevant performance benchmarks or peer groups; and (3) the Fund had a limited operating history. With respect to Emerging Markets Fund, following significant discussions, the directors determined that the Fund’s performance supported renewal of the Fund’s advisory arrangement, but that the board would continue to monitor closely the performance of the Fund. The directors noted that Artisan Partners had provided thorough and thoughtful analysis regarding its continued
| | |
| 146 | | Artisan Partners Funds |
FACTORS CONSIDERED IN RENEWING THE FUNDS’ ADVISORY AGREEMENTS
confidence in the Fund’s investment team. The directors also noted Artisan Partners’ past record of improving the performance of other Funds that experienced periods of underperformance. The directors noted that, because Developing World Fund was not yet in operation, it had no performance history. However, the directors reviewed the performance of a fund managed by Developing World Fund’s proposed portfolio manager at his prior firm, and noted that the proposed portfolio manager had produced successful results using an investment process similar to that proposed for the Fund.
The costs of the services and profitability of Artisan Partners. The directors concluded that the costs of the services provided by Artisan Partners, and the profits it realizes, or expects to realize in the case of Developing World Fund, are reasonable in relation to the nature and quality of services provided, and in comparison to fees charged by mutual funds considered by Lipper to be in the same peer category or universe.
Comparisons of the services to be rendered and the amounts to be paid under the Advisory Agreement with those under other investment advisory agreements. The directors concluded that the fees paid by the Current Funds to Artisan Partners are reasonable in relation to the nature and quality of the services provided and in comparison to (i) the fees charged by mutual funds considered by Lipper to be within the same peer category or universe and (ii) the fees charged and the array of services offered to other Artisan Partners clients, including its separate account clients and mutual funds for which it serves as sub-adviser. In addition, the directors noted that Artisan Partners has contractually agreed to maintain certain expense limitations through January 31, 2017, for Emerging Markets Fund, Global Equity Fund, Global Opportunities Fund, Global Small Cap Fund, Global Value Fund, High Income Fund, International Fund, International Value Fund, Mid Cap Fund, Mid Cap Value Fund and Value Fund. The directors concluded that the nature, extent and quality of services proposed to be provided to Developing World Fund by Artisan Partners were appropriate and that the fees proposed to be paid to Artisan Partners were reasonable. In this regard, the directors took into account the fees paid by mutual funds considered by Lipper to be within the same peer group or universe as Developing World Fund. The directors also concluded that the estimated expense ratio of each share class of Developing World Fund (taking into account Artisan Partners’ contractual undertaking to maintain an expense limitation through January 31, 2017) was reasonable in relation to the expense ratios of other funds in the Lipper peer groups.
The extent to which economies of scale would be realized as each Current Fund grows and whether fee levels reflect these economies of scale for the benefit of Fund investors. The directors concluded that the shareholders of Global Opportunities Fund, Global Value Fund, International Fund, International Value Fund, Mid Cap Fund, Mid Cap Value Fund, Small Cap Fund, Small Cap Value Fund and Value Fund have appropriately benefited from economies of scale under the management fee structures of their advisory arrangements. The directors concluded that the shareholders of each of Emerging Markets Fund, Global Equity Fund and High Income Fund would likely benefit from economies of scale if each Fund’s assets reach the level at which the Fund will be able to take advantage of the investment advisory fee breakpoints in the Advisory Agreement (reduced fee levels on assets above stated thresholds). It was also concluded that Artisan Partners had not achieved (nor was it likely to achieve) economies of scale in the management of International Small Cap Fund because the Fund closed to new investors at a relatively modest asset level. The directors also considered that the fee rate for Global Small Cap Fund had been set at a level
| | |
| Artisan Partners Funds | | 147 |
FACTORS CONSIDERED IN RENEWING THE FUNDS’ ADVISORY AGREEMENTS
that was intended to be appropriate for its anticipated asset size, thus not requiring adjustment through breakpoints. The directors noted that since Developing World Fund does not currently have any assets, there are no material benefits from economies of scale with respect to Developing World Fund at present. The directors also noted that the proposed management fee schedule for Developing World Fund includes breakpoints at $1 billion, $2 billion, $3.5 billion and $5 billion of Fund net assets. The directors concluded that these breakpoints will result in a sharing, as between the Fund and Artisan Partners, of possible future economies of scale as and if the Fund’s assets grow to substantial levels.
Other benefits derived by the Funds or Artisan Partners. The directors concluded that, other than the services provided by Artisan Partners pursuant to the Advisory Agreement and the management fees to be paid in return, the Funds and Artisan Partners may potentially benefit from their relationship with each other in several ways. For Artisan Partners, the directors concluded the primary fall-out benefits include: (1) the potential conversion of Fund shareholders to separate account clients, (2) the acquisition of research products and services in return for brokerage commissions paid by the Funds (“soft dollars”) and (3) reputational benefits as a result of its association with the Funds. The directors concluded that, although Artisan Partners may derive such additional benefits, the Funds also could benefit from potential institutional shareholders who might choose to invest in the Funds because they want Artisan Partners’ services, but do not meet Artisan Partners’ minimum separate account size requirements. The directors also concluded that the Funds benefit from Artisan Partners’ use of soft dollars generated with respect to its separate account clients, and from reputational benefits as a result of their association with Artisan Partners.
Following those discussions, the board approved the Advisory Agreement through June 30, 2016 for each Current Fund and through May 12, 2017 for Developing World Fund by the unanimous vote of all directors and also by the unanimous vote of all the independent directors.
| | |
| 148 | | Artisan Partners Funds |
NOTES ON MANAGEMENT’S DISCUSSION OF FUND PERFORMANCE AND PORTFOLIO HOLDINGS’ CLASSIFICATION
The discussions of each Fund included in this report include statistical information about the portfolios of each of the Funds. Except as otherwise noted, that information is as of September 30, 2015. That information will vary with changes in a Fund’s portfolio investments. The performance information for each Fund relative to its benchmark index discussed in this report was prepared by the Adviser using information reported by FactSet Research Systems, Inc. (“FactSet”). For the purposes of assigning portfolio securities to a particular country in this report, the Adviser considers an issuer to be from a particular country as designated by its securities information vendors. However, the Adviser in its own judgment may consider an issuer to be from a country other than the country designated by the securities information vendors. A vendor’s criteria may include the identity of the jurisdiction of the issuer’s incorporation, the main equity trading market for the issuer’s securities, the geographical distribution of the issuer’s operations and the location of the issuer’s headquarters. The Adviser may also consider other criteria such as the source of a company’s revenues. Over time, country designations may change.
For the purposes of assigning portfolio securities to a particular sector and industry, the Adviser assigns equity securities in accordance with the sector and industry classifications of the Global Industry Classification Standard (GICS®) developed by MSCI Inc. and Standard & Poor’s (to the extent available) as primary sources and FactSet (to the extent available) as a secondary source for this information. The Adviser assigns debt securities in accordance with the industry groups developed by Bloomberg Finance L.P. In the event the Adviser’s securities information vendors do not classify a security to a particular sector or industry, or if the published classification appears to be erroneous, the Adviser classifies the security according to its own judgment, using other securities information vendors, the company description and other publicly available information about the company’s peer group. Sector and industry classifications may change over time.
The names of portfolio securities reflected in this report are as reported by the Funds’ data providers, may not represent the legal name of the entity and, in some cases, are translations of non-English names.
Definition of Portfolio Statistic
Market Capitalization is the aggregate value of all of a company’s outstanding equity securities.
Descriptions of Indices
Each Fund’s performance is compared in this report to changes in one or more indices, including in all cases a broad-based index of changes in prices of securities in the markets in which the Fund invests. All of the indices are unmanaged and their returns include reinvested dividends. Unlike the Funds’ returns, the returns of each index do not include the payment of sales commissions or other expenses that would be incurred in the purchase or sale of the securities included in that index. An investment cannot be made directly in an index. Fair value pricing is not employed by market indices.
| | |
| Artisan Partners Funds | | 149 |
NOTES ON MANAGEMENT’S DISCUSSION OF FUND PERFORMANCE AND PORTFOLIO HOLDINGS’ CLASSIFICATION
The indices to which the Funds are compared are:
Artisan Developing World and Artisan Emerging Markets Funds – Morgan Stanley Capital International Emerging Markets Index (MSCI Emerging Markets) is a market-weighted index of companies in emerging markets.
Artisan Global Equity, Artisan Global Opportunities, Artisan Global Small Cap and Artisan Global Value Funds – Morgan Stanley Capital International All Country World Index (MSCI ACWI) is a market-weighted index of global developed and emerging markets.
Artisan Global Small Cap Fund – Morgan Stanley Capital International All Country World Small Cap Index (MSCI ACWI Small Cap) – is a market-weighted index of small cap securities of global developed and emerging markets.
Artisan High Income Fund – BofA Merrill Lynch U.S. High Yield Master II Total Return Index tracks the performance of below investment grade U.S. dollar-denominated corporate bonds publicly issued in the U.S. domestic market.
Artisan International, Artisan International Small Cap and Artisan International Value Funds – Morgan Stanley Capital International EAFE Index (MSCI EAFE) is a market-weighted index of companies in developed markets, excluding the U.S. and Canada. MSCI EAFE’s average annual return since inception of the International Fund is based upon a starting date of December 31, 1995.
Artisan International Fund – Morgan Stanley Capital All Country World Index ex USA (MSCI ACWI ex USA) is a market-weighted index of global developed and emerging markets, excluding the U.S.
Artisan International Small Cap Fund – Morgan Stanley Capital International EAFE Small Cap Index (MSCI EAFE Small Cap) is a market-weighted index of small companies in developed markets, excluding the U.S. and Canada.
Artisan International Value Fund – Morgan Stanley Capital International EAFE Value Index (MSCI EAFE Value) is a market-weighted index of companies in developed markets, excluding the U.S. and Canada, that exhibits value investment style characteristics according to MSCI’s methodology.
Artisan Mid Cap and Artisan Mid Cap Value Funds – Russell Midcap® Index is a market-weighted index of about 800 medium-sized U.S. companies.
Artisan Mid Cap Fund – Russell Midcap® Growth Index is a market-weighted index of those medium-sized companies included in the Russell Midcap® Index with higher price-to-book and higher forecasted growth values.
Artisan Mid Cap Value Fund – Russell Midcap® Value Index is a market-weighted index of those medium-sized companies included in the Russell Midcap® Index with lower price-to-book ratios and lower forecasted growth values.
Artisan Small Cap and Artisan Small Cap Value Funds – Russell 2000® Index is a market-weighted index of about 2,000 small U.S. companies.
| | |
| 150 | | Artisan Partners Funds |
NOTES ON MANAGEMENT’S DISCUSSION OF FUND PERFORMANCE AND PORTFOLIO HOLDINGS’ CLASSIFICATION
Artisan Small Cap Fund – Russell 2000® Growth Index is a market-weighted index of those small companies included in the Russell 2000® Index with higher price-to-book ratios and higher forecasted growth values.
Artisan Small Cap Value Fund – Russell 2000® Value Index is a market-weighted index of those small companies included in the Russell 2000® Index with lower price-to-book ratios and lower forecasted growth values.
Artisan Value Fund – Russell 1000® Index is a market-weighted index of about 1,000 large U.S. companies.
Artisan Value Fund – Russell 1000® Value Index is a market-weighted index of those large companies included in the Russell 1000® Index with lower price-to-book ratios and lower forecasted growth values.
Trademarks
Trademarks and copyrights relating to the indices and products of portfolio companies mentioned in this report, if any, are owned by their respective owners. Except as otherwise indicated, the trademarks, including names, logos, slogans and service marks appearing in this report are the property of the Adviser and may not be copied, reproduced, published or in any way used without written permission.
The Global Industry Classification Standard (“GICS”) was developed by and is the exclusive property and a service mark of MSCI Inc. (“MSCI”) and Standard & Poor’s, a division of The McGraw-Hill Companies, Inc. (“S&P”) and is licensed for use by the Adviser. Neither MSCI, S&P nor any third party involved in making or compiling the GICS or any GICS classifications makes any express or implied warranties or representations with respect to such standard or classification (or the results to be obtained by the use thereof), and all such parties hereby expressly disclaim all warranties of originality, accuracy, completeness, merchantability and fitness for a particular purpose with respect to any of such standard or classification. Without limiting any of the foregoing, in no event shall MSCI, S&P, any of their affiliates or any third party involved in making or compiling the GICS or any GICS classifications have any liability for any direct, indirect, special, punitive, consequential or any other damages (including lost profits) even if notified of the possibility of such damages.
MSCI makes no express or implied warranties or representations and shall have no liability whatsoever with respect to any MSCI data contained herein. The MSCI data may not be further redistributed or used to create indices or financial products. This report is not approved or produced by MSCI.
For the BofA Merrill Lynch U.S. High Yield Master II Total Return Index the source is BofA Merrill Lynch, used with permission. BofA Merrill Lynch is licensing the BofA Merrill Lynch indices “as is,” makes no warranties regarding same, does not guarantee the suitability, quality, accuracy, timeliness, and/or completeness of the BofA Merrill Lynch indices or any data included in, related to, or derived there from, assumes no liability in connection with their use, and does not sponsor, endorse, or recommend Artisan Partners, or any of its products or services.
| | |
| Artisan Partners Funds | | 151 |
NOTES ON MANAGEMENT’S DISCUSSION OF FUND PERFORMANCE AND PORTFOLIO HOLDINGS’ CLASSIFICATION
Russell Investment Group is the source and owner of the Russell Index data contained or reflected in this material and all trademarks and copyrights related thereto. The presentation may contain confidential information and unauthorized use, disclosure, copying, dissemination or redistribution is strictly prohibited. This is a presentation of Artisan Partners Funds. Russell Investment Group is not responsible for the formatting or configuration of this material or for any inaccuracy in Artisan Partners Funds’ presentation thereof.
PROXY VOTING POLICIES AND PROCEDURES
You may obtain a description of Artisan Partners Funds’ proxy voting policies and procedures, without charge, upon request by calling 800.344.1770. That information also is included in Artisan Partners Funds’ statement of additional information, which is available without charge, on Artisan Partners Funds’ website at www.artisanpartners.com and on the Securities and Exchange Commission’s website at www.sec.gov.
Information relating to how each Fund voted proxies relating to portfolio securities held during the twelve-month period ended June 30 is available without charge, on Artisan Partners Funds’ website at www.artisanpartners.com and on the Securities and Exchange Commission’s website at www.sec.gov.
INFORMATION ABOUT PORTFOLIO SECURITIES
Artisan Partners Funds files a complete schedule of portfolio holdings with the Securities and Exchange Commission for the quarters ending December 31 and June 30 (the first and third quarters of the Funds’ fiscal year) on Form N-Q. The Funds’ Forms N-Q are available on the Securities and Exchange Commission’s website at www.sec.gov. You also may review and copy those documents by visiting the Securities and Exchange Commission’s Public Reference Room in Washington, D.C. Information on the operation of the Public Reference Room may be obtained by calling the Securities and Exchange Commission at 800.SEC.0330.
| | |
| 152 | | Artisan Partners Funds |
DIRECTORS AND OFFICERS
The board of directors has overall responsibility for the conduct of the affairs of Artisan Partners Funds. Each director serves an indefinite term of unlimited duration until the next annual meeting of shareholders and until the election and qualification of his or her successor or until he or she retires, resigns or is removed from office. Artisan Partners Funds’ bylaws further provide that each director must retire by the end of the calendar year in which he or she attains the age of 75. The board of directors may fill any vacancy on the board provided that after such appointment at least two-thirds of the directors have been elected by the shareholders. The shareholders may remove a director by a vote of a majority of the outstanding shares of the Funds at any meeting of shareholders called for the purpose of removing such director.
The board of directors elects the officers of Artisan Partners Funds. Each officer serves until the election and qualification of his or her successor, or until he or she sooner dies, resigns, or is removed or disqualified. The board of directors may remove any officer with or without cause at any time.
The names and ages of the directors and officers as of November 13, 2015, the position each holds with the Funds, the date each was first elected to office, their principal business occupations and other directorships they have held during at least the last five years are shown below. Each director oversees all fifteen series of Artisan Partners Funds.
| | | | | | | | |
| | | | | |
Name and Age at 11/13/15 | | Position(s)
Held with
Artisan Partners Funds | | Date First Elected
or Appointed to Office | | Principal Occupation(s) during at least the
Past 5 Years | | Other Public Company or
Registered Investment
Company Directorships Held |
| Directors who are not “interested persons” of Artisan Partners Funds: |
| David A. Erne – 72 | | Director | | 3/27/95 | | Of counsel to the law firm Reinhart Boerner Van Deuren s.c., Milwaukee, WI. | | None. |
| Gail L. Hanson – 59 | | Director | | 1/1/12 | | Chief Financial Officer, Aurora Health Care (not for profit health care provider); from September 2004 to February 2011, Deputy Executive Director, State of Wisconsin Investment Board. | | Director, Northwestern Mutual Series Fund, Inc. (investment company) (27 portfolios). |
| Thomas R. Hefty – 68 | | Director and Independent Chair of the Board of Directors | | Director since 3/27/95; Independent Chair since 1/1/15 | | Retired; from January 2007 to February 2008, President, Kern Family Foundation (private, grant-making organization); until December 2006, of counsel to the law firm Reinhart Boerner Van Deuren s.c., Milwaukee, WI; until December 2006, Adjunct Professor, Department of Business and Economics, Ripon College; until December 2002, Chairman of the Board and Chief Executive Officer of Cobalt Corporation (provider of managed care and specialty business services). | | None. |
| | |
| Artisan Partners Funds | | 153 |
DIRECTORS AND OFFICERS
| | | | | | | | |
| | | | | |
Name and Age at 11/13/15 | | Position(s)
Held with
Artisan Partners
Funds | | Date First Elected
or Appointed to Office | | Principal Occupation(s) during at least the
Past 5 Years | | Other Public Company or
Registered Investment
Company Directorships Held |
| Peter M. Lebovitz – 60 | | Director | | 7/1/14 | | Managing Partner, Harkness Partners, LLC (provider of strategic consulting to investment management firms). | | Independent Chair of the Board and Independent Trustee, ALTFMX Trust (investment company) (2 portfolios). |
| Patrick S. Pittard – 69 | | Director | | 8/9/01 | | Distinguished Executive in Residence (teaching position), University of Georgia; until December 2012, Chairman and Chief Executive Officer, ACT Bridge, Inc. (enterprise talent management firm); until October 2001, Chairman of the Board, President and Chief Executive Officer of Heidrick & Struggles International, Inc. (executive search firm). | | Director, Lincoln National Corporation (insurance and investment management company). |
| R. Scott Trumbull – 67 | | Director | | 11/13/12 | | Until 2015, Chairman and Director, Franklin Electric Co., Inc. (manufacturer of water and fuel pumping systems); until 2014, Chief Executive Officer, Franklin Electric Co., Inc. | | Director, Welltower Inc. (investor in health care real estate); Director, Columbus McKinnon Corporation (designer, manufacturer and marketer of material handling products). |
| Director who is an “interested person” of Artisan Partners Funds and Officer: |
| Eric R. Colson – 46* | | Director, President and Chief Executive Officer | | President and Chief Executive Officer since 2/9/10; Director since 11/12/13 | | President, Chief Executive Officer and Director of Artisan Partners Asset Management Inc. (since March 2013) and Chairman (since August 2015); Managing Director, Chief Executive Officer and since April 2013 President of Artisan Partners; President and Chief Executive Officer of Artisan Investments GP LLC; President and Chief Executive Officer of Artisan Partners Holdings LP (since March 2013); prior thereto, Managing Director and Chief Operating Officer – Investment Operations of Artisan Partners. | | None. |
| | |
| 154 | | Artisan Partners Funds |
DIRECTORS AND OFFICERS
| | | | | | | | |
| | | | | |
Name and Age at 11/13/15 | | Position(s)
Held with
Artisan Partners
Funds | | Date First Elected
or Appointed to Office | | Principal Occupation(s) during at least the
Past 5 Years | | Other Public Company or
Registered Investment
Company Directorships Held |
| Officers: |
| Brooke J. Billick – 61 | | Chief Compliance Officer | | 8/19/04 | | Chief Compliance Officer – U.S. Mutual Funds and Associate Counsel of Artisan Partners; Chief Compliance Officer of Artisan Partners Distributors LLC; until January 2012, Chief Compliance Officer of Artisan Partners. | | None. |
| Gregory K. Ramirez – 45 | | Chief Financial Officer, Vice President and Treasurer | | 2/8/11 | | Managing Director and since April 2013, Vice President and Assistant Treasurer of Artisan Partners; Senior Vice President (since October 2013) of Artisan Partners Asset Management Inc.; Chairman and President of Artisan Partners Distributors LLC; prior thereto, Vice President, Treasurer and Chief Financial Officer of Artisan Partners Distributors LLC; until February 2011, Assistant Secretary and Assistant Treasurer of Artisan Partners Funds. | | None. |
| Sarah A. Johnson – 43 | | General Counsel, Vice President and Secretary | | 2/8/11 | | Managing Director, Vice President (since April 2013), Secretary (since October 2013), Chief Compliance Officer (January 2012 – September 2013) and General Counsel (since October 2013) of Artisan Partners; prior thereto Associate Counsel of Artisan Partners; Executive Vice President, Chief Legal Officer and Secretary (since October 2013) of Artisan Partners Asset Management Inc.; Vice President and Secretary of Artisan Partners Distributors, LLC; until February 2011, Assistant Secretary of Artisan Partners Funds. | | None. |
Laura E. Simpson – 39 | | Vice President and Assistant Secretary | | 2/10/15 | | Deputy General Counsel (since January 2015) of Artisan Partners; prior thereto, Associate Counsel; until March 2011, Counsel, Invesco Ltd. | | None. |
| Shannon K. Jagodinski – 38 | | Vice President and Assistant Treasurer | | Vice President since 2/10/15; Assistant Treasurer since 2/14/12 | | Senior Manager of Vehicle Administration of Artisan Partners. | | None. |
| * | Mr. Colson is an “interested person” of Artisan Partners Funds, as defined in the 1940 Act, because he is President and Chief Executive Officer of Artisan Partners Funds and holds various positions with Artisan Partners and its affiliates. |
| | |
| Artisan Partners Funds | | 155 |
DIRECTORS AND OFFICERS
The business address of the officers and the director affiliated with Artisan Partners is 875 E. Wisconsin Avenue, Suite 800, Milwaukee, Wisconsin 53202. The address of the other directors is c/o Artisan Partners Funds, 875 E. Wisconsin Avenue, Suite 800, Milwaukee, Wisconsin 53202.
Artisan Partners Funds’ statement of additional information (SAI) contains further information about the directors. Please call 800.344.1770 or visit our website at www.artisanpartners.com for a free copy of the SAI.
| | |
| 156 | | Artisan Partners Funds |

ARTISAN PARTNERS FUNDS
P.O. BOX 8412
BOSTON, MA 02266-8412

Item 2. Code of Ethics.
(a) Registrant has adopted a code of ethics (the “Code”) that applies to its principal executive officer, principal financial officer and principal accounting officer (the “Covered Officers”).
(b) No disclosures are required pursuant to this Item 2(b).
(c) During the period covered by the report, registrant did not make any substantive amendments to the Code.
(d) During the period covered by the report, registrant did not grant any waivers, including implicit waivers, from the provisions of the Code.
(e) Not applicable.
(f) A copy of the Code is filed as Exhibit (a)(1) to this Form N-CSR.
Item 3. Audit Committee Financial Expert.
Registrant’s board of directors has determined that Gail L. Hanson, member and chairman of the registrant’s audit committee, Thomas R. Hefty, member of the registrant’s audit committee, Peter M. Lebovitz, member of the registrant’s audit committee, and R. Scott Trumbull, member of the registrant’s audit committee, each qualify as an audit committee financial expert, as such term is defined in Instruction 2(b) to Item 3 of Form N-CSR. Ms. Hanson, Mr. Hefty, Mr. Lebovitz and Mr. Trumbull are “independent” as such term is defined in paragraph (a)(2) of Item 3 of Form N-CSR.
Under applicable securities laws, a person who is determined to be an audit committee financial expert will not be deemed an “expert” for any purpose, including, without limitation, for the purposes of Section 11 of the Securities Act of 1933, as a result of being designated or identified as an audit committee financial expert. The designation or identification of a person as an audit committee financial expert does not impose on such person any duties, obligations, or liabilities that are greater than the duties, obligations, and liabilities imposed on such person as a member of the audit committee and board of directors in the absence of such designation or identification.
Item 4. Principal Accountant Fees and Services.
Aggregate fees billed to the registrant for professional services rendered by the registrant’s principal accountant, Ernst & Young LLP, are summarized in the tables below. The tables summarize fees billed (or to be billed) by the registrant’s principal accountant for work performed relating to each applicable period identified below.
Fees:
| | | | | | | | |
| | | Fiscal Year Ended
September 30, 2015 | | | Fiscal Year Ended
September 30, 2014 | |
Audit Fees (a) | | $ | 365,300 | | | $ | 337,800 | |
Audit-Related Fees (b) | | $ | 66,200 | | | $ | 61,050 | |
Tax Fees (c) | | $ | 374,096 | | | $ | 330,957 | |
All Other Fees (d) | | $ | — | | | | — | |
(a) “Audit Fees” include amounts for professional services rendered by the principal accountant for the audit of the registrant’s annual financial statements and services that are normally provided by the accountant in connection with statutory and regulatory filings or engagements, including for 2015, portions of which have not been billed at the time of this filing and fees billed for consents issued in conjunction with the registrant’s post-effective amendments to the Funds’ registration statements filed for each of the last two fiscal years. The fees billed during the fiscal year ended September 30, 2015 also include the consent issued in conjunction with the
registrant’s post-effective amendments to the Funds’ registration statements filed in connection with the initial offering of Investor Shares, Institutional Shares and Advisor Shares of Artisan Developing World Fund. The fees billed during the fiscal year ended September 30, 2014 also include consents issued in conjunction with the registrant’s post-effective amendments to the Funds’ registration statements filed in connection with the initial offering of Investor and Advisor shares of Artisan High Income Fund, and in conjunction with the redesignation of Artisan Emerging Markets Fund Advisor Shares to Investor Shares.
(b) “Audit-Related Fees” include amounts for assurance and related services by the principal accountant that are reasonably related to the performance of the audit of the registrant’s financial statements. Audit-related fees have not been reported under the item “audit fees” in the chart above.
The fees billed by Ernst & Young LLP during the fiscal years ended September 30, 2015 and September 30, 2014 include fees incurred for services for review procedures performed in conjunction with the semiannual reports to shareholders as of March 31, 2015 and March 31, 2014.
(c) “Tax Fees” include amounts for professional services rendered by the principal accountant for tax compliance, tax advice and tax planning.
The fees shown in the table above for the fiscal year ended September 30, 2015 include fees for (1) the review and preparation of the Funds’ income tax returns for the fiscal year ended September 30, 2015, which have not been billed as of the time of this filing; (2) the review of excise tax calculations and preparation of excise tax returns for the calendar year ended December 31, 2015, which also have not yet been billed as of the time of this filing; (3) the use of a PFIC database supplied by Ernst & Young LLP for the fiscal year ended September 30, 2014 and the excise year ended December 31, 2014, and the semiannual period ended March 31, 2015; (4) the use of a Qualified Foreign Corporation (QFC) Database supplied by Ernst & Young LLP for the calendar year ended December 31, 2014; (5) the use of a Global Withholding Tax Reporter Database supplied by Ernst & Young LLP for the fiscal year ended September 30, 2015; and (6) the filing of reclaims of tax amounts withheld by European Union member countries.
The fees shown in the table above for the fiscal year ended September 30, 2014 include fees for (1) the review and preparation of the Funds’ income tax returns for the fiscal year ended September 30, 2014; (2) the review of excise tax calculations and preparation of excise tax returns for the calendar year ended December 31, 2014; (3) the use of a PFIC database supplied by Ernst & Young LLP for the fiscal year ended September 30, 2013 and the excise year ended December 31, 2013, and the semiannual period ended March 31, 2014; (4) the use of a Qualified Foreign Corporation (QFC) Database supplied by Ernst & Young LLP for the calendar year ended December 31, 2013; (5) the use of a Global Withholding Tax Reporter Database supplied by Ernst & Young LLP for the fiscal year ended September 30, 2014; and (6) the filing of reclaims of tax amounts withheld by European Union member countries
(d) None.
(e)(1) During its regularly scheduled periodic meetings, the registrant’s audit committee considers any requests to pre-approve any audit, audit-related, tax and other services to be provided by the principal accountants of the registrant. The audit committee has authorized its chairman to exercise that authority in the intervals between meetings; and the chairman presents any such pre-approvals to the audit committee at its next regularly scheduled meeting. Under paragraph (c)(7)(i)(C) of Rule 2-01 of Regulation S-X, pre-approval of non-audit services may be waived provided that: 1) the aggregate fees for all such services provided constitutes no more than five percent of the total amount of fees paid by the registrant to its principal accountant during the fiscal year in which services are provided, 2) such services were not recognized by the registrant at the time of engagement as non-audit services and 3) such services are promptly brought to the attention of the audit committee of the registrant and approved prior to the completion of the audit.
(e)(2) No services included in Items 4(b) – (d) above were approved pursuant to paragraph (c)(7)(i)(C) of Rule 2-01 of
Regulation S-X.
(f) Not applicable.
(g) The aggregate fees for the fiscal years ended September 30, 2015 and September 30, 2014 by the registrant’s principal accountant for non-audit services rendered to the registrant are shown in the tables above and described under Items 4(b) – (d) above. For the registrant’s fiscal years ended September 30, 2015 and September 30, 2014, Ernst & Young LLP served as the registrant’s principal accountant and provided no services and billed no fees for non-audit services rendered to the registrant’s adviser or entities controlling, controlled by or under common control with the adviser.
(h) The audit committee of the registrant’s board of directors has considered whether the provision of non-audit services that were rendered to the registrant’s investment adviser, and any entity controlling, controlled by or under common control with the investment adviser that provides ongoing services to the registrant that were not pre-approved pursuant to paragraph (c)(7)(ii) of Rule 2-01 of Regulation S-X is compatible with maintaining the principal accountant’s independence. The provisions of Rule 2-01(c)(7) were effective on May 6, 2003. No such services were rendered on or after May 6, 2003.
Item 5. Audit Committee of Listed Registrants.
Not applicable.
Item 6. Schedule of Investments.
The Schedules of Investments in securities of unaffiliated issuers as of September 30, 2015 are included as part of the annual reports to shareholders filed under Item 1 of this Form N-CSR.
Item 7. Disclosure of Proxy Voting Policies and Procedures for Closed-End Management Investment Companies.
Not applicable.
Item 8. Portfolio Managers of Closed-End Management Investment Companies.
Not applicable.
Item 9. Purchases of Equity Securities by Closed-End Management Investment Company and Affiliated Purchasers.
Not applicable.
Item 10. Submission of Matters to a Vote of Security Holders.
No material changes to report.
Item 11. Controls and Procedures.
(a) The registrant’s principal executive and principal financial officers have concluded, based on an evaluation of the registrant’s disclosure controls and procedures (as defined in Rule 30a-3(c) under the Investment Company Act of 1940, the “Disclosure Controls”) as of a date within 90 days prior to the filing date (the “Filing Date”) of this Form N-CSR (the “Report”), that the Disclosure Controls are effectively designed to provide reasonable assurance that the information required to be disclosed by the registrant in the Report is recorded, processed, summarized and reported by the Filing Date, including ensuring that information required to be disclosed in the Report is accumulated and communicated to the registrant’s management, including the registrant’s principal executive officer and principal financial officer, as appropriate to allow timely decisions regarding required disclosure.
(b) There were no changes in the registrant’s internal controls over financial reporting (as defined in Rule 30a-3(d) under the Investment Company Act of 1940) that occurred during the second fiscal quarter of the period covered by this report that have materially affected, or are reasonably likely to materially affect, the registrant’s internal control over financial reporting.
Item 12. Exhibits.
| | | | |
(a) | | (1) | | Code of Ethics for Principal Executive Officer, Principal Financial Officer and Principal Accounting Officer (as referenced in Item 2 above), attached hereto as Exhibit (a)(1) |
| | |
| | (2) | | Certifications of Eric R. Colson, Principal Executive Officer and Gregory K. Ramirez, Principal Financial Officer pursuant to Rule 30a-2(a) under the Investment Company Act of 1940 (17 CFR 270.30a-2(a)), attached hereto as Exhibits (a)(2)(i) and (a)(2)(ii) |
| | |
(b) | | | | Certification of Eric R. Colson, Principal Executive Officer and Gregory K. Ramirez, Principal Financial Officer pursuant to Section 906 of the Sarbanes-Oxley Act of 2002, attached hereto as Exhibit (b) |
SIGNATURES
Pursuant to the requirements of the Securities Exchange Act of 1934 and the Investment Company Act of 1940, the registrant has duly caused this report to be signed on its behalf by the undersigned, thereunto duly authorized.
| | |
| Artisan Partners Funds, Inc. |
| |
| By: | | /s/ Eric R. Colson |
| | Eric R. Colson |
| | Principal Executive Officer |
| |
| Date: | | December 3, 2015 |
Pursuant to the requirements of the Securities Exchange Act of 1934 and the Investment Company Act of 1940, this report has been signed below by the following persons on behalf of the registrant and in the capacities and on the dates indicated.
| | |
|
| |
| By: | | /s/ Eric R. Colson |
| | Eric R. Colson |
| | Principal Executive Officer |
| |
| Date: | | December 3, 2015 |
|
|
| |
| By: | | /s/ Gregory K. Ramirez |
| | Gregory K. Ramirez |
| | Principal Financial Officer |
| |
| Date: | | December 3, 2015 |