UNITED STATES
SECURITIES AND EXCHANGE COMMISSION
Washington, D.C. 20549
FORM N-CSR
CERTIFIED SHAREHOLDER REPORT OF REGISTERED
MANAGEMENT INVESTMENT COMPANIES
| | |
Investment Company Act file number | | 811-08932 |
Artisan Funds, Inc.
|
| (Exact name of registrant as specified in charter) |
| | |
875 East Wisconsin Avenue, Suite 800 Milwaukee, WI 53202 |
| (Address of principal executive offices) (Zip code) |
| | |
Janet D. Olsen Artisan Funds, Inc. 875 East Wisconsin Avenue, #800 Milwaukee, Wisconsin 53202 | | Bruce A. Rosenblum Bell, Boyd & Lloyd LLP 1615 L Street, N.W., Suite 1200 Washington, D.C. 20036 |
| (Name and address of agents for service) |
Registrant’s telephone number, including area code: (414) 390-6100
Date of fiscal year end: 09/30/07
Date of reporting period: 03/31/07
| Item 1. | Reports to Shareholders. |
SEMIANNUAL
R E P O R T
MARCH 31, 2007
ARTISAN INTERNATIONAL FUND
ARTISAN INTERNATIONAL SMALL CAP FUND
ARTISAN INTERNATIONAL VALUE FUND
ARTISAN MID CAP FUND
ARTISAN MID CAP VALUE FUND
ARTISAN OPPORTUNISTIC VALUE FUND
ARTISAN SMALL CAP FUND
ARTISAN SMALL CAP VALUE FUND

ARTISAN FUNDS, INC.
INVESTOR SHARES
ARTISAN FUNDS
P.O. BOX 8412
BOSTON, MA 02266-8412
This report and the unaudited financial statements contained herein are provided for the general information of the shareholders of Artisan Funds. Before investing, investors should consider carefully each Fund’s investment objective, risks and charges and expenses. For a prospectus, which contains that information and more information about each Fund, please call 800.344.1770 or visit our website at www.artisanfunds.com. Read it carefully before you invest or send money.
Company discussions are for illustration only and are not intended as recommendations of individual stocks. The discussions present information about the companies believed to be accurate, and the views of the portfolio managers, as of March 31, 2007. That information and those views may change, and the Funds disclaim any obligation to advise shareholders of any such changes. Artisan International Fund, Artisan International Value Fund and Artisan Mid Cap Fund offer institutional classes of shares for institutional investors meeting certain minimum investment requirements. A report on each institutional class is available under separate cover.
Artisan Funds offered through Artisan Distributors LLC, member NASD.
TABLE OF CONTENTS
AVERAGE ANNUAL TOTAL RETURNS (as of 3/31/07)
| | | | | | | | | | | | | | | |
| | | 1-Year | | | 3-Year | | | 5-Year | | | 10-Year | | | Since
Inception | |
Artisan International Fund (inception 12/28/95) | | 18.86 | % | | 19.28 | % | | 13.33 | % | | 12.81 | % | | 14.79 | % |
Artisan International Small Cap Fund (inception 12/21/01) | | 20.22 | | | 27.04 | | | 27.67 | | | NA | | | 27.21 | |
Artisan International Value Fund (inception 9/23/02) | | 20.85 | | | 22.49 | | | NA | | | NA | | | 30.44 | |
Artisan Mid Cap Fund (inception 6/27/97) | | 5.17 | | | 10.39 | | | 7.60 | | | NA | | | 17.18 | |
Artisan Mid Cap Value Fund (inception 3/28/01) | | 13.45 | | | 17.54 | | | 16.72 | | | NA | | | 16.12 | |
Artisan Opportunistic Value Fund (inception 3/27/06) | | 18.10 | | | NA | | | NA | | | NA | | | 17.65 | |
Artisan Small Cap Fund (inception 3/28/95) | | (4.74 | ) | | 9.45 | | | 7.83 | | | 7.75 | | | 9.54 | |
Artisan Small Cap Value Fund (inception 9/29/97) | | 12.50 | | | 16.95 | | | 15.30 | | | NA | | | 14.00 | |
The performance quoted represents past performance, which does not guarantee future results. The investment return and principal value of an investment in a Fund will fluctuate, so that an investor’s shares in the Fund, when redeemed, may be worth more or less than their original cost. Current performance may be lower or higher than the performance data quoted. For current to most recent month-end performance information, visit www.artisanfunds.com or call 800.344.1770. The performance information shown for Artisan International Fund, Artisan International Small Cap Fund and Artisan International Value Fund does not reflect the deduction of a 2% redemption fee on shares held by an investor for 90 days or less and, if reflected, the fee would reduce the performance quoted. Artisan International Small Cap Fund’s investments in initial public offerings (IPOs) made a material contribution to the Fund’s performance. IPO investments are not an integral component of the Fund’s investment process and may not be available in the future. The performance information shown for Artisan Opportunistic Value Fund reflects Artisan Partners’ undertaking to limit the Fund’s expenses when they exceed 1.50%, which may be terminated at any time, has been in effect since the Fund’s inception and has had a material impact on the Fund’s performance. In addition, the outside directors of Artisan Funds have waived that portion of their fees allocable to Artisan Opportunistic Value Fund for the fiscal year ended September 30, 2006. Absent that expense waiver, the Fund’s performance would have been lower.
Artisan International, Artisan International Small Cap, Artisan International Value & Artisan Opportunistic Value: International investments involve special risks, including currency fluctuation, lower liquidity, different accounting methods and economic and political systems and higher transaction costs. These risks are typically greater in emerging markets.
Artisan International, Artisan International Small Cap, Artisan Mid Cap & Artisan Small Cap: Growth stocks may underperform other asset types during a given period.
Artisan International Value, Artisan Opportunistic Value, Artisan Mid Cap Value & Artisan Small Cap Value: Value stocks may underperform other asset types during a given period.
Artisan International Small Cap, Artisan International Value, Artisan Small Cap & Artisan Small Cap Value: Stocks of smaller companies tend to be more volatile and less liquid than those of large companies, have underperformed the stocks of larger companies during some periods and tend to have a shorter history of operations than larger companies.
Artisan International Value, Artisan Mid Cap, and Artisan Mid Cap Value & Artisan Opportunistic Value: Stocks of medium-sized companies tend to be more volatile than those of large companies, and have underperformed the stocks of small and large companies during some periods.
ARTISAN INTERNATIONAL FUND (ARTIX)
INVESTMENT PROCESS HIGHLIGHTS
Artisan International Fund uses a fundamental stock selection process focused on identifying long-term growth opportunities.
Themes. The investment team’s thematic approach identifies catalysts for change and develops investment themes with the objective of capitalizing on them globally. Changing demographics, developing technology, privatization of economic resources and outsourcing are among the long-term catalysts for change that currently form the basis for the team’s investment themes. The team incorporates these catalysts along with sector and regional fundamentals into a long-term global framework for investment analysis and decision-making.
Sustainable Growth. The team applies a fundamental approach to identifying the long-term, sustainable growth characteristics of potential investments. The team seeks high quality companies that are well managed, have a dominant or improving market position and competitive advantages compared to industry and regional peers.
Valuation. The team assesses the relationship between its estimate of a company’s sustainable growth prospects and its stock price. The team uses multiple valuation metrics to establish price targets.
The Fund primarily invests in non-U.S. growth companies of all market capitalizations in developed and emerging markets.
PERFORMANCE HISTORY
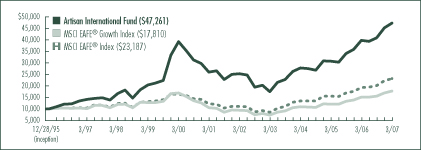
GROWTH OF AN ASSUMED $10,000 INVESTMENT (12/28/95 to 3/31/07)
AVERAGE ANNUAL TOTAL RETURNS (as of 3/31/07)
| | | | | | | | | | | | | | | |
| Fund / Index | | 1-Year | | | 3-Year | | | 5-Year | | | 10-Year | | | Since
Inception | |
Artisan International Fund | | 18.86 | % | | 19.28 | % | | 13.33 | % | | 12.81 | % | | 14.79 | % |
MSCI EAFE® Growth Index | | 17.77 | | | 17.55 | | | 13.47 | | | 5.81 | | | 5.26 | |
MSCI EAFE® Index | | 20.20 | | | 19.83 | | | 15.78 | | | 8.31 | | | 7.76 | |
The performance quoted represents past performance, which does not guarantee future results. The investment return and principal value of an investment in the Fund will fluctuate, so that an investor’s shares in the Fund, when redeemed, may be worth more or less than their original cost. Current performance may be lower or higher than the performance data quoted. For current to most recent month-end performance information, visit www.artisanfunds.com or call 800.344.1770. The graph and table above do not reflect the deduction of taxes that a shareholder would pay on distributions or sale of Fund shares. The performance shown does not reflect the deduction of a 2% redemption fee on shares held by an investor for 90 days or less and, if reflected, the fee would reduce the performance quoted. See page 86 for a description of each index.
2
INVESTING ENVIRONMENT
During the six-month period ended March 31, 2007, the MSCI EAFE® Index generated a strong 14.85% return. Gains across the markets were fairly broad-based, though slightly stronger in Europe than in the Far East, due in large part to the underperformance of Japanese stocks. Emerging markets stocks outpaced developed markets. China and Brazil were standouts advancing more than 30% each. In the MSCI EAFE® Index, the industrials and materials sectors were leaders, gaining more than 20% each, while the healthcare and technology sectors posted small single-digit advances.
SECTOR DIVERSIFICATION
| | | | | | |
| Sector | | 9/30/06 | | | 3/31/07 | |
Consumer Discretionary | | 11.8 | % | | 11.4 | % |
Consumer Staples | | 9.8 | | | 9.3 | |
Energy | | 6.5 | | | 4.2 | |
Financials | | 37.3 | | | 32.4 | |
Healthcare | | 5.7 | | | 3.9 | |
Industrials | | 10.9 | | | 14.4 | |
Information Technology | | 4.8 | | | 5.7 | |
Materials | | 0.0 | (1) | | 1.5 | |
Telecommunication Services | | 4.8 | | | 7.3 | |
Utilities | | 7.7 | | | 8.4 | |
Other assets less liabilities | | 0.7 | | | 1.5 | |
Total | | 100.0 | % | | 100.0 | % |
As a percentage of total net assets.
(1) Represents less than 0.1% of total net assets.
PERFORMANCE DISCUSSION
The Fund outperformed the MSCI EAFE® Index during the semiannual reporting period with a gain of 15.76%. The primary driver of strength relative to the Index was positive security selection as two of our key themes, infrastructure and demographics, produced a number of winners. Strength in those themes contributed to positive results in several sectors. Our list of several top contributors in those themes included French construction company Bouygues SA, Japanese heavy machine manufacturer Mitsubishi Heavy Industries, Ltd., French electricity producer Electricite de France, Chinese wireless provider China Mobile Ltd., British grocer William Morrison Supermarkets PLC and Italian energy infrastructure provider Saipem S.p.A. The biggest detractor to performance was the financial sector. Within the sector we were hurt most by Japanese retail affiliated credit card company Credit Saison Co., Ltd., Japanese leasing company ORIX Corporation and Japanese consumer finance company AIFUL CORPORATION. We sold AIFUL due to reduced expectations for future growth.
FUND CHANGES
During the period, we continued to use our fundamental stock selection process to manage a portfolio of companies with what we consider to be reasonable valuations, attractive sustainable growth potential and exposure to the secular themes we have identified.
Two of our purchases could be found in a developing alternative energy trend in our infrastructure theme. We purchased Spanish wind energy turbine maker GamesaCorpocation Tecnologica, S.A. and German specialty chemicals company Wacker Chemie AG. Wacker Chemie’s Polysilicon division has products that are used in solar panels. Other additions in our infrastructure theme included U.K. utility National Grid PLC and German airport operator Fraport AG.
Those additions were funded in large part by several sales in Japan. During the period, we sold our positions in insurance company Millea Holdings, Inc., bank holding company Mitsubishi UFJ Financial Group, Inc., game manufacturer SEGA SAMMY HOLDINGS, INC. and general contracting company TAISEI CORPORATION.
REGION ALLOCATION
| | | | | | |
| Region | | 9/30/06 | | | 3/31/07 | |
Europe | | 55.4 | % | | 56.9 | % |
Pacific Basin | | 29.0 | | | 20.8 | |
Emerging Markets | | 14.0 | | | 19.9 | |
Americas | | 0.9 | | | 0.9 | |
As a percentage of total net assets.
3
ARTISAN INTERNATIONAL SMALL CAP FUND (ARTJX)
INVESTMENT PROCESS HIGHLIGHTS
Artisan International Small Cap Fund uses a fundamental stock selection process focused on identifying long-term growth opportunities among small non-U.S. companies.
Themes. The investment team’s thematic approach identifies catalysts for change and develops investment themes with the objective of capitalizing on them globally. Changing demographics, developing technology, privatization of economic resources and outsourcing are among the long-term catalysts for change that currently form the basis for the team’s investment themes. The team incorporates these catalysts along with sector and regional fundamentals into a long-term global framework for investment analysis and decision-making.
Sustainable Growth. The team applies a fundamental approach to identifying the long-term, sustainable growth characteristics of potential investments. The team seeks high quality companies that are well managed, have a dominant or improving market position and competitive advantages compared to industry and regional peers.
Valuation. The team assesses the relationship between its estimate of a company’s sustainable growth prospects and its stock price. The team uses multiple valuation metrics to establish price targets.
The Fund primarily invests in non-U.S. small-cap growth companies in developed and emerging markets with market capitalizations less than $3 billion at the time of investment.
PERFORMANCE HISTORY
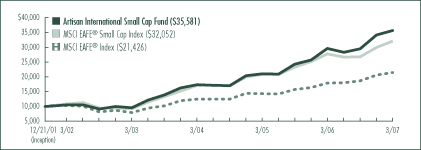
GROWTH OF AN ASSUMED $10,000 INVESTMENT (12/21/01 to 3/31/07)
AVERAGE ANNUAL TOTAL RETURNS (as of 3/31/07)
| | | | | | | | | | | | |
| Fund / Index | | 1-Year | | | 3-Year | | | 5-Year | | | Since
Inception | |
Artisan International Small Cap Fund | | 20.22 | % | | 27.04 | % | | 27.67 | % | | 27.21 | % |
MSCI EAFE® Small Cap Index | | 15.55 | | | 23.32 | | | 24.29 | | | 24.71 | |
MSCI EAFE® Index | | 20.20 | | | 19.83 | | | 15.78 | | | 15.54 | |
The performance quoted represents past performance, which does not guarantee future results. The investment return and principal value of an investment in the Fund will fluctuate, so that an investor’s shares in the Fund, when redeemed, may be worth more or less than their original cost. Current performance may be lower or higher than the performance data quoted. For current to most recent month-end performance information, visit www.artisanfunds.com or call 800.344.1770. The graph and table above do not reflect the deduction of taxes that a shareholder would pay on distributions or sale of Fund shares. The performance shown does not reflect the deduction of a 2% redemption fee on shares held by an investor for 90 days or less and, if reflected, the fee would reduce the performance quoted. The Fund’s investments in initial public offerings (IPOs) made a material contribution to the Fund’s performance. IPO investments are not an integral component of the Fund’s investment process and may not be available in the future. See page 86 for a description of each index.
4
INVESTING ENVIRONMENT
During the semiannual reporting period ended March 31, 2007, international small-cap stocks showed considerable strength as the MSCI EAFE® Small Cap Index advanced 19.64% in U.S. dollars. Every sector in the Index posted double-digit gains. The telecommunications, energy and industrial sectors were the leaders. The consumer discretionary, consumer staples and technology sectors trailed.
SECTOR DIVERSIFICATION
| | | | | | |
| Sector | | 9/30/06 | | | 3/31/07 | |
Consumer Discretionary | | 7.3 | % | | 10.1 | % |
Consumer Staples | | 7.1 | | | 8.4 | |
Energy | | 10.1 | | | 7.3 | |
Financials | | 31.5 | | | 33.6 | |
Healthcare | | 2.9 | | | 2.1 | |
Industrials | | 29.4 | | | 31.3 | |
Information Technology | | 0.1 | | | 1.1 | |
Materials | | 3.2 | | | 0.7 | |
Telecommunication Services | | 1.3 | | | 1.4 | |
Utilities | | 2.2 | | | 1.6 | |
Other assets less liabilities | | 4.9 | | | 2.4 | |
Total | | 100.0 | % | | 100.0 | % |
As a percentage of total net assets.
PERFORMANCE DISCUSSION
The Fund returned 20.86% for the six-month period ended March 31, 2007. Outperformance relative to the Index was driven in part by strong stock selection in the consumer staples and industrial sectors. Our underperformers were not concentrated in any one area. In the consumer staples sector, Mexican food retailer Organización Soriana S.A.B. de C.V., Turkish soft drink bottler Coca-Cola Icecek AS and South African retailer Massmart Holdings Limited were the strongest performers. Among our industrial stocks, Swiss pumps manufacturer Sulzer AG was our largest positive contributor. Its stock reached our target price during the period and we sold our position. Other solid contributors in the industrials sector included Hong Kong-based environmental protection project management provider China Everbright International Limited (a new purchase during the period), German railroad equipment manufacturer Vossloh AG, and Chinese airport operator Beijing Capital International Airport Company Limited. On the downside, our two biggest decliners in the portfolio were from the United Kingdom—Queen’s Walk Investment Ltd., an investment company investing primarily in asset-backed securities, and NETeller PLC, a provider of online money transfer services for Internet gaming companies. Other underperformers included Dutch office products distributor Corporate Express, Japanese real estate firm CREED CORPORATION, and Korean casino and hotel services provider Kangwon Land Inc.
REGION ALLOCATION
| | | | | | |
| Region | | 9/30/06 | | | 3/31/07 | |
Europe | | 43.8 | % | | 47.3 | % |
Pacific Basin | | 24.0 | | | 25.9 | |
Emerging Markets | | 24.9 | | | 23.3 | |
Americas | | 2.4 | | | 1.1 | |
As a percentage of total net assets.
FUND CHANGES
Activity was high during the period as we purchased a number of new names and sold several others. We were attracted to our new positions based on the sustainable growth characteristics we look for in potential investments. In addition to China Everbright International, our largest purchases included Spazio Investment NV (Dutch holding company that manages investments in the Italian industrial real estate market), Kowloon Development Company Limited (Hong Kong-based real estate development company), Tele Atlas NV (based in the Netherlands, a world leader in key segments of the navigation market, including personal and auto navigation, wireless/location-based services, emergency services and fleet-based services), HASEKO Corporation (Japanese general contractor that specializes in condominium construction), and CDNetworks Co., Ltd. (Korean provider of Content Delivery Network (CDN) service to local Internet content providers in the domestic and overseas markets).
Our biggest sales during the period were Korea Investment Holdings Co., Ltd., Sulzer, Banco Latinoamericano de Exportaciones, S.A., Aur Resources, Inc., Acergy SA, Panva Gas Holdings Limited and FINETEC Corporation.
5
ARTISAN INTERNATIONAL VALUE FUND (ARTKX)
INVESTMENT PROCESS HIGHLIGHTS
Artisan International Value Fund uses a bottom-up investment process focused on identifying what the investment team believes are high quality, undervalued businesses that offer the potential for superior risk/reward outcomes.
Undervaluation. Determining the intrinsic value of the business is the heart of the team’s research process. As long-term investors, it is the team’s core belief that valuation is the most crucial determinant of stock market return over the long-term.
Business quality. The team seeks to invest in companies with a history of generating strong free cash flow, improving returns on capital and strong competitive positions in their industries. This criteria helps rule out businesses that are statistically cheap, but whose values are deteriorating over time.
Financial strength. The team believes that investing in companies with strong balance sheets helps to reduce the potential for capital risk and provides company management the ability to build value when attractive opportunities are available.
Shareholder-oriented management. The team’s research process attempts to identify management teams with a history of building value for shareholders.
The Fund primarily invests in undervalued, non-U.S. companies of all market capitalizations in developed and emerging markets.
PERFORMANCE HISTORY
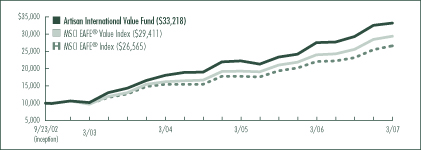
GROWTH OF AN ASSUMED $10,000 INVESTMENT (9/23/02 to 3/31/07)
AVERAGE ANNUAL TOTAL RETURNS (as of 3/31/07)
| | | | | | | | | |
| Fund / Index | | 1-Year | | | 3-Year | | | Since
Inception | |
Artisan International Value Fund | | 20.85 | % | | 22.49 | % | | 30.44 | % |
MSCI EAFE® Value Index | | 22.58 | | | 22.05 | | | 26.97 | |
MSCI EAFE® Index | | 20.20 | | | 19.83 | | | 24.14 | |
The performance quoted represents past performance, which does not guarantee future results. The investment return and principal value of an investment in the Fund will fluctuate, so that an investor’s shares in the Fund, when redeemed, may be worth more or less than their original cost. Current performance may be lower or higher than the performance data quoted. For current to most recent month-end performance information, visit www.artisanfunds.com or call 800.344.1770. The graph and table above do not reflect the deduction of taxes that a shareholder would pay on distributions or sale of Fund shares. The performance shown does not reflect the deduction of a 2% redemption fee on shares held by an investor for 90 days or less and, if reflected, the fee would reduce the performance quoted. See page 86 for a description of each index.
6
INVESTING ENVIRONMENT
During the semiannual reporting period ended March 31, 2007, international stocks continued their strong run of performance as the MSCI EAFE® Index gained 14.85%. Not only did international equities broadly outperform their domestic counterparts, but foreign currencies also appreciated relative to the dollar. This continued a pair of trends that has been generally consistent for the past five years. We attribute this to increasing concerns about the health of the U.S. economy—interest rates have risen, the war in Iraq continues to take a heavy psychological and financial toll, and there are mounting problems in the subprime mortgage market.
SECTOR DIVERSIFICATION
| | | | | | |
| Sector | | 9/30/06 | | | 3/31/07 | |
Consumer Discretionary | | 26.3 | % | | 26.5 | % |
Consumer Staples | | 17.0 | | | 15.1 | |
Financials | | 18.4 | | | 14.6 | |
Healthcare | | — | | | 1.5 | |
Industrials | | 16.5 | | | 22.4 | |
Information Technology | | 2.8 | | | 1.0 | |
Materials | | 4.4 | | | 3.4 | |
Telecommunication Services | | 5.1 | | | 5.6 | |
Utilities | | 1.1 | | | — | |
Other assets less liabilities | | 8.4 | | | 9.9 | |
Total | | 100.0 | % | | 100.0 | % |
As a percentage of total net assets.
PERFORMANCE DISCUSSION
Artisan International Value Fund increased 13.52% during the six-month period ended March 31, 2007.
As value investors, our primary task is the purchase of shares of companies that are selling at a meaningful discount to our estimate of intrinsic value. Thus, our efforts are centered around monitoring business performance and the consequent impact on intrinsic value. As a result, our views on performance are a function of the fundamentals of the companies owned in the portfolio.
The share prices of the following companies had a meaningful positive impact on the portfolio during the semiannual period: Galiform Plc (formerly MFI Furniture Group PLC), a U.K. trade kitchen business; Pfeiffer Vacuum Technology AG, a German vacuum pumps manufacturer; Countrywide PLC, a U.K. service provider to companies in the residential property industry; Vodafone Group PLC, a global wireless telecommunications company; and Diageo PLC, a U.K.-based beverage company. Countrywide was the subject of a takeover bid during the semiannual period, which drove its stock price to new highs. We exited our position after the stock price rose close to our estimate of fair value. The number of stocks in the portfolio that posted losses was limited. U.K.-based reinsurance broker Benfield Group Plc, Korean beverage company Lotte Chilsung Beverage Co., Ltd. and Japanese pachinko machine manufacturer SANKYO CO., LTD. were three stocks that declined during the period. We used the weakness as an opportunity to build our position in Sankyo.
FUND CHANGES
As stock prices rose, we exited a number of positions that reached our estimates of intrinsic value. These sales included: Amdocs Limited, Renault SA, Grupo Televisa S.A., Euronext NV, Brit Insurance Holdings PLC, Red Electrica de Espana, Cementir S.p.A. and Gruma S.A.B.
Proceeds from those sales funded the purchases of Switzerland-based temporary employment company Adecco SA, French pharmaceutical company Sanofi-Aventis, Hong Kong real estate development company Pacific Century Premium Developments Limited and Japanese consumer finance companies TAKEFUJI CORPORATION and ACOM CO., LTD, among others.
REGION ALLOCATION
| | | | | | |
| Region | | 9/30/06 | | | 3/31/07 | |
Europe | | 54.3 | % | | 52.7 | % |
Pacific Basin | | 14.0 | | | 17.7 | |
Americas | | 12.5 | | | 10.9 | |
Emerging Markets | | 10.8 | | | 8.8 | |
As a percentage of total net assets.
7
ARTISAN MID CAP FUND (ARTMX)
INVESTMENT PROCESS HIGHLIGHTS
Artisan Mid Cap Fund uses a bottom-up investment process to construct a diversified portfolio of U.S. mid-cap growth companies.
Security Selection. The team’s investment process begins by identifying companies possessing franchise characteristics (strong competitive positions), selling at attractive valuations and benefiting from an accelerating trend. The investment team looks for companies that are well positioned for long-term growth, driven by demand for their products and services, at an early enough stage in their profit cycle to benefit from the increased cash flows produced by the profit cycle.
Capital Allocation. Based on the investment team’s fundamental analysis of a company’s profit cycle, portfolio holdings develop through three stages. GardenSM investments are small positions in the early part of their profit cycle that will warrant a more sizeable allocation once their profit cycle accelerates. CropSM investments are positions that are being increased to a full weight because they are moving through the strongest part of their profit cycle. HarvestSM investments are positions that are being reduced as they near the team’s estimate of full valuation or their profit cycle begins to decelerate.
Broad Diversification. The team looks for investment opportunities across the entire economy so that it can find sustainable growth regardless of the sector or industry.
The Fund primarily invests in medium-sized U.S. growth companies. The Fund generally maintains median and weighted average market capitalizations of less than $10 billion.
PERFORMANCE HISTORY
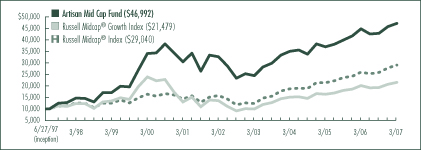
GROWTH OF AN ASSUMED $10,000 INVESTMENT (6/27/97 to 3/31/07)
AVERAGE ANNUAL TOTAL RETURNS (as of 3/31/07)
| | | | | | | | | | | | |
| Fund / Index | | 1-Year | | | 3-Year | | | 5-Year | | | Since
Inception | |
Artisan Mid Cap Fund | �� | 5.17 | % | | 10.39 | % | | 7.60 | % | | 17.18 | % |
Russell Midcap® Growth Index | | 6.90 | | | 12.41 | | | 9.45 | | | 8.15 | |
Russell Midcap® Index | | 11.79 | | | 15.72 | | | 12.91 | | | 11.54 | |
The performance quoted represents past performance, which does not guarantee future results. The investment return and principal value of an investment in the Fund will fluctuate, so that an investor’s shares in the Fund, when redeemed, may be worth more or less than their original cost. Current performance may be lower or higher than the performance data quoted. For current to most recent month-end performance information, visit www.artisanfunds.com or call 800.344.1770. The graph and table above do not reflect the deduction of taxes that a shareholder would pay on distributions or sale of Fund shares. See page 86 for a description of each index.
8
INVESTING ENVIRONMENT
In a strong six-month period for stocks, mid-caps were the preferred market cap group, outdistancing small and large-cap stocks. In the mid-cap space, investors preferred value as the Russell Midcap® Growth Index gained 11.18% compared to the 13.77% return for the Russell Midcap® Value Index. In the Russell Midcap® Growth Index, commodity sensitive materials and energy stocks were preferred, while healthcare and technology stocks were among those that trailed the pack. Housing market concerns and credit distress in the subprime mortgage industry also led to sub par returns for financial stocks.
SECTOR DIVERSIFICATION
| | | | | | |
| Sector | | 9/30/06 | | | 3/31/07 | |
Auto & Transportation | | 2.1 | % | | 3.5 | % |
Consumer Discretionary | | 16.6 | | | 18.6 | |
Consumer Staples | | 2.2 | | | 3.9 | |
Financial Services | | 16.2 | | | 14.6 | |
Healthcare | | 17.5 | | | 19.5 | |
Materials & Processing | | 6.1 | | | 7.4 | |
Other | | 3.1 | | | 1.3 | |
Other Energy | | 4.8 | | | 3.8 | |
Producer Durables | | 5.5 | | | 4.0 | |
Technology | | 19.9 | | | 19.2 | |
Utilities | | 3.5 | | | 2.0 | |
Other assets less liabilities | | 2.5 | | | 2.2 | |
Total | | 100.0 | % | | 100.0 | % |
As a percentage of total net assets.
PERFORMANCE DISCUSSION
The Fund gained a solid 9.94% for the six-month period ended March 31, 2007. The Fund’s strongest gains relative to the Index could be found in the materials, healthcare and consumer staples sectors.
Our list of leading performers in those sectors included complex metal components manufacturer Precision Castparts Corp., agribusiness and food products company Bunge Limited, biopharmaceutical company MedImmune, Inc., healthcare information technology company Cerner Corporation and grocery operator Supervalu Inc. Investors Financial Services Corp. was another strong contributor as it increased nearly 35%, due in large part to a premium takeout offer from State Street Corporation. We pared back our position on news of the pending takeout.
The technology sector was the primary source of underperformance for the Fund. Within the technology sector, weakness generally centered on two positions—Advanced Micro Devices, Inc. and Intermec, Inc. We sold our position in semiconductor chip manufacturer Advanced Micro Devices because we believed the risks were not skewed in our favor. We continued to hold Intermec, which is an applied technologies company with a broad product offering that includes a franchise in RFID (radio frequency identification) technology.
FUND CHANGES
During the period, we initiated positions in a number of new companies; many were GardenSM investments, but several made it into our top 30 investments, which we generally consider to be our CropSM holdings. All of our new positions met the conditions of our security selection process—they possessed franchise characteristics, were selling at attractive valuations and were benefiting from an accelerating trend.
Our largest three purchases were beverage company Hansen Natural Corporation, Linux operating system distributor Red Hat, Inc. and surgical systems company Intuitive Surgical, Inc.
9
ARTISAN MID CAP VALUE FUND (ARTQX)
INVESTMENT PROCESS HIGHLIGHTS
Artisan Mid Cap Value Fund uses a bottom-up investment process to construct a diversified portfolio of U.S. mid-cap value companies that the investment team believes are undervalued, in sound financial condition and have attractive business economics. The team believes companies with these characteristics are less likely to experience eroding values over the long-term.
Attractive valuation. The team values a business using what it believes are reasonable expectations for the long-term earnings power and capitalization rates of that business. This results in a range of values for the company that the team believes would be reasonable. The team generally will purchase a security if the stock price falls below or toward the lower end of that range.
Sound financial condition. The team favors companies with an acceptable level of debt and positive cash flow. At a minimum, the team tries to avoid companies that have so much debt that management may be unable to make decisions that would be in the best interests of the companies’ shareholders.
Attractive business economics. The team favors cash-producing businesses that it believes are capable of earning acceptable returns on capital over the company’s business cycle.
The Fund primarily invests in U.S. securities with market capitalizations between $1.5 billion and $10 billion at the time of purchase.
PERFORMANCE HISTORY
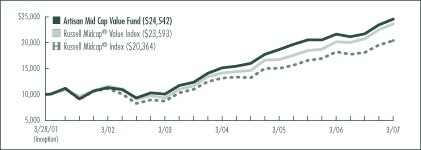
GROWTH OF AN ASSUMED $10,000 INVESTMENT (3/28/01 to 3/31/07)
AVERAGE ANNUAL TOTAL RETURNS (as of 3/31/07)
| | | | | | | | | | | | |
| Fund / Index | | 1-Year | | | 3-Year | | | 5-Year | | | Since
Inception | |
Artisan Mid Cap Value Fund | | 13.45 | % | | 17.54 | % | | 16.72 | % | | 16.12 | % |
Russell Midcap® Value Index | | 17.13 | | | 18.58 | | | 15.22 | | | 15.36 | |
Russell Midcap® Index | | 11.79 | | | 15.72 | | | 12.91 | | | 12.57 | |
The performance quoted represents past performance, which does not guarantee future results. The investment return and principal value of an investment in the Fund will fluctuate, so that an investor’s shares in the Fund, when redeemed, may be worth more or less than their original cost. Current performance may be lower or higher than the performance data quoted. For current to most recent month-end performance information, visit www.artisanfunds.com or call 800.344.1770. The graph and table above do not reflect the deduction of taxes that a shareholder would pay on distributions or sale of Fund shares. See page 86 for a description of each index.
10
INVESTING ENVIRONMENT
In the six-month period ended March 31, 2007 mid-cap stocks showed considerable strength as the Russell Midcap® Value and Russell Midcap® indices increased 13.77% and 12.38%, respectively. Every sector in the Russell Midcap® Value Index posted strong gains. The leaders were the energy and materials sectors. The producer durables, healthcare and technology sectors underperformed the market during the period.
SECTOR DIVERSIFICATION
| | | | | | |
| Sector | | 9/30/06 | | | 3/31/07 | |
Auto & Transportation | | 6.0 | % | | 9.2 | % |
Consumer Discretionary | | 31.0 | | | 18.6 | |
Consumer Staples | | 4.2 | | | 4.4 | |
Financial Services | | 26.9 | | | 26.9 | |
Healthcare | | — | | | 1.4 | |
Materials & Processing | | 4.3 | | | 3.4 | |
Other Energy | | 15.0 | | | 18.8 | |
Producer Durables | | 1.1 | | | 2.9 | |
Technology | | 8.6 | | | 7.3 | |
Other assets less liabilities | | 2.9 | | | 7.1 | |
Total | | 100.0 | % | | 100.0 | % |
As a percentage of total net assets.
PERFORMANCE DISCUSSION
The Fund increased 13.00% during the six-month period ended March 31, 2007. Strong stock selection in the technology sector added significant value to the Fund’s relative performance. We also benefited from strength among our financial and consumer staples holdings. Detracting from performance were certain holdings in the consumer discretionary sector and our absence from a strong utilities group. Electronic components distributor Avnet, Inc. and analog and digital signal processor manufacturer Analog Devices, Inc. were our leading contributors in the technology sector.
Among our financial holdings, our strongest performers included two of our property and casualty insurance and reinsurance providers, Alleghany Corporation and White Mountains Insurance Group, Ltd., as well as real estate investment trust Annaly Capital Management, Inc. Our lack of investment in the banking industry also contributed positively to relative performance as the group underperformed. All three of our protein producers—Tyson Foods, Inc., Pilgrim’s Pride Corporation and Smithfield Foods, Inc. (a new purchase during the period)—were solid performers. Other positive contributors included two of our energy-related holdings—oil and gas exploration and production company Noble Energy, Inc. and oil tanker owner Teekay Shipping Corporation. In the consumer discretionary sector, our underperformers were household furnishings companies Furniture Brands International, Inc. and Leggett & Platt, Incorporated as well as athletic footwear and apparel retailer Foot Locker, Inc.
FUND CHANGES
In addition to Smithfield Foods, our largest purchases during the period were GATX Corporation (a railcar leasing company), Alexander & Baldwin, Inc. (a diversified company with ocean transportation and property development and management operations), IndyMac Bancorp, Inc. (a holding company for IndyMac Bank, the 9th largest thrift nationwide (based on assets) and the 9th largest mortgage originator) and BJ Services Company (the third largest provider of pressure pumping services for the petroleum industry). We were attracted to all of our new positions based on the key characteristics of our investment process: attractive valuation, sound financial condition and attractive business economics.
Our purchases were funded in part by the sales of Hilton Hotels Corporation, Hasbro, Inc., Pogo Producing Company, Manpower Inc. and H&R Block, Inc.
11
ARTISAN OPPORTUNISTIC VALUE FUND (ARTLX)
INVESTMENT PROCESS HIGHLIGHTS
Artisan Opportunistic Value Fund uses a bottom-up investment process to construct a flexible portfolio of value-oriented companies that the team believes are undervalued, in solid financial condition and have attractive business economics. The team believes companies with these characteristics are less likely to experience eroding values over the long-term.
Attractive valuation. The team values a business using what it believes are reasonable expectations for the long-term earnings power and capitalization rates of that business. This results in a range of values for the company that the team believes would be reasonable. The team generally will purchase a security if the stock price falls below or toward the lower end of that range.
Sound financial condition. The team favors companies with an acceptable level of debt and positive cash flow. At a minimum, the team tries to avoid companies that have so much debt that management may be unable to make decisions that would be in the best interests of the companies’ shareholders.
Attractive business economics. The team favors cash-producing businesses that it believes are capable of earning acceptable returns on capital over the company’s business cycle.
The Fund primarily invests in securities with market capitalizations greater than $1.5 billion at the time of initial purchase.
The Fund can invest up to 25% of its assets in non-U.S. securities.
PERFORMANCE HISTORY
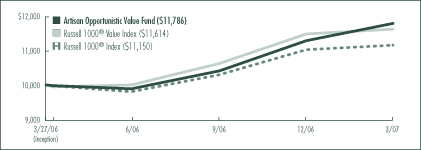
GROWTH OF AN ASSUMED $10,000 INVESTMENT (3/27/06 to 3/31/07)
TOTAL RETURNS (as of 3/31/07)
| | | | | | |
| Fund / Index | | 1-Year | | | Since
Inception | |
Artisan Opportunistic Value Fund | | 18.10 | % | | 17.65 | % |
Russell 1000® Value Index | | 16.83 | | | 15.96 | |
Russell 1000® Index | | 11.84 | | | 11.37 | |
The performance quoted represents past performance, which does not guarantee future results. The investment return and principal value of an investment in the Fund will fluctuate, so that an investor’s shares in the Fund, when redeemed, may be worth more or less than their original cost. Current performance may be lower or higher than the performance data quoted. For current to most recent month-end performance information, visit www.artisanfunds.com or call 800.344.1770. The graph and table above do not reflect the deduction of taxes that a shareholder would pay on distributions or sale of Fund shares. The Fund’s performance information reflects Artisan Partners’ undertaking to limit the Fund’s expenses, which may be terminated at any time, has been in effect since the Fund’s inception and has had a material impact on the Fund’s performance. In addition, the outside directors of Artisan Funds have waived that portion of their fees allocable to the Fund for the fiscal year ended September 30, 2006. Absent that expense waiver, the Fund’s performance would have been lower. See page 86 for a description of each index.
12
INVESTING ENVIRONMENT
Stocks of all sizes made strong advances during the six-month period ended March 31, 2007. Though large-cap stocks as a whole generated solid gains in excess of 8%, as measured by the Russell 1000® Index they trailed both small- and mid-cap companies during the period, which returned over 11% and 12%, respectively. Strength in the market was broad across sectors. Materials, utilities and energy stocks were among the strongest performers. In contrast, the healthcare, technology and financial sectors failed to keep pace with the broad market.
SECTOR DIVERSIFICATION
| | | | | | |
| Sector | | 9/30/06 | | | 3/31/07 | |
Auto & Transportation | | 2.1 | % | | 2.1 | % |
Consumer Discretionary | | 24.2 | | | 19.5 | |
Consumer Staples | | — | | | 2.1 | |
Financial Services | | 31.7 | | | 31.5 | |
Healthcare | | 3.6 | | | 2.4 | |
Integrated Oils | | 2.4 | | | 2.5 | |
Materials & Processing | | 2.8 | | | — | |
Other | | 3.8 | | | 3.7 | |
Other Energy | | 10.0 | | | 9.8 | |
Producer Durables | | — | | | 6.8 | |
Technology | | 16.7 | | | 11.7 | |
Other assets less liabilities | | 2.7 | | | 7.9 | |
Total | | 100.0 | % | | 100.0 | % |
As a percentage of total net assets.
PERFORMANCE DISCUSSION
The Fund is constructed from the bottom-up without concern for the characteristics of a benchmark, and our sector weights and market cap characteristics also varied quite widely from those of the Index. For the six-month period ended March 31, 2007, the Fund increased 13.22%. Our strongest positive contributors to performance were electronic components distributor Avnet, Inc., athletic footwear and apparel retailer NIKE, Inc., oil and natural gas producer Apache Corporation, financial services provider Royal Bank of Scotland Group plc and oil refiner Valero Energy Corporation. The Fund’s largest decliners were auto insurance provider The Progressive Corporation and two of our more recent purchases, banking and financial services group BNP Paribas and holding company IndyMac Bancorp.
FUND CHANGES
In addition to BNP Paribas and IndyMac Bancorp, our purchases during the period included Nokia Corporation (the world’s largest maker of mobile phones), Ingersoll-Rand Company Limited (a global provider of climate control, industrial, compact vehicle, construction and security products), Statoil ASA (a Norwegian oil and gas company), Ingram Micro Inc. (the largest distributor of IT related products in the world), Smithfield Foods, Inc. (the largest hog producer and pork processor in the world) and Allied World Assurance Company Holdings, Ltd. (specialty insurance and reinsurance provider). We were attracted to these new positions based on the key characteristics of our investment process: attractive valuation, sound financial condition and attractive business economics.
All six of our sales during the period were due to valuation. We sold the following companies as their prices reached our target selling ranges—ConocoPhillips, International Business Machines Corporation, Countrywide Financial Corporation, The Dow Chemical Company, Rent-A-Center, Inc. and Johnson & Johnson.
13
ARTISAN SMALL CAP FUND (ARTSX)
INVESTMENT PROCESS HIGHLIGHTS
Artisan Small Cap Fund uses a bottom-up investment process to construct a diversified portfolio of U.S. small-cap growth companies.
Competitive advantages. A sustainable competitive advantage is critical to producing above average growth and profitability. Identifying the source of a company’s competitive advantage lends confidence to the team’s assessment of intrinsic value.
Return on invested capital. The team believes that, over time, a company with improving returns on its invested capital will be rewarded with a higher valuation. The team determines how much capital investment is needed to achieve a company’s continued growth and analyzes management’s ability to use that capital in the most effective way to support that growth.
Intrinsic value. The team estimates a company’s intrinsic value—the value it thinks a buyer would pay to buy the entire company. The team bases its buy and sell targets for a company’s stock on its intrinsic value estimates.
The Fund primarily invests in companies with market capitalizations between $300 million and $1.5 billion that meet its standards for earnings growth and sustainable growth prospects.
PERFORMANCE HISTORY
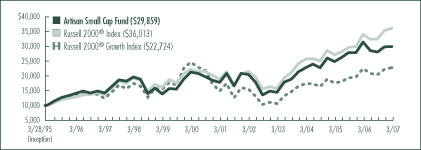
GROWTH OF AN ASSUMED $10,000 INVESTMENT (3/28/95 to 3/31/07)
AVERAGE ANNUAL TOTAL RETURNS (as of 3/31/07)
| | | | | | | | | | | | | | | |
| Fund / Index | | 1-Year | | | 3-Year | | | 5-Year | | | 10-Year | | | Since
Inception | |
Artisan Small Cap Fund | | (4.74 | %) | | 9.45 | % | | 7.83 | % | | 7.75 | % | | 9.54 | % |
Russell 2000® Growth Index | | 1.56 | | | 9.41 | | | 7.88 | | | 6.31 | | | 7.07 | |
Russell 2000® Index | | 5.91 | | | 12.00 | | | 10.95 | | | 10.23 | | | 11.26 | |
The performance quoted represents past performance, which does not guarantee future results. The investment return and principal value of an investment in the Fund will fluctuate, so that an investor’s shares in the Fund, when redeemed, may be worth more or less than their original cost. Current performance may be lower or higher than the performance data quoted. For current to most recent month-end performance information, visit www.artisanfunds.com or call 800.344.1770. The graph and table above do not reflect the deduction of taxes that a shareholder would pay on distributions or sale of Fund shares. See page 86 for a description of each index.
14
INVESTING ENVIRONMENT
Small-cap stocks, as measured by the Russell 2000® Index, tacked on a nice gain over the six-month period ended March 31, 2007, advancing 11.02%. Growth stocks held a slight advantage over value stocks as the Russell 2000® Growth Index gained 11.46% compared to the 10.62% return for the Russell 2000® Value Index for the same period. Though performance was strong over the full period, returns were not achieved without some volatility as subprime mortgage industry woes and a sell-off in Chinese stocks contributed to a bumpy ride during February and March of 2007. Across the sectors in the Russell 2000® Growth Index, the standout performers were materials, consumer staples and transportation stocks. Not surprisingly, amid the subprime mortgage industry concerns, financials were laggards.
SECTOR DIVERSIFICATION
| | | | | | |
| Sector | | 9/30/06 | | | 3/31/07 | |
Auto & Transportation | | 5.4 | % | | 5.8 | % |
Consumer Discretionary | | 23.1 | | | 24.0 | |
Financial Services | | 19.8 | | | 14.1 | |
Healthcare | | 10.1 | | | 13.4 | |
Materials & Processing | | 4.7 | | | 4.3 | |
Other Energy | | 6.8 | | | 7.3 | |
Producer Durables | | 5.3 | | | 6.6 | |
Technology | | 21.8 | | | 20.0 | |
Utilities | | — | | | 1.5 | |
Other assets less liabilities | | 3.0 | | | 3.0 | |
Total | | 100.0 | % | | 100.0 | % |
As a percentage of total net assets.
PERFORMANCE DISCUSSION
The Fund gained 6.47% for the six-month period ended March 31, 2007. The Fund had strong performers in the utilities, healthcare and technology sectors. The materials sector was the Fund’s primary source of weakness relative to the Russell 2000® Growth Index. In the utilities sector, our leading performer was electricity transmission company ITC Holdings Corp. (a new purchase during the period), which generated a solid gain. Among our healthcare stocks, ventricular assist device maker Thoratec Corporation and clinical research services company ICON PLC were top contributors to performance as each returned more than 20%. Their contributions to the Fund’s return were partially offset by weakness in respiratory pharmaceutical company Adams Respiratory Therapeutics, Inc. We sold our position in Adams Respiratory Therapeutics due to lower growth expectations.
In the technology sector, the Fund benefited from the strength of customer intelligence software company Witness Systems, Inc. and applied technologies company Aeroflex Incorporated, both of which received takeout offers during the period. We sold our position in Witness Systems and reduced our weight in Aeroflex.
Our low weight in commodity-sensitive stocks was part of the reason for the Fund’s underperformance in the materials sector. Roofing materials company Beacon Roofing Supply, Inc. also declined, which further contributed to our negative results in the sector. We sold our position in Beacon due to lower growth expectations.
FUND CHANGES
During the period, a pick up in volatility presented us with a number of opportunities. We used those opportunities to invest in companies that met our security selection criteria: competitive advantages, return on invested capital and intrinsic valuation. Our largest purchases were Transaction Systems Architects, Inc., an electronic payment software maker; Microsemi Corporation, a semiconductor company; Brightpoint, Inc., a wireless services company; and Iconix Brand Group, Inc., a brand manager.
Our purchases were funded by the sales already mentioned, and others, including Open Solutions Inc., F5 Networks, Inc., Central Garden & Pet Company and Max Re Capital Ltd.
15
ARTISAN SMALL CAP VALUE FUND (ARTVX)
INVESTMENT PROCESS HIGHLIGHTS
Artisan Small Cap Value Fund uses a bottom-up investment process to construct a diversified portfolio of U.S. small-cap value companies that the investment team believes are undervalued, in sound financial condition and have attractive business economics. The team believes companies with these characteristics are less likely to experience eroding values over the long-term.
Attractive valuation. The team values a business using what it believes are reasonable expectations for the long-term earnings power and capitalization rates of that business. This results in a range of values for the company that the team believes would be reasonable. The team generally will purchase a security if the stock price falls below or toward the lower end of that range.
Sound financial condition. The team favors companies with an acceptable level of debt and positive cash flow. At a minimum, the team tries to avoid companies that have so much debt that management may be unable to make decisions that would be in the best interests of the companies’ shareholders.
Attractive business economics. The team favors cash-producing businesses that it believes are capable of earning acceptable returns on capital over the company’s business cycle.
The Fund primarily invests in U.S. securities with market capitalizations below $1.5 billion at the time of purchase.
PERFORMANCE HISTORY
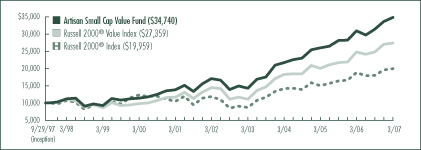
GROWTH OF AN ASSUMED $10,000 INVESTMENT (9/29/97 to 3/31/07)
AVERAGE ANNUAL TOTAL RETURNS (as of 3/31/07)
| | | | | | | | | | | | |
| Fund / Index | | 1-Year | | | 3-Year | | | 5-Year | | | Since
Inception | |
Artisan Small Cap Value Fund | | 12.50 | % | | 16.95 | % | | 15.30 | % | | 14.00 | % |
Russell 2000® Value Index | | 10.38 | | | 14.47 | | | 13.61 | | | 11.17 | |
Russell 2000® Index | | 5.91 | | | 12.00 | | | 10.95 | | | 7.54 | |
The performance quoted represents past performance, which does not guarantee future results. The investment return and principal value of an investment in the Fund will fluctuate, so that an investor’s shares in the Fund, when redeemed, may be worth more or less than their original cost. Current performance may be lower or higher than the performance data quoted. For current to most recent month-end performance information, visit www.artisanfunds.com or call 800.344.1770. The graph and table above do not reflect the deduction of taxes that a shareholder would pay on distributions or sale of Fund shares. See page 86 for a description of each index.
16
INVESTING ENVIRONMENT
The six-month period ended March 31, 2007, was a very strong period for small cap stocks as the Russell 2000® Value and Russell 2000® indices increased 10.62% and 11.02%, respectively. Most sectors in the Russell 2000® Value Index posted double-digit returns—consumer staples and materials were two of the leaders. The financials sector significantly underperformed during the same period.
SECTOR DIVERSIFICATION
| | | | | | |
| Sector | | 9/30/06 | | | 3/31/07 | |
Auto & Transportation | | 3.5 | % | | 4.5 | % |
Consumer Discretionary | | 30.3 | | | 22.8 | |
Consumer Staples | | 1.9 | | | 1.7 | |
Financial Services | | 14.0 | | | 12.0 | |
Healthcare | | 4.2 | | | 4.8 | |
Materials & Processing | | 9.8 | | | 9.4 | |
Other | | — | | | 1.1 | |
Other Energy | | 12.0 | | | 17.9 | |
Producer Durables | | 2.9 | | | 5.4 | |
Technology | | 11.6 | | | 11.1 | |
Utilities | | 2.5 | | | 1.9 | |
Other assets less liabilities | | 7.3 | | | 7.4 | |
Total | | 100.0 | % | | 100.0 | % |
As a percentage of total net assets.
PERFORMANCE DISCUSSION
The Fund gained 10.98% for the six-month period ended March 31, 2007, which compared to the 10.62% return for the Russell 2000® Value Index. The Fund was generally supported by the returns of our financial and healthcare stocks during the period. Conversely, selection in the consumer discretionary sector hurt the Fund’s relative results. In the financials sector, our list of leading contributors included title insurance provider Stewart Information Services Corporation and our insurance brokers Hub International Limited and Hilb Rogal & Hobbs Company. Our lack of investment in the banking industry also contributed positively to relative performance as the group underperformed. Among our healthcare holdings, two of our strongest contributors were medical instruments developer CONMED Corporation and health and security imaging systems manufacturer Analogic Corporation. Other top contributors included casing and tubing manufacturer Lone Star Technologies, Inc., automotive and residential materials and components manufacturer Quanex Corporation and oil services company RPC, Inc. In the consumer discretionary sector, among our underperformers were residential furniture manufacturer Furniture Brands International, Inc. and human resources services provider Gevity HR, Inc. Other holdings that underperformed during the period included oil and gas company Stone Energy Corporation, mortgage banking company Accredited Home Lenders Holding Co., and flat panel displays inspecting equipment manufacturer Orbotech, Ltd.
FUND CHANGES
We found opportunities during the period to purchase several new names and sold several others. We were attracted to all of our new positions based on the key characteristics of our investment process: attractive valuation, sound financial condition and attractive business economics.
We found several attractive investment opportunities in the computer services and software industry. We bought CACI International Inc., SRA International, Inc. and SI International Inc., all of which provide information technology services to federal government agencies; SonicWALL, Inc., a provider of Internet security solutions for broadband customers in small- to mid-sized businesses; and webMethods, Inc., a provider of integration software services. We also purchased Grey Wolf, Inc. (a land drilling contractor), CARBO Ceramics Inc. (a materials supplier to the oil and gas industry) and Walter Industries, Inc. (a diversified company with operations primarily in two distinct segments—coal mining and natural gas production, and homebuilding and financing for lower income customers), among others.
Our sales during the period included Applebee’s International, Inc., Albemarle Corporation, Open Text Corporation and Superior Industries International, Inc.
17
ARTISAN FUNDS, INC.
Top Ten Holdings – March 31, 2007 (Unaudited)
ARTISAN INTERNATIONAL FUND
| | | | | |
| Company Name | | Country | | 3/31/07 | |
UBS AG | | Switzerland | | 3.1 | % |
Allianz SE | | Germany | | 2.5 | |
Bouygues SA | | France | | 2.4 | |
Nestle SA | | Switzerland | | 2.4 | |
Fortum Oyj | | Finland | | 2.1 | |
Mitsubishi Heavy Industries, Ltd. | | Japan | | 2.1 | |
Publishing & Broadcasting Limited | | Australia | | 2.1 | |
Kookmin Bank | | South Korea | | 2.0 | |
Swiss Re | | Switzerland | | 2.0 | |
Credit Saison Co., Ltd. | | Japan | | 1.9 | |
Total | | | | 22.6 | % |
As a percentage of total net assets. Top 10 Holdings are determined by issuer.
ARTISAN INTERNATIONAL VALUE FUND
| | | | | |
| Company Name | | Country | | 3/31/07 | |
Diageo PLC | | United Kingdom | | 5.1 | % |
Tyco International Ltd. | | United States | | 4.9 | |
Wolters Kluwer NV | | Netherlands | | 4.5 | |
Vodafone Group PLC | | United Kingdom | | 4.0 | |
Pfeiffer Vacuum Technology AG | | Germany | | 3.7 | |
Galiform Plc | | United Kingdom | | 3.6 | |
Adecco SA | | Switzerland | | 3.5 | |
Benfield Group Plc | | United Kingdom | | 3.4 | |
Givaudan SA | | Switzerland | | 3.0 | |
Heidelberger Druckmaschinen AG | | Germany | | 3.0 | |
Total | | | | 38.7 | % |
As a percentage of total net assets. Top 10 Holdings are determined by issuer.
ARTISAN INTERNATIONAL SMALL CAP FUND
| | | | | |
| Company Name | | Country | | 3/31/07 | |
Spazio Investment NV | | Italy | | 3.2 | % |
Fraser & Neave Limited | | Singapore | | 2.7 | |
Empresas ICA S.A.B. de C.V. | | Mexico | | 2.6 | |
Sibir Energy PLC | | United Kingdom | | 2.2 | |
Bank Sarasin & Cie AG | | Switzerland | | 2.2 | |
NTT URBAN DEVELOPMENT CORPORATION | | Japan | | 2.0 | |
Vossloh AG | | Germany | | 2.0 | |
Geodis SA | | France | | 1.9 | |
Commercial International Bank | | Egypt | | 1.9 | |
CREED CORPORATION | | Japan | | 1.8 | |
Total | | | | 22.5 | % |
As a percentage of total net assets. Top 10 Holdings are determined by issuer.
ARTISAN MID CAP FUND
| | | | | |
| Company Name | | Country | | 3/31/07 | |
Thermo Fisher Scientific, Inc. | | United States | | 4.5 | % |
Electronic Arts Inc. | | United States | | 4.3 | |
MedImmune, Inc. | | United States | | 3.0 | |
Allergan, Inc. | | United States | | 2.8 | |
Chico's FAS, Inc. | | United States | | 2.6 | |
MGIC Investment Corporation | | United States | | 2.5 | |
Supervalu Inc. | | United States | | 2.1 | |
NII Holdings, Inc. | | United States | | 1.9 | |
Hansen Natural Corporation | | United States | | 1.8 | |
Intermec, Inc. | | United States | | 1.8 | |
Total | | | | 27.3 | % |
As a percentage of total net assets. Top 10 Holdings are determined by issuer.
18
ARTISAN MID CAP VALUE FUND
| | | | | |
| Company Name | | Country | | 3/31/07 | |
Alleghany Corporation | | United States | | 3.7 | % |
Avnet, Inc. | | United States | | 3.2 | |
Nabors Industries Ltd. | | United States | | 2.8 | |
Pioneer Natural Resources Company | | United States | | 2.7 | |
Noble Energy, Inc. | | United States | | 2.6 | |
Forest Oil Corporation | | United States | | 2.5 | |
Ingram Micro Inc. | | United States | | 2.5 | |
Fidelity National Financial, Inc. | | United States | | 2.4 | |
The Student Loan Corporation | | United States | | 2.4 | |
Hewitt Associates, Inc. | | United States | | 2.4 | |
Total | | | | 27.2 | % |
As a percentage of total net assets. Top 10 Holdings are determined by issuer.
ARTISAN SMALL CAP FUND
| | | | | |
| Company Name | | Country | | 3/31/07 | |
Global Cash Access Holdings, Inc. | | United States | | 1.9 | % |
W-H Energy Services, Inc. | | United States | | 1.9 | |
HealthExtras, Inc. | | United States | | 1.8 | |
optionsXpress Holdings, Inc. | | United States | | 1.8 | |
K-V Pharmaceutical Company | | United States | | 1.8 | |
Avocent Corporation | | United States | | 1.8 | |
Transaction Systems Architects, Inc. | | United States | | 1.8 | |
Euronet Worldwide, Inc. | | United States | | 1.7 | |
Microsemi Corporation | | United States | | 1.7 | |
Actuant Corporation | | United States | | 1.7 | |
Total | | | | 17.9 | % |
As a percentage of total net assets. Top 10 Holdings are determined by issuer.
ARTISAN OPPORTUNISTIC VALUE FUND
| | | | | |
| Company Name | | Country | | 3/31/07 | |
Apache Corporation | | United States | | 4.9 | % |
Wal-Mart Stores, Inc. | | United States | | 4.9 | |
Royal Bank of Scotland Group PLC | | United Kingdom | | 4.7 | |
American International Group, Inc. | | United States | | 4.7 | |
BNP Paribas | | France | | 4.2 | |
Nokia Corporation | | Finland | | 4.0 | |
Berkshire Hathaway Inc. | | United States | | 3.7 | |
Avnet, Inc. | | United States | | 3.6 | |
NIKE, Inc. | | United States | | 3.5 | |
The Progressive Corporation | | United States | | 2.9 | |
Total | | | | 41.1 | % |
As a percentage of total net assets. Top 10 Holdings are determined by issuer.
ARTISAN SMALL CAP VALUE FUND
| | | | | |
| Company Name | | Country | | 3/31/07 | |
Stewart Information Services Corporation | | United States | | 3.0 | % |
Lone Star Technologies, Inc. | | United States | | 2.7 | |
Lawson Software, Inc. | | United States | | 2.2 | |
St. Mary Land & Exploration Company | | United States | | 2.1 | |
Hilb Rogal & Hobbs Company | | United States | | 2.1 | |
Orbotech Ltd. | | Israel | | 2.0 | |
Quanex Corporation | | United States | | 1.9 | |
Ethan Allen Interiors Inc. | | United States | | 1.9 | |
Tetra Tech, Inc. | | United States | | 1.9 | |
Zale Corporation | | United States | | 1.8 | |
Total | | | | 21.6 | % |
As a percentage of total net assets. Top 10 Holdings are determined by issuer.
19
ARTISAN INTERNATIONAL FUND
Schedule of Investments – March 31, 2007 (Unaudited)
| | | | | |
| | | Shares
Held | | Value |
| | | | | |
COMMON AND
PREFERRED STOCKS - 98.5% | | | | | |
| | | | | |
| AUSTRALIA - 2.1% | | | | | |
Publishing & Broadcasting Limited | | 20,919,713 | | $ | 335,983,921 |
| | | | | |
| AUSTRIA - 1.0% | | | | | |
Wiener Staedtische Versicherung AG | | 2,241,674 | | | 159,010,094 |
| | | | | |
| BELGIUM - 2.0% | | | | | |
Dexia SA | | 2,430,313 | | | 72,527,565 |
Fortis | | 5,560,111 | | | 253,871,085 |
Umicore | | 9,380 | | | 1,667,780 |
| | | | | |
| | | | | 328,066,430 |
| BRAZIL - 0.3% | | | | | |
Vivo Participacoes S.A., Preferred (ADR) | | 13,530,268 | | | 47,491,241 |
| | | | | |
| CANADA - 0.9% | | | | | |
Nortel Networks Corporation(1) | | 6,278,900 | | | 151,007,545 |
| | | | | |
| CHINA - 7.1% | | | | | |
China Construction Bank | | 124,150,000 | | | 70,865,681 |
China Life Insurance Co., Limited, Series H | | 57,212,500 | | | 164,750,912 |
China Merchants Holdings International Company Limited | | 38,801,000 | | | 163,874,448 |
China Mobile Ltd. | | 20,342,700 | | | 185,111,150 |
China Netcom Group Corporation (Hong Kong) Limited | | 49,380,100 | | | 129,240,807 |
China Resources Enterprise Ltd | | 17,826,200 | | | 59,432,074 |
China Resources Land Limited | | 69,382,300 | | | 83,470,099 |
China Unicom Limited | | 188,297,500 | | | 271,354,687 |
Denway Motors Limited | | 19,166,100 | | | 8,364,549 |
Tencent Holdings Limited | | 2,569,600 | | | 8,386,101 |
| | | | | |
| | | | | 1,144,850,508 |
| DENMARK - 0.3% | | | | | |
A P Moeller - Maersk A/S, Series B | | 5,176 | | | 54,008,014 |
| | | | | |
| FINLAND - 2.2% | | | | | |
Fortum Oyj(2) | | 11,871,479 | | | 346,191,407 |
| | | | | |
| FRANCE - 11.3% | | | | | |
Alstom(1) | | 1,581,586 | | | 205,254,807 |
Bouygues SA | | 5,108,002 | | | 394,740,913 |
Carrefour SA | | 3,790,879 | | | 277,256,518 |
Electricite de France (EDF) | | 3,222,197 | | | 270,142,393 |
| | | | | |
| | | Shares
Held | | Value |
| | | | | |
| FRANCE (CONTINUED) | | | | | |
LVMH Moet Hennessy Louis Vuitton SA | | 2,158,767 | | $ | 239,498,681 |
Technip SA | | 2,626,443 | | | 192,688,692 |
Vinci SA | | 1,521,641 | | | 235,832,026 |
| | | | | |
| | | | | 1,815,414,030 |
| GERMANY - 10.0% | | | | | |
Allianz SE | | 1,972,290 | | | 404,977,238 |
Bayerische Motoren Werke (BMW) AG | | 827,391 | | | 48,819,791 |
DaimlerChrysler AG | | 1,992,255 | | | 163,407,135 |
Deutsche Post AG | | 6,267,158 | | | 189,709,146 |
E.ON AG | | 1,017,700 | | | 138,369,363 |
Fraport AG | | 2,254,345 | | | 164,667,012 |
IVG Immobilien AG | | 1,241,382 | | | 59,450,064 |
Linde AG | | 562,961 | | | 60,651,340 |
RWE AG | | 1,624,498 | | | 171,849,093 |
United Internet AG | | 1,852,470 | | | 36,005,753 |
Wacker Chemie AG(1) | | 1,027,445 | | | 178,426,622 |
| | | | | |
| | | | | 1,616,332,557 |
| HONG KONG - 4.9% | | | | | |
The Bank of East Asia, Ltd. | | 5,012,300 | | | 29,155,825 |
Hutchison Whampoa Limited | | 19,473,800 | | | 187,173,786 |
MTR Corporation Limited | | 27,340,800 | | | 68,443,853 |
NWS Holdings Limited | | 38,262,246 | | | 103,570,295 |
Sun Hung Kai Properties Limited | | 18,813,400 | | | 217,424,972 |
Swire Pacific Limited, A Shares | | 17,048,177 | | | 191,242,428 |
| | | | | |
| | | | | 797,011,159 |
| ITALY - 3.7% | | | | | |
Hera SpA | | 7,168,780 | | | 30,165,708 |
Intesa Sanpaolo | | 16,518,998 | | | 125,450,353 |
Mediobanca S.p.A. | | 5,196,386 | | | 115,716,349 |
Telecom Italia S.p.A. - RNC | | 22,702,705 | | | 56,136,036 |
UniCredito Italiano SpA | | 29,060,970 | | | 276,600,330 |
| | | | | |
| | | | | 604,068,776 |
| JAPAN - 12.8% | | | | | |
Chugai Pharmaceutical Co., Ltd. | | 5,895,900 | | | 149,098,625 |
Credit Saison Co., Ltd.(3) | | 9,332,200 | | | 307,272,030 |
JAPAN TOBACCO INC. | | 52,487 | | �� | 257,891,828 |
Jupiter Telecommunications Co., Ltd.(1) | | 227,341 | | | 190,994,221 |
KEYENCE CORPORATION | | 252,850 | | | 57,054,324 |
KUBOTA CORPORATION | | 3,224,900 | | | 28,269,872 |
Mitsubishi Estate Company Ltd. | | 4,657,400 | | | 152,954,328 |
Mitsubishi Heavy Industries, Ltd. | | 53,478,200 | | | 345,811,171 |
Mitsui Fudosan Co., Ltd. | | 4,213,900 | | | 123,727,885 |
20
| | | | | |
| | | Shares
Held | | Value |
| | | | | |
| JAPAN (CONTINUED) | | | | | |
Mizuho Financial Group, Inc. | | 10,399 | | $ | 66,979,303 |
NTT Data Corporation | | 21,083 | | | 107,168,338 |
ORIX Corporation | | 1,091,970 | | | 284,483,019 |
| | | | | |
| | | | | 2,071,704,944 |
| LUXEMBOURG - 0.6% | | | | | |
RTL Group | | 772,286 | | | 92,849,248 |
| | | | | |
| MEXICO - 2.2% | | | | | |
Grupo Televisa S.A. (ADR) | | 8,131,029 | | | 242,304,664 |
Wal-Mart de Mexico SA de CV | | 27,476,200 | | | 117,315,091 |
| | | | | |
| | | | | 359,619,755 |
| NETHERLANDS - 3.1% | | | | | |
ASML Holding N.V.(1) | | 10,238,656 | | | 252,893,451 |
ASML Holding N.V., NY Shares(1) | | 620,474 | | | 15,356,732 |
ING Groep N.V. | | 4,295,360 | | | 181,606,338 |
Unilever NV CVA | | 1,467,933 | | | 42,748,457 |
| | | | | |
| | | | | 492,604,978 |
| NORWAY - 1.3% | | | | | |
Renewable Energy Corp AS(1) | | 2,322,800 | | | 52,545,120 |
SeaDrill Ltd.(1) | | 9,982,405 | | | 164,230,212 |
| | | | | |
| | | | | 216,775,332 |
| PORTUGAL - 0.1% | | | | | |
Sonae, S.G.P.S., S.A. | | 6,014,294 | | | 13,577,790 |
| | | | | |
| RUSSIA - 3.6% | | | | | |
LUKOIL (ADR) | | 3,139,682 | | | 271,582,493 |
NovaTek OAO (GDR) | | 872,583 | | | 50,609,814 |
OAO TMK (GDR)(1)(4) | | 1,059,675 | | | 35,605,080 |
RAO Unified Energy System (UES)(GDR) | | 1,640,060 | | | 223,458,175 |
| | | | | |
| | | | | 581,255,562 |
| SINGAPORE - 1.0% | | | | | |
Singapore Airlines Limited | | 15,385,400 | | | 168,340,401 |
| | | | | |
| SOUTH AFRICA - 0.6% | | | | | |
MTN Group Limited | | 6,571,374 | | | 89,224,666 |
| | | | | |
| SOUTH KOREA - 5.5% | | | | | |
Hana Financial Group Inc. | | 3,928,484 | | | 203,355,836 |
Kookmin Bank | | 3,603,853 | | | 323,304,840 |
NHN Corp.(1) | | 1,013,266 | | | 148,629,579 |
Shinhan Financial Group Co., Ltd. | | 3,628,338 | | | 208,259,196 |
| | | | | |
| | | | | 883,549,451 |
| SPAIN - 2.2% | | | | | |
Bolsas y Mercados Espanoles | | 177,172 | | | 8,683,614 |
Gamesa Corporacion Tecnologica, S.A. (Gamesa) | | 4,908,680 | | | 177,701,761 |
Industria de Diseno Textil, S.A. (Inditex) | | 2,733,417 | | | 169,901,285 |
| | | | | |
| | | | | 356,286,660 |
| | | | | | |
| | | Shares
Held | | Value |
| | | | | | |
| SWITZERLAND - 11.6% | | | | | | |
Adecco SA | | | 2,808,659 | | $ | 178,322,052 |
Nestle SA | | | 999,674 | | | 389,331,128 |
Novartis AG | | | 3,138,997 | | | 180,050,274 |
Roche Holding AG | | | 228,776 | | | 44,375,183 |
Roche Holding AG - Genussscheine | | | 1,413,621 | | | 250,116,047 |
Swiss Re | | | 3,447,086 | | | 314,880,094 |
UBS AG | | | 8,550,066 | | | 508,015,278 |
| | | | | | |
| | | | | | 1,865,090,056 |
| | | | | | |
| TAIWAN - 0.6% | | | | | | |
Taiwan Semiconductor Manufacturing Company Ltd. (ADR) | | | 8,586,138 | | | 92,300,984 |
| | | | | | |
| UNITED KINGDOM - 7.5% | | | | | | |
Barclays PLC | | | 10,032,195 | | | 142,338,722 |
British Sky Broadcasting Group plc | | | 6,194,112 | | | 68,746,405 |
Cadbury Schweppes PLC | | | 12,066,733 | | | 154,820,737 |
Carnival PLC | | | 1,496,098 | | | 72,100,896 |
Kingfisher PLC | | | 28,473,347 | | | 155,906,968 |
Lloyds TSB Group plc | | | 15,873,850 | | | 174,929,128 |
National Grid PLC | | | 11,487,375 | | | 180,278,245 |
Vodafone Group Plc | | | 3,391,251 | | | 9,042,553 |
William Morrison Supermarkets PLC | | | 42,657,451 | | | 259,175,353 |
| | | | | | |
| | | | | | 1,217,339,007 |
| | | | | | |
Total common and preferred stocks (Cost $11,221,220,267) | | | 15,899,954,516 |
| | | Par
Amount | | |
| SHORT-TERM INVESTMENTS (CASH EQUIVALENTS) - 0.9% | | | | | | |
| Repurchase agreement with Fixed Income Clearing Corporation, 5.00%, dated 3/30/07, due 4/2/07, maturity value $149,644,326, collateralized by $68,050,275 market value Federal National Mortgage Association Note, 6.30%, due 12/21/26, and $84,525,000 market value Federal National Mortgage Association Note, 6.625%, due 11/15/30 (Cost $149,582,000) | | $ | 149,582,000 | | | 149,582,000 |
| | | | | | |
| | | | | | |
Total investments - 99.4% (Cost $11,370,802,267) | | | | | | 16,049,536,516 |
| | | | | | |
Other assets less liabilities - 0.6% | | | 90,537,515 |
| | | | | | |
| | | | | | |
Total net assets - 100.0%(5) | | | | | $ | 16,140,074,031 |
| | | | | | |
21
(1) | Non-income producing security. |
(2) | 11,500,000 shares of the security, with a value of $335,358,482, were on loan at March 31, 2007. |
(3) | Affiliated company as defined by the Investment Company Act of 1940. See Note (6) in Notes to Financial Statements. |
(4) | Valued at a fair value in accordance with procedures established by the Board of Directors of Artisan Funds. In total, securities valued at a fair value were $35,605,080 or 0.2% of total net assets. |
(5) | Percentages for the various classifications relate to total net assets. |
Security names may not represent the legal name of the entity.
(ADR) American Depository Receipt
(GDR) Global Depository Receipt
| | | | | | |
PORTFOLIO DIVERSIFICATION - MARCH 31, 2007 (Unaudited) | |
| | | Value | | Percentage
of Total
Net Assets | |
Consumer Discretionary | | $ | 1,848,309,838 | | 11.4 | % |
Consumer Staples | | | 1,498,539,112 | | 9.3 | |
Energy | | | 679,111,211 | | 4.2 | |
Financials | | | 5,225,302,606 | | 32.4 | |
Healthcare | | | 623,640,129 | | 3.9 | |
Industrials | | | 2,320,161,514 | | 14.4 | |
Information Technology | | | 921,347,927 | | 5.7 | |
Materials | | | 240,745,742 | | 1.5 | |
Telecommunication Services | | | 1,182,342,053 | | 7.3 | |
Utilities | | | 1,360,454,384 | | 8.4 | |
| | | | | | |
Total common and preferred stocks | | | 15,899,954,516 | | 98.5 | |
Short-term investments | | | 149,582,000 | | 0.9 | |
| | | | | | |
Total investments | | | 16,049,536,516 | | 99.4 | |
Other assets less liabilities | | | 90,537,515 | | 0.6 | |
| | | | | | |
Total net assets | | $ | 16,140,074,031 | | 100.0 | % |
| | | | | | |
| | | | | | |
| CURRENCY EXPOSURE - MARCH 31, 2007 (Unaudited) | |
| | | Value | | Percentage
of Total Investments | |
Australian dollar | | $ | 335,983,921 | | 2.1 | % |
British pound | | | 1,217,339,007 | | 7.6 | |
Danish krone | | | 54,008,014 | | 0.3 | |
Euro | | | 5,809,045,238 | | 36.2 | |
Hong Kong dollar | | | 1,941,861,667 | | 12.1 | |
Japanese yen | | | 2,071,704,944 | | 12.9 | |
Mexican peso | | | 117,315,091 | | 0.7 | |
Norwegian krone | | | 216,775,332 | | 1.4 | |
Singapore dollar | | | 168,340,401 | | 1.0 | |
South African rand | | | 89,224,666 | | 0.6 | |
South Korean won | | | 883,549,451 | | 5.5 | |
Swiss franc | | | 1,865,090,056 | | 11.6 | |
US dollar | | | 1,279,298,728 | | 8.0 | |
| | | | | | |
Total investments | | $ | 16,049,536,516 | | 100.0 | % |
| | | | | | |
The accompanying notes are an integral part of the financial statements.
22
ARTISAN INTERNATIONAL SMALL CAP FUND
Schedule of Investments – March 31, 2007 (Unaudited)
| | | | | |
| | | Shares Held | | Value |
| | | | | |
| COMMON STOCKS - 97.6% | | | | | |
| | | | | |
| AUSTRALIA - 1.0% | | | | | |
Billabong International Limited | | 844,362 | | $ | 11,408,996 |
| | | | | |
| AUSTRIA - 3.2% | | | | | |
C.A.T. oil AG(1) | | 304,049 | | | 9,544,851 |
Flughafen Wien AG | | 127,899 | | | 12,525,299 |
Wienerberger AG | | 216,243 | | | 13,504,590 |
| | | | | |
| | | | | 35,574,740 |
| BRAZIL - 0.2% | | | | | |
GVT Holding SA(1) | | 162,200 | | | 1,873,688 |
| | | | | |
| CANADA - 1.1% | | | | | |
Great Canadian Gaming Corporation(1) | | 1,150,400 | | | 11,817,881 |
| | | | | |
| CHINA - 7.9% | | | | | |
Beijing Capital International Airport Company Limited, Series H | | 18,328,600 | | | 18,203,102 |
China Everbright International Limited | | 60,910,800 | | | 17,150,286 |
China Everbright Limited(1) | | 11,868,600 | | | 12,151,891 |
Hengan International Group Company Limited | | 5,249,900 | | | 15,386,537 |
Hi Sun Technology (China) Limited(1) | | 545,700 | | | 174,602 |
Shanghai Electric Group Company Limited, Series H | | 32,652,300 | | | 15,253,202 |
Xinhua Finance Limited(1) | | 15,397 | | | 9,655,790 |
| | | | | |
| | | | | 87,975,410 |
| DENMARK - 0.3% | | | | | |
TK Development A/S(1) | | 144,100 | | | 2,880,579 |
| | | | | |
| EGYPT - 1.9% | | | | | |
Commercial International Bank (GDR)(2) | | 2,140,747 | | | 20,872,283 |
| | | | | |
| FINLAND - 1.5% | | | | | |
Metso Corporation | | 326,300 | | | 17,239,366 |
| | | | | |
| FRANCE - 6.7% | | | | | |
Geodis SA | | 97,703 | | | 20,966,180 |
Guyenne et Gascogne SA | | 120,566 | | | 19,343,078 |
Kaufman & Broad S.A. | | 261,579 | | | 19,648,467 |
Norbert Dentressangle | | 152,000 | | | 14,213,445 |
| | | | | |
| | | | | 74,171,170 |
| | | | | |
| | | Shares Held | | Value |
| | | | | |
| GERMANY - 3.4% | | | | | |
DIC Asset AG | | 123,546 | | $ | 5,281,246 |
Vossloh AG | | 233,094 | | | 22,391,238 |
Wirecard AG(1) | | 899,003 | | | 9,955,736 |
| | | | | |
| | | | | 37,628,220 |
| GREECE - 1.3% | | | | | |
Greek Postal Savings Bank(1) | | 496,300 | | | 12,556,886 |
Metka S.A. | | 112,470 | | | 2,010,252 |
| | | | | |
| | | | | 14,567,138 |
| HONG KONG - 6.9% | | | | | |
Cafe De Coral Holdings Limited | | 4,818,000 | | | 8,706,746 |
Chen Hsong Holdings Limited | | 7,752,200 | | | 5,059,988 |
Emperor Entertainment Hotel Limited | | 26,860,200 | | | 5,122,122 |
Hong Kong Exchanges & Clearing Limited | | 2,078,000 | | | 20,212,197 |
Imagi International Holdings Limited(1) | | 6,120,200 | | | 3,328,963 |
Kowloon Development Company Limited | | 8,599,900 | | | 16,509,695 |
Tian An China Investments Company Limited(1) | | 22,987,400 | | | 17,652,064 |
| | | | | |
| | | | | 76,591,775 |
| INDIA - 2.5% | | | | | |
Indiabulls Financial Services Ltd. | | 1,651,313 | | | 16,032,534 |
Indiabulls Real Estate Ltd(1) | | 1,651,313 | | | 11,245,569 |
| | | | | |
| | | | | 27,278,103 |
| ITALY - 9.3% | | | | | |
Azimut Holding SpA | | 1,228,673 | | | 18,136,618 |
Davide Campari - Milano S.p.A. | | 474,607 | | | 4,672,608 |
Pirelli & C. Real Estate S.p.A. | | 214,202 | | | 16,249,990 |
Socotherm S.p.A. | | 1,015,711 | | | 15,861,432 |
Spazio Investment NV(3) | | 1,769,487 | | | 35,456,540 |
Tod’s S.p.A. | | 153,950 | | | 13,431,270 |
| | | | | |
| | | | | 103,808,458 |
| JAPAN - 11.0% | | | | | |
CREED CORPORATION | | 6,327 | | | 20,510,132 |
HASEKO Corporation(1) | | 3,407,800 | | | 12,435,115 |
NTT URBAN DEVELOPMENT CORPORATION | | 9,670 | | | 22,648,676 |
Ozeki Company, Ltd. | | 387,400 | | | 10,717,278 |
Pasona Inc. | | 7,285 | | | 15,393,457 |
Raito Kogyo Co., Ltd. | | 2,397,100 | | | 7,750,298 |
SHIZUOKA GAS CO., LTD. | | 1,906,000 | | | 13,538,035 |
SHO-BOND CORPORATION | | 1,287,700 | | | 13,877,962 |
USJ Co., Ltd.(1) | | 13,490 | | | 5,872,683 |
| | | | | |
| | | | | 122,743,636 |
23
| | | | | |
| | | Shares Held | | Value |
| | | | | |
| MEXICO - 3.4% | | | | | |
Empresas ICA S.A.B. de C.V.(1) | | 7,491,150 | | $ | 28,856,358 |
Organizacion Soriana S.A.B. de C.V., Series B | | 3,047,100 | | | 9,013,006 |
| | | | | |
| | | | | 37,869,364 |
| NETHERLANDS - 4.4% | | | | | |
Buhrmann NV | | 628,235 | | | 8,459,416 |
SBM Offshore NV | | 319,898 | | | 11,533,792 |
Tele Atlas NV(1) | | 567,386 | | | 12,748,595 |
VastNed Retail NV | | 158,273 | | | 16,132,033 |
| | | | | |
| | | | | 48,873,836 |
| NORWAY - 3.4% | | | | | |
Electromagnetic GeoServices AS(1) | | 210,050 | | | 5,028,096 |
Scandinavian Property Development ASA (SPD)(1)(2) | | 1,400,000 | | | 11,746,705 |
Sea Production Ltd.(1)(2) | | 1,000,000 | | | 1,974,236 |
SeaDrill Ltd.(1) | | 906,530 | | | 14,914,203 |
Sealift Ltd.(1)(2) | | 1,500,000 | | | 3,825,083 |
| | | | | |
| | | | | 37,488,323 |
| OMAN - 0.7% | | | | | |
Bank Muscat SAOG (GDR)(2) | | 414,532 | | | 4,684,212 |
Bank Muscat SAOG, Reg S (GDR)(2) | | 242,872 | | | 2,744,454 |
| | | | | |
| | | | | 7,428,666 |
| PHILIPPINES - 0.1% | | | | | |
First Gen Corporation | | 627,800 | | | 728,638 |
| | | | | |
| PORTUGAL - 0.7% | | | | | |
CIMPOR-Cimentos de Portugal, SGPS, SA | | 931,019 | | | 7,810,447 |
| | | | | |
| RUSSIA - 1.2% | | | | | |
Uralsvyazinform (ADR)(2) | | 1,067,900 | | | 13,882,700 |
| | | | | |
| SINGAPORE - 7.0% | | | | | |
Fraser & Neave Limited | | 8,878,600 | | | 29,846,001 |
Jaya Holdings Limited | | 13,987,200 | | | 13,368,118 |
SIA Engineering Company | | 4,214,200 | | | 13,055,229 |
Singapore Exchange Limited | | 4,177,000 | | | 18,033,385 |
Want Want Holdings Limited | | 1,928,000 | | | 3,759,600 |
| | | | | |
| | | | | 78,062,333 |
| SOUTH AFRICA - 1.1% | | | | | |
Massmart Holdings Limited | | 1,101,482 | | | 12,807,224 |
| | | | | |
| SOUTH KOREA - 2.0% | | | | | |
CDNetworks Co., Ltd.(1) | | 436,272 | | | 12,381,444 |
Kangwon Land Inc. | | 534,356 | | | 10,024,855 |
| | | | | |
| | | | | 22,406,299 |
| SWEDEN - 2.2% | | | | | |
D. Carnegie & Co AB | | 440,800 | | | 9,169,130 |
Elekta AB, B Shares | | 786,272 | | | 14,159,607 |
Gant Company AB(1) | | 36,100 | | | 1,274,367 |
| | | | | |
| | | | | 24,603,104 |
| | | | | | |
| | | Shares Held | | Value |
| SWITZERLAND - 5.7% | | | | | | |
Bank Sarasin & Cie AG, B Shares | | | 6,836 | | $ | 24,696,572 |
Banque Cantonale Vaudoise (BCV) | | | 11,371 | | | 5,413,425 |
iQ Power AG(1) | | | 1,386,491 | | | 4,056,196 |
Schindler Holding AG, Participation Certificates | | | 319,396 | | | 19,450,524 |
Straumann Holding AG(1) | | | 33,588 | | | 9,632,900 |
| | | | | | |
| | | | | | 63,249,617 |
| THAILAND - 0.4% | | | | | | |
Bangkok Bank Public Company Limited | | | 1,479,900 | | | 4,776,598 |
| | | | | | |
| TURKEY - 1.9% | | | | | | |
Akenerji Elektrik Uretim AS(1) | | | 972,781 | | | 3,298,510 |
Coca-Cola Icecek AS(1) | | | 2,217,815 | | | 17,844,489 |
| | | | | | |
| | | | | | 21,142,999 |
| UNITED KINGDOM - 5.2% | | | | | | |
IMI PLC | | | 914,996 | | | 10,443,330 |
Investec PLC | | | 1,288,180 | | | 16,679,932 |
Queen’s Walk Investment Ltd. | | | 728,254 | | | 5,768,930 |
Sibir Energy PLC(1) | | | 2,675,890 | | | 24,749,017 |
| | | | | | |
| | | | | | 57,641,209 |
| | | | | | |
Total common stocks (Cost $737,427,217) | | | | | | 1,085,202,800 |
| | | Par
Amount | | |
| SHORT-TERM INVESTMENTS (CASH EQUIVALENTS) - 1.0% | | | | | | |
Repurchase agreement with Fixed Income Clearing Corporation,
5.00%, dated 3/30/07, due 4/2/07, maturity value $10,998,581, collateralized by $11,217,169 market value Federal Home Loan Bank Note,
5.625%, due 3/14/36
(Cost $10,994,000) | | $ | 10,994,000 | | | 10,994,000 |
| | | | | | |
| | | | | | |
Total investments - 98.6% (Cost $748,421,217) | | | | | | 1,096,196,800 |
| | | | | | |
Other assets less liabilities - 1.4% | | | | | | 15,954,835 |
| | | | | | |
| | | | | | |
Total net assets - 100.0%(4) | | | | | $ | 1,112,151,635 |
| | | | | | |
(1) | Non-income producing security. |
(2) | Valued at a fair value in accordance with procedures established by the Board of Directors of Artisan Funds. In total, securities valued at a fair value were $59,729,673 or 5.4% of total net assets. |
(3) | Affiliated company as defined by the Investment Company Act of 1940. See Note (6) in Notes to Financial Statements. |
(4) | Percentages for the various classifications relate to total net assets. |
Security names may not represent the legal name of the entity.
(ADR) American Depository Receipt
(GDR) Global Depository Receipt
24
| | | | | | |
| PORTFOLIO DIVERSIFICATION - MARCH 31, 2007 (Unaudited) | |
| | | Value | | Percentage of Total Net Assets | |
Consumer Discretionary | | $ | 111,661,329 | | 10.1 | % |
Consumer Staples | | | 93,543,820 | | 8.4 | |
Energy | | | 81,631,391 | | 7.3 | |
Financials | | | 373,364,398 | | 33.6 | |
Healthcare | | | 23,792,507 | | 2.1 | |
Industrials | | | 347,695,893 | | 31.3 | |
Information Technology | | | 12,381,444 | | 1.1 | |
Materials | | | 7,810,447 | | 0.7 | |
Telecommunication Services | | | 15,756,388 | | 1.4 | |
Utilities | | | 17,565,183 | | 1.6 | |
| | | | | | |
Total common stocks | | | 1,085,202,800 | | 97.6 | |
Short-term investments | | | 10,994,000 | | 1.0 | |
| | | | | | |
Total investments | | | 1,096,196,800 | | 98.6 | |
Other assets less liabilities | | | 15,954,835 | | 1.4 | |
| | | | | | |
Total net assets | | $ | 1,112,151,635 | | 100.0 | % |
| | | | | | |
| | | | | | |
| CURRENCY EXPOSURE - MARCH 31, 2007 (Unaudited) | |
| | | Value | | Percentage
of Total
Investments | |
Australian dollar | | $ | 11,408,996 | | 1.0 | % |
Brazilian real | | | 1,873,688 | | 0.2 | |
British pound | | | 51,872,279 | | 4.7 | |
Canadian dollar | | | 11,817,881 | | 1.1 | |
Danish krone | | | 2,880,579 | | 0.3 | |
Euro | | | 349,498,501 | | 31.9 | |
Hong Kong dollar | | | 154,911,395 | | 14.1 | |
Indian rupee | | | 27,278,103 | | 2.5 | |
Japanese yen | | | 132,399,426 | | 12.1 | |
Mexican peso | | | 37,869,364 | | 3.5 | |
Norwegian krone | | | 37,488,323 | | 3.4 | |
Philippine peso | | | 728,638 | | 0.1 | |
Singapore dollar | | | 74,302,733 | | 6.8 | |
South African rand | | | 12,807,224 | | 1.2 | |
South Korean won | | | 22,406,299 | | 2.0 | |
Swedish krona | | | 24,603,104 | | 2.2 | |
Swiss franc | | | 59,193,421 | | 5.4 | |
Thai baht | | | 4,776,598 | | 0.4 | |
Turkish lira | | | 21,142,999 | | 1.9 | |
US dollar | | | 56,937,249 | | 5.2 | |
| | | | | | |
Total investments | | $ | 1,096,196,800 | | 100.0 | % |
| | | | | | |
The accompanying notes are an integral part of the financial statements.
25
ARTISAN INTERNATIONAL VALUE FUND
Schedule of Investments – March 31, 2007 (Unaudited)
| | | | | |
| | | Shares
Held | | Value |
| | | | | |
| COMMON STOCKS - 90.1% | | | | | |
| | | | | |
| BERMUDA - 1.2% | | | | | |
Lancashire Holdings Ltd(1) | | 3,622,158 | | $ | 24,163,449 |
| | | | | |
| CANADA - 2.8% | | | | | |
CanWest Global Communications Corp.(1) | | 5,991,900 | | | 57,401,831 |
| | | | | |
| FRANCE - 3.1% | | | | | |
Gemalto NV(1) | | 81,027 | | | 1,869,304 |
Sanofi-Aventis | | 360,718 | | | 31,369,422 |
Vivendi | | 744,289 | | | 30,245,344 |
| | | | | |
| | | | | 63,484,070 |
| GERMANY - 7.7% | | | | | |
Bayerische Motoren Werke (BMW) AG | | 340,644 | | | 20,099,528 |
Heidelberger Druckmaschinen AG | | 1,333,367 | | | 61,094,419 |
Pfeiffer Vacuum Technology AG(2) | | 822,027 | | | 74,824,863 |
| | | | | |
| | | | | 156,018,810 |
| HONG KONG - 3.3% | | | | | |
Guoco Group Limited | | 3,183,600 | | | 44,778,606 |
Pacific Century Premium Developments Limited | | 68,766,900 | | | 21,738,561 |
| | | | | |
| | | | | 66,517,167 |
| JAPAN - 14.4% | | | | | |
ACOM CO., LTD | | 449,570 | | | 19,113,592 |
Central Japan Railway Company | | 4,092 | | | 46,531,568 |
MEITEC CORPORATION(2) | | 1,832,900 | | | 59,105,737 |
SANKYO CO., LTD. | | 1,204,500 | | | 52,947,301 |
Sekisui House, Ltd. | | 3,199,700 | | | 49,798,454 |
TAKEFUJI CORPORATION | | 569,340 | | | 22,852,836 |
UNI-CHARM CORPORATION | | 665,200 | | | 42,111,270 |
| | | | | |
| | | | | 292,460,758 |
| MEXICO - 4.2% | | | | | |
Grupo Modelo, S.A. de C.V., Series C | | 7,861,200 | | | 40,273,672 |
Kimberly-Clark de Mexico, S.A. de C.V., Class A | | 9,840,700 | | | 43,906,822 |
| | | | | |
| | | | | 84,180,494 |
| | | | | |
| | | Shares
Held | | Value |
| NETHERLANDS - 4.5% | | | | | |
Wolters Kluwer NV | | 3,008,566 | | $ | 90,266,585 |
| | | | | |
| SOUTH KOREA - 3.4% | | | | | |
Honam Petrochemical Corporation | | 96,747 | | | 8,381,038 |
Lotte Chilsung Beverage Co., Ltd. | | 14,600 | | | 18,637,968 |
Lotte Confectionery Co., Ltd. | | 7,705 | | | 9,868,755 |
SK Telecom Co., Ltd. (ADR) | | 1,364,100 | | | 31,947,222 |
| | | | | |
| | | | | 68,834,983 |
| SWITZERLAND - 8.7% | | | | | |
Adecco SA | | 1,103,156 | | | 70,039,489 |
Givaudan SA | | 66,441 | | | 61,457,173 |
Panalpina Welttransport Holding AG | | 26,831 | | | 4,488,946 |
Pargesa Holding SA | | 281,483 | | | 29,534,693 |
Tamedia AG | | 81,060 | | | 11,006,789 |
| | | | | |
| | | | | 176,527,090 |
| UNITED KINGDOM - 28.7% | | | | | |
Benfield Group Plc | | 10,716,586 | | | 68,379,870 |
Carpetright PLC | | 1,040,855 | | | 23,821,098 |
Diageo PLC | | 5,073,939 | | | 102,792,972 |
Experian Group Ltd. | | 3,332,696 | | | 38,398,515 |
Galiform Plc(1) | | 23,637,823 | | | 72,448,161 |
Home Retail Group | | 5,939,371 | | | 51,893,774 |
Signet Group PLC | | 24,663,421 | | | 60,910,039 |
SurfControl PLC(1)(2) | | 1,871,963 | | | 17,497,770 |
Unilever PLC (ADR) | | 1,586,816 | | | 47,715,557 |
Vitec Group PLC | | 1,316,870 | | | 15,392,926 |
Vodafone Group PLC (ADR) | | 3,014,468 | | | 80,968,611 |
| | | | | |
| | | | | 580,219,293 |
| UNITED STATES - 8.1% | | | | | |
Arch Capital Group Ltd.(1) | | 312,336 | | | 21,304,439 |
Tyco International Ltd. | | 3,125,300 | | | 98,603,215 |
Willis Group Holdings Limited | | 1,108,500 | | | 43,874,430 |
| | | | | |
| | | | | 163,782,084 |
| | | | | |
Total common stocks
(Cost $1,532,753,477) | | | | | 1,823,856,614 |
26
| | | | | | |
| | | Par
Amount | | Value |
| SHORT-TERM INVESTMENTS (CASH EQUIVALENTS) - 9.0% | | | | | | |
Repurchase agreement with Fixed Income Clearing Corporation, 5.00%, dated 3/30/07, due 4/2/07, maturity value $183,032,232, collateralized by $28,556,625 market value Federal Home Loan Bank Note, 5.625%, due 3/14/36, and $158,061,000 market value Federal National Mortgage Association Note,
6.00%, due 4/18/36
(Cost $182,956,000) | | $ | 182,956,000 | | $ | 182,956,000 |
| | | | | | |
| | | | | | |
Total investments - 99.1%
(Cost $1,715,709,477) | | | | | | 2,006,812,614 |
| | | | | | |
Other assets less liabilities - 0.9% | | | | | | 17,683,205 |
| | | | | | |
| | | | | | |
Total net assets - 100.0%(3) | | | | | $ | 2,024,495,819 |
| | | | | | |
(1) | Non-income producing security. |
(2) | Affiliated company as defined by the Investment Company Act of 1940. See Note (6) in Notes to Financial Statements. |
(3) | Percentages for the various classifications relate to total net assets. |
Security names may not represent the legal name of the entity.
(ADR) American Depository Receipt
| | | | | | |
| PORTFOLIO DIVERSIFICATION -MARCH 31, 2007 (Unaudited) | |
| | | Value | | Percentage
of Total
Net Assets | |
Consumer Discretionary | | $ | 536,231,830 | | 26.5 | % |
Consumer Staples | | | 305,307,016 | | 15.1 | |
Financials | | | 295,740,476 | | 14.6 | |
Healthcare | | | 31,369,422 | | 1.5 | |
Industrials | | | 453,086,752 | | 22.4 | |
Information Technology | | | 19,367,074 | | 1.0 | |
Materials | | | 69,838,211 | | 3.4 | |
Telecommunication Services | | | 112,915,833 | | 5.6 | |
| | | | | | |
Total common stocks | | | 1,823,856,614 | | 90.1 | |
Short-term investments | | | 182,956,000 | | 9.0 | |
| | | | | | |
Total investments | | | 2,006,812,614 | | 99.1 | |
Other assets less liabilities | | | 17,683,205 | | 0.9 | |
| | | | | | |
Total net assets | | $ | 2,024,495,819 | | 100.0 | % |
| | | | | | |
| | | | | | |
| CURRENCY EXPOSURE - MARCH 31, 2007 (Unaudited) | |
| | | Value | | Percentage
of Total
Investments | |
British pound | | $ | 475,698,574 | | 23.7 | % |
Canadian dollar | | | 57,401,831 | | 2.9 | |
Euro | | | 309,769,465 | | 15.4 | |
Hong Kong dollar | | | 66,517,167 | | 3.3 | |
Japanese yen | | | 292,460,758 | | 14.6 | |
Mexican peso | | | 84,180,494 | | 4.2 | |
South Korean won | | | 36,887,761 | | 1.8 | |
Swiss franc | | | 176,527,090 | | 8.8 | |
US dollar | | | 507,369,474 | | 25.3 | |
| | | | | | |
Total investments | | $ | 2,006,812,614 | | 100.0 | % |
| | | | | | |
The accompanying notes are an integral part of the financial statements.
27
ARTISAN MID CAP FUND
Schedule of Investments – March 31, 2007 (Unaudited)
| | | | | |
| | | Shares Held | | Value |
| | | | | |
| COMMON STOCKS - 97.8% | | | | | |
| | | | | |
| AUTO & TRANSPORTATION - 3.5% | | | |
Air Transport - 1.2% | | | | | |
Southwest Airlines Co. | | 4,136,600 | | $ | 60,808,020 |
| | | | | |
Auto Parts: Original Equipment - 1.2% | | | |
BorgWarner Inc. | | 864,000 | | | 65,162,880 |
| | | | | |
Transportation Miscellaneous - 1.1% | | | |
C.H. Robinson Worldwide, Inc. | | 756,000 | | | 36,099,000 |
Expeditors International of Washington, Inc. | | 571,900 | | | 23,630,908 |
| | | | | |
| | | | | 59,729,908 |
| CONSUMER DISCRETIONARY - 18.6% | | | |
Advertising Agencies - 1.3% | | | |
Clear Channel Outdoor Holdings, Inc., Class A(1) | | 1,820,300 | | | 47,892,093 |
Focus Media Holding Limited (ADR)(1)(2) | | 282,600 | | | 22,172,796 |
| | | | | |
| | | | | 70,064,889 |
Cable Television Services - 0.3% | | | |
TiVo Inc.(1) | | 2,057,100 | | | 13,062,585 |
| | | | | |
Consumer Electronics - 6.6% | | | |
Electronic Arts Inc.(1) | | 4,527,900 | | | 228,025,044 |
Harman International Industries, Incorporated | | 367,500 | | | 35,309,400 |
VeriSign, Inc.(1) | | 1,118,400 | | | 28,094,208 |
Yahoo! Inc.(1) | | 1,875,000 | | | 58,668,750 |
| | | | | |
| | | | | 350,097,402 |
Radio & TV Broadcasters - 0.5% | | | |
XM Satellite Radio Holdings Inc.(1) | | 2,068,900 | | | 26,730,188 |
| | | | | |
Restaurants - 0.8% | | | | | |
YUM! Brands, Inc. | | 751,500 | | | 43,406,640 |
| | | | | |
Retail - 5.8% | | | | | |
Amazon.com, Inc.(1) | | 2,130,200 | | | 84,760,658 |
Chico’s FAS, Inc.(1) | | 5,692,268 | | | 139,062,107 |
Kohl’s Corporation(1) | | 540,700 | | | 41,423,027 |
The TJX Companies, Inc. | | 1,451,500 | | | 39,132,440 |
| | | | | |
| | | | | 304,378,232 |
Services: Commercial - 1.0% | | | |
Iron Mountain Incorporated(1) | | 1,515,450 | | | 39,598,708 |
Robert Half International Inc. | | 357,505 | | | 13,231,260 |
| | | | | |
| | | | | 52,829,968 |
| | | | | |
| | | Shares Held | | Value |
| | | | | |
| CONSUMER DISCRETIONARY - (CONTINUED) | | | |
Textiles Apparel Manufacturers - 1.8% | | | |
Polo Ralph Lauren Corporation, Class A | | 944,100 | | $ | 83,222,415 |
Quiksilver, Inc.(1) | | 1,155,300 | | | 13,401,480 |
| | | | | |
| | | | | 96,623,895 |
Toys - 0.5% | | | | | |
Marvel Entertainment, Inc.(1) | | 1,038,600 | | | 28,821,150 |
| | | | | |
| CONSUMER STAPLES - 3.9% | | | |
Beverage: Soft Drinks - 1.8% | | | |
Hansen Natural Corporation(1) | | 2,519,900 | | | 95,453,812 |
| | | | | |
Drug & Grocery Store Chains - 2.1% | | | |
Supervalu Inc. | | 2,837,700 | | | 110,868,939 |
| | | | | |
| FINANCIAL SERVICES - 14.6% | | | |
Banks: Outside New York City - 2.3% | | | |
Investors Financial Services Corp. | | 886,000 | | | 51,520,900 |
Northern Trust Corporation | | 878,100 | | | 52,808,934 |
UCBH Holdings, Inc. | | 914,600 | | | 17,029,852 |
| | | | | |
| | | | | 121,359,686 |
Diversified Financial Services - 1.5% | | | |
CB Richard Ellis Group, Inc.(1) | | 1,464,000 | | | 50,039,520 |
Greenhill & Co., Inc. | | 512,000 | | | 31,431,680 |
| | | | | |
| | | | | 81,471,200 |
Financial Data Processing Services & Systems - 4.1% | | | | | |
Alliance Data Systems Corporation(1) | | 1,509,800 | | | 93,033,876 |
Global Payments Inc. | | 674,500 | | | 22,973,470 |
Paychex, Inc. | | 532,100 | | | 20,150,627 |
The Western Union Company | | 3,589,500 | | | 78,789,525 |
| | | | | |
| | | | | 214,947,498 |
Financial Information Services - 1.6% | | | |
Equifax Inc. | | 2,317,800 | | | 84,483,810 |
| | | | | |
Financial Miscellaneous - 2.5% | | | |
MGIC Investment Corporation | | 2,275,400 | | | 134,066,568 |
| | | | | |
Insurance: Multi-Line - 1.4% | | | |
Aon Corporation | | 733,600 | | | 27,847,456 |
CIGNA Corporation | | 318,800 | | | 45,480,008 |
| | | | | |
| | | | | 73,327,464 |
28
| | | | | |
| | | Shares Held | | Value |
| | | | | |
| FINANCIAL SERVICES (CONTINUED) | | | |
Securities Brokerage & Services - 1.2% | | | |
The Bear Stearns Companies Inc. | | 172,000 | | $ | 25,860,200 |
Investment Technology Group, Inc.(1) | | 1,018,500 | | | 39,925,200 |
| | | | | |
| | | | | 65,785,400 |
| HEALTHCARE - 19.5% | | | |
Biotechnology Research & Production -0.6% | | | |
Celgene Corporation(1) | | 561,200 | | | 29,440,552 |
| | | | | |
Drugs & Pharmaceuticals - 6.0% | | | |
Allergan, Inc. | | 1,317,800 | | | 146,038,596 |
Barr Pharmaceuticals, Inc.(1) | | 249,300 | | | 11,555,055 |
MedImmune, Inc.(1) | | 4,422,300 | | | 160,927,497 |
| | | | | |
| | | | | 318,521,148 |
Electronics: Medical Systems - 2.7% | | | |
Intuitive Surgical, Inc.(1) | | 662,200 | | | 80,503,654 |
Varian Medical Systems, Inc.(1) | | 1,332,500 | | | 63,546,925 |
| | | | | |
| | | | | 144,050,579 |
Health Care Management Services - 1.2% | | | | | |
Cerner Corporation(1) | | 1,153,500 | | | 62,808,075 |
| | | | | |
Health Care Services - 0.9% | | | |
Express Scripts, Inc.(1) | | 556,700 | | | 44,936,824 |
| | | | | |
Medical & Dental Instruments & Supplies - 8.1% | | | | | |
Gen-Probe Incorporated(1) | | 740,100 | | | 34,843,908 |
Patterson Companies, Inc.(1) | | 2,593,600 | | | 92,046,864 |
Thermo Fisher Scientific, Inc.(1) | | 5,045,300 | | | 235,867,775 |
Ventana Medical Systems, Inc.(1) | | 1,532,100 | | | 64,194,990 |
| | | | | |
| | | | | 426,953,537 |
| MATERIALS & PROCESSING - 7.4% | | | |
Agriculture Fishing & Ranching - 1.7% | | | |
Bunge Limited | | 1,077,500 | | | 88,592,050 |
| | | | | |
Chemicals - 1.6% | | | |
Ecolab Inc. | | 1,346,200 | | | 57,886,600 |
Energy Conversion Devices, Inc.(1) | | 742,900 | | | 25,956,926 |
| | | | | |
| | | | | 83,843,526 |
Diversified Materials & Processing - 0.8% | | | |
Hexcel Corporation(1) | | 2,074,100 | | | 41,170,885 |
| | | | | |
Engineering & Contracting Services - 0.7% | | | |
Quanta Services, Inc.(1) | | 1,548,600 | | | 39,055,692 |
| | | | | |
Metal Fabricating - 1.8% | | | |
Precision Castparts Corp. | | 890,200 | | | 92,625,310 |
| | | | | |
Real Estate - 0.8% | | | |
The St. Joe Company | | 847,000 | | | 44,306,570 |
| | | | | |
| | | Shares Held | | Value |
| | | | | |
| OTHER - 1.3% | | | |
Multi-Sector Companies - 1.3% | | | | | |
McDermott International, Inc.(1) | | 1,419,100 | | $ | 69,507,518 |
| | | | | |
| OTHER ENERGY - 3.8% | | | | | |
Coal - 0.6% | | | | | |
CONSOL Energy Inc. | | 788,900 | | | 30,869,657 |
| | | | | |
Machinery: Oil Well Equipment & Services - 3.2% | | | |
Dresser-Rand Group Inc.(1) | | 1,811,800 | | | 55,187,428 |
Helix Energy Solutions Group, Inc.(1) | | 1,647,200 | | | 61,424,088 |
Smith International, Inc. | | 1,135,500 | | | 54,560,775 |
| | | | | |
| | | | | 171,172,291 |
Oil: Crude Producers - 0.0%(3) | | | | | |
Denbury Resources Inc.(1) | | 27,500 | | | 819,225 |
| | | | | |
| PRODUCER DURABLES - 4.0% | | | | | |
Diversified Production - 0.3% | | | | | |
Danaher Corporation | | 230,500 | | | 16,469,225 |
| | | | | |
Electrical Equipment & Components - 1.3% | | | |
Cooper Industries, Ltd., Class A | | 1,468,500 | | | 66,067,815 |
| | | | | |
Identification Control & Filter Devices -2.0% | | | | | |
ESCO Technologies Inc.(1) | | 579,800 | | | 25,986,636 |
Roper Industries, Inc. | | 1,399,400 | | | 76,799,072 |
| | | | | |
| | | | | 102,785,708 |
Machinery: Industrial/Specialty - 0.4% | | | |
Joy Global Inc. | | 433,723 | | | 18,606,717 |
| | | | | |
| TECHNOLOGY - 19.2% | | | | | |
Communications Technology - 3.1% | | | |
Ciena Corporation(1) | | 1,509,300 | | | 42,184,935 |
Corning Incorporated(1) | | 1,146,700 | | | 26,075,958 |
JDS Uniphase Corporation(1) | | 1,727,149 | | | 26,304,479 |
Juniper Networks, Inc.(1) | | 3,552,700 | | | 69,917,136 |
| | | | | |
| | | | | 164,482,508 |
Computer Services Software & Systems - 5.2% | | | |
Adobe Systems Incorporated(1) | | 758,396 | | | 31,625,113 |
Autodesk, Inc.(1) | | 1,981,300 | | | 74,496,880 |
Cadence Design Systems, Inc.(1) | | 1,548,600 | | | 32,613,516 |
NAVTEQ Corporation(1) | | 1,558,800 | | | 53,778,600 |
Red Hat, Inc.(1) | | 3,521,300 | | | 80,743,409 |
| | | | | |
| | | | | 273,257,518 |
Computer Technology - 4.2% | | | | | |
Intermec, Inc.(1)(4) | | 4,206,000 | | | 93,962,040 |
Network Appliance, Inc.(1) | | 1,644,400 | | | 60,053,488 |
SanDisk Corporation(1) | | 1,548,600 | | | 67,828,680 |
Zebra Technologies Corporation(1) | | 47,400 | | | 1,830,114 |
| | | | | |
| | | | | 223,674,322 |
29
| | | | | |
| | | Shares Held | | Value |
| | | | | |
| TECHNOLOGY (CONTINUED) | | | | | |
Electronics - 0.5% | | | | | |
Avid Technology, Inc.(1) | | 723,600 | | $ | 25,239,168 |
| | | | | |
Electronics: Semi-Conductors/Components - 4.8% | | | | | |
Analog Devices, Inc. | | 1,055,200 | | | 36,393,848 |
Broadcom Corporation, Class A(1) | | 2,115,450 | | | 67,842,482 |
Integrated Device Technology, Inc.(1) | | 2,619,400 | | | 40,391,148 |
Linear Technology Corporation | | 2,619,800 | | | 82,759,482 |
Spansion Inc., Class A(1) | | 1,937,100 | | | 23,613,249 |
| | | | | |
| | | | | 251,000,209 |
Electronics: Technology - 1.4% | | | | | |
Rockwell Automation, Inc. | | 466,900 | | | 27,953,303 |
Trimble Navigation Limited(1) | | 1,641,400 | | | 44,055,176 |
| | | | | |
| | | | | 72,008,479 |
| UTILITIES - 2.0% | | | | | |
Utilities: Telecommunications - 2.0% | | | |
Level 3 Communications, Inc.(1) | | 1,359,000 | | | 8,289,900 |
NII Holdings, Inc.(1) | | 1,341,300 | | | 99,497,634 |
| | | | | |
| | | | | 107,787,534 |
| | | | | |
Total common stocks
(Cost $4,080,492,832) | | | | | 5,163,532,776 |
| | | | | | |
| | | Par
Amount | | Value |
| SHORT-TERM INVESTMENTS (CASH EQUIVALENTS) - 1.7% | | | | | | |
Repurchase agreement with Fixed Income Clearing Corporation, 5.00%, dated 3/30/07, due 4/2/07, maturity value $88,052,673, collateralized by $89,781,188 market value Federal National Mortgage Association Note, 6.125%, due 8/17/26
(Cost $88,016,000) | | $ | 88,016,000 | | $ | 88,016,000 |
| | | | | | |
| | | | | | |
Total investments - 99.5%
(Cost $4,168,508,832) | | | | | | 5,251,548,776 |
| | | | | | |
Other assets less liabilities - 0.5% | | | | | | 26,748,187 |
| | | | | | |
| | | | | | |
Total net assets - 100.0%(5) | | | | | $ | 5,278,296,963 |
| | | | | | |
(1) | Non-income producing security. |
(2) | The Fund considers the issuer to be from China. See the Fund's Statement of Additional Information for information on how a particular country is assigned. The security trades on a U.S. exchange. |
(3) | Represents less than 0.1% of total net assets. |
(4) | Affiliated company as defined by the Investment Company Act of 1940. See Note (6) in Notes to Financial Statements. |
(5) | Percentages for the various classifications relate to total net assets. |
Security names may not represent the legal name of the entity.
(ADR) American Depository Receipt
The accompanying notes are an integral part of the financial statements.
30
ARTISAN MID CAP VALUE FUND
Schedule of Investments – March 31, 2007 (Unaudited)
| | | | | |
| | | Shares
Held | | Value |
| | | | | |
| COMMON STOCKS - 92.9% | | | | | |
| | | | | |
| AUTO & TRANSPORTATION - 9.2% | | | |
Recreational Vehicles & Boats - 1.4% | | | |
Thor Industries, Inc. | | 1,127,400 | | $ | 44,408,286 |
| | | | | |
Shipping - 3.8% | | | | | |
Alexander & Baldwin, Inc. | | 1,030,800 | | | 51,993,552 |
Teekay Shipping Corporation | | 1,221,500 | | | 66,095,365 |
| | | | | |
| | | | | 118,088,917 |
Truckers - 4.0% | | | | | |
Con-way Inc. | | 1,407,700 | | | 70,159,768 |
YRC Worldwide Inc.(1) | | 1,396,200 | | | 56,155,164 |
| | | | | |
| | | | | 126,314,932 |
| CONSUMER DISCRETIONARY - 18.6% | | | |
Household Furnishings - 5.0% | | | |
Furniture Brands International, Inc.(2) | | 2,025,500 | | | 31,962,390 |
Leggett & Platt, Incorporated | | 2,560,600 | | | 58,048,802 |
Mohawk Industries, Inc.(1) | | 826,600 | | | 67,822,530 |
| | | | | |
| | | | | 157,833,722 |
Rental & Leasing Services: Consumer - 0.7% | | | | | |
Rent-A-Center, Inc.(1) | | 781,400 | | | 21,863,572 |
| | | | | |
Retail - 7.4% | | | | | |
AutoZone, Inc.(1) | | 463,700 | | | 59,418,518 |
Chico’s FAS, Inc.(1) | | 628,400 | | | 15,351,812 |
Claire’s Stores, Inc. | | 1,198,500 | | | 38,495,820 |
Foot Locker, Inc. | | 2,738,500 | | | 64,491,675 |
Zale Corporation(1)(2) | | 2,015,900 | | | 53,179,442 |
| | | | | |
| | | | | 230,937,267 |
Services: Commercial - 2.4% | | | |
Hewitt Associates, Inc.(1) | | 2,560,700 | | | 74,849,261 |
| | | | | |
Textiles Apparel Manufacturers - 1.9% | | | |
Liz Claiborne Inc. | | 1,354,300 | | | 58,031,755 |
| | | | | |
Toys - 1.2% | | | | | |
Marvel Entertainment, Inc.(1) | | 1,324,100 | | | 36,743,775 |
| | | | | |
| CONSUMER STAPLES - 4.4% | | | |
Foods - 4.4% | | | | | |
Pilgrim’s Pride Corporation | | 1,355,100 | | | 44,975,769 |
Smithfield Foods, Inc.(1) | | 1,978,700 | | | 59,262,065 |
Tyson Foods, Inc., Class A | | 1,718,300 | | | 33,352,203 |
| | | | | |
| | | | | 137,590,037 |
| | | | | |
| | | Shares
Held | | Value |
| | | | | |
| FINANCIAL SERVICES - 26.9% | | | |
Finance: Small Loan - 2.4% | | | |
The Student Loan Corporation | | 406,800 | | $ | 75,632,256 |
| | | | | |
Financial Data Processing Services & Systems - 1.0% | | | |
Fidelity National Information Services, Inc. | | 695,368 | | | 31,611,429 |
| | | | | |
Financial Miscellaneous - 3.3% | | | |
Fidelity National Financial, Inc. | | 3,159,831 | | | 75,867,542 |
MBIA Inc. | | 443,000 | | | 29,012,070 |
| | | | | |
| | | | | 104,879,612 |
Insurance: Multi-Line - 4.8% | | | |
Alleghany Corporation(1) | | 314,086 | | | 117,342,530 |
Arthur J. Gallagher & Co. | | 1,199,300 | | | 33,976,169 |
| | | | | |
| | | | | 151,318,699 |
Insurance: Property-Casualty - 4.7% | | | |
Allied World Assurance Company Holdings, Ltd | | 1,327,700 | | | 56,759,175 |
Arch Capital Group Ltd.(1) | | 289,573 | | | 19,751,774 |
White Mountains Insurance Group, Ltd. | | 125,900 | | | 71,322,350 |
| | | | | |
| | | | | 147,833,299 |
Real Estate Investment Trusts (REIT) - 2.4% | | | | | |
Annaly Capital Management, Inc. | | 4,770,900 | | | 73,853,532 |
| | | | | |
Rental & Leasing Services: Commercial - 4.0% | | | | | |
GATX Corporation | | 1,183,200 | | | 56,556,960 |
Ryder System, Inc. | | 1,382,700 | | | 68,222,418 |
| | | | | |
| | | | | 124,779,378 |
Savings & Loan - 2.9% | | | | | |
IndyMac Bancorp, Inc. | | 1,617,000 | | | 51,824,850 |
Washington Federal, Inc. | | 1,631,516 | | | 38,275,365 |
| | | | | |
| | | | | 90,100,215 |
Securities Brokerage & Services - 1.4% | | | |
Nuveen Investments, Inc. | | 932,700 | | | 44,116,710 |
| | | | | |
| HEALTHCARE - 1.4% | | | | | |
Health Care Management Services - 1.4% | | | | | |
Community Health Systems, Inc.(1) | | 1,270,400 | | | 44,781,600 |
| | | | | |
31
| | | | | |
| | | Shares
Held | | Value |
| | | | | |
| MATERIALS & PROCESSING - 3.4% | | | |
Building: Roofing & Wallboard - 1.4% | | | |
USG Corporation(1) | | 923,300 | | $ | 43,099,644 |
| | | | | |
Chemicals - 2.0% | | | | | |
The Lubrizol Corporation | | 1,212,800 | | | 62,495,584 |
| | | | | |
| OTHER ENERGY - 18.8% | | | | | |
Machinery: Oil Well Equipment & Services - 4.4% | | | |
BJ Services Company | | 1,813,200 | | | 50,588,280 |
Nabors Industries Ltd.(1) | | 2,993,400 | | | 88,814,178 |
| | | | | |
| | | | | 139,402,458 |
Oil: Crude Producers - 14.4% | | | | | |
Apache Corporation | | 885,046 | | | 62,572,752 |
Cimarex Energy Co. | | 1,819,000 | | | 67,339,380 |
Forest Oil Corporation(1)(2) | | 2,394,100 | | | 79,891,117 |
Mariner Energy, Inc.(1)(2) | | 2,475,691 | | | 47,359,969 |
Noble Energy, Inc. | | 1,373,100 | | | 81,905,415 |
Pioneer Natural Resources Company | | 1,943,304 | | | 83,775,836 |
XTO Energy Inc. | | 563,742 | | | 30,898,699 |
| | | | | |
| | | | | 453,743,168 |
| PRODUCER DURABLES - 2.9% | | | |
Diversified Production - 1.4% | | | |
Dover Corporation | | 931,500 | | | 45,466,515 |
| | | | | |
Identification Control & Filter Devices - 1.5% | | | | | |
Hubbell Incorporated | | 999,200 | | | 48,201,408 |
| | | | | |
| TECHNOLOGY - 7.3% | | | | | |
Computer Technology - 2.5% | | | |
Ingram Micro Inc.(1) | | 4,130,900 | | | 79,767,679 |
| | | | | |
Electronics: Semi-Conductors/
Components - 4.8% | | | |
Analog Devices, Inc. | | 1,486,100 | | | 51,255,589 |
Avnet, Inc.(1) | | 2,740,800 | | | 99,052,512 |
| | | | | |
| | | | | 150,308,101 |
| | | | | |
Total common stocks
(Cost $2,517,336,010) | | | | | 2,918,052,811 |
| | | | | | | |
| | | Par
Amount | | Value | |
| SHORT-TERM INVESTMENTS (CASH EQUIVALENTS) - 9.7% | | | | | | | |
Repurchase agreement with Fixed Income Clearing Corporation, 5.00%, dated 3/30/07, due 4/2/07, maturity value $303,704,491, collateralized by $309,651,300 market value Federal National Mortgage Association Note,
5.45%, due 10/18/21
(Cost $303,578,000) | | $ | 303,578,000 | | $ | 303,578,000 | |
| | | | | | | |
| | | | | | | |
Total investments - 102.6%
(Cost $2,820,914,010) | | | | | | 3,221,630,811 | |
| | | | | | | |
Other assets less liabilities - (2.6%) | | | (80,994,342 | ) |
| | | | | | | |
| | | | | | | |
Total net assets - 100.0%(3) | | | | | $ | 3,140,636,469 | |
| | | | | | | |
(1) | Non-income producing security. |
(2) | Affiliated company as defined by the Investment Company Act of 1940. See Note (6) in Notes to Financial Statements. |
(3) | Percentages for the various classifications relate to total net assets. |
Security names may not represent the legal name of the entity.
The accompanying notes are an integral part of the financial statements.
32
ARTISAN OPPORTUNISTIC VALUE FUND
Schedule of Investments – March 31, 2007 (Unaudited)
| | | | | |
| | | Shares
Held | | Value |
| | | | | |
| COMMON STOCKS - 92.1% | | | | | |
| | | | | |
| AUTO & TRANSPORTATION - 2.1% | | | | | |
Truckers - 2.1% | | | | | |
YRC Worldwide Inc.(1) | | 79,400 | | $ | 3,193,468 |
| | | | | |
| CONSUMER DISCRETIONARY - 19.5% | | | |
Household Furnishings - 2.1% | | | |
Mohawk Industries, Inc.(1) | | 39,300 | | | 3,224,565 |
| | | | | |
Leisure Time - 2.7% | | | | | |
Carnival Corporation | | 88,600 | | | 4,151,796 |
| | | | | |
Retail - 6.9% | | | | | |
Foot Locker, Inc. | | 135,200 | | | 3,183,960 |
Wal-Mart Stores, Inc. | | 161,900 | | | 7,601,205 |
| | | | | |
| | | | | 10,785,165 |
Services: Commercial - 4.3% | | | | | |
Accenture Ltd, Class A | | 84,300 | | | 3,248,922 |
Hewitt Associates, Inc.(1) | | 116,000 | | | 3,390,680 |
| | | | | |
| | | | | 6,639,602 |
Shoes - 3.5% | | | | | |
NIKE, Inc., Class B | | 51,700 | | | 5,493,642 |
| | | | | |
| CONSUMER STAPLES - 2.1% | | | | | |
Foods - 2.1% | | | | | |
Smithfield Foods, Inc.(1) | | 110,400 | | | 3,306,480 |
| | | | | |
| FINANCIAL SERVICES - 31.5% | | | | | |
Banks: Outside New York City - 10.6% | | | |
Bank of America Corporation | | 52,600 | | | 2,683,652 |
BNP Paribas (2) | | 61,700 | | | 6,444,572 |
Royal Bank of Scotland Group PLC(2) | | 187,300 | | | 7,312,591 |
| | | | | |
| | | | | 16,440,815 |
Diversified Financial Services - 2.8% | | | |
Citigroup Inc. | | 83,800 | | | 4,302,292 |
| | | | | |
Finance: Small Loan - 2.4% | | | | | |
The Student Loan Corporation | | 19,900 | | | 3,699,808 |
| | | | | |
Financial Miscellaneous - 1.8% | | | |
Fidelity National Financial, Inc. | | 118,300 | | | 2,840,383 |
| | | | | |
Insurance: Multi-Line - 6.6% | | | | | |
Alleghany Corporation(1) | | 122 | | | 45,579 |
The Allstate Corporation | | 49,300 | | | 2,960,958 |
American International Group, Inc. | | 108,300 | | | 7,279,926 |
| | | | | |
| | | | | 10,286,463 |
| | | | | |
| | | Shares
Held | | Value |
| | | | | |
| FINANCIAL SERVICES (CONTINUED) | | | |
Insurance: Property-Casualty - 3.6% | | | | | |
Allied World Assurance Company Holdings, Ltd | | 21,900 | | $ | 936,225 |
The Progressive Corporation | | 209,700 | | | 4,575,654 |
| | | | | |
| | | | | 5,511,879 |
Real Estate Investment Trusts (REIT) - 2.1% | | | | | |
Annaly Capital Management, Inc. | | 206,200 | | | 3,191,976 |
| | | | | |
Savings & Loan - 1.6% | | | | | |
IndyMac Bancorp, Inc. | | 75,100 | | | 2,406,955 |
| | | | | |
| HEALTHCARE - 2.4% | | | | | |
Health Care Management Services - 2.4% | | | | | |
Aetna Inc. | | 86,200 | | | 3,774,698 |
| | | | | |
| INTEGRATED OILS - 2.5% | | | | | |
Oil: Intergrated International - 2.5% | | | | | |
Statoil ASA (ADR)(2) | | 143,200 | | | 3,877,856 |
| | | | | |
| OTHER - 3.7% | | | | | |
Multi-Sector Companies - 3.7% | | | |
Berkshire Hathaway Inc., Class B(1) | | 1,580 | | | 5,751,200 |
| | | | | |
| OTHER ENERGY - 9.8% | | | | | |
Energy Miscellaneous - 2.0% | | | | | |
Valero Energy Corporation | | 47,300 | | | 3,050,377 |
| | | | | |
Machinery: Oil Well Equipment & Services - 2.9% | | | | | |
Nabors Industries Ltd.(1) | | 149,900 | | | 4,447,533 |
| | | | | |
Oil: Crude Producers - 4.9% | | | | | |
Apache Corporation | | 108,600 | | | 7,678,020 |
| | | | | |
| PRODUCER DURABLES - 6.8% | | | | | |
Machinery: Industrial/
Specialty - 2.8% | | | |
Ingersoll-Rand Company Limited | | 101,200 | | | 4,389,044 |
| | | | | |
Telecommunications Equipment - 4.0% | | | |
Nokia Corporation (ADR)(1)(2) | | 270,900 | | | 6,209,028 |
| | | | | |
33
| | | | | | |
| | | Shares
Held | | Value |
| | | | | | |
| TECHNOLOGY - 11.7% | | | | | | |
Computer Services Software & Systems - 2.5% | | | | | | |
Microsoft Corporation | | | 139,070 | | $ | 3,875,881 |
| | | | | | |
Computer Technology - 3.7% | | | | | | |
Dell Inc.(1) | | | 82,900 | | | 1,924,109 |
Ingram Micro Inc.(1) | | | 200,700 | | | 3,875,517 |
| | | | | | |
| | | | | | 5,799,626 |
Electronics: Semi-Conductors/Components - 5.5% | | | | | | |
Analog Devices, Inc. | | | 87,500 | | | 3,017,875 |
Avnet, Inc.(1) | | | 154,500 | | | 5,583,630 |
| | | | | | |
| | | | | | 8,601,505 |
| | | | | | |
Total common stocks
(Cost $130,713,957) | | | | | | 142,930,057 |
| | | Par
Amount | | |
| SHORT-TERM INVESTMENTS (CASH EQUIVALENTS) - 5.5% | | | | | | |
Repurchase agreement with Fixed Income Clearing Corporation,
5.00%, dated 3/30/07, due 4/2/07, maturity value $8,546,560, collateralized by $8,715,680 market value U.S. Treasury Bill,
4.875%, due 9/27/07
(Cost $8,543,000) | | $ | 8,543,000 | | | 8,543,000 |
| | | | | | |
| | | | | | |
Total investments - 97.6%
(Cost $139,256,957) | | | | | | 151,473,057 |
| | | | | | |
Other assets less liabilities - 2.4% | | | | | | 3,753,936 |
| | | | | | |
| | | | | | |
Total net assets - 100.0%(3) | | | | | $ | 155,226,993 |
| | | | | | |
(1) | Non-income producing security. |
(2) | The Fund considers the issuer to be from outside of the United States. See the Fund's Statement of Additional Information for information on how a particular country is assigned. |
| | | | |
Security | | Issuer Country | | Trading Currency |
BNP Paribas | | France | | Euro |
Nokia Corporation (ADR) | | Finland | | US dollar |
Royal Bank of Scotland Group PLC | | United Kingdom | | British pound |
Statoil ASA (ADR) | | Norway | | US dollar |
(3) | Percentages for the various classifications relate to total net assets. |
Security names may not represent the legal name of the entity.
(ADR) American Depository Receipt
The accompanying notes are an integral part of the financial statements.
34
ARTISAN SMALL CAP FUND
Schedule of Investments – March 31, 2007 (Unaudited)
| | | | | |
| | | Shares
Held | | Value |
| | | | | |
| COMMON STOCKS - 97.0% | | | |
| | | | | |
| AUTO & TRANSPORTATION - 5.8% | | | |
Air Transport - 1.4% | | | | | |
AirTran Holdings, Inc.(1) | | 1,659,400 | | $ | 17,042,038 |
| | | | | |
Auto Parts: After Market - 1.5% | | | |
Keystone Automotive Industries, Inc.(1) | | 521,000 | | | 17,557,700 |
Transportation Miscellaneous - 1.4% | | | |
Pacer International, Inc. | | 634,800 | | | 17,101,512 |
| | | | | |
Truckers - 1.5% | | | | | |
Old Dominion Freight Line, Inc.(1) | | 624,000 | | | 17,977,440 |
| | | | | |
| CONSUMER DISCRETIONARY - 24.0% | | | |
Advertising Agencies - 1.1% | | | |
inVentiv Health, Inc.(1) | | 353,600 | | | 13,539,344 |
| | | | | |
Education Services - 3.0% | | | |
Bright Horizons Family Solutions, Inc.(1) | | 478,300 | | | 18,055,825 |
Strayer Education, Inc. | | 138,500 | | | 17,312,500 |
| | | | | |
| | | | | 35,368,325 |
Restaurants - 1.5% | | | | | |
RARE Hospitality International, Inc.(1) | | 596,250 | | | 17,941,162 |
| | | | | |
Retail - 5.0% | | | | | |
Guitar Center, Inc.(1) | | 347,800 | | | 15,692,736 |
Hibbett Sporting Goods, Inc.(1) | | 409,350 | | | 11,703,316 |
Tween Brands, Inc.(1) | | 401,900 | | | 14,355,868 |
United Natural Foods, Inc.(1) | | 559,700 | | | 17,149,208 |
| | | | | |
| | | | | 58,901,128 |
Services: Commercial - 7.1% | | | |
The Advisory Board Company(1) | | 370,700 | | | 18,764,834 |
CRA International, Inc.(1) | | 329,800 | | | 17,208,964 |
The GEO Group, Inc.(1) | | 387,350 | | | 17,554,702 |
Kenexa Corporation(1) | | 56,200 | | | 1,749,506 |
Resources Connection, Inc.(1) | | 322,500 | | | 10,316,775 |
Waste Connections, Inc.(1) | | 610,725 | | | 18,285,107 |
| | | | | |
| | | | | 83,879,888 |
Shoes - 1.6% | | | | | |
Iconix Brand Group, Inc.(1) | | 927,900 | | | 18,929,160 |
| | | | | |
Textiles Apparel Manufacturers -1.5% | | | |
Carter’s, Inc.(1) | | 712,800 | | | 18,062,352 |
| | | | | |
| | | Shares
Held | | Value |
| CONSUMER DISCRETIONARY (CONTINUED) | | | |
Wholesalers - 3.2% | | | | | |
Brightpoint, Inc.(1) | | 1,681,700 | | $ | 19,238,648 |
LKQ Corporation(1) | | 840,200 | | | 18,366,772 |
| | | | | |
| | | | | 37,605,420 |
| FINANCIAL SERVICES - 14.1% | | | | | |
Banks: Outside New York City - 3.4% | | | |
Alabama National BanCorporation | | 188,300 | | | 13,333,523 |
Westamerica Bancorporation | | 206,800 | | | 9,961,556 |
Wintrust Financial Corporation | | 384,000 | | | 17,130,240 |
| | | | | |
| | | | | 40,425,319 |
Diversified Financial Services - 1.7% | | | |
Euronet Worldwide, Inc.(1) | | 758,900 | | | 20,384,054 |
| | | | | |
Finance: Small Loan - 0.8% | | | | | |
Nelnet, Inc., Class A | | 373,000 | | | 8,940,810 |
| | | | | |
Financial Miscellaneous - 2.4% | | | | | |
Global Cash Access Holdings, Inc.(1) | | 1,335,900 | | | 22,296,171 |
Triad Guaranty Inc.(1) | | 135,200 | | | 5,598,632 |
| | | | | |
| | | | | 27,894,803 |
Insurance: Property-Casualty - 0.9% | | | |
Ohio Casualty Corporation | | 373,100 | | | 11,174,345 |
| | | | | |
Investment Management Companies - 1.7% | | | | | |
National Financial Partners Corp. | | 416,700 | | | 19,547,397 |
| | | | | |
Rental & Leasing Services: Commercial - 1.4% | | | | | |
Williams Scotsman International, Inc.(1) | | 829,300 | | | 16,304,038 |
| | | | | |
Securities Brokerage & Services - 1.8% | | | | | |
optionsXpress Holdings, Inc. | | 895,600 | | | 21,082,424 |
| | | | | |
| HEALTHCARE - 13.4% | | | | | |
Biotechnology Research & Production - 1.4% | | | | | |
ArthroCare Corporation(1) | | 472,400 | | | 17,025,296 |
| | | | | |
Drugs & Pharmaceuticals - 1.8% | | | |
K-V Pharmaceutical Company, Class A(1) | | 847,600 | | | 20,961,148 |
| | | | | |
Electronics: Medical Systems - 0.8% | | | |
NxStage Medical, Inc.(1) | | 708,600 | | | 9,438,552 |
35
| | | | | |
| | | Shares
Held | | Value |
| HEALTHCARE (CONTINUED) | | | | | |
Health Care Facilities - 1.5% | | | | | |
ICON PLC (ADR)(1)(2) | | 411,800 | | $ | 17,542,680 |
| | | | | |
Health Care Management Services - 2.8% | | | | | |
HealthExtras, Inc.(1) | | 733,900 | | | 21,121,642 |
Sierra Health Services, Inc.(1) | | 282,300 | | | 11,622,291 |
| | | | | |
| | | | | 32,743,933 |
Medical & Dental Instruments &
Supplies - 5.1% | | | |
DJO Incorporated(1) | | 397,900 | | | 15,080,410 |
ICU Medical, Inc.(1) | | 259,200 | | | 10,160,640 |
PSS World Medical, Inc.(1) | | 848,400 | | | 17,935,176 |
Thoratec Corporation(1) | | 845,100 | | | 17,662,590 |
| | | | | |
| | | | | 60,838,816 |
| MATERIALS & PROCESSING - 4.3% | | | |
Agriculture Fishing & Ranching - 1.2% | | | |
The Andersons, Inc. | | 331,700 | | | 14,727,480 |
| | | | | |
Building: Heating & Plumbing - 1.6% | | | |
Interline Brands, Inc.(1) | | 840,100 | | | 18,414,992 |
| | | | | |
Metal Fabricating - 1.5% | | | | | |
Kaydon Corporation | | 412,700 | | | 17,564,512 |
| | | | | |
| OTHER ENERGY - 7.3% | | | | | |
Machinery: Oil Well Equipment & Services - 4.3% | | | | | |
Core Laboratories N.V.(1)(2) | | 167,600 | | | 14,049,908 |
Dril-Quip, Inc.(1) | | 171,100 | | | 7,405,208 |
Hornbeck Offshore Services, Inc.(1) | | 257,700 | | | 7,383,105 |
W-H Energy Services, Inc.(1) | | 468,400 | | | 21,893,016 |
| | | | | |
| | | | | 50,731,237 |
Offshore Drilling - 1.6% | | | | | |
Hercules Offshore, Inc.(1) | | 741,200 | | | 19,463,912 |
| | | | | |
Oil: Crude Producers - 1.4% | | | | | |
Bill Barrett Corporation(1) | | 500,700 | | | 16,227,687 |
| | | | | |
| PRODUCER DURABLES - 6.6% | | | | | |
Identification Control & Filter Devices - 1.5% | | | | | |
ESCO Technologies Inc.(1) | | 401,000 | | | 17,972,820 |
| | | | | |
Machinery: Industrial/
Specialty - 2.8% | | | |
Actuant Corporation | | 391,500 | | | 19,892,115 |
Columbus McKinnon Corporation(1) | | 565,500 | | | 12,661,545 |
| | | | | |
| | | | | 32,553,660 |
| | | | | |
| | | Shares
Held | | Value |
| PRODUCER DURABLES (CONTINUED) | | | |
Machinery: Specialty - 1.1% | | | | | |
Bucyrus International, Inc. | | 245,000 | | $ | 12,617,500 |
| | |
Production Technology Equipment - 1.2% | | | | | |
Axcelis Technologies, Inc.(1) | | 1,802,200 | | | 13,768,808 |
| | | | | |
| TECHNOLOGY - 20.0% | | | | | |
Communications Technology - 3.1% | | | |
AudioCodes Ltd.(1)(2) | | 1,284,500 | | | 8,683,220 |
Avocent Corporation(1) | | 771,100 | | | 20,796,567 |
Ixia(1) | | 751,400 | | | 6,988,020 |
| | | | | |
| | | | | 36,467,807 |
Computer Services Software &
Systems - 11.0% | | | |
CommVault Systems, Inc.(1) | | 544,000 | | | 8,812,800 |
Concur Technologies, Inc.(1) | | 702,100 | | | 12,258,666 |
Epicor Software Corporation(1) | | 669,100 | | | 9,307,181 |
Informatica Corporation(1) | | 1,220,100 | | | 16,385,943 |
Macrovision Corporation(1) | | 739,400 | | | 18,521,970 |
Progress Software Corporation(1) | | 516,700 | | | 16,121,040 |
SRA International, Inc., Class A(1) | | 542,900 | | | 13,225,044 |
Transaction Systems Architects, Inc.(1) | | 640,800 | | | 20,755,512 |
Wind River Systems, Inc.(1) | | 1,468,000 | | | 14,591,920 |
| | | | | |
| | | | | 129,980,076 |
Computer Technology - 0.6% | | | |
Aruba Networks, Inc.(1) | | 506,200 | | | 7,425,954 |
| | | | | |
Electronics - 1.2% | | | | | |
Aeroflex Incorporated(1) | | 1,104,200 | | | 14,520,230 |
| | | | | |
Electronics: Semi-Conductors/
Components - 4.1% | | | |
DSP Group, Inc.(1) | | 1,002,400 | | | 19,045,600 |
Microsemi Corporation(1) | | 976,800 | | | 20,327,208 |
Tessera Technologies, Inc.(1) | | 221,900 | | | 8,818,306 |
| | | | | |
| | | | | 48,191,114 |
| UTILITIES - 1.5% | | | | | |
Utilities: Electrical - 1.5% | | | | | |
ITC Holdings Corp. | | 400,500 | | | 17,337,645 |
| | | | | |
| | | | | |
Total common stocks
(Cost $1,016,184,081) | | | | | 1,146,174,518 |
36
| | | | | | |
| | | Par
Amount | | Value |
| SHORT-TERM INVESTMENTS (CASH EQUIVALENTS) - 2.0% | | | | | | |
Repurchase agreement with Fixed Income Clearing Corporation,
5.00%, dated 3/30/07, due 4/2/07, maturity value $23,622,839, collateralized by $24,087,950 market value Federal Home Loan Mortgage Corporation Note, 6.75%, due 3/15/31
(Cost $23,613,000) | | $ | 23,613,000 | | $ | 23,613,000 |
| | | | | | |
| | | | | | |
Total investments - 99.0% (Cost $1,039,797,081) | | | | | | 1,169,787,518 |
| | | | | | |
Other assets less liabilities - 1.0% | | | | | | 11,669,275 |
| | | | | | |
| | | | | | |
Total net assets - 100.0%(3) | | | | | $ | 1,181,456,793 |
| | | | | | |
(1) | Non-income producing security. |
(2) | The Fund considers the issuer to be from outside of the United States. See the Fund's Statement of Additional Information for information on how a particular country is assigned. |
| | | | |
Security | | Issuer Country | | Trading Currency |
| AudioCodes Ltd. | | Israel | | US dollar |
| Core Laboratories N.V. | | Netherlands | | US dollar |
| ICON PLC (ADR) | | Ireland | | US dollar |
(3) | Percentages for the various classifications relate to total net assets. |
Security names may not represent the legal name of the entity.
(ADR) American Depository Receipt
The accompanying notes are an integral part of the financial statements.
37
ARTISAN SMALL CAP VALUE FUND
Schedule of Investments – March 31, 2007 (Unaudited)
| | | | | |
| | | Shares
Held | | Value |
| | | | | |
| COMMON STOCKS - 92.6% | | | | | |
| | | | | |
| AUTO & TRANSPORTATION - 4.5% | | | | | |
Auto Parts: After Market - 0.9% | | | |
Commercial Vehicle Group, Inc(1) | | 962,300 | | $ | 19,823,380 |
| | | | | |
Auto Trucks & Parts - 0.8% | | | | | |
Wabash National Corporation | | 1,236,100 | | | 19,060,662 |
| | | | | |
Shipping - 1.6% | | | | | |
OMI Corporation | | 1,338,600 | | | 35,954,796 |
| | | | | |
Truckers - 1.2% | | | | | |
Arkansas Best Corporation | | 770,600 | | | 27,394,830 |
| | | | | |
| CONSUMER DISCRETIONARY - 22.8% | | | |
Consumer Electronics - 1.2% | | | | | |
EarthLink, Inc.(1) | | 3,706,300 | | | 27,241,305 |
| | | | | |
Household Furnishings - 2.8% | | | |
Ethan Allen Interiors Inc. | | 1,199,200 | | | 42,379,728 |
Furniture Brands International, Inc.(2) | | 1,390,900 | | | 21,948,402 |
| | | | | |
| | | | | 64,328,130 |
Radio & TV Broadcasters - 0.4% | | | | | |
World Wrestling Entertainment, Inc., Class A | | 607,900 | | | 9,908,770 |
| | | | | |
Rental & Leasing Services: Consumer - 0.6% | | | | | |
Rent-A-Center, Inc.(1) | | 491,200 | | | 13,743,776 |
| | | | | |
Retail - 6.6% | | | | | |
1-800 CONTACTS, INC.(1) | | 675,500 | | | 11,348,400 |
Global Imaging Systems, Inc.(1) | | 557,000 | | | 10,861,500 |
Lithia Motors, Inc., Class A | | 393,500 | | | 10,785,835 |
MarineMax, Inc.(1)(2) | | 1,231,200 | | | 28,539,216 |
Sonic Automotive, Inc., Class A | | 1,146,300 | | | 32,669,550 |
Stein Mart, Inc. | | 398,600 | | | 6,505,152 |
Tuesday Morning Corporation | | 442,300 | | | 6,563,732 |
Zale Corporation(1)(2) | | 1,586,600 | | | 41,854,508 |
| | | | | |
| | | | | 149,127,893 |
Services: Commercial - 9.4% | | | | | |
AMN Healthcare Services, Inc.(1) | | 461,400 | | | 10,436,868 |
Cross Country Healthcare, Inc.(1)(2) | | 1,970,900 | | | 35,929,507 |
| | | | | |
| | | Shares
Held | | Value |
| CONSUMER DISCRETIONARY (CONTINUED) | | | |
Services: Commercial (Continued) | | | |
Diamond Management & Technology Consultants, Inc. | | 957,300 | | $ | 11,190,837 |
Gevity HR, Inc.(2) | | 1,689,400 | | | 33,348,756 |
Hudson Highland Group, Inc.(1) | | 1,051,800 | | | 16,397,562 |
Korn/Ferry International(1) | | 583,500 | | | 13,385,490 |
Medical Staffing Network Holdings, Inc.(1)(2) | | 1,548,900 | | | 9,835,515 |
Tetra Tech, Inc.(1) | | 2,209,700 | | | 42,116,882 |
Watson Wyatt Worldwide, Inc. | | 827,200 | | | 40,243,280 |
| | | | | |
| | | | | 212,884,697 |
Textiles Apparel Manufacturers - 1.1% | | | |
Kellwood Company | | 844,650 | | | 24,773,585 |
| | | | | |
Toys - 0.5% | | | | | |
Marvel Entertainment, Inc.(1) | | 391,000 | | | 10,850,250 |
| | | | | |
Wholesalers - 0.2% | | | | | |
United Stationers Inc.(1) | | 88,000 | | | 5,272,960 |
| | | | | |
| CONSUMER STAPLES - 1.7% | | | | | |
Foods - 1.7% | | | | | |
Sanderson Farms, Inc.(2) | | 1,054,100 | | | 39,064,946 |
| | | | | |
| FINANCIAL SERVICES - 12.0% | | | | | |
Finance Companies - 1.3% | | | | | |
Accredited Home Lenders Holding Co.(1) | | 487,300 | | | 4,517,271 |
Assured Guaranty Ltd. | | 939,600 | | | 25,669,872 |
| | | | | |
| | | | | 30,187,143 |
Financial Miscellaneous - 3.0% | | | | | |
Stewart Information Services Corporation(2) | | 1,610,100 | | | 67,286,079 |
| | | | | |
Insurance: Multi-Line - 5.4% | | | | | |
Hilb Rogal & Hobbs Company | | 956,100 | | | 46,896,705 |
Hub International Limited(3) | | 425,600 | | | 17,739,008 |
Max Re Capital Ltd. | | 655,200 | | | 16,694,496 |
PICO Holdings, Inc.(1) | | 614,200 | | | 26,232,482 |
Security Capital Assurance Ltd | | 490,900 | | | 13,858,107 |
| | | | | |
| | | | | 121,420,798 |
Investment Management Companies - 0.6% | | | | | |
GAMCO Investors, Inc., Class A | | 317,900 | | | 13,774,607 |
| | | | | |
38
| | | | | |
| | | Shares
Held | | Value |
| FINANCIAL SERVICES (CONTINUED) | | | |
Real Estate Investment Trusts (REIT) - 1.7% | | | | | |
Annaly Capital Management, Inc. | | 1,858,400 | | $ | 28,768,032 |
Eagle Hospitality Properties Trust, Inc. | | 883,400 | | | 9,849,910 |
| | | | | |
| | | | | 38,617,942 |
| HEALTHCARE - 4.8% | | | | | |
Electronics: Medical Systems - 2.1% | | | | | |
Analogic Corporation | | 579,600 | | | 36,445,248 |
Datascope Corp. | | 309,000 | | | 11,182,710 |
| | | | | |
| | | | | 47,627,958 |
Health Care Management Services - 0.9% | | | | | |
HealthSpring, Inc.(1) | | 901,200 | | | 21,223,260 |
| | | | | |
Medical & Dental Instruments & Supplies - 1.3% | | | | | |
CONMED Corporation(1) | | 781,800 | | | 22,852,014 |
National Dentex Corporation(1)(2) | | 413,500 | | | 5,822,080 |
| | | | | |
| | | | | 28,674,094 |
Medical Services - 0.5% | | | | | |
America Service Group Inc.(1)(2) | | 603,600 | | | 10,062,012 |
| | | | | |
| MATERIALS & PROCESSING - 9.4% | | | |
Building Materials - 0.6% | | | | | |
Building Materials Holding Corporation | | 609,100 | | | 11,030,801 |
Simpson Manufacturing Co., Inc. | | 41,900 | | | 1,292,196 |
| | | | | |
| | | | | 12,322,997 |
Chemicals - 1.2% | | | | | |
MacDermid, Incorporated | | 772,800 | | | 26,947,536 |
| | | | | |
Engineering & Contracting Services - 0.0%(4) | | | | | |
Dycom Industries, Inc.(1) | | 25,800 | | | 672,348 |
| | | | | |
Metal Fabricating - 4.6% | | | | | |
Lone Star Technologies, Inc.(1) | | 942,000 | | | 62,200,260 |
Quanex Corporation | | 1,002,675 | | | 42,463,286 |
| | | | | |
| | | | | 104,663,546 |
Paper - 1.3% | | | | | |
Albany International Corp., Class A | | 833,500 | | | 29,955,990 |
| | | | | |
Steel - 1.7% | | | | | |
Schnitzer Steel Industries, Inc., Class A | | 978,900 | | | 39,322,413 |
| | | | | |
| OTHER - 1.1% | | | | | |
Multi-Sector Companies - 1.1% | | | | | |
Walter Industries, Inc. | | 1,008,200 | | | 24,952,950 |
| | | | | |
| | | Shares
Held | | Value |
| OTHER ENERGY - 17.9% | | | | | |
Energy Miscellaneous - 0.7% | | | | | |
Aventine Renewable Energy Holdings, Inc.(1) | | 905,700 | | $ | 16,501,854 |
| | | | | |
Machinery: Oil Well Equipment & Services - 3.5% | | | | | |
CARBO Ceramics Inc. | | 580,900 | | | 27,040,895 |
RPC Inc. | | 2,192,500 | | | 36,527,050 |
Superior Energy Services, Inc.(1) | | 447,400 | | | 15,421,878 |
| | | | | |
| | | | | 78,989,823 |
Offshore Drilling - 1.8% | | | | | |
Atwood Oceanics, Inc.(1) | | 689,500 | | | 40,466,755 |
| | | | | |
Oil: Crude Producers - 11.9% | | | | | |
Cimarex Energy Co. | | 1,047,900 | | | 38,793,258 |
Energy Partners, Ltd.(1) | | 493,400 | | | 8,955,210 |
Forest Oil Corporation(1)(2) | | 964,258 | | | 32,177,289 |
Grey Wolf, Inc.(1) | | 4,998,600 | | | 33,490,620 |
Mariner Energy, Inc.(1)(2) | | 1,921,297 | | | 36,754,412 |
Plains Exploration & Production Company(1) | | 231,793 | | | 10,463,136 |
Rosetta Resources Inc.(1) | | 1,261,600 | | | 25,913,264 |
St. Mary Land & Exploration Company | | 1,288,000 | | | 47,243,840 |
Stone Energy Corporation(1) | | 608,700 | | | 18,072,303 |
VeraSun Energy Corporation(1) | | 851,200 | | | 16,913,344 |
| | | | | |
| | | | | 268,776,676 |
| PRODUCER DURABLES - 5.4% | | | | | |
Electrical Equipment & Components - 0.3% | | | | | |
Power-One, Inc.(1) | | 1,119,200 | | | 6,401,824 |
| | | | | |
Manufactured Housing - 0.7% | | | | | |
Champion Enterprises, Inc.(1) | | 1,702,000 | | | 14,977,600 |
| | | | | |
Production Technology Equipment - 4.4% | | | | | |
ATMI, Inc.(1) | | 128,700 | | | 3,934,359 |
Entegris, Inc.(1) | | 2,279,900 | | | 24,394,930 |
LTX Corporation(1)(2) | | 3,261,500 | | | 19,960,380 |
Orbotech, Ltd.(1)(2)(3) | | 2,083,900 | | | 45,908,317 |
Ultratech, Inc.(1) | | 409,300 | | | 5,570,573 |
| | | | | |
| | | | | 99,768,559 |
| TECHNOLOGY - 11.1% | | | | | |
Communications Technology - 2.4% | | | |
ADC Telecommunications, Inc.(1) | | 326,100 | | | 5,458,914 |
ADTRAN, Inc. | | 249,200 | | | 6,068,020 |
Black Box Corporation | | 258,400 | | | 9,441,936 |
CSG Systems International, Inc.(1) | | 669,500 | | | 16,750,890 |
Standard Microsystems Corporation(1) | | 558,000 | | | 17,041,320 |
| | | | | |
| | | | | 54,761,080 |
39
| | | | | |
| | | Shares
Held | | Value |
| TECHNOLOGY (CONTINUED) | | | | | |
Computer Services Software & Systems - 7.2% | | | | | |
Altiris, Inc.(1) | | 300,300 | | $ | 9,882,873 |
CACI International Inc(1) | | 355,200 | | | 16,644,672 |
CIBER, Inc.(1) | | 1,697,700 | | | 13,360,899 |
Keane, Inc.(1) | | 1,115,800 | | | 15,152,564 |
Lawson Software, Inc.(1) | | 6,256,300 | | | 50,613,467 |
Manhattan Associates, Inc.(1) | | 985,900 | | | 27,043,237 |
SI International Inc.(1) | | 302,200 | | | 8,676,162 |
SonicWALL, Inc.(1) | | 735,800 | | | 6,151,288 |
SRA International, Inc., Class A(1) | | 561,100 | | | 13,668,396 |
webMethods, Inc.(1) | | 326,600 | | | 2,348,254 |
| | | | | |
| | | | | 163,541,812 |
Computer Technology - 0.8% | | | | | |
Komag, Incorporated(1) | | 553,800 | | | 18,125,874 |
| | | | | |
Electrical & Electronics - 0.3% | | | | | |
Benchmark Electronics, Inc.(1) | | 351,900 | | | 7,270,254 |
| | | | | |
Electronics: Semi-Conductors/Components - 0.4% | | | | | |
Actel Corporation(1) | | 571,900 | | | 9,447,788 |
| | | | | |
| UTILITIES - 1.9% | | | | | |
Utilities: Electrical - 0.3% | | | | | |
El Paso Electric Company(1) | | 267,800 | | | 7,056,530 |
| | | | | |
Utilities: Gas Distributors - 0.6% | | | |
SEMCO Energy, Inc.(1) | | 1,676,240 | | | 12,772,949 |
| | | | | |
Utilities: Telecommunications - 1.0% | | | |
IDT Corporation | | 538,700 | | | 6,076,536 |
IDT Corporation, Class B | | 557,500 | | | 6,327,625 |
USA Mobility, Inc. | | 519,800 | | | 10,359,614 |
| | | | | |
| | | | | 22,763,775 |
| | | | | |
Total common stocks
(Cost $1,744,377,703) | | | | | 2,098,764,806 |
| | | | | | |
| | | Par
Amount | | Value |
SHORT-TERM INVESTMENTS
(CASH EQUIVALENTS) - 7.1% | | | | | | |
Repurchase agreement with Fixed Income Clearing Corporation, 5.00%, dated 3/30/07, due 4/2/07, maturity value $161,674,336, collateralized by $53,687,500 market value Federal Home Loan Bank Note, 5.75%, due 6/12/26, and $111,153,000 market value Federal National Mortgage Association Note,
5.80%, due 2/9/26
(Cost $161,607,000) | | $ | 161,607,000 | | $ | 161,607,000 |
| | | | | | |
| | | | | | |
Total investments - 99.7%
(Cost $1,905,984,703) | | | | | | 2,260,371,806 |
| | | | | | |
Other assets less liabilities - 0.3% | | | | | | 6,539,840 |
| | | | | | |
| | | | | | |
Total net assets - 100.0%(5) | | | | | $ | 2,266,911,646 |
| | | | | | |
(1) | Non-income producing security. |
(2) | Affiliated company as defined by the Investment Company Act of 1940. See Note (6) in Notes to Financial Statements. |
(3) | The Fund considers the issuer to be from outside of the United States. See the Fund’s Statement of Additional Information for information on how a particular country is assigned. |
| | | | |
Security | | Issuer Country | | Trading Currency |
Hub International Limited | | Canada | | US dollar |
Orbotech, Ltd. | | Israel | | US dollar |
(4) | Represents less than 0.1% of total net assets. |
(5) | Percentages for the various classifications relate to total net assets. |
Security names may not represent the legal name of the entity.
The accompanying notes are an integral part of the financial statements.
40
[THIS PAGE INTENTIONALLY LEFT BLANK]
41
ARTISAN FUNDS, INC.
Statements of Assets and Liabilities – March 31, 2007 (Unaudited)
| | | | |
| | | INTERNATIONAL | |
| ASSETS: | | | | |
Investments in securities, unaffiliated, at value | | $ | 15,592,682,486 | |
Investments in securities, affiliated, at value | | | 307,272,030 | |
Short-term investments (repurchase agreements), at value | | | 149,582,000 | |
| | | | |
Total investments | | | 16,049,536,516 | |
Cash | | | 934 | |
Foreign currency | | | 15,487,846 | |
Receivable from investments sold | | | 211,726,918 | |
Receivable from fund shares sold | | | 29,148,897 | |
Dividends and interest receivable | | | 51,553,050 | |
Other assets | | | 97,324 | |
| | | | |
Total assets | | | 16,357,551,485 | |
| |
| LIABILITIES: | | | | |
Net unrealized loss on foreign currency forward contracts | | | 367,838 | |
Payable for investments purchased | | | 199,457,664 | |
Payable for fund shares redeemed | | | 7,273,821 | |
Payable for operating expenses | | | 5,720,757 | |
Payable for withholding taxes | | | 4,560,050 | |
Payable for deferred directors’ compensation | | | 97,324 | |
| | | | |
Total liabilities | | | 217,477,454 | |
| | | | |
Total net assets | | $ | 16,140,074,031 | |
| | | | |
| NET ASSETS CONSIST OF: | | | | |
Fund shares issued and outstanding | | $ | 10,957,121,416 | |
Net unrealized appreciation on investments and foreign currency related transactions | | | 4,678,833,701 | |
Accumulated undistributed net investment loss | | | (180,575,295 | ) |
Accumulated undistributed net realized gains on investments and foreign currency related transactions | | | 684,694,209 | |
| | | | |
| | $ | 16,140,074,031 | |
| | | | |
| SUPPLEMENTARY INFORMATION: | | | | |
Net assets | | | | |
Investor Shares | | $ | 11,457,417,180 | |
Institutional Shares | | $ | 4,682,656,851 | |
Shares outstanding (Indefinite number of shares authorized, $0.01 par value) | | | | |
Investor Shares | | | 377,412,661 | |
Institutional Shares | | | 153,334,241 | |
Net asset value, offering price and redemption price per share | | | | |
Investor Shares | | $ | 30.36 | |
Institutional Shares | | $ | 30.54 | |
Cost of securities of unaffiliated issuers held | | $ | 11,078,891,800 | |
Cost of securities of affiliated issuers held | | $ | 291,910,467 | |
Cost of foreign currency | | $ | 15,435,093 | |
Value of security on loan | | $ | 335,358,482 | (1) |
(1) | Included in investments in securities, unaffiliated, at value, above. |
42
| | | | | | | | | | |
| INTERNATIONAL SMALL CAP | | | INTERNATIONAL VALUE | | | MID CAP | |
| | | | | | | | | | |
| $ | 1,049,746,260 | | | $ | 1,672,428,244 | | | $ | 5,069,570,736 | |
| | 35,456,540 | | | | 151,428,370 | | | | 93,962,040 | |
| | 10,994,000 | | | | 182,956,000 | | | | 88,016,000 | |
| | | | | | | | | | | |
| | 1,096,196,800 | | | | 2,006,812,614 | | | | 5,251,548,776 | |
| | 729 | | | | 984 | | | | 963 | |
| | 2,504,866 | | | | 3 | | | | - | |
| | 23,751,723 | | | | - | | | | 52,116,853 | |
| | 2,669,387 | | | | 25,982,380 | | | | 19,809,667 | |
| | 2,527,346 | | | | 6,165,544 | | | | 1,252,342 | |
| | 6,767 | | | | 7,833 | | | | 41,223 | |
| | | | | | | | | | | |
| | 1,127,657,618 | | | | 2,038,969,358 | | | | 5,324,769,824 | |
| | |
| | | | | | | | | | |
| | 26,692 | | | | 133 | | | | - | |
| | 13,113,061 | | | | 4,309,627 | | | | 23,720,522 | |
| | 160,634 | | | | 9,051,841 | | | | 19,076,446 | |
| | 364,124 | | | | 907,532 | | | | 3,634,670 | |
| | 1,834,705 | | | | 196,573 | | | | - | |
| | 6,767 | | | | 7,833 | | | | 41,223 | |
| | | | | | | | | | | |
| | 15,505,983 | | | | 14,473,539 | | | | 46,472,861 | |
| | | | | | | | | | | |
| $ | 1,112,151,635 | | | $ | 2,024,495,819 | | | $ | 5,278,296,963 | |
| | | | | | | | | | | |
| | | | | | | | | | |
| $ | 710,542,875 | | | $ | 1,675,572,185 | | | $ | 3,811,575,214 | |
| | 346,158,045 | | | | 291,144,996 | | | | 1,083,039,944 | |
| | (19,739,852 | ) | | | (6,396,072 | ) | | | (19,538,055 | ) |
| | 75,190,567 | | | | 64,174,710 | | | | 403,219,860 | |
| | | | | | | | | | | |
| $ | 1,112,151,635 | | | $ | 2,024,495,819 | | | $ | 5,278,296,963 | |
| | | | | | | | | | | |
| | | | | | | | | | |
| | | | | | | | | | |
| $ | 1,112,151,635 | | | $ | 1,891,680,891 | | | $ | 4,509,485,478 | |
| | | | $ | 132,814,928 | | | $ | 768,811,485 | |
| | | | | | | | | | |
| | 48,847,631 | | | | 66,265,556 | | | | 143,689,301 | |
| | | | | 4,650,132 | | | | 24,062,902 | |
| | | | | | | | | | |
| $ | 22.77 | | | $ | 28.55 | | | $ | 31.38 | |
| | | | $ | 28.56 | | | $ | 31.95 | |
| $ | 720,769,664 | | | $ | 1,595,380,870 | | | $ | 4,057,413,519 | |
| $ | 27,651,553 | | | $ | 120,328,607 | | | $ | 111,095,313 | |
| $ | 2,504,658 | | | $ | 3 | | | $ | - | |
| $ | - | | | $ | - | | | $ | - | |
The accompanying notes are an integral part of the financial statements.
43
ARTISAN FUNDS, INC.
Statements of Assets and Liabilities – March 31, 2007 (Unaudited) (Continued)
| | | |
| | | MID CAP VALUE |
| ASSETS: | | | |
Investments in securities, unaffiliated, at value | | $ | 2,705,659,893 |
Investments in securities, affiliated, at value | | | 212,392,918 |
Short-term investments (repurchase agreements), at value | | | 303,578,000 |
| | | |
Total investments | | | 3,221,630,811 |
Cash | | | 668 |
Receivable from investments sold | | | 285,708 |
Receivable from fund shares sold | | | 8,101,025 |
Dividends and interest receivable | | | 3,132,856 |
Other assets | | | 19,815 |
| | | |
Total assets | | | 3,233,170,883 |
| |
| LIABILITIES: | | | |
Payable for investments purchased | | | 88,720,266 |
Payable for fund shares redeemed | | | 1,821,858 |
Payable for operating expenses | | | 1,972,475 |
Payable for withholding taxes | | | - |
Payable for deferred directors’ compensation | | | 19,815 |
| | | |
Total liabilities | | | 92,534,414 |
| | | |
Total net assets | | $ | 3,140,636,469 |
| | | |
| NET ASSETS CONSIST OF: | | | |
Fund shares issued and outstanding | | $ | 2,617,258,718 |
Net unrealized appreciation on investments and foreign currency related transactions | | | 400,716,801 |
Accumulated undistributed net investment income (loss) | | | 3,422,478 |
Accumulated undistributed net realized gains on investments and foreign currency related transactions | | | 119,238,472 |
| | | |
| | $ | 3,140,636,469 |
| | | |
| SUPPLEMENTARY INFORMATION: | | | |
Net assets | | | |
Investor Shares | | $ | 3,140,636,469 |
Shares outstanding (Indefinite number of shares authorized, $0.01 par value) | | | |
Investor Shares | | | 148,427,931 |
Net asset value, offering price and redemption price per share | | | |
Investor Shares | | $ | 21.16 |
Cost of securities of unaffiliated issuers held | | $ | 2,603,808,271 |
Cost of securities of affiliated issuers held | | $ | 217,105,739 |
44
| | | | | | | | |
| OPPORTUNISTIC VALUE | | SMALL CAP | | | SMALL CAP VALUE |
| | | | | | | | |
| $ | 142,930,057 | | $ | 1,146,174,518 | | | $ | 1,670,273,387 |
| | - | | | - | | | | 428,491,419 |
| | 8,543,000 | | | 23,613,000 | | | | 161,607,000 |
| | | | | | | | | |
| | 151,473,057 | | | 1,169,787,518 | | | | 2,260,371,806 |
| | 999 | | | 900 | | | | 562 |
| | 3,858,880 | | | 14,610,927 | | | | 15,204,807 |
| | 811,202 | | | 3,022,953 | | | | 3,787,063 |
| | 321,938 | | | 326,930 | | | | 1,664,060 |
| | 251 | | | 9,201 | | | | 291,928 |
| | | | | | | | | |
| | 156,466,327 | | | 1,187,758,429 | | | | 2,281,320,226 |
| | |
| | | | | | | | |
| | 1,034,687 | | | 4,751,061 | | | | 12,831,728 |
| | 1,784 | | | 875,046 | | | | 257,331 |
| | 202,612 | | | 666,328 | | | | 1,299,837 |
| | - | | | - | | | | 5,592 |
| | 251 | | | 9,201 | | | | 14,092 |
| | | | | | | | | |
| | 1,239,334 | | | 6,301,636 | | | | 14,408,580 |
| | | | | | | | | |
| $ | 155,226,993 | | $ | 1,181,456,793 | | | $ | 2,266,911,646 |
| | | | | | | | | |
| | | | | | | | |
| $ | 140,239,565 | | $ | 1,033,336,124 | | | $ | 1,788,383,282 |
| | 12,219,979 | | | 129,990,437 | | | | 354,387,103 |
| | 206,977 | | | (4,811,494 | ) | | | 1,235,060 |
| | 2,560,472 | | | 22,941,726 | | | | 122,906,201 |
| | | | | | | | | |
| $ | 155,226,993 | | $ | 1,181,456,793 | | | $ | 2,266,911,646 |
| | | | | | | | | |
| | | | | | | | |
| | | | | | | | |
| $ | 155,226,993 | | $ | 1,181,456,793 | | | $ | 2,266,911,646 |
| | | | | | | | |
| | 13,314,148 | | | 64,645,493 | | | | 121,098,629 |
| | | | | | | | |
| $ | 11.66 | | $ | 18.28 | | | $ | 18.72 |
| $ | 139,256,957 | | $ | 1,039,797,081 | | | $ | 1,523,025,699 |
| $ | - | | $ | - | | | $ | 382,959,004 |
The accompanying notes are an integral part of the financial statements.
45
ARTISAN FUNDS, INC.
Statements of Operations — For the Six Months Ended March 31, 2007 (Unaudited)
| | | | |
| | | INTERNATIONAL | |
| INVESTMENT INCOME: | | | | |
Dividends, from unaffiliated issuers(1) | | $ | 87,469,856 | |
Dividends, from affiliated issuers(1) | | | 2,062,995 | |
Interest | | | 3,801,427 | |
Securities lending | | | 904,819 | |
Other | | | 860,550 | |
| | | | |
Total investment income | | | 95,099,647 | |
| |
| EXPENSES: | | | | |
Advisory fees | | | 69,545,256 | |
Transfer agent fees | | | | |
Investor Shares | | | 11,115,943 | |
Institutional Shares | | | 12,824 | |
Shareholder communications | | | | |
Investor Shares | | | 678,770 | |
Institutional Shares | | | 19,448 | |
Custodian fees | | | 3,926,796 | |
Accounting fees | | | 38,042 | |
Professional fees | | | 336,712 | |
Registration fees | | | | |
Investor Shares | | | 50,064 | |
Institutional Shares | | | 7,297 | |
Directors’ fees | | | 205,974 | |
Other operating expenses | | | 267,583 | |
| | | | |
Total operating expenses | | | 86,204,709 | |
| | | | |
Net investment income (loss) | | | 8,894,938 | |
| |
| NET REALIZED AND UNREALIZED GAINS (LOSSES) ON INVESTMENTS: | | | | |
Net realized gain (loss) on: | | | | |
Investments(1) | | | 812,193,316 | |
Foreign currency related transactions | | | (954,623 | ) |
| | | | |
| | | 811,238,693 | |
Net increase (decrease) in unrealized appreciation or depreciation on: | | | | |
Investments | | | 1,387,615,231 | |
Foreign currency related transactions | | | 168,798 | |
| | | | |
| | | 1,387,784,029 | |
| | | | |
Net gain on investments and foreign currency related transactions | | | 2,199,022,722 | |
| | | | |
Net increase in net assets resulting from operations | | $ | 2,207,917,660 | |
| | | | |
| | | | | | | |
(1) | | | | | | | |
Fund | | Net of foreign taxes
withheld on dividends,
unaffiliated issuers | | Net of foreign taxes
withheld on dividends,
affiliated issuers | | Including net realized
gain (loss) on investments
from affiliated issuers | |
International | | $9,599,777 | | $155,279 | | $(51,131,555 | ) |
International Small Cap | | 423,973 | | 46,000 | | 191,354 | |
International Value | | 163,262 | | 47,471 | | (137,512 | ) |
Mid Cap | | - | | - | | 2,503,374 | |
46
| | | | | | | | | | |
| | INTERNATIONAL SMALL CAP | | | | INTERNATIONAL VALUE | | | | MID CAP | |
| | | | | | | | | | |
| $ | 6,327,961 | | | $ | 13,590,156 | | | $ | 10,769,402 | |
| | 260,669 | | | | 630,690 | | | | - | |
| | 626,246 | | | | 3,898,352 | | | | 2,057,644 | |
| | - | | | | - | | | | - | |
| | - | | | | - | | | | - | |
| | | | | | | | | | | |
| | 7,214,876 | | | | 18,119,198 | | | | 12,827,046 | |
| | |
| | | | | | | | | | |
| | 6,524,811 | | | | 8,321,725 | | | | 25,316,096 | |
| | | | | | | | | | |
| | 817,640 | | | | 1,659,178 | | | | 6,067,157 | |
| | | | | 7,358 | | | | 11,632 | |
| | | | | | | | | | |
| | 41,669 | | | | 168,196 | | | | 522,752 | |
| | | | | 11,191 | | | | 7,661 | |
| | 348,023 | | | | 330,439 | | | | 73,065 | |
| | 27,041 | | | | 37,283 | | | | 33,143 | |
| | 24,912 | | | | 32,744 | | | | 93,429 | |
| | | | | | | | | | |
| | 20,475 | | | | 101,951 | | | | 28,376 | |
| | | | | 30,743 | | | | 7,524 | |
| | 14,154 | | | | 21,638 | | | | 76,272 | |
| | 100,639 | | | | 35,200 | | | | 106,392 | |
| | | | | | | | | | | |
| | 7,919,364 | | | | 10,757,646 | | | | 32,343,499 | |
| | | | | | | | | | | |
| | (704,488 | ) | | | 7,361,552 | | | | (19,516,453 | ) |
| | |
| | | | | | | | | | |
| | | | | | | | | | |
| | 76,236,893 | | | | 82,956,508 | | | | 416,492,639 | |
| | (408,207 | ) | | | (337,318 | ) | | | - | |
| | | | | | | | | | | |
| | 75,828,686 | | | | 82,619,190 | | | | 416,492,639 | |
| | | | | | | | | | |
| | 120,959,626 | | | | 115,982,167 | | | | 118,672,579 | |
| | (808,940 | ) | | | 60,874 | | | | - | |
| | | | | | | | | | | |
| | 120,150,686 | | | | 116,043,041 | | | | 118,672,579 | |
| | | | | | | | | | | |
| | 195,979,372 | | | | 198,662,231 | | | | 535,165,218 | |
| | | | | | | | | | | |
| $ | 195,274,884 | | | $ | 206,023,783 | | | $ | 515,648,765 | |
| | | | | | | | | | | |
The accompanying notes are an integral part of the financial statements.
47
ARTISAN FUNDS, INC.
Statements of Operations — For the Six Months Ended March 31, 2007 (Unaudited) (Continued)
| | | |
| | | MID CAP VALUE |
| INVESTMENT INCOME: | | | |
Dividends, from unaffiliated issuers(1) | | $ | 15,717,366 |
Dividends, from affiliated issuers(1) | | | 824,080 |
Interest | | | 4,169,223 |
Other | | | - |
| | | |
Total investment income | | | 20,710,669 |
| |
| EXPENSES: | | | |
Advisory fees | | | 13,525,903 |
Transfer agent fees | | | |
Investor Shares | | | 3,130,679 |
Shareholder communications | | | |
Investor Shares | | | 353,963 |
Custodian fees | | | 37,040 |
Accounting fees | | | 21,434 |
Professional fees | | | 46,691 |
Registration fees | | | |
Investor Shares | | | 63,178 |
Directors’ fees | | | 38,479 |
Other operating expenses | | | 58,587 |
| | | |
Total operating expenses | | | 17,275,954 |
| | | |
Net investment income (loss) | | | 3,434,715 |
| |
| NET REALIZED AND UNREALIZED GAINS (LOSSES) ON INVESTMENTS: | | | |
Net realized gain (loss) on: | | | |
Investments(1) | | | 141,549,630 |
Foreign currency related transactions | | | - |
| | | |
| | | 141,549,630 |
Net increase (decrease) in unrealized appreciation or depreciation on: | | | |
Investments | | | 197,560,496 |
Foreign currency related transactions | | | - |
| | | |
| | | 197,560,496 |
| | | |
Net gain on investments and foreign currency related transactions | | | 339,110,126 |
| | | |
Net increase in net assets resulting from operations | | $ | 342,544,841 |
| | | |
| | | | | | |
(1) | | | | | | |
Fund | | Net of foreign taxes
withheld on dividends,
unaffiliated issuers | | Net of foreign taxes
withheld on dividends,
affiliated issuers | | Including net realized
gain on investments
from affiliated issuers |
Mid Cap Value | | $ - | | $ - | | $ 5,155,140 |
Opportunistic Value | | - | | - | | - |
Small Cap | | - | | - | | - |
Small Cap Value | | 13,519 | | - | | 12,644,385 |
48
| | | | | | | | | |
| OPPORTUNISTIC VALUE | | | SMALL CAP | | | SMALL CAP VALUE |
| | | | | | | | | |
| $ | 913,863 | | | $ | 1,442,347 | | | $ | 7,660,213 |
| | - | | | | - | | | | 2,772,066 |
| | 233,293 | | | | 1,152,745 | | | | 3,705,556 |
| | - | | | | 31,693 | | | | - |
| | | | | | | | | | |
| | 1,147,156 | | | | 2,626,785 | | | | 14,137,835 |
| | |
| | | | | | | | | |
| | 517,813 | | | | 6,103,444 | | | | 10,292,131 |
| | | | | | | | | |
| | 221,622 | | | | 1,047,494 | | | | 2,245,416 |
| | | | | | | | | |
| | 15,934 | | | | 133,200 | | | | 167,846 |
| | 6,755 | | | | 22,638 | | | | 31,466 |
| | 30,573 | | | | 22,990 | | | | 23,324 |
| | 15,608 | | | | 26,844 | | | | 35,187 |
| | | | | | | | | |
| | 46,904 | | | | 29,890 | | | | 27,470 |
| | 3,000 | | | | 17,801 | | | | 29,681 |
| | 4,813 | | | | 29,270 | | | | 43,420 |
| | | | | | | | | | |
| | 863,022 | | | | 7,433,571 | | | | 12,895,941 |
| | | | | | | | | | |
| | 284,134 | | | | (4,806,786 | ) | | | 1,241,894 |
| | |
| | | | | | | | | |
| | | | | | | | | |
| | 2,987,833 | | | | 34,105,315 | | | | 146,039,164 |
| | (2,829 | ) | | | - | | | | - |
| | | | | | | | | | |
| | 2,985,004 | | | | 34,105,315 | | | | 146,039,164 |
| | | | | | | | | |
| | 9,788,051 | | | | 51,367,550 | | | | 76,771,715 |
| | 4,399 | | | | - | | | | - |
| | | | | | | | | | |
| | 9,792,450 | | | | 51,367,550 | | | | 76,771,715 |
| | | | | | | | | |
| | 12,777,454 | | | | 85,472,865 | | | | 222,810,879 |
| | | | | | | | | | |
| $ | 13,061,588 | | | $ | 80,666,079 | | | $ | 224,052,773 |
| | | | | | | | | | |
The accompanying notes are an integral part of the financial statements.
49
ARTISAN FUNDS, INC.
Statements of Changes in Net Assets
| | | | | | | | |
| | | INTERNATIONAL | |
| | | Six Months Ended
3/31/2007(1) | | | Year Ended
9/30/2006 | |
| OPERATIONS: | | | | | | | | |
Net investment income (loss) | | $ | 8,894,938 | | | $ | 91,268,255 | |
Net realized gain (loss) on: | | | | | | | | |
Investments | | | 812,193,316 | | | | 1,705,050,798 | |
Foreign currency related transactions | | | (954,623 | ) | | | (3,919,900 | ) |
Net increase (decrease) in unrealized appreciation or depreciation on: | | | | | | | | |
Investments | | | 1,387,615,231 | | | | 485,434,611 | |
Foreign currency related transactions | | | 168,798 | | | | 249,502 | |
| | | | | | | | |
Net increase in net assets resulting from operations | | | 2,207,917,660 | | | | 2,278,083,266 | |
| | |
| DISTRIBUTIONS PAID TO SHAREHOLDERS: | | | | | | | | |
Net investment income: | | | | | | | | |
Investor Shares | | | (149,579,439 | ) | | | (129,259,160 | ) |
Institutional Shares | | | (69,406,628 | ) | | | (71,446,014 | ) |
Net realized gains on investment transactions: | | | | | | | | |
Investor Shares | | | (800,773,961 | ) | | | - | |
Institutional Shares | | | (332,232,670 | ) | | | - | |
| | | | | | | | |
Total distributions paid to shareholders | | | (1,351,992,698 | ) | | | (200,705,174 | ) |
| | |
| FUND SHARE ACTIVITIES: | | | | | | | | |
Net increase (decrease) in net assets resulting from fund share activities | | | 1,366,296,679 | | | | 165,474,731 | |
| | | | | | | | |
Total increase (decrease) in net assets | | | 2,222,221,641 | | | | 2,242,852,823 | |
| | | | | | | | |
Net assets, beginning of period | | | 13,917,852,390 | | | | 11,674,999,567 | |
| | | | | | | | |
Net assets, end of period | | $ | 16,140,074,031 | | | $ | 13,917,852,390 | |
| | | | | | | | |
| | | | | | | | |
Accumulated undistributed net investment income (loss) | | $ | (180,575,295 | ) | | $ | 29,515,834 | |
| | | | | | | | |
50
| | | | | | | | | | | | | | | | | | | | | | |
| INTERNATIONAL SMALL CAP | | | INTERNATIONAL VALUE | | | MID CAP | |
Six Months Ended
3/31/2007(1) | | | Year Ended
9/30/2006 | | | Six Months Ended
3/31/2007(1) | | | Year Ended
9/30/2006 | | | Six Months Ended
3/31/2007(1) | | | Year Ended
9/30/2006 | |
| | | | | | | | | | | | | | | | | | | | | | |
| $ | (704,488 | ) | | $ | 3,700,720 | | | $ | 7,361,552 | | | $ | 18,549,621 | | | $ | (19,516,453 | ) | | $ | (29,617,835 | ) |
| | | | | | | | | | | | | | | | | | | | | | |
| | 76,236,893 | | | | 165,713,461 | | | | 82,956,508 | | | | 63,848,919 | | | | 416,492,639 | | | | 701,530,781 | |
| | (408,207 | ) | | | (381,598 | ) | | | (337,318 | ) | | | (230,417 | ) | | | - | | | | - | |
| | | | | | | | | | | | | | | | | | | | | | |
| | 120,959,626 | | | | (1,545,057 | ) | | | 115,982,167 | | | | 103,014,146 | | | | 118,672,579 | | | | (251,537,673 | ) |
| | (808,940 | ) | | | (617,231 | ) | | | 60,874 | | | | 36,872 | | | | - | | | | - | |
| | | | | | | | | | | | | | | | | | | | | | | |
| | 195,274,884 | | | | 166,870,295 | | | | 206,023,783 | | | | 185,219,141 | | | | 515,648,765 | | | | 420,375,273 | |
| | | | | |
| | | | | | | | | | | | | | | | | | | | | | |
| | | | | | | | | | | | | | | | | | | | | | |
| | (29,082,285 | ) | | | (7,528,607 | ) | | | (24,384,271 | ) | | | (13,095,062 | ) | | | - | | | | - | |
| | | | | | | | | (1,768,836 | ) | | | | | | | - | | | | - | |
| | | | | | | | | | | | | | | | | | | | | | |
| | (156,285,811 | ) | | | (71,173,967 | ) | | | (71,597,063 | ) | | | (16,600,079 | ) | | | (480,601,368 | ) | | | (209,469,474 | ) |
| | | | | | | | | (3,867,611 | ) | | | | | | | (82,408,794 | ) | | | (41,213,795 | ) |
| | | | | | | | | | | | | | | | | | | | | | | |
| | (185,368,096 | ) | | | (78,702,574 | ) | | | (101,617,781 | ) | | | (29,695,141 | ) | | | (563,010,162 | ) | | | (250,683,269 | ) |
| | | | | |
| | | | | | | | | | | | | | | | | | | | | | |
| | 162,482,963 | | | | 70,444,652 | | | | 607,514,779 | | | | 555,837,073 | | | | (44,136,485 | ) | | | (655,280,963 | ) |
| | | | | | | | | | | | | | | | | | | | | | | |
| | 172,389,751 | | | | 158,612,373 | | | | 711,920,781 | | | | 711,361,073 | | | | (91,497,882 | ) | | | (485,588,959 | ) |
| | | | | | | | | | | | | | | | | | | | | | | |
| | 939,761,884 | | | | 781,149,511 | | | | 1,312,575,038 | | | | 601,213,965 | | | | 5,369,794,845 | | | | 5,855,383,804 | |
| | | | | | | | | | | | | | | | | | | | | | | |
| $ | 1,112,151,635 | | | $ | 939,761,884 | | | $ | 2,024,495,819 | | | $ | 1,312,575,038 | | | $ | 5,278,296,963 | | | $ | 5,369,794,845 | |
| | | | | | | | | | | | | | | | | | | | | | | |
| | | | | | | | | | | | | | | | | | | | | | |
| $ | (19,739,852 | ) | | $ | 10,046,921 | | | $ | (6,396,072 | ) | | $ | 12,395,483 | | | $ | (19,538,055 | ) | | $ | (21,602 | ) |
| | | | | | | | | | | | | | | | | | | | | | | |
The accompanying notes are an integral part of the financial statements.
51
ARTISAN FUNDS, INC.
Statements of Changes in Net Assets (Continued)
| | | | | | | | |
| | | MID CAP VALUE | |
| | | Six Months Ended
3/31/2007(1) | | | Year Ended
9/30/2006 | |
| OPERATIONS: | | | | | | | | |
Net investment income (loss) | | $ | 3,434,715 | | | $ | 8,980,992 | |
Net realized gain (loss) on: | | | | | | | | |
Investments | | | 141,549,630 | | | | 142,494,534 | |
Foreign currency related transactions | | | - | | | | - | |
Net increase (decrease) in unrealized appreciation or depreciation on: | | | | | | | | |
Investments | | | 197,560,496 | | | | (2,012,828 | ) |
Foreign currency related transactions | | | - | | | | - | |
| | | | | | | | |
Net increase in net assets resulting from operations | | | 342,544,841 | | | | 149,462,698 | |
| | |
| DISTRIBUTIONS PAID TO SHAREHOLDERS: | | | | | | | | |
Net investment income: | | | | | | | | |
Investor Shares | | | (7,420,350 | ) | | | (1,572,879 | ) |
Net realized gains on investment transactions: | | | | | | | | |
Investor Shares | | | (156,158,979 | ) | | | (115,690,210 | ) |
| | | | | | | | |
Total distributions paid to shareholders | | | (163,579,329 | ) | | | (117,263,089 | ) |
| | |
| FUND SHARE ACTIVITIES: | | | | | | | | |
Net increase (decrease) in net assets resulting from fund share activities | | | 318,349,265 | | | | (160,035,696 | ) |
| | | | | | | | |
Total increase (decrease) in net assets | | | 497,314,777 | | | | (127,836,087 | ) |
| | | | | | | | |
Net assets, beginning of period | | | 2,643,321,692 | | | | 2,771,157,779 | |
| | | | | | | | |
Net assets, end of period | | $ | 3,140,636,469 | | | $ | 2,643,321,692 | |
| | | | | | | | |
| | | | | | | | |
Accumulated undistributed net investment income (loss) | | $ | 3,422,478 | | | $ | 7,408,113 | |
| | | | | | | | |
(2) | For the period from commencement of operations (March 27, 2006) through September 30, 2006. |
52
| | | | | | | | | | | | | | | | | | | | | | |
| OPPORTUNISTIC VALUE | | | SMALL CAP | | | SMALL CAP VALUE | |
Six Months Ended
3/31/2007(1) | | | Period Ended
9/30/2006(2) | | | Six Months Ended
3/31/2007(1) | | | Year Ended
9/30/2006 | | | Six Months Ended
3/31/2007(1) | | | Year Ended
9/30/2006 | |
| | | | | | | | | | | | | | | | | | | | | | |
| $ | 284,134 | | | $ | 134,163 | | | $ | (4,806,786 | ) | | $ | (8,764,671 | ) | | $ | 1,241,894 | | | $ | (1,667,593 | ) |
| | | | | | | | | | | | | | | | | | | | | | |
| | 2,987,833 | | | | 513,722 | | | | 34,105,315 | | | | 32,875,407 | | | | 146,039,164 | | | | 264,972,761 | |
| | (2,829 | ) | | | (2,194 | ) | | | - | | | | - | | | | - | | | | - | |
| | | | | | | | | | | | | | | | | | | | | | |
| | 9,788,051 | | | | 2,428,049 | | | | 51,367,550 | | | | (23,271,457 | ) | | | 76,771,715 | | | | (60,339,075 | ) |
| | 4,399 | | | | (520 | ) | | | - | | | | - | | | | - | | | | - | |
| | | | | | | | | | | | | | | | | | | | | | | |
| | 13,061,588 | | | | 3,073,220 | | | | 80,666,079 | | | | 839,279 | | | | 224,052,773 | | | | 202,966,093 | |
| | | | | |
| | | | | | | | | | | | | | | | | | | | | | |
| | | | | | | | | | | | | | | | | | | | | | |
| | (262,233 | ) | | | - | | | | - | | | | - | | | | - | | | | - | |
| | | | | | | | | | | | | | | | | | | | | | |
| | (938,254 | ) | | | - | | | | (24,611,864 | ) | | | (36,967,423 | ) | | | (264,220,232 | ) | | | (205,122,847 | ) |
| | | | | | | | | | | | | | | | | | | | | | | |
| | (1,200,487 | ) | | | - | | | | (24,611,864 | ) | | | (36,967,423 | ) | | | (264,220,232 | ) | | | (205,122,847 | ) |
| | | | | |
| | | | | | | | | | | | | | | | | | | | | | |
| | 68,409,797 | | | | 71,882,875 | | | | (138,416,768 | ) | | | 196,696,072 | | | | 267,596,982 | | | | 320,766,182 | |
| | | | | | | | | | | | | | | | | | | | | | | |
| | 80,270,898 | | | | 74,956,095 | | | | (82,362,553 | ) | | | 160,567,928 | | | | 227,429,523 | | | | 318,609,428 | |
| | | | | | | | | | | | | | | | | | | | | | | |
| | 74,956,095 | | | | - | | | | 1,263,819,346 | | | | 1,103,251,418 | | | | 2,039,482,123 | | | | 1,720,872,695 | |
| | | | | | | | | | | | | | | | | | | | | | | |
| $ | 155,226,993 | | | $ | 74,956,095 | | | $ | 1,181,456,793 | | | $ | 1,263,819,346 | | | $ | 2,266,911,646 | | | $ | 2,039,482,123 | |
| | | | | | | | | | | | | | | | | | | | | | | |
| | | | | | | | | | | | | | | | | | | | | | |
| $ | 206,977 | | | $ | 185,076 | | | $ | (4,811,494 | ) | | $ | (4,708 | ) | | $ | 1,235,060 | | | $ | (6,834 | ) |
| | | | | | | | | | | | | | | | | | | | | | | |
The accompanying notes are an integral part of the financial statements.
53
ARTISAN FUNDS, INC.
Financial Highlights – For a share outstanding throughout each period
The financial highlights table is intended to help you understand the Funds’ financial performance for the past 5 years or, if shorter, the period of a Fund’s operations. Certain information reflects financial results for a single Fund share. The total returns in the table represent the rate that an investor would have earned or lost on an investment in the Fund (assuming reinvestment of all dividends and distributions).
| | | | | | | | | | | | | | | | | | | | | | | | |
Year or
Period
Ended | | | Net Asset
Value
Beginning
of Period | | Net
Investment
Income
(Loss)(1) | | | Net Realized
and Unrealized
Gain (Loss) on
Investments | | | Total Income
(Loss) from
Investment
Operations | | | Dividends
from Net
Investment
Income | | |
Distributions
from Net
Realized
Gains | |
| | | | | | | | | | | | | | | | | | | | | | | | |
| ARTISAN INTERNATIONAL FUND | | | | | | | | | | | | | |
| Investor Shares | | | | | | | | | | | | | | | | | | | | | | | | |
| 3/31/2007 | (5) | | $ | 28.75 | | $ | 0.01 | | | $ | 4.36 | | | $ | 4.37 | | | $ | (0.43 | ) | | $ | (2.33 | ) |
| 9/30/2006 | | | | 24.40 | | | 0.18 | | | | 4.58 | | | | 4.76 | | | | (0.41 | ) | | | - | |
| 9/30/2005 | | | | 19.33 | | | 0.21 | | | | 4.98 | | | | 5.19 | | | | (0.12 | ) | | | - | |
| 9/30/2004 | | | | 16.54 | | | 0.12 | | | | 2.85 | | | | 2.97 | | | | (0.18 | ) | | | - | |
| 9/30/2003 | (6) | | | 15.63 | | | 0.02 | | | | 0.89 | | | | 0.91 | | | | - | | | | - | |
| 6/30/2003 | | | | 18.15 | | | 0.20 | | | | (2.62 | ) | | | (2.42 | ) | | | (0.10 | ) | | | - | |
| 6/30/2002 | | | | 19.53 | | | 0.15 | | | | (1.46 | ) | | | (1.31 | ) | | | (0.07 | ) | | | - | |
| Institutional Shares | | | | | | | | | | | | | | | | | | | | |
| 3/31/2007 | (5) | | $ | 28.92 | | $ | 0.04 | | | $ | 4.40 | | | $ | 4.44 | | | $ | (0.49 | ) | | $ | (2.33 | ) |
| 9/30/2006 | | | | 24.54 | | | 0.22 | | | | 4.62 | | | | 4.84 | | | | (0.46 | ) | | | - | |
| 9/30/2005 | | | | 19.44 | | | 0.25 | | | | 5.01 | | | | 5.26 | | | | (0.16 | ) | | | - | |
| 9/30/2004 | | | | 16.63 | | | 0.16 | | | | 2.86 | | | | 3.02 | | | | (0.21 | ) | | | - | |
| 9/30/2003 | (6) | | | 15.71 | | | 0.03 | | | | 0.89 | | | | 0.92 | | | | - | | | | - | |
| 6/30/2003 | | | | 18.24 | | | 0.25 | | | | (2.65 | ) | | | (2.40 | ) | | | (0.13 | ) | | | - | |
| 6/30/2002 | | | | 19.62 | | | 0.18 | | | | (1.46 | ) | | | (1.28 | ) | | | (0.10 | ) | | | - | |
| | | | | | | | | | | | | | | | | | | | | | | | |
| ARTISAN INTERNATIONAL SMALL CAP FUND | | | | | | | | | | | | | |
| Investor Shares | | | | | | | | | | | | | | | | | | | | | | | | |
| 3/31/2007 | (5) | | $ | 22.77 | | $ | (0.02 | ) | | $ | 4.48 | | | $ | 4.46 | | | $ | (0.70 | ) | | $ | (3.76 | ) |
| 9/30/2006 | | | | 20.86 | | | 0.09 | | | | 3.90 | | | | 3.99 | | | | (0.20 | ) | | | (1.88 | ) |
| 9/30/2005 | | | | 16.40 | | | 0.19 | | | | 6.16 | | | | 6.35 | | | | (0.12 | ) | | | (1.77 | ) |
| 9/30/2004 | | | | 13.84 | | | 0.15 | | | | 2.93 | | | | 3.08 | | | | (0.03 | ) | | | (0.49 | ) |
| 9/30/2003 | (6) | | | 12.10 | | | - | (7) | | | 1.74 | | | | 1.74 | | | | - | | | | - | |
| 6/30/2003 | | | | 10.50 | | | 0.03 | | | | 1.59 | | | | 1.62 | | | | - | | | | (0.02 | ) |
| 6/30/2002 | (8) | | | 10.00 | | | - | (7) | | | 0.50 | (9) | | | 0.50 | | | | - | | | | - | |
| | | | | | | | | | | | | | | | | | | | | | | | |
| ARTISAN INTERNATIONAL VALUE FUND | | | | | | | | | | | | | |
| Investor Shares | | | | | | | | | | | | | | | | | | | | | | | | |
| 3/31/2007 | (5) | | $ | 26.71 | | $ | 0.12 | | | $ | 3.44 | | | $ | 3.56 | | | $ | (0.44 | ) | | $ | (1.28 | ) |
| 9/30/2006 | | | | 22.38 | | | 0.53 | | | | 4.87 | | | | 5.40 | | | | (0.47 | ) | | | (0.60 | ) |
| 9/30/2005 | | | | 18.54 | | | 0.28 | | | | 3.88 | | | | 4.16 | | | | (0.11 | ) | | | (0.21 | ) |
| 9/30/2004 | | | | 14.32 | | | 0.28 | | | | 4.33 | | | | 4.61 | | | | (0.09 | ) | | | (0.30 | ) |
| 9/30/2003 | (6) | | | 13.01 | | | 0.02 | | | | 1.29 | | | | 1.31 | | | | - | | | | - | |
| 6/30/2003 | (10) | | | 10.00 | | | 0.09 | | | | 2.92 | | | | 3.01 | | | | - | | | | - | |
| Institutional Shares | | | | | | | | | | | | | | | | | | | | |
| 3/31/2007 | (5) | | $ | 26.71 | | $ | 0.14 | | | $ | 3.44 | | | $ | 3.58 | | | $ | (0.45 | ) | | $ | (1.28 | ) |
(1) | Computed based on average shares outstanding. |
(2) | Periods less than twelve months (where applicable) are not annualized. |
(3) | Periods less than twelve months (where applicable) are annualized. |
(4) | The ratios of expenses to average net assets and net investment income (loss) to average net assets exclude expenses waived or paid by the Adviser or the Board of Directors. Absent expenses waived or paid by the Adviser or the Board of Directors, the ratios of expenses to average net assets and net investment income (loss) to average net assets would have been as follows: |
| | | | | | | | |
| | | Year or
Period Ended | | Ratio of Expenses to
Average Net Assets | | | Ratio of Net Investment Income
(Loss) to Average Net Assets | |
International Investor Shares | | 9/30/2003 | | 1.23 | % | | 0.49 | % |
International Institutional Shares | | 9/30/2003 | | 1.00 | | | 0.73 | |
International Small Cap Investor Shares | | 9/30/2003 | | 1.69 | | | 0.05 | |
International Value Investor Shares | | 9/30/2003 | | 2.80 | | | (0.34 | ) |
| | 6/30/2003 | | 5.02 | | | (1.43 | ) |
54
| | | | | | | | | | | | | | | | | | | | |
Total
Distributions | | | Net Asset
Value
End
of Period | | Total
Return(2) | | | Net Assets
End of
Period
(millions) | | Ratio of
Expenses
to Average
Net Assets(3)(4) | | | Ratio of Net
Investment
Income (Loss)
to Average
Net Assets(3)(4) | | | Portfolio
Turnover
Rate(2) | |
| | | | | | | | | | | | | | | | | | | | |
| | | | | | | | | | | | | | | | | |
| | | | | | | | | | | | | | | | | | | | | |
| $ | (2.76 | ) | | $ | 30.36 | | 15.76 | % | | $ | 11,457.4 | | 1.21 | % | | 0.05 | % | | 31.90 | % |
| | (0.41 | ) | | | 28.75 | | 19.84 | | | | 9,801.9 | | 1.20 | | | 0.66 | | | 57.80 | |
| | (0.12 | ) | | | 24.40 | | 26.97 | | | | 7,686.9 | | 1.19 | | | 0.94 | | | 56.15 | |
| | (0.18 | ) | | | 19.33 | | 18.04 | | | | 6,130.2 | | 1.22 | | | 0.64 | | | 54.96 | |
| | - | | | | 16.54 | | 5.82 | | | | 5,544.7 | | 1.23 | | | 0.49 | | | 15.23 | |
| | (0.10 | ) | | | 15.63 | | (13.30 | ) | | | 5,182.8 | | 1.20 | | | 1.35 | | | 37.13 | |
| | (0.07 | ) | | | 18.15 | | (6.73 | ) | | | 5,289.6 | | 1.21 | | | 0.82 | | | 50.67 | |
| | | | | | | | | | | | | | | | | | | | | |
| $ | (2.82 | ) | | $ | 30.54 | | 15.90 | % | | $ | 4,682.7 | | 0.99 | % | | 0.27 | % | | 31.90 | % |
| | (0.46 | ) | | | 28.92 | | 20.07 | | | | 4,116.0 | | 1.00 | | | 0.82 | | | 57.80 | |
| | (0.16 | ) | | | 24.54 | | 27.21 | | | | 3,988.1 | | 0.99 | | | 1.11 | | | 56.15 | |
| | (0.21 | ) | | | 19.44 | | 18.31 | | | | 3,622.1 | | 1.01 | | | 0.85 | | | 54.96 | |
| | - | | | | 16.63 | | 5.86 | | | | 3,354.7 | | 1.00 | | | 0.73 | | | 15.23 | |
| | (0.13 | ) | | | 15.71 | | (13.09 | ) | | | 2,975.0 | | 1.01 | | | 1.68 | | | 37.13 | |
| | (0.10 | ) | | | 18.24 | | (6.52 | ) | | | 2,062.0 | | 1.01 | | | 1.01 | | | 50.67 | |
| | | | | | | | | | | | | | | | | | | | |
| | | | | | | | | | | | | | | | | | | | | |
| | | | | | | | | | | | | | | | | | | | | |
| $ | (4.46 | ) | | $ | 22.77 | | 20.86 | % | | $ | 1,112.2 | | 1.52 | % | | (0.13 | )% | | 27.29 | % |
| | (2.08 | ) | | | 22.77 | | 21.63 | | | | 939.8 | | 1.53 | | | 0.41 | | | 62.21 | |
| | (1.89 | ) | | | 20.86 | | 42.13 | | | | 781.1 | | 1.53 | | | 1.03 | | | 57.25 | |
| | (0.52 | ) | | | 16.40 | | 22.66 | | | | 515.0 | | 1.57 | | | 0.95 | | | 81.03 | |
| | - | | | | 13.84 | | 14.46 | | | | 391.3 | | 1.68 | | | 0.06 | | | 13.28 | |
| | (0.02 | ) | | | 12.10 | | 15.53 | | | | 238.6 | | 1.77 | | | 0.28 | | | 62.79 | |
| | - | | | | 10.50 | | 5.00 | | | | 74.5 | | 2.39 | | | (0.02 | ) | | 25.14 | |
| | | | | | | | | | | | | | | | | | | | |
| | | | | | | | | | | | | | | | | | | | | |
| | | | | | | | | | | | | | | | | | | | | |
| $ | (1.72 | ) | | $ | 28.55 | | 13.52 | % | | $ | 1,891.7 | | 1.25 | % | | 0.84 | % | | 22.58 | % |
| | (1.07 | ) | | | 26.71 | | 25.38 | | | | 1,312.6 | | 1.25 | | | 2.18 | | | 42.52 | |
| | (0.32 | ) | | | 22.38 | | 22.71 | | | | 601.2 | | 1.31 | | | 1.33 | | | 53.15 | |
| | (0.39 | ) | | | 18.54 | | 32.81 | | | | 217.5 | | 1.56 | | | 1.61 | | | 14.66 | |
| | - | | | | 14.32 | | 10.07 | | | | 23.6 | | 2.00 | | | 0.46 | | | 9.30 | |
| | - | | | | 13.01 | | 30.10 | | | | 16.3 | | 2.45 | | | 1.14 | | | 17.42 | |
| | | | | | | | | | | | | | | | | | | | | |
| $ | (1.73 | ) | | $ | 28.56 | | 13.60 | % | | $ | 132.8 | | 1.08 | % | | 1.01 | % | | 22.58 | % |
| | (5) | Unaudited. For the six months ended March 31, 2007. |
| | (6) | For the period from July 1, 2003 to September 30, 2003. Artisan Funds changed its fiscal year-end from June 30 to September 30 effective September 30, 2003. |
| | (7) | Amount is between $0.005 and $(0.005) per share. |
| | (8) | For the period from commencement of operations (December 21, 2001) through June 30, 2002. |
| | (9) | The amount shown may not correlate with the aggregate gains and losses of portfolio securities due to the timing of subscriptions and redemptions of fund shares. |
| | (10) | For the period from commencement of operations (September 23, 2002) through June 30, 2003. |
The accompanying notes are an integral part of the financial statements.
55
ARTISAN FUNDS, INC.
Financial Highlights – For a share outstanding throughout each period (Continued)
| | | | | | | | | | | | | | | | | | | | | | | | |
Year or
Period
Ended | | | Net Asset
Value
Beginning
of Period | | Net
Investment
Income
(Loss)(1) | | | Net Realized
and Unrealized
Gain (Loss) on
Investments | | | Total Income
(Loss) from
Investment
Operations | | |
Dividends
from Net
Investment
Income | | | Distributions
from Net
Realized
Gains | |
| | | | | | | | | | | | | | | | | | | | | | | | |
| ARTISAN MID CAP FUND | | | | | | | | | | | | | | | | | | | | |
| Investor Shares | | | | | | | | | | | | | | | | | | | | | | | | |
| 3/31/2007 | (5) | | $ | 31.77 | | $ | (0.12 | ) | | $ | 3.20 | | | $ | 3.08 | | | $ | - | | | $ | (3.47 | ) |
| 9/30/2006 | | | | 30.84 | | | (0.17 | ) | | | 2.43 | | | | 2.26 | | | | - | | | | (1.33 | ) |
| 9/30/2005 | | | | 26.13 | | | (0.18 | ) | | | 4.89 | | | | 4.71 | | | | - | | | | - | |
| 9/30/2004 | | | | 23.11 | | | (0.20 | ) | | | 3.22 | | | | 3.02 | | | | - | | | | - | |
| 9/30/2003 | (6) | | | 21.81 | | | (0.05 | ) | | | 1.35 | | | | 1.30 | | | | - | | | | - | |
| 6/30/2003 | | | | 22.13 | | | (0.11 | ) | | | (0.21 | )(7) | | | (0.32 | ) | | | - | | | | - | |
| 6/30/2002 | | | | 26.43 | | | (0.19 | ) | | | (4.11 | ) | | | (4.30 | ) | | | - | | | | - | |
| Institutional Shares | | | | | | | | | | | | | | | | | | | | | | | | |
| 3/31/2007 | (5) | | $ | 32.24 | | $ | (0.08 | ) | | $ | 3.26 | | | $ | 3.18 | | | $ | - | | | $ | (3.47 | ) |
| 9/30/2006 | | | | 31.21 | | | (0.10 | ) | | | 2.46 | | | | 2.36 | | | | - | | | | (1.33 | ) |
| 9/30/2005 | | | | 26.38 | | | (0.12 | ) | | | 4.95 | | | | 4.83 | | | | - | | | | - | |
| 9/30/2004 | | | | 23.28 | | | (0.14 | ) | | | 3.24 | | | | 3.10 | | | | - | | | | - | |
| 9/30/2003 | (6) | | | 21.96 | | | (0.03 | ) | | | 1.35 | | | | 1.32 | | | | - | | | | - | |
| 6/30/2003 | | | | 22.24 | | | (0.07 | ) | | | (0.21 | )(7) | | | (0.28 | ) | | | - | | | | - | |
| 6/30/2002 | | | | 26.48 | | | (0.13 | ) | | | (4.11 | ) | | | (4.24 | ) | | | - | | | | - | |
| | | | | | | | | | | | | | | | | | | | | | | | |
| ARTISAN MID CAP VALUE FUND | | | | | | | | | | | | | | | | | | | | |
| Investor Shares | | | | | | | | | | | | | | | | | | | | | | | | |
| 3/31/2007 | (5) | | $ | 19.87 | | $ | 0.02 | | | $ | 2.51 | | | $ | 2.53 | | | $ | (0.06 | ) | | $ | (1.18 | ) |
| 9/30/2006 | | | | 19.60 | | | 0.06 | | | | 1.04 | | | | 1.10 | | | | (0.01 | ) | | | (0.82 | ) |
| 9/30/2005 | | | | 15.55 | | | (0.01 | ) | | | 4.36 | | | | 4.35 | | | | - | (8) | | | (0.30 | ) |
| 9/30/2004 | | | | 12.22 | | | 0.10 | | | | 3.47 | | | | 3.57 | | | | - | | | | (0.24 | ) |
| 9/30/2003 | (6) | | | 11.64 | | | (0.01 | ) | | | 0.59 | | | | 0.58 | | | | - | | | | - | |
| 6/30/2003 | | | | 10.82 | | | (0.03 | ) | | | 0.85 | | | | 0.82 | | | | - | | | | - | |
| 6/30/2002 | | | | 11.18 | | | (0.09 | ) | | | (0.19 | ) | | | (0.28 | ) | | | - | | | | (0.08 | ) |
| | | | | | | | | | | | | | | | | | | | | | | | |
| ARTISAN OPPORTUNISTIC VALUE FUND | | | | | | | | | | | | | | | | | | | | |
| Investor Shares | | | | | | | | | | | | | | | | | | | | | | | | |
| 3/31/2007 | (5) | | $ | 10.41 | | $ | 0.03 | | | $ | 1.34 | | | $ | 1.37 | | | $ | (0.03 | ) | | $ | (0.09 | ) |
| 9/30/2006 | (9) | | | 10.00 | | | 0.03 | | | | 0.38 | | | | 0.41 | | | | - | | | | - | |
(1) | Computed based on average shares outstanding. |
(2) | Periods less than twelve months (where applicable) are not annualized. |
(3) | Periods less than twelve months (where applicable) are annualized. |
(4) | The ratios of expenses to average net assets and net investment income (loss) to average net assets exclude expenses waived or paid by the Adviser or the Board of Directors. Absent expenses waived or paid by the Adviser or the Board of Directors, the ratios of expenses to average net assets and net investment income (loss) to average net assets would have been as follows: |
| | | | | | | | |
| | | Year or
Period Ended | | Ratio of Expenses to
Average Net Assets | | | Ratio of Net Investment Income
(Loss) to Average Net Assets | |
Mid Cap Investor Shares | | 9/30/2003 | | 1.20 | % | | (0.81 | )% |
Mid Cap Institutional Shares | | 9/30/2003 | | 0.98 | | | (0.59 | ) |
Mid Cap Value Investor Shares | | 9/30/2003 | | 1.63 | | | (0.35 | ) |
| | 6/30/2002 | | 2.53 | | | (1.40 | ) |
| | 6/30/2001 | | 5.17 | | | (3.84 | ) |
Opportunistic Value Investor Shares | | 9/30/2006 | | 1.64 | | | 0.39 | |
56
| | | | | | | | | | | | | | | | | | | | |
Total
Distributions | | | Net Asset
Value
End
of Period | | Total
Return(2) | | | Net Assets
End of
Period
(millions) | | Ratio of
Expenses
to Average
Net Assets(3)(4) | | | Ratio of Net
Investment
Income (Loss)
to Average
Net Assets(3)(4) | | | Portfolio
Turnover
Rate(2) | |
| | | | | | | | | | | | | | | | | | | | |
| | | | | | | | | | | | | | | | | | | | | |
| | | | | | | | | | | | | | | | | | | | | |
| $ | (3.47 | ) | | $ | 31.38 | | 9.94 | % | | $ | 4,509.5 | | 1.24 | % | | (0.76 | )% | | 31.05 | % |
| | (1.33 | ) | | | 31.77 | | 7.42 | | | | 4,571.9 | | 1.18 | | | (0.55 | ) | | 73.59 | |
| | - | | | | 30.84 | | 18.06 | | | | 4,874.0 | | 1.18 | | | (0.63 | ) | | 83.00 | |
| | - | | | | 26.13 | | 13.02 | | | | 4,042.7 | | 1.19 | | | (0.77 | ) | | 101.09 | |
| | - | | | | 23.11 | | 6.01 | | | | 2,583.2 | | 1.20 | | | (0.81 | ) | | 26.52 | |
| | - | | | | 21.81 | | (1.45 | ) | | | 2,286.6 | | 1.20 | | | (0.56 | ) | | 102.85 | |
| | - | | | | 22.13 | | (16.27 | ) | | | 1,855.5 | | 1.22 | | | (0.77 | ) | | 121.14 | |
| | | | | | | | | | | | | | | | | | | | | |
| $ | (3.47 | ) | | $ | 31.95 | | 10.11 | % | | $ | 768.8 | | 0.95 | % | | (0.48 | )% | | 31.05 | % |
| | (1.33 | ) | | | 32.24 | | 7.66 | | | | 797.9 | | 0.95 | | | (0.31 | ) | | 73.59 | |
| | - | | | | 31.21 | | 18.35 | | | | 981.3 | | 0.95 | | | (0.40 | ) | | 83.00 | |
| | - | | | | 26.38 | | 13.27 | | | | 1,036.0 | | 0.96 | | | (0.54 | ) | | 101.09 | |
| | - | | | | 23.28 | | 6.06 | | | | 929.6 | | 0.98 | | | (0.59 | ) | | 26.52 | |
| | - | | | | 21.96 | | (1.26 | ) | | | 829.0 | | 1.00 | | | (0.36 | ) | | 102.85 | |
| | - | | | | 22.24 | | (16.04 | ) | | | 449.8 | | 1.02 | | | (0.56 | ) | | 121.14 | |
| | | | | | | | | | | | | | | | | | | | |
| | | | | | | | | | | | | | | | | | | | | |
| | | | | | | | | | | | | | | | | | | | | |
| $ | (1.24 | ) | | $ | 21.16 | | 13.00 | % | | $ | 3,140.6 | | 1.21 | % | | 0.24 | % | | 25.61 | % |
| | (0.83 | ) | | | 19.87 | | 5.87 | | | | 2,643.3 | | 1.20 | | | 0.33 | | | 47.73 | |
| | (0.30 | ) | | | 19.60 | | 28.42 | | | | 2,771.2 | | 1.22 | | | (0.04 | ) | | 51.60 | |
| | (0.24 | ) | | | 15.55 | | 29.60 | | | | 312.3 | | 1.39 | | | 0.73 | | | 53.79 | |
| | - | | | | 12.22 | | 4.98 | | | | 77.4 | | 1.59 | | | (0.31 | ) | | 11.90 | |
| | - | | | | 11.64 | | 7.58 | | | | 64.5 | | 1.78 | | | (0.34 | ) | | 45.55 | |
| | (0.08 | ) | | | 10.82 | | (2.37 | ) | | | 22.0 | | 1.95 | | | (0.82 | ) | | 167.70 | |
| | | | | | | | | | | | | | | | | | | | |
| | | | | | | | | | | | | | | | | | | | | |
| | | | | | | | | | | | | | | | | | | | | |
| $ | (0.12 | ) | | $ | 11.66 | | 13.22 | % | | $ | 155.2 | | 1.50 | % | | 0.49 | % | | 22.01 | % |
| | - | | | | 10.41 | | 4.10 | | | | 75.0 | | 1.49 | | | 0.55 | | | 34.07 | |
| | (5) | Unaudited. For the six months ended March 31, 2007. |
| | (6) | For the period from July 1, 2003 to September 30, 2003. Artisan Funds changed its fiscal year-end from June 30 to September 30 effective September 30, 2003. |
| | (7) | The amount shown may not correlate with the aggregate gains and losses of portfolio securities due to the timing of subscriptions and redemptions of fund shares. |
| | (8) | Amount is between $0.005 and $(0.005) per share. |
| | (9) | For the period from commencement of operations (March 27, 2006) through September 30, 2006. |
The accompanying notes are an integral part of the financial statements.
57
ARTISAN FUNDS, INC.
Financial Highlights – For a share outstanding throughout each period (Continued)
| | | | | | | | | | | | | | | | | | | | | | | | |
Year or
Period
Ended | | | Net Asset
Value
Beginning
of Period | | Net
Investment
Income
(Loss)(1) | | | Net Realized
and Unrealized
Gain (Loss) on
Investments | | | Total Income
(Loss) from
Investment
Operations | | | Dividends
from Net
Investment
Income | | | Distributions
from Net
Realized
Gains | |
| | | | | | | | | | | | | | | | | | | | | | | | |
| ARTISAN SMALL CAP FUND | | | | | | | | | | | | | | | | | | | | |
| Investor Shares | | | | | | | | | | | | | | | | | | | | | | | | |
| 3/31/2007 | (5) | | $ | 17.51 | | $ | (0.07 | ) | | $ | 1.20 | | | $ | 1.13 | | | $ | - | | | $ | (0.36 | ) |
| 9/30/2006 | | | | 17.95 | | | (0.13 | ) | | | 0.26 | | | | 0.13 | | | | - | | | | (0.57 | ) |
| 9/30/2005 | | | | 15.12 | | | (0.13 | ) | | | 3.49 | | | | 3.36 | | | | - | | | | (0.53 | ) |
| 9/30/2004 | | | | 12.53 | | | (0.14 | ) | | | 2.73 | | | | 2.59 | | | | - | | | | - | |
| 9/30/2003 | (6) | | | 11.90 | | | (0.04 | ) | | | 0.67 | | | | 0.63 | | | | - | | | | - | |
| 6/30/2003 | | | | 11.99 | | | (0.10 | ) | | | 0.07 | (7) | | | (0.03 | ) | | | - | | | | (0.06 | ) |
| 6/30/2002 | | | | 13.99 | | | (0.13 | ) | | | (1.81 | ) | | | (1.94 | ) | | | - | | | | (0.06 | ) |
| | | | | | | | | | | | | | | | | | | | | | | | |
| ARTISAN SMALL CAP VALUE FUND | | | | | | | | | | | | | | | | | | | | |
| Investor Shares | | | | | | | | | | | | | | | | | | | | | | | | |
| 3/31/2007 | (5) | | $ | 19.17 | | $ | 0.01 | | | $ | 2.01 | | | $ | 2.02 | | | $ | - | | | $ | (2.47 | ) |
| 9/30/2006 | | | | 19.51 | | | (0.02 | ) | | | 2.00 | | | | 1.98 | | | | - | | | | (2.32 | ) |
| 9/30/2005 | | | | 17.63 | | | (0.03 | ) | | | 3.69 | | | | 3.66 | | | | - | | | | (1.78 | ) |
| 9/30/2004 | | | | 13.67 | | | (0.03 | ) | | | 4.19 | | | | 4.16 | | | | - | | | | (0.20 | ) |
| 9/30/2003 | (6) | | | 13.15 | | | (0.01 | ) | | | 0.53 | | | | 0.52 | | | | - | | | | - | |
| 6/30/2003 | | | | 13.48 | | | (0.03 | ) | | | 0.20 | | | | 0.17 | | | | - | | | | (0.50 | ) |
| 6/30/2002 | | | | 13.05 | | | (0.01 | ) | | | 1.16 | | | | 1.15 | | | | (0.01 | ) | | | (0.71 | ) |
(1) | Computed based on average shares outstanding. |
(2) | Periods less than twelve months (where applicable) are not annualized. |
(3) | Periods less than twelve months (where applicable) are annualized. |
(4) | The ratios of expenses to average net assets and net investment income (loss) to average net assets exclude expenses waived or paid by the Adviser or the Board of Directors. Absent expenses waived or paid by the Adviser or the Board of Directors, the ratios of expenses to average net assets and net investment income (loss) to average net assets would have been as follows: |
| | | | | | | | |
| | | Year or
Period Ended | | Ratio of Expenses to
Average Net Assets | | | Ratio of Net Investment
(Loss) to Average Net Assets | |
Small Cap Investor Shares | | 9/30/2003 | | 1.46 | % | | (1.18 | )% |
Small Cap Value Investor Shares | | 9/30/2003 | | 1.20 | | | (0.41 | ) |
58
| | | | | | | | | | | | | | | | | | | | |
Total
Distributions | | | Net Asset
Value
End
of Period | | Total
Return(2) | | | Net Assets
End of
Period
(millions) | | Ratio of
Expenses
to Average
Net Assets(3)(4) | | | Ratio of Net
Investment
Income (Loss)
to Average
Net Assets(3)(4) | | | Portfolio
Turnover
Rate(2) | |
| | | | | | | | | | | | | | | | | | | | |
| | | | | | | | | | | | | | | | | | | | | |
| | | | | | | | | | | | | | | | | | | | | |
| $ | (0.36 | ) | | $ | 18.28 | | 6.47 | % | | $ | 1,181.5 | | 1.18 | % | | (0.76 | )% | | 40.53 | % |
| | (0.57 | ) | | | 17.51 | | 0.74 | | | | 1,263.8 | | 1.15 | | | (0.70 | ) | | 101.98 | |
| | (0.53 | ) | | | 17.95 | | 22.64 | | | | 1,103.3 | | 1.18 | | | (0.80 | ) | | 78.60 | |
| | - | | | | 15.12 | | 20.67 | | | | 239.6 | | 1.27 | | | (0.95 | ) | | 119.40 | |
| | - | | | | 12.53 | | 5.29 | | | | 127.9 | | 1.44 | | | (1.16 | ) | | 30.18 | |
| | (0.06 | ) | | | 11.90 | | (0.11 | ) | | | 116.0 | | 1.39 | | | (0.98 | ) | | 127.41 | |
| | (0.06 | ) | | | 11.99 | | (13.90 | ) | | | 131.9 | | 1.31 | | | (1.00 | ) | | 139.72 | |
| | | | | | | | | | | | | | | | | | | | |
| | | | | | | | | | | | | | | | | | | | | |
| | | | | | | | | | | | | | | | | | | | | |
| $ | (2.47 | ) | | $ | 18.72 | | 10.98 | % | | $ | 2,266.9 | | 1.19 | % | | 0.11 | % | | 30.79 | % |
| | (2.32 | ) | | | 19.17 | | 11.40 | | | | 2,039.5 | | 1.17 | | | (0.09 | ) | | 58.88 | |
| | (1.78 | ) | | | 19.51 | | 22.42 | | | | 1,720.9 | | 1.18 | | | (0.16 | ) | | 56.03 | |
| | (0.20 | ) | | | 17.63 | | 30.76 | | | | 1,192.8 | | 1.18 | | | (0.17 | ) | | 41.31 | |
| | - | | | | 13.67 | | 3.95 | | | | 775.2 | | 1.20 | | | (0.40 | ) | | 12.20 | |
| | (0.50 | ) | | | 13.15 | | 1.90 | | | | 702.5 | | 1.21 | | | (0.21 | ) | | 49.57 | |
| | (0.72 | ) | | | 13.48 | | 9.65 | | | | 623.5 | | 1.20 | | | (0.10 | ) | | 33.59 | |
| | (5) | Unaudited. For the six months ended March 31, 2007. |
| | (6) | For the period from July 1, 2003 to September 30, 2003. Artisan Funds changed its fiscal year-end from June 30 to September 30 effective September 30, 2003. |
| | (7) | The amount shown may not correlate with the aggregate gains and losses of portfolio securities due to the timing of subscriptions and redemptions of fund shares. |
The accompanying notes are an integral part of the financial statements.
59
ARTISAN FUNDS, INC.
Notes to Financial Statements – March 31, 2007 (Unaudited)
Artisan Funds, Inc. (“Artisan Funds”) was incorporated on January 5, 1995, as a Wisconsin corporation and is registered under the Investment Company Act of 1940, as amended. Artisan Funds is a series comprised of nine open-end, diversified mutual funds. The following funds (each a “Fund” and collectively the “Funds”) are covered by this report:
| | |
| Fund Name | | Inception Date |
Artisan International Fund (“International Fund” or “International”) | | December 28, 1995 |
Artisan International Small Cap Fund (“International Small Cap Fund” or “International Small Cap”) | | December 21, 2001 |
Artisan International Value Fund (“International Value Fund” or “International Value”) | | September 23, 2002 |
Artisan Mid Cap Fund (“Mid Cap Fund” or “Mid Cap”) | | June 27, 1997 |
Artisan Mid Cap Value Fund (“Mid Cap Value Fund” or “Mid Cap Value”) | | March 28, 2001 |
Artisan Opportunistic Value Fund (“Opportunistic Value Fund” or “Opportunistic Value”) | | March 27, 2006 |
Artisan Small Cap Fund (“Small Cap Fund” or “Small Cap”) | | March 28, 1995 |
Artisan Small Cap Value Fund (“Small Cap Value Fund” or “Small Cap Value”) | | September 29, 1997 |
Each Fund’s investment objective is to seek long-term capital growth. Each Fund has offered shares of capital stock of the class designated Investor Shares since the commencement of its operations. International Fund, International Value Fund and Mid Cap Fund began offering Institutional Shares on July 1, 1997, October 1, 2006 and July 1, 2000, respectively. Institutional Shares are sold to institutional investors meeting certain minimum investment requirements.
Each class of shares has equal rights with respect to portfolio assets and voting privileges. Each class has exclusive voting rights with respect to any matters involving only that class.
Income, expenses not specific to either class and realized and unrealized gains and losses were allocated daily to each class of shares based upon the relative net asset value of outstanding shares. Expenses attributable to a particular class of shares, such as transfer agency fees, shareholder communication expenses and registration fees, were allocated directly to that class.
Artisan Emerging Markets Fund (inception date June 26, 2006), also a series of Artisan Funds, Inc., offered only Institutional Shares during the period covered by this report. The financial statements of Artisan Emerging Markets Fund have been presented in a separate report.
| (2) | Summary of significant accounting policies: |
The following is a summary of significant accounting policies of the Funds in effect during the period covered by the financial statements, which were in accordance with United States generally accepted accounting principles.
| (a) | Security valuation – The net asset value (“NAV”) of the shares of each class of each Fund was determined as of the close of regular session trading on the New York Stock Exchange (“NYSE”) (usually 4:00 p.m., Eastern Time, but sometimes earlier) each day the NYSE was open for regular session trading. The NAV of each class of shares was determined by dividing the value of each Fund’s securities and other assets |
60
NOTES TO FINANCIAL STATEMENTS
| | attributed to that class, less its liabilities attributed to that class, by the number of outstanding shares of that class of that Fund. |
In determining NAV, each equity security traded on a securities exchange was valued at the closing price as of the time of valuation on the exchange or market on which the security was principally traded (the “principal exchange”). The closing price provided by each exchange may differ and may represent information such as last sales price, an official closing price, a closing auction price or other information, depending on exchange or market convention. Absent closing price information for a security from the principal exchange as of the time of valuation, the security was valued using the most recent bid quotation on the principal exchange, except that securities listed on the London Stock Exchange were valued at the mean of the most recent bid and asked quotations as of the time of valuation. Short-term investments maturing within sixty days of the valuation date were valued at amortized cost, which approximates market value.
Securities for which prices were not readily available were valued by Artisan Funds’ valuation committee (the “valuation committee”) at a fair value determined in good faith under procedures established by and under the general supervision of Artisan Funds’ Board of Directors (the “Board of Directors”). A price was considered to be not readily available if, among other things, the valuation committee believed that the price determined as described in the preceding paragraph did not reflect a fair value of the security.
International Fund, International Small Cap Fund and International Value Fund generally invested a significant portion, and perhaps as much as substantially all, of their total assets in securities principally traded in markets outside the U.S. Each of the other Funds had the ability to invest in securities principally traded outside the U.S. The foreign markets in which the Funds invested were sometimes open on days when the NYSE was not open and the Funds did not calculate their NAVs, and sometimes were not open on days when the Funds did calculate their NAVs. Even on days on which both the foreign market and the NYSE were open, several hours may have passed between the time when trading in the foreign market closed and the time as of which the Funds calculate their NAVs. That was generally the case for markets in Europe, Asia, Australia and other far eastern markets; the regular closing time of foreign markets in North and South America was generally the same as the closing time of the NYSE and the time as of which the Funds calculated their NAVs.
The valuation committee concluded that a price determined under the Funds’ valuation procedures was not readily available if, among other things, the valuation committee believed that the value of the security might have been materially affected by events occurring after the close of the market in which the security was principally traded but before the time for determination of NAV (“subsequent event”). A subsequent event might include a company-specific development (for example, announcement of a merger that is made after the close of the foreign market), a development that might affect an entire market or region (for example, imposition of foreign exchange controls by a foreign government), a potentially global development (such as a terrorist attack that may be expected to have an impact on investor expectations worldwide) or a significant change in one or more United
61
NOTES TO FINANCIAL STATEMENTS
States securities indexes. Artisan Funds monitored for subsequent events using several tools. An indication by any of those tools of a potential material change in the value of securities resulted in either a meeting of the valuation committee, which considered whether a subsequent event had occurred and whether local market closing prices continued to represent fair values for potentially affected non-U.S. securities, and/or a valuation based on information provided by a third party research service. This third party research service was used to assist in determining estimates of fair values for foreign securities. That service utilized statistical data based on historical performance of securities, markets and other data in developing factors used to estimate a fair value.
Estimates of fair values utilized by the Funds as described above may differ from the value realized on the subsequent sale of those securities and the differences may have been material to the NAV of the applicable Fund or to the information presented.
There are certain risks involved in investing in foreign securities. These risks include those resulting from future adverse political, social, and economic developments, fluctuations in currency exchange rates, the possible imposition of exchange controls, and other foreign laws or restrictions.
| (b) | Taxes – No provision was made for federal income taxes or excise taxes since each Fund intends to (i) comply with the provisions of Subchapter M of the Internal Revenue Code applicable to regulated investment companies and (ii) distribute to its shareholders substantially all of its taxable income as well as net realized gains from the sale of investment securities. The Funds may utilize earnings and profits distributed to shareholders on redemptions of Fund shares as part of the dividends paid deduction. |
The Funds may be subject to taxes on realized gains from the sale of investment securities imposed by certain countries in which the Funds invest. The Funds recorded the foreign tax expense, if any, on an accrual basis. The taxes were included in “Payable for withholding taxes” on the accompanying Statement of Assets and Liabilities.
| (c) | Portfolio transactions – In determining a Fund’s NAV, security transactions and shareholder transactions were accounted for no later than one business day after trade date, in accordance with applicable law. However, for financial reporting purposes, security transactions and shareholder transactions were recorded on trade date in accordance with United States generally accepted accounting principles. Net realized gains and losses on securities were computed on specific security lot identification. |
| (d) | Foreign currency translation – Values of investments, open foreign currency forward contracts, payables for capital gains taxes and cash denominated in foreign currencies were translated into U.S. dollars using a spot market rate of exchange as of the time of determination of each Fund’s NAV on the day of valuation. Payables and receivables for securities transactions, dividend and reclaim receivables and other receivables and payables denominated in a foreign currency were translated into U.S. dollars using a spot market rate of exchange as of 12:00 p.m. (Eastern Time) on the day of valuation. Purchases and sales of investments and dividend and interest income were translated into U.S. dollars using a spot market rate of exchange as of |
62
NOTES TO FINANCIAL STATEMENTS
| | 12:00 p.m. (Eastern Time) on the date of such transactions. The portion of security gains or losses resulting from changes in foreign exchange rates was included with net realized and unrealized gain or loss from investments, as appropriate, for both financial reporting and tax purposes. |
The Funds may enter into foreign currency forward contracts to hedge the foreign currency exposure on open payables and receivables. Foreign currency forward contracts, if any, were recorded at market value and any related realized and unrealized gains and losses were reported as foreign currency related transactions for financial reporting purposes. For tax purposes, these foreign exchange gains and losses were treated as ordinary income or loss. The Funds could be exposed to loss if the counterparties fail to perform under these contracts.
Other foreign currency related transaction gains and losses may result from currency gains and losses realized from the difference between the amounts of dividends and foreign withholding taxes recorded on the Funds’ books and the U.S. dollar equivalent of the amounts actually received or paid. The net increase (decrease) in unrealized appreciation or depreciation on foreign currency related transactions arose from changes in the values of assets and liabilities, other than investments in securities, resulting from changes in foreign exchange rates.
| (e) | Repurchase agreements – Each Fund may enter into repurchase agreements with institutions that Artisan Partners Limited Partnership (“the Adviser”) determined were creditworthy pursuant to criteria adopted by the Board of Directors. Repurchase agreements were recorded at cost plus accrued interest and were collateralized in an amount greater than or equal to the repurchase price plus accrued interest. Collateral was held by the Funds’ custodian and in the event of default on the obligation of the counterparty to repurchase, the Funds had the right to liquidate the collateral and apply the proceeds in satisfaction of the obligation. If the proceeds from any sale of such collateral were less than the repurchase price, the Fund would have suffered a loss. |
| (f) | Securities lending – International Fund entered into securities lending transactions secured by collateral in the form of U.S. Government securities at least equal to, at all times, the fair value of the securities loaned. Unrealized gain or loss in the value of the security loaned as of March 31, 2007 was accounted for in the financial statements of the International Fund. All other Artisan Funds may enter into securities lending transactions, but did not do so during the period covered by these financial statements. In entering into securities lending arrangements a fund takes the risk that the borrower may not provide additional collateral when required or return the securities when due or, if the borrower defaults, the fund may experience delays in selling collateral or the collateral may not be sufficient to cover the value of securities lent. |
During the six months ended March 31, 2007, International Fund earned $904,819 from securities lending transactions which was included in the accompanying Statement of Operations. International Fund had one security on loan at March 31, 2007 as disclosed on the accompanying Schedules of Investments, with a value of $335,358,482, which was collateralized by U.S. Treasury Notes, with a value of $350,071,532 at March 31, 2007.
| (g) | Transfer agent fees – The Funds have authorized certain financial services companies, broker-dealers, banks or other authorized agents, and in some cases, other |
63
NOTES TO FINANCIAL STATEMENTS
| | organizations designated by an authorized agent (with their designees, collectively “authorized agents”) to accept purchase, exchange and redemption orders for Investor Shares on the Funds’ behalf. Many authorized agents charged a fee for accounting and shareholder services that the agent provided to Fund shareholders on the Fund’s behalf. Those services typically included recordkeeping, transaction processing for shareholders’ accounts and other services. The fee was either based on the number of accounts to which the intermediary provided such services, or a percentage, as of March 31, 2007, up to 0.40% annually of the average value of Fund shares held in such accounts. Each Fund paid a portion of such fees, which are intended to compensate the authorized agent for its provision of services of the type that would be provided by the Funds’ transfer agent or other service providers if the shares were registered on the books of the Funds’ transfer agent. The balance of the fees incurred was paid by the Adviser. The Funds’ expenses incurred for services provided by authorized agents were included in “Transfer agent fees” in the Statements of Operations. The table below shows the fees and expenses to the Funds’ transfer agent and the fees to authorized agents incurred by each class of each Fund during the six months ended March 31, 2007: |
| | | | | | | | | |
| | | Six Months Ended 3/31/07 |
| Fund | | Fees and Expenses
to Transfer Agent | | Fees to
Authorized
Agents | | Total |
International - Investor Shares | | $ | 324,143 | | $ | 10,791,800 | | $ | 11,115,943 |
International - Institutional Shares | | | 12,824 | | | - | | | 12,824 |
International Small Cap - Investor Shares | | | 48,526 | | | 769,114 | | | 817,640 |
International Value - Investor Shares | | | 82,688 | | | 1,576,490 | | | 1,659,178 |
International Value - Institutional Shares | | | 7,358 | | | - | | | 7,358 |
Mid Cap - Investor Shares | | | 145,803 | | | 5,921,354 | | | 6,067,157 |
Mid Cap - Institutional Shares | | | 11,632 | | | - | | | 11,632 |
Mid Cap Value - Investor Shares | | | 168,600 | | | 2,962,079 | | | 3,130,679 |
Opportunistic Value - Investor Shares | | | 61,111 | | | 160,511 | | | 221,622 |
Small Cap - Investor Shares | | | 90,856 | | | 956,638 | | | 1,047,494 |
Small Cap Value - Investor Shares | | | 52,943 | | | 2,192,473 | | | 2,245,416 |
| (h) | Commission recapture – Each of the Funds had the ability to direct portfolio trades to various brokers that have agreed to rebate a portion of the commissions generated. Such cash rebates were made directly to the applicable Fund and were included in net realized gain or loss on investments in the Statements of Operations as follows: |
| | | |
International | | $ | 105,699 |
International Small Cap | | | 5,678 |
International Value | | | 101,209 |
Mid Cap | | | 338,166 |
Mid Cap Value | | | 151,040 |
Opportunistic Value | | | 1,460 |
Small Cap | | | 112,810 |
Small Cap Value | | | 118,690 |
64
NOTES TO FINANCIAL STATEMENTS
| (i) | Use of estimates – The preparation of financial statements in conformity with U.S. generally accepted accounting principles required management to make estimates and assumptions that affect the reported amounts and disclosures in the financial statements. Actual results could differ from those estimates. |
| (j) | Indemnifications – In the normal course of business, the Funds have entered into contracts in which the Funds agree to indemnify the other party or parties against various potential costs or liabilities. The Funds’ maximum exposure under these arrangements is unknown. No claim had been made for indemnification pursuant to any such agreement of the Funds. |
| (k) | Other – Dividend income less foreign taxes withheld, if any, was generally recorded on the ex-dividend date. In some cases, the information was not available to the Fund on the ex-dividend date. In such cases, which may have included private placements and foreign securities, dividends were recorded as soon after the ex-dividend date as reliable information became available to the Funds. Non-cash dividends included in dividend income, if any, were generally recorded at the fair market value of securities received. Interest income was reported on the accrual basis. Distributions to shareholders were recorded on the ex-dividend date. Expenses attributable to Artisan Funds were generally allocated to each Fund based on net assets. However, other expense allocation methodologies were used, depending on the nature of the expense item. Expenses attributable to a particular Fund or class were allocated directly to that Fund or class. |
The character of income and net realized gains and losses may differ in some instances for financial statement and tax purposes and may result in reclassification of permanent differences among certain capital accounts to more appropriately conform financial accounting to tax characterizations of dividend and capital gain distributions.
International Fund, International Small Cap Fund and International Value Fund generally imposed a 2% redemption fee on shares held 90 days or less. Those redemption fees were recorded as a reduction in the cost of shares redeemed and had the primary effect of increasing paid-in capital. Each Fund reserved the right to waive or reduce the 2% redemption fee on shares held 90 days or less at its discretion when the Fund believed such waiver was in the best interests of the Fund, including but not limited to when it determined that imposition of the redemption fee was not necessary to protect the Fund from the effects of short-term trading. The Funds waived the fee on redemption of shares held by certain authorized agents or other Fund intermediaries.
| (3) | Transactions with affiliates: |
The Adviser, with which the officers and a director of Artisan Funds were affiliated, provided investment advisory and administrative services to the Funds. In exchange for those services, each Fund (with the exception of International Fund, International Small Cap Fund and Opportunistic Value Fund) paid a monthly management fee to the Adviser as follows:
| | | |
Average Daily Net Assets | | Annual Rate | |
Less than $500 million | | 1.000 | % |
$500 million to $750 million | | 0.975 | |
$750 million to $1 billion | | 0.950 | |
Greater than $1 billion | | 0.925 | |
65
NOTES TO FINANCIAL STATEMENTS
International Fund paid a monthly management fee to the Adviser as follows:
| | | |
Average Daily Net Assets | | Annual Rate | |
Less than $500 million | | 1.000 | % |
$500 million to $750 million | | 0.975 | �� |
$750 million to $1 billion | | 0.950 | |
$1 billion to $12 billion | | 0.925 | |
Greater than $12 billion | | 0.900 | |
International Small Cap Fund paid a monthly management fee to the Adviser at an annual rate of 1.250% of average daily net assets.
Opportunistic Value Fund paid a monthly management fee to the Adviser as follows:
| | | |
Average Daily Net Assets | | Annual Rate | |
Less than $1 billion | | 0.900 | % |
$1 billion to $4 billion | | 0.875 | |
$4 billion to $8 billion | | 0.850 | |
$8 billion to $12 billion | | 0.825 | |
Greater than $12 billion | | 0.800 | |
The officers and director of Artisan Funds who are affiliated with the Adviser received no compensation from the Funds.
Prior to April 1, 2007, each director who was not an interested person of Artisan Funds or the Adviser received an annual retainer of $140,000, payable quarterly, as well as reimbursement of expenses related to his duties as a director of Artisan Funds. In addition, the non-interested chair of the Board of Directors received an additional annual retainer of $60,000, payable quarterly, and each chair of a board committee who was a non-interested director received an additional annual retainer of $30,000, payable quarterly. Effective April 1, 2007, each director who is not an interested person of Artisan Funds or the Adviser will receive an annual retainer of $150,000, payable quarterly. The other additional annual retainer fees were unchanged. These fees were generally allocated to each of the Artisan Funds based on net assets, subject to a minimum allocation of $1,500 to each Fund per quarter.
Artisan Funds has adopted a deferred compensation plan for independent directors that enables directors to elect to defer receipt of all or a portion of the annual compensation they are entitled to receive from the Funds. For purposes of determining the amount owed to the directors under the plan, deferred amounts were invested in shares of the Artisan Funds as selected by the individual directors. Each Fund purchased shares of the Artisan Funds selected for deferral by the director in amounts equal to his investment, resulting in a Fund asset equal to the deferred compensation liability. Such assets were included as a component of "Other assets" on the Statement of Assets and Liabilities. Deferral of directors’ fees under the plan did not affect the net assets of the Funds, and did not materially affect the Funds’ assets, liabilities or net investment income per share. Amounts will be deferred until distributed in accordance with the plan.
66
NOTES TO FINANCIAL STATEMENTS
Shares of Artisan Funds were offered for sale by Artisan Distributors LLC (“Distributors”). Distributors is wholly owned by the Adviser. All distribution expenses relating to the Funds were paid by the Adviser.
| (4) | Line of credit arrangement: |
Artisan Funds is party to a line of credit agreement with State Street Bank and Trust Company, which expires August 2007, under which each Fund may borrow up to the lesser of (a) $75 million or (b) the lesser of (i) 10% of its total assets (after giving effect to the loan) or (ii) the maximum amount the Fund may have borrowed under the Investment Company Act of 1940, the limitations included in the Fund’s prospectus, or any limit or restriction under any law or regulation to which the Fund was subject or any agreement to which the Fund or Artisan Funds is a party; provided that the aggregate borrowings by all Artisan Funds may not exceed $100 million. Artisan Funds paid a commitment fee at the annual rate of 0.10% on the unused portion of the line of credit. Interest was charged on any borrowings at the current Federal Funds rate plus 0.50%. The use of the line of credit was generally restricted to temporary borrowing for extraordinary or emergency purposes. During the six months ended March 31, 2007, there were no borrowings under the line of credit for International Value Fund, Mid Cap Value Fund, Opportunistic Value Fund, Small Cap Fund and Small Cap Value Fund. During the six months ended March 31, 2007, International Fund, International Small Cap Fund and Mid Cap Fund paid interest of $16,120, $14,022 and $2,579 on maximum borrowings of $25,231,293, $14,996,194 and $15,972,538, respectively.
| (5) | Investment transactions: |
The cost of securities purchased and the proceeds from the sale of securities (excluding short-term securities) for the six months ended March 31, 2007 were as follows:
| | | | | | |
| Fund | | Security Purchases | | Security Sales |
International | | $ | 4,766,367,577 | | $ | 4,893,896,528 |
International Small Cap | | | 278,073,937 | | | 284,057,184 |
International Value | | | 779,903,317 | | | 357,577,375 |
Mid Cap | | | 1,647,471,112 | | | 2,254,624,140 |
Mid Cap Value | | | 706,233,394 | | | 694,960,731 |
Opportunistic Value | | | 80,844,080 | | | 23,661,674 |
Small Cap | | | 490,413,519 | | | 654,421,216 |
Small Cap Value | | | 624,062,217 | | | 637,847,899 |
| (6) | Transactions in securities of affiliates: |
The table below shows information about securities of the Funds’ “affiliates” (as defined below) that were held by the Funds, purchased or sold by the Funds, or from which dividends were received by the Funds during the six months ended March 31, 2007. The Funds have identified a company as an affiliate for the purpose of this report if one or more of the Funds owned, in the aggregate, voting securities that it believed represented 5% or more of that company’s outstanding voting securities (as defined by the Investment Company Act of 1940) during the six months ended March 31, 2007.
67
NOTES TO FINANCIAL STATEMENTS
| | | | | | | | | | | | | | | | | | | | | | |
| | | | | As of
9/30/06 | | | | | | | | | | | As of 3/31/07 |
| Fund | | Security | | Share
Balance | | Purchase
Cost | | Sales
Cost | | Net
Realized
Gain (Loss) | | | Dividend
Income(1) | | Share
Balance | | Value |
| International | | Credit Saison Co., Ltd. | | 9,284,400 | | $ | 1,556,870 | | $ | - | | $ | - | | | $ | 2,062,995 | | 9,332,200 | | $ | 307,272,030 |
| | | TAISEI CORPORATION(2) | | 54,263,300 | | | - | | | 233,887,164 | | | (51,131,555 | ) | | | - | | - | | | - |
| | | Total(3) | | | | | 1,556,870 | | | 233,887,164 | | | (51,131,555 | ) | | | 2,062,995 | | | | | 307,272,030 |
| International Small Cap | | Spazio Investment NV(4) | | - | | $ | 28,486,887 | | | 835,335 | | | 191,354 | | | | 260,669 | | 1,769,487 | | | 35,456,540 |
| | | Total(3) | | | | | 28,486,887 | | | 835,335 | | | 191,354 | | | | 260,669 | | | | | 35,456,540 |
| International Value | | MEITEC CORPORATION(4) | | 1,282,600 | | | 17,361,391 | | | - | | | - | | | | 630,690 | | 1,832,900 | | | 59,105,737 |
| | | Pfeiffer Vacuum Technology AG | | 714,441 | | | 11,128,617 | | | 2,275,406 | | | (4,487 | ) | | | - | | 822,027 | | | 74,824,863 |
| | | SurfControl PLC(5) | | 1,603,124 | | | 4,678,771 | | | 2,187,031 | | | (133,025 | ) | | | - | | 1,871,963 | | | 17,497,770 |
| | | Total(3) | | | | | 33,168,779 | | | 4,462,437 | | | (137,512 | ) | | | 630,690 | | | | | 151,428,370 |
| Mid Cap | | Intermec, Inc.(5) | | 3,374,500 | | | 18,604,186 | | | - | | | - | | | | - | | 4,206,000 | | | 93,962,040 |
| | | Marvel Entertainment, Inc.(2)(5) | | 1,361,100 | | | 73,515 | | | 6,100,823 | | | 2,503,374 | | | | - | | 1,038,600 | | | 28,821,150 |
| | | Total(3) | | | | | 18,677,701 | | | 6,100,823 | | | 2,503,374 | | | | - | | | | | 93,962,040 |
| Mid Cap Value | | Forest Oil Corporation(4)(5) | | 1,107,300 | | | 40,511,068 | | | - | | | - | | | | - | | 2,394,100 | | | 79,891,117 |
| | | Furniture Brands International, Inc. | | 2,696,700 | | | 2,013,965 | | | 18,246,933 | | | (5,310,801 | ) | | | 824,080 | | 2,025,500 | | | 31,962,390 |
| | | Mariner Energy, Inc.(4)(5) | | 1,116,191 | | | 25,669,834 | | | - | | | - | | | | - | | 2,475,691 | | | 47,359,969 |
| | | Marvel Entertainment, Inc.(2)(5) | | 2,440,500 | | | 2,613,734 | | | 21,453,723 | | | 11,777,699 | | | | - | | 1,324,100 | | | 36,743,775 |
| | | Zale Corporation(5) | | 2,543,200 | | | 2,750,683 | | | 19,860,867 | | | (1,311,758 | ) | | | - | | 2,015,900 | | | 53,179,442 |
| | | Total(3) | | | | | 73,559,284 | | | 59,561,523 | | | 5,155,140 | | | | 824,080 | | | | | 212,392,918 |
| Small Cap Value | | America Service Group Inc.(5) | | 603,600 | | | - | | | - | | | - | | | | - | | 603,600 | | | 10,062,012 |
| | | Cross Country Healthcare, Inc.(5) | | 2,097,500 | | | 2,837,440 | | | 5,278,882 | | | 1,207,574 | | | | - | | 1,970,900 | | | 35,929,507 |
| | | Diamond Management & Technology Consultants, Inc.(2) | | 2,079,700 | | | 4,865,754 | | | 13,720,299 | | | 7,767,919 | | | | 620,010 | | 957,300 | | | 11,190,837 |
| | | Forest Oil Corporation(4)(5) | | 616,258 | | | 10,911,974 | | | - | | | - | | | | - | | 964,258 | | | 32,177,289 |
| | | Furniture Brands International, Inc. | | 2,012,900 | | | - | | | 15,053,820 | | | (4,979,032 | ) | | | 615,120 | | 1,390,900 | | | 21,948,402 |
| | | Gevity HR, Inc.(4) | | 305,600 | | | 29,796,413 | | | - | | | - | | | | 87,111 | | 1,689,400 | | | 33,348,756 |
| | | LTX Corporation(4)(5) | | 2,465,500 | | | 4,107,485 | | | 191,197 | | | 47,606 | | | | - | | 3,261,500 | | | 19,960,380 |
| | | Manhattan Associates, Inc.(2)(5) | | 1,539,600 | | | - | | | 11,576,184 | | | 4,381,247 | | | | - | | 985,900 | | | 27,043,237 |
| | | MarineMax, Inc.(4)(5) | | 294,000 | | | 22,450,484 | | | - | | | - | | | | - | | 1,231,200 | | | 28,539,216 |
| | | Mariner Energy, Inc.(4)(5) | | 1,260,997 | | | 12,904,853 | | | - | | | - | | | | - | | 1,921,297 | | | 36,754,412 |
| | | Marvel Entertainment, Inc.(2)(5) | | 576,200 | | | - | | | 2,637,746 | | | 2,424,798 | | | | - | | 391,000 | | | 10,850,250 |
| | | Medical Staffing Network Holdings, Inc.(5) | | 1,548,900 | | | - | | | - | | | - | | | | - | | 1,548,900 | | | 9,835,515 |
| | | National Dentex Corporation(5) | | 413,500 | | | - | | | - | | | - | | | | - | | 413,500 | | | 5,822,080 |
| | | Orbotech, Ltd.(4)(5) | | 1,277,200 | | | 19,579,061 | | | - | | | - | | | | - | | 2,083,900 | | | 45,908,317 |
| | | Sanderson Farms, Inc. | | 1,197,500 | | | - | | | 3,979,123 | | | 1,093,531 | | | | 287,400 | | 1,054,100 | | | 39,064,946 |
| | | Stewart Information Services Corporation | | 1,501,100 | | | 4,300,986 | | | - | | | - | | | | 1,162,425 | | 1,610,100 | | | 67,286,079 |
| | | Zale Corporation(5) | | 2,005,500 | | | - | | | 11,480,436 | | | 700,742 | | | | - | | 1,586,600 | | | 41,854,508 |
| | | Total(3) | | | | | 111,754,450 | | | 63,917,687 | | | 12,644,385 | | | | 2,772,066 | | | | | 428,491,419 |
See notes on next page.
68
NOTES TO FINANCIAL STATEMENTS
(1) | Net of foreign taxes withheld, if any. |
(2) | Issuer was no longer an affiliate as of March 31, 2007. |
(3) | Total value as of 3/31/2007 is presented for only those issuers that were affiliates as of March 31, 2007. |
(4) | Issuer was not an affiliate as of September 30, 2006. |
(5) | Non-income producing security. |
| (7) | Information for Federal income tax purposes: |
For Federal income tax purposes, the cost of investments, gross unrealized appreciation, gross unrealized depreciation and net unrealized appreciation on investments as of March 31, 2007 were as follows:
| | | | | | | | | | | | | |
| Fund | | Cost of
Investments | | Gross
Unrealized
Appreciation | | Gross
Unrealized
Depreciation | | | Net
Unrealized
Appreciation on
Investments |
| International | | $ | 11,546,348,154 | | $ | 4,569,978,662 | | $ | (66,790,300 | ) | | $ | 4,503,188,362 |
| International Small Cap | | | 799,442,318 | | | 311,261,122 | | | (14,506,640 | ) | | | 296,754,482 |
| International Value | | | 1,737,037,016 | | | 279,655,570 | | | (9,879,972 | ) | | | 269,775,598 |
| Mid Cap | | | 4,184,985,895 | | | 1,124,736,645 | | | (58,173,764 | ) | | | 1,066,562,881 |
| Mid Cap Value | | | 2,823,003,718 | | | 426,927,222 | | | (28,300,129 | ) | | | 398,627,093 |
| Opportunistic Value | | | 139,416,403 | | | 13,101,870 | | | (1,045,216 | ) | | | 12,056,654 |
| Small Cap | | | 1,046,167,850 | | | 149,999,928 | | | (26,380,260 | ) | | | 123,619,668 |
| Small Cap Value | | | 1,906,812,173 | | | 410,364,957 | | | (56,805,324 | ) | | | 353,559,633 |
The difference between cost of investments for financial reporting and cost of investments for Federal income tax purposes was due primarily to timing differences in recognizing certain gains and losses on security transactions (e.g., wash sale loss deferrals and passive foreign investment company transactions).
The tax characterization of ordinary income dividends and long-term capital gain distributions paid during the six months ended March 31, 2007 and the year ended September 30, 2006 were as follows:
| | | | | | | | | | | | | | | |
| | | Six Months Ended 3/31/07 | | | Year Ended 9/30/06 | |
| Fund | | Ordinary
Income
Dividends | | Long-Term
Capital Gain
Distributions | | | Ordinary
Income
Dividends | | | Long-Term
Capital Gain
Distributions | |
| International | | $ | 218,986,067 | | $ | 1,133,006,631 | | | $ | 200,705,174 | | | $ | - | |
| International Small Cap | | | 50,533,801 | | | 134,834,295 | | | | 33,534,988 | | | | 45,167,586 | |
| International Value | | | 58,575,571 | | | 43,042,210 | | | | 20,163,763 | | | | 9,531,378 | |
| Mid Cap | | | 26,122,960 | | | 536,887,202 | | | | 30,312,731 | | | | 220,370,538 | |
| Mid Cap Value | | | 80,938,738 | | | 82,640,591 | | | | 91,428,711 | | | | 25,834,378 | |
| Opportunistic Value | | | 1,200,487 | | | - | | | | - | (1) | | | - | (1) |
| Small Cap | | | 16,675,263 | | | 7,936,601 | | | | 19,680,637 | | | | 17,286,786 | |
| Small Cap Value | | | 86,156,248 | | | 178,063,984 | | | | 52,669,430 | | | | 152,453,417 | |
(1) | For the period from commencement of operations (March 27, 2006) through September 30, 2006. |
Ordinary income dividends and long-term capital gain distributions were determined in accordance with income tax regulations that may differ from U.S. generally accepted accounting principles.
69
NOTES TO FINANCIAL STATEMENTS
These differences were due to differing treatments for items such as net short-term gains, wash sale loss deferrals, foreign currency transactions, net investment losses and capital loss carryovers. Gains on redemptions-in-kind for International Fund and Mid Cap Fund of $29,012,833 and $13,451,833, respectively, were included in net realized gain (loss) on investments in the Statement of Operations for the year ended September 30, 2006, and were not recognized for Federal income tax purposes.
Additional tax information as of and for the year ended September 30, 2006 follows:
| | | | | | | | | | | | | |
| | | As of 9/30/06 | | Year Ended 9/30/06 | |
| Fund | | Undistributed
Ordinary
Income | | Undistributed
Long-Term
Gain | | Capital Loss
Carryforward
Utilized | | Post-October
Losses | |
| International | | $ | 212,453,758 | | $ | 1,018,713,221 | | $ | 617,923,426 | | $ | - | |
| International Small Cap | | | 48,705,322 | | | 134,831,447 | | | - | | | - | |
| International Value | | | 46,295,790 | | | 37,751,013 | | | - | | | - | |
| Mid Cap | | | 26,118,296 | | | 536,884,861 | | | - | | | - | |
| Mid Cap Value | | | 72,061,396 | | | 71,446,073 | | | - | | | - | |
| Opportunistic Value | | | 879,512 | | | - | | | - | | | 2,194 | (1) |
| Small Cap | | | 16,656,782 | | | 5,964,573 | | | - | | | - | |
| Small Cap Value | | | 85,448,393 | | | 156,651,531 | | | - | | | - | |
(1) | For the period from commencement of operations (March 27, 2006) through September 30, 2006. |
As of September 30, 2006, none of the Funds had capital loss carryforwards.
70
NOTES TO FINANCIAL STATEMENTS
[THIS PAGE INTENTIONALLY LEFT BLANK]
71
NOTES TO FINANCIAL STATEMENTS
| (8) | Fund share activities: |
Capital share transactions for the Funds were as follows:
| | | | | | | | | | | | |
| | | INTERNATIONAL | | | INTERNATIONAL
SMALL CAP | |
Six months ended March 31, 2007 | | Investor
Shares | | | Institutional
Shares | | | Investor
Shares | |
Net asset value of shares transferred | | | | | | | | | | | | |
Proceeds from shares issued | | $ | 1,221,409,213 | | | $ | 236,054,876 | | | $ | 104,256,713 | |
Net asset value of shares issued in reinvestment of dividends and distributions | | | 914,418,120 | | | | 375,581,486 | | | | 175,371,856 | |
Cost of shares redeemed(1) | | | (1,084,675,284 | ) | | | (296,491,732 | ) | | | (117,145,606 | ) |
| | | | | | | | | | | | |
Net increase (decrease) from fund share transactions | | $ | 1,051,152,049 | | | $ | 315,144,630 | | | $ | 162,482,963 | |
| | | | | | | | | | | | |
| | | |
Shares transferred | | | | | | | | | | | | |
Shares sold | | | 41,461,883 | | | | 7,738,949 | | | | 4,596,601 | |
Shares issued in reinvestment of dividends and distributions | | | 31,850,161 | | | | 13,013,911 | | | | 8,191,119 | |
Shares redeemed | | | (36,878,516 | ) | | | (9,746,297 | ) | | | (5,218,863 | ) |
| | | | | | | | | | | | |
Net increase (decrease) in capital shares | | | 36,433,528 | | | | 11,006,563 | | | | 7,568,857 | |
| | | | | | | | | | | | |
| | |
| | | INTERNATIONAL | | | INTERNATIONAL
SMALL CAP | |
Year ended September 30, 2006 | | Investor
Shares | | | Institutional
Shares | | | Investor
Shares | |
Proceeds from shares issued | | $ | 2,314,789,322 | | | $ | 316,068,084 | | | $ | 183,703,921 | |
Net asset value of shares issued in reinvestment of dividends and distributions | | | 121,587,382 | | | | 67,354,311 | | | | 76,365,043 | |
Cost of shares redeemed(1) | | | (1,736,641,589 | ) | | | (917,682,779 | ) | | | (189,624,312 | ) |
| | | | | | | | | | | | |
Net increase (decrease) from fund share transactions | | $ | 699,735,115 | | | $ | (534,260,384 | ) | | $ | 70,444,652 | |
| | | | | | | | | | | | |
| | | |
Shares sold | | | 85,995,680 | | | | 12,075,907 | | | | 8,475,604 | |
Shares issued in reinvestment of dividends and distributions | | | 5,049,329 | | | | 2,785,484 | | | | 4,198,188 | |
Shares redeemed | | | (65,072,487 | ) | | | (35,034,422 | ) | | | (8,846,307 | ) |
| | | | | | | | | | | | |
Net increase (decrease) in capital shares | | | 25,972,522 | | | | (20,173,031 | ) | | | 3,827,485 | |
| | | | | | | | | | | | |
| | (1) | Net of redemption fees of: |
| | | | | | |
| Fund | | Six Months
Ended
3/31/2007 | | Year Ended
9/30/2006 |
International - Investor Shares | | $ | 308,767 | | $ | 863,753 |
International - Institutional Shares | | | 134,383 | | | 389,313 |
International Small Cap - Investor Shares | | | 4,071 | | | 29,405 |
International Value - Investor Shares | | | 206,124 | | | 222,110 |
International Value - Institutional Shares | | | 13,709 | | | - |
| | (2) | For the period from commencement of operations (March 27, 2006) through September 30, 2006. |
72
NOTES TO FINANCIAL STATEMENTS
| | | | | | | | | | | | | | | | | | | | | | | | | | | | | | |
INTERNATIONAL
VALUE | | | MID CAP | | | MID CAP
VALUE | | | OPPORTUNISTIC
VALUE | | | SMALL CAP | | | SMALL CAP
VALUE | |
Investor
Shares | | | Institutional
Shares | | | Investor
Shares | | | Institutional
Shares | | | Investor
Shares | | | Investor
Shares | | | Investor
Shares | | | Investor
Shares | |
| $ | (78,194,778 | ) | | $ | 78,194,778 | | | | | | | | | | | | | | | | | | | | | | | | | |
| | 756,869,688 | | | | 43,712,430 | | | $ | 292,786,604 | | | $ | 17,273,694 | | | $ | 489,596,371 | | | $ | 77,965,104 | | | $ | 96,562,686 | | | $ | 227,663,441 | |
| | 88,578,891 | | | | 6,278,901 | | | | 474,031,867 | | | | 81,886,968 | | | | 157,266,155 | | | | 1,195,855 | | | | 20,175,067 | | | | 261,614,624 | |
| | (285,963,748 | ) | | | (1,961,383 | ) | | | (786,263,400 | ) | | | (123,852,218 | ) | | | (328,513,261 | ) | | | (10,751,162 | ) | | | (255,154,521 | ) | | | (221,681,083 | ) |
| | | | | | | | | | | | | | | | | | | | | | | | | | | | | | | |
| $ | 481,290,053 | | | $ | 126,224,726 | | | $ | (19,444,929 | ) | | $ | (24,691,556 | ) | | $ | 318,349,265 | | | $ | 68,409,797 | | | $ | (138,416,768 | ) | | $ | 267,596,982 | |
| | | | | | | | | | | | | | | | | | | | | | | | | | | | | | | |
| | | | | | | |
| | (2,927,547 | ) | | | 2,927,547 | | | | | | | | | | | | | | | | | | | | | | | | | |
| | 27,108,609 | | | | 1,568,426 | | | | 9,211,352 | | | | 522,516 | | | | 23,462,966 | | | | 6,951,937 | | | | 5,260,008 | | | | 12,137,987 | |
| | 3,182,856 | | | | 225,617 | | | | 15,430,725 | | | | 2,620,383 | | | | 7,766,230 | | | | 107,252 | | | | 1,113,414 | | | | 14,477,843 | |
| | (10,237,063 | ) | | | (71,458 | ) | | | (24,845,108 | ) | | | (3,823,512 | ) | | | (15,850,054 | ) | | | (948,028 | ) | | | (13,902,598 | ) | | | (11,890,809 | ) |
| | | | | | | | | | | | | | | | | | | | | | | | | | | | | | | |
| | 17,126,855 | | | | 4,650,132 | | | | (203,031 | ) | | | (680,613 | ) | | | 15,379,142 | | | | 6,111,161 | | | | (7,529,176 | ) | | | 14,725,021 | |
| | | | | | | | | | | | | | | | | | | | | | | | | | | | | | | |
| | | | | | |
INTERNATIONAL
VALUE | | | | | | MID CAP | | | MID CAP
VALUE | | | OPPORTUNISTIC
VALUE | | | SMALL CAP | | | SMALL CAP
VALUE | |
Investor
Shares | | | | | | Investor
Shares | | | Institutional
Shares | | | Investor
Shares | | | Investor
Shares(2) | | | Investor
Shares | | | Investor
Shares | |
| $ | 711,293,524 | | | | | | | $ | 902,753,102 | | | $ | 55,931,735 | | | $ | 1,278,114,752 | | | $ | 76,696,206 | | | $ | 469,041,774 | | | $ | 482,338,945 | |
| | 28,357,891 | | | | | | | | 205,964,332 | | | | 40,056,662 | | | | 113,719,066 | | | | - | | | | 29,151,935 | | | | 198,667,438 | |
| | (183,814,342 | ) | | | | | | | (1,552,986,575 | ) | | | (307,000,219 | ) | | | (1,551,869,514 | ) | | | (4,813,331 | ) | | | (301,497,637 | ) | | | (360,240,201 | ) |
| | | | | | | | | | | | | | | | | | | | | | | | | | | | | | | |
| $ | 555,837,073 | | | | | | | $ | (444,269,141 | ) | | $ | (211,011,822 | ) | | $ | (160,035,696 | ) | | $ | 71,882,875 | | | $ | 196,696,072 | | | $ | 320,766,182 | |
| | | | | | | | | | | | | | | | | | | | | | | | | | | | | | | |
| | | | | | | |
| | 28,589,432 | | | | | | | | 28,570,035 | | | | 1,750,257 | | | | 66,702,499 | | | | 7,689,378 | | | | 25,960,358 | | | | 26,431,133 | |
| | 1,344,769 | | | | | | | | 6,671,990 | | | | 1,280,993 | | | | 6,061,606 | | | | - | | | | 1,669,642 | | | | 11,477,024 | |
| | (7,654,580 | ) | | | | | | | (49,375,193 | ) | | | (9,727,021 | ) | | | (81,083,86 | ) | | | (486,391 | ) | | | (16,910,947 | ) | | | (19,722,554 | ) |
| | | | | | | | | | | | | | | | | | | | | | | | | | | | | | | |
| | 22,279,621 | | | | | | | | (14,133,168 | ) | | | (6,695,771 | ) | | | (8,319,764 | ) | | | 7,202,987 | | | | 10,719,053 | | | | 18,185,603 | |
| | | | | | | | | | | | | | | | | | | | | | | | | | | | | | | |
73
NOTES TO FINANCIAL STATEMENTS
Artisan Funds and the Adviser were defendants in a lawsuit in the Circuit Court of the Third Judicial Circuit, Madison County, Illinois that sought certification of a plaintiff class consisting of all persons in the United States who held shares in International Fund for a period of more than 14 days during the five years prior to the filing of the lawsuit. The suit sought compensatory and punitive damages under state law, as well as interest, costs and attorney’s fees. The lawsuit alleged, in summary, that Artisan Funds and the Adviser exposed long-term International Fund shareholders to trading by market timers by allegedly (a) failing to properly evaluate daily whether a significant event affecting the value of International Fund’s securities had occurred after foreign markets had closed but before the calculation of the Fund’s NAV; (b) failing to implement the Fund’s portfolio valuation and share pricing policies and procedures; (c) allowing portfolio valuation and share policies and procedures that benefited market timers at the expense of long-term shareholders; and (d) failing to know and implement applicable rules and regulations concerning the calculation of NAV.
Artisan Funds and the Adviser removed the lawsuit from state court to federal district court. The federal district court ordered the case remanded to Illinois state court. Artisan Funds and the Adviser then appealed the remand order to the United States Court of Appeals for the Seventh Circuit and, on April 5, 2005, the Court of Appeals ruled in favor of Artisan Funds and the Adviser. As a result, the action was dismissed with prejudice in May 2005. The plaintiff subsequently sought and was granted review by the United States Supreme Court on the question of whether the Court of Appeals had jurisdiction to hear the appeal. On June 15, 2006, the United States Supreme Court ruled that the Court of Appeals had lacked jurisdiction to hear the appeal of Artisan Funds and the Adviser, vacated the judgment of the Court of Appeals and remanded the case to the Court of Appeals with instructions to dismiss the appeal for lack of jurisdiction. On October 16, 2006, the Court of Appeals dismissed the appeal and remanded the case to state court. Artisan Funds and the Adviser have again removed the action from state court to federal court and intend to continue to defend the lawsuit vigorously.
Certain legal fees incurred by Artisan Funds in defense of the lawsuit have been allocated to International Fund and were included in professional fees in the Statement of Operations. As of the date of this report, Artisan Funds does not believe that the action described herein will have a material effect on the financial condition of any Fund.
| (10) | Recent Accounting Pronouncements: |
On July 13, 2006, the Financial Accounting Standards Board (FASB) released FASB Interpretation No. 48 "Accounting for Uncertainty in Income Taxes" (FIN 48). FIN 48 provides guidance for how uncertain tax positions should be recognized, measured, presented and disclosed in the financial statements. FIN 48 requires the evaluation of tax positions taken or expected to be taken in the course of preparing the Fund’s tax returns to determine whether the tax positions are "more-likely-than-not" to be sustained by the applicable tax authority. Tax positions not deemed to meet a more-likely-than-not threshold would be deemed to be uncertain and would be recorded as tax expense in the current year. Adoption of FIN 48 is required for fiscal years beginning after December 15, 2006 and is to be applied to all open tax years as of the effective date. Recent SEC guidance allows implementing FIN 48 in fund NAV calculations as late as the fund’s last
74
NOTES TO FINANCIAL STATEMENTS
NAV calculation in the first required financial statement reporting period. As a result, the Funds will incorporate FIN 48 in its semi-annual report on March 31, 2008. As of the date of this report, management is evaluating the implications of FIN 48 and its impact to the financial statements has not yet been determined.
In September 2006, FASB issued Statement on Financial Accounting Standards No. 157, "Fair Value Measurements” (FAS 157). This standard clarifies the definition of fair value for financial reporting, establishes a framework for measuring fair value and requires additional disclosures about the use of fair value measurements. FAS 157 is effective for financial statements issued for fiscal years beginning after November 15, 2007 and interim periods within those fiscal years. As of March 31, 2007, the Funds did not believe the adoption of FAS 157 would impact the amounts reported in the financial statements, however, additional disclosures would be required about the inputs used to develop the measurements of fair value and the effect of certain of the measurements reported in the statement of operations for a fiscal period.
75
SHAREHOLDER EXPENSE EXAMPLE
As a shareholder of Artisan Funds, you may incur transaction costs, including redemption fees, and you will incur ongoing costs, including management fees and other Fund expenses. This example is intended to help you understand your ongoing costs (in dollars) of investing in a Fund and to compare these costs with the ongoing costs of investing in other mutual funds.
The example is based on an investment of $1,000 invested at the beginning of the period and held for the entire period from October 1, 2006 to March 31, 2007.
Actual Expenses
The first line under the name of each Fund in the table below provides information about actual account values and actual expenses. You may use the information in this line, together with the amount you invested, to estimate the expenses that you paid over the period. Simply divide your account value by $1,000 (for example, an $8,600 account value divided by $1,000 = 8.6), then multiply the result by the number in the first line under the name of your Fund under the heading entitled “Expenses Paid During Period” to estimate the expenses you paid on your account during this period.
Hypothetical Example for Comparison Purposes
The second line below each Fund’s name in the table below provides information about hypothetical account values and hypothetical expenses based on each Fund’s actual expense ratio for the six months ended March 31, 2007 and an assumed rate of return of 5% per year before expenses, which is not the Fund’s actual return. The hypothetical account values and expenses may not be used to estimate the actual ending account balances or expenses you paid for the period. You may use this information to compare the ongoing costs of investing in each Fund and other funds. To do so, compare the 5% hypothetical example with the 5% hypothetical examples that appear in the shareholder reports of the other funds.
Please note that the expenses shown in the table are meant to highlight your ongoing costs only and do not reflect any transactional costs, such as redemption fees. Therefore, the second line of the table is useful in comparing ongoing costs only, and will not help you determine the relative costs of owning different funds. If these transactional costs were included, your costs would have been higher.
| | | | | | |
| | | Beginning
Account Value
10/1/2006 | | Ending
Account Value
3/31/2007 | | Expenses Paid During
Period
10/1/2006-3/31/2007(1) |
Artisan International Fund - Investor Shares | | | | | | |
Actual | | $1,000.00 | | $1,157.61 | | $6.51 |
Hypothetical (5% return before expenses) | | $1,000.00 | | $1,018.90 | | $6.09 |
Artisan International Fund - Institutional Shares | | | | | | |
Actual | | $1,000.00 | | $1,158.99 | | $5.33 |
Hypothetical (5% return before expenses) | | $1,000.00 | | $1,020.00 | | $4.99 |
Artisan International Small Cap Fund - Investor Shares | | | | | | |
Actual | | $1,000.00 | | $1,208.56 | | $8.37 |
Hypothetical (5% return before expenses) | | $1,000.00 | | $1,017.35 | | $7.64 |
76
SHAREHOLDER EXPENSE EXAMPLE
| | | | | | |
| | | Beginning
Account Value
10/1/2006 | | Ending
Account Value
3/31/2007 | | Expenses Paid During
Period
10/1/2006-3/31/2007(1) |
Artisan International Value Fund - Investor Shares | | | | | | |
Actual | | $1,000.00 | | $1,135.16 | | $6.65 |
Hypothetical (5% return before expenses) | | $1,000.00 | | $1,018.70 | | $6.29 |
Artisan International Value Fund - Institutional Shares | | | | | | |
Actual | | $1,000.00 | | $1,135.96 | | $5.75 |
Hypothetical (5% return before expenses) | | $1,000.00 | | $1,019.55 | | $5.44 |
Artisan Mid Cap Fund - Investor Shares | | | | | | |
Actual | | $1,000.00 | | $1,099.36 | | $6.49 |
Hypothetical (5% return before expenses) | | $1,000.00 | | $1,018.75 | | $6.24 |
Artisan Mid Cap Fund - Institutional Shares | | | | | | |
Actual | | $1,000.00 | | $1,101.11 | | $4.98 |
Hypothetical (5% return before expenses) | | $1,000.00 | | $1,020.19 | | $4.78 |
Artisan Mid Cap Value Fund - Investor Shares | | | | | | |
Actual | | $1,000.00 | | $1,129.97 | | $6.43 |
Hypothetical (5% return before expenses) | | $1,000.00 | | $1,018.90 | | $6.09 |
Artisan Opportunistic Value Fund - Investor Shares | | | | | | |
Actual | | $1,000.00 | | $1,132.17 | | $7.97 |
Hypothetical (5% return before expenses) | | $1,000.00 | | $1,017.45 | | $7.54 |
Artisan Small Cap Fund - Investor Shares | | | | | | |
Actual | | $1,000.00 | | $1,064.66 | | $6.07 |
Hypothetical (5% return before expenses) | | $1,000.00 | | $1,019.05 | | $5.94 |
Artisan Small Cap Value Fund - Investor Shares | | | | | | |
Actual | | $1,000.00 | | $1,109.76 | | $6.26 |
Hypothetical (5% return before expenses) | | $1,000.00 | | $1,019.00 | | $5.99 |
(1) | Expenses are equal to the Fund’s ratio of expenses to average net assets for the six-month period ended March 31, 2007 (shown below); multiplied by the average account value over the period; multiplied by 182/365 (to reflect the one-half year period). |
| | |
| Fund | | Annualized Ratio of Expenses to Average
Net Assets for the Six-Month
Period Ended March 31, 2007 |
Artisan International Fund - Investor Shares | | 1.21% |
Artisan International Fund - Institutional Shares | | 0.99 |
Artisan International Small Cap Fund - Investor Shares | | 1.52 |
Artisan International Value Fund - Investor Shares | | 1.25 |
Artisan International Value Fund - Institutional Shares | | 1.08 |
Artisan Mid Cap Fund - Investor Shares | | 1.24 |
Artisan Mid Cap Fund - Institutional Shares | | 0.95 |
Artisan Mid Cap Value Fund - Investor Shares | | 1.21 |
Artisan Opportunistic Value Fund - Investor Shares | | 1.50 |
Artisan Small Cap Fund - Investor Shares | | 1.18 |
Artisan Small Cap Value Fund - Investor Shares | | 1.19 |
77
FACTORS CONSIDERED IN RENEWING THE FUNDS’ ADVISORY AGREEMENTS
Artisan Partners Limited Partnership (“Artisan Partners”) is responsible for management of the Funds’ investment portfolios and for overall management of the Funds’ business and affairs pursuant to Investment Advisory Agreements dated December 28, 1995, as amended November 17, 2005 (International Fund); November 7, 2001 (International Small Cap Fund); August 9, 2002 (International Value Fund); April 10, 1997 (Mid Cap Fund); January 25, 2001 (Mid Cap Value Fund); March 27, 1995 (Small Cap Fund) and August 20, 1997 (Small Cap Value Fund) (the “Advisory Agreements”). The advisory agreement for Opportunistic Value Fund dated February 9, 2006, continues through November 30, 2007, and so was not considered at the meetings described below. Artisan Partners is a Delaware limited partnership the sole general partner of which is Artisan Investment Corporation. Artisan Investment Corporation was incorporated on December 7, 1994 for the sole purpose of acting as general partner of Artisan Partners. Artisan Investment Corporation is owned by ZFIC, Inc., a Wisconsin Corporation, which is controlled by Mr. Ziegler and Ms. Ziegler, who together own 100% of its voting stock. The principal address of Artisan Partners is 875 E. Wisconsin Avenue, Suite 800, Milwaukee, Wisconsin 53202. Artisan Partners also has offices at 100 Pine Street, Suite 2950, San Francisco, California 94111; One Maritime Plaza, Suite 1450, San Francisco, California 94111; Five Concourse Parkway NE, Suite 2120, Atlanta, Georgia 30328; 1350 Avenue of the Americas Suite 3005, New York, New York 10019 and 800 Delaware Avenue, Suite 800, Wilmington, Delaware 19801.
The Advisory Agreement for each Fund may be continued from year to year only so long as the continuance is approved annually (a) by the vote of a majority of the directors of Artisan Funds who are not “interested persons” of Artisan Funds or Artisan Partners cast in person at a meeting called for the purpose of voting on such approval, and (b) by the board of directors or by the vote of a majority (as defined in the 1940 Act) of the outstanding shares of the Fund. Each Advisory Agreement provides that Artisan Partners shall not be liable for any loss suffered by a Fund or its shareholders as a consequence of any act or omission in connection with investment advisory or portfolio services under the agreement, except by reason of willful misfeasance, bad faith or gross negligence on the part of Artisan Partners in the performance of its duties or from reckless disregard by Artisan Partners of its obligations and duties under the Advisory Agreement. Each Agreement will terminate automatically in the event of its assignment (as defined in the 1940 Act).
The directors of Artisan Funds held a special meeting of the board on November 3, 2006 (the “November Special Meeting”), at which meeting they gave preliminary consideration to information bearing on continuation of each Advisory Agreement for the period from December 1, 2006 through November 30, 2007. The primary purpose of the November Special Meeting was to ensure that the directors had ample opportunity to consider matters they deemed relevant in considering the continuation of the Advisory Agreements, and to request any additional information they considered reasonably necessary to their deliberations, without undue time constraints.
The independent directors of Artisan Funds next met in executive session on November 9, 2006 with their independent counsel to further consider the matters reviewed at the November Special Meeting and to reach certain conclusions in connection with the review and approval of the Advisory Agreements. The full board then met at a regular meeting on November 10, 2006, at which time they approved the continuation of each Advisory Agreement from December 1, 2006 to November 30, 2007.
78
FACTORS CONSIDERED IN RENEWING THE FUNDS’ ADVISORY AGREEMENTS
Prior to the November Special Meeting, independent counsel to the independent directors sent to Artisan Partners a request for information to be provided to the directors in connection with their consideration of the continuation of the Advisory Agreements. Artisan Partners provided materials to the directors that included responses to that request, other information Artisan Partners believed was useful in evaluating the continuation of the Advisory Agreements and extensive reports prepared by Lipper Inc. (“Lipper”), an independent source of investment company data, relating to each Fund’s performance and expenses compared to the performance and expenses of a relatively small peer group and a larger peer universe of funds determined by Lipper to be comparable. Artisan Partners also provided additional reports prepared by Lipper comparing certain of the Funds’ performance and expenses to different peer groups and peer universes that Artisan Partners believed were more appropriate for comparative purposes than the peer groups and peer universes selected by Lipper. The directors also received and reviewed a memorandum from their independent counsel regarding the directors’ responsibilities in evaluating the Funds’ investment advisory agreements.
In evaluating the Advisory Agreements, the directors reviewed the available information and discussed with representatives of Artisan Partners each Fund’s operations, the nature, extent and quality of the advisory and other services provided by Artisan Partners to the Funds, the overall expense ratios of each class of shares of the Funds, and economies of scale and other benefits derived by Artisan Partners from its relationship with the Funds. In addition to the third party reports by Lipper and the memorandum from independent counsel, the directors reviewed information provided prior to and presented at the November Special Meeting concerning the following:
| • | | The terms of each Advisory Agreement, including: a list of services performed by Artisan Partners; Artisan Partners’ responsibility for making investment decisions and for observing investment objectives, policies and restrictions of each Artisan Fund; Artisan Partners’ standard of care; and termination provisions; |
| • | | Artisan Partners’ personnel and operations, including: the education, experience and number of Artisan Partners’ investment personnel; Artisan Partners’ assessment of its ability to attract and retain capable investment and business professionals through compensation programs and equity participation and recent hiring and retention information; Artisan Partners’ research and decision-making processes, including methods adopted to ensure compliance with investment objectives, policies and restrictions of the Funds; policies relating to the assignment of Artisan Partners’ personnel to the various Funds’ portfolios; the compensation of Artisan Partners’ personnel with primary responsibility for managing the Funds; the time and attention of Artisan Partners’ personnel devoted to the Funds; and the adequacy and sophistication of Artisan Partners’ technology and systems with respect to investment and administrative matters; |
| • | | Each Fund’s short- and long-term investment performance, including a comparison for various time periods with (1) other Artisan Partners client accounts managed in the same investment strategy, (2) other mutual funds having similar investment objectives, and (3) appropriate market indices; |
| • | | Potential for conflicts of interest between the Funds and Artisan Partners and circumstances and actions addressing or bearing on potential conflicts of interest, |
79
FACTORS CONSIDERED IN RENEWING THE FUNDS’ ADVISORY AGREEMENTS
| | including: the type and number of other clients served by Artisan Partners in each of its investment strategies; the basis of sharing personnel, services, research and advice among clients; the basis of decisions by Artisan Partners to buy or sell securities for the Funds and other clients where the same security might be bought or sold for a number of clients; Artisan Partners’ methodology of allocating investment opportunities, including initial public offerings, among the Funds and other clients; potential advantages and disadvantages in having an investment adviser that has other clients; Artisan Partners’ own investments and possible conflicts with the Funds; Artisan Partners’ code of ethics; any litigation pending, threatened or settled involving Artisan Partners; and results of any regulatory examinations; |
| • | | Potential “fall-out” benefits gained by Artisan Partners or its affiliates from their relationship with the Funds, including: benefits to Artisan Partners in attracting and retaining other clients and the method of estimating other benefits; |
| • | | Brokerage and portfolio transactions, including: the standards and performance in seeking best execution; commissions paid, including commissions by purpose; allocation of brokerage for research products and services (soft dollars); Artisan Partners’ practices in light of SEC guidance under Section 28(e) of the Securities Exchange Act of 1934; and portfolio turnover rates; |
| • | | The structure of advisory fees charged, including: the method of computing fees; recognition of economies of scale through breakpoints in the fees; the frequency of the payment of fees; a comparison of the fees charged by Artisan Partners to the Funds with the fees charged by Artisan Partners to other accounts managed by Artisan Partners in the same investment strategies, including other mutual funds for which Artisan Partners provides sub-advisory services; a comparison of the fees charged by Artisan Partners to the Funds with the management fees charged by other investment advisers for managing mutual funds with similar investment objectives and strategies; and potential cost savings by Artisan Partners, incentives to effect savings and the sharing of savings with the Funds; |
| • | | The effect of advisory and other fees on the Funds’ total expenses, including: comparisons of expenses and expense ratios with those of other mutual funds, taking into account comparability factors such as size, account-level charges and investment objective; voluntary expense limitations or reductions and the relationship of expenses to expense limitations; the allocation of certain expenses between Artisan Partners, Distributor and the Funds; and fees paid to service providers other than Artisan Partners, including custodial, transfer agent and shareholder servicing fees; |
| • | | The financial condition and stability of Artisan Partners, including Artisan Partners’ consolidated balance sheet; and |
| • | | The profitability to Artisan Partners of its relationship with each Fund, including: unaudited schedules showing Artisan Partners’ revenues, costs and profits in providing services to the Funds, on a fund-by-fund basis; the methods of allocating expenses in compiling those statements and the impact different methods would have on overall profitability; and Artisan Partners’ profit margins and appropriate comparisons with Artisan Partners’ profit margins on private account advisory fees. |
At the end of the November Special Meeting, after discussion and consideration of the information presented, the independent directors met in executive session with their
80
FACTORS CONSIDERED IN RENEWING THE FUNDS’ ADVISORY AGREEMENTS
independent counsel and subsequently requested additional supplemental material concerning the funds for which Artisan Partners serves as subadviser.
On November 9, 2006, the independent directors then again met separately with their independent counsel to review and discuss relevant information regarding the continuation of the Advisory Agreements and the information presented and discussed at the November Special Meeting. In the course of this review process, the independent directors reviewed and discussed the following information:
The nature, extent and quality of Artisan Partners’ services. The independent directors reviewed the nature, extent and the quality of Artisan Partners’ services to the Funds and considered the following:
| • | | Because Artisan Partners’ principal responsibility is management of the Funds’ investment portfolios, the investment performance achieved by Artisan Partners is an important measure of the quality of the services provided. |
| • | | Besides investment management, Artisan Partners provides the Funds with general administration services, including the preparation of regulatory filings, supervises the pricing of the Funds’ portfolios and calculation of net asset value, provides services to certain of the Funds’ shareholders and management of the Funds’ relationships with its third party service providers, including its custodian, fund accounting agent, transfer agent, lawyers and auditors. |
| • | | The quality of Artisan Partners’ services to the Funds in absolute terms and relative to mutual fund industry standards. |
| • | | The sufficiency and quality of Artisan Partners personnel. |
| • | | Artisan Partners’ financial condition. |
The investment performance of each Fund. The independent directors reviewed for each Fund for periods ended June 30, 2006 short-term and long-term investment performance compared to broad-based and style specific market indexes, performance for the period January 1, 2006 through September 30, 2006 compared to the same indexes, Morningstar ratings™ (for those Funds rated by Morningstar) and Lipper rankings. The independent directors concluded that the overall investment performance of each Fund has been good to excellent and with respect to Artisan Small Cap Fund performance has been acceptable. In reaching that conclusion, the independent directors considered the following:
| • | | Because of each Fund’s style specific investment strategy, the investment performance of each Fund and, in particular, its performance compared to a broad based market index is affected by the relative performance of growth-oriented stocks and value-oriented stocks in the market overall. |
| • | | A fund’s relative performance in the Lipper performance universe may be significantly influenced by the style category in which Lipper places the fund. |
| • | | The performance of each Fund, without taking expenses into account, was consistent with the performance, before expenses, of other accounts managed by Artisan Partners in the same investment strategy. |
81
FACTORS CONSIDERED IN RENEWING THE FUNDS’ ADVISORY AGREEMENTS
Cost of services, economies of scale and benefits derived by Artisan Partners. The independent directors reviewed the overall expense ratio of each class of shares of each Fund in comparison to the expense ratios of its peers in relation to the nature and quality of services provided and in relation to the fees Artisan Partners charges its other clients who have similar investment strategies and objectives (but to whom Artisan Partners generally provides few or no services other than portfolio management). The independent directors also considered whether shareholders of the Funds have benefited or will benefit from economies of scale under the management fee structures in the Advisory Agreements, including the fact that since International Small Cap Fund closed at a relatively low asset level, Artisan Partners is not likely to enjoy economies of scale in its management. In their review, the independent directors considered the following:
| • | | The rates of fee paid by each Fund to Artisan Partners have been stable or have decreased as a percentage of Fund assets as a result of fee breakpoints, but the aggregate dollar amounts of the fees paid have increased as the Funds have grown. |
| • | | In return for its services, each Fund, other than Artisan International Small Cap Fund, pays Artisan Partners a monthly fee at the annual rate of 1% of the Fund’s average daily net assets up to $500 million; 0.975 of 1% of the next $250 million; 0.950 of 1% of the next $250 million; and 0.925 of 1% of average daily net assets over $1 billion. In addition, Artisan International Fund pays Artisan Partners a monthly fee at the annual rate of 0.900 of 1% of the Fund’s average daily net assets over $12 billion. Artisan International Small Cap Fund pays Artisan Partners a monthly fee at the annual rate of 1.25% of the Fund’s average daily net assets. |
| • | | Although the management fee paid to Artisan Partners by many of the Funds was slightly higher than the median of fees paid by other funds in Lipper’s expense groups for the respective Funds, each Fund’s total expense ratio generally was lower than or comparable to the median total expense ratio of those other funds. |
Profitability of Artisan Partners. The independent directors reviewed a profitability analysis for Artisan Partners for the twelve-month period ended June 30, 2006, including a comparison of the fees charged to the Funds and Artisan Partners’ separate account clients. The independent directors also considered the fact that the relationship with each of the Funds being reviewed was profitable to Artisan Partners during the twelve-months ended June 30, 2006.
Other benefits derived by the Funds or Artisan Partners. The independent directors then reviewed the potential benefits that Artisan Partners may derive as a result of its relationship with the Funds, other than the services provided by Artisan Partners pursuant to the Advisory Agreements and the management fees paid in return. For Artisan Partners, the independent directors considered two potential benefits to Artisan Partners: (1) the potential conversion of a Fund shareholder to a separate account client; and (2) the acquisition of research products and services in return for commissions (“soft dollars”). The independent directors noted that, although Artisan Partners derives or may derive those additional benefits, the Funds also benefit in similar fashion. In reaching those conclusions, the independent directors considered the following:
| • | | Artisan Partners does not solicit the Funds’ shareholders to become separate account clients nor to purchase other goods or services provided by Artisan Partners or its |
82
FACTORS CONSIDERED IN RENEWING THE FUNDS’ ADVISORY AGREEMENTS
| | affiliates. Artisan Partners refers potential separate account clients that do not meet Artisan Partners’ minimum separate account size requirements to the Funds. |
| • | | Artisan Partners utilizes third-party research products and services and proprietary research from executing brokers paid for with soft dollars paid by the Funds and by other clients of Artisan Partners. Artisan Partners’ use of soft dollars provides Artisan Partners, and thereby the Funds, with access to third party and proprietary research and also helps Artisan Partners maintain important and open relationships with brokers. Use of a Fund’s commissions for soft dollar purposes is on the same terms as every other client account managed by Artisan Partners in the same investment strategy. |
The directors concluded their annual Advisory Agreement contract review at a regularly scheduled meeting on November 10, 2006. At the November 10th meeting, the independent directors and counsel to the independent directors reviewed with the full board the information discussed at the November 9th meeting. The directors then considered whether any further discussion or review was necessary, concluding that the November Special Meeting and the information reviewed by the independent directors at the November 9th meeting provided a strong basis for considering the continuation of the Advisory Agreements. The directors then reviewed and affirmed each of the following conclusions:
The nature, extent and quality of Artisan Partners’ services. The directors concluded that the nature and extent of Artisan Partners’ services to the Funds was appropriate and consistent with, and in some cases more advantageous to the Funds than, the terms of the Advisory Agreements. The directors concluded that the quality of Artisan Partners’ services has been consistently high, with no material deficiencies.
The investment performance of each Fund. The directors concluded that the overall performance of each Fund has been good to excellent and with respect to Artisan Small Cap Fund, performance has been acceptable.
Cost of services, economies of scale and benefits derived by Artisan Partners. The directors concluded that the overall expense ratio of each class of shares of each Fund was within an acceptable range of, and in line with industry averages. The directors concluded that the fees each Fund pays to Artisan Partners (and Artisan Partners’ corresponding profits) are reasonable in relation to the nature and quality of services provided to the Funds and in relation to the fees Artisan Partners charges its other clients who have similar investment strategies and objectives (but to whom Artisan Partners generally provides few or no services other than portfolio management). The directors also concluded that shareholders of the Funds (except for Artisan International Small Cap Fund) have benefited or will benefit from economies of scale under the management fee structures in the Advisory Agreements, and that, because International Small Cap Fund closed at such a small asset level, Artisan Partners is not likely to enjoy economies of scale in its management.
Other benefits derived by the Funds or Artisan Partners. The directors concluded that, other than the services provided by Artisan Partners pursuant to the Advisory Agreements and the management fees paid in return, the Funds and Artisan Partners may potentially benefit from their relationship with each other in several ways. For Artisan Partners, the
83
FACTORS CONSIDERED IN RENEWING THE FUNDS’ ADVISORY AGREEMENTS
directors concluded there were two principal benefits: (1) the potential conversion of a Fund shareholder to a separate account client; and (2) the acquisition of research products and services in return for commissions (“soft dollars”). The directors concluded that, although Artisan Partners derives or may derive those additional benefits, the Funds also could benefit from conversions of separate account clients to Fund investors and did benefit from Artisan Partners’ use of soft dollars with respect to its separate account clients. Following those discussions, the board approved the continuation of each Advisory Agreement through November 30, 2007 by the unanimous vote of all directors and also by the unanimous vote of all the “non-interested” directors.
84
NOTES ON MANAGEMENT’S DISCUSSION OF FUND PERFORMANCE
The discussions of each Fund included in this report include statistical information about the portfolios of each of the Funds. Except as otherwise noted, that information is as of March 31, 2007. That information will vary with changes in a Fund’s portfolio investments. The performance information for each Fund relative to its benchmark index discussed in this Report was prepared by the Adviser using information reported by FactSet Databases (“FactSet”). For the purposes of assigning portfolio securities to a particular country, the Adviser considers an issuer to be from a particular country as designated by its securities information vendors. The Adviser currently uses MSCI as its primary source and FactSet as a secondary source for this information. As a result, Artisan Mid Cap Fund, Artisan Mid Cap Value Fund, Artisan Opportunistic Value Fund, Artisan Small Cap Fund and Artisan Small Cap Value Fund routinely hold securities of issuers organized outside the U.S., but with their primary trading markets in the U.S. In addition, those Funds may hold a limited number of non-U.S. securities that are traded in the U.S., directly or as ADRs. Also based on the designations of the securities information vendors, Artisan International Fund, Artisan International Small Cap Fund and Artisan International Value Fund routinely hold securities of issuers organized within the U.S. and/or issuers with their primary trading markets in the U.S. In the event (i) the Adviser’s securities information vendors do not assign a security to a particular country or if the published classification appears to be erroneous, or (ii) its primary vendor does not assign a security to a particular country and the secondary vendor has assigned a security to a particular country by using a methodology that is not the same as the methodology the primary vendor uses to assign a country, the Adviser assigns the security to a country using the primary vendor’s published criteria (to the extent available) or the Adviser’s own judgment. The primary information vendor’s criteria include the identity of the jurisdiction of the issuer’s incorporation, the main equity trading market for the issuer’s securities, the geographical distribution of the issuer’s operations and the location of the issuer’s headquarters. Country designations may change over time.
For the purposes of assigning portfolio securities to a particular sector and industry, the Adviser considers an issuer to be included in a particular sector and industry as classified by its securities information vendors, Artisan Mid Cap Fund, Artisan Mid Cap Value Fund, Artisan Opportunistic Value Fund, Artisan Small Cap Fund and Artisan Small Cap Value Fund assign securities in accordance with the sector and industry classifications provided by The Frank Russell Company (to the extent available) as a primary source and FactSet (to the extent available) as a secondary source for this information. Artisan International Fund, Artisan International Small Cap Fund and Artisan International Value Fund assign securities for these purposes in accordance with the sector and industry classifications provided by MSCI (to the extent available) as a primary source and FactSet (to the extent available) as a secondary source for this information. In the event the Adviser’s securities information vendors do not classify a security to a particular sector and industry or if the published classification appears to be erroneous, the Adviser will classify the security according to the Adviser’s own judgment, using other securities information vendors, the company description and publicly available information about the company’s peer group. Sector and industry classifications may change over time.
The names of portfolio securities reflected in this report are as reported by the Funds’ data providers, may not represent the legal name of the entity and, in some cases, are translations of non-English names.
85
NOTES ON MANAGEMENT’S DISCUSSION OF FUND PERFORMANCE
Definitions of Portfolio Statistics
Median Market Cap provides a measure of the market capitalization value of the companies in a portfolio. Market capitalization is the aggregate value of all a company’s outstanding common stock. Market capitalization is calculated by FactSet using the price as of the most recent month-end multiplied by the number of shares outstanding as shown in the financial statements of the issuer. Equal numbers of companies in the portfolio have market capitalizations higher and lower than the median. Weighted Average Market Cap is the average of the market capitalizations of the companies in the portfolio weighted by the size of each company’s position within the portfolio.
Descriptions of Indices
Each Fund’s performance is compared in this report to changes in one or more indices, including in all cases a broad-based index of changes in prices of securities in the market in which the Fund invests. All of the indices are unmanaged and their returns include reinvested dividends. Unlike the Funds’ returns, the returns of each index do not include the payment of sales commissions or other expenses that would be incurred in the purchase or sale of the securities included in that index. An investment cannot be made directly in an index.
The indices to which the Funds are compared are:
Artisan International, Artisan International Small Cap and Artisan International Value Funds – Morgan Stanley Capital International EAFE® Index (MSCI EAFE®) is a market-weighted index of companies in developed markets, excluding the U.S. and Canada. MSCI EAFE’s average annual return since inception of the International Fund is based upon a starting date of December 31, 1995.
Artisan International Fund – Morgan Stanley Capital International EAFE® Growth Index (MSCI EAFE® Growth) is a market-weighted index of companies in developed markets, excluding the U.S. and Canada, with higher price-to-book ratios. MSCI EAFE Growth’s average annual return since inception of the International Fund is based upon a starting date of December 31, 1995.
Artisan International Small Cap Fund – Morgan Stanley Capital International EAFE® Small Cap Index (MSCI EAFE® Small Cap) is a market-weighted index of small companies in developed markets, excluding the U.S. and Canada.
Artisan International Value Fund – Morgan Stanley Capital International EAFE® Value Index (MSCI EAFE® Value) is a market-weighted index of companies in developed markets, excluding the U.S. and Canada, with lower price-to-book ratios.
Artisan Mid Cap Fund – Russell Midcap® Index is a market-weighted index of about 800 medium-sized U.S. companies. The Russell Midcap® Growth Index is a market-weighted index of those medium-sized companies included in the Russell Midcap® Index with higher price-to-book and higher forecasted growth values.
Artisan Mid Cap Value Fund – Russell Midcap® Index is a market-weighted index of about 800 medium-sized U.S. companies. The Russell Midcap® Value Index is a market-weighted index of those medium-sized companies included in the Russell Midcap® Index with lower price-to-book ratios and lower forecasted growth values.
86
NOTES ON MANAGEMENT’S DISCUSSION OF FUND PERFORMANCE
Artisan Opportunistic Value Fund – Russell 1000® Index is a market-weighted index of about 1,000 large U.S. companies. The Russell 1000® Value Index is a market-weighted index of those large companies included in the Russell 1000® Index with lower price-to-book ratios and lower forecasted growth values.
Artisan Small Cap Fund – Russell 2000® Index is a market-weighted index of about 2,000 small U.S. companies. Russell 2000® Growth Index is a market-weighted index of those small companies included in the Russell 2000® Index with higher price-to-book ratios and higher forecasted growth values.
Artisan Small Cap Value Fund – Russell 2000® Index is a market-weighted index of about 2,000 small U.S. companies. The Russell 2000® Value Index is a market-weighted index of those small companies included in the Russell 2000® Index with lower price-to-book ratios and lower forecasted growth values.
Trademarks
Trademarks and copyrights relating to the indices and products of portfolio companies mentioned in this report are owned by their respective owners. Except as otherwise indicated, the trademarks, including names, logos, slogans and service marks appearing in this report are the property of the Adviser and may not be copied, reproduced, published or in any way used without written permission.
PROXY VOTING POLICIES AND PROCEDURES
You may obtain a description of Artisan Funds’ proxy voting policies and procedures, without charge, upon request by calling 800.344.1770. That information also is included in Artisan Funds’ statement of additional information, which is available on the Funds’ website at www.artisanfunds.com and the Securities and Exchange Commission’s website at www.sec.gov.
Information relating to how each Artisan Fund voted proxies relating to portfolio securities held during the twelve months ended June 30 is available on the Funds’ website at www.artisanfunds.com and on the Securities and Exchange Commission’s website at www.sec.gov.
INFORMATION ABOUT PORTFOLIO SECURITIES
Artisan Funds files a complete schedule of portfolio holdings with the Securities and Exchange Commission for the quarters ending December 31 and June 30 (the first and third quarters of the Funds’ fiscal year) on Form N-Q. The Funds’ Forms N-Q are available on the Securities and Exchange Commission’s website at www.sec.gov. You may also review and copy those documents by visiting the Securities and Exchange Commission’s Public Reference Room in Washington, D.C. Information on the operation of the Public Reference Room may be obtained by calling the Securities and Exchange Commission at 800.SEC.0330.
87
| | | | |
 | | ARTISAN FUNDS P.O. BOX 8412 BOSTON, MA 02266-8412 800.344.1770 WWW.ARTISANFUNDS.COM | | |


ARTISAN
SEMIANNUAL
REPORT
MARCH 31, 2007
ARTISAN EMERGING
MARKETS FUND
_________
ARTISAN INTERNATIONAL
FUND
_________
ARTISAN INTERNATIONAL
VALUE FUND
_________
ARTISAN MID CAP FUND
ARTISAN FUNDS, INC.
INSTITUTIONAL SHARES
TABLE OF CONTENTS
ARTISAN FUNDS
P.O. BOX 8412
BOSTON, MA 02266-8412
This report and the unaudited financial statements contained herein are provided for the general information of the shareholders of the Institutional Shares of Artisan Emerging Markets Fund, Artisan International Fund, Artisan International Value Fund and Artisan Mid Cap Fund. Before investing, investors should consider carefully each Fund’s investment objective, risks and charges and expenses. For more complete information on any Fund, including fees and expenses, please call 800.399.1770 for a free prospectus. Read it carefully before you invest or send money.
Company discussions are for illustration only and are not intended as recommendations of individual stocks. The discussions present information about the companies believed to be accurate, and the views of the portfolio managers, as of March 31, 2007. That information and those views may change, and the Funds disclaim any obligation to advise shareholders of any such changes.
Artisan Funds offered through Artisan Distributors LLC, member NASD.
ARTISAN EMERGING MARKETS FUND
INSTITUTIONAL SHARES
| | |
| INVESTMENT PROCESS HIGHLIGHTS | | |
Artisan Emerging Markets Fund uses a fundamental research process to construct a diversified portfolio of emerging market companies. The team’s investment process is focused on identifying companies that are priced at a discount relative to the team’s estimate of their sustainable earnings. • Sustainable Earnings. The team estimates a company’s sustainable earnings based upon financial and business analysis. The team’s financial analysis focuses on a company’s balance sheet, income statement, and statement of cash flows within a normalized return on equity model to assess earnings potential. The team’s business analysis examines a company’s competitive advantages and financial strength to assess sustainability. The team believes that over the long-term a stock’s price is directly related to the company’s sustainable earnings. • Valuation. The team values a business and develops a price target based on its sustainable earnings and cash flow expectations and risk analysis. The team believes that investment opportunities develop when businesses with sustainable earnings are undervalued relative to historical, industry and regional valuations. • Risk Analysis. The team believes that a disciplined risk framework allows greater focus on fundamental stock selection. The team incorporates its assessment of company-specific and macroeconomic risks into its valuation analysis to develop a risk-adjusted target price. The team’s risk-rating assessment includes a review of the currency, interest rate, monetary and fiscal policy and political risks to which a company is exposed. |
|
| PERFORMANCE HISTORY | | |
GROWTH OF AN ASSUMED $10,000 INVESTMENT (6/26/06 to 3/31/07)
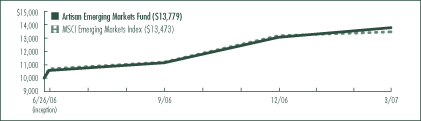
TOTAL RETURNS (as of 3/31/07)
| | | |
| Fund / Index | | Since
Inception(1) | |
Artisan Emerging Markets Fund – Institutional Shares | | 37.79 | % |
MSCI Emerging Markets IndexSM | | 34.73 | |
(1) | For the period from commencement of operations (June 26, 2006) through March 31, 2007; not annualized. |
The performance quoted represents past performance, which does not guarantee future results. The investment return and principal value of an investment in the Fund will fluctuate, so that an investor’s shares in the Fund, when redeemed, may be worth more or less than their original cost. The Fund’s return may vary greatly over short periods, and current performance may be materially lower or higher than the performance data quoted. The Fund’s investments in initial public offerings (IPOs) made a material contribution to the Fund’s performance. IPO investments are not an integral component of the Fund’s investment process and may not be available in the future. For current to most recent month-end performance information call 800.399.1770. The table above does not reflect the deduction of taxes that a shareholder would pay on distributions or sale of Fund shares. The performance shown does not reflect the deduction of a 2% redemption fee on shares held by an investor for 90 days or less and, if reflected, the fee would reduce the performance quoted. The Fund’s performance information reflects Artisan Partners’ undertaking to limit the Fund’s expenses, which may be terminated at any time, has been in effect since the Fund’s inception and has had a material impact on the Fund’s performance. In addition, the outside directors of Artisan Funds have waived that portion of their fees allocable to the Fund through the first six months of its operations. Absent that expense waiver, the Fund’s performance would have been lower. See page 53 for a description of each index.
1
INVESTING ENVIRONMENT
With the exception of some China induced volatility in the latter part of February, the six-month period ended March 31, 2007 was a strong period for emerging markets, which advanced more than 20%. Despite the volatility, China was a leader, increasing more than 30%. Other leaders that also returned more than 30% included Brazil, South Africa and Poland. Taiwan, South Korea, Russia and India were on the list of laggards, though each country generated positive returns. As a group, emerging markets outperformed their developed market counterparts. Across sectors, materials stocks were the clear leaders, moving over 38% higher, while technology stocks managed to eke out only a 2% gain.
SECTOR DIVERSIFICATION
| | | | | | |
| Sector | | 9/30/06 | | | 3/31/07 | |
Consumer Discretionary | | 7.6 | % | | 11.2 | % |
Consumer Staples | | 7.5 | | | 7.9 | |
Energy | | 12.0 | | | 10.1 | |
Financials | | 17.4 | | | 16.8 | |
Healthcare | | 2.5 | | | 4.8 | |
Industrials | | 8.2 | | | 11.3 | |
Information Technology | | 17.0 | | | 12.5 | |
Materials | | 12.1 | | | 12.0 | |
Telecommunication Services | | 12.8 | | | 10.7 | |
Utilities | | 1.8 | | | 1.2 | |
Other assets less liabilities | | 1.1 | | | 1.5 | |
Total | | 100.0 | % | | 100.0 | % |
As a percentage of total net assets.
PERFORMANCE DISCUSSION
The Fund gained 23.58% for the six- month period ended March 31, 2007, outperforming the MSCI Emerging Markets IndexSM. In the Fund, our list of leading contributors was fairly broad, but we had a number of standouts in China, Russia, Turkey and Mexico. Three of our top contributors in China were additions to the portfolio during the period – train-borne electrical systems provider Zhuzhou CSR Times Electric Co., Ltd., China Coal Energy Company and GOME Electrical Appliances Holdings Limited, a home appliance and consumer electronics retail chain. Diesel engine manufacturer Weichai Power Co., Ltd. and educational services company New Oriental Education & Technology Group, Inc. were also on our list of leaders in China. Russian nickel producer Mining and Metallurgical Company Norilsk Nickel, Turkish bank Turkiye Garanti Bankasi A.S. and Mexican copper producer Grupo Mexico SAB de CV were several of the Fund’s other top contributors to performance during the period.
On the downside, our low weight in a very strong Malaysian market and a select few underperforming stocks in South Africa and South Korea hurt the Fund on a relative basis. In South Africa, Gold Fields Limited and Sasol produced positive returns, in U.S. dollar terms, but their gains came up short of the Index. In South Korea, Samsung Electronics Co., Ltd. and Hyundai Motor Company both posted losses.
FUND CHANGES
The volatility during the period provided us with a number of opportunities to reallocate capital in the portfolio. Our activity was fairly broad-based, but we believe all our purchases possessed sustainable earnings growth potential and were trading at attractive valuation levels.
In addition to Zhuzhou CSR Times Electric, China Coal Energy and GOME Electrical Appliances, our list of purchases also included Russian wireless provider Mobile TeleSystems and entry level housing construction company Consorcio ARA, S.A. de C.V. (Mexico). Our purchases were funded in part by the sales of Infosys Technologies Limited, America Movil SAB de C.V. and NovaTek OAO.
REGION ALLOCATION
| | | | | | |
| Region | | 9/30/06 | | | 3/31/07 | |
Emerging Asia | | 49.4 | % | | 46.4 | % |
Emerging Europe, Middle East & Africa | | 23.4 | | | 26.0 | |
Latin America | | 23.4 | | | 22.7 | |
Developed Markets | | 2.7 | | | 3.4 | |
As a percentage of total net assets.
2
ARTISAN INTERNATIONAL FUND
INSTITUTIONAL SHARES
INVESTMENT PROCESS HIGHLIGHTS
Artisan International Fund uses a fundamental stock selection process focused on identifying long-term growth opportunities.
Themes. The investment team’s thematic approach identifies catalysts for change and develops investment themes with the objective of capitalizing on them globally. Changing demographics, developing technology, privatization of economic resources and outsourcing are among the long-term catalysts for change that currently form the basis for the team’s investment themes. The team incorporates these catalysts along with sector and regional fundamentals into a long-term global framework for investment analysis and decision-making.
Sustainable Growth. The team applies a fundamental approach to identifying the long-term, sustainable growth characteristics of potential investments. The team seeks high quality companies that are well managed, have a dominant or improving market position and competitive advantages compared to industry and regional peers.
Valuation. The team assesses the relationship between its estimate of a company’s sustainable growth prospects and its stock price. The team uses multiple valuation metrics to establish price targets.
The Fund primarily invests in non-U.S. growth companies of all market capitalizations in developed and emerging markets.
PERFORMANCE HISTORY
GROWTH OF AN ASSUMED $10,000 INVESTMENT (7/1/97 to 3/31/07)
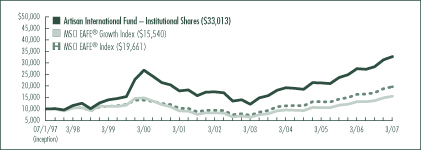
AVERAGE ANNUAL TOTAL RETURNS (as of 3/31/07)
| | | | | | | | | | | | |
| Fund / Index | | 1-Year | | | 3-Year | | | 5-Year | | | Since
Inception | |
Artisan International Fund — Institutional Shares | | 19.11 | % | | 19.53 | % | | 13.57 | % | | 13.03 | % |
MSCI EAFE® Growth Index | | 17.77 | | | 17.55 | | | 13.47 | | | 4.63 | |
MSCI EAFE® Index | | 20.20 | | | 19.83 | | | 15.78 | | | 7.18 | |
The performance quoted represents past performance, which does not guarantee future results. The investment return and principal value of an investment in the Fund will fluctuate, so that an investor’s shares in the Fund, when redeemed, may be worth more or less than their original cost. Current performance may be lower or higher than the performance data quoted. For current to most recent month-end performance information, visit www.artisanfunds.com or call 800.399.1770. The graph and table above do not reflect the deduction of taxes that a shareholder would pay on distributions or sale of Fund shares. The performance shown does not reflect the deduction of a 2% redemption fee on shares held by an investor for 90 days or less and, if reflected, the fee would reduce the performance quoted. See page 53 for a description of each index.
3
INVESTING ENVIRONMENT
During the six-month period ended March 31, 2007, the MSCI EAFE® Index generated a strong 14.85% return. Gains across the markets were fairly broad-based, though slightly stronger in Europe than in the Far East, due in large part to the underperformance of Japanese stocks. Emerging markets stocks outpaced developed markets. China and Brazil were standouts advancing more than 30% each. In the MSCI EAFE® Index, the industrials and materials sectors were leaders, gaining more than 20% each, while the healthcare and technology sectors posted small single-digit advances.
SECTOR DIVERSIFICATION
| | | | | | |
| Sector | | 9/30/06 | | | 3/31/07 | |
Consumer Discretionary | | 11.8 | % | | 11.4 | % |
Consumer Staples | | 9.8 | | | 9.3 | |
Energy | | 6.5 | | | 4.2 | |
Financials | | 37.3 | | | 32.4 | |
Healthcare | | 5.7 | | | 3.9 | |
Industrials | | 10.9 | | | 14.4 | |
Information Technology | | 4.8 | | | 5.7 | |
Materials | | 0.0 | (1) | | 1.5 | |
Telecommunication Services | | 4.8 | | | 7.3 | |
Utilities | | 7.7 | | | 8.4 | |
Other assets less liabilities | | 0.7 | | | 1.5 | |
Total | | 100.0 | % | | 100.0 | % |
As a percentage of total net assets.
(1) Represents less than 0.1% of total net assets.
PERFORMANCE DISCUSSION
The Fund outperformed the MSCI EAFE® Index during the semiannual reporting period with a gain of 15.90%. The primary driver of strength relative to the Index was positive security selection as two of our key themes, infrastructure and demographics, produced a number of winners. Strength in those themes contributed to positive results in several sectors. Our list of several top contributors in those themes included French construction company Bouygues SA, Japanese heavy machine manufacturer Mitsubishi Heavy Industries, Ltd., French electricity producer Electricite de France, Chinese wireless provider China Mobile Ltd., British grocer William Morrison Supermarkets PLC and Italian energy infrastructure provider Saipem S.p.A. The biggest detractor to performance was the financial sector. Within the sector we were hurt most by Japanese retail affiliated credit card company Credit Saison Co., Ltd., Japanese leasing company ORIX Corporation and Japanese consumer finance company AIFUL CORPORATION. We sold AIFUL due to reduced expectations for future growth.
FUND CHANGES
During the period, we continued to use our fundamental stock selection process to manage a portfolio of companies with what we consider to be reasonable valuations, attractive sustainable growth potential and exposure to the secular themes we have identified.
Two of our purchases could be found in a developing alternative energy trend in our infrastructure theme. We purchased Spanish wind energy turbine maker GamesaCorpocation Tecnologica, S.A. and German specialty chemicals company Wacker Chemie AG. Wacker Chemie’s Polysilicon division has products that are used in solar panels. Other additions in our infrastructure theme included U.K. utility National Grid PLC and German airport operator Fraport AG.
Those additions were funded in large part by several sales in Japan. During the period, we sold our positions in insurance company Millea Holdings, Inc., bank holding company Mitsubishi UFJ Financial Group, Inc., game manufacturer SEGA SAMMY HOLDINGS, INC. and general contracting company TAISEI CORPORATION.
REGION ALLOCATION
| | | | | | |
| Region | | 9/30/06 | | | 3/31/07 | |
Europe | | 55.4 | % | | 56.9 | % |
Pacific Basin | | 29.0 | | | 20.8 | |
Emerging Markets | | 14.0 | | | 19.9 | |
Americas | | 0.9 | | | 0.9 | |
As a percentage of total net assets.
4
ARTISAN INTERNATIONAL VALUE FUND
INSTITUTIONAL SHARES
INVESTMENT PROCESS HIGHLIGHTS
Artisan International Value Fund uses a bottom-up investment process focused on identifying what the investment team believes are high quality, undervalued businesses that offer the potential for superior risk/reward outcomes.
Undervaluation. Determining the intrinsic value of the business is the heart of the team’s research process. As long-term investors, it is the team’s core belief that valuation is the most crucial determinant of stock market return over the long-term.
Business quality. The team seeks to invest in companies with a history of generating strong free cash flow, improving returns on capital and strong competitive positions in their industries. This criteria helps rule out businesses that are statistically cheap, but whose values are deteriorating over time.
Financial strength. The team believes that investing in companies with strong balance sheets helps to reduce the potential for capital risk and provides company management the ability to build value when attractive opportunities are available.
Shareholder-oriented management. The team’s research process attempts to identify management teams with a history of building value for shareholders.
The Fund primarily invests in undervalued, non-U.S. companies of all market capitalizations in developed and emerging markets.
PERFORMANCE HISTORY
GROWTH OF AN ASSUMED $10,000 INVESTMENT (10/1/06 to 3/31/07)
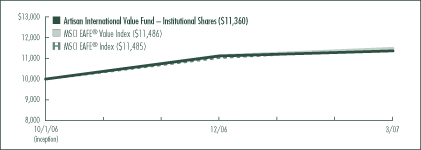
AVERAGE ANNUAL TOTAL RETURNS (as of 3/31/07)
| | | |
| Fund / Index | | Since
Inception(1) | |
Artisan International Value Fund—Institutional Shares | | 13.60 | % |
MSCI EAFE® Value Index | | 14.86 | |
MSCI EAFE® Index | | 14.85 | |
(1) | For the period from commencement of operations (October 1, 2006) through March 31, 2007; not annualized. |
The performance quoted represents past performance, which does not guarantee future results. The investment return and principal value of an investment in the Fund will fluctuate, so that an investor’s shares in the Fund, when redeemed, may be worth more or less than their original cost. Current performance may be lower or higher than the performance data quoted. For current to most recent month-end performance information, visit www.artisanfunds.com or call 800.399.1770. The graph and table above do not reflect the deduction of taxes that a shareholder would pay on distributions or sale of Fund shares. The performance shown does not reflect the deduction of a 2% redemption fee on shares held by an investor for 90 days or less and, if reflected, the fee would reduce the performance quoted. See page 53 for a description of each index.
5
INVESTING ENVIRONMENT
During the semiannual reporting period ended March 31, 2007, international stocks continued their strong run of performance as the MSCI EAFE® Index gained 14.85%. Not only did international equities broadly outperform their domestic counterparts, but foreign currencies also appreciated relative to the dollar. This continued a pair of trends that has been generally consistent for the past five years. We attribute this to increasing concerns about the health of the U.S. economy—interest rates have risen, the war in Iraq continues to take a heavy psychological and financial toll, and there are mounting problems in the subprime mortgage market.
SECTOR DIVERSIFICATION
| | | | | | |
| Sector | | 9/30/06 | | | 3/31/07 | |
Consumer Discretionary | | 26.3 | % | | 26.5 | % |
Consumer Staples | | 17.0 | | | 15.1 | |
Financials | | 18.4 | | | 14.6 | |
Healthcare | | — | | | 1.5 | |
Industrials | | 16.5 | | | 22.4 | |
Information Technology | | 2.8 | | | 1.0 | |
Materials | | 4.4 | | | 3.4 | |
Telecommunication Services | | 5.1 | | | 5.6 | |
Utilities | | 1.1 | | | — | |
Other assets less liabilities | | 8.4 | | | 9.9 | |
Total | | 100.0 | % | | 100.0 | % |
As a percentage of total net assets.
PERFORMANCE DISCUSSION
Artisan International Value Fund increased 13.60% during the six-month period ended March 31, 2007.
As value investors, our primary task is the purchase of shares of companies that are selling at a meaningful discount to our estimate of intrinsic value. Thus, our efforts are centered around monitoring business performance and the consequent impact on intrinsic value. As a result, our views on performance are a function of the fundamentals of the companies owned in the portfolio.
The share prices of the following companies had a meaningful positive impact on the portfolio during the semiannual period: Galiform Plc (formerly MFI Furniture Group PLC), a U.K. trade kitchen business; Pfeiffer Vacuum Technology AG, a German vacuum pumps manufacturer; Countrywide PLC, a U.K. service provider to companies in the residential property industry; Vodafone Group PLC, a global wireless telecommunications company; and Diageo PLC, a U.K.-based beverage company. Countrywide was the subject of a takeover bid during the semiannual period, which drove its stock price to new highs. We exited our position after the stock price rose close to our estimate of fair value. The number of stocks in the portfolio that posted losses was limited. U.K.-based reinsurance broker Benfield Group Plc, Korean beverage company Lotte Chilsung Beverage Co., Ltd. and Japanese pachinko machine manufacturer SANKYO CO., LTD. were three stocks that declined during the period. We used the weakness as an opportunity to build our position in Sankyo.
FUND CHANGES
As stock prices rose, we exited a number of positions that reached our estimates of intrinsic value. These sales included: Amdocs Limited, Renault SA, Grupo Televisa S.A., Euronext NV, Brit Insurance Holdings PLC, Red Electrica de Espana, Cementir S.p.A. and Gruma S.A.B.
Proceeds from those sales funded the purchases of Switzerland-based temporary employment company Adecco SA, French pharmaceutical company Sanofi-Aventis, Hong Kong real estate development company Pacific Century Premium Developments Limited and Japanese consumer finance companies TAKEFUJI CORPORATION and ACOM CO., LTD, among others.
REGION ALLOCATION
| | | | | | |
| Region | | 9/30/06 | | | 3/31/07 | |
Europe | | 54.3 | % | | 52.7 | % |
Pacific Basin | | 14.0 | | | 17.7 | |
Americas | | 12.5 | | | 10.9 | |
Emerging Markets | | 10.8 | | | 8.8 | |
As a percentage of total net assets.
6
ARTISAN MID CAP FUND
INSTITUTIONAL SHARES
INVESTMENT PROCESS HIGHLIGHTS
Artisan Mid Cap Fund uses a bottom-up investment process to construct a diversified portfolio of U.S. mid-cap growth companies.
Security Selection. The team’s investment process begins by identifying companies possessing franchise characteristics (strong competitive positions), selling at attractive valuations and benefiting from an accelerating trend. The investment team looks for companies that are well positioned for long-term growth, driven by demand for their products and services, at an early enough stage in their profit cycle to benefit from the increased cash flows produced by the profit cycle.
Capital Allocation. Based on the investment team’s fundamental analysis of a company’s profit cycle, portfolio holdings develop through three stages. GardenSM investments are small positions in the early part of their profit cycle that will warrant a more sizeable allocation once their profit cycle accelerates. CropSM investments are positions that are being increased to a full weight because they are moving through the strongest part of their profit cycle. HarvestSM investments are positions that are being reduced as they near the team’s estimate of full valuation or their profit cycle begins to decelerate.
Broad Diversification. The team looks for investment opportunities across the entire economy so that it can find sustainable growth regardless of the sector or industry.
The Fund primarily invests in medium-sized U.S. growth companies. The Fund generally maintains median and weighted average market capitalizations of less than $10 billion.
PERFORMANCE HISTORY
GROWTH OF AN ASSUMED $10,000 INVESTMENT (7/1/00 to 3/31/07)
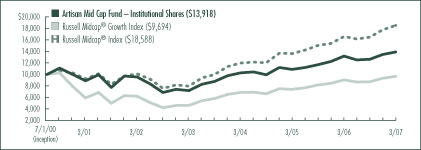
AVERAGE ANNUAL TOTAL RETURNS (as of 3/31/07)
| | | | | | | | | | | | |
| Fund / Index | | 1-Year | | | 3-Year | | | 5-Year | | | Since
Inception | |
Artisan Mid Cap Fund—Institutional Shares | | 5.43 | % | | 10.66 | % | | 7.85 | % | | 5.02 | % |
Russell Midcap® Growth Index | | 6.90 | | | 12.41 | | | 9.45 | | | (0.46 | ) |
Russell Midcap® Index | | 11.79 | | | 15.72 | | | 12.91 | | | 9.62 | |
The performance quoted represents past performance, which does not guarantee future results. The investment return and principal value of an investment in the Fund will fluctuate, so that an investor’s shares in the Fund, when redeemed, may be worth more or less than their original cost. Current performance may be lower or higher than the performance data quoted. For current to most recent month-end performance information, visit www.artisanfunds.com or call 800.399.1770. The graph and table above do not reflect the deduction of taxes that a shareholder would pay on distributions or sale of Fund shares. See page 53 for a description of each index.
7
INVESTING ENVIRONMENT
In a strong six-month period for stocks, mid-caps were the preferred market cap group, outdistancing small and large-cap stocks. In the mid-cap space, investors preferred value as the Russell Midcap® Growth Index gained 11.18% compared to the 13.77% return for the Russell Midcap® Value Index. In the Russell Midcap® Growth Index, commodity sensitive materials and energy stocks were preferred, while healthcare and technology stocks were among those that trailed the pack. Housing market concerns and credit distress in the subprime mortgage industry also led to sub par returns for financial stocks.
SECTOR DIVERSIFICATION
| | | | | | |
| Sector | | 9/30/06 | | | 3/31/07 | |
Auto & Transportation | | 2.1 | % | | 3.5 | % |
Consumer Discretionary | | 16.6 | | | 18.6 | |
Consumer Staples | | 2.2 | | | 3.9 | |
Financial Services | | 16.2 | | | 14.6 | |
Healthcare | | 17.5 | | | 19.5 | |
Materials & Processing | | 6.1 | | | 7.4 | |
Other | | 3.1 | | | 1.3 | |
Other Energy | | 4.8 | | | 3.8 | |
Producer Durables | | 5.5 | | | 4.0 | |
Technology | | 19.9 | | | 19.2 | |
Utilities | | 3.5 | | | 2.0 | |
Other assets less liabilities | | 2.5 | | | 2.2 | |
Total | | 100.0 | % | | 100.0 | % |
As a percentage of total net assets.
PERFORMANCE DISCUSSION
The Fund gained a solid 10.11% for the six-month period ended March 31, 2007. The Fund’s strongest gains relative to the Index could be found in the materials, healthcare and consumer staples sectors.
Our list of leading performers in those sectors included complex metal components manufacturer Precision Castparts Corp., agribusiness and food products company Bunge Limited, biopharmaceutical company MedImmune, Inc., healthcare information technology company Cerner Corporation and grocery operator Supervalu Inc. Investors Financial Services Corp. was another strong contributor as it increased nearly 35%, due in large part to a premium takeout offer from State Street Corporation. We pared back our position on news of the pending takeout.
The technology sector was the primary source of underperformance for the Fund. Within the technology sector, weakness generally centered on two positions—Advanced Micro Devices, Inc. and Intermec, Inc. We sold our position in semiconductor chip manufacturer Advanced Micro Devices because we believed the risks were not skewed in our favor. We continued to hold Intermec, which is an applied technologies company with a broad product offering that includes a franchise in RFID (radio frequency identification) technology.
FUND CHANGES
During the period, we initiated positions in a number of new companies; many were GardenSM investments, but several made it into our top 30 investments, which we generally consider to be our CropSM holdings. All of our new positions met the conditions of our security selection process—they possessed franchise characteristics, were selling at attractive valuations and were benefiting from an accelerating trend.
Our largest three purchases were beverage company Hansen Natural Corporation, Linux operating system distributor Red Hat, Inc. and surgical systems company Intuitive Surgical, Inc.
8
ARTISAN FUNDS, INC.
Top Ten Holdings – March 31, 2007 (Unaudited)
ARTISAN EMERGING MARKETS FUND
| | | | | |
| Company Name | | Country | | 3/31/07 | |
Samsung Electronics Co., Ltd. | | South Korea | | 4.2 | % |
Petroleo Brasileiro S.A. - Petrobras | | Brazil | | 3.1 | |
Taiwan Semiconductor Manufacturing Company Ltd. | | Taiwan | | 3.0 | |
LUKOIL | | Russia | | 2.9 | |
Companhia Vale do Rio Doce (CVRD) | | Brazil | | 2.8 | |
Kookmin Bank | | South Korea | | 2.2 | |
Hon Hai Precision Industry Co., Ltd. (Foxconn) | | Taiwan | | 2.1 | |
Zhuzhou CSR Times Electric Co., Ltd. | | China | | 1.9 | |
Mobile TeleSystems | | Russia | | 1.8 | |
Teva Pharmaceutical Industries Ltd. | | Israel | | 1.8 | |
Total | | | | 25.8 | % |
As a percentage of total net assets. Top 10 Holdings are determined by issuer.
ARTISAN INTERNATIONAL VALUE FUND
| | | | | |
| Company Name | | Country | | 3/31/07 | |
Diageo PLC | | United Kingdom | | 5.1 | % |
Tyco International Ltd. | | United States | | 4.9 | |
Wolters Kluwer NV | | Netherlands | | 4.5 | |
Vodafone Group PLC | | United Kingdom | | 4.0 | |
Pfeiffer Vacuum Technology AG | | Germany | | 3.7 | |
Galiform Plc | | United Kingdom | | 3.6 | |
Adecco SA | | Switzerland | | 3.5 | |
Benfield Group Plc | | United Kingdom | | 3.4 | |
Givaudan SA | | Switzerland | | 3.0 | |
Heidelberger Druckmaschinen AG | | Germany | | 3.0 | |
Total | | | | 38.7 | % |
As a percentage of total net assets. Top 10 Holdings are determined by issuer.
ARTISAN INTERNATIONAL FUND
| | | | | |
| Company Name | | Country | | 3/31/07 | |
UBS AG | | Switzerland | | 3.1 | % |
Allianz SE | | Germany | | 2.5 | |
Bouygues SA | | France | | 2.4 | |
Nestle SA | | Switzerland | | 2.4 | |
Fortum Oyj | | Finland | | 2.1 | |
Mitsubishi Heavy Industries, Ltd. | | Japan | | 2.1 | |
Publishing & Broadcasting Limited | | Australia | | 2.1 | |
Kookmin Bank | | South Korea | | 2.0 | |
Swiss Re | | Switzerland | | 2.0 | |
Credit Saison Co., Ltd. | | Japan | | 1.9 | |
Total | | | | 22.6 | % |
As a percentage of total net assets. Top 10 Holdings are determined by issuer.
ARTISAN MID CAP FUND
| | | | | |
| Company Name | | Country | | 3/31/07 | |
Thermo Fisher Scientific, Inc. | | United States | | 4.5 | % |
Electronic Arts Inc. | | United States | | 4.3 | |
MedImmune, Inc. | | United States | | 3.0 | |
Allergan, Inc. | | United States | | 2.8 | |
Chico’s FAS, Inc. | | United States | | 2.6 | |
MGIC Investment Corporation | | United States | | 2.5 | |
Supervalu Inc. | | United States | | 2.1 | |
NII Holdings, Inc. | | United States | | 1.9 | |
Hansen Natural Corporation | | United States | | 1.8 | |
Intermec, Inc. | | United States | | 1.8 | |
Total | | | | 27.3 | % |
As a percentage of total net assets. Top 10 Holdings are determined by issuer.
9
ARTISAN EMERGING MARKETS FUND
Schedule of Investments – March 31, 2007 (Unaudited)
| | | | | |
| | | Shares
Held | | Value |
| | | | | |
COMMON AND
PREFERRED STOCKS - 98.5% | | | | | |
| | | | | |
| BAHRAIN - 0.5% | | | | | |
Investcorp Bank B.S.C. (GDR)(1)(2) | | 1,388 | | $ | 36,088 |
| | | | | |
| BRAZIL - 14.3% | | | | | |
American Banknote SA | | 4,600 | | | 41,305 |
Banco Itau Holding Financeira SA, Preferred | | 2,700 | | | 94,224 |
Companhia Brasileira de Distribuicao Grupo Pao de Acucar, Preferred | | 1,700,000 | | | 49,507 |
Companhia Energetica de Minas Gerais- CEMIG, Preferred | | 1,000,000 | | | 49,022 |
Companhia Vale do Rio Doce (CVRD) | | 5,700 | | | 211,091 |
Duratex S.A., Preferred | | 2,000 | | | 39,460 |
EDP - Energias do Brasil SA | | 3,200 | | | 46,906 |
Empresa Brasileira de Aeronautica S.A. (Embraer) | | 6,400 | | | 72,968 |
Klabin Segall SA(2) | | 5,600 | | | 44,821 |
Petroleo Brasileiro S.A. - Petrobras | | 9,300 | | | 233,549 |
Telesp - Telecomunicacoes de Sao Paulo S.A. | | 1,600 | | | 35,723 |
Tim Participacoes S.A., Preferred(2) | | 17,800,000 | | | 57,885 |
Unibanco - Uniao de Bancos Brasileiros S.A. (Unit) | | 7,900 | | | 69,748 |
Votorantim Celulose e Papel S.A., Preferred | | 2,300 | | | 42,175 |
| | | | | |
| | | | | 1,088,384 |
| CHILE - 1.6% | | | | | |
Compania Cervecerias Unidas S.A. (ADR) | | 1,900 | | | 59,698 |
Empresa Nacional de Telecomunicaciones S.A. (ENTEL) | | 4,146 | | | 59,526 |
| | | | | |
| | | | | 119,224 |
| CHINA - 9.9% | | | | | |
Chaoda Modern Agriculture (Holdings) Limited | | 98,000 | | | 68,732 |
China Coal Energy Company, H Shares(2) | | 64,000 | | | 68,313 |
China Huiyuan Juice Group Limited(2) | | 45,500 | | | 55,437 |
Geely Automobile Holdings Limited | | 525,000 | | | 69,207 |
GOME Electrical Appliances Holdings Limited | | 68,888 | | | 76,616 |
Mindray Medical International Limited, Class A (ADR) | | 2,300 | | | 54,763 |
New Oriental Education & Technology Group, Inc. (ADR)(2) | | 2,033 | | | 82,397 |
Samson Holding Ltd. | | 107,000 | | | 61,350 |
| | | | | |
| | | Shares
Held | | Value |
| | | | | |
| CHINA (CONTINUED) | | | | | |
Weichai Power Co., Ltd., H Shares | | 15,000 | | $ | 77,942 |
Zhuzhou CSR Times Electric Co., Ltd., H Shares(2) | | 86,000 | | | 140,884 |
| | | | | |
| | | | | 755,641 |
| COLOMBIA - 0.5% | | | | | |
Suramericana de Inversiones S.A. | | 4,790 | | | 40,014 |
| | | | | |
| EGYPT - 3.9% | | | | | |
Egyptian Financial Group-Hermes Holding(1)(2) | | 9,145 | | | 60,525 |
El Sewedy Cables Holding Company(1)(2) | | 4,912 | | | 37,942 |
Orascom Construction Industries (OCI)(1) | | 987 | | | 49,556 |
Orascom Telecom Holding SAE(1) | | 1,173 | | | 81,340 |
Telecom Egypt(1) | | 23,278 | | | 65,671 |
| | | | | |
| | | | | 295,034 |
| HONG KONG - 1.4% | | | | | |
Huabao International Holdings Limited | | 100,000 | | | 60,536 |
Tingyi (Cayman Islands) Holding Corporation | | 46,000 | | | 44,331 |
| | | | | |
| | | | | 104,867 |
| INDIA - 4.7% | | | | | |
Bajaj Hindusthan Limited | | 14,941 | | | 67,993 |
Dr. Reddy’s Laboratories Limited | | 2,808 | | | 46,838 |
Hindalco Industries Limited | | 15,924 | | | 47,884 |
ITC Limited | | 12,700 | | | 44,121 |
Jaiprakash Associates Ltd. | | 2,901 | | | 35,708 |
Punjab National Bank Limited | | 2,720 | | | 29,725 |
Wockhardt Limited | | 9,619 | | | 87,637 |
| | | | | |
| | | | | 359,906 |
| INDONESIA - 1.1% | | | | | |
PT Telekomunikasi Indonesia, Series B | | 79,500 | | | 85,816 |
| | | | | |
| ISRAEL - 2.8% | | | | | |
Makhteshim-Agan Industries Ltd.(1) | | 6,639 | | | 41,641 |
Strauss Group Ltd.(1) | | 3,422 | | | 37,035 |
Teva Pharmaceutical Industries Ltd.(1) | | 3,671 | | | 135,786 |
| | | | | |
| | | | | 214,462 |
| LEBANON - 0.5% | | | | | |
SOLIDERE (GDR)(1) | | 2,400 | | | 38,280 |
| | | | | |
| MEXICO - 6.3% | | | | | |
Consorcio ARA, S.A. de C.V. | | 41,600 | | | 71,606 |
Fomento Economico Mexicano, S.A.B. de C.V., Series UBD | | 8,800 | | | 97,086 |
Grupo Aeroportuario del Pacifico SA de CV, Class B | | 11,800 | | | 50,799 |
10
| | | | | |
| | | Shares
Held | | Value |
| | | | | |
| MEXICO (CONTINUED) | | | | | |
Grupo Financiero Banorte S.A.B. de C.V. | | 15,300 | | $ | 72,451 |
Grupo Mexico SAB de CV | | 18,100 | | | 83,627 |
Grupo Televisa S.A., Series CPO | | 17,500 | | | 104,208 |
| | | | | |
| | | | | 479,777 |
| NETHERLANDS - 1.0% | | | | | |
Kardan NV(2) | | 2,607 | | | 39,005 |
Plaza Centers (Europe) BV(2) | | 10,681 | | | 39,673 |
| | | | | |
| | | | | 78,678 |
| PAKISTAN - 0.4% | | | | | |
Pakistan Telecommunication Company Limited, Class A | | 43,500 | | | 33,944 |
| | | | | |
| PHILIPPINES - 0.6% | | | | | |
Philippine Long Distance Telephone Company | | 900 | | | 47,098 |
| | | | | |
| POLAND - 0.8% | | | | | |
Polski Koncern Naftowy Orlen S.A.(2) | | 3,480 | | | 57,705 |
| | | | | |
| RUSSIA - 6.9% | | | | | |
LUKOIL (ADR) | | 2,524 | | | 218,326 |
Mining and Metallurgical Company Norilsk Nickel (ADR) | | 617 | | | 117,230 |
Mobile TeleSystems (ADR) | | 2,450 | | | 137,102 |
VolgaTelecom (ADR)(1) | | 4,300 | | | 52,976 |
| | | | | |
| | | | | 525,634 |
| SOUTH AFRICA - 6.3% | | | | | |
Edgars Consolidated Stores Limited | | 9,095 | | | 56,906 |
Ellerine Holdings Limited | | 3,733 | | | 42,195 |
Gold Fields Limited | | 4,785 | | | 88,715 |
Impala Platinum Holdings Limited | | 2,803 | | | 88,099 |
Reunert Limited | | 3,713 | | | 41,304 |
Sasol | | 3,639 | | | 121,417 |
Steinhoff International Holdings Limited | | 13,643 | | | 43,913 |
| | | | | |
| | | | | 482,549 |
| SOUTH KOREA - 14.4% | | | | | |
Daewoo Shipbuilding & Marine Engineering Co., Ltd. | | 1,570 | | | 57,657 |
GS Engineering & Construction Corp. | | 620 | | | 55,489 |
Hyundai Development Company | | 906 | | | 49,980 |
Hyundai Motor Company | | 1,552 | | | 109,042 |
Kookmin Bank | | 1,903 | | | 170,720 |
Korean Air Lines Co., Ltd. | | 1,028 | | | 40,156 |
LG Telecom Ltd.(2) | | 4,762 | | | 54,160 |
| | | | | |
| | | Shares
Held | | Value |
| | | | | |
| SOUTH KOREA (CONTINUED) | | | | | |
MegaStudy Co., Ltd. | | 287 | | $ | 50,335 |
Samsung Electronics Co., Ltd. | | 534 | | | 319,560 |
Shinhan Financial Group Co., Ltd. | | 1,970 | | | 113,074 |
Shinsegae Co., Ltd. | | 133 | | | 76,339 |
| | | | | |
| | | | | 1,096,512 |
| TAIWAN - 12.1% | | | | | |
Acer Inc. | | 42,160 | | | 80,901 |
AU Optronics Corp. | | 43,000 | | | 61,462 |
Cathay Financial Holding Co., Ltd. | | 46,088 | | | 95,680 |
Chinatrust Financial Holding Company Ltd. | | 100,440 | | | 78,459 |
Far Eastern Textile Ltd. | | 86,740 | | | 74,704 |
Hon Hai Precision Industry Co., Ltd. (Foxconn) | | 23,800 | | | 159,664 |
Taishin Financial Holdings Co., Ltd.(2) | | 209,000 | | | 107,367 |
Taiwan Fertilizer Co., Ltd. | | 24,000 | | | 39,889 |
Taiwan Semiconductor Manufacturing Company Ltd. | | 110,000 | | | 225,704 |
| | | | | |
| | | | | 923,830 |
| THAILAND - 3.2% | | | | | |
Bumrungrad Hospital Public Company Limited (NVDR) | | 33,700 | | | 38,263 |
Krung Thai Bank Public Company Limited (NVDR)(2) | | 151,200 | | | 52,257 |
The Siam Cement Public Company Limited (NVDR) | | 6,700 | | | 45,164 |
Siam Commercial Bank Public Company Limited (NVDR) | | 31,200 | | | 60,600 |
Total Access Communication Public Company Limited(2) | | 9,600 | | | 43,392 |
| | | | | |
| | | | | 239,676 |
| TURKEY - 4.3% | | | | | |
Akcansa Cimento A.S.(2) | | 6,042 | | | 37,762 |
Tofas Turk Otomobil Fabrikasi AS | | 11,318 | | | 43,093 |
Tupras-Turkiye Petrol Rafinerileri A.S. | | 3,032 | | | 67,523 |
Turk Sise ve Cam Fabrikalari AS (Sisecam)(2) | | 11,411 | | | 43,447 |
Turkcell Iletisim Hizmetleri AS (Turkcell) | | 12,170 | | | 62,074 |
Turkiye Garanti Bankasi A.S. (Unit) | | 16,170 | | | 72,602 |
| | | | | |
| | | | | 326,501 |
| UNITED KINGDOM - 1.0% | | | | | |
Anglo American PLC | | 1,413 | | | 74,436 |
| | | | | |
Total common and preferred stocks
(Cost $6,231,268) | | | | | 7,504,056 |
11
| | | | | | | |
| | | Par
Amount | | Value | |
| SHORT-TERM INVESTMENTS (CASH EQUIVALENTS) - 1.8% | | | | | | | |
Repurchase agreement with State
Street Bank and Trust Company,
5.00%, dated 3/30/07, due
4/2/07, maturity value
$137,057, collateralized by
$142,275 market value
Federal National Mortgage
Association Note,
5.625%, due 11/15/21
(Cost $137,000) | | $ | 137,000 | | $ | 137,000 | |
| | | | | | | |
| | | | | | | |
Total investments - 100.3%
(Cost $6,368,268) | | | | | | 7,641,056 | |
| | | | | | | |
Other assets less liabilities - (0.3%) | | | | | | (26,178 | ) |
| | | | | | | |
| | | | | | | |
Total net assets - 100.0%(3) | | | | | $ | 7,614,878 | |
| | | | | | | |
(1) | Valued at a fair value in accordance with procedures established by the Board of Directors of Artisan Funds. In total, securities valued at a fair value were $636,840 or 8.4% of total net assets. |
(2) | Non-income producing security. |
(3) | Percentages for the various classifications relate to total net assets. |
Security names may not represent the legal name of the entity.
(ADR) American Depository Receipt
(GDR) Global Depository Receipt
(NVDR) Non-Voting Depository Receipt
| | | | | | | |
| PORTFOLIO DIVERSIFICATION - MARCH 31, 2007 (Unaudited) | |
| | | Value | | | Percentage
of Total
Net Assets | |
Consumer Discretionary | | $ | 854,315 | | | 11.2 | % |
Consumer Staples | | | 600,279 | | | 7.9 | |
Energy | | | 766,833 | | | 10.1 | |
Financials | | | 1,277,033 | | | 16.8 | |
Healthcare | | | 363,287 | | | 4.8 | |
Industrials | | | 862,830 | | | 11.3 | |
Information Technology | | | 949,131 | | | 12.5 | |
Materials | | | 917,713 | | | 12.0 | |
Telecommunication Services | | | 816,707 | | | 10.7 | |
Utilities | | | 95,928 | | | 1.2 | |
| | | | | | | |
Total common and preferred stocks | | | 7,504,056 | | | 98.5 | |
Short-term investments | | | 137,000 | | | 1.8 | |
| | | | | | | |
Total investments | | | 7,641,056 | | | 100.3 | |
Other assets less liabilities | | | (26,178 | ) | | (0.3 | ) |
| | | | | | | |
Total net assets | | $ | 7,614,878 | | | 100.0 | % |
| | | | | | | |
| | | | | | |
| CURRENCY EXPOSURE - MARCH 31, 2007 (Unaudited) | |
| | | Value | | Percentage
of Total
Investments | |
Brazilian real | | $ | 1,088,384 | | 14.2 | % |
British pound | | | 114,109 | | 1.5 | |
Chilean peso | | | 59,526 | | 0.8 | |
Colombian peso | | | 40,014 | | 0.5 | |
Egyptian pound | | | 295,034 | | 3.9 | |
Euro | | | 39,005 | | 0.5 | |
Hong Kong dollar | | | 723,348 | | 9.5 | |
Indian rupee | | | 359,906 | | 4.7 | |
Indonesian rupiah | | | 85,816 | | 1.1 | |
Israeli shekel | | | 214,462 | | 2.8 | |
Mexican peso | | | 479,777 | | 6.3 | |
Pakistani rupee | | | 33,944 | | 0.4 | |
Philippine peso | | | 47,098 | | 0.6 | |
Polish zloty | | | 57,705 | | 0.8 | |
South African rand | | | 482,549 | | 6.3 | |
South Korean won | | | 1,096,512 | | 14.3 | |
Taiwan dollar | | | 923,830 | | 12.1 | |
Thai baht | | | 196,284 | | 2.6 | |
Turkish lira | | | 326,501 | | 4.3 | |
US dollar | | | 977,252 | | 12.8 | |
| | | | | | |
Total investments | | $ | 7,641,056 | | 100.0 | |
| | | | | | |
The accompanying notes are an integral part of the financial statements.
12
ARTISAN INTERNATIONAL FUND
Schedule of Investments – March 31, 2007 (Unaudited)
| | | | | |
| | | Shares
Held | | Value |
| | | | | |
COMMON AND
PREFERRED STOCKS - 98.5% | | | | | |
| | | | | |
| AUSTRALIA - 2.1% | | | | | |
Publishing & Broadcasting Limited | | 20,919,713 | | $ | 335,983,921 |
| | | | | |
| AUSTRIA - 1.0% | | | | | |
Wiener Staedtische Versicherung AG | | 2,241,674 | | | 159,010,094 |
| | | | | |
| BELGIUM - 2.0% | | | | | |
Dexia SA | | 2,430,313 | | | 72,527,565 |
Fortis | | 5,560,111 | | | 253,871,085 |
Umicore | | 9,380 | | | 1,667,780 |
| | | | | |
| | | | | 328,066,430 |
| BRAZIL - 0.3% | | | | | |
Vivo Participacoes S.A., Preferred (ADR) | | 13,530,268 | | | 47,491,241 |
| | | | | |
| CANADA - 0.9% | | | | | |
Nortel Networks Corporation(1) | | 6,278,900 | | | 151,007,545 |
| | | | | |
| CHINA - 7.1% | | | | | |
China Construction Bank | | 124,150,000 | | | 70,865,681 |
China Life Insurance Co., Limited, Series H | | 57,212,500 | | | 164,750,912 |
China Merchants Holdings International Company Limited | | 38,801,000 | | | 163,874,448 |
China Mobile Ltd. | | 20,342,700 | | | 185,111,150 |
China Netcom Group Corporation (Hong Kong) Limited | | 49,380,100 | | | 129,240,807 |
China Resources Enterprise Ltd | | 17,826,200 | | | 59,432,074 |
China Resources Land Limited | | 69,382,300 | | | 83,470,099 |
China Unicom Limited | | 188,297,500 | | | 271,354,687 |
Denway Motors Limited | | 19,166,100 | | | 8,364,549 |
Tencent Holdings Limited | | 2,569,600 | | | 8,386,101 |
| | | | | |
| | | | | 1,144,850,508 |
| DENMARK - 0.3% | | | | | |
A P Moeller - Maersk A/S, Series B | | 5,176 | | | 54,008,014 |
| | | | | |
| FINLAND - 2.2% | | | | | |
Fortum Oyj(2) | | 11,871,479 | | | 346,191,407 |
| | | | | |
| FRANCE - 11.3% | | | | | |
Alstom(1) | | 1,581,586 | | | 205,254,807 |
Bouygues SA | | 5,108,002 | | | 394,740,913 |
Carrefour SA | | 3,790,879 | | | 277,256,518 |
Electricite de France (EDF) | | 3,222,197 | | | 270,142,393 |
| | | | | |
| | | Shares
Held | | Value |
| | | | | |
| FRANCE (CONTINUED) | | | | | |
LVMH Moet Hennessy Louis Vuitton SA | | 2,158,767 | | $ | 239,498,681 |
Technip SA | | 2,626,443 | | | 192,688,692 |
Vinci SA | | 1,521,641 | | | 235,832,026 |
| | | | | |
| | | | | 1,815,414,030 |
| GERMANY - 10.0% | | | | | |
Allianz SE | | 1,972,290 | | | 404,977,238 |
Bayerische Motoren Werke (BMW) AG | | 827,391 | | | 48,819,791 |
DaimlerChrysler AG | | 1,992,255 | | | 163,407,135 |
Deutsche Post AG | | 6,267,158 | | | 189,709,146 |
E.ON AG | | 1,017,700 | | | 138,369,363 |
Fraport AG | | 2,254,345 | | | 164,667,012 |
IVG Immobilien AG | | 1,241,382 | | | 59,450,064 |
Linde AG | | 562,961 | | | 60,651,340 |
RWE AG | | 1,624,498 | | | 171,849,093 |
United Internet AG | | 1,852,470 | | | 36,005,753 |
Wacker Chemie AG(1) | | 1,027,445 | | | 178,426,622 |
| | | | | |
| | | | | 1,616,332,557 |
| HONG KONG - 4.9% | | | | | |
The Bank of East Asia, Ltd. | | 5,012,300 | | | 29,155,825 |
Hutchison Whampoa Limited | | 19,473,800 | | | 187,173,786 |
MTR Corporation Limited | | 27,340,800 | | | 68,443,853 |
NWS Holdings Limited | | 38,262,246 | | | 103,570,295 |
Sun Hung Kai Properties Limited | | 18,813,400 | | | 217,424,972 |
Swire Pacific Limited, A Shares | | 17,048,177 | | | 191,242,428 |
| | | | | |
| | | | | 797,011,159 |
| ITALY - 3.7% | | | | | |
Hera SpA | | 7,168,780 | | | 30,165,708 |
Intesa Sanpaolo | | 16,518,998 | | | 125,450,353 |
Mediobanca S.p.A. | | 5,196,386 | | | 115,716,349 |
Telecom Italia S.p.A. - RNC | | 22,702,705 | | | 56,136,036 |
UniCredito Italiano SpA | | 29,060,970 | | | 276,600,330 |
| | | | | |
| | | | | 604,068,776 |
| JAPAN - 12.8% | | | | | |
Chugai Pharmaceutical Co., Ltd. | | 5,895,900 | | | 149,098,625 |
Credit Saison Co., Ltd.(3) | | 9,332,200 | | | 307,272,030 |
JAPAN TOBACCO INC. | | 52,487 | | | 257,891,828 |
Jupiter Telecommunications Co., Ltd.(1) | | 227,341 | | | 190,994,221 |
KEYENCE CORPORATION | | 252,850 | | | 57,054,324 |
KUBOTA CORPORATION | | 3,224,900 | | | 28,269,872 |
Mitsubishi Estate Company Ltd. | | 4,657,400 | | | 152,954,328 |
Mitsubishi Heavy Industries, Ltd. | | 53,478,200 | | | 345,811,171 |
Mitsui Fudosan Co., Ltd. | | 4,213,900 | | | 123,727,885 |
13
| | | | | |
| | | Shares
Held | | Value |
| | | | | |
| JAPAN (CONTINUED) | | | | | |
Mizuho Financial Group, Inc. | | 10,399 | | $ | 66,979,303 |
NTT Data Corporation | | 21,083 | | | 107,168,338 |
ORIX Corporation | | 1,091,970 | | | 284,483,019 |
| | | | | |
| | | | | 2,071,704,944 |
| LUXEMBOURG - 0.6% | | | | | |
RTL Group | | 772,286 | | | 92,849,248 |
| | | | | |
| MEXICO - 2.2% | | | | | |
Grupo Televisa S.A. (ADR) | | 8,131,029 | | | 242,304,664 |
Wal-Mart de Mexico SA de CV | | 27,476,200 | | | 117,315,091 |
| | | | | |
| | | | | 359,619,755 |
| NETHERLANDS - 3.1% | | | | | |
ASML Holding N.V.(1) | | 10,238,656 | | | 252,893,451 |
ASML Holding N.V., NY Shares(1) | | 620,474 | | | 15,356,732 |
ING Groep N.V. | | 4,295,360 | | | 181,606,338 |
Unilever NV CVA | | 1,467,933 | | | 42,748,457 |
| | | | | |
| | | | | 492,604,978 |
| NORWAY - 1.3% | | | | | |
Renewable Energy Corp AS(1) | | 2,322,800 | | | 52,545,120 |
SeaDrill Ltd.(1) | | 9,982,405 | | | 164,230,212 |
| | | | | |
| | | | | 216,775,332 |
| PORTUGAL - 0.1% | | | | | |
Sonae, S.G.P.S., S.A. | | 6,014,294 | | | 13,577,790 |
| | | | | |
| RUSSIA - 3.6% | | | | | |
LUKOIL (ADR) | | 3,139,682 | | | 271,582,493 |
NovaTek OAO (GDR) | | 872,583 | | | 50,609,814 |
OAO TMK (GDR)(1)(4) | | 1,059,675 | | | 35,605,080 |
RAO Unified Energy System (UES)(GDR) | | 1,640,060 | | | 223,458,175 |
| | | | | |
| | | | | 581,255,562 |
| SINGAPORE - 1.0% | | | | | |
Singapore Airlines Limited | | 15,385,400 | | | 168,340,401 |
| | | | | |
| SOUTH AFRICA - 0.6% | | | | | |
MTN Group Limited | | 6,571,374 | | | 89,224,666 |
| | | | | |
| SOUTH KOREA - 5.5% | | | | | |
Hana Financial Group Inc. | | 3,928,484 | | | 203,355,836 |
Kookmin Bank | | 3,603,853 | | | 323,304,840 |
NHN Corp.(1) | | 1,013,266 | | | 148,629,579 |
Shinhan Financial Group Co., Ltd. | | 3,628,338 | | | 208,259,196 |
| | | | | |
| | | | | 883,549,451 |
| SPAIN - 2.2% | | | | | |
Bolsas y Mercados Espanoles | | 177,172 | | | 8,683,614 |
Gamesa Corporacion Tecnologica, S.A. (Gamesa) | | 4,908,680 | | | 177,701,761 |
Industria de Diseno Textil, S.A. (Inditex) | | 2,733,417 | | | 169,901,285 |
| | | | | |
| | | | | 356,286,660 |
| | | | | | |
| | | Shares
Held | | Value |
| | | | | | |
| SWITZERLAND - 11.6% | | | | | | |
Adecco SA | | | 2,808,659 | | $ | 178,322,052 |
Nestle SA | | | 999,674 | | | 389,331,128 |
Novartis AG | | | 3,138,997 | | | 180,050,274 |
Roche Holding AG | | | 228,776 | | | 44,375,183 |
Roche Holding AG - Genussscheine | | | 1,413,621 | | | 250,116,047 |
Swiss Re | | | 3,447,086 | | | 314,880,094 |
UBS AG | | | 8,550,066 | | | 508,015,278 |
| | | | | | |
| | | | | | 1,865,090,056 |
| | | | | | |
| TAIWAN - 0.6% | | | | | | |
Taiwan Semiconductor Manufacturing Company Ltd. (ADR) | | | 8,586,138 | | | 92,300,984 |
| | | | | | |
| UNITED KINGDOM - 7.5% | | | | | | |
Barclays PLC | | | 10,032,195 | | | 142,338,722 |
British Sky Broadcasting Group plc | | | 6,194,112 | | | 68,746,405 |
Cadbury Schweppes PLC | | | 12,066,733 | | | 154,820,737 |
Carnival PLC | | | 1,496,098 | | | 72,100,896 |
Kingfisher PLC | | | 28,473,347 | | | 155,906,968 |
Lloyds TSB Group plc | | | 15,873,850 | | | 174,929,128 |
National Grid PLC | | | 11,487,375 | | | 180,278,245 |
Vodafone Group Plc | | | 3,391,251 | | | 9,042,553 |
William Morrison Supermarkets PLC | | | 42,657,451 | | | 259,175,353 |
| | | | | | |
| | | | | | 1,217,339,007 |
| | | | | | |
Total common and preferred stocks (Cost $11,221,220,267) | | | 15,899,954,516 |
| | | Par
Amount | | |
| SHORT-TERM INVESTMENTS (CASH EQUIVALENTS) - 0.9% | | | | | | |
| Repurchase agreement with Fixed Income Clearing Corporation, 5.00%, dated 3/30/07, due 4/2/07, maturity value $149,644,326, collateralized by $68,050,275 market value Federal National Mortgage Association Note, 6.30%, due 12/21/26, and $84,525,000 market value Federal National Mortgage Association Note, 6.625%, due 11/15/30 (Cost $149,582,000) | | $ | 149,582,000 | | | 149,582,000 |
| | | | | | |
| | | | | | |
Total investments - 99.4% (Cost $11,370,802,267) | | | | | | 16,049,536,516 |
| | | | | | |
Other assets less liabilities - 0.6% | | | 90,537,515 |
| | | | | | |
| | | | | | |
Total net assets - 100.0%(5) | | | | | $ | 16,140,074,031 |
| | | | | | |
14
(1) | Non-income producing security. |
(2) | 11,500,000 shares of the security, with a value of $335,358,482, were on loan at March 31, 2007. |
(3) | Affiliated company as defined by the Investment Company Act of 1940. See Note (6) in Notes to Financial Statements. |
(4) | Valued at a fair value in accordance with procedures established by the Board of Directors of Artisan Funds. In total, securities valued at a fair value were $35,605,080 or 0.2% of total net assets. |
(5) | Percentages for the various classifications relate to total net assets. |
Security names may not represent the legal name of the entity.
(ADR) American Depository Receipt
(GDR) Global Depository Receipt
| | | | | | |
PORTFOLIO DIVERSIFICATION - MARCH 31, 2007 (Unaudited) | |
| | | Value | | Percentage
of Total
Net Assets | |
Consumer Discretionary | | $ | 1,848,309,838 | | 11.4 | % |
Consumer Staples | | | 1,498,539,112 | | 9.3 | |
Energy | | | 679,111,211 | | 4.2 | |
Financials | | | 5,225,302,606 | | 32.4 | |
Healthcare | | | 623,640,129 | | 3.9 | |
Industrials | | | 2,320,161,514 | | 14.4 | |
Information Technology | | | 921,347,927 | | 5.7 | |
Materials | | | 240,745,742 | | 1.5 | |
Telecommunication Services | | | 1,182,342,053 | | 7.3 | |
Utilities | | | 1,360,454,384 | | 8.4 | |
| | | | | | |
Total common and preferred stocks | | | 15,899,954,516 | | 98.5 | |
Short-term investments | | | 149,582,000 | | 0.9 | |
| | | | | | |
Total investments | | | 16,049,536,516 | | 99.4 | |
Other assets less liabilities | | | 90,537,515 | | 0.6 | |
| | | | | | |
Total net assets | | $ | 16,140,074,031 | | 100.0 | % |
| | | | | | |
| | | | | | |
| CURRENCY EXPOSURE - MARCH 31, 2007 (Unaudited) | |
| | | Value | | Percentage
of Total Investments | |
Australian dollar | | $ | 335,983,921 | | 2.1 | % |
British pound | | | 1,217,339,007 | | 7.6 | |
Danish krone | | | 54,008,014 | | 0.3 | |
Euro | | | 5,809,045,238 | | 36.2 | |
Hong Kong dollar | | | 1,941,861,667 | | 12.1 | |
Japanese yen | | | 2,071,704,944 | | 12.9 | |
Mexican peso | | | 117,315,091 | | 0.7 | |
Norwegian krone | | | 216,775,332 | | 1.4 | |
Singapore dollar | | | 168,340,401 | | 1.0 | |
South African rand | | | 89,224,666 | | 0.6 | |
South Korean won | | | 883,549,451 | | 5.5 | |
Swiss franc | | | 1,865,090,056 | | 11.6 | |
US dollar | | | 1,279,298,728 | | 8.0 | |
| | | | | | |
Total investments | | $ | 16,049,536,516 | | 100.0 | % |
| | | | | | |
The accompanying notes are an integral part of the financial statements.
15
ARTISAN INTERNATIONAL VALUE FUND
Schedule of Investments – March 31, 2007 (Unaudited)
| | | | | |
| | | Shares
Held | | Value |
| | | | | |
| COMMON STOCKS - 90.1% | | | | | |
| | | | | |
| BERMUDA - 1.2% | | | | | |
Lancashire Holdings Ltd(1) | | 3,622,158 | | $ | 24,163,449 |
| | | | | |
| CANADA - 2.8% | | | | | |
CanWest Global Communications Corp.(1) | | 5,991,900 | | | 57,401,831 |
| | | | | |
| FRANCE - 3.1% | | | | | |
Gemalto NV(1) | | 81,027 | | | 1,869,304 |
Sanofi-Aventis | | 360,718 | | | 31,369,422 |
Vivendi | | 744,289 | | | 30,245,344 |
| | | | | |
| | | | | 63,484,070 |
| GERMANY - 7.7% | | | | | |
Bayerische Motoren Werke (BMW) AG | | 340,644 | | | 20,099,528 |
Heidelberger Druckmaschinen AG | | 1,333,367 | | | 61,094,419 |
Pfeiffer Vacuum Technology AG(2) | | 822,027 | | | 74,824,863 |
| | | | | |
| | | | | 156,018,810 |
| HONG KONG - 3.3% | | | | | |
Guoco Group Limited | | 3,183,600 | | | 44,778,606 |
Pacific Century Premium Developments Limited | | 68,766,900 | | | 21,738,561 |
| | | | | |
| | | | | 66,517,167 |
| JAPAN - 14.4% | | | | | |
ACOM CO., LTD | | 449,570 | | | 19,113,592 |
Central Japan Railway Company | | 4,092 | | | 46,531,568 |
MEITEC CORPORATION(2) | | 1,832,900 | | | 59,105,737 |
SANKYO CO., LTD. | | 1,204,500 | | | 52,947,301 |
Sekisui House, Ltd. | | 3,199,700 | | | 49,798,454 |
TAKEFUJI CORPORATION | | 569,340 | | | 22,852,836 |
UNI-CHARM CORPORATION | | 665,200 | | | 42,111,270 |
| | | | | |
| | | | | 292,460,758 |
| MEXICO - 4.2% | | | | | |
Grupo Modelo, S.A. de C.V., Series C | | 7,861,200 | | | 40,273,672 |
Kimberly-Clark de Mexico, S.A. de C.V., Class A | | 9,840,700 | | | 43,906,822 |
| | | | | |
| | | | | 84,180,494 |
| | | | | |
| | | Shares
Held | | Value |
| NETHERLANDS - 4.5% | | | | | |
Wolters Kluwer NV | | 3,008,566 | | $ | 90,266,585 |
| | | | | |
| SOUTH KOREA - 3.4% | | | | | |
Honam Petrochemical Corporation | | 96,747 | | | 8,381,038 |
Lotte Chilsung Beverage Co., Ltd. | | 14,600 | | | 18,637,968 |
Lotte Confectionery Co., Ltd. | | 7,705 | | | 9,868,755 |
SK Telecom Co., Ltd. (ADR) | | 1,364,100 | | | 31,947,222 |
| | | | | |
| | | | | 68,834,983 |
| SWITZERLAND - 8.7% | | | | | |
Adecco SA | | 1,103,156 | | | 70,039,489 |
Givaudan SA | | 66,441 | | | 61,457,173 |
Panalpina Welttransport Holding AG | | 26,831 | | | 4,488,946 |
Pargesa Holding SA | | 281,483 | | | 29,534,693 |
Tamedia AG | | 81,060 | | | 11,006,789 |
| | | | | |
| | | | | 176,527,090 |
| UNITED KINGDOM - 28.7% | | | | | |
Benfield Group Plc | | 10,716,586 | | | 68,379,870 |
Carpetright PLC | | 1,040,855 | | | 23,821,098 |
Diageo PLC | | 5,073,939 | | | 102,792,972 |
Experian Group Ltd. | | 3,332,696 | | | 38,398,515 |
Galiform Plc(1) | | 23,637,823 | | | 72,448,161 |
Home Retail Group | | 5,939,371 | | | 51,893,774 |
Signet Group PLC | | 24,663,421 | | | 60,910,039 |
SurfControl PLC(1)(2) | | 1,871,963 | | | 17,497,770 |
Unilever PLC (ADR) | | 1,586,816 | | | 47,715,557 |
Vitec Group PLC | | 1,316,870 | | | 15,392,926 |
Vodafone Group PLC (ADR) | | 3,014,468 | | | 80,968,611 |
| | | | | |
| | | | | 580,219,293 |
| UNITED STATES - 8.1% | | | | | |
Arch Capital Group Ltd.(1) | | 312,336 | | | 21,304,439 |
Tyco International Ltd. | | 3,125,300 | | | 98,603,215 |
Willis Group Holdings Limited | | 1,108,500 | | | 43,874,430 |
| | | | | |
| | | | | 163,782,084 |
| | | | | |
Total common stocks
(Cost $1,532,753,477) | | | | | 1,823,856,614 |
16
| | | | | | |
| | | Par
Amount | | Value |
| SHORT-TERM INVESTMENTS (CASH EQUIVALENTS) - 9.0% | | | | | | |
Repurchase agreement with Fixed Income Clearing Corporation, 5.00%, dated 3/30/07, due 4/2/07, maturity value $183,032,232, collateralized by $28,556,625 market value Federal Home Loan Bank Note, 5.625%, due 3/14/36, and $158,061,000 market value Federal National Mortgage Association Note,
6.00%, due 4/18/36
(Cost $182,956,000) | | $ | 182,956,000 | | $ | 182,956,000 |
| | | | | | |
| | | | | | |
Total investments - 99.1%
(Cost $1,715,709,477) | | | | | | 2,006,812,614 |
| | | | | | |
Other assets less liabilities - 0.9% | | | | | | 17,683,205 |
| | | | | | |
| | | | | | |
Total net assets - 100.0%(3) | | | | | $ | 2,024,495,819 |
| | | | | | |
(1) | Non-income producing security. |
(2) | Affiliated company as defined by the Investment Company Act of 1940. See Note (6) in Notes to Financial Statements. |
(3) | Percentages for the various classifications relate to total net assets. |
Security names may not represent the legal name of the entity.
(ADR) American Depository Receipt
| | | | | | |
| PORTFOLIO DIVERSIFICATION - MARCH 31, 2007 (Unaudited) | |
| | | Value | | Percentage
of Total
Net Assets | |
Consumer Discretionary | | $ | 536,231,830 | | 26.5 | % |
Consumer Staples | | | 305,307,016 | | 15.1 | |
Financials | | | 295,740,476 | | 14.6 | |
Healthcare | | | 31,369,422 | | 1.5 | |
Industrials | | | 453,086,752 | | 22.4 | |
Information Technology | | | 19,367,074 | | 1.0 | |
Materials | | | 69,838,211 | | 3.4 | |
Telecommunication Services | | | 112,915,833 | | 5.6 | |
| | | | | | |
Total common stocks | | | 1,823,856,614 | | 90.1 | |
Short-term investments | | | 182,956,000 | | 9.0 | |
| | | | | | |
Total investments | | | 2,006,812,614 | | 99.1 | |
Other assets less liabilities | | | 17,683,205 | | 0.9 | |
| | | | | | |
Total net assets | | $ | 2,024,495,819 | | 100.0 | % |
| | | | | | |
| | | | | | |
| CURRENCY EXPOSURE - MARCH 31, 2007 (Unaudited) | |
| | | Value | | Percentage
of Total
Investments | |
British pound | | $ | 475,698,574 | | 23.7 | % |
Canadian dollar | | | 57,401,831 | | 2.9 | |
Euro | | | 309,769,465 | | 15.4 | |
Hong Kong dollar | | | 66,517,167 | | 3.3 | |
Japanese yen | | | 292,460,758 | | 14.6 | |
Mexican peso | | | 84,180,494 | | 4.2 | |
South Korean won | | | 36,887,761 | | 1.8 | |
Swiss franc | | | 176,527,090 | | 8.8 | |
US dollar | | | 507,369,474 | | 25.3 | |
| | | | | | |
Total investments | | $ | 2,006,812,614 | | 100.0 | % |
| | | | | | |
The accompanying notes are an integral part of the financial statements.
17
ARTISAN MID CAP FUND
Schedule of Investments – March 31, 2007 (Unaudited)
| | | | | |
| | | Shares Held | | Value |
| | | | | |
| COMMON STOCKS - 97.8% | | | | | |
| | | | | |
| AUTO & TRANSPORTATION - 3.5% | | | |
Air Transport - 1.2% | | | | | |
Southwest Airlines Co. | | 4,136,600 | | $ | 60,808,020 |
| | | | | |
Auto Parts: Original Equipment - 1.2% | | | |
BorgWarner Inc. | | 864,000 | | | 65,162,880 |
| | | | | |
Transportation Miscellaneous - 1.1% | | | |
C.H. Robinson Worldwide, Inc. | | 756,000 | | | 36,099,000 |
Expeditors International of Washington, Inc. | | 571,900 | | | 23,630,908 |
| | | | | |
| | | | | 59,729,908 |
| CONSUMER DISCRETIONARY - 18.6% | | | |
Advertising Agencies - 1.3% | | | |
Clear Channel Outdoor Holdings, Inc., Class A(1) | | 1,820,300 | | | 47,892,093 |
Focus Media Holding Limited (ADR)(1)(2) | | 282,600 | | | 22,172,796 |
| | | | | |
| | | | | 70,064,889 |
Cable Television Services - 0.3% | | | |
TiVo Inc.(1) | | 2,057,100 | | | 13,062,585 |
| | | | | |
Consumer Electronics - 6.6% | | | |
Electronic Arts Inc.(1) | | 4,527,900 | | | 228,025,044 |
Harman International Industries, Incorporated | | 367,500 | | | 35,309,400 |
VeriSign, Inc.(1) | | 1,118,400 | | | 28,094,208 |
Yahoo! Inc.(1) | | 1,875,000 | | | 58,668,750 |
| | | | | |
| | | | | 350,097,402 |
Radio & TV Broadcasters - 0.5% | | | |
XM Satellite Radio Holdings Inc.(1) | | 2,068,900 | | | 26,730,188 |
| | | | | |
Restaurants - 0.8% | | | | | |
YUM! Brands, Inc. | | 751,500 | | | 43,406,640 |
| | | | | |
Retail - 5.8% | | | | | |
Amazon.com, Inc.(1) | | 2,130,200 | | | 84,760,658 |
Chico’s FAS, Inc.(1) | | 5,692,268 | | | 139,062,107 |
Kohl’s Corporation(1) | | 540,700 | | | 41,423,027 |
The TJX Companies, Inc. | | 1,451,500 | | | 39,132,440 |
| | | | | |
| | | | | 304,378,232 |
Services: Commercial - 1.0% | | | |
Iron Mountain Incorporated(1) | | 1,515,450 | | | 39,598,708 |
Robert Half International Inc. | | 357,505 | | | 13,231,260 |
| | | | | |
| | | | | 52,829,968 |
| | | | | |
| | | Shares Held | | Value |
| | | | | |
| CONSUMER DISCRETIONARY - (CONTINUED) | | | |
Textiles Apparel Manufacturers - 1.8% | | | |
Polo Ralph Lauren Corporation, Class A | | 944,100 | | $ | 83,222,415 |
Quiksilver, Inc.(1) | | 1,155,300 | | | 13,401,480 |
| | | | | |
| | | | | 96,623,895 |
Toys - 0.5% | | | | | |
Marvel Entertainment, Inc.(1) | | 1,038,600 | | | 28,821,150 |
| | | | | |
| CONSUMER STAPLES - 3.9% | | | |
Beverage: Soft Drinks - 1.8% | | | |
Hansen Natural Corporation(1) | | 2,519,900 | | | 95,453,812 |
| | | | | |
Drug & Grocery Store Chains - 2.1% | | | |
Supervalu Inc. | | 2,837,700 | | | 110,868,939 |
| | | | | |
| FINANCIAL SERVICES - 14.6% | | | |
Banks: Outside New York City - 2.3% | | | |
Investors Financial Services Corp. | | 886,000 | | | 51,520,900 |
Northern Trust Corporation | | 878,100 | | | 52,808,934 |
UCBH Holdings, Inc. | | 914,600 | | | 17,029,852 |
| | | | | |
| | | | | 121,359,686 |
Diversified Financial Services - 1.5% | | | |
CB Richard Ellis Group, Inc.(1) | | 1,464,000 | | | 50,039,520 |
Greenhill & Co., Inc. | | 512,000 | | | 31,431,680 |
| | | | | |
| | | | | 81,471,200 |
Financial Data Processing Services & Systems - 4.1% | | | | | |
Alliance Data Systems Corporation(1) | | 1,509,800 | | | 93,033,876 |
Global Payments Inc. | | 674,500 | | | 22,973,470 |
Paychex, Inc. | | 532,100 | | | 20,150,627 |
The Western Union Company | | 3,589,500 | | | 78,789,525 |
| | | | | |
| | | | | 214,947,498 |
Financial Information Services - 1.6% | | | |
Equifax Inc. | | 2,317,800 | | | 84,483,810 |
| | | | | |
Financial Miscellaneous - 2.5% | | | |
MGIC Investment Corporation | | 2,275,400 | | | 134,066,568 |
| | | | | |
Insurance: Multi-Line - 1.4% | | | |
Aon Corporation | | 733,600 | | | 27,847,456 |
CIGNA Corporation | | 318,800 | | | 45,480,008 |
| | | | | |
| | | | | 73,327,464 |
18
| | | | | |
| | | Shares Held | | Value |
| | | | | |
| FINANCIAL SERVICES (CONTINUED) | | | |
Securities Brokerage & Services - 1.2% | | | |
The Bear Stearns Companies Inc. | | 172,000 | | $ | 25,860,200 |
Investment Technology Group, Inc.(1) | | 1,018,500 | | | 39,925,200 |
| | | | | |
| | | | | 65,785,400 |
| HEALTHCARE - 19.5% | | | |
Biotechnology Research & Production -0.6% | | | |
Celgene Corporation(1) | | 561,200 | | | 29,440,552 |
| | | | | |
Drugs & Pharmaceuticals - 6.0% | | | |
Allergan, Inc. | | 1,317,800 | | | 146,038,596 |
Barr Pharmaceuticals, Inc.(1) | | 249,300 | | | 11,555,055 |
MedImmune, Inc.(1) | | 4,422,300 | | | 160,927,497 |
| | | | | |
| | | | | 318,521,148 |
Electronics: Medical Systems - 2.7% | | | |
Intuitive Surgical, Inc.(1) | | 662,200 | | | 80,503,654 |
Varian Medical Systems, Inc.(1) | | 1,332,500 | | | 63,546,925 |
| | | | | |
| | | | | 144,050,579 |
Health Care Management Services - 1.2% | | | | | |
Cerner Corporation(1) | | 1,153,500 | | | 62,808,075 |
| | | | | |
Health Care Services - 0.9% | | | |
Express Scripts, Inc.(1) | | 556,700 | | | 44,936,824 |
| | | | | |
Medical & Dental Instruments & Supplies - 8.1% | | | | | |
Gen-Probe Incorporated(1) | | 740,100 | | | 34,843,908 |
Patterson Companies, Inc.(1) | | 2,593,600 | | | 92,046,864 |
Thermo Fisher Scientific, Inc.(1) | | 5,045,300 | | | 235,867,775 |
Ventana Medical Systems, Inc.(1) | | 1,532,100 | | | 64,194,990 |
| | | | | |
| | | | | 426,953,537 |
| MATERIALS & PROCESSING - 7.4% | | | |
Agriculture Fishing & Ranching - 1.7% | | | |
Bunge Limited | | 1,077,500 | | | 88,592,050 |
| | | | | |
Chemicals - 1.6% | | | |
Ecolab Inc. | | 1,346,200 | | | 57,886,600 |
Energy Conversion Devices, Inc.(1) | | 742,900 | | | 25,956,926 |
| | | | | |
| | | | | 83,843,526 |
Diversified Materials & Processing - 0.8% | | | |
Hexcel Corporation(1) | | 2,074,100 | | | 41,170,885 |
| | | | | |
Engineering & Contracting Services - 0.7% | | | |
Quanta Services, Inc.(1) | | 1,548,600 | | | 39,055,692 |
| | | | | |
Metal Fabricating - 1.8% | | | |
Precision Castparts Corp. | | 890,200 | | | 92,625,310 |
| | | | | |
Real Estate - 0.8% | | | |
The St. Joe Company | | 847,000 | | | 44,306,570 |
| | | | | |
| | | Shares Held | | Value |
| | | | | |
| OTHER - 1.3% | | | |
Multi-Sector Companies - 1.3% | | | | | |
McDermott International, Inc.(1) | | 1,419,100 | | $ | 69,507,518 |
| | | | | |
| OTHER ENERGY - 3.8% | | | | | |
Coal - 0.6% | | | | | |
CONSOL Energy Inc. | | 788,900 | | | 30,869,657 |
| | | | | |
Machinery: Oil Well Equipment & Services - 3.2% | | | |
Dresser-Rand Group Inc.(1) | | 1,811,800 | | | 55,187,428 |
Helix Energy Solutions Group, Inc.(1) | | 1,647,200 | | | 61,424,088 |
Smith International, Inc. | | 1,135,500 | | | 54,560,775 |
| | | | | |
| | | | | 171,172,291 |
Oil: Crude Producers - 0.0%(3) | | | | | |
Denbury Resources Inc.(1) | | 27,500 | | | 819,225 |
| | | | | |
| PRODUCER DURABLES - 4.0% | | | | | |
Diversified Production - 0.3% | | | | | |
Danaher Corporation | | 230,500 | | | 16,469,225 |
| | | | | |
Electrical Equipment & Components - 1.3% | | | |
Cooper Industries, Ltd., Class A | | 1,468,500 | | | 66,067,815 |
| | | | | |
Identification Control & Filter Devices -2.0% | | | | | |
ESCO Technologies Inc.(1) | | 579,800 | | | 25,986,636 |
Roper Industries, Inc. | | 1,399,400 | | | 76,799,072 |
| | | | | |
| | | | | 102,785,708 |
Machinery: Industrial/Specialty - 0.4% | | | |
Joy Global Inc. | | 433,723 | | | 18,606,717 |
| | | | | |
| TECHNOLOGY - 19.2% | | | | | |
Communications Technology - 3.1% | | | |
Ciena Corporation(1) | | 1,509,300 | | | 42,184,935 |
Corning Incorporated(1) | | 1,146,700 | | | 26,075,958 |
JDS Uniphase Corporation(1) | | 1,727,149 | | | 26,304,479 |
Juniper Networks, Inc.(1) | | 3,552,700 | | | 69,917,136 |
| | | | | |
| | | | | 164,482,508 |
Computer Services Software & Systems - 5.2% | | | |
Adobe Systems Incorporated(1) | | 758,396 | | | 31,625,113 |
Autodesk, Inc.(1) | | 1,981,300 | | | 74,496,880 |
Cadence Design Systems, Inc.(1) | | 1,548,600 | | | 32,613,516 |
NAVTEQ Corporation(1) | | 1,558,800 | | | 53,778,600 |
Red Hat, Inc.(1) | | 3,521,300 | | | 80,743,409 |
| | | | | |
| | | | | 273,257,518 |
Computer Technology - 4.2% | | | | | |
Intermec, Inc.(1)(4) | | 4,206,000 | | | 93,962,040 |
Network Appliance, Inc.(1) | | 1,644,400 | | | 60,053,488 |
SanDisk Corporation(1) | | 1,548,600 | | | 67,828,680 |
Zebra Technologies Corporation(1) | | 47,400 | | | 1,830,114 |
| | | | | |
| | | | | 223,674,322 |
19
| | | | | |
| | | Shares Held | | Value |
| | | | | |
| TECHNOLOGY (CONTINUED) | | | | | |
Electronics - 0.5% | | | | | |
Avid Technology, Inc.(1) | | 723,600 | | $ | 25,239,168 |
| | | | | |
Electronics: Semi-Conductors/Components - 4.8% | | | | | |
Analog Devices, Inc. | | 1,055,200 | | | 36,393,848 |
Broadcom Corporation, Class A(1) | | 2,115,450 | | | 67,842,482 |
Integrated Device Technology, Inc.(1) | | 2,619,400 | | | 40,391,148 |
Linear Technology Corporation | | 2,619,800 | | | 82,759,482 |
Spansion Inc., Class A(1) | | 1,937,100 | | | 23,613,249 |
| | | | | |
| | | | | 251,000,209 |
Electronics: Technology - 1.4% | | | | | |
Rockwell Automation, Inc. | | 466,900 | | | 27,953,303 |
Trimble Navigation Limited(1) | | 1,641,400 | | | 44,055,176 |
| | | | | |
| | | | | 72,008,479 |
| UTILITIES - 2.0% | | | | | |
Utilities: Telecommunications - 2.0% | | | |
Level 3 Communications, Inc.(1) | | 1,359,000 | | | 8,289,900 |
NII Holdings, Inc.(1) | | 1,341,300 | | | 99,497,634 |
| | | | | |
| | | | | 107,787,534 |
| | | | | |
Total common stocks
(Cost $4,080,492,832) | | | | | 5,163,532,776 |
| | | | | | |
| | | Par
Amount | | Value |
| SHORT-TERM INVESTMENTS (CASH EQUIVALENTS) - 1.7% | | | | | | |
Repurchase agreement with Fixed Income Clearing Corporation, 5.00%, dated 3/30/07, due 4/2/07, maturity value $88,052,673, collateralized by $89,781,188 market value Federal National Mortgage Association Note, 6.125%, due 8/17/26
(Cost $88,016,000) | | $ | 88,016,000 | | $ | 88,016,000 |
| | | | | | |
| | | | | | |
Total investments - 99.5%
(Cost $4,168,508,832) | | | | | | 5,251,548,776 |
| | | | | | |
Other assets less liabilities - 0.5% | | | | | | 26,748,187 |
| | | | | | |
| | | | | | |
Total net assets - 100.0%(5) | | | | | $ | 5,278,296,963 |
| | | | | | |
(1) | Non-income producing security. |
(2) | The Fund considers the issuer to be from China. See the Fund's Statement of Additional Information for information on how a particular country is assigned. The security trades on a U.S. exchange. |
(3) | Represents less than 0.1% of total net assets. |
(4) | Affiliated company as defined by the Investment Company Act of 1940. See Note (6) in Notes to Financial Statements. |
(5) | Percentages for the various classifications relate to total net assets. |
Security names may not represent the legal name of the entity.
(ADR) American Depository Receipt
The accompanying notes are an integral part of the financial statements.
20
[THIS PAGE INTENTIONALLY LEFT BLANK]
21
ARTISAN FUNDS, INC.
Statements of Assets and Liabilities – March 31, 2007 (Unaudited)
| | | | |
| | | EMERGING MARKETS | |
| ASSETS: | | | | |
Investments in securities, unaffiliated, at value | | $ | 7,504,056 | |
Investments in securities, affiliated, at value | | | - | |
Short-term investments (repurchase agreements), at value | | | 137,000 | |
| | | | |
Total investments | | | 7,641,056 | |
Cash | | | 692 | |
Foreign currency | | | 6,347 | |
Receivable from investments sold | | | - | |
Receivable from fund shares sold | | | - | |
Dividends and interest receivable | | | 20,721 | |
Receivable from Adviser | | | 64,622 | |
Other assets | | | - | |
| | | | |
Total assets | | | 7,733,438 | |
| |
| LIABILITIES: | | | | |
Net unrealized loss on foreign currency forward contracts | | | - | |
Payable for investments purchased | | | - | |
Payable for fund shares redeemed | | | - | |
Payable for operating expenses | | | 76,681 | |
Payable for withholding taxes | | | 6,394 | |
Payable for advisory fees | | | 35,485 | |
Payable for deferred directors’ compensation | | | - | |
| | | | |
Total liabilities | | | 118,560 | |
| | | | |
Total net assets | | $ | 7,614,878 | |
| | | | |
| NET ASSETS CONSIST OF: | | | | |
Fund shares issued and outstanding | | $ | 5,830,431 | |
Net unrealized appreciation on investments and foreign currency related transactions | | | 1,268,852 | |
Accumulated undistributed net investment loss | | | (1,377 | ) |
Accumulated undistributed net realized gains on investments and foreign currency related transactions | | | 516,972 | |
| | | | |
| | $ | 7,614,878 | |
| | | | |
| SUPPLEMENTARY INFORMATION: | | | | |
Net assets | | | | |
Investor Shares | | | | |
Institutional Shares | | $ | 7,614,878 | |
Shares outstanding (Indefinite number of shares authorized, $0.01 par value) | | | | |
Investor Shares | | | | |
Institutional Shares | | | 568,024 | |
Net asset value, offering price and redemption price per share | | | | |
Investor Shares | | | | |
Institutional Shares | | $ | 13.41 | |
Cost of securities of unaffiliated issuers held | | $ | 6,368,268 | |
Cost of securities of affiliated issuers held | | $ | - | |
Cost of foreign currency | | $ | 6,390 | |
Value of security on loan | | $ | - | |
(1) | Included in investments in securities, unaffiliated, at value, above. |
22
| | | | | | | | | | |
INTERNATIONAL | | | INTERNATIONAL VALUE | | | MID CAP | |
| | | | | | | | | | |
| $ | 15,592,682,486 | | | $ | 1,672,428,244 | | | $ | 5,069,570,736 | |
| | 307,272,030 | | | | 151,428,370 | | | | 93,962,040 | |
| | 149,582,000 | | | | 182,956,000 | | | | 88,016,000 | |
| | | | | | | | | | | |
| | 16,049,536,516 | | | | 2,006,812,614 | | | | 5,251,548,776 | |
| | 934 | | | | 984 | | | | 963 | |
| | 15,487,846 | | | | 3 | | | | - | |
| | 211,726,918 | | | | - | | | | 52,116,853 | |
| | 29,148,897 | | | | 25,982,380 | | | | 19,809,667 | |
| | 51,553,050 | | | | 6,165,544 | | | | 1,252,342 | |
| | - | | | | - | | | | - | |
| | 97,324 | | | | 7,833 | | | | 41,223 | |
| | | | | | | | | | | |
| | 16,357,551,485 | | | | 2,038,969,358 | | | | 5,324,769,824 | |
| | |
| | | | | | | | | | |
| | 367,838 | | | | 133 | | | | - | |
| | 199,457,664 | | | | 4,309,627 | | | | 23,720,522 | |
| | 7,273,821 | | | | 9,051,841 | | | | 19,076,446 | |
| | 5,720,757 | | | | 907,532 | | | | 3,634,670 | |
| | 4,560,050 | | | | 196,573 | | | | - | |
| | - | | | | - | | | | - | |
| | 97,324 | | | | 7,833 | | | | 41,223 | |
| | | | | | | | | | | |
| | 217,477,454 | | | | 14,473,539 | | | | 46,472,861 | |
| | | | | | | | | | | |
| $ | 16,140,074,031 | | | $ | 2,024,495,819 | | | $ | 5,278,296,963 | |
| | | | | | | | | | | |
| | | | | | | | | | |
| $ | 10,957,121,416 | | | $ | 1,675,572,185 | | | $ | 3,811,575,214 | |
| | 4,678,833,701 | | | | 291,144,996 | | | | 1,083,039,944 | |
| | (180,575,295 | ) | | | (6,396,072 | ) | | | (19,538,055 | ) |
| | 684,694,209 | | | | 64,174,710 | | | | 403,219,860 | |
| | | | | | | | | | | |
| $ | 16,140,074,031 | | | $ | 2,024,495,819 | | | $ | 5,278,296,963 | |
| | | | | | | | | | | |
| | | | | | | | | | |
| | | | | | | | | | |
| $ | 11,457,417,180 | | | $ | 1,891,680,891 | | | $ | 4,509,485,478 | |
| $ | 4,682,656,851 | | | $ | 132,814,928 | | | $ | 768,811,485 | |
| | | | | | | | | | |
| | 377,412,661 | | | | 66,265,556 | | | | 143,689,301 | |
| | 153,334,241 | | | | 4,650,132 | | | | 24,062,902 | |
| | | | | | | | | | |
| $ | 30.36 | | | $ | 28.55 | | | $ | 31.38 | |
| $ | 30.54 | | | $ | 28.56 | | | $ | 31.95 | |
| $ | 11,078,891,800 | | | $ | 1,595,380,870 | | | $ | 4,057,413,519 | |
| $ | 291,910,467 | | | $ | 120,328,607 | | | $ | 111,095,313 | |
| $ | 15,435,093 | | | $ | 3 | | | $ | - | |
| $ | 335,358,482 | (1) | | $ | - | | | $ | - | |
The accompanying notes are an integral part of the financial statements.
23
ARTISAN FUNDS, INC.
Statements of Operations — For the Six Months Ended March 31, 2007 (Unaudited)
| | | | |
| | | EMERGING MARKETS | |
| INVESTMENT INCOME: | | | | |
Dividends, from unaffiliated issuers(1) | | $ | 53,229 | |
Dividends, from affiliated issuers(1) | | | - | |
Interest | | | 3,073 | |
Securities lending | | | - | |
Other | | | - | |
| | | | |
Total investment income | | | 56,302 | |
| |
| EXPENSES: | | | | |
Advisory fees | | | 35,485 | |
Transfer agent fees | | | | |
Investor Shares | | | | |
Institutional Shares | | | 6,912 | |
Shareholder communications | | | | |
Investor Shares | | | | |
Institutional Shares | | | 6,033 | |
Custodian fees | | | 11,924 | |
Accounting fees | | | 15,516 | |
Professional fees | | | 17,210 | |
Registration fees | | | | |
Investor Shares | | | | |
Institutional Shares | | | 14,152 | |
Directors’ fees | | | 3,000 | |
Other operating expenses | | | 2,104 | |
| | | | |
Total operating expenses before amounts waived or paid by the Adviser or the Board of Directors | | | 112,336 | |
| | | | |
Less amounts waived or paid by the Adviser or Board of Directors | | | (64,622 | ) |
| | | | |
Net Expenses | | | 47,714 | |
| | | | |
Net investment income (loss) | | | 8,588 | |
| |
| NET REALIZED AND UNREALIZED GAINS (LOSSES) ON INVESTMENTS: | | | | |
Net realized gain (loss) on: | | | | |
Investments(1) | | | 568,493 | |
Foreign currency related transactions | | | (12,151 | ) |
| | | | |
| | | 556,342 | |
Net increase (decrease) in unrealized appreciation or depreciation on: | | | | |
Investments | | | 829,725 | |
Foreign currency related transactions | | | 67 | |
| | | | |
| | | 829,792 | |
| | | | |
Net gain on investments and foreign currency related transactions | | | 1,386,134 | |
| | | | |
Net increase in net assets resulting from operations | | $ | 1,394,722 | |
| | | | |
| | | | | | | |
(1) | | | | | | | |
Fund | | Net of foreign taxes
withheld on dividends,
unaffiliated issuers | | Net of foreign taxes
withheld on dividends,
affiliated issuers | | Including net realized
gain (loss) on investments
from affiliated issuers | |
Emerging Markets | | $ 6,009 | | $ - | | $ - | |
International | | 9,599,777 | | 155,279 | | (51,131,555 | ) |
International Value | | 163,262 | | 47,471 | | (137,512 | ) |
Mid Cap | | - | | - | | 2,503,374 | |
24
| | | | | | | | | | |
| | INTERNATIONAL | | | | INTERNATIONAL VALUE | | | | MID CAP | |
| | | | | | | | | | |
| $ | 87,469,856 | | | $ | 13,590,156 | | | $ | 10,769,402 | |
| | 2,062,995 | | | | 630,690 | | | | - | |
| | 3,801,427 | | | | 3,898,352 | | | | 2,057,644 | |
| | 904,819 | | | | - | | | | - | |
| | 860,550 | | | | - | | | | - | |
| | | | | | | | | | | |
| | 95,099,647 | | | | 18,119,198 | | | | 12,827,046 | |
| | |
| | | | | | | | | | |
| | 69,545,256 | | | | 8,321,725 | | | | 25,316,096 | |
| | | | | | | | | | |
| | 11,115,943 | | | | 1,659,178 | | | | 6,067,157 | |
| | 12,824 | | | | 7,358 | | | | 11,632 | |
| | | | | | | | | | |
| | 678,770 | | | | 168,196 | | | | 522,752 | |
| | 19,448 | | | | 11,191 | | | | 7,661 | |
| | 3,926,796 | | | | 330,439 | | | | 73,065 | |
| | 38,042 | | | | 37,283 | | | | 33,143 | |
| | 336,712 | | | | 32,744 | | | | 93,429 | |
| | | | | | | | | | |
| | 50,064 | | | | 101,951 | | | | 28,376 | |
| | 7,297 | | | | 30,743 | | | | 7,524 | |
| | 205,974 | | | | 21,638 | | | | 76,272 | |
| | 267,583 | | | | 35,200 | | | | 106,392 | |
| | | | | | | | | | | |
| | 86,204,709 | | | | 10,757,646 | | | | 32,343,499 | |
| | | | | | | | | | | |
| | - | | | | - | | | | - | |
| | | | | | | | | | | |
| | 86,204,709 | | | | 10,757,646 | | | | 32,343,499 | |
| | | | | | | | | | | |
| | 8,894,938 | | | | 7,361,552 | | | | (19,516,453 | ) |
| | |
| | | | | | | | | | |
| | | | | | | | | | |
| | 812,193,316 | | | | 82,956,508 | | | | 416,492,639 | |
| | (954,623 | ) | | | (337,318 | ) | | | - | |
| | | | | | | | | | | |
| | 811,238,693 | | | | 82,619,190 | | | | 416,492,639 | |
| | | | | | | | | | |
| | 1,387,615,231 | | | | 115,982,167 | | | | 118,672,579 | |
| | 168,798 | | | | 60,874 | | | | - | |
| | | | | | | | | | | |
| | 1,387,784,029 | | | | 116,043,041 | | | | 118,672,579 | |
| | | | | | | | | | | |
| | 2,199,022,722 | | | | 198,662,231 | | | | 535,165,218 | |
| | | | | | | | | | | |
| $ | 2,207,917,660 | | | $ | 206,023,783 | | | $ | 515,648,765 | |
| | | | | | | | | | | |
The accompanying notes are an integral part of the financial statements.
25
ARTISAN FUNDS, INC.
Statements of Changes in Net Assets
| | | | | | | | |
| | | EMERGING MARKETS | |
| | | Six Months Ended
3/31/2007(1) | | | Period Ended
9/30/2006(2) | |
| OPERATIONS: | | | | | | | | |
Net investment income (loss) | | $ | 8,588 | | | $ | 15,542 | |
Net realized gain (loss) on: | | | | | | | | |
Investments | | | 568,493 | | | | 126,872 | |
Foreign currency related transactions | | | (12,151 | ) | | | (9,914 | ) |
Net increase (decrease) in unrealized appreciation or depreciation on: | | | | | | | | |
Investments | | | 829,725 | | | | 443,063 | |
Foreign currency related transactions | | | 67 | | | | (4,003 | ) |
| | | | | | | | |
Net increase in net assets resulting from operations | | | 1,394,722 | | | | 571,560 | |
| | |
| DISTRIBUTIONS PAID TO SHAREHOLDERS: | | | | | | | | |
Net investment income: | | | | | | | | |
Investor Shares | | | | | | | | |
Institutional Shares | | | (15,593 | ) | | | - | |
Net realized gains on investment transactions: | | | | | | | | |
Investor Shares | | | | | | | | |
Institutional Shares | | | (166,242 | ) | | | - | |
| | | | | | | | |
Total distributions paid to shareholders | | | (181,835 | ) | | | - | |
| | |
| FUND SHARE ACTIVITIES: | | | | | | | | |
Net increase (decrease) in net assets resulting from fund share activities | | | 520,431 | | | | 5,310,000 | |
| | | | | | | | |
Total increase (decrease) in net assets | | | 1,733,318 | | | | 5,881,560 | |
| | | | | | | | |
Net assets, beginning of period | | | 5,881,560 | | | | - | |
| | | | | | | | |
Net assets, end of period | | $ | 7,614,878 | | | $ | 5,881,560 | |
| | | | | | | | |
| | | | | | | | |
Accumulated undistributed net investment income (loss) | | $ | (1,377 | ) | | $ | 5,628 | |
| | | | | | | | |
(2) | For the period from commencement of operations (June 26, 2006) through September 30, 2006. |
26
| | | | | | | | | | | | | | | | | | | | | | |
INTERNATIONAL | | | INTERNATIONAL VALUE | | | MID CAP | |
Six Months Ended
3/31/2007(1) | | | Year Ended
9/30/2006 | | | Six Months Ended
3/31/2007(1) | | | Year Ended
9/30/2006 | | | Six Months Ended
3/31/2007(1) | | | Year Ended
9/30/2006 | |
| | | | | | | | | | | | | | | | | | | | | | |
| $ | 8,894,938 | | | $ | 91,268,255 | | | $ | 7,361,552 | | | $ | 18,549,621 | | | $ | (19,516,453 | ) | | $ | (29,617,835 | ) |
| | | | | | | | | | | | | | | | | | | | | | |
| | 812,193,316 | | | | 1,705,050,798 | | | | 82,956,508 | | | | 63,848,919 | | | | 416,492,639 | | | | 701,530,781 | |
| | (954,623 | ) | | | (3,919,900 | ) | | | (337,318 | ) | | | (230,417 | ) | | | - | | | | - | |
| | | | | | | | | | | | | | | | | | | | | | |
| | 1,387,615,231 | | | | 485,434,611 | | | | 115,982,167 | | | | 103,014,146 | | | | 118,672,579 | | | | (251,537,673 | ) |
| | 168,798 | | | | 249,502 | | | | 60,874 | | | | 36,872 | | | | - | | | | - | |
| | | | | | | | | | | | | | | | | | | | | | | |
| | 2,207,917,660 | | | | 2,278,083,266 | | | | 206,023,783 | | | | 185,219,141 | | | | 515,648,765 | | | | 420,375,273 | |
| | | | | |
| | | | | | | | | | | | | | | | | | | | | | |
| | | | | | | | | | | | | | | | | | | | | | |
| | (149,579,439 | ) | | | (129,259,160 | ) | | | (24,384,271 | ) | | | (13,095,062 | ) | | | - | | | | - | |
| | (69,406,628 | ) | | | (71,446,014 | ) | | | (1,768,836 | ) | | | | | | | - | | | | - | |
| | | | | | | | | | | | | | | | | | | | | | |
| | (800,773,961 | ) | | | - | | | | (71,597,063 | ) | | | (16,600,079 | ) | | | (480,601,368 | ) | | | (209,469,474 | ) |
| | (332,232,670 | ) | | | - | | | | (3,867,611 | ) | | | | | | | (82,408,794 | ) | | | (41,213,795 | ) |
| | | | | | | | | | | | | | | | | | | | | | | |
| | (1,351,992,698 | ) | | | (200,705,174 | ) | | | (101,617,781 | ) | | | (29,695,141 | ) | | | (563,010,162 | ) | | | (250,683,269 | ) |
| | | | | |
| | | | | | | | | | | | | | | | | | | | | | |
| | 1,366,296,679 | | | | 165,474,731 | | | | 607,514,779 | | | | 555,837,073 | | | | (44,136,485 | ) | | | (655,280,963 | ) |
| | | | | | | | | | | | | | | | | | | | | | | |
| | 2,222,221,641 | | | | 2,242,852,823 | | | | 711,920,781 | | | | 711,361,073 | | | | (91,497,882 | ) | | | (485,588,959 | ) |
| | | | | | | | | | | | | | | | | | | | | | | |
| | 13,917,852,390 | | | | 11,674,999,567 | | | | 1,312,575,038 | | | | 601,213,965 | | | | 5,369,794,845 | | | | 5,855,383,804 | |
| | | | | | | | | | | | | | | | | | | | | | | |
| $ | 16,140,074,031 | | | $ | 13,917,852,390 | | | $ | 2,024,495,819 | | | $ | 1,312,575,038 | | | $ | 5,278,296,963 | | | $ | 5,369,794,845 | |
| | | | | | | | | | | | | | | | | | | | | | | |
| | | | | | | | | | | | | | | | | | | | | | |
| $ | (180,575,295 | ) | | $ | 29,515,834 | | | $ | (6,396,072 | ) | | $ | 12,395,483 | | | $ | (19,538,055 | ) | | $ | (21,602 | ) |
| | | | | | | | | | | | | | | | | | | | | | | |
The accompanying notes are an integral part of the financial statements.
27
ARTISAN FUNDS, INC.
Financial Highlights – For a share outstanding throughout each period
The financial highlights table is intended to help you understand the Funds’ financial performance for the past 5 years or, if shorter, the period of a Fund’s operations. Certain information reflects financial results for a single Fund share. The total returns in the table represent the rate that an investor would have earned or lost on an investment in the Fund (assuming reinvestment of all dividends and distributions).
| | | | | | | | | | | | | | | | | | | | | | | | |
Year or
Period
Ended | | | Net Asset
Value
Beginning
of Period | | Net
Investment
Income
(Loss)(1) | | | Net Realized
and Unrealized
Gain (Loss) on
Investments | | | Total Income
(Loss) from
Investment
Operations | | | Dividends
from Net
Investment
Income | | |
Distributions
from Net
Realized
Gains | |
| | | | | | | | | | | | | | | | | | | | | | | | |
| ARTISAN EMERGING MARKETS FUND | | | | | | | | | | | | | | | | | | | | |
| Institutional Shares | | | | | | | | | | | | | | | | | | | | | | | | |
| 3/31/2007 | (5) | | $ | 11.15 | | $ | 0.02 | | | $ | 2.58 | | | $ | 2.60 | | | $ | (0.03 | ) | | $ | (0.31 | ) |
| 9/30/2006 | (6) | | | 10.00 | | | 0.03 | | | | 1.12 | | | | 1.15 | | | | - | | | | - | |
| | | | | | | | | | | | | | | | | | | | | | | | |
| ARTISAN INTERNATIONAL FUND | | | | | | | | | | | | | |
| Institutional Shares | | | | | | | | | | | | | | | | | |
| 3/31/2007 | (5) | | $ | 28.92 | | $ | 0.04 | | | $ | 4.40 | | | $ | 4.44 | | | $ | (0.49 | ) | | $ | (2.33 | ) |
| 9/30/2006 | | | | 24.54 | | | 0.22 | | | | 4.62 | | | | 4.84 | | | | (0.46 | ) | | | - | |
| 9/30/2005 | | | | 19.44 | | | 0.25 | | | | 5.01 | | | | 5.26 | | | | (0.16 | ) | | | - | |
| 9/30/2004 | | | | 16.63 | | | 0.16 | | | | 2.86 | | | | 3.02 | | | | (0.21 | ) | | | - | |
| 9/30/2003 | (7) | | | 15.71 | | | 0.03 | | | | 0.89 | | | | 0.92 | | | | - | | | | - | |
| 6/30/2003 | | | | 18.24 | | | 0.25 | | | | (2.65 | ) | | | (2.40 | ) | | | (0.13 | ) | | | - | |
| 6/30/2002 | | | | 19.62 | | | 0.18 | | | | (1.46 | ) | | | (1.28 | ) | | | (0.10 | ) | | | - | |
| | | | | | | | | | | | | | | | | | | | | | | | |
| ARTISAN INTERNATIONAL VALUE FUND | | | | | | | | | | | | | |
| Institutional Shares | | | | | | | | | | | | | | | | | |
| 3/31/2007 | (5) | | $ | 26.71 | | $ | 0.14 | | | $ | 3.44 | | | $ | 3.58 | | | $ | (0.45 | ) | | $ | (1.28 | ) |
| | | | | | | | | | | | | | | | | | | | | | | | |
| ARTISAN MID CAP FUND | | | | | | | | | | | | | |
| Institutional Shares | | | | | | | | | | | | | | | | | | | | | | | | |
| 3/31/2007 | (5) | | $ | 32.24 | | $ | (0.08 | ) | | $ | 3.26 | | | $ | 3.18 | | | $ | - | | | $ | (3.47 | ) |
| 9/30/2006 | | | | 31.21 | | | (0.10 | ) | | | 2.46 | | | | 2.36 | | | | - | | | | (1.33 | ) |
| 9/30/2005 | | | | 26.38 | | | (0.12 | ) | | | 4.95 | | | | 4.83 | | | | - | | | | - | |
| 9/30/2004 | | | | 23.28 | | | (0.14 | ) | | | 3.24 | | | | 3.10 | | | | - | | | | - | |
| 9/30/2003 | (7) | | | 21.96 | | | (0.03 | ) | | | 1.35 | | | | 1.32 | | | | - | | | | - | |
| 6/30/2003 | | | | 22.24 | | | (0.07 | ) | | | (0.21 | )(8) | | | (0.28 | ) | | | - | | | | - | |
| 6/30/2002 | | | | 26.48 | | | (0.13 | ) | | | (4.11 | ) | | | (4.24 | ) | | | - | | | | - | |
(1) | Computed based on average shares outstanding. |
(2) | Periods less than twelve months (where applicable) are not annualized. |
(3) | Periods less than twelve months (where applicable) are annualized. |
(4) | The ratios of expenses to average net assets and net investment income (loss) to average net assets exclude expenses waived or paid by the Adviser or the Board of Directors. Absent expenses waived or paid by the Adviser or the Board of Directors, the ratios of expenses to average net assets and net investment income (loss) to average net assets would have been as follows: |
| | | | | | | | |
| | | Year or
Period Ended | | Ratio of Expenses to
Average Net Assets | | | Ratio of Net Investment Income
(Loss) to Average Net Assets | |
Emerging Markets Institutional Shares | | 3/31/2007 | | 3.32 | % | | (1.66 | )% |
| | 9/30/2006 | | 7.58 | | | (5.11 | ) |
International Institutional Shares | | 9/30/2003 | | 1.00 | | | 0.73 | |
Mid Cap Institutional Shares | | 9/30/2003 | | 0.98 | | | (0.59 | ) |
28
| | | | | | | | | | | | | | | | | | | | |
Total
Distributions | | | Net Asset
Value
End
of Period | | Total
Return(2) | | | Net
Assets
End of
Period
(millions) | | Ratio of
Expenses
to Average
Net Assets(3)(4) | | | Ratio of Net
Investment
Income (Loss)
to Average
Net Assets(3)(4) | | | Portfolio
Turnover
Rate(2) | |
| | | | | | | | | | | | | | | | | | | | |
| | | | | | | | | | | | | | | | | | | | | |
| | | | | | | | | | | | | | | | | | | | | |
| $ | (0.34 | ) | | $ | 13.41 | | 23.58 | % | | $ | 7.6 | | 1.41 | % | | 0.25 | % | | 35.92 | % |
| | - | | | | 11.15 | | 11.50 | | | | 5.9 | | 1.40 | | | 1.07 | | | 24.26 | |
| | | | | | | | | | | | | | | | | | | | |
| | | | | | | | | | | | | | | | | | | | | |
| | | | | | | | | | | | | | | | | | | | | |
| $ | (2.82 | ) | | $ | 30.54 | | 15.90 | % | | $ | 4,682.7 | | 0.99 | % | | 0.27 | % | | 31.90 | % |
| | (0.46 | ) | | | 28.92 | | 20.07 | | | | 4,116.0 | | 1.00 | | | 0.82 | | | 57.80 | |
| | (0.16 | ) | | | 24.54 | | 27.21 | | | | 3,988.1 | | 0.99 | | | 1.11 | | | 56.15 | |
| | (0.21 | ) | | | 19.44 | | 18.31 | | | | 3,622.1 | | 1.01 | | | 0.85 | | | 54.96 | |
| | - | | | | 16.63 | | 5.86 | | | | 3,354.7 | | 1.00 | | | 0.73 | | | 15.23 | |
| | (0.13 | ) | | | 15.71 | | (13.09 | ) | | | 2,975.0 | | 1.01 | | | 1.68 | | | 37.13 | |
| | (0.10 | ) | | | 18.24 | | (6.52 | ) | | | 2,062.0 | | 1.01 | | | 1.01 | | | 50.67 | |
| | | | | | | | | | | | | | | | | | | | |
| | | | | | | | | | | | | | | | | | | | | |
| | | | | | | | | | | | | | | | | | | | | |
| $ | (1.73 | ) | | $ | 28.56 | | 13.60 | % | | $ | 132.8 | | 1.08 | % | | 1.01 | % | | 22.58 | % |
| | | | | | | | | | | | | | | | | | | | |
| | | | | | | | | | | | | | | | | | | | | |
| | | | | | | | | | | | | | | | | | | | | |
| $ | (3.47 | ) | | $ | 31.95 | | 10.11 | % | | $ | 768.8 | | 0.95 | % | | (0.48 | )% | | 31.05 | % |
| | (1.33 | ) | | | 32.24 | | 7.66 | | | | 797.9 | | 0.95 | | | (0.31 | ) | | 73.59 | |
| | - | | | | 31.21 | | 18.35 | | | | 981.3 | | 0.95 | | | (0.40 | ) | | 83.00 | |
| | - | | | | 26.38 | | 13.27 | | | | 1,036.0 | | 0.96 | | | (0.54 | ) | | 101.09 | |
| | - | | | | 23.28 | | 6.06 | | | | 929.6 | | 0.98 | | | (0.59 | ) | | 26.52 | |
| | - | | | | 21.96 | | (1.26 | ) | | | 829.0 | | 1.00 | | | (0.36 | ) | | 102.85 | |
| | - | | | | 22.24 | | (16.04 | ) | | | 449.8 | | 1.02 | | | (0.56 | ) | | 121.14 | |
| | (5) | Unaudited. For the six months ended March 31, 2007. |
| | (6) | For the period from commencement of operations (June 26, 2006) through September 30, 2006. |
| | (7) | For the period from July 1, 2003 to September 30, 2003. Artisan Funds changed its fiscal year-end from June 30 to September 30 effective September 30, 2003. |
| | (8) | The amount shown may not correlate with the aggregate gains and losses of portfolio securities due to the timing of subscriptions and redemptions of fund shares. |
The accompanying notes are an integral part of the financial statements.
29
ARTISAN FUNDS, INC.
Notes to Financial Statements – March 31, 2007 (Unaudited)
Artisan Funds, Inc. (“Artisan Funds”) was incorporated on January 5, 1995, as a Wisconsin corporation and is registered under the Investment Company Act of 1940, as amended. Artisan Funds is a series comprised of nine open-end, diversified mutual funds. Artisan Emerging Markets Fund (“Emerging Markets Fund” or “Emerging Markets”), Artisan International Fund (“International Fund” or “International”), Artisan International Value Fund (“International Value Fund” or “International Value”) and Artisan Mid Cap Fund (“Mid Cap Fund” or “Mid Cap”), four series of Artisan Funds (each a “Fund” and collectively the “Funds”), commenced operations on June 26, 2006, December 28, 1995, September 23, 2002 and June 27, 1997, respectively. Each Fund’s investment objective is to seek long-term capital growth.
Emerging Markets Fund only offers shares of capital stock of one class—Institutional Shares. International Fund, International Value Fund and Mid Cap Fund offer shares of capital stock of two classes—Institutional Shares and Investor Shares—and have offered Investor Shares since the commencement of operations. International Fund, International Value Fund and Mid Cap Fund began offering Institutional Shares on July 1, 1997, October 1, 2006 and July 1, 2000, respectively. Institutional Shares are sold to institutional investors meeting certain minimum investment requirements. Each class of shares has equal rights with respect to portfolio assets and voting privileges. Each class has exclusive voting rights with respect to any matters involving only that class. Income, expenses not specific to either class and realized and unrealized gains and losses are allocated daily to each class of shares based upon the relative net asset value of outstanding shares. Expenses attributable to a particular class of shares, such as transfer agency fees, shareholder communication expenses and registration fees, are allocated directly to that class.
| (2) | Summary of significant accounting policies: |
The following is a summary of significant accounting policies of the Funds in effect during the period covered by the financial statements, which were in accordance with United States generally accepted accounting principles.
| (a) | Security valuation – The net asset value (“NAV”) of the shares of each class of each Fund was determined as of the close of regular session trading on the New York Stock Exchange (“NYSE”) (usually 4:00 p.m., Eastern Time, but sometimes earlier) each day the NYSE was open for regular session trading. The NAV of each class of shares was determined by dividing the value of each Fund’s securities and other assets attributed to that class, less its liabilities attributed to that class, by the number of outstanding shares of that class of that Fund. |
In determining NAV, each equity security traded on a securities exchange was valued at the closing price as of the time of valuation on the exchange or market on which the security was principally traded (the “principal exchange”). The closing price provided by each exchange may differ and may represent information such as last sales price, an official closing price, a closing auction price or other information, depending on exchange or market convention. Absent closing price information for a
30
NOTES TO FINANCIAL STATEMENTS
security from the principal exchange as of the time of valuation, the security was valued using the most recent bid quotation on the principal exchange, except that securities listed on the London Stock Exchange were valued at the mean of the most recent bid and asked quotations as of the time of valuation. Short-term investments maturing within sixty days of the valuation date were valued at amortized cost, which approximates market value.
Securities for which prices were not readily available were valued by Artisan Funds’ valuation committee (the “valuation committee”) at a fair value determined in good faith under procedures established by and under the general supervision of Artisan Funds’ Board of Directors (the “Board of Directors”). A price was considered to be not readily available if, among other things, the valuation committee believed that the price determined as described in the preceding paragraph did not reflect a fair value of the security.
Emerging Markets Fund, International Fund and International Value Fund generally invested a significant portion, and perhaps as much as substantially all, of their total assets in securities principally traded in markets outside the U.S. Mid Cap Fund had the ability to invest in securities principally traded outside the U.S. The foreign markets in which the Funds invested were sometimes open on days when the NYSE was not open and the Funds did not calculate their NAVs, and sometimes were not open on days when the Funds did calculate their NAVs. Even on days on which both the foreign market and the NYSE were open, several hours may have passed between the time when trading in the foreign market closed and the time as of which the Funds calculate their NAVs. That was generally the case for markets in Europe, Asia, Australia and other far eastern markets; the regular closing time of foreign markets in North and South America was generally the same as the closing time of the NYSE and the time as of which the Funds calculated their NAVs.
The valuation committee concluded that a price determined under the Funds’ valuation procedures was not readily available if, among other things, the valuation committee believed that the value of the security might have been materially affected by events occurring after the close of the market in which the security was principally traded but before the time for determination of NAV (“subsequent event”). A subsequent event might include a company-specific development (for example, announcement of a merger that is made after the close of the foreign market), a development that might affect an entire market or region (for example, imposition of foreign exchange controls by a foreign government), a potentially global development (such as a terrorist attack that may be expected to have an impact on investor expectations worldwide) or a significant change in one or more United States securities indexes. Artisan Funds monitored for subsequent events using several tools. An indication by any of those tools of a potential material change in the value of securities resulted in either a meeting of the valuation committee, which considered whether a subsequent event had occurred and whether local market closing prices continued to represent fair values for potentially affected non-U.S. securities, and/or a valuation based on information provided by a third party research service. This third party research service was used to assist in determining estimates of fair values for foreign securities. That service utilized statistical data based on historical performance of securities, markets and other data in developing factors used to estimate a fair value.
31
NOTES TO FINANCIAL STATEMENTS
Estimates of fair values utilized by the Funds as described above may differ from the value realized on the subsequent sale of those securities and the differences may have been material to the NAV of the applicable Fund or to the information presented.
There are certain risks involved in investing in foreign securities. These risks include those resulting from future adverse political, social, and economic developments, fluctuations in currency exchange rates, the possible imposition of exchange controls, and other foreign laws or restrictions.
| (b) | Taxes – No provision was made for federal income taxes or excise taxes since each Fund intends to (i) comply with the provisions of Subchapter M of the Internal Revenue Code applicable to regulated investment companies and (ii) distribute to its shareholders substantially all of its taxable income as well as net realized gains from the sale of investment securities. The Funds may utilize earnings and profits distributed to shareholders on redemptions of Fund shares as part of the dividends paid deduction. |
The Funds may be subject to taxes on realized gains from the sale of investment securities imposed by certain countries in which the Funds invest. The Funds recorded the foreign tax expense, if any, on an accrual basis. The taxes were included in “Payable for withholding taxes” on the accompanying Statement of Assets and Liabilities.
| (c) | Portfolio transactions – In determining a Fund’s NAV, security transactions and shareholder transactions were accounted for no later than one business day after trade date, in accordance with applicable law. However, for financial reporting purposes, security transactions and shareholder transactions were recorded on trade date in accordance with United States generally accepted accounting principles. Net realized gains and losses on securities were computed on specific security lot identification. |
| (d) | Foreign currency translation – Values of investments, open foreign currency forward contracts, payables for capital gains taxes and cash denominated in foreign currencies were translated into U.S. dollars using a spot market rate of exchange as of the time of determination of each Fund’s NAV on the day of valuation. Payables and receivables for securities transactions, dividend and reclaim receivables and other receivables and payables denominated in a foreign currency were translated into U.S. dollars using a spot market rate of exchange as of 12:00 p.m. (Eastern Time) on the day of valuation. Purchases and sales of investments and dividend and interest income were translated into U.S. dollars using a spot market rate of exchange as of 12:00 p.m. (Eastern Time) on the date of such transactions. The portion of security gains or losses resulting from changes in foreign exchange rates was included with net realized and unrealized gain or loss from investments, as appropriate, for both financial reporting and tax purposes. |
The Funds may enter into foreign currency forward contracts to hedge the foreign currency exposure on open payables and receivables. Foreign currency forward contracts, if any, were recorded at market value and any related realized and unrealized gains and losses were reported as foreign currency related transactions for financial reporting purposes. For tax purposes, these foreign exchange gains and
32
NOTES TO FINANCIAL STATEMENTS
losses were treated as ordinary income or loss. The Funds could be exposed to loss if the counterparties fail to perform under these contracts.
Other foreign currency related transaction gains and losses may result from currency gains and losses realized from the difference between the amounts of dividends and foreign withholding taxes recorded on the Funds’ books and the U.S. dollar equivalent of the amounts actually received or paid. The net increase (decrease) in unrealized appreciation or depreciation on foreign currency related transactions arose from changes in the values of assets and liabilities, other than investments in securities, resulting from changes in foreign exchange rates.
| (e) | Repurchase agreements – Each Fund may enter into repurchase agreements with institutions that Artisan Partners Limited Partnership (“the Adviser”) determined were creditworthy pursuant to criteria adopted by the Board of Directors. Repurchase agreements were recorded at cost plus accrued interest and were collateralized in an amount greater than or equal to the repurchase price plus accrued interest. Collateral was held by the Funds’ custodian and in the event of default on the obligation of the counterparty to repurchase, the Funds had the right to liquidate the collateral and apply the proceeds in satisfaction of the obligation. If the proceeds from any sale of such collateral were less than the repurchase price, the Fund would have suffered a loss. |
| (f) | Securities lending – International Fund entered into securities lending transactions secured by collateral in the form of U.S. Government securities at least equal to, at all times, the fair value of the securities loaned. Unrealized gain or loss in the value of the security loaned as of March 31, 2007 was accounted for in the financial statements of the International Fund. All other Artisan Funds may enter into securities lending transactions, but did not do so during the period covered by these financial statements. In entering into securities lending arrangements a fund takes the risk that the borrower may not provide additional collateral when required or return the securities when due or, if the borrower defaults, the fund may experience delays in selling collateral or the collateral may not be sufficient to cover the value of securities lent. |
During the six months ended March 31, 2007, International Fund earned $904,819 from securities lending transactions, which was included in the accompanying Statement of Operations. International Fund had one security on loan at March 31, 2007 as disclosed on the accompanying Schedules of Investments, with a value of $335,358,482, which was collateralized by U.S. Treasury Notes, with a value of $350,071,532 at March 31, 2007.
| (g) | Commission recapture – Each of the Funds had the ability to direct portfolio trades to various brokers that have agreed to rebate a portion of the commissions generated. Such cash rebates were made directly to the applicable Fund and were included in net realized gain or loss on investments in the Statements of Operations as follows: |
| | | |
Emerging Markets | | $ | - |
International | | | 105,699 |
International Value | | | 101,209 |
Mid Cap | | | 338,166 |
33
NOTES TO FINANCIAL STATEMENTS
| (h) | Use of estimates – The preparation of financial statements in conformity with U.S. generally accepted accounting principles required management to make estimates and assumptions that affect the reported amounts and disclosures in the financial statements. Actual results could differ from those estimates. |
| (i) | Indemnifications – In the normal course of business, the Funds have entered into contracts in which the Funds agree to indemnify the other party or parties against various potential costs or liabilities. The Funds’ maximum exposure under these arrangements is unknown. No claim had been made for indemnification pursuant to any such agreement of the Funds. |
| (j) | Other – Dividend income less foreign taxes withheld, if any, was generally recorded on the ex-dividend date. In some cases, the information was not available to the Fund on the ex-dividend date. In such cases, which may have included private placements and foreign securities, dividends were recorded as soon after the ex-dividend date as reliable information became available to the Funds. Non-cash dividends included in dividend income, if any, were generally recorded at the fair market value of securities received. Interest income was reported on the accrual basis. Distributions to shareholders were recorded on the ex-dividend date. Expenses attributable to Artisan Funds were generally allocated to each Fund based on net assets. However, other expense allocation methodologies were used, depending on the nature of the expense item. Expenses attributable to a particular Fund or class were allocated directly to that Fund or class. |
The character of income and net realized gains and losses may differ in some instances for financial statement and tax purposes and may result in reclassification of permanent differences among certain capital accounts to more appropriately conform financial accounting to tax characterizations of dividend and capital gain distributions.
Emerging Markets Fund, International Fund and International Value Fund generally imposed a 2% redemption fee on shares held 90 days or less. Those redemption fees were recorded as a reduction in the cost of shares redeemed and had the primary effect of increasing paid-in capital. Each Fund reserved the right to waive or reduce the 2% redemption fee on shares held 90 days or less at its discretion when the Fund believed such waiver was in the best interests of the Fund, including but not limited to when it determined that imposition of the redemption fee was not necessary to protect the Fund from the effects of short-term trading. The Funds waived the fee on redemption of shares held by certain authorized agents or other Fund intermediaries.
| (3) | Transactions with affiliates: |
The Adviser, with which the officers and a director of Artisan Funds were affiliated, provided investment advisory and administrative services to the Funds. In exchange for those services, each Fund paid a monthly management fee to the Adviser as follows:
Emerging Markets Fund
| | | |
Average Daily Net Assets | | Annual Rate | |
All | | 1.050 | % |
34
NOTES TO FINANCIAL STATEMENTS
International Fund
| | | |
Average Daily Net Assets | | Annual Rate | |
Less than $500 million | | 1.000 | % |
$500 million to $750 million | | 0.975 | |
$750 million to $1 billion | | 0.950 | |
$1 billion to $12 billion | | 0.925 | |
Greater than $12 billion | | 0.900 | |
International Value Fund & Mid Cap Fund
| | | |
Average Daily Net Assets | | Annual Rate | |
Less than $500 million | | 1.000 | % |
$500 million to $750 million | | 0.975 | |
$750 million to $1 billion | | 0.950 | |
Greater than $1 billion | | 0.925 | |
The Adviser has voluntarily undertaken to reimburse Emerging Markets Fund for any ordinary operating expenses in excess of 1.50% of average daily net assets, annually.
The officers and director of Artisan Funds who are affiliated with the Adviser received no compensation from the Funds.
Prior to April 1, 2007, each director who was not an interested person of Artisan Funds or the Adviser received an annual retainer of $140,000, payable quarterly, as well as reimbursement of expenses related to his duties as a director of Artisan Funds. In addition, the non-interested chair of the Board of Directors received an additional annual retainer of $60,000, payable quarterly, and each chair of a board committee who was a non-interested director received an additional annual retainer of $30,000, payable quarterly. Effective April 1, 2007, each director who is not an interested person of Artisan Funds or the Adviser will receive an annual retainer of $150,000, payable quarterly. The other additional annual retainer fees were unchanged. These fees were generally allocated to each of the Artisan Funds based on net assets, subject to a minimum allocation of $1,500 to each Fund per quarter. Directors fees for Emerging Markets Fund have been waived through September 30, 2007.
Artisan Funds has adopted a deferred compensation plan for independent directors that enables directors to elect to defer receipt of all or a portion of the annual compensation they are entitled to receive from the Funds. For purposes of determining the amount owed to the directors under the plan, deferred amounts were invested in shares of the Artisan Funds as selected by the individual directors. Each Fund purchased shares of the Artisan Funds selected for deferral by the director in amounts equal to his investment, resulting in a Fund asset equal to the deferred compensation liability. Such assets were included as a component of "Other assets" on the Statement of Assets and Liabilities. Deferral of directors’ fees under the plan did not affect the net assets of the Funds, and did not materially affect the Funds’ assets, liabilities or net investment income per share. Amounts will be deferred until distributed in accordance with the plan.
35
NOTES TO FINANCIAL STATEMENTS
Shares of Artisan Funds were offered for sale by Artisan Distributors LLC (“Distributors”). Distributors is wholly owned by the Adviser. All distribution expenses relating to the Funds were paid by the Adviser.
| (4) | Line of credit arrangement: |
Artisan Funds is party to a line of credit agreement with State Street Bank and Trust Company, which expires August 2007, under which each Fund may borrow up to the lesser of (a) $75 million or (b) the lesser of (i) 10% of its total assets (after giving effect to the loan) or (ii) the maximum amount the Fund may have borrowed under the Investment Company Act of 1940, the limitations included in the Fund’s prospectus, or any limit or restriction under any law or regulation to which the Fund was subject or any agreement to which the Fund or Artisan Funds is a party; provided that the aggregate borrowings by all Artisan Funds may not exceed $100 million. Artisan Funds paid a commitment fee at the annual rate of 0.10% on the unused portion of the line of credit. Interest was charged on any borrowings at the current Federal Funds rate plus 0.50%. The use of the line of credit was generally restricted to temporary borrowing for extraordinary or emergency purposes. During the six months ended March 31, 2007, there were no borrowings under the line of credit for Emerging Markets Fund and International Value Fund. During the six months ended March 31, 2007, International Fund and Mid Cap Fund paid interest of $16,120 and $2,579 on maximum borrowings of $25,231,293 and $15,972,538, respectively.
| (5) | Investment transactions: |
The cost of securities purchased and the proceeds from the sale of securities (excluding short-term securities) for the six months ended March 31, 2007 were as follows:
| | | | | | |
| Fund | | Security Purchases | | Security Sales |
Emerging Markets | | $ | 2,694,304 | | $ | 2,402,233 |
International | | | 4,766,367,577 | | | 4,893,896,528 |
International Value | | | 779,903,317 | | | 357,577,375 |
Mid Cap | | | 1,647,471,112 | | | 2,254,624,140 |
| (6) | Transactions in securities of affiliates: |
The table below shows information about securities of the Funds’ “affiliates” (as defined below) that were held by the Funds, purchased or sold by the Funds, or from which dividends were received by the Funds during the six months ended March 31, 2007. The Funds have identified a company as an affiliate for the purpose of this report if one or more of the Funds owned, in the aggregate, voting securities that it believed represented 5% or more of that company’s outstanding voting securities (as defined by the Investment Company Act of 1940) during the six months ended March 31, 2007.
36
NOTES TO FINANCIAL STATEMENTS
| | | | | | | | | | | | | | | | | | | | | | |
| | | | | As of
9/30/06 | | | | | | | | | | | As of 3/31/07 |
| Fund | | Security | | Share
Balance | | Purchase
Cost | | Sales
Cost | | Net
Realized
Gain (Loss) | | | Dividend
Income(1) | | Share
Balance | | Value |
| International | | Credit Saison Co., Ltd. | | 9,284,400 | | $ | 1,556,870 | | $ | - | | $ | - | | | $ | 2,062,995 | | 9,332,200 | | $ | 307,272,030 |
| | | TAISEI CORPORATION(2) | | 54,263,300 | | | - | | | 233,887,164 | | | (51,131,555 | ) | | | - | | - | | | - |
| | | Total(3) | | | | | 1,556,870 | | | 233,887,164 | | | (51,131,555 | ) | | | 2,062,995 | | | | | 307,272,030 |
| International Value | | MEITEC CORPORATION(4) | | 1,282,600 | | | 17,361,391 | | | - | | | - | | | | 630,690 | | 1,832,900 | | | 59,105,737 |
| | | Pfeiffer Vacuum Technology AG | | 714,441 | | | 11,128,617 | | | 2,275,406 | | | (4,487 | ) | | | - | | 822,027 | | | 74,824,863 |
| | | SurfControl PLC(5) | | 1,603,124 | | | 4,678,771 | | | 2,187,031 | | | (133,025 | ) | | | - | | 1,871,963 | | | 17,497,770 |
| | | Total(3) | | | | | 33,168,779 | | | 4,462,437 | | | (137,512 | ) | | | 630,690 | | | | | 151,428,370 |
| Mid Cap | | Intermec, Inc.(5) | | 3,374,500 | | | 18,604,186 | | | - | | | - | | | | - | | 4,206,000 | | | 93,962,040 |
| | | Marvel Entertainment, Inc.(2)(5) | | 1,361,100 | | | 73,515 | | | 6,100,823 | | | 2,503,374 | | | | - | | 1,038,600 | | | 28,821,150 |
| | | Total(3) | | | | | 18,677,701 | | | 6,100,823 | | | 2,503,374 | | | | - | | | | | 93,962,040 |
(1) | Net of foreign taxes withheld, if any. |
(2) | Issuer was no longer an affiliate as of March 31, 2007. |
(3) | Total value as of 3/31/2007 is presented for only those issuers that were affiliates as of March 31, 2007. |
(4) | Issuer was not an affiliate as of September 30, 2006. |
(5) | Non-income producing security. |
| (7) | Information for Federal income tax purposes: |
For Federal income tax purposes, the cost of investments, gross unrealized appreciation, gross unrealized depreciation and net unrealized appreciation on investments as of March 31, 2007 were as follows:
| | | | | | | | | | | | | |
| Fund | | Cost of
Investments | | Gross
Unrealized
Appreciation | | Gross
Unrealized
Depreciation | | | Net
Unrealized
Appreciation on
Investments |
| Emerging Markets | | $ | 6,369,991 | | $ | 1,354,777 | | $ | (83,712 | ) | | $ | 1,271,065 |
| International | | | 11,546,348,154 | | | 4,569,978,662 | | | (66,790,300 | ) | | | 4,503,188,362 |
| International Value | | | 1,737,037,016 | | | 279,655,570 | | | (9,879,972 | ) | | | 269,775,598 |
| Mid Cap | | | 4,184,985,895 | | | 1,124,736,645 | | | (58,173,764 | ) | | | 1,066,562,881 |
The difference between cost of investments for financial reporting and cost of investments for Federal income tax purposes was due primarily to timing differences in recognizing certain gains and losses on security transactions (e.g., wash sale loss deferrals and passive foreign investment company transactions).
37
NOTES TO FINANCIAL STATEMENTS
The tax characterization of ordinary income dividends and long-term capital gain distributions paid during the six months ended March 31, 2007 and the year ended September 30, 2006 were as follows:
| | | | | | | | | | | | |
| | | Six Months Ended 3/31/07 | | Year Ended 9/30/06 | |
| Fund | | Ordinary
Income
Dividends | | Long-Term
Capital Gain
Distributions | | Ordinary
Income
Dividends | | | Long-Term
Capital Gain
Distributions | |
| Emerging Markets | | $ | 181,835 | | $ | - | | - | (1) | | - | (1) |
| International | | | 218,986,067 | | | 1,133,006,631 | | 200,705,174 | | | - | |
| International Value | | | 58,575,571 | | | 43,042,210 | | 20,163,763 | | | 9,531,378 | |
| Mid Cap | | | 26,122,960 | | | 536,887,202 | | 30,312,731 | | | 220,370,538 | |
(1) | For the period from commencement of operations (June 26, 2006) through September 30, 2006. |
Ordinary income dividends and long-term capital gain distributions were determined in accordance with income tax regulations that may differ from U.S. generally accepted accounting principles. These differences were due to differing treatments for items such as net short-term gains, wash sale loss deferrals, foreign currency transactions, net investment losses and capital loss carryovers. Gains on redemptions-in-kind for International Fund and Mid Cap Fund, for the year ended September 30, 2006, of $29,012,833 and $13,451,833, respectively, were not recognized for Federal income tax purposes.
Additional tax information as of and for the year ended September 30, 2006 follows:
| | | | | | | | | | | | | | |
| | | As of 9/30/06 | | Year Ended 9/30/06 | |
| Fund | | Undistributed
Ordinary
Income | | Undistributed
Long-Term
Gain | | Capital Loss
Carryforward
Utilized | | | Post-October
Losses | |
| Emerging Markets | | $ | 143,395 | | $ | - | | $ | - | (1) | | $ | 8,572 | (1) |
| International | | | 212,453,758 | | | 1,018,713,221 | | | 617,923,426 | | | | - | |
| International Value | | | 46,295,790 | | | 37,751,013 | | | - | | | | - | |
| Mid Cap | | | 26,118,296 | | | 536,884,861 | | | - | | | | - | |
(1) | For the period from commencement of operations (June 26, 2006) through September 30, 2006. |
As of September 30, 2006, none of the Funds had capital loss carryforwards.
38
NOTES TO FINANCIAL STATEMENTS
[THIS PAGE INTENTIONALLY LEFT BLANK]
39
NOTES TO FINANCIAL STATEMENTS
| (8) | Fund share activities: |
Capital share transactions for the Funds were as follows:
| | | | |
| |
| | | EMERGING MARKETS | |
Six months ended March 31, 2007 | | Institutional Shares | |
Net asset value of shares transferred | | | | |
Proceeds from shares issued | | $ | 350,000 | |
Net asset value of shares issued in reinvestment of dividends and distributions | | | 181,510 | |
Cost of shares redeemed(1) | | | (11,079 | ) |
| | | | |
Net increase (decrease) from fund share transactions | | $ | 520,431 | |
| | | | |
| |
Shares transferred | | | | |
Shares sold | | | 27,038 | |
Shares issued in reinvestment of dividends and distributions | | | 14,521 | |
Shares redeemed | | | (946 | ) |
| | | | |
Net increase (decrease) in capital shares | | | 40,613 | |
| | | | |
| |
| | | EMERGING MARKETS | |
Year ended September 30, 2006 | | Institutional Shares(2) | |
Proceeds from shares issued | | $ | 5,310,000 | |
Net asset value of shares issued in reinvestment of dividends and distributions | | | - | |
Cost of shares redeemed(1) | | | - | |
| | | | |
Net increase (decrease) from fund share transactions | | $ | 5,310,000 | |
| | | | |
| |
Shares sold | | | 527,411 | |
Shares issued in reinvestment of dividends and distributions | | | - | |
Shares redeemed | | | - | |
| | | | |
Net increase (decrease) in capital shares | | | 527,411 | |
| | | | |
| | (1) | Net of redemption fees of: |
| | | | | | | |
| Fund | | Six Months
Ended
3/31/2007 | | Year Ended
9/30/2006 | |
Emerging Markets - Institutional Shares | | $ | - | | $ | - | (2) |
International - Investor Shares | | | 308,767 | | | 863,753 | |
International - Institutional Shares | | | 134,383 | | | 389,313 | |
International Value - Investor Shares | | | 206,124 | | | 222,110 | |
International Value - Institutional Shares | | | 13,709 | | | | |
| | (2) | For the period from commencement of operations (June 26, 2006) through September 30, 2006. |
40
NOTES TO FINANCIAL STATEMENTS
| | | | | | | | | | | | | | | | | | | | | | |
| INTERNATIONAL | | | INTERNATIONAL
VALUE | | | MID CAP | |
Investor
Shares | | | Institutional
Shares | | | Investor
Shares | | | Institutional
Shares | | | Investor
Shares | | | Institutional
Shares | |
| | | | | | | | $ | (78,194,778 | ) | | $ | 78,194,778 | | | | | | | | | |
| $ | 1,221,409,213 | | | $ | 236,054,876 | | | | 756,869,688 | | | | 43,712,430 | | | $ | 292,786,604 | | | $ | 17,273,694 | |
| | 914,418,120 | | | | 375,581,486 | | | | 88,578,891 | | | | 6,278,901 | | | | 474,031,867 | | | | 81,886,968 | |
| | (1,084,675,284 | ) | | | (296,491,732 | ) | | | (285,963,748 | ) | | | (1,961,383 | ) | | | (786,263,400 | ) | | | (123,852,218 | ) |
| | | | | | | | | | | | | | | | | | | | | | | |
| $ | 1,051,152,049 | | | $ | 315,144,630 | | | $ | 481,290,053 | | | $ | 126,224,726 | | | $ | (19,444,929 | ) | | $ | (24,691,556 | ) |
| | | | | | | | | | | | | | | | | | | | | | | |
| | | | | |
| | | | | | | | | (2,927,547 | ) | | | 2,927,547 | | | | | | | | | |
| | 41,461,883 | | | | 7,738,949 | | | | 27,108,609 | | | | 1,568,426 | | | | 9,211,352 | | | | 522,516 | |
| | 31,850,161 | | | | 13,013,911 | | | | 3,182,856 | | | | 225,617 | | | | 15,430,725 | | | | 2,620,383 | |
| | (36,878,516 | ) | | | (9,746,297 | ) | | | (10,237,063 | ) | | | (71,458 | ) | | | (24,845,108 | ) | | | (3,823,512 | ) |
| | | | | | | | | | | | | | | | | | | | | | | |
| | 36,433,528 | | | | 11,006,563 | | | | 17,126,855 | | | | 4,650,132 | | | | (203,031 | ) | | | (680,613 | ) |
| | | | | | | | | | | | | | | | | | | | | | | |
| | | |
| INTERNATIONAL | | | INTERNATIONAL
VALUE | | | | | | MID CAP | |
Investor
Shares | | | Institutional
Shares | | | Investor
Shares | | | | | | Investor
Shares | | | Institutional
Shares | |
| $ | 2,314,789,322 | | | $ | 316,068,084 | | | $ | 711,293,524 | | | | | | | $ | 902,753,102 | | | $ | 55,931,735 | |
| | 121,587,382 | | | | 67,354,311 | | | | 28,357,891 | | | | | | | | 205,964,332 | | | | 40,056,662 | |
| | (1,736,641,589 | ) | | | (917,682,779 | ) | | | (183,814,342 | ) | | | | | | | (1,552,986,575 | ) | | | (307,000,219 | ) |
| | | | | | | | | | | | | | | | | | | | | | | |
| $ | 699,735,115 | | | $ | (534,260,384 | ) | | $ | 555,837,073 | | | | | | | $ | (444,269,141 | ) | | $ | (211,011,822 | ) |
| | | | | | | | | | | | | | | | | | | | | | | |
| | | | | |
| | 85,995,680 | | | | 12,075,907 | | | | 28,589,432 | | | | | | | | 28,570,035 | | | | 1,750,257 | |
| | 5,049,329 | | | | 2,785,484 | | | | 1,344,769 | | | | | | | | 6,671,990 | | | | 1,280,993 | |
| | (65,072,487 | ) | | | (35,034,422 | ) | | | (7,654,580 | ) | | | | | | | (49,375,193 | ) | | | (9,727,021 | ) |
| | | | | | | | | | | | | | | | | | | | | | | |
| | 25,972,522 | | | | (20,173,031 | ) | | | 22,279,621 | | | | | | | | (14,133,168 | ) | | | (6,695,771 | ) |
| | | | | | | | | | | | | | | | | | | | | | | |
41
NOTES TO FINANCIAL STATEMENTS
Artisan Funds and the Adviser were defendants in a lawsuit in the Circuit Court of the Third Judicial Circuit, Madison County, Illinois that sought certification of a plaintiff class consisting of all persons in the United States who held shares in International Fund for a period of more than 14 days during the five years prior to the filing of the lawsuit. The suit sought compensatory and punitive damages under state law, as well as interest, costs and attorney’s fees. The lawsuit alleged, in summary, that Artisan Funds and the Adviser exposed long-term International Fund shareholders to trading by market timers by allegedly (a) failing to properly evaluate daily whether a significant event affecting the value of International Fund’s securities had occurred after foreign markets had closed but before the calculation of the Fund’s NAV; (b) failing to implement the Fund’s portfolio valuation and share pricing policies and procedures; (c) allowing portfolio valuation and share policies and procedures that benefited market timers at the expense of long-term shareholders; and (d) failing to know and implement applicable rules and regulations concerning the calculation of NAV.
Artisan Funds and the Adviser removed the lawsuit from state court to federal district court. The federal district court ordered the case remanded to Illinois state court. Artisan Funds and the Adviser then appealed the remand order to the United States Court of Appeals for the Seventh Circuit and, on April 5, 2005, the Court of Appeals ruled in favor of Artisan Funds and the Adviser. As a result, the action was dismissed with prejudice in May 2005. The plaintiff subsequently sought and was granted review by the United States Supreme Court on the question of whether the Court of Appeals had jurisdiction to hear the appeal. On June 15, 2006, the United States Supreme Court ruled that the Court of Appeals had lacked jurisdiction to hear the appeal of Artisan Funds and the Adviser, vacated the judgment of the Court of Appeals and remanded the case to the Court of Appeals with instructions to dismiss the appeal for lack of jurisdiction. On October 16, 2006, the Court of Appeals dismissed the appeal and remanded the case to state court. Artisan Funds and the Adviser have again removed the action from state court to federal court and intend to continue to defend the lawsuit vigorously.
Certain legal fees incurred by Artisan Funds in defense of the lawsuit have been allocated to International Fund and were included in professional fees in the Statement of Operations. As of the date of this report, Artisan Funds does not believe that the action described herein will have a material effect on the financial condition of any Fund.
| (10) | Recent Accounting Pronouncements: |
On July 13, 2006, the Financial Accounting Standards Board (FASB) released FASB Interpretation No. 48 "Accounting for Uncertainty in Income Taxes" (FIN 48). FIN 48 provides guidance for how uncertain tax positions should be recognized, measured, presented and disclosed in the financial statements. FIN 48 requires the evaluation of tax positions taken or expected to be taken in the course of preparing the Fund’s tax returns to determine whether the tax positions are "more-likely-than-not" to be sustained by the applicable tax authority. Tax positions not deemed to meet a more-likely-than-not threshold would be deemed to be uncertain and would be recorded as tax expense in the current year. Adoption of FIN 48 is required for fiscal years beginning after December 15, 2006 and is to be applied to all open tax years as of the effective date. Recent SEC guidance allows implementing FIN 48 in fund NAV calculations as late as the fund’s last
42
NOTES TO FINANCIAL STATEMENTS
NAV calculation in the first required financial statement reporting period. As a result, the Funds will incorporate FIN 48 in its semi-annual report on March 31, 2008. As of the date of this report, management is evaluating the implications of FIN 48 and its impact to the financial statements has not yet been determined.
In September 2006, FASB issued Statement on Financial Accounting Standards No. 157, “Fair Value Measurements” (FAS 157). This standard clarifies the definition of fair value for financial reporting, establishes a framework for measuring fair value and requires additional disclosures about the use of fair value measurements. FAS 157 is effective for financial statements issued for fiscal years beginning after November 15, 2007 and interim periods within those fiscal years. As of March 31, 2007, the Funds did not believe the adoption of FAS 157 would impact the amounts reported in the financial statements, however, additional disclosures would be required about the inputs used to develop the measurements of fair value and the effect of certain of the measurements reported in the statement of operations for a fiscal period.
43
SHAREHOLDER EXPENSE EXAMPLE
As a shareholder of Artisan Funds, you may incur transaction costs, including redemption fees, and you will incur ongoing costs, including management fees and other Fund expenses. This example is intended to help you understand your ongoing costs (in dollars) of investing in a Fund and to compare these costs with the ongoing costs of investing in other mutual funds.
The example is based on an investment of $1,000 invested at the beginning of the period and held for the entire period from October 1, 2006 to March 31, 2007.
Actual Expenses
The first line under the name of each Fund in the table below provides information about actual account values and actual expenses. You may use the information in this line, together with the amount you invested, to estimate the expenses that you paid over the period. Simply divide your account value by $1,000 (for example, an $8,600 account value divided by $1,000 = 8.6), then multiply the result by the number in the first line under the name of your Fund under the heading entitled “Expenses Paid During Period” to estimate the expenses you paid on your account during this period.
Hypothetical Example for Comparison Purposes
The second line below each Fund’s name in the table below provides information about hypothetical account values and hypothetical expenses based on each Fund’s actual expense ratio for the six months ended March 31, 2007 and an assumed rate of return of 5% per year before expenses, which is not the Fund’s actual return. The hypothetical account values and expenses may not be used to estimate the actual ending account balances or expenses you paid for the period. You may use this information to compare the ongoing costs of investing in each Fund and other funds. To do so, compare the 5% hypothetical example with the 5% hypothetical examples that appear in the shareholder reports of the other funds.
Please note that the expenses shown in the table are meant to highlight your ongoing costs only and do not reflect any transactional costs, such as redemption fees. Therefore, the second line of the table is useful in comparing ongoing costs only, and will not help you determine the relative costs of owning different funds. If these transactional costs were included, your costs would have been higher.
| | | | | | | | | |
| | | Beginning
Account Value
10/1/2006 | | Ending
Account Value
3/31/2007 | | Expenses Paid During Period 10/1/2006-3/31/2007(1) |
Artisan Emerging Markets Fund - Institutional Shares | | | | | | | | | |
Actual | | $ | 1,000.00 | | $ | 1,235.80 | | $ | 7.86 |
Hypothetical (5% return before expenses) | | $ | 1,000.00 | | $ | 1,017.90 | | $ | 7.09 |
Artisan International Fund - Institutional Shares | | | | | | | | | |
Actual | | $ | 1,000.00 | | $ | 1,158.99 | | $ | 5.33 |
Hypothetical (5% return before expenses) | | $ | 1,000.00 | | $ | 1,020.00 | | $ | 4.99 |
Artisan International Value Fund - Institutional Shares | | | | | | | | | |
Actual | | $ | 1,000.00 | | $ | 1,135.96 | | $ | 5.75 |
Hypothetical (5% return before expenses) | | $ | 1,000.00 | | $ | 1,019.55 | | $ | 5.44 |
44
SHAREHOLDER EXPENSE EXAMPLE
| | | | | | | | | |
| | | Beginning
Account Value
10/1/2006 | | Ending
Account Value
3/31/2007 | | Expenses Paid During Period 10/1/2006-3/31/2007(1) |
Artisan Mid Cap Fund - Institutional Shares | | | | | | | | | |
Actual | | $ | 1,000.00 | | $ | 1,101.11 | | $ | 4.98 |
Hypothetical (5% return before expenses) | | $ | 1,000.00 | | $ | 1,020.19 | | $ | 4.78 |
(1) | Expenses are equal to the Fund’s ratio of expenses to average net assets for the six-month period ended March 31, 2007 (shown below); multiplied by the average account value over the period; multiplied by 182/365 (to reflect the one-half year period). |
| | |
| Fund | | Annualized Ratio of Expenses to Average
Net Assets for the Six-Month
Period Ended March 31, 2007 |
Artisan Emerging Markets Fund - Institutional Shares | | 1.41% |
Artisan International Fund - Institutional Shares | | 0.99 |
Artisan International Value Fund - Institutional Shares | | 1.08 |
Artisan Mid Cap Fund - Institutional Shares | | 0.95 |
45
FACTORS CONSIDERED IN RENEWING THE FUNDS’ ADVISORY AGREEMENTS
Artisan Partners Limited Partnership (“Artisan Partners”) is responsible for management of the Funds’ investment portfolios and for overall management of the Funds’ business and affairs pursuant to Investment Advisory Agreements dated December 28, 1995, as amended November 17, 2005 (International Fund); November 7, 2001 (International Small Cap Fund); August 9, 2002 (International Value Fund); April 10, 1997 (Mid Cap Fund); January 25, 2001 (Mid Cap Value Fund); March 27, 1995 (Small Cap Fund) and August 20, 1997 (Small Cap Value Fund) (the “Advisory Agreements”). The advisory agreements for Opportunistic Value Fund dated February 9, 2006, and Emerging Markets Fund dated May 10, 2006, continue through November 30, 2007, and so were not considered at the meetings described below. Artisan Partners is a Delaware limited partnership the sole general partner of which is Artisan Investment Corporation. Artisan Investment Corporation was incorporated on December 7, 1994 for the sole purpose of acting as general partner of Artisan Partners. Artisan Investment Corporation is owned by ZFIC, Inc., a Wisconsin Corporation, which is controlled by Mr. Ziegler and Ms. Ziegler, who together own 100% of its voting stock. The principal address of Artisan Partners is 875 E. Wisconsin Avenue, Suite 800, Milwaukee, Wisconsin 53202. Artisan Partners also has offices at 100 Pine Street, Suite 2950, San Francisco, California 94111; One Maritime Plaza, Suite 1450, San Francisco, California 94111; Five Concourse Parkway NE, Suite 2120, Atlanta, Georgia 30328; 1350 Avenue of the Americas Suite 3005, New York, New York 10019 and 800 Delaware Avenue, Suite 800, Wilmington, Delaware 19801.
The Advisory Agreement for each Fund may be continued from year to year only so long as the continuance is approved annually (a) by the vote of a majority of the directors of Artisan Funds who are not “interested persons” of Artisan Funds or Artisan Partners cast in person at a meeting called for the purpose of voting on such approval, and (b) by the board of directors or by the vote of a majority (as defined in the 1940 Act) of the outstanding shares of the Fund. Each Advisory Agreement provides that Artisan Partners shall not be liable for any loss suffered by a Fund or its shareholders as a consequence of any act or omission in connection with investment advisory or portfolio services under the agreement, except by reason of willful misfeasance, bad faith or gross negligence on the part of Artisan Partners in the performance of its duties or from reckless disregard by Artisan Partners of its obligations and duties under the Advisory Agreement. Each Agreement will terminate automatically in the event of its assignment (as defined in the 1940 Act).
The directors of Artisan Funds held a special meeting of the board on November 3, 2006 (the “November Special Meeting”), at which meeting they gave preliminary consideration to information bearing on continuation of each Advisory Agreement for the period from December 1, 2006 through November 30, 2007. The primary purpose of the November Special Meeting was to ensure that the directors had ample opportunity to consider matters they deemed relevant in considering the continuation of the Advisory Agreements, and to request any additional information they considered reasonably necessary to their deliberations, without undue time constraints.
The independent directors of Artisan Funds next met in executive session on November 9, 2006 with their independent counsel to further consider the matters reviewed at the November Special Meeting and to reach certain conclusions in connection with the review and approval of the Advisory Agreements. The full board then met at a regular meeting on November 10, 2006, at which time they approved the continuation of each Advisory Agreement from December 1, 2006 to November 30, 2007.
46
FACTORS CONSIDERED IN RENEWING THE FUNDS’ ADVISORY AGREEMENTS
Prior to the November Special Meeting, independent counsel to the independent directors sent to Artisan Partners a request for information to be provided to the directors in connection with their consideration of the continuation of the Advisory Agreements. Artisan Partners provided materials to the directors that included responses to that request, other information Artisan Partners believed was useful in evaluating the continuation of the Advisory Agreements and extensive reports prepared by Lipper Inc. (“Lipper”), an independent source of investment company data, relating to each Fund’s performance and expenses compared to the performance and expenses of a relatively small peer group and a larger peer universe of funds determined by Lipper to be comparable. Artisan Partners also provided additional reports prepared by Lipper comparing certain of the Funds’ performance and expenses to different peer groups and peer universes that Artisan Partners believed were more appropriate for comparative purposes than the peer groups and peer universes selected by Lipper. The directors also received and reviewed a memorandum from their independent counsel regarding the directors’ responsibilities in evaluating the Funds’ investment advisory agreements.
In evaluating the Advisory Agreements, the directors reviewed the available information and discussed with representatives of Artisan Partners each Fund’s operations, the nature, extent and quality of the advisory and other services provided by Artisan Partners to the Funds, the overall expense ratios of each class of shares of the Funds, and economies of scale and other benefits derived by Artisan Partners from its relationship with the Funds. In addition to the third party reports by Lipper and the memorandum from independent counsel, the directors reviewed information provided prior to and presented at the November Special Meeting concerning the following:
| • | | The terms of each Advisory Agreement, including: a list of services performed by Artisan Partners; Artisan Partners’ responsibility for making investment decisions and for observing investment objectives, policies and restrictions of each Artisan Fund; Artisan Partners’ standard of care; and termination provisions; |
| • | | Artisan Partners’ personnel and operations, including: the education, experience and number of Artisan Partners’ investment personnel; Artisan Partners’ assessment of its ability to attract and retain capable investment and business professionals through compensation programs and equity participation and recent hiring and retention information; Artisan Partners’ research and decision-making processes, including methods adopted to ensure compliance with investment objectives, policies and restrictions of the Funds; policies relating to the assignment of Artisan Partners’ personnel to the various Funds’ portfolios; the compensation of Artisan Partners’ personnel with primary responsibility for managing the Funds; the time and attention of Artisan Partners’ personnel devoted to the Funds; and the adequacy and sophistication of Artisan Partners’ technology and systems with respect to investment and administrative matters; |
| • | | Each Fund’s short- and long-term investment performance, including a comparison for various time periods with (1) other Artisan Partners client accounts managed in the same investment strategy, (2) other mutual funds having similar investment objectives, and (3) appropriate market indices; |
| • | | Potential for conflicts of interest between the Funds and Artisan Partners and circumstances and actions addressing or bearing on potential conflicts of interest, including: the type and number of other clients served by Artisan Partners in each of its investment strategies; the basis of sharing personnel, services, research and advice among |
47
FACTORS CONSIDERED IN RENEWING THE FUNDS’ ADVISORY AGREEMENTS
| | clients; the basis of decisions by Artisan Partners to buy or sell securities for the Funds and other clients where the same security might be bought or sold for a number of clients; Artisan Partners’ methodology of allocating investment opportunities, including initial public offerings, among the Funds and other clients; potential advantages and disadvantages in having an investment adviser that has other clients; Artisan Partners’ own investments and possible conflicts with the Funds; Artisan Partners’ code of ethics; any litigation pending, threatened or settled involving Artisan Partners; and results of any regulatory examinations; |
| • | | Potential “fall-out” benefits gained by Artisan Partners or its affiliates from their relationship with the Funds, including: benefits to Artisan Partners in attracting and retaining other clients and the method of estimating other benefits; |
| • | | Brokerage and portfolio transactions, including: the standards and performance in seeking best execution; commissions paid, including commissions by purpose; allocation of brokerage for research products and services (soft dollars); Artisan Partners’ practices in light of SEC guidance under Section 28(e) of the Securities Exchange Act of 1934; and portfolio turnover rates; |
| • | | The structure of advisory fees charged, including: the method of computing fees; recognition of economies of scale through breakpoints in the fees; the frequency of the payment of fees; a comparison of the fees charged by Artisan Partners to the Funds with the fees charged by Artisan Partners to other accounts managed by Artisan Partners in the same investment strategies, including other mutual funds for which Artisan Partners provides sub-advisory services; a comparison of the fees charged by Artisan Partners to the Funds with the management fees charged by other investment advisers for managing mutual funds with similar investment objectives and strategies; and potential cost savings by Artisan Partners, incentives to effect savings and the sharing of savings with the Funds; |
| • | | The effect of advisory and other fees on the Funds’ total expenses, including: comparisons of expenses and expense ratios with those of other mutual funds, taking into account comparability factors such as size, account-level charges and investment objective; voluntary expense limitations or reductions and the relationship of expenses to expense limitations; the allocation of certain expenses between Artisan Partners, Distributor and the Funds; and fees paid to service providers other than Artisan Partners, including custodial, transfer agent and shareholder servicing fees; |
| • | | The financial condition and stability of Artisan Partners, including Artisan Partners’ consolidated balance sheet; and |
| • | | The profitability to Artisan Partners of its relationship with each Fund, including: unaudited schedules showing Artisan Partners’ revenues, costs and profits in providing services to the Funds, on a fund-by-fund basis; the methods of allocating expenses in compiling those statements and the impact different methods would have on overall profitability; and Artisan Partners’ profit margins and appropriate comparisons with Artisan Partners’ profit margins on private account advisory fees. |
At the end of the November Special Meeting, after discussion and consideration of the information presented, the independent directors met in executive session with their independent counsel and subsequently requested additional supplemental material concerning the funds for which Artisan Partners serves as subadviser.
48
FACTORS CONSIDERED IN RENEWING THE FUNDS’ ADVISORY AGREEMENTS
On November 9, 2006, the independent directors then again met separately with their independent counsel to review and discuss relevant information regarding the continuation of the Advisory Agreements and the information presented and discussed at the November Special Meeting. In the course of this review process, the independent directors reviewed and discussed the following information:
The nature, extent and quality of Artisan Partners’ services. The independent directors reviewed the nature, extent and the quality of Artisan Partners’ services to the Funds and considered the following:
| • | | Because Artisan Partners’ principal responsibility is management of the Funds’ investment portfolios, the investment performance achieved by Artisan Partners is an important measure of the quality of the services provided. |
| • | | Besides investment management, Artisan Partners provides the Funds with general administration services, including the preparation of regulatory filings, supervises the pricing of the Funds’ portfolios and calculation of net asset value, provides services to certain of the Funds’ shareholders and management of the Funds’ relationships with its third party service providers, including its custodian, fund accounting agent, transfer agent, lawyers and auditors. |
| • | | The quality of Artisan Partners’ services to the Funds in absolute terms and relative to mutual fund industry standards. |
| • | | The sufficiency and quality of Artisan Partners personnel. |
| • | | Artisan Partners’ financial condition. |
The investment performance of each Fund. The independent directors reviewed for each Fund for periods ended June 30, 2006 short-term and long-term investment performance compared to broad-based and style specific market indexes, performance for the period January 1, 2006 through September 30, 2006 compared to the same indexes, Morningstar ratings™ (for those Funds rated by Morningstar) and Lipper rankings. The independent directors concluded that the overall investment performance of each Fund has been good to excellent and with respect to Artisan Small Cap Fund performance has been acceptable. In reaching that conclusion, the independent directors considered the following:
| • | | Because of each Fund’s style specific investment strategy, the investment performance of each Fund and, in particular, its performance compared to a broad based market index is affected by the relative performance of growth-oriented stocks and value-oriented stocks in the market overall. |
| • | | A fund’s relative performance in the Lipper performance universe may be significantly influenced by the style category in which Lipper places the fund. |
| • | | The performance of each Fund, without taking expenses into account, was consistent with the performance, before expenses, of other accounts managed by Artisan Partners in the same investment strategy. |
Cost of services, economies of scale and benefits derived by Artisan Partners. The independent directors reviewed the overall expense ratio of each class of shares of each Fund in comparison to the expense ratios of its peers in relation to the nature and quality of services provided and in relation to the fees Artisan Partners charges its other clients who have similar investment strategies and objectives (but to whom Artisan Partners
49
FACTORS CONSIDERED IN RENEWING THE FUNDS’ ADVISORY AGREEMENTS
generally provides few or no services other than portfolio management). The independent directors also considered whether shareholders of the Funds have benefited or will benefit from economies of scale under the management fee structures in the Advisory Agreements, including the fact that since International Small Cap Fund closed at a relatively low asset level, Artisan Partners is not likely to enjoy economies of scale in its management. In their review, the independent directors considered the following:
| • | | The rates of fee paid by each Fund to Artisan Partners have been stable or have decreased as a percentage of Fund assets as a result of fee breakpoints, but the aggregate dollar amounts of the fees paid have increased as the Funds have grown. |
| • | | In return for its services, each Fund, other than Artisan International Small Cap Fund, pays Artisan Partners a monthly fee at the annual rate of 1% of the Fund’s average daily net assets up to $500 million; 0.975 of 1% of the next $250 million; 0.950 of 1% of the next $250 million; and 0.925 of 1% of average daily net assets over $1 billion. In addition, Artisan International Fund pays Artisan Partners a monthly fee at the annual rate of 0.900 of 1% of the Fund’s average daily net assets over $12 billion. Artisan International Small Cap Fund pays Artisan Partners a monthly fee at the annual rate of 1.25% of the Fund’s average daily net assets. |
| • | | Although the management fee paid to Artisan Partners by many of the Funds was slightly higher than the median of fees paid by other funds in Lipper’s expense groups for the respective Funds, each Fund’s total expense ratio generally was lower than or comparable to the median total expense ratio of those other funds. |
Profitability of Artisan Partners. The independent directors reviewed a profitability analysis for Artisan Partners for the twelve-month period ended June 30, 2006, including a comparison of the fees charged to the Funds and Artisan Partners’ separate account clients. The independent directors also considered the fact that the relationship with each of the Funds being reviewed was profitable to Artisan Partners during the twelve-months ended June 30, 2006.
Other benefits derived by the Funds or Artisan Partners. The independent directors then reviewed the potential benefits that Artisan Partners may derive as a result of its relationship with the Funds, other than the services provided by Artisan Partners pursuant to the Advisory Agreements and the management fees paid in return. For Artisan Partners, the independent directors considered two potential benefits to Artisan Partners: (1) the potential conversion of a Fund shareholder to a separate account client; and (2) the acquisition of research products and services in return for commissions (“soft dollars”). The independent directors noted that, although Artisan Partners derives or may derive those additional benefits, the Funds also benefit in similar fashion. In reaching those conclusions, the independent directors considered the following:
| • | | Artisan Partners does not solicit the Funds’ shareholders to become separate account clients nor to purchase other goods or services provided by Artisan Partners or its affiliates. Artisan Partners refers potential separate account clients that do not meet Artisan Partners’ minimum separate account size requirements to the Funds. |
| • | | Artisan Partners utilizes third-party research products and services and proprietary research from executing brokers paid for with soft dollars paid by the Funds and by other clients of Artisan Partners. Artisan Partners’ use of soft dollars provides Artisan Partners, and thereby the Funds, with access to third party and proprietary research and also helps |
50
FACTORS CONSIDERED IN RENEWING THE FUNDS’ ADVISORY AGREEMENTS
| | Artisan Partners maintain important and open relationships with brokers. Use of a Fund’s commissions for soft dollar purposes is on the same terms as every other client account managed by Artisan Partners in the same investment strategy. |
The directors concluded their annual Advisory Agreement contract review at a regularly scheduled meeting on November 10, 2006. At the November 10th meeting, the independent directors and counsel to the independent directors reviewed with the full board the information discussed at the November 9th meeting. The directors then considered whether any further discussion or review was necessary, concluding that the November Special Meeting and the information reviewed by the independent directors at the November 9th meeting provided a strong basis for considering the continuation of the Advisory Agreements. The directors then reviewed and affirmed each of the following conclusions:
The nature, extent and quality of Artisan Partners’ services. The directors concluded that the nature and extent of Artisan Partners’ services to the Funds was appropriate and consistent with, and in some cases more advantageous to the Funds than, the terms of the Advisory Agreements. The directors concluded that the quality of Artisan Partners’ services has been consistently high, with no material deficiencies.
The investment performance of each Fund. The directors concluded that the overall performance of each Fund has been good to excellent and with respect to Artisan Small Cap Fund, performance has been acceptable.
Cost of services, economies of scale and benefits derived by Artisan Partners. The directors concluded that the overall expense ratio of each class of shares of each Fund was within an acceptable range of, and in line with industry averages. The directors concluded that the fees each Fund pays to Artisan Partners (and Artisan Partners’ corresponding profits) are reasonable in relation to the nature and quality of services provided to the Funds and in relation to the fees Artisan Partners charges its other clients who have similar investment strategies and objectives (but to whom Artisan Partners generally provides few or no services other than portfolio management). The directors also concluded that shareholders of the Funds (except for Artisan International Small Cap Fund) have benefited or will benefit from economies of scale under the management fee structures in the Advisory Agreements, and that, because International Small Cap Fund closed at such a small asset level, Artisan Partners is not likely to enjoy economies of scale in its management.
Other benefits derived by the Funds or Artisan Partners. The directors concluded that, other than the services provided by Artisan Partners pursuant to the Advisory Agreements and the management fees paid in return, the Funds and Artisan Partners may potentially benefit from their relationship with each other in several ways. For Artisan Partners, the directors concluded there were two principal benefits: (1) the potential conversion of a Fund shareholder to a separate account client; and (2) the acquisition of research products and services in return for commissions (“soft dollars”). The directors concluded that, although Artisan Partners derives or may derive those additional benefits, the Funds also could benefit from conversions of separate account clients to Fund investors and did benefit from Artisan Partners’ use of soft dollars with respect to its separate account clients. Following those discussions, the board approved the continuation of each Advisory Agreement through November 30, 2007 by the unanimous vote of all directors and also by the unanimous vote of all the “non-interested” directors.
51
NOTES ON MANAGEMENT’S DISCUSSION OF FUND PERFORMANCE
The discussions of each Fund included in this report include statistical information about the portfolios of each of the Funds. Except as otherwise noted, that information is as of March 31, 2007. That information will vary with changes in a Fund’s portfolio investments. The performance information for each Fund relative to its benchmark index discussed in this Report was prepared by the Adviser using information reported by FactSet Databases (“FactSet”). For the purposes of assigning portfolio securities to a particular country, the Adviser considers an issuer to be from a particular country as designated by its securities information vendors. The Adviser currently uses MSCI as its primary source and FactSet as a secondary source for this information. As a result, Artisan Mid Cap Fund, routinely holds securities of issuers organized outside the U.S., but with their primary trading markets in the U.S. In addition, Artisan Mid Cap Fund may hold a limited number of non-U.S. securities that are traded in the U.S., directly or as ADRs. Also based on the designations of the securities information vendors, Artisan International Fund and Artisan International Value Fund routinely hold securities of issuers organized within the U.S. and/or issuers with their primary trading markets in the U.S. Artisan Emerging Markets Fund may hold securities of issuers organized in developed markets or traded in developed markets. In the event (i) the Adviser’s securities information vendors do not assign a security to a particular country or if the published classification appears to be erroneous, or (ii) its primary vendor does not assign a security to a particular country and the secondary vendor has assigned a security to a particular country by using a methodology that is not the same as the methodology the primary vendor uses to assign a country, the Adviser assigns the security to a country using the primary vendor’s published criteria (to the extent available) or the Adviser’s own judgment. The primary information vendor’s criteria include the identity of the jurisdiction of the issuer’s incorporation, the main equity trading market for the issuer’s securities, the geographical distribution of the issuer’s operations and the location of the issuer’s headquarters. Country designations may change over time.
For the purposes of assigning portfolio securities to a particular sector and industry, the Adviser considers an issuer to be included in a particular sector and industry as classified by its securities information vendors, Artisan Mid Cap Fund assigns securities in accordance with the sector and industry classifications provided by The Frank Russell Company (to the extent available) as a primary source and FactSet (to the extent available) as a secondary source for this information. Artisan Emerging Markets Fund, Artisan International Fund and Artisan International Value Fund assign securities for these purposes in accordance with the sector and industry classifications provided by MSCI (to the extent available) as a primary source and FactSet (to the extent available) as a secondary source for this information. In the event the Adviser’s securities information vendors do not classify a security to a particular sector and industry or if the published classification appears to be erroneous, the Adviser will classify the security according to the Adviser’s own judgment, using other securities information vendors, the company description and publicly available information about the company’s peer group. Sector and industry classifications may change over time.
The names of portfolio securities reflected in this report are as reported by the Funds’ data providers, may not represent the legal name of the entity and, in some cases, are translations of non-English names.
52
NOTES ON MANAGEMENT’S DISCUSSION OF FUND PERFORMANCE
Definitions of Portfolio Statistics
Median Market Cap provides a measure of the market capitalization value of the companies in a portfolio. Market capitalization is the aggregate value of all a company’s outstanding common stock. Market capitalization is calculated by FactSet using the price as of the most recent month-end multiplied by the number of shares outstanding as shown in the financial statements of the issuer. Equal numbers of companies in the portfolio have market capitalizations higher and lower than the median. Weighted Average Market Cap is the average of the market capitalizations of the companies in the portfolio weighted by the size of each company’s position within the portfolio.
Descriptions of Indices
Each Fund’s performance is compared in this report to changes in one or more indices, including in all cases a broad-based index of changes in prices of securities in the market in which the Fund invests. All of the indices are unmanaged and their returns include reinvested dividends. Unlike the Funds’ returns, the returns of each index do not include the payment of sales commissions or other expenses that would be incurred in the purchase or sale of the securities included in that index. An investment cannot be made directly in an index.
The indices to which the Funds are compared are:
Artisan Emerging Markets Fund – Morgan Stanley Capital International Emerging Markets IndexSM is a market-weighted index of companies in emerging markets.
Artisan International Fund – Morgan Stanley Capital International EAFE® Index (MSCI EAFE®) is a market-weighted index of companies in developed markets, excluding the U.S. and Canada. Morgan Stanley Capital International EAFE® Growth Index (MSCI EAFE® Growth) is a market-weighted index of companies in developed markets, excluding the U.S. and Canada, with higher price-to-book ratios.
Artisan International Value Fund – Morgan Stanley Capital International EAFE® Index (MSCI EAFE®) is a market-weighted index of companies in developed markets, excluding the U.S. and Canada. Morgan Stanley Capital International EAFE® Value Index (MSCI EAFE® Value) is a market-weighted index of companies in developed markets, excluding the U.S. and Canada, with lower price-to-book ratios.
Artisan Mid Cap Fund – Russell Midcap® Index is a market-weighted index of about 800 medium-sized U.S. companies. The Russell Midcap® Growth Index is a market-weighted index of those medium-sized companies included in the Russell Midcap® Index with higher price-to-book and higher forecasted growth values.
Trademarks
Trademarks and copyrights relating to the indices and products of portfolio companies mentioned in this report are owned by their respective owners. Except as otherwise indicated, the trademarks, including names, logos, slogans and service marks appearing in this report are the property of the Adviser and may not be copied, reproduced, published or in any way used without written permission.
53
PROXY VOTING POLICIES AND PROCEDURES
You may obtain a description of Artisan Funds’ proxy voting policies and procedures, without charge, upon request by calling 800.399.1770. That information also is included in Artisan Funds’ statement of additional information, which is available without charge, upon request, by calling 800.399.1770 and at the Securities and Exchange Commission’s website at www.sec.gov.
Information relating to how Artisian International Fund, Artisian International Value Fund and Artisian Mid Cap Fund voted proxies relating to portfolio securities held during the twelve months ended June 30 is available on the Funds’ website at www.artisanfunds.com and on the Securities and Exchange Commission’s website at www.sec.gov. Information relating to Artisan Emerging Markets Fund will be available for the twelve months ended June 30, 2007 on its website at www.artemf.com and on the SEC’s website at www.sec.gov in August 2007.
INFORMATION ABOUT PORTFOLIO SECURITIES
Artisan Funds files a complete schedule of portfolio holdings with the Securities and Exchange Commission for the quarters ending December 31 and June 30 (the first and third quarters of the Funds’ fiscal year) on Form N-Q. The Funds’ Forms N-Q are available on the Securities and Exchange Commission’s website at www.sec.gov. You may also review and copy those documents by visiting the Securities and Exchange Commission’s Public Reference Room in Washington, D.C. Information on the operation of the Public Reference Room may be obtained by calling the Securities and Exchange Commission at 800.SEC.0330.
54
| | | | |
 | | ARTISAN FUNDS P.O. BOX 8412 BOSTON, MA 02266-8412 800.399.1770 | | |
Not applicable for semiannual reports.
| Item 3. | Audit Committee Financial Expert. |
Not applicable for semiannual reports.
| Item 4. | Principal Accountant Fees and Services. |
Not applicable for semiannual reports.
| Item 5. | Audit Committee of Listed Registrants. |
Not applicable.
| Item 6. | Schedule of Investments. |
The Schedule of Investments in securities of unaffiliated issuers is included as part of the semiannual reports to shareholders filed under Item 1 of this Form.
| Item 7. | Disclosure of Proxy Voting Policies and Procedures for Closed-End Management Investment Companies. |
Not applicable.
| Item 8. | Portfolio Managers of Closed-End Management Investment Companies. |
Not applicable.
| Item 9. | Purchases of Equity Securities by Closed-End Management Investment Company and Affiliated Purchasers. |
Not applicable.
| Item 10. | Submission of Matters to a Vote of Security Holders. |
The registrant has a governance and nominating committee, which is responsible for selecting and nominating persons for election or appointment as members of registrant’s board of directors. At a meeting of the committee held on August 19, 2004, the committee adopted guidelines by which the committee, which is comprised entirely of independent directors, will consider any candidates for board membership (whether recommended by a shareholder, the committee, the board of directors or management personnel). At a meeting of the committee held on February 8, 2007, the committee revised the guidelines to include the consideration of the effect of the registrant’s retirement policy on the potential length of service of any candidate.
| Item 11. | Controls and Procedures. |
(a) The registrant’s principal executive and principal financial officers have concluded, based on an evaluation of the registrant’s disclosure controls and procedures (as defined in Rule 30a-3(c) under the Investment Company Act of 1940, the “Disclosure Controls”) as of a date within 90 days prior to the filing date (the “Filing Date”) of this Form N-CSR (the “Report”), the Disclosure Controls are effectively designed to ensure that information required to be disclosed by the registrant in the Report is recorded, processed, summarized and reported by the Filing Date, including ensuring that information required to be disclosed in the Report is accumulated and communicated to the registrant’s management, including the registrant’s principal executive officer and principal financial officer, as appropriate to allow timely decisions regarding required disclosure.
(b) There were no changes in the registrant’s internal controls over financial reporting (as defined in Rule 30a-3(d) under the Investment Company Act of 1940) that occurred during the second fiscal quarter of the period covered by this report that have materially affected, or are reasonably likely to materially affect, the registrant’s internal control over financial reporting.
| | | | |
(a) | | (1) | | Not applicable for semiannual reports |
| | |
| | (2) | | Certifications of Andrew A. Ziegler, Principal Executive Officer and Lawrence A. Totsky, Principal Financial Officer pursuant to Rule 30a-2(a) under the Investment Company Act of 1940 (17 CFR 270.30a-2(a)), attached hereto as Exhibits (a)(2)(i) and (a)(2)(ii) |
| | |
(b) | | | | Certification of Andrew A. Ziegler, Principal Executive Officer and Lawrence A. Totsky, Principal Financial Officer pursuant to Section 906 of the Sarbanes-Oxley Act of 2002, attached hereto as Exhibit (b) |
SIGNATURES
Pursuant to the requirements of the Securities Exchange Act of 1934 and the Investment Company Act of 1940, the registrant has duly caused this report to be signed on its behalf by the undersigned, thereunto duly authorized.
| | | | |
Artisan Funds, Inc. | | |
| | |
By: | | /s/ Andrew A. Ziegler | | |
| | Andrew A. Ziegler | | |
| | Principal Executive Officer | | |
Date: | | June 7, 2007 | | |
Pursuant to the requirements of the Securities Exchange Act of 1934 and the Investment Company Act of 1940, this report has been signed below by the following persons on behalf of the registrant and in the capacities and on the dates indicated.
| | | | |
| By: | | /s/ Andrew A. Ziegler | | |
| | Andrew A. Ziegler | | |
| | Principal Executive Officer | | |
| Date: | | June 7, 2007 | | |
| | |
| By: | | /s/ Lawrence A. Totsky | | |
| | Lawrence A. Totsky | | |
| | Principal Financial Officer | | |
| Date: | | June 7, 2007 | | |