UNITED STATES
SECURITIES AND EXCHANGE COMMISSION
Washington, D.C. 20549
FORM N-CSR
CERTIFIED SHAREHOLDER REPORT OF REGISTERED
MANAGEMENT INVESTMENT COMPANIES
Investment Company Act file number 811-08932
Artisan Funds, Inc.
(Exact name of registrant as specified in charter)
875 East Wisconsin Avenue, Suite 800
Milwaukee, WI 53202
(Address of principal executive offices) (Zip Code)
| | |
| Janet D. Olsen | | Alyssa Albertelli |
| Artisan Funds, Inc. | | Ropes & Gray LLP |
| 875 East Wisconsin Avenue, Suite 800 | | One Metro Center |
| Milwaukee, Wisconsin 53202 | | 700 12th Street, N.W., Suite 900 |
| | Washington, D.C. 20005-3948 |
| (Name and address of agents for service) |
Registrant’s telephone number, including area code: (414) 390-6100
Date of fiscal year end: 9/30/10
Date of reporting period: 3/31/10
Form N-CSR is to be used by management investment companies to file reports with the Commission not later than 10 days after the transmission to stockholders of any report that is required to be transmitted to stockholders under Rule 30e-1 under the Investment Company Act of 1940 (17 CFR 270.30e-1). The Commission may use the information provided on Form N-CSR in its regulatory, disclosure review, inspection, and policymaking roles.
A registrant is required to disclose the information specified by Form N-CSR, and the Commission will make this information public. A registrant is not required to respond to the collection of information contained in Form N-CSR unless the Form displays a currently valid Office of Management and Budget (“OMB”) control number. Please direct comments concerning the accuracy of the information collection burden estimate and any suggestions for reducing the burden to Secretary, Securities and Exchange Commission, 100 F Street, NE, Washington, DC 20549. The OMB has reviewed this collection of information under the clearance requirements of 44 U.S.C. § 3507.
| Item 1. | Reports to Shareholders. |
SEMIANNUAL
R E P O R T
MARCH 31, 2010
ARTISAN GLOBAL EQUITY FUND
ARTISAN GLOBAL VALUE FUND
ARTISAN INTERNATIONAL FUND
ARTISAN INTERNATIONAL SMALL CAP FUND
ARTISAN INTERNATIONAL VALUE FUND
ARTISAN MID CAP FUND
ARTISAN MID CAP VALUE FUND
ARTISAN OPPORTUNISTIC GROWTH FUND
ARTISAN OPPORTUNISTIC VALUE FUND
ARTISAN SMALL CAP FUND
ARTISAN SMALL CAP VALUE FUND

ARTISAN
ARTISAN FUNDS, INC.
INVESTOR SHARES
ARTISAN FUNDS
P.O. BOX 8412
BOSTON, MA 02266-8412
This report and the unaudited financial statements contained herein are provided for the general information of the shareholders of Artisan Funds. Before investing, investors should consider carefully each Fund’s investment objective, risks and charges and expenses. For a prospectus, which contains that information and more information about each Fund, please call 800.344.1770 or visit our website at www.artisanfunds.com. Read it carefully before you invest or send money.
Company discussions are for illustration only and are not intended as recommendations of individual stocks. The discussions present information about the companies believed to be accurate, and the views of the portfolio managers, as of March 31, 2010. That information and those views may change, and the Funds disclaim any obligation to advise shareholders of any such changes. Artisan Emerging Markets Fund, Artisan International Fund, Artisan International Value Fund and Artisan Mid Cap Fund offer other classes of shares. Reports on each of the other classes are available under separate cover.
Artisan Funds offered through Artisan Distributors LLC, member FINRA.
TABLE OF CONTENTS
ARTISAN GLOBAL EQUITY FUND (ARTHX)
Artisan Global Equity Fund, the twelfth series of Artisan Funds, Inc. began operations on March 29, 2010. This semiannual report has been designed to provide an overview of the Fund. We will review the investment process and have provided portfolio statistics as an indication of the Fund’s initial positioning.
INVESTMENT APPROACH
Artisan Global Equity Fund seeks to invest in well-managed, quality growth companies around the globe that the team believes are exposed to secular growth themes and have strong brands and reasonable valuations.
INVESTMENT TEAM
The Fund is co-managed by Barry Dargan and Mark Yockey. Mr. Yockey is also the portfolio manager of Artisan International Fund and Artisan International Small Cap Fund. The duo is supported by Artisan’s deep and highly experienced global equity analyst team.
INVESTMENT PROCESS HIGHLIGHTS
Artisan Global Equity Fund employs a fundamental stock selection process focused on identifying long-term growth opportunities. The investment team’s thematic approach identifies catalysts for change and develops investment themes with the objective of capitalizing on them globally.
Themes. Changing demographics, developing technology, privatization of economic resources, outsourcing and infrastructure are among the long-term catalysts for change that currently form the basis for our investment themes. The team incorporates these catalysts along with sector and regional fundamentals into a long-term global framework for investment analysis and decision-making.
Sustainable Growth. The team applies a fundamental approach to identifying the long-term, sustainable growth characteristics of potential investments. The team seeks high quality companies that are well managed, have a dominant or improving market position and competitive advantages compared to industry and regional peers.
Valuation. The team assesses the relationship between its estimate of a company’s sustainable growth prospects and its stock price. The team utilizes multiple valuation metrics to establish price targets.
2
PERFORMANCE HISTORY
The Fund’s performance and growth of an assumed $10,000 investment chart have been omitted due to the Fund’s short performance history, but will be included in the September 2010 annual report.
PORTFOLIO CONSTRUCTION
| | • | | Capitalization Range. The Fund primarily invests in U.S. and non-U.S. companies of all market capitalizations. |
| | • | | Emerging Markets. The Fund can invest up to 30% of its assets in emerging markets at time of purchase. |
| | • | | Position Size. The Fund’s maximum position size is 5% of assets at the time of purchase in 75% of the portfolio, but in the remaining 25% of the portfolio the team can invest up to 10% of Fund assets at the time of purchase in a single position. |
SECTOR DIVERSIFICATION
| | | |
| Sector | | 3/31/10 | |
Consumer Discretionary | | 10.7 | % |
Consumer Staples | | 17.0 | |
Energy | | 6.4 | |
Financials | | 14.0 | |
Healthcare | | 14.2 | |
Industrials | | 5.1 | |
Information Technology | | 14.4 | |
Materials | | 8.8 | |
Telecommunication Services | | 2.8 | |
Other assets less liabilities | | 6.6 | |
Total | | 100.0 | % |
As a percentage of total net assets.
REGION ALLOCATION
| | | |
| Region | | 3/31/10 | |
Europe | | 36.1 | % |
Americas | | 32.5 | |
Emerging Markets | | 13.2 | |
Pacific Basin | | 11.6 | |
As a percentage of total net assets.
3
ARTISAN GLOBAL VALUE FUND (ARTGX)
INVESTMENT PROCESS HIGHLIGHTS
Artisan Global Value Fund employs a bottom-up investment process to construct a diversified portfolio of securities of undervalued U.S. and non-U.S. companies. The Fund’s investment process is focused on identifying what the investment team considers to be high quality, undervalued businesses that offer the potential for superior risk/reward outcomes. The team’s in-depth research process focuses on four key investment characteristics:
Undervaluation. Determining the intrinsic value of the business is the heart of the team’s research process. The team believes that intrinsic value represents the amount that a buyer would pay to own a company’s future cash flows. The team seeks to invest at a significant discount to the team’s estimate of the intrinsic value of a business.
Business quality. The team seeks to invest in companies with histories of generating strong free cash flow, improving returns on capital and strong competitive positions in their industries.
Financial strength. The team believes that investing in companies with strong balance sheets helps to reduce the potential for capital risk and provides company management the ability to build value when attractive opportunities are available.
Shareholder-oriented management. The team’s research process attempts to identify management teams with a history of building value for shareholders.
PERFORMANCE HISTORY
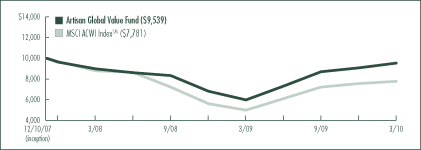
GROWTH OF AN ASSUMED $10,000 INVESTMENT (12/10/2007 to 3/31/2010)
AVERAGE ANNUAL TOTAL RETURNS (as of 3/31/2010)
| | | | | | | | | |
| Fund / Index | | Six
Months(1) | | | 1-Year | | | Since
Inception | |
Artisan Global Value Fund | | 9.56 | % | | 59.63 | % | | -2.02 | % |
MSCI ACWISM (All Country World Index) | | 7.90 | | | 55.48 | | | -10.31 | |
The performance quoted represents past performance, which does not guarantee future results. The investment return and principal value of an investment in the Fund will fluctuate, so that an investor’s shares in the Fund, when redeemed, may be worth more or less than their original cost. The Fund’s return may vary greatly over short periods, and current performance may be materially lower or higher than the performance data quoted. For current to most recent month-end performance information, visit www.artisanfunds.com or call 800.344.1770. The graph and table above do not reflect the deduction of taxes that a shareholder would pay on distributions or sale of Fund shares. The performance shown does not reflect the deduction of a 2% redemption fee on shares held by an investor for 90 days or less and, if reflected, the fee would reduce the performance quoted. The Fund’s performance information reflects Artisan Partners’ agreement to limit the Fund’s expenses to no more than 1.50%, which has been in effect since the Fund’s inception and has had a material impact on the Fund’s performance, which would have been lower in its absence. See page 111 for a description of the index.
4
INVESTING ENVIRONMENT
Global equity markets, as measured by the MSCI All Country World IndexSM, advanced 7.90% during the six-month period ended March 31, 2010 as economies around the world began to show signs of stabilization. The economic environment, however, remained muted as concerns surrounding large government deficits in several developed markets, including the U.S., weighed on sentiment.
SECTOR DIVERSIFICATION
| | | | | | |
| Sector | | 9/30/09 | | | 3/31/10 | |
Consumer Discretionary | | 21.5 | % | | 22.9 | % |
Consumer Staples | | 14.2 | | | 14.5 | |
Energy | | 2.3 | | | 2.1 | |
Financials | | 22.6 | | | 27.5 | |
Healthcare | | 9.3 | | | 8.1 | |
Industrials | | 14.5 | | | 14.6 | |
Information Technology | | 9.1 | | | 5.6 | |
Materials | | 2.4 | | | — | |
Other assets less liabilities | | 4.1 | | | 4.7 | |
Total | | 100.0 | % | | 100.0 | % |
As a percentage of total net assets.
PERFORMANCE DISCUSSION
Though the economic environment was still uneven, our portfolio returned 9.56% as we remained focused on the intersection of balance sheet strength, business quality and valuation.
Performance of the following stocks had a positive impact on the Fund: American Express Company, a credit card company; Signet Jewelers Ltd., a jewelry retailer in the U.S. and U.K.; Experian PLC, a U.K. credit-verification company; Compass Group PLC, a contract caterer; and Tyco Electronics Ltd., a U.S. electronic components manufacturer. Some of our worst performers included: SANKYO CO., LTD., a Japanese pachinko machine manufacturer; Cintas Corporation, a U.S. uniform manufacturer; Dell Inc., a U.S. computer maker; Pargesa Holding SA, a Swiss holding company; and Home Retail Group plc, a U.K. home and general merchandise retailer.
REGION ALLOCATION
| | | | | | |
| Region | | 9/30/09 | | | 3/31/10 | |
Americas | | 43.0 | % | | 45.5 | % |
Europe | | 45.2 | | | 42.5 | |
Pacific Basin | | 6.4 | | | 7.3 | |
Emerging Markets | | 1.3 | | | — | |
As a percentage of total net assets.
FUND CHANGES
Although new investments were harder to find as markets improved, we did identify several new investment opportunities for the portfolio during the period. New purchases included food distributor Sysco Corporation, British lender Lloyds Banking Group plc, U.S. property and casualty insurer The Chubb Corporation, U.S. for-profit education company Apollo Group, Inc. and Japanese megabank Mitsubishi UFJ Financial Group, Inc. Our sales during the period included Givaudan SA, Grupo Modelo, S.A. de C.V. and Cadbury PLC.
5
ARTISAN INTERNATIONAL FUND (ARTIX)
INVESTMENT PROCESS HIGHLIGHTS
Artisan International Fund employs a fundamental stock selection process focused on identifying long-term growth opportunities.
Themes. The investment team’s thematic approach identifies catalysts for change and develops investment themes with the objective of capitalizing on them globally. Changing demographics, developing technology, privatization of economic resources, outsourcing and infrastructure are among the long-term catalysts for change that currently form the basis for the team’s investment themes. The team incorporates these catalysts along with sector and regional fundamentals into a long-term global framework for investment analysis and decision-making.
Sustainable Growth. The team applies a fundamental approach to identifying the long term, sustainable growth characteristics of potential investments. The team seeks high quality companies that are well managed, have a dominant or improving market position and competitive advantages compared to industry and regional peers.
Valuation. The team assesses the relationship between its estimate of a company’s sustainable growth prospects and the company’s stock price. The team uses multiple valuation metrics to establish price targets.
PERFORMANCE HISTORY
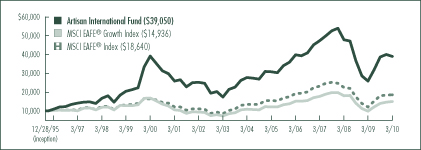
GROWTH OF AN ASSUMED $10,000 INVESTMENT (12/28/1995 to 3/31/2010)
AVERAGE ANNUAL TOTAL RETURNS (as of 3/31/2010)
| | | | | | | | | | | | | | | | | | |
| Fund / Index | | Six
Months(1) | | | 1-Year | | | 3-Year | | | 5-Year | | | 10-Year | | | Since
Inception | |
Artisan International Fund | | 1.11 | % | | 51.22 | % | | -6.16 | % | | 4.90 | % | | -0.03 | % | | 10.03 | % |
MSCI EAFE® Growth Index | | 6.20 | | | 50.61 | | | -5.70 | | | 4.24 | | | -1.26 | | | 2.85 | |
MSCI EAFE® Index | | 3.06 | | | 54.44 | | | -7.02 | | | 3.75 | | | 1.27 | | | 4.46 | |
The performance quoted represents past performance, which does not guarantee future results. The investment return and principal value of an investment in the Fund will fluctuate, so that an investor’s shares in the Fund, when redeemed, may be worth more or less than their original cost. Current performance may be lower or higher than the performance data quoted. For current to most recent month-end performance information, visit www.artisanfunds.com or call 800.344.1770. The graph and table above do not reflect the deduction of taxes that a shareholder would pay on distributions or sale of Fund shares. The performance shown does not reflect the deduction of a 2% redemption fee on shares held by an investor for 90 days or less and, if reflected, the fee would reduce the performance quoted. See page 111 for a description of each index.
6
INVESTING ENVIRONMENT
The MSCI EAFE® Index was up 3.06% during the six-month period ended March 31, 2010. The market environment was choppy during the period as countries and economies around the globe continued to deal with the aftermath of the financial crisis. Concerns mounted over Greece’s ability to refinance its debt and the contagion spread over to other sovereign debt issues within the EU. Sentiment improved late in the period when government officials in Greece passed austerity measures aimed at lowering its budget deficit and restoring confidence in its financial condition. Most market sectors posted solid gains during the period. The most notable exception was the financials sector, which dipped 5%, largely due to weakness among European banks. International currencies were generally weak against the U.S. dollar during the period, which eroded some of the gains in the market for U.S. dollar based investors.
SECTOR DIVERSIFICATION
| | | | | | |
| Sector | | 9/30/09 | | | 3/31/10 | |
Consumer Discretionary | | 12.1 | % | | 14.9 | % |
Consumer Staples | | 14.2 | | | 12.8 | |
Energy | | 4.5 | | | 1.3 | |
Financials | | 30.7 | | | 26.1 | |
Healthcare | | 10.1 | | | 10.5 | |
Industrials | | 11.2 | | | 15.3 | |
Information Technology | | 6.4 | | | 8.0 | |
Materials | | 6.6 | | | 8.2 | |
Telecommunication Services | | 1.6 | | | — | |
Utilities | | 1.5 | | | 1.8 | |
Other assets less liabilities | | 1.1 | | | 1.1 | |
Total | | 100.0 | % | | 100.0 | % |
As a percentage of total net assets.
PERFORMANCE DISCUSSION
The Fund ended the period with a return of 1.11%.
Our top performers came from a variety of sectors and included semiconductor manufacturer ASML Holding N.V., multinational food company Nestle SA, rail and freight services provider Canadian Pacific Railway Limited, trading company MITSUI & CO., LTD. and gases and engineering company Linde AG.
On the downside, several of our European financial holdings were among our biggest decliners during the period. Included in that group were ING Groep N.V. (Netherlands), Societe Generale (France) and Intesa Sanpaolo (Italy), as well as two positions we sold during the period, The Governor and Company of the Bank of Ireland (Ireland) and Credit Suisse Group AG (Switzerland).
REGION ALLOCATION
| | | | | | |
| Region | | 9/30/09 | | | 3/31/10 | |
Europe | | 68.7 | % | | 64.9 | % |
Pacific Basin | | 9.5 | | | 13.9 | |
Emerging Markets | | 13.9 | | | 12.8 | |
Americas | | 6.8 | | | 7.3 | |
As a percentage of total net assets.
FUND CHANGES
We look to invest in companies with attractive growth rates, trading at reasonable valuations, with exposure to the long-term themes we have identified. Our larger purchases during the period included Netherlands-based mail and logistics services provider TNT NV, Japanese auto manufacturer HONDA MOTOR CO., LTD., Hong Kong-based resort and casino operator Sands China Ltd., German electric company RWE AG and Hong Kong-based flavor and fragrances company Huabao International Holdings Limited.
Sales during the period included Gazprom, Heineken Holding NV, Telefonica S.A., Allianz SE and Assicurazioni Generali S.p.A.
7
ARTISAN INTERNATIONAL SMALL CAP FUND (ARTJX)
INVESTMENT PROCESS HIGHLIGHTS
Artisan International Small Cap Fund employs a fundamental stock selection process focused on identifying long-term growth opportunities among small non-U.S. companies.
Themes. The investment team’s thematic approach identifies catalysts for change and develops investment themes with the objective of capitalizing on them globally. Changing demographics, developing technology, privatization of economic resources, outsourcing and infrastructure are among the long-term catalysts for change that currently form the basis for the team’s investment themes. The team incorporates these catalysts along with sector and regional fundamentals into a long-term global framework for investment analysis and decision-making.
Sustainable Growth. The team applies a fundamental approach to identifying the long term, sustainable growth characteristics of potential investments. The team seeks high quality companies that are well managed, have a dominant or improving market position and competitive advantages compared to industry and regional peers.
Valuation. The team assesses the relationship between its estimate of a company’s sustainable growth prospects and the company’s stock price. The team uses multiple valuation metrics to establish price targets.
PERFORMANCE HISTORY
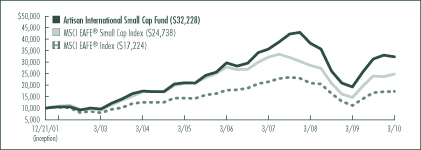
GROWTH OF AN ASSUMED $10,000 INVESTMENT (12/21/2001 to 3/31/2010)
AVERAGE ANNUAL TOTAL RETURNS (as of 3/31/2010)
| | | | | | | | | | | | | | | |
| Fund / Index | | Six
Months(1) | | | 1-Year | | | 3-Year | | | 5-Year | | | Since
Inception | |
Artisan International Small Cap Fund | | 3.05 | % | | 68.48 | % | | -3.25 | % | | 8.94 | % | | 15.19 | % |
MSCI EAFE® Small Cap Index | | 3.69 | | | 70.02 | | | -8.27 | | | 3.60 | | | 11.57 | |
MSCI EAFE® Index | | 3.06 | | | 54.44 | | | -7.02 | | | 3.75 | | | 6.79 | |
The performance quoted represents past performance, which does not guarantee future results. The investment return and principal value of an investment in the Fund will fluctuate, so that an investor’s shares in the Fund, when redeemed, may be worth more or less than their original cost. Current performance may be lower or higher than the performance data quoted. For current to most recent month-end performance information, visit www.artisanfunds.com or call 800.344.1770. The graph and table above do not reflect the deduction of taxes that a shareholder would pay on distributions or sale of Fund shares. The performance shown does not reflect the deduction of a 2% redemption fee on shares held by an investor for 90 days or less and, if reflected, the fee would reduce the performance quoted. The Fund’s investments in initial public offerings (IPOs) made a material contribution to the Fund’s performance. IPO investments are not an integral component of the Fund’s investment process and may not be available in the future. See page 111 for a description of each index.
8
INVESTING ENVIRONMENT
International small-cap equities, as measured by the MSCI EAFE® Small Cap Index, generally trended lower for the first part of the fiscal year until March, when stocks rebounded sharply, recovering losses suffered earlier in the period. Lingering aftershocks of the financial crisis, sovereign debt concerns in the euro zone and a potential slowdown in Chinese bank lending all contributed to the general decline in returns until the upturn in March, when Greece passed austerity measures aimed at reducing its budget deficit and euro zone leaders agreed to create a financial safety net with the IMF to help restore confidence in the euro. The shift in investor sentiment helped the Index end up 3.69% for this semiannual reporting period with all sectors, except financials, generating positive returns. Not surprisingly, the euro zone’s most troubled countries, Greece, Ireland, Portugal, Spain and Italy, comprised the only country decliners in the Index.
SECTOR DIVERSIFICATION
| | | | | | |
| Sector | | 9/30/09 | | | 3/31/10 | |
Consumer Discretionary | | 21.8 | % | | 28.6 | % |
Consumer Staples | | 20.7 | | | 15.4 | |
Financials | | 17.2 | | | 12.4 | |
Healthcare | | 8.4 | | | 8.7 | |
Industrials | | 16.8 | | | 17.5 | |
Information Technology | | 8.8 | | | 9.0 | |
Materials | | 3.5 | | | 2.4 | |
Utilities | | — | | | 1.6 | |
Other assets less liabilities | | 2.8 | | | 4.4 | |
Total | | 100.0 | % | | 100.0 | % |
As a percentage of total net assets.
PERFORMANCE DISCUSSION
The Fund trailed the MSCI EAFE® Small Cap Index over the last six months with a return of 3.05%. Our underperformance largely stemmed from the technology and consumer discretionary sectors. Wirecard AG, a global leader in the e-payment industry, was one of our weakest performers in the technology sector and overall. Home improvement retailer Praktiker Bau-Und Heimwerkermaerkte Holding AG was also a big detractor and largely responsible for stymieing our consumer discretionary holdings.
The primary driver of our absolute performance, as well as the major source of relative strength, was the industrials sector with Schindler Holding AG, and Beijing Enterprises Water Group Limited leading the way. Strong stock selection in the financials sector, led by our commercial bank holdings, Commercial International Bank and Industrial and Commercial Bank of China (Asia) Limited, generated positive results in marked contrast to the Index’s loss in this sector.
Regionally, our Pacific Basin holdings outperformed those in the Index and our investments in emerging markets, particularly China, proved positive. Our German and U.K. stocks were the largest performance detractors in Europe.
REGION ALLOCATION
| | | | | | |
| Region | | 9/30/09 | | | 3/31/10 | |
Europe | | 61.4 | % | | 56.6 | % |
Emerging Markets | | 23.3 | | | 22.7 | |
Pacific Basin | | 10.2 | | | 13.1 | |
Americas | | 2.3 | | | 3.2 | |
As a percentage of total net assets.
FUND CHANGES
As we maneuver through an environment where countries and economies are working through the lasting effects of the global financial crisis, we remain committed to our investment process. We seek to invest in companies with attractive growth rates, trading at reasonable valuations, with exposure to the long-term themes we have identified. Our larger purchases during the period included water treatment company Beijing Enterprises Water Group Limited and U.K. pub companies Punch Taverns plc and Enterprise Inns plc. Sales during the period included Praktiker Bau-Und Heimwerkermaerkte Holding AG, Sky Deutschland AG, Intertek Group plc and Centamin Egypt Limited.
9
ARTISAN INTERNATIONAL VALUE FUND (ARTKX)
INVESTMENT PROCESS HIGHLIGHTS
Artisan International Value Fund employs a bottom-up investment process to construct a diversified portfolio of stocks of undervalued non-U.S. companies. The Fund’s investment process is focused on identifying what the investment team believes are high quality, undervalued businesses that offer the potential for superior risk/reward outcomes. The team’s in-depth research process focuses on four key investment characteristics:
Undervaluation. Determining the intrinsic value of the business is the heart of the team’s research process. The team believes that intrinsic value represents the amount that a buyer would pay to own a company’s future cash flows. The team seeks to invest at a significant discount to its estimate of the intrinsic value of a business.
Business quality. The team seeks to invest in companies with histories of generating strong free cash flow, improving returns on capital and strong competitive positions in their industries.
Financial strength. The team believes that investing in companies with strong balance sheets helps to reduce the potential for capital risk and provides company management the ability to build value when attractive opportunities are available.
Shareholder-oriented management. The team’s research process attempts to identify management teams with a history of building value for shareholders.
PERFORMANCE HISTORY
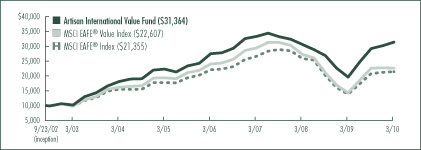
GROWTH OF AN ASSUMED $10,000 INVESTMENT (9/23/2002 to 3/31/2010)
AVERAGE ANNUAL TOTAL RETURNS (as of 3/31/2010)
| | | | | | | | | | | | | | | |
| Fund / Index | | Six
Months(1) | | | 1-Year | | | 3-Year | | | 5-Year | | | Since
Inception | |
Artisan International Value Fund | | 7.35 | % | | 60.19 | % | | -1.90 | % | | 7.13 | % | | 16.42 | % |
MSCI EAFE® Value Index | | 0.04 | | | 58.52 | | | -8.40 | | | 3.20 | | | 11.46 | |
MSCI EAFE® Index | | 3.06 | | | 54.44 | | | -7.02 | | | 3.75 | | | 10.62 | |
The performance quoted represents past performance, which does not guarantee future results. The investment return and principal value of an investment in the Fund will fluctuate, so that an investor’s shares in the Fund, when redeemed, may be worth more or less than their original cost. Current performance may be lower or higher than the performance data quoted. For current to most recent month-end performance information, visit www.artisanfunds.com or call 800.344.1770. The graph and table above do not reflect the deduction of taxes that a shareholder would pay on distributions or sale of Fund shares. The performance shown does not reflect the deduction of a 2% redemption fee on shares held by an investor for 90 days or less and, if reflected, the fee would reduce the performance quoted. See page 111 for a description of each index.
10
INVESTING ENVIRONMENT
International equity markets, as measured by the MSCI EAFE® Index, advanced 3.06% during the six-month period ended March 31, 2010. The economic environment remained muted as concerns surrounding large government deficits in several developed markets, including Greece and the U.S., weighed on sentiment.
SECTOR DIVERSIFICATION
| | | | | | |
| Sector | | 9/30/09 | | | 3/31/10 | |
Consumer Discretionary | | 23.4 | % | | 23.3 | % |
Consumer Staples | | 10.0 | | | 9.3 | |
Energy | | 4.7 | | | 4.3 | |
Financials | | 17.9 | | | 21.8 | |
Healthcare | | 8.8 | | | 7.3 | |
Industrials | | 14.6 | | | 16.4 | |
Information Technology | | 6.1 | | | 7.5 | |
Materials | | 3.2 | | | 2.5 | |
Telecommunication Services | | 1.4 | | | — | |
Other assets less liabilities | | 9.9 | | | 7.6 | |
Total | | 100.0 | % | | 100.0 | % |
As a percentage of total net assets.
PERFORMANCE DISCUSSION
Though the economic environment was still uneven, our portfolio returned 7.35% as we remained focused on the intersection of balance sheet strength, business quality and valuation.
Over the six-month period, we saw a few businesses or industries where revenue growth returned. Corporations also strengthened their balance sheets and continued to cut costs, as at least a partial offset to revenue declines. Equities that made positive contributions to the Fund’s performance included: Signet Jewelers Ltd., a jewelry retailer in the U.S. and U.K.; Experian PLC, a U.K. credit-checking company; Compass Group PLC, a U.K. contract caterer; Tyco Electronics Ltd., a U.S. electronic components manufacturer and Credit Saison Co., Ltd., a Japanese credit card company. Some of the worst performing equities in the portfolio during the period were SANKYO CO., LTD., a Japanese pachinko machine manufacturer; Brit Insurance Holdings NV, a U.K. insurance and reinsurance company; Gemalto NV, a French smart card maker; SEINO HOLDINGS CO., LTD., a Japanese transportation company; and Pargesa Holding SA, a Swiss holding company.
REGION ALLOCATION
| | | | | | |
| Region | | 9/30/09 | | | 3/31/10 | |
Europe | | 64.2 | % | | 66.1 | % |
Americas | | 13.0 | | | 14.0 | |
Pacific Basin | | 10.2 | | | 11.7 | |
Emerging Markets | | 2.7 | | | 0.6 | |
As a percentage of total net assets.
FUND CHANGES
Although new investments were harder to find as markets improved, we did identify several new investment opportunities for the portfolio during the period. We acquired shares in previously mentioned Brit Insurance Holdings NV, publishing group Reed Elsevier PLC, British lender Lloyds Banking Group plc, British defense technology contractor Qinetiq Group PLC, Japanese megabank Mitsubishi UFJ Financial Group, Inc. and Japanese wigmaker Aderans Holdings Company Limited. We funded these purchases in part by selling our shares in Cadbury PLC, SK Telecom Co., Ltd. and Grupo Modelo, S.A. de C.V.
11
ARTISAN MID CAP FUND (ARTMX)
INVESTMENT PROCESS HIGHLIGHTS
Artisan Mid Cap Fund employs a bottom-up investment process to construct a diversified portfolio of primarily U.S. mid-cap growth companies. The Fund’s investment process focuses on two distinct areas – security selection and capital allocation.
The Fund’s investment team attempts to identify companies that possess franchise characteristics that are selling at attractive valuations and benefiting from an accelerating profit cycle.
Franchise characteristics. These are characteristics that the team believes help to protect a company’s stream of cash flow from the effects of competition. The team looks for companies with at least two of the following characteristics: low cost production capability, possession of a proprietary asset, dominant market share or a defensible brand name.
Attractive valuations. Through its own fundamental research, the team estimates the amount a buyer would pay to buy the entire company (the company’s “intrinsic value” or “private market value”) and considers whether to purchase a stock if it sells at a discount to that estimate.
Accelerating profit cycle. The team tries to invest in companies that are well positioned for long-term growth, at an early enough stage in their profit cycle to benefit from the increased cash flows produced by the profit cycle.
Based on the investment team’s fundamental analysis of a company’s profit cycle, portfolio holdings develop through three stages. GardenSM investments are small positions in the early part of their profit cycle that will warrant a more sizeable allocation once their profit cycle accelerates. CropSM investments are positions that are being increased to a full weight because they are moving through the strongest part of their profit cycle. HarvestSM investments are positions that are being reduced as they near the team’s estimate of full valuation or their profit cycle begins to decelerate.
PERFORMANCE HISTORY
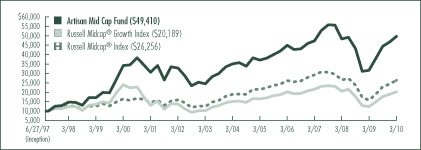
GROWTH OF AN ASSUMED $10,000 INVESTMENT (6/27/1997 to 3/31/2010)
AVERAGE ANNUAL TOTAL RETURNS (as of 3/31/2010)
| | | | | | | | | | | | | | | | | | |
| Fund / Index | | Six
Months(1) | | | 1-Year | | | 3-Year | | | 5-Year | | | 10-Year | | | Since
Inception | |
Artisan Mid Cap Fund | | 12.07 | % | | 56.92 | % | | 1.69 | % | | 5.98 | % | | 3.80 | % | | 13.34 | % |
Russell Midcap® Growth Index | | 14.88 | | | 63.00 | | | -2.04 | | | 4.27 | | | -1.69 | | | 5.66 | |
Russell Midcap® Index | | 15.10 | | | 67.71 | | | -3.30 | | | 4.20 | | | 4.84 | | | 7.86 | |
The performance quoted represents past performance, which does not guarantee future results. The investment return and principal value of an investment in the Fund will fluctuate, so that an investor’s shares in the Fund, when redeemed, may be worth more or less than their original cost. Current performance may be lower or higher than the performance data quoted. For current to most recent month-end performance information, visit www.artisanfunds.com or call 800.344.1770. The graph and table above do not reflect the deduction of taxes that a shareholder would pay on distributions or sale of Fund shares. See page 111 for a description of each index.
12
INVESTING ENVIRONMENT
During the six months ended March 31, 2010, strong earnings reports and evidence that economic and business conditions were steadily improving lifted U.S. mid-cap stocks higher. The Russell Midcap® Index gained 15.10% in the period. Value stocks were slightly favored over growth stocks in the mid-cap market segment as the Russell Midcap® Value Index returned 15.32%, while the Russell Midcap® Growth Index returned 14.88%. Within the Russell Midcap® Growth Index, most sectors earned double-digit percentage gains. The strongest performing sector was health care, rising more than 19%. The utilities sector was the only sector to lose ground, declining 3%.
SECTOR DIVERSIFICATION
| | | | | | |
| Sector | | 9/30/09 | | | 3/31/10 | |
Consumer Discretionary | | 16.0 | % | | 19.9 | % |
Consumer Staples | | 3.0 | | | 1.6 | |
Energy | | 2.1 | | | 5.2 | |
Financials | | 6.5 | | | 5.3 | |
Healthcare | | 17.8 | | | 15.7 | |
Industrials | | 13.2 | | | 12.9 | |
Information Technology | | 34.7 | | | 35.3 | |
Materials | | 2.4 | | | 1.9 | |
Exchange Traded Funds | | 0.7 | | | — | |
Other assets less liabilities | | 3.6 | | | 2.2 | |
Total | | 100.0 | % | | 100.0 | % |
As a percentage of total net assets.
PERFORMANCE DISCUSSION
The Fund participated in the gain, returning 12.07% in the period. The technology, materials and energy sectors were sources of positive returns. In the technology sector, returns were led by Cree, Inc., a provider of LED (Light Emitting Diode) chips and lighting solutions, ARM Holdings PLC, a developer and licenser of microprocessors and Agilent Technologies, Inc., a manufacturer of test and measurement products, among others. Top performers in the materials and energy sectors included fertilizer company Agrium Inc. and energy services and equipment provider Smith International, Inc.
Returns on holdings in the health care sector were not as strong. Our underperformers in the health care sector included Illumina, Inc., a developer of tools for genetic analysis, and athenahealth, Inc., a clinical billing software provider. The industrials and financials sectors were also areas of underperformance. In the industrials sector, solar panel maker First Solar, Inc. and contracting services company Quanta Services, Inc. detracted from returns. Our results in the financials sector suffered from our lack of real estate investment trusts (REITS) and a negative return by brokerage services provider TD Ameritrade Holding Corporation.
FUND CHANGES
The most notable changes to the portfolio during the period were increased exposure to the consumer discretionary and energy sectors and a reduced weighting in the health care sector. In the consumer discretionary sector, we added to our positions in Harman International Industries, Incorporated and Ctrip.com International, Ltd. and purchased Polo Ralph Lauren Corporation and Gafisa S.A. In the energy sector, we increased our position in Smith International, Inc. Other significant purchases included Cummins Inc., Edwards Lifesciences Corporation and GSI Commerce, Inc.
Our reduced weighting in the health care sector was due in part to the sale of C.R. Bard, Inc. and a reduced position in Cerner Corporation. In addition to these sales, our new purchases were funded with sales in other sectors, such as sales of TD Ameritrade Holding Corporation, Quanta Services, Inc., CommScope, Inc., Invesco Limited and Ecolab Inc., among others.
13
ARTISAN MID CAP VALUE FUND (ARTQX)
INVESTMENT PROCESS HIGHLIGHTS
Artisan Mid Cap Value Fund employs a bottom-up investment process to construct a diversified portfolio of stocks of medium-sized U.S. companies that the investment team believes are undervalued, in solid financial condition and have attractive business economics. The team believes companies with these characteristics are less likely to experience eroding values over the long term.
Attractive valuation. The team values a business using what it believes are reasonable expectations for the long-term earnings power and capitalization rates of that business. This results in a range of values for the company that the team believes would be reasonable. The team generally will purchase a security if the stock price falls below or toward the lower end of that range.
Sound financial condition. The team favors companies with an acceptable level of debt and positive cash flow. At a minimum, the team tries to avoid companies that have so much debt that management may be unable to make decisions that would be in the best interests of the companies’ shareholders.
Attractive business economics. The team favors cash-producing businesses that it believes are capable of earning acceptable returns on capital over the company’s business cycle.
PERFORMANCE HISTORY
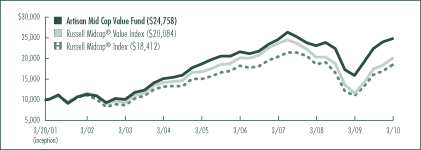
GROWTH OF AN ASSUMED $10,000 INVESTMENT (3/28/2001 to 3/31/2010)
AVERAGE ANNUAL TOTAL RETURNS (as of 3/31/2010)
| | | | | | | | | | | | | | | |
| Fund / Index | | Six
Months(1) | | | 1-Year | | | 3-Year | | | 5-Year | | | Since
Inception | |
Artisan Mid Cap Value Fund | | 10.50 | % | | 55.81 | % | | 0.29 | % | | 5.80 | % | | 10.59 | % |
Russell Midcap® Value Index | | 15.32 | | | 72.41 | | | -5.22 | | | 3.71 | | | 8.05 | |
Russell Midcap® Index | | 15.10 | | | 67.71 | | | -3.30 | | | 4.20 | | | 7.01 | |
The performance quoted represents past performance, which does not guarantee future results. The investment return and principal value of an investment in the Fund will fluctuate, so that an investor’s shares in the Fund, when redeemed, may be worth more or less than their original cost. Current performance may be lower or higher than the performance data quoted. For current to most recent month-end performance information, visit www.artisanfunds.com or call 800.344.1770. The graph and table above do not reflect the deduction of taxes that a shareholder would pay on distributions or sale of Fund shares. See page 111 for a description of each index.
14
INVESTING ENVIRONMENT
The Russell Midcap® and Russell Midcap® Value indices gained 15.10% and 15.32%, respectively, during the six-month period ended March 31, 2010. After a volatile start to the period, equities rallied strongly during the latter part of February and throughout March, led by gains in the traditionally cyclical sectors. For the period as a whole, the consumer discretionary, industrials and health care sectors posted the strongest returns while the utilities, telecom and energy sectors lagged, as they have since the initial market rebound in March 2009.
SECTOR DIVERSIFICATION
| | | | | | |
| Sector | | 9/30/09 | | | 3/31/10 | |
Consumer Discretionary | | 12.3 | % | | 10.5 | % |
Consumer Staples | | 6.9 | | | 7.5 | |
Energy | | 10.3 | | | 8.8 | |
Financials | | 13.9 | | | 17.2 | |
Healthcare | | 6.8 | | | 3.7 | |
Industrials | | 22.9 | | | 20.0 | |
Information Technology | | 16.4 | | | 19.1 | |
Utilities | | 3.1 | | | 7.8 | |
Other assets less liabilities | | 7.4 | | | 5.4 | |
Total | | 100.0 | % | | 100.0 | % |
As a percentage of total net assets.
PERFORMANCE DISCUSSION
The Fund participated in the advance with a return of 10.50%. A number of our best performers came from the health care sector. Leading orthopedic company Stryker Corporation, drug distributor Cardinal Health, Inc. and managed care services provider CIGNA Corporation were our top performers in the health care sector. We sold our position in Cardinal Health during the period. Our minimal investment in the relatively weak energy and utilities sectors also boosted returns relative to the Index. From an individual stock perspective, our leading contributors during the period included oil and gas exploration and production company Cimarex Energy Co., light fixtures company Acuity Brands, Inc., toy company Mattel, Inc., aerospace and defense company Rockwell Collins, Inc. and information services provider Equifax Inc.
The financial sector was a source of underperformance. Our insurance companies did not keep pace with those in the Index, held back by insurance brokerage Brown & Brown, Inc., property and casualty insurer Allied World Assurance Company Holdings, Ltd and title insurer Fidelity National Financial, Inc. Also hurting returns within the sector was our minimal investment in REITs and our lack of banking exposure. The consumer discretionary and technology sectors were also sources of relative weakness. Within these sectors, H&R Block, Inc., Omnicom Group Inc., Total System Services, Inc., The Western Union Company and Ingram Micro Inc. were our worst relative performers.
FUND CHANGES
We had one takeout completed during the period: Marvel Entertainment, Inc. by The Walt Disney Company. We exited our positions in Dover Corporation, Covance Inc., Seagate Technology, Lam Research Corporation and Thomas & Betts Corporation. Purchases during the period included property and casualty insurer The Allstate Corporation, money transfer services provider The Western Union Company, electronic payment processor Total Systems Services, Inc., construction and engineering firm Jacobs Engineering Group Inc. and utilities American Water Works Company Inc., OGE Energy Corp. and Xcel Energy Inc.
15
ARTISAN OPPORTUNISTIC GROWTH FUND (ARTRX)
INVESTMENT PROCESS HIGHLIGHTS
Artisan Opportunistic Growth Fund employs a bottom-up investment process to construct a diversified portfolio of growth companies across a broad capitalization range. The Fund’s investment process focuses on two distinct areas – security selection and capital allocation.
The Fund’s investment team attempts to identify companies that possess franchise characteristics that are selling at attractive valuations and benefiting from an accelerating profit cycle.
Franchise characteristics. These are characteristics that the team believes help to protect a company’s stream of cash flow from the effects of competition. The team looks for companies with at least two of the following characteristics: low cost production capability, possession of a proprietary asset, dominant market share or a defensible brand name.
Attractive valuations. Through its own fundamental research, the team estimates the amount a buyer would pay to buy the entire company (the company’s “intrinsic value” or “private market value”) and considers whether to purchase a stock if it sells at a discount to that estimate.
Accelerating profit cycle. The team tries to invest in companies that are well positioned for long-term growth, at an early enough stage in their profit cycle to benefit from the increased cash flows produced by the profit cycle.
Based on the investment team’s fundamental analysis of a company’s profit cycle, portfolio holdings develop through three stages. GardenSM investments are small positions in the early part of their profit cycle that will warrant a more sizeable allocation once their profit cycle accelerates. CropSM investments are positions that are being increased to a full weight because they are moving through the strongest part of their profit cycle. HarvestSM investments are positions that are being reduced as they near the team’s estimate of full valuation or their profit cycle begins to decelerate.
PERFORMANCE HISTORY
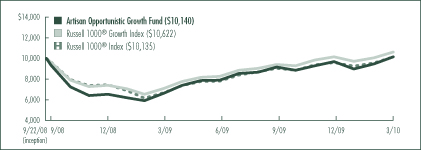
GROWTH OF AN ASSUMED $10,000 INVESTMENT (9/22/2008 to 3/31/2010)
AVERAGE ANNUAL TOTAL RETURNS (as of 3/31/2010)
| | | | | | | | | |
| Fund / Index | | Six
Months(1) | | | 1-Year | | | Since
Inception | |
Artisan Opportunistic Growth Fund | | 10.94 | % | | 53.17 | % | | 0.92 | % |
Russell 1000® Growth Index | | 12.96 | | | 49.75 | | | 4.05 | |
Russell 1000® Index | | 12.11 | | | 51.60 | | | 0.89 | |
The performance quoted represents past performance, which does not guarantee future results. The investment return and principal value of an investment in the Fund will fluctuate, so that an investor’s shares in the Fund, when redeemed, may be worth more or less than their original cost. The Fund’s return may vary greatly over short periods, and current performance may be materially lower or higher than the performance data quoted. For current to most recent month-end performance information, visit www.artisanfunds.com or call 800.344.1770. The table above does not reflect the deduction of taxes that a shareholder would pay on distributions or sale of Fund shares. The Fund’s performance information reflects Artisan Partners’ agreement to limit the Fund’s expenses to no more than 1.50%, which has been in effect since the Fund’s inception and has had a material impact on the Fund’s performance, which would have been lower in its absence. See page 111 for a description of each index.
16
INVESTING ENVIRONMENT
During the reporting period ending March 31, 2010, strong earnings reports and evidence that economic and business conditions were steadily improving presented a positive environment for stocks. The Russell 1000® Index gained 12.11% as of the end of the period. Growth stocks were slightly favored versus value stocks as the Russell 1000® Growth Index advanced 12.96%, while its value counterpart returned 11.28%. Within the Russell 1000® Index, all sectors had positive returns, though there was a fair degree of variation. The consumer discretionary and industrials sectors were the leaders, each rising more than 18%. The utilities and telecommunications sectors, on the other hand, rose less than 5%.
SECTOR DIVERSIFICATION
| | | | | | |
| Sector | | 9/30/09 | | | 3/31/10 | |
Consumer Discretionary | | 15.1 | % | | 15.2 | % |
Energy | | 4.3 | | | 7.0 | |
Financials | | 7.8 | | | 6.1 | |
Healthcare | | 12.6 | | | 11.6 | |
Industrials | | 10.9 | | | 10.2 | |
Information Technology | | 41.8 | | | 41.7 | |
Materials | | 1.4 | | | 2.1 | |
Other assets less liabilities | | 6.1 | | | 6.1 | |
Total | | 100.0 | % | | 100.0 | % |
As a percentage of total net assets.
PERFORMANCE DISCUSSION
For the six-month period ended March 31, 2010, the Fund returned 10.94%. Our top contributors were ARM Holdings PLC, a developer and licenser of microprocessors, consumer electronics company Apple Inc., Agilent Technologies, Inc., a manufacturer of test and measurement products, electronic payments company Visa Inc., and Cummins Inc., a manufacturer of diesel and natural gas engines. The Fund’s largest detractors were wind-turbine maker Gamesa Corporacion Tecnologica, S.A., solar panel producer First Solar, Inc., video game publisher Activision Blizzard, Inc., MEMC Electronic Materials, Inc., a manufacturer of silicon wafers for the semiconductor industry and silicon to the solar industry, and contracting services company Quanta Services, Inc.
REGION ALLOCATION
| | | | | | |
| Region | | 9/30/09 | | | 3/31/10 | |
Americas | | 79.8 | % | | 72.9 | % |
Emerging Markets | | 1.9 | | | 13.7 | |
Europe | | 12.2 | | | 7.3 | |
As a percentage of total net assets.
FUND CHANGES
The investment team attempts to identify companies that possess franchise characteristics that are selling at attractive valuations and benefiting from an accelerating profit cycle. During the six-month period ended March 31, 2010, the Fund’s number of holdings decreased from 39 to 37. Our purchases included Cummins Inc., Ctrip.com International, Ltd., Compagnie Financiere Richemont SA, Precision Castparts Corp. and Wynn Macau Limited.
These purchases were partially funded with sales of Activision Blizzard, Inc., Bank of America Corporation, Best Buy Co., Inc., C.R. Bard, Inc. and CSX Corporation, among others.
17
ARTISAN OPPORTUNISTIC VALUE FUND (ARTLX)
INVESTMENT PROCESS HIGHLIGHTS
Artisan Opportunistic Value Fund employs a bottom-up investment process to construct a diversified portfolio of stocks that the team believes are undervalued, in solid financial condition with attractive business economics. The team believes companies with these characteristics are less likely to experience eroding values over the long term.
Attractive valuation. The team values a business using what it believes are reasonable expectations for the long-term earnings power and capitalization rates of that business. This results in a range of values for the company that the team believes would be reasonable. The team generally will purchase a security if the stock price falls below or toward the lower end of that range.
Sound financial condition. The team favors companies with an acceptable level of debt and positive cash flow. At a minimum, the team tries to avoid companies that have so much debt that management may be unable to make decisions that would be in the best interest of the companies’ shareholders.
Attractive business economics. The team favors cash-producing businesses that it believes are capable of earning acceptable returns on capital over the company’s business cycle.
PERFORMANCE HISTORY
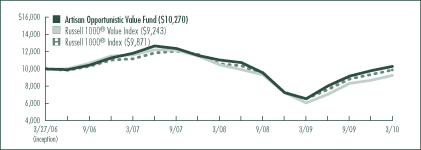
GROWTH OF AN ASSUMED $10,000 INVESTMENT (3/27/2006 to 3/31/2010)
AVERAGE ANNUAL TOTAL RETURNS (as of 3/31/2010)
| | | | | | | | | | | | |
| Fund / Index | | Six
Months(1) | | | 1-Year | | | 3-Year | | | Since
Inception | |
Artisan Opportunistic Value Fund | | 12.41 | % | | 57.38 | % | | -4.49 | % | | 0.67 | % |
Russell 1000® Value Index | | 11.28 | | | 53.56 | | | -7.33 | | | -1.94 | |
Russell 1000® Index | | 12.11 | | | 51.60 | | | -3.98 | | | -0.32 | |
The performance quoted represents past performance, which does not guarantee future results. The investment return and principal value of an investment in the Fund will fluctuate, so that an investor’s shares in the Fund, when redeemed, may be worth more or less than their original cost. Current performance may be lower or higher than the performance data quoted. For current to most recent month-end performance information, visit www.artisanfunds.com or call 800.344.1770. The graph and table above do not reflect the deduction of taxes that a shareholder would pay on distributions or sale of Fund shares. See page 111 for a description of each index.
18
INVESTING ENVIRONMENT
The Russell 1000® and Russell 1000® Value indices gained 12.11% and 11.28%, respectively, during the six-month period ended March 31, 2010. After a volatile start to the period, equities rallied strongly during the latter part of February and throughout March, led by large gains in the traditionally cyclical sectors. For the period as a whole, the consumer discretionary, industrials and health care sectors posted the strongest returns while the utilities, telecom and energy sectors lagged, as they have since the initial market rebound in March 2009.
SECTOR DIVERSIFICATION
| | | | | | |
| Sector | | 9/30/09 | | | 3/31/10 | |
Consumer Discretionary | | 12.6 | % | | 4.9 | % |
Consumer Staples | | 14.2 | | | 11.3 | |
Energy | | 5.8 | | | 9.6 | |
Financials | | 18.9 | | | 21.2 | |
Healthcare | | 10.8 | | | 10.5 | |
Industrials | | 8.3 | | | 6.9 | |
Information Technology | | 26.5 | | | 30.6 | |
Other assets less liabilities | | 2.9 | | | 5.0 | |
Total | | 100.0 | % | | 100.0 | % |
As a percentage of total net assets.
PERFORMANCE DISCUSSION
For the six-month period ended March 31, 2010, the Fund returned 12.41%. We benefited from our energy and consumer staples holdings. Our top contributors in these two sectors included contract driller Nabors Industries Ltd. and exploration and production company Apache Corporation in the energy sector and food manufacturer Nestle SA, retailer Wal-Mart Stores, Inc. and international cigarette producer Phillip Morris International Inc. in the consumer staples sector. The outperformance of our health care companies, led by managed care services provider CIGNA Corporation and orthopedic company Stryker Corporation, and our lack of investment in the utilities and telecom sectors also boosted returns relative to the Index. We sold our position in Stryker during the period.
On the downside, our consumer discretionary stocks did not keep pace with those in the Index. Global advertising and marketing services agency Omnicom Group Inc. and floor coverings manufacturer Mohawk Industries, Inc., two holdings that we sold during the period, were our primary detractors. Our technology and industrials holdings also fell short of those in the Index. In those sectors, technology distributor Ingram Micro Inc., mobile phone maker Nokia Corporation, money transfer services provider The Western Union Company and aerospace and defense company Lockheed Martin Corporation were our biggest detractors relative to the Index. We sold our position in Nokia during the period.
REGION ALLOCATION
| | | | | | |
| Region | | 9/30/09 | | | 3/31/10 | |
Americas | | 89.4 | % | | 94.0 | % |
Europe | | 7.7 | | | 1.0 | |
As a percentage of total net assets.
FUND CHANGES
Our purchases this period included a number of technology companies, including IT infrastructure provider International Business Machines Corporation, The Western Union Company, electronic payment processor Total Systems Services, Inc. and semiconductor equipment provider Applied Materials, Inc. We also initiated positions in property and casualty insurer Alleghany Corporation, aerospace and defense company Raytheon Company, integrated oil and gas company Exxon Mobil Corporation, food manufacturer Kraft Foods Inc. and diversified global health care company Baxter International Inc. Sales included Rockwell Collins, Inc., Unilever PLC, Avnet, Inc., The Walt Disney Company and Dell Inc.
19
ARTISAN SMALL CAP FUND (ARTSX)
INVESTMENT PROCESS HIGHLIGHTS
Artisan Small Cap Fund employs a bottom-up investment process to construct a diversified portfolio of primarily U.S. small-cap growth companies. The Fund’s investment process focuses on two distinct areas – security selection and capital allocation.
The Fund’s investment team attempts to identify companies that possess franchise characteristics that are selling at attractive valuations and benefiting from an accelerating profit cycle.
Franchise characteristics. These are characteristics that the team believes help to protect a company’s stream of cash flow from the effects of competition. The team looks for companies with at least two of the following characteristics: low cost production capability, possession of a proprietary asset, dominant market share or a defensible brand name.
Attractive valuations. Through its own fundamental research, the team estimates the amount a buyer would pay to buy the entire company (the company’s “intrinsic value” or “private market value”) and considers whether to purchase a stock if it sells at a discount to that estimate.
Accelerating profit cycle. The team tries to invest in companies that are well positioned for long-term growth, at an early enough stage in their profit cycle to benefit from the increased cash flows produced by the profit cycle.
Based on the investment team’s fundamental analysis of a company’s profit cycle, portfolio holdings develop through three stages. GardenSM investments are small positions in the early part of their profit cycle that will warrant a more sizeable allocation once their profit cycle accelerates. CropSM investments are positions that are being increased to a full weight because they are moving through the strongest part of their profit cycle. HarvestSM investments are positions that are being reduced as they near the team’s estimate of full valuation or their profit cycle begins to decelerate.
PERFORMANCE HISTORY
GROWTH OF AN ASSUMED $10,000 INVESTMENT (3/28/1995 to 3/31/2010)
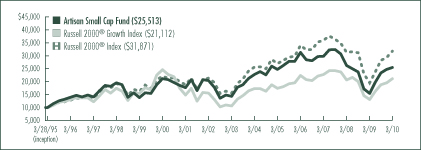
AVERAGE ANNUAL TOTAL RETURNS (as of 3/31/2010)
| | | | | | | | | | | | | | | | | | |
| Fund / Index | | Six
Months(1) | | | 1-Year | | | 3-Year | | | 5-Year | | | 10-Year | | | Since
Inception | |
Artisan Small Cap Fund | | 8.93 | % | | 64.86 | % | | -5.11 | % | | 0.57 | % | | 1.86 | % | | 6.44 | % |
Russell 2000® Growth Index | | 12.07 | | | 60.32 | | | -2.42 | | | 3.82 | | | -1.53 | | | 5.10 | |
Russell 2000® Index | | 13.07 | | | 62.76 | | | -3.99 | | | 3.36 | | | 3.68 | | | 8.03 | |
The performance quoted represents past performance, which does not guarantee future results. The investment return and principal value of an investment in the Fund will fluctuate, so that an investor’s shares in the Fund, when redeemed, may be worth more or less than their original cost. Current performance may be lower or higher than the performance data quoted. For current to most recent month-end performance information, visit www.artisanfunds.com or call 800.344.1770. The graph and table above do not reflect the deduction of taxes that a shareholder would pay on distributions or sale of Fund shares. See page 111 for a description of each index.
20
INVESTING ENVIRONMENT
During the six months ending March 31, 2010, strong earnings reports and evidence that economic and business conditions were steadily improving lifted small-cap stocks higher. The Russell 2000® Index gained 13.07% in the period. Value stocks were preferred over growth stocks among the small-cap market cap segment as the Russell 2000® Value Index climbed 14.01%, while the Russell 2000® Growth Index returned 12.07%. Within the Russell 2000® Growth Index, all sectors had positive returns, though there was a significant level of dispersion. The consumer discretionary and consumer staples sectors were the leaders, each rising more than 20%. The utilities and telecommunications sectors trailed with gains of nearly 3%.
SECTOR DIVERSIFICATION
| | | | | | |
| Sector | | 9/30/09 | | | 3/31/10 | |
Consumer Discretionary | | 10.1 | % | | 12.5 | % |
Consumer Staples | | 3.7 | | | 1.6 | |
Energy | | 7.4 | | | 5.6 | |
Financials | | 7.4 | | | 8.3 | |
Healthcare | | 14.8 | | | 16.3 | |
Industrials | | 20.6 | | | 17.4 | |
Information Technology | | 28.9 | | | 32.1 | |
Materials | | 1.3 | | | 1.0 | |
Utilities | | 1.4 | | | 1.6 | |
Other assets less liabilities | | 4.4 | | | 3.6 | |
Total | | 100.0 | % | | 100.0 | % |
As a percentage of total net assets.
PERFORMANCE DISCUSSION
The Fund participated in the strong market, gaining 8.93% in the period. Compared with the Russell 2000® Growth Index, the Fund benefited from positive stock selection in the industrials, financials and consumer staples sectors. Our top contributors to return in these sectors were Waste Connections, Inc., a solid waste services company, Ares Capital Corporation, a business development company, and Bare Escentuals, Inc., a mineral-based cosmetics retailer. Across the rest of the portfolio, winners included e-commerce services provider GSI Commerce, Inc., semiconductor company Atheros Communications, Inc. and specialty retailer PETsMART, Inc.
The health care sector was an area of relative weakness. Detracting from our performance in this sector were Clarient, Inc., an oncology-focused laboratory services provider, Phase Forward Incorporated, a data management solutions provider for clinical trials, and biopharmaceutical company AMAG Pharmaceuticals, Inc. Other weak performers were Euronet Worldwide, Inc., an electronic payments provider, Tessera Technologies, Inc., a provider of miniaturization technologies for the electronics industry, and STEC, Inc., a producer of enterprise storage solid-state drives (SSDs).
FUND CHANGES
The biggest sector-level shifts in the portfolio during the period were increased positions in the technology and consumer discretionary sectors and decreased exposures to the industrials and consumer staples sectors. In the consumer discretionary sector, we added to our positions in LKQ Corporation and Monro Muffler Brake, Inc. In the technology sector, we increased our positions in Atheros Communications, Inc. and GSI Commerce, Inc.
In the industrials sector, our reduced weighting was due in part to the sale of Corrections Corporation of America and UTi Worldwide Inc. Our consumer staples weighting decreased due in part to sales of Bare Escentuals, Inc. and Chattem, Inc.
21
ARTISAN SMALL CAP VALUE FUND (ARTVX)
INVESTMENT PROCESS HIGHLIGHTS
Artisan Small Cap Value Fund employs a bottom-up investment process to construct a diversified portfolio of small-cap U.S. companies that the team believes are undervalued, in solid financial condition and have attractive business economics. The team believes companies with these characteristics are less likely to experience eroding values over the long term.
Attractive valuation. The team values a business using what it believes are reasonable expectations for the long-term earnings power and capitalization rates of that business. This results in a range of values for the company that the team believes would be reasonable. The team generally will purchase a security if the stock price falls below or toward the lower end of that range.
Sound financial condition. The team favors companies with an acceptable level of debt and positive cash flow. At a minimum, the team tries to avoid companies that have so much debt that management may be unable to make decisions that would be in the best interest of the companies’ shareholders.
Attractive business economics. The team favors cash-producing businesses that it believes are capable of earning acceptable returns on capital over the company’s business cycle.
PERFORMANCE HISTORY
GROWTH OF AN ASSUMED $10,000 INVESTMENT (9/29/1997 to 3/31/2010)
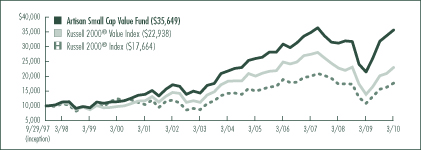
AVERAGE ANNUAL TOTAL RETURNS (as of 3/31/2010)
| | | | | | | | | | | | | | | | | | |
| Fund / Index | | Six
Months(1) | | | 1-Year | | | 3-Year | | | 5-Year | | | 10-Year | | | Since
Inception | |
Artisan Small Cap Value Fund | | 11.93 | % | | 66.78 | % | | 0.87 | % | | 6.58 | % | | 12.09 | % | | 10.70 | % |
Russell 2000® Value Index | | 14.01 | | | 65.07 | | | -5.71 | | | 2.75 | | | 8.90 | | | 6.87 | |
Russell 2000® Index | | 13.07 | | | 62.76 | | | -3.99 | | | 3.36 | | | 3.68 | | | 4.66 | |
The performance quoted represents past performance, which does not guarantee future results. The investment return and principal value of an investment in the Fund will fluctuate, so that an investor’s shares in the Fund, when redeemed, may be worth more or less than their original cost. Current performance may be lower or higher than the performance data quoted. For current to most recent month-end performance information, visit www.artisanfunds.com or call 800.344.1770. The graph and table above do not reflect the deduction of taxes that a shareholder would pay on distributions or sale of Fund shares. See page 111 for a description of each index.
22
INVESTING ENVIRONMENT
The Russell 2000® and Russell 2000® Value indices gained 13.07% and 14.01%, respectively, during the six-month period ended March 31, 2010. After a volatile start to the period, equities rallied strongly during the latter part of February and throughout March, led by gains in the traditionally cyclical sectors. For the period as a whole, the consumer discretionary, industrials and health care sectors posted the strongest returns while the utilities, telecom and energy sectors lagged, as they have since the initial market rebound in March 2009.
SECTOR DIVERSIFICATION
| | | | | | |
| Sector | | 9/30/09 | | | 3/31/10 | |
Consumer Discretionary | | 5.8 | % | | 6.7 | % |
Consumer Staples | | 2.6 | | | 2.7 | |
Energy | | 7.8 | | | 8.8 | |
Financials | | 8.6 | | | 8.2 | |
Healthcare | | 5.6 | | | 3.1 | |
Industrials | | 22.8 | | | 22.9 | |
Information Technology | | 24.9 | | | 27.3 | |
Materials | | 4.7 | | | 4.4 | |
Utilities | | 9.1 | | | 10.5 | |
Other assets less liabilities | | 8.1 | | | 5.4 | |
Total | | 100.0 | % | | 100.0 | % |
As a percentage of total net assets.
PERFORMANCE DISCUSSION
The Fund participated in the advance with a return of 11.93%.
Our technology holdings outperformed those in the Index. Printer vendor Lexmark International, Inc., commercial services provider MAXIMUS, Inc. and software companies MicroStrategy Incorporated, Manhattan Associates, Inc. and Progress Software Corporation were some of our top contributors during the period. We also benefited from strong stock selection in the consumer staples and industrials sectors. Takeout targets Chattem, Inc. and MPS Group, Inc. were two of our strongest performers in these sectors. Other top contributors included leaf tobacco merchant Universal Corporation in the consumer staples sector and light fixtures company Acuity Brands, Inc. and industrial machinery manufacturer Woodward Governor Company in the industrials sector.
The declines of several of our energy companies contributed to our underperformance. Marine contractor Cal Dive International, Inc., oil and natural gas exploration and production company Comstock Resources, Inc. and contract drilling services providers Seahawk Drilling, Inc. and Parker Drilling Company were our biggest detractors in the sector. Weakness of certain holdings in the consumer discretionary, financials and materials sectors also weighed on relative returns. International Speedway Corporation, The Student Loan Corporation, Allied World Assurance Company Holdings, Ltd and Eagle Materials Inc. were among our detractors in these sectors.
FUND CHANGES
We had two takeouts completed during the period: SPSS Inc. by International Business Machines Corporation and new purchase Chattem, Inc. by Sanofi-Aventis. We also sold three other positions as they were in the process of being acquired: Varian Inc. by Agilent Technologies, Inc., Marvel Entertainment, Inc. by The Walt Disney Company, and MPS Group, Inc. by Adecco SA. Other sales during the period included Kforce Inc., Regal-Beloit Corporation and Sanderson Farms, Inc.
Our new purchase activity slowed during the period as the run-up in valuations made it more difficult to find new ideas that met our investment criteria. Comstock Resources, Inc. was our largest purchase. Smaller additions included consulting services provider FTI Consulting, Inc., Web security solutions provider Websense, Inc. and financial self-service solutions provider Diebold, Incorporated.
23
ARTISAN GLOBAL EQUITY FUND
Schedule of Investments – March 31, 2010 (Unaudited)
| | | | | |
| | | Shares
Held | | Value |
| | | | | |
| COMMON AND PREFERRED STOCKS - 93.4% | | | | | |
| | | | | |
| BRAZIL - 2.1% | | | | | |
Companhia de Bebidas das Americas, Preferred(1) | | 565 | | $ | 51,787 |
Natura Cosmeticos SA | | 1,900 | | | 38,569 |
Petroleo Brasileiro S.A., Preferred (DR) | | 1,951 | | | 77,240 |
| | | | | |
| | | | | 167,596 |
| CHINA - 1.6% | | | | | |
China Pacific Insurance (Group) Company, Ltd., H Shares(2) | | 17,200 | | | 76,427 |
Huabao International Holdings Limited | | 43,100 | | | 51,514 |
| | | | | |
| | | | | 127,941 |
| DENMARK - 0.9% | | | | | |
Novo Nordisk A/S, Class B | | 954 | | | 74,028 |
| | | | | |
| FRANCE - 4.3% | | | | | |
Air Liquide SA | | 630 | | | 75,629 |
Christian Dior SA | | 1,016 | | | 108,381 |
DANONE S.A. | | 1,251 | | | 75,359 |
Pernod Ricard SA | | 887 | | | 75,320 |
| | | | | |
| | | | | 334,689 |
| GERMANY - 4.8% | | | | | |
Bayer AG | | 1,097 | | | 74,202 |
Deutsche Boerse AG | | 992 | | | 73,531 |
Henkel AG & Co. KGaA, Preferred(1) | | 1,388 | | | 74,726 |
Linde AG | | 628 | | | 74,931 |
Symrise AG | | 3,297 | | | 78,508 |
| | | | | |
| | | | | 375,898 |
| HONG KONG - 2.9% | | | | | |
Dairy Farm International Holdings Limited | | 5,300 | | | 34,980 |
Esprit Holdings Limited | | 11,800 | | | 93,163 |
Li & Fung Limited | | 20,700 | | | 101,710 |
| | | | | |
| | | | | 229,853 |
| INDONESIA - 0.7% | | | | | |
PT Bank Rakyat Indonesia | | 61,500 | | | 55,759 |
| | | | | |
| ISRAEL - 2.8% | | | | | |
Teva Pharmaceutical Industries Limited (DR) | | 3,499 | | | 220,717 |
| | | | | |
| JAPAN - 8.7% | | | | | |
CANON INC. | | 1,600 | | | 74,104 |
FAST RETAILING CO., LTD. | | 295 | | | 51,276 |
| | | | | |
| | | Shares
Held | | Value |
| | | | | |
| JAPAN (CONTINUED) | | | | | |
HISAMITSU PHARMACEUTICAL CO., INC. | | 1,025 | | $ | 38,099 |
HOYA | | 2,700 | | | 74,193 |
INPEX CORPORATION | | 21 | | | 154,091 |
Nitori Co., Ltd. | | 500 | | | 37,972 |
Nomura Holdings, Inc. | | 9,900 | | | 72,961 |
SANTEN PHARMACEUTICAL CO., LTD. | | 1,200 | | | 36,017 |
Shin-Etsu Chemical Co., Ltd. | | 1,570 | | | 91,187 |
UNICHARM CORPORATION | | 535 | | | 51,674 |
| | | | | |
| | | | | 681,574 |
| KOREA - 1.4% | | | | | |
Amorepacific Corporation | | 52 | | | 37,824 |
Samsung Electronics Co., Ltd. | | 103 | | | 74,465 |
| | | | | |
| | | | | 112,289 |
| NETHERLANDS - 1.0% | | | | | |
Akzo Nobel N.V. | | 1,331 | | | 75,855 |
| | | | | |
| PERU - 0.5% | | | | | |
Credicorp Ltd. | | 431 | | | 38,006 |
| | | | | |
| RUSSIA - 1.7% | | | | | |
Gazprom (DR) | | 5,830 | | | 136,014 |
| | | | | |
| SOUTH AFRICA - 1.0% | | | | | |
MTN Group Limited(2) | | 4,899 | | | 75,330 |
| | | | | |
| SPAIN - 2.8% | | | | | |
Industria de Diseno Textil, S.A. | | 1,114 | | | 73,433 |
Telefonica S.A. | | 6,170 | | | 146,170 |
| | | | | |
| | | | | 219,603 |
| SWITZERLAND - 9.1% | | | | | |
Julius Baer Group Ltd. | | 3,154 | | | 114,416 |
Nestle SA | | 4,403 | | | 225,495 |
Roche Holding AG - Genussscheine(1) | | 927 | | | 150,339 |
Swatch Group AG | | 175 | | | 55,799 |
Synthes, Inc. | | 596 | | | 74,387 |
UBS AG(2) | | 5,951 | | | 96,738 |
| | | | | |
| | | | | 717,174 |
| TAIWAN - 0.9% | | | | | |
Taiwan Semiconductor Manufacturing Company Ltd. (DR) | | 7,048 | | | 73,933 |
| | | | | |
| THAILAND - 0.5% | | | | | |
CP ALL PCL(2)(3) | | 44,600 | | | 37,931 |
| | | | | |
24
| | | | | |
| | | Shares
Held | | Value |
| | | | | |
| UNITED KINGDOM - 13.2% | | | | | |
Babcock International Group plc | | 10,692 | | $ | 97,756 |
BHP Billiton Plc | | 4,921 | | | 168,768 |
Experian PLC | | 11,272 | | | 110,928 |
HSBC Holdings plc | | 16,334 | | | 165,576 |
Reckitt Benckiser Group PLC | | 2,077 | | | 114,002 |
Reed Elsevier PLC | | 9,455 | | | 75,398 |
SSL International plc | | 3,075 | | | 37,937 |
Standard Chartered plc | | 2,774 | | | 75,666 |
Tesco plc | | 14,247 | | | 94,143 |
WPP plc | | 9,213 | | | 95,488 |
| | | | | |
| | | | | 1,035,662 |
| UNITED STATES - 32.5% | | | | | |
3M Company | | 919 | | | 76,801 |
Accenture plc, Class A | | 3,509 | | | 147,203 |
Allergan, Inc. | | 1,160 | | | 75,771 |
Apple Inc.(2) | | 320 | | | 75,178 |
The Bank of New York Mellon Corporation | | 2,408 | | | 74,359 |
Church & Dwight Company, Inc. | | 1,107 | | | 74,114 |
Cisco Systems, Inc.(2) | | 4,918 | | | 128,016 |
CME Group Inc., Class A | | 354 | | | 111,903 |
Colgate-Palmolive Company | | 876 | | | 74,688 |
Covidien plc | | 1,884 | | | 94,727 |
DENTSPLY International Inc | | 1,618 | | | 56,387 |
The Dun & Bradstreet Corporation | | 1,002 | | | 74,569 |
eBay Inc.(2) | | 2,032 | | | 54,762 |
EMC Corporation(2) | | 4,118 | | | 74,289 |
Franklin Resources, Inc. | | 671 | | | 74,414 |
The Goldman Sachs Group, Inc. | | 428 | | | 73,030 |
Google Inc., Class A(2) | | 232 | | | 131,546 |
Hess Corporation | | 922 | | | 57,671 |
Johnson & Johnson | | 2,006 | | | 130,791 |
Mead Johnson Nutrition Company | | 1,421 | | | 73,935 |
Monsanto Company | | 1,047 | | | 74,777 |
NIKE, Inc., Class B | | 1,007 | | | 74,014 |
Oracle Corporation | | 2,895 | | | 74,373 |
PepsiCo, Inc. | | 1,117 | | | 73,901 |
The Procter & Gamble Company | | 2,045 | | | 129,387 |
Schlumberger Limited | | 1,180 | | | 74,883 |
Thermo Fisher Scientific Inc.(2) | | 1,107 | | | 56,944 |
Verisk Analytics, Inc., Class A(2) | | 1,325 | | | 37,365 |
Visa Inc., Class A | | 825 | | | 75,100 |
The Walt Disney Company | | 2,108 | | | 73,590 |
The Western Union Company | | 4,337 | | | 73,556 |
| | | | | |
| | | | | 2,552,044 |
| | | | | |
Total common and preferred stocks
(Cost $7,357,526) | | | | | 7,341,896 |
| | | | | | | |
| | | Par
Amount | | Value | |
| | | | | | | |
SHORT-TERM INVESTMENTS
(CASH EQUIVALENTS) - 90.1% | | | | | | | |
Repurchase agreement with Fixed Income Clearing Corporation, 0.00%, dated 3/31/10, due 4/1/10, maturity value
$7,082,000(4)
(Cost $7,082,000) | | $ | 7,082,000 | | $ | 7,082,000 | |
| | | | | | | |
| | | | | | | |
Total investments - 183.5%
(Cost $14,439,526) | | | | | | 14,423,896 | |
| | | | | | | |
Other assets less liabilities - (83.5%) | | | | | | (6,562,351 | ) |
| | | | | | | |
| | | | | | | |
Total net assets - 100.0%(5) | | | | | $ | 7,861,545 | |
| | | | | | | |
| (2) | Non-income producing security. |
| (3) | Valued at a fair value in accordance with procedures established by the board of directors of Artisan Funds, Inc. In total, securities valued at a fair value were $37,931 or 0.5% of total net assets. |
| | | | | | | | |
Issuer | | Rate | | | Maturity | | Value |
U.S. Treasury Note | | 4.625 | % | | 11/15/2016 | | $ | 2,565,483 |
U.S. Treasury Note | | 1.375 | | | 1/15/2013 | | | 4,663,313 |
| | | | | | | | |
| | | | | | | $ | 7,228,796 |
| | | | | | | | |
| (5) | Percentages for the various classifications relate to total net assets. |
Company names are as reported by a data service provider and in some cases are translations; a company’s legal name may be different.
(DR) Depository Receipt, voting rights may vary.
25
| | | | | | | |
PORTFOLIO DIVERSIFICATION - March 31, 2010 (Unaudited) | |
| | | Value | | | Percentage
of Total
Net Assets | |
Consumer Discretionary | | $ | 840,224 | | | 10.7 | % |
Consumer Staples | | | 1,337,835 | | | 17.0 | |
Energy | | | 499,899 | | | 6.4 | |
Financials | | | 1,102,786 | | | 14.0 | |
Healthcare | | | 1,120,346 | | | 14.2 | |
Industrials | | | 397,419 | | | 5.1 | |
Information Technology | | | 1,130,718 | | | 14.4 | |
Materials | | | 691,169 | | | 8.8 | |
Telecommunication Services | | | 221,500 | | | 2.8 | |
| | | | | | | |
Total common and preferred stocks | | | 7,341,896 | | | 93.4 | |
Short-term investments | | | 7,082,000 | | | 90.1 | |
| | | | | | | |
Total investments | | | 14,423,896 | | | 183.5 | |
Other assets less liabilities | | | (6,562,351 | ) | | (83.5 | ) |
| | | | | | | |
Total net assets | | $ | 7,861,545 | | | 100.0 | % |
| | | | | | | |
| | | | | | |
| CURRENCY EXPOSURE - March 31, 2010 (Unaudited) | |
| | | Value | | Percentage
of Total
Investments | |
Brazilian real | | $ | 90,356 | | 0.6 | % |
British pound | | | 1,035,662 | | 7.2 | |
Danish krone | | | 74,028 | | 0.5 | |
Euro | | | 1,006,045 | | 7.0 | |
Hong Kong dollar | | | 322,814 | | 2.2 | |
Indonesian rupiah | | | 55,759 | | 0.4 | |
Japanese yen | | | 681,574 | | 4.7 | |
Korean won | | | 112,289 | | 0.8 | |
South African rand | | | 75,330 | | 0.5 | |
Swiss franc | | | 717,174 | | 5.0 | |
Thai baht | | | 37,931 | | 0.3 | |
U.S. dollar | | | 10,214,934 | | 70.8 | |
| | | | | | |
Total investments | | $ | 14,423,896 | | 100.0 | % |
| | | | | | |
| | | | | |
| TOP TEN HOLDINGS - March 31, 2010 (Unaudited) | |
Company Name | | Country | | Percentage
of Total
Net Assets | |
Nestle SA | | Switzerland | | 2.9 | % |
Teva Pharmaceutical Industries Limited | | Israel | | 2.8 | |
BHP Billiton Plc | | United Kingdom | | 2.1 | |
HSBC Holdings plc | | United Kingdom | | 2.1 | |
INPEX CORPORATION | | Japan | | 2.0 | |
Roche Holding AG | | Switzerland | | 1.9 | |
Accenture plc | | United States | | 1.9 | |
Telefonica S.A. | | Spain | | 1.9 | |
Gazprom | | Russia | | 1.7 | |
Google Inc. | | United States | | 1.7 | |
| | | | | |
Total | | | | 21.0 | % |
| | | | | |
For the purpose of determining the Fund’s top ten holdings, securities of the same issuer are aggregated to determine the weight in the Fund.
The accompanying notes are an integral part of the financial statements.
26
ARTISAN GLOBAL VALUE FUND
Schedule of Investments – March 31, 2010 (Unaudited)
| | | | | |
| | | Shares
Held | | Value |
| | | | | |
COMMON STOCKS AND
EQUITY-LINKED SECURITIES - 95.3% | | | |
| | | | | |
| FRANCE - 7.5% | | | | | |
Publicis Groupe | | 18,834 | | $ | 805,881 |
Societe Television Francaise 1 | | 26,039 | | | 483,054 |
Sodexo | | 13,834 | | | 826,807 |
Total SA | | 5,628 | | | 326,711 |
| | | | | |
| | | | | 2,442,453 |
| HONG KONG - 2.6% | | | | | |
Guoco Group Limited | | 81,250 | | | 849,728 |
| | | | | |
| IRELAND - 1.5% | | | | | |
Ryanair Holdings PLC, Equity-Linked Security, 144A(1)(2)(3)(4) | | 97,296 | | | 483,599 |
| | | | | |
| JAPAN - 4.7% | | | | | |
Credit Saison Co., Ltd. | | 37,100 | | | 575,409 |
Daiwa Securities Group Inc. | | 59,596 | | | 313,630 |
Mitsubishi UFJ Financial Group, Inc. | | 60,200 | | | 315,520 |
SANKYO CO., LTD. | | 6,548 | | | 323,933 |
| | | | | |
| | | | | 1,528,492 |
| NETHERLANDS - 1.2% | | | | | |
Wolters Kluwer NV | | 17,158 | | | 372,066 |
| | | | | |
| SWITZERLAND - 10.0% | | | | | |
Adecco SA | | 11,494 | | | 652,424 |
Novartis AG | | 16,414 | | | 886,549 |
Panalpina Welttransport Holding AG | | 8,909 | | | 756,640 |
Pargesa Holding SA | | 11,301 | | | 959,256 |
| | | | | |
| | | | | 3,254,869 |
| UNITED KINGDOM - 22.3% | | | | | |
Compass Group PLC | | 87,298 | | | 696,817 |
Diageo plc | | 54,983 | | | 922,809 |
Experian PLC | | 156,142 | | | 1,536,590 |
Home Retail Group plc | | 119,895 | | | 493,059 |
Lloyds Banking Group plc(4) | | 585,819 | | | 558,013 |
Royal Dutch Shell PLC, Class A | | 12,276 | | | 355,073 |
Signet Jewelers Ltd.(4) | | 49,395 | | | 1,597,434 |
Unilever plc (DR) | | 36,711 | | | 1,074,898 |
| | | | | |
| | | | | 7,234,693 |
| UNITED STATES - 45.5% | | | | | |
3M Company | | 5,965 | | | 498,495 |
American Express Company | | 34,477 | | | 1,422,521 |
Apollo Group, Inc., Class A(4)(5) | | 7,865 | | | 482,046 |
Arch Capital Group Ltd.(4)(6) | | 13,821 | | | 1,053,851 |
| | | | | | | |
| | | Shares
Held | | Value | |
| | | | | | | |
| UNITED STATES (CONTINUED) | | | | | | | |
The Bank of New York Mellon Corporation | | | 38,837 | | $ | 1,199,287 | |
The Chubb Corporation | | | 10,441 | | | 541,366 | |
Cintas Corporation | | | 29,200 | | | 820,228 | |
Covidien plc | | | 11,640 | | | 585,259 | |
Dell Inc.(4) | | | 26,278 | | | 394,433 | |
Johnson & Johnson | | | 17,725 | | | 1,155,670 | |
Marsh & McLennan Companies, Inc. | | | 46,690 | | | 1,140,170 | |
Microsoft Corporation | | | 11,995 | | | 351,094 | |
Mohawk Industries, Inc.(4) | | | 16,940 | | | 921,197 | |
The Procter & Gamble Company | | | 14,936 | | | 945,001 | |
The Sherwin-Williams Company | | | 6,315 | | | 427,399 | |
Sysco Corporation | | | 23,652 | | | 697,734 | |
Tyco Electronics Ltd. | | | 38,619 | | | 1,061,250 | |
Wal-Mart Stores, Inc. | | | 19,492 | | | 1,083,755 | |
| | | | | | | |
| | | | | | 14,780,756 | |
| | | | | | | |
Total common stocks and equity-linked securities
(Cost $23,616,123) | | | 30,946,656 | |
| | |
| | | Par
Amount | | | |
| SHORT-TERM INVESTMENTS (CASH EQUIVALENTS) - 5.4% | | | | | | | |
Repurchase agreement with Fixed Income Clearing Corporation, 0.00%, dated 3/31/10, due 4/1/10, maturity value $1,750,000(7)
(Cost $1,750,000) | | $ | 1,750,000 | | | 1,750,000 | |
| | | | | | | |
| | | | | | | |
Total investments - 100.7%
(Cost $25,366,123) | | | | | | 32,696,656 | |
| | | | | | | |
Other assets less liabilities - (0.7%) | | | | | | (219,839 | ) |
| | | | | | | |
| | | | | | | |
Total net assets - 100.0%(8) | | | | | $ | 32,476,817 | |
| | | | | | | |
| (1) | Valued at a fair value in accordance with procedures established by the board of directors of Artisan Funds, Inc. In total, securities valued at a fair value were $483,599 or 1.5% of total net assets. |
| (2) | Security is an equity-linked participation certificate issued by HSBC Bank plc. As described in Note 2(i) in Notes to Financial Statements, equity-linked participation certificates are subject to counterparty risk with respect to the bank or broker-dealer that issues them. |
27
| (3) | Security is restricted and was acquired in a transaction under Rule 144A of the Securities Act of 1933, as amended. Restricted securities may be resold in transactions exempt from registration normally to qualified institutional buyers. Ryanair Holdings PLC was acquired on various dates from August 26, 2009 to November 3, 2009 at an aggregate cost of $436,548. In total, the value of these restricted securities held by the Fund was $483,599 or 1.5% of total net assets. |
| (4) | Non-income producing security. |
| (6) | Affiliated company as defined by the Investment Company Act of 1940, as amended. See Note (6) in Notes to Financial Statements. |
| | | | | | | | |
Issuer | | Rate | | | Maturity | | Value |
U.S. Treasury Note | | 4.625 | % | | 11/15/2016 | | $ | 1,789,743 |
| (8) | Percentages for the various classifications relate to total net assets. |
Company names are as reported by a data service provider and in some cases are translations; a company’s legal name may be different.
(DR) Depository Receipt, voting rights may vary.
| | | | | | | |
| PORTFOLIO DIVERSIFICATION - March 31, 2010 (Unaudited) | |
| | | Value | | | Percentage
of Total
Net Assets | |
Consumer Discretionary | | $ | 7,429,693 | | | 22.9 | % |
Consumer Staples | | | 4,724,197 | | | 14.5 | |
Energy | | | 681,784 | | | 2.1 | |
Financials | | | 8,928,751 | | | 27.5 | |
Healthcare | | | 2,627,478 | | | 8.1 | |
Industrials | | | 4,747,976 | | | 14.6 | |
Information Technology | | | 1,806,777 | | | 5.6 | |
| | | | | | | |
Total common stocks | | | 30,946,656 | | | 95.3 | |
Short-term investments | | | 1,750,000 | | | 5.4 | |
| | | | | | | |
Total investments | | | 32,696,656 | | | 100.7 | |
Other assets less liabilities | | | (219,839 | ) | | (0.7 | ) |
| | | | | | | |
Total net assets | | $ | 32,476,817 | | | 100.0 | % |
| | | | | | | |
| | | | | | |
| CURRENCY EXPOSURE - March 31, 2010 (Unaudited) | |
| | | Value | | Percentage
of Total
Investments | |
British pound | | $ | 4,207,288 | | 12.9 | % |
Euro | | | 3,653,191 | | 11.2 | |
Hong Kong dollar | | | 849,728 | | 2.6 | |
Japanese yen | | | 1,528,492 | | 4.7 | |
Swiss franc | | | 3,254,869 | | 9.9 | |
U.S. dollar | | | 19,203,088 | | 58.7 | |
| | | | | | |
Total investments | | $ | 32,696,656 | | 100.0 | % |
| | | | | | |
| | | | | |
| TOP TEN HOLDINGS - March 31, 2010 (Unaudited) | |
Company Name | | Country | | Percentage
of Total
Net Assets | |
Signet Jewelers Ltd. | | United Kingdom | | 4.9 | % |
Experian PLC | | United Kingdom | | 4.7 | |
American Express Company | | United States | | 4.4 | |
The Bank of New York Mellon Corporation | | United States | | 3.7 | |
Johnson & Johnson | | United States | | 3.6 | |
Marsh & McLennan Companies, Inc. | | United States | | 3.5 | |
Wal-Mart Stores, Inc. | | United States | | 3.3 | |
Unilever plc | | United Kingdom | | 3.3 | |
Tyco Electronics Ltd. | | United States | | 3.3 | |
Arch Capital Group Ltd. | | United States | | 3.2 | |
| | | | | |
Total | | | | 37.9 | % |
| | | | | |
For the purpose of determining the Fund’s top ten holdings, securities of the same issuer are aggregated to determine the weight in the Fund.
The accompanying notes are an integral part of the financial statements.
28
ARTISAN INTERNATIONAL FUND
Schedule of Investments – March 31, 2010 (Unaudited)
| | | | | |
| | | Shares
Held | | Value |
| | | | | |
COMMON AND
PREFERRED STOCKS - 98.9% | | | |
| | | | | |
| AUSTRALIA - 0.2% | | | | | |
Foster’s Group Limited | | 4,050,176 | | $ | 19,661,049 |
| | | | | |
| BELGIUM - 1.5% | | | | | |
Anheuser-Busch InBev NV | | 1,987,856 | | | 100,133,295 |
Umicore | | 1,451,958 | | | 50,703,924 |
| | | | | |
| | | | | 150,837,219 |
| BRAZIL - 1.3% | | | | | |
Petroleo Brasileiro S.A., Preferred (DR) | | 3,467,624 | | | 137,283,234 |
| | | | | |
| CANADA - 2.3% | | | | | |
Canadian Pacific Railway Limited | | 4,218,471 | | | 237,246,809 |
| | | | | |
| CHINA - 7.6% | | | | | |
Baidu, Inc., Class A (DR)(1) | | 51,837 | | | 30,946,689 |
Beijing Enterprises Holdings Ltd. | | 5,260,470 | | | 36,586,326 |
China Construction Bank, H Shares | | 172,387,100 | | | 140,986,970 |
China Life Insurance Co., Limited,
H Shares | | 31,712,900 | | | 151,942,542 |
China Merchants Bank Co., Ltd.,
H Shares | | 11,120,804 | | | 30,078,486 |
China Merchants Holdings International Company Limited | | 15,554,265 | | | 56,894,243 |
Ctrip.com International, Ltd. (DR)(1) | | 510,206 | | | 20,000,075 |
Huabao International Holdings Limited | | 80,561,405 | | | 96,288,739 |
Industrial and Commercial Bank of China Ltd, H Shares | | 129,116,800 | | | 98,613,855 |
Tencent Holdings Limited | �� | 1,010,500 | | | 20,264,011 |
Wynn Macau Limited(1) | | 69,329,672 | | | 99,830,084 |
| | | | | |
| | | | | 782,432,020 |
| DENMARK - 1.2% | | | | | |
Danske Bank A/S(1) | | 5,110,524 | | | 125,727,903 |
| | | | | |
| FRANCE - 12.5% | | | | | |
Accor S.A. | | 2,443,762 | | | 135,195,374 |
BNP Paribas | | 2,727,893 | | | 209,496,688 |
Compagnie de Saint-Gobain | | 1,189,302 | | | 57,185,395 |
Credit Agricole S.A. | | 3,781,281 | | | 66,189,169 |
Natixis(1) | | 19,801,049 | | | 106,843,463 |
Pernod Ricard SA | | 2,960,307 | | | 251,375,639 |
| | | | | |
| | | Shares
Held | | Value |
| | | | | |
| FRANCE (CONTINUED) | | | | | |
Societe Generale | | 2,576,520 | | $ | 162,045,174 |
Unibail-Rodamco | | 615,157 | | | 124,629,314 |
Vinci SA | | 3,070,721 | | | 180,974,887 |
| | | | | |
| | | | | 1,293,935,103 |
| GERMANY - 13.7% | | | | | |
Bayer AG | | 4,223,307 | | | 285,666,917 |
Daimler AG | | 4,898,618 | | | 230,611,859 |
Deutsche Boerse AG | | 291,010 | | | 21,570,737 |
Deutsche Post AG | | 11,835,137 | | | 205,329,038 |
Linde AG | | 2,610,379 | | | 311,461,189 |
Muenchener Rueckversicherungs-Gesellschaft AG | | 1,626,456 | | | 263,942,344 |
Rhoen-Klinikum AG | | 52,496 | | | 1,343,626 |
RWE AG | | 1,092,986 | | | 96,841,479 |
| | | | | |
| | | | | 1,416,767,189 |
| HONG KONG - 4.1% | | | | | |
The Bank of East Asia, Ltd. | | 15,875,835 | | | 58,683,899 |
Esprit Holdings Limited | | 8,912,800 | | | 70,367,987 |
Li & Fung Limited | | 27,734,899 | | | 136,276,704 |
NWS Holdings Limited | | 33,563,746 | | | 66,917,833 |
Sands China Ltd.(1) | | 61,192,264 | | | 97,097,426 |
| | | | | |
| | | | | 429,343,849 |
| INDIA - 2.5% | | | | | |
Housing Development Finance Corporation Ltd. | | 1,248,822 | | | 75,535,720 |
ICICI Bank Limited | | 1,675,413 | | | 35,639,145 |
ICICI Bank Limited (DR) | | 3,355,985 | | | 143,300,560 |
| | | | | |
| | | | | 254,475,425 |
| ITALY - 1.6% | | | | | |
Intesa Sanpaolo(1) | | 44,606,531 | | | 166,133,397 |
| | | | | |
| JAPAN - 8.0% | | | | | |
DENSO CORPORATION | | 3,393,734 | | | 101,096,900 |
FAST RETAILING CO., LTD. | | 430,450 | | | 74,818,831 |
HONDA MOTOR CO., LTD. | | 3,154,100 | | | 111,333,084 |
Mitsubishi Corporation | | 1,062,200 | | | 27,836,025 |
Mitsubishi UFJ Financial Group, Inc. | | 5,564,800 | | | 29,166,242 |
MITSUI & CO., LTD. | | 14,769,600 | | | 248,187,417 |
Nitori Co., Ltd. | | 1,015,050 | | | 77,086,908 |
SUZUKI MOTOR CORPORATION | | 5,331,006 | | | 117,636,810 |
The Tokyo Electric Power Company, Incorporated | | 1,550,100 | | | 41,318,314 |
| | | | | |
| | | | | 828,480,531 |
29
| | | | | |
| | | Shares
Held | | Value |
| | | | | |
| NETHERLANDS - 9.9% | | | | | |
Akzo Nobel N.V. | | 2,429,679 | | $ | 138,469,099 |
ASML Holding N.V. | | 13,736,782 | | | 490,928,021 |
ING Groep N.V.(1) | | 25,996,320 | | | 259,547,475 |
TNT NV | | 4,907,157 | | | 140,709,339 |
| | | | | |
| | | | | 1,029,653,934 |
| SINGAPORE - 1.6% | | | | | |
Genting Singapore PLC(1) | | 98,584,799 | | | 62,366,451 |
Oversea-Chinese Banking Corporation Limited | | 17,052,900 | | | 106,173,029 |
| | | | | |
| | | | | 168,539,480 |
| SPAIN - 0.7% | | | | | |
Industria de Diseno Textil, S.A. | | 1,182,433 | | | 77,944,205 |
| | | | | |
| SWEDEN - 1.2% | | | | | |
AB SKF, Class B | | 2,642,181 | | | 46,947,874 |
Sandvik AB | | 5,926,172 | | | 74,070,995 |
| | | | | |
| | | | | 121,018,869 |
| SWITZERLAND - 10.8% | | | | | |
Holcim Ltd.(1) | | 3,409,524 | | | 254,162,165 |
Nestle SA | | 5,815,029 | | | 297,810,666 |
Novartis AG | | 3,869,333 | | | 208,989,486 |
Roche Holding AG | | 340,244 | | | 56,761,115 |
Roche Holding AG - Genussscheine(2) | | 1,301,588 | | | 211,088,342 |
UBS AG(1) | | 5,658,391 | | | 91,981,052 |
| | | | | |
| | | | | 1,120,792,826 |
| TAIWAN - 1.4% | | | | | |
Taiwan Semiconductor Manufacturing Company Ltd. (DR) | | 12,262,088 | | | 128,629,303 |
Uni-President Enterprises Corp. | | 10,111,000 | | | 11,509,309 |
| | | | | |
| | | | | 140,138,612 |
| TURKEY - 0.0%(3) | | | | | |
Coca-Cola Icecek AS | | 348,439 | | | 2,961,531 |
| | | | | |
| UNITED KINGDOM - 11.8% | | | | | |
Carnival plc | | 591,478 | | | 24,279,195 |
Experian PLC | | 20,372,331 | | | 200,483,728 |
HSBC Holdings plc | | 18,787,002 | | | 190,609,357 |
Imperial Tobacco Group plc | | 6,064,662 | | | 184,982,687 |
Kingfisher PLC | | 33,175,167 | | | 107,936,001 |
National Grid PLC | | 5,432,144 | | | 52,880,598 |
Smith & Nephew PLC | | 12,080,417 | | | 120,349,719 |
Standard Chartered plc | | 1,553,099 | | | 42,363,952 |
Tesco plc | | 44,797,052 | | | 296,016,661 |
| | | | | |
| | | | | 1,219,901,898 |
| UNITED STATES - 5.0% | | | | | |
Accenture plc, Class A | | 3,807,576 | | | 159,727,813 |
Covidien plc | | 3,925,270 | | | 197,362,576 |
| | | | | | |
| | | Shares
Held | | Value |
| | | | | | |
| UNITED STATES (CONTINUED) | | | | | | |
Philip Morris International Inc. | | | 3,012,404 | | $ | 157,126,993 |
| | | | | | |
| | | | | | 514,217,382 |
| | | | | | |
Total common and preferred stocks (Cost $8,802,259,308) | | | | | | 10,237,492,465 |
| | |
| | | Par
Amount | | |
SHORT-TERM INVESTMENTS
(CASH EQUIVALENTS) - 1.0% | | | | | | |
Repurchase agreement with Fixed Income Clearing Corporation, 0.00%, dated 3/31/10, due 4/1/10, maturity value $102,820,000(4)
(Cost $102,820,000) | | $ | 102,820,000 | | | 102,820,000 |
| | | | | | |
| | | | | | |
Total investments - 99.9%
(Cost $8,905,079,308) | | | | | | 10,340,312,465 |
| | | | | | |
Other assets less liabilities - 0.1% | | | 7,101,289 |
| | | | | | |
| | | | | | |
Total net assets - 100.0%(5) | | | | | $ | 10,347,413,754 |
| | | | | | |
| (1) | Non-income producing security. |
| (3) | Represents less than 0.1% of total net assets. |
| | | | | | | | |
Issuer | | Rate | | | Maturity | | Value |
U.S. Treasury Note | | 3.375 | % | | 6/30/2013 | | $ | 104,878,862 |
| (5) | Percentages for the various classifications relate to total net assets. |
Company names are as reported by a data service provider and in some cases are translations; a company’s legal name may be different.
(DR) Depository Receipt, voting rights may vary.
30
| | | | | | |
| PORTFOLIO DIVERSIFICATION - March 31, 2010 (Unaudited) | |
| | | Value | | Percentage
of Total
Net Assets | |
Consumer Discretionary | | $ | 1,543,877,894 | | 14.9 | % |
Consumer Staples | | | 1,321,577,830 | | 12.8 | |
Energy | | | 137,283,234 | | 1.3 | |
Financials | | | 2,701,200,473 | | 26.1 | |
Healthcare | | | 1,081,561,781 | | 10.5 | |
Industrials | | | 1,579,369,909 | | 15.3 | |
Information Technology | | | 830,495,837 | | 8.0 | |
Materials | | | 851,085,116 | | 8.2 | |
Utilities | | | 191,040,391 | | 1.8 | |
| | | | | | |
Total common and preferred stocks | | | 10,237,492,465 | | 98.9 | |
Short-term investments | | | 102,820,000 | | 1.0 | |
| | | | | | |
Total investments | | | 10,340,312,465 | | 99.9 | |
Other assets less liabilities | | | 7,101,289 | | 0.1 | |
| | | | | | |
Total net assets | | $ | 10,347,413,754 | | 100.0 | % |
| | | | | | |
| | | | | | |
| CURRENCY EXPOSURE - March 31, 2010 (Unaudited) | |
| | | Value | | Percentage
of Total
Investments | |
Australian dollar | | $ | 19,661,049 | | 0.2 | % |
British pound | | | 1,186,324,204 | | 11.5 | |
Danish krone | | | 125,727,903 | | 1.2 | |
Euro | | | 4,135,271,047 | | 40.0 | |
Hong Kong dollar | | | 1,194,406,799 | | 11.6 | |
Indian rupee | | | 111,174,865 | | 1.1 | |
Japanese yen | | | 828,480,531 | | 8.0 | |
Singapore dollar | | | 168,539,480 | | 1.6 | |
Swedish krona | | | 121,018,869 | | 1.2 | |
Swiss franc | | | 1,120,792,826 | | 10.8 | |
Taiwan dollar | | | 11,509,309 | | 0.1 | |
Turkish lira | | | 2,961,531 | | 0.0 | (1) |
U.S. dollar | | | 1,314,444,052 | | 12.7 | |
| | | | | | |
Total investments | | $ | 10,340,312,465 | | 100.0 | % |
| | | | | | |
| (1) | Represents less than 0.1% of total investments. |
| | | | | |
| TOP TEN HOLDINGS - March 31, 2010 (Unaudited) | |
Company Name | | Country | | Percentage
of Total
Net Assets | |
ASML Holding N.V. | | Netherlands | | 4.7 | % |
Linde AG | | Germany | | 3.0 | |
Nestle SA | | Switzerland | | 2.9 | |
Tesco plc | | United Kingdom | | 2.9 | |
Bayer AG | | Germany | | 2.8 | |
Roche Holding AG | | Switzerland | | 2.6 | |
Muenchener Rueckversicherungs-Gesellschaft AG | | Germany | | 2.6 | |
ING Groep N.V. | | Netherlands | | 2.5 | |
Holcim Ltd. | | Switzerland | | 2.5 | |
Pernod Ricard SA | | France | | 2.4 | |
| | | | | |
Total | | | | 28.9 | % |
| | | | | |
For the purpose of determining the Fund's top ten holdings, securities of the same issuer are aggregated to determine the weight in the Fund.
The accompanying notes are an integral part of the financial statements.
31
ARTISAN INTERNATIONAL SMALL CAP FUND
Schedule of Investments – March 31, 2010 (Unaudited)
| | | | | |
| | | Shares
Held | | Value |
| | | | | |
| COMMON STOCKS - 95.6% | | | | | |
| | | | | |
| AUSTRALIA - 1.9% | | | | | |
Domino’s Pizza Enterprises Limited | | 3,065,747 | | $ | 15,107,330 |
| | | | | |
| AUSTRIA - 4.4% | | | | | |
bwin Interactive Entertainment AG(1) | | 286,999 | | | 16,881,519 |
Flughafen Wien AG | | 331,050 | | | 16,463,431 |
Wienerberger AG(1) | | 91,816 | | | 1,788,243 |
| | | | | |
| | | | | 35,133,193 |
| CANADA - 2.1% | | | | | |
Finning International Inc. | | 931,417 | | | 16,873,995 |
| | | | | |
| CHINA - 14.4% | | | | | |
Beijing Capital Land Limited, H Shares | | 10,828,000 | | | 4,253,521 |
China Everbright International Limited | | 23,915,700 | | | 12,166,921 |
China Gas Holdings Ltd. | | 23,298,000 | | | 13,082,948 |
China National Building Material Company Ltd., H Shares | | 3,284,000 | | | 6,352,923 |
China Real Estate Information Corp. (DR)(1) | | 496,478 | | | 4,974,710 |
Hengan International Group Company Limited | | 2,426,550 | | | 18,095,405 |
Intime Department Store Group Company Limited | | 9,711,000 | | | 9,405,509 |
New World Department Store China | | 5,621,000 | | | 5,393,496 |
Ports Design Limited | | 2,470,000 | | | 6,235,245 |
REXLot Holdings Limited | | 160,325,000 | | | 22,920,533 |
Yingde Gases(1) | | 9,977,000 | | | 11,025,232 |
| | | | | |
| | | | | 113,906,443 |
| EGYPT - 2.9% | | | | | |
Commercial International Bank (DR) | | 1,570,693 | | | 18,377,108 |
Eastern Tobacco | | 197,642 | | | 4,486,969 |
| | | | | |
| | | | | 22,864,077 |
| FRANCE - 3.7% | | | | | |
Laurent-Perrier | | 68,940 | | | 5,540,274 |
Meetic(1) | | 340,582 | | | 10,442,164 |
Remy Cointreau SA | | 201,605 | | | 10,415,394 |
Vilmorin & Cie | | 23,941 | | | 2,458,500 |
| | | | | |
| | | | | 28,856,332 |
| GERMANY - 9.9% | | | | | |
Gerresheimer AG | | 604,897 | | | 18,913,652 |
Sixt AG | | 208,377 | | | 6,664,606 |
Wacker Neuson SE | | 1,264,345 | | | 14,481,196 |
Wirecard AG | | 4,047,122 | | | 38,263,731 |
| | | | | |
| | | | | 78,323,185 |
| | | | | |
| | | Shares
Held | | Value |
| | | | | |
| HONG KONG - 8.2% | | | | | |
Beijing Enterprises Water Group Limited(1) | | 47,222,000 | | $ | 17,455,278 |
Cafe De Coral Holdings Limited | | 5,102,000 | | | 11,972,623 |
Industrial and Commercial Bank of China (Asia) Limited | | 9,528,000 | | | 23,929,678 |
Shangri-La Asia Limited | | 2,900,000 | | | 5,669,833 |
SJM Holdings Limited | | 8,919,000 | | | 5,858,505 |
| | | | | |
| | | | | 64,885,917 |
| INDIA - 0.2% | | | | | |
ACC Limited | | 72,000 | | | 1,518,503 |
| | | | | |
| ITALY - 5.3% | | | | | |
Azimut Holding SpA | | 656,588 | | | 8,313,946 |
Bulgari S.p.A. | | 1,339,106 | | | 10,906,245 |
Davide Campari - Milano S.p.A. | | 2,097,553 | | | 22,423,677 |
| | | | | |
| | | | | 41,643,868 |
| JAPAN - 0.7% | | | | | |
Nichi-iko Pharmaceutical Co., Ltd. | | 196,300 | | | 5,515,885 |
| | | | | |
| RUSSIA - 0.2% | | | | | |
Pharmstandard(1)(2) | | 24,350 | | | 1,965,840 |
| | | | | |
| SINGAPORE - 2.3% | | | | | |
City Developments Limited | | 690,000 | | | 5,228,207 |
SIA Engineering Company | | 5,008,700 | | | 12,710,165 |
| | | | | |
| | | | | 17,938,372 |
| SPAIN - 0.6% | | | | | |
Sol Melia, S.A. | | 516,528 | | | 4,444,023 |
| | | | | |
| SWITZERLAND - 9.0% | | | | | |
Bank Sarasin & Cie AG, B Shares(1) | | 633,062 | | | 26,267,510 |
Nobel Biocare Holding AG | | 475,249 | | | 12,710,567 |
Schindler Holding AG, Participation Certificates(3) | | 241,995 | | | 21,298,498 |
Straumann Holding AG | | 43,986 | | | 10,950,612 |
| | | | | |
| | | | | 71,227,187 |
| THAILAND - 1.2% | | | | | |
CP ALL PCL(1)(2) | | 11,000,300 | | | 9,355,443 |
| | | | | |
| TURKEY - 3.8% | | | | | |
Coca-Cola Icecek AS | | 3,544,968 | | | 30,130,184 |
| | | | | |
| UNITED KINGDOM - 23.7% | | | | | |
888 Holdings PLC | | 5,658,721 | | | 8,518,407 |
Babcock International Group plc | | 1,373,274 | | | 12,555,750 |
32
| | | | | | |
| | | Shares
Held | | Value |
| | | | | | |
| UNITED KINGDOM (CONTINUED) | | | | | | |
The Berkeley Group Holdings PLC(1) | | | 862,833 | | $ | 10,658,095 |
Catlin Group Limited | | | 1,232,924 | | | 6,739,201 |
Enterprise Inns plc(1) | | | 9,159,754 | | | 16,679,901 |
Greene King PLC | | | 1,272,185 | | | 8,652,678 |
InterContinental Hotels Group PLC | | | 442,561 | | | 6,930,766 |
Marston’s PLC | | | 2,399,879 | | | 3,339,543 |
Mothercare plc | | | 1,183,993 | | | 10,789,233 |
PartyGaming plc(1) | | | 1,977,534 | | | 9,605,900 |
Persimmon plc(1) | | | 1,246,099 | | | 8,802,391 |
Playtech Ltd. | | | 1,691,597 | | | 13,861,783 |
Premier Foods PLC(1) | | | 39,005,083 | | | 18,786,962 |
Punch Taverns plc(1) | | | 14,232,350 | | | 17,278,062 |
Redrow plc(1) | | | 4,457,662 | | | 9,585,293 |
SSL International plc | | | 1,486,712 | | | 18,341,963 |
VT Group plc | | | 492,389 | | | 5,603,999 |
| | | | | | |
| | | | | | 186,729,927 |
| UNITED STATES - 1.1% | | | | | | |
AsiaInfo Holdings, Inc.(1) | | | 319,956 | | | 8,472,435 |
| | | | | | |
Total common stocks
(Cost $625,300,746) | | | | | | 754,892,139 |
| | |
| | | Par
Amount | | |
| SHORT-TERM INVESTMENTS (CASH EQUIVALENTS) - 1.1% | | | | | | |
Repurchase agreement with Fixed Income Clearing Corporation, 0.00%, dated 3/31/10, due 4/1/10, maturity value $8,568,000(4)
(Cost $8,568,000) | | $ | 8,568,000 | | | 8,568,000 |
| | | | | | |
| | | | | | |
Total investments - 96.7%
(Cost $633,868,746) | | | | | | 763,460,139 |
| | | | | | |
Other assets less liabilities - 3.3% | | | | | | 25,847,629 |
| | | | | | |
| | | | | | |
Total net assets - 100.0%(5) | | | | | $ | 789,307,768 |
| | | | | | |
| (1) | Non-income producing security. |
| (2) | Valued at a fair value in accordance with procedures established by the board of directors of Artisan Funds, Inc. In total, securities valued at a fair value were $11,321,283 or 1.4% of total net assets. |
| | | | | |
Issuer | | Maturity | | Value |
U.S. Treasury Bill | | 5/20/2010 | | $ | 8,743,251 |
| (5) | Percentages for the various classifications relate to total net assets. |
Company names are as reported by a data service provider and in some cases are translations; a company’s legal name may be different.
(DR) Depository Receipt, voting rights may vary.
| | | | | | |
| PORTFOLIO DIVERSIFICATION - March 31, 2010 (Unaudited) | |
| | | Value | | Percentage
of Total
Net Assets | |
Consumer Discretionary | | $ | 225,635,130 | | 28.6 | % |
Consumer Staples | | | 121,692,808 | | 15.4 | |
Financials | | | 98,083,881 | | 12.4 | |
Healthcare | | | 68,398,519 | | 8.7 | |
Industrials | | | 138,062,082 | | 17.5 | |
Information Technology | | | 71,040,113 | | 9.0 | |
Materials | | | 18,896,658 | | 2.4 | |
Utilities | | | 13,082,948 | | 1.6 | |
| | | | | | |
Total common stocks | | | 754,892,139 | | 95.6 | |
Short-term investments | | | 8,568,000 | | 1.1 | |
| | | | | | |
Total investments | | | 763,460,139 | | 96.7 | |
Other assets less liabilities | | | 25,847,629 | | 3.3 | |
| | | | | | |
Total net assets | | $ | 789,307,768 | | 100.0 | % |
| | | | | | |
| | | | | | |
| CURRENCY EXPOSURE - March 31, 2010 (Unaudited) | |
| | | Value | | Percentage
of Total
Investments | |
Australian dollar | | $ | 15,107,330 | | 2.0 | % |
British pound | | | 186,729,927 | | 24.5 | |
Canadian dollar | | | 16,873,995 | | 2.2 | |
Egyptian pound | | | 4,486,969 | | 0.6 | |
Euro | | | 188,400,601 | | 24.7 | |
Hong Kong dollar | | | 173,817,650 | | 22.8 | |
Indian rupee | | | 1,518,503 | | 0.2 | |
Japanese yen | | | 5,515,885 | | 0.7 | |
Singapore dollar | | | 17,938,372 | | 2.4 | |
Swiss franc | | | 71,227,187 | | 9.3 | |
Thai baht | | | 9,355,443 | | 1.2 | |
Turkish lira | | | 30,130,184 | | 3.9 | |
U.S. dollar | | | 42,358,093 | | 5.5 | |
| | | | | | |
Total investments | | $ | 763,460,139 | | 100.0 | % |
| | | | | | |
33
| | | | | |
| TOP TEN HOLDINGS - March 31, 2010 (Unaudited) | |
Company Name | | Country | | Percentage
of Total
Net Assets | |
Wirecard AG | | Germany | | 4.8 | % |
Coca-Cola Icecek AS | | Turkey | | 3.8 | |
Bank Sarasin & Cie AG | | Switzerland | | 3.3 | |
Industrial and Commercial Bank of China (Asia) Limited | | Hong Kong | | 3.0 | |
REXLot Holdings Limited | | China | | 2.9 | |
Davide Campari - Milano S.p.A. | | Italy | | 2.8 | |
Schindler Holding AG | | Switzerland | | 2.7 | |
Gerresheimer AG | | Germany | | 2.4 | |
Premier Foods PLC | | United Kingdom | | 2.4 | |
Commercial International Bank | | Egypt | | 2.3 | |
| | | | | |
Total | | | | 30.4 | % |
| | | | | |
For the purpose of determining the Fund’s top ten holdings, securities of the same issuer are aggregated to determine the weight in the Fund.
The accompanying notes are an integral part of the financial statements.
34
ARTISAN INTERNATIONAL VALUE FUND
Schedule of Investments - March 31, 2010 (Unaudited)
| | | | | |
| | | Shares
Held | | Value |
| | | | | |
COMMON STOCKS AND
EQUITY-LINKED SECURITIES - 92.4% | | | |
| | | | | |
| BELGIUM - 0.7% | | | | | |
Groupe Bruxelles Lambert S.A. | | 216,493 | | $ | 19,129,225 |
| | | | | |
| FRANCE - 12.0% | | | | | |
Gemalto NV(1) | | 961,919 | | | 41,626,892 |
Publicis Groupe | | 1,866,971 | | | 79,885,088 |
Societe Television Francaise 1 | | 3,682,460 | | | 68,313,994 |
Sodexo | | 1,265,854 | | | 75,655,389 |
Total SA | | 1,190,334 | | | 69,100,028 |
| | | | | |
| | | | | 334,581,391 |
| HONG KONG - 2.8% | | | | | |
Guoco Group Limited | | 7,488,800 | | | 78,319,292 |
| | | | | |
| IRELAND - 2.3% | | | | | |
Ryanair Holdings PLC, Equity-Linked Security, 144A(1)(2)(3)(4) | | 12,930,719 | | | 64,270,765 |
| | | | | |
| JAPAN - 8.8% | | | | | |
Aderans Holdings Company Limited | | 1,649,900 | | | 19,571,495 |
Credit Saison Co., Ltd. | | 4,611,159 | | | 71,517,601 |
Daiwa Securities Group Inc. | | 8,324,431 | | | 43,808,108 |
MEITEC CORPORATION | | 734,747 | | | 14,390,007 |
Mitsubishi UFJ Financial Group, Inc. | | 2,831,800 | | | 14,842,037 |
Mitsubishi UFJ Financial Group, Inc.(4) | | 3,654,200 | | | 19,152,401 |
SANKYO CO., LTD. | | 1,036,438 | | | 51,273,139 |
SEINO HOLDINGS CO., LTD. | | 1,468,800 | | | 10,463,374 |
| | | | | |
| | | | | 245,018,162 |
| KOREA - 0.6% | | | | | |
Lotte Chilsung Beverage Co., Ltd. | | 21,573 | | | 16,492,682 |
| | | | | |
| NETHERLANDS - 1.0% | | | | | |
Wolters Kluwer NV | | 1,275,524 | | | 27,659,347 |
| | | | | |
| SINGAPORE - 0.1% | | | | | |
ARA Asset Management Limited | | 3,164,000 | | | 2,578,334 |
| | | | | |
| SWITZERLAND - 17.7% | | | |
Adecco SA | | 1,652,671 | | | 93,809,142 |
Givaudan SA | | 80,233 | | | 70,386,499 |
Nestle SA | | 882,371 | | | 45,189,714 |
Novartis AG | | 1,708,101 | | | 92,257,542 |
Panalpina Welttransport Holding AG | | 993,802 | | | 84,403,423 |
Pargesa Holding SA | | 1,134,566 | | | 96,304,682 |
| | | | | | |
| | | Shares
Held | | Value |
| | | | | | |
| SWITZERLAND (CONTINUED) | | | |
Tamedia AG | | | 124,422 | | $ | 10,148,228 |
| | | | | | |
| | | | | | 492,499,230 |
| UNITED KINGDOM - 32.4% | | | |
Brit Insurance Holdings NV | | | 2,978,456 | | | 34,011,526 |
Carpetright PLC | | | 1,710,914 | | | 20,770,483 |
Compass Group PLC | | | 9,483,880 | | | 75,700,756 |
Diageo plc | | | 5,282,285 | | | 88,655,438 |
Experian PLC | | | 15,100,173 | | | 148,600,520 |
Home Retail Group plc | | | 9,709,182 | | | 39,928,258 |
Lancashire Holdings Ltd | | | 4,037,560 | | | 29,495,346 |
Lloyds Banking Group plc(1) | | | 55,662,944 | | | 53,020,855 |
Qinetiq Group PLC | | | 19,855,890 | | | 40,375,934 |
Reed Elsevier PLC | | | 7,179,245 | | | 57,250,584 |
Royal Dutch Shell PLC, Class A | | | 1,742,447 | | | 50,398,850 |
Savills Plc | | | 6,146,972 | | | 32,461,524 |
Signet Jewelers Ltd.(1) | | | 4,147,639 | | | 134,134,645 |
Unilever plc (DR) | | | 2,987,517 | | | 87,474,498 |
Vitec Group PLC | | | 1,321,051 | | | 8,119,009 |
| | | | | | |
| | | | | | 900,398,226 |
| UNITED STATES - 14.0% | | | |
Accenture plc, Class A | | | 1,334,978 | | | 56,002,327 |
Arch Capital Group Ltd.(1)(5) | | | 1,465,031 | | | 111,708,614 |
Covidien plc | | | 2,198,645 | | | 110,547,871 |
Tyco Electronics Ltd. | | | 3,990,945 | | | 109,671,169 |
| | | | | | |
| | | | | | 387,929,981 |
| | | | | | |
Total common stocks and equity-linked securities
(Cost $2,210,364,223) | | | 2,568,876,635 |
| | |
| | | Par
Amount | | |
SHORT-TERM INVESTMENTS
(CASH EQUIVALENTS) - 6.7% | | | |
Repurchase agreement with Fixed Income Clearing Corporation, 0.00%, dated 3/31/10, due 4/1/10, maturity value $186,854,000(6)
(Cost $186,854,000) | | $ | 186,854,000 | | | 186,854,000 |
| | | | | | |
| | | | | | |
Total investments - 99.1%
(Cost $2,397,218,223) | | | 2,755,730,635 |
| | | | | | |
Other assets less liabilities - 0.9% | | | 24,083,422 |
| | | | | | |
| | | | | | |
Total net assets - 100.0%(7) | | $ | 2,779,814,057 |
| | | | | | |
35
| (1) | Non-income producing security. |
| (2) | Valued at a fair value in accordance with procedures established by the board of directors of Artisan Funds, Inc. In total, securities valued at a fair value were $64,270,765 or 2.3% of total net assets. |
| (3) | Security is an equity-linked participation certificate issued by HSBC Bank plc. As described in Note 2(i) in Notes to Financial Statements, equity-linked participation certificates are subject to counterparty risk with respect to the bank or broker-dealer that issues them. |
| (4) | Security is restricted. Ryanair Holdings PLC was acquired in a transaction under Rule 144A of the Securities Act of 1933, as amended. Restricted securities under Rule 144A may be resold in transactions exempt from registration normally to qualified institutional buyers. Mitsubishi UFJ Financial Group, Inc., was acquired in a private placement and is not deemed to be illiquid in the United States; however, the shares of the Mitsubishi UFJ Financial Group, Inc are freely tradeable outside the United States, where the Fund expects to trade them. |
| | | | | | | | | | | |
Security | | Acquisition
Dates | | Cost | | Value | | Percentage
of Total
Net Assets | |
Ryanair Holdings PLC | | 9/17/2008-
3/31/2010 | | $ | 54,812,778 | | $ | 64,270,765 | | 2.3 | % |
Mitsubishi UFJ Financial Group, Inc. | | 12/14/2009 | | | 17,639,402 | | | 19,152,401 | | 0.7 | % |
| | | | | | | | | | | |
Total Restricted Securities | | | | | | | $ | 83,423,166 | | 3.0 | % |
| | | | | | | | | | | |
| (5) | Affiliated company as defined by the Investment Company Act of 1940, as amended. See Note (6) in Notes to Financial Statements. |
| | | | | | | | |
Issuer | | Rate | | | Maturity | | Value |
U.S. Treasury Note | | 1.375 | % | | 3/15/2012 | | $ | 36,854,350 |
U.S. Treasury Note | | 1.375 | | | 9/15/2012 | | | 153,738,388 |
| | | | | | | | |
| | | | | | | $ | 190,592,738 |
| | | | | | | | |
| (7) | Percentages for the various classifications relate to total net assets. |
Company names are as reported by a data service provider and in some cases are translations; a company’s legal name may be different.
(DR) Depository Receipt, voting rights may vary.
36
| | | | | | |
| PORTFOLIO DIVERSIFICATION - March 31, 2010 (Unaudited) | |
| | | Value | | Percentage
of Total
Net Assets | |
Consumer Discretionary | | $ | 648,838,920 | | 23.3 | % |
Consumer Staples | | | 257,383,827 | | 9.3 | |
Energy | | | 119,498,878 | | 4.3 | |
Financials | | | 606,349,545 | | 21.8 | |
Healthcare | | | 202,805,413 | | 7.3 | |
Industrials | | | 456,313,165 | | 16.4 | |
Information Technology | | | 207,300,388 | | 7.5 | |
Materials | | | 70,386,499 | | 2.5 | |
| | | | | | |
Total common stocks | | | 2,568,876,635 | | 92.4 | |
Short-term investments | | | 186,854,000 | | 6.7 | |
| | | | | | |
Total investments | | | 2,755,730,635 | | 99.1 | |
Other assets less liabilities | | | 24,083,422 | | 0.9 | |
| | | | | | |
Total net assets | | $ | 2,779,814,057 | | 100.0 | % |
| | | | | | |
| | | | | | |
| CURRENCY EXPOSURE - March 31, 2010 (Unaudited) | |
| | | Value | | Percentage
of Total
Investments | |
British pound | | $ | 628,390,233 | | 22.8 | % |
Euro | | | 496,039,578 | | 18.0 | |
Hong Kong dollar | | | 78,319,292 | | 2.8 | |
Japanese yen | | | 245,018,162 | | 8.9 | |
Korean won | | | 16,492,682 | | 0.6 | |
Singapore dollar | | | 2,578,334 | | 0.1 | |
Swiss franc | | | 492,499,230 | | 17.9 | |
U.S. dollar | | | 796,393,124 | | 28.9 | |
| | | | | | |
Total investments | | $ | 2,755,730,635 | | 100.0 | % |
| | | | | | |
| | | | | |
| TOP TEN HOLDINGS - March 31, 2010 (Unaudited) | |
Company Name | | Country | | Percentage
of Total
Net Assets | |
Experian PLC | | United Kingdom | | 5.3 | % |
Signet Jewelers Ltd. | | United Kingdom | | 4.8 | |
Arch Capital Group Ltd. | | United States | | 4.0 | |
Covidien plc | | United States | | 4.0 | |
Tyco Electronics Ltd. | | United States | | 3.9 | |
Pargesa Holding SA | | Switzerland | | 3.5 | |
Adecco SA | | Switzerland | | 3.4 | |
Novartis AG | | Switzerland | | 3.3 | |
Diageo plc | | United Kingdom | | 3.2 | |
Unilever plc | | United Kingdom | | 3.1 | |
| | | | | |
Total | | | | 38.5 | % |
| | | | | |
For the purpose of determining the Fund’s top ten holdings, securities of the same issuer are aggregated to determine the weight in the Fund.
The Fund owns Pargesa Holding SA (Pargesa) which represents 3.5% of the Fund’s total net assets, and Groupe Bruxelles Lambert SA (GBL) which represents 0.7% of the Fund’s total net assests. Pargesa is the parent company of GBL. If aggregated, the Fund’s holdings of both securities would represent 4.2% of the Fund’s total net assets.
The accompanying notes are an integral part of the financial statements.
37
ARTISAN MID CAP FUND
Schedule of Investments – March 31, 2010 (Unaudited)
| | | | | |
| | | Shares
Held | | Value |
| | | | | |
| COMMON STOCKS - 97.8% | | | |
| | | | | |
| CONSUMER DISCRETIONARY - 19.9% | | | | | |
Auto Components - 1.8% | | | | | |
BorgWarner Inc.(1) | | 1,117,899 | | $ | 42,681,384 |
Johnson Controls, Inc. | | 1,235,662 | | | 40,764,489 |
| | | | | |
| | | | | 83,445,873 |
Distributors - 1.5% | | | | | |
LKQ Corporation(1) | | 3,464,201 | | | 70,323,280 |
| | | | | |
Hotels, Restaurants & Leisure - 5.8% | | | | | |
Chipotle Mexican Grill, Inc., Class A(1) | | 301,500 | | | 33,970,005 |
Ctrip.com International, Ltd. (DR)(1)(2) | | 2,054,100 | | | 80,520,720 |
Home Inns & Hotels Management, Inc. (DR)(1)(2) | | 787,500 | | | 25,782,750 |
Panera Bread Company, Class A(1) | | 115,100 | | | 8,803,999 |
Starbucks Corporation(1) | | 567,283 | | | 13,767,958 |
Starwood Hotels & Resorts Worldwide, Inc. | | 1,505,622 | | | 70,222,210 |
Wynn Resorts, Limited | | 485,300 | | | 36,800,299 |
| | | | | |
| | | | | 269,867,941 |
Household Durables - 2.7% | | | | | |
Gafisa S.A. (DR)(2) | | 2,436,900 | | | 33,483,006 |
Harman International Industries, Incorporated | | 1,962,900 | | | 91,824,462 |
| | | | | |
| | | | | 125,307,468 |
Multiline Retail - 3.3% | | | | | |
Kohl’s Corporation(1) | | 2,798,764 | | | 153,316,292 |
| | | | | |
Specialty Retail - 2.2% | | | | | |
Dick’s Sporting Goods, Inc., Class A(1) | | 2,094,400 | | | 54,684,784 |
O’Reilly Automotive, Inc.(1) | | 1,129,700 | | | 47,119,787 |
| | | | | |
| | | | | 101,804,571 |
Textiles, Apparel & Luxury Goods - 2.6% | | | | | |
Coach, Inc. | | 1,856,600 | | | 73,372,832 |
Polo Ralph Lauren Corporation, Class A | | 571,900 | | | 48,634,376 |
| | | | | |
| | | | | 122,007,208 |
| | | | | |
| | | | | |
| | | Shares
Held | | Value |
| | | | | |
| CONSUMER STAPLES - 1.6% |
Beverages - 1.6% | | | | | |
Hansen Natural Corporation(1) | | 1,710,712 | | $ | 74,210,687 |
| | | | | |
| ENERGY - 5.2% |
Energy Equipment & Services - 3.7% | | | | | |
Cameron International Corporation(1) | | 1,300,100 | | | 55,722,286 |
Dresser-Rand Group Inc.(1) | | 701,396 | | | 22,037,862 |
Smith International, Inc. | | 2,232,858 | | | 95,610,980 |
| | | | | |
| | | | | 173,371,128 |
Oil, Gas & Consumable Fuels - 1.5% | | | | | |
Range Resources Corporation | | 1,466,031 | | | 68,712,873 |
| | | | | |
| FINANCIALS - 5.3% | | | | | |
Capital Markets - 1.8% | | | | | |
Ares Capital Corporation | | 2,677,300 | | | 39,731,132 |
Greenhill & Co., Inc. | | 554,886 | | | 45,550,592 |
| | | | | |
| | | | | 85,281,724 |
Commercial Banks - 1.2% | | | | | |
FirstMerit Corporation | | 618,400 | | | 13,338,888 |
HDFC Bank Limited (DR)(2) | | 321,848 | | | 44,862,393 |
| | | | | |
| | | | | 58,201,281 |
Diversified Financial Services - 2.3% | | | | | |
CME Group Inc., Class A | | 334,841 | | | 105,846,589 |
| | | | | |
| HEALTHCARE - 15.7% | | | | | |
Biotechnology - 0.6% | | | | | |
Human Genome Sciences, Inc.(1) | | 519,100 | | | 15,676,820 |
Vertex Pharmaceuticals Incorporated(1) | | 297,400 | | | 12,154,738 |
| | | | | |
| | | | | 27,831,558 |
Health Care Equipment & Supplies - 2.8% | | | | | |
Edwards Lifesciences Corporation(1) | | 698,900 | | | 69,107,232 |
Intuitive Surgical, Inc.(1) | | 79,812 | | | 27,784,952 |
NuVasive, Inc.(1) | | 736,270 | | | 33,279,404 |
| | | | | |
| | | | | 130,171,588 |
Health Care Providers & Services - 1.5% | | | | | |
Community Health Systems, Inc.(1) | | 1,885,200 | | | 69,620,436 |
38
| | | | | |
| | | Shares
Held | | Value |
| | | | | |
| HEALTHCARE (CONTINUED) | | | | | |
Health Care Technology - 5.1% | | | |
athenahealth, Inc.(1)(3) | | 1,772,200 | | $ | 64,791,632 |
Cerner Corporation(1) | | 2,060,800 | | | 175,291,648 |
| | | | | |
| | | | | 240,083,280 |
Life Sciences Tools & Services - 1.5% | | | | | |
Illumina, Inc.(1) | | 1,824,796 | | | 70,984,564 |
| | | | | |
Pharmaceuticals - 4.2% | | | | | |
Allergan, Inc. | | 3,017,461 | | | 197,100,552 |
| | | | | |
| INDUSTRIALS - 12.9% | | | |
Aerospace & Defense - 3.1% | | | |
Precision Castparts Corp. | | 1,150,220 | | | 145,744,376 |
| | | | | |
Air Freight & Logistics - 1.9% | | | |
C.H. Robinson Worldwide, Inc. | | 614,702 | | | 34,331,107 |
Expeditors International of Washington, Inc. | | 1,545,227 | | | 57,049,781 |
| | | | | |
| | | | | 91,380,888 |
Construction & Engineering - 1.0% | | | |
AECOM Technology Corporation(1) | | 885,300 | | | 25,115,961 |
Fluor Corporation | | 499,319 | | | 23,223,327 |
| | | | | |
| | | | | 48,339,288 |
Electrical Equipment - 1.4% | | | |
Roper Industries, Inc. | | 1,176,054 | | | 68,022,963 |
| | | | | |
Machinery - 2.4% | | | |
Cummins Inc. | | 1,667,600 | | | 103,307,820 |
PACCAR Inc | | 250,006 | | | 10,835,260 |
| | | | | |
| | | | | 114,143,080 |
Professional Services - 1.3% | | | |
IHS Inc., Class A(1) | | 534,900 | | | 28,601,103 |
Verisk Analytics, Inc., Class A(1) | | 1,163,500 | | | 32,810,700 |
| | | | | |
| | | | | 61,411,803 |
Road & Rail - 1.3% | | | |
J.B. Hunt Transport Services, Inc. | | 1,682,226 | | | 60,358,269 |
| | | | | |
Trading Companies & Distributors - 0.5% | | | | | |
Watsco, Inc., Class A | | 410,800 | | | 23,366,304 |
| | | | | |
INFORMATION
TECHNOLOGY - 35.3% | | | |
Communications
Equipment - 1.5% | | | |
Juniper Networks, Inc.(1) | | 2,319,827 | | | 71,172,292 |
| | | | | |
| | | | | |
| | | Shares
Held | | Value |
| | | | | |
| INFORMATION TECHNOLOGY (CONTINUED) | | | | | |
Computers & Peripherals - 1.5% | | | |
NetApp, Inc.(1) | | 2,172,675 | | $ | 70,742,298 |
| | | | | |
Electronic Equipment & Instruments - 4.7% | | | | | |
Agilent Technologies, Inc.(1) | | 4,154,900 | | | 142,887,011 |
Trimble Navigation Limited(1) | | 2,663,799 | | | 76,504,307 |
| | | | | |
| | | | | 219,391,318 |
Internet Software & Services - 4.2% | | | | | |
GSI Commerce, Inc.(1) | | 1,767,800 | | | 48,915,026 |
MercadoLibre, Inc.(1) | | 1,614,100 | | | 77,815,761 |
NetEase.com, Inc. (DR)(1)(2) | | 129,200 | | | 4,582,724 |
Vistaprint N.V.(1) | | 1,188,100 | | | 68,018,725 |
| | | | | |
| | | | | 199,332,236 |
IT Services - 2.3% | | | |
Cognizant Technology Solutions Corporation, Class A(1) | | 730,700 | | | 37,251,086 |
The Western Union Company | | 4,070,947 | | | 69,043,261 |
| | | | | |
| | | | | 106,294,347 |
Semiconductors & Semiconductor Equipment - 8.8% | | | |
Analog Devices, Inc. | | 1,584,066 | | | 45,652,782 |
ARM Holdings PLC (DR)(2) | | 8,073,800 | | | 86,308,922 |
Broadcom Corporation, Class A | | 2,160,919 | | | 71,699,292 |
Cree, Inc.(1) | | 844,711 | | | 59,315,606 |
MEMC Electronic Materials, Inc.(1) | | 3,745,598 | | | 57,420,017 |
NVIDIA Corporation(1) | | 5,424,476 | | | 94,277,393 |
| | | | | |
| | | | | 414,674,012 |
Software - 12.3% | | | |
ANSYS, Inc.(1) | | 1,314,500 | | | 56,707,530 |
AsiaInfo Holdings, Inc.(1) | | 960,000 | | | 25,420,800 |
Autodesk, Inc.(1) | | 2,659,237 | | | 78,234,753 |
Blackboard Inc.(1) | | 1,321,100 | | | 55,037,026 |
Citrix Systems, Inc.(1) | | 2,417,060 | | | 114,737,838 |
Concur Technologies, Inc.(1) | | 525,900 | | | 21,567,159 |
Electronic Arts Inc.(1) | | 1,248,535 | | | 23,297,663 |
Mc Afee, Inc.(1) | | 459,728 | | | 18,448,885 |
Red Hat, Inc.(1) | | 2,071,188 | | | 60,623,673 |
salesforce.com, inc.(1) | | 686,535 | | | 51,112,531 |
SolarWinds, Inc.(1) | | 685,600 | | | 14,850,096 |
VMware, Inc., Class A(1) | | 1,102,502 | | | 58,763,357 |
| | | | | |
| | | | | 578,801,311 |
| MATERIALS - 1.9% | | | | | |
Chemicals - 1.9% | | | | | |
Agrium Inc.(2) | | 1,236,700 | | | 87,348,121 |
| | | | | |
Total common stocks
(Cost $3,419,949,319) | | | | | 4,588,011,799 |
39
| | | | | | | |
| | | Par
Amount | | Value | |
| | | | | | | |
SHORT-TERM INVESTMENTS
(CASH EQUIVALENTS) - 2.4% | | | | |
Repurchase agreement with Fixed
Income Clearing Corporation, 0.00%,
dated 3/31/10, due 4/1/10,
maturity value $113,520,000(4)
(Cost $113,520,000) | | $ | 113,520,000 | | $ | 113,520,000 | |
| | | | | | | |
| | | | | | | |
Total investments - 100.2%
(Cost $3,533,469,319) | | | | | | 4,701,531,799 | |
| | | | | | | |
Other assets less liabilities - (0.2%) | | | | | | (8,374,572 | ) |
| | | | | | | |
| | | | | | | |
Total net assets - 100.0%(5) | | | | | $ | 4,693,157,227 | |
| | | | | | | |
| (1) | Non-income producing security. |
| (2) | The Fund considers the company to be from outside of the United States. See the Fund’s Statement of Additional Information for information on how a particular country is assigned. |
| | | | |
Security | | Country | | Trading Currency |
Agrium Inc. | | Canada | | U.S. dollar |
ARM Holdings PLC (DR) | | United Kingdom | | U.S. dollar |
Ctrip.com International, Ltd. (DR) | | China | | U.S. dollar |
Gafisa S.A. (DR) | | Brazil | | U.S. dollar |
HDFC Bank Limited (DR) | | India | | U.S. dollar |
Home Inns & Hotels Management, Inc. (DR) | | China | | U.S. dollar |
NetEase.com, Inc. (DR) | | China | | U.S. dollar |
| (3) | Affiliated company as defined by the Investment Company Act of 1940, as amended. See Note (6) in Notes to Financial Statements. |
| | | | | |
Issuer | | Maturity | | Value |
U.S. Treasury Bill | | 4/22/2010 | | $ | 24,557,715 |
U.S. Treasury Bill | | 5/20/2010 | | | 91,236,749 |
| | | | | |
| | | | $ | 115,794,464 |
| | | | | |
| (5) | Percentages for the various classifications relate to total net assets. |
Company names are as reported by a data service provider and in some cases are translations; a company’s legal name may be different.
(DR) Depository Receipt, voting rights may vary.
| | | | | |
| TOP TEN HOLDINGS - March 31, 2010 (Unaudited) | |
Company Name | | Country | | Percentage
of Total
Net Assets | |
Allergan, Inc. | | United States | | 4.2 | % |
Cerner Corporation | | United States | | 3.7 | |
Kohl’s Corporation | | United States | | 3.3 | |
Precision Castparts Corp. | | United States | | 3.1 | |
Agilent Technologies, Inc. | | United States | | 3.0 | |
Citrix Systems, Inc. | | United States | | 2.4 | |
CME Group Inc. | | United States | | 2.3 | |
Cummins Inc. | | United States | | 2.2 | |
Smith International, Inc. | | United States | | 2.0 | |
NVIDIA Corporation | | United States | | 2.0 | |
| | | | | |
Total | | | | 28.2 | % |
| | | | | |
For the purpose of determining the Fund’s top ten holdings, securities of the same issuer are aggregated to determine the weight in the Fund.
The accompanying notes are an integral part of the financial statements.
40
ARTISAN MID CAP VALUE FUND
Schedule of Investments – March 31, 2010 (Unaudited)
| | | | | |
| | | Shares
Held | | Value |
| | | | | |
| COMMON STOCKS - 94.6% | | | | | |
| | | | | |
| CONSUMER DISCRETIONARY - 10.5% | | | | | |
Auto Components - 1.4% | | | | | |
BorgWarner Inc.(1) | | 2,120,100 | | $ | 80,945,418 |
| | | | | |
Diversified Consumer Services - 1.9% | | | | | |
H&R Block, Inc. | | 6,043,300 | | | 107,570,740 |
| | | | | |
Hotels, Restaurants & Leisure - 1.8% | | | | | |
Burger King Holdings, Inc. | | 4,843,300 | | | 102,968,558 |
| | | | | |
Household Durables - 1.5% | | | |
Mohawk Industries, Inc.(1) | | 1,598,000 | | | 86,899,240 |
| | | | | |
Leisure Equipment & Products - 1.5% | | | | | |
Mattel, Inc. | | 3,713,200 | | | 84,438,168 |
| | | | | |
Media - 2.0% | | | |
Omnicom Group Inc. | | 3,046,900 | | | 118,250,189 |
| | | | | |
Specialty Retail - 0.4% | | | |
AutoZone, Inc.(1) | | 138,500 | | | 23,972,965 |
| | | | | |
| CONSUMER STAPLES - 7.5% | | | | | |
Food & Staples Retailing - 3.8% | | | |
The Kroger Co. | | 5,689,000 | | | 123,223,740 |
Sysco Corporation | | 3,323,900 | | | 98,055,050 |
| | | | | |
| | | | | 221,278,790 |
Food Products - 3.7% | | | |
Campbell Soup Company | | 3,281,300 | | | 115,993,955 |
H.J. Heinz Company | | 2,088,100 | | | 95,238,241 |
| | | | | |
| | | | | 211,232,196 |
| ENERGY - 8.8% | | | |
Energy Equipment & Services - 2.4% | | | | | |
Nabors Industries Ltd.(1) | | 6,522,500 | | | 128,036,675 |
Pride International, Inc.(1) | | 415,500 | | | 12,510,705 |
| | | | | |
| | | | | 140,547,380 |
Oil, Gas & Consumable Fuels - 6.4% | | | | | |
Chesapeake Energy Corporation | | 1,825,000 | | | 43,143,000 |
| | | | | |
| | | Shares
Held | | Value |
| | | | | |
| ENERGY (CONTINUED) | | | |
Oil, Gas & Consumable Fuels (Continued) | | | | | |
Cimarex Energy Co. | | 3,089,390 | | $ | 183,447,978 |
EOG Resources, Inc. | | 628,600 | | | 58,422,084 |
Southwestern Energy Company(1) | | 2,078,100 | | | 84,620,232 |
| | | | | |
| | | | | 369,633,294 |
| FINANCIALS - 17.2% | | | | | |
Consumer Finance - 0.2% | | | |
The Student Loan Corporation | | 258,100 | | | 9,170,293 |
| | | | | |
Insurance - 15.5% | | | |
Alleghany Corporation(1)(2) | | 516,402 | | | 150,169,562 |
Allied World Assurance Company Holdings, Ltd | | 1,970,900 | | | 88,394,865 |
The Allstate Corporation | | 3,824,700 | | | 123,576,057 |
Arch Capital Group Ltd.(1)(2) | | 1,592,873 | | | 121,456,566 |
Brown & Brown, Inc. | | 4,293,400 | | | 76,937,728 |
Fidelity National Financial, Inc. | | 10,079,581 | | | 149,379,391 |
The Progressive Corporation | | 5,369,400 | | | 102,501,846 |
W. R. Berkley Corporation | | 3,206,700 | | | 83,662,803 |
| | | | | |
| | | | | 896,078,818 |
Real Estate Investment Trusts (REITS) - 1.5% | | | | | |
Annaly Capital Management, Inc. | | 4,879,400 | | | 83,828,092 |
| | | | | |
| HEALTHCARE - 3.7% | | | | | |
Health Care Equipment & Supplies - 1.8% | | | | | |
Stryker Corporation | | 1,843,100 | | | 105,462,182 |
| | | | | |
Health Care Providers & Services - 1.9% | | | | | |
CIGNA Corporation | | 2,940,450 | | | 107,561,661 |
| | | | | |
| INDUSTRIALS - 20.0% | | | | | |
Aerospace & Defense - 3.7% | | | |
L-3 Communications Holdings, Inc. | | 1,416,900 | | | 129,830,547 |
Rockwell Collins, Inc. | | 1,369,853 | | | 85,739,099 |
| | | | | |
| | | | | 215,569,646 |
Commercial Services & Supplies - 2.0% | | | | | |
Cintas Corporation | | 4,112,300 | | | 115,514,507 |
41
| | | | | |
| | | Shares
Held | | Value |
| | | | | |
| INDUSTRIALS (CONTINUED) | | | | | |
Construction & Engineering - 1.9% | | | | | |
Jacobs Engineering Group Inc.(1) | | 2,429,000 | | $ | 109,766,510 |
| | | | | |
Electrical Equipment - 3.7% | | | |
Acuity Brands, Inc.(2) | | 2,169,215 | | | 91,562,565 |
Hubbell Inc., Class B | | 2,471,600 | | | 124,642,788 |
| | | | | |
| | | | | 216,205,353 |
Marine - 0.3% | | | | | |
Alexander & Baldwin, Inc. | | 501,900 | | | 16,587,795 |
| | | | | |
Professional Services - 6.3% | | | |
The Dun & Bradstreet Corporation | | 1,225,200 | | | 91,179,384 |
Equifax Inc. | | 3,835,300 | | | 137,303,740 |
Manpower Inc. | | 1,246,500 | | | 71,200,080 |
Robert Half International Inc. | | 1,475,800 | | | 44,908,594 |
Towers Watson & Co., Class A | | 380,000 | | | 18,050,000 |
| | | | | |
| | | | | 362,641,798 |
Road & Rail - 1.4% | | | | | |
Ryder System, Inc.(2) | | 2,141,400 | | | 83,000,664 |
| | | | | |
Trading Companies & Distributors - 0.7% | | | | | |
GATX Corporation | | 1,312,700 | | | 37,608,855 |
| | | | | |
| INFORMATION TECHNOLOGY - 19.1% | | | | | |
Electronic Equipment & Instruments - 6.7% | | | | | |
Arrow Electronics, Inc.(1) | | 3,771,400 | | | 113,632,282 |
Avnet, Inc.(1) | | 4,357,310 | | | 130,719,300 |
Ingram Micro Inc., Class A(1)(2) | | 8,139,400 | | | 142,846,470 |
| | | | | |
| | | | | 387,198,052 |
IT Services - 7.8% | | | | | |
Hewitt Associates, Inc.(1) | | 2,983,000 | | | 118,663,740 |
SAIC, Inc.(1) | | 5,547,800 | | | 98,196,060 |
Total System Services, Inc. | | 7,414,900 | | | 116,117,334 |
The Western Union Company | | 6,988,800 | | | 118,530,048 |
| | | | | |
| | | | | 451,507,182 |
Semiconductors & Semiconductor Equipment - 2.9% | | | |
Analog Devices, Inc. | | 2,546,200 | | | 73,381,484 |
National Semiconductor Corporation | | 6,605,200 | | | 95,445,140 |
| | | | | |
| | | | | 168,826,624 |
Software - 1.7% | | | | | |
SYNOPSYS, INC.(1) | | 4,368,000 | | | 97,712,160 |
| | | | | |
| | | | | | |
| | | Shares
Held | | Value |
| | | | | | |
| UTILITIES - 7.8% | | | | | | |
Electrical Utilities - 1.3% | | | | | | |
PPL Corporation | | | 2,684,700 | | $ | 74,393,037 |
| | | | | | |
Multi-Utilities - 4.7% | | | | | | |
OGE Energy Corp. | | | 2,461,000 | | | 95,831,340 |
SCANA Corporation | | | 2,482,300 | | | 93,309,657 |
Xcel Energy Inc. | | | 4,016,400 | | | 85,147,680 |
| | | | | | |
| | | | | | 274,288,677 |
Water Utilities - 1.8% | | | | | | |
American Water Works Company, Inc. | | | 4,719,600 | | | 102,698,496 |
| | | | | | |
Total common stocks
(Cost $4,815,931,318) | | | | | | 5,463,357,340 |
| | |
| | | Par
Amount | | |
| SHORT-TERM INVESTMENTS (CASH EQUIVALENTS) - 4.8% | | | |
Repurchase agreement with Fixed Income Clearing Corporation, 0.00%, dated 3/31/10, due 4/1/10, maturity value $279,329,000(3)
(Cost $279,329,000) | | $ | 279,329,000 | | | 279,329,000 |
| | | | | | |
| | | | | | |
Total investments - 99. 4%
(Cost $5,095,260,318) | | | | | | 5,742,686,340 |
| | | | | | |
Other assets less liabilities - 0.6% | | | | | | 35,574,897 |
| | | | | | |
| | | | | | |
Total net assets - 100.0%(4) | | | | | $ | 5,778,261,237 |
| | | | | | |
| (1) | Non-income producing security. |
| (2) | Affiliated company as defined by the Investment Company Act of 1940, as amended. See Note (6) in Notes to Financial Statements. |
| | | | | | | | |
Issuer | | Rate | | | Maturity | | Value |
U.S. Treasury Note | | 3.375 | % | | 6/30/2013 | | $ | 188,030,128 |
U.S. Treasury Note | | 1.375 | | | 9/15/2012 | | | 96,886,613 |
| | | | | | | | |
| | | | | | | $ | 284,916,741 |
| | | | | | | | |
| (4) | Percentages for the various classifications relate to total net assets. |
Company names are as reported by a data service provider and in some cases are translations; a company’s legal name may be different.
42
| | | | | |
| TOP TEN HOLDINGS - March 31, 2010 (Unaudited) | |
Company Name | | Country | | Percentage
of Total
Net Assets | |
Cimarex Energy Co. | | United States | | 3.2 | % |
Alleghany Corporation | | United States | | 2.6 | |
Fidelity National Financial, Inc. | | United States | | 2.6 | |
Ingram Micro Inc. | | United States | | 2.5 | |
Equifax Inc. | | United States | | 2.4 | |
Avnet, Inc. | | United States | | 2.3 | |
L-3 Communications Holdings, Inc. | | United States | | 2.2 | |
Nabors Industries Ltd. | | United States | | 2.2 | |
Hubbell Inc. | | United States | | 2.2 | |
The Allstate Corporation | | United States | | 2.1 | |
| | | | | |
Total | | | | 24.3 | % |
| | | | | |
For the purpose of determining the Fund’s top ten holdings, securities of the same issuer are aggregated to determine the weight in the Fund.
The accompanying notes are an integral part of the financial statements.
43
ARTISAN OPPORTUNISTIC GROWTH FUND
Schedule of Investments – March 31, 2010 (Unaudited)
| | | | | |
| | | Shares
Held | | Value |
| | | | | |
| COMMON STOCKS - 93.9% | | | |
| | | | | |
| CONSUMER DISCRETIONARY - 15.2% | | | |
Auto Components - 2.3% | | | |
Johnson Controls, Inc. | | 43,994 | | $ | 1,451,362 |
| | | | | |
Hotels, Restaurants & Leisure - 5.5% | | | |
Ctrip.com International, Ltd. (DR)(1)(2) | | 39,500 | | | 1,548,400 |
Starbucks Corporation(1) | | 30,452 | | | 739,070 |
Wynn Macau Limited(1)(2) | | 847,900 | | | 1,220,919 |
| | | | | |
| | | | | 3,508,389 |
Household Durables - 1.6% | | | |
Gafisa S.A.(2) | | 150,600 | | | 1,040,782 |
| | | | | |
Multiline Retail - 2.9% | | | |
Kohl’s Corporation(1) | | 34,200 | | | 1,873,476 |
| | | | | |
Textiles, Apparel & Luxury Goods - 2.9% | | | | | |
Compagnie Financiere Richemont SA (A Units)(2) | | 35,400 | | | 1,370,810 |
Polo Ralph Lauren Corporation, Class A | | 6,000 | | | 510,240 |
| | | | | |
| | | | | 1,881,050 |
| ENERGY - 7.0% | | | | | |
Energy Equipment & Services - 3.2% | | | |
Schlumberger Limited | | 32,225 | | | 2,044,998 |
| | | | | |
Oil, Gas & Consumable Fuels - 3.8% | | | |
Petroleo Brasileiro S.A. (DR)(2) | | 26,225 | | | 1,166,750 |
Range Resources Corporation | | 27,000 | | | 1,265,490 |
| | | | | |
| | | | | 2,432,240 |
| FINANCIALS - 6.1% | | | | | |
Commercial Banks - 1.8% | | | |
HDFC Bank Limited (DR)(2) | | 8,125 | | | 1,132,544 |
| | | | | |
Diversified Financial Services - 4.3% | | | |
CME Group Inc., Class A | | 5,180 | | | 1,637,450 |
JPMorgan Chase & Co. | | 25,175 | | | 1,126,581 |
| | | | | |
| | | | | 2,764,031 |
| HEALTHCARE - 11.6% | | | | | |
Health Care Equipment & Supplies - 1.4% | | | | | |
Edwards Lifesciences Corporation(1) | | 8,800 | | | 870,144 |
| | | | | |
Health Care Providers & Services - 2.7% | | | | | |
Community Health Systems, Inc.(1) | | 47,800 | | | 1,765,254 |
| | | | | |
| | | Shares
Held | | Value |
| | | | | |
| HEALTHCARE (CONTINUED) | | | | | |
Health Care Technology - 2.8% | | | |
Cerner Corporation(1) | | 21,179 | | $ | 1,801,486 |
| | | | | |
Pharmaceuticals - 4.7% | | | |
Allergan, Inc. | | 45,775 | | | 2,990,023 |
| | | | | |
| INDUSTRIALS - 10.2% | | | |
Aerospace & Defense - 2.1% | | | |
Precision Castparts Corp. | | 10,400 | | | 1,317,784 |
| | | | | |
Electrical Equipment - 2.0% | | | |
ABB Limited (DR)(1)(2) | | 59,100 | | | 1,290,744 |
| | | | | |
Machinery - 4.4% | | | |
Cummins Inc. | | 31,000 | | | 1,920,450 |
Weg S.A.(2) | | 84,400 | | | 901,735 |
| | | | | |
| | | | | 2,822,185 |
Road & Rail - 1.7% | | | |
Localiza Rent a Car SA(2) | | 102,000 | | | 1,078,303 |
| | | | | |
| INFORMATION TECHNOLOGY - 41.7% | | | |
Computers & Peripherals - 10.0% | | | |
Apple Inc.(1) | | 14,725 | | | 3,459,344 |
EMC Corporation(1) | | 163,900 | | | 2,956,756 |
| | | | | |
| | | | | 6,416,100 |
Electronic Equipment & Instruments - 6.0% | | | | | |
Agilent Technologies, Inc.(1) | | 93,800 | | | 3,225,782 |
Corning Incorporated | | 31,000 | | | 626,510 |
| | | | | |
| | | | | 3,852,292 |
Internet Software & Services - 8.4% | | | |
eBay Inc.(1) | | 78,400 | | | 2,112,880 |
Google Inc., Class A(1) | | 5,755 | | | 3,263,143 |
| | | | | |
| | | | | 5,376,023 |
IT Services - 3.8% | | | |
Visa Inc., Class A | | 27,100 | | | 2,466,913 |
| | | | | |
Semiconductors & Semiconductor Equipment - 9.4% | | | | | |
ARM Holdings PLC(2) | | 565,300 | | | 2,044,238 |
Broadcom Corporation, Class A | | 34,225 | | | 1,135,585 |
MediaTek Incorporation(2) | | 39,700 | | | 688,793 |
MEMC Electronic Materials, Inc.(1) | | 61,040 | | | 935,743 |
NVIDIA Corporation(1) | | 72,420 | | | 1,258,660 |
| | | | | |
| | | | | 6,063,019 |
44
| | | | | | | |
| | | Shares
Held | | Value | |
| | | | | | | |
| INFORMATION TECHNOLOGY (CONTINUED) | | | | | | | |
Software - 4.1% | | | | |
Citrix Systems, Inc.(1) | | | 56,000 | | $ | 2,658,320 | |
| | | | | | | |
| MATERIALS - 2.1% | | | | | | | |
Chemicals - 2.1% | | | | | | | |
The Mosaic Company | | | 22,265 | | | 1,353,044 | |
| | | | | | | |
Total common stocks
(Cost $48,577,570) | | | | | | 60,250,506 | |
| | | Par
Amount | | | |
SHORT-TERM INVESTMENTS
(CASH EQUIVALENTS) - 6.1% | | | | |
Repurchase agreement with Fixed Income Clearing Corporation, 0.00%, dated 3/31/10, due 4/1/10, maturity value
$3,906,000(4)
(Cost $3,906,000) | | $ | 3,906,000 | | | 3,906,000 | |
| | | | | | | |
| | | | | | | |
Total investments - 100.0%
(Cost $52,483,570) | | | | | | 64,156,506 | |
| | | | | | | |
Other assets less liabilities - 0.0%(3) | | | | | | (21,067 | ) |
| | | | | | | |
| | | | | | | |
Total net assets - 100.0%(5) | | | | | $ | 64,135,439 | |
| | | | | | | |
| (1) | Non-income producing security. |
| (2) | The Fund considers the company to be from outside of the United States. See the Fund’s Statement of Additional Information for information on how a particular country is assigned. |
| | | | |
Security | | Country | | Trading Currency |
ABB Limited (DR) | | Switzerland | | U.S. dollar |
ARM Holdings PLC | | United Kingdom | | British pound |
Compagnie Financiere Richemont SA (A Units) | | Switzerland | | Swiss franc |
Ctrip.com International, Ltd. (DR) | | China | | U.S. dollar |
Gafisa S.A. | | Brazil | | Brazilian real |
HDFC Bank Limited (DR) | | India | | U.S. dollar |
Localiza Rent a Car SA | | Brazil | | Brazilian real |
MediaTek Incorporation | | Taiwan | | Taiwan dollar |
Petroleo Brasileiro S.A. (DR) | | Brazil | | U.S. dollar |
Weg S.A. | | Brazil | | Brazilian real |
Wynn Macau Limited | | China | | Hong Kong dollar |
| (3) | Represents less than 0.1% of total net assets. |
| | | | | | | | |
Issuer | | Rate | | | Maturity | | Value |
U.S. Treasury Note | | 4.625 | % | | 11/15/2016 | | $ | 3,989,520 |
| (5) | Percentages for the various classifications relate to total net assets. |
Company names are as reported by a data service provider and in some cases are translations; a company’s legal name may be different.
(DR) Depository Receipt, voting rights may vary.
| | | | | | |
| CURRENCY EXPOSURE - March 31, 2010 (Unaudited) | |
| | | Value | | Percentage
of Total
Investments | |
Brazilian real | | $ | 3,020,820 | | 4.7 | % |
British pound | | | 2,044,238 | | 3.2 | |
Hong Kong dollar | | | 1,220,919 | | 1.9 | |
Swiss franc | | | 1,370,810 | | 2.1 | |
Taiwan dollar | | | 688,793 | | 1.1 | |
U.S. dollar | | | 55,810,926 | | 87.0 | |
| | | | | | |
Total investments | | $ | 64,156,506 | | 100.0 | % |
| | | | | | |
| | | | | |
| TOP TEN HOLDINGS - March 31, 2010 (Unaudited) | |
Company Name | | Country | | Percentage
of Total
Net Assets | |
Apple Inc. | | United States | | 5.4 | % |
Google Inc. | | United States | | 5.1 | |
Agilent Technologies, Inc. | | United States | | 5.0 | |
Allergan, Inc. | | United States | | 4.7 | |
EMC Corporation | | United States | | 4.6 | |
Citrix Systems, Inc. | | United States | | 4.1 | |
Visa Inc. | | United States | | 3.8 | |
eBay Inc. | | United States | | 3.3 | |
Schlumberger Limited | | United States | | 3.2 | |
ARM Holdings Plc | | United Kingdom | | 3.2 | |
| | | | | |
Total | | | | 42.4 | % |
| | | | | |
For the purpose of determining the Fund’s top ten holdings, securities of the same issuer are aggregated to determine the weight in the Fund.
The accompanying notes are an integral part of the financial statements.
45
ARTISAN OPPORTUNISTIC VALUE FUND
Schedule of Investments – March 31, 2010 (Unaudited)
| | | | | |
| | | Shares
Held | | Value |
| | | | | |
| COMMON STOCKS - 95.0% | | | | | |
| | | | | |
| CONSUMER DISCRETIONARY - 4.9% | | | |
Hotels, Restaurants & Leisure - 2.0% | | | | | |
McDonald’s Corporation | | 74,300 | | $ | 4,957,296 |
| | | | | |
Media - 2.9% | | | | | |
Comcast Corporation, Class A(1) | | 401,300 | | | 7,211,361 |
| | | | | |
| CONSUMER STAPLES - 11.3% | | | | | |
Food & Staples Retailing - 6.4% | | | | | |
The Kroger Co. | | 275,300 | | | 5,962,998 |
Wal-Mart Stores, Inc. | | 182,300 | | | 10,135,880 |
| | | | | |
| | | | | 16,098,878 |
Food Products - 3.9% | | | | | |
Kraft Foods Inc., Class A | | 244,300 | | | 7,387,632 |
Nestle SA(2) | | 49,800 | | | 2,550,455 |
| | | | | |
| | | | | 9,938,087 |
Tobacco - 1.0% | | | | | |
Philip Morris International Inc. | | 48,000 | | | 2,503,680 |
| | | | | |
| ENERGY - 9.6% | | | | | |
Energy Equipment & Services - 2.2% | | | | | |
Nabors Industries Ltd.(3) | | 286,800 | | | 5,629,884 |
| | | | | |
Oil, Gas & Consumable Fuels - 7.4% | | | | | |
Apache Corporation | | 60,000 | | | 6,090,000 |
Chesapeake Energy Corporation | | 224,600 | | | 5,309,544 |
Exxon Mobil Corporation | | 111,000 | | | 7,434,780 |
| | | | | |
| | | | | 18,834,324 |
| FINANCIALS - 21.2% | | | | | |
Insurance - 19.3% | | | | | |
Alleghany Corporation(3) | | 27,438 | | | 7,978,970 |
The Allstate Corporation | | 246,050 | | | 7,949,876 |
Arch Capital Group Ltd.(3)(4) | | 114,500 | | | 8,730,625 |
Berkshire Hathaway Inc., Class B(3) | | 77,400 | | | 6,290,298 |
The Chubb Corporation | | 99,000 | | | 5,133,150 |
Fidelity National Financial, Inc. | | 498,000 | | | 7,380,360 |
The Progressive Corporation | | 285,800 | | | 5,455,922 |
| | | | | |
| | | | | 48,919,201 |
Real Estate Investment Trusts (REITS) - 1.9% | | | | | |
Annaly Capital Management, Inc. | | 282,000 | | | 4,844,760 |
| | | | | |
| | | Shares
Held | | Value |
| | | | | |
| HEALTHCARE - 10.5% | | | | | |
Health Care Equipment & Supplies - 2.6% | | | | | |
Baxter International Inc. | | 114,000 | | $ | 6,634,800 |
| | | | | |
Health Care Providers & Services - 1.9% | | | | | |
CIGNA Corporation | | 133,500 | | | 4,883,430 |
| | | | | |
Pharmaceuticals - 6.0% | | | | | |
Johnson & Johnson | | 149,300 | | | 9,734,360 |
Pfizer Inc. | | 315,000 | | | 5,402,250 |
| | | | | |
| | | | | 15,136,610 |
| INDUSTRIALS - 6.9% | | | | | |
Aerospace & Defense - 6.9% | | | | | |
Lockheed Martin Corporation | | 118,500 | | | 9,861,570 |
Raytheon Company | | 131,400 | | | 7,505,568 |
| | | | | |
| | | | | 17,367,138 |
| INFORMATION TECHNOLOGY - 30.6% | | | |
Computers & Peripherals - 7.9% | | | |
Hewlett-Packard Company | | 189,000 | | | 10,045,350 |
International Business Machines Corporation | | 77,300 | | | 9,913,725 |
| | | | | |
| | | | | 19,959,075 |
Electronic Equipment & Instruments - 5.6% | | | | | |
Corning Incorporated | | 314,000 | | | 6,345,940 |
Ingram Micro Inc., Class A(3)(4) | | 441,800 | | | 7,753,590 |
| | | | | |
| | | | | 14,099,530 |
IT Services - 8.6% | | | | | |
Accenture plc, Class A | | 228,800 | | | 9,598,160 |
Total System Services, Inc. | | 362,300 | | | 5,673,618 |
The Western Union Company | | 386,300 | | | 6,551,648 |
| | | | | |
| | | | | 21,823,426 |
Semiconductors & Semiconductor Equipment - 4.6% | | | |
Applied Materials, Inc. | | 393,800 | | | 5,308,424 |
Texas Instruments Incorporated | | 261,800 | | | 6,406,246 |
| | | | | |
| | | | | 11,714,670 |
Software - 3.9% | | | | | |
Microsoft Corporation | | 339,800 | | | 9,945,946 |
| | | | | |
Total common stocks
(Cost $213,590,822) | | | 240,502,096 |
46
| | | | | | |
| | | Par
Amount | | Value |
| | | | | | |
SHORT-TERM INVESTMENTS
(CASH EQUIVALENTS) - 3.8% | | | |
Repurchase agreement with Fixed Income Clearing Corporation, 0.00%, dated 3/31/10, due 4/1/10, maturity value $9,677,000(5)
(Cost $9,677,000) | | $ | 9,677,000 | | $ | 9,677,000 |
| | | | | | |
| | | | | | |
Total investments - 98.8%
(Cost $223,267,822) | | | 250,179,096 |
| | | | | | |
Other assets less liabilities - 1.2% | | | 3,029,184 |
| | | | | | |
| | | | | | |
Total net assets - 100.0%(6) | | $ | 253,208,280 |
| | | | | | |
| (2) | The Fund considers the company to be from Switzerland. See the Fund’s Statement of Additional Information for information on how a particular country is assigned. The security trades in U.S. dollars. |
| (3) | Non-income producing security. |
| (4) | Affiliated company as defined by the Investment Company Act of 1940, as amended. See Note (6) in Notes to Financial Statements. |
| | | | | | | | |
Issuer | | Rate | | | Maturity | | Value |
U.S. Treasury Note | | 4.625 | % | | 11/15/2016 | | $ | 9,874,062 |
| (6) | Percentages for the various classifications relate to total net assets. |
Company names are as reported by a data service provider and in some cases are translations; a company’s legal name may be different.
| | | | | |
| TOP TEN HOLDINGS - March 31, 2010 (Unaudited) | |
Company Name | | Country | | Percentage
of Total
Net Assets | |
Wal-Mart Stores, Inc. | | United States | | 4.0 | % |
Hewlett-Packard Company | | United States | | 4.0 | |
Microsoft Corporation | | United States | | 3.9 | |
International Business Machines Corporation | | United States | | 3.9 | |
Lockheed Martin Corporation | | United States | | 3.9 | |
Johnson & Johnson | | United States | | 3.8 | |
Accenture plc | | United States | | 3.8 | |
Arch Capital Group Ltd. | | United States | | 3.4 | |
Alleghany Corporation | | United States | | 3.2 | |
The Allstate Corporation | | United States | | 3.1 | |
| | | | | |
Total | | | | 37.0 | % |
| | | | | |
For the purpose of determining the Fund’s top ten holdings, securities of the same issuer are aggregated to determine the weight in the Fund.
The accompanying notes are an integral part of the financial statements.
47
ARTISAN SMALL CAP FUND
Schedule of Investments – March 31, 2010 (Unaudited)
| | | | | |
| | | Shares
Held | | Value |
| | | | | |
| COMMON STOCKS - 96.4% | | | | | |
| | | | | |
| CONSUMER DISCRETIONARY - 12.5% | | | |
Distributors - 3.0% | | | | | |
LKQ Corporation(1) | | 583,700 | | $ | 11,849,110 |
| | | | | |
Hotels, Restaurants & Leisure - 1.7% | | | |
Home Inns & Hotels Management, Inc. (DR)(1)(2) | | 46,500 | | | 1,522,410 |
WMS Industries(1) | | 119,100 | | | 4,995,054 |
| | | | | |
| | | | | 6,517,464 |
Specialty Retail - 6.0% | | | | | |
The Gymboree Corporation(1) | | 124,700 | | | 6,438,261 |
Hibbett Sports, Inc.(1) | | 303,150 | | | 7,754,577 |
Monro Muffler Brake, Inc. | | 142,800 | | | 5,106,528 |
PETsMART, Inc. | | 121,900 | | | 3,895,924 |
| | | | | |
| | | | | 23,195,290 |
Textiles, Apparel & Luxury Goods - 1.8% | | | | | |
Iconix Brand Group, Inc.(1) | | 457,300 | | | 7,024,128 |
| | | | | |
| CONSUMER STAPLES - 1.6% | | | | | |
Food Products - 1.6% | | | | | |
Flowers Foods, Inc. | | 155,000 | | | 3,834,700 |
TreeHouse Foods, Inc.(1) | | 53,700 | | | 2,355,819 |
| | | | | |
| | | | | 6,190,519 |
| ENERGY - 5.6% | | | | | |
Energy Equipment & Services - 3.1% | | | |
Core Laboratories N.V. | | 52,600 | | | 6,880,080 |
Dril-Quip, Inc.(1) | | 82,200 | | | 5,001,048 |
| | | | | |
| | | | | 11,881,128 |
Oil, Gas & Consumable Fuels - 2.5% | | | |
Carrizo Oil & Gas, Inc.(1) | | 221,600 | | | 5,085,720 |
Comstock Resources, Inc.(1) | | 149,800 | | | 4,763,640 |
| | | | | |
| | | | | 9,849,360 |
| FINANCIALS - 8.3% | | | | | |
Capital Markets - 4.5% | | | | | |
Ares Capital Corporation | | 898,861 | | | 13,339,097 |
Artio Global Investors Inc., Class A | | 55,800 | | | 1,380,492 |
Greenhill & Co., Inc. | | 33,100 | | | 2,717,179 |
| | | | | |
| | | | | 17,436,768 |
Commercial Banks - 2.0% | | | | | |
FirstMerit Corporation | | 51,000 | | | 1,100,070 |
MB Financial, Inc. | | 288,300 | | | 6,495,399 |
| | | | | |
| | | | | 7,595,469 |
| | | | | |
| | | Shares
Held | | Value |
| | | | | |
| FINANCIALS (CONTINUED) | | | | | |
Insurance - 1.8% | | | | | |
Reinsurance Group of America, Incorporated | | 135,800 | | $ | 7,132,216 |
| | | | | |
| HEALTHCARE - 16.3% | | | | | |
Biotechnology - 1.9% | | | | | |
AMAG Pharamaceuticals, Inc.(1) | | 110,300 | | | 3,850,573 |
Cepheid(1) | | 205,700 | | | 3,595,636 |
| | | | | |
| | | | | 7,446,209 |
Health Care Equipment & Supplies - 1.8% | | | | | |
Masimo Corporation | | 146,100 | | | 3,878,955 |
NuVasive, Inc.(1) | | 66,300 | | | 2,996,760 |
| | | | | |
| | | | | 6,875,715 |
Health Care Providers & Services - 7.4% | | | | | |
Catalyst Health Solutions, Inc.(1) | | 114,900 | | | 4,754,562 |
Clarient, Inc.(1) | | 955,300 | | | 2,502,886 |
Genoptix, Inc.(1) | | 177,200 | | | 6,288,828 |
Health Management Associates, Inc.(1) | | 265,000 | | | 2,279,000 |
HMS Holdings Corp.(1) | | 73,400 | | | 3,742,666 |
PSS World Medical, Inc.(1) | | 392,800 | | | 9,234,728 |
| | | | | |
| | | | | 28,802,670 |
Health Care Technology - 4.2% | | | | | |
athenahealth, Inc.(1)(3) | | 212,300 | | | 7,761,688 |
Phase Forward Incorporated(1) | | 593,800 | | | 7,760,966 |
Quality Systems, Inc. | | 15,800 | | | 970,752 |
| | | | | |
| | | | | 16,493,406 |
Life Sciences Tools & Services - 1.0% | | | | | |
ICON PLC (DR)(1)(2) | | 147,200 | | | 3,886,080 |
| | | | | |
| INDUSTRIALS - 17.4% | | | | | |
Aerospace & Defense - 3.2% | | | | | |
AAR CORP.(1) | | 258,900 | | | 6,425,898 |
Hexcel Corporation(1) | | 422,900 | | | 6,106,676 |
| | | | | |
| | | | | 12,532,574 |
Commercial Services & Supplies - 5.1% | | | | | |
Clean Harbors, Inc.(1) | | 77,400 | | | 4,300,344 |
The GEO Group, Inc.(1) | | 255,600 | | | 5,065,992 |
Waste Connections, Inc.(1) | | 303,325 | | | 10,300,917 |
| | | | | |
| | | | | 19,667,253 |
48
| | | | | |
| | | Shares
Held | | Value |
| | | | | |
| INDUSTRIALS (CONTINUED) | | | | | |
Electrical Equipment - 0.9% | | | | | |
Regal-Beloit Corporation | | 58,500 | | $ | 3,475,485 |
| | | | | |
Machinery - 3.7% | | | | | |
IDEX Corporation | | 164,300 | | | 5,438,330 |
The Middleby Corporation(1) | | 61,200 | | | 3,524,508 |
Robbins & Myers, Inc. | | 221,000 | | | 5,264,220 |
| | | | | |
| | | | | 14,227,058 |
Professional Services - 1.2% | | | | | |
FTI Consulting, Inc.(1) | | 115,100 | | | 4,525,732 |
| | | | | |
Road & Rail - 1.7% | | | | | |
Old Dominion Freight Line, Inc.(1) | | 199,100 | | | 6,647,949 |
| | | | | |
Transportation Infrastructure - 1.6% | | | | | |
Aegean Marine Petroleum Network Inc.(2) | | 214,300 | | | 6,081,834 |
| | | | | |
| INFORMATION TECHNOLOGY - 32.1% | | | |
Communications Equipment - 1.1% | | | |
Riverbed Technology, Inc.(1) | | 145,100 | | | 4,120,840 |
| | | | | |
Computers & Peripherals - 1.1% | | | |
STEC, Inc.(1) | | 99,100 | | | 1,187,218 |
Synaptics Incorporated(1) | | 110,400 | | | 3,048,144 |
| | | | | |
| | | | | 4,235,362 |
Electronic Equipment & Instruments - 1.9% | | | | | |
Brightpoint, Inc.(1) | | 973,900 | | | 7,333,467 |
| | | | | |
Internet Software & Services - 3.5% | | | | | |
GSI Commerce, Inc.(1) | | 410,200 | | | 11,350,234 |
Vistaprint N.V.(1) | | 39,000 | | | 2,232,750 |
| | | | | |
| | | | | 13,582,984 |
IT Services - 3.5% | | | | | |
Euronet Worldwide, Inc.(1) | | 468,980 | | | 8,643,302 |
ManTech International Corporation, Class A(1) | | 99,100 | | | 4,839,053 |
| | | | | |
| | | | | 13,482,355 |
Semiconductors & Semiconductor Equipment - 5.7% | | | |
Atheros Communications, Inc.(1) | | 252,600 | | | 9,778,146 |
Microsemi Corporation(1) | | 334,200 | | | 5,795,028 |
Nanometrics Incorporated(1) | | 187,000 | | | 1,772,760 |
Tessera Technologies, Inc.(1) | | 192,400 | | | 3,901,872 |
Varian Semiconductor Equipment Associates, Inc.(1) | | 21,200 | | | 702,144 |
| | | | | |
| | | | | 21,949,950 |
| | | | | | |
| | | Shares
Held | | Value |
| | | | | | |
| INFORMATION TECHNOLOGY (CONTINUED) | | | | | | |
Software - 15.3% | | | | | | |
ANSYS, Inc.(1) | | | 154,400 | | $ | 6,660,816 |
AsiaInfo Holdings, Inc.(1) | | | 120,500 | | | 3,190,840 |
Blackboard Inc.(1) | | | 105,300 | | | 4,386,798 |
CommVault Systems, Inc.(1) | | | 429,600 | | | 9,171,960 |
Concur Technologies, Inc.(1) | | | 137,000 | | | 5,618,370 |
Informatica Corporation(1) | | | 311,900 | | | 8,377,634 |
Progress Software Corporation(1) | | | 199,100 | | | 6,257,713 |
Quest Software, Inc.(1) | | | 197,000 | | | 3,504,630 |
Rovi Corporation(1) | | | 205,700 | | | 7,637,641 |
SolarWinds, Inc.(1) | | | 215,500 | | | 4,667,730 |
| | | | | | |
| | | | | | 59,474,132 |
| MATERIALS - 1.0% | | | | | | |
Chemicals - 1.0% | | | | | | |
Albemarle Corporation | | | 93,100 | | | 3,968,853 |
| | | | | | |
| UTILITIES - 1.6% | | | | | | |
Electrical Utilities - 1.6% | | | | | | |
ITC Holdings Corp. | | | 112,400 | | | 6,182,000 |
| | | | | | |
Total common stocks
(Cost $263,906,376) | | | | | | 373,663,360 |
| | |
| | | Par
Amount | | |
SHORT-TERM INVESTMENTS
(CASH EQUIVALENTS) - 3.3% | | | | | | |
Repurchase agreement with Fixed
Income Clearing Corporation, 0.00%,
dated 3/31/10, due 4/1/10,
maturity value $12,718,000(4)
(Cost $12,718,000) | | $ | 12,718,000 | | | 12,718,000 |
| | | | | | |
| | | | | | |
Total investments - 99.7%
(Cost $276,624,376) | | | | | | 386,381,360 |
| | | | | | |
Other assets less liabilities - 0.3% | | | | | | 1,236,308 |
| | | | | | |
| | | | | | |
Total net assets - 100.0%(5) | | | | | $ | 387,617,668 |
| | | | | | |
| (1) | Non-income producing security. |
| (2) | The Fund considers the company to be from outside of the United States. See the Fund’s Statement of Additional Information for information on how a particular country is assigned. |
| | | | |
Security | | Country | | Trading Currency |
Aegean Marine Petroleum Network Inc. | | Greece | | US dollar |
Home Inns & Hotels Management, Inc. (DR) | | China | | US dollar |
ICON PLC (DR) | | Ireland | | US dollar |
49
| (3) | Affiliated company as defined by the Investment Company Act of 1940, as amended. See Note (6) in Notes to Financial Statements. |
| | | | | | | | |
Issuer | | Rate | | | Maturity | | Value |
U.S. Treasury Note | | 4.625 | % | | 11/15/2016 | | $ | 12,977,022 |
| (5) | Percentages for the various classifications relate to total net assets. |
Company names are as reported by a data service provider and in some cases are translations; a company’s legal name may be different.
(DR) Depository Receipt, voting rights may vary.
| | | | | |
| TOP TEN HOLDINGS - March 31, 2010 (Unaudited) | |
Company Name | | Country | | Percentage
of Total
Net Assets | |
Ares Capital Corporation | | United States | | 3.4 | % |
LKQ Corporation | | United States | | 3.1 | |
GSI Commerce, Inc. | | United States | | 2.9 | |
Waste Connections, Inc. | | United States | | 2.7 | |
Atheros Communications, Inc. | | United States | | 2.5 | |
PSS World Medical, Inc. | | United States | | 2.4 | |
CommVault Systems, Inc. | | United States | | 2.4 | |
Euronet Worldwide, Inc. | | United States | | 2.2 | |
Informatica Corporation | | United States | | 2.2 | |
athenahealth, Inc. | | United States | | 2.0 | |
| | | | | |
Total | | | | 25.8 | % |
| | | | | |
For the purpose of determining the Fund’s top ten holdings, securities of the same issuer are aggregated to determine the weight in the Fund.
The accompanying notes are an integral part of the financial statements.
50
ARTISAN SMALL CAP VALUE FUND
Schedule of Investments – March 31, 2010 (Unaudited)
| | | | | |
| | | Shares
Held | | Value |
| | | | | |
| COMMON STOCKS - 94.6% | | | | | |
| | | | | |
| CONSUMER DISCRETIONARY - 6.7% | | | |
Diversified Consumer Services - 1.0% | | | | | |
Matthews International Corporation | | 694,900 | | $ | 24,668,950 |
| | | | | |
Hotels, Restaurants & Leisure - 2.3% | | | | | |
International Speedway Corporation, Class A | | 1,060,100 | | | 27,318,777 |
Jack in the Box Inc.(1) | | 1,378,800 | | | 32,470,740 |
| | | | | |
| | | | | 59,789,517 |
Media - 1.7% | | | | | |
Meredith Corporation | | 1,021,400 | | | 35,146,374 |
World Wrestling Entertainment, Inc., Class A | | 527,900 | | | 9,132,670 |
| | | | | |
| | | | | 44,279,044 |
Specialty Retail - 1.7% | | | | | |
Rent-A-Center, Inc.(1) | | 1,894,985 | | | 44,816,395 |
| | | | | |
| CONSUMER STAPLES - 2.7% | | | | | |
Food & Staples Retailing - 1.3% | | | |
Ruddick Corporation | | 1,055,700 | | | 33,402,348 |
| | | | | |
Tobacco - 1.4% | | | | | |
Universal Corporation | | 696,700 | | | 36,709,123 |
| | | | | |
| ENERGY - 8.8% | | | | | |
Energy Equipment & Services - 4.9% | | | | | |
Cal Dive International, Inc.(1) | | 4,355,588 | | | 31,926,460 |
Parker Drilling Company(1) | | 4,165,400 | | | 20,535,422 |
Patterson-UTI Energy, Inc. | | 2,286,500 | | | 31,942,405 |
RPC, Inc. | | 954,000 | | | 10,618,020 |
Seahawk Drilling, Inc.(1)(2) | | 806,500 | | | 15,202,525 |
Superior Energy Services, Inc.(1) | | 724,500 | | | 15,228,990 |
| | | | | |
| | | | | 125,453,822 |
Oil, Gas & Consumable Fuels - 3.9% | | | | | |
Comstock Resources, Inc.(1) | | 1,258,200 | | | 40,010,760 |
Forest Oil Corporation(1) | | 1,444,000 | | | 37,284,080 |
Holly Corporation | | 854,800 | | | 23,857,468 |
| | | | | |
| | | | | 101,152,308 |
| | | | | |
| | | Shares
Held | | Value |
| | | | | |
| FINANCIALS - 8.2% | | | | | |
Consumer Finance - 0.4% | | | | | |
The Student Loan Corporation | | 321,500 | | $ | 11,422,895 |
| | | | | |
Diversified Financial Services - 1.2% | | | | | |
PICO Holdings, Inc.(1) | | 822,100 | | | 30,573,899 |
| | | | | |
Insurance - 6.1% | | | | | |
Allied World Assurance Company Holdings, Ltd | | 393,600 | | | 17,652,960 |
Aspen Insurance Holdings Limited | | 440,700 | | | 12,709,788 |
Assured Guaranty Ltd. | | 563,600 | | | 12,382,292 |
Endurance Specialty Holdings Ltd. | | 311,700 | | | 11,579,655 |
Max Capital Group Ltd. | | 625,400 | | | 14,377,946 |
Platinum Underwriters Holdings, Ltd. | | 632,700 | | | 23,460,516 |
Stewart Information Services Corporation(2) | | 1,161,778 | | | 16,032,536 |
Willis Group Holdings Limited | | 416,246 | | | 13,024,337 |
Zenith National Insurance Corp. | | 927,300 | | | 35,534,136 |
| | | | | |
| | | | | 156,754,166 |
Real Estate Investment Trusts (REITS) - 0.5% | | | | | |
Pebblebrook Hotel Trust(1) | | 574,700 | | | 12,085,941 |
| | | | | |
| HEALTHCARE - 3.1% | | | | | |
Health Care Equipment & Supplies - 1.1% | | | | | |
CONMED Corporation(1) | | 1,110,800 | | | 26,448,148 |
National Dentex Corporation(1) | | 229,600 | | | 2,238,600 |
| | | | | |
| | | | | 28,686,748 |
Health Care Providers & Services - 2.0% | | | | | |
AMN Healthcare Services, Inc.(1)(2) | | 2,438,900 | | | 21,462,320 |
Cross Country Healthcare, Inc.(1)(2) | | 2,199,100 | | | 22,232,901 |
HealthSpring, Inc.(1) | | 490,400 | | | 8,631,040 |
Medical Staffing Network Holdings, Inc.(1) | | 1,508,600 | | | 211,204 |
| | | | | |
| | | | | 52,537,465 |
51
| | | | | |
| | | Shares
Held | | Value |
| | | | | |
| INDUSTRIALS - 22.9% | | | | | |
Aerospace & Defense - 1.8% | | | |
Spirit AeroSystems Holdings, Inc., Class A(1) | | 1,151,200 | | $ | 26,915,056 |
Teledyne Technologies Incorporated(1) | | 457,500 | | | 18,881,025 |
| | | | | |
| | | | | 45,796,081 |
Building Products - 1.0% | | | | | |
Quanex Building Products Corporation | | 1,473,975 | | | 24,364,807 |
| | | | | |
Commercial Services & Supplies - 0.8% | | | | | |
Sykes Enterprises, Incorporated(1) | | 857,100 | | | 19,576,164 |
| | | | | |
Construction & Engineering - 4.3% | | | | | |
Comfort Systems USA, Inc.(2) | | 2,481,900 | | | 30,998,931 |
EMCOR Group, Inc.(1) | | 1,664,600 | | | 40,999,098 |
Granite Construction Incorporated | | 1,261,000 | | | 38,107,420 |
| | | | | |
| | | | | 110,105,449 |
Electrical Equipment - 2.8% | | | | | |
Acuity Brands, Inc.(2) | | 748,000 | | | 31,573,080 |
Woodward Governor Company | | 1,246,000 | | | 39,847,080 |
| | | | | |
| | | | | 71,420,160 |
Industrial Conglomerates - 0.3% | | | |
McDermott International, Inc.(1) | | 325,500 | | | 8,762,460 |
| | | | | |
Machinery - 3.2% | | | | | |
Astec Industries, Inc.(1)(2) | | 1,203,800 | | | 34,862,048 |
IDEX Corporation | | 772,700 | | | 25,576,370 |
Mueller Industries, Inc. | | 823,100 | | | 22,050,849 |
| | | | | |
| | | | | 82,489,267 |
Marine - 1.1% | | | | | |
Kirby Corporation(1) | | 710,000 | | | 27,086,500 |
| | | | | |
Professional Services - 6.0% | | | | | |
CRA International, Inc.(1) | | 367,400 | | | 8,420,808 |
Diamond Management & Technology Consultants, Inc. | | 771,600 | | | 6,057,060 |
FTI Consulting, Inc.(1) | | 662,300 | | | 26,041,636 |
Hudson Highland Group, Inc.(1) | | 1,427,700 | | | 6,281,880 |
Korn/Ferry International(1) | | 418,900 | | | 7,393,585 |
School Specialty, Inc.(1)(2) | | 1,613,600 | | | 36,644,856 |
Towers Watson & Co., Class A | | 852,200 | | | 40,479,500 |
TrueBlue, Inc.(1) | | 1,489,100 | | | 23,081,050 |
| | | | | |
| | | | | 154,400,375 |
Road & Rail - 1.6% | | | | | |
Arkansas Best Corporation | | 484,900 | | | 14,488,812 |
Ryder System, Inc.(2) | | 687,200 | | | 26,635,872 |
| | | | | |
| | | | | 41,124,684 |
| | | | | |
| | | Shares
Held | | Value |
| | | | | |
| INFORMATION TECHNOLOGY - 27.3% | | | | | |
Computers & Peripherals - 3.2% | | | |
Diebold, Incorporated | | 405,300 | | $ | 12,872,328 |
Imation Corp.(1) | | 1,230,900 | | | 13,552,209 |
Intermec, Inc.(1) | | 2,071,400 | | | 29,372,452 |
Lexmark International, Inc., Class A(1) | | 698,400 | | | 25,198,272 |
| | | | | |
| | | | | 80,995,261 |
Electronic Equipment & Instruments - 4.9% | | | | | |
Anixter International Inc.(1) | | 573,700 | | | 26,877,845 |
Arrow Electronics, Inc.(1) | | 1,009,400 | | | 30,413,222 |
Benchmark Electronics, Inc.(1) | | 1,252,800 | | | 25,983,072 |
Coherent, Inc.(1) | | 41,200 | | | 1,316,752 |
Orbotech, Ltd.(1)(2)(3) | | 2,440,479 | | | 26,430,388 |
RadiSys Corporation(1)(2) | | 1,614,600 | | | 14,466,816 |
| | | | | |
| | | | | 125,488,095 |
Internet Software & Services - 2.0% | | | | | |
EarthLink, Inc. | | 1,945,400 | | | 16,613,716 |
Monster Worldwide, Inc.(1) | | 2,048,200 | | | 34,020,602 |
| | | | | |
| | | | | 50,634,318 |
IT Services - 3.6% | | | | | |
CACI International Inc(1) | | 651,900 | | | 31,845,315 |
MAXIMUS, Inc. | | 484,800 | | | 29,538,864 |
SRA International, Inc., Class A(1) | | 1,539,000 | | | 31,995,810 |
| | | | | |
| | | | | 93,379,989 |
Semiconductors & Semiconductor Equipment - 5.1% | | | |
Actel Corporation(1)(2) | | 1,810,400 | | | 25,074,040 |
ATMI, Inc.(1) | | 486,900 | | | 9,402,039 |
LTX Corporation(1) | | 3,804,100 | | | 11,526,423 |
Rudolph Technologies, Inc.(1)(2) | | 2,128,400 | | | 18,240,388 |
Standard Microsystems Corporation(1) | | 584,400 | | | 13,604,832 |
Ultra Clean Holdings, Inc.(1)(2) | | 1,594,444 | | | 13,584,663 |
Ultratech, Inc.(1)(2) | | 1,736,200 | | | 23,612,320 |
Varian Semiconductor Equipment Associates, Inc.(1) | | 453,900 | | | 15,033,168 |
| | | | | |
| | | | | 130,077,873 |
Software - 8.5% | | | | | |
Fair Isaac Corporation | | 1,214,000 | | | 30,762,760 |
Jack Henry and Associates, Inc. | | 823,900 | | | 19,823,034 |
Lawson Software, Inc.(1) | | 5,931,700 | | | 39,208,537 |
Manhattan Associates, Inc.(1)(2) | | 1,585,100 | | | 40,388,348 |
MicroStrategy Incorporated, Class A(1) | | 333,400 | | | 28,362,338 |
Progress Software Corporation(1) | | 817,800 | | | 25,703,454 |
TIBCO Software Inc.(1) | | 1,056,500 | | | 11,399,635 |
Websense, Inc.(1) | | 1,007,800 | | | 22,947,606 |
| | | | | |
| | | | | 218,595,712 |
52
| | | | | | |
| | | Shares
Held | | Value |
| | | | | | |
| MATERIALS - 4.4% | | | | | | |
Chemicals - 4.1% | | | | | | |
H.B. Fuller Company | | | 1,668,200 | | $ | 38,718,922 |
Olin Corporation | | | 1,087,800 | | | 21,342,636 |
OM Group, Inc.(1) | | | 303,400 | | | 10,279,192 |
Sensient Technologies Corporation | | | 1,234,700 | | | 35,880,382 |
| | | | | | |
| | | | | | 106,221,132 |
Construction Materials - 0.3% | | | |
Eagle Materials Inc. | | | 335,700 | | | 8,909,478 |
| | | | | | |
| UTILITIES - 10.5% | | | |
Electrical Utilities - 7.8% | | | |
ALLETE, Inc. | | | 1,093,600 | | | 36,613,728 |
Cleco Corporation | | | 1,417,900 | | | 37,645,245 |
El Paso Electric Company(1) | | | 1,640,700 | | | 33,798,420 |
The Empire District Electric Company | | | 969,600 | | | 17,472,192 |
IDACORP, Inc. | | | 999,800 | | | 34,613,076 |
Portland General Electric Company | | | 1,775,000 | | | 34,275,250 |
UIL Holdings Corporation | | | 266,800 | | | 7,337,000 |
| | | | | | |
| | | | | | 201,754,911 |
| | | | | | |
Gas Utilities - 0.5% | | | |
Northwest Natural Gas Company | | | 280,400 | | | 13,066,640 |
| | | | | | |
Multi-Utilities - 2.2% | | | |
NorthWestern Corporation | | | 1,130,600 | | | 30,311,386 |
Vectren Corporation | | | 1,103,500 | | | 27,278,520 |
| | | | | | |
| | | | | | 57,589,906 |
| | | | | | |
Total common stocks
(Cost $2,224,770,615) | | | | | | 2,434,171,883 |
| | |
| | | Par
Amount | | |
SHORT-TERM INVESTMENTS
(CASH EQUIVALENTS) - 5.2% | | | |
Repurchase agreement with Fixed Income Clearing Corporation, 0.00%, dated 3/31/10, due 4/1/10, maturity value $135,058,000(4)
(Cost $135,058,000) | | $ | 135,058,000 | | | 135,058,000 |
| | | | | | |
| | | | | | |
Total investments - 99.8%
(Cost $2,359,828,615) | | | | | | 2,569,229,883 |
| | | | | | |
Other assets less liabilities - 0.2% | | | | | | 4,318,637 |
| | | | | | |
| | | | | | |
Total net assets - 100.0%(5) | | | | | $ | 2,573,548,520 |
| | | | | | |
| (1) | Non-income producing security. |
| (2) | Affiliated company as defined by the Investment Company Act of 1940, as amended. See Note (6) in Notes to Financial Statements. |
| (3) | The Fund considers the company to be from Israel. See the Fund’s Statement of Additional Information for information on how a particular country is assigned. The security trades in U.S. dollars. |
| | | | | | | | |
Issuer | | Rate | | | Maturity | | Value |
U.S. Treasury Note | | 4.000 | % | | 2/15/2015 | | $ | 137,762,848 |
| (5) | Percentages for the various classifications relate to total net assets. |
Company names are as reported by a data service provider and in some cases are translations; a company’s legal name may be different.
TOP TEN HOLDINGS - March 31, 2010 (Unaudited)
| | | | | |
Company Name | | Country | | Percentage
of Total
Net Assets | |
Rent-A-Center, Inc. | | United States | | 1.7 | % |
EMCOR Group, Inc. | | United States | | 1.6 | |
Towers Watson & Co. | | United States | | 1.6 | |
Manhattan Associates, Inc. | | United States | | 1.6 | |
Comstock Resources, Inc. | | United States | | 1.6 | |
Woodward Governor Company | | United States | | 1.5 | |
Lawson Software, Inc. | | United States | | 1.5 | |
H.B. Fuller Company | | United States | | 1.5 | |
Granite Construction Incorporated | | United States | | 1.5 | |
Cleco Corporation | | United States | | 1.5 | |
| | | | | |
Total | | | | 15.6 | % |
| | | | | |
For the purpose of determining the Fund’s top ten holdings, securities of the same issuer are aggregated to determine the weight in the Fund.
The accompanying notes are an integral part of the financial statements.
53
ARTISAN FUNDS, INC.
Statements of Assets and Liabilities – March 31, 2010 (Unaudited)
| | | | | | | | |
| | | GLOBAL EQUITY | | | GLOBAL VALUE | |
| ASSETS: | | | | | | | | |
Investments in securities, unaffiliated, at value | | $ | 7,341,896 | | | $ | 29,892,805 | |
Investments in securities, affiliated, at value | | | - | | | | 1,053,851 | |
Short-term investments (repurchase agreements), at value | | | 7,082,000 | | | | 1,750,000 | |
| | | | | | | | |
Total investments | | | 14,423,896 | | | | 32,696,656 | |
Cash | | | 786 | | | | 883 | |
Foreign currency | | | - | | | | 11 | |
Net unrealized gain on foreign currency forward contracts | | | 17,119 | | | | - | |
Receivable from investments sold | | | - | | | | 160,949 | |
Receivable from fund shares sold | | | 797,577 | | | | 148,606 | |
Dividends and interest receivable | | | - | | | | 76,542 | |
Receivable from Adviser | | | 2,582 | | | | 59,271 | |
Other assets | | | - | | | | 326 | |
| | | | | | | | |
Total assets | | | 15,241,960 | | | | 33,143,244 | |
| | |
| LIABILITIES: | | | | | | | | |
Net unrealized loss on foreign currency forward contracts | | | - | | | | 55 | |
Payable for investments purchased | | | 7,375,613 | | | | 379,866 | |
Payable for operating expenses | | | 2,682 | | | | 134,308 | |
Payable for withholding taxes | | | 1,920 | | | | 1,605 | |
Payable for advisory fees | | | 200 | | | | 150,267 | |
Payable for deferred directors’ compensation | | | - | | | | 326 | |
| | | | | | | | |
Total liabilities | | | 7,380,415 | | | | 666,427 | |
| | | | | | | | |
Total net assets | | $ | 7,861,545 | | | $ | 32,476,817 | |
| | | | | | | | |
| NET ASSETS CONSIST OF: | | | | | | | | |
Fund shares issued and outstanding | | $ | 7,880,362 | | | $ | 27,108,624 | |
Net unrealized appreciation (depreciation) on investments and foreign currency related transactions | | | (16,710 | ) | | | 7,331,451 | |
Accumulated undistributed net investment loss | | | (299 | ) | | | (419,874 | ) |
Accumulated undistributed net realized losses on investments and foreign currency related transactions | | | (1,808 | ) | | | (1,543,384 | ) |
| | | | | | | | |
| | $ | 7,861,545 | | | $ | 32,476,817 | |
| | | | | | | | |
| SUPPLEMENTARY INFORMATION: | | | | | | | | |
Net assets | | | | | | | | |
Investor Shares | | $ | 7,861,545 | | | $ | 32,476,817 | |
Shares outstanding (Indefinite number of shares authorized, $0.01 par value) | | | | | | | | |
Investor Shares | | | 788,087 | | | | 3,509,647 | |
Net asset value, offering price and redemption price per share | | | | | | | | |
Investor Shares | | $ | 9.98 | | | $ | 9.25 | |
Cost of securities of unaffiliated issuers held | | $ | 14,439,526 | | | $ | 24,571,934 | |
Cost of securities of affiliated issuers held | | $ | - | | | $ | 794,189 | |
Cost of foreign currency | | $ | - | | | $ | 11 | |
The accompanying notes are an integral part of the financial statements.
54
ARTISAN FUNDS, INC.
Statements of Assets and Liabilities – March 31, 2010 (Unaudited) (Continued)
| | | | | | | | |
| | | INTERNATIONAL | | | INTERNATIONAL
SMALL CAP | |
| ASSETS: | | | | | | | | |
Investments in securities, unaffiliated, at value | | $ | 10,237,492,465 | | | $ | 754,892,139 | |
Short-term investments (repurchase agreements), at value | | | 102,820,000 | | | | 8,568,000 | |
| | | | | | | | |
Total investments | | | 10,340,312,465 | | | | 763,460,139 | |
Cash | | | 9,942,764 | | | | 287 | |
Foreign currency | | | 5,217,422 | | | | 201 | |
Receivable from investments sold | | | 66,610,350 | | | | 15,342,240 | |
Receivable from fund shares sold | | | 23,716,640 | | | | 15,521,915 | |
Dividends and interest receivable | | | 22,531,513 | | | | 1,748,291 | |
Other assets | | | 335,637 | | | | 22,350 | |
| | | | | | | | |
Total assets | | | 10,468,666,791 | | | | 796,095,423 | |
| | |
| LIABILITIES: | | | | | | | | |
Net unrealized loss on foreign currency forward contracts | | | 94,784 | | | | 38,386 | |
Payable for investments purchased | | | 101,301,739 | | | | 5,221,919 | |
Payable for fund shares redeemed | | | 14,432,846 | | | | 409,801 | |
Payable for operating expenses | | | 4,100,414 | | | | 242,275 | |
Payable for withholding taxes | | | 987,617 | | | | 852,924 | |
Payable for deferred directors’ compensation | | | 335,637 | | | | 22,350 | |
| | | | | | | | |
Total liabilities | | | 121,253,037 | | | | 6,787,655 | |
| | | | | | | | |
Total net assets | | $ | 10,347,413,754 | | | $ | 789,307,768 | |
| | | | | | | | |
| NET ASSETS CONSIST OF: | | | | | | | | |
Fund shares issued and outstanding | | $ | 11,611,798,446 | | | $ | 798,639,700 | |
Net unrealized appreciation on investments and foreign currency related transactions | | | 1,435,702,385 | | | | 128,827,357 | |
Accumulated undistributed net investment loss | | | (14,444 | ) | | | (2,148,973 | ) |
Accumulated undistributed net realized losses on investments and foreign currency related transactions | | | (2,700,072,633 | ) | | | (136,010,316 | ) |
| | | | | | | | |
| | $ | 10,347,413,754 | | | $ | 789,307,768 | |
| | | | | | | | |
| SUPPLEMENTARY INFORMATION: | | | | | | | | |
Net assets | | | | | | | | |
Investor Shares | | $ | 7,898,468,881 | | | $ | 789,307,768 | |
Institutional Shares | | $ | 2,448,944,873 | | | | | |
Shares outstanding (Indefinite number of shares authorized, $0.01 par value) | | | | | | | | |
Investor Shares | | | 392,148,882 | | | | 46,282,769 | |
Institutional Shares | | | 120,851,920 | | | | | |
Net asset value, offering price and redemption price per share | | | | | | | | |
Investor Shares | | $ | 20.14 | | | $ | 17.05 | |
Institutional Shares | | $ | 20.26 | | | | | |
Cost of securities of unaffiliated issuers held | | $ | 8,905,079,308 | | | $ | 633,868,746 | |
Cost of foreign currency | | $ | 5,218,900 | | | $ | 200 | |
The accompanying notes are an integral part of the financial statements.
55
ARTISAN FUNDS, INC.
Statements of Assets and Liabilities – March 31, 2010 (Unaudited) (Continued)
| | | | | | | | |
| | | INTERNATIONAL VALUE | | | MID CAP | |
| ASSETS: | | | | | | | | |
Investments in securities, unaffiliated, at value | | $ | 2,457,168,021 | | | $ | 4,523,220,167 | |
Investments in securities, affiliated, at value | | | 111,708,614 | | | | 64,791,632 | |
Short-term investments (repurchase agreements), at value | | | 186,854,000 | | | | 113,520,000 | |
| | | | | | | | |
Total investments | | | 2,755,730,635 | | | | 4,701,531,799 | |
Cash | | | 297 | | | | 861 | |
Foreign currency | | | 29 | | | | - | |
Net unrealized gain on foreign currency forward contracts | | | 266,492 | | | | - | |
Receivable from investments sold | | | 563,677 | | | | 22,602,567 | |
Receivable from fund shares sold | | | 55,027,930 | | | | 5,599,555 | |
Dividends and interest receivable | | | 8,753,458 | | | | 784,684 | |
Other assets | | | 38,700 | | | | 125,928 | |
| | | | | | | | |
Total assets | | | 2,820,381,218 | | | | 4,730,645,394 | |
| | |
| LIABILITIES: | | | | | | | | |
Payable for investments purchased | | | 38,414,043 | | | | 29,298,029 | |
Payable for fund shares redeemed | | | 1,005,807 | | | | 5,501,114 | |
Payable for operating expenses | | | 648,542 | | | | 2,563,096 | |
Payable for withholding taxes | | | 460,069 | | | | - | |
Payable for deferred directors’ compensation | | | 38,700 | | | | 125,928 | |
| | | | | | | | |
Total liabilities | | | 40,567,161 | | | | 37,488,167 | |
| | | | | | | | |
Total net assets | | $ | 2,779,814,057 | | | $ | 4,693,157,227 | |
| | | | | | | | |
| NET ASSETS CONSIST OF: | | | | | | | | |
Fund shares issued and outstanding | | $ | 2,594,789,064 | | | $ | 4,317,541,199 | |
Net unrealized appreciation on investments and foreign currency related transactions | | | 358,608,929 | | | | 1,168,062,480 | |
Accumulated undistributed net investment loss | | | (15,129,185 | ) | | | (16,780,962 | ) |
Accumulated undistributed net realized losses on investments and foreign currency related transactions | | | (158,454,751 | ) | | | (775,665,490 | ) |
| | | | | | | | |
| | $ | 2,779,814,057 | | | $ | 4,693,157,227 | |
| | | | | | | | |
| SUPPLEMENTARY INFORMATION: | | | | | | | | |
Net assets | | | | | | | | |
Investor Shares | | $ | 2,291,129,889 | | | $ | 4,202,122,581 | |
Institutional Shares | | $ | 488,684,168 | | | $ | 491,034,646 | |
Shares outstanding (Indefinite number of shares authorized, $0.01 par value) | | | | | | | | |
Investor Shares | | | 95,215,974 | | | | 154,426,292 | |
Institutional Shares | | | 20,310,951 | | | | 17,508,599 | |
Net asset value, offering price and redemption price per share | | | | | | | | |
Investor Shares | | $ | 24.06 | | | $ | 27.21 | |
Institutional Shares | | $ | 24.06 | | | $ | 28.05 | |
Cost of securities of unaffiliated issuers held | | $ | 2,311,049,928 | | | $ | 3,462,424,376 | |
Cost of securities of affiliated issuers held | | $ | 86,168,295 | | | $ | 71,044,943 | |
Cost of foreign currency | | $ | 29 | | | | - | |
The accompanying notes are an integral part of the financial statements.
56
ARTISAN FUNDS, INC.
Statements of Assets and Liabilities – March 31, 2010 (Unaudited) (Continued)
| | | | | | | | |
| | | MID CAP VALUE | | | OPPORTUNISTIC
GROWTH | |
| ASSETS: | | | | | | | | |
Investments in securities, unaffiliated, at value | | $ | 4,874,321,513 | | | $ | 60,250,506 | |
Investments in securities, affiliated, at value | | | 589,035,827 | | | | - | |
Short-term investments (repurchase agreements), at value | | | 279,329,000 | | | | 3,906,000 | |
| | | | | | | | |
Total investments | | | 5,742,686,340 | | | | 64,156,506 | |
Cash | | | 91 | | | | 689 | |
Foreign currency | | | - | | | | 68,080 | |
Receivable from investments sold | | | 30,068,470 | | | | 1,128,912 | |
Receivable from fund shares sold | | | 15,711,765 | | | | 79,002 | |
Dividends and interest receivable | | | 14,030,962 | | | | 15,251 | |
Receivable from Adviser | | | - | | | | 13,558 | |
Other assets | | | 91,648 | | | | 178 | |
| | | | | | | | |
Total assets | | | 5,802,589,276 | | | | 65,462,176 | |
| | |
| LIABILITIES: | | | | | | | | |
Payable for investments purchased | | | 17,892,844 | | | | 901,836 | |
Payable for fund shares redeemed | | | 3,978,506 | | | | 5,100 | |
Payable for operating expenses | | | 2,365,041 | | | | 175,755 | |
Payable for withholding taxes | | | - | | | | 321 | |
Payable for advisory fees | | | - | | | | 243,547 | |
Payable for deferred directors’ compensation | | | 91,648 | | | | 178 | |
| | | | | | | | |
Total liabilities | | | 24,328,039 | | | | 1,326,737 | |
| | | | | | | | |
Total net assets | | $ | 5,778,261,237 | | | $ | 64,135,439 | |
| | | | | | | | |
| NET ASSETS CONSIST OF: | | | | | | | | |
Fund shares issued and outstanding | | $ | 5,281,754,489 | | | $ | 51,814,337 | |
Net unrealized appreciation on investments and foreign currency related transactions | | | 647,426,022 | | | | 11,640,171 | |
Accumulated undistributed net investment income (loss) | | | 18,943,292 | | | | (282,990 | ) |
Accumulated undistributed net realized gains (losses) on investments and foreign currency related transactions | | | (169,862,566 | ) | | | 963,921 | |
| | | | | | | | |
| | $ | 5,778,261,237 | | | $ | 64,135,439 | |
| | | | | | | | |
| SUPPLEMENTARY INFORMATION: | | | | | | | | |
Net assets | | | | | | | | |
Investor Shares | | $ | 5,778,261,237 | | | $ | 64,135,439 | |
Shares outstanding (Indefinite number of shares authorized, $0.01 par value) | | | | | | | | |
Investor Shares | | | 311,475,368 | | | | 6,324,441 | |
Net asset value, offering price and redemption price per share | | | | | | | | |
Investor Shares | | $ | 18.55 | | | $ | 10.14 | |
Cost of securities of unaffiliated issuers held | | $ | 4,572,223,009 | | | $ | 52,483,570 | |
Cost of securities of affiliated issuers held | | $ | 523,037,309 | | | $ | - | |
Cost of foreign currency | | $ | - | | | $ | 68,046 | |
The accompanying notes are an integral part of the financial statements.
57
ARTISAN FUNDS, INC.
Statements of Assets and Liabilities – March 31, 2010 (Unaudited) (Continued)
| | | | | | | |
| | | OPPORTUNISTIC
VALUE | | | SMALL CAP | |
| ASSETS: | | | | | | | |
Investments in securities, unaffiliated, at value | | $ | 224,017,881 | | | $365,901,672 | |
Investments in securities, affiliated, at value | | | 16,484,215 | | | 7,761,688 | |
Short-term investments (repurchase agreements), at value | | | 9,677,000 | | | 12,718,000 | |
| | | | | | | |
Total investments | | | 250,179,096 | | | 386,381,360 | |
Cash | | | 863 | | | 326 | |
Receivable from investments sold | | | 5,099,432 | | | 6,345,588 | |
Receivable from fund shares sold | | | 926,645 | | | 1,103,443 | |
Dividends and interest receivable | | | 541,667 | | | 22,394 | |
Other assets | | | 4,364 | | | 20,289 | |
| | | | | | | |
Total assets | | | 256,752,067 | | | 393,873,400 | |
| | |
| LIABILITIES: | | | | | | | |
Payable for investments purchased | | | 3,252,278 | | | 5,627,429 | |
Payable for fund shares redeemed | | | 135,742 | | | 330,380 | |
Payable for operating expenses | | | 151,403 | | | 277,634 | |
Payable for deferred directors’ compensation | | | 4,364 | | | 20,289 | |
| | | | | | | |
Total liabilities | | | 3,543,787 | | | 6,255,732 | |
| | | | | | | |
Total net assets | | $ | 253,208,280 | | | $387,617,668 | |
| | | | | | | |
| NET ASSETS CONSIST OF: | | | | | | | |
Fund shares issued and outstanding | | $ | 321,811,895 | | | $535,021,866 | |
Net unrealized appreciation on investments and foreign currency related transactions | | | 26,911,274 | | | 109,756,984 | |
Accumulated undistributed net investment income (loss) | | | 387,072 | | | (1,185,426 | ) |
Accumulated undistributed net realized losses on investments and foreign currency related transactions | | | (95,901,961 | ) | | (255,975,756 | ) |
| | | | | | | |
| | $ | 253,208,280 | | | $387,617,668 | |
| | | | | | | |
| SUPPLEMENTARY INFORMATION: | | | | | | | |
Net assets | | | | | | | |
Investor Shares | | $ | 253,208,280 | | | $387,617,668 | |
Shares outstanding (Indefinite number of shares authorized, $0.01 par value) | | | | | | | |
Investor Shares | | | 27,869,951 | | | 27,618,578 | |
Net asset value, offering price and redemption price per share | | | | | | | |
Investor Shares | | $ | 9.09 | | | $ 14.03 | |
Cost of securities of unaffiliated issuers held | | $ | 208,933,205 | | | $269,785,434 | |
Cost of securities of affiliated issuers held | | $ | 14,334,617 | | | $ 6,838,942 | |
The accompanying notes are an integral part of the financial statements.
58
ARTISAN FUNDS, INC.
Statements of Assets and Liabilities – March 31, 2010 (Unaudited) (Continued)
| | | | |
| | | SMALL CAP VALUE | |
| ASSETS: | | | | |
Investments in securities, unaffiliated, at value | | $ | 2,036,729,851 | |
Investments in securities, affiliated, at value | | | 397,442,032 | |
Short-term investments (repurchase agreements), at value | | | 135,058,000 | |
| | | | |
Total investments | | | 2,569,229,883 | |
Cash | | | 301 | |
Receivable from investments sold | | | 5,504,280 | |
Receivable from fund shares sold | | | 6,537,030 | |
Dividends and interest receivable | | | 1,281,190 | |
Other assets | | | 51,729 | |
| | | | |
Total assets | | | 2,582,604,413 | |
| |
| LIABILITIES: | | | | |
Payable for investments purchased | | | 4,569,679 | |
Payable for fund shares redeemed | | | 3,104,176 | |
Payable for operating expenses | | | 1,330,309 | |
Payable for deferred directors’ compensation | | | 51,729 | |
| | | | |
Total liabilities | | | 9,055,893 | |
| | | | |
Total net assets | | $ | 2,573,548,520 | |
| | | | |
| NET ASSETS CONSIST OF: | | | | |
Fund shares issued and outstanding | | $ | 2,421,838,272 | |
Net unrealized appreciation on investments and foreign currency related transactions | | | 209,401,268 | |
Accumulated undistributed net investment income | | | 591,232 | |
Accumulated undistributed net realized losses on investments and foreign currency related transactions | | | (58,282,252 | ) |
| | | | |
| | $ | 2,573,548,520 | |
| | | | |
| SUPPLEMENTARY INFORMATION: | | | | |
Net assets | | | | |
Investor Shares | | $ | 2,573,548,520 | |
Shares outstanding (Indefinite number of shares authorized, $0.01 par value) | | | | |
Investor Shares | | | 169,744,026 | |
Net asset value, offering price and redemption price per share | | | | |
Investor Shares | | $ | 15.16 | |
Cost of securities of unaffiliated issuers held | | $ | 1,915,237,818 | |
Cost of securities of affiliated issuers held | | $ | 444,590,797 | |
The accompanying notes are an integral part of the financial statements.
59
ARTISAN FUNDS, INC.
Statements of Operations – For the Six Months Ended March 31, 2010 (Unaudited)
| | | | | | | | |
| | | GLOBAL EQUITY(1) | | | GLOBAL VALUE | |
| INVESTMENT INCOME: | | | | | | | | |
Dividends, from unaffiliated issuers(2) | | $ | - | | | $ | 313,133 | |
Interest | | | 1 | | | | 96 | |
| | | | | | | | |
Total investment income | | | 1 | | | | 313,229 | |
| | |
| EXPENSES: | | | | | | | | |
Advisory fees | | | 200 | | | | 150,267 | |
Transfer agent fees | | | | | | | | |
Investor Shares | | | 695 | | | | 60,109 | |
Shareholder communications | | | | | | | | |
Investor Shares | | | 61 | | | | 2,208 | |
Custodian fees | | | 444 | | | | 5,476 | |
Accounting fees | | | 205 | | | | 21,551 | |
Professional fees | | | 601 | | | | 19,898 | |
Registration fees | | | | | | | | |
Investor Shares | | | 616 | | | | 20,365 | |
Directors’ fees | | | 48 | | | | 3,000 | |
Other operating expenses | | | 12 | | | | 1,798 | |
| | | | | | | | |
Total operating expenses | | | 2,882 | | | | 284,672 | |
Less amounts waived or paid by the Adviser | | | (2,582 | ) | | | (59,271 | ) |
| | | | | | | | |
Net Expenses | | | 300 | | | | 225,401 | |
| | | | | | | | |
Net investment income (loss) | | | (299 | ) | | | 87,828 | |
| | |
| NET REALIZED AND UNREALIZED GAINS (LOSSES) ON INVESTMENTS: | | | | | | | | |
Net realized gain (loss) on: | | | | | | | | |
Investments(2) | | | - | | | | 932,205 | |
Foreign currency related transactions | | | (1,808 | ) | | | (3,589 | ) |
| | | | | | | | |
| | | (1,808 | ) | | | 928,616 | |
Net increase (decrease) in unrealized appreciation or depreciation on: | | | | | | | | |
Investments | | | (15,630 | ) | | | 1,793,596 | |
Foreign currency related transactions | | | (1,080 | ) | | | 359 | |
| | | | | | | | |
| | | (16,710 | ) | | | 1,793,955 | |
| | | | | | | | |
Net gain (loss) on investments and foreign currency related transactions | | | (18,518 | ) | | | 2,722,571 | |
| | | | | | | | |
Net increase (decrease) in net assets resulting from operations | | $ | (18,818 | ) | | $ | 2,810,399 | |
| | | | | | | | |
| (1) | For the period from commencement of operations (March 29, 2010) through March 31, 2010. |
| | | | | | | | | |
| (2) | | Fund | | Net of foreign taxes
withheld on dividends,
unaffiliated issuers | | Including net realized
gain (loss) on investments
from affiliated issuers | |
| | Global Equity | | $ | - | | $ | - | |
| | Global Value | | | 12,008 | | | (25 | ) |
The accompanying notes are an integral part of the financial statements.
60
ARTISAN FUNDS, INC.
Statements of Operations – For the Six Months Ended March 31, 2010 (Unaudited) (Continued)
| | | | | | | | |
| | | INTERNATIONAL | | | INTERNATIONAL
SMALL CAP | |
| INVESTMENT INCOME: | | | | | | | | |
Dividends, from unaffiliated issuers(1) | | $ | 59,810,650 | | | $ | 3,378,843 | |
Interest | | | 17,449 | | | | 1,260 | |
| | | | | | | | |
Total investment income | | | 59,828,099 | | | | 3,380,103 | |
| | |
| EXPENSES: | | | | | | | | |
Advisory fees | | | 47,914,583 | | | | 4,608,884 | |
Transfer agent fees | | | | | | | | |
Investor Shares | | | 8,388,380 | | | | 544,522 | |
Institutional Shares | | | 11,527 | | | | | |
Shareholder communications | | | | | | | | |
Investor Shares | | | 508,071 | | | | 18,772 | |
Institutional Shares | | | 14,220 | | | | | |
Custodian fees | | | 1,818,931 | | | | 211,979 | |
Accounting fees | | | 31,250 | | | | 22,859 | |
Professional fees | | | 239,389 | | | | 28,219 | |
Registration fees | | | | | | | | |
Investor Shares | | | 403,113 | | | | 43,946 | |
Institutional Shares | | | 8,812 | | | | | |
Directors’ fees | | | 204,008 | | | | 15,389 | |
Other operating expenses | | | 261,514 | | | | 10,364 | |
| | | | | | | | |
Total operating expenses | | | 59,803,798 | | | | 5,504,934 | |
| | | | | | | | |
Net investment income (loss) | | | 24,301 | | | | (2,124,831 | ) |
| | |
| NET REALIZED AND UNREALIZED GAINS (LOSSES) ON INVESTMENTS: | | | | | | | | |
Net realized gain (loss) on: | | | | | | | | |
Investments | | | 18,329,042 | | | | (1,741,076 | ) |
Foreign currency related transactions | | | (1,830,151 | ) | | | (199,872 | ) |
| | | | | | | | |
| | | 16,498,891 | | | | (1,940,948 | ) |
Net increase (decrease) in unrealized appreciation or depreciation on: | | | | | | | | |
Investments | | | 87,246,355 | | | | 25,460,955 | |
Foreign currency related transactions | | | 1,678,265 | | | | (540,087 | ) |
| | | | | | | | |
| | | 88,924,620 | | | | 24,920,868 | |
| | | | | | | | |
Net gain on investments and foreign currency related transactions | | | 105,423,511 | | | | 22,979,920 | |
| | | | | | | | |
Net increase in net assets resulting from operations | | $ | 105,447,812 | | | $ | 20,855,089 | |
| | | | | | | | |
| | | | | |
| (1) | | Fund | | Net of foreign taxes
withheld on dividends,
unaffiliated issuers |
| | International | | $ | 5,217,031 |
| | International Small Cap | | | 180,142 |
The accompanying notes are an integral part of the financial statements.
61
ARTISAN FUNDS, INC.
Statements of Operations – For the Six Months Ended March 31, 2010 (Unaudited) (Continued)
| | | | | | | | |
| | | INTERNATIONAL VALUE | | | MID CAP | |
| INVESTMENT INCOME: | | | | | | | | |
Dividends, from unaffiliated issuers(1) | | $ | 26,925,750 | | | $ | 8,858,869 | |
Interest | | | 11,308 | | | | 8,876 | |
| | | | | | | | |
Total investment income | | | 26,937,058 | | | | 8,867,745 | |
| | |
| EXPENSES: | | | | | | | | |
Advisory fees | | | 11,098,993 | | | | 20,221,144 | |
Transfer agent fees | | | | | | | | |
Investor Shares | | | 1,919,440 | | | | 4,714,535 | |
Institutional Shares | | | 9,271 | | | | 9,177 | |
Shareholder communications | | | | | | | | |
Investor Shares | | | 94,892 | | | | 233,552 | |
Institutional Shares | | | 1,230 | | | | 3,392 | |
Custodian fees | | | 288,552 | | | | 44,884 | |
Accounting fees | | | 32,545 | | | | 24,111 | |
Professional fees | | | 50,028 | | | | 86,135 | |
Registration fees | | | | | | | | |
Investor Shares | | | 74,375 | | | | 56,896 | |
Institutional Shares | | | 15,517 | | | | 7,109 | |
Directors’ fees | | | 41,792 | | | | 91,644 | |
Other operating expenses | | | 26,874 | | | | 51,837 | |
| | | | | | | | |
Total operating expenses | | | 13,653,509 | | | | 25,544,416 | |
| | | | | | | | |
Net investment income (loss) | | | 13,283,549 | | | | (16,676,671 | ) |
| | |
| NET REALIZED AND UNREALIZED GAINS (LOSSES) ON INVESTMENTS: | | | | | | | | |
Net realized gain (loss) on: | | | | | | | | |
Investments(1) | | | (6,760,461 | ) | | | 16,628,580 | |
Foreign currency related transactions | | | (542,103 | ) | | | - | |
| | | | | | | | |
| | | (7,302,564 | ) | | | 16,628,580 | |
Net increase in unrealized appreciation or depreciation on: | | | | | | | | |
Investments | | | 168,549,557 | | | | 499,422,766 | |
Foreign currency related transactions | | | 36,405 | | | | - | |
| | | | | | | | |
| | | 168,585,962 | | | | 499,422,766 | |
| | | | | | | | |
Net gain on investments and foreign currency related transactions | | | 161,283,398 | | | | 516,051,346 | |
| | | | | | | | |
Net increase in net assets resulting from operations | | $ | 174,566,947 | | | $ | 499,374,675 | |
| | | | | | | | |
| | | | | | | | |
| (1) | | Fund | | Net of foreign taxes
withheld on dividends,
unaffiliated issuers | | Including net realized
gain (loss) on investments
from affiliated issuers |
| | International Value | | $ | 1,617,142 | | $ | 70,505 |
| | Mid Cap | | | 11,368 | | | - |
The accompanying notes are an integral part of the financial statements.
62
ARTISAN FUNDS, INC.
Statements of Operations – For the Six Months Ended March 31, 2010 (Unaudited) (Continued)
| | | | | | | |
| | | MID CAP VALUE | | OPPORTUNISTIC
GROWTH | |
| INVESTMENT INCOME: | | | | | | | |
Dividends, from unaffiliated issuers(1) | | $ | 48,498,460 | | $ | 123,076 | |
Dividends, from affiliated issuers(1) | | | 1,647,101 | | | - | |
Interest | | | 18,622 | | | 220 | |
| | | | | | | |
Total investment income | | | 50,164,183 | | | 123,296 | |
| | |
| EXPENSES: | | | | | | | |
Advisory fees | | | 24,190,265 | | | 243,547 | |
Transfer agent fees | | | | | | | |
Investor Shares | | | 5,926,316 | | | 97,254 | |
Shareholder communications | | | | | | | |
Investor Shares | | | 436,262 | | | 6,736 | |
Custodian fees | | | 50,595 | | | 7,137 | |
Accounting fees | | | 18,144 | | | 23,495 | |
Professional fees | | | 129,178 | | | 12,921 | |
Registration fees | | | | | | | |
Investor Shares | | | 206,681 | | | 24,540 | |
Directors’ fees | | | 110,616 | | | 3,000 | |
Other operating expenses | | | 71,269 | | | 839 | |
| | | | | | | |
Total operating expenses | | | 31,139,326 | | | 419,469 | |
Less amounts waived or paid by the Adviser | | | - | | | (13,558 | ) |
| | | | | | | |
Net Expenses | | | 31,139,326 | | | 405,911 | |
| | | | | | | |
Net investment income (loss) | | | 19,024,857 | | | (282,615 | ) |
| | |
| NET REALIZED AND UNREALIZED GAINS (LOSSES) ON INVESTMENTS: | | | | | | | |
Net realized gain (loss) on: | | | | | | | |
Investments(1) | | | 246,617,617 | | | 1,843,351 | |
Foreign currency related transactions | | | - | | | (33,059 | ) |
| | | | | | | |
| | | 246,617,617 | | | 1,810,292 | |
Net increase (decrease) in unrealized appreciation or depreciation on: | | | | | | | |
Investments | | | 251,371,301 | | | 4,281,094 | |
Foreign currency related transactions | | | - | | | (32,971 | ) |
| | | | | | | |
| | | 251,371,301 | | | 4,248,123 | |
| | | | | | | |
Net gain on investments and foreign currency related transactions | | | 497,988,918 | | | 6,058,415 | |
| | | | | | | |
Net increase in net assets resulting from operations | | $ | 517,013,775 | | $ | 5,775,800 | |
| | | | | | | |
| | | | | | | | | |
| (1) | | Fund | | Net of foreign taxes
withheld on dividends,
unaffiliated issuers | | Including net realized
(loss) on investments
from affiliated issuers | |
| | Mid Cap Value | | $ | - | | $ | (745,631 | ) |
| | Opportunistic Growth | | | 1,954 | | | - | |
The accompanying notes are an integral part of the financial statements.
63
ARTISAN FUNDS, INC.
Statements of Operations – For the Six Months Ended March 31, 2010 (Unaudited) (Continued)
| | | | | | | | |
| | | OPPORTUNISTIC
VALUE | | | SMALL CAP | |
| INVESTMENT INCOME: | | | | | | | | |
Dividends, from unaffiliated issuers(1) | | $ | 2,214,600 | | | $ | 1,301,206 | |
Interest | | | 433 | | | | 849 | |
| | | | | | | | |
Total investment income | | | 2,215,033 | | | | 1,302,055 | |
| | |
| EXPENSES: | | | | | | | | |
Advisory fees | | | 938,767 | | | | 1,966,115 | |
Transfer agent fees | | | | | | | | |
Investor Shares | | | 289,897 | | | | 371,418 | |
Shareholder communications | | | | | | | | |
Investor Shares | | | 20,254 | | | | 50,276 | |
Custodian fees | | | 5,528 | | | | 8,238 | |
Accounting fees | | | 18,304 | | | | 17,455 | |
Professional fees | | | 27,358 | | | | 22,228 | |
Registration fees | | | | | | | | |
Investor Shares | | | 18,323 | | | | 17,773 | |
Directors’ fees | | | 3,489 | | | | 9,233 | |
Other operating expenses | | | 4,058 | | | | 6,257 | |
| | | | | | | | |
Total operating expenses | | | 1,325,978 | | | | 2,468,993 | |
| | | | | | | | |
Net investment income (loss) | | | 889,055 | | | | (1,166,938 | ) |
| | |
| NET REALIZED AND UNREALIZED GAINS (LOSSES) ON INVESTMENTS: | | | | | | | | |
Net realized gain (loss) on: | | | | | | | | |
Investments(1) | | | 7,541,214 | | | | 38,727,297 | |
Foreign currency related transactions | | | (5,571 | ) | | | - | |
| | | | | | | | |
| | | 7,535,643 | | | | 38,727,297 | |
Net increase (decrease) in unrealized appreciation or depreciation on: | | | | | | | | |
Investments | | | 16,088,093 | | | | (4,510,727 | ) |
| | | | | | | | |
Net gain on investments and foreign currency related transactions | | | 23,623,736 | | | | 34,216,570 | |
| | | | | | | | |
Net increase in net assets resulting from operations | | $ | 24,512,791 | | | $ | 33,049,632 | |
| | | | | | | | |
| | | | | | | | | |
| (1) | | Fund | | Net of foreign taxes
withheld on dividends,
unaffiliated issuers | | Including net realized
(loss) on investments
from affiliated issuers | |
| | Opportunistic Value | | $ | - | | $ | - | |
| | Small Cap | | | 1,858 | | | (93,317 | ) |
The accompanying notes are an integral part of the financial statements.
64
ARTISAN FUNDS, INC.
Statements of Operations – For the Six Months Ended March 31, 2010 (Unaudited) (Continued)
| | | |
| | | SMALL CAP VALUE |
| INVESTMENT INCOME: | | | |
Dividends, from unaffiliated issuers | | $ | 13,702,523 |
Dividends, from affiliated issuers | | | 1,048,432 |
Interest | | | 7,881 |
| | | |
Total investment income | | | 14,758,836 |
| |
| EXPENSES: | | | |
Advisory fees | | | 11,072,862 |
Transfer agent fees | | | |
Investor Shares | | | 2,574,000 |
Shareholder communications | | | |
Investor Shares | | | 189,762 |
Custodian fees | | | 24,429 |
Accounting fees | | | 18,087 |
Professional fees | | | 34,246 |
Registration fees | | | |
Investor Shares | | | 72,528 |
Directors’ fees | | | 46,992 |
Other operating expenses | | | 79,306 |
| | | |
Total operating expenses | | | 14,112,212 |
| | | |
Net investment income | | | 646,624 |
| |
| NET REALIZED AND UNREALIZED GAINS ON INVESTMENTS: | | | |
Net realized gain on: | | | |
Investments(1) | | | 91,307,132 |
Net increase in unrealized appreciation or depreciation on: | | | |
Investments | | | 176,226,034 |
| | | |
Net gain on investments and foreign currency related transactions | | | 267,533,166 |
| | | |
Net increase in net assets resulting from operations | | $ | 268,179,790 |
| | | |
| | | | | | |
| (1) | | Fund | | Including net realized
(loss) on investments
from affiliated issuers | |
| | Small Cap Value | | $ | (2,209,165 | ) |
The accompanying notes are an integral part of the financial statements.
65
ARTISAN FUNDS, INC.
Statements of Changes in Net Assets
| | | | | | | | | | | | |
| | | GLOBAL EQUITY | | | GLOBAL VALUE | |
| | | Period Ended
3/31/2010(1)(2) | | | Six Months Ended
3/31/2010(2) | | | Year Ended
9/30/2009 | |
| OPERATIONS: | | | | | | | | | | | | |
Net investment income (loss) | | $ | (299 | ) | | $ | 87,828 | | | $ | 206,576 | |
Net realized gain (loss) on: | | | | | | | | | | | | |
Investments | | | - | | | | 932,205 | | | | (2,211,339 | ) |
Foreign currency related transactions | | | (1,808 | ) | | | (3,589 | ) | | | (1,249 | ) |
Net increase (decrease) in unrealized appreciation or depreciation on: | | | | | | | | | | | | |
Investments | | | (15,630 | ) | | | 1,793,596 | | | | 6,796,447 | |
Foreign currency related transactions | | | (1,080 | ) | | | 359 | | | | 976 | |
| | | | | | | | | | | | |
Net increase (decrease) in net assets resulting from operations | | | (18,817 | ) | | | 2,810,399 | | | | 4,791,411 | |
| | | |
| DISTRIBUTIONS PAID TO SHAREHOLDERS: | | | | | | | | | | | | |
Net investment income: | | | | | | | | | | | | |
Investor Shares | | | - | | | | (689,211 | ) | | | (120,537 | ) |
| | | | | | | | | | | | |
Total distributions paid to shareholders | | | - | | | | (689,211 | ) | | | (120,537 | ) |
| | | |
| FUND SHARE ACTIVITIES: | | | | | | | | | | | | |
Net increase in net assets resulting from fund share activities | | | 7,880,362 | | | | 1,738,064 | | | | 14,381,195 | |
| | | | | | | | | | | | |
Total increase in net assets | | | 7,861,545 | | | | 3,859,252 | | | | 19,052,069 | |
| | | | | | | | | | | | |
Net assets, beginning of period | | | - | | | | 28,617,565 | | | | 9,565,496 | |
| | | | | | | | | | | | |
Net assets, end of period | | $ | 7,861,545 | | | $ | 32,476,817 | | | $ | 28,617,565 | |
| | | | | | | | | | | | |
| | | |
Accumulated undistributed net investment income (loss) | | $ | (299 | ) | | $ | (419,874 | ) | | $ | 181,509 | |
| | | | | | | | | | | | |
| (1) | For the period from commencement of operations (March 29, 2010) through March 31, 2010. |
The accompanying notes are an integral part of the financial statements.
66
ARTISAN FUNDS, INC.
Statements of Changes in Net Assets (Continued)
| | | | | | | | | | | | | | | | |
| | | INTERNATIONAL | | | INTERNATIONAL SMALL CAP | |
| | | Six Months Ended
3/31/2010(1) | | | Year Ended
9/30/2009 | | | Six Months Ended
3/31/2010(1) | | | Year Ended
9/30/2009 | |
| OPERATIONS: | | | | | | | | | | | | | | | | |
Net investment income (loss) | | $ | 24,301 | | | $ | 132,762,575 | | | $ | (2,124,831 | ) | | $ | 5,108,638 | |
Net realized gain (loss) on: | | | | | | | | | | | | | | | | |
Investments | | | 18,329,042 | | | | (2,628,919,339 | ) | | | (1,741,076 | ) | | | (134,000,418 | ) |
Foreign currency related transactions | | | (1,830,151 | ) | | | (2,414,432 | ) | | | (199,872 | ) | | | (142,407 | ) |
Net increase (decrease) in unrealized appreciation or depreciation on: | | | | | | | | | | | | | | | | |
Investments | | | 87,246,355 | | | | 2,629,216,166 | | | | 25,460,955 | | | | 209,865,674 | |
Foreign currency related transactions | | | 1,678,265 | | | | 613,814 | | | | (540,087 | ) | | | (180,609 | ) |
| | | | | | | | | | | | | | | | |
Net increase in net assets resulting from operations | | | 105,447,812 | | | | 131,258,784 | | | | 20,855,089 | | | | 80,650,878 | |
| | | | |
| DISTRIBUTIONS PAID TO SHAREHOLDERS: | | | | | | | | | | | | | | | | |
Net investment income: | | | | | | | | | | | | | | | | |
Investor Shares | | | (94,522,015 | ) | | | (73,117,872 | ) | | | (4,971,337 | ) | | | (6,726,029 | ) |
Institutional Shares | | | (34,565,734 | ) | | | (37,487,951 | ) | | | | | | | | |
Net realized gains on investment transactions: | | | | | | | | | | | | | | | | |
Investor Shares | | | - | | | | (274,728,222 | ) | | | - | | | | (8,348,645 | ) |
Institutional Shares | | | - | | | | (101,344,058 | ) | | | | | | | | |
| | | | | | | | | | | | | | | | |
Total distributions paid to shareholders | | | (129,087,749 | ) | | | (486,678,103 | ) | | | (4,971,337 | ) | | | (15,074,674 | ) |
| | | | |
| FUND SHARE ACTIVITIES: | | | | | | | | | | | | | | | | |
Net increase (decrease) in net assets resulting from fund share activities | | | (256,801,033 | ) | | | (820,456,337 | ) | | | 77,621,284 | | | | (102,179,473 | ) |
| | | | | | | | | | | | | | | | |
Total increase (decrease) in net assets | | | (280,440,970 | ) | | | (1,175,875,656 | ) | | | 93,505,036 | | | | (36,603,269 | ) |
| | | | | | | | | | | | | | | | |
Net assets, beginning of period | | | 10,627,854,724 | | | | 11,803,730,380 | | | | 695,802,732 | | | | 732,406,001 | |
| | | | | | | | | | | | | | | | |
Net assets, end of period | | $ | 10,347,413,754 | | | $ | 10,627,854,724 | | | $ | 789,307,768 | | | $ | 695,802,732 | |
| | | | | | | | | | | | | | | | |
| | | | |
Accumulated undistributed net investment income (loss) | | $ | (14,444 | ) | | $ | 129,049,002 | | | $ | (2,148,973 | ) | | $ | 4,947,196 | |
| | | | | | | | | | | | | | | | |
The accompanying notes are an integral part of the financial statements.
67
ARTISAN FUNDS, INC.
Statements of Changes in Net Assets (Continued)
| | | | | | | | | | | | | | | | |
| | | INTERNATIONAL VALUE | | | MID CAP | |
| | | Six Months Ended
3/31/2010(1) | | | Year Ended
9/30/2009 | | | Six Months Ended
3/31/2010(1) | | | Year Ended
9/30/2009 | |
| OPERATIONS: | | | | | | | | | | | | | | | | |
Net investment income (loss) | | $ | 13,283,549 | | | $ | 11,511,387 | | | $ | (16,676,671 | ) | | $ | (17,497,526 | ) |
Net realized gain (loss) on: | | | | | | | | | | | | | | | | |
Investments | | | (6,760,461 | ) | | | (139,186,395 | ) | | | 16,628,580 | | | | (769,509,214 | ) |
Foreign currency related transactions | | | (542,103 | ) | | | 9,770,470 | | | | - | | | | - | |
Net increase in unrealized appreciation or depreciation on: | | | | | | | | | | | | | | | | |
Investments | | | 168,549,557 | | | | 299,492,429 | | | | 499,422,766 | | | | 792,263,717 | |
Foreign currency related transactions | | | 36,405 | | | | 548,147 | | | | - | | | | - | |
| | | | | | | | | | | | | | | | |
Net increase in net assets resulting from operations | | | 174,566,947 | | | | 182,136,038 | | | | 499,374,675 | | | | 5,256,977 | |
| | | | |
| DISTRIBUTIONS PAID TO SHAREHOLDERS: | | | | | | | | | | | | | | | | |
Net investment income: | | | | | | | | | | | | | | | | |
Investor Shares | | | (34,819,928 | ) | | | (10,176,045 | ) | | | - | | | | - | |
Institutional Shares | | | (7,409,299 | ) | | | (2,362,145 | ) | | | - | | | | - | |
Net realized gains on investment transactions: | | | | | | | | | | | | | | | | |
Investor Shares | | | - | | | | - | | | | - | | | | (40,893,720 | ) |
Institutional Shares | | | - | | | | - | | | | - | | | | (5,219,106 | ) |
| | | | | | | | | | | | | | | | |
Total distributions paid to shareholders | | | (42,229,227 | ) | | | (12,538,190 | ) | | | - | | | | (46,112,826 | ) |
| | | | |
| FUND SHARE ACTIVITIES: | | | | | | | | | | | | | | | | |
Net increase (decrease) in net assets resulting from fund share activities | | | 627,730,685 | | | | 634,624,462 | | | | 50,716,869 | | | | (85,588,305 | ) |
| | | | | | | | | | | | | | | | |
Total increase (decrease) in net assets | | | 760,068,405 | | | | 804,222,310 | | | | 550,091,544 | | | | (126,444,154 | ) |
| | | | | | | | | | | | | | | | |
Net assets, beginning of period | | | 2,019,745,652 | | | | 1,215,523,342 | | | | 4,143,065,683 | | | | 4,269,509,837 | |
| | | | | | | | | | | | | | | | |
Net assets, end of period | | $ | 2,779,814,057 | | | $ | 2,019,745,652 | | | $ | 4,693,157,227 | | | $ | 4,143,065,683 | |
| | | | | | | | | | | | | | | | |
| | | | |
Accumulated undistributed net investment
income (loss) | | $ | (15,129,185 | ) | | $ | 13,816,491 | | | $ | (16,780,962 | ) | | $ | (104,290 | ) |
| | | | | | | | | | | | | | | | |
The accompanying notes are an integral part of the financial statements.
68
ARTISAN FUNDS, INC.
Statements of Changes in Net Assets (Continued)
| | | | | | | | | | | | | | | | |
| | | MID CAP VALUE | | | OPPORTUNISTIC GROWTH | |
| | | Six Months Ended
3/31/2010(1) | | | Year Ended
9/30/2009 | | | Six Months Ended
3/31/2010(1) | | | Year Ended
9/30/2009 | |
| OPERATIONS: | | | | | | | | | | | | | | | | |
Net investment income (loss) | | $ | 19,024,857 | | | $ | 19,063,713 | | | $ | (282,615 | ) | | $ | (109,264 | ) |
Net realized gain (loss) on: | | | | | | | | | | | | | | | | |
Investments | | | 246,617,617 | | | | (409,231,827 | ) | | | 1,843,351 | | | | (835,142 | ) |
Foreign currency related transactions | | | - | | | | - | | | | (33,059 | ) | | | 447 | |
Net increase (decrease) in unrealized appreciation or depreciation on: | | | | | | | | | | | | | | | | |
Investments | | | 251,371,301 | | | | 623,062,782 | | | | 4,281,094 | | | | 7,779,098 | |
Foreign currency related transactions | | | - | | | | - | | | | (32,971 | ) | | | 195 | |
| | | | | | | | | | | | | | | | |
Net increase in net assets resulting from operations | | | 517,013,775 | | | | 232,894,668 | | | | 5,775,800 | | | | 6,835,334 | |
| | | | |
| DISTRIBUTIONS PAID TO SHAREHOLDERS: | | | | | | | | | | | | | | | | |
Net investment income: | | | | | | | | | | | | | | | | |
Investor Shares | | | (19,093,720 | ) | | | (4,661,179 | ) | | | - | | | | - | |
Net realized gains on investment transactions: | | | | | | | | | | | | | | | | |
Investor Shares | | | - | | | | (23,963,286 | ) | | | - | | | | - | |
| | | | | | | | | | | | | | | | |
Total distributions paid to shareholders | | | (19,093,720 | ) | | | (28,624,465 | ) | | | - | | | | - | |
| | | | |
| FUND SHARE ACTIVITIES: | | | | | | | | | | | | | | | | |
Net increase in net assets resulting from fund share activities | | | 652,384,756 | | | | 1,192,224,172 | | | | 12,802,599 | | | | 33,056,223 | |
| | | | | | | | | | | | | | | | |
Total increase in net assets | | | 1,150,304,811 | | | | 1,396,494,375 | | | | 18,578,399 | | | | 39,891,557 | |
| | | | | | | | | | | | | | | | |
Net assets, beginning of period | | | 4,627,956,426 | | | | 3,231,462,051 | | | | 45,557,040 | | | | 5,665,483 | |
| | | | | | | | | | | | | | | | |
Net assets, end of period | | $ | 5,778,261,237 | | | $ | 4,627,956,426 | | | $ | 64,135,439 | | | $ | 45,557,040 | |
| | | | | | | | | | | | | | | | |
| | | | |
Accumulated undistributed net investment
income (loss) | | $ | 18,943,292 | | | $ | 19,012,157 | | | $ | (282,990 | ) | | $ | (374 | ) |
| | | | | | | | | | | | | | | | |
The accompanying notes are an integral part of the financial statements.
69
ARTISAN FUNDS, INC.
Statements of Changes in Net Assets (Continued)
| | | | | | | | | | | | | | | | |
| | | OPPORTUNISTIC VALUE | | | SMALL CAP | |
| | | Six Months Ended
3/31/2010(1) | | | Year Ended
9/30/2009 | | | Six Months Ended
3/31/2010(1) | | | Year Ended
9/30/2009 | |
| OPERATIONS: | | | | | | | | | | | | | | | | |
Net investment income (loss) | | $ | 889,055 | | | $ | 1,304,526 | | | $ | (1,166,938 | ) | | $ | (1,674,671 | ) |
Net realized gain (loss) on: | | | | | | | | | | | | | | | | |
Investments | | | 7,541,214 | | | | (68,445,898 | ) | | | 38,727,297 | | | | (203,855,722 | ) |
Foreign currency related transactions | | | (5,571 | ) | | | 11,020 | | | | - | | | | - | |
Net increase (decrease) in unrealized appreciation or depreciation on: | | | | | | | | | | | | | | | | |
Investments | | | 16,088,093 | | | | 44,443,949 | | | | (4,510,727 | ) | | | 151,823,713 | |
| | | | | | | | | | | | | | | | |
Net increase (decrease) in net assets resulting from operations | | | 24,512,791 | | | | (22,686,403 | ) | | | 33,049,632 | | | | (53,706,680 | ) |
| | | | |
| DISTRIBUTIONS PAID TO SHAREHOLDERS: | | | | | | | | | | | | | | | | |
Net investment income: | | | | | | | | | | | | | | | | |
Investor Shares | | | (840,245 | ) | | | (2,058,250 | ) | | | - | | | | - | |
Net realized gains on investment transactions: | | | | | | | | | | | | | | | | |
Investor Shares | | | - | | | | - | | | | - | | | | - | |
Tax return of capital: | | | | | | | | | | | | | | | | |
Investor Shares | | | - | | | | - | | | | - | | | | (665,408 | ) |
| | | | | | | | | | | | | | | | |
Total distributions paid to shareholders | | | (840,245 | ) | | | (2,058,250 | ) | | | - | | | | (665,408 | ) |
| | | | |
| FUND SHARE ACTIVITIES: | | | | | | | | | | | | | | | | |
Net increase (decrease) in net assets resulting from fund share activities | | | 48,425,759 | | | | (24,429,047 | ) | | | (82,427,676 | ) | | | (95,759,005 | ) |
| | | | | | | | | | | | | | | | |
Total increase (decrease) in net assets | | | 72,098,305 | | | | (49,173,700 | ) | | | (49,378,044 | ) | | | (150,131,093 | ) |
| | | | | | | | | | | | | | | | |
Net assets, beginning of period | | | 181,109,975 | | | | 230,283,675 | | | | 436,995,712 | | | | 587,126,805 | |
| | | | | | | | | | | | | | | | |
Net assets, end of period | | $ | 253,208,280 | | | $ | 181,109,975 | | | $ | 387,617,668 | | | $ | 436,995,712 | |
| | | | | | | | | | | | | | | | |
| | | | |
Accumulated undistributed net investment
income (loss) | | $ | 387,072 | | | $ | 338,264 | | | $ | (1,185,426 | ) | | $ | (18,488 | ) |
| | | | | | | | | | | | | | | | |
The accompanying notes are an integral part of the financial statements.
70
ARTISAN FUNDS, INC.
Statements of Changes in Net Assets (Continued)
| | | | | | | | |
| | | SMALL CAP VALUE | |
| | | Six Months Ended
3/31/2010(1) | | | Year Ended
9/30/2009 | |
| OPERATIONS: | | | | | | | | |
Net investment income | | $ | 646,624 | | | $ | 2,997,650 | |
Net realized gain (loss) on: | | | | | | | | |
Investments | | | 91,307,132 | | | | (141,698,056 | ) |
Foreign currency related transactions | | | - | | | | (1,342 | ) |
Net increase in unrealized appreciation or depreciation on: | | | | | | | | |
Investments | | | 176,226,034 | | | | 158,604,198 | |
| | | | | | | | |
Net increase in net assets resulting from operations | | | 268,179,790 | | | | 19,902,450 | |
| | |
| DISTRIBUTIONS PAID TO SHAREHOLDERS: | | | | | | | | |
Net investment income: | | | | | | | | |
Investor Shares | | | (2,598,102 | ) | | | - | |
Net realized gains on investment transactions: | | | | | | | | |
Investor Shares | | | - | | | | (41,873,575 | ) |
| | | | | | | | |
Total distributions paid to shareholders | | | (2,598,102 | ) | | | (41,873,575 | ) |
| | |
| FUND SHARE ACTIVITIES: | | | | | | | | |
Net increase in net assets resulting from fund share activities | | | 151,471,534 | | | | 276,386,431 | |
| | | | | | | | |
Total increase in net assets | | | 417,053,222 | | | | 254,415,306 | |
| | | | | | | | |
Net assets, beginning of period | | | 2,156,495,298 | | | | 1,902,079,992 | |
| | | | | | | | |
Net assets, end of period | | $ | 2,573,548,520 | | | $ | 2,156,495,298 | |
| | | | | | | | |
| | |
Accumulated undistributed net investment income | | $ | 591,232 | | | $ | 2,542,709 | |
| | | | | | | | |
The accompanying notes are an integral part of the financial statements.
71
ARTISAN FUNDS, INC.
Financial Highlights – For a share outstanding throughout each period
The financial highlights table is intended to help you understand the Funds’ financial performance for the past 5 years or, if shorter, the period of a Fund’s operations. Certain information reflects financial results for a single Fund share. The total returns in the table represent the rate that an investor would have earned or lost on an investment in the Fund (assuming reinvestment of all dividends and distributions).
| | | | | | | | | | | | | | | | | | | | | | | | |
Year or
Period
Ended | | | Net Asset
Value
Beginning
of Period | | Net
Investment
Income
(Loss)(1) | | | Net Realized
and Unrealized
Gain (Loss) on
Investments | | | Total Income
(Loss) from
Investment
Operations | | | Dividends
from Net
Investment
Income | | | Distributions
from Net
Realized
Gains | |
| | | | | | | | | | | | | | | | | | | | | | | | |
ARTISAN GLOBAL EQUITY FUND | | | | | | | | | | | | | | | | | | | | |
| Investor Shares | | | | | | | | | | | | | | | | | | | | | | | | |
| 3/31/2010 | (5) | | $ | 10.00 | | $ | - | (6) | | $ | (0.02 | ) | | $ | (0.02 | ) | | $ | - | | | $ | - | |
| | | | | | | | | | | | | | | | | | | | | | | | |
ARTISAN GLOBAL VALUE FUND | | | | | | | | | | | | | | | | | | | | |
| Investor Shares | | | | | | | | | | | | | | | | | | | | | | | | |
| 3/31/2010 | (7) | | $ | 8.64 | | $ | 0.03 | | | $ | 0.78 | | | $ | 0.81 | | | $ | (0.20 | ) | | $ | - | |
| 9/30/2009 | | | | 8.32 | | | 0.08 | | | | 0.29 | | | | 0.37 | | | | (0.05 | ) | | | - | |
| 9/30/2008 | (8) | | | 10.00 | | | 0.10 | | | | (1.78 | ) | | | (1.68 | ) | | | - | | | | - | |
| | | | | | | | | | | | | | | | | | | | | | | | |
ARTISAN INTERNATIONAL FUND | | | | | | | | | | | | | | | | | | | | |
| Investor Shares | | | | | | | | | | | | | | | | | | | | | | | | |
| 3/31/2010 | (7) | | $ | 20.16 | | $ | (0.01 | ) | | $ | 0.24 | | | $ | 0.23 | | | $ | (0.25 | ) | | $ | - | |
| 9/30/2009 | | | | 20.34 | | | 0.23 | | | | 0.48 | | | | 0.71 | | | | (0.19 | ) | | | (0.70 | ) |
| 9/30/2008 | | | | 33.75 | | | 0.36 | | | | (9.10 | ) | | | (8.74 | ) | | | (0.20 | ) | | | (4.47 | ) |
| 9/30/2007 | | | | 28.75 | | | 0.31 | | | | 7.45 | | | | 7.76 | | | | (0.43 | ) | | | (2.33 | ) |
| 9/30/2006 | | | | 24.40 | | | 0.18 | | | | 4.58 | | | | 4.76 | | | | (0.41 | ) | | | - | |
| 9/30/2005 | | | | 19.33 | | | 0.21 | | | | 4.98 | | | | 5.19 | | | | (0.12 | ) | | | - | |
| | | | | | | | | | | | | | | | | | | | | | | | |
ARTISAN INTERNATIONAL SMALL CAP FUND | | | | | | | | | | | | | | | | | |
| Investor Shares | | | | | | | | | | | | | | | | | | | | | | | | |
| 3/31/2010 | (7) | | $ | 16.66 | | $ | (0.05 | ) | | $ | 0.56 | | | $ | 0.51 | | | $ | (0.12 | ) | | $ | - | |
| 9/30/2009 | | | | 14.28 | | | 0.12 | | | | 2.62 | | | | 2.74 | | | | (0.16 | ) | | | (0.20 | ) |
| 9/30/2008 | | | | 26.96 | | | 0.21 | | | | (9.26 | ) | | | (9.05 | ) | | | (0.20 | ) | | | (3.43 | ) |
| 9/30/2007 | | | | 22.77 | | | 0.11 | | | | 8.54 | | | | 8.65 | | | | (0.70 | ) | | | (3.76 | ) |
| 9/30/2006 | | | | 20.86 | | | 0.09 | | | | 3.90 | | | | 3.99 | | | | (0.20 | ) | | | (1.88 | ) |
| 9/30/2005 | | | | 16.40 | | | 0.19 | | | | 6.16 | | | | 6.35 | | | | (0.12 | ) | | | (1.77 | ) |
| (1) | Computed based on average shares outstanding. |
| (2) | Periods less than twelve months (where applicable) are not annualized. |
| (3) | Periods less than twelve months (where applicable) are annualized. |
| (4) | The ratios of expenses to average net assets and net investment income (loss) to average net assets exclude expenses waived or paid by the Adviser or the board of directors. Absent expenses waived or paid by the Adviser or the board of directors, the ratios of expenses to average net assets and net investment income (loss) to average net assets would have been as follows: |
| | | | | | | | |
| | | Year or
Period Ended | | Ratio of Expenses to
Average Net Assets | | | Ratio of Net Investment Income
(Loss) to Average Net Assets | |
Global Equity Investor Shares | | 3/31/2010 | | 14.43 | % | | (14.43 | )% |
Global Value Investor Shares | | 3/31/2010 | | 1.89 | % | | 0.19 | % |
| | 9/30/2009 | | 2.16 | % | | 0.45 | % |
| | 9/30/2008 | | 3.53 | % | | (0.70 | )% |
72
| | | | | | | | | | | | | | | | | | | | |
Total
Distributions | | | Net Asset
Value
End
of Period | | Total
Return(2) | | | Net Assets
End of
Period
(millions) | | Ratio of
Expenses
to Average
Net Assets(3)(4) | | | Ratio of Net
Investment
Income (Loss)
to Average
Net Assets(3)(4) | | | Portfolio
Turnover
Rate(2) | |
| | | | | | | | | | | | | | | | | | | | |
| | | | | | | | | | | | | | | | | | | | | |
| | | | | | | | | | | | | | | | | | | | | |
| $ | - | | | $ | 9.98 | | (0.30 | )% | | $ | 7.9 | | 1.50 | % | | (1.50 | )% | | 0.00 | % |
| | | | | | | | | | | | | | | | | | | | |
| | | | | | | | | | | | | | | | | | | | | |
| | | | | | | | | | | | | | | | | | | | | |
| $ | (0.20 | ) | | $ | 9.25 | | 9.56 | % | | $ | 32.5 | | 1.50 | % | | 0.58 | % | | 17.48 | % |
| | (0.05 | ) | | | 8.64 | | 4.65 | | | | 28.6 | | 1.50 | | | 1.11 | | | 56.57 | |
| | - | | | | 8.32 | | (16.80 | ) | | | 9.6 | | 1.44 | | | 1.39 | | | 42.27 | |
| | | | | | | | | | | | | | | | | | | | |
| | | | | | | | | | | | | | | | | | | | | |
| | | | | | | | | | | | | | | | | | | | | |
| $ | (0.25 | ) | | $ | 20.14 | | 1.11 | % | | $ | 7,898.5 | | 1.22 | % | | (0.06 | )% | | 36.53 | % |
| | (0.89 | ) | | | 20.16 | | 5.00 | | | | 7,715.1 | | 1.22 | | | 1.47 | | | 82.38 | |
| | (4.67 | ) | | | 20.34 | | (29.99 | ) | | | 8,760.0 | | 1.22 | | | 1.28 | | | 54.42 | |
| | (2.76 | ) | | | 33.75 | | 28.69 | | | | 12,810.0 | | 1.21 | | | 1.01 | | | 66.30 | |
| | (0.41 | ) | | | 28.75 | | 19.84 | | | | 9,801.9 | | 1.20 | | | 0.66 | | | 57.80 | |
| | (0.12 | ) | | | 24.40 | | 26.97 | | | | 7,686.9 | | 1.19 | | | 0.94 | | | 56.15 | |
| | | | | | | | | | | | | | | | | | | | | |
| | | | | | | | | | | | | | | | | | | | | |
| | | | | | | | | | | | | | | | | | | | | |
| $ | (0.12 | ) | | $ | 17.05 | | 3.05 | % | | $ | 789.3 | | 1.49 | % | | (0.58 | )% | | 34.17 | % |
| | (0.36 | ) | | | 16.66 | | 20.59 | | | | 695.8 | | 1.50 | | | 0.99 | | | 58.42 | |
| | (3.63 | ) | | | 14.28 | | (38.44 | ) | | | 732.4 | | 1.51 | | | 0.96 | | | 42.80 | |
| | (4.46 | ) | | | 26.96 | | 43.10 | | | | 1,356.0 | | 1.52 | | | 0.45 | | | 49.85 | |
| | (2.08 | ) | | | 22.77 | | 21.63 | | | | 939.8 | | 1.53 | | | 0.41 | | | 62.21 | |
| | (1.89 | ) | | | 20.86 | | 42.13 | | | | 781.1 | | 1.53 | | | 1.03 | | | 57.25 | |
| | (5) | Unaudited. For the period from commencement of operations (March 29, 2010) through March 31, 2010. |
| | (6) | Amount is between $0.005 and $(0.005) per share. |
| | (7) | Unaudited. For the six months ended March 31, 2010. |
| | (8) | For the period from commencement of operations (December 10, 2007) through September 30, 2008. |
The accompanying notes are an integral part of the financial statements.
73
ARTISAN FUNDS, INC.
Financial Highlights – For a share outstanding throughout each period (Continued)
| | | | | | | | | | | | | | | | | | | | | | | | |
Year or
Period
Ended | | |
Net Asset
Value
Beginning
of Period | | Net
Investment
Income
(Loss)(1) | | | Net Realized
and Unrealized
Gain (Loss) on
Investments | | | Total Income
(Loss) from
Investment
Operations | | | Dividends
from Net
Investment
Income | | | Distributions
from Net
Realized
Gains | |
| | | | | | | | | | | | | | | | | | | | | | | | |
ARTISAN INTERNATIONAL VALUE FUND | | | | | | | | | | | | | | | | | |
| Investor Shares | | | | | | | | | | | | | | | | | | | | | | | | |
| 3/31/2010 | (5) | | $ | 22.83 | | $ | 0.13 | | | $ | 1.52 | | | $ | 1.65 | | | $ | (0.42 | ) | | $ | - | |
| 9/30/2009 | | | | 21.20 | | | 0.17 | | | | 1.67 | | | | 1.84 | | | | (0.21 | ) | | | - | |
| 9/30/2008 | | | | 28.49 | | | 0.45 | | | | (5.56 | ) | | | (5.11 | ) | | | (0.51 | ) | | | (1.67 | ) |
| 9/30/2007 | | | | 26.71 | | | 0.38 | | | | 3.12 | | | | 3.50 | | | | (0.44 | ) | | | (1.28 | ) |
| 9/30/2006 | | | | 22.38 | | | 0.53 | | | | 4.87 | | | | 5.40 | | | | (0.47 | ) | | | (0.60 | ) |
| 9/30/2005 | | | | 18.54 | | | 0.28 | | | | 3.88 | | | | 4.16 | | | | (0.11 | ) | | | (0.21 | ) |
| | | | | | | | | | | | | | | | | | | | | | | | |
ARTISAN MID CAP FUND | | | | | | | | | | | | | | | | | | | | |
| Investor Shares | | | | | | | | | | | | | | | | | | | | | | | | |
| 3/31/2010 | (5) | | $ | 24.28 | | $ | (0.10 | ) | | $ | 3.03 | | | $ | 2.93 | | | $ | - | | | $ | - | |
| 9/30/2009 | | | | 24.08 | | | (0.11 | ) | | | 0.59 | | | | 0.48 | | | | - | | | | (0.28 | ) |
| 9/30/2008 | | | | 37.06 | | | (0.22 | ) | | | (6.86 | ) | | | (7.08 | ) | | | - | | | | (5.90 | ) |
| 9/30/2007 | | | | 31.77 | | | (0.24 | ) | | | 9.00 | | | | 8.76 | | | | - | | | | (3.47 | ) |
| 9/30/2006 | | | | 30.84 | | | (0.17 | ) | | | 2.43 | | | | 2.26 | | | | - | | | | (1.33 | ) |
| 9/30/2005 | | | | 26.13 | | | (0.18 | ) | | | 4.89 | | | | 4.71 | | | | - | | | | - | |
| | | | | | | | | | | | | | | | | | | | | | | | |
ARTISAN MID CAP VALUE FUND | | | | | | | | | | | | | | | | | | | | |
| Investor Shares | | | | | | | | | | | | | | | | | | | | | | | | |
| 3/31/2010 | (5) | | $ | 16.85 | | $ | 0.06 | | | $ | 1.71 | | | $ | 1.77 | | | $ | (0.07 | ) | | $ | - | |
| 9/30/2009 | | | | 17.01 | | | 0.08 | | | | (0.10 | ) | | | (0.02 | ) | | | (0.02 | ) | | | (0.12 | ) |
| 9/30/2008 | | | | 21.70 | | | 0.03 | | | | (2.31 | ) | | | (2.28 | ) | | | (0.08 | ) | | | (2.33 | ) |
| 9/30/2007 | | | | 19.87 | | | 0.09 | | | | 2.98 | | | | 3.07 | | | | (0.06 | ) | | | (1.18 | ) |
| 9/30/2006 | | | | 19.60 | | | 0.06 | | | | 1.04 | | | | 1.10 | | | | (0.01 | ) | | | (0.82 | ) |
| 9/30/2005 | | | | 15.55 | | | (0.01 | ) | | | 4.36 | | | | 4.35 | | | | - | (6) | | | (0.30 | ) |
| | | | | | | | | | | | | | | | | | | | | | | | |
ARTISAN OPPORTUNISTIC GROWTH FUND | | | | | | | | | |
| Investor Shares | | | | | | | | | | | | | | | | | | | | | | | | |
| 3/31/2010 | (5) | | $ | 9.14 | | $ | (0.05 | ) | | $ | 1.05 | | | $ | 1.00 | | | $ | - | | | $ | - | |
| 9/30/2009 | | | | 9.32 | | | (0.05 | ) | | | (0.13 | ) | | | (0.18 | ) | | | - | | | | - | |
| 9/30/2008 | (6) | | | 10.00 | | | - | (7) | | | (0.68 | ) | | | (0.68 | ) | | | - | | | | - | |
| (1) | Computed based on average shares outstanding. |
| (2) | Periods less than twelve months (where applicable) are not annualized. |
| (3) | Periods less than twelve months (where applicable) are annualized. |
| (4) | The ratios of expenses to average net assets and net investment income (loss) to average net assets exclude expenses waived or paid by the Adviser or the board of directors. Absent expenses waived or paid by the Adviser or the board of directors, the ratios of expenses to average net assets and net investment income (loss) to average net assets would have been as follows: |
| | | | | | | | |
| | | Year or
Period Ended | | Ratio of Expenses to
Average Net Assets | | | Ratio of Net Investment Income
(Loss) to Average Net Assets | |
Opportunistic Growth Investor Shares | | 3/31/2010 | | 1.55 | % | | (1.09 | )% |
| | 9/30/2009 | | 2.24 | % | | (1.36 | )% |
| | 9/30/2008 | | 48.41 | % | | (47.60 | )% |
74
| | | | | | | | | | | | | | | | | | | | |
Total
Distributions | | | Net Asset
Value
End
of Period | | Total
Return(2) | | | Net Assets
End of
Period
(millions) | | Ratio of
Expenses
to Average
Net Assets(3)(4) | | | Ratio of Net
Investment
Income (Loss)
to Average
Net Assets(3)(4) | | | Portfolio
Turnover
Rate(2) | |
| | | | | | | | | | | | | | | | | | | | |
| | | | | | | | | | | | | | | | | | | | | |
| | | | | | | | | | | | | | | | | | | | | |
| $ | (0.42 | ) | | $ | 24.06 | | 7.35 | % | | $ | 2,291.1 | | 1.20 | % | | 1.09 | % | | 10.57 | % |
| | (0.21 | ) | | | 22.83 | | 8.95 | | | | 1,739.5 | | 1.25 | | | 0.95 | | | 55.49 | |
| | (2.18 | ) | | | 21.20 | | (19.10 | ) | | | 1,029.4 | | 1.23 | | | 1.83 | | | 44.72 | |
| | (1.72 | ) | | | 28.49 | | 13.28 | | | | 1,594.7 | | 1.23 | | | 1.34 | | | 45.60 | |
| | (1.07 | ) | | | 26.71 | | 25.38 | | | | 1,312.6 | | 1.25 | | | 2.18 | | | 42.52 | |
| | (0.32 | ) | | | 22.38 | | 22.71 | | | | 601.2 | | 1.31 | | | 1.33 | | | 53.15 | |
| | | | | | | | | | | | | | | | | | | | |
| | | | | | | | | | | | | | | | | | | | | |
| | | | | | | | | | | | | | | | | | | | | |
| $ | - | | | $ | 27.21 | | 12.07 | % | | $ | 4,202.1 | | 1.21 | % | | (0.80 | )% | | 32.42 | % |
| | (0.28 | ) | | | 24.28 | | 2.47 | | | | 3,688.6 | | 1.23 | | | (0.57 | ) | | 68.39 | |
| | (5.90 | ) | | | 24.08 | | (22.47 | ) | | | 3,732.3 | | 1.24 | | | (0.75 | ) | | 79.76 | |
| | (3.47 | ) | | | 37.06 | | 29.83 | | | | 5,319.3 | | 1.22 | | | (0.73 | ) | | 71.04 | |
| | (1.33 | ) | | | 31.77 | | 7.42 | | | | 4,571.9 | | 1.18 | | | (0.55 | ) | | 73.59 | |
| | - | | | | 30.84 | | 18.06 | | | | 4,874.0 | | 1.18 | | | (0.63 | ) | | 83.00 | |
| | | | | | | | | | | | | | | | | | | | |
| | | | | | | | | | | | | | | | | | | | | |
| | | | | | | | | | | | | | | | | | | | | |
| $ | (0.07 | ) | | $ | 18.55 | | 10.50 | % | | $ | 5,778.3 | | 1.20 | % | | 0.74 | % | | 21.06 | % |
| | (0.14 | ) | | | 16.85 | | 0.21 | | | | 4,628.0 | | 1.21 | | | 0.62 | | | 53.84 | |
| | (2.41 | ) | | | 17.01 | | (11.16 | ) | | | 3,231.5 | | 1.21 | | | 0.18 | | | 69.77 | |
| | (1.24 | ) | | | 21.70 | | 15.88 | | | | 3,420.7 | | 1.20 | | | 0.41 | | | 53.62 | |
| | (0.83 | ) | | | 19.87 | | 5.87 | | | | 2,643.3 | | 1.20 | | | 0.33 | | | 47.73 | |
| | (0.30 | ) | | | 19.60 | | 28.42 | | | | 2,771.2 | | 1.22 | | | (0.04 | ) | | 51.60 | |
| | | | | | | | | | | | | | | | | | | | |
| | | | | | | | | | | | | | | | | | | | | |
| | | | | | | | | | | | | | | | | | | | | |
| $ | - | | | $ | 10.14 | | 10.94 | % | | $ | 64.1 | | 1.50 | % | | (1.04 | )% | | 39.58 | % |
| | - | | | | 9.14 | | (1.93 | ) | | | 45.6 | | 1.47 | | | (0.59 | ) | | 101.01 | |
| | - | | | | 9.32 | | (6.80 | ) | | | 5.7 | | 1.50 | | | (0.69 | ) | | 3.05 | |
| | (5) | Unaudited. For the six months ended March 31, 2010. |
| | (6) | For the period from commencement of operations (September 22, 2008) through September 30, 2008. |
| | (7) | Amount is between $0.005 and $(0.005) per share. |
The accompanying notes are an integral part of the financial statements.
75
ARTISAN FUNDS, INC.
Financial Highlights – For a share outstanding throughout each period (Continued)
| | | | | | | | | | | | | | | | | | | | | | | | | | | | |
Year or
Period
Ended | | |
Net Asset
Value
Beginning
of Period | | Net
Investment
Income
(Loss)(1) | | | Net Realized
and Unrealized
Gain (Loss) on
Investments | | | Total Income
(Loss) from
Investment
Operations | | | Dividends
from Net
Investment
Income | | | Distributions
from Net
Realized
Gains | | | Distributions
from Tax
Return of
Capital | |
| | | | | | | | | | | | | | | | | | | | | | | | | | | | |
ARTISAN OPPORTUNISTIC VALUE FUND | | | | | | | | | | | | | |
| Investor Shares | | | | | | | | | | | | | | | | | | | | | | | | | | | | |
| 3/31/2010 | (5) | | $ | 8.12 | | $ | 0.04 | | | $ | 0.97 | | | $ | 1.01 | | | $ | (0.04 | ) | | $ | - | | | | | |
| 9/30/2009 | | | | 8.58 | | | 0.06 | | | | (0.44 | ) | | | (0.38 | ) | | | (0.08 | ) | | | - | | | | | |
| 9/30/2008 | | | | 12.22 | | | 0.08 | | | | (2.70 | ) | | | (2.62 | ) | | | (0.14 | ) | | | (0.88 | ) | | | | |
| 9/30/2007 | | | | 10.41 | | | 0.20 | | | | 1.73 | | | | 1.93 | | | | (0.03 | ) | | | (0.09 | ) | | | | |
| 9/30/2006 | (6) | | | 10.00 | | | 0.03 | | | | 0.38 | | | | 0.41 | | | | - | | | | - | | | | | |
| | | | | | | | | | | | | | | | | | | | | | | | | | | | |
ARTISAN SMALL CAP FUND | | | | | | | | | | | | | | | | | | | | | |
| Investor Shares | | | | | | | | | | | | | | | | | | | | | | | | | | | | |
| 3/31/2010 | (5) | | $ | 12.88 | | $ | (0.04 | ) | | $ | 1.19 | | | $ | 1.15 | | | $ | - | | | $ | - | | | $ | - | |
| 9/30/2009 | | | | 13.13 | | | (0.05 | ) | | | (0.18 | ) | | | (0.23 | ) | | | - | | | | - | | | | (0.02 | ) |
| 9/30/2008 | | | | 19.89 | | | (0.09 | ) | | | (4.82 | ) | | | (4.91 | ) | | | - | | | | (1.85 | ) | | | - | |
| 9/30/2007 | | | | 17.51 | | | (0.13 | ) | | | 2.87 | | | | 2.74 | | | | - | | | | (0.36 | ) | | | - | |
| 9/30/2006 | | | | 17.95 | | | (0.13 | ) | | | 0.26 | | | | 0.13 | | | | - | | | | (0.57 | ) | | | - | |
| 9/30/2005 | | | | 15.12 | | | (0.13 | ) | | | 3.49 | | | | 3.36 | | | | - | | | | (0.53 | ) | | | - | |
| | | | | | | | | | | | | | | | | | | | | | | | | | | | |
ARTISAN SMALL CAP VALUE FUND | | | | | | | | | | | | | |
| Investor Shares | | | | | | | | | | | | | | | | | | | | | | | | | | | | |
| 3/31/2010 | (5) | | $ | 13.56 | | $ | - | (7) | | $ | 1.62 | | | $ | 1.62 | | | $ | (0.02 | ) | | $ | - | | | $ | - | |
| 9/30/2009 | | | | 13.93 | | | 0.02 | | | | (0.07 | ) | | | (0.05 | ) | | | - | | | | (0.32 | ) | | | - | |
| 9/30/2008 | | | | 18.13 | | | (0.02 | ) | | | (1.09 | ) | | | (1.11 | ) | | | - | | | | (3.09 | ) | | | - | |
| 9/30/2007 | | | | 19.17 | | | (0.01 | ) | | | 1.44 | | | | 1.43 | | | | - | | | | (2.47 | ) | | | - | |
| 9/30/2006 | | | | 19.51 | | | (0.02 | ) | | | 2.00 | | | | 1.98 | | | | - | | | | (2.32 | ) | | | - | |
| 9/30/2005 | | | | 17.63 | | | (0.03 | ) | | | 3.69 | | | | 3.66 | | | | - | | | | (1.78 | ) | | | - | |
| (1) | Computed based on average shares outstanding. |
| (2) | Periods less than twelve months (where applicable) are not annualized. |
| (3) | Periods less than twelve months (where applicable) are annualized. |
| (4) | The ratios of expenses to average net assets and net investment income (loss) to average net assets exclude expenses waived or paid by the Adviser or the board of directors. Absent expenses waived or paid by the Adviser or the board of directors, the ratios of expenses to average net assets and net investment income (loss) to average net assets would have been as follows: |
| | | | | | | | |
| | | Year or
Period Ended | | Ratio of Expenses to
Average Net Assets | | | Ratio of Net Investment Income
(Loss) to Average Net Assets | |
Opportunistic Value Investor Shares | | 9/30/2006 | | 1.64 | % | | 0.39 | % |
76
| | | | | | | | | | | | | | | | | | | | |
Total
Distributions | | | Net Asset
Value
End
of Period | | Total
Return(2) | | | Net Assets
End of
Period
(millions) | | Ratio of
Expenses
to Average
Net Assets(3)(4) | | | Ratio of Net
Investment
Income (Loss)
to Average
Net Assets(3)(4) | | | Portfolio
Turnover
Rate(2) | |
| | | | | | | | | | | | | | | | | | | | |
| | | | | | | | | | | | | | | | | | | | | |
| | | | | | | | | | | | | | | | | | | | | |
| $ | (0.04 | ) | | $ | 9.09 | | 12.41 | % | | $ | 253.2 | | 1.27 | % | | 0.85 | % | | 41.45 | % |
| | (0.08 | ) | | | 8.12 | | (4.10 | ) | | | 181.1 | | 1.32 | | | 0.84 | | | 85.44 | |
| | (1.02 | ) | | | 8.58 | | (22.88 | ) | | | 230.3 | | 1.23 | | | 0.77 | | | 99.24 | |
| | (0.12 | ) | | | 12.22 | | 18.65 | | | | 278.7 | | 1.24 | | | 1.71 | | | 50.79 | |
| | - | | | | 10.41 | | 4.10 | | | | 75.0 | | 1.49 | | | 0.55 | | | 34.07 | |
| | | | | | | | | | | | | | | | | | | | |
| | | | | | | | | | | | | | | | | | | | | |
| | | | | | | | | | | | | | | | | | | | | |
| $ | - | | | $ | 14.03 | | 8.93 | % | | $ | 387.6 | | 1.26 | % | | (0.59 | )% | | 29.29 | % |
| | (0.02 | ) | | | 12.88 | | (1.73 | ) | | | 437.0 | | 1.26 | | | (0.47 | ) | | 80.51 | |
| | (1.85 | ) | | | 13.13 | | (26.64 | ) | | | 587.1 | | 1.22 | | | (0.58 | ) | | 96.90 | |
| | (0.36 | ) | | | 19.89 | | 15.84 | | | | 1,151.5 | | 1.18 | | | (0.70 | ) | | 74.32 | |
| | (0.57 | ) | | | 17.51 | | 0.74 | | | | 1,263.8 | | 1.15 | | | (0.70 | ) | | 101.98 | |
| | (0.53 | ) | | | 17.95 | | 22.64 | | | | 1,103.3 | | 1.18 | | | (0.80 | ) | | 78.60 | |
| | | | | | | | | | | | | | | | | | | | |
| | | | | | | | | | | | | | | | | | | | | |
| | | | | | | | | | | | | | | | | | | | | |
| $ | (0.02 | ) | | $ | 15.16 | | 11.93 | % | | $ | 2,573.5 | | 1.21 | % | | 0.06 | % | | 19.16 | % |
| | (0.32 | ) | | | 13.56 | | 0.46 | | | | 2,156.5 | | 1.22 | | | 0.20 | | | 63.05 | |
| | (3.09 | ) | | | 13.93 | | (5.77 | ) | | | 1,902.1 | | 1.20 | | | (0.16 | ) | | 75.49 | |
| | (2.47 | ) | | | 18.13 | | 7.48 | | | | 2,151.2 | | 1.19 | | | (0.03 | ) | | 72.38 | |
| | (2.32 | ) | | | 19.17 | | 11.40 | | | | 2,039.5 | | 1.17 | | | (0.09 | ) | | 58.88 | |
| | (1.78 | ) | | | 19.51 | | 22.42 | | | | 1,720.9 | | 1.18 | | | (0.16 | ) | | 56.03 | |
| | (5) | Unaudited. For the six months ended March 31, 2010. |
| | (6) | For the period from commencement of operations (March 27, 2006) through September 30, 2006. |
| | (7) | Amount is between $0.005 and $(0.005) per share. |
The accompanying notes are an integral part of the financial statements.
77
ARTISAN FUNDS, INC.
Notes to Financial Statements – March 31, 2010 (Unaudited)
Artisan Funds, Inc. (“Artisan Funds”) was incorporated on January 5, 1995, as a Wisconsin corporation and is registered under the Investment Company Act of 1940, as amended. Artisan Funds is a series comprised of twelve open-end, diversified mutual funds. The following funds (each a “Fund” and collectively the “Funds”) are covered by this report:
| | |
| Fund Name | | Inception Date |
Artisan Global Equity Fund (“Global Equity Fund” or “Global Equity”) | | March 29, 2010 |
Artisan Global Value Fund (“Global Value Fund” or “Global Value”) | | December 10, 2007 |
Artisan International Fund (“International Fund” or “International”) | | December 28, 1995 |
Artisan International Small Cap Fund (“International Small Cap Fund” or “International Small Cap”) | | December 21, 2001 |
Artisan International Value Fund (“International Value Fund” or “International Value”) | | September 23, 2002 |
Artisan Mid Cap Fund (“Mid Cap Fund” or “Mid Cap”) | | June 27, 1997 |
Artisan Mid Cap Value Fund (“Mid Cap Value Fund” or “Mid Cap Value”) | | March 28, 2001 |
Artisan Opportunistic Growth Fund (“Opportunistic Growth Fund” or “Opportunistic Growth”) | | September 22, 2008 |
Artisan Opportunistic Value Fund (“Opportunistic Value Fund” or “Opportunistic Value”) | | March 27, 2006 |
Artisan Small Cap Fund (“Small Cap Fund” or “Small Cap”) | | March 28, 1995 |
Artisan Small Cap Value Fund (“Small Cap Value Fund” or “Small Cap Value”) | | September 29, 1997 |
Each Fund’s investment objective is to seek long-term capital growth. Each Fund has offered shares of capital stock of the class designated Investor Shares since the commencement of its operations. International Fund, International Value Fund and Mid Cap Fund began offering Institutional Shares on July 1, 1997, October 1, 2006 and July 1, 2000, respectively. Institutional Shares are sold to institutional investors meeting certain minimum investment requirements.
Each class of shares has equal rights with respect to portfolio assets and voting privileges. Each class has exclusive voting rights with respect to any matters involving only that class.
Income, expenses not specific to a particular class and realized and unrealized gains and losses were allocated daily to each class of shares based upon the relative net asset value of outstanding shares. Expenses attributable to a particular class of shares, such as transfer agency fees, shareholder communication expenses and registration fees, were allocated directly to that class.
Each Fund is managed by Artisan Partners Limited Partnership (the “Adviser”). The Adviser is wholly owned by Artisan Partners Holdings LP (“Artisan Holdings”). Artisan Global Equity Fund is subadvised by Artisan Partners UK LLP (“Artisan UK”). A wholly-owned subsidiary of Artisan Holdings is the founding member of Artisan UK.
Artisan Emerging Markets Fund, also a series of Artisan Funds, Inc., commenced operations on June 26, 2006 and has offered Institutional Shares since inception. It began offering Advisor shares on June 2, 2008. The financial statements of both classes of Artisan Emerging Markets Fund are presented in separate reports.
78
NOTES TO FINANCIAL STATEMENTS (UNAUDITED)
| (2) | Summary of significant accounting policies: |
The following is a summary of significant accounting policies of the Funds in effect during the period covered by the financial statements, which were in accordance with United States generally accepted accounting principles.
| (a) | Security valuation – The net asset value (“NAV”) of the shares of each class of each Fund was determined as of the close of regular session trading on the New York Stock Exchange (“NYSE”) (usually 4:00 p.m., Eastern Time) each day the NYSE was open for regular session trading. The NAV of each class of shares was determined by dividing the value of each Fund’s securities and other assets attributed to that class, less its liabilities attributed to that class, by the number of outstanding shares of that class of that Fund. |
| | In determining NAV, each equity security traded on a securities exchange, including the Nasdaq Stock Market and over-the-counter securities, was valued at the closing price as of the time of valuation on the exchange or market designated by the Fund’s accounting agent or pricing vendor as the principal exchange (the “principal exchange”). The closing price provided by the pricing vendor for a principal exchange may differ and may represent information such as last sales price, an official closing price, a closing auction price or other information, depending on exchange or market convention. Absent closing price information from the principal exchange as of the time of valuation, the security was valued using the closing price on another exchange on which the security traded (if such price is made available by the pricing vendor) or the most recent bid quotation on the principal exchange or, if not available, another exchange or in the over-the-counter market, except that securities listed on the London Stock Exchange were valued at the mean of the most recent bid and asked quotations as of the time of valuation. Short-term investments, other than repurchase agreements, maturing within sixty days from the valuation date were valued at amortized cost, which approximates market value. |
| | Securities for which prices were not readily available were valued by Artisan Funds’ valuation committee (the “valuation committee”) at a fair value determined in good faith under procedures established by and under the general supervision of Artisan Funds’ board of directors (the “board of directors”). A price was considered to be not readily available if, among other things, the valuation committee believed that the price determined as described in the preceding paragraph did not reflect a fair value of the security. |
| | Global Equity Fund, Global Value Fund, International Fund, International Small Cap Fund and International Value Fund generally invested a significant portion, and perhaps as much as substantially all, of their total assets in securities principally traded in markets outside the U.S. Opportunistic Growth Fund and Opportunistic Value Fund had the ability to invest, and did invest, in securities principally traded outside the U.S. The foreign markets in which the Funds invested were sometimes open on days when the NYSE was not open and the Funds did not calculate their NAVs, and sometimes were not open on days when the Funds did calculate their NAVs. Even on days on which both the foreign market and the NYSE were open, several hours may have passed between the time when trading in the foreign market closed and the time as of which the Funds calculate their NAVs. That was generally the case for markets in |
79
NOTES TO FINANCIAL STATEMENTS (UNAUDITED)
| | Europe, Asia, Australia and other far eastern markets; the regular closing time of foreign markets in North and South America was generally the same as the closing time of the NYSE and the time as of which the Funds calculated their NAVs. |
| | The valuation committee concluded that a price determined under the Funds’ valuation procedures was not readily available if, among other things, the valuation committee believed that the value of the security might have been materially affected by events occurring after the close of the market in which the security was principally traded but before the time for determination of NAV (“subsequent event”). A subsequent event might include a company-specific development (for example, announcement of a merger that is made after the close of the foreign market), a development that might affect an entire market or region (for example, imposition of foreign exchange controls by a foreign government), a potentially global development (such as a terrorist attack that may be expected to have an impact on investor expectations worldwide) or a significant change in one or more U.S. securities indexes. Artisan Funds monitored for subsequent events using several tools. An indication by any of those tools of a potential material change in the value of securities resulted in either a meeting of the valuation committee, which considered whether a subsequent event had occurred and whether local market closing prices continued to represent fair values for potentially affected non-U.S. securities, and/or a valuation based on information provided by a third party research service. This third party research service was used to assist in determining estimates of fair values for foreign securities. That service utilized statistical data based on historical performance of securities, markets and other data in developing factors used to estimate a fair value. |
| | Estimates of fair values utilized by the Funds as described above may differ from the value realized on the subsequent sale of those securities and from quoted or published prices for those securities. The differences may have been material to the NAV of the applicable Fund or to the information presented. |
| | Foreign stocks as an asset class may underperform U.S. stocks, and foreign stocks may be more volatile than U.S. stocks. Risks relating to investment in foreign securities (including, but not limited to, depositary receipts and participation certificates) include: currency exchange rate fluctuation; less available public information about the issuers of securities; less stringent regulatory standards; lack of uniform accounting, auditing and financial reporting standards; and country risks including less liquidity, high inflation rates, unfavorable economic practices and political instability. The risks of foreign investments are typically greater in emerging and less developed markets. |
| (b) | Fair value measurements – Under generally accepted accounting principles for fair value measurement, accounting standards clarify the definition of fair value for financial reporting, establish a framework for measuring fair value and require additional disclosures about the use of fair value measurements. In accordance with this standard, fair value is defined as the price that each Fund would receive upon selling an investment in an orderly transaction to an independent buyer in the principal or most advantageous market of the investment. The standard establishes a three-tier hierarchy to distinguish between (1) inputs that reflect the assumptions market participants would use in pricing an asset or liability developed based on the market data obtained from sources independent of the reporting entity (observable |
80
NOTES TO FINANCIAL STATEMENTS (UNAUDITED)
| | inputs) and (2) inputs that reflect the reporting entity’s own assumptions about the assumptions market participants would use in pricing an asset or liability developed based on the best information available in the circumstances (unobservable inputs) and to establish classification of fair value measurements for disclosure purposes. Various inputs are used in determining the value of the Funds’ investments. The three-tier hierarchy of inputs is summarized in three broad levels: |
| | • | | Level 1 – quoted prices in active markets for identical investments |
| | • | | Level 2 – other significant observable inputs (including but not limited to quoted prices for similar securities, interest rates, credit risks, etc.) |
| | • | | Level 3 – significant unobservable inputs (including the Funds’ own assumptions in determining the fair value of investments) |
| | The inputs or methodology used for valuing securities are not necessarily an indication of the risk or liquidity associated with investing in those securities. |
| | The following table summarizes each Fund’s investments, based on the inputs used to determine their fair values as of March 31, 2010: |
| | | | | | | | | | | |
| Fund | | Level 1 - Quoted
Prices | | Level 2 - Other Significant
Observable Inputs | | Level 3 - Significant
Unobservable Inputs | | Total |
Global Equity | | | | | | | | | | | |
Equity Securities(1) | | | | | | | | | | | |
Americas | | $ | 2,552,044 | | $ | - | | - | | $ | 2,552,044 |
Emerging Markets | | | 1,007,585 | | | 37,931 | | - | | | 1,045,516 |
Europe | | | 2,832,909 | | | - | | - | | | 2,832,909 |
Pacific Basin | | | 911,427 | | | - | | - | | | 911,427 |
Repurchase Agreements | | | - | | | 7,082,000 | | - | | | 7,082,000 |
Total | | $ | 7,303,965 | | $ | 7,119,931 | | - | | $ | 14,423,896 |
Global Value | | | | | | | | | | | |
Equity Securities(1) | | | | | | | | | | | |
Americas | | $ | 14,780,756 | | $ | - | | - | | $ | 14,780,756 |
Emerging Markets | | | - | | | - | | - | | | - |
Europe | | | 13,304,081 | | | 483,599 | | - | | | 13,787,680 |
Pacific Basin | | | 2,378,220 | | | - | | - | | | 2,378,220 |
Repurchase Agreements | | | - | | | 1,750,000 | | - | | | 1,750,000 |
Total | | $ | 30,463,057 | | $ | 2,233,599 | | - | | $ | 32,696,656 |
International | | | | | | | | | | | |
Equity Securities(1) | | | | | | | | | | | |
Americas | | $ | 751,464,191 | | $ | - | | - | | $ | 751,464,191 |
Emerging Markets | | | 1,317,290,822 | | | - | | - | | | 1,317,290,822 |
Europe | | | 6,722,712,543 | | | - | | - | | | 6,722,712,543 |
Pacific Basin | | | 1,446,024,909 | | | - | | - | | | 1,446,024,909 |
Repurchase Agreements | | | - | | | 102,820,000 | | - | | | 102,820,000 |
Total | | $ | 10,237,492,465 | | $ | 102,820,000 | | - | | $ | 10,340,312,465 |
81
NOTES TO FINANCIAL STATEMENTS (UNAUDITED)
| | | | | | | | | | | |
| Fund | | Level 1 - Quoted
Prices | | Level 2 - Other Significant
Observable Inputs | | Level 3 - Significant
Unobservable Inputs | | Total |
International Small Cap | | | | | | | | | | | |
Equity Securities(1) | | | | | | | | | | | |
Americas | | $ | 25,346,430 | | $ | - | | - | | $ | 25,346,430 |
Emerging Markets | | | 168,419,207 | | | 11,321,283 | | - | | | 179,740,490 |
Europe | | | 446,357,715 | | | - | | - | | | 446,357,715 |
Pacific Basin | | | 103,447,504 | | | - | | - | | | 103,447,504 |
Repurchase Agreements | | | - | | | 8,568,000 | | - | | | 8,568,000 |
Total | | $ | 743,570,856 | | $ | 19,889,283 | | - | | $ | 763,460,139 |
International Value | | | | | | | | | | | |
Equity Securities(1) | | | | | | | | | | | |
Americas | | $ | 387,929,981 | | $ | - | | - | | $ | 387,929,981 |
Emerging Markets | | | 16,492,682 | | | - | | - | | | 16,492,682 |
Europe | | | 1,774,267,419 | | | 64,270,765 | | - | | | 1,838,538,184 |
Pacific Basin | | | 325,915,788 | | | - | | - | | | 325,915,788 |
Repurchase Agreements | | | - | | | 186,854,000 | | - | | | 186,854,000 |
Total | | $ | 2,504,605,870 | | $ | 251,124,765 | | - | | $ | 2,755,730,635 |
Mid Cap | | | | | | | | | | | |
Equity Securities(1) | | $ | 4,588,011,799 | | | - | | - | | $ | 4,588,011,799 |
Repurchase Agreements | | | - | | $ | 113,520,000 | | - | | | 113,520,000 |
Total | | $ | 4,588,011,799 | | $ | 113,520,000 | | - | | $ | 4,701,531,799 |
Mid Cap Value | | | | | | | | | | | |
Equity Securities(1) | | $ | 5,463,357,340 | | $ | - | | - | | $ | 5,463,357,340 |
Repurchase Agreements | | | - | | | 279,329,000 | | - | | | 279,329,000 |
Total | | $ | 5,463,357,340 | | $ | 279,329,000 | | - | | $ | 5,742,686,340 |
Opportunistic Growth Fund | | | | | | | | | | | |
Equity Securities(1) | | $ | 60,250,506 | | | - | | - | | $ | 60,250,506 |
Repurchase Agreements | | | - | | $ | 3,906,000 | | - | | | 3,906,000 |
Total | | $ | 60,250,506 | | $ | 3,906,000 | | - | | $ | 64,156,506 |
Opportunistic Value Fund | | | | | | | | | | | |
Equity Securities(1) | | $ | 240,502,096 | | | - | | - | | $ | 240,502,096 |
Repurchase Agreements | | | - | | $ | 9,677,000 | | - | | | 9,677,000 |
Total | | $ | 240,502,096 | | $ | 9,677,000 | | - | | $ | 250,179,096 |
Small Cap Fund | | | | | | | | | | | |
Equity Securities(1) | | $ | 373,663,360 | | | - | | - | | $ | 373,663,360 |
Repurchase Agreements | | | - | | $ | 12,718,000 | | - | | | 12,718,000 |
Total | | $ | 373,663,360 | | $ | 12,718,000 | | - | | $ | 386,381,360 |
Small Cap Value Fund | | | | | | | | | | | |
Equity Securities (1) | | $ | 2,434,171,883 | | | - | | - | | $ | 2,434,171,883 |
Repurchase Agreements | | | - | | $ | 135,058,000 | | - | | | 135,058,000 |
Total | | $ | 2,434,171,883 | | $ | 135,058,000 | | - | | $ | 2,569,229,883 |
|
(1)See Fund’s Schedule of Investments for sector or country classifications. |
82
NOTES TO FINANCIAL STATEMENTS (UNAUDITED)
| (c) | Income taxes – No provision was made for federal income taxes or excise taxes since each Fund intends to (i) comply with the provisions of Subchapter M of the Internal Revenue Code applicable to regulated investment companies and (ii) distribute to its shareholders substantially all of its taxable income as well as net realized gains from the sale of investment securities. The Funds may utilize earnings and profits distributed to shareholders on redemptions of Fund shares as part of the dividends paid deduction. |
| | The Funds have analyzed the tax positions taken on federal income tax returns for all open tax years and have concluded that as of March 31, 2010, no provision for income tax is required in the Funds’ financial statements. The Funds’ federal and state income and federal excise tax returns for tax years for which the applicable statutes of limitations have not expired are subject to examination by the Internal Revenue Service and state department of revenue. |
| | The Funds may be subject to taxes on realized gains from the sale of investment securities imposed by certain countries in which the Funds invest. The foreign tax expense, if any, was recorded on an accrual basis and is included in “Payable for withholding taxes” on the accompanying Statements of Assets and Liabilities. |
| (d) | Portfolio transactions – In determining a Fund’s NAV, security transactions and shareholder transactions were accounted for no later than one business day after trade date, in accordance with applicable law. However, for financial reporting purposes, security transactions and shareholder transactions were recorded on trade date in accordance with United States generally accepted accounting principles. Net realized gains and losses on securities were computed on specific security lot identification. |
| (e) | Foreign currency translation – Values of foreign investments, open foreign currency forward contracts, payables for capital gains taxes and cash denominated in foreign currencies were translated into U.S. dollars using a spot market rate of exchange as of the time of determination of each Fund’s NAV on the day of valuation. Payables and receivables for securities transactions, dividend and reclaim receivables and other receivables and payables denominated in a foreign currency were translated into U.S. dollars using a spot market rate of exchange as of 12:00 p.m. (Eastern Time) on the day of valuation. Purchases and sales of investments and dividend and interest income were translated into U.S. dollars using a spot market rate of exchange as of 12:00 p.m. (Eastern Time) on the date of such transactions. The portion of security gains or losses resulting from changes in foreign exchange rates was included with net realized and unrealized gain or loss from investments, as appropriate, for both financial reporting and tax purposes. |
| | The Funds may enter into foreign currency forward contracts to hedge the foreign currency exposure on open payables and receivables. These foreign currency forward contracts, or spot contracts, generally settle within two business days. The Funds also may enter into foreign currency forward contracts to hedge against foreign currency exchange rate risks on its non-U.S. dollar denominated investment securities, although they generally do not do so. Foreign currency forward contracts were recorded at market value and any related realized and unrealized gains and losses were reported as foreign currency related transactions for financial reporting purposes. For tax purposes, these foreign exchange gains and losses were treated as ordinary income or loss. The Funds could be exposed to loss if the counterparties fail to perform under these contracts. |
83
NOTES TO FINANCIAL STATEMENTS (UNAUDITED)
| | Other foreign currency related transaction gains and losses may result from currency gains and losses realized from the difference between the amounts of dividends and foreign withholding taxes recorded on the Funds’ books and the U.S. dollar equivalent of the amounts actually received or paid. The net increase (decrease) in unrealized appreciation or depreciation on foreign currency related transactions arose from changes in the values of assets and liabilities, other than investments in securities, resulting from changes in foreign exchange rates. |
| (f) | Repurchase agreements – Each Fund may enter into repurchase agreements with institutions that the Adviser determined were creditworthy pursuant to criteria adopted by the board of directors. Repurchase agreements were recorded at cost plus accrued interest and were collateralized in an amount greater than or equal to the repurchase price plus accrued interest. Collateral (in the form of U.S. government securities) was held by the Funds’ custodian and in the event of default on the obligation of the counterparty to repurchase, the Funds had the right to liquidate the collateral and apply the proceeds in satisfaction of the obligation. If the proceeds from any sale of such collateral were less than the repurchase price, the Fund would have suffered a loss. |
| (g) | Depositary receipts – Each of the Funds may invest in depositary receipts. Depositary receipts are typically issued by a financial institution (a “depositary”), evidencing ownership interests in a security issued by an issuer and deposited with the depositary. |
| (h) | Securities lending – Each of the Funds may enter into securities lending transactions secured by collateral in the form of U.S. Government securities at least equal to, at all times, the fair value of the securities loaned. Any such collateral will be held in a custody account maintained by State Street Bank and Trust Company, the Funds’ custodian. When securities are on loan, the Fund does not receive dividends on the securities loaned, but receives compensation from the borrower in lieu of such dividends. Gain or loss in the fair value of the securities loaned that may occur during the term of the loan will be for the account of the applicable Fund. In entering into securities lending arrangements, the Fund takes the risk that the borrower may not provide additional collateral when required or return the securities when due or, if the borrower defaults, the Fund may experience delays in selling collateral or the collateral may not be sufficient to cover the value of securities lent. There were no securities on loan during the six months ended March 31, 2010. |
| (i) | Equity-linked participation certificates – Global Equity Fund, Global Value Fund, International Fund, International Small Cap Fund, International Value Fund, Opportunistic Growth Fund, and Opportunistic Value Fund may invest in equity-linked participation certificates. Equity-linked participation certificates are derivative securities which are designed to provide synthetic exposure to one or more underlying securities. An investment in an equity-linked participation certificate typically entitles the holder to a return equal to the market return of the underlying security or securities, subject to the credit risk of the issuing financial institution. |
| (j) | Transfer agent fees – Each Fund paid fees to, and reimbursed expenses of, the Funds’ transfer agent. In addition, the Funds have authorized certain financial services companies, broker-dealers, banks or other authorized agents, and in some cases, other organizations designated by an authorized agent (with their designees, collectively |
84
NOTES TO FINANCIAL STATEMENTS (UNAUDITED)
| | “authorized agents”) to accept purchase, exchange and redemption orders for Investor Shares on the Funds’ behalf. Many authorized agents charged a fee for accounting and shareholder services that the agent provided to Fund shareholders on the Fund’s behalf. Those services typically included recordkeeping, transaction processing for shareholders’ accounts and other services. The fee was either based on the number of accounts to which the intermediary provided such services, or was a percentage, as of March 31, 2010 up to 0.40% annually, of the average value of Fund shares held in such accounts. Each Fund paid a portion of such fees, which are intended to compensate the authorized agent for its provision of services of the type that would be provided by the Funds’ transfer agent or other service providers if the shares were registered on the books of the Funds’ transfer agent. The balance of the fees incurred was paid by the Adviser. The Funds’ expenses incurred for services provided by authorized agents were included in “Transfer agent fees” in the Statements of Operations. The table below shows the fees and expenses to the Funds’ transfer agent and the fees to authorized agents incurred by each class of each Fund during the six months ended March 31, 2010: |
| | | | | | | | | |
| | | Six Months Ended 3/31/10 |
| Fund | | Fees and Expenses
to Transfer Agent | | Fees to
Authorized
Agents | | Total |
Global Equity - Investor Shares(1) | | $ | 481 | | $ | 214 | | $ | 695 |
Global Value - Investor Shares | | | 28,039 | | | 32,070 | | | 60,109 |
International - Investor Shares | | | 296,710 | | | 8,091,670 | | | 8,388,380 |
International - Institutional Shares | | | 11,527 | | | - | | | 11,527 |
International Small Cap - Investor Shares | | | 37,571 | | | 506,951 | | | 544,522 |
International Value - Investor Shares | | | 61,163 | | | 1,858,283 | | | 1,919,446 |
International Value - Institutional Shares | | | 9,271 | | | - | | | 9,271 |
Mid Cap - Investor Shares | | | 74,108 | | | 4,640,427 | | | 4,714,535 |
Mid Cap - Institutional Shares | | | 9,177 | | | - | | | 9,177 |
Mid Cap Value - Investor Shares | | | 239,407 | | | 5,686,909 | | | 5,926,316 |
Opportunistic Growth - Investor Shares | | | 33,584 | | | 63,401 | | | 97,254 |
Opportunistic Value - Investor Shares | | | 39,680 | | | 250,217 | | | 289,897 |
Small Cap - Investor Shares | | | 51,262 | | | 320,156 | | | 371,418 |
Small Cap Value - Investor Shares | | | 45,536 | | | 2,528,464 | | | 2,574,000 |
|
(1)For the period of commencement of operations (March 29, 2010) through March 31, 2010. |
| (k) | Commission recapture – Each of the Funds had the ability to direct portfolio trades to various brokers that have agreed to rebate a portion of the commissions generated. Such cash rebates were made directly to the applicable Fund and were included in net realized gain or loss on investments in the Statements of Operations as follows: |
| | | |
Global Equity(1) | | $ | – |
Global Value | | | 89 |
International | | | – |
International Small Cap | | | 765 |
| | (1) | For the period of commencement of operations (March 29, 2010) through March 31, 2010. |
85
NOTES TO FINANCIAL STATEMENTS (UNAUDITED)
| | | |
International Value | | $ | 23,579 |
Mid Cap | | | 146,912 |
Mid Cap Value | | | 221,814 |
Opportunistic Growth | | | 3,931 |
Opportunistic Value | | | 12,730 |
Small Cap | | | 30,803 |
Small Cap Value | | | 97,402 |
| (l) | Use of estimates – The preparation of financial statements in conformity with United States generally accepted accounting principles requires management to make estimates and assumptions that affect the reported amounts and disclosures in the financial statements. Actual results could differ from those estimates. |
| (m) | Indemnifications – In the normal course of business, the Funds have entered into contracts in which the Funds agree to indemnify the other party or parties against various potential costs or liabilities. The Funds’ maximum exposure under these arrangements is unknown. No claim had been made for indemnification pursuant to any such agreement of the Funds. |
| (n) | Other – Dividend income less foreign taxes withheld, if any, was generally recorded on the ex-dividend date. In some cases, the information was not available to the Fund on the ex-dividend date. In such cases, which may have included private placements and foreign securities, dividends were recorded as soon after the ex-dividend date as reliable information became available to the Funds. Non-cash dividends included in dividend income, if any, were generally recorded at the fair market value of securities received. Interest income was reported on the accrual basis. Distributions to shareholders were recorded on the ex-dividend date. Expenses attributable to Artisan Funds were generally allocated to each Fund based on net assets. However, other expense allocation methodologies were used, depending on the nature of the expense item. Expenses attributable to a particular Fund or class were allocated directly to that Fund or class. |
| | The character of income and net realized gains and losses may differ in some instances for financial statement and tax purposes and may result in reclassification of permanent differences among certain capital accounts to more appropriately conform financial accounting to tax characterizations of dividend and capital gain distributions. |
| | Global Equity Fund, Global Value Fund, International Fund, International Small Cap Fund and International Value Fund generally imposed a 2% redemption fee on shares held 90 days or less. Those redemption fees were recorded as a reduction in the cost of shares redeemed and had the primary effect of increasing paid-in capital. Each Fund reserved the right to waive or reduce the 2% redemption fee on shares held 90 days or less at its discretion when the Fund believed such waiver was in the best interests of the Fund, including but not limited to when it determined that imposition of the redemption fee was not necessary to protect the Fund from the effects of short-term trading. The Funds waived the fee on redemption of shares held by certain authorized agents or other Fund intermediaries and otherwise in accordance with the Funds’ prospectus. |
86
NOTES TO FINANCIAL STATEMENTS (UNAUDITED)
| (3) | Transactions with affiliates: |
The Adviser, with which the officers and a director of Artisan Funds were affiliated, provided investment advisory and administrative services to the Funds. In exchange for those services, each Fund (with the exception of Global Equity Fund, Global Value Fund, International Fund, International Small Cap Fund, Opportunistic Growth Fund, and Opportunistic Value Fund) pays a monthly management fee to the Adviser as follows:
| | | |
Average Daily Net Assets | | Annual Rate | |
Less than $500 million | | 1.000 | % |
$500 million to $750 million | | 0.975 | |
$750 million to $1 billion | | 0.950 | |
Greater than $1 billion | | 0.925 | |
Global Equity Fund and Global Value Fund pay a monthly management fee to the Adviser as follows:
| | | |
Average Daily Net Assets | | Annual Rate | |
Less than $1 billion | | 1.000 | % |
$1 billion to $4 billion | | 0.975 | |
$4 billion to $8 billion | | 0.950 | |
$8 billion to $12 billion | | 0.925 | |
Greater than $12 billion | | 0.900 | |
International Fund pays a monthly management fee to the Adviser as follows:
| | | |
Average Daily Net Assets | | Annual Rate | |
Less than $500 million | | 1.000 | % |
$500 million to $750 million | | 0.975 | |
$750 million to $1 billion | | 0.950 | |
$1 billion to $12 billion | | 0.925 | |
Greater than $12 billion | | 0.900 | |
International Small Cap Fund pays a monthly management fee to the Adviser at an annual rate of 1.250% of average daily net assets.
Opportunistic Growth Fund and Opportunistic Value Fund pay a monthly management fee to the Adviser as follows:
| | | |
Average Daily Net Assets | | Annual Rate | |
Less than $1 billion | | 0.900 | % |
$1 billion to $4 billion | | 0.875 | |
$4 billion to $8 billion | | 0.850 | |
$8 billion to $12 billion | | 0.825 | |
Greater than $12 billion | | 0.800 | |
The Adviser has contractually agreed to waive its management fee, and to the extent that fee waiver is insufficient, to reimburse Global Equity Fund, Global Value Fund, and Opportunistic Growth Fund for any ordinary operating expenses in an amount sufficient to cause the Fund’s ordinary operating expenses, including the management fee, to be not more than 1.50% of average daily net assets, annually. For the period ended March 31, 2010, the Adviser paid operating expenses on behalf of Global Equity Fund, Global Value Fund, and Opportunistic Growth Fund. Global Equity Fund, Global Value Fund, and Opportunistic Growth Fund reimburse the Adviser annually for operating expenses paid on their behalf up
87
NOTES TO FINANCIAL STATEMENTS (UNAUDITED)
to 1.50% of average daily net assets, annually. The amount of operating expenses owed to the Adviser is included in payable for advisory fees and payable for operating expenses on the Statements of Assets and Liabilities for Global Equity Fund, Global Value Fund, and Opportunistic Growth Fund.
The officers and director of Artisan Funds who are affiliated with the Adviser receive no compensation from the Funds.
Prior to April 1, 2010, each director who was not an affiliated person of the Adviser received an annual retainer of $170,000, payable quarterly, as well as reimbursement of expenses related to his duties as a director of Artisan Funds. The amount of the annual retainer increases by $10,000 with each new series of Artisan Funds. In addition, the non-interested chair of the board of directors received an annual retainer of $60,000, payable quarterly, and each chair of a board committee who was a non-interested director received an annual retainer of $30,000, payable quarterly. Effective April 1, 2010, each director who was not an affiliated person of Artisan Funds or the Adviser received an annual retainer of $180,000, payable quarterly, due to the commencement of operations of Global Equity Fund. The other additional annual retainer fees were unchanged. These fees were generally allocated to each of the Artisan Funds based on net assets, subject to a minimum allocation of $1,500 to each Fund per quarter.
Artisan Funds has adopted a deferred compensation plan for directors who are not affiliated persons of the Adviser that enables directors to elect to defer receipt of all or a portion of the annual compensation they are entitled to receive from the Funds. For purposes of determining the amount owed to the directors under the plan, deferred amounts were invested in shares of Artisan Funds as selected by the individual directors. Each Fund purchased shares of Artisan Funds selected for deferral by the director in amounts equal to his investment, resulting in a Fund asset equal to the deferred compensation liability. Such assets were included as a component of “Other assets” on the Statement of Assets and Liabilities. Deferral of directors’ fees under the plan did not affect the net assets of the Funds, and did not materially affect the Funds’ assets, liabilities or net investment income per share. Amounts will be deferred until distributed in accordance with the plan.
Shares of Artisan Funds were offered for sale by Artisan Distributors LLC (“Distributors”). Distributors is wholly owned by Artisan Holdings. All distribution expenses relating to the Funds were paid by the Adviser.
| (4) | Line of credit arrangement: |
Artisan Funds is party to a line of credit agreement with State Street Bank and Trust Company (“SSB”), which expires in August 2010, under which each Fund may borrow up to the lesser of (a) $75 million or (b) the lesser of (i) 33 1/3% of its adjusted net assets, with adjusted net assets being total assets less liabilities and the value of any assets pledged to anyone other than SSB, (after giving effect to the loan) or (ii) the maximum amount the Fund may borrow under the Investment Company Act of 1940, the limitations included in the Fund’s prospectus, or any limit or restriction under any law or regulation to which the Fund was subject or any agreement to which the Fund or Artisan Funds is a party; provided that the aggregate borrowings by all Artisan Funds may not exceed $100 million. Artisan Funds paid a commitment fee at the annual rate of 0.15% on the unused portion of the line of credit and interest was charged on any borrowings at the current Federal Funds rate plus
88
NOTES TO FINANCIAL STATEMENTS (UNAUDITED)
1.25%. SSB has agreed to waive 0.05% of the commitment fee by reducing the Funds’ custody expenses until August 2010. The use of the line of credit was generally restricted to temporary borrowing for extraordinary or emergency purposes. During the six months ended March 31, 2010, there were no borrowings under the line of credit for Global Equity Fund, Global Value Fund, International Fund, International Small Cap Fund, International Value Fund, Mid Cap Fund, Mid Cap Value Fund, Opportunistic Growth Fund, Opportunistic Value Fund, or Small Cap Value Fund. During the six months ended March 31, 2010, Small Cap Fund paid interest of $1,555 on maximum borrowings of $6,680,325.
| (5) | Investment transactions: |
The cost of securities purchased and the proceeds from the sale of securities (excluding short-term securities) for the six months ended March 31, 2010 were as follows:
| | | | | | |
| Fund | | Security Purchases | | Security Sales |
Global Equity(1) | | $ | 7,357,526 | | $ | - |
Global Value | | | 5,762,392 | | | 4,982,209 |
International | | | 3,629,731,630 | | | 4,003,688,236 |
International Small Cap | | | 294,592,244 | | | 243,598,248 |
International Value | | | 813,576,243 | | | 226,483,794 |
Mid Cap | | | 1,411,976,448 | | | 1,335,292,380 |
Mid Cap Value | | | 1,746,464,182 | | | 1,014,610,854 |
Opportunistic Growth | | | 31,891,728 | | | 19,786,651 |
Opportunistic Value | | | 124,614,979 | | | 83,624,989 |
Small Cap | | | 109,348,814 | | | 187,583,604 |
Small Cap Value | | | 648,392,628 | | | 415,866,327 |
| (1) | For the period of commencement of operations (March 29, 2010) through March 31, 2010. |
| (6) | Transactions in securities of affiliates: |
The table below shows information about securities of the Funds’ “affiliates” (as defined below) that were held by the Funds, purchased or sold by the Funds, or from which dividends were received by the Funds during the six months ended March 31, 2010. The Funds identify a company as an affiliate for the purpose of this report if one or more of the Funds owned, in the aggregate, voting securities that it believed represented 5% or more of that company’s outstanding voting securities (as defined by the Investment Company Act of 1940) during the six months ended March 31, 2010.
| | | | | | | | | | | | | | | | | | | | | | |
| | | | | As of
9/30/09 | | | | | | | | | | | As of 3/31/10 |
| Fund | | Security | | Share
Balance | | Purchase
Cost | | Sales
Cost | | Net
Realized
Gain (Loss) | | | Dividend
Income(1) | | Share
Balance | | Value |
| Global Value | | Arch Capital Group Ltd.(2)(3) | | 13,901 | | $ | 28,796 | | $ | 34,134 | | $ | (25 | ) | | $ | - | | 13,821 | | $ | 1,053,851 |
| | | Total(4) | | | | $ | 28,796 | | $ | 34,134 | | $ | (25 | ) | | $ | - | | | | $ | 1,053,851 |
See notes on page 91.
89
NOTES TO FINANCIAL STATEMENTS (UNAUDITED)
| | | | | | | | | | | | | | | | | | | | | | |
| | | | | As of
9/30/09 | | | | | | | | | | | As of 3/31/10 |
| Fund | | Security | | Share
Balance | | Purchase
Cost | | Sales
Cost | | Net
Realized
Gain (Loss) | | | Dividend
Income(1) | | Share
Balance | | Value |
| International Value | | | | | | | | | | | | | | | | | | | | | | |
| | | Arch Capital Group Ltd.(2)(3) | | 1,276,234 | | $ | 15,503,884 | | $ | 2,666,744 | | $ | 70,505 | | | $ | - | | 1,465,031 | | $ | 111,708,614 |
| | | Total(4) | | | | $ | 15,503,884 | | $ | 2,666,744 | | $ | 70,505 | | | $ | - | | | | $ | 111,708,614 |
| Mid Cap | | | | | | | | | | | | | | | | | | | | | | |
| | | athenahealth, Inc.(2)(3) | | 833,900 | | $ | 38,205,101 | | $ | - | | $ | - | | | $ | - | | 1,772,200 | | $ | 64,791,632 |
| | | Total(4) | | | | $ | 38,205,101 | | $ | - | | $ | - | | | $ | - | | | | $ | 64,791,632 |
| Mid Cap Value | | | | | | | | | | | | | | | | | | | | | | |
| | | Acuity Brands, Inc. | | 2,418,315 | | $ | 10,981,976 | | $ | 23,680,220 | | $ | (745,631 | ) | | $ | 644,076 | | 2,169,215 | | $ | 91,562,565 |
| | | Alleghany Corporation(3) | | 475,576 | | | 8,070,608 | | | - | | | - | | | | - | | 516,402 | | | 150,169,562 |
| | | Arch Capital Group Ltd.(2)(3) | | 1,414,873 | | | 12,475,627 | | | - | | | - | | | | - | | 1,592,873 | | | 121,456,566 |
| | | Ingram Micro Inc., Class A(2)(3) | | 6,496,000 | | | 28,639,143 | | | - | | | - | | | | - | | 8,139,400 | | | 142,846,470 |
| | | Ryder System, Inc.(2) | | 1,844,300 | | | 11,566,423 | | | - | | | - | | | | 1,003,025 | | 2,141,400 | | | 83,000,664 |
| | | Total(4) | | | | $ | 71,733,777 | | $ | 23,680,220 | | $ | (745,631 | ) | | $ | 1,647,101 | | | | $ | 589,035,827 |
| Opportunistic Value | | | | | | | | | | | | | | | | | | | | | | |
| | | Arch Capital Group Ltd.(2)(3) | | 69,700 | | $ | 3,157,113 | | $ | - | | $ | - | | | $ | - | | 114,500 | | $ | 8,730,625 |
| | | Ingram Micro Inc., Class A(2)(3) | | 360,500 | | | 1,457,668 | | | - | | | - | | | | - | | 441,800 | | | 7,753,590 |
| | | Total(4) | | | | $ | 4,614,781 | | $ | - | | $ | - | | | $ | - | | | | $ | 16,484,215 |
| Small Cap | | | | | | | | | | | | | | | | | | | | | | |
| | | Astec Industries, Inc.(2)(3)(5) | | 140,900 | | $ | - | | $ | 3,705,424 | | $ | (176,209 | ) | | $ | - | | - | | $ | - |
| | | athenahealth, Inc.(2)(3) | | 110,800 | | | 4,974,841 | | | 1,106,111 | | | 82,892 | | | | - | | 212,300 | | | 7,761,688 |
| | | Total(4) | | | | $ | 4,974,841 | | $ | 4,811,535 | | $ | (93,317 | ) | | $ | - | | | | $ | 7,761,688 |
| Small Cap Value | | | | | | | | | | | | | | | | | | | | | | |
| | | Actel Corporation(2)(3) | | 1,305,900 | | $ | 5,847,682 | | $ | - | | $ | - | | | $ | - | | 1,810,400 | | $ | 25,074,040 |
| | | Acuity Brands, Inc. | | 897,200 | | | 1,266,748 | | | 8,720,434 | | | (1,120,748 | ) | | | 231,179 | | 748,000 | | | 31,573,080 |
| | | AMN Healthcare Services, Inc.(3) | | 2,231,300 | | | 1,804,614 | | | - | | | - | | | | - | | 2,438,900 | | | 21,462,320 |
| | | Astec Industries, Inc.(2)(3) | | 668,100 | | | 13,548,902 | | | - | | | - | | | | - | | 1,203,800 | | | 34,862,048 |
| | | Comfort Systems USA, Inc.(2) | | 1,700,600 | | | 9,012,718 | | | - | | | - | | | | 234,385 | | 2,481,900 | | | 30,998,931 |
| | | Cross Country Healthcare, Inc.(3) | | 2,147,700 | | | 1,769,407 | | | 2,530,715 | | | (1,081,373 | ) | | | - | | 2,199,100 | | | 22,232,901 |
| | | Diamond Management & Technology Consultants, Inc.(5) | | 1,658,000 | | | - | | | 7,666,858 | | | (1,061,012 | ) | | | 165,270 | | 771,600 | | | 6,057,060 |
| | | Hudson Highland Group, Inc.(2)(3)(5) | | 1,220,200 | | | 895,359 | | | - | | | - | | | | - | | 1,427,700 | | | 6,281,880 |
| | | Manhattan Associates, Inc.(3) | | 1,503,300 | | | 2,746,944 | | | 813,153 | | | (50,670 | ) | | | - | | 1,585,100 | | | 40,388,348 |
| | | Medical Staffing Network Holdings, Inc.(3)(5) | | 1,577,900 | | | - | | | 548,293 | | | (520,564 | ) | | | - | | 1,508,600 | | | 211,204 |
| | | Orbotech, Ltd.(3) | | 2,243,779 | | | 1,937,003 | | | - | | | - | | | | - | | 2,440,479 | | | 26,430,388 |
| | | Quanex Building Products Corporation(5) | | 2,030,475 | | | 1,522,225 | | | 10,766,941 | | | 73,421 | | | | 89,384 | | 1,473,975 | | | 24,364,807 |
| | | RadiSys Corporation(3) | | 1,294,500 | | | 2,705,816 | | | - | | | - | | | | - | | 1,614,600 | | | 14,466,816 |
See notes on page 91.
90
NOTES TO FINANCIAL STATEMENTS (UNAUDITED)
| | | | | | | | | | | | | | | | | | | | | | |
| | | | | As of
9/30/09 | | | | | | | | | | | As of 3/31/10 |
| Fund | | Security | | Share
Balance | | Purchase
Cost | | Sales
Cost | | Net
Realized
Gain (Loss) | | | Dividend
Income(1) | | Share
Balance | | Value |
| | | Rudolph Technologies, Inc.(3) | | 1,922,600 | | | 1,411,566 | | | - | | | - | | | | - | | 2,128,400 | | | 18,240,388 |
| | | Ryder System, Inc.(2) | | 482,500 | | | 10,524,237 | | | 2,586,873 | | | 1,551,781 | | | | 270,125 | | 687,200 | | | 26,635,872 |
| | | School Specialty, Inc.(2)(3) | | 851,600 | | | 17,224,467 | | | - | | | - | | | | - | | 1,613,600 | | | 36,644,856 |
| | | Seahawk Drilling, Inc.(2)(3) | | 366,100 | | | 10,313,737 | | | - | | | - | | | | - | | 806,500 | | | 15,202,525 |
| | | Stewart Information Services Corporation | | 1,120,678 | | | 432,975 | | | - | | | - | | | | 58,089 | | 1,161,778 | | | 16,032,536 |
| | | Ultra Clean Holdings, Inc.(3) | | 1,455,900 | | | 902,111 | | | - | | | - | | | | - | | 1,594,444 | | | 13,584,663 |
| | | Ultratech, Inc.(3) | | 1,434,300 | | | 4,072,127 | | | - | | | - | | | | - | | 1,736,200 | | | 23,612,320 |
| | | Total(4) | | | | $ | 87,938,638 | | $ | 33,633,267 | | $ | (2,209,165 | ) | | $ | 1,048,432 | | | | $ | 397,442,032 |
| (1) | Net of foreign taxes withheld, if any. |
| (2) | Issuer was not an affiliate as of September 30, 2009. |
| (3) | Non-income producing security. |
| (4) | Total value as of March 31, 2010 is presented for only those issuers that were affiliates as of March 31, 2010. |
| (5) | Issuer was no longer an affiliate as of March 31, 2010. |
| (7) | Information for Federal income tax purposes: |
For Federal income tax purposes, the cost of investments, gross unrealized appreciation, gross unrealized depreciation and net unrealized appreciation (depreciation) on investments as of March 31, 2010 were as follows:
| | | | | | | | | | | | | |
| Fund | | Cost of
Investments | | Gross Unrealized
Appreciation | | Gross
Unrealized
Depreciation | | | Net
Unrealized
Appreciation
(Depreciation)
on Investments |
Global Equity | | $ | 14,439,526 | | $ | 35,786 | | $ | (51,416) | | | $ | (15,630) |
Global Value | | | 26,579,006 | | | 6,302,597 | | | (184,947 | ) | | | 6,117,650 |
International | | | 9,007,443,552 | | | 1,623,414,514 | | | (290,545,601 | ) | | | 1,332,868,913 |
International Small Cap | | | 634,761,983 | | | 163,399,563 | | | (34,701,407 | ) | | | 128,698,156 |
International Value | | | 2,456,647,044 | | | 323,685,505 | | | (24,601,914 | ) | | | 299,083,591 |
Mid Cap | | | 3,566,976,802 | | | 1,209,502,280 | | | (74,947,283 | ) | | | 1,134,554,997 |
Mid Cap Value | | | 5,146,976,865 | | | 688,603,427 | | | (92,893,952 | ) | | | 595,709,475 |
Opportunistic Growth | | | 52,648,150 | | | 11,657,135 | | | (148,779 | ) | | | 11,508,356 |
Opportunistic Value | | | 229,226,001 | | | 24,116,218 | | | (3,163,123 | ) | | | 20,953,095 |
Small Cap | | | 295,299,102 | | | 98,270,650 | | | (7,188,392 | ) | | | 91,082,258 |
Small Cap Value | | | 2,378,496,023 | | | 351,424,998 | | | (160,691,138 | ) | | | 190,733,860 |
The difference between cost of investments for financial reporting and cost of investments for Federal income tax purposes was due primarily to timing differences in recognizing certain gains and losses on security transactions (e.g., wash sale loss deferrals and passive foreign investment company transactions).
91
NOTES TO FINANCIAL STATEMENTS (UNAUDITED)
The tax characterization of ordinary income dividends and long-term capital gain distributions paid during the six months ended March 31, 2010 and the year ended September 30, 2009 was as follows:
| | | | | | | | | | | | | | | |
| | | Six Months Ended 3/31/10 | | Year Ended 9/30/09 |
| Fund | | Ordinary
Income
Dividends | | Long-Term
Capital Gain
Distributions | | Ordinary
Income
Dividends | | Long-Term
Capital Gain
Distributions | | Tax Return of
Capital
Distributions |
Global Equity(1) | | $ | - | | $ | - | | | NA | | | NA | | | NA |
Global Value | | | 689,211 | | | - | | $ | 120,537 | | $ | - | | $ | - |
International | | | 129,087,749 | | | - | | | 168,596,974 | | | 318,081,129 | | | - |
International Small Cap | | | 4,971,337 | | | - | | | 8,262,565 | | | 6,812,109 | | | - |
International Value | | | 42,229,227 | | | - | | | 12,538,190 | | | - | | | - |
Mid Cap | | | - | | | - | | | - | | | 46,112,826 | | | - |
Mid Cap Value | | | 19,093,720 | | | - | | | 4,665,242 | | | 23,959,223 | | | - |
Opportunistic Growth | | | - | | | - | | | - | | | - | | | - |
Opportunistic Value | | | 840,245 | | | - | | | 2,058,250 | | | - | | | - |
Small Cap | | | - | | | - | | | - | | | - | | | 665,408 |
Small Cap Value | | | 2,598,102 | | | - | | | 19,312 | | | 41,854,263 | | | - |
| (1) | For the period of commencement of operations (March 29, 2010) through March 31, 2010. |
Ordinary income dividends and long-term capital gain distributions were determined in accordance with income tax regulations that may differ from U.S. generally accepted accounting principles. These differences were due to differing treatments for items such as net short-term gains, wash sale loss deferrals, passive foreign investment company transactions, foreign currency transactions, net investment losses and post-October losses. Gains on redemptions-in-kind for International Fund of $123,107,002 were included in net realized gain (loss) on investments in the Statement of Operations for the period ended March 31, 2010, and were not recognized for Federal income tax purposes.
Additional tax information as of and for the year ended September 30, 2009 follows:
| | | | | | | | | |
| | | Undistributed
Ordinary Income | | Undistributed
Long-Term Gain | | Post-October
Losses |
Global Value | | $ | 689,180 | | $ | - | | $ | 1,454,259 |
International | | | 129,070,165 | | | - | | | 1,743,954,947 |
International Small Cap | | | 4,969,618 | | | - | | | 91,175,656 |
International Value | | | 40,471,520 | | | - | | | 100,777,481 |
Mid Cap | | | - | | | - | | | 623,684,822 |
Mid Cap Value | | | 19,078,639 | | | - | | | 293,694,457 |
Opportunistic Growth | | | - | | | - | | | 388,671 |
Opportunistic Value | | | 341,609 | | | - | | | 58,295,184 |
Small Cap | | | - | | | - | | | 178,632,090 |
Small Cap Value | | | 2,582,903 | | | - | | | 107,261,562 |
92
NOTES TO FINANCIAL STATEMENTS (UNAUDITED)
As of September 30, 2009, the Funds had capital loss carryovers as follows:
| | | | | |
| | | Net Capital
Loss Carryover | | Expiration |
Global Value | | $ | 237,042 | | 2017 |
International | | | 846,687,411 | | 2017 |
International Small Cap | | | 42,384,176 | | 2017 |
International Value | | | 21,273,231 | | 2017 |
Mid Cap | | | 133,629,309 | | 2017 |
Mid Cap Value | | | 63,364,689 | | 2017 |
Opportunistic Growth | | | 199,888 | | 2017 |
Opportunistic Value | | | 35,503,974 | | 2017 |
Small Cap | | | 89,964,498 | | 2017 |
Small Cap Value | | | 22,928,816 | | 2017 |
93
NOTES TO FINANCIAL STATEMENTS (UNAUDITED)
| (8) | Fund share activities: |
Capital share transactions for the Funds were as follows:
| | | | | | | | | | | | | | | | | | | |
| | | GLOBAL
EQUITY | | GLOBAL
VALUE | | | INTERNATIONAL | | | INTERNATIONAL
SMALL CAP | |
Six Months ended March 31, 2010 | | Investor
Shares(1) | | Investor
Shares | | | Investor
Shares | | | Institutional
Shares | | | Investor
Shares | |
Proceeds from shares issued | | $ | 7,880,362 | | $ | 4,409,698 | | | $ | 1,037,740,753 | | | $ | 103,802,798 | | | $ | 146,936,574 | |
Net asset value of shares issued in reinvestment of dividends and distributions | | | - | | | 681,070 | | | | 85,906,490 | | | | 32,932,785 | | | | 4,715,018 | |
Cost of shares redeemed(2) | | | - | | | (3,352,704 | ) | | | (931,452,819 | ) | | | (585,731,040 | ) | | | (74,030,308 | ) |
| | | | | | | | | | | | | | | | | | | |
Net increase (decrease) from fund share transactions | | $ | 7,880,362 | | $ | 1,738,064 | | | $ | 192,194,424 | | | $ | (448,995,457 | ) | | $ | 77,621,284 | |
| | | | | | | | | | | | | | | | | | | |
| | | | | |
Shares sold | | | 788,087 | | | 496,086 | | | | 51,491,302 | | | | 5,174,340 | | | | 8,601,053 | |
Shares issued in reinvestment of dividends and distributions | | | - | | | 78,194 | | | | 4,233,932 | | | | 1,614,352 | | | | 280,489 | |
Shares redeemed | | | - | | | (377,660 | ) | | | (46,322,952 | ) | | | (29,485,317 | ) | | | (4,370,733 | ) |
| | | | | | | | | | | | | | | | | | | |
Net increase (decrease) in capital shares | | | 788,087 | | | 196,620 | | | | 9,402,282 | | | | (22,696,625 | ) | | | 4,510,809 | |
| | | | | | | | | | | | | | | | | | | |
| | | | |
| | | | | GLOBAL
VALUE | | | INTERNATIONAL | | | INTERNATIONAL
SMALL CAP | |
Year ended September 30, 2009 | | | | Investor
Shares | | | Investor
Shares | | | Institutional
Shares | | | Investor
Shares | |
Proceeds from shares issued | | | | | $ | 19,624,420 | | | $ | 1,592,516,571 | | | $ | 172,950,986 | | | $ | 176,434,127 | |
Net asset value of shares issued in reinvestment of dividends and distributions | | | | | | 119,040 | | | | 331,783,610 | | | | 136,080,351 | | | | 14,306,941 | |
Cost of shares redeemed(2) | | | | | | (5,362,265 | ) | | | (2,620,368,565 | ) | | | (433,419,290 | ) | | | (292,920,541 | ) |
| | | | | | | | | | | | | | | | | | | |
Net increase (decrease) from fund share transactions | | | | | $ | 14,381,195 | | | $ | (696,068,384 | ) | | $ | (124,387,953 | ) | | $ | (102,179,473 | ) |
| | | | | | | | | | | | | | | | | | | |
| | | | | |
Shares sold | | | | | | 2,913,263 | | | | 102,961,075 | | | | 11,471,176 | | | | 14,930,821 | |
Shares issued in reinvestment of dividends and distributions | | | | | | 17,454 | | | | 22,089,455 | | | | 9,017,916 | | | | 1,308,961 | |
Shares redeemed | | | | | | (767,349 | ) | | | (173,003,712 | ) | | | (25,335,842 | ) | | | (25,771,244 | ) |
| | | | | | | | | | | | | | | | | | | |
Net increase (decrease) in capital shares | | | | | | 2,163,368 | | | | (47,953,182 | ) | | | (4,846,750 | ) | | | (9,531,462 | ) |
| | | | | | | | | | | | | | | | | | | |
| (1) | For the period from commencement of operations (March 29, 2010) through March 31, 2010. |
| (2) | Net of redemption fees of: |
| | | | | | |
| Fund | | 3/31/2010 | | 9/30/2009 |
Global Value - Investor Shares | | $ | 2,275 | | $ | 9,174 |
International - Investor Shares | | | 217,212 | | | 940,168 |
International - Institutional Shares | | | 68,776 | | | 357,772 |
International Small Cap - Investor Shares | | | 14,751 | | | 84,469 |
94
NOTES TO FINANCIAL STATEMENTS (UNAUDITED)
| | | | | | | | | | | | | | | | | | | | |
| | | INTERNATIONAL VALUE | | | MID CAP | | | MID CAP
VALUE | |
Six Months ended March 31, 2010 | | Investor
Shares | | | Institutional
Shares | | | Investor
Shares | | | Institutional
Shares | | | Investor
Shares | |
Proceeds from shares issued | | $ | 583,014,527 | | | $ | 187,486,944 | | | $ | 470,150,921 | | | $ | 3,251,910 | | | $ | 1,093,501,110 | |
Net asset value of shares issued in reinvestment of dividends and distributions | | | 31,364,232 | | | | 5,318,821 | | | | - | | | | - | | | | 17,787,983 | |
Cost of shares redeemed(1) | | | (173,348,008 | ) | | | (6,105,831 | ) | | | (401,707,626 | ) | | | (20,978,336 | ) | | | (458,904,337 | ) |
| | | | | | | | | | | | | | | | | | | | |
Net increase (decrease) from fund share transactions | | $ | 441,030,751 | | | $ | 186,699,934 | | | $ | 68,443,295 | | | $ | (17,726,426 | ) | | $ | 652,384,756 | |
| | | | | | | | | | | | | | | | | | | | |
| | | | | |
Shares sold | | | 25,120,456 | | | | 8,066,804 | | | | 18,596,494 | | | | 126,721 | | | | 61,782,652 | |
Shares issued in reinvestment of dividends and distributions | | | 1,378,042 | | | | 233,794 | | | | - | | | | - | | | | 1,003,270 | |
Shares redeemed | | | (7,487,022 | ) | | | (262,767 | ) | | | (16,061,242 | ) | | | (800,348 | ) | | | (26,021,979 | ) |
| | | | | | | | | | | | | | | | | | | | |
Net increase (decrease) in capital shares | | | 19,011,476 | | | | 8,037,831 | | | | 2,535,252 | | | | (673,627 | ) | | | 36,763,943 | |
| | | | | | | | | | | | | | | | | | | | |
| | | |
| | | INTERNATIONAL VALUE | | | MID CAP | | | MID CAP
VALUE | |
Year ended September 30, 2009 | | Investor
Shares | | | Institutional
Shares | | | Investor
Shares | | | Institutional
Shares | | | Investor
Shares | |
Proceeds from shares issued | | $ | 998,478,418 | | | $ | 89,768,173 | | | $ | 736,881,835 | | | $ | 40,963,051 | | | $ | 2,001,278,772 | |
Net asset value of shares issued in reinvestment of dividends and distributions | | | 9,494,289 | | | | 1,837,654 | | | | 40,618,187 | | | | 5,181,307 | | | | 27,732,642 | |
Cost of shares redeemed(1) | | | (442,674,211 | ) | | | (22,279,861 | ) | | | (787,631,410 | ) | | | (121,601,275 | ) | | | (836,787,242 | ) |
| | | | | | | | | | | | | | | | | | | | |
Net increase (decrease) from fund share transactions | | $ | 565,298,496 | | | $ | 69,325,966 | | | $ | (10,131,388 | ) | | $ | (75,456,917 | ) | | $ | 1,192,224,172 | |
| | | | | | | | | | | | | | | | | | | | |
| | | | | |
Shares sold | | | 52,470,821 | | | | 4,662,123 | | | | 38,015,250 | | | | 2,178,933 | | | | 146,741,963 | |
Shares issued in reinvestment of dividends and distributions | | | 527,754 | | | | 102,319 | | | | 2,392,119 | | | | 297,093 | | | | 2,180,239 | |
Shares redeemed | | | (25,344,403 | ) | | | (1,262,697 | ) | | | (43,513,929 | ) | | | (6,036,669 | ) | | | (64,200,797 | ) |
| | | | | | | | | | | | | | | | | | | | |
Net increase (decrease) in capital shares | | | 27,654,172 | | | | 3,501,745 | | | | (3,106,560 | ) | | | (3,560,643 | ) | | | 84,721,405 | |
| | | | | | | | | | | | | | | | | | | | |
| (1) | Net of redemption fees of: |
| | | | | | |
| Fund | | 3/31/2010 | | 9/30/2009 |
International Value - Investor Shares | | $ | 124,861 | | $ | 604,391 |
International Value - Institutional Shares | | | 24,273 | | | 107,009 |
95
NOTES TO FINANCIAL STATEMENTS (UNAUDITED)
| | | | | | | | | | | | | | | | |
| | | OPPORTUNISTIC
GROWTH | | | OPPORTUNISTIC
VALUE | | | SMALL CAP | | | SMALL CAP
VALUE | |
Six Months ended March 31, 2010 | | Investor
Shares | | | Investor
Shares | | | Investor
Shares | | | Investor
Shares | |
Proceeds from shares issued | | $ | 19,651,603 | | | $ | 69,244,072 | | | $ | 54,968,500 | | | $ | 376,077,067 | |
Net asset value of shares issued in reinvestment of dividends and distributions | | | - | | | | 811,247 | | | | - | | | | 2,473,612 | |
Cost of shares redeemed(1) | | | (6,849,004 | ) | | | (21,629,560 | ) | | | (137,396,176 | ) | | | (227,079,145 | ) |
| | | | | | | | | | | | | | | | |
Net increase (decrease) from fund share transactions | | $ | 12,802,599 | | | $ | 48,425,759 | | | $ | (82,427,676 | ) | | $ | 151,471,534 | |
| | | | | | | | | | | | | | | | |
| | | | |
Shares sold | | | 2,073,228 | | | | 7,984,859 | | | | 4,106,857 | | | | 26,422,176 | |
Shares issued in reinvestment of dividends and distributions | | | - | | | | 94,772 | | | | - | | | | 176,813 | |
Shares redeemed | | | (732,915 | ) | | | (2,520,978 | ) | | | (10,412,580 | ) | | | (15,930,545 | ) |
| | | | | | | | | | | | | | | | |
Net increase (decrease) in capital shares | | | 1,340,313 | | | | 5,558,653 | | | | (6,305,723 | ) | | | 10,668,444 | |
| | | | | | | | | | | | | | | | |
| | | | |
| | | OPPORTUNISTIC
GROWTH | | | OPPORTUNISTIC
VALUE | | | SMALL CAP | | | SMALL CAP
VALUE | |
Year ended September 30, 2009 | | Investor
Shares | | | Investor
Shares | | | Investor
Shares | | | Investor
Shares | |
Proceeds from shares issued | | $ | 36,443,180 | | | $ | 77,642,687 | | | $ | 127,203,222 | | | $ | 663,675,871 | |
Net asset value of shares issued in reinvestment of dividends and distributions | | | - | | | | 2,040,180 | | | | 591,391 | | | | 41,643,045 | |
Cost of shares redeemed(1) | | | (3,386,957 | ) | | | (104,111,914 | ) | | | (223,553,618 | ) | | | (428,932,485 | ) |
| | | | | | | | | | | | | | | | |
Net increase (decrease) from fund share transactions | | $ | 33,056,223 | | | $ | (24,429,047 | ) | | $ | (95,759,005 | ) | | $ | 276,386,431 | |
| | | | | | | | | | | | | | | | |
| | | | |
Shares sold | | | 4,790,702 | | | | 11,576,435 | | | | 12,593,776 | | | | 60,531,651 | |
Shares issued in reinvestment of dividends and distributions | | | - | | | | 322,303 | | | | 63,659 | | | | 4,189,441 | |
Shares redeemed | | | (414,267 | ) | | | (16,422,436 | ) | | | (23,451,871 | ) | | | (42,194,212 | ) |
| | | | | | | | | | | | | | | | |
Net increase (decrease) in capital shares | | | 4,376,435 | | | | (4,523,698 | ) | | | (10,794,436 | ) | | | 22,526,880 | |
| | | | | | | | | | | | | | | | |
| (1) | Net of redemption fees of: |
| | | | | |
| Fund | | 3/31/2010 | | 9/30/2009 |
Opportunistic Growth - Investor Shares | | $ | 915 | | - |
The Funds have evaluated subsequent events through the issuance of the Funds’ financial statements and have determined there is no impact to the Funds’ financial statements.
96
SHAREHOLDER EXPENSE EXAMPLE
As a shareholder of Artisan Funds, you may incur transaction costs, including redemption fees, and you will incur ongoing costs, including management fees and other Fund expenses. This example is intended to help you understand your ongoing costs (in dollars) of investing in a Fund and to compare these costs with the ongoing costs of investing in other mutual funds.
The example is based on an investment of $1,000 invested at the beginning of the period and held for the entire period from October 1, 2009 to March 31, 2010.
Actual Expenses
The first line under the name of each Fund in the table below provides information about actual account values and actual expenses. You may use the information in this line, together with the amount you invested, to estimate the expenses that you paid over the period. Simply divide your account value by $1,000 (for example, an $8,600 account value divided by $1,000 = 8.6), then multiply the result by the number in the first line under the name of your Fund under the heading entitled “Expenses Paid During Period” to estimate the expenses you paid on your account during this period.
Hypothetical Example for Comparison Purposes
The second line below each Fund’s name in the table below provides information about hypothetical account values and hypothetical expenses based on each Fund’s actual expense ratio for the six months ended March 31, 2010 and an assumed rate of return of 5% per year before expenses, which is not the Fund’s actual return. The hypothetical account values and expenses may not be used to estimate the actual ending account balances or expenses you paid for the period. You may use this information to compare the ongoing costs of investing in each Fund and other funds. To do so, compare the 5% hypothetical example with the 5% hypothetical examples that appear in the shareholder reports of the other funds.
Please note that the expenses shown in the table are meant to highlight your ongoing costs only and do not reflect any transactional costs, such as redemption fees. Therefore, the second line of the table is useful in comparing ongoing costs only, and will not help you determine the relative costs of owning different funds. If these transactional costs were included, your costs would have been higher.
| | | | | | | | | |
| | | Beginning
Account Value
10/1/2009 | | Ending
Account Value
3/31/2010 | | Expenses Paid During
Period
10/1/2009-3/31/2010(1) |
Artisan Global Equity Fund - Investor Shares(2) | | | | | | | | | |
Actual | | $ | 1,000.00 | | $ | 997.00 | | $ | 0.12 |
Hypothetical (5% return before expenses) | | $ | 1,000.00 | | $ | 1,017.45 | | $ | 0.12 |
Artisan Global Value Fund - Investor Shares | | | | | | | | | |
Actual | | $ | 1,000.00 | | $ | 1,095.60 | | $ | 7.84 |
Hypothetical (5% return before expenses) | | $ | 1,000.00 | | $ | 1,017.45 | | $ | 7.54 |
Artisan International Fund - Investor Shares | | | | | | | | | |
Actual | | $ | 1,000.00 | | $ | 1,011.10 | | $ | 6.12 |
Hypothetical (5% return before expenses) | | $ | 1,000.00 | | $ | 1,018.85 | | $ | 6.14 |
See notes on page 99.
97
SHAREHOLDER EXPENSE EXAMPLE
| | | | | | | | | |
| | | Beginning
Account Value
10/1/2009 | | Ending
Account Value
3/31/2010 | | Expenses Paid During
Period
10/1/2009-3/31/2010(1) |
Artisan International Small Cap Fund - Investor Shares | | | | | | | | | |
Actual | | $ | 1,000.00 | | $ | 1,030.50 | | $ | 7.54 |
Hypothetical (5% return before expenses) | | $ | 1,000.00 | | $ | 1,017.50 | | $ | 7.49 |
Artisan International Value Fund - Investor Shares | | | | | | | | | |
Actual | | $ | 1,000.00 | | $ | 1,073.50 | | $ | 6.20 |
Hypothetical (5% return before expenses) | | $ | 1,000.00 | | $ | 1,018.95 | | $ | 6.04 |
Artisan Mid Cap Fund - Investor Shares | | | | | | | | | |
Actual | | $ | 1,000.00 | | $ | 1,120.70 | | $ | 6.40 |
Hypothetical (5% return before expenses) | | $ | 1,000.00 | | $ | 1,018.90 | | $ | 6.09 |
Artisan Mid Cap Value Fund - Investor Shares | | | | | | | | | |
Actual | | $ | 1,000.00 | | $ | 1,105.00 | | $ | 6.30 |
Hypothetical (5% return before expenses) | | $ | 1,000.00 | | $ | 1,018.95 | | $ | 6.04 |
Artisan Opportunistic Growth Fund - Investor Shares | | | | | | | | | |
Actual | | $ | 1,000.00 | | $ | 1,109.40 | | $ | 7.89 |
Hypothetical (5% return before expenses) | | $ | 1,000.00 | | $ | 1,017.45 | | $ | 7.54 |
Artisan Opportunistic Value Fund - Investor Shares | | | | | | | | | |
Actual | | $ | 1,000.00 | | $ | 1,124.10 | | $ | 6.73 |
Hypothetical (5% return before expenses) | | $ | 1,000.00 | | $ | 1,018.60 | | $ | 6.39 |
Artisan Small Cap Fund - Investor Shares | | | | | | | | | |
Actual | | $ | 1,000.00 | | $ | 1,089.30 | | $ | 6.56 |
Hypothetical (5% return before expenses) | | $ | 1,000.00 | | $ | 1,018.65 | | $ | 6.34 |
Artisan Small Cap Value Fund - Investor Shares | | | | | | | | | |
Actual | | $ | 1,000.00 | | $ | 1,119.30 | | $ | 6.39 |
Hypothetical (5% return before expenses) | | $ | 1,000.00 | | $ | 1,018.90 | | $ | 6.09 |
See notes on page 99.
98
SHAREHOLDER EXPENSE EXAMPLE
| (1) | Expenses are equal to the Fund’s ratio of expenses to average net assets for the six-month period ended March 31, 2010 (shown below), multiplied by the average account value over the period, multiplied by 182/365 (to reflect the one-half year period). |
| | |
| Fund | | Annualized Ratio of Expenses to Average
Net Assets for the Six-Month
Period Ended March 31, 2010 |
Artisan Global Equity Fund - Investor Shares(a)(b) | | 1.50% |
Artisan Global Value Fund - Investor Shares(b) | | 1.50% |
Artisan International Fund - Investor Shares | | 1.22% |
Artisan International Small Cap Fund - Investor Shares | | 1.49% |
Artisan International Value Fund - Investor Shares | | 1.20% |
Artisan Mid Cap Fund - Investor Shares | | 1.21% |
Artisan Mid Cap Value Fund - Investor Shares | | 1.20% |
Artisan Opportunistic Growth Fund - Investor Shares(b) | | 1.50% |
Artisan Opportunistic Value Fund - Investor Shares | | 1.27% |
Artisan Small Cap Fund - Investor Shares | | 1.26% |
Artisan Small Cap Value Fund - Investor Shares | | 1.21% |
| | (a) | For the period from commencement of operations (March 29, 2010) through March 31, 2010. |
| | (b) | The annualized ratio of expenses to average net assets excludes expenses waived or paid by the Adviser. |
| (2) | The account value and the expenses paid for Global Equity Fund have been presented for the period from commencement of operations (March 29, 2010) through March 31, 2010. Assuming a six month period, the actual account value as of March 31, 2010 and the expenses paid during period 10/1/2009- 3/31/2010 would have been as follows: |
| | | | | | | | | |
| | | Beginning
Account Value
10/1/2009 | | Ending
Account Value
3/31/2010 | | Expenses Paid During
Period
10/1/09-3/31/10 |
Artisan Global Equity Fund - Investor Shares | | | | | | | | | |
Actual | | $ | 1,000.00 | | $ | 997.00 | | $ | 7.47 |
Hypothetical (5% return before expenses) | | $ | 1,000.00 | | $ | 1,017.45 | | $ | 7.54 |
99
FACTORS CONSIDERED IN RENEWING THE FUNDS’ ADVISORY AGREEMENTS
Artisan Partners Limited Partnership (“Artisan Partners”) is responsible for management of the Funds’ investment portfolios and for overall management of the Funds’ business and affairs pursuant to investment advisory agreements dated May 10, 2006 (Emerging Markets Fund); August 9, 2007 (Global Value Fund); December 28, 1995, as amended November 17, 2005 (International Fund); November 7, 2001 (International Small Cap Fund); August 9, 2002 (International Value Fund); April 10, 1997 (Mid Cap Fund); January 25, 2001 (Mid Cap Value Fund); May 15, 2008 (Opportunistic Growth Fund); February 9, 2006 (Opportunistic Value Fund); March 27, 1995 (Small Cap Fund); and August 20, 1997 (Small Cap Value Fund) (each, an “Advisory Agreement” and together, the “Advisory Agreements”). Artisan Partners, a Delaware limited partnership, is managed by its general partner, Artisan Investments GP LLC, a Delaware limited liability company wholly-owned by Artisan Partners Holdings LP (“Artisan Partners Holdings”). Artisan Partners Holdings is a limited partnership organized under the laws of Delaware whose sole general partner is Artisan Investment Corporation, a Wisconsin corporation. Artisan Partners was founded in March 2009 and succeeded to the investment management business of Artisan Partners Holdings during 2009. Artisan Partners Holdings was founded in December 1994 and began providing investment management services in March 1995. The principal address of Artisan Partners is 875 E. Wisconsin Avenue, Suite 800, Milwaukee, Wisconsin 53202.
The Advisory Agreement for each Fund may be continued from year to year only so long as the continuance is approved annually (a) by the vote of a majority of the directors of Artisan Funds who are not “interested persons” of Artisan Funds or Artisan Partners cast in person at a meeting called for the purpose of voting on such approval, and (b) by the board of directors or by the vote of a majority (as defined in the 1940 Act) of the outstanding shares of the Fund. Each Advisory Agreement provides that Artisan Partners shall not be liable for any loss suffered by a Fund or its shareholders as a consequence of any act or omission in connection with investment advisory or portfolio services under the Advisory Agreement, except by reason of willful misfeasance, bad faith, or gross negligence on the part of Artisan Partners in the performance of its duties or from reckless disregard by Artisan Partners of its obligations and duties under the Advisory Agreement. Each Advisory Agreement will terminate automatically in the event of its assignment (as defined in the 1940 Act).
The directors of Artisan Funds held a special meeting of the board on October 29, 2009 (the “Special Meeting”), at which meeting they gave preliminary consideration to information bearing on the continuation of each Advisory Agreement for the period from December 1, 2009 through November 30, 2010. The primary purpose of the Special Meeting was to ensure that the directors had ample opportunity to consider matters they deemed relevant in considering the continuation of the Advisory Agreements, and to request any additional information they considered reasonably necessary to their deliberations, without undue time constraints.
Prior to the Special Meeting, independent counsel to the independent directors sent to Artisan Partners a request for information to be provided to the directors in connection with their consideration of the continuation of the Advisory Agreements. Artisan Partners provided materials to the directors in response to that request, other information Artisan Partners believed was useful in evaluating the continuation of the Advisory Agreements and extensive reports prepared by Lipper Inc. (“Lipper”), an independent source of investment company data, relating to each Fund’s performance and expenses compared to the
100
FACTORS CONSIDERED IN RENEWING THE FUNDS’ ADVISORY AGREEMENTS
performance and expenses of a relatively small peer group and a larger peer universe of funds determined by Lipper to be comparable. Artisan Partners also provided additional reports prepared by Lipper comparing certain of the Funds’ performance and expenses to peer groups and peer universes with a different style classification that Artisan Partners believed was more appropriate for comparative purposes than the style classification originally selected by Lipper. The directors also received and reviewed a memorandum from their independent counsel regarding the directors’ responsibilities in evaluating the Funds’ Advisory Agreements.
In evaluating the Advisory Agreements, the directors reviewed the available information and discussed with representatives of Artisan Partners each Fund’s operations, the nature, extent and quality of the advisory and other services provided by Artisan Partners to the Funds, the overall expense ratios of each class of shares of the Funds, and economies of scale and other benefits derived by Artisan Partners from its relationship with the Funds. In addition to the third party reports by Lipper and the memorandum from independent counsel, the directors reviewed information provided prior to and presented at the Special Meeting concerning the following:
| • | | Artisan Partners’ personnel and methods, including: Artisan Partners’ assessment of its ability to attract and retain capable research, advisory and administrative personnel through compensation programs and equity participation and Artisan Partners’ assessment of recent hiring and retention experience; the compensation of Artisan Partners’ personnel with primary responsibility for managing the Funds; the time and attention of Artisan Partners’ investment personnel devoted to the Funds; Artisan Partners’ research and decision-making processes, including methods adopted to ensure compliance with investment objectives, policies and restrictions of the portfolios of the Funds; the policies relating to the assignment of Artisan Partners’ personnel to the various Funds’ portfolios; the adequacy and sophistication of Artisan Partners’ technology and systems with respect to investment and administrative matters; and the education, experience and number of Artisan Partners’ advisory personnel; |
| • | | The terms of each Advisory Agreement, including: a list of services performed by Artisan Partners; how the services performed by Artisan Partners under each Advisory Agreement differ from: (a) the services performed by Artisan Partners under other advisory agreements with registered investment companies or other accounts, and (b) the services typically performed by an investment adviser for registered investment companies and other accounts; Artisan Partners’ responsibility for making investment decisions and for observing investment objectives, policies, and restrictions; Artisan Partners’ standard of care; and termination provisions; |
| • | | Each Fund’s short- and long-term investment performance, including comparisons for various time periods with (a) other Artisan Partners client accounts managed in the same investment strategy, (b) other mutual funds having similar investment objectives, and (c) appropriate market indices; |
| • | | Litigation pending, threatened or settled involving Artisan Partners, and the results of any audits, investigations or examinations of the Securities and Exchange Commission (the “SEC”); |
| • | | Information regarding fee arrangements, including: a comparison of the Funds’ total expenses and total expense ratios with other mutual funds (taking into account factors |
101
FACTORS CONSIDERED IN RENEWING THE FUNDS’ ADVISORY AGREEMENTS
| | bearing on comparability, such as size, account-level charges, and investment objective); the structure of the advisory fees, including the method of computing fees and the frequency of payment of fees; a comparison of the advisory fees charged by Artisan Partners to the Funds with the advisory fees charged by other advisory organizations for managing mutual funds and other accounts, especially funds and accounts having similar investment goals and providing similar service; voluntary or contractual advisory fee limitations or reductions and relationship of fees to any fee limitation; the possible cost savings by Artisan Partners, incentives to effect savings, and sharing of savings with the Funds; any economies of scale as reflected in the basic advisory fees and any sliding scale reflecting increased size; a comparison of the fees charged by Artisan Partners to the Funds with the fees charged by Artisan Partners for managing other accounts including other mutual funds to which Artisan Partners provides sub-advisory services, with similar investment goals, including an explanation of any material differences, as well as any differences attributable to variations in service levels; information regarding other expenses, including expenses incurred by each of: (a) Artisan Partners, as adviser and administrator, (b) Artisan Distributors LLC, as the principal underwriter and (c) the Funds; custodian, shareholder servicing and transfer agent fees; and information regarding payments to financial intermediaries; |
| • | | Potential “fall-out” benefits gained by Artisan Partners or its affiliates from its relationship with the Funds, in addition to the advisory fees, including receipt of research paid for with commissions and the benefits to Artisan Partners in attracting and retaining other clients; and the method of estimating other benefits; |
| • | | Brokerage and portfolio transactions, including: the standards and performance in seeking best execution, commissions paid, including commissions by purpose; allocation of brokerage for research and other services (“soft dollars”); Artisan Partners’ practices in light of SEC guidance under Section 28(e) of the Securities Exchange Act of 1934; research purchased with Artisan Partners’ cash; research available for purchase by cash; the execution of portfolio transactions through brokers who sell the Funds’ shares and steps taken to comply with Rule 12b-1(h) under the 1940 Act; and portfolio turnover rates; |
| • | | Artisan Partners’ financial condition and stability and financial arrangements between Artisan Partners and its parent organization; |
| • | | The profitability to Artisan Partners of its relationship with each Fund, including: unaudited schedules showing Artisan Partners’ revenue, expenses and profits in providing services to the Funds on a Fund-by-Fund basis; the assumptions and allocation methodologies utilized for profitability analysis; Artisan Partners’ profit margins; and comparisons with Artisan Partners’ profit margins on other accounts managed by Artisan Partners; and |
| • | | Potential conflicts of interest between the Funds and Artisan Partners and circumstances and actions addressing or bearing on potential conflicts of interest, including: the type and number of other clients served by Artisan Partners; the basis of sharing personnel, services, research and advice among clients; the basis of decisions to buy or sell securities for the Funds and other clients where the same security might be bought or sold for a number of clients; the basis of allocating purchases and sales of the same security, including initial public offerings, among the Funds and other clients of Artisan Partners; the possible advantages, including economies of scale, and disadvantages in having an investment |
102
FACTORS CONSIDERED IN RENEWING THE FUNDS’ ADVISORY AGREEMENTS
| | adviser that has other clients; Artisan Partners’ investments on its own behalf and possible conflicts with the Funds; Artisan Partners’ code of ethics; and Artisan Partners’ proxy voting policies. |
On October 29, 2009 and November 11, 2009, the independent directors met separately with their independent counsel to review and discuss relevant information regarding the continuation of the Advisory Agreements and the information presented and discussed at the Special Meeting. The directors concluded their annual Advisory Agreement review at a regularly scheduled meeting on November 12, 2009. At the November 12th meeting, the independent directors and their independent counsel reviewed with the full board the information discussed at the Special Meeting and the November 11th meeting. The directors then considered whether any further discussion or review was necessary, concluding that the Special Meeting and the information reviewed by the independent directors at the November 11th and 12th meetings provided a strong basis for considering the continuation of the Advisory Agreements. The directors then reviewed and affirmed each of the following conclusions:
The nature, extent, and quality of Artisan Partners’ services. The directors concluded that the nature and extent of Artisan Partners’ services to the Funds was appropriate and consistent with, and in some cases more advantageous to the Funds than, the terms of the Advisory Agreements. The directors concluded that the quality of Artisan Partners’ services has been consistently high, with no material deficiencies.
The investment performance of each Fund. The directors concluded that each of International Fund, International Small Cap Fund, International Value Fund, Mid Cap Fund, Mid Cap Value Fund and Small Cap Value Fund had met its long-term performance standards by adhering to its investment strategy and outperforming its peers over long-term periods. The directors also concluded that each of Emerging Markets Fund, Global Value Fund, Opportunistic Growth Fund and Opportunistic Value Fund had adhered to its investment strategy and performed satisfactorily or better since inception periods. In addition, the directors concluded that, over the long-term, Small Cap Fund had adhered to its investment strategy and that performance was acceptable. Moreover, based on recent changes to the investment management team of Small Cap Fund, the directors concluded that prospects for the performance of that Fund were favorable.
Cost of services, economies of scale and benefits derived by Artisan Partners. The directors concluded that the costs of the services provided by Artisan Partners and the profits realized are reasonable in relation to the nature and quality of services provided and in comparison to (i) the fees charged by mutual funds considered by Lipper, Inc. to be within the same peer category or universe and (ii) the fees charged and the array of services offered to other Artisan clients, including its separate account clients, who have similar investment strategies and objectives, for which it provides few or no services other than portfolio management. The directors concluded that the Funds’ overall expense ratios are competitive and demonstrate Artisan Partners’ history of effective management of the Funds’ business and affairs. The directors also concluded that the shareholders of the Funds (except for International Small Cap Fund and Emerging Markets Fund) have appropriately benefited (or are expected to benefit) from economies of scale under the management fee structures in the Advisory Agreements. It was also concluded that Artisan Partners had not achieved (nor was likely to achieve) economies of scale in the management of International
103
FACTORS CONSIDERED IN RENEWING THE FUNDS’ ADVISORY AGREEMENTS
Small Cap Fund, because it closed at a small asset level. The directors also concluded that Artisan Partners had appropriately put in place a low initial fee schedule in lieu of breakpoints for Emerging Markets Fund.
Other benefits derived by the Funds or Artisan Partners. The directors concluded that, other than the services provided by Artisan Partners pursuant to the Advisory Agreements and the management fees paid in return, the Funds and Artisan Partners may potentially benefit from their relationship with each other in several ways. For Artisan Partners, the directors concluded there were two primary fall-out benefits: (1) the potential conversion of Fund shareholders to separate account clients; and (2) the acquisition of research products and services in return for commissions (“soft dollars”). The directors concluded that, although Artisan Partners derives or may derive those additional benefits, the Funds also could benefit from conversions of Artisan Partners’ separate account clients to Fund shareholders and from the institutional shareholders who choose to invest in the Funds because they want Artisan Partners’ services, but do not meet Artisan Partners’ minimum separate account size requirements. The directors also concluded that the Funds benefit from Artisan Partners’ use of soft dollars generated with respect to its separate account clients.
Following those discussions, the board approved the continuation of each Advisory Agreement through November 30, 2010 by the unanimous vote of all directors and also by the unanimous vote of all the “non-interested” directors.
104
FACTORS CONSIDERED IN APPROVING ARTISAN GLOBAL EQUITY FUND’S ADVISORY AGREEMENTS
Artisan Partners Limited Partnership (“APLP”) is responsible for the management of Artisan Global Equity Fund’s (the “Fund”) investment portfolio, the supervision of the Fund’s sub-advisory relationship, and for the overall management of the Fund’s business and affairs pursuant to an investment advisory agreement dated February 9, 2010 (the “Advisory Agreement”). Artisan Partners UK LLP (“Artisan UK,” and collectively with APLP, “Artisan Partners”) serves as the Fund’s investment sub-adviser pursuant to a sub-advisory agreement with APLP dated February 9, 2010 (the “Sub-Advisory Agreement,” and collectively with the Advisory Agreement, the “Advisory Agreements”). Under the terms of the Sub-Advisory Agreement, Artisan UK manages the investment of the Fund’s assets, subject to the general supervision of APLP and Artisan Funds’ board of directors.
APLP, a Delaware limited partnership, is managed by its general partner, Artisan Investments GP LLC, a Delaware limited liability company wholly-owned by Artisan Partners Holdings LP (“Artisan Partners Holdings”). Artisan Partners Holdings is a limited partnership organized under the laws of Delaware whose sole general partner is Artisan Investment Corporation, a Wisconsin corporation. APLP was founded in March 2009 and succeeded to the investment management business of Artisan Partners Holdings during 2009. Artisan Partners Holdings was founded in December 1994 and began providing investment management services in March 1995. Artisan UK is a limited liability partnership organized under the laws of England and Wales. Artisan UK’s founding partner is Artisan Partners Limited, a private limited company incorporated under the laws of England and Wales. The sole shareholder of Artisan Partners Limited is Artisan Partners Holdings. Artisan UK was founded in December 2009. The principal address of APLP and Artisan UK is 875 E. Wisconsin Avenue, Suite 800, Milwaukee, Wisconsin 53202.
The Advisory Agreements for the Fund must be approved initially (a) by the vote of a majority of the directors of Artisan Funds who are not “interested persons” of the Fund or Artisan Partners cast in person at a meeting called for the purpose of voting on such approval, and (b) by the board of directors or by the vote of a majority (as defined in the Investment Company Act of 1940 (the “1940 Act”)) of the outstanding shares of the Fund. The Advisory Agreement provides that APLP shall not be liable for any loss suffered by the Fund or its shareholders as a consequence of any act or omission in connection with investment advisory or portfolio services under the Advisory Agreement, except by reason of willful misfeasance, bad faith or gross negligence on the part of APLP in the performance of its duties or from reckless disregard by APLP of its obligations and duties under the Advisory Agreement. The Advisory Agreement provides that APLP is authorized to appoint one or more qualified sub-advisers to assist in the performance of the Advisory Agreement. The Sub-Advisory Agreement provides that Artisan UK shall not be liable for any loss suffered by APLP or the Fund as a consequence of any act or omission of Artisan UK, or of any members, employees or agents of Artisan UK, in connection with investment advisory or portfolio services under the agreement, except by reason of willful misfeasance, bad faith or gross negligence on the part of Artisan UK in the performance of its duties or by reason of reckless disregard by Artisan UK of its obligations and duties under the Sub-Advisory Agreement. The Advisory Agreements will be in effect until November 30, 2011 and will terminate automatically in the event of an assignment (as defined in the 1940 Act).
The Fund’s board of directors, including a quorum of the independent directors, formally considered the initial approval of the Advisory Agreements at a meeting held on February 9, 2010 (the “Meeting”).
105
FACTORS CONSIDERED IN APPROVING ARTISAN GLOBAL EQUITY FUND’S ADVISORY AGREEMENTS
Prior to the Meeting, independent counsel to the independent directors sent Artisan Partners a request for information to be provided to the directors in connection with the initial approval of the Advisory Agreements. Artisan Partners provided materials to the directors in response to that request, other information Artisan Partners believed was useful in evaluating the Advisory Agreements and reports prepared by Lipper Inc. (“Lipper”), an independent source of investment company data, relating to the Fund’s management fees and expenses compared to the management fees and expenses of a peer group determined by Lipper to be comparable. The directors also received and reviewed a memorandum from their independent counsel regarding the directors’ responsibilities in evaluating the Fund’s Advisory Agreements.
In evaluating the Advisory Agreements, the directors reviewed the available information and discussed with representatives of Artisan Partners the nature, extent and quality of the advisory and other services to be provided by Artisan Partners to the Fund, the anticipated overall expense ratio of the Fund, and the prospect for economies of scale and other benefits being derived by Artisan Partners from its relationship with the Fund. In addition to the third party reports by Lipper and the memorandum from independent counsel, the directors reviewed the information provided prior to the meeting concerning the following:
| • | | Artisan Partners’ personnel and methods, including: Artisan Partners’ assessment of its ability to attract and retain capable research, advisory and administrative personnel through compensation programs and equity participation and Artisan Partners’ assessment of recent hiring and retention experience; the compensation of Artisan Partners’ personnel with primary responsibility for managing the Fund; the time and attention of Artisan Partners’ investment personnel devoted to the Fund; Artisan Partners’ research and decision-making processes, including methods adopted to ensure compliance with investment objectives, policies and restrictions of the Fund; the adequacy and sophistication of Artisan Partners’ technology and systems with respect to investment and administrative matters; and the education, experience and number of Artisan Partners’ advisory personnel; |
| • | | The terms of the Advisory Agreements, including: a list of services performed by Artisan Partners; how the services performed by Artisan Partners differ from: (a) the services performed by Artisan Partners under other advisory agreements with registered investment companies or other accounts, and (b) the services typically performed by an investment adviser for registered investment companies and other accounts; Artisan Partners’ responsibility for making investment decisions and for observing investment objectives, policies and restrictions of the Fund; Artisan Partners’ standard of care; and termination provisions; |
| • | | Litigation pending, threatened or settled involving Artisan Partners, and the results of any audits, investigations or examinations of the Securities and Exchange Commission (the “SEC”); |
| • | | Information regarding fee arrangements, including: a comparison of the estimated total expenses and total expense ratio of the Fund with other mutual funds (taking into account factors bearing on comparability, such as size, account-level charges, and investment objective); the structure of the proposed advisory fees, including: the method of computing fees, and the frequency of payment of fees; a comparison of the proposed advisory fees charged by APLP to the Fund with the advisory fees charged by other |
106
FACTORS CONSIDERED IN APPROVING ARTISAN GLOBAL EQUITY FUND’S ADVISORY AGREEMENTS
| | advisory organizations for managing mutual funds and other accounts, especially funds and accounts having similar investment goals and providing similar service; voluntary or contractual advisory fee limitations or reductions and relationship of fees to any fee limitation; the possible cost savings by APLP, incentives to effect savings, and sharing of savings with the Fund; any economies of scale as reflected in the basic advisory fees and any sliding scale reflecting increased size; a comparison of fees proposed to be charged by APLP to the Fund with the fees charged by APLP for managing other accounts including other mutual funds to which APLP provides sub-advisory services, with similar investment goals, including an explanation of any material differences, as well as any differences attributable to variations in service levels; information regarding other expenses, including expenses incurred by each of: (a) APLP, as adviser and administrator, (b) Artisan Distributors LLC, as the principal underwriter and (c) the Fund; custodian, shareholder servicing and transfer agent fees; and information regarding payments to financial intermediaries; |
| • | | Potential “fall-out” benefits gained by Artisan Partners or its affiliates from their proposed relationship with the Fund, in addition to the proposed advisory fees, including receipt of research paid for with commissions and the benefits to Artisan Partners in attracting and retaining other clients; and the method of estimating other benefits; |
| • | | Brokerage and portfolio transactions, including: the standards and performance in seeking best execution; commissions paid, including commissions by purpose; allocation of brokerage for research products and other services (“soft dollars”); Artisan Partners’ practices in light of SEC guidance under Section 28(e) of the Securities Exchange Act of 1934; research purchased with Artisan Partners’ cash; and research available for purchase by cash; |
| • | | Artisan Partners’ financial condition and stability and financial arrangements between APLP and its parent organization; |
| • | | The potential profitability to Artisan Partners of its relationship with the Fund; and |
| • | | Potential for conflicts of interest between the Fund and Artisan Partners and circumstances and actions addressing or bearing on potential conflicts of interest, including: the type and number of other clients served by Artisan Partners; the basis of sharing personnel, services, research and advice among clients; the basis of decisions to buy or sell securities for the Fund and other clients where the same security might be bought or sold for a number of clients; the basis for allocating purchases and sales of the same security, including initial public offerings, among the Fund and other clients of Artisan Partners; the potential advantages, including economies of scale, and disadvantages in having an investment adviser that has other clients; Artisan Partners’ investments on its own behalf and possible conflicts with the Fund; Artisan Partners’ code of ethics; and APLP’s proxy voting policies. |
At the end of the Meeting, after discussion and consideration of the information presented, the independent directors met in executive session with their independent counsel. In the course of reviewing and discussing the relevant information regarding the initial approval of the Fund’s Advisory Agreements, the directors reviewed and affirmed each of the following conclusions:
The nature, extent and quality of Artisan Partners’ services. The directors concluded that the nature and extent of services provided to the Fund by APLP and Artisan UK would be
107
FACTORS CONSIDERED IN APPROVING ARTISAN GLOBAL EQUITY FUND’S ADVISORY AGREEMENTS
appropriate and consistent with, and in some cases more advantageous to the Fund than, the terms of the Advisory Agreements. The directors concluded that Artisan Partners has sufficient and well qualified personnel, with appropriate education and experience, to serve the Fund effectively and that key personnel, including the proposed investment management team, would not be undesirably overextended in assuming management responsibilities for the Fund.
The investment performance of the Fund. Because the Fund was not yet in operation, the directors noted that the Fund had no performance history of its own to review. However, the directors reviewed the performance history of the proposed investment management team and concluded that the proposed investment management team had produced positive historical results. In particular, the directors noted that Mr. Yockey, proposed co-portfolio manager of the Fund, had produced positive historical results for Artisan International Fund and Artisan International Small Cap Fund over the long term, and Mr. Dargan, proposed co-portfolio manager for the Fund, had produced positive historical results for other global and international mutual funds for which he had served as portfolio manager.
Cost of services, economies of scale and benefits derived by Artisan Partners. The directors concluded that the overall estimated expense ratio of the Fund (after giving effect to APLP’s contractual undertaking to reimburse the Fund for ordinary operating expenses in excess of 1.50% of the Fund’s average net assets annually) was reasonable in relation to the nature, extent and quality of services to be provided to the Fund and in comparison to (i) the fees charged by mutual funds considered by Lipper to be within the same peer category or universe and (ii) the fees charged and the array of services offered to other Artisan clients, including APLP’s separate account clients, who have similar investment strategies and objectives, for which it provides few or no services other than portfolio management. The directors noted that APLP expects the fee schedule for separately managed accounts in its global equity strategy to be the same as that of the separately managed accounts in its global value strategy. The directors also noted that the proposed management fee schedule would be the same as Artisan Global Value Fund and would include breakpoints at $1 billion, $4 billion, $8 billion and $12 billion, which represent the same breakpoints that are currently in place for Artisan Global Value Fund, Artisan Opportunistic Growth Fund and Artisan Opportunistic Value Fund. It was the conclusion of the board that these breakpoints properly took into account such economies of scale as could be anticipated at this point from possible growth of the Fund’s assets.
Other benefits derived by the Fund or Artisan Partners. The directors concluded that, other than the services provided by Artisan Partners pursuant to the Advisory Agreements and the proposed management fees paid in return, the Fund and Artisan Partners may potentially benefit from their relationship with each other in several ways. For Artisan Partners, the directors concluded that there were potentially two primary fall-out benefits: (1) the potential conversion of Fund shareholders to separate account clients; and (2) the acquisition of research products and services in return for commissions (“soft dollars”). The directors concluded that, although Artisan Partners may derive those additional benefits, the Fund also could benefit from conversions of Artisan Partners’ separate account clients to Fund shareholders and from the institutional shareholders who choose to invest in the Fund because they want Artisan Partners’ services, but do not meet Artisan Partners’ minimum
108
FACTORS CONSIDERED IN APPROVING ARTISAN GLOBAL EQUITY FUND’S ADVISORY AGREEMENTS
separate account size requirements. The directors also concluded that the Fund could benefit from Artisan Partners’ use of soft dollars generated with respect to its separate account clients.
Following those discussions, the board approved the Fund’s Advisory Agreements through November 30, 2011 by the unanimous vote of all directors present at the meeting, constituting a quorum, and also by the unanimous vote of all the “non-interested” directors present at the meeting, constituting a quorum.
109
NOTES ON MANAGEMENT’S DISCUSSION OF FUND PERFORMANCE AND PORTFOLIO HOLDINGS’ CLASSIFICATION
The discussions of each Fund included in this report include statistical information about the portfolios of each of the Funds. Except as otherwise noted, that information is as of March 31, 2010. That information will vary with changes in a Fund’s portfolio investments. The performance information for each Fund relative to its benchmark index discussed in this report was prepared by the Adviser using information reported by FactSet Databases (“FactSet”). For the purposes of assigning portfolio securities to a particular country, the Adviser considers an issuer to be from a particular country as designated by its securities information vendors. The Adviser currently uses MSCI Inc. as its primary source and FactSet as a secondary source for this information. In the event (i) the Adviser’s securities information vendors do not assign a security to a particular country or if the published classification appears to be erroneous, or (ii) its primary vendor does not assign a security to a particular country and the secondary vendor has assigned a security to a particular country by using a methodology that is not the same as the methodology the primary vendor uses to assign a country, the Adviser assigns the security to a country using the primary vendor’s published criteria (to the extent available) or the Adviser’s own judgment. The primary information vendor’s criteria include the identity of the jurisdiction of the issuer’s incorporation, the main equity trading market for the issuer’s securities, the geographical distribution of the issuer’s operations and the location of the issuer’s headquarters. Country designations may change over time.
For the purposes of assigning portfolio securities to a particular sector and industry, the Adviser assigns securities in accordance with the sector and industry classifications of the Global Industry Classification Standard (GICS®) developed by MSCI Inc. and Standard & Poor’s (to the extent available) as a primary source and FactSet (to the extent available) as a secondary source for this information. In the event the Adviser’s securities information vendors do not classify a security to a particular sector or industry or if the published classification appears to be erroneous, the Adviser classifies the security according to its own judgment, using other securities information vendors, the company description and other publicly available information about the company’s peer group. Sector and industry classifications may change over time.
The names of portfolio securities reflected in this report are as reported by the Funds’ data providers, may not represent the legal name of the entity and, in some cases, are translations of non-English names.
Definitions of Portfolio Statistics
Market Capitalization is the aggregate value of all of a company’s outstanding equity securities.
Descriptions of Indices
Each Fund’s performance is compared in this report to changes in one or more indices, including in all cases a broad-based index of changes in prices of securities in the markets in which the Fund invests. All of the indices are unmanaged and their returns include reinvested dividends. Unlike the Funds’ returns, the returns of each index do not include the payment of sales commissions or other expenses that would be incurred in the purchase or sale of the securities included in that index. An investment cannot be made directly in an index. Fair value pricing is not employed by market indices.
110
NOTES ON MANAGEMENT’S DISCUSSION OF FUND PERFORMANCE AND PORTFOLIO HOLDINGS’ CLASSIFICATION
The indices to which the Funds are compared are:
Artisan Global Equity and Artisan Global Value Funds – Morgan Stanley Capital International All Country World IndexSM (MSCI ACWISM) is a market-weighted index of global developed and emerging markets.
Artisan International, Artisan International Small Cap and Artisan International Value Funds – Morgan Stanley Capital International EAFE® Index (MSCI EAFE®) is a market-weighted index of companies in developed markets, excluding the U.S. and Canada. MSCI EAFE®’s average annual return since inception of the International Fund is based upon a starting date of December 31, 1995.
Artisan International Fund – Morgan Stanley Capital International EAFE® Growth Index (MSCI EAFE® Growth) is a market-weighted index of companies in developed markets, excluding the U.S. and Canada, that exhibits growth investment style characteristics according to MSCI’s methodology. MSCI EAFE® Growth’s average annual return since inception of the International Fund is based upon a starting date of December 31, 1995.
Artisan International Small Cap Fund – Morgan Stanley Capital International EAFE® Small Cap Index (MSCI EAFE® Small Cap) is a market-weighted index of small companies in developed markets, excluding the U.S. and Canada.
Artisan International Value Fund – Morgan Stanley Capital International EAFE® Value Index (MSCI EAFE® Value) is a market-weighted index of companies in developed markets, excluding the U.S. and Canada, that exhibits value investment style characteristics according to MSCI’s methodology.
Artisan Mid Cap and Artisan Mid Cap Value Funds – Russell Midcap® Index is a market-weighted index of about 800 medium-sized U.S. companies.
Artisan Mid Cap Fund – Russell Midcap® Growth Index is a market-weighted index of those medium-sized companies included in the Russell Midcap® Index with higher price-to-book and higher forecasted growth values.
Artisan Mid Cap Value Fund – Russell Midcap® Value Index is a market-weighted index of those medium-sized companies included in the Russell Midcap® Index with lower price-to-book ratios and lower forecasted growth values.
Artisan Opportunistic Growth and Artisan Opportunistic Value Funds – Russell 1000® Index is a market-weighted index of about 1,000 large U.S. companies.
Artisan Opportunistic Growth Fund – Russell 1000® Growth Index is a market-weighted index of those companies included in the Russell 1000® Index with higher price-to-book ratios and higher forecasted growth values.
Artisan Opportunistic Value Fund – Russell 1000® Value Index is a market-weighted index of those large companies included in the Russell 1000® Index with lower price-to-book ratios and lower forecasted growth values.
Artisan Small Cap and Artisan Small Cap Value Funds – Russell 2000® Index is a market-weighted index of about 2,000 small U.S. companies.
Artisan Small Cap Fund – Russell 2000® Growth Index is a market-weighted index of those small companies included in the Russell 2000® Index with higher price-to-book ratios and higher forecasted growth values.
111
NOTES ON MANAGEMENT’S DISCUSSION OF FUND PERFORMANCE AND PORTFOLIO HOLDINGS’ CLASSIFICATION
Artisan Small Cap Value Fund – Russell 2000® Value Index is a market-weighted index of those small companies included in the Russell 2000® Index with lower price-to-book ratios and lower forecasted growth values.
Trademarks
Trademarks and copyrights relating to the indices and products of portfolio companies mentioned in this report are owned by their respective owners. Except as otherwise indicated, the trademarks, including names, logos, slogans and service marks appearing in this report are the property of the Adviser and may not be copied, reproduced, published or in any way used without written permission.
The Global Industry Classification Standard (“GICS”) was developed by and is the exclusive property and a service mark of MSCI Inc. (“MSCI”) and Standard & Poor’s, a division of The McGraw-Hill Companies, Inc. (“S&P”) and is licensed for use by Artisan Partners Limited Partnership. Neither MSCI, S&P nor any third party involved in making or compiling the GICS or any GICS classifications makes any express or implied warranties or representations with respect to such standard or classification (or the results to be obtained by the use thereof), and all such parties hereby expressly disclaim all warranties of originality, accuracy, completeness, merchantability and fitness for a particular purpose with respect to any of such standard or classification. Without limiting any of the foregoing, in no event shall MSCI, S&P, any of their affiliates or any third party involved in making or compiling the GICS or any GICS classifications have any liability for any direct, indirect, special, punitive, consequential or any other damages (including lost profits) even if notified of the possibility of such damages.
The MSCI information may only be used by the reader, may not be reproduced or redisseminated in any form and may not be used to create any financial instruments or products or any indices. The MSCI information is provided on an “as is” basis and the reader of this information assumes the entire risk of any use made of this information. MSCI, each of its affiliates and each other person involved in or related to compiling, computing or creating any MSCI information (collectively, the “MSCI Parties”) expressly disclaims all warranties (including, without limitation, any warranties of originality, accuracy, completeness, timeliness, non-infringement, merchantability and fitness for a particular purpose) with respect to this information. Without limiting any of the foregoing, in no event shall MSCI Parties have any liability for any direct, indirect, special, incidental, punitive, consequential (including, without limitation, lost profits) or any other damages.
Russell Investment Group is the source and owner of the Russell Index data contained or reflected in this material and all trademarks and copyrights related thereto. The presentation may contain confidential information and unauthorized use, disclosure, copying, dissemination or redistribution is strictly prohibited. This is a presentation of Artisan Funds, Inc. Russell Investment Group is not responsible for the formatting or configuration of this material or for any inaccuracy in Artisan Funds’ presentation thereof.
PROXY VOTING POLICIES AND PROCEDURES
You may obtain a description of Artisan Funds’ proxy voting policies and procedures, without charge, upon request by calling 800.344.1770. That information also is included in Artisan Funds’ statements of additional information, which are available without charge, on the Funds’ website at www.artisanfunds.com and on the Securities and Exchange Commission’s website at www.sec.gov.
112
PROXY VOTING POLICIES AND PROCEDURES
Information relating to how each Artisan Fund, except Artisan Global Equity Fund, voted proxies relating to portfolio securities held during the twelve-month period ended June 30 is available without charge, on the Funds’ website at www.artisanfunds.com and on the Securities and Exchange Commission’s website at www.sec.gov. Artisan Global Equity Fund’s proxy voting record for the period ending June 30, 2010 will be available by August 31, 2010, without charge, on the Funds’ website and on the Securities and Exchange Commission website.
INFORMATION ABOUT PORTFOLIO SECURITIES
Artisan Funds files a complete schedule of portfolio holdings with the Securities and Exchange Commission for the quarters ending December 31 and June 30 (the first and third quarters of the Funds’ fiscal year) on Form N-Q. The Funds’ Forms N-Q are available on the Securities and Exchange Commission’s website at www.sec.gov. You also may review and copy those documents by visiting the Securities and Exchange Commission’s Public Reference Room in Washington, D.C. Information on the operation of the Public Reference Room may be obtained by calling the Securities and Exchange Commission at 800.SEC.0330.
113
| | | | |
 | | ARTISAN FUNDS P.O. BOX 8412 BOSTON, MA 02266-8412 800.344.1770 WWW.ARTISANFUNDS.COM | | |


ARTISAN
SEMIANNUAL
REPORT
MARCH 31, 2010
ARTISAN EMERGING
MARKETS FUND
_________
ARTISAN INTERNATIONAL
FUND
_________
ARTISAN INTERNATIONAL
VALUE FUND
_________
ARTISAN MID CAP FUND
ARTISAN FUNDS, INC.
INSTITUTIONAL SHARES
TABLE OF CONTENTS
ARTISAN FUNDS
P.O. BOX 8412
BOSTON, MA 02266-8412
This report and the unaudited financial statements contained herein are provided for the general information of the shareholders of the Institutional Shares of Artisan Emerging Markets Fund, Artisan International Fund, Artisan International Value Fund and Artisan Mid Cap Fund. Before investing, investors should consider carefully each Fund’s investment objective, risks and charges and expenses. For more complete information on any Fund, including fees and expenses, please call 800.399.1770 for a free prospectus. Read it carefully before you invest or send money.
Company discussions are for illustration only and are not intended as recommendations of individual stocks. The discussions present information about the companies believed to be accurate, and the views of the portfolio managers, as of March 31, 2010. That information and those views may change, and the Funds disclaim any obligation to advise shareholders of any such changes. Each of the Funds offer other classes of shares. A report on each of the other classes is available under separate cover.
Artisan Funds offered through Artisan Distributors LLC, member FINRA.
ARTISAN EMERGING MARKETS FUND
INSTITUTIONAL SHARES
INVESTMENT PROCESS HIGHLIGHTS
Artisan Emerging Markets Fund employs a fundamental research process to construct a diversified portfolio of emerging market companies. The team’s investment process is focused on identifying companies that are priced at a discount relative to the team’s estimate of their sustainable earnings.
| • | | Sustainable Earnings. The team believes that over the long term a stock’s price is directly related to the company’s ability to deliver sustainable earnings. The team determines a company’s sustainable earnings based upon financial and strategic analysis. The financial analysis of a company’s balance sheet, income statement, and statement of cash flows focuses on identifying historical drivers of return on equity. The strategic analysis examines a company’s competitive advantages and financial strength to assess sustainability. |
| • | | Valuation. The team believes that investment opportunities develop when businesses with sustainable earnings are undervalued relative to peers and historical industry, country and regional valuations. The team values a business and develops a price target based on their assessment of the business’s sustainable earnings and cash flow expectations and the team’s risk analysis. |
| • | | Risk Analysis. The team believes that a disciplined risk framework allows greater focus on fundamental stock selection. The team incorporates its assessment of company-specific and macroeconomic risks into its valuation analysis to develop a risk-adjusted target price. The risk-rating assessment includes a review of the currency, interest rate, monetary and fiscal policy and political risks to which a company is exposed. |
PERFORMANCE HISTORY
GROWTH OF AN ASSUMED $1,000,000 INVESTMENT (6/26/2006 to 3/31/2010)
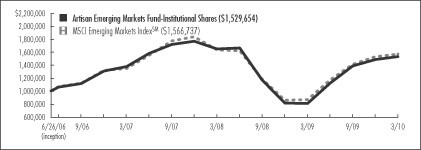
AVERAGE ANNUAL TOTAL RETURNS (as of 3/31/2010)
| | | | | | | | | | | | |
| Fund / Index | | Six
Months(1) | | | 1-Year | | | 3-Year | | | Since
Inception | |
Artisan Emerging Markets Fund – Institutional Shares | | 10.27 | % | | 89.16 | % | | 3.54 | % | | 11.96 | % |
MSCI Emerging Markets IndexSM | | 11.16 | | | 81.08 | | | 5.16 | | | 12.68 | |
The performance quoted represents past performance, which does not guarantee future results. The investment return and principal value of an investment in the Fund will fluctuate, so that an investor’s shares in the Fund, when redeemed, may be worth more or less than their original cost. Current performance may be lower or higher than the performance data quoted. The Fund’s investments in initial public offerings (IPOs) made a material contribution to the Fund’s performance. IPO investments are not an integral component of the Fund’s investment process and may not be available in the future. For current to most recent month-end performance information call 800.399.1770. The graph and table above do not reflect the deduction of taxes that a shareholder would pay on distributions or sale of Fund shares. The performance shown does not reflect the deduction of a 2% redemption fee on shares held by an investor for 90 days or less and, if reflected, the fee would reduce the performance quoted. The Fund’s performance information reflects Artisan Partners’ agreement to limit the Fund’s expenses to no more than 1.50%, which has been in effect since the Fund’s inception and has had a material impact on the Fund’s performance. Absent that expense waiver, the Fund’s performance would have been lower. See page 52 for a description of the index.
2
INVESTING ENVIRONMENT
Emerging markets stocks were up 11.16% during the six-month period ended March 31, 2010, as measured by the MSCI Emerging Markets IndexSM. From a regional perspective, the EMEA (Europe, Middle East & Africa) region was the strongest performing region as stocks in Russia and South Africa posted gains of approximately 18% and 14%, respectively. Strong results in Latin America were driven by 22% gains in Mexican stocks and 13% gains in Brazilian stocks. Asia lagged other regions but still put up strong numbers. India was among the strongest Asian countries advancing nearly 13%, while China and Korea gained 6-8%. Taiwan trailed the overall market by a wide margin with a gain of only 4%.
SECTOR DIVERSIFICATION
| | | | | | |
| Sector | | 9/30/09 | | | 3/31/10 | |
Consumer Discretionary | | 10.9 | % | | 9.6 | % |
Consumer Staples | | 6.2 | | | 6.9 | |
Energy | | 12.7 | | | 11.1 | |
Financials | | 14.8 | | | 16.0 | |
Healthcare | | 2.2 | | | 1.8 | |
Industrials | | 10.8 | | | 9.8 | |
Information Technology | | 12.9 | | | 12.6 | |
Materials | | 11.3 | | | 14.0 | |
Telecommunication Services | | 11.8 | | | 10.7 | |
Utilities | | 2.6 | | | 1.8 | |
Other assets less liabilities | | 3.8 | | | 5.7 | |
Total | | 100.0 | % | | 100.0 | % |
As a percentage of total net assets.
PERFORMANCE DISCUSSION
The Fund returned 10.27% during the six-month period. We benefited from the strength of our holdings in China, Turkey, Russia and Brazil. Some of our leading performers in these countries were fruit and vegetable producer Chaoda Modern Agriculture (Holdings) Limited, water treatment services provider Sound Global Ltd., investment and development bank Turkiye Sinai Kalkinma Bankasi A.S., rail freight transportation services provider Globaltrans Investment PLC, consumer products manufacturer Hypermarcas SA and truck and luxury coach manufacturer Marcopolo S.A.
On the downside, we were negatively impacted by our lack of investment in Israel, which advanced more than 25% in the Index, and by the underperformance of our holdings in Taiwan and Korea. Our biggest decliners in Taiwan were fertilizer manufacturer and land owner Taiwan Fertilizer Co., Ltd. and financial services provider Chinatrust Financial Holding Company Ltd. In Korea, our results were hindered by weakness in online educational programs provider MegaStudy Co., Ltd. and residential construction company Hyundai Development Company. Other weak performers in the portfolio included Samson Holding Ltd., real estate developer Rodobens Negocios Imobiliarios SA and Turkcell Iletisim Hizmetleri AS.
REGION ALLOCATION
| | | | | | |
| Region | | 9/30/09 | | | 3/31/10 | |
Emerging Asia | | 41.9 | % | | 42.2 | % |
Emerging Europe, Middle East & Africa | | 24.1 | | | 25.0 | |
Latin America | | 26.0 | | | 24.8 | |
Developed Markets | | 4.2 | | | 2.3 | |
As a percentage of total net assets.
FUND CHANGES
Our largest additions to the portfolio during the period included: Indian cement manufacturer India Cements Limited, Brazilian stock exchange operator BM&F BOVESPA SA, Russian steel manufacturer Magnitogorsk Iron & Steel Works, Indonesian auto manufacturer PT Astra International Tbk and Indian pipe manufacturer Welspun-Gujarat Stahl Ltd. Our purchases were funded in part by the sales of Gold Fields Limited, Turk Hava Yollari Anonim Ortakligi, All America Latina Logistica, Dufry South America Ltd and Sound Global Ltd.
3
ARTISAN INTERNATIONAL FUND
INSTITUTIONAL SHARES
INVESTMENT PROCESS HIGHLIGHTS
Artisan International Fund employs a fundamental stock selection process focused on identifying long-term growth opportunities.
Themes. The investment team’s thematic approach identifies catalysts for change and develops investment themes with the objective of capitalizing on them globally. Changing demographics, developing technology, privatization of economic resources, outsourcing and infrastructure are among the long-term catalysts for change that currently form the basis for the team’s investment themes. The team incorporates these catalysts along with sector and regional fundamentals into a long-term global framework for investment analysis and decision-making.
Sustainable Growth. The team applies a fundamental approach to identifying the long term, sustainable growth characteristics of potential investments. The team seeks high quality companies that are well managed, have a dominant or improving market position and competitive advantages compared to industry and regional peers.
Valuation. The team assesses the relationship between its estimate of a company’s sustainable growth prospects and the company’s stock price. The team uses multiple valuation metrics to establish price targets.
PERFORMANCE HISTORY
GROWTH OF AN ASSUMED $1,000,000 INVESTMENT (7/1/1997 to 3/31/2010)
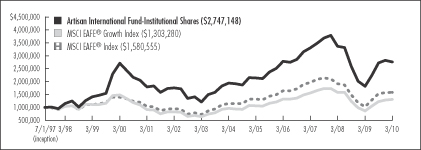
AVERAGE ANNUAL TOTAL RETURNS (as of 3/31/2010)
| | | | | | | | | | | | | | | | | | |
| Fund / Index | | Six
Months(1) | | | 1-Year | | | 3-Year | | | 5-Year | | | 10-Year | | | Since
Inception | |
Artisan International Fund – Institutional Shares | | 1.24 | % | | 51.48 | % | | -5.94 | % | | 5.14 | % | | 0.18 | % | | 8.25 | % |
MSCI EAFE® Growth Index | | 6.20 | | | 50.61 | | | -5.70 | | | 4.24 | | | -1.26 | | | 2.10 | |
MSCI EAFE® Index | | 3.06 | | | 54.44 | | | -7.02 | | | 3.75 | | | 1.27 | | | 3.66 | |
The performance quoted represents past performance, which does not guarantee future results. The investment return and principal value of an investment in the Fund will fluctuate, so that an investor’s shares in the Fund, when redeemed, may be worth more or less than their original cost. Current performance may be lower or higher than the performance data quoted. For current to most recent month-end performance information, visit www.artisanfunds.com or call 800.399.1770. The graph and table above do not reflect the deduction of taxes that a shareholder would pay on distributions or sale of Fund shares. The performance shown does not reflect the deduction of a 2% redemption fee on shares held by an investor for 90 days or less and, if reflected, the fee would reduce the performance quoted. See page 53 for a description of each index.
4
INVESTING ENVIRONMENT
The MSCI EAFE® Index was up 3.06% during the six-month period ended March 31, 2010. The market environment was choppy during the period as countries and economies around the globe continued to deal with the aftermath of the financial crisis. Concerns mounted over Greece’s ability to refinance its debt and the contagion spread over to other sovereign debt issues within the EU. Sentiment improved late in the period when government officials in Greece passed austerity measures aimed at lowering its budget deficit and restoring confidence in its financial condition. Most market sectors posted solid gains during the period. The most notable exception was the financials sector, which dipped 5%, largely due to weakness among European banks. International currencies were generally weak against the U.S. dollar during the period, which eroded some of the gains in the market for U.S. dollar based investors.
SECTOR DIVERSIFICATION
| | | | | | |
| Sector | | 9/30/09 | | | 3/31/10 | |
Consumer Discretionary | | 12.1 | % | | 14.9 | % |
Consumer Staples | | 14.2 | | | 12.8 | |
Energy | | 4.5 | | | 1.3 | |
Financials | | 30.7 | | | 26.1 | |
Healthcare | | 10.1 | | | 10.5 | |
Industrials | | 11.2 | | | 15.3 | |
Information Technology | | 6.4 | | | 8.0 | |
Materials | | 6.6 | | | 8.2 | |
Telecommunication Services | | 1.6 | | | — | |
Utilities | | 1.5 | | | 1.8 | |
Other assets less liabilities | | 1.1 | | | 1.1 | |
Total | | 100.0 | % | | 100.0 | % |
As a percentage of total net assets.
PERFORMANCE DISCUSSION
The Fund ended the period with a return of 1.24%.
Our top performers came from a variety of sectors and included semiconductor manufacturer ASML Holding N.V., multinational food company Nestle SA, rail and freight services provider Canadian Pacific Railway Limited, trading company MITSUI & CO., LTD. and gases and engineering company Linde AG.
On the downside, several of our European financial holdings were among our biggest decliners during the period. Included in that group were ING Groep N.V. (Netherlands), Societe Generale (France) and Intesa Sanpaolo (Italy), as well as two positions we sold during the period, The Governor and Company of the Bank of Ireland (Ireland) and Credit Suisse Group AG (Switzerland).
REGION ALLOCATION
| | | | | | |
| Region | | 9/30/09 | | | 3/31/10 | |
Europe | | 68.7 | % | | 64.9 | % |
Pacific Basin | | 9.5 | | | 13.9 | |
Emerging Markets | | 13.9 | | | 12.8 | |
Americas | | 6.8 | | | 7.3 | |
As a percentage of total net assets.
FUND CHANGES
We look to invest in companies with attractive growth rates, trading at reasonable valuations, with exposure to the long-term themes we have identified. Our larger purchases during the period included Netherlands-based mail and logistics services provider TNT NV, Japanese auto manufacturer HONDA MOTOR CO., LTD., Hong Kong-based resort and casino operator Sands China Ltd., German electric company RWE AG and Hong Kong-based flavor and fragrances company Huabao International Holdings Limited.
Sales during the period included Gazprom, Heineken Holding NV, Telefonica S.A., Allianz SE and Assicurazioni Generali S.p.A.
5
ARTISAN INTERNATIONAL VALUE FUND
INSTITUTIONAL SHARES
INVESTMENT PROCESS HIGHLIGHTS
Artisan International Value Fund employs a bottom-up investment process to construct a diversified portfolio of stocks of undervalued non-U.S. companies. The Fund’s investment process is focused on identifying what the investment team believes are high quality, undervalued businesses that offer the potential for superior risk/reward outcomes. The team’s in-depth research process focuses on four key investment characteristics:
Undervaluation. Determining the intrinsic value of the business is the heart of the team’s research process. The team believes that intrinsic value represents the amount that a buyer would pay to own a company’s future cash flows. The team seeks to invest at a significant discount to its estimate of the intrinsic value of a business.
Business quality. The team seeks to invest in companies with histories of generating strong free cash flow, improving returns on capital and strong competitive positions in their industries.
Financial strength. The team believes that investing in companies with strong balance sheets helps to reduce the potential for capital risk and provides company management the ability to build value when attractive opportunities are available.
Shareholder-oriented management. The team’s research process attempts to identify management teams with a history of building value for shareholders.
PERFORMANCE HISTORY
GROWTH OF AN ASSUMED $1,000,000 INVESTMENT (10/1/2006 to 3/31/2010)

AVERAGE ANNUAL TOTAL RETURNS (as of 3/31/2010)
| | | | | | | | | | | | |
| Fund / Index | | Six
Months(1) | | | 1-Year | | | 3-Year | | | Since
Inception | |
Artisan International Value Fund – Institutional Shares | | 7.49 | % | | 60.60 | % | | -1.69 | % | | 2.21 | % |
MSCI EAFE® Value Index | | 0.04 | | | 58.52 | | | -8.40 | | | -3.50 | |
MSCI EAFE® Index | | 3.06 | | | 54.44 | | | -7.02 | | | -2.26 | |
The performance quoted represents past performance, which does not guarantee future results. The investment return and principal value of an investment in the Fund will fluctuate, so that an investor’s shares in the Fund, when redeemed, may be worth more or less than their original cost. Current performance may be lower or higher than the performance data quoted. For current to most recent month-end performance information, visit www.artisanfunds.com or call 800.399.1770. The graph and table above do not reflect the deduction of taxes that a shareholder would pay on distributions or sale of Fund shares. The performance shown does not reflect the deduction of a 2% redemption fee on shares held by an investor for 90 days or less and, if reflected, the fee would reduce the performance quoted. See page 53 for a description of each index.
6
INVESTING ENVIRONMENT
International equity markets, as measured by the MSCI EAFE® Index, advanced 3.06% during the six-month period ended March 31, 2010. The economic environment remained muted as concerns surrounding large government deficits in several developed markets, including Greece and the U.S., weighed on sentiment.
SECTOR DIVERSIFICATION
| | | | | | |
| Sector | | 9/30/09 | | | 3/31/10 | |
Consumer Discretionary | | 23.4 | % | | 23.3 | % |
Consumer Staples | | 10.0 | | | 9.3 | |
Energy | | 4.7 | | | 4.3 | |
Financials | | 17.9 | | | 21.8 | |
Healthcare | | 8.8 | | | 7.3 | |
Industrials | | 14.6 | | | 16.4 | |
Information Technology | | 6.1 | | | 7.5 | |
Materials | | 3.2 | | | 2.5 | |
Telecommunication Services | | 1.4 | | | — | |
Other assets less liabilities | | 9.9 | | | 7.6 | |
Total | | 100.0 | % | | 100.0 | % |
As a percentage of total net assets.
PERFORMANCE DISCUSSION
Though the economic environment was still uneven, our portfolio returned 7.49% as we remained focused on the intersection of balance sheet strength, business quality and valuation.
Over the six-month period, we saw a few businesses or industries where revenue growth returned. Corporations also strengthened their balance sheets and continued to cut costs, as at least a partial offset to revenue declines. Equities that made positive contributions to the Fund’s performance included: Signet Jewelers Ltd., a jewelry retailer in the U.S. and U.K.; Experian PLC, a U.K. credit-checking company; Compass Group PLC, a U.K. contract caterer; Tyco Electronics Ltd., a U.S. electronic components manufacturer and Credit Saison Co., Ltd., a Japanese credit card company. Some of the worst performing equities in the portfolio during the period were SANKYO CO., LTD., a Japanese pachinko machine manufacturer; Brit Insurance Holdings NV, a U.K. insurance and reinsurance company; Gemalto NV, a French smart card maker; SEINO HOLDINGS CO., LTD., a Japanese transportation company; and Pargesa Holding SA, a Swiss holding company.
REGION ALLOCATION
| | | | | | |
| Region | | 9/30/09 | | | 3/31/10 | |
Europe | | 64.2 | % | | 66.1 | % |
Americas | | 13.0 | | | 14.0 | |
Pacific Basin | | 10.2 | | | 11.7 | |
Emerging Markets | | 2.7 | | | 0.6 | |
As a percentage of total net assets.
FUND CHANGES
Although new investments were harder to find as markets improved, we did identify several new investment opportunities for the portfolio during the period. We acquired shares in previously mentioned Brit Insurance Holdings NV, publishing group Reed Elsevier PLC, British lender Lloyds Banking Group plc, British defense technology contractor Qinetiq Group PLC, Japanese megabank Mitsubishi UFJ Financial Group, Inc. and Japanese wigmaker Aderans Holdings Company Limited. We funded these purchases in part by selling our shares in Cadbury PLC, SK Telecom Co., Ltd. and Grupo Modelo, S.A. de C.V.
7
ARTISAN MID CAP FUND
INSTITUTIONAL SHARES
INVESTMENT PROCESS HIGHLIGHTS
Artisan Mid Cap Fund employs a bottom-up investment process to construct a diversified portfolio of primarily U.S. mid-cap growth companies. The Fund’s investment process focuses on two distinct areas – security selection and capital allocation.
The Fund’s investment team attempts to identify companies that possess franchise characteristics that are selling at attractive valuations and benefiting from an accelerating profit cycle.
Franchise characteristics. These are characteristics that the team believes help to protect a company’s stream of cash flow from the effects of competition. The team looks for companies with at least two of the following characteristics: low cost production capability, possession of a proprietary asset, dominant market share or a defensible brand name.
Attractive valuations. Through its own fundamental research, the team estimates the amount a buyer would pay to buy the entire company (the company’s “intrinsic value” or “private market value”) and considers whether to purchase a stock if it sells at a discount to that estimate.
Accelerating profit cycle. The team tries to invest in companies that are well positioned for long-term growth, at an early enough stage in their profit cycle to benefit from the increased cash flows produced by the profit cycle.
Based on the investment team’s fundamental analysis of a company’s profit cycle, portfolio holdings develop through three stages. GardenSM investments are small positions in the early part of their profit cycle that will warrant a more sizeable allocation once their profit cycle accelerates. CropSM investments are positions that are being increased to a full weight because they are moving through the strongest part of their profit cycle. HarvestSM investments are positions that are being reduced as they near the team’s estimate of full valuation or their profit cycle begins to decelerate.
PERFORMANCE HISTORY
GROWTH OF AN ASSUMED $1,000,000 INVESTMENT (7/1/2000 to 3/31/2010)
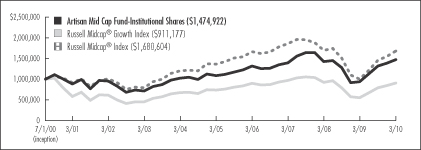
AVERAGE ANNUAL TOTAL RETURNS (as of 3/31/2010)
| | | | | | | | | | | | | | | |
| Fund / Index | | Six
Months(1) | | | 1-Year | | | 3-Year | | | 5-Year | | | Since
Inception | |
Artisan Mid Cap Fund – Institutional Shares | | 12.16 | % | | 57.17 | % | | 1.95 | % | | 6.25 | % | | 4.07 | % |
Russell Midcap® Growth Index | | 14.88 | | | 63.00 | | | -2.04 | | | 4.27 | | | -0.95 | |
Russell Midcap® Index | | 15.10 | | | 67.71 | | | -3.30 | | | 4.20 | | | 5.47 | |
The performance quoted represents past performance, which does not guarantee future results. The investment return and principal value of an investment in the Fund will fluctuate, so that an investor’s shares in the Fund, when redeemed, may be worth more or less than their original cost. Current performance may be lower or higher than the performance data quoted. For current to most recent month-end performance information, visit www.artisanfunds.com or call 800.399.1770. The graph and table above do not reflect the deduction of taxes that a shareholder would pay on distributions or sale of Fund shares. See page 53 for a description of each index.
8
INVESTING ENVIRONMENT
During the six months ended March 31, 2010, strong earnings reports and evidence that economic and business conditions were steadily improving lifted U.S. mid-cap stocks higher. The Russell Midcap® Index gained 15.10% in the period. Value stocks were slightly favored over growth stocks in the mid-cap market segment as the Russell Midcap® Value Index returned 15.32%, while the Russell Midcap® Growth Index returned 14.88%. Within the Russell Midcap® Growth Index, most sectors earned double-digit percentage gains. The strongest performing sector was health care, rising more than 19%. The utilities sector was the only sector to lose ground, declining 3%.
SECTOR DIVERSIFICATION
| | | | | | |
| Sector | | 9/30/09 | | | 3/31/10 | |
Consumer Discretionary | | 16.0 | % | | 19.9 | % |
Consumer Staples | | 3.0 | | | 1.6 | |
Energy | | 2.1 | | | 5.2 | |
Financials | | 6.5 | | | 5.3 | |
Healthcare | | 17.8 | | | 15.7 | |
Industrials | | 13.2 | | | 12.9 | |
Information Technology | | 34.7 | | | 35.3 | |
Materials | | 2.4 | | | 1.9 | |
Exchange Traded Funds | | 0.7 | | | — | |
Other assets less liabilities | | 3.6 | | | 2.2 | |
Total | | 100.0 | % | | 100.0 | % |
As a percentage of total net assets.
PERFORMANCE DISCUSSION
The Fund participated in the gain, returning 12.16% in the period. The technology, materials and energy sectors were sources of positive returns. In the technology sector, returns were led by Cree, Inc., a provider of LED (Light Emitting Diode) chips and lighting solutions, ARM Holdings PLC, a developer and licenser of microprocessors and Agilent Technologies, Inc., a manufacturer of test and measurement products, among others. Top performers in the materials and energy sectors included fertilizer company Agrium Inc. and energy services and equipment provider Smith International, Inc.
Returns on holdings in the health care sector were not as strong. Our underperformers in the health care sector included Illumina, Inc., a developer of tools for genetic analysis, and athenahealth, Inc., a clinical billing software provider. The industrials and financials sectors were also areas of underperformance. In the industrials sector, solar panel maker First Solar, Inc. and contracting services company Quanta Services, Inc. detracted from returns. Our results in the financials sector suffered from our lack of real estate investment trusts (REITS) and a negative return by brokerage services provider TD Ameritrade Holding Corporation.
FUND CHANGES
The most notable changes to the portfolio during the period were increased exposure to the consumer discretionary and energy sectors and a reduced weighting in the health care sector. In the consumer discretionary sector, we added to our positions in Harman International Industries, Incorporated and Ctrip.com International, Ltd. and purchased Polo Ralph Lauren Corporation and Gafisa S.A. In the energy sector, we increased our position in Smith International, Inc. Other significant purchases included Cummins Inc., Edwards Lifesciences Corporation and GSI Commerce, Inc.
Our reduced weighting in the health care sector was due in part to the sale of C.R. Bard, Inc. and a reduced position in Cerner Corporation. In addition to these sales, our new purchases were funded with sales in other sectors, such as sales of TD Ameritrade Holding Corporation, Quanta Services, Inc., CommScope, Inc., Invesco Limited and Ecolab Inc., among others.
9
ARTISAN EMERGING MARKETS FUND
Schedule of Investments – March 31, 2010 (Unaudited)
| | | | | |
| | | Shares
Held | | Value |
| | | | | |
COMMON AND
PREFERRED STOCKS - 94.3% |
| | | | | |
| BRAZIL - 17.6% | | | | | |
Amil Participacoes SA | | 203,000 | | $ | 1,580,988 |
BM&F BOVESPA SA | | 407,200 | | | 2,756,875 |
Companhia Energetica de Minas Gerais-CEMIG, Preferred(1) | | 100,747 | | | 1,672,366 |
Companhia Vale do Rio Doce | | 303,762 | | | 9,761,857 |
Empresa Brasileira de Aeronautica S.A. | | 288,900 | | | 1,709,016 |
Fleury SA(2) | | 121,500 | | | 1,298,113 |
Hypermarcas SA(2) | | 152,500 | | | 1,865,142 |
Iguatemi Empresa de Shopping Centers SA | | 106,300 | | | 1,790,247 |
Itau Unibanco Holdings SA, Preferred(1) | | 224,251 | | | 4,917,923 |
Marcopolo S.A., Preferred(1) | | 419,500 | | | 1,887,143 |
Petroleo Brasileiro S.A. | | 471,900 | | | 10,534,726 |
Randon SA Implementos e Participacoes, Preferred(1) | | 141,000 | | | 1,087,024 |
Rodobens Negocios Imobiliarios SA | | 142,100 | | | 998,819 |
SEB - Sistema Educacional Brasileiro SA (Units)(1) | | 137,400 | | | 1,854,303 |
SLC Agricola SA | | 147,982 | | | 1,209,918 |
Tele Norte Leste Participacoes S.A. | | 87,800 | | | 1,885,995 |
Tim Participacoes S.A., Preferred(1) | | 700,900 | | | 1,958,823 |
Wilson Sons Limited (DR) | | 129,821 | | | 1,704,569 |
| | | | | |
| | | | | 50,473,847 |
| CHILE - 1.1% | | | | | |
Compania Cervecerias Unidas S.A. | | 214,778 | | | 1,604,358 |
Empresa Nacional de Telecomunicaciones S.A. | | 119,319 | | | 1,623,284 |
| | | | | |
| | | | | 3,227,642 |
| CHINA - 11.6% | | | | | |
Airmedia Group, Inc. (DR)(2) | | 183,645 | | | 1,147,781 |
Ajisen China Holdings Limited | | 2,040,913 | | | 2,005,624 |
Chaoda Modern Agriculture (Holdings) Limited | | 3,758,536 | | | 4,003,361 |
China Dongxiang Group Company | | 3,961,000 | | | 2,841,584 |
China Mobile Limited | | 591,000 | | | 5,686,022 |
China Railway Construction Corporation, H Shares | | 1,209,500 | | | 1,487,681 |
GOME Electrical Appliances Holdings Limited(2) | | 9,329,587 | | | 3,136,198 |
Huabao International Holdings Limited | | 3,349,600 | | | 4,003,515 |
Mindray Medical International Limited, Class A (DR) | | 67,530 | | | 2,459,443 |
| | | | | |
| | | Shares
Held | | Value |
| | | | | |
| CHINA (CONTINUED) | | | | | |
New Oriental Education & Technology Group, Inc. (DR)(2) | | 18,445 | | $ | 1,577,232 |
Tingyi (Cayman Islands) Holding Corporation | | 1,088,300 | | | 2,565,076 |
Zhuzhou CSR Times Electric Co., Ltd., H Shares | | 1,235,200 | | | 2,335,414 |
| | | | | |
| | | | | 33,248,931 |
| CZECH REPUBLIC - 0.6% | | | | | |
CEZ | | 39,658 | | | 1,873,367 |
| | | | | |
| EGYPT - 2.0% | | | | | |
Commercial International Bank | | 157,181 | | | 1,855,569 |
Egyptian Financial Group-Hermes Holding | | 539,401 | | | 3,087,889 |
Orascom Construction Industries | | 17,679 | | | 848,630 |
| | | | | |
| | | | | 5,792,088 |
| HONG KONG - 0.5% | | | | | |
Samson Holding Ltd. | | 9,107,955 | | | 1,536,713 |
| | | | | |
| HUNGARY - 0.7% | | | | | |
MOL Hungarian Oil and Gas Nyrt., Class A(2) | | 20,072 | | | 2,053,574 |
| | | | | |
| INDIA - 5.1% | | | | | |
Cairn India Ltd.(2) | | 482,077 | | | 3,273,442 |
India Cements Limited | | 1,009,184 | | | 2,944,718 |
Nagarjuna Construction Company Ltd. | | 543,295 | | | 1,972,538 |
Patni Computer Systems Ltd | | 172,770 | | | 2,062,696 |
Power Finance Corporation | | 339,980 | | | 1,959,457 |
Welspun Gujarat Stahl Rohren Ltd. | | 380,304 | | | 2,318,080 |
| | | | | |
| | | | | 14,530,931 |
| INDONESIA - 3.5% | | | | | |
PT Astra International Tbk | | 527,000 | | | 2,426,650 |
PT Bank Rakyat Indonesia | | 2,432,000 | | | 2,204,956 |
PT Indocement Tunggal Prakarsa Tbk | | 1,844,095 | | | 2,887,890 |
PT Telekomunikasi Indonesia | | 2,951,500 | | | 2,611,086 |
| | | | | |
| | | | | 10,130,582 |
| ITALY - 0.5% | | | | | |
Tenaris S.A. (DR) | | 36,186 | | | 1,553,827 |
| | | | | |
| KAZAKSTAN - 1.1% | | | | | |
KazMunaiGas Exploration Production (DR) | | 122,896 | | | 3,031,844 |
10
| | | | | |
| | | Shares
Held | | Value |
| | | | | |
| KOREA - 8.4% | | | | | |
Daewoo Shipbuilding & Marine Engineering Co., Ltd. | | 96,534 | | $ | 1,851,419 |
Hyundai Development Company | | 42,381 | | | 1,237,962 |
MegaStudy Co., Ltd. | | 9,662 | | | 1,592,614 |
Samsung Electronics Co., Ltd. | | 17,566 | | | 12,699,623 |
Shinhan Financial Group Co., Ltd. | | 89,587 | | | 3,519,503 |
Shinsegae Co., Ltd. | | 6,443 | | | 3,046,538 |
| | | | | |
| | | | | 23,947,659 |
| MEXICO - 6.1% | | | | | |
America Movil SAB de C.V., Series L | | 2,319,763 | | | 5,844,555 |
Bolsa Mexicana de Valores SA(2) | | 1,003,290 | | | 1,590,495 |
Fomento Economico Mexicano SAB, Series UBD (Units) | | 485,382 | | | 2,308,791 |
Grupo Financiero Banorte S.A.B. de C.V. | | 640,241 | | | 2,839,819 |
Grupo Televisa S.A. | | 576,541 | | | 2,436,033 |
Urbi, Desarrollos Urbanos, S.A. de C.V.(2) | | 1,012,562 | | | 2,338,178 |
| | | | | |
| | | | | 17,357,871 |
| NETHERLANDS - 0.5% | | | | | |
Plaza Centers (Europe) BV(2) | | 646,147 | | | 1,323,712 |
| | | | | |
| POLAND - 0.7% | | | | | |
Polski Koncern Naftowy Orlen S.A.(2) | | 138,109 | | | 1,875,877 |
| | | | | |
| RUSSIA - 6.0% | | | | | |
Globaltrans Investment PLC (DR)(2) | | 214,628 | | | 2,800,895 |
LUKOIL (DR) | | 98,552 | | | 5,587,898 |
Magnit | | 20,811 | | | 1,810,557 |
Magnitogorsk Iron & Steel Works (DR)(2) | | 218,787 | | | 2,651,698 |
Mobile TeleSystems (DR) | | 50,086 | | | 2,779,773 |
Razguliay Group(2)(3) | | 806,642 | | | 1,444,259 |
| | | | | |
| | | | | 17,075,080 |
| SOUTH AFRICA - 8.8% | | | | | |
ABSA Group Limited | | 158,286 | | | 3,092,376 |
African Bank Investments Limited | | 449,980 | | | 2,199,319 |
Barloworld Limited | | 234,550 | | | 1,587,228 |
Grindrod Limited | | 971,165 | | | 2,041,330 |
Harmony Gold Mining Company Limited | | 223,987 | | | 2,115,710 |
Impala Platinum Holdings Limited | | 178,266 | | | 5,237,539 |
Mondi Limited | | 418,596 | | | 3,091,878 |
Mr. Price Group Limited | | 294,347 | | | 1,608,376 |
MTN Group Limited(2) | | 280,772 | | | 4,317,345 |
| | | | | |
| | | | | 25,291,101 |
| SWEDEN - 0.8% | | | | | |
Alliance Oil Co Ltd. (DR)(2) | | 144,000 | | | 2,288,452 |
| | | | | |
| TAIWAN - 10.4% | | | | | |
Acer Inc. | | 622,599 | | | 1,838,900 |
Cathay Financial Holding Co., Ltd.(2) | | 1,330,292 | | | 2,220,085 |
| | | | | | |
| | | Shares
Held | | Value |
| | | | | | |
| TAIWAN (CONTINUED) | | | | | | |
Chinatrust Financial Holding Company Ltd. | | | 3,020,838 | | $ | 1,712,170 |
Far Eastern Textile Ltd. | | | 1,642,698 | | | 1,805,219 |
Hon Hai Precision Industry Co., Ltd. | | | 1,037,729 | | | 4,492,970 |
HTC Corporation | | | 276,400 | | | 3,228,931 |
MediaTek Incorporation | | | 220,214 | | | 3,820,704 |
Prime View International Co., Ltd.(2) | | | 1,197,000 | | | 2,167,249 |
Taiwan Fertilizer Co., Ltd. | | | 842,000 | | | 2,691,070 |
Taiwan Semiconductor Manufacturing Company Ltd. | | | 3,006,647 | | | 5,822,432 |
| | | | | | |
| | | | | | 29,799,730 |
| THAILAND - 3.2% | | | | | | |
Bangkok Bank Public Company Limited (DR) | | | 479,200 | | | 1,948,811 |
Bumrungrad Hospital Public Company Limited (DR) | | | 1,422,400 | | | 1,352,677 |
Glow Energy Pcl (DR) | | | 1,490,500 | | | 1,774,679 |
Siam Commercial Bank Public Company Limited (DR) | | | 868,600 | | | 2,471,353 |
Total Access Communication Public Company Limited (DR) | | | 1,339,000 | | | 1,552,884 |
| | | | | | |
| | | | | | 9,100,404 |
| TURKEY - 4.4% | | | | | | |
Cimsa Cimento Sanayi ve Ticaret A.S. | | | 411,394 | | | 2,317,522 |
Ford Otomotiv Sanayi A.S. | | | 265,519 | | | 1,924,368 |
Tekfen Holding A.S.(2) | | | 472,882 | | | 1,775,936 |
Tupras-Turkiye Petrol Rafinerileri A.S. | | | 72,949 | | | 1,658,205 |
Turkcell Iletisim Hizmetleri AS | | | 378,631 | | | 2,307,585 |
Turkiye Sinai Kalkinma Bankasi A.S.(2) | | | 1,809,135 | | | 2,693,886 |
| | | | | | |
| | | | | | 12,677,502 |
| UNITED ARAB EMIRATES - 0.7% | | | | | | |
Air Arabia | | | 7,254,521 | | | 1,935,592 |
| | | | | | |
Total common and preferred stocks
(Cost $231,479,385) | | | | | | 270,126,326 |
| | |
| | | Par
Amount | | |
SHORT-TERM INVESTMENTS
(CASH EQUIVALENTS) - 3.2% | | | | | | |
Repurchase agreement with Fixed Income Clearing Corporation, 0.00%, dated 3/31/10, due 4/1/10, maturity value $9,104,000(4)
(Cost $9,104,000) | | $ | 9,104,000 | | | 9,104,000 |
| | | | | | |
| | | | | | |
Total investments - 97.5%
(Cost $240,583,385) | | | | | | 279,230,326 |
| | | | | | |
Other assets less liabilities - 2.5% | | | | | | 7,159,611 |
| | | | | | |
| | | | | | |
Total net assets - 100.0%(5) | | | | | $ | 286,389,937 |
| | | | | | |
11
| (2) | Non-income producing security. |
| (3) | Valued at a fair value in accordance with procedures established by the board of directors of Artisan Funds, Inc. In total, securities valued at a fair value were $1,444,259 or 0.5% of total net assets. |
| | | | | | | | |
Issuer | | Rate | | | Maturity | | Value |
U.S. Treasury Bond | | 4.625 | % | | 11/15/2016 | | $ | 9,283,716 |
| (5) | Percentages for the various classifications relate to total net assets. |
Company names are as reported by a data service provider and in some cases are translations; a company’s legal name may be different.
(DR) Depository Receipt, voting rights may vary.
| | | | | | |
| PORTFOLIO DIVERSIFICATION - MARCH 31, 2010 (Unaudited) | |
| | | Value | | Percentage
of Total
Net Assets | |
Consumer Discretionary | | $ | 27,424,473 | | 9.6 | % |
Consumer Staples | | | 19,858,000 | | 6.9 | |
Energy | | | 31,857,845 | | 11.1 | |
Financials | | | 45,765,433 | | 16.0 | |
Healthcare | | | 5,110,233 | | 1.8 | |
Industrials | | | 28,067,596 | | 9.8 | |
Information Technology | | | 36,133,505 | | 12.6 | |
Materials | | | 40,021,477 | | 14.0 | |
Telecommunication Services | | | 30,567,352 | | 10.7 | |
Utilities | | | 5,320,412 | | 1.8 | |
| | | | | | |
Total common and preferred stocks | | | 270,126,326 | | 94.3 | |
Short-term investments | | | 9,104,000 | | 3.2 | |
| | | | | | |
Total investments | | | 279,230,326 | | 97.5 | |
Other assets less liabilities | | | 7,159,611 | | 2.5 | |
| | | | | | |
Total net assets | | $ | 286,389,937 | | 100.0 | % |
| | | | | | |
| | | | | | |
| CURRENCY EXPOSURE - MARCH 31, 2010 (Unaudited) | |
| | | Value | | Percentage
of Total
Investments | |
Brazilian real | | $ | 50,473,847 | | 18.1 | % |
British pound | | | 1,323,712 | | 0.5 | |
Chilean peso | | | 3,227,642 | | 1.1 | |
Czech koruna | | | 1,873,367 | | 0.7 | |
Egyptian pound | | | 5,792,088 | | 2.1 | |
Hong Kong dollar | | | 29,601,188 | | 10.6 | |
Hungarian forint | | | 2,053,574 | | 0.7 | |
Indian rupee | | | 14,530,931 | | 5.2 | |
Indonesian rupiah | | | 10,130,582 | | 3.6 | |
Korean won | | | 23,947,659 | | 8.6 | |
Mexican peso | | | 17,357,871 | | 6.2 | |
Polish zloty | | | 1,875,877 | | 0.7 | |
South African rand | | | 25,291,101 | | 9.0 | |
Swedish krona | | | 2,288,452 | | 0.8 | |
Taiwan dollar | | | 29,799,730 | | 10.7 | |
Thai baht | | | 9,100,404 | | 3.3 | |
Turkish lira | | | 12,677,502 | | 4.5 | |
United Arab Emirates dirham | | | 1,935,592 | | 0.7 | |
U.S. dollar | | | 35,949,207 | | 12.9 | |
| | | | | | |
Total investments | | $ | 279,230,326 | | 100.0 | % |
| | | | | | |
| | | | | |
| TOP TEN HOLDINGS - MARCH 31, 2010 (Unaudited) | |
Company Name | | Country | | Percentage
of Total
Net Assets | |
Samsung Electronics Co., Ltd. | | Korea | | 4.4 | % |
Petroleo Brasileiro S.A. | | Brazil | | 3.7 | |
Companhia Vale do Rio Doce | | Brazil | | 3.4 | |
America Movil SAB de C.V. | | Mexico | | 2.0 | |
Taiwan Semiconductor Manufacturing Company Ltd. | | Taiwan | | 2.0 | |
China Mobile Limited | | China | | 2.0 | |
LUKOIL | | Russia | | 2.0 | |
Impala Platinum Holdings Limited | | South Africa | | 1.8 | |
Itau Unibanco Holdings SA | | Brazil | | 1.7 | |
Hon Hai Precision Industry Co., Ltd. | | Taiwan | | 1.6 | |
| | | | | |
Total | | | | 24.6 | % |
| | | | | |
For the purpose of determining the Fund’s top ten holdings, securities of the same issuer are aggregated to determine the weight in the Fund.
The accompanying notes are an integral part of the financial statements.
12
ARTISAN INTERNATIONAL FUND
Schedule of Investments – March 31, 2010 (Unaudited)
| | | | | |
| | | Shares
Held | | Value |
| | | | | |
COMMON AND
PREFERRED STOCKS - 98.9% | | | |
| | | | | |
| AUSTRALIA - 0.2% | | | | | |
Foster’s Group Limited | | 4,050,176 | | $ | 19,661,049 |
| | | | | |
| BELGIUM - 1.5% | | | | | |
Anheuser-Busch InBev NV | | 1,987,856 | | | 100,133,295 |
Umicore | | 1,451,958 | | | 50,703,924 |
| | | | | |
| | | | | 150,837,219 |
| BRAZIL - 1.3% | | | | | |
Petroleo Brasileiro S.A., Preferred (DR) | | 3,467,624 | | | 137,283,234 |
| | | | | |
| CANADA - 2.3% | | | | | |
Canadian Pacific Railway Limited | | 4,218,471 | | | 237,246,809 |
| | | | | |
| CHINA - 7.6% | | | | | |
Baidu, Inc., Class A (DR)(1) | | 51,837 | | | 30,946,689 |
Beijing Enterprises Holdings Ltd. | | 5,260,470 | | | 36,586,326 |
China Construction Bank, H Shares | | 172,387,100 | | | 140,986,970 |
China Life Insurance Co., Limited,
H Shares | | 31,712,900 | | | 151,942,542 |
China Merchants Bank Co., Ltd.,
H Shares | | 11,120,804 | | | 30,078,486 |
China Merchants Holdings International Company Limited | | 15,554,265 | | | 56,894,243 |
Ctrip.com International, Ltd. (DR)(1) | | 510,206 | | | 20,000,075 |
Huabao International Holdings Limited | | 80,561,405 | | | 96,288,739 |
Industrial and Commercial Bank of China Ltd, H Shares | | 129,116,800 | | | 98,613,855 |
Tencent Holdings Limited | | 1,010,500 | | | 20,264,011 |
Wynn Macau Limited(1) | | 69,329,672 | | | 99,830,084 |
| | | | | |
| | | | | 782,432,020 |
| DENMARK - 1.2% | | | | | |
Danske Bank A/S(1) | | 5,110,524 | | | 125,727,903 |
| | | | | |
| FRANCE - 12.5% | | | | | |
Accor S.A. | | 2,443,762 | | | 135,195,374 |
BNP Paribas | | 2,727,893 | | | 209,496,688 |
Compagnie de Saint-Gobain | | 1,189,302 | | | 57,185,395 |
Credit Agricole S.A. | | 3,781,281 | | | 66,189,169 |
Natixis(1) | | 19,801,049 | | | 106,843,463 |
Pernod Ricard SA | | 2,960,307 | | | 251,375,639 |
| | | | | |
| | | Shares
Held | | Value |
| | | | | |
| FRANCE (CONTINUED) | | | | | |
Societe Generale | | 2,576,520 | | $ | 162,045,174 |
Unibail-Rodamco | | 615,157 | | | 124,629,314 |
Vinci SA | | 3,070,721 | | | 180,974,887 |
| | | | | |
| | | | | 1,293,935,103 |
| GERMANY - 13.7% | | | | | |
Bayer AG | | 4,223,307 | | | 285,666,917 |
Daimler AG | | 4,898,618 | | | 230,611,859 |
Deutsche Boerse AG | | 291,010 | | | 21,570,737 |
Deutsche Post AG | | 11,835,137 | | | 205,329,038 |
Linde AG | | 2,610,379 | | | 311,461,189 |
Muenchener Rueckversicherungs-Gesellschaft AG | | 1,626,456 | | | 263,942,344 |
Rhoen-Klinikum AG | | 52,496 | | | 1,343,626 |
RWE AG | | 1,092,986 | | | 96,841,479 |
| | | | | |
| | | | | 1,416,767,189 |
| HONG KONG - 4.1% | | | | | |
The Bank of East Asia, Ltd. | | 15,875,835 | | | 58,683,899 |
Esprit Holdings Limited | | 8,912,800 | | | 70,367,987 |
Li & Fung Limited | | 27,734,899 | | | 136,276,704 |
NWS Holdings Limited | | 33,563,746 | | | 66,917,833 |
Sands China Ltd.(1) | | 61,192,264 | | | 97,097,426 |
| | | | | |
| | | | | 429,343,849 |
| INDIA - 2.5% | | | | | |
Housing Development Finance Corporation Ltd. | | 1,248,822 | | | 75,535,720 |
ICICI Bank Limited | | 1,675,413 | | | 35,639,145 |
ICICI Bank Limited (DR) | | 3,355,985 | | | 143,300,560 |
| | | | | |
| | | | | 254,475,425 |
| ITALY - 1.6% | | | | | |
Intesa Sanpaolo(1) | | 44,606,531 | | | 166,133,397 |
| | | | | |
| JAPAN - 8.0% | | | | | |
DENSO CORPORATION | | 3,393,734 | | | 101,096,900 |
FAST RETAILING CO., LTD. | | 430,450 | | | 74,818,831 |
HONDA MOTOR CO., LTD. | | 3,154,100 | | | 111,333,084 |
Mitsubishi Corporation | | 1,062,200 | | | 27,836,025 |
Mitsubishi UFJ Financial Group, Inc. | | 5,564,800 | | | 29,166,242 |
MITSUI & CO., LTD. | | 14,769,600 | | | 248,187,417 |
Nitori Co., Ltd. | | 1,015,050 | | | 77,086,908 |
SUZUKI MOTOR CORPORATION | | 5,331,006 | | | 117,636,810 |
The Tokyo Electric Power Company, Incorporated | | 1,550,100 | | | 41,318,314 |
| | | | | |
| | | | | 828,480,531 |
13
| | | | | |
| | | Shares
Held | | Value |
| | | | | |
| NETHERLANDS - 9.9% | | | | | |
Akzo Nobel N.V. | | 2,429,679 | | $ | 138,469,099 |
ASML Holding N.V. | | 13,736,782 | | | 490,928,021 |
ING Groep N.V.(1) | | 25,996,320 | | | 259,547,475 |
TNT NV | | 4,907,157 | | | 140,709,339 |
| | | | | |
| | | | | 1,029,653,934 |
| SINGAPORE - 1.6% | | | | | |
Genting Singapore PLC(1) | | 98,584,799 | | | 62,366,451 |
Oversea-Chinese Banking Corporation Limited | | 17,052,900 | | | 106,173,029 |
| | | | | |
| | | | | 168,539,480 |
| SPAIN - 0.7% | | | | | |
Industria de Diseno Textil, S.A. | | 1,182,433 | | | 77,944,205 |
| | | | | |
| SWEDEN - 1.2% | | | | | |
AB SKF, Class B | | 2,642,181 | | | 46,947,874 |
Sandvik AB | | 5,926,172 | | | 74,070,995 |
| | | | | |
| | | | | 121,018,869 |
| SWITZERLAND - 10.8% | | | | | |
Holcim Ltd.(1) | | 3,409,524 | | | 254,162,165 |
Nestle SA | | 5,815,029 | | | 297,810,666 |
Novartis AG | | 3,869,333 | | | 208,989,486 |
Roche Holding AG | | 340,244 | | | 56,761,115 |
Roche Holding AG - Genussscheine(2) | | 1,301,588 | | | 211,088,342 |
UBS AG(1) | | 5,658,391 | | | 91,981,052 |
| | | | | |
| | | | | 1,120,792,826 |
| TAIWAN - 1.4% | | | | | |
Taiwan Semiconductor Manufacturing Company Ltd. (DR) | | 12,262,088 | | | 128,629,303 |
Uni-President Enterprises Corp. | | 10,111,000 | | | 11,509,309 |
| | | | | |
| | | | | 140,138,612 |
| TURKEY - 0.0%(3) | | | | | |
Coca-Cola Icecek AS | | 348,439 | | | 2,961,531 |
| | | | | |
| UNITED KINGDOM - 11.8% | | | | | |
Carnival plc | | 591,478 | | | 24,279,195 |
Experian PLC | | 20,372,331 | | | 200,483,728 |
HSBC Holdings plc | | 18,787,002 | | | 190,609,357 |
Imperial Tobacco Group plc | | 6,064,662 | | | 184,982,687 |
Kingfisher PLC | | 33,175,167 | | | 107,936,001 |
National Grid PLC | | 5,432,144 | | | 52,880,598 |
Smith & Nephew PLC | | 12,080,417 | | | 120,349,719 |
Standard Chartered plc | | 1,553,099 | | | 42,363,952 |
Tesco plc | | 44,797,052 | | | 296,016,661 |
| | | | | |
| | | | | 1,219,901,898 |
| UNITED STATES - 5.0% | | | | | |
Accenture plc, Class A | | 3,807,576 | | | 159,727,813 |
Covidien plc | | 3,925,270 | | | 197,362,576 |
| | | | | | |
| | | Shares
Held | | Value |
| | | | | | |
| UNITED STATES (CONTINUED) | | | | | | |
Philip Morris International Inc. | | | 3,012,404 | | $ | 157,126,993 |
| | | | | | |
| | | | | | 514,217,382 |
| | | | | | |
Total common and preferred stocks (Cost $8,802,259,308) | | | | | | 10,237,492,465 |
| | |
| | | Par
Amount | | |
SHORT-TERM INVESTMENTS
(CASH EQUIVALENTS) - 1.0% | | | | | | |
Repurchase agreement with Fixed Income Clearing Corporation, 0.00%, dated 3/31/10, due 4/1/10, maturity value $102,820,000(4)
(Cost $102,820,000) | | $ | 102,820,000 | | | 102,820,000 |
| | | | | | |
| | | | | | |
Total investments - 99.9%
(Cost $8,905,079,308) | | | | | | 10,340,312,465 |
| | | | | | |
Other assets less liabilities - 0.1% | | | 7,101,289 |
| | | | | | |
| | | | | | |
Total net assets - 100.0%(5) | | | | | $ | 10,347,413,754 |
| | | | | | |
| (1) | Non-income producing security. |
| (3) | Represents less than 0.1% of total net assets. |
| | | | | | | | |
Issuer | | Rate | | | Maturity | | Value |
U.S. Treasury Note | | 3.375 | % | | 6/30/2013 | | $ | 104,878,862 |
| (5) | Percentages for the various classifications relate to total net assets. |
Company names are as reported by a data service provider and in some cases are translations; a company’s legal name may be different.
(DR) Depository Receipt, voting rights may vary.
14
| | | | | | |
| PORTFOLIO DIVERSIFICATION - MARCH 31, 2010 (Unaudited) | |
| | | Value | | Percentage
of Total
Net Assets | |
Consumer Discretionary | | $ | 1,543,877,894 | | 14.9 | % |
Consumer Staples | | | 1,321,577,830 | | 12.8 | |
Energy | | | 137,283,234 | | 1.3 | |
Financials | | | 2,701,200,473 | | 26.1 | |
Healthcare | | | 1,081,561,781 | | 10.5 | |
Industrials | | | 1,579,369,909 | | 15.3 | |
Information Technology | | | 830,495,837 | | 8.0 | |
Materials | | | 851,085,116 | | 8.2 | |
Utilities | | | 191,040,391 | | 1.8 | |
| | | | | | |
Total common and preferred stocks | | | 10,237,492,465 | | 98.9 | |
Short-term investments | | | 102,820,000 | | 1.0 | |
| | | | | | |
Total investments | | | 10,340,312,465 | | 99.9 | |
Other assets less liabilities | | | 7,101,289 | | 0.1 | |
| | | | | | |
Total net assets | | $ | 10,347,413,754 | | 100.0 | % |
| | | | | | |
| | | | | | |
| CURRENCY EXPOSURE - MARCH 31, 2010 (Unaudited) | |
| | | Value | | Percentage
of Total
Investments | |
Australian dollar | | $ | 19,661,049 | | 0.2 | % |
British pound | | | 1,186,324,204 | | 11.5 | |
Danish krone | | | 125,727,903 | | 1.2 | |
Euro | | | 4,135,271,047 | | 40.0 | |
Hong Kong dollar | | | 1,194,406,799 | | 11.6 | |
Indian rupee | | | 111,174,865 | | 1.1 | |
Japanese yen | | | 828,480,531 | | 8.0 | |
Singapore dollar | | | 168,539,480 | | 1.6 | |
Swedish krona | | | 121,018,869 | | 1.2 | |
Swiss franc | | | 1,120,792,826 | | 10.8 | |
Taiwan dollar | | | 11,509,309 | | 0.1 | |
Turkish lira | | | 2,961,531 | | 0.0 | (1) |
U.S. dollar | | | 1,314,444,052 | | 12.7 | |
| | | | | | |
Total investments | | $ | 10,340,312,465 | | 100.0 | % |
| | | | | | |
| (1) | Represents less than 0.1% of total investments. |
| | | | | |
| TOP TEN HOLDINGS - MARCH 31, 2010 (Unaudited) | |
Company Name | | Country | | Percentage
of Total
Net Assets | |
ASML Holding N.V. | | Netherlands | | 4.7 | % |
Linde AG | | Germany | | 3.0 | |
Nestle SA | | Switzerland | | 2.9 | |
Tesco plc | | United Kingdom | | 2.9 | |
Bayer AG | | Germany | | 2.8 | |
Roche Holding AG | | Switzerland | | 2.6 | |
Muenchener Rueckversicherungs-Gesellschaft AG | | Germany | | 2.6 | |
ING Groep N.V. | | Netherlands | | 2.5 | |
Holcim Ltd. | | Switzerland | | 2.5 | |
Pernod Ricard SA | | France | | 2.4 | |
| | | | | |
Total | | | | 28.9 | % |
| | | | | |
For the purpose of determining the Fund's top ten holdings, securities of the same issuer are aggregated to determine the weight in the Fund.
The accompanying notes are an integral part of the financial statements.
15
ARTISAN INTERNATIONAL VALUE FUND
Schedule of Investments – March 31, 2010 (Unaudited)
| | | | | |
| | | Shares
Held | | Value |
| | | | | |
COMMON STOCKS AND
EQUITY-LINKED SECURITIES - 92.4% | | | |
| | | | | |
| BELGIUM - 0.7% | | | | | |
Groupe Bruxelles Lambert S.A. | | 216,493 | | $ | 19,129,225 |
| | | | | |
| FRANCE - 12.0% | | | | | |
Gemalto NV(1) | | 961,919 | | | 41,626,892 |
Publicis Groupe | | 1,866,971 | | | 79,885,088 |
Societe Television Francaise 1 | | 3,682,460 | | | 68,313,994 |
Sodexo | | 1,265,854 | | | 75,655,389 |
Total SA | | 1,190,334 | | | 69,100,028 |
| | | | | |
| | | | | 334,581,391 |
| HONG KONG - 2.8% | | | | | |
Guoco Group Limited | | 7,488,800 | | | 78,319,292 |
| | | | | |
| IRELAND - 2.3% | | | | | |
Ryanair Holdings PLC, Equity-Linked Security, 144A(1)(2)(3)(4) | | 12,930,719 | | | 64,270,765 |
| | | | | |
| JAPAN - 8.8% | | | | | |
Aderans Holdings Company Limited | | 1,649,900 | | | 19,571,495 |
Credit Saison Co., Ltd. | | 4,611,159 | | | 71,517,601 |
Daiwa Securities Group Inc. | | 8,324,431 | | | 43,808,108 |
MEITEC CORPORATION | | 734,747 | | | 14,390,007 |
Mitsubishi UFJ Financial Group, Inc. | | 2,831,800 | | | 14,842,037 |
Mitsubishi UFJ Financial Group, Inc(4) | | 3,654,200 | | | 19,152,401 |
SANKYO CO., LTD. | | 1,036,438 | | | 51,273,139 |
SEINO HOLDINGS CO., LTD. | | 1,468,800 | | | 10,463,374 |
| | | | | |
| | | | | 245,018,162 |
| KOREA - 0.6% | | | | | |
Lotte Chilsung Beverage Co., Ltd. | | 21,573 | | | 16,492,682 |
| | | | | |
| NETHERLANDS - 1.0% | | | | | |
Wolters Kluwer NV | | 1,275,524 | | | 27,659,347 |
| | | | | |
| SINGAPORE - 0.1% | | | | | |
ARA Asset Management Limited | | 3,164,000 | | | 2,578,334 |
| | | | | |
| SWITZERLAND - 17.7% | | | |
Adecco SA | | 1,652,671 | | | 93,809,142 |
Givaudan SA | | 80,233 | | | 70,386,499 |
Nestle SA | | 882,371 | | | 45,189,714 |
Novartis AG | | 1,708,101 | | | 92,257,542 |
Panalpina Welttransport Holding AG | | 993,802 | | | 84,403,423 |
Pargesa Holding SA | | 1,134,566 | | | 96,304,682 |
| | | | | | |
| | | Shares
Held | | Value |
| | | | | | |
| SWITZERLAND (CONTINUED) | | | |
Tamedia AG | | | 124,422 | | $ | 10,148,228 |
| | | | | | |
| | | | | | 492,499,230 |
| UNITED KINGDOM - 32.4% | | | |
Brit Insurance Holdings NV | | | 2,978,456 | | | 34,011,526 |
Carpetright PLC | | | 1,710,914 | | | 20,770,483 |
Compass Group PLC | | | 9,483,880 | | | 75,700,756 |
Diageo plc | | | 5,282,285 | | | 88,655,438 |
Experian PLC | | | 15,100,173 | | | 148,600,520 |
Home Retail Group plc | | | 9,709,182 | | | 39,928,258 |
Lancashire Holdings Ltd | | | 4,037,560 | | | 29,495,346 |
Lloyds Banking Group plc(1) | | | 55,662,944 | | | 53,020,855 |
Qinetiq Group PLC | | | 19,855,890 | | | 40,375,934 |
Reed Elsevier PLC | | | 7,179,245 | | | 57,250,584 |
Royal Dutch Shell PLC, Class A | | | 1,742,447 | | | 50,398,850 |
Savills Plc | | | 6,146,972 | | | 32,461,524 |
Signet Jewelers Ltd.(1) | | | 4,147,639 | | | 134,134,645 |
Unilever plc (DR) | | | 2,987,517 | | | 87,474,498 |
Vitec Group PLC | | | 1,321,051 | | | 8,119,009 |
| | | | | | |
| | | | | | 900,398,226 |
| UNITED STATES - 14.0% | | | |
Accenture plc, Class A | | | 1,334,978 | | | 56,002,327 |
Arch Capital Group Ltd.(1)(5) | | | 1,465,031 | | | 111,708,614 |
Covidien plc | | | 2,198,645 | | | 110,547,871 |
Tyco Electronics Ltd. | | | 3,990,945 | | | 109,671,169 |
| | | | | | |
| | | | | | 387,929,981 |
| | | | | | |
Total common stocks and equity-linked securities
(Cost $2,210,364,223) | | | 2,568,876,635 |
| | |
| | | Par
Amount | | |
SHORT-TERM INVESTMENTS
(CASH EQUIVALENTS) - 6.7% | | | |
Repurchase agreement with Fixed Income Clearing Corporation, 0.00%, dated 3/31/10, due 4/1/10, maturity value $186,854,000(6)
(Cost $186,854,000) | | $ | 186,854,000 | | | 186,854,000 |
| | | | | | |
| | | | | | |
Total investments - 99.1%
(Cost $2,397,218,223) | | | 2,755,730,635 |
| | | | | | |
Other assets less liabilities - 0.9% | | | 24,083,422 |
| | | | | | |
| | | | | | |
Total net assets - 100.0%(7) | | $ | 2,779,814,057 |
| | | | | | |
16
| (1) | Non-income producing security. |
| (2) | Valued at a fair value in accordance with procedures established by the board of directors of Artisan Funds, Inc. In total, securities valued at a fair value were $64,270,765 or 2.3% of total net assets. |
| (3) | Security is an equity-linked participation certificate issued by HSBC Bank plc. As described in Note 2(i) in Notes to Financial Statements, equity-linked participation certificates are subject to counterparty risk with respect to the bank or broker-dealer that issues them. |
| (4) | Security is restricted. Ryanair Holdings PLC was acquired in a transaction under Rule 144A of the Securities Act of 1933, as amended. Restricted securities under Rule 144A may be resold in transactions exempt from registration normally to qualified institutional buyers. Mitsubishi UFJ Financial Group, Inc., was acquired in a private placement and is not deemed to be illiquid in the United States; however, the shares of the Mitsubishi UFJ Financial Group, Inc are freely tradeable outside the United States, where the Fund expects to trade them. |
| | | | | | | | | | | |
Security | | Acquisition
Dates | | Cost | | Value | | Percentage
of Total
Net Assets | |
Ryanair Holdings PLC | | 9/17/2008 -
3/31/2010 | | $ | 54,812,778 | | $ | 64,270,765 | | 2.3 | % |
Mitsubishi UFJ Financial Group, Inc. | | 12/14/2009 | | | 17,639,402 | | | 19,152,401 | | 0.7 | % |
| | | | | | | | | | | |
Total Restricted Securities | | | | | | | $ | 83,423,166 | | 3.0 | % |
| | | | | | | | | | | |
| (5) | Affiliated company as defined by the Investment Company Act of 1940, as amended. See Note (6) in Notes to Financial Statements. |
| | | | | | | | |
Issuer | | Rate | | | Maturity | | Value |
U.S. Treasury Note | | 1.375 | % | | 3/15/2012 | | $ | 36,854,350 |
U.S. Treasury Note | | 1.375 | | | 9/15/2012 | | | 153,738,388 |
| | | | | | | | |
| | | | | | | $ | 190,592,738 |
| | | | | | | | |
| (7) | Percentages for the various classifications relate to total net assets. |
Company names are as reported by a data service provider and in some cases are translations; a company’s legal name may be different.
(DR) Depository Receipt, voting rights may vary.
| | | | | | |
| PORTFOLIO DIVERSIFICATION - MARCH 31, 2010 (Unaudited) | |
| | | Value | | Percentage
of Total
Net Assets | |
Consumer Discretionary | | $ | 648,838,920 | | 23.3 | % |
Consumer Staples | | | 257,383,827 | | 9.3 | |
Energy | | | 119,498,878 | | 4.3 | |
Financials | | | 606,349,545 | | 21.8 | |
Healthcare | | | 202,805,413 | | 7.3 | |
Industrials | | | 456,313,165 | | 16.4 | |
Information Technology | | | 207,300,388 | | 7.5 | |
Materials | | | 70,386,499 | | 2.5 | |
| | | | | | |
Total common stocks | | | 2,568,876,635 | | 92.4 | |
Short-term investments | | | 186,854,000 | | 6.7 | |
| | | | | | |
Total investments | | | 2,755,730,635 | | 99.1 | |
Other assets less liabilities | | | 24,083,422 | | 0.9 | |
| | | | | | |
Total net assets | | $ | 2,779,814,057 | | 100.0 | % |
| | | | | | |
| | | | | | |
| CURRENCY EXPOSURE - MARCH 31, 2010 (Unaudited) | |
| | | Value | | Percentage
of Total
Investments | |
British pound | | $ | 628,390,233 | | 22.8 | % |
Euro | | | 496,039,578 | | 18.0 | |
Hong Kong dollar | | | 78,319,292 | | 2.8 | |
Japanese yen | | | 245,018,162 | | 8.9 | |
Korean won | | | 16,492,682 | | 0.6 | |
Singapore dollar | | | 2,578,334 | | 0.1 | |
Swiss franc | | | 492,499,230 | | 17.9 | |
U.S. dollar | | | 796,393,124 | | 28.9 | |
| | | | | | |
Total investments | | $ | 2,755,730,635 | | 100.0 | % |
| | | | | | |
| | | | | |
| TOP TEN HOLDINGS - MARCH 31, 2010 (Unaudited) | |
Company Name | | Country | | Percentage
of Total
Net Assets | |
Experian PLC | | United Kingdom | | 5.3 | % |
Signet Jewelers Ltd. | | United Kingdom | | 4.8 | |
Arch Capital Group Ltd. | | United States | | 4.0 | |
Covidien plc | | United States | | 4.0 | |
Tyco Electronics Ltd. | | United States | | 3.9 | |
Pargesa Holding SA | | Switzerland | | 3.5 | |
Adecco SA | | Switzerland | | 3.4 | |
Novartis AG | | Switzerland | | 3.3 | |
Diageo plc | | United Kingdom | | 3.2 | |
Unilever plc | | United Kingdom | | 3.1 | |
| | | | | |
Total | | | | 38.5 | % |
| | | | | |
For the purpose of determining the Fund’s top ten holdings, securities of the same issuer are aggregated to determine the weight in the Fund.
The Fund owns Pargesa Holding SA (Pargesa) which represents 3.5% of the Fund’s total net assets, and Groupe Bruxelles Lambert SA (GBL) which represents 0.7% of the Fund’s total net assests. Pargesa is the parent company of GBL. If aggregated, the Fund’s holdings of both securities would represent 4.2% of the Fund’s total net assets.
The accompanying notes are an integral part of the financial statements.
17
ARTISAN MID CAP FUND
Schedule of Investments – March 31, 2010 (Unaudited)
| | | | | |
| | | Shares
Held | | Value |
| | | | | |
| COMMON STOCKS - 97.8% | | | |
| | | | | |
| CONSUMER DISCRETIONARY - 19.9% | | | | | |
Auto Components - 1.8% | | | | | |
BorgWarner Inc.(1) | | 1,117,899 | | $ | 42,681,384 |
Johnson Controls, Inc. | | 1,235,662 | | | 40,764,489 |
| | | | | |
| | | | | 83,445,873 |
Distributors - 1.5% | | | | | |
LKQ Corporation(1) | | 3,464,201 | | | 70,323,280 |
| | | | | |
Hotels, Restaurants & Leisure - 5.8% | | | | | |
Chipotle Mexican Grill, Inc., Class A(1) | | 301,500 | | | 33,970,005 |
Ctrip.com International, Ltd. (DR)(1)(2) | | 2,054,100 | | | 80,520,720 |
Home Inns & Hotels Management, Inc. (DR)(1)(2) | | 787,500 | | | 25,782,750 |
Panera Bread Company, Class A(1) | | 115,100 | | | 8,803,999 |
Starbucks Corporation(1) | | 567,283 | | | 13,767,958 |
Starwood Hotels & Resorts Worldwide, Inc. | | 1,505,622 | | | 70,222,210 |
Wynn Resorts, Limited | | 485,300 | | | 36,800,299 |
| | | | | |
| | | | | 269,867,941 |
Household Durables - 2.7% | | | | | |
Gafisa S.A. (DR)(2) | | 2,436,900 | | | 33,483,006 |
Harman International Industries, Incorporated | | 1,962,900 | | | 91,824,462 |
| | | | | |
| | | | | 125,307,468 |
Multiline Retail - 3.3% | | | | | |
Kohl’s Corporation(1) | | 2,798,764 | | | 153,316,292 |
| | | | | |
Specialty Retail - 2.2% | | | | | |
Dick’s Sporting Goods, Inc., Class A(1) | | 2,094,400 | | | 54,684,784 |
O’Reilly Automotive, Inc.(1) | | 1,129,700 | | | 47,119,787 |
| | | | | |
| | | | | 101,804,571 |
Textiles, Apparel & Luxury Goods - 2.6% | | | | | |
Coach, Inc. | | 1,856,600 | | | 73,372,832 |
Polo Ralph Lauren Corporation, Class A | | 571,900 | | | 48,634,376 |
| | | | | |
| | | | | 122,007,208 |
| | | | | |
| | | | | |
| | | Shares
Held | | Value |
| | | | | |
| CONSUMER STAPLES - 1.6% |
Beverages - 1.6% | | | | | |
Hansen Natural Corporation(1) | | 1,710,712 | | $ | 74,210,687 |
| | | | | |
| ENERGY - 5.2% |
Energy Equipment & Services - 3.7% | | | | | |
Cameron International Corporation(1) | | 1,300,100 | | | 55,722,286 |
Dresser-Rand Group Inc.(1) | | 701,396 | | | 22,037,862 |
Smith International, Inc. | | 2,232,858 | | | 95,610,980 |
| | | | | |
| | | | | 173,371,128 |
Oil, Gas & Consumable Fuels - 1.5% | | | | | |
Range Resources Corporation | | 1,466,031 | | | 68,712,873 |
| | | | | |
| FINANCIALS - 5.3% | | | | | |
Capital Markets - 1.8% | | | | | |
Ares Capital Corporation | | 2,677,300 | | | 39,731,132 |
Greenhill & Co., Inc. | | 554,886 | | | 45,550,592 |
| | | | | |
| | | | | 85,281,724 |
Commercial Banks - 1.2% | | | | | |
FirstMerit Corporation | | 618,400 | | | 13,338,888 |
HDFC Bank Limited (DR)(2) | | 321,848 | | | 44,862,393 |
| | | | | |
| | | | | 58,201,281 |
Diversified Financial Services - 2.3% | | | | | |
CME Group Inc., Class A | | 334,841 | | | 105,846,589 |
| | | | | |
| HEALTHCARE - 15.7% | | | | | |
Biotechnology - 0.6% | | | | | |
Human Genome Sciences, Inc.(1) | | 519,100 | | | 15,676,820 |
Vertex Pharmaceuticals Incorporated(1) | | 297,400 | | | 12,154,738 |
| | | | | |
| | | | | 27,831,558 |
Health Care Equipment & Supplies - 2.8% | | | | | |
Edwards Lifesciences Corporation(1) | | 698,900 | | | 69,107,232 |
Intuitive Surgical, Inc.(1) | | 79,812 | | | 27,784,952 |
NuVasive, Inc.(1) | | 736,270 | | | 33,279,404 |
| | | | | |
| | | | | 130,171,588 |
Health Care Providers & Services - 1.5% | | | | | |
Community Health Systems, Inc.(1) | | 1,885,200 | | | 69,620,436 |
18
| | | | | |
| | | Shares
Held | | Value |
| | | | | |
| HEALTHCARE (CONTINUED) | | | | | |
Health Care Technology - 5.1% | | | |
athenahealth, Inc.(1)(3) | | 1,772,200 | | $ | 64,791,632 |
Cerner Corporation(1) | | 2,060,800 | | | 175,291,648 |
| | | | | |
| | | | | 240,083,280 |
Life Sciences Tools & Services - 1.5% | | | | | |
Illumina, Inc.(1) | | 1,824,796 | | | 70,984,564 |
| | | | | |
Pharmaceuticals - 4.2% | | | | | |
Allergan, Inc. | | 3,017,461 | | | 197,100,552 |
| | | | | |
| INDUSTRIALS - 12.9% | | | |
Aerospace & Defense - 3.1% | | | |
Precision Castparts Corp. | | 1,150,220 | | | 145,744,376 |
| | | | | |
Air Freight & Logistics - 1.9% | | | |
C.H. Robinson Worldwide, Inc. | | 614,702 | | | 34,331,107 |
Expeditors International of Washington, Inc. | | 1,545,227 | | | 57,049,781 |
| | | | | |
| | | | | 91,380,888 |
Construction & Engineering - 1.0% | | | |
AECOM Technology Corporation(1) | | 885,300 | | | 25,115,961 |
Fluor Corporation | | 499,319 | | | 23,223,327 |
| | | | | |
| | | | | 48,339,288 |
Electrical Equipment - 1.4% | | | |
Roper Industries, Inc. | | 1,176,054 | | | 68,022,963 |
| | | | | |
Machinery - 2.4% | | | |
Cummins Inc. | | 1,667,600 | | | 103,307,820 |
PACCAR Inc | | 250,006 | | | 10,835,260 |
| | | | | |
| | | | | 114,143,080 |
Professional Services - 1.3% | | | |
IHS Inc., Class A(1) | | 534,900 | | | 28,601,103 |
Verisk Analytics, Inc., Class A(1) | | 1,163,500 | | | 32,810,700 |
| | | | | |
| | | | | 61,411,803 |
Road & Rail - 1.3% | | | |
J.B. Hunt Transport Services, Inc. | | 1,682,226 | | | 60,358,269 |
| | | | | |
Trading Companies & Distributors - 0.5% | | | | | |
Watsco, Inc., Class A | | 410,800 | | | 23,366,304 |
| | | | | |
| INFORMATION TECHNOLOGY - 35.3% | | | |
Communications Equipment - 1.5% | | | |
Juniper Networks, Inc.(1) | | 2,319,827 | | | 71,172,292 |
| | | | | |
Computers & Peripherals - 1.5% | | | |
NetApp, Inc.(1) | | 2,172,675 | | | 70,742,298 |
| | | | | |
| | | Shares
Held | | Value |
| | | | | |
| INFORMATION TECHNOLOGY (CONTINUED) | | | | | |
Electronic Equipment & Instruments - 4.7% | | | | | |
Agilent Technologies, Inc.(1) | | 4,154,900 | | $ | 142,887,011 |
Trimble Navigation Limited(1) | | 2,663,799 | | | 76,504,307 |
| | | | | |
| | | | | 219,391,318 |
Internet Software & Services - 4.2% | | | | | |
GSI Commerce, Inc.(1) | | 1,767,800 | | | 48,915,026 |
MercadoLibre, Inc.(1) | | 1,614,100 | | | 77,815,761 |
NetEase.com, Inc. (DR)(1)(2) | | 129,200 | | | 4,582,724 |
Vistaprint N.V.(1) | | 1,188,100 | | | 68,018,725 |
| | | | | |
| | | | | 199,332,236 |
IT Services - 2.3% | | | |
Cognizant Technology Solutions Corporation, Class A(1) | | 730,700 | | | 37,251,086 |
The Western Union Company | | 4,070,947 | | | 69,043,261 |
| | | | | |
| | | | | 106,294,347 |
Semiconductors & Semiconductor Equipment - 8.8% | | | |
Analog Devices, Inc. | | 1,584,066 | | | 45,652,782 |
ARM Holdings PLC (DR)(2) | | 8,073,800 | | | 86,308,922 |
Broadcom Corporation, Class A | | 2,160,919 | | | 71,699,292 |
Cree, Inc.(1) | | 844,711 | | | 59,315,606 |
MEMC Electronic Materials, Inc.(1) | | 3,745,598 | | | 57,420,017 |
NVIDIA Corporation(1) | | 5,424,476 | | | 94,277,393 |
| | | | | |
| | | | | 414,674,012 |
Software - 12.3% | | | |
ANSYS, Inc.(1) | | 1,314,500 | | | 56,707,530 |
AsiaInfo Holdings, Inc.(1) | | 960,000 | | | 25,420,800 |
Autodesk, Inc.(1) | | 2,659,237 | | | 78,234,753 |
Blackboard Inc.(1) | | 1,321,100 | | | 55,037,026 |
Citrix Systems, Inc.(1) | | 2,417,060 | | | 114,737,838 |
Concur Technologies, Inc.(1) | | 525,900 | | | 21,567,159 |
Electronic Arts Inc.(1) | | 1,248,535 | | | 23,297,663 |
Mc Afee, Inc.(1) | | 459,728 | | | 18,448,885 |
Red Hat, Inc.(1) | | 2,071,188 | | | 60,623,673 |
salesforce.com, inc.(1) | | 686,535 | | | 51,112,531 |
SolarWinds, Inc.(1) | | 685,600 | | | 14,850,096 |
VMware, Inc., Class A(1) | | 1,102,502 | | | 58,763,357 |
| | | | | |
| | | | | 578,801,311 |
| MATERIALS - 1.9% | | | | | |
Chemicals - 1.9% | | | | | |
Agrium Inc.(2) | | 1,236,700 | | | 87,348,121 |
| | | | | |
Total common stocks
(Cost $3,419,949,319) | | | | | 4,588,011,799 |
19
| | | | | | | |
| | | Par
Amount | | Value | |
| | | | | | | |
SHORT-TERM INVESTMENTS
(CASH EQUIVALENTS) - 2.4% | | | | |
Repurchase agreement with Fixed
Income Clearing Corporation, 0.00%,
dated 3/31/10, due 4/1/10,
maturity value $113,520,000(4)
(Cost $113,520,000) | | $ | 113,520,000 | | $ | 113,520,000 | |
| | | | | | | |
| | | | | | | |
Total investments - 100.2%
(Cost $3,533,469,319) | | | | | | 4,701,531,799 | |
| | | | | | | |
Other assets less liabilities - (0.2%) | | | | | | (8,374,572 | ) |
| | | | | | | |
| | | | | | | |
Total net assets - 100.0%(5) | | | | | $ | 4,693,157,227 | |
| | | | | | | |
| (1) | Non-income producing security. |
| (2) | The Fund considers the company to be from outside of the United States. See the Fund’s Statement of Additional Information for information on how a particular country is assigned. |
| | | | |
Security | | Country | | Trading Currency |
Agrium Inc. | | Canada | | U.S. dollar |
ARM Holdings PLC (DR) | | United Kingdom | | U.S. dollar |
Ctrip.com International, Ltd. (DR) | | China | | U.S. dollar |
Gafisa S.A. (DR) | | Brazil | | U.S. dollar |
HDFC Bank Limited (DR) | | India | | U.S. dollar |
Home Inns & Hotels Management, Inc. (DR) | | China | | U.S. dollar |
NetEase.com, Inc. (DR) | | China | | U.S. dollar |
| (3) | Affiliated company as defined by the Investment Company Act of 1940, as amended. See Note (6) in Notes to Financial Statements. |
| | | | | |
Issuer | | Maturity | | Value |
U.S. Treasury Bill | | 4/22/2010 | | $ | 24,557,715 |
U.S. Treasury Bill | | 5/20/2010 | | | 91,236,749 |
| | | | | |
| | | | $ | 115,794,464 |
| | | | | |
| (5) | Percentages for the various classifications relate to total net assets. |
Company names are as reported by a data service provider and in some cases are translations; a company’s legal name may be different.
(DR) Depository Receipt, voting rights may vary.
| | | | | |
| TOP TEN HOLDINGS - MARCH 31, 2010 (Unaudited) | |
Company Name | | Country | | Percentage
of Total
Net Assets | |
Allergan, Inc. | | United States | | 4.2 | % |
Cerner Corporation | | United States | | 3.7 | |
Kohl’s Corporation | | United States | | 3.3 | |
Precision Castparts Corp. | | United States | | 3.1 | |
Agilent Technologies, Inc. | | United States | | 3.0 | |
Citrix Systems, Inc. | | United States | | 2.4 | |
CME Group Inc. | | United States | | 2.3 | |
Cummins Inc. | | United States | | 2.2 | |
Smith International, Inc. | | United States | | 2.0 | |
NVIDIA Corporation | | United States | | 2.0 | |
| | | | | |
Total | | | | 28.2 | % |
| | | | | |
For the purpose of determining the Fund’s top ten holdings, securities of the same issuer are aggregated to determine the weight in the Fund.
The accompanying notes are an integral part of the financial statements.
20
ARTISAN FUNDS, INC.
Statements of Assets and Liabilities – March 31, 2010 (Unaudited)
| | | | | | | | |
| | | EMERGING MARKETS | | | INTERNATIONAL | |
| ASSETS: | | | | | | | | |
Investments in securities, unaffiliated, at value | | $ | 270,126,326 | | | $ | 10,237,492,465 | |
Short-term investments (repurchase agreements), at value | | | 9,104,000 | | | | 102,820,000 | |
| | | | | | | | |
Total investments | | | 279,230,326 | | | | 10,340,312,465 | |
Cash | | | 273 | | | | 9,942,764 | |
Foreign currency | | | 279,923 | | | | 5,217,422 | |
Net unrealized gain on foreign currency forward contracts | | | 3,894 | | | | - | |
Receivable from investments sold | | | 1,777,772 | | | | 66,610,350 | |
Receivable from fund shares sold | | | 11,745,667 | | | | 23,716,640 | |
Dividends and interest receivable | | | 578,796 | | | | 22,531,513 | |
Receivable from Adviser | | | 141,861 | | | | - | |
Other assets | | | 1,846 | | | | 335,637 | |
| | | | | | | | |
Total assets | | | 293,760,358 | | | | 10,468,666,791 | |
| | |
| LIABILITIES: | | | | | | | | |
Net unrealized loss on foreign currency forward contracts | | | - | | | | 94,784 | |
Payable for investments purchased | | | 6,724,770 | | | | 101,301,739 | |
Payable for fund shares redeemed | | | 5,296 | | | | 14,432,846 | |
Payable for operating expenses | | | 424,956 | | | | 4,100,414 | |
Payable for withholding taxes | | | 213,553 | | | | 987,617 | |
Payable for deferred directors’ compensation | | | 1,846 | | | | 335,637 | |
| | | | | | | | |
Total liabilities | | | 7,370,421 | | | | 121,253,037 | |
| | | | | | | | |
Total net assets | | $ | 286,389,937 | | | $ | 10,347,413,754 | |
| | | | | | | | |
| NET ASSETS CONSIST OF: | | | | | | | | |
Fund shares issued and outstanding | | $ | 271,997,081 | | | $ | 11,611,798,446 | |
Net unrealized appreciation on investments and foreign currency related transactions | | | 38,462,925 | | | | 1,435,702,385 | |
Accumulated undistributed net investment loss | | | (1,053,593 | ) | | | (14,444 | ) |
Accumulated undistributed net realized losses on investments and foreign currency related transactions | | | (23,016,476 | ) | | | (2,700,072,633 | ) |
| | | | | | | | |
| | $ | 286,389,937 | | | $ | 10,347,413,754 | |
| | | | | | | | |
| SUPPLEMENTARY INFORMATION: | | | | | | | | |
Net assets | | | | | | | | |
Investor Shares | | | | | | $ | 7,898,468,881 | |
Institutional Shares | | $ | 145,946,526 | | | $ | 2,448,944,873 | |
Advisor Shares | | $ | 140,443,411 | | | | | |
Shares outstanding (Indefinite number of shares authorized, $0.01 par value) | | | | | | | | |
Investor Shares | | | | | | | 392,148,882 | |
Institutional Shares | | | 10,247,398 | | | | 120,851,920 | |
Advisor Shares | | | 9,843,299 | | | | | |
Net asset value, offering price and redemption price per share | | | | | | | | |
Investor Shares | | | | | | $ | 20.14 | |
Institutional Shares | | $ | 14.24 | | | $ | 20.26 | |
Advisor Shares | | $ | 14.27 | | | | | |
Cost of securities of unaffiliated issuers held | | $ | 240,583,385 | | | $ | 8,905,079,308 | |
Cost of foreign currency | | $ | 279,586 | | | $ | 5,218,900 | |
The accompanying notes are an integral part of the financial statements.
21
ARTISAN FUNDS, INC.
Statements of Assets and Liabilities – March 31, 2010 (Unaudited) (Continued)
| | | | | | | | |
| | | INTERNATIONAL VALUE | | | MID CAP | |
| ASSETS: | | | | | | | | |
Investments in securities, unaffiliated, at value | | $ | 2,457,168,021 | | | $ | 4,523,220,167 | |
Investments in securities, affiliated, at value | | | 111,708,614 | | | | 64,791,632 | |
Short-term investments (repurchase agreements), at value | | | 186,854,000 | | | | 113,520,000 | |
| | | | | | | | |
Total investments | | | 2,755,730,635 | | | | 4,701,531,799 | |
Cash | | | 297 | | | | 861 | |
Foreign currency | | | 29 | | | | - | |
Net unrealized gain on foreign currency forward contracts | | | 266,492 | | | | - | |
Receivable from investments sold | | | 563,677 | | | | 22,602,567 | |
Receivable from fund shares sold | | | 55,027,930 | | | | 5,599,555 | |
Dividends and interest receivable | | | 8,753,458 | | | | 784,684 | |
Other assets | | | 38,700 | | | | 125,928 | |
| | | | | | | | |
Total assets | | | 2,820,381,218 | | | | 4,730,645,394 | |
| | |
| LIABILITIES: | | | | | | | | |
Payable for investments purchased | | | 38,414,043 | | | | 29,298,029 | |
Payable for fund shares redeemed | | | 1,005,807 | | | | 5,501,114 | |
Payable for operating expenses | | | 648,542 | | | | 2,563,096 | |
Payable for withholding taxes | | | 460,069 | | | | - | |
Payable for deferred directors’ compensation | | | 38,700 | | | | 125,928 | |
| | | | | | | | |
Total liabilities | | | 40,567,161 | | | | 37,488,167 | |
| | | | | | | | |
Total net assets | | $ | 2,779,814,057 | | | $ | 4,693,157,227 | |
| | | | | | | | |
| NET ASSETS CONSIST OF: | | | | | | | | |
Fund shares issued and outstanding | | $ | 2,594,789,064 | | | $ | 4,317,541,199 | |
Net unrealized appreciation on investments and foreign currency related transactions | | | 358,608,929 | | | | 1,168,062,480 | |
Accumulated undistributed net investment loss | | | (15,129,185 | ) | | | (16,780,962 | ) |
Accumulated undistributed net realized losses on investments and foreign currency related transactions | | | (158,454,751 | ) | | | (775,665,490 | ) |
| | | | | | | | |
| | $ | 2,779,814,057 | | | $ | 4,693,157,227 | |
| | | | | | | | |
| SUPPLEMENTARY INFORMATION: | | | | | | | | |
Net assets | | | | | | | | |
Investor Shares | | $ | 2,291,129,889 | | | $ | 4,202,122,581 | |
Institutional Shares | | $ | 488,684,168 | | | $ | 491,034,646 | |
Shares outstanding (Indefinite number of shares authorized, $0.01 par value) | | | | | | | | |
Investor Shares | | | 95,215,974 | | | | 154,426,292 | |
Institutional Shares | | | 20,310,951 | | | | 17,508,599 | |
Net asset value, offering price and redemption price per share | | | | | | | | |
Investor Shares | | $ | 24.06 | | | $ | 27.21 | |
Institutional Shares | | $ | 24.06 | | | $ | 28.05 | |
Cost of securities of unaffiliated issuers held | | $ | 2,311,049,928 | | | $ | 3,462,424,376 | |
Cost of securities of affiliated issuers held | | $ | 86,168,295 | | | $ | 71,044,943 | |
Cost of foreign currency | | $ | 29 | | | | - | |
The accompanying notes are an integral part of the financial statements.
22
ARTISAN FUNDS, INC.
Statements of Operations – For the Six Months Ended March 31, 2010 (Unaudited)
| | | | | | | | |
| | | EMERGING
MARKETS | | | INTERNATIONAL | |
| INVESTMENT INCOME: | | | | | | | | |
Dividends, from unaffiliated issuers(1) | | $ | 1,225,176 | | | $ | 59,810,650 | |
Interest | | | 501 | | | | 17,449 | |
| | | | | | | | |
Total investment income | | | 1,225,677 | | | | 59,828,099 | |
| | |
| EXPENSES: | | | | | | | | |
Advisory fees | | | 1,110,713 | | | | 47,914,583 | |
Transfer agent fees | | | | | | | | |
Investor Shares | | | | | | | 8,388,380 | |
Institutional Shares | | | 8,492 | | | | 11,527 | |
Advisor Shares | | | 149,993 | | | | | |
Shareholder communications | | | | | | | | |
Investor Shares | | | | | | | 508,071 | |
Institutional Shares | | | 719 | | | | 14,220 | |
Advisor Shares | | | 16,272 | | | | | |
Custodian fees | | | 172,611 | | | | 1,818,931 | |
Accounting fees | | | 30,377 | | | | 31,250 | |
Professional fees | | | 41,191 | | | | 239,389 | |
Registration fees | | | | | | | | |
Investor Shares | | | | | | | 403,113 | |
Institutional Shares | | | 27,465 | | | | 8,812 | |
Advisor Shares | | | 76,409 | | | | | |
Directors’ fees | | | 3,464 | | | | 204,008 | |
Other operating expenses | | | 3,007 | | | | 261,514 | |
| | | | | | | | |
Total operating expenses | | | 1,640,713 | | | | 59,803,798 | |
| | | | | | | | |
Less amounts waived or paid by the Adviser | | | (141,861 | ) | | | - | |
| | | | | | | | |
Net Expenses | | | 1,498,852 | | | | 59,803,798 | |
| | | | | | | | |
Net investment income (loss) | | | (273,175 | ) | | | 24,301 | |
| | |
| NET REALIZED AND UNREALIZED GAINS (LOSSES) ON INVESTMENTS: | | | | | | | | |
Net realized gain (loss) on: | | | | | | | | |
Investments | | | 5,292,507 | | | | 18,329,042 | |
Foreign currency related transactions | | | (139,953 | ) | | | (1,830,151 | ) |
| | | | | | | | |
| | | 5,152,554 | | | | 16,498,891 | |
Net increase (decrease) in unrealized appreciation or depreciation on: | | | | | | | | |
Investments | | | 16,546,347 | | | | 87,246,355 | |
Foreign currency related transactions | | | (103,188 | ) | | | 1,678,265 | |
| | | | | | | | |
| | | 16,443,159 | | | | 88,924,620 | |
| | | | | | | | |
Net gain on investments and foreign currency related transactions | | | 21,595,713 | | | | 105,423,511 | |
| | | | | | | | |
Net increase in net assets resulting from operations | | $ | 21,322,538 | | | $ | 105,447,812 | |
| | | | | | | | |
| | | | | |
| (1) | | Fund | | Net of foreign taxes
withheld on dividends,
unaffiliated issuers |
| | Emerging Markets | | $ | 87,876 |
| | International | | | 5,217,031 |
The accompanying notes are an integral part of the financial statements.
23
ARTISAN FUNDS, INC.
Statements of Operations – For the Six Months Ended March 31, 2010 (Unaudited) (Continued)
| | | | | | | | |
| | | INTERNATIONAL VALUE | | | MID CAP | |
| INVESTMENT INCOME: | | | | | | | | |
Dividends, from unaffiliated issuers(1) | | $ | 26,925,750 | | | $ | 8,858,869 | |
Interest | | | 11,308 | | | | 8,876 | |
| | | | | | | | |
Total investment income | | | 26,937,058 | | | | 8,867,745 | |
| | |
| EXPENSES: | | | | | | | | |
Advisory fees | | | 11,098,993 | | | | 20,221,144 | |
Transfer agent fees | | | | | | | | |
Investor Shares | | | 1,919,440 | | | | 4,714,535 | |
Institutional Shares | | | 9,271 | | | | 9,177 | |
Shareholder communications | | | | | | | | |
Investor Shares | | | 94,892 | | | | 233,552 | |
Institutional Shares | | | 1,230 | | | | 3,392 | |
Custodian fees | | | 288,552 | | | | 44,884 | |
Accounting fees | | | 32,545 | | | | 24,111 | |
Professional fees | | | 50,028 | | | | 86,135 | |
Registration fees | | | | | | | | |
Investor Shares | | | 74,375 | | | | 56,896 | |
Institutional Shares | | | 15,517 | | | | 7,109 | |
Directors’ fees | | | 41,792 | | | | 91,644 | |
Other operating expenses | | | 26,874 | | | | 51,837 | |
| | | | | | | | |
Total operating expenses | | | 13,653,509 | | | | 25,544,416 | |
| | | | | | | | |
Net investment income (loss) | | | 13,283,549 | | | | (16,676,671 | ) |
| | |
| NET REALIZED AND UNREALIZED GAINS (LOSSES) ON INVESTMENTS: | | | | | | | | |
Net realized gain (loss) on: | | | | | | | | |
Investments(1) | | | (6,760,461 | ) | | | 16,628,580 | |
Foreign currency related transactions | | | (542,103 | ) | | | - | |
| | | | | | | | |
| | | (7,302,564 | ) | | | 16,628,580 | |
Net increase in unrealized appreciation or depreciation on: | | | | | | | | |
Investments | | | 168,549,557 | | | | 499,422,766 | |
Foreign currency related transactions | | | 36,405 | | | | - | |
| | | | | | | | |
| | | 168,585,962 | | | | 499,422,766 | |
| | | | | | | | |
Net gain on investments and foreign currency related transactions | | | 161,283,398 | | | | 516,051,346 | |
| | | | | | | | |
Net increase in net assets resulting from operations | | $ | 174,566,947 | | | $ | 499,374,675 | |
| | | | | | | | |
| | | | | | | | |
| (1) | | Fund | | Net of foreign taxes
withheld on dividends,
unaffiliated issuers | | Including net realized
gain (loss) on investments
from affiliated issuers |
| | International Value | | $ | 1,617,142 | | $ | 70,505 |
| | Mid Cap | | | 11,368 | | | - |
The accompanying notes are an integral part of the financial statements.
24
ARTISAN FUNDS, INC.
Statements of Changes in Net Assets
| | | | | | | | | | | | | | | | |
| | | EMERGING MARKETS | | | INTERNATIONAL | |
| | | Six Months Ended
3/31/2010(1) | | | Year Ended
9/30/2009 | | | Six Months Ended
3/31/2010(1) | | | Year Ended
9/30/2009 | |
| OPERATIONS: | | | | | | | | | | | | | | | | |
Net investment income (loss) | | $ | (273,175 | ) | | $ | 743,057 | | | $ | 24,301 | | | $ | 132,762,575 | |
Net realized gain (loss) on: | | | | | | | | | | | | | | | | |
Investments | | | 5,292,507 | | | | (26,362,147 | ) | | | 18,329,042 | | | | (2,628,919,339 | ) |
Foreign currency related transactions | | | (139,953 | ) | | | (230,806 | ) | | | (1,830,151 | ) | | | (2,414,432 | ) |
Net increase (decrease) in unrealized appreciation or depreciation on: | | | | | | | | | | | | | | | | |
Investments | | | 16,546,347 | | | | 52,745,622 | | | | 87,246,355 | | | | 2,629,216,166 | |
Foreign currency related transactions | | | (103,188 | ) | | | 20,169 | | | | 1,678,265 | | | | 613,814 | |
| | | | | | | | | | | | | | | | |
Net increase in net assets resulting from operations | | | 21,322,538 | | | | 26,915,895 | | | | 105,447,812 | | | | 131,258,784 | |
| | | | |
| DISTRIBUTIONS PAID TO SHAREHOLDERS: | | | | | | | | | | | | | | | | |
Net investment income: | | | | | | | | | | | | | | | | |
Investor Shares | | | | | | | | | | | (94,522,015 | ) | | | (73,117,872 | ) |
Institutional Shares | | | (988,454 | ) | | | (747,694 | ) | | | (34,565,734 | ) | | | (37,487,951 | ) |
Advisor Shares | | | (508,663 | ) | | | (51,612 | ) | | | | | | | | |
Net realized gains on investment transactions: | | | | | | | | | | | | | | | | |
Investor Shares | | | | | | | | | | | - | | | | (274,728,222 | ) |
Institutional Shares | | | - | | | | (59,063 | ) | | | - | | | | (101,344,058 | ) |
Advisor Shares | | | - | | | | (4,077 | ) | | | | | | | | |
| | | | | | | | | | | | | | | | |
Total distributions paid to shareholders | | | (1,497,117 | ) | | | (862,446 | ) | | | (129,087,749 | ) | | | (486,678,103 | ) |
| | | | |
| FUND SHARE ACTIVITIES: | | | | | | | | | | | | | | | | |
Net increase (decrease) in net assets resulting from fund share activities | | | 112,155,396 | | | | 55,346,259 | | | | (256,801,033 | ) | | | (820,456,337 | ) |
| | | | | | | | | | | | | | | | |
Total increase (decrease) in net assets | | | 131,980,817 | | | | 81,399,708 | | | | (280,440,970 | ) | | | (1,175,875,656 | ) |
| | | | | | | | | | | | | | | | |
Net assets, beginning of period | | | 154,409,120 | | | | 73,009,412 | | | | 10,627,854,724 | | | | 11,803,730,380 | |
| | | | | | | | | | | | | | | | |
Net assets, end of period | | $ | 286,389,937 | | | $ | 154,409,120 | | | $ | 10,347,413,754 | | | $ | 10,627,854,724 | |
| | | | | | | | | | | | | | | | |
| | | | | | | | | | | | | | | | |
Accumulated undistributed net investment income (loss) | | $ | (1,053,593 | ) | | $ | 716,697 | | | $ | (14,444 | ) | | $ | 129,049,002 | |
| | | | | | | | | | | | | | | | |
The accompanying notes are an integral part of the financial statements.
25
ARTISAN FUNDS, INC.
Statements of Changes in Net Assets (Continued)
| | | | | | | | | | | | | | | | |
| | | INTERNATIONAL VALUE | | | MID CAP | |
| | | Six Months Ended
3/31/2010(1) | | | Year Ended
9/30/2009 | | | Six Months Ended
3/31/2010(1) | | | Year Ended
9/30/2009 | |
| OPERATIONS: | | | | | | | | | | | | | | | | |
Net investment income (loss) | | $ | 13,283,549 | | | $ | 11,511,387 | | | $ | (16,676,671 | ) | | $ | (17,497,526 | ) |
Net realized gain (loss) on: | | | | | | | | | | | | | | | | |
Investments | | | (6,760,461 | ) | | | (139,186,395 | ) | | | 16,628,580 | | | | (769,509,214 | ) |
Foreign currency related transactions | | | (542,103 | ) | | | 9,770,470 | | | | - | | | | - | |
Net increase in unrealized appreciation or depreciation on: | | | | | | | | | | | | | | | | |
Investments | | | 168,549,557 | | | | 299,492,429 | | | | 499,422,766 | | | | 792,263,717 | |
Foreign currency related transactions | | | 36,405 | | | | 548,147 | | | | - | | | | - | |
| | | | | | | | | | | | | | | | |
Net increase in net assets resulting from operations | | | 174,566,947 | | | | 182,136,038 | | | | 499,374,675 | | | | 5,256,977 | |
| | | | |
| DISTRIBUTIONS PAID TO SHAREHOLDERS: | | | | | | | | | | | | | | | | |
Net investment income: | | | | | | | | | | | | | | | | |
Investor Shares | | | (34,819,928 | ) | | | (10,176,045 | ) | | | - | | | | - | |
Institutional Shares | | | (7,409,299 | ) | | | (2,362,145 | ) | | | - | | | | - | |
Net realized gains on investment transactions: | | | | | | | | | | | | | | | | |
Investor Shares | | | - | | | | - | | | | - | | | | (40,893,720 | ) |
Institutional Shares | | | - | | | | - | | | | - | | | | (5,219,106 | ) |
| | | | | | | | | | | | | | | | |
Total distributions paid to shareholders | | | (42,229,227 | ) | | | (12,538,190 | ) | | | - | | | | (46,112,826 | ) |
| | | | |
| FUND SHARE ACTIVITIES: | | | | | | | | | | | | | | | | |
Net increase (decrease) in net assets resulting from fund share activities | | | 627,730,685 | | | | 634,624,462 | | | | 50,716,869 | | | | (85,588,305 | ) |
| | | | | | | | | | | | | | | | |
Total increase (decrease) in net assets | | | 760,068,405 | | | | 804,222,310 | | | | 550,091,544 | | | | (126,444,154 | ) |
| | | | | | | | | | | | | | | | |
Net assets, beginning of period | | | 2,019,745,652 | | | | 1,215,523,342 | | | | 4,143,065,683 | | | | 4,269,509,837 | |
| | | | | | | | | | | | | | | | |
Net assets, end of period | | $ | 2,779,814,057 | | | $ | 2,019,745,652 | | | $ | 4,693,157,227 | | | $ | 4,143,065,683 | |
| | | | | | | | | | | | | | | | |
| | | | |
Accumulated undistributed net investment income (loss) | | $ | (15,129,185 | ) | | $ | 13,816,491 | | | $ | (16,780,962 | ) | | $ | (104,290 | ) |
| | | | | | | | | | | | | | | | |
The accompanying notes are an integral part of the financial statements.
26
[THIS PAGE INTENTIONALLY LEFT BLANK]
27
ARTISAN FUNDS, INC.
Financial Highlights – For a share outstanding throughout each period
The financial highlights table is intended to help you understand the Funds’ financial performance for the past 5 years or, if shorter, the period of a Fund’s operations. Certain information reflects financial results for a single Fund share. The total returns in the table represent the rate that an investor would have earned or lost on an investment in the Fund (assuming reinvestment of all dividends and distributions).
| | | | | | | | | | | | | | | | | | | | | | | | |
Year or
Period
Ended | | | Net Asset
Value
Beginning
of Period | | Net
Investment
Income
(Loss)(1) | | | Net Realized
and Unrealized
Gain (Loss) on
Investments | | | Total Income
(Loss) from
Investment
Operations | | | Dividends
from Net
Investment
Income | | | Distributions
from Net
Realized Gains | |
| | | | | | | | | | | | | | | | | | | | | | | | |
ARTISAN EMERGING MARKETS FUND | |
| Institutional Shares | | | | | | | | | | | | | | | | | | | | | | | | |
| 3/31/2010 | (5) | | $ | 13.02 | | $ | (0.02 | ) | | $ | 1.35 | | | $ | 1.33 | | | $ | (0.11 | ) | | $ | - | |
| 9/30/2009 | | | | 11.15 | | | 0.09 | | | | 1.91 | | | | 2.00 | | | | (0.12 | ) | | | (0.01 | ) |
| 9/30/2008 | | | | 16.71 | | | 0.18 | | | | (5.41 | ) | | | (5.23 | ) | | | (0.01 | ) | | | (0.32 | ) |
| 9/30/2007 | | | | 11.15 | | | 0.09 | | | | 5.81 | | | | 5.90 | | | | (0.03 | ) | | | (0.31 | ) |
| 9/30/2006 | (6) | | | 10.00 | | | 0.03 | | | | 1.12 | | | | 1.15 | | | | - | | | | - | |
| | | | | | | | | | | | | | | | | | | | | | | | |
ARTISAN INTERNATIONAL FUND | |
| Institutional Shares | | | | | | | | | | | | | | | | | | | | | | | | |
| 3/31/2010 | (5) | | $ | 20.29 | | $ | 0.02 | | | $ | 0.23 | | | $ | 0.25 | | | $ | (0.28 | ) | | $ | - | |
| 9/30/2009 | | | | 20.51 | | | 0.28 | | | | 0.46 | | | | 0.74 | | | | (0.26 | ) | | | (0.70 | ) |
| 9/30/2008 | | | | 33.99 | | | 0.42 | | | | (9.16 | ) | | | (8.74 | ) | | | (0.27 | ) | | | (4.47 | ) |
| 9/30/2007 | | | | 28.92 | | | 0.37 | | | | 7.52 | | | | 7.89 | | | | (0.49 | ) | | | (2.33 | ) |
| 9/30/2006 | | | | 24.54 | | | 0.22 | | | | 4.62 | | | | 4.84 | | | | (0.46 | ) | | | - | |
| 9/30/2005 | | | | 19.44 | | | 0.25 | | | | 5.01 | | | | 5.26 | | | | (0.16 | ) | | | - | |
| (1) | Computed based on average shares outstanding. |
| (2) | Periods less than twelve months (where applicable) are not annualized. |
| (3) | Periods less than twelve months (where applicable) are annualized. |
| (4) | The ratios of expenses to average net assets and net investment income (loss) to average net assets exclude expenses waived or paid by the Adviser or the board of directors. Absent expenses waived or paid by the Adviser or the board of directors, the ratios of expenses to average net assets and net investment income (loss) to average net assets would have been as follows: |
| | | | | | | | |
| | | Year or
Period Ended | | Ratio of Expenses to
Average Net Assets | | | Ratio of Net Investment Income
(Loss) to Average Net Assets | |
Emerging Markets Institutional Shares | | 9/30/2009 | | 1.81 | % | | 0.71 | % |
| | 9/30/2008 | | 1.51 | % | | 1.16 | % |
| | 9/30/2007 | | 3.19 | % | | (1.08 | )% |
| | 9/30/2006 | | 7.58 | % | | (5.11 | )% |
| (5) | Unaudited. For the six months ended March 31, 2010. |
| (6) | For the period from commencement of operations (June 26, 2006) through September 30, 2006. |
28
| | | | | | | | | | | | | | | | | | | | |
Total
Distributions | | | Net Asset
Value
End of
Period | | Total
Return(2) | | | Net Assets
End of
Period
(millions) | | Ratio of
Expenses
to Average
Net Assets(3)(4) | | | Ratio of Net
Investment
Income (Loss)
to Average
Net Assets(3)(4) | | | Portfolio
Turnover
Rate(2) | |
| | | | | | | | | | | | | | | | | | | | |
| | | | | | | | | | | | | | | | | |
| | | | | | | | | | | | | | | | | | | | | |
| $ | (0.11 | ) | | $ | 14.24 | | 10.27 | % | | $ | 145.9 | | 1.36 | % | | (0.24 | )% | | 11.99 | % |
| | (0.13 | ) | | | 13.02 | | 18.66 | | | | 104.0 | | 1.50 | | | 1.02 | | | 56.88 | |
| | (0.33 | ) | | | 11.15 | | (31.91 | ) | | | 69.8 | | 1.50 | | | 1.17 | | | 42.24 | |
| | (0.34 | ) | | | 16.71 | | 53.99 | | | | 18.4 | | 1.44 | | | 0.67 | | | 71.28 | |
| | - | | | | 11.15 | | 11.50 | | | | 5.9 | | 1.40 | | | 1.07 | | | 24.26 | |
| | | | | | | | | | | | | | | | | | | | |
| | | | | | | | | | | | | | | | | |
| | | | | | | | | | | | | | | | | | | | | |
| $ | (0.28 | ) | | $ | 20.26 | | 1.24 | % | | $ | 2,448.9 | | 0.98 | % | | 0.18 | % | | 36.53 | % |
| | (0.96 | ) | | | 20.29 | | 5.25 | | | | 2,912.7 | | 0.99 | | | 1.76 | | | 82.38 | |
| | (4.74 | ) | | | 20.51 | | (29.83 | ) | | | 3,043.8 | | 0.98 | | | 1.50 | | | 54.42 | |
| | (2.82 | ) | | | 33.99 | | 28.99 | | | | 5,049.3 | | 0.98 | | | 1.22 | | | 66.30 | |
| | (0.46 | ) | | | 28.92 | | 20.07 | | | | 4,116.0 | | 1.00 | | | 0.82 | | | 57.80 | |
| | (0.16 | ) | | | 24.54 | | 27.21 | | | | 3,988.1 | | 0.99 | | | 1.11 | | | 56.15 | |
The accompanying notes are an integral part of the financial statements.
29
ARTISAN FUNDS, INC.
Financial Highlights – For a share outstanding throughout each period (Continued)
| | | | | | | | | | | | | | | | | | | | | | | | |
Year or
Period
Ended | | |
Net Asset
Value
Beginning
of Period | | Net
Investment
Income
(Loss)(1) | | | Net Realized
and Unrealized
Gain (Loss) on
Investments | | | Total Income
(Loss) from
Investment
Operations | | | Dividends
from Net
Investment
Income | | | Distributions
from Net
Realized Gains | |
| | | | | | | | | | | | | | | | | | | | | | | | |
ARTISAN INTERNATIONAL VALUE FUND | | | | | | | | | | | | | | | | | |
| Institutional Shares | | | | | | | | | | | | | | | | | | | | | | | | |
| 3/31/2010 | (4) | | $ | 22.83 | | $ | 0.16 | | | $ | 1.52 | | | $ | 1.68 | | | $ | (0.45 | ) | | $ | - | |
| 9/30/2009 | | | | 21.22 | | | 0.21 | | | | 1.66 | | | | 1.87 | | | | (0.26 | ) | | | - | |
| 9/30/2008 | | | | 28.53 | | | 0.52 | | | | (5.58 | ) | | | (5.06 | ) | | | (0.58 | ) | | | (1.67 | ) |
| 9/30/2007 | | | | 26.71 | | | 0.41 | | | | 3.14 | | | | 3.55 | | | | (0.45 | ) | | | (1.28 | ) |
| | | | | | | | | | | | | | | | | | | | | | | | |
ARTISAN MID CAP FUND | | | | | | | | | | | | | | | | | |
| Institutional Shares | | | | | | | | | | | | | | | | | | | | | | | | |
| 3/31/2010 | (4) | | $ | 25.00 | | $ | (0.07 | ) | | $ | 3.12 | | | $ | 3.05 | | | $ | - | | | $ | - | |
| 9/30/2009 | | | | 24.71 | | | (0.06 | ) | | | 0.63 | | | | 0.57 | | | | - | | | | (0.28 | ) |
| 9/30/2008 | | | | 37.78 | | | (0.14 | ) | | | (7.03 | ) | | | (7.17 | ) | | | - | | | | (5.90 | ) |
| 9/30/2007 | | | | 32.24 | | | (0.16 | ) | | | 9.17 | | | | 9.01 | | | | - | | | | (3.47 | ) |
| 9/30/2006 | | | | 31.21 | | | (0.10 | ) | | | 2.46 | | | | 2.36 | | | | - | | | | (1.33 | ) |
| 9/30/2005 | | | | 26.38 | | | (0.12 | ) | | | 4.95 | | | | 4.83 | | | | - | | | | - | |
| (1) | Computed based on average shares outstanding. |
| (2) | Periods less than twelve months (where applicable) are not annualized. |
| (3) | Periods less than twelve months (where applicable) are annualized. |
| (4) | Unaudited. For the six months ended March 31, 2010. |
30
| | | | | | | | | | | | | | | | | | | | |
Total
Distributions | | | Net Asset
Value
End of
Period | | Total
Return(2) | | | Net Assets
End of
Period
(millions) | | Ratio of
Expenses
to Average
Net Assets(3) | | | Ratio of Net
Investment
Income (Loss)
to Average
Net Assets(3) | | | Portfolio
Turnover
Rate(2) | |
| | | | | | | | | | | | | | | | | | | | |
| | | | | | | | | | | | | | | | | |
| | | | | | | | | | | | | | | | | | | | | |
| $ | (0.45 | ) | | $ | 24.06 | | 7.49 | % | | $ | 488.7 | | 1.00 | % | | 1.35 | % | | 10.57 | % |
| | (0.26 | ) | | | 22.83 | | 9.14 | | | | 280.2 | | 1.04 | | | 1.17 | | | 55.49 | |
| | (2.25 | ) | | | 21.22 | | (18.92 | ) | | | 186.1 | | 1.03 | | | 2.10 | | | 44.72 | |
| | (1.73 | ) | | | 28.53 | | 13.48 | | | | 218.9 | | 1.06 | | | 1.47 | | | 45.60 | |
| | | | | | | | | | | | | | | | | | | | |
| | | | | | | | | | | | | | | | | |
| | | | | | | | | | | | | | | | | | | | | |
| $ | - | | | $ | 28.05 | | 12.16 | % | | $ | 491.0 | | 0.96 | % | | (0.55 | )% | | 32.42 | % |
| | (0.28 | ) | | | 25.00 | | 2.77 | | | | 454.5 | | 0.97 | | | (0.32 | ) | | 68.39 | |
| | (5.90 | ) | | | 24.71 | | (22.23 | ) | | | 537.2 | | 0.95 | | | (0.46 | ) | | 79.76 | |
| | (3.47 | ) | | | 37.78 | | 30.17 | | | | 785.4 | | 0.95 | | | (0.47 | ) | | 71.04 | |
| | (1.33 | ) | | | 32.24 | | 7.66 | | | | 797.9 | | 0.95 | | | (0.31 | ) | | 73.59 | |
| | - | | | | 31.21 | | 18.35 | | | | 981.3 | | 0.95 | | | (0.40 | ) | | 83.00 | |
The accompanying notes are an integral part of the financial statements.
31
ARTISAN FUNDS, INC.
Notes to Financial Statements – March 31, 2010 (Unaudited)
Artisan Funds, Inc. (“Artisan Funds”) was incorporated on January 5, 1995, as a Wisconsin corporation and is registered under the Investment Company Act of 1940, as amended. Artisan Funds is a series comprised of twelve open-end, diversified mutual funds. Artisan Emerging Markets Fund (“Emerging Markets Fund” or “Emerging Markets”), Artisan International Fund (“International Fund” or “International”), Artisan International Value Fund (“International Value Fund” or “International Value”) and Artisan Mid Cap Fund (“Mid Cap Fund” or “Mid Cap”), each a series of Artisan Funds (each a “Fund,” and collectively, the “Funds”), commenced operations on June 26, 2006, December 28, 1995, September 23, 2002 and June 27, 1997, respectively. Each Fund’s investment objective is to seek long-term capital growth.
Emerging Markets Fund offers shares of capital stock of two classes – Institutional Shares and Advisor Shares – and has offered Institutional Shares since the commencement of operations and began offering Advisor Shares on June 2, 2008. Advisor Shares are sold to employee benefit plans, clients of financial advisors, clients of sponsored programs and institutional or other investors. All investments and exchanges are subject to approval by the Fund. International Fund, International Value Fund and Mid Cap Fund offer shares of capital stock of two classes – Institutional Shares and Investor Shares – and have offered Investor Shares since the commencement of operations. International Fund, International Value Fund and Mid Cap Fund began offering Institutional Shares on July 1, 1997, October 1, 2006 and July 1, 2000, respectively. Institutional Shares are sold to institutional investors meeting certain minimum investment requirements.
Each class of shares has equal rights with respect to portfolio assets and voting privileges. Each class has exclusive voting rights with respect to any matters involving only that class.
Income, expenses not specific to a particular class and realized and unrealized gains and losses were allocated daily to each class of shares based upon the relative net asset value of outstanding shares. Expenses attributable to a particular class of shares, such as transfer agency fees, shareholder communication expenses and registration fees, were allocated directly to that class.
Each Fund is managed by Artisan Partners Limited Partnership (the “Adviser”). The Adviser is wholly owned by Artisan Partners Holdings LP (“Artisan Holdings”).
| (2) | Summary of significant accounting policies: |
The following is a summary of significant accounting policies of the Funds in effect during the period covered by the financial statements, which were in accordance with United States generally accepted accounting principles.
| (a) | Security valuation – The net asset value (“NAV”) of the shares of each class of each Fund was determined as of the close of regular session trading on the New York Stock Exchange (“NYSE”) (usually 4:00 p.m., Eastern Time) each day the NYSE was open for regular session trading. The NAV of each class of shares was determined by dividing the value of each Fund’s securities and other assets attributed to that class, less |
32
NOTES TO FINANCIAL STATEMENTS (UNAUDITED)
| | its liabilities attributed to that class, by the number of outstanding shares of that class of that Fund. |
In determining NAV, each equity security traded on a securities exchange, including the Nasdaq Stock Market and over-the-counter securities, was valued at the closing price as of the time of valuation on the exchange or market designated by the Fund’s accounting agent or pricing vendor as the principal exchange (the “principal exchange”). The closing price provided by the pricing vendor for a principal exchange may differ and may represent information such as last sales price, an official closing price, a closing auction price or other information, depending on exchange or market convention. Absent closing price information from the principal exchange as of the time of valuation, the security was valued using the closing price on another exchange on which the security traded (if such price is made available by the pricing vendor) or the most recent bid quotation on the principal exchange or, if not available, another exchange or in the over-the-counter market, except that securities listed on the London Stock Exchange were valued at the mean of the most recent bid and asked quotations as of the time of valuation. Short-term investments, other than repurchase agreements, maturing within sixty days from the valuation date were valued at amortized cost, which approximates market value.
Securities for which prices were not readily available were valued by Artisan Funds’ valuation committee (the “valuation committee”) at a fair value determined in good faith under procedures established by and under the general supervision of Artisan Funds’ board of directors (the “board of directors”). A price was considered to be not readily available if, among other things, the valuation committee believed that the price determined as described in the preceding paragraph did not reflect a fair value of the security.
Emerging Markets Fund, International Fund, and International Value Fund generally invested a significant portion, and perhaps as much as substantially all, of their total assets in securities principally traded in markets outside the U.S. The foreign markets in which the Funds invested were sometimes open on days when the NYSE was not open and the Funds did not calculate their NAVs, and sometimes were not open on days when the Funds did calculate their NAVs. Even on days on which both the foreign market and the NYSE were open, several hours may have passed between the time when trading in the foreign market closed and the time as of which the Funds calculate their NAVs. That was generally the case for markets in Europe, Asia, Australia and other far eastern markets; the regular closing time of foreign markets in North and South America was generally the same as the closing time of the NYSE and the time as of which the Funds calculated their NAVs.
The valuation committee concluded that a price determined under the Funds’ valuation procedures was not readily available if, among other things, the valuation committee believed that the value of the security might have been materially affected by events occurring after the close of the market in which the security was principally traded but before the time for determination of NAV (“subsequent event”). A subsequent event might include a company-specific development (for example, announcement of a merger that is made after the close of the foreign market), a development that might affect an entire market or region (for example, imposition of
33
NOTES TO FINANCIAL STATEMENTS (UNAUDITED)
foreign exchange controls by a foreign government), a potentially global development (such as a terrorist attack that may be expected to have an impact on investor expectations worldwide) or a significant change in one or more U.S. securities indexes. Artisan Funds monitored for subsequent events using several tools. An indication by any of those tools of a potential material change in the value of securities resulted in either a meeting of the valuation committee, which considered whether a subsequent event had occurred and whether local market closing prices continued to represent fair values for potentially affected non-U.S. securities, and/or a valuation based on information provided by a third party research service. This third party research service was used to assist in determining estimates of fair values for foreign securities. That service utilized statistical data based on historical performance of securities, markets and other data in developing factors used to estimate a fair value.
Estimates of fair values utilized by the Funds as described above may differ from the value realized on the subsequent sale of those securities and from quoted or published prices for those securities. The differences may have been material to the NAV of the applicable Fund or to the information presented.
Foreign stocks as an asset class may underperform U.S. stocks, and foreign stocks may be more volatile than U.S. stocks. Risks relating to investment in foreign securities (including, but not limited to, depositary receipts and participation certificates) include: currency exchange rate fluctuation; less available public information about the issuers of securities; less stringent regulatory standards; lack of uniform accounting, auditing and financial reporting standards; and country risks including less liquidity, high inflation rates, unfavorable economic practices and political instability.
The risks of foreign investments are typically greater in emerging and less developed markets. For example, political and economic structures in these less developed countries may be new and changing rapidly, which may cause instability and greater risk of loss. Their securities markets may be less developed, and securities in those markets are generally more volatile and less liquid than those in the developed markets. Emerging market countries also are more likely to experience high levels of inflation, deflation or currency devaluations, which could hurt their economies and securities markets. Certain emerging markets also may face other significant internal or external risks, including a heightened risk of war, and ethnic, religious and racial conflicts. In addition, governments in many emerging market countries participate to a significant degree in their economies and securities markets, which may impair investment and economic growth of companies in those markets. High levels of national debt tend to make such markets also heavily reliant on foreign capital and, therefore, vulnerable to capital flight.
| (b) | Fair Value Measurements – Under generally accepted accounting principles for fair value measurement, accounting standards clarify the definition of fair value for financial reporting, establish a framework for measuring fair value and require additional disclosures about the use of fair value measurements. In accordance with this standard, fair value is defined as the price that each Fund would receive upon selling an investment in an orderly transaction to an independent buyer in the principal or most advantageous market of the investment. The standard establishes a three-tier hierarchy to distinguish between (1) inputs that reflect the assumptions |
34
NOTES TO FINANCIAL STATEMENTS (UNAUDITED)
| | market participants would use in pricing an asset or liability developed based on the market data obtained from sources independent of the reporting entity (observable inputs) and (2) inputs that reflect the reporting entity’s own assumptions about the assumptions market participants would use in pricing an asset or liability developed based on the best information available in the circumstances (unobservable inputs) and to establish classification of fair value measurements for disclosure purposes. Various inputs are used in determining the value of the Funds’ investments. The three-tier hierarchy of inputs is summarized in three broad levels: |
| | • | | Level 1 – quoted prices in active markets for identical investments |
| | • | | Level 2 – other significant observable inputs (including but not limited to quoted prices for similar securities, interest rates, credit risks, etc.) |
| | • | | Level 3 – significant unobservable inputs (including the Funds’ own assumptions in determining the fair value of investments) |
The inputs or methodology used for valuing securities are not necessarily an indication of the risk or liquidity associated with investing in those securities.
The following table summarizes each Fund’s investments, based on the inputs used to determine their fair values as of March 31, 2010:
| | | | | | | | | | | | |
| Fund | | Level 1 - Quoted
Prices | | Level 2 - Other Significant
Observable Inputs | | Level 3 - Significant
Unobservable Inputs | | Total |
Emerging Markets | | | | | | | | | | | | |
Equity Securities(1) | | | | | | | | | | | | |
Emerging Asia | | $ | 120,758,237 | | $ | - | | $ | - | | $ | 120,758,237 |
Latin America | | | 71,059,360 | | | - | | | - | | | 71,059,360 |
Emerging Europe, Middle East & Africa | | | 70,161,766 | | | 1,444,259 | | | - | | | 71,606,025 |
Developed Markets | | | 6,702,704 | | | - | | | - | | | 6,702,704 |
Repurchase Agreements | | | - | | | 9,104,000 | | | - | | | 9,104,000 |
Total | | $ | 268,682,067 | | $ | 10,548,259 | | $ | - | | $ | 279,230,326 |
International | | | | | | | | | | | | |
Equity Securities(1) | | | | | | | | | | | | |
Americas | | $ | 751,464,191 | | $ | - | | $ | - | | $ | 751,464,191 |
Emerging Markets | | | 1,317,290,822 | | | - | | | - | | | 1,317,290,822 |
Europe | | | 6,722,712,543 | | | - | | | - | | | 6,722,712,543 |
Pacific Basin | | | 1,446,024,909 | | | - | | | - | | | 1,446,024,909 |
Repurchase Agreements | | | - | | | 102,820,000 | | | - | | | 102,820,000 |
Total | | $ | 10,237,492,465 | | $ | 102,820,000 | | $ | - | | $ | 10,340,312,465 |
35
NOTES TO FINANCIAL STATEMENTS (UNAUDITED)
| | | | | | | | | | | | |
| Fund | | Level 1 - Quoted
Prices | | Level 2 - Other Significant
Observable Inputs | | Level 3 - Significant
Unobservable Inputs | | Total |
International Value | | | | | | | | | | | | |
Equity Securities(1) | | | | | | | | | | | | |
Americas | | $ | 387,929,981 | | $ | - | | $ | - | | $ | 387,929,981 |
Emerging Markets | | | 16,492,682 | | | - | | | - | | | 16,492,682 |
Europe | | | 1,774,267,419 | | | 64,270,765 | | | - | | | 1,838,538,184 |
Pacific Basin | | | 325,915,788 | | | - | | | - | | | 325,915,788 |
Repurchase Agreements | | | - | | | 186,854,000 | | | - | | | 186,854,000 |
Total | | $ | 2,504,605,870 | | $ | 251,124,765 | | $ | - | | $ | 2,755,730,635 |
Mid Cap | | | | | | | | | | | | |
Equity Securities(1) | | $ | 4,588,011,799 | | | - | | $ | - | | $ | 4,588,011,799 |
Repurchase Agreements | | | - | | $ | 113,520,000 | | | - | | | 113,520,000 |
Total | | $ | 4,588,011,799 | | $ | 113,520,000 | | $ | - | | $ | 4,701,531,799 |
|
(1)See Fund’s Schedule of Investments for sector or country classifications. |
| (c) | Income taxes – No provision was made for federal income taxes or excise taxes since each Fund intends to (i) comply with the provisions of Subchapter M of the Internal Revenue Code applicable to regulated investment companies and (ii) distribute to its shareholders substantially all of its taxable income as well as net realized gains from the sale of investment securities. The Funds may utilize earnings and profits distributed to shareholders on redemptions of Fund shares as part of the dividends paid deduction. |
The Funds have analyzed the tax positions taken on federal income tax returns for all open tax years and have concluded that as of March 31, 2010, no provision for income tax is required in the Funds’ financial statements. The Funds’ federal and state income and federal excise tax returns for tax years for which the applicable statutes of limitations have not expired are subject to examination by the Internal Revenue Service and state department of revenue.
The Funds may be subject to taxes on realized gains from the sale of investment securities imposed by certain countries in which the Funds invest. The foreign tax expense, if any, was recorded on an accrual basis and is included in “Payable for withholding taxes” on the accompanying Statements of Assets and Liabilities.
| (d) | Portfolio transactions – In determining a Fund’s NAV, security transactions and shareholder transactions were accounted for no later than one business day after trade date, in accordance with applicable law. However, for financial reporting purposes, security transactions and shareholder transactions were recorded on trade date in accordance with United States generally accepted accounting principles. Net realized gains and losses on securities were computed on specific security lot identification. |
| (e) | Foreign currency translation – Values of foreign investments, open foreign currency forward contracts, payables for capital gains taxes and cash denominated in foreign currencies were translated into U.S. dollars using a spot market rate of exchange as of the time of determination of each Fund’s NAV on the day of valuation. Payables and receivables for securities transactions, dividend and reclaim receivables and other receivables and payables denominated in a foreign currency were translated into U.S. |
36
NOTES TO FINANCIAL STATEMENTS (UNAUDITED)
| | dollars using a spot market rate of exchange as of 12:00 p.m. (Eastern Time) on the day of valuation. Purchases and sales of investments and dividend and interest income were translated into U.S. dollars using a spot market rate of exchange as of 12:00 p.m. (Eastern Time) on the date of such transactions. The portion of security gains or losses resulting from changes in foreign exchange rates was included with net realized and unrealized gain or loss from investments, as appropriate, for both financial reporting and tax purposes. |
The Funds may enter into foreign currency forward contracts to hedge the foreign currency exposure on open payables and receivables. These foreign currency forward contracts, or spot contracts, generally settle within two business days. The Funds also may enter into foreign currency forward contracts to hedge against foreign currency exchange rate risks on its non-U.S. dollar denominated investment securities, although they generally do not do so. Foreign currency forward contracts were recorded at market value and any related realized and unrealized gains and losses were reported as foreign currency related transactions for financial reporting purposes. For tax purposes, these foreign exchange gains and losses were treated as ordinary income or loss. The Funds could be exposed to loss if the counterparties fail to perform under these contracts.
Other foreign currency related transaction gains and losses may result from currency gains and losses realized from the difference between the amounts of dividends and foreign withholding taxes recorded on the Funds’ books and the U.S. dollar equivalent of the amounts actually received or paid. The net increase (decrease) in unrealized appreciation or depreciation on foreign currency related transactions arose from changes in the values of assets and liabilities, other than investments in securities, resulting from changes in foreign exchange rates.
| (f) | Repurchase agreements – Each Fund may enter into repurchase agreements with institutions that the Adviser determined were creditworthy pursuant to criteria adopted by the board of directors. Repurchase agreements were recorded at cost plus accrued interest and were collateralized in an amount greater than or equal to the repurchase price plus accrued interest. Collateral (in the form of U.S. government securities) was held by the Funds’ custodian and in the event of default on the obligation of the counterparty to repurchase, the Funds had the right to liquidate the collateral and apply the proceeds in satisfaction of the obligation. If the proceeds from any sale of such collateral were less than the repurchase price, the Fund would have suffered a loss. |
| (g) | Depositary receipts – Each of the Funds may invest in depositary receipts. Depositary receipts are typically issued by a financial institution (a “depositary”), evidencing ownership interests in a security issued by an issuer and deposited with the depositary. |
| (h) | Securities lending – Each of the Funds may enter into securities lending transactions secured by collateral in the form of U.S. Government securities at least equal to, at all times, the fair value of the securities loaned. Any such collateral will be held in a custody account maintained by State Street Bank and Trust Company, the Funds’ custodian. When securities are on loan, the Fund does not receive dividends on the securities loaned, but receives compensation from the borrower in lieu of such dividends. Gain or loss in the fair value of the securities loaned that may occur during |
37
NOTES TO FINANCIAL STATEMENTS (UNAUDITED)
| | the term of the loan will be for the account of the applicable Fund. In entering into securities lending arrangements, the Fund takes the risk that the borrower may not provide additional collateral when required or return the securities when due or, if the borrower defaults, the Fund may experience delays in selling collateral or the collateral may not be sufficient to cover the value of securities lent. There were no securities on loan during the six months ended March 31, 2010. |
| (i) | Equity-linked participation certificates – Emerging Markets Fund, International Fund, and International Value Fund may invest in equity-linked participation certificates. Equity-linked participation certificates are derivative securities which are designed to provide synthetic exposure to one or more underlying securities. An investment in an equity-linked participation certificate typically entitles the holder to a return equal to the market return of the underlying security or securities, subject to the credit risk of the issuing financial institution. |
| (j) | Commission recapture – Each of the Funds had the ability to direct portfolio trades to various brokers that have agreed to rebate a portion of the commissions generated. Such cash rebates were made directly to the applicable Fund and were included in net realized gain or loss on investments in the Statements of Operations as follows: |
| | | |
Emerging Markets | | $ | - |
International | | | - |
International Value | | | 23,579 |
Mid Cap | | | 146,912 |
| (k) | Use of estimates – The preparation of financial statements in conformity with United States generally accepted accounting principles requires management to make estimates and assumptions that affect the reported amounts and disclosures in the financial statements. Actual results could differ from those estimates. |
| (l) | Indemnifications – In the normal course of business, the Funds have entered into contracts in which the Funds agree to indemnify the other party or parties against various potential costs or liabilities. The Funds’ maximum exposure under these arrangements is unknown. No claim had been made for indemnification pursuant to any such agreement of the Funds. |
| (m) | Other – Dividend income less foreign taxes withheld, if any, was generally recorded on the ex-dividend date. In some cases, the information was not available to the Fund on the ex-dividend date. In such cases, which may have included private placements and foreign securities, dividends were recorded as soon after the ex-dividend date as reliable information became available to the Funds. Non-cash dividends included in dividend income, if any, were generally recorded at the fair market value of securities received. Interest income was reported on the accrual basis. Distributions to shareholders were recorded on the ex-dividend date. Expenses attributable to Artisan Funds were generally allocated to each Fund based on net assets. However, other expense allocation methodologies were used, depending on the nature of the expense item. Expenses attributable to a particular Fund or class were allocated directly to that Fund or class. |
38
NOTES TO FINANCIAL STATEMENTS (UNAUDITED)
The character of income and net realized gains and losses may differ in some instances for financial statement and tax purposes and may result in reclassification of permanent differences among certain capital accounts to more appropriately conform financial accounting to tax characterizations of dividend and capital gain distributions.
Emerging Markets Fund, International Fund and International Value Fund generally imposed a 2% redemption fee on shares held 90 days or less. Those redemption fees were recorded as a reduction in the cost of shares redeemed and had the primary effect of increasing paid-in capital. Each Fund reserved the right to waive or reduce the 2% redemption fee on shares held 90 days or less at its discretion when the Fund believed such waiver was in the best interests of the Fund, including but not limited to when it determined that imposition of the redemption fee was not necessary to protect the Fund from the effects of short-term trading. The Funds waived the fee on redemption of shares held by certain authorized agents or other Fund intermediaries and otherwise in accordance with the Funds’ prospectus.
| (3) | Transactions with affiliates: |
The Adviser, with which the officers and a director of Artisan Funds were affiliated, provided investment advisory and administrative services to the Funds. In exchange for those services, each Fund pays a monthly management fee to the Adviser as follows:
Emerging Markets Fund
| | | |
Average Daily Net Assets | | Annual Rate | |
All | | 1.050 | % |
International Fund
| | | |
Average Daily Net Assets | | Annual Rate | |
Less than $500 million | | 1.000 | % |
$500 million to $750 million | | 0.975 | |
$750 million to $1 billion | | 0.950 | |
$1 billion to $12 billion | | 0.925 | |
Greater than $12 billion | | 0.900 | |
International Value Fund and Mid Cap Fund
| | | |
Average Daily Net Assets | | Annual Rate | |
Less than $500 million | | 1.000 | % |
$500 million to $750 million | | 0.975 | |
$750 million to $1 billion | | 0.950 | |
Greater than $1 billion | | 0.925 | |
The Adviser has contractually agreed to waive its management fee, and to the extent that fee waiver is insufficient, to reimburse Emerging Markets Fund for any ordinary operating expenses in an amount sufficient to cause the Fund’s ordinary operating expenses, including the management fee, to be not more than 1.50% of average daily net assets, annually. For the period ended March 31, 2010, the Adviser paid operating expenses on behalf of the Adviser Shares of Emerging Markets Fund. Emerging Markets Fund reimburses the Adviser
39
NOTES TO FINANCIAL STATEMENTS (UNAUDITED)
annually for operating expenses paid on their behalf up to 1.50% of average daily net assets, annually. The amount of operating expenses owed to the Adviser is included in payable for advisory fees and payable for operating expenses on the Statements of Assets and Liabilities for Emerging Markets Fund.
The officers and director of Artisan Funds who are affiliated with the Adviser receive no compensation from the Funds.
Prior to April 1, 2010, each director who was not an affiliated person of the Adviser received an annual retainer of $170,000, payable quarterly, as well as reimbursement of expenses related to his duties as a director of Artisan Funds. The amount of the annual retainer increases by $10,000 with each new series of Artisan Funds. In addition, the non-interested chair of the board of directors received an annual retainer of $60,000, payable quarterly, and each chair of a board committee who was a non-interested director received an annual retainer of $30,000, payable quarterly. Effective April 1, 2010, each director who was not an affiliated person of Artisan Funds or the Adviser received an annual retainer of $180,000, payable quarterly, due to the commencement of operations of Global Equity Fund. The other additional annual retainer fees were unchanged. These fees were generally allocated to each of the Artisan Funds based on net assets, subject to a minimum allocation of $1,500 to each Fund per quarter.
Artisan Funds has adopted a deferred compensation plan for directors who are not affiliated persons of the Adviser that enables directors to elect to defer receipt of all or a portion of the annual compensation they are entitled to receive from the Funds. For purposes of determining the amount owed to the directors under the plan, deferred amounts were invested in shares of Artisan Funds as selected by the individual directors. Each Fund purchased shares of Artisan Funds selected for deferral by the director in amounts equal to his investment, resulting in a Fund asset equal to the deferred compensation liability. Such assets were included as a component of “Other assets” on the Statement of Assets and Liabilities. Deferral of directors’ fees under the plan did not affect the net assets of the Funds, and did not materially affect the Funds’ assets, liabilities or net investment income per share. Amounts will be deferred until distributed in accordance with the plan.
Shares of Artisan Funds were offered for sale by Artisan Distributors LLC (“Distributors”). Distributors is wholly owned by Artisan Holdings. All distribution expenses relating to the Funds were paid by the Adviser.
| (4) | Line of credit arrangement: |
Artisan Funds is party to a line of credit agreement with State Street Bank and Trust Company (“SSB”), which expires in August 2010, under which each Fund may borrow up to the lesser of (a) $75 million or (b) the lesser of (i) 33 1/3% of its adjusted net assets, with adjusted net assets being total assets less liabilities and the value of any assets pledged to anyone other than SSB, (after giving effect to the loan) or (ii) the maximum amount the Fund may borrow under the Investment Company Act of 1940, the limitations included in the Fund’s prospectus, or any limit or restriction under any law or regulation to which the Fund was subject or any agreement to which the Fund or Artisan Funds is a party; provided that the aggregate borrowings by all Artisan Funds may not exceed $100 million. Artisan Funds paid a commitment fee at the annual rate of 0.15% on the unused portion of the line of credit and interest was charged on any borrowings at the current Federal Funds rate plus
40
NOTES TO FINANCIAL STATEMENTS (UNAUDITED)
1.25%. SSB has agreed to waive 0.05% of the commitment fee by reducing the Funds’ custody expenses until August 2010. The use of the line of credit was generally restricted to temporary borrowing for extraordinary or emergency purposes. During the six months ended March 31, 2010, there were no borrowings under the line of credit for Emerging Markets Fund, International Fund, International Value Fund or Mid Cap Fund.
| (5) | Investment transactions: |
The cost of securities purchased and the proceeds from the sale of securities (excluding short-term securities) for the six months ended March 31, 2010 were as follows:
| | | | | | |
| Fund | | Security Purchases | | Security Sales |
Emerging Markets | | $ | 123,724,963 | | $ | 24,265,947 |
International | | | 3,629,731,630 | | | 4,003,688,236 |
International Value | | | 813,576,243 | | | 226,483,794 |
Mid Cap | | | 1,411,976,448 | | | 1,335,292,380 |
| (6) | Transactions in securities of affiliates: |
The table below shows information about securities of the Funds’ “affiliates” (as defined below) that were held by the Funds, purchased or sold by the Funds, or from which dividends were received by the Funds during the six months ended March 31, 2010. The Funds identify a company as an affiliate for the purpose of this report if one or more of the Funds owned, in the aggregate, voting securities that it believed represented 5% or more of that company’s outstanding voting securities (as defined by the Investment Company Act of 1940) during the six months ended March 31, 2010.
| | | | | | | | | | | | | | | | | | | | | |
| | | | | As of
9/30/09 | | | | | | | | | | As of 3/31/10 |
| Fund | | Security | | Share
Balance | | Purchase
Cost | | Sales
Cost | | Net
Realized
Gain (Loss) | | Dividend
Income(1) | | Share
Balance | | Value |
| International Value | | | | | | | | | | | | | | | | | | | | | |
| | | Arch Capital Group Ltd.(2)(3) | | 1,276,234 | | $ | 15,503,884 | | $ | 2,666,744 | | $ | 70,505 | | $ | - | | 1,465,031 | | $ | 111,708,614 |
| | | Total(4) | | | | $ | 15,503,884 | | $ | 2,666,744 | | $ | 70,505 | | $ | - | | | | $ | 111,708,614 |
| Mid Cap | | | | | | | | | | | | | | | | | | | | | |
| | | athenahealth, Inc.(2)(3) | | 833,900 | | $ | 38,205,101 | | $ | - | | $ | - | | $ | - | | 1,772,200 | | $ | 64,791,632 |
| | | Total(4) | | | | $ | 38,205,101 | | $ | - | | $ | - | | $ | - | | | | $ | 64,791,632 |
| (1) | Net of foreign taxes withheld, if any. |
| (2) | Issuer was not an affiliate as of September 30, 2009. |
| (3) | Non-income producing security. |
| (4) | Total value as of March 31, 2010 is presented for only those issuers that were affiliates as of March 31, 2010. |
41
NOTES TO FINANCIAL STATEMENTS (UNAUDITED)
| (7) | Information for Federal income tax purposes: |
For Federal income tax purposes, the cost of investments, gross unrealized appreciation, gross unrealized depreciation and net unrealized appreciation on investments as of March 31, 2010 were as follows:
| | | | | | | | | | | | | |
| Fund | | Cost of
Investments | | Gross Unrealized
Appreciation | | Gross
Unrealized
Depreciation | | | Net Unrealized
Appreciation on
Investments |
Emerging Markets | | $ | 250,872,746 | | $ | 33,656,175 | | $ | (5,298,595 | ) | | $ | 28,357,580 |
International | | | 9,007,443,552 | | | 1,623,414,514 | | | (290,545,601 | ) | | | 1,332,868,913 |
International Value | | | 2,456,647,044 | | | 323,685,505 | | | (24,601,914 | ) | | | 299,083,591 |
Mid Cap | | | 3,566,976,802 | | | 1,209,502,280 | | | (74,947,283 | ) | | | 1,134,554,997 |
The difference between cost of investments for financial reporting and cost of investments for Federal income tax purposes was due primarily to timing differences in recognizing certain gains and losses on security transactions (e.g., wash sale loss deferrals and passive foreign investment company transactions).
The tax characterization of ordinary income dividends and long-term capital gain distributions paid during the six months ended March 31, 2010 and the year ended September 30, 2009 was as follows:
| | | | | | | | | | | | | | | |
| | | Six Months Ended 3/31/10 | | Year Ended 9/30/09 |
| Fund | | Ordinary
Income
Dividends | | Long-Term
Capital Gain
Distributions | | Ordinary
Income
Dividends | | Long-Term
Capital Gain
Distributions | | Tax Return of
Capital
Distributions |
Emerging Markets | | $ | 1,497,117 | | $ | - | | $ | 862,446 | | $ | - | | $ | - |
International | | | 129,087,749 | | | - | | | 168,596,974 | | | 318,081,129 | | | - |
International Value | | | 42,229,227 | | | - | | | 12,538,190 | | | - | | | - |
Mid Cap | | | - | | | - | | | - | | | 46,112,826 | | | - |
Ordinary income dividends and long-term capital gain distributions were determined in accordance with income tax regulations that may differ from U.S. generally accepted accounting principles. These differences were due to differing treatments for items such as net short-term gains, wash sale loss deferrals, passive foreign investment company transactions, foreign currency transactions, net investment losses and post-October losses. Gains on redemptions-in-kind for International Fund of $123,107,002 were included in net realized gain (loss) on investments in the Statement of Operations for the period ended March 31, 2010, and were not recognized for Federal income tax purposes.
Additional tax information as of and for the year ended September 30, 2009 follows:
| | | | | | | | | |
| | | Undistributed
Ordinary Income | | Undistributed
Long-Term Gain | | Post-October
Losses |
Emerging Markets | | $ | 1,495,995 | | $ | - | | $ | 13,611,288 |
International | | | 129,070,165 | | | - | | | 1,743,954,947 |
International Value | | | 40,471,520 | | | - | | | 100,777,481 |
Mid Cap | | | - | | | - | | | 623,684,822 |
42
NOTES TO FINANCIAL STATEMENTS (UNAUDITED)
As of September 30, 2009, the Funds had capital loss carryovers as follows:
| | | | | |
| | | Net Capital
Loss Carryover | | Expiration |
Emerging Markets | | $ | 4,542,143 | | 2017 |
International | | | 846,687,411 | | 2017 |
International Value | | | 21,273,231 | | 2017 |
Mid Cap | | | 133,629,309 | | 2017 |
| (8) | Fund share activities: |
Capital share transactions for the Funds were as follows:
| | | | | | | | | | | | | | | | |
| | | EMERGING MARKETS | | | INTERNATIONAL | |
Six Months ended March 31, 2010 | | Institutional
Shares | | | Advisor
Shares | | | Investor
Shares | | | Institutional
Shares | |
Proceeds from shares issued | | $ | 39,528,000 | | | $ | 86,916,106 | | | $ | 1,037,740,753 | | | $ | 103,802,798 | |
Net asset value of shares issued in reinvestment of dividends and distributions | | | 983,707 | | | | 499,770 | | | | 85,906,490 | | | | 32,932,785 | |
Cost of shares redeemed(1) | | | (10,117,038 | ) | | | (5,655,149 | ) | | | (931,452,819 | ) | | | (585,731,040 | ) |
| | | | | | | | | | | | | | | | |
Net increase (decrease) from fund share transactions | | $ | 30,394,669 | | | $ | 81,760,727 | | | $ | 192,194,424 | | | $ | (448,995,457 | ) |
| | | | | | | | | | | | | | | | |
| | | | |
Shares sold | | | 2,933,942 | | | | 6,353,090 | | | | 51,491,302 | | | | 5,174,340 | |
Shares issued in reinvestment of dividends and distributions | | | 73,686 | | | | 37,352 | | | | 4,233,932 | | | | 1,614,352 | |
Shares redeemed | | | (745,565 | ) | | | (418,813 | ) | | | (46,322,952 | ) | | | (29,485,317 | ) |
| | | | | | | | | | | | | | | | |
Net increase (decrease) in capital shares | | | 2,262,063 | | | | 5,971,629 | | | | 9,402,282 | | | | (22,696,625 | ) |
| | | | | | | | | | | | | | | | |
| | |
| | | EMERGING MARKETS | | | INTERNATIONAL | |
Year ended September 30, 2009 | | Institutional
Shares | | | Advisor
Shares | | | Investor
Shares | | | Institutional
Shares | |
Proceeds from shares issued | | $ | 36,046,627 | | | $ | 42,105,884 | | | $ | 1,592,516,571 | | | $ | 172,950,986 | |
Net asset value of shares issued in reinvestment of dividends and distributions | | | 801,388 | | | | 55,689 | | | | 331,783,610 | | | | 136,080,351 | |
Cost of shares redeemed(1) | | | (20,916,631 | ) | | | (2,746,698 | ) | | | (2,620,368,565 | ) | | | (433,419,290 | ) |
| | | | | | | | | | | | | | | | |
Net increase (decrease) from fund share transactions | | $ | 15,931,384 | | | $ | 39,414,875 | | | $ | (696,068,384 | ) | | $ | (124,387,953 | ) |
| | | | | | | | | | | | | | | | |
| | | | |
Shares sold | | | 3,727,344 | | | | 3,845,456 | | | | 102,961,075 | | | | 11,471,176 | |
Shares issued in reinvestment of dividends and distributions | | | 104,212 | | | | 7,232 | | | | 22,089,455 | | | | 9,017,916 | |
Shares redeemed | | | (2,106,464 | ) | | | (268,708 | ) | | | (173,003,712 | ) | | | (25,335,842 | ) |
| | | | | | | | | | | | | | | | |
Net increase (decrease) in capital shares | | | 1,725,092 | | | | 3,583,980 | | | | (47,953,182 | ) | | | (4,846,750 | ) |
| | | | | | | | | | | | | | | | |
| (1) | Net of redemption fees of: |
| | | | | | |
| Fund | | 3/31/2010 | | 9/30/2009 |
Emerging Markets - Institutional Shares | | $ | 742 | | $ | 618 |
Emerging Markets - Advisor Shares | | | 528 | | | 36 |
International - Investor Shares | | | 217,212 | | | 940,168 |
International - Institutional Shares | | | 68,776 | | | 357,772 |
43
NOTES TO FINANCIAL STATEMENTS (UNAUDITED)
| | | | | | | | | | | | | | | | |
| | | INTERNATIONAL VALUE | | | MID CAP | |
Six Months ended March 31, 2010 | | Investor
Shares | | | Institutional
Shares | | | Investor
Shares | | | Institutional
Shares | |
Proceeds from shares issued | | $ | 583,014,527 | | | $ | 187,486,944 | | | $ | 470,150,921 | | | $ | 3,251,910 | |
Net asset value of shares issued in reinvestment of dividends and distributions | | | 31,364,232 | | | | 5,318,821 | | | | - | | | | - | |
Cost of shares redeemed(1) | | | (173,348,008 | ) | | | (6,105,831 | ) | | | (401,707,626 | ) | | | (20,978,336 | ) |
| | | | | | | | | | | | | | | | |
Net increase (decrease) from fund share transactions | | $ | 441,030,751 | | | $ | 186,699,934 | | | $ | 68,443,295 | | | $ | (17,726,426 | ) |
| | | | | | | | | | | | | | | | |
| | | | |
Shares sold | | | 25,120,456 | | | | 8,066,804 | | | | 18,596,494 | | | | 126,721 | |
Shares issued in reinvestment of dividends and distributions | | | 1,378,042 | | | | 233,794 | | | | - | | | | - | |
Shares redeemed | | | (7,487,022 | ) | | | (262,767 | ) | | | (16,061,242 | ) | | | (800,348 | ) |
| | | | | | | | | | | | | | | | |
Net increase (decrease) in capital shares | | | 19,011,476 | | | | 8,037,831 | | | | 2,535,252 | | | | (673,627 | ) |
| | | | | | | | | | | | | | | | |
| | |
| | | INTERNATIONAL VALUE | | | MID CAP | |
Year ended September 30, 2009 | | Investor
Shares | | | Institutional
Shares | | | Investor
Shares | | | Institutional
Shares | |
Proceeds from shares issued | | $ | 998,478,418 | | | $ | 89,768,173 | | | $ | 736,881,835 | | | $ | 40,963,051 | |
Net asset value of shares issued in reinvestment of dividends and distributions | | | 9,494,289 | | | | 1,837,654 | | | | 40,618,187 | | | | 5,181,307 | |
Cost of shares redeemed(1) | | | (442,674,211 | ) | | | (22,279,861 | ) | | | (787,631,410 | ) | | | (121,601,275 | ) |
| | | | | | | | | | | | | | | | |
Net increase (decrease) from fund share transactions | | $ | 565,298,496 | | | $ | 69,325,966 | | | $ | (10,131,388 | ) | | $ | (75,456,917 | ) |
| | | | | | | | | | | | | | | | |
| | | | |
Shares sold | | | 52,470,821 | | | | 4,662,123 | | | | 38,015,250 | | | | 2,178,933 | |
Shares issued in reinvestment of dividends and distributions | | | 527,754 | | | | 102,319 | | | | 2,392,119 | | | | 297,093 | |
Shares redeemed | | | (25,344,403 | ) | | | (1,262,697 | ) | | | (43,513,929 | ) | | | (6,036,669 | ) |
| | | | | | | | | | | | | | | | |
Net increase (decrease) in capital shares | | | 27,654,172 | | | | 3,501,745 | | | | (3,106,560 | ) | | | (3,560,643 | ) |
| | | | | | | | | | | | | | | | |
| (1) | Net of redemption fees of: |
| | | | | | |
| Fund | | 3/31/2010 | | 9/30/2009 |
International Value - Investor Shares | | $ | 124,861 | | $ | 604,391 |
International Value - Institutional Shares | | | 24,273 | | | 107,009 |
The Funds have evaluated subsequent events through the issuance of the Funds’ financial statements and have determined there is no impact to the Funds’ financial statements.
44
SHAREHOLDER EXPENSE EXAMPLE
As a shareholder of Artisan Funds, you may incur transaction costs, including redemption fees, and you will incur ongoing costs, including management fees and other Fund expenses. This example is intended to help you understand your ongoing costs (in dollars) of investing in a Fund and to compare these costs with the ongoing costs of investing in other mutual funds.
The example is based on an investment of $1,000 invested at the beginning of the period and held for the entire period from October 1, 2009 to March 31, 2010.
Actual Expenses
The first line under the name of each Fund in the table below provides information about actual account values and actual expenses. You may use the information in this line, together with the amount you invested, to estimate the expenses that you paid over the period. Simply divide your account value by $1,000 (for example, an $8,600 account value divided by $1,000 = 8.6), then multiply the result by the number in the first line under the name of your Fund under the heading entitled “Expenses Paid During Period” to estimate the expenses you paid on your account during this period.
Hypothetical Example for Comparison Purposes
The second line below each Fund’s name in the table below provides information about hypothetical account values and hypothetical expenses based on each Fund’s actual expense ratio for the six months ended March 31, 2010 and an assumed rate of return of 5% per year before expenses, which is not the Fund’s actual return. The hypothetical account values and expenses may not be used to estimate the actual ending account balances or expenses you paid for the period. You may use this information to compare the ongoing costs of investing in each Fund and other funds. To do so, compare the 5% hypothetical example with the 5% hypothetical examples that appear in the shareholder reports of the other funds.
Please note that the expenses shown in the table are meant to highlight your ongoing costs only and do not reflect any transactional costs, such as redemption fees. Therefore, the second line of the table is useful in comparing ongoing costs only, and will not help you determine the relative costs of owning different funds. If these transactional costs were included, your costs would have been higher.
| | | | | | | | | |
| | | Beginning
Account Value
10/1/2009 | | Ending
Account Value
3/31/2010 | | Expenses Paid During
Period
10/1/2009-3/31/2010(1) |
Artisan Emerging Markets Fund - Institutional Shares | | | | | | | | | |
Actual | | $ | 1,000.00 | | $ | 1,102.70 | | $ | 7.13 |
Hypothetical (5% return before expenses) | | $ | 1,000.00 | | $ | 1,018.15 | | $ | 6.84 |
Artisan International Fund - Institutional Shares | | | | | | | | | |
Actual | | $ | 1,000.00 | | $ | 1,012.40 | | $ | 4.92 |
Hypothetical (5% return before expenses) | | $ | 1,000.00 | | $ | 1,020.04 | | $ | 4.94 |
Artisan International Value Fund - Institutional Shares | | | | | | | | | |
Actual | | $ | 1,000.00 | | $ | 1,074.90 | | $ | 5.17 |
Hypothetical (5% return before expenses) | | $ | 1,000.00 | | $ | 1,019.95 | | $ | 5.04 |
45
SHAREHOLDER EXPENSE EXAMPLE
| | | | | | | | | |
| | | Beginning
Account Value
10/1/2009 | | Ending
Account Value
3/31/2010 | | Expenses Paid During
Period
10/1/2009-3/31/2010(1) |
Artisan Mid Cap Fund - Institutional Shares | | | | | | | | | |
Actual | | $ | 1,000.00 | | $ | 1,121.60 | | $ | 5.08 |
Hypothetical (5% return before expenses) | | $ | 1,000.00 | | $ | 1,020.14 | | $ | 4.84 |
| (1) | Expenses are equal to the Fund’s ratio of expenses to average net assets for the six-month period ended March 31, 2010 (shown below), multiplied by the average account value over the period, multiplied by 182/365 (to reflect the one-half year period). |
| | |
| Fund | | Annualized Ratio of Expenses to Average
Net Assets for the Six-Month
Period Ended March 31, 2010 |
Artisan Emerging Markets Fund - Institutional Shares | | 1.36% |
Artisan International Fund - Institutional Shares | | 0.98% |
Artisan International Value Fund - Institutional Shares | | 1.00% |
Artisan Mid Cap Fund - Institutional Shares | | 0.96% |
46
FACTORS CONSIDERED IN RENEWING THE FUNDS’ ADVISORY AGREEMENTS
Artisan Partners Limited Partnership (“Artisan Partners”) is responsible for management of the Funds’ investment portfolios and for overall management of the Funds’ business and affairs pursuant to investment advisory agreements dated May 10, 2006 (Emerging Markets Fund); August 9, 2007 (Global Value Fund); December 28, 1995, as amended November 17, 2005 (International Fund); November 7, 2001 (International Small Cap Fund); August 9, 2002 (International Value Fund); April 10, 1997 (Mid Cap Fund); January 25, 2001 (Mid Cap Value Fund); May 15, 2008 (Opportunistic Growth Fund); February 9, 2006 (Opportunistic Value Fund); March 27, 1995 (Small Cap Fund); and August 20, 1997 (Small Cap Value Fund) (each, an “Advisory Agreement” and together, the “Advisory Agreements”). Artisan Partners, a Delaware limited partnership, is managed by its general partner, Artisan Investments GP LLC, a Delaware limited liability company wholly-owned by Artisan Partners Holdings LP (“Artisan Partners Holdings”). Artisan Partners Holdings is a limited partnership organized under the laws of Delaware whose sole general partner is Artisan Investment Corporation, a Wisconsin corporation. Artisan Partners was founded in March 2009 and succeeded to the investment management business of Artisan Partners Holdings during 2009. Artisan Partners Holdings was founded in December 1994 and began providing investment management services in March 1995. The principal address of Artisan Partners is 875 E. Wisconsin Avenue, Suite 800, Milwaukee, Wisconsin 53202.
The Advisory Agreement for each Fund may be continued from year to year only so long as the continuance is approved annually (a) by the vote of a majority of the directors of Artisan Funds who are not “interested persons” of Artisan Funds or Artisan Partners cast in person at a meeting called for the purpose of voting on such approval, and (b) by the board of directors or by the vote of a majority (as defined in the 1940 Act) of the outstanding shares of the Fund. Each Advisory Agreement provides that Artisan Partners shall not be liable for any loss suffered by a Fund or its shareholders as a consequence of any act or omission in connection with investment advisory or portfolio services under the Advisory Agreement, except by reason of willful misfeasance, bad faith, or gross negligence on the part of Artisan Partners in the performance of its duties or from reckless disregard by Artisan Partners of its obligations and duties under the Advisory Agreement. Each Advisory Agreement will terminate automatically in the event of its assignment (as defined in the 1940 Act).
The directors of Artisan Funds held a special meeting of the board on October 29, 2009 (the “Special Meeting”), at which meeting they gave preliminary consideration to information bearing on the continuation of each Advisory Agreement for the period from December 1, 2009 through November 30, 2010. The primary purpose of the Special Meeting was to ensure that the directors had ample opportunity to consider matters they deemed relevant in considering the continuation of the Advisory Agreements, and to request any additional information they considered reasonably necessary to their deliberations, without undue time constraints.
Prior to the Special Meeting, independent counsel to the independent directors sent to Artisan Partners a request for information to be provided to the directors in connection with their consideration of the continuation of the Advisory Agreements. Artisan Partners provided materials to the directors in response to that request, other information Artisan Partners believed was useful in evaluating the continuation of the Advisory Agreements and extensive reports prepared by Lipper Inc. (“Lipper”), an independent source of investment company data, relating to each Fund’s performance and expenses compared to the
47
FACTORS CONSIDERED IN RENEWING THE FUNDS’ ADVISORY AGREEMENTS
performance and expenses of a relatively small peer group and a larger peer universe of funds determined by Lipper to be comparable. Artisan Partners also provided additional reports prepared by Lipper comparing certain of the Funds’ performance and expenses to peer groups and peer universes with a different style classification that Artisan Partners believed was more appropriate for comparative purposes than the style classification originally selected by Lipper. The directors also received and reviewed a memorandum from their independent counsel regarding the directors’ responsibilities in evaluating the Funds’ Advisory Agreements.
In evaluating the Advisory Agreements, the directors reviewed the available information and discussed with representatives of Artisan Partners each Fund’s operations, the nature, extent and quality of the advisory and other services provided by Artisan Partners to the Funds, the overall expense ratios of each class of shares of the Funds, and economies of scale and other benefits derived by Artisan Partners from its relationship with the Funds. In addition to the third party reports by Lipper and the memorandum from independent counsel, the directors reviewed information provided prior to and presented at the Special Meeting concerning the following:
| • | | Artisan Partners’ personnel and methods, including: Artisan Partners’ assessment of its ability to attract and retain capable research, advisory and administrative personnel through compensation programs and equity participation and Artisan Partners’ assessment of recent hiring and retention experience; the compensation of Artisan Partners’ personnel with primary responsibility for managing the Funds; the time and attention of Artisan Partners’ investment personnel devoted to the Funds; Artisan Partners’ research and decision-making processes, including methods adopted to ensure compliance with investment objectives, policies and restrictions of the portfolios of the Funds; the policies relating to the assignment of Artisan Partners’ personnel to the various Funds’ portfolios; the adequacy and sophistication of Artisan Partners’ technology and systems with respect to investment and administrative matters; and the education, experience and number of Artisan Partners’ advisory personnel; |
| • | | The terms of each Advisory Agreement, including: a list of services performed by Artisan Partners; how the services performed by Artisan Partners under each Advisory Agreement differ from: (a) the services performed by Artisan Partners under other advisory agreements with registered investment companies or other accounts, and (b) the services typically performed by an investment adviser for registered investment companies and other accounts; Artisan Partners’ responsibility for making investment decisions and for observing investment objectives, policies, and restrictions; Artisan Partners’ standard of care; and termination provisions; |
| • | | Each Fund’s short- and long-term investment performance, including comparisons for various time periods with (a) other Artisan Partners client accounts managed in the same investment strategy, (b) other mutual funds having similar investment objectives, and (c) appropriate market indices; |
| • | | Litigation pending, threatened or settled involving Artisan Partners, and the results of any audits, investigations or examinations of the Securities and Exchange Commission (the “SEC”); |
| • | | Information regarding fee arrangements, including: a comparison of the Funds’ total expenses and total expense ratios with other mutual funds (taking into account factors |
48
FACTORS CONSIDERED IN RENEWING THE FUNDS’ ADVISORY AGREEMENTS
| | bearing on comparability, such as size, account-level charges, and investment objective); the structure of the advisory fees, including the method of computing fees and the frequency of payment of fees; a comparison of the advisory fees charged by Artisan Partners to the Funds with the advisory fees charged by other advisory organizations for managing mutual funds and other accounts, especially funds and accounts having similar investment goals and providing similar service; voluntary or contractual advisory fee limitations or reductions and relationship of fees to any fee limitation; the possible cost savings by Artisan Partners, incentives to effect savings, and sharing of savings with the Funds; any economies of scale as reflected in the basic advisory fees and any sliding scale reflecting increased size; a comparison of the fees charged by Artisan Partners to the Funds with the fees charged by Artisan Partners for managing other accounts including other mutual funds to which Artisan Partners provides sub-advisory services, with similar investment goals, including an explanation of any material differences, as well as any differences attributable to variations in service levels; information regarding other expenses, including expenses incurred by each of: (a) Artisan Partners, as adviser and administrator, (b) Artisan Distributors LLC, as the principal underwriter and (c) the Funds; custodian, shareholder servicing and transfer agent fees; and information regarding payments to financial intermediaries; |
| • | | Potential “fall-out” benefits gained by Artisan Partners or its affiliates from its relationship with the Funds, in addition to the advisory fees, including receipt of research paid for with commissions and the benefits to Artisan Partners in attracting and retaining other clients; and the method of estimating other benefits; |
| • | | Brokerage and portfolio transactions, including: the standards and performance in seeking best execution, commissions paid, including commissions by purpose; allocation of brokerage for research and other services (“soft dollars”); Artisan Partners’ practices in light of SEC guidance under Section 28(e) of the Securities Exchange Act of 1934; research purchased with Artisan Partners’ cash; research available for purchase by cash; the execution of portfolio transactions through brokers who sell the Funds’ shares and steps taken to comply with Rule 12b-1(h) under the 1940 Act; and portfolio turnover rates; |
| • | | Artisan Partners’ financial condition and stability and financial arrangements between Artisan Partners and its parent organization; |
| • | | The profitability to Artisan Partners of its relationship with each Fund, including: unaudited schedules showing Artisan Partners’ revenue, expenses and profits in providing services to the Funds on a Fund-by-Fund basis; the assumptions and allocation methodologies utilized for profitability analysis; Artisan Partners’ profit margins; and comparisons with Artisan Partners’ profit margins on other accounts managed by Artisan Partners; and |
| • | | Potential conflicts of interest between the Funds and Artisan Partners and circumstances and actions addressing or bearing on potential conflicts of interest, including: the type and number of other clients served by Artisan Partners; the basis of sharing personnel, services, research and advice among clients; the basis of decisions to buy or sell securities for the Funds and other clients where the same security might be bought or sold for a number of clients; the basis of allocating purchases and sales of the same security, including initial public offerings, among the Funds and other clients of Artisan Partners; the possible advantages, including economies of scale, and disadvantages in having an investment |
49
FACTORS CONSIDERED IN RENEWING THE FUNDS’ ADVISORY AGREEMENTS
| | adviser that has other clients; Artisan Partners’ investments on its own behalf and possible conflicts with the Funds; Artisan Partners’ code of ethics; and Artisan Partners’ proxy voting policies. |
On October 29, 2009 and November 11, 2009, the independent directors met separately with their independent counsel to review and discuss relevant information regarding the continuation of the Advisory Agreements and the information presented and discussed at the Special Meeting. The directors concluded their annual Advisory Agreement review at a regularly scheduled meeting on November 12, 2009. At the November 12th meeting, the independent directors and their independent counsel reviewed with the full board the information discussed at the Special Meeting and the November 11th meeting. The directors then considered whether any further discussion or review was necessary, concluding that the Special Meeting and the information reviewed by the independent directors at the November 11th and 12th meetings provided a strong basis for considering the continuation of the Advisory Agreements. The directors then reviewed and affirmed each of the following conclusions:
The nature, extent, and quality of Artisan Partners’ services. The directors concluded that the nature and extent of Artisan Partners’ services to the Funds was appropriate and consistent with, and in some cases more advantageous to the Funds than, the terms of the Advisory Agreements. The directors concluded that the quality of Artisan Partners’ services has been consistently high, with no material deficiencies.
The investment performance of each Fund. The directors concluded that each of International Fund, International Small Cap Fund, International Value Fund, Mid Cap Fund, Mid Cap Value Fund and Small Cap Value Fund had met its long-term performance standards by adhering to its investment strategy and outperforming its peers over long-term periods. The directors also concluded that each of Emerging Markets Fund, Global Value Fund, Opportunistic Growth Fund and Opportunistic Value Fund had adhered to its investment strategy and performed satisfactorily or better since inception periods. In addition, the directors concluded that, over the long-term, Small Cap Fund had adhered to its investment strategy and that performance was acceptable. Moreover, based on recent changes to the investment management team of Small Cap Fund, the directors concluded that prospects for the performance of that Fund were favorable.
Cost of services, economies of scale and benefits derived by Artisan Partners. The directors concluded that the costs of the services provided by Artisan Partners and the profits realized are reasonable in relation to the nature and quality of services provided and in comparison to (i) the fees charged by mutual funds considered by Lipper, Inc. to be within the same peer category or universe and (ii) the fees charged and the array of services offered to other Artisan clients, including its separate account clients, who have similar investment strategies and objectives, for which it provides few or no services other than portfolio management. The directors concluded that the Funds’ overall expense ratios are competitive and demonstrate Artisan Partners’ history of effective management of the Funds’ business and affairs. The directors also concluded that the shareholders of the Funds (except for International Small Cap Fund and Emerging Markets Fund) have appropriately benefited (or are expected to benefit) from economies of scale under the management fee structures in the Advisory Agreements. It was also concluded that Artisan Partners had not achieved (nor was likely to achieve) economies of scale in the management of International
50
FACTORS CONSIDERED IN RENEWING THE FUNDS’ ADVISORY AGREEMENTS
Small Cap Fund, because it closed at a small asset level. The directors also concluded that Artisan Partners had appropriately put in place a low initial fee schedule in lieu of breakpoints for Emerging Markets Fund.
Other benefits derived by the Funds or Artisan Partners. The directors concluded that, other than the services provided by Artisan Partners pursuant to the Advisory Agreements and the management fees paid in return, the Funds and Artisan Partners may potentially benefit from their relationship with each other in several ways. For Artisan Partners, the directors concluded there were two primary fall-out benefits: (1) the potential conversion of Fund shareholders to separate account clients; and (2) the acquisition of research products and services in return for commissions (“soft dollars”). The directors concluded that, although Artisan Partners derives or may derive those additional benefits, the Funds also could benefit from conversions of Artisan Partners’ separate account clients to Fund shareholders and from the institutional shareholders who choose to invest in the Funds because they want Artisan Partners’ services, but do not meet Artisan Partners’ minimum separate account size requirements. The directors also concluded that the Funds benefit from Artisan Partners’ use of soft dollars generated with respect to its separate account clients.
Following those discussions, the board approved the continuation of each Advisory Agreement through November 30, 2010 by the unanimous vote of all directors and also by the unanimous vote of all the “non-interested” directors.
51
NOTES ON MANAGEMENT’S DISCUSSION OF FUND PERFORMANCE AND PORTFOLIO HOLDINGS’ CLASSIFICATION
The discussions of each Fund included in this report include statistical information about the portfolios of each of the Funds. Except as otherwise noted, that information is as of March 31, 2010. That information will vary with changes in a Fund’s portfolio investments. The performance information for each Fund relative to its benchmark index discussed in this report was prepared by the Adviser using information reported by FactSet Databases (“FactSet”). For the purposes of assigning portfolio securities to a particular country, the Adviser considers an issuer to be from a particular country as designated by its securities information vendors. The Adviser currently uses MSCI Inc. as its primary source and FactSet as a secondary source for this information. In the event (i) the Adviser’s securities information vendors do not assign a security to a particular country or if the published classification appears to be erroneous, or (ii) its primary vendor does not assign a security to a particular country and the secondary vendor has assigned a security to a particular country by using a methodology that is not the same as the methodology the primary vendor uses to assign a country, the Adviser assigns the security to a country using the primary vendor’s published criteria (to the extent available) or the Adviser’s own judgment. The primary information vendor’s criteria include the identity of the jurisdiction of the issuer’s incorporation, the main equity trading market for the issuer’s securities, the geographical distribution of the issuer’s operations and the location of the issuer’s headquarters. Country designations may change over time.
For the purposes of assigning portfolio securities to a particular sector and industry, the Adviser assigns securities in accordance with the sector and industry classifications of the Global Industry Classification Standard (GICS®) developed by MSCI Inc. and Standard & Poor’s (to the extent available) as a primary source and FactSet (to the extent available) as a secondary source for this information. In the event the Adviser’s securities information vendors do not classify a security to a particular sector or industry or if the published classification appears to be erroneous, the Adviser classifies the security according to its own judgment, using other securities information vendors, the company description and other publicly available information about the company’s peer group. Sector and industry classifications may change over time.
The names of portfolio securities reflected in this report are as reported by the Funds’ data providers, may not represent the legal name of the entity and, in some cases, are translations of non-English names.
Descriptions of Indices
Each Fund’s performance is compared in this report to changes in one or more indices, including in all cases a broad-based index of changes in prices of securities in the markets in which the Fund invests. All of the indices are unmanaged and their returns include reinvested dividends. Unlike the Funds’ returns, the returns of each index do not include the payment of sales commissions or other expenses that would be incurred in the purchase or sale of the securities included in that index. An investment cannot be made directly in an index. Fair value pricing is not employed by market indices.
The indices to which the Funds are compared are:
Artisan Emerging Markets Fund – Morgan Stanley Capital International Emerging Markets IndexSM is a market-weighted index of companies in emerging markets.
52
NOTES ON MANAGEMENT’S DISCUSSION OF FUND PERFORMANCE AND PORTFOLIO HOLDINGS’ CLASSIFICATION
Artisan International and Artisan International Value Funds – Morgan Stanley Capital International EAFE® Index (MSCI EAFE®) is a market-weighted index of companies in developed markets, excluding the U.S. and Canada. MSCI EAFE®’s average annual return since inception of the International Fund is based upon a starting date of December 31, 1995.
Artisan International Fund – Morgan Stanley Capital International EAFE® Growth Index (MSCI EAFE® Growth) is a market-weighted index of companies in developed markets, excluding the U.S. and Canada, that exhibits growth investment style characteristics according to MSCI’s methodology. MSCI EAFE® Growth’s average annual return since inception of the International Fund is based upon a starting date of December 31, 1995.
Artisan International Value Fund – Morgan Stanley Capital International EAFE® Value Index (MSCI EAFE® Value) is a market-weighted index of companies in developed markets, excluding the U.S. and Canada, that exhibits value investment style characteristics according to MSCI’s methodology.
Artisan Mid Cap Fund – Russell Midcap® Index is a market-weighted index of about 800 medium-sized U.S. companies.
Artisan Mid Cap Fund – Russell Midcap® Growth Index is a market-weighted index of those medium-sized companies included in the Russell Midcap® Index with higher price-to-book and higher forecasted growth values.
Trademarks
Trademarks and copyrights relating to the indices and products of portfolio companies mentioned in this report are owned by their respective owners. Except as otherwise indicated, the trademarks, including names, logos, slogans and service marks appearing in this report are the property of the Adviser and may not be copied, reproduced, published or in any way used without written permission.
The Global Industry Classification Standard (“GICS”) was developed by and is the exclusive property and a service mark of MSCI Inc. (“MSCI”) and Standard & Poor’s, a division of The McGraw-Hill Companies, Inc. (“S&P”) and is licensed for use by Artisan Partners Limited Partnership. Neither MSCI, S&P nor any third party involved in making or compiling the GICS or any GICS classifications makes any express or implied warranties or representations with respect to such standard or classification (or the results to be obtained by the use thereof), and all such parties hereby expressly disclaim all warranties of originality, accuracy, completeness, merchantability and fitness for a particular purpose with respect to any of such standard or classification. Without limiting any of the foregoing, in no event shall MSCI, S&P, any of their affiliates or any third party involved in making or compiling the GICS or any GICS classifications have any liability for any direct, indirect, special, punitive, consequential or any other damages (including lost profits) even if notified of the possibility of such damages.
The MSCI information may only be used by the reader, may not be reproduced or redisseminated in any form and may not be used to create any financial instruments or products or any indices. The MSCI information is provided on an “as is” basis and the reader of this information assumes the entire risk of any use made of this information. MSCI, each of its affiliates and each other person involved in or related to compiling, computing or creating any MSCI information (collectively, the “MSCI Parties”) expressly
53
NOTES ON MANAGEMENT’S DISCUSSION OF FUND PERFORMANCE AND PORTFOLIO HOLDINGS’ CLASSIFICATION
disclaims all warranties (including, without limitation, any warranties of originality, accuracy, completeness, timeliness, non-infringement, merchantability and fitness for a particular purpose) with respect to this information. Without limiting any of the foregoing, in no event shall MSCI Parties have any liability for any direct, indirect, special, incidental, punitive, consequential (including, without limitation, lost profits) or any other damages.
Russell Investment Group is the source and owner of the Russell Index data contained or reflected in this material and all trademarks and copyrights related thereto. The presentation may contain confidential information and unauthorized use, disclosure, copying, dissemination or redistribution is strictly prohibited. This is a presentation of Artisan Funds, Inc. Russell Investment Group is not responsible for the formatting or configuration of this material or for any inaccuracy in Artisan Funds’ presentation thereof.
PROXY VOTING POLICIES AND PROCEDURES
You may obtain a description of Artisan Funds’ proxy voting policies and procedures, without charge, upon request by calling 800.399.1770. That information also is included in Artisan Funds’ statement of additional information, which is available without charge, upon request, by calling 800.399.1770 and on the Securities and Exchange Commission’s website at www.sec.gov.
Information relating to how each Artisan Fund voted proxies relating to portfolio securities held during the twelve-month period ended June 30 is available without charge, on the Funds’ website at www.artisanfunds.com and on the Securities and Exchange Commission’s website at www.sec.gov.
INFORMATION ABOUT PORTFOLIO SECURITIES
Artisan Funds files a complete schedule of portfolio holdings with the Securities and Exchange Commission for the quarters ending December 31 and June 30 (the first and third quarters of the Funds’ fiscal year) on Form N-Q. The Funds’ Forms N-Q are available on the Securities and Exchange Commission’s website at www.sec.gov. You also may review and copy those documents by visiting the Securities and Exchange Commission’s Public Reference Room in Washington, D.C. Information on the operation of the Public Reference Room may be obtained by calling the Securities and Exchange Commission at 800.SEC.0330.
54
| | | | |

| | ARTISAN FUNDS P.O. BOX 8412 BOSTON, MA 02266-8412 800.399.1770 | | |

ARTISAN
SEMIANNUAL
REPORT
MARCH 31, 2010
ARTISAN EMERGING
MARKETS FUND
_________
ARTISAN FUNDS, INC.
ADVISOR SHARES
TABLE OF CONTENTS
ARTISAN FUNDS
P.O. BOX 8412
BOSTON, MA 02266-8412
This report and the unaudited financial statements contained herein are provided for the general information of the shareholders of the Advisor Shares of Artisan Emerging Markets Fund. Before investing, investors should consider carefully the Fund’s investment objective, risks and charges and expenses. For more complete information on the Fund, including fees and expenses, please call 866.574.1770 for a free prospectus. Read it carefully before you invest or send money.
Company discussions are for illustration only and are not intended as recommendations of individual stocks. The discussion presents information about the companies believed to be accurate, and the views of the portfolio managers, as of March 31, 2010. That information and those views may change, and the Fund disclaims any obligation to advise shareholders of any such changes. Artisan Emerging Markets Fund also offers an institutional class of shares for institutional investors meeting certain minimum investment requirements. A report on the institutional class is available under separate cover.
Artisan Funds offered through Artisan Distributors LLC, member FINRA.
ARTISAN EMERGING MARKETS FUND (ARTZX)
INVESTMENT PROCESS HIGHLIGHTS
Artisan Emerging Markets Fund employs a fundamental research process to construct a diversified portfolio of emerging market companies. The team’s investment process is focused on identifying companies that are priced at a discount relative to the team’s estimate of their sustainable earnings.
| • | | Sustainable Earnings. The team believes that over the long term a stock’s price is directly related to the company’s ability to deliver sustainable earnings. The team determines a company’s sustainable earnings based upon financial and strategic analysis. The financial analysis of a company’s balance sheet, income statement, and statement of cash flows focuses on identifying historical drivers of return on equity. The strategic analysis examines a company’s competitive advantages and financial strength to assess sustainability. |
| • | | Valuation. The team believes that investment opportunities develop when businesses with sustainable earnings are undervalued relative to peers and historical industry, country and regional valuations. The team values a business and develops a price target based on their assessment of the business’s sustainable earnings and cash flow expectations and the team’s risk analysis. |
| • | | Risk Analysis. The team believes that a disciplined risk framework allows greater focus on fundamental stock selection. The team incorporates its assessment of company-specific and macroeconomic risks into its valuation analysis to develop a risk-adjusted target price. The risk-rating assessment includes a review of the currency, interest rate, monetary and fiscal policy and political risks to which a company is exposed. |
PERFORMANCE HISTORY
GROWTH OF AN ASSUMED $10,000 INVESTMENT (6/2/2008 to 3/31/2010)
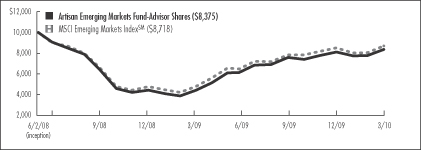
AVERAGE ANNUAL TOTAL RETURNS (as of 3/31/2010)
| | | | | | | | | |
| Fund / Index | | Six Month(1) | | | 1-Year | | | Since
Inception | |
Artisan Emerging Markets Fund - Advisor Shares | | 10.26 | % | | 89.03 | % | | -9.25 | % |
MSCI Emerging Markets IndexSM | | 11.16 | | | 81.08 | | | -7.23 | |
The performance quoted represents past performance, which does not guarantee future results. The investment return and principal value of an investment in the Fund will fluctuate, so that an investor’s shares in the Fund, when redeemed, may be worth more or less than their original cost. Current performance may be lower or higher than the performance data quoted. For current to most recent month-end performance information call 866.574.1770. The graph and table above do not reflect the deduction of taxes that a shareholder would pay on distributions or sale of Fund shares. The performance shown does not reflect the deduction of a 2% redemption fee on shares held by an investor for 90 days or less and, if reflected, the fee would reduce the performance quoted. The Fund’s performance information reflects Artisan Partners’ agreement to limit the Fund’s expenses to no more than 1.50%, which has been in effect since the Fund’s inception and has had a material impact on the Fund’s performance. Absent that expense waiver, the Fund’s performance would have been lower. See page 28 for a description of the index.
2
INVESTING ENVIRONMENT
Emerging markets stocks were up 11.16% during the six-month period ended March 31, 2010, as measured by the MSCI Emerging Markets IndexSM. From a regional perspective, the EMEA (Europe, Middle East & Africa) region was the strongest performing region as stocks in Russia and South Africa posted gains of approximately 18% and 14%, respectively. Strong results in Latin America were driven by 22% gains in Mexican stocks and 13% gains in Brazilian stocks. Asia lagged other regions but still put up strong numbers. India was among the strongest Asian countries advancing nearly 13%, while China and Korea gained 6-8%. Taiwan trailed the overall market by a wide margin with a gain of only 4%.
SECTOR DIVERSIFICATION
| | | | | | |
| Sector | | 9/30/09 | | | 3/31/10 | |
Consumer Discretionary | | 10.9 | % | | 9.6 | % |
Consumer Staples | | 6.2 | | | 6.9 | |
Energy | | 12.7 | | | 11.1 | |
Financials | | 14.8 | | | 16.0 | |
Healthcare | | 2.2 | | | 1.8 | |
Industrials | | 10.8 | | | 9.8 | |
Information Technology | | 12.9 | | | 12.6 | |
Materials | | 11.3 | | | 14.0 | |
Telecommunication Services | | 11.8 | | | 10.7 | |
Utilities | | 2.6 | | | 1.8 | |
Other assets less liabilities | | 3.8 | | | 5.7 | |
Total | | 100.0 | % | | 100.0 | % |
As a percentage of total net assets.
PERFORMANCE DISCUSSION
The Fund returned 10.26% during the six-month period. We benefited from the strength of our holdings in China, Turkey, Russia and Brazil. Some of our leading performers in these countries were fruit and vegetable producer Chaoda Modern Agriculture (Holdings) Limited, water treatment services provider Sound Global Ltd., investment and development bank Turkiye Sinai Kalkinma Bankasi A.S., rail freight transportation services provider Globaltrans Investment PLC, consumer products manufacturer Hypermarcas SA and truck and luxury coach manufacturer Marcopolo S.A.
On the downside, we were negatively impacted by our lack of investment in Israel, which advanced more than 25% in the Index, and by the underperformance of our holdings in Taiwan and Korea. Our biggest decliners in Taiwan were fertilizer manufacturer and land owner Taiwan Fertilizer Co., Ltd. and financial services provider Chinatrust Financial Holding Company Ltd. In Korea, our results were hindered by weakness in online educational programs provider MegaStudy Co., Ltd. and residential construction company Hyundai Development Company. Other weak performers in the portfolio included Samson Holding Ltd., real estate developer Rodobens Negocios Imobiliarios SA and Turkcell Iletisim Hizmetleri AS.
REGION ALLOCATION
| | | | | | |
| Region | | 9/30/09 | | | 3/31/10 | |
Emerging Asia | | 41.9 | % | | 42.2 | % |
Emerging Europe, Middle East & Africa | | 24.1 | | | 25.0 | |
Latin America | | 26.0 | | | 24.8 | |
Developed Markets | | 4.2 | | | 2.3 | |
As a percentage of total net assets.
FUND CHANGES
Our largest additions to the portfolio during the period included: Indian cement manufacturer India Cements Limited, Brazilian stock exchange operator BM&F BOVESPA SA, Russian steel manufacturer Magnitogorsk Iron & Steel Works, Indonesian auto manufacturer PT Astra International Tbk and Indian pipe manufacturer Welspun-Gujarat Stahl Ltd. Our purchases were funded in part by the sales of Gold Fields Limited, Turk Hava Yollari Anonim Ortakligi, All America Latina Logistica, Dufry South America Ltd and Sound Global Ltd.
3
ARTISAN EMERGING MARKETS FUND
Schedule of Investments – March 31, 2010 (Unaudited)
| | | | | |
| | | Shares
Held | | Value |
| | | | | |
COMMON AND
PREFERRED STOCKS - 94.3% |
| | | | | |
| BRAZIL - 17.6% | | | | | |
Amil Participacoes SA | | 203,000 | | $ | 1,580,988 |
BM&F BOVESPA SA | | 407,200 | | | 2,756,875 |
Companhia Energetica de Minas Gerais- CEMIG, Preferred(1) | | 100,747 | | | 1,672,366 |
Companhia Vale do Rio Doce | | 303,762 | | | 9,761,857 |
Empresa Brasileira de Aeronautica S.A. | | 288,900 | | | 1,709,016 |
Fleury SA(2) | | 121,500 | | | 1,298,113 |
Hypermarcas SA(2) | | 152,500 | | | 1,865,142 |
Iguatemi Empresa de Shopping Centers SA | | 106,300 | | | 1,790,247 |
Itau Unibanco Holdings SA, Preferred(1) | | 224,251 | | | 4,917,923 |
Marcopolo S.A., Preferred(1) | | 419,500 | | | 1,887,143 |
Petroleo Brasileiro S.A. | | 471,900 | | | 10,534,726 |
Randon SA Implementos e Participacoes, Preferred(1) | | 141,000 | | | 1,087,024 |
Rodobens Negocios Imobiliarios SA | | 142,100 | | | 998,819 |
SEB - Sistema Educacional Brasileiro SA (Units)(1) | | 137,400 | | | 1,854,303 |
SLC Agricola SA | | 147,982 | | | 1,209,918 |
Tele Norte Leste Participacoes S.A. | | 87,800 | | | 1,885,995 |
Tim Participacoes S.A., Preferred(1) | | 700,900 | | | 1,958,823 |
Wilson Sons Limited (DR) | | 129,821 | | | 1,704,569 |
| | | | | |
| | | | | 50,473,847 |
| CHILE - 1.1% | | | | | |
Compania Cervecerias Unidas S.A. | | 214,778 | | | 1,604,358 |
Empresa Nacional de Telecomunicaciones S.A. | | 119,319 | | | 1,623,284 |
| | | | | |
| | | | | 3,227,642 |
| CHINA - 11.6% | | | | | |
Airmedia Group, Inc. (DR)(2) | | 183,645 | | | 1,147,781 |
Ajisen China Holdings Limited | | 2,040,913 | | | 2,005,624 |
Chaoda Modern Agriculture (Holdings) Limited | | 3,758,536 | | | 4,003,361 |
China Dongxiang Group Company | | 3,961,000 | | | 2,841,584 |
China Mobile Limited | | 591,000 | | | 5,686,022 |
China Railway Construction Corporation, H Shares | | 1,209,500 | | | 1,487,681 |
GOME Electrical Appliances Holdings Limited(2) | | 9,329,587 | | | 3,136,198 |
Huabao International Holdings Limited | | 3,349,600 | | | 4,003,515 |
Mindray Medical International Limited, Class A (DR) | | 67,530 | | | 2,459,443 |
| | | | | |
| | | Shares
Held | | Value |
| | | | | |
| CHINA (CONTINUED) | | | | | |
New Oriental Education & Technology Group, Inc. (DR)(2) | | 18,445 | | $ | 1,577,232 |
Tingyi (Cayman Islands) Holding Corporation | | 1,088,300 | | | 2,565,076 |
Zhuzhou CSR Times Electric Co., Ltd., H Shares | | 1,235,200 | | | 2,335,414 |
| | | | | |
| | | | | 33,248,931 |
| CZECH REPUBLIC - 0.6% | | | | | |
CEZ | | 39,658 | | | 1,873,367 |
| | | | | |
| EGYPT - 2.0% | | | | | |
Commercial International Bank | | 157,181 | | | 1,855,569 |
Egyptian Financial Group-Hermes Holding | | 539,401 | | | 3,087,889 |
Orascom Construction Industries | | 17,679 | | | 848,630 |
| | | | | |
| | | | | 5,792,088 |
| HONG KONG - 0.5% | | | | | |
Samson Holding Ltd. | | 9,107,955 | | | 1,536,713 |
| | | | | |
| HUNGARY - 0.7% | | | | | |
MOL Hungarian Oil and Gas Nyrt., Class A(2) | | 20,072 | | | 2,053,574 |
| | | | | |
| INDIA - 5.1% | | | | | |
Cairn India Ltd.(2) | | 482,077 | | | 3,273,442 |
India Cements Limited | | 1,009,184 | | | 2,944,718 |
Nagarjuna Construction Company Ltd. | | 543,295 | | | 1,972,538 |
Patni Computer Systems Ltd | | 172,770 | | | 2,062,696 |
Power Finance Corporation | | 339,980 | | | 1,959,457 |
Welspun Gujarat Stahl Rohren Ltd. | | 380,304 | | | 2,318,080 |
| | | | | |
| | | | | 14,530,931 |
| INDONESIA - 3.5% | | | | | |
PT Astra International Tbk | | 527,000 | | | 2,426,650 |
PT Bank Rakyat Indonesia | | 2,432,000 | | | 2,204,956 |
PT Indocement Tunggal Prakarsa Tbk | | 1,844,095 | | | 2,887,890 |
PT Telekomunikasi Indonesia | | 2,951,500 | | | 2,611,086 |
| | | | | |
| | | | | 10,130,582 |
| ITALY - 0.5% | | | | | |
Tenaris S.A. (DR) | | 36,186 | | | 1,553,827 |
| | | | | |
| KAZAKSTAN - 1.1% | | | | | |
KazMunaiGas Exploration Production (DR) | | 122,896 | | | 3,031,844 |
4
| | | | | |
| | | Shares
Held | | Value |
| | | | | |
| KOREA - 8.4% | | | | | |
Daewoo Shipbuilding & Marine Engineering Co., Ltd. | | 96,534 | | $ | 1,851,419 |
Hyundai Development Company | | 42,381 | | | 1,237,962 |
MegaStudy Co., Ltd. | | 9,662 | | | 1,592,614 |
Samsung Electronics Co., Ltd. | | 17,566 | | | 12,699,623 |
Shinhan Financial Group Co., Ltd. | | 89,587 | | | 3,519,503 |
Shinsegae Co., Ltd. | | 6,443 | | | 3,046,538 |
| | | | | |
| | | | | 23,947,659 |
| MEXICO - 6.1% | | | | | |
America Movil SAB de C.V., Series L | | 2,319,763 | | | 5,844,555 |
Bolsa Mexicana de Valores SA(2) | | 1,003,290 | | | 1,590,495 |
Fomento Economico Mexicano SAB, Series UBD (Units) | | 485,382 | | | 2,308,791 |
Grupo Financiero Banorte S.A.B. de C.V. | | 640,241 | | | 2,839,819 |
Grupo Televisa S.A. | | 576,541 | | | 2,436,033 |
Urbi, Desarrollos Urbanos, S.A. de C.V.(2) | | 1,012,562 | | | 2,338,178 |
| | | | | |
| | | | | 17,357,871 |
| NETHERLANDS - 0.5% | | | | | |
Plaza Centers (Europe) BV(2) | | 646,147 | | | 1,323,712 |
| | | | | |
| POLAND - 0.7% | | | | | |
Polski Koncern Naftowy Orlen S.A.(2) | | 138,109 | | | 1,875,877 |
| | | | | |
| RUSSIA - 6.0% | | | | | |
Globaltrans Investment PLC (DR)(2) | | 214,628 | | | 2,800,895 |
LUKOIL (DR) | | 98,552 | | | 5,587,898 |
Magnit | | 20,811 | | | 1,810,557 |
Magnitogorsk Iron & Steel Works (DR)(2) | | 218,787 | | | 2,651,698 |
Mobile TeleSystems (DR) | | 50,086 | | | 2,779,773 |
Razguliay Group(2)(3) | | 806,642 | | | 1,444,259 |
| | | | | |
| | | | | 17,075,080 |
| SOUTH AFRICA - 8.8% | | | | | |
ABSA Group Limited | | 158,286 | | | 3,092,376 |
African Bank Investments Limited | | 449,980 | | | 2,199,319 |
Barloworld Limited | | 234,550 | | | 1,587,228 |
Grindrod Limited | | 971,165 | | | 2,041,330 |
Harmony Gold Mining Company Limited | | 223,987 | | | 2,115,710 |
Impala Platinum Holdings Limited | | 178,266 | | | 5,237,539 |
Mondi Limited | | 418,596 | | | 3,091,878 |
Mr. Price Group Limited | | 294,347 | | | 1,608,376 |
MTN Group Limited(2) | | 280,772 | | | 4,317,345 |
| | | | | |
| | | | | 25,291,101 |
| SWEDEN - 0.8% | | | | | |
Alliance Oil Co Ltd. (DR)(2) | | 144,000 | | | 2,288,452 |
| | | | | |
| TAIWAN - 10.4% | | | | | |
Acer Inc. | | 622,599 | | | 1,838,900 |
Cathay Financial Holding Co., Ltd.(2) | | 1,330,292 | | | 2,220,085 |
| | | | | | |
| | | Shares
Held | | Value |
| | | | | | |
| TAIWAN (CONTINUED) | | | | | | |
Chinatrust Financial Holding Company Ltd. | | | 3,020,838 | | $ | 1,712,170 |
Far Eastern Textile Ltd. | | | 1,642,698 | | | 1,805,219 |
Hon Hai Precision Industry Co., Ltd. | | | 1,037,729 | | | 4,492,970 |
HTC Corporation | | | 276,400 | | | 3,228,931 |
MediaTek Incorporation | | | 220,214 | | | 3,820,704 |
Prime View International Co., Ltd.(2) | | | 1,197,000 | | | 2,167,249 |
Taiwan Fertilizer Co., Ltd. | | | 842,000 | | | 2,691,070 |
Taiwan Semiconductor Manufacturing Company Ltd. | | | 3,006,647 | | | 5,822,432 |
| | | | | | |
| | | | | | 29,799,730 |
| THAILAND - 3.2% | | | | | | |
Bangkok Bank Public Company Limited (DR) | | | 479,200 | | | 1,948,811 |
Bumrungrad Hospital Public Company Limited (DR) | | | 1,422,400 | | | 1,352,677 |
Glow Energy Pcl (DR) | | | 1,490,500 | | | 1,774,679 |
Siam Commercial Bank Public Company Limited (DR) | | | 868,600 | | | 2,471,353 |
Total Access Communication Public Company Limited (DR) | | | 1,339,000 | | | 1,552,884 |
| | | | | | |
| | | | | | 9,100,404 |
| TURKEY - 4.4% | | | | | | |
Cimsa Cimento Sanayi ve Ticaret A.S. | | | 411,394 | | | 2,317,522 |
Ford Otomotiv Sanayi A.S. | | | 265,519 | | | 1,924,368 |
Tekfen Holding A.S.(2) | | | 472,882 | | | 1,775,936 |
Tupras-Turkiye Petrol Rafinerileri A.S. | | | 72,949 | | | 1,658,205 |
Turkcell Iletisim Hizmetleri AS | | | 378,631 | | | 2,307,585 |
Turkiye Sinai Kalkinma Bankasi A.S.(2) | | | 1,809,135 | | | 2,693,886 |
| | | | | | |
| | | | | | 12,677,502 |
| UNITED ARAB EMIRATES - 0.7% | | | | | | |
Air Arabia | | | 7,254,521 | | | 1,935,592 |
| | | | | | |
Total common and preferred stocks
(Cost $231,479,385) | | | | | | 270,126,326 |
| | |
| | | Par
Amount | | |
SHORT-TERM INVESTMENTS
(CASH EQUIVALENTS) - 3.2% | | | | | | |
Repurchase agreement with Fixed Income Clearing Corporation, 0.00%, dated 3/31/10, due 4/1/10, maturity value $9,104,000(4)
(Cost $9,104,000) | | $ | 9,104,000 | | | 9,104,000 |
| | | | | | |
| | | | | | |
Total investments - 97.5%
(Cost $240,583,385) | | | | | | 279,230,326 |
| | | | | | |
Other assets less liabilities - 2.5% | | | | | | 7,159,611 |
| | | | | | |
| | | | | | |
Total net assets - 100.0%(5) | | | | | $ | 286,389,937 |
| | | | | | |
5
| (2) | Non-income producing security. |
| (3) | Valued at a fair value in accordance with procedures established by the board of directors of Artisan Funds, Inc. In total, securities valued at a fair value were $1,444,259 or 0.5% of total net assets. |
| | | | | | | | |
Issuer | | Rate | | | Maturity | | Value |
U.S. Treasury Bond | | 4.625 | % | | 11/15/2016 | | $ | 9,283,716 |
| (5) | Percentages for the various classifications relate to total net assets. |
Company names are as reported by a data service provider and in some cases are translations; a company’s legal name may be different.
(DR) Depository Receipt, voting rights may vary.
| | | | | | |
| PORTFOLIO DIVERSIFICATION - MARCH 31, 2010 (Unaudited) | |
| | | Value | | Percentage
of Total
Net Assets | |
Consumer Discretionary | | $ | 27,424,473 | | 9.6 | % |
Consumer Staples | | | 19,858,000 | | 6.9 | |
Energy | | | 31,857,845 | | 11.1 | |
Financials | | | 45,765,433 | | 16.0 | |
Healthcare | | | 5,110,233 | | 1.8 | |
Industrials | | | 28,067,596 | | 9.8 | |
Information Technology | | | 36,133,505 | | 12.6 | |
Materials | | | 40,021,477 | | 14.0 | |
Telecommunication Services | | | 30,567,352 | | 10.7 | |
Utilities | | | 5,320,412 | | 1.8 | |
| | | | | | |
Total common and preferred stocks | | | 270,126,326 | | 94.3 | |
Short-term investments | | | 9,104,000 | | 3.2 | |
| | | | | | |
Total investments | | | 279,230,326 | | 97.5 | |
Other assets less liabilities | | | 7,159,611 | | 2.5 | |
| | | | | | |
Total net assets | | $ | 286,389,937 | | 100.0 | % |
| | | | | | |
| | | | | | |
| CURRENCY EXPOSURE - MARCH 31, 2010 (Unaudited) | |
| | | Value | | Percentage
of Total
Investments | |
Brazilian real | | $ | 50,473,847 | | 18.1 | % |
British pound | | | 1,323,712 | | 0.5 | |
Chilean peso | | | 3,227,642 | | 1.1 | |
Czech koruna | | | 1,873,367 | | 0.7 | |
Egyptian pound | | | 5,792,088 | | 2.1 | |
Hong Kong dollar | | | 29,601,188 | | 10.6 | |
Hungarian forint | | | 2,053,574 | | 0.7 | |
Indian rupee | | | 14,530,931 | | 5.2 | |
Indonesian rupiah | | | 10,130,582 | | 3.6 | |
Korean won | | | 23,947,659 | | 8.6 | |
Mexican peso | | | 17,357,871 | | 6.2 | |
Polish zloty | | | 1,875,877 | | 0.7 | |
South African rand | | | 25,291,101 | | 9.0 | |
Swedish krona | | | 2,288,452 | | 0.8 | |
Taiwan dollar | | | 29,799,730 | | 10.7 | |
Thai baht | | | 9,100,404 | | 3.3 | |
Turkish lira | | | 12,677,502 | | 4.5 | |
United Arab Emirates dirham | | | 1,935,592 | | 0.7 | |
U.S. dollar | | | 35,949,207 | | 12.9 | |
| | | | | | |
Total investments | | $ | 279,230,326 | | 100.0 | % |
| | | | | | |
| | | | | |
| TOP TEN HOLDINGS - MARCH 31, 2010 (Unaudited) | |
Company Name | | Country | | Percentage
of Total
Net Assets | |
Samsung Electronics Co., Ltd. | | Korea | | 4.4 | % |
Petroleo Brasileiro S.A. | | Brazil | | 3.7 | |
Companhia Vale do Rio Doce | | Brazil | | 3.4 | |
America Movil SAB de C.V. | | Mexico | | 2.0 | |
Taiwan Semiconductor Manufacturing Company Ltd. | | Taiwan | | 2.0 | |
China Mobile Limited | | China | | 2.0 | |
LUKOIL | | Russia | | 2.0 | |
Impala Platinum Holdings Limited | | South Africa | | 1.8 | |
Itau Unibanco Holdings SA | | Brazil | | 1.7 | |
Hon Hai Precision Industry Co., Ltd. | | Taiwan | | 1.6 | |
| | | | | |
Total | | | | 24.6 | % |
| | | | | |
For the purpose of determining the Fund’s top ten holdings, securities of the same issuer are aggregated to determine the weight in the Fund.
The accompanying notes are an integral part of the financial statements.
6
ARTISAN FUNDS, INC.
Statement of Assets and Liabilities – March 31, 2010 (Unaudited)
| | | | |
| | | EMERGING MARKETS | |
| ASSETS: | | | | |
Investments in securities, unaffiliated, at value | | $ | 270,126,326 | |
Short-term investments (repurchase agreements), at value | | | 9,104,000 | |
| | | | |
Total investments | | | 279,230,326 | |
Cash | | | 273 | |
Foreign currency | | | 279,923 | |
Net unrealized gain on foreign currency forward contracts | | | 3,894 | |
Receivable from investments sold | | | 1,777,772 | |
Receivable from fund shares sold | | | 11,745,667 | |
Dividends and interest receivable | | | 578,796 | |
Receivable from Adviser | | | 141,861 | |
Other assets | | | 1,846 | |
| | | | |
Total assets | | | 293,760,358 | |
| |
| LIABILITIES: | | | | |
Payable for investments purchased | | | 6,724,770 | |
Payable for fund shares redeemed | | | 5,296 | |
Payable for operating expenses | | | 424,956 | |
Payable for withholding taxes | | | 213,553 | |
Payable for deferred directors’ compensation | | | 1,846 | |
| | | | |
Total liabilities | | | 7,370,421 | |
| | | | |
Total net assets | | $ | 286,389,937 | |
| | | | |
| NET ASSETS CONSIST OF: | | | | |
Fund shares issued and outstanding | | $ | 271,997,081 | |
Net unrealized appreciation on investments and foreign currency related transactions | | | 38,462,925 | |
Accumulated undistributed net investment loss | | | (1,053,593 | ) |
Accumulated undistributed net realized losses on investments and foreign currency related transactions | | | (23,016,476 | ) |
| | | | |
| | $ | 286,389,937 | |
| | | | |
| SUPPLEMENTARY INFORMATION: | | | | |
Net assets | | | | |
Institutional Shares | | $ | 145,946,526 | |
Advisor Shares | | $ | 140,443,411 | |
Shares outstanding (Indefinite number of shares authorized, $0.01 par value) | | | | |
Institutional Shares | | | 10,247,398 | |
Advisor Shares | | | 9,843,299 | |
Net asset value, offering price and redemption price per share | | | | |
Institutional Shares | | $ | 14.24 | |
Advisor Shares | | $ | 14.27 | |
Cost of securities of unaffiliated issuers held | | $ | 240,583,385 | |
Cost of foreign currency | | $ | 279,586 | |
The accompanying notes are an integral part of the financial statements.
7
ARTISAN FUNDS, INC.
Statement of Operations – For the Six Months Ended March 31, 2010 (Unaudited)
| | | | |
| | | EMERGING
MARKETS | |
| INVESTMENT INCOME: | | | | |
Dividends, from unaffiliated issuers(1) | | $ | 1,225,176 | |
Interest | | | 501 | |
| | | | |
Total investment income | | | 1,225,677 | |
| |
| EXPENSES: | | | | |
Advisory fees | | | 1,110,713 | |
Transfer agent fees | | | | |
Institutional Shares | | | 8,492 | |
Advisor Shares | | | 149,993 | |
Shareholder communications | | | | |
Institutional Shares | | | 719 | |
Advisor Shares | | | 16,272 | |
Custodian fees | | | 172,611 | |
Accounting fees | | | 30,377 | |
Professional fees | | | 41,191 | |
Registration fees | | | | |
Institutional Shares | | | 27,465 | |
Advisor Shares | | | 76,409 | |
Directors’ fees | | | 3,464 | |
Other operating expenses | | | 3,007 | |
| | | | |
Total operating expenses | | | 1,640,713 | |
Less amounts waived or paid by the Adviser | | | (141,861 | ) |
| | | | |
Net Expenses | | | 1,498,852 | |
| | | | |
Net investment loss | | | (273,175 | ) |
| |
| NET REALIZED AND UNREALIZED GAINS (LOSSES) ON INVESTMENTS: | | | | |
Net realized gain (loss) on: | | | | |
Investments | | | 5,292,507 | |
Foreign currency related transactions | | | (139,953 | ) |
| | | | |
| | | 5,152,554 | |
Net increase (decrease) in unrealized appreciation or depreciation on: | | | | |
Investments | | | 16,546,347 | |
Foreign currency related transactions | | | (103,188 | ) |
| | | | |
| | | 16,443,159 | |
| | | | |
Net gain on investments and foreign currency related transactions | | | 21,595,713 | |
| | | | |
Net increase in net assets resulting from operations | | $ | 21,322,538 | |
| | | | |
| (1) | Net of foreign taxes withheld of $87,876 |
The accompanying notes are an integral part of the financial statements.
8
ARTISAN FUNDS, INC.
Statement of Changes in Net Assets
| | | | | | | | |
| | | EMERGING MARKETS | |
| | | Six Months Ended
3/31/2010(1) | | | Year Ended
9/30/2009 | |
| OPERATIONS: | | | | | | | | |
Net investment income (loss) | | $ | (273,175 | ) | | $ | 743,057 | |
Net realized gain (loss) on: | | | | | | | | |
Investments | | | 5,292,507 | | | | (26,362,147 | ) |
Foreign currency related transactions | | | (139,953 | ) | | | (230,806 | ) |
Net increase (decrease) in unrealized appreciation or depreciation on: | | | | | | | | |
Investments | | | 16,546,347 | | | | 52,745,622 | |
Foreign currency related transactions | | | (103,188 | ) | | | 20,169 | |
| | | | | | | | |
Net increase in net assets resulting from operations | | | 21,322,538 | | | | 26,915,895 | |
| | |
| DISTRIBUTIONS PAID TO SHAREHOLDERS: | | | | | | | | |
Net investment income: | | | | | | | | |
Institutional Shares | | | (988,454 | ) | | | (747,694 | ) |
Advisor Shares | | | (508,663 | ) | | | (51,612 | ) |
Net realized gains on investment transactions: | | | | | | | | |
Institutional Shares | | | - | | | | (59,063 | ) |
Advisor Shares | | | - | | | | (4,077 | ) |
| | | | | | | | |
Total distributions paid to shareholders | | | (1,497,117 | ) | | | (862,446 | ) |
| | |
| FUND SHARE ACTIVITIES: | | | | | | | | |
Net increase in net assets resulting from fund share activities | | | 112,155,396 | | | | 55,346,259 | |
| | | | | | | | |
Total increase in net assets | | | 131,980,817 | | | | 81,399,708 | |
| | | | | | | | |
Net assets, beginning of period | | | 154,409,120 | | | | 73,009,412 | |
| | | | | | | | |
Net assets, end of period | | $ | 286,389,937 | | | $ | 154,409,120 | |
| | | | | | | | |
| | | | | | | | |
Accumulated undistributed net investment income (loss) | | $ | (1,053,593 | ) | | $ | 716,697 | |
| | | | | | | | |
The accompanying notes are an integral part of the financial statements.
9
ARTISAN FUNDS, INC.
Financial Highlights – For a share outstanding throughout each period
The financial highlights table is intended to help you understand the Fund’s financial performance for the past 5 years or, if shorter, the period of a Fund’s operations. Certain information reflects financial results for a single Fund share. The total returns in the table represent the rate that an investor would have earned or lost on an investment in the Fund (assuming reinvestment of all dividends and distributions).
| | | | | | | | | | | | | | | | | | | | | | | | |
Year or
Period
Ended | | |
Net Asset
Value
Beginning
of Period | | Net
Investment
Income
(Loss)(1) | | | Net Realized
and Unrealized
Gain (Loss) on
Investments | | | Total Income
(Loss) from
Investment
Operations | | | Dividends
from Net
Investment
Income | | | Distributions
from Net
Realized Gains | |
| | | | | | | | | | | | | | | | | | | | | | | | |
ARTISAN EMERGING MARKETS FUND | | | | | | | | | | | | | | | | | | | | |
| Advisor Shares | | | | | | | | | | | | | | | | | | | | | | | | |
| 3/31/2010 | (5) | | $ | 13.03 | | $ | (0.02 | ) | | $ | 1.35 | | | $ | 1.33 | | | $ | (0.09 | ) | | $ | - | |
| 9/30/2009 | | | | 11.16 | | | 0.07 | | | | 1.93 | | | | 2.00 | | | | (0.12 | ) | | | (0.01 | ) |
| 9/30/2008 | (6) | | | 17.43 | | | 0.04 | | | | (6.31 | ) | | | (6.27 | ) | | | - | | | | - | |
| (1) | Computed based on average shares outstanding. |
| (2) | Periods less than twelve months (where applicable) are not annualized. |
| (3) | Periods less than twelve months (where applicable) are annualized. |
| (4) | The ratios of expenses to average net assets and net investment income (loss) to average net assets exclude expenses waived or paid by the Adviser or the board of directors. Absent expenses waived or paid by the Adviser or the board of directors, the ratios of expenses to average net assets and net investment income (loss) to average net assets would have been as follows: |
| | | | | | | | |
| | | Year or
Period Ended | | Ratio of Expenses to
Average Net Assets | | | Ratio of Net Investment Income
(Loss) to Average Net Assets | |
Emerging Markets Advisor Shares | | 3/31/2010 | | 1.82 | % | | (0.61 | )% |
| | 9/30/2009 | | 3.00 | % | | (0.80 | )% |
| | 9/30/2008 | | 9.73 | % | | (7.30 | )% |
| (5) | Unaudited. For the six months ended March 31, 2010. |
| (6) | For the period from commencement of operations (June 2, 2008) through September 30, 2008. |
10
ARTISAN FUNDS, INC.
Financial Highlights – For a share outstanding throughout each period (Continued)
| | | | | | | | | | | | | | | | | | | | |
Total
Distributions | | | Net Asset
Value
End of
Period | | Total
Return(2) | | | Net Assets
End of
Period
(millions) | | Ratio of
Expenses
to Average
Net Assets(3)(4) | | | Ratio of Net
Investment
Income (Loss)
to Average
Net Assets(3)(4) | | | Portfolio
Turnover
Rate(2) | |
| | | | | | | | | | | | | | | | | | | | |
| | | | | | | | | | | | | | | | | | | | | |
| | | | | | | | | | | | | | | | | | | | | |
| $ | (0.09 | ) | | $ | 14.27 | | 10.26 | % | | $ | 140.4 | | 1.50 | % | | (0.28 | )% | | 11.99 | % |
| | (0.13 | ) | | | 13.03 | | 18.64 | | | | 50.4 | | 1.50 | | | 0.70 | | | 56.88 | |
| | - | | | | 11.16 | | (35.97 | ) | | | 3.2 | | 1.50 | | | 0.93 | | | 42.24 | |
The accompanying notes are an integral part of the financial statements.
11
ARTISAN FUNDS, INC.
Notes to Financial Statements – March 31, 2010 (Unaudited)
Artisan Funds, Inc. (“Artisan Funds”) was incorporated on January 5, 1995, as a Wisconsin corporation and is registered under the Investment Company Act of 1940, as amended. Artisan Funds is a series comprised of twelve open-end, diversified mutual funds. Artisan Emerging Markets Fund (the “Fund”), commenced operations on June 26, 2006. The Fund’s investment objective is to seek long-term capital growth.
Emerging Markets Fund offers shares of capital stock of two classes – Institutional Shares and Advisor Shares – and began offering Advisor Shares on June 2, 2008. Advisor Shares are sold to employee benefit plans, clients of financial advisors, clients of sponsored programs and institutional or other investors. All investments and exchanges are subject to approval by the Fund. The financial statements of Institutional Shares are presented in a separate report.
Each class of shares has equal rights with respect to portfolio assets and voting privileges. Each class has exclusive voting rights with respect to any matters involving only that class.
Income, expenses not specific to a particular class and realized and unrealized gains and losses were allocated daily to each class of shares based upon the relative net asset value of outstanding shares. Expenses attributable to a particular class of shares, such as transfer agency fees, shareholder communication expenses and registration fees, were allocated directly to that class.
The Fund is managed by Artisan Partners Limited Partnership (the “Adviser”). The Adviser is wholly owned by Artisan Partners Holdings LP (“Artisan Holdings”).
| (2) | Summary of significant accounting policies: |
The following is a summary of significant accounting policies of Artisan Funds in effect during the period covered by the financial statements, which were in accordance with United States generally accepted accounting principles.
| (a) | Security valuation – The net asset value (“NAV”) of the shares of each class of the Fund was determined as of the close of regular session trading on the New York Stock Exchange (“NYSE”) (usually 4:00 p.m., Eastern Time) each day the NYSE was open for regular session trading. The NAV of each class of shares was determined by dividing the value of the Fund’s securities and other assets attributed to that class, less its liabilities attributed to that class, by the number of outstanding shares of that class of the Fund. |
In determining NAV, each equity security traded on a securities exchange, including the Nasdaq Stock Market and over-the-counter securities, was valued at the closing price as of the time of valuation on the exchange or market designated by the Fund’s accounting agent or pricing vendor as the principal exchange (the “principal exchange”). The closing price provided by the pricing vendor for a principal exchange may differ and may represent information such as last sales price, an official closing price, a closing auction price or other information, depending on exchange or market convention. Absent closing price information from the principal exchange as of the
12
NOTES TO FINANCIAL STATEMENTS
time of valuation, the security was valued using the closing price on another exchange on which the security traded (if such price is made available by the pricing vendor) or the most recent bid quotation on the principal exchange or, if not available, another exchange or in the over-the-counter market, except that securities listed on the London Stock Exchange were valued at the mean of the most recent bid and asked quotations as of the time of valuation. Short-term investments, other than repurchase agreements, maturing within sixty days from the valuation date were valued at amortized cost, which approximates market value.
Securities for which prices were not readily available were valued by Artisan Funds’ valuation committee (the “valuation committee”) at a fair value determined in good faith under procedures established by and under the general supervision of Artisan Funds’ board of directors (the “board of directors”). A price was considered to be not readily available if, among other things, the valuation committee believed that the price determined as described in the preceding paragraph did not reflect a fair value of the security.
Emerging Markets Fund generally invested a significant portion, and perhaps as much as substantially all, of its total assets in securities principally traded in markets outside the U.S. The foreign markets in which the Fund invested were sometimes open on days when the NYSE was not open and the Fund did not calculate its NAV, and sometimes were not open on days when the Fund did calculate its NAV. Even on days on which both the foreign market and the NYSE were open, several hours may have passed between the time when trading in the foreign market closed and the time as of which the Fund calculates its NAV. That was generally the case for markets in Europe, Asia, Australia and other far eastern markets; the regular closing time of foreign markets in North and South America was generally the same as the closing time of the NYSE and the time as of which the Fund calculated its NAV.
The valuation committee concluded that a price determined under the Fund’s valuation procedures was not readily available if, among other things, the valuation committee believed that the value of the security might have been materially affected by events occurring after the close of the market in which the security was principally traded but before the time for determination of NAV (“subsequent event”). A subsequent event might include a company-specific development (for example, announcement of a merger that is made after the close of the foreign market), a development that might affect an entire market or region (for example, imposition of foreign exchange controls by a foreign government), a potentially global development (such as a terrorist attack that may be expected to have an impact on investor expectations worldwide) or a significant change in one or more U.S. securities indexes. Artisan Funds monitored for subsequent events using several tools. An indication by any of those tools of a potential material change in the value of securities resulted in either a meeting of the valuation committee, which considered whether a subsequent event had occurred and whether local market closing prices continued to represent fair values for potentially affected non-U.S. securities, and/or a valuation based on information provided by a third party research service. This third party research service was used to assist in determining estimates of fair values for foreign securities. That service utilized statistical data based on historical performance of securities, markets and other data in developing factors used to estimate a fair value.
13
NOTES TO FINANCIAL STATEMENTS
Estimates of fair values utilized by the Fund as described above may differ from the value realized on the subsequent sale of those securities and from quoted or published prices for those securities. The differences may have been material to the NAV of the Fund or to the information presented.
Foreign stocks as an asset class may underperform U.S. stocks, and foreign stocks may be more volatile than U.S. stocks. Risks relating to investments in foreign securities (including, but not limited to, depositary receipts and participation certificates) include: currency exchange rate fluctuation; less available public information about the issuers of securities; less stringent regulatory standards; lack of uniform accounting, auditing and financial reporting standards; and country risks including less liquidity, high inflation rates, unfavorable economic practices and political instability.
The risks of foreign investments typically are greater in emerging and less developed markets. For example, political and economic structures in these less developed countries may be new and changing rapidly, which may cause instability and greater risk of loss. Their securities markets may be less developed, and securities in those markets are generally more volatile and less liquid than those in the developed markets. Emerging market countries also are more likely to experience high levels of inflation, deflation or currency devaluations, which could hurt their economies and securities markets. Certain emerging markets also may face other significant internal or external risks, including a heightened risk of war, and ethnic, religious and racial conflicts. In addition, governments in many emerging market countries participate to a significant degree in their economies and securities markets, which may impair investment and economic growth of companies in those markets. High levels of national debt tend to make such markets also heavily reliant on foreign capital and, therefore, vulnerable to capital flight.
| (b) | Fair Value Measurements – Under generally accepted accounting principles for fair value measurement, accounting standards clarify the definition of fair value for financial reporting, establish a framework for measuring fair value and require additional disclosures about the use of fair value measurements. In accordance with this standard, fair value is defined as the price that the Fund would receive upon selling an investment in an orderly transaction to an independent buyer in the principal or most advantageous market of the investment. The standard establishes a three-tier hierarchy to distinguish between (1) inputs that reflect the assumptions market participants would use in pricing an asset or liability developed based on the market data obtained from sources independent of the reporting entity (observable inputs) and (2) inputs that reflect the reporting entity’s own assumptions about the assumptions market participants would use in pricing an asset or liability developed based on the best information available in the circumstances (unobservable inputs) and to establish classification of fair value measurements for disclosure purposes. Various inputs are used in determining the value of the Fund’s investments. The three-tier hierarchy of inputs is summarized in three broad levels: |
| | • | | Level 1 – quoted prices in active markets for identical investments |
| | • | | Level 2 – other significant observable inputs (including but not limited to quoted prices for similar securities, interest rates, credit risks, etc.) |
| | • | | Level 3 – significant unobservable inputs (including the Fund’s own assumptions in determining the fair value of investments) |
14
NOTES TO FINANCIAL STATEMENTS
The inputs or methodology used for valuing securities are not necessarily an indication of the risk or liquidity associated with investing in those securities.
The following table summarizes the Fund’s investments, based on the inputs used to determine their fair values as of March 31, 2010:
| | | | | | | | | | | | |
| | | Level 1 - Quoted Prices | | Level 2 - Other Significant Observable Inputs | | Level 3 - Significant Unobservable Inputs | | Total |
Equity Securities(1) | | | | | | | | | | | | |
Emerging Asia | | $ | 120,758,237 | | $ | - | | $ | - | | $ | 120,758,237 |
Latin America | | | 71,059,360 | | | - | | | - | | | 71,059,360 |
Emerging Europe, Middle East & Africa | | | 70,161,766 | | | 1,444,259 | | | - | | | 71,606,025 |
Developed Markets | | | 6,702,704 | | | - | | | - | | | 6,702,704 |
Repurchase Agreements | | | - | | | 9,104,000 | | | - | | | 9,104,000 |
Total | | $ | 268,682,067 | | $ | 10,548,259 | | $ | - | | $ | 279,230,326 |
| | (1) | See Fund’s Schedule of Investments for country classifications. |
| (c) | Taxes – No provision was made for federal income taxes or excise taxes since the Fund intends to (i) comply with the provisions of Subchapter M of the Internal Revenue Code applicable to regulated investment companies and (ii) distribute to its shareholders substantially all of its taxable income as well as net realized gains from the sale of investment securities. The Fund may utilize earnings and profits distributed to shareholders on redemptions of Fund shares as part of the dividends paid deduction. |
The Fund has analyzed the tax positions taken on federal income tax returns for all open tax years and has concluded that as of March 31, 2010, no provision for income tax would be required in the Fund’s financial statements. The Fund’s federal and state income and federal excise tax returns for tax years for which the applicable statutes of limitations have not expired are subject to examination by the Internal Revenue Service and state department of revenue.
The Fund may be subject to taxes on realized gains from the sale of investment securities imposed by certain countries in which the Fund invests. The foreign tax expense, if any, was recorded on an accrual basis and is included in “Payable for withholding taxes” on the accompanying Statement of Assets and Liabilities.
| (d) | Portfolio transactions – In determining the Fund’s NAV, security transactions and shareholder transactions were accounted for no later than one business day after trade date, in accordance with applicable law. However, for financial reporting purposes, security transactions and shareholder transactions were recorded on trade date in accordance with United States generally accepted accounting principles. Net realized gains and losses on securities were computed on specific security lot identification. |
| (e) | Foreign currency translation – Values of foreign investments, open foreign currency forward contracts, payables for capital gains taxes and cash denominated in foreign currencies were translated into U.S. dollars using a spot market rate of exchange as of the time of determination of the Fund’s NAV on the day of valuation. Payables and |
15
NOTES TO FINANCIAL STATEMENTS
| | receivables for securities transactions, dividend and reclaim receivables and other receivables and payables denominated in a foreign currency were translated into U.S. dollars using a spot market rate of exchange as of 12:00 p.m. (Eastern Time) on the day of valuation. Purchases and sales of investments and dividend and interest income were translated into U.S. dollars using a spot market rate of exchange as of 12:00 p.m. (Eastern Time) on the date of such transactions. The portion of security gains or losses resulting from changes in foreign exchange rates was included with net realized and unrealized gain or loss from investments, as appropriate, for both financial reporting and tax purposes. |
The Fund may enter into foreign currency forward contracts to hedge the foreign currency exposure on open payables and receivables. These foreign currency forward contracts, or spot contracts, generally settle within two business days. The Fund also may enter into foreign currency forward contracts to hedge against foreign currency exchange rate risks on its non-U.S. dollar denominated investment securities, although they generally do not do so. Foreign currency forward contracts, if any, were recorded at market value and any related realized and unrealized gains and losses were reported as foreign currency related transactions for financial reporting purposes. For tax purposes, these foreign exchange gains and losses were treated as ordinary income or loss. The Fund could be exposed to loss if the counterparties fail to perform under these contracts.
Other foreign currency related transaction gains and losses may result from currency gains and losses realized from the difference between the amounts of dividends and foreign withholding taxes recorded on the Fund’s books and the U.S. dollar equivalent of the amounts actually received or paid. The net increase (decrease) in unrealized appreciation or depreciation on foreign currency related transactions arose from changes in the values of assets and liabilities, other than investments in securities, resulting from changes in foreign exchange rates.
| (f) | Repurchase agreements – The Fund may enter into repurchase agreements with institutions that the Adviser determined were creditworthy pursuant to criteria adopted by the board of directors. Repurchase agreements were recorded at cost plus accrued interest and were collateralized in an amount greater than or equal to the repurchase price plus accrued interest. Collateral (in the form of U.S. government securities) was held by the Fund’s custodian and in the event of default on the obligation of the counterparty to repurchase, the Fund had the right to liquidate the collateral and apply the proceeds in satisfaction of the obligation. If the proceeds from any sale of such collateral were less than the repurchase price, the Fund would have suffered a loss. |
| (g) | Depositary receipts – The Fund may invest in depositary receipts. Depositary receipts are typically issued by a financial institution (a “depositary”), evidencing ownership interests in a security issued by an issuer and deposited with the depositary. |
| (h) | Securities lending – The Fund may enter into securities lending transactions secured by collateral in the form of U.S. Government securities at least equal to, at all times, the fair value of the securities loaned. Any such collateral will be held in a custody account maintained by State Street Bank and Trust Company, the Fund’s custodian. |
16
NOTES TO FINANCIAL STATEMENTS
| | When securities are on loan, the Fund does not receive dividends on the securities loaned, but receives compensation from the borrower in lieu of such dividends. Gain or loss in the fair value of the securities loaned that may occur during the term of the loan will be for the account of the applicable Fund. In entering into securities lending arrangements, the Fund takes the risk that the borrower may not provide additional collateral when required or return the securities when due or, if the borrower defaults, the Fund may experience delays in selling collateral or the collateral may not be sufficient to cover the value of securities lent. There were no securities on loan during the six months ended March 31, 2010. |
| (i) | Equity-linked participation certificates – The Fund may invest in equity-linked participation certificates. Equity-linked participation certificates are derivative securities which are designed to provide synthetic exposure to one or more underlying securities. An investment in an equity-linked participation certificate typically entitles the holder to a return equal to the market return of the underlying security or securities, subject to the credit risk of the issuing financial institution. The Fund did not invest in participation certificates during the six months ended March 31, 2010. |
| (j) | Transfer agent fees – The Fund paid fees to, and reimbursed expenses of, the Fund’s transfer agent. In addition, the Fund has authorized certain financial services companies, broker-dealers, banks or other authorized agents, and in some cases, other organizations designated by an authorized agent (with their designees, collectively “authorized agents”) to accept purchase, exchange and redemption orders for Advisor Shares on the Fund’s behalf. Many authorized agents charged a fee for accounting and shareholder services that the agent provided to Fund shareholders on the Fund’s behalf. Those services typically included recordkeeping, transaction processing for shareholders’ accounts and other services. The fee was either based on the number of accounts to which the authorized agent provided such services, or was a percentage (as of March 31, 2010, up to 0.40% annually) of the average value of Fund shares held in such accounts. The Fund paid a portion of such fees, which are intended to compensate the authorized agent for its provision of services of the type that would be provided by the Fund’s transfer agent or other service providers if the shares were registered on the books of the Fund’s transfer agent. The balance of the fees incurred was paid by the Adviser. The Fund’s expenses incurred for services provided by authorized agents were included in “Transfer agent fees” in the Statement of Operations. The table below shows the fees and expenses to the Fund’s transfer agent and the fees to authorized agents incurred by each class of the Fund during the six months ended March 31, 2010. |
| | | | | | | | | |
| | | Six Months Ended 3/31/10 |
| | | Fees and Expenses
to Transfer Agent | | Fees to
Authorized
Agents | | Total |
Institutional Shares | | $ | 8,492 | | $ | - | | $ | 8,492 |
Advisor Shares | | | 30,909 | | | 119,084 | | | 149,993 |
| (k) | Commission recapture – The Fund had the ability to direct portfolio trades to various brokers that have agreed to rebate a portion of the commissions generated. The Fund received no commission recapture rebates for the six months ended March 31, 2010. |
17
NOTES TO FINANCIAL STATEMENTS
| (l) | Use of estimates – The preparation of financial statements in conformity with United States generally accepted accounting principles requires management to make estimates and assumptions that affect the reported amounts and disclosures in the financial statements. Actual results could differ from those estimates. |
| (m) | Indemnifications – In the normal course of business, the Fund has entered into contracts in which the Fund agrees to indemnify the other party or parties against various potential costs or liabilities. The Fund’s maximum exposure under these arrangements is unknown. No claim had been made for indemnification pursuant to any such agreement of the Fund. |
| (n) | Other – Dividend income less foreign taxes withheld, if any, was generally recorded on the ex-dividend date. In some cases, the information was not available to the Fund on the ex-dividend date. In such cases, which may have included private placements and foreign securities, dividends were recorded as soon after the ex-dividend date as reliable information became available to the Fund. Non-cash dividends included in dividend income, if any, were generally recorded at the fair market value of securities received. Interest income was reported on the accrual basis. Distributions to shareholders were recorded on the ex-dividend date. Expenses attributable to Artisan Funds were generally allocated to each Artisan Fund based on net assets. However, other expense allocation methodologies were used, depending on the nature of the expense item. Expenses attributable to a particular Fund or class were allocated directly to that Fund or class. |
The character of income and net realized gains and losses may differ in some instances for financial statement and tax purposes and may result in reclassification of permanent differences among certain capital accounts to more appropriately conform financial accounting to tax characterizations of dividend and capital gain distributions.
Emerging Markets Fund generally imposed a 2% redemption fee on shares held 90 days or less. Those redemption fees were recorded as a reduction in the cost of shares redeemed and had the primary effect of increasing paid-in capital. The Fund reserved the right to waive or reduce the 2% redemption fee on shares held 90 days or less at its discretion when the Fund believed such waiver was in the best interests of the Fund, including but not limited to when it determined that imposition of the redemption fee was not necessary to protect the Fund from the effects of short-term trading. The Fund waived the fee on redemption of shares held by certain authorized agents or other Fund intermediaries and otherwise in accordance with the Fund’s prospectus.
| (3) | Transactions with affiliates: |
The Adviser, with which the officers and a director of Artisan Funds were affiliated, provided investment advisory and administrative services to the Fund. In exchange for those services, Emerging Markets Fund paid a monthly management fee to the Adviser at the annual rate of 1.05% of the Fund’s average daily net assets.
The Adviser has contractually agreed to waive its management fee, and to the extent that fee waiver is insufficient, to reimburse Emerging Markets Fund for any ordinary operating expenses in an amount sufficient to cause the Fund’s ordinary operating expenses, including the management fee, to be not more than 1.50% of average daily net assets, annually. For the
18
NOTES TO FINANCIAL STATEMENTS
six months ended March 31, 2010, the Adviser paid operating expenses on behalf of the Advisor Shares of Emerging Markets Fund. Emerging Markets Fund reimburses the Adviser annually for operating expenses paid on its behalf up to 1.50% of average daily net assets, annually. The amount of operating expenses owed to the Adviser is included in payable for operating expenses on the Statements of Assets and Liabilities for Emerging Markets Fund.
The officers and director of Artisan Funds who are affiliated with the Adviser receive no compensation from Artisan Funds.
Prior to April 1, 2010, each director who was not an affiliated person of the Adviser received an annual retainer of $170,000, payable quarterly, as well as reimbursement of expenses related to his duties as a director of Artisan Funds. The amount of the annual retainer increases by $10,000 with each new series of Artisan Funds. In addition, the non-interested chair of the board of directors received an annual retainer of $60,000, payable quarterly, and each chair of a board committee who was a non-interested director received an annual retainer of $30,000, payable quarterly. Effective April 1, 2010, each director who was not an affiliated person of Artisan Funds or the Adviser received an annual retainer of $180,000, payable quarterly, due to the commencement of operations of Global Equity Fund. The other additional annual retainer fees were unchanged. These fees were generally allocated to each of the Artisan Funds based on net assets, subject to a minimum allocation of $1,500 to each Fund per quarter.
Artisan Funds has adopted a deferred compensation plan for directors who are not affiliated persons of the Adviser that enables directors to elect to defer receipt of all or a portion of the annual compensation they are entitled to receive from Artisan Funds. For purposes of determining the amount owed to the directors under the plan, deferred amounts were invested in shares of Artisan Funds as selected by the individual directors. The Fund purchased shares of Artisan Funds selected for deferral by the director in amounts equal to his investment, resulting in a Fund asset equal to the deferred compensation liability. Such assets were included as a component of “Other assets” on the Statement of Assets and Liabilities. Deferral of directors’ fees under the plan did not affect the net assets of the Fund, and did not materially affect the Fund’s assets, liabilities or net investment income per share. Amounts will be deferred until distributed in accordance with the plan.
Shares of Artisan Funds were offered for sale by Artisan Distributors LLC (“Distributors”). Distributors is wholly owned by Artisan Holdings. All distribution expenses relating to the Fund were paid by the Adviser.
| (4) | Line of credit arrangement: |
Artisan Funds is party to a line of credit agreement with State Street Bank and Trust Company (“SSB”), which expires in August 2010, under which the Fund may borrow up to the lesser of (a) $75 million or (b) the lesser of (i) 33 1/3% of its adjusted net assets, with adjusted net assets being total assets less liabilities and the value of any assets pledged to anyone other than SSB, (after giving effect to the loan) or (ii) the maximum amount the Fund may borrow under the Investment Company Act of 1940, the limitations included in the Fund’s prospectus, or any limit or restriction under any law or regulation to which the Fund was subject or any agreement to which the Fund or Artisan Funds is a party; provided that the aggregate borrowings by all Artisan Funds may not exceed $100 million. Artisan Funds paid a commitment fee at the annual rate of 0.15% on the unused portion of the line
19
NOTES TO FINANCIAL STATEMENTS
of credit and interest was charged on any borrowings at the current Federal Funds rate plus 1.25%. SSB has agreed to waive 0.05% of the commitment fee by reducing the Funds’ custody expenses until August 2010. The use of the line of credit was generally restricted to temporary borrowing for extraordinary or emergency purposes. During the six months ended March 31, 2010, there were no borrowings under the line of credit for the Fund.
| (5) | Investment transactions: |
The cost of securities purchased and the proceeds from the sale of securities (excluding short-term securities) for the six months ended March 31, 2010 were $123,724,963 and $24,265,947, respectively.
| (6) | Information for Federal income tax purposes: |
For Federal income tax purposes, the cost of investments, gross unrealized appreciation, gross unrealized depreciation and net unrealized appreciation on investments as of March 31, 2010 were as follows:
| | | | | | | | | | |
Cost of
Investments | | Gross Unrealized
Appreciation | | Gross
Unrealized
Depreciation | | | Net
Unrealized
Appreciation
on Investments |
| $250,872,746 | | $ | 33,656,175 | | $ | (5,298,595 | ) | | $ | 28,357,580 |
The difference between cost of investments for financial reporting and cost of investments for Federal income tax purposes was due primarily to timing differences in recognizing certain gains and losses on security transactions (e.g., wash sale loss deferrals and passive foreign investment company transactions).
The tax characterization of ordinary income dividends and long-term capital gain distributions paid during the six months ended March 31, 2010 and the year ended September 30, 2009 were as follows:
| | | | | | |
| Six Months Ended 3/31/10 | | Year Ended 9/30/09 |
Ordinary
Income
Dividends | | Long-Term
Capital Gain
Distributions | | Ordinary
Income
Dividends | | Long-Term
Capital Gain
Distributions |
| $1,497,117 | | $ - | | $862,446 | | $ - |
| | | |
Ordinary income dividends and long-term capital gain distributions were determined in accordance with income tax regulations that may differ from U.S. generally accepted accounting principles. These differences were due to differing treatments for items such as net short-term gains, wash sale loss deferrals, passive foreign investment company transactions, foreign currency transactions, net investment losses and post-October losses.
20
NOTES TO FINANCIAL STATEMENTS
Additional tax information as of and for the year ended September 30, 2009 follows:
| | | | |
Undistributed Ordinary Income | | Undistributed
Long-Term Gain | | Post-October
Losses |
| $1,495,995 | | $ - | | $13,611,288 |
As of September 30, 2009, the Fund had a capital loss carryover of $4,542,143 with an expiration of 2017.
| (7) | Fund share activities: |
Capital share transactions for the Fund were as follows:
| | | | | | | | |
Six months ended March 31, 2010 | | Institutional
Shares | | | Advisor
Shares | |
Proceeds from shares issued | | $ | 39,528,000 | | | $ | 86,916,106 | |
Net asset value of shares issued in reinvestment of dividends and distributions | | | 983,707 | | | | 499,770 | |
Cost of shares redeemed(1) | | | (10,117,038 | ) | | | (5,655,149 | ) |
| | | | | | | | |
Net increase from fund share transactions | | $ | 30,394,669 | | | $ | 81,760,727 | |
| | | | | | | | |
| | |
Shares sold | | | 2,933,942 | | | | 6,353,090 | |
Shares issued in reinvestment of dividends and distributions | | | 73,686 | | | | 37,352 | |
Shares redeemed | | | (745,565 | ) | | | (418,813 | ) |
| | | | | | | | |
Net increase in capital shares | | | 2,262,063 | | | | 5,971,629 | |
| | | | | | | | |
| | |
Year ended September 30, 2009 | | Institutional
Shares | | | Advisor
Shares | |
Proceeds from shares issued | | $ | 36,046,627 | | | $ | 42,105,884 | |
Net asset value of shares issued in reinvestment of dividends and distributions | | | 801,388 | | | | 55,689 | |
Cost of shares redeemed(1) | | | (20,916,631 | ) | | | (2,746,698 | ) |
| | | | | | | | |
Net increase from fund share transactions | | $ | 15,931,384 | | | $ | 39,414,875 | |
| | | | | | | | |
| | |
Shares sold | | | 3,727,344 | | | | 3,845,456 | |
Shares issued in reinvestment of dividends and distributions | | | 104,212 | | | | 7,232 | |
Shares redeemed | | | (2,106,464 | ) | | | (268,708 | ) |
| | | | | | | | |
Net increase in capital shares | | | 1,725,092 | | | | 3,583,980 | |
| | | | | | | | |
| (1) | Net of redemption fees of: |
| | | | | | |
| | | 3/31/2010 | | 9/30/2009 |
Institutional Shares | | $ | 742 | | $ | 618 |
Advisor Shares | | | 528 | | | 36 |
The Fund evaluated subsequent events through the issuance of the Fund’s financial statements and has determined there is no impact to the Fund’s financial statements.
21
SHAREHOLDER EXPENSE EXAMPLE (UNAUDITED)
As a shareholder of Artisan Funds, you may incur transaction costs, including redemption fees, and you will incur ongoing costs, including management fees and other Fund expenses. This example is intended to help you understand your ongoing costs (in dollars) of investing in a Fund and to compare these costs with the ongoing costs of investing in other mutual funds.
The example is based on an investment of $1,000 invested at the beginning of the period and held for the entire period from October 1, 2009 to March 31, 2010.
Actual Expenses
The first line below the Fund’s name in the table below provides information about actual account values and actual expenses. You may use the information in this line, together with the amount you invested, to estimate the expenses that you paid over the period. Simply divide your account value by $1,000 (for example, an $8,600 account value divided by $1,000 = 8.6), then multiply the result by the number in the first line under the name of the Fund under the heading entitled “Expenses Paid During Period” to estimate the expenses you paid on your account during this period.
Hypothetical Example for Comparison Purposes
The second line below the Fund’s name in the table below provides information about hypothetical account values and hypothetical expenses based on the Fund’s actual expense ratio for the six months ended March 31, 2010 and an assumed rate of return of 5% per year before expenses, which is not the Fund’s actual return. The hypothetical account values and expenses may not be used to estimate the actual ending account balances or expenses you paid for the period. You may use this information to compare the ongoing costs of investing in the Fund and other funds. To do so, compare the 5% hypothetical example with the 5% hypothetical examples that appear in the shareholder reports of the other funds.
Please note that the expenses shown in the table are meant to highlight your ongoing costs only and do not reflect any transactional costs, such as redemption fees. Therefore, the second line of the table is useful in comparing ongoing costs only, and will not help you determine the relative costs of owning different funds. If these transactional costs were included, your costs would have been higher.
| | | | | | | | | |
| | | Beginning
Account Value
10/1/2009 | | Ending
Account Value
3/31/2010 | | Expenses Paid During
Period
10/1/2009-3/31/2010(1) |
Artisan Emerging Markets Fund - Advisor Shares | | | | | | | | | |
Actual | | $ | 1,000.00 | | $ | 1,102.60 | | $ | 7.86 |
Hypothetical (5% return before expenses) | | $ | 1,000.00 | | $ | 1,017.55 | | $ | 7.54 |
| (1) | Expenses are equal to the Fund’s ratio of expenses to average net assets for the six-month period ended March 31, 2010 (shown below), multiplied by the average account value over the period, multiplied by 182/365 (to reflect the one-half year period). |
| | | |
| Fund | | Annualized Ratio of Expenses to Average
Net Assets for the Six-Month
Period Ended March 31, 2010 | |
Artisan Emerging Markets Fund - Advisor Shares(a) | | 1.50 | % |
| (a) | The annualized ratio of expenses to average net assets excludes expenses waived or paid by the Adviser. |
22
FACTORS CONSIDERED IN RENEWING THE FUNDS’ ADVISORY AGREEMENTS
Artisan Partners Limited Partnership (“Artisan Partners”) is responsible for management of the Funds’ investment portfolios and for overall management of the Funds’ business and affairs pursuant to investment advisory agreements dated May 10, 2006 (Emerging Markets Fund); August 9, 2007 (Global Value Fund); December 28, 1995, as amended November 17, 2005 (International Fund); November 7, 2001 (International Small Cap Fund); August 9, 2002 (International Value Fund); April 10, 1997 (Mid Cap Fund); January 25, 2001 (Mid Cap Value Fund); May 15, 2008 (Opportunistic Growth Fund); February 9, 2006 (Opportunistic Value Fund); March 27, 1995 (Small Cap Fund); and August 20, 1997 (Small Cap Value Fund) (each, an “Advisory Agreement” and together, the “Advisory Agreements”). Artisan Partners, a Delaware limited partnership, is managed by its general partner, Artisan Investments GP LLC, a Delaware limited liability company wholly-owned by Artisan Partners Holdings LP (“Artisan Partners Holdings”). Artisan Partners Holdings is a limited partnership organized under the laws of Delaware whose sole general partner is Artisan Investment Corporation, a Wisconsin corporation. Artisan Partners was founded in March 2009 and succeeded to the investment management business of Artisan Partners Holdings during 2009. Artisan Partners Holdings was founded in December 1994 and began providing investment management services in March 1995. The principal address of Artisan Partners is 875 E. Wisconsin Avenue, Suite 800, Milwaukee, Wisconsin 53202.
The Advisory Agreement for each Fund may be continued from year to year only so long as the continuance is approved annually (a) by the vote of a majority of the directors of Artisan Funds who are not “interested persons” of Artisan Funds or Artisan Partners cast in person at a meeting called for the purpose of voting on such approval, and (b) by the board of directors or by the vote of a majority (as defined in the 1940 Act) of the outstanding shares of the Fund. Each Advisory Agreement provides that Artisan Partners shall not be liable for any loss suffered by a Fund or its shareholders as a consequence of any act or omission in connection with investment advisory or portfolio services under the Advisory Agreement, except by reason of willful misfeasance, bad faith, or gross negligence on the part of Artisan Partners in the performance of its duties or from reckless disregard by Artisan Partners of its obligations and duties under the Advisory Agreement. Each Advisory Agreement will terminate automatically in the event of its assignment (as defined in the 1940 Act).
The directors of Artisan Funds held a special meeting of the board on October 29, 2009 (the “Special Meeting”), at which meeting they gave preliminary consideration to information bearing on the continuation of each Advisory Agreement for the period from December 1, 2009 through November 30, 2010. The primary purpose of the Special Meeting was to ensure that the directors had ample opportunity to consider matters they deemed relevant in considering the continuation of the Advisory Agreements, and to request any additional information they considered reasonably necessary to their deliberations, without undue time constraints.
Prior to the Special Meeting, independent counsel to the independent directors sent to Artisan Partners a request for information to be provided to the directors in connection with their consideration of the continuation of the Advisory Agreements. Artisan Partners provided materials to the directors in response to that request, other information Artisan Partners believed was useful in evaluating the continuation of the Advisory Agreements and extensive reports prepared by Lipper Inc. (“Lipper”), an independent source of investment company data, relating to each Fund’s performance and expenses compared to the
23
FACTORS CONSIDERED IN RENEWING THE FUNDS’ ADVISORY AGREEMENTS
performance and expenses of a relatively small peer group and a larger peer universe of funds determined by Lipper to be comparable. Artisan Partners also provided additional reports prepared by Lipper comparing certain of the Funds’ performance and expenses to peer groups and peer universes with a different style classification that Artisan Partners believed was more appropriate for comparative purposes than the style classification originally selected by Lipper. The directors also received and reviewed a memorandum from their independent counsel regarding the directors’ responsibilities in evaluating the Funds’ Advisory Agreements.
In evaluating the Advisory Agreements, the directors reviewed the available information and discussed with representatives of Artisan Partners each Fund’s operations, the nature, extent and quality of the advisory and other services provided by Artisan Partners to the Funds, the overall expense ratios of each class of shares of the Funds, and economies of scale and other benefits derived by Artisan Partners from its relationship with the Funds. In addition to the third party reports by Lipper and the memorandum from independent counsel, the directors reviewed information provided prior to and presented at the Special Meeting concerning the following:
| • | | Artisan Partners’ personnel and methods, including: Artisan Partners’ assessment of its ability to attract and retain capable research, advisory and administrative personnel through compensation programs and equity participation and Artisan Partners’ assessment of recent hiring and retention experience; the compensation of Artisan Partners’ personnel with primary responsibility for managing the Funds; the time and attention of Artisan Partners’ investment personnel devoted to the Funds; Artisan Partners’ research and decision-making processes, including methods adopted to ensure compliance with investment objectives, policies and restrictions of the portfolios of the Funds; the policies relating to the assignment of Artisan Partners’ personnel to the various Funds’ portfolios; the adequacy and sophistication of Artisan Partners’ technology and systems with respect to investment and administrative matters; and the education, experience and number of Artisan Partners’ advisory personnel; |
| • | | The terms of each Advisory Agreement, including: a list of services performed by Artisan Partners; how the services performed by Artisan Partners under each Advisory Agreement differ from: (a) the services performed by Artisan Partners under other advisory agreements with registered investment companies or other accounts, and (b) the services typically performed by an investment adviser for registered investment companies and other accounts; Artisan Partners’ responsibility for making investment decisions and for observing investment objectives, policies, and restrictions; Artisan Partners’ standard of care; and termination provisions; |
| • | | Each Fund’s short- and long-term investment performance, including comparisons for various time periods with (a) other Artisan Partners client accounts managed in the same investment strategy, (b) other mutual funds having similar investment objectives, and (c) appropriate market indices; |
| • | | Litigation pending, threatened or settled involving Artisan Partners, and the results of any audits, investigations or examinations of the Securities and Exchange Commission (the “SEC”); |
| • | | Information regarding fee arrangements, including: a comparison of the Funds’ total expenses and total expense ratios with other mutual funds (taking into account factors |
24
FACTORS CONSIDERED IN RENEWING THE FUNDS’ ADVISORY AGREEMENTS
| | bearing on comparability, such as size, account-level charges, and investment objective); the structure of the advisory fees, including the method of computing fees and the frequency of payment of fees; a comparison of the advisory fees charged by Artisan Partners to the Funds with the advisory fees charged by other advisory organizations for managing mutual funds and other accounts, especially funds and accounts having similar investment goals and providing similar service; voluntary or contractual advisory fee limitations or reductions and relationship of fees to any fee limitation; the possible cost savings by Artisan Partners, incentives to effect savings, and sharing of savings with the Funds; any economies of scale as reflected in the basic advisory fees and any sliding scale reflecting increased size; a comparison of the fees charged by Artisan Partners to the Funds with the fees charged by Artisan Partners for managing other accounts including other mutual funds to which Artisan Partners provides sub-advisory services, with similar investment goals, including an explanation of any material differences, as well as any differences attributable to variations in service levels; information regarding other expenses, including expenses incurred by each of: (a) Artisan Partners, as adviser and administrator, (b) Artisan Distributors LLC, as the principal underwriter and (c) the Funds; custodian, shareholder servicing and transfer agent fees; and information regarding payments to financial intermediaries; |
| • | | Potential “fall-out” benefits gained by Artisan Partners or its affiliates from its relationship with the Funds, in addition to the advisory fees, including receipt of research paid for with commissions and the benefits to Artisan Partners in attracting and retaining other clients; and the method of estimating other benefits; |
| • | | Brokerage and portfolio transactions, including: the standards and performance in seeking best execution, commissions paid, including commissions by purpose; allocation of brokerage for research and other services (“soft dollars”); Artisan Partners’ practices in light of SEC guidance under Section 28(e) of the Securities Exchange Act of 1934; research purchased with Artisan Partners’ cash; research available for purchase by cash; the execution of portfolio transactions through brokers who sell the Funds’ shares and steps taken to comply with Rule 12b-1(h) under the 1940 Act; and portfolio turnover rates; |
| • | | Artisan Partners’ financial condition and stability and financial arrangements between Artisan Partners and its parent organization; |
| • | | The profitability to Artisan Partners of its relationship with each Fund, including: unaudited schedules showing Artisan Partners’ revenue, expenses and profits in providing services to the Funds on a Fund-by-Fund basis; the assumptions and allocation methodologies utilized for profitability analysis; Artisan Partners’ profit margins; and comparisons with Artisan Partners’ profit margins on other accounts managed by Artisan Partners; and |
| • | | Potential conflicts of interest between the Funds and Artisan Partners and circumstances and actions addressing or bearing on potential conflicts of interest, including: the type and number of other clients served by Artisan Partners; the basis of sharing personnel, services, research and advice among clients; the basis of decisions to buy or sell securities for the Funds and other clients where the same security might be bought or sold for a number of clients; the basis of allocating purchases and sales of the same security, including initial public offerings, among the Funds and other clients of Artisan Partners; the possible advantages, including economies of scale, and disadvantages in having an investment |
25
FACTORS CONSIDERED IN RENEWING THE FUNDS’ ADVISORY AGREEMENTS
| | adviser that has other clients; Artisan Partners’ investments on its own behalf and possible conflicts with the Funds; Artisan Partners’ code of ethics; and Artisan Partners’ proxy voting policies. |
On October 29, 2009 and November 11, 2009, the independent directors met separately with their independent counsel to review and discuss relevant information regarding the continuation of the Advisory Agreements and the information presented and discussed at the Special Meeting. The directors concluded their annual Advisory Agreement review at a regularly scheduled meeting on November 12, 2009. At the November 12th meeting, the independent directors and their independent counsel reviewed with the full board the information discussed at the Special Meeting and the November 11th meeting. The directors then considered whether any further discussion or review was necessary, concluding that the Special Meeting and the information reviewed by the independent directors at the November 11th and 12th meetings provided a strong basis for considering the continuation of the Advisory Agreements. The directors then reviewed and affirmed each of the following conclusions:
The nature, extent, and quality of Artisan Partners’ services. The directors concluded that the nature and extent of Artisan Partners’ services to the Funds was appropriate and consistent with, and in some cases more advantageous to the Funds than, the terms of the Advisory Agreements. The directors concluded that the quality of Artisan Partners’ services has been consistently high, with no material deficiencies.
The investment performance of each Fund. The directors concluded that each of International Fund, International Small Cap Fund, International Value Fund, Mid Cap Fund, Mid Cap Value Fund and Small Cap Value Fund had met its long-term performance standards by adhering to its investment strategy and outperforming its peers over long-term periods. The directors also concluded that each of Emerging Markets Fund, Global Value Fund, Opportunistic Growth Fund and Opportunistic Value Fund had adhered to its investment strategy and performed satisfactorily or better since inception periods. In addition, the directors concluded that, over the long-term, Small Cap Fund had adhered to its investment strategy and that performance was acceptable. Moreover, based on recent changes to the investment management team of Small Cap Fund, the directors concluded that prospects for the performance of that Fund were favorable.
Cost of services, economies of scale and benefits derived by Artisan Partners. The directors concluded that the costs of the services provided by Artisan Partners and the profits realized are reasonable in relation to the nature and quality of services provided and in comparison to (i) the fees charged by mutual funds considered by Lipper, Inc. to be within the same peer category or universe and (ii) the fees charged and the array of services offered to other Artisan clients, including its separate account clients, who have similar investment strategies and objectives, for which it provides few or no services other than portfolio management. The directors concluded that the Funds’ overall expense ratios are competitive and demonstrate Artisan Partners’ history of effective management of the Funds’ business and affairs. The directors also concluded that the shareholders of the Funds (except for International Small Cap Fund and Emerging Markets Fund) have appropriately benefited (or are expected to benefit) from economies of scale under the management fee structures in the Advisory Agreements. It was also concluded that Artisan Partners had not achieved (nor was likely to achieve) economies of scale in the management of International
26
FACTORS CONSIDERED IN RENEWING THE FUNDS’ ADVISORY AGREEMENTS
Small Cap Fund, because it closed at a small asset level. The directors also concluded that Artisan Partners had appropriately put in place a low initial fee schedule in lieu of breakpoints for Emerging Markets Fund.
Other benefits derived by the Funds or Artisan Partners. The directors concluded that, other than the services provided by Artisan Partners pursuant to the Advisory Agreements and the management fees paid in return, the Funds and Artisan Partners may potentially benefit from their relationship with each other in several ways. For Artisan Partners, the directors concluded there were two primary fall-out benefits: (1) the potential conversion of Fund shareholders to separate account clients; and (2) the acquisition of research products and services in return for commissions (“soft dollars”). The directors concluded that, although Artisan Partners derives or may derive those additional benefits, the Funds also could benefit from conversions of Artisan Partners’ separate account clients to Fund shareholders and from the institutional shareholders who choose to invest in the Funds because they want Artisan Partners’ services, but do not meet Artisan Partners’ minimum separate account size requirements. The directors also concluded that the Funds benefit from Artisan Partners’ use of soft dollars generated with respect to its separate account clients.
Following those discussions, the board approved the continuation of each Advisory Agreement through November 30, 2010 by the unanimous vote of all directors and also by the unanimous vote of all the “non-interested” directors.
27
NOTES ON MANAGEMENT’S DISCUSSION OF FUND PERFORMANCE AND PORTFOLIO HOLDINGS’ CLASSIFICATION
The discussion of the Fund included in this report includes statistical information about the portfolio of the Fund. Except as otherwise noted, that information is as of March 31, 2010. That information will vary with changes in the Fund’s portfolio investments. The performance information for the Fund relative to its benchmark index discussed in this report was prepared by the Adviser using information reported by FactSet Databases (“FactSet”). For the purposes of assigning portfolio securities to a particular country, the Adviser considers an issuer to be from a particular country as designated by its securities information vendors. The Adviser currently uses MSCI Inc. as its primary source and FactSet as a secondary source for this information. In the event (i) the Adviser’s securities information vendors do not assign a security to a particular country or if the published classification appears to be erroneous, or (ii) its primary vendor does not assign a security to a particular country and the secondary vendor has assigned a security to a particular country by using a methodology that is not the same as the methodology the primary vendor uses to assign a country, the Adviser assigns the security to a country using the primary vendor’s published criteria (to the extent available) or the Adviser’s own judgment. The primary information vendor’s criteria include the identity of the jurisdiction of the issuer’s incorporation, the main equity trading market for the issuer’s securities, the geographical distribution of the issuer’s operations and the location of the issuer’s headquarters. Country designations may change over time.
For the purposes of assigning portfolio securities to a particular sector and industry, the Adviser assigns securities in accordance with the sector and industry classifications of the Global Industry Classification Standard (GICS®) developed by MSCI Inc. and Standard & Poor’s (to the extent available) as a primary source and FactSet (to the extent available) as a secondary source for this information. In the event the Adviser’s securities information vendors do not classify a security to a particular sector or industry or if the published classification appears to be erroneous, the Adviser classifies the security according to its own judgment, using other securities information vendors, the company description and other publicly available information about the company’s peer group. Sector and industry classifications may change over time.
The names of portfolio securities reflected in this report are as reported by the Fund’s data providers, may not represent the legal name of the entity and, in some cases, are translations of non-English names.
Descriptions of Indices
The Fund’s performance is compared in this report to changes in a broad-based index of changes in prices of securities in the market in which the Fund invests. This index is unmanaged and its returns include reinvested dividends. Unlike the Fund’s returns, the returns of the index do not include the payment of sales commissions or other expenses that would be incurred in the purchase or sale of the securities included in the index. An investment cannot be made directly in an index. Fair value pricing is not employed by market indices.
The index to which the Fund is compared is the Morgan Stanley Capital International Emerging Markets IndexSM, a market-weighted index of companies in emerging markets.
28
NOTES ON MANAGEMENT’S DISCUSSION OF FUND PERFORMANCE AND PORTFOLIO HOLDINGS’ CLASSIFICATION
Trademarks
Trademarks and copyrights relating to the indices and products of portfolio companies mentioned in this report are owned by their respective owners. Except as otherwise indicated, the trademarks, including names, logos, slogans and service marks appearing in this report are the property of the Adviser and may not be copied, reproduced, published or in any way used without written permission.
The Global Industry Classification Standard (“GICS”) was developed by and is the exclusive property and a service mark of MSCI Inc. (“MSCI”) and Standard & Poor’s, a division of The McGraw-Hill Companies, Inc. (“S&P”) and is licensed for use by Artisan Partners Limited Partnership. Neither MSCI, S&P nor any third party involved in making or compiling the GICS or any GICS classifications makes any express or implied warranties or representations with respect to such standard or classification (or the results to be obtained by the use thereof), and all such parties hereby expressly disclaim all warranties of originality, accuracy, completeness, merchantability and fitness for a particular purpose with respect to any of such standard or classification. Without limiting any of the foregoing, in no event shall MSCI, S&P, any of their affiliates or any third party involved in making or compiling the GICS or any GICS classifications have any liability for any direct, indirect, special, punitive, consequential or any other damages (including lost profits) even if notified of the possibility of such damages.
The MSCI information may only be used by the reader, may not be reproduced or redisseminated in any form and may not be used to create any financial instruments or products or any indices. The MSCI information is provided on an “as is” basis and the reader of this information assumes the entire risk of any use made of this information. MSCI, each of its affiliates and each other person involved in or related to compiling, computing or creating any MSCI information (collectively, the “MSCI Parties”) expressly disclaims all warranties (including, without limitation, any warranties of originality, accuracy, completeness, timeliness, non-infringement, merchantability and fitness for a particular purpose) with respect to this information. Without limiting any of the foregoing, in no event shall MSCI Parties have any liability for any direct, indirect, special, incidental, punitive, consequential (including, without limitation, lost profits) or any other damages.
PROXY VOTING POLICIES AND PROCEDURES
You may obtain a description of Artisan Funds’ proxy voting policies and procedures, without charge, upon request by calling 866.574.1770. That information also is included in Artisan Funds’ statement of additional information, which is available without charge, on the Fund’s website at www.artisanfunds.com and on the Securities and Exchange Commission’s website at www.sec.gov.
29
PROXY VOTING POLICIES AND PROCEDURES
Information relating to how the Fund voted proxies relating to portfolio securities held during the twelve-month period ended June 30 is available without charge, on the Fund’s website at www.artisanfunds.com and on the Securities and Exchange Commission’s website at www.sec.gov.
INFORMATION ABOUT PORTFOLIO SECURITIES
Artisan Funds files a complete schedule of portfolio holdings with the Securities and Exchange Commission for the quarters ending December 31 and June 30 (the first and third quarters of the Funds’ fiscal year) on Form N-Q. The Fund’s Forms N-Q are available on the Securities and Exchange Commission’s website at www.sec.gov. You also may review and copy those documents by visiting the Securities and Exchange Commission’s Public Reference Room in Washington, D.C. Information on the operation of the Public Reference Room may be obtained by calling the Securities and Exchange Commission at 800.SEC.0330.
30
| | | | |

| | ARTISAN FUNDS P.O. BOX 8412 BOSTON, MA 02266-8412 866.574.1770 | | |
Not applicable for semiannual reports.
| Item 3. | Audit Committee Financial Expert. |
Not applicable for semiannual reports.
| Item 4. | Principal Accountant Fees and Services. |
Not applicable for semiannual reports.
| Item 5. | Audit Committee of Listed Registrants. |
Not applicable.
| Item 6. | Schedule of Investments. |
The Schedules of Investments in securities of unaffiliated issuers as of March 31, 2010 are included as part of the semiannual reports to shareholders filed under Item 1 of this Form N-CSR.
| Item 7. | Disclosure of Proxy Voting Policies and Procedures for Closed-End Management Investment Companies. |
Not applicable.
| Item 8. | Portfolio Managers of Closed-End Management Investment Companies. |
Not applicable.
| Item 9. | Purchases of Equity Securities by Closed-End Management Investment Company and Affiliated Purchasers. |
Not applicable.
| Item 10. | Submission of Matters to a Vote of Security Holders. |
No material changes to report.
| Item 11. | Controls and Procedures. |
(a) The registrant’s principal executive and principal financial officers have concluded, based on an evaluation of the registrant’s disclosure controls and procedures (as defined in Rule 30a-3(c) under the Investment Company Act of 1940, the “Disclosure Controls”) as of a date within 90 days prior to the filing date (the “Filing Date”) of this Form N-CSR (the “Report”), that the Disclosure Controls are effectively designed to provide reasonable assurance that the information required to be disclosed by the registrant in the Report is recorded, processed, summarized and reported by the Filing Date, including ensuring that information required to be disclosed in the Report is accumulated and communicated to the registrant’s management, including the registrant’s principal executive officer and principal financial officer, as appropriate to allow timely decisions regarding required disclosure.
(b) There were no changes in the registrant’s internal controls over financial reporting (as defined in Rule 30a-3(d) under the Investment Company Act of 1940) that occurred during the second fiscal quarter of the period covered by this report that have materially affected, or are reasonably likely to materially affect, the registrant’s internal control over financial reporting.
| | | | |
| (a) | | (1) | | Not applicable for semiannual reports |
| | |
| | (2) | | Certifications of Eric R. Colson, Principal Executive Officer and Lawrence A. Totsky, Principal Financial Officer pursuant to Rule 30a-2(a) under the Investment Company Act of 1940 (17 CFR 270.30a-2(a)), attached hereto as Exhibits (a)(2)(i) and (a)(2)(ii) |
| | |
| (b) | | | | Certification of Eric R. Colson, Principal Executive Officer and Lawrence A. Totsky, Principal Financial Officer pursuant to Section 906 of the Sarbanes-Oxley Act of 2002, attached hereto as Exhibit (b) |
SIGNATURES
Pursuant to the requirements of the Securities Exchange Act of 1934 and the Investment Company Act of 1940, the registrant has duly caused this report to be signed on its behalf by the undersigned, thereunto duly authorized.
Artisan Funds, Inc.
| | |
| By: | | /S/ ERIC R. COLSON |
| | Eric R. Colson |
| | Principal Executive Officer |
| |
| Date: | | June 4, 2010 |
Pursuant to the requirements of the Securities Exchange Act of 1934 and the Investment Company Act of 1940, this report has been signed below by the following persons on behalf of the registrant and in the capacities and on the dates indicated.
| | |
| By: | | /S/ ERIC R. COLSON |
| | Eric R. Colson |
| | Principal Executive Officer |
| |
| Date: | | June 4, 2010 |
| |
| By: | | /S/ LAWRENCE A. TOTSKY |
| | Lawrence A. Totsky |
| | Principal Financial Officer |
| |
| Date: | | June 4, 2010 |