UNITED STATES
SECURITIES AND EXCHANGE COMMISSION
Washington, D.C. 20549
FORM N-CSR
CERTIFIED SHAREHOLDER REPORT OF REGISTERED
MANAGEMENT INVESTMENT COMPANIES
Investment Company Act file number 811-08932
Artisan Partners Funds, Inc.
(Exact name of registrant as specified in charter)
875 East Wisconsin Avenue, Suite 800
Milwaukee, Wisconsin 53202
(Address of principal executive offices) (Zip Code)
| | |
Sarah A. Johnson | | John M. Loder |
Artisan Partners Funds, Inc. | | Ropes & Gray LLP |
875 East Wisconsin Avenue, Suite 800 | | Prudential Tower, 800 Boylston Street |
Milwaukee, Wisconsin 53202 | | Boston, Massachusetts 02199 |
(Name and address of agents for service)
Registrant’s telephone number, including area code: (414) 390-6100
Date of fiscal year end: 9/30
Date of reporting period: 9/30/16
Form N-CSR is to be used by management investment companies to file reports with the Commission not later than 10 days after the transmission to stockholders of any report that is required to be transmitted to stockholders under Rule 30e-1 under the Investment Company Act of 1940 (17 CFR 270.30e-1). The Commission may use the information provided on Form N-CSR in its regulatory, disclosure review, inspection, and policymaking roles.
A registrant is required to disclose the information specified by Form N-CSR, and the Commission will make this information public. A registrant is not required to respond to the collection of information contained in Form N-CSR unless the Form displays a currently valid Office of Management and Budget (“OMB”) control number. Please direct comments concerning the accuracy of the information collection burden estimate and any suggestions for reducing the burden to Secretary, Securities and Exchange Commission, 100 F Street, NE, Washington, DC 20549. The OMB has reviewed this collection of information under the clearance requirements of 44 U.S.C. § 3507.
Item 1. Reports to Shareholders.
ARTISAN PARTNERS FUNDS
| | | | | | |
| | | Share Class |
| | | Investor | | Advisor | | Institutional |
Artisan Developing World Fund | | ARTYX | | APDYX | | APHYX |
Artisan Emerging Markets Fund | | ARTZX | | N/A | | APHEX |
Artisan Global Equity Fund | | ARTHX | | N/A | | APHHX |
Artisan Global Opportunities Fund | | ARTRX | | APDRX | | APHRX |
Artisan Global Small Cap Fund | | ARTWX | | N/A | | N/A |
Artisan Global Value Fund | | ARTGX | | APDGX | | APHGX |
Artisan High Income Fund | | ARTFX | | APDFX | | N/A |
Artisan International Fund | | ARTIX | | APDIX | | APHIX |
Artisan International Small Cap Fund | | ARTJX | | N/A | | APHJX |
Artisan International Value Fund | | ARTKX | | APDKX | | APHKX |
Artisan Mid Cap Fund | | ARTMX | | APDMX | | APHMX |
Artisan Mid Cap Value Fund | | ARTQX | | APDQX | | APHQX |
Artisan Small Cap Fund | | ARTSX | | N/A | | APHSX |
Artisan Value Fund | | ARTLX | | APDLX | | APHLX |
TABLE OF CONTENTS
ARTISAN PARTNERS FUNDS
P.O. BOX 8412
BOSTON, MA 02266-8412
This report and the audited financial statements contained herein are provided for the general information of the shareholders of Artisan Partners Funds. Before investing, investors should consider carefully each Fund’s investment objective, risks and charges and expenses. For a prospectus or summary prospectus, which contain that information and more information about each Fund, please call 800.344.1770 or visit our website at www.artisanpartners.com. Read it carefully before you invest or send money.
Company discussions are for illustration only and are not intended as recommendations of individual stocks. The discussions present information about the companies believed to be accurate, and the views of the portfolio managers, as of September 30, 2016. That information and those views may change, and the Funds disclaim any obligation to advise shareholders of any such changes.
Artisan Partners Funds offered through Artisan Partners Distributors LLC, member FINRA.
ARTISAN DEVELOPING WORLD FUND
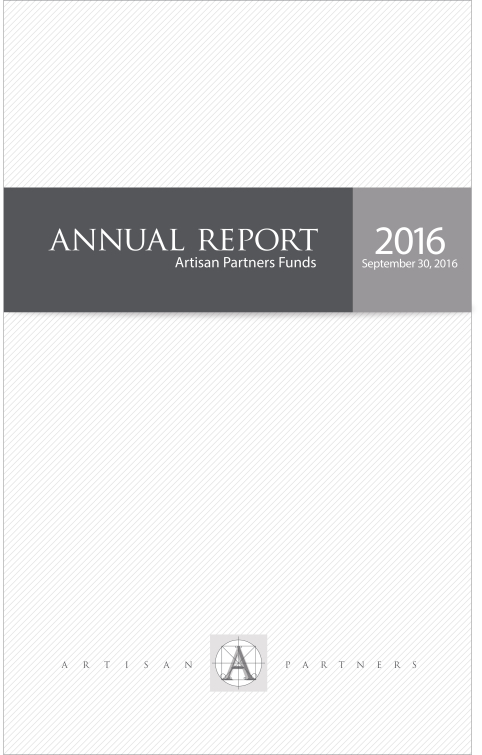
PERFORMANCE HISTORY
GROWTH OF AN ASSUMED $10,000 INVESTMENT (6/29/2015 to 9/30/2016)
AVERAGE ANNUAL TOTAL RETURNS (as of 9/30/2016)
| | | | | | | | | | |
| Fund / Index | | 1-Year | | Since
Inception |
Artisan Developing World Fund – Investor Shares (6/29/2015) | | | | 25.27 | % | | | | 4.04 | % |
Artisan Developing World Fund – Advisor Shares (6/29/2015) | | | | 25.63 | | | | | 4.28 | |
Artisan Developing World Fund – Institutional Shares (6/29/2015) | | | | 25.86 | | | | | 4.44 | |
MSCI Emerging Markets Index | | | | 16.78 | | | | | -2.24 | * |
| * | As of Investor, Institutional and Advisor Shares inception date. |
The performance quoted represents past performance, which does not guarantee future results. The investment return and principal value of an investment in the Fund will fluctuate, so that an investor’s shares in the Fund, when redeemed, may be worth more or less than their original cost. Current performance may be lower or higher than the performance data quoted. For current to most recent month-end performance, visit www.artisanpartners.com or call 800.344.1770. The table above does not reflect the deduction of taxes that a shareholder would pay on distributions or sale of Fund shares. The Fund’s performance reflects Artisan Partners Limited Partnership’s (the “Adviser” or “Artisan Partners”) contractual agreement to limit the Fund’s expenses to no more than 1.50%, of the average daily net assets of Investor Shares, 1.40% of the average daily net assets of Advisor Shares and 1.40% of the average daily net assets of Institutional Shares, which has been in effect since the Fund’s inception and has had a material impact on performance, which would have been lower in its absence. See Notes on Management’s Discussion of Fund Performance and Portfolio Holdings’ Classification for a description of the index.
INVESTING ENVIRONMENT
During the 12-month period ended September 30, 2016, emerging markets equities advanced by double digits, outperforming developed markets peers. Accommodative monetary policy by central banks and negative global bond yields spurred record inflows to the asset class. Rising oil prices strengthened currencies in commodity-producing countries – also aiding returns in the period.
SECTOR DIVERSIFICATION
| | | | | | | | | | |
| Sector | | 9/30/2015 | | 9/30/2016 |
Consumer Discretionary | | | | 15.2 | % | | | | 20.4 | % |
Consumer Staples | | | | 13.7 | | | | | 16.4 | |
Financials | | | | 23.9 | | | | | 13.4 | |
Health Care | | | | 3.6 | | | | | 10.5 | |
Industrials | | | | 4.3 | | | | | 6.6 | |
Information Technology | | | | 25.5 | | | | | 22.1 | |
Materials | | | | 1.0 | | | | | - | |
Real Estate | | | | - | | | | | 1.7 | |
Telecommunication Services | | | | 1.8 | | | | | 0.9 | |
Other assets less liabilities | | | | 11.0 | | | | | 8.0 | |
| | | | | 100.0 | % | | | | 100.0 | % |
PERFORMANCE DISCUSSION
Performance of the following stocks had a positive impact on the portfolio during the period: Brazilian post-secondary institution operator Kroton Educacional, Chinese Internet and mobile services provider Tencent Holdings, Chinese Internet services and e-commerce provider Alibaba, Panamanian airline passenger and cargo services provider Copa Holdings, and Peruvian financial services provider Credicorp.
Notable detractors included: Saudi Arabian travel company AI Tayyar Travel, Chinese insurance products and services provider China Life Insurance, Indian satellite subscription provider Dish TV India, Russian food retailer Magnit and Danish pharmaceutical products producer Novo Nordisk.
REGION ALLOCATION
| | | | | | | | | | |
| Region | | 9/30/2015 | | 9/30/2016 |
Emerging Asia | | | | 39.5 | % | | | | 38.4 | % |
Developed Markets | | | | 24.3 | | | | | 27.0 | |
Latin America | | | | 11.3 | | | | | 15.8 | |
Europe, Middle East and Africa | | | | 13.9 | | | | | 10.8 | |
PORTFOLIO CHANGES
We identified several new investment opportunities for the portfolio during the period, including Brazilian consumer goods manufacturer Hypermarcas, US-based biopharmaceutical company China Biologic Products, Chinese airport operator Shanghai International Airport, Brazilian insurance and benefits package provider Qualicorp, and Danish pharmaceutical products producer Novo Nordisk. We funded these purchases in part by selling our positions in Diageo, China Life Insurance, Taiwan Semiconductor Manufacturing, Hexagon and BB Seguridade Participacoes.
ARTISAN EMERGING MARKETS FUND
PERFORMANCE HISTORY
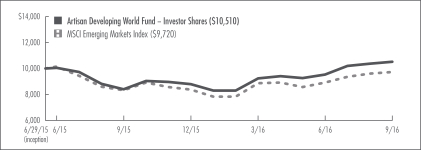
GROWTH OF AN ASSUMED $1,000,000 INVESTMENT (6/26/2006 to 9/30/2016)
AVERAGE ANNUAL TOTAL RETURNS (as of 9/30/2016)
| | | | | | | | | | | | | | | | | | | | | | | | | |
| Fund / Index | | 1-Year | | 3-Year | | 5-Year | | 10-Year | | Since
Inception |
Artisan Emerging Markets Fund – Investor Shares (6/2/2008)1 | | | | 28.79 | % | | | | 1.58 | % | | | | 2.99 | % | | | | n/a | | | | | -2.96 | % |
Artisan Emerging Markets Fund – Institutional Shares (6/26/2006) | | | | 28.69 | | | | | 1.68 | | | | | 3.19 | | | | | 2.60 | % | | | | 3.63 | |
MSCI Emerging Markets Index | | | | 16.78 | | | | | -0.56 | | | | | 3.03 | | | | | 3.95 | | | | | 5.00 | * |
| 1 | Effective February 14, 2014, Emerging Markets Fund’s Advisor Shares were redesignated as Investor Shares. |
| * | As of Institutional Shares inception date. |
The performance quoted represents past performance, which does not guarantee future results. The investment return and principal value of an investment in the Fund will fluctuate, so that an investor’s shares in the Fund, when redeemed, may be worth more or less than their original cost. Current performance may be lower or higher than the performance data quoted. For current to most recent month-end performance, visit www.artisanpartners.com or call 800.344.1770. The graph and table above do not reflect the deduction of taxes that a shareholder would pay on distributions or sale of Fund shares. The Fund’s performance reflects Artisan Partners’ contractual agreement to limit the Fund’s expenses to no more than 1.50%, which has been in effect since the Fund’s inception and has had a material impact on performance, which would have been lower in its absence. See Notes on Management’s Discussion of Fund Performance and Portfolio Holdings’ Classification for a description of the index.
INVESTING ENVIRONMENT
During the 12-month period ended September 30, 2016, emerging markets equities advanced double digits, outperforming developed markets peers. Accommodative monetary policy by central banks and negative global bond yields spurred record inflows to the asset class. Rising oil prices strengthened currencies in commodity-producing countries – also aiding returns in the period.
SECTOR DIVERSIFICATION
| | | | | | | | | | |
| Sector | | 9/30/2015 | | 9/30/2016 |
Consumer Discretionary | | | | 14.8 | % | | | | 14.6 | % |
Consumer Staples | | | | 4.9 | | | | | 6.0 | |
Energy | | | | 6.4 | | | | | 6.2 | |
Financials | | | | 24.4 | | | | | 20.2 | |
Health Care | | | | 7.9 | | | | | 5.9 | |
Industrials | | | | 7.0 | | | | | 7.9 | |
Information Technology | | | | 21.5 | | | | | 24.7 | |
Materials | | | | 5.9 | | | | | 6.7 | |
Telecommunication Services | | | | 2.6 | | | | | 2.5 | |
Utilities | | | | 1.1 | | | | | 4.1 | |
Other assets less liabilities | | | | 3.5 | | | | | 1.2 | |
| | | | | 100.0 | % | | | | 100.0 | % |
PERFORMANCE DISCUSSION
Performance of the following stocks had a positive impact on the portfolio during the period: Korean consumer and industrial equipment manufacturer Samsung Electronics, Taiwanese integrated circuits manufacturer Taiwan Semiconductor Manufacturing, Russian commercial bank Sberbank, Chinese Internet services and e-commerce provider Alibaba, and South African-focused mining services company Randgold Resources.
Notable detractors included: Chinese train-borne electrical systems provider Zhuzhou CRRC Times Electric, Chinese insurance products and services provider China Life Insurance, Korean automobile manufacturer Kia Motors, Chinese media production company Wisdom Sports, and Chinese industrial equipment and technology producer China High Precision Automation.
REGION ALLOCATION
| | | | | | | | | | |
| Sector | | 9/30/2015 | | 9/30/2016 |
Emerging Asia | | | | 60.0 | % | | | | 56.6 | % |
Latin America | | | | 14.9 | | | | | 19.4 | |
Europe, Middle East and Africa | | | | 17.0 | | | | | 18.4 | |
Developed Markets | | | | 4.6 | | | | | 4.4 | |
PORTFOLIO CHANGES
We identified several new investment opportunities for the portfolio during the period, including UAE diversified health care company NMC Health, Taiwanese industrial waste disposal company Sunny Friend Environmental Technology, Brazilian electricity company Cia Energetica de Minas Gerais, Czech commercial bank Moneta Money Bank and Indonesian power company Cikarang Listrindo. We funded these purchases in part by selling our positions in CTBC Financial Holding, Emaar Malls, YPF, Integrated Diagnostics and Habib Bank.
ARTISAN GLOBAL EQUITY FUND
PERFORMANCE HISTORY
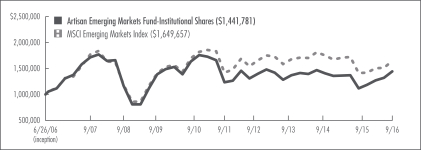
GROWTH OF AN ASSUMED $10,000 INVESTMENT (3/29/2010 to 9/30/2016)
AVERAGE ANNUAL TOTAL RETURNS (as of 9/30/2016)
| | | | | | | | | | | | | | | | |
| Fund / Index | | 1-Year | | | 3-Year | | | 5-Year | | | Since
Inception | |
Artisan Global Equity Fund – Investor Shares (3/29/2010) | | | 7.40 | % | | | 5.12 | % | | | 14.57 | % | | | 10.95 | % |
Artisan Global Equity Fund – Institutional Shares (10/15/2015) | | | n/a | | | | n/a | | | | n/a | | | | 3.01 | 1 |
MSCI ACWI Index | | | 11.96 | | | | 5.17 | | | | 10.63 | | | | 7.14 | * |
| 1 | For the period from commencement of operations 10/15/2015 through 9/30/2016; not annualized. |
| * | As of Investor Shares inception date. |
The performance quoted represents past performance, which does not guarantee future results. The investment return and principal value of an investment in the Fund will fluctuate, so that an investor’s shares in the Fund, when redeemed, may be worth more or less than their original cost. Current performance may be lower or higher than the performance data quoted. The Fund’s investments in initial public offerings (IPOs) made a material contribution to the Fund’s performance. IPO investments are not an integral component of the Fund’s investment process and may not be available in the future. For current to most recent month-end performance, visit www.artisanpartners.com or call 800.344.1770. The graph and table above do not reflect the deduction of taxes that a shareholder would pay on distributions or sale of Fund shares. The Fund’s performance reflects Artisan Partners’ contractual agreement to limit the Fund’s expenses to no more than 1.50%, which has been in effect since the Fund’s inception and has had a material impact on performance, which would have been lower in its absence. See Notes on Management’s Discussion of Fund Performance and Portfolio Holdings’ Classification for a description of the index.
INVESTING ENVIRONMENT
The 12-month period ended September 30, 2016, was volatile for global equities, though global equities closed the period up double digits in USD terms. Stocks sold off in late 2015 and early 2016 on fears over China’s slowing growth and slumping oil prices, but later bounced as oil prices rallied. The United Kingdom’s June 2016 vote to leave the European Union again rattled global markets, though stocks swiftly rebounded as global central banks remained exceptionally accommodative.
SECTOR DIVERSIFICATION
| | | | | | | | | | |
| Sector | | 9/30/2015 | | 9/30/2016 |
Consumer Discretionary | | | | 24.4 | % | | | | 26.2 | % |
Consumer Staples | | | | 1.4 | | | | | 14.6 | |
Financials | | | | 13.9 | | | | | 7.8 | |
Health Care | | | | 28.2 | | | | | 12.6 | |
Industrials | | | | 6.6 | | | | | 5.9 | |
Information Technology | | | | 14.5 | | | | | 22.8 | |
Materials | | | | 4.0 | | | | | 3.3 | |
Real Estate | | | | — | | | | | 2.3 | |
Telecommunication Services | | | | 1.9 | | | | | 2.7 | |
Utilities | | | | 2.2 | | | | | — | |
Other assets less liabilities | | | | 2.9 | | | | | 1.8 | |
| | | | | 100.0 | % | | | | 100.0 | % |
PERFORMANCE DISCUSSION
Performance of the following stocks had a positive impact on the portfolio during the period: US-based developer and distributor of biomedical technologies Medivation, Finnish consumer packaged goods manufacturer Huhtamaki, US-based online retailer Amazon.com, US-based therapeutic and diagnostic medical products manufacturer Medtronic and US-based Internet search engine operator Alphabet.
Notable detractors included: US-based medical services and solutions holding company Envision Healthcare Holdings, US-based specialty pharmaceutical products provider Portola Pharmaceuticals, US-based global payment and travel company American Express, US-based biopharmaceutical products provider PTC Therapeutics and US-based home furnishings provider Restoration Hardware Holdings.
REGION ALLOCAITON
| | | | | | | | | | |
| Region | | 9/30/2015 | | 9/30/2016 |
Americas | | | | 57.9 | % | | | | 64.3 | % |
Europe | | | | 24.3 | | | | | 20.0 | |
Pacific Basin | | | | 2.6 | | | | | 8.0 | |
Emerging Markets | | | | 12.3 | | | | | 5.9 | |
PORTFOLIO CHANGES
We identified several new investment opportunities for the portfolio during the period, including US-based brewing company Molson Coors Brewing, US-based online retailer Amazon.com, US-based discount retail chain operator Dollar Tree, Japanese tobacco product manufacturer and distributor Japan Tobacco, and US-based minimally invasive medical devices manufacturer Boston Scientific. We funded these purchases in part by selling our positions in Advance Auto Parts, American Express, Gilead Sciences, JPMorgan Chase and Baidu.
ARTISAN GLOBAL OPPORTUNITIES FUND
PERFORMANCE HISTORY
GROWTH OF AN ASSUMED $10,000 INVESTMENT (9/22/2008 to 9/30/2016)
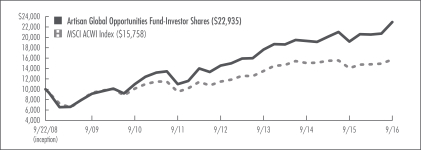
AVERAGE ANNUAL TOTAL RETURNS (as of 9/30/2016)
| | | | | | | | | | | | | | | | | | | | |
| Fund / Index | | 1-Year | | 3-Year | | 5-Year | | Since
Inception |
Artisan Global Opportunities Fund – Investor Shares (9/22/2008) | | | | 19.29 | % | | | | 9.12 | % | | | | 15.82 | % | | | | 10.90 | % |
Artisan Global Opportunities Fund – Advisor Shares (4/1/2015) | | | | 19.37 | | | | | n/a | | | | | n/a | | | | | 9.42 | |
Artisan Global Opportunities Fund – Institutional Shares (7/26/2011) | | | | 19.60 | | | | | 9.40 | | | | | 16.10 | | | | | 10.98 | |
MSCI ACWI Index | | | | 11.96 | | | | | 5.17 | | | | | 10.63 | | | | | 5.83 | * |
| * | As of Investor Shares inception date. |
The performance quoted represents past performance, which does not guarantee future results. The investment return and principal value of an investment in the Fund will fluctuate, so that an investor’s shares in the Fund, when redeemed, may be worth more or less than their original cost. Current performance may be lower or higher than the performance data quoted. For current to most recent month-end performance, visit www.artisanpartners.com or call 800.344.1770. The graph and table above do not reflect the deduction of taxes that a shareholder would pay on distributions or sale of Fund shares. The Investor Shares’ performance reflects Artisan Partners’ contractual agreement, in effect from the inception of the Investor Shares through January 31, 2014, to limit the Investor Shares’ expenses to no more than 1.50%, which has had a material impact on performance, which would have been lower in its absence. See Notes on Management’s Discussion of Fund Performance and Portfolio Holdings’ Classification for a description of the index.
INVESTING ENVIRONMENT
For the 12-month period ended September 30, 2016, global equities advanced by double digits but not without sporadic bouts of volatility. Global monetary policy remained historically accommodative, with most major central banks maintaining near zero or negative interest-rate policies—likely contributing to investor demand for higher-yielding equities. Oil prices were flat, falling sharply through early 2016 before rebounding through the summer. Amid the commodities price recovery and abating concerns about the rate of China’s economic growth, emerging markets equities generally outpaced global equities. Against a background of tepid global economic activity, US stocks outperformed the developed world, while small-cap stocks outpaced mid and large caps during the period.
SECTOR DIVERSIFICATION
| | | | | | | | | | |
| Sector | | 9/30/2015 | | 9/30/2016 |
Consumer Discretionary | | | | 16.5 | % | | | | 9.7 | % |
Consumer Staples | | | | 5.0 | | | | | 8.8 | |
Energy | | | | 1.5 | | | | | 2.4 | |
Financials | | | | 6.9 | | | | | 6.8 | |
Health Care | | | | 16.6 | | | | | 14.9 | |
Industrials | | | | 10.1 | | | | | 12.3 | |
Information Technology | | | | 31.9 | | | | | 34.5 | |
Materials | | | | 2.1 | | | | | 4.0 | |
Utilities | | | | 1.5 | | | | | — | |
Other assets less liabilities | | | | 7.9 | | | | | 6.6 | |
| | | | | 100.0 | % | | | | 100.0 | % |
PERFORMANCE DISCUSSION
Performance of the following stocks had a positive impact on the portfolio during the period: Danish biotechnology company Genmab, Chinese Internet and mobile services provider Tencent Holdings, US-based social networking website operator Facebook, US-based Internet search engine operator Alphabet and US-based financial information services provider S&P Global.
Notable detractors included: US-based quick-serve Mexican restaurant operator Chipotle Mexican Grill, US-based biopharmaceutical company Regeneron Pharmaceuticals, UK-based international foods retail group Associated British Foods, US-based life science tools and integrated systems manufacturer Illumina and US-based personal and commercial insurance provider Direct Line Insurance.
REGION ALLOCATION
| | | | | | | | | | |
| Region | | 9/30/2015 | | 9/30/2016 |
Americas | | | | 52.9 | % | | | | 54.7 | % |
Europe | | | | 21.1 | | | | | 16.1 | |
Pacific Basin | | | | 10.3 | | | | | 14.0 | |
Emerging Markets | | | | 7.8 | | | | | 8.6 | |
PORTFOLIO CHANGES
We identified several new investment opportunities for the portfolio during the period, including minimally invasive medical devices manufacturer Boston Scientific, Australian vineyard and winery operator Treasury Wine Estates, US-based provider of water, hygiene and energy technologies Ecolab, US-based online travel company Priceline and UK-based digital automotive marketplace operator AutoTrader. We funded these purchases in part by selling our positions in Abbott Laboratories, Illumina, Walt Disney, FANUC and Chipotle Mexican Grill.
ARTISAN GLOBAL SMALL CAP FUND
PERFORMANCE HISTORY
GROWTH OF AN ASSUMED $10,000 INVESTMENT (6/25/2013 to 9/30/2016)
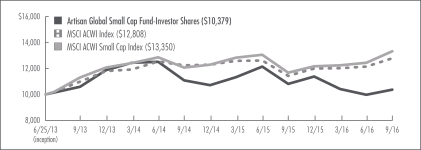
Average annual TOTAL RETURNS (as of 9/30/2016)
| | | | | | | | | | | | | | | |
| Fund / Index | | 1-Year | | 3-Year | | Since
Inception |
Artisan Global Small Cap Fund – Investor Shares (6/25/2013) | | | | -4.05 | % | | | | -0.73 | % | | | | 1.14 | % |
MSCI AWCI Index | | | | 11.96 | | | | | 5.17 | | | | | 7.87 | * |
MSCI ACWI Small Cap Index | | | | 14.21 | | | | | 5.67 | | | | | 9.25 | * |
| * | As of Investor Shares inception date. |
The performance quoted represents past performance, which does not guarantee future results. The investment return and principal value of an investment in the Fund will fluctuate, so that an investor’s shares in the Fund, when redeemed, may be worth more or less than their original cost. Current performance may be lower or higher than the performance data quoted. The Fund’s investments in initial public offerings (IPOs) made a material contribution to the Fund’s performance. IPO investments are not an integral component of the Fund’s investment process and may not be available in the future. For current to most recent month-end performance, visit www.artisanpartners.com or call 800.344.1770. The graph and table above does not reflect the deduction of taxes that a shareholder would pay on distributions or sale of Fund shares. The Fund’s performance reflects Artisan Partners’ contractual agreement to limit the Fund’s expenses to no more than 1.50%, which has been in effect since the Fund’s inception and has had a material impact on performance, which would have been lower in its absence. See Notes on Management’s Discussion of Fund Performance and Portfolio Holdings’ Classification for a description of the index.
| | |
| 10 | | Artisan Partners Funds |
INVESTING ENVIRONMENT
The 12-month period ended September 30, 2016, was volatile for global equities. Stocks sold off in late 2015 and early 2016 on fears over China’s slowing growth and slumping oil prices, but later bounced as oil prices rallied. The United Kingdom’s June 2016 vote to leave the European Union again rattled global markets, though stocks swiftly rebounded as global central banks remained exceptionally accommodative. Ultimately, global small-cap stocks closed the period up double digits in USD terms, outpacing large-cap stocks.
SECTOR DIVERSIFICATION
| | | | | | | | | | |
| Sector | | 9/30/2015 | | 9/30/2016 |
Consumer Discretionary | | | | 18.6 | % | | | | 26.5 | % |
Consumer Staples | | | | 4.0 | | | | | 18.4 | |
Financials | | | | 9.5 | | | | | 3.8 | |
Health Care | | | | 20.0 | | | | | 9.9 | |
Industrials | | | | 7.6 | | | | | 11.7 | |
Information Technology | | | | 8.5 | | | | | 4.0 | |
Materials | | | | 6.3 | | | | | 6.9 | |
Real Estate | | | | — | | | | | 3.8 | |
Telecommunication Services | | | | 6.3 | | | | | 11.3 | |
Utilities | | | | 10.5 | | | | | — | |
Other assets less liabilities | | | | 8.7 | | | | | 3.7 | |
| | | | | 100.0 | % | | | | 100.0 | % |
PERFORMANCE DISCUSSION
Performance of the following stocks had a positive impact on the portfolio during the period: Finnish consumer packaged goods manufacturer Huhtamaki, US-based cable company Cable One, US-based clinical-stage biopharmaceutical company Nektar Therapeutics, Swedish producer of confectionery products Coletta and Japanese chain store operator Seria.
Notable detractors included: UK-based education and health services provider Cambian, US-based specialty pharmaceutical products provider Portola Pharmaceuticals, UK-based supplier of plastic and fiber products Essentra, US-based biopharmaceutical products provider PTC Therapeutics and wastewater treatment company SIIC Environment Holdings.
REGION ALLOCATION
| | | | | | | | | | |
| Region | | 9/30/2015 | | 9/30/2016 |
Europe | | | | 50.7 | % | | | | 70.2 | % |
Americas | | | | 13.6 | | | | | 16.1 | |
Emerging Markets | | | | 21.6 | | | | | 6.4 | |
Pacific Basin | | | | 5.4 | | | | | 3.6 | |
PORTFOLIO CHANGES
We identified several new investment opportunities for the portfolio during the period, including Danish tobacco products manufacturer and distributor Scandinavian Tobacco, Dutch connectivity and performance management services provider InterXion Holding, Swedish cable company Com Hem Holding, German specialty glass and plastic products producer Gerresheimer, and US-based snack food manufacturer and distributor Snyder’s-Lance. We funded these purchases in part by selling our positions in SIIC Environment Holdings, 21Vianet, Cambian, CT Environmental and Cera Sanitaryware.
| | |
| Artisan Partners Funds | | 11 |
ARTISAN GLOBAL VALUE FUND
PERFORMANCE HISTORY
GROWTH OF AN ASSUMED $10,000 INVESTMENT (12/10/2007 to 9/30/2016)
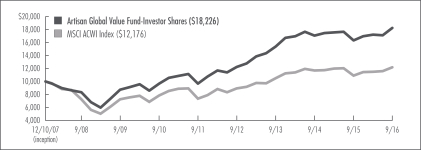
AVERAGE ANNUAL TOTAL RETURNS (as of 9/30/2016)
| | | | | | | | | | | | | | | | | | | | |
| Fund / Index | | 1-Year | | 3-Year | | 5-Year | | Since
Inception |
Artisan Global Value Fund – Investor Shares (12/10/2007) | | | | 11.86 | % | | | | 5.83 | % | | | | 13.58 | % | | | | 7.05 | % |
Artisan Global Value Fund – Advisor Shares (4/1/2015) | | | | 12.00 | | | | | n/a | | | | | n/a | | | | | 2.62 | |
Artisan Global Value Fund – Institutional Shares (7/17/2012) | | | | 12.18 | | | | | 6.09 | | | | | n/a | | | | | 12.16 | |
MSCI ACWI Index | | | | 11.96 | | | | | 5.17 | | | | | 10.63 | | | | | 2.26 | * |
| * | As of Investor Shares inception date. |
The performance quoted represents past performance, which does not guarantee future results. The investment return and principal value of an investment in the Fund will fluctuate, so that an investor’s shares in the Fund, when redeemed, may be worth more or less than their original cost. Current performance may be lower or higher than the performance data quoted. For current to most recent month-end performance information, visit www.artisanpartners.com or call 800.344.1770. The graph and table above do not reflect the deduction of taxes that a shareholder would pay on distributions or sale of Fund shares. The Investor Shares’ performance reflects Artisan Partners’ contractual agreement, in effect from the inception of the Investor Shares through January 31, 2014, to limit the expenses to no more than 1.50%, which has had a material impact on performance, which would have been lower in its absence. See Notes on Management’s Discussion of Fund Performance and Portfolio Holdings’ Classification for a description of the index.
| | |
| 12 | | Artisan Partners Funds |
INVESTING ENVIRONMENT
Global equity markets experienced a volatile 12 months, but closed the period ended September 30, 2016, in positive territory. Negative interest rates in Europe and Japan and the flattened US yield curve spurred a selloff in late 2015 that continued through the first month of the 2016. Stocks gained modestly with the rise in oil prices, and bounced back in concert with GBP after a sharp decline induced by the United Kingdom’s June 2016 vote to leave the European Union. Global monetary policy continued to be extraordinarily accommodative.
SECTOR DIVERSIFICATION
| | | | | | | | | | |
| Sector | | 9/30/2015 | | 9/30/2016 |
Consumer Discretionary | | | | 3.9 | % | | | | 3.7 | % |
Consumer Staples | | | | 7.1 | | | | | 6.8 | |
Energy | | | | 2.8 | | | | | 2.4 | |
Financials | | | | 37.1 | | | | | 31.4 | |
Health Care | | | | 7.9 | | | | | 6.2 | |
Industrials | | | | 7.7 | | | | | 10.1 | |
Information Technology | | | | 23.3 | | | | | 25.2 | |
Telecommunication Services | | | | 1.9 | | | | | 3.1 | |
Other assets less liabilities | | | | 8.3 | | | | | 11.1 | |
| | | | | 100.0% | | | | | 100.0% | |
PERFORMANCE DISCUSSION
Performance of the following stocks had a positive impact on the portfolio during the period: Korean consumer and industrial equipment manufacturer Samsung Electronics, Brazilian telecommunications company Telefonica Brasil, US-based software developer Microsoft, US-based health care products manufacturer and services provider Johnson & Johnson, and US-based digital communications equipment manufacturer QUALCOMM.
Notable detractors included: UK-based commercial bank RBS, Swiss banking and financial services provider UBS, UK-based banking and financial services company Lloyds Banking, UK-based food retailer operator Tesco, and UK-based consulting and engineering services provider Amec Foster Wheeler.
REGION ALLOCATION
| | | | | | | | | | |
| Region | | 9/30/2015 | | 9/30/2016 |
Americas | | | | 55.2 | % | | | | 49.4 | % |
Europe | | | | 28.9 | | | | | 27.7 | |
Emerging Markets | | | | 7.5 | | | | | 11.5 | |
Pacific Basin | | | | 0.1 | | | | | 0.3 | |
PORTFOLIO CHANGES
We identified several new investment opportunities for the portfolio during the period, including Chinese Internet search engine operator Baidu, US-based package and freight delivery company FedEx, Swiss luxury goods retailer Cie Financiere Richemont, UK-based bespoke solutions engineer IMI and Japanese automobile tire manufacturer Bridgestone. We funded these purchases in part by selling our positions in Applied Materials, Novartis, New Oriental Education & Technology, Flextronics International and Joy Global.
| | |
| Artisan Partners Funds | | 13 |
ARTISAN HIGH INCOME FUND
PERFORMANCE HISTORY
GROWTH OF AN ASSUMED $10,000 INVESTMENT (3/19/2014 to 9/30/2016)
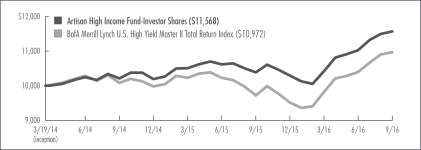
AVERAGE ANNUAL TOTAL RETURNS (as of 9/30/2016)
| | | | | | | | |
| Fund / Index | | 1-Year | | | Since
Inception | |
Artisan High Income Fund – Investor Shares (3/19/2014) | | | 11.40 | % | | | 5.92 | % |
Artisan High Income Fund – Advisor Shares (3/19/2014) | | | 11.61 | | | | 6.07 | |
BofA Merrill Lynch U.S. High Yield Master II Total Return | | | 12.82 | | | | 3.73 | * |
| * | As of Investor and Advisor Shares inception date. |
The performance quoted represents past performance, which does not guarantee future results. The investment return and principal value of an investment in the Fund will fluctuate, so that an investor’s shares in the Fund, when redeemed, may be worth more or less than their original cost. Current performance may be lower or higher than the performance data quoted. For current to most recent month-end performance, visit www.artisanpartners.com or call 800.344.1770. The graph and table above does not reflect the deduction of taxes that a shareholder would pay on distributions or sale of Fund shares. The performance shown does not reflect the deduction of a 2% redemption fee on shares held by an investor for 90 days or less and, if reflected, the fee would reduce the performance quoted. Unlike the Index, the Fund may hold loans and other security types. At times, this can cause material differences in relative performance. See Notes on Management’s Discussion of Fund Performance and Portfolio Holdings’ Classification for a description of the index.
| | |
| 14 | | Artisan Partners Funds |
INVESTING ENVIRONMENT
The non-investment grade credit market advanced during the 12-month period ended September 30, 2016, as yields and spreads reached their lowest levels in more than a year. Credit markets benefited from a rebound in commodity prices, aggressive central bank policies and some evidence of reduced global macro risks.
PERFORMANCE DISCUSSION
Performance of the following holdings had a positive impact on the portfolio during the period: US-based energy infrastructure company Williams Cos, Taiwanese polyethylene manufacturer USI, US-based real estate investment trust VEREIT, Dutch cable provider Altice and US-based oil and gas company Laredo Petroleum.
Performance of the following holdings had a negative impact on the portfolio during the period: US-based integrated circuit manufacturer Opal Acquisition, US-based risk management provider York Risk Services, US-based crop input distributer Pinnacle Operating, US-based exploration and production company Midstates Petroleum and Canadian oil and natural gas company Paramount Resources.
PORTFOLIO COMPOSITION
| | | | | | | | | | |
| Type | | 9/30/2015 | | 9/30/2016 |
Corporate Bonds | | | | 73.2 | % | | | | 71.1 | % |
Bank Loans | | | | 21.0 | | | | | 21.4 | |
Cash and Equivalents | | | | 5.8 | | | | | 7.5 | |
PORTFOLIO CHANGES
We identified several new investment opportunities for the portfolio during the period, including US-based energy infrastructure company Williams Cos, Singapore-based investment holding company HUB Holdings, US-based provider of commerce technologies and network solutions First Data, US-based overhead crane manufacturer Cloud Crane, and Canadian exploration and production company Seven Generations Energy. We funded these purchases in part by selling our positions in Range Resources, Electronic Funds Source, Frontier Communications, Parsley Energy and Valeant Pharmaceuticals International.
| | |
| Artisan Partners Funds | | 15 |
ARTISAN INTERNATIONAL FUND
PERFORMANCE HISTORY
GROWTH OF AN ASSUMED $10,000 INVESTMENT (12/28/1995 to 9/30/2016)
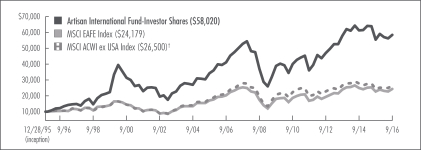
AVERAGE ANNUAL TOTAL RETURNS (as of 9/30/2016)
| | | | | | | | | | | | | | | | | | | | | | | | | |
| Fund / Index | | 1-Year | | 3-Year | | 5-Year | | 10-Year | | Since
Inception |
Artisan International Fund – Investor Shares (12/28/1995) | | | | 5.39 | % | | | | 0.30 | % | | | | 10.07 | % | | | | 3.58 | % | | | | 8.84 | % |
Artisan International Fund – Advisor Shares (4/1/2015) | | | | 5.58 | | | | | n/a | | | | | n/a | | | | | n/a | | | | | -5.95 | |
Artisan International Fund – Institutional Shares (7/1/1997) | | | | 5.64 | | | | | 0.54 | | | | | 10.32 | | | | | 3.82 | | | | | 7.66 | |
MSCI EAFE Index | | | | 6.52 | | | | | 0.48 | | | | | 7.39 | | | | | 1.82 | | | | | 4.34 | * |
MSCI ACWI ex USA Index† | | | | 9.26 | | | | | 0.18 | | | | | 6.04 | | | | | 2.16 | | | | | 4.81 | * |
| * | As of Investor Shares inception date. |
| † | The performance of the Index represents linked performance data for the MSCI ACWI ex USA (Gross) Index from inception to 12/31/2000 and the MSCI ACWI ex USA (Net) Index from 1/1/2001 forward. |
The performance quoted represents past performance, which does not guarantee future results. The investment return and principal value of an investment in the Fund will fluctuate, so that an investor’s shares in the Fund, when redeemed, may be worth more or less than their original cost. Current performance may be lower or higher than the performance data quoted. For current to most recent month-end performance, visit www.artisanpartners.com or call 800.344.1770. The graph and table above do not reflect the deduction of taxes that a shareholder would pay on distributions or sale of Fund shares. See Notes on Management’s Discussion of Fund Performance and Portfolio Holdings’ Classification for a description of each index.
| | |
| 16 | | Artisan Partners Funds |
INVESTING ENVIRONMENT
The 12-month period ended September 30, 2016, was volatile for international equities, though they closed the period in positive territory in USD terms. Stocks sold off in late 2015 and early 2016 on fears over China’s slowing growth and slumping oil prices, but later bounced as oil prices rallied. The United Kingdom’s June 2016 vote to leave the European Union again rattled global markets, though stocks swiftly rebounded as global central banks remained exceptionally accommodative.
SECTOR DIVERSIFICATION
| | | | | | | | | | |
| Sector | | 9/30/2015 | | 9/30/2016 |
Consumer Discretionary | | | | 21.2 | % | | | | 9.5 | % |
Consumer Staples | | | | 10.0 | | | | | 27.0 | |
Financials | | | | 12.3 | | | | | 15.5 | |
Health Care | | | | 19.3 | | | | | 11.2 | |
Industrials | | | | 9.9 | | | | | 11.9 | |
Information Technology | | | | 12.5 | | | | | 8.8 | |
Materials | | | | 8.0 | | | | | 4.1 | |
Real Estate | | | | – | | | | | 1.6 | |
Telecommunication Services | | | | 3.1 | | | | | 8.7 | |
Utilities | | | | 0.1 | | | | | – | |
Other assets less liabilities | | | | 3.6 | | | | | 1.7 | |
| | | | | 100.0 | % | | | | 100.0 | % |
PERFORMANCE DISCUSSION
Performance of the following stocks had a positive impact on the portfolio during the period: US-based therapeutic and diagnostic medical products manufacturer Medtronic, Hong Kong-based insurance and financial services provider AIA, Chinese Internet search engine operator Baidu, Swiss crop-protection product and seed producer Syngenta, and Swiss biopharmaceutical company Actelion.
Notable detractors included: German health care and agricultural products producer Bayer, UK-based provider of air passenger and cargo transport services International Consolidated Airlines, UK-based provider of information technology services Cognizant Technology Solutions, UK-based banking and financial services company Lloyds Banking, and Swiss pharmaceutical and consumer health care product manufacturer Novartis.
REGION ALLOCATION
| | | | | | | | | | |
| Region | | 9/30/2015 | | 9/30/2016 |
Europe | | | | 56.4 | % | | | | 50.5 | % |
Americas | | | | 16.2 | | | | | 24.3 | |
Pacific Basin | | | | 11.0 | | | | | 16.6 | |
Emerging Markets | | | | 12.8 | | | | | 6.9 | |
PORTFOLIO CHANGES
We identified several new investment opportunities for the portfolio during the period, including Japanese tobacco product manufacturer and distributor Japan Tobacco, US-based provider of risk and insurance brokerage consulting Aon, Japanese telecommunication services provider NTT DOCOMO, UK-based branded and consumer packaged goods manufacturer Unilever, and Chinese Internet services and e-commerce provider Alibaba. We funded these purchases in part by selling our positions in Baidu, Toyota, Grupo Televisa, Tencent Holdings and Syngenta.
| | |
| Artisan Partners Funds | | 17 |
ARTISAN INTERNATIONAL SMALL CAP FUND
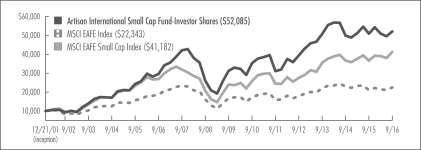
PERFORMANCE HISTORY
GROWTH OF AN ASSUMED $10,000 INVESTMENT (12/21/2001 to 9/30/2016)
AVERAGE ANNUAL TOTAL RETURNS (as of 9/30/2016)
| | | | | | | | | | | | | | | | | | | | |
| Fund / Index | | 1-Year | | | 3-Year | | | 5-Year | | | 10-Year | | | Since
Inception | |
Artisan International Small Cap Fund – Investor Shares (12/21/2001) | | | 2.50 | % | | | 0.93 | % | | | 10.87 | % | | | 5.87 | % | | | 11.82 | % |
Artisan International Small Cap Fund – Institutional Shares (4/12/2016) | | | n/a | | | | n/a | | | | n/a | | | | n/a | | | | 2.84 | 1 |
MSCI EAFE Index | | | 6.52 | | | | 0.48 | | | | 7.39 | | | | 1.82 | | | | 5.59 | * |
MSCI EAFE Small Cap Index | | | 12.33 | | | | 5.08 | | | | 11.07 | | | | 4.39 | | | | 10.05 | * |
| 1 | For the period from commencement of operations 4/12/2016 through 9/30/2016; not annualized. |
| * | As of Investor Shares inception date. |
The performance quoted represents past performance, which does not guarantee future results. The investment return and principal value of an investment in the Fund will fluctuate, so that an investor’s shares in the Fund, when redeemed, may be worth more or less than their original cost. Current performance may be lower or higher than the performance data quoted. For current to most recent month-end performance, visit www.artisanpartners.com or call 800.344.1770. The graph and table above do not reflect the deduction of taxes that a shareholder would pay on distributions or sale of Fund shares. See Notes on Management’s Discussion of Fund Performance and Portfolio Holdings’ Classification for a description of each index.
| | |
| 18 | | Artisan Partners Funds |
INVESTING ENVIRONMENT
The 12-month period ended September 30, 2016, was volatile for international equities. Stocks sold off in late 2015 and early 2016 on fears over China’s slowing growth and slumping oil prices, but later bounced as oil prices rallied. The United Kingdom’s June 2016 vote to leave the European Union again rattled global markets, though stocks swiftly rebounded as global central banks remained exceptionally accommodative. Ultimately, international small-cap stocks ended the period up double digits in USD terms, outpacing large-cap stocks.
SECTOR DIVERSIFICATION
| | | | | | | | | | |
| Sector | | 9/30/2015 | | 9/30/2016 |
Consumer Discretionary | | | | 7.4 | % | | | | 14.0 | % |
Consumer Staples | | | | 12.6 | | | | | 26.3 | |
Financials | | | | 2.1 | | | | | 2.0 | |
Health Care | | | | 12.8 | | | | | 7.1 | |
Industrials | | | | 17.0 | | | | | 15.9 | |
Information Technology | | | | 18.5 | | | | | 15.9 | |
Materials | | | | 4.3 | | | | | 1.9 | |
Real Estate | | | | — | | | | | 2.0 | |
Telecommunication Services | | | | 7.6 | | | | | 10.8 | |
Utilities | | | | 8.9 | | | | | 1.3 | |
Other assets less liabilities | | | | 8.8 | | | | | 2.8 | |
| | | | | 100.0 | % | | | | 100.0 | % |
PERFORMANCE DISCUSSION
Performance of the following stocks had a positive impact on the portfolio during the period: Danish beer and soft drinks producer Royal Unibrew, Finnish consumer packaged goods manufacturer Huhtamaki, Swiss niche components developer, producer and distributor Comet Holding, Swedish producer of confectionery products Cloetta and Canadian telecommunications service provider Manitoba Telecom Services.
Notable detractors included: UK-based human resources services provider Hays, Chinese environmental consultant China Everbright International, UK-based supplier of plastic and fiber products Essentra, Spanish telecommunication company Euskaltel and Italian investment management services company Azimut Holding.
REGION ALLOCATION
| | | | | | | | | | |
| Region | | 9/30/2015 | | 9/30/2016 |
Europe | | | | 64.7 | % | | | | 80.9 | % |
Pacific Basin | | | | 2.1 | | | | | 8.8 | |
Emerging Markets | | | | 23.2 | | | | | 5.0 | |
Americas | | | | 1.2 | | | | | 2.5 | |
PORTFOLIO CHANGES
We identified several new investment opportunities for the portfolio during the period, including German provider of office and warehouse supplies Takkt, Danish tobacco products manufacturer and distributor Scandinavian Tobacco, Dutch connectivity and performance management services provider InterXion Holding, UK-based automobile insurance provider AA, and UK-based home emergency and repair services provider HomeServe. We funded these purchases in part by selling our positions in Beijing Enterprises Water, China Everbright International, 21Vianet, Almirall and Hays.
| | |
| Artisan Partners Funds | | 19 |
ARTISAN INTERNATIONAL VALUE FUND
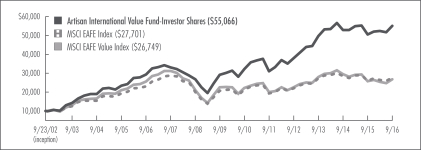
PERFORMANCE HISTORY
GROWTH OF AN ASSUMED $10,000 INVESTMENT (9/23/2002 to 9/30/2016)
AVERAGE ANNUAL TOTAL RETURNS (as of 9/30/2016)
| | | | | | | | | | | | | | | | | | | | | | | | | |
| Fund / Index | | 1-Year | | 3-Year | | 5-Year | | 10-Year | | Since
Inception |
Artisan International Value Fund – Investor Shares (9/23/2002) | | | | 9.02 | % | | | | 3.44 | % | | | | 12.21 | % | | | | 6.53 | % | | | | 12.94 | % |
Artisan International Value Fund – Advisor Shares (4/1/2015) | | | | 9.17 | | | | | n/a | | | | | n/a | | | | | n/a | | | | | 0.21 | |
Artisan International Value Fund –Institutional Shares (10/1/2006) | | | | 9.27 | | | | | 3.68 | | | | | 12.44 | | | | | 6.74 | | | | | 6.74 | |
MSCI EAFE Index | | | | 6.52 | | | | | 0.48 | | | | | 7.39 | | | | | 1.82 | | | | | 7.54 | * |
MSCI EAFE Value Index | | | | 3.52 | | | | | -1.49 | | | | | 5.99 | | | | | 0.44 | | | | | 7.27 | * |
| * | As of Investor Shares inception date. |
The performance quoted represents past performance, which does not guarantee future results. The investment return and principal value of an investment in the Fund will fluctuate, so that an investor’s shares in the Fund, when redeemed, may be worth more or less than their original cost. Current performance may be lower or higher than the performance data quoted. For current to most recent month-end performance, visit www.artisanpartners.com or call 800.344.1770. The graph and table above do not reflect the deduction of taxes that a shareholder would pay on distributions or sale of Fund shares. See Notes on Management’s Discussion of Fund Performance and Portfolio Holdings’ Classification for a description of each index.
| | |
| 20 | | Artisan Partners Funds |
INVESTING ENVIRONMENT
Global equity markets experienced a volatile 12 months, but closed the period ended September 30, 2016, in positive territory. Negative interest rates in Europe and Japan and the flattened US yield curve spurred a selloff in late 2015 that continued through the first month of the 2016. Stocks gained modestly with the rise in oil prices, and bounced back in concert with GBP after a sharp Brexit-induced decline in late June. Global monetary policy continued to be extraordinarily accommodative.
SECTOR DIVERSIFICATION
| | | | | | | | | | |
| Sector | | 9/30/2015 | | 9/30/2016 |
Consumer Discretionary | | | | 15.0 | % | | | | 11.3 | % |
Consumer Staples | | | | 8.8 | | | | | 8.5 | |
Energy | | | | 3.5 | | | | | 3.2 | |
Financials | | | | 24.4 | | | | | 22.2 | |
Health Care | | | | 5.4 | | | | | 5.4 | |
Industrials | | | | 13.2 | | | | | 17.3 | |
Information Technology | | | | 14.2 | | | | | 16.8 | |
Telecommunication Services | | | | 1.8 | | | | | 3.0 | |
Other assets less liabilities | | | | 13.7 | | | | | 12.3 | |
| | | | | 100.0 | % | | | | 100.0 | % |
PERFORMANCE DISCUSSION
Performance of the following stocks had a positive impact on the portfolio during the period: Korean consumer and industrial equipment manufacturer Samsung Electronics, Japanese industrial products manufacturer Tokyo Electron, Brazilian telecommunications company Telefonica Brasil, UK-based catering services provider Compass, and Swiss power and automation technologies provider ABB.
Notable detractors included: UK-based commercial bank RBS, Swiss banking and financial services provider UBS, UK-based banking and financial services company Lloyds Banking, UK-based food retailer operator Tesco and Dutch financial services provider ING.
REGION ALLOCATION
| | | | | | | | | | |
| Region | | 9/30/2015 | | 9/30/2016 |
Europe | | | | 55.7 | % | | | | 53.4 | % |
Americas | | | | 14.9 | | | | | 14.9 | |
Emerging Markets | | | | 10.8 | | | | | 14.4 | |
Pacific Basin | | | | 4.9 | | | | | 5.0 | |
PORTFOLIO CHANGES
We identified several new investment opportunities for the portfolio during the period, including Swiss luxury goods retailer Cie Financiere Richemont, US-based provider of risk and insurance brokerage consulting Aon, Indian provider of software development and engineering services HCL Technologies, UK-based bespoke solutions engineer IMI, and Norwegian geophysical consulting and contracting services company TGS Nopec Geophysical. We funded these purchases in part by selling our positions in Flextronics International, Deutsche Boerse, New Oriental Education & Technology, Serco and Kao.
| | |
| Artisan Partners Funds | | 21 |
ARTISAN MID CAP FUND
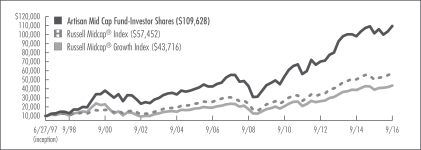
PERFORMANCE HISTORY
GROWTH OF AN ASSUMED $10,000 INVESTMENT (6/27/1997 to 9/30/2016)
AVERAGE ANNUAL TOTAL RETURNS (as of 9/30/2016)
| | | | | | | | | | | | | | | | | | | | | | | | | |
| Fund / Index | | 1-Year | | 3-Year | | 5-Year | | 10-Year | | Since
Inception |
Artisan Mid Cap Fund – Investor Shares (6/27/1997) | | | | 8.08 | % | | | | 5.75 | % | | | | 14.16 | % | | | | 9.88 | % | | | | 13.24 | % |
Artisan Mid Cap Fund – Advisor Shares (4/1/2015) | | | | 8.19 | | | | | n/a | | | | | n/a | | | | | n/a | | | | | 1.73 | |
Artisan Mid Cap Fund – Institutional Shares (7/1/2000) | | | | 8.33 | | | | | 6.01 | | | | | 14.44 | | | | | 10.17 | | | | | 7.68 | |
Russell Midcap® Index | | | | 14.25 | | | | | 9.70 | | | | | 16.67 | | | | | 8.32 | | | | | 9.50 | * |
Russell Midcap® Growth Index | | | | 11.24 | | | | | 8.90 | | | | | 15.85 | | | | | 8.51 | | | | | 7.96 | * |
| * | As of Investor Shares inception date. |
The performance quoted represents past performance, which does not guarantee future results. The investment return and principal value of an investment in the Fund will fluctuate, so that an investor’s shares in the Fund, when redeemed, may be worth more or less than their original cost. Current performance may be lower or higher than the performance data quoted. For current to most recent month-end performance, visit www.artisanpartners.com or call 800.344.1770. The graph and table above do not reflect the deduction of taxes that a shareholder would pay on distributions or sale of Fund shares. See Notes on Management’s Discussion of Fund Performance and Portfolio Holdings’ Classification for a description of each index.
| | |
| 22 | | Artisan Partners Funds |
INVESTING ENVIRONMENT
For the 12-month period ended September 30, 2016, domestic mid-cap stocks advanced by double digits. Monetary policy remained historically accommodative, with most major central banks maintaining near-zero or negative interest-rate policies – likely contributing to investor demand for higher-yielding equities. Oil prices were flat, falling sharply through early 2016 before rebounding through the summer. Against a background of tepid global economic activity, US stocks outperformed the developed world, while small-cap stocks outpaced mid-and large-cap stocks during the period.
SECTOR DIVERSIFICATION
| | | | | | | | | | |
| Sector | | 9/30/2015 | | 9/30/2016 |
Consumer Discretionary | | | | 20.8 | % | | | | 18.0 | % |
Consumer Staples | | | | 2.4 | | | | | 2.8 | |
Energy | | | | 1.7 | | | | | 3.1 | |
Financials | | | | 6.4 | | | | | 6.4 | |
Health Care | | | | 23.7 | | | | | 21.4 | |
Industrials | | | | 16.8 | | | | | 19.8 | |
Information Technology | | | | 20.8 | | | | | 21.9 | |
Materials | | | | 1.3 | | | | | 1.5 | |
Telecommunication Services | | | | 1.0 | | | | | 0.7 | |
Other assets less liabilities | | | | 5.1 | | | | | 4.4 | |
| | | | | 100.0 | % | | | | 100.0 | % |
PERFORMANCE DISCUSSION
Performance of the following stocks had a positive impact on the portfolio during the period: financial information services provider S&P Global, minimally invasive medical devices manufacturer Boston Scientific, three-dimensional graphics processors developer NVIDIA, automotive products and services provider LKQ, and electronic transaction processing services provider Global Payments.
Notable detractors included: quick-serve Mexican restaurant operator Chipotle Mexican Grill, jeweler retail company Signet Jewelers, pharmaceutical research company Alkermes, medical services and solutions holding company Envision Healthcare Holdings, and professional social network operator LinkedIn.
PORTFOLIO CHANGES
We identified several new investment opportunities for the portfolio during the period, including vehicle components manufacturer Delphi Automotive, three-dimensional graphics processors developer NVIDIA, lighting and control systems producer Acuity Brands, integrated payment processor Vantiv and consumer product retailer Newell Brands. We funded these purchases in part by selling our positions in Illumina, Chipotle Mexican Grill, Signet Jewelers, TD Ameritrade and ServiceNow.
| | |
| Artisan Partners Funds | | 23 |
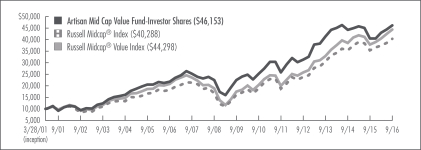
ARTISAN MID CAP VALUE FUND
PERFORMANCE HISTORY
GROWTH OF AN ASSUMED $10,000 INVESTMENT (3/28/2001 to 9/30/2016)
AVERAGE ANNUAL TOTAL RETURNS (as of 9/30/2016)
| | | | | | | | | | | | | | | | | | | | |
| Fund / Index | | 1-Year | | | 3-Year | | | 5-Year | | | 10-Year | | | Since
Inception | |
Artisan Mid Cap Value Fund – Investor Shares (3/28/2001) | | | 14.10 | % | | | 3.84 | % | | | 12.33 | % | | | 7.83 | % | | | 10.36 | % |
Artisan Mid Cap Value Fund – Advisor Shares (4/1/2015) | | | 14.22 | | | | n/a | | | | n/a | | | | n/a | | | | 0.72 | |
Artisan Mid Cap Value Fund – Institutional Shares (2/1/2012) | | | 14.29 | | | | 4.06 | | | | n/a | | | | n/a | | | | 9.12 | |
Russell Midcap® Index | | | 14.25 | | | | 9.70 | | | | 16.67 | | | | 8.32 | | | | 9.40 | * |
Russell Midcap® Value Index | | | 17.26 | | | | 10.49 | | | | 17.38 | | | | 7.89 | | | | 10.07 | * |
| * | As of Investor Shares inception date. |
The performance quoted represents past performance, which does not guarantee future results. The investment return and principal value of an investment in the Fund will fluctuate, so that an investor’s shares in the Fund, when redeemed, may be worth more or less than their original cost. Current performance may be lower or higher than the performance data quoted. For current to most recent month-end performance, visit www.artisanpartners.com or call 800.344.1770. The graph and table above do not reflect the deduction of taxes that a shareholder would pay on distributions or sale of Fund shares. See Notes on Management’s Discussion of Fund Performance and Portfolio Holdings’ Classification for a description of each index.
| | |
| 24 | | Artisan Partners Funds |
INVESTING ENVIRONMENT
For the 12-month period ended September 30, 2016, US equities advanced by double digits and outperformed global equities. The US Federal Reserve’s dovish monetary policy benefited US markets, as did oil gains in the back half of the period. Equities dropped sharply after the United Kingdom voted in June 2016 to leave the European Union, but swiftly rebounded as global stimulus speculations eased uncertainty. Value stocks had an edge over growth during the period, and small-cap stocks modestly outpaced large- and mid-cap stocks.
SECTOR DIVERSIFICATION
| | | | | | | | | | |
| Sector | | 9/30/2015 | | 9/30/2016 |
Consumer Discretionary | | | | 17.6 | % | | | | 18.2 | % |
Consumer Staples | | | | 1.5 | | | | | — | |
Energy | | | | 6.2 | | | | | 10.6 | |
Financials | | | | 24.6 | | | | | 22.4 | |
Health Care | | | | — | | | | | 1.6 | |
Industrials | | | | 14.7 | | | | | 15.3 | |
Information Technology | | | | 17.0 | | | | | 14.3 | |
Materials | | | | 7.5 | | | | | 9.5 | |
Utilities | | | | 5.1 | | | | | 1.5 | |
Other assets less liabilities | | | | 5.8 | | | | | 6.6 | |
| | | | | 100.0 | % | | | | 100.0 | % |
PERFORMANCE DISCUSSION
Performance of the following stocks had a positive impact on the portfolio during the period: oil and gas company Devon Energy, oil and gas company Apache, gold company Kinross Gold, gold company Goldcorp and mining equipment manufacturer Joy Global.
Notable detractors included: oil and gas company SM Energy, financial products and services provider H&R Block, video and Internet commerce company Liberty Interactive QVC, retail chain operator Bed Bath & Beyond, and potash and phosphate producer Mosaic.
PORTFOLIO CHANGES
We identified several new investment opportunities for the portfolio during the period, including oil and gas company Devon Energy , aircraft leasing company Air Lease, media and information services company News Corp, auto retailer AutoNation and tank barge operator Kirby Corp. We funded these purchases in part by selling our positions in SCANA, Bed Bath & Beyond, Republic Services, Teradata and Kroger.
| | |
| Artisan Partners Funds | | 25 |
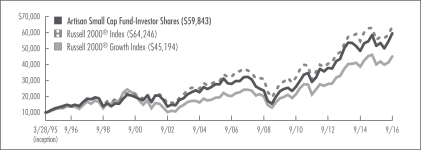
ARTISAN SMALL CAP FUND
PERFORMANCE HISTORY
GROWTH OF AN ASSUMED $10,000 INVESTMENT (3/28/1995 to 9/30/2016)
AVERAGE ANNUAL TOTAL RETURNS (as of 9/30/2016)
| | | | | | | | | | | | | | | | | | | | | | | | | |
| Fund / Index | | 1-Year | | 3-Year | | 5-Year | | 10-Year | | Since
Inception |
Artisan Small Cap Fund – Investor Shares (3/28/1995) | | | | 15.27 | % | | | | 5.98 | % | | | | 15.50 | % | | | | 7.87 | % | | | | 8.67 | % |
Artisan Small Cap Fund – Institutional Shares (5/7/2012) | | | | 15.51 | | | | | 6.20 | | | | | n/a | | | | | n/a | | | | | 12.68 | |
Russell 2000® Index | | | | 15.47 | | | | | 6.71 | | | | | 15.82 | | | | | 7.07 | | | | | 9.03 | * |
Russell 2000® Growth Index | | | | 12.12 | | | | | 6.58 | | | | | 16.15 | | | | | 8.29 | | | | | 7.26 | * |
| * | As of Investor Shares inception date. |
The performance quoted represents past performance, which does not guarantee future results. The investment return and principal value of an investment in the Fund will fluctuate, so that an investor’s shares in the Fund, when redeemed, may be worth more or less than their original cost. Current performance may be lower or higher than the performance data quoted. For current to most recent month-end performance, visit www.artisanpartners.com or call 800.344.1770. The graph and table above do not reflect the deduction of taxes that a shareholder would pay on distributions or sale of Fund shares. See Notes on Management’s Discussion of Fund Performance and Portfolio Holdings’ Classification for a description of each index.
| | |
| 26 | | Artisan Partners Funds |
INVESTING ENVIRONMENT
For the 12-month period ended September 30, 2016, domestic small-cap stocks advanced by double digits. Monetary policy remained historically accommodative, with most major central banks maintaining near zero or negative interest-rate policies – likely contributing to investor demand for higher-yielding equities. Oil prices were flat, falling sharply through early 2016 before rebounding through the summer. Against a background of tepid global economic activity, US stocks outperformed the developed world, while small-cap stocks outpaced mid- and large-cap stocks during the period.
SECTOR DIVERSIFICATION
| | | | | | | | | | |
| Sector | | 9/30/2015 | | 9/30/2016 |
Consumer Discretionary | | | | 14.9 | % | | | | 11.2 | % |
Consumer Staples | | | | 1.0 | | | | | 0.8 | |
Energy | | | | 1.4 | | | | | 1.2 | |
Financials | | | | — | | | | | 1.3 | |
Health Care | | | | 22.6 | | | | | 22.2 | |
Industrials | | | | 16.9 | | | | | 21.9 | |
Information Technology | | | | 38.1 | | | | | 34.9 | |
Other assets less liabilities | | | | 5.1 | | | | | 6.5 | |
| | | | | 100.0 | % | | | | 100.0 | % |
PERFORMANCE DISCUSSION
Performance of the following stocks had a positive impact on the portfolio during the period: lighting and control systems producer Acuity Brands, machine vision-systems manufacturer Cognex, technology solutions provider John Bean Technologies, medical device company Nevro Corp and Online trading site operator MercadoLibre.
Notable detractors included: home furnishings provider Restoration Hardware, provider of Internet radio services Pandora Media, developer of a non-invasive screening tests Exact Sciences, online construction collaboration solutions provider Textura and provider of healthcare professionals outsourcing services Team Health Holdings.
PORTFOLIO CHANGES
We identified several new investment opportunities for the portfolio during the period, including provider of cloud-based business services Veeva Systems, retail store chain operator Ollie’s Bargain Outlet Holdings, filtration systems manufacturer Donaldson, enterprise software designer and developer Atlassian and US-based home furnishings provider Dun & Bradstreet. We funded these purchases in part by selling our positions in Restoration Hardware, Incyte, Team Health Holdings, Forward Air and Textura.
| | |
| Artisan Partners Funds | | 27 |
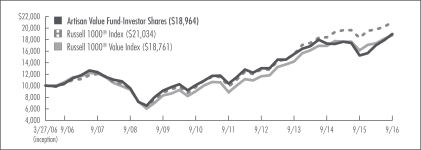
ARTISAN VALUE FUND
PERFORMANCE HISTORY
GROWTH OF AN ASSUMED $10,000 INVESTMENT (3/27/2006 to 9/30/2016)
AVERAGE ANNUAL TOTAL RETURNS (as of 9/30/2016)
| | | | | | | | | | | | | | | | | | | | | | | | | |
| Fund / Index | | 1-Year | | 3-Year | | 5-Year | | 10-Year | | Since
Inception |
Artisan Value Fund – Investor Shares (3/27/2006) | | | | 24.64 | % | | | | 6.99 | % | | | | 12.81 | % | | | | 6.18 | % | | | | 6.28 | % |
Artisan Value Fund – Advisor Shares (4/1/2015) | | | | 24.73 | | | | | n/a | | | | | n/a | | | | | n/a | | | | | 5.02 | |
Artisan Value Fund – Institutional Shares (7/26/2011) | | | | 24.78 | | | | | 7.19 | | | | | 13.07 | | | | | n/a | | | | | 9.37 | |
Russell 1000® Index | | | | 14.93 | | | | | 10.78 | | | | | 16.41 | | | | | 7.40 | | | | | 7.33 | * |
Russell 1000® Value Index | | | | 16.20 | | | | | 9.70 | | | | | 16.15 | | | | | 5.85 | | | | | 6.17 | * |
| * | As of Investor Shares inception date. |
The performance quoted represents past performance, which does not guarantee future results. The investment return and principal value of an investment in the Fund will fluctuate, so that an investor’s shares in the Fund, when redeemed, may be worth more or less than their original cost. Current performance may be lower or higher than the performance data quoted. For current to most recent month-end performance, visit www.artisanpartners.com or call 800.344.1770. The graph and table above do not reflect the deduction of taxes that a shareholder would pay on distributions or sale of Fund shares. See Notes on Management’s Discussion of Fund Performance and Portfolio Holdings’ Classification for a description of each index.
| | |
| 28 | | Artisan Partners Funds |
INVESTING ENVIRONMENT
For the 12-month period ended September 30, 2016, US equities advanced by double digits and outperformed global equities. The US Federal Reserve’s dovish monetary policy benefited US markets, as did oil gains in the back half of the period. Equities dropped sharply after the United Kingdom voted to leave the European Union, but swiftly rebounded as global stimulus speculations eased uncertainty. Value stocks had an edge over growth during the period, and small-cap stocks modestly outpaced large and mid cap.
SECTOR DIVERSIFICATION
| | | | | | | | | | |
| Sector | | 9/30/2015 | | 9/30/2016 |
Consumer Discretionary | | | | 5.5 | % | | | | 16.1 | % |
Energy | | | | 13.4 | | | | | 15.1 | |
Financials | | | | 24.2 | | | | | 17.4 | |
Health Care | | | | 1.3 | | | | | 2.0 | |
Industrials | | | | 12.4 | | | | | 8.7 | |
Information Technology | | | | 26.6 | | | | | 20.8 | |
Materials | | | | 12.4 | | | | | 14.5 | |
Telecommunication Services | | | | 2.0 | | | | | — | |
Other assets less liabilities | | | | 2.2 | | | | | 5.4 | |
| | | | | 100.0% | | | | | 100.0% | |
PERFORMANCE DISCUSSION
Performance of the following stocks had a positive impact on the portfolio during the period: oil and gas company Apache, consumer and industrial equipment manufacturer Samsung Electronics, gold company Kinross Gold, gold company Goldcorp and mining equipment manufacturer Joy Global.
Notable detractors included: video and Internet commerce company Liberty Interactive QVC, potash and phosphate producer Mosaic, global insurance and reinsurance writer Arch Capital, global investment banking company Goldman Sachs, and banking and financial services company Citigroup.
REGION ALLOCATION
| | | | | | | | | | |
| Region | | 9/30/2015 | | 9/30/2016 |
Americas | | | | 87.7 | % | | | | 85.5 | % |
Emerging Markets | | | | 5.6 | | | | | 6.0 | |
Europe | | | | 2.5 | | | | | 3.1 | |
Pacific Basin | | | | 2.0 | | | | | — | |
PORTFOLIO CHANGES
We identified several new investment opportunities for the portfolio during the period, including aircraft leasing company Air Lease, media and entertainment company Time Warner, chemical company LyondellBasell, video and Internet commerce company Liberty Interactive QVC, and video and Internet holding company Liberty Ventures. We funded these purchases in part by selling our positions in EMC, Arch Capital, Joy Global, Precision Castparts and Progressive.
| | |
| Artisan Partners Funds | | 29 |
ARTISAN DEVELOPING WORLD FUND
Schedule of Investments – September 30, 2016
Dollar values in thousands
| | | | | | | | | | |
| | | Shares
Held | | Value |
| COMMON STOCKS AND EQUITY-LINKED SECURITIES - 92.0% | | | | | | | | | | |
| | | | | | | | | | |
| ARGENTINA - 0.5% | | | | | | | | | | |
Grupo Supervielle S.A. (DR)(1) | | | | 314,758 | | | | $ | 4,662 | |
| | | | | | | | | | |
| BRAZIL - 9.5% | | | | | | | | | | |
Ambev S.A. (DR) | | | | 2,238,249 | | | | | 13,631 | |
Hypermarcas S.A. | | | | 2,305,200 | | | | | 19,755 | |
Kroton Educacional S.A. | | | | 5,057,600 | | | | | 23,001 | |
Lojas Renner S.A. | | | | 1,180,113 | | | | | 8,879 | |
Qualicorp S.A. | | | | 3,153,200 | | | | | 18,596 | |
| | | | | | | | | | |
| | | | | | | | | 83,862 | |
| CHINA - 17.7% | | | | | | | | | | |
Alibaba Group Holding Ltd. (DR)(1) | | | | 286,876 | | | | | 30,348 | |
Baidu, Inc. (DR)(1) | | | | 121,574 | | | | | 22,135 | |
Kweichow Moutai Co., Ltd., Class A(2) | | | | 597,751 | | | | | 26,747 | |
Shanghai International Airport Co., Ltd.,
Class A(2) | | | | 4,611,392 | | | | | 18,677 | |
Sinopharm Group Co., Ltd., Class H(2) | | | | 4,813,100 | | | | | 23,344 | |
Tencent Holdings Ltd.(2) | | | | 1,265,800 | | | | | 35,073 | |
| | | | | | | | | | |
| | | | | | | | | 156,324 | |
| DENMARK - 2.0% | | | | | | | | | | |
Novo Nordisk AS (DR) | | | | 428,382 | | | | | 17,816 | |
| | | | | | | | | | |
| EGYPT - 0.8% | | | | | | | | | | |
Commercial International Bank Egypt
S.A.E.(2) | | | | 775,013 | | | | | 4,168 | |
Commercial International Bank Egypt
S.A.E. (DR)(2) | | | | 638,382 | | | | | 2,518 | |
| | | | | | | | | | |
| | | | | | | | | 6,686 | |
| FRANCE - 1.7% | | | | | | | | | | |
LVMH Moet Hennessy Louis Vuitton SE(2) | | | | 89,968 | | | | | 15,338 | |
| | | | | | | | | | |
| HONG KONG - 6.7% | | | | | | | | | | |
AIA Group Ltd.(2) | | | | 5,413,300 | | | | | 36,270 | |
Sands China Ltd.(2) | | | | 5,193,600 | | | | | 22,750 | |
| | | | | | | | | | |
| | | | | | | | | 59,020 | |
| INDIA - 10.5% | | | | | | | | | | |
Ajanta Pharma Ltd.(2) | | | | 139,462 | | | | | 4,225 | |
Aurobindo Pharma Ltd.(2) | | | | 793,235 | | | | | 10,242 | |
Bharti Infratel Ltd.(2) | | | | 1,382,673 | | | | | 7,658 | |
Dish TV India Ltd.(1)(2) | | | | 12,487,676 | | | | | 17,501 | |
Eicher Motors Ltd.(2) | | | | 36,378 | | | | | 13,632 | |
HDFC Bank Ltd. (DR) | | | | 422,565 | | | | | 30,378 | |
PVR Ltd.(2) | | | | 536,858 | | | | | 9,633 | |
| | | | | | | | | | |
| | | | | | | | | 93,269 | |
| INDONESIA - 2.6% | | | | | | | | | | |
Bank Mandiri Persero Tbk PT(2) | | | | 9,440,400 | | | | | 8,137 | |
Matahari Department Store Tbk PT(2) | | | | 6,557,900 | | | | | 9,309 | |
Media Nusantara Citra Tbk PT(2) | | | | 33,001,200 | | | | | 5,108 | |
| | | | | | | | | | |
| | | | | | | | | 22,554 | |
| KOREA - 2.1% | | | | | | | | | | |
SK Hynix, Inc.(2) | | | | 505,101 | | | | | 18,486 | |
| | | | | | | | | | |
| MALAYSIA - 0.4% | | | | | | | | | | |
My EG Services Bhd(2) | | | | 6,929,700 | | | | | 3,831 | |
| | | | | | | | | | |
| MEXICO - 2.6% | | | | | | | | | | |
Grupo Televisa S.A.B. (DR) | | | | 902,214 | | | | | 23,178 | |
| | | | | | | | | | |
| NETHERLANDS - 3.6% | | | | | | | | | | |
Unilever N.V. (DR)(2) | | | | 681,384 | | | | | 31,432 | |
| | | | | | | | | | |
| PANAMA - 1.4% | | | | | | | | | | |
Copa Holdings S.A., Class A(3) | | | | 145,660 | | | | | 12,808 | |
| | | | | | | | | | |
| PERU - 1.8% | | | | | | | | | | |
Credicorp Ltd. | | | | 103,114 | | | | | 15,696 | |
| | | | | | | | | | |
| PHILIPPINES - 1.1% | | | | | | | | | | |
Puregold Price Club, Inc.(2) | | | | 10,735,700 | | | | | 9,409 | |
| | | | | | | | | | |
| RUSSIA - 5.0% | | | | | | | | | | |
Magnit PJSC (DR)(2) | | | | 849,974 | | | | | 35,436 | |
QIWI plc (DR) | | | | 611,020 | | | | | 8,945 | |
| | | | | | | | | | |
| | | | | | | | | 44,381 | |
| SAUDI ARABIA - 0.4% | | | | | | | | | | |
Al Tayyar Travel Group, Equity-Linked
Security(1)(2)(3)(4)(5) | | | | 489,368 | | | | | 3,638 | |
| | | | | | | | | | |
| SOUTH AFRICA - 2.8% | | | | | | | | | | |
Clicks Group Ltd.(2) | | | | 431,320 | | | | | 3,999 | |
Mr Price Group Ltd.(2) | | | | 1,507,104 | | | | | 16,688 | |
Pioneer Foods Group Ltd.(2) | | | | 352,218 | | | | | 4,468 | |
| | | | | | | | | | |
| | | | | | | | | 25,155 | |
| TAIWAN - 2.2% | | | | | | | | | | |
Eclat Textile Co., Ltd.(2) | | | | 629,000 | | | | | 7,539 | |
Largan Precision Co., Ltd.(2) | | | | 69,000 | | | | | 8,384 | |
Tung Thih Electronic Co., Ltd.(2) | | | | 246,000 | | | | | 3,441 | |
| | | | | | | | | | |
| | | | | | | | | 19,364 | |
| THAILAND - 1.9% | | | | | | | | | | |
Siam Commercial Bank PCL(2) | | | | 3,846,200 | | | | | 16,525 | |
| | |
| 30 | | Artisan Partners Funds |
| | | | | | | | | | |
| | | Shares
Held | | Value |
| UNITED ARAB EMIRATES - 1.7% | | | | | | | | | | |
Emaar Properties PJSC(2) | | | | 7,919,505 | | | | $ | 15,292 | |
| | | | | | | | | | |
| UNITED STATES - 13.0% | | | | | | | | | | |
China Biologic Products, Inc.(1) | | | | 153,660 | | | | | 19,128 | |
Delphi Automotive plc | | | | 200,732 | | | | | 14,316 | |
EPAM Systems, Inc.(1) | | | | 129,659 | | | | | 8,987 | |
Facebook, Inc., Class A(1) | | | | 277,606 | | | | | 35,609 | |
Kansas City Southern | | | | 138,023 | | | | | 12,880 | |
MercadoLibre, Inc. | | | | 48,631 | | | | | 8,995 | |
Visa, Inc., Class A | | | | 182,545 | | | | | 15,096 | |
| | | | | | | | | | |
| | | | | | | | | 115,011 | |
| | | | | | | | | | |
Total common stocks and equity-linked securities
(Cost $695,983) | | | | | | | | | 813,737 | |
| | |
| | | Principal
Amount | | |
SHORT-TERM INVESTMENTS
(CASH EQUIVALENTS) - 8.1% | | | | | | | | | | |
Repurchase agreement with Fixed Income Clearing Corporation, 0.03%,
dated 9/30/16, due 10/3/16,
maturity value $71,649
(Cost $71,649)(6) | | | $ | 71,649 | | | | $ | 71,649 | |
| | | | | | | | | | |
| | | | | | | | | | |
Total investments - 100.1%
(Cost $767,632) | | | | | | | | | 885,386 | |
| | | | | | | | | | |
Other assets less liabilities - (0.1)% | | | | | | | | | (742 | ) |
| | | | | | | | | | |
| | | | | | | | | | |
Total net assets - 100.0%(7) | | | | | | | | $ | 884,644 | |
| | | | | | | | | | |
| (1) | Non-income producing security. |
| (2) | Valued at a fair value in accordance with procedures established by the board of directors of Artisan Partners Funds. In total, securities valued at a fair value were $448,898, or 50.7% of total net assets. See notes 2(a) and 4 in Notes to Financial Statements for additional information. |
| (4) | Security is restricted. The security was acquired in a transaction pursuant to Rule 144A under the Securities Act of 1933, as amended, on the date or during the period noted below. The shares of the security may be resold in transactions exempt from registration to qualified institutional buyers. |
| | | | | | | | | | | | | | | | | | | | |
Security | | Acquisition
Date | | Cost | | Value | | Percentage
of Total
Net Assets |
Al Tayyar Travel Group | | |
| 7/9/2015-
7/12/2016 |
| | | $ | 5,992 | | | | $ | 3,638 | | | | | 0.4 | % |
| (5) | Security is an equity-linked security issued by HSBC Bank plc. As described in 2(h) in Notes to Financial Statements, equity-linked securities are subject to counterparty risk with respect to the bank or broker-dealer that issues them. |
| | | | | | | | | | | | | | | |
Security | | Rate | | Maturity | | Value |
U.S. Treasury Note | | | | 0.125 | % | | | | 4/15/2017 | | | | $ | 73,084 | |
| (7) | Percentages for the various classifications relate to total net assets. |
Company names are as reported by a data service provider and in some cases are translations; a company’s legal name may be different.
(DR) Depositary Receipt, voting rights may vary.
| | | | | | | | | | |
| PORTFOLIO DIVERSIFICATION - September 30, 2016 | |
Dollar values in thousands | |
| | | Value | | Percentage
of Total
Investments |
Consumer Discretionary | | | $ | 180,319 | | | | | 20.4 | % |
Consumer Staples | | | | 144,877 | | | | | 16.4 | |
Financials | | | | 118,354 | | | | | 13.4 | |
Health Care | | | | 93,351 | | | | | 10.5 | |
Industrials | | | | 57,997 | | | | | 6.5 | |
Information Technology | | | | 195,889 | | | | | 22.1 | |
Real Estate | | | | 15,292 | | | | | 1.7 | |
Telecommunication Services | | | | 7,658 | | | | | 0.9 | |
Short-term investments | | | | 71,649 | | | | | 8.1 | |
| | | | | | | | | | |
Total investments | | | $ | 885,386 | | | | | 100.0 | % |
| | | | | | | | | | |
| | | | | | | | | | |
| TRADING CURRENCIES - September 30, 2016 | |
Dollar values in thousands | |
| | | Value | | Percentage
of Total
Investments |
Brazilian real | | | $ | 70,231 | | | | | 7.9 | % |
Chinese yuan renminbi offshore | | | | 45,424 | | | | | 5.1 | |
Egyptian pound | | | | 4,168 | | | | | 0.5 | |
Euro | | | | 46,770 | | | | | 5.3 | |
Hong Kong dollar | | | | 117,437 | | | | | 13.3 | |
Indian rupee | | | | 62,891 | | | | | 7.1 | |
Indonesian rupiah | | | | 22,554 | | | | | 2.5 | |
Korean won | | | | 18,486 | | | | | 2.1 | |
Malaysian ringgit | | | | 3,831 | | | | | 0.4 | |
Philippine peso | | | | 9,409 | | | | | 1.1 | |
South African rand | | | | 25,155 | | | | | 2.8 | |
Taiwan dollar | | | | 19,364 | | | | | 2.2 | |
Thai baht | | | | 16,525 | | | | | 1.9 | |
U.S. dollar | | | | 407,849 | | | | | 46.1 | |
UAE dirham | | | | 15,292 | | | | | 1.7 | |
| | | | | | | | | | |
Total investments | | | $ | 885,386 | | | | | 100.0 | % |
| | | | | | | | | | |
| | |
| Artisan Partners Funds | | 31 |
| | | | | | | |
| TOP TEN HOLDINGS - September 30, 2016 | |
Company Name | | Country | | Percentage
of Total
Net Assets |
AIA Group Ltd. | | Hong Kong | | | | 4.1 | % |
Facebook, Inc. | | United States | | | | 4.0 | |
Magnit PJSC | | Russia | | | | 4.0 | |
Tencent Holdings Ltd. | | China | | | | 4.0 | |
Unilever N.V. | | Netherlands | | | | 3.6 | |
HDFC Bank Ltd. | | India | | | | 3.4 | |
Alibaba Group Holding Ltd. | | China | | | | 3.4 | |
Kweichow Moutai Co., Ltd. | | China | | | | 3.0 | |
Sinopharm Group Co., Ltd. | | China | | | | 2.7 | |
Grupo Televisa S.A.B. | | Mexico | | | | 2.6 | |
| | | | | | | |
Total | | | | | | 34.8 | % |
| | | | | | | |
For the purpose of determining the Fund’s top ten holdings, securities of the same issuer are aggregated to determine the weight in the Fund.
The accompanying notes are an integral part of the financial statements.
| | |
| 32 | | Artisan Partners Funds |
ARTISAN EMERGING MARKETS FUND
Schedule of Investments – September 30, 2016
Dollar values in thousands
| | | | | | | | | | |
| | | Shares
Held | | Value |
| | | | | | | | | | |
| COMMON STOCKS - 87.0% | | | | | | | | | | |
| | | | | | | | | | |
| ARGENTINA - 3.0% | | | | | | | | | | |
Grupo Financiero Galicia S.A.(DR) | | | | 18,327 | | | | $ | 570 | |
Pampa Energia S.A.(DR)(1) | | | | 16,149 | | | | | 523 | |
| | | | | | | | | | |
| | | | | | | | | 1,093 | |
| BRAZIL - 6.5% | | | | | | | | | | |
Cosan S.A. Industria e Comercio | | | | 22,700 | | | | | 263 | |
CVC Brasil Operadora e Agencia de Viagens S.A. | | | | 42,663 | | | | | 316 | |
GAEC Educacao S.A. | | | | 55,300 | | | | | 211 | |
Hypermarcas S.A. | | | | 40,438 | | | | | 347 | |
Linx S.A. | | | | 62,200 | | | | | 371 | |
Petroleo Brasileiro S.A.(1) | | | | 107,489 | | | | | 500 | |
Vale S.A. | | | | 72,513 | | | | | 397 | |
| | | | | | | | | | |
| | | | | | | | | 2,405 | |
| CHILE - 1.8% | | | | | | | | | | |
Empresa Nacional de Telecomunicaciones S.A.(1) | | | | 27,545 | | | | | 270 | |
SACI Falabella | | | | 54,942 | | | | | 403 | |
| | | | | | | | | | |
| | | | | | | | | 673 | |
| CHINA - 19.6% | | | | | | | | | | |
Ajisen China Holdings Ltd.(2) | | | | 439,913 | | | | | 202 | |
Alibaba Group Holding Ltd. (DR)(1) | | | | 12,009 | | | | | 1,270 | |
Baidu, Inc. (DR)(1) | | | | 3,770 | | | | | 686 | |
China High Precision Automation Group Ltd.(1)(2)(3) | | | | 9,066,000 | | | | | – | |
China Life Insurance Co., Ltd., Class H(2) | | | | 155,800 | | | | | 406 | |
China Petroleum & Chemical Corp., Class H(2) | | | | 649,453 | | | | | 478 | |
China Unicom Hong Kong Ltd.(2) | | | | 251,500 | | | | | 306 | |
Digital China Holdings Ltd.(2) | | | | 478,460 | | | | | 461 | |
GOME Electrical Appliances Holding Ltd.(2) | | | | 1,553,288 | | | | | 191 | |
Huabao International Holdings Ltd.(1)(2) | | | | 694,322 | | | | | 268 | |
Noah Holdings Ltd. (DR)(1) | | | | 20,128 | | | | | 526 | |
Sino Biopharmaceutical Ltd.(2) | | | | 811,000 | | | | | 549 | |
Sinopharm Group Co., Ltd., Class H(2) | | | | 122,500 | | | | | 594 | |
Sinotrans Ltd., Class H(2) | | | | 539,341 | | | | | 265 | |
Wisdom Sports Group(1)(2) | | | | 778,839 | | | | | 277 | |
Zhuzhou CRRC Times Electric Co., Ltd., Class H(2) | | | | 138,515 | | | | | 723 | |
| | | | | | | | | | |
| | | | | | | | | 7,202 | |
| CZECH REPUBLIC - 0.9% | | | | | | | | | | |
Moneta Money Bank AS(1)(2) | | | | 108,918 | | | | | 348 | |
| | | | | | | | | | |
| GERMANY - 0.4% | | | | | | | | | | |
Rocket Internet SE(1)(2) | | | | 7,252 | | | | | 156 | |
| | | | | | | | | | |
| | | | | | | | | | |
| GREECE - 0.8% | | | | | | | | | | |
JUMBO S.A.(2) | | | | 23,494 | | | | | 293 | |
| HONG KONG - 1.5% | | | | | | | | | | |
AIA Group Ltd.(2) | | | | 80,065 | | | | | 537 | |
| | | | | | | | | | |
| INDIA - 7.5% | | | | | | | | | | |
Aurobindo Pharma Ltd.(2) | | | | 28,381 | | | | | 366 | |
Dr Reddy’s Laboratories Ltd.(2) | | | | 2,537 | | | | | 118 | |
Godrej Consumer Products Ltd.(2) | | | | 13,077 | | | | | 310 | |
Havells India Ltd.(2) | | | | 34,880 | | | | | 220 | |
ICICI Bank Ltd.(2) | | | | 176,697 | | | | | 674 | |
Kajaria Ceramics Ltd.(2) | | | | 14,313 | | | | | 299 | |
RBL Bank Ltd.(1) | | | | 2,426 | | | | | 11 | |
Reliance Industries Ltd.(2) | | | | 37,732 | | | | | 616 | |
Tech Mahindra Ltd.(2) | | | | 20,938 | | | | | 133 | |
| | | | | | | | | | |
| | | | | | | | | 2,747 | |
| INDONESIA - 5.0% | | | | | | | | | | |
Astra International Tbk PT(2) | | | | 780,170 | | | | | 496 | |
Bank Negara Indonesia Persero Tbk PT(2) | | | | 847,618 | | | | | 362 | |
Cikarang Listrindo Tbk PT(1)(2) | | | | 2,894,200 | | | | | 330 | |
Hanjaya Mandala Sampoerna Tbk PT(2) | | | | 506,850 | | | | | 154 | |
Indofood CBP Sukses Makmur Tbk PT(2) | | | | 661,600 | | | | | 482 | |
| | | | | | | | | | |
| | | | | | | | | 1,824 | |
| KAZAKHSTAN - 0.5% | | | | | | | | | | |
KCell JSC (DR)(2) | | | | 52,986 | | | | | 178 | |
| | | | | | | | | | |
| KENYA - 0.9% | | | | | | | | | | |
Equity Group Holdings Ltd.(2) | | | | 494,000 | | | | | 158 | |
Safaricom Ltd.(2) | | | | 911,200 | | | | | 179 | |
| | | | | | | | | | |
| | | | | | | | | 337 | |
| KOREA - 5.8% | | | | | | | | | | |
E-Mart, Inc.(2) | | | | 920 | | | | | 132 | |
Hanssem Co., Ltd.(2) | | | | 1,300 | | | | | 208 | |
KB Financial Group, Inc.(2) | | | | 8,120 | | | | | 279 | |
Kia Motors Corp.(2) | | | | 12,709 | | | | | 489 | |
Korea Electric Power Corp.(2) | | | | 5,668 | | | | | 278 | |
LG Chem Ltd. (2) | | | | 1,598 | | | | | 350 | |
Shinhan Financial Group Co., Ltd.(2) | | | | 11,062 | | | | | 405 | |
| | | | | | | | | | |
| | | | | | | | | 2,141 | |
| MALAYSIA - 0.8% | | | | | | | | | | |
AirAsia BHD(2) | | | | 411,800 | | | | | 278 | |
| | | | | | | | | | |
| | | | | | | | | | |
| MEXICO - 2.4% | | | | | | | | | | |
Alsea S.A.B. de C.V. | | | | 48,152 | | | | | 163 | |
Cemex S.A.B. de C.V., UNIT(1) | | | | 527,744 | | | | | 419 | |
Grupo Televisa S.A.B., UNIT | | | | 58,450 | | | | | 300 | |
| | | | | | | | | | |
| | | | | | | | | 882 | |
| PANAMA - 1.0% | | | | | | | | | | |
Copa Holdings S.A., Class A(4) | | | | 4,065 | | | | | 357 | |
| | |
| Artisan Partners Funds | | 33 |
| | | | | | | | | | |
| | | Shares
Held | | Value |
| PERU - 2.0% | | | | | | | | | | |
Credicorp Ltd. | | | | 2,978 | | | | $ | 453 | |
Grana y Montero S.A. (DR) | | | | 31,864 | | | | | 266 | |
| | | | | | | | | | |
| | | | | | | | | 719 | |
| POLAND - 0.8% | | | | | | | | | | |
Eurocash S.A.(2) | | | | 25,712 | | | | | 287 | |
| | | | | | | | | | |
| RUSSIA - 4.7% | | | | | | | | | | |
Lukoil PJSC (DR)(2) | | | | 8,287 | | | | | 403 | |
Magnit PJSC(1)(2) | | | | 2,866 | | | | | 474 | |
MMC Norilsk Nickel PJSC (DR)(2) | | | | 23,660 | | | | | 378 | |
Moscow Exchange MICEX-RTS PJSC(1)(2) | | | | 133,567 | | | | | 269 | |
Yandex N.V., Class A(1) | | | | 9,619 | | | | | 203 | |
| | | | | | | | | | |
| | | | | | | | | 1,727 | |
| SOUTH AFRICA - 4.0% | | | | | | | | | | |
FirstRand Ltd.(2) | | | | 82,676 | | | | | 287 | |
Naspers Ltd., Class N(2) | | | | 5,108 | | | | | 885 | |
Woolworths Holdings Ltd.(2) | | | | 56,035 | | | | | 316 | |
| | | | | | | | | | |
| | | | | | | | | 1,488 | |
| SWITZERLAND - 0.8% | | | | | | | | | | |
Dufry AG(1)(2) | | | | 2,273 | | | | | 284 | |
| | | | | | | | | | |
| TAIWAN - 10.5% | | | | | | | | | | |
E Ink Holdings, Inc.(2) | | | | 242,000 | | | | | 187 | |
Hon Hai Precision Industry Co., Ltd.(2) | | | | 257,508 | | | | | 652 | |
MediaTek, Inc.(2) | | | | 53,794 | | | | | 413 | |
Sunny Friend Environmental Technology Co., Ltd.(2) | | | | 118,000 | | | | | 507 | |
Taiwan Semiconductor Manufacturing Co., Ltd.(2) | | | | 358,647 | | | | | 2,103 | |
| | | | | | | | | | |
| | | | | | | | | 3,862 | |
| THAILAND - 0.8% | | | | | | | | | | |
Bangkok Bank PCL (DR)(2) | | | | 62,000 | | | | | 292 | |
| | | | | | | | | | |
| TURKEY - 1.7% | | | | | | | | | | |
Ford Otomotiv Sanayi AS(2) | | | | 29,064 | | | | | 307 | |
Turkiye Sinai Kalkinma Bankasi AS(2) | | | | 755,218 | | | | | 336 | |
| | | | | | | | | | |
| | | | | | | | | 643 | |
| UNITED ARAB EMIRATES - 1.5% | | | | | | | | | | |
NMC Health plc(2) | | | | 30,186 | | | | | 535 | |
| | | | | | | | | | |
| UNITED KINGDOM - 1.8% | | | | | | | | | | |
Randgold Resources Ltd.(2) | | | | 6,508 | | | | | 654 | |
| | | | | | | | | | |
Total common stocks
(Cost $30,666) | | | | | | | | | 31,942 | |
| | | | | | | | | | |
| | | | | | | | | | |
| PREFERRED STOCKS - 11.8% | | | | | | | | | | |
| | | | | | | | | | |
| BRAZIL - 2.7% | | | | | | | | | | |
Cia Energetica de Minas Gerais(4) | | | | 148,300 | | | | | 391 | |
Itau Unibanco Holding S.A.(4) | | | | 55,005 | | | | | 601 | |
| | | | | | | | | | |
| | | | | | | | | 992 | |
| KOREA - 6.6% | | | | | | | | | | |
Samsung Electronics Co., Ltd.(2)(4) | | | | 2,051 | | | | | 2,421 | |
| RUSSIA - 2.5% | | | | | | | | | | |
Sberbank of Russia PJSC(2)(4) | | | | 540,262 | | | | | 911 | |
| | | | | | | | | | |
Total preferred stocks
(Cost $3,407) | | | | | | | | | 4,324 | |
| | |
| | | Principal
Amount | | |
SHORT-TERM INVESTMENTS
(CASH EQUIVALENTS) - 1.7% | | | | | | | | | | |
Repurchase agreement with Fixed Income Clearing Corporation, 0.03%,
dated 9/30/16, due 10/3/16,
maturity value $618
(Cost $618)(5) | | | $ | 618 | | | | $ | 618 | |
| | | | | | | | | | |
Total investments - 100.5%
(Cost $34,691) | | | | | | | | | 36,884 | |
| | | | | | | | | | |
Other assets less liabilities - (0.5)% | | | | | | | | | (194 | ) |
| | | | | | | | | | |
| | | | | | | | | | |
Total net assets - 100.0%(6) | | | | | | | | $ | 36,690 | |
| | | | | | | | | | |
| (1) | Non-income producing security. |
| (2) | Valued at a fair value in accordance with procedures established by the board of directors of Artisan Partners Funds. In total, securities valued at a fair value were $26,449, or 72.1% of total net assets. See notes 2(a) and 4 in Notes to Financial Statements for additional information. |
| (3) | Security has been deemed illiquid under procedures established by the board of directors of Artisan Partners Funds. |
| | | | | | | | | | | | | | | |
Security | | Rate | | Maturity | | Value |
U.S. Treasury Note | | | | 0.125 | % | | | | 4/15/2017 | | | | $ | 632 | |
| (6) | Percentages for the various classifications relate to total net assets. |
Company names are as reported by a data service provider and in some cases are translations; a company’s legal name may be different.
(DR) Depositary Receipt, voting rights may vary.
| | |
| 34 | | Artisan Partners Funds |
| | | | | | | | | | |
| PORTFOLIO DIVERSIFICATION - September 30, 2016 | |
Dollar values in thousands | |
| | | Value | | Percentage
of Total
Investments |
Consumer Discretionary | | | $ | 5,341 | | | | | 14.5 | % |
Consumer Staples | | | | 2,186 | | | | | 5.9 | |
Energy | | | | 2,260 | | | | | 6.1 | |
Financials | | | | 7,425 | | | | | 20.1 | |
Health Care | | | | 2,162 | | | | | 5.9 | |
Industrials | | | | 2,915 | | | | | 7.9 | |
Information Technology | | | | 9,056 | | | | | 24.6 | |
Materials | | | | 2,466 | | | | | 6.7 | |
Telecommunication Services | | | | 933 | | | | | 2.5 | |
Utilities | | | | 1,522 | | | | | 4.1 | |
Short-term investments | | | | 618 | | | | | 1.7 | |
| | | | | | | | | | |
Total investments | | | $ | 36,884 | | | | | 100.0 | % |
| | | | | | | | | | |
| | | | | | | | | | |
| TRADING CURRENCIES - September 30, 2016 | |
Dollar values in thousands | |
| | | Value | | Percentage
of Total
Investments |
Brazilian real | | | $ | 3,397 | | | | | 9.2 | % |
British pound | | | | 1,189 | | | | | 3.2 | |
Chilean peso | | | | 673 | | | | | 1.8 | |
Czech koruna | | | | 348 | | | | | 0.9 | |
Euro | | | | 449 | | | | | 1.2 | |
Hong Kong dollar | | | | 5,257 | | | | | 14.3 | |
Indian rupee | | | | 2,747 | | | | | 7.5 | |
Indonesian rupiah | | | | 1,824 | | | | | 4.9 | |
Kenyan shilling | | | | 337 | | | | | 0.9 | |
Korean won | | | | 4,562 | | | | | 12.4 | |
Malaysian ringgit | | | | 278 | | | | | 0.8 | |
Mexican peso | | | | 882 | | | | | 2.4 | |
Polish zloty | | | | 287 | | | | | 0.8 | |
South African rand | | | | 1,488 | | | | | 4.0 | |
Swiss franc | | | | 284 | | | | | 0.8 | |
Taiwan dollar | | | | 3,862 | | | | | 10.5 | |
Thai baht | | | | 292 | | | | | 0.8 | |
Turkish lira | | | | 643 | | | | | 1.7 | |
U.S. dollar | | | | 8,085 | | | | | 21.9 | |
| | | | | | | | | | |
Total investments | | | $ | 36,884 | | | | | 100.0 | % |
| | | | | | | | | | |
| | | | | | | |
| TOP TEN HOLDINGS - September 30, 2016 | |
Company Name | | Country | | Percentage
of Total
Net Assets |
Samsung Electronics Co., Ltd. | | Korea | | | | 6.6 | % |
Taiwan Semiconductor Manufacturing Co., Ltd. | | Taiwan | | | | 5.7 | |
Alibaba Group Holding Ltd. | | China | | | | 3.5 | |
Sberbank of Russia PJSC | | Russia | | | | 2.5 | |
Naspers Ltd. | | South Africa | | | | 2.4 | |
Zhuzhou CRRC Times Electric Co., Ltd. | | China | | | | 2.0 | |
Baidu, Inc. | | China | | | | 1.9 | |
ICICI Bank Ltd. | | India | | | | 1.8 | |
Randgold Resources Ltd. | | United Kingdom | | | | 1.8 | |
Hon Hai Precision Industry Co., Ltd. | | Taiwan | | | | 1.8 | |
| | | | | | | |
Total | | | | | | 30.0 | % |
| | | | | | | |
For the purpose of determining the Fund’s top ten holdings, securities of the same issuer are aggregated to determine the weight in the Fund.
The accompanying notes are an integral part of the financial statements.
| | |
| Artisan Partners Funds | | 35 |
ARTISAN GLOBAL EQUITY FUND
Schedule of Investments – September 30, 2016
Dollar values in thousands
| | | | | | | | | | |
| | | Shares
Held | | Value |
| | | | | | | | | | |
| COMMON STOCKS - 98.2% | | | | | | | | | | |
| | | | | | | | | | |
| CANADA - 2.0% | | | | | | |
Canadian Pacific Railway Ltd. | | | | 33,676 | | | | $ | 5,142 | |
| | | | | | | | | | |
| CHINA - 1.3% | | | | | | |
Alibaba Group Holding Ltd. (DR)(1) | | | | 23,820 | | | | | 2,520 | |
Ctrip.com International Ltd. (DR)(1) | | | | 20,072 | | | | | 935 | |
| | | | | | | | | | |
| | | | | | | | | 3,455 | |
| DENMARK - 2.2% | | | | | | |
Genmab AS(1)(2) | | | | 9,763 | | | | | 1,673 | |
ISS AS(2) | | | | 94,642 | | | | | 3,938 | |
| | | | | | | | | | |
| | | | | | | | | 5,611 | |
| FINLAND - 1.6% | | | | | | |
Huhtamaki Oyj(2) | | | | 87,980 | | | | | 4,097 | |
| | | | | | | | | | |
| FRANCE - 3.2% | | | | | | |
Elis S.A.(2) | | | | 331,080 | | | | | 5,465 | |
Natixis S.A.(2) | | | | 566,523 | | | | | 2,641 | |
| | | | | | | | | | |
| | | | | | | | | 8,106 | |
| GERMANY - 8.0% | | | | | | |
Deutsche Boerse AG(1)(2) | | | | 97,435 | | | | | 7,890 | |
Linde AG(2) | | | | 15,299 | | | | | 2,600 | |
Vonovia SE(2) | | | | 153,067 | | | | | 5,796 | |
Wirecard AG(2) | | | | 84,238 | | | | | 4,375 | |
| | | | | | | | | | |
| | | | | | | | | 20,661 | |
| HONG KONG - 1.9% | | | | | | |
AIA Group Ltd.(2) | | | | 723,595 | | | | | 4,848 | |
| | | | | | | | | | |
| INDONESIA - 0.2% | | | | | | |
Bank Rakyat Indonesia Persero Tbk PT(2) | | | | 397,500 | | | | | 373 | |
| | | | | | | | | | |
| JAPAN - 6.1% | | | | | | |
Calbee, Inc.(2) | | | | 52,600 | | | | | 1,989 | |
Japan Tobacco, Inc.(2) | | | | 149,600 | | | | | 6,112 | |
Nitori Holdings Co., Ltd.(2) | | | | 27,078 | | | | | 3,240 | |
NTT DOCOMO, Inc.(2) | | | | 172,168 | | | | | 4,365 | |
| | | | | | | | | | |
| | | | | | | | | 15,706 | |
| NETHERLANDS - 2.1% | | | | | | |
InterXion Holding N.V.(1) | | | | 151,979 | | | | | 5,505 | |
| | | | | | | | | | |
| SWITZERLAND - 2.6% | | | | | | |
Nestle S.A.(2) | | | | 86,185 | | | | | 6,791 | |
| | | | | | | | | | |
| | | | | | | | | | |
| TAIWAN - 4.3% | | | | | | |
Ginko International Co., Ltd.(2) | | | | 627,000 | | | | | 6,233 | |
Taiwan Semiconductor Manufacturing Co., Ltd.(2) | | | | 823,000 | | | | | 4,827 | |
| | | | | | | | | | |
| | | | | | | | | 11,060 | |
| THAILAND - 0.2% | |
Thai Beverage PCL(2) | | | | 545,000 | | | | | 388 | |
| | | | | | | | | | |
| UNITED KINGDOM - 0.2% | |
Merlin Entertainments plc(2) | | | | 105,442 | | | | | 601 | |
| | | | | | | | | | |
| UNITED STATES - 62.3% | |
Alphabet, Inc., Class A(1) | | | | 4,810 | | | | | 3,868 | |
Alphabet, Inc., ClassC(1)(3) | | | | 9,215 | | | | | 7,163 | |
Amazon.com, Inc.(1) | | | | 10,564 | | | | | 8,845 | |
Aon plc | | | | 39,064 | | | | | 4,394 | |
AutoZone, Inc.(1) | | | | 3,427 | | | | | 2,633 | |
Boston Scientific Corp.(1) | | | | 253,686 | | | | | 6,038 | |
CDK Global, Inc. | | | | 44,190 | | | | | 2,535 | |
Celgene Corp.(1) | | | | 55,147 | | | | | 5,765 | |
Charter Communications, Inc., Class A(1) | | | | 18,770 | | | | | 5,067 | |
Comcast Corp., Class A | | | | 97,727 | | | | | 6,483 | |
Dollar General Corp. | | | | 134,840 | | | | | 9,437 | |
Dollar Tree, Inc.(1) | | | | 85,507 | | | | | 6,749 | |
Facebook, Inc., Class A(1) | | | | 34,667 | | | | | 4,447 | |
Fidelity National Information Services, Inc. | | | | 57,202 | | | | | 4,406 | |
FleetCor Technologies, Inc.(1) | | | | 27,352 | | | | | 4,752 | |
Home Depot, Inc. | | | | 45,393 | | | | | 5,841 | |
Liberty Global plc, Class A(1) | | | | 101,743 | | | | | 3,478 | |
Liberty Global plc, Series C(1)(3) | | | | 116,534 | | | | | 3,850 | |
Liberty Global plc LiLAC, Class A(1) | | | | 12,558 | | | | | 347 | |
Liberty Global plc LiLAC, Class C(1)(3) | | | | 14,581 | | | | | 409 | |
Live Nation Entertainment, Inc.(1) | | | | 182,136 | | | | | 5,005 | |
LKQ Corp.(1) | | | | 36,916 | | | | | 1,309 | |
MasterCard, Inc., Class A | | | | 94,694 | | | | | 9,637 | |
Medtronic plc | | | | 112,213 | | | | | 9,695 | |
Molson Coors Brewing Co., Class B | | | | 85,915 | | | | | 9,434 | |
Mondelez International, Inc., Class A | | | | 116,009 | | | | | 5,093 | |
Monster Beverage Corp.(1) | | | | 17,248 | | | | | 2,532 | |
NewMarket Corp. | | | | 4,358 | | | | | 1,871 | |
Patheon N.V.(1) | | | | 104,029 | | | | | 3,082 | |
Pentair plc | | | | 8,386 | | | | | 539 | |
PepsiCo, Inc. | | | | 48,988 | | | | | 5,328 | |
Priceline Group, Inc.(1) | | | | 2,283 | | | | | 3,359 | |
SBA Communications Corp., Class A(1) | | | | 23,340 | | | | | 2,618 | |
Splunk, Inc.(1) | | | | 77,335 | | | | | 4,538 | |
| | | | | | | | | | |
| | | | | | | | | 160,547 | |
| | | | | | | | | | |
Total common stocks
(Cost $219,459) | | | | | | | | | 252,891 | |
| | |
| 36 | | Artisan Partners Funds |
| | | | | | | | | | |
| | | Principal
Amount | | Value |
SHORT-TERM INVESTMENTS
(CASH EQUIVALENTS) - 0.9% | |
Repurchase agreement with Fixed Income
Clearing Corporation, 0.03%,
dated 9/30/16, due 10/3/16,
maturity value $2,408
(Cost $2,408)(4) | | | $ | 2,408 | | | | $ | 2,408 | |
| | | | | | | | | | |
| | | | | | | | | | |
Total investments - 99.1%
(Cost $221,867) | | | | | | | | | 255,299 | |
| | | | | | | | | | |
Other assets less liabilities - 0.9% | | | | | | | | | 2,275 | |
| | | | | | | | | | |
| | | | | | | | | | |
Total net assets - 100.0%(5) | | | | | | | | $ | 257,574 | |
| | | | | | | | | | |
| (1) | Non-income producing security. |
| (2) | Valued at a fair value in accordance with procedures established by the board of directors of Artisan Partners Funds. In total, securities valued at a fair value were $78,242, or 30.4% of total net assets. See notes 2(a) and 4 in Notes to Financial Statements for additional information. |
| | | | | | | | | | | | | | | |
Security | | Rate | | Maturity | | Value |
U.S. Treasury Note | | | | 0.125 | % | | | | 4/15/2017 | | | | $ | 2,460 | |
| (5) | Percentages for the various classifications relate to total net assets. |
Company names are as reported by a data service provider and in some cases are translations; a company’s legal name may be different.
(DR) Depositary Receipt, voting rights may vary.
| | | | | | | | | | |
| PORTFOLIO DIVERSIFICATION - September 30, 2016 | |
Dollar values in thousands | |
| | | Value | | Percentage
of Total
Investments |
Consumer Discretionary | | | $ | 67,588 | | | | | 26.5 | % |
Consumer Staples | | | | 37,667 | | | | | 14.8 | |
Financials | | | | 20,146 | | | | | 7.9 | |
Health Care | | | | 32,486 | | | | | 12.7 | |
Industrials | | | | 15,084 | | | | | 5.9 | |
Information Technology | | | | 58,573 | | | | | 22.9 | |
Materials | | | | 8,568 | | | | | 3.4 | |
Real Estate | | | | 5,796 | | | | | 2.3 | |
Telecommunication Services | | | | 6,983 | | | | | 2.7 | |
Short-term investments | | | | 2,408 | | | | | 0.9 | |
| | | | | | | | | | |
Total investments | | | $ | 255,299 | | | | | 100.0 | % |
| | | | | | | | | | |
| | | | | | | | | | |
| TRADING CURRENCIES - September 30, 2016 | |
Dollar values in thousands | |
| | | Value | | Percentage
of Total
Investments |
British pound | | | $ | 601 | | | | | 0.2 | % |
Danish krone | | | | 5,611 | | | | | 2.2 | |
Euro | | | | 32,864 | | | | | 12.9 | |
Hong Kong dollar | | | | 4,848 | | | | | 1.9 | |
Indonesian rupiah | | | | 373 | | | | | 0.1 | |
Japanese yen | | | | 15,706 | | | | | 6.1 | |
Singapore dollar | | | | 388 | | | | | 0.2 | |
Swiss franc | | | | 6,791 | | | | | 2.7 | |
Taiwan dollar | | | | 11,060 | | | | | 4.3 | |
U.S. dollar | | | | 177,057 | | | | | 69.4 | |
| | | | | | | | | | |
Total investments | | | $ | 255,299 | | | | | 100.0 | % |
| | | | | | | | | | |
| | | | | | | |
| TOP TEN HOLDINGS - September 30, 2016 | |
Company Name | | Country | | Percentage
of Total
Net Assets |
Alphabet, Inc. | | United States | | | | 4.3 | % |
Medtronic plc | | United States | | | | 3.8 | |
MasterCard, Inc. | | United States | | | | 3.7 | |
Dollar General Corp. | | United States | | | | 3.7 | |
Molson Coors Brewing Co. | | United States | | | | 3.7 | |
Amazon.com, Inc. | | United States | | | | 3.4 | |
Liberty Global plc | | United States | | | | 3.1 | |
Deutsche Boerse AG | | Germany | | | | 3.1 | |
Nestle S.A. | | Switzerland | | | | 2.6 | |
Dollar Tree, Inc. | | United States | | | | 2.6 | |
| | | | | | | |
Total | | | | | | 34.0 | % |
| | | | | | | |
For the purpose of determining the Fund’s top ten holdings, securities of the same issuer are aggregated to determine the weight in the Fund.
The accompanying notes are an integral part of the financial statements.
| | |
| Artisan Partners Funds | | 37 |
ARTISAN GLOBAL OPPORTUNITIES FUND
Schedule of Investments – September 30, 2016
Dollar values in thousands
| | | | | | | | | | |
| | | Shares
Held | | Value |
| COMMON STOCKS - 93.4% | | | | | | | | | | |
| | | | | | | | | | |
| AUSTRALIA - 4.2% | | | | | | | | | | |
James Hardie Industries plc (DR)(1) | | | | 2,590,288 | | | | $ | 40,630 | |
Treasury Wine Estates Ltd.(1) | | | | 4,260,150 | | | | | 36,049 | |
| | | | | | | | | | |
| | | | | | | | | 76,679 | |
| BRAZIL - 1.0% | | | | | | | | | | |
Raia Drogasil S.A. | | | | 943,600 | | | | | 19,231 | |
| | | | | | | | | | |
| CHINA - 3.9% | | | | | | | | | | |
Tencent Holdings Ltd.(1) | | | | 2,616,617 | | | | | 72,502 | |
| | | | | | | | | | |
| DENMARK - 3.1% | | | | | | | | | | |
Genmab AS(1)(2) | | | | 328,878 | | | | | 56,358 | |
| | | | | | | | | | |
| FRANCE - 2.8% | | | | | | | | | | |
Eurofins Scientific SE(1) | | | | 112,043 | | | | | 50,893 | |
| | | | | | | | | | |
| GERMANY - 2.0% | | | | | | | | | | |
Brenntag AG(1) | | | | 659,225 | | | | | 35,973 | |
| | | | | | | | | | |
| HONG KONG - 1.8% | | | | | | | | | | |
Hong Kong Exchanges and Clearing Ltd.(1) | | | | 622,158 | | | | | 16,412 | |
Sands China Ltd.(1) | | | | 3,824,089 | | | | | 16,751 | |
| | | | | | | | | | |
| | | | | | | | | 33,163 | |
| JAPAN - 8.0% | | | | | | | | | | |
Harmonic Drive Systems, Inc.(1) | | | | 302,740 | | | | | 8,803 | |
Keyence Corp.(1) | | | | 12,600 | | | | | 9,171 | |
Lion Corp.(1) | | | | 967,000 | | | | | 15,641 | |
Nintendo Co., Ltd.(1) | | | | 164,126 | | | | | 43,429 | |
Shiseido Co., Ltd.(1) | | | | 1,540,018 | | | | | 40,725 | |
Stanley Electric Co., Ltd.(1) | | | | 1,121,046 | | | | | 30,154 | |
| | | | | | | | | | |
| | | | | | | | | 147,923 | |
| KOREA - 1.3% | | | | | | | | | | |
Amorepacific Corp.(1) | | | | 66,661 | | | | | 23,577 | |
| | | | | | | | | | |
| MEXICO - 0.9% | | | | | | | | | | |
Fomento Economico Mexicano S.A.B. de C.V. (DR) | | | | 173,999 | | | | | 16,015 | |
| | | | | | | | | | |
| NETHERLANDS - 1.0% | | | | | | | | | | |
ASML Holding N.V. (DR) | | | | 165,891 | | | | | 18,178 | |
| | | | | | | | | | |
| SWEDEN - 0.7% | | | | | | | | | | |
Hexagon AB, Class B(1) | | | | 295,016 | | | | | 12,873 | |
| | | | | | | | | | |
| TAIWAN - 1.4% | | | | | | | | | | |
Hermes Microvision, Inc.(1) | | | | 598,000 | | | | | 25,876 | |
| UNITED KINGDOM - 6.6% | | | | | | | | | | |
ASOS plc(1)(2) | | | | 503,037 | | | | | 31,616 | |
Associated British Foods plc(1) | | | | 320,528 | | | | | 10,802 | |
Auto Trader Group plc(1) | | | | 4,725,920 | | | | | 24,839 | |
Direct Line Insurance Group plc(1) | | | | 6,631,650 | | | | | 31,357 | |
Intertek Group plc(1) | | | | 501,854 | | | | | 22,721 | |
| | | | | | | | | | |
| | | | | | | | | 121,335 | |
| UNITED STATES - 54.7% | | | | | | | | | | |
Alphabet, Inc., Class A(2) | | | | 87,955 | | | | | 70,721 | |
Alphabet, Inc., Class C(2)(3) | | | | 56,402 | | | | | 43,841 | |
Anthem, Inc. | | | | 237,154 | | | | | 29,718 | |
Boston Scientific Corp.(2) | | | | 2,644,794 | | | | | 62,946 | |
Broadcom Ltd. | | | | 213,899 | | | | | 36,902 | |
DexCom, Inc.(2) | | | | 247,991 | | | | | 21,739 | |
Ecolab, Inc. | | | | 259,067 | | | | | 31,534 | |
Electronic Arts, Inc.(2) | | | | 570,888 | | | | | 48,754 | |
Facebook, Inc., Class A(2) | | | | 555,536 | | | | | 71,259 | |
IHS Markit Ltd.(2) | | | | 4,211,886 | | | | | 158,156 | |
LKQ Corp.(2) | | | | 1,646,995 | | | | | 58,402 | |
Noble Energy, Inc. | | | | 679,083 | | | | | 24,270 | |
Priceline Group, Inc.(2) | | | | 19,081 | | | | | 28,078 | |
Regeneron Pharmaceuticals, Inc.(2) | | | | 129,839 | | | | | 52,198 | |
S&P Global, Inc. | | | | 601,473 | | | | | 76,122 | |
salesforce.com, Inc.(2) | | | | 347,951 | | | | | 24,819 | |
Schlumberger Ltd. | | | | 258,440 | | | | | 20,324 | |
Starbucks Corp. | | | | 249,523 | | | | | 13,509 | |
Visa, Inc., Class A | | | | 1,126,218 | | | | | 93,138 | |
Workday, Inc., Class A(2) | | | | 418,540 | | | | | 38,376 | |
| | | | | | | | | | |
| | | | | | | | | 1,004,806 | |
| | | | | | | | | | |
Total common stocks
(Cost $1,278,559) | | | | | | | | | 1,715,382 | |
| | |
| | | Principal
Amount | | |
SHORT-TERM INVESTMENTS
(CASH EQUIVALENTS) - 6.4% | | | | | | | | | | |
Repurchase agreement with Fixed Income Clearing Corporation, 0.03%,
dated 9/30/16, due 10/3/16,
maturity value $118,529
(Cost $118,529)(4) | | | $ | 118,529 | | | | $ | 118,529 | |
| | | | | | | | | | |
| | | | | | | | | | |
Total investments - 99.8%
(Cost $1,397,088) | | | | | | | | | 1,833,911 | |
| | | | | | | | | | |
Other assets less liabilities - 0.2% | | | | | | | | | 3,526 | |
| | | | | | | | | | |
| | | | | | | | | | |
Total net assets - 100.0%(5) | | | | | | | | $ | 1,837,437 | |
| | | | | | | | | | |
| | |
| 38 | | Artisan Partners Funds |
| (1) | Valued at a fair value in accordance with procedures established by the board of directors of Artisan Partners Funds. In total, securities valued at a fair value were $657,152, or 35.8% of total net assets. See notes 2(a) and 4 in Notes to Financial Statements for additional information. |
| (2) | Non-income producing security. |
| | | | | | | | | | | | | | | |
Security | | Rate | | Maturity | | Value |
U.S. Treasury Note | | | | 0.125 | % | | | | 4/15/2017 | | | | $ | 120,907 | |
| (5) | Percentages for the various classifications relate to total net assets. |
Company names are as reported by a data service provider and in some cases are translations; a company’s legal name may be different.
(DR) Depositary Receipt, voting rights may vary.
| | | | | | | | | | |
| PORTFOLIO DIVERSIFICATION - September 30, 2016 | |
Dollar values in thousands | |
| | | Value | | Percentage
of Total
Investments |
Consumer Discretionary | | | $ | 178,510 | | | | | 9.7 | % |
Consumer Staples | | | | 162,040 | | | | | 8.9 | |
Energy | | | | 44,594 | | | | | 2.4 | |
Financials | | | | 123,891 | | | | | 6.8 | |
Health Care | | | | 273,852 | | | | | 14.9 | |
Industrials | | | | 225,653 | | | | | 12.3 | |
Information Technology | | | | 634,678 | | | | | 34.6 | |
Materials | | | | 72,164 | | | | | 3.9 | |
Short-term investments | | | | 118,529 | | | | | 6.5 | |
| | | | | | | | | | |
Total investments | | | $ | 1,833,911 | | | | | 100.0 | % |
| | | | | | | | | | |
| | | | | | | | | | |
| TRADING CURRENCIES - September 30, 2016 | |
Dollar values in thousands | |
| | | Value | | Percentage
of Total
Investments |
Australian dollar | | | $ | 76,679 | | | | | 4.2 | % |
Brazilian real | | | | 19,231 | | | | | 1.0 | |
British pound | | | | 121,335 | | | | | 6.6 | |
Danish krone | | | | 56,358 | | | | | 3.1 | |
Euro | | | | 86,866 | | | | | 4.7 | |
Hong Kong dollar | | | | 105,665 | | | | | 5.8 | |
Japanese yen | | | | 147,923 | | | | | 8.1 | |
Korean won | | | | 23,577 | | | | | 1.3 | |
Swedish krona | | | | 12,873 | | | | | 0.7 | |
Taiwan dollar | | | | 25,876 | | | | | 1.4 | |
U.S. dollar | | | | 1,157,528 | | | | | 63.1 | |
| | | | | | | | | | |
Total investments | | | $ | 1,833,911 | | | | | 100.0 | % |
| | | | | | | | | | |
| | | | | | | | | | |
| FOREIGN CURRENCY FORWARD CONTRACTS - September 30, 2016 |
Dollar values in thousands |
| | | | | | | | | | | | | | | | | | | | | | | | |
Counterparty | | Contract
Settlement
Date | | Contract Amount | | Unrealized
Depreciation |
| | | Deliver | | Receive | |
| State Street Bank and Trust Company | | 2/3/2017 | | JPY | | | | 5,571,734 | | | | | USD | | | | | 55,165 | | | | $ | (94 | ) |
JPY - Japanese yen
USD - U.S. dollar
| | | | | | | |
| TOP TEN HOLDINGS - September 30, 2016 | |
Company Name | | Country | | Percentage
of Total
Net Assets |
IHS Markit Ltd. | | United States | | | | 8.6 | % |
Alphabet, Inc. | | United States | | | | 6.2 | |
Visa, Inc. | | United States | | | | 5.1 | |
S&P Global, Inc. | | United States | | | | 4.1 | |
Tencent Holdings Ltd. | | China | | | | 3.9 | |
Facebook, Inc. | | United States | | | | 3.9 | |
Boston Scientific Corp. | | United States | | | | 3.4 | |
LKQ Corp. | | United States | | | | 3.2 | |
Genmab AS | | Denmark | | | | 3.1 | |
Regeneron Pharmaceuticals, Inc. | | United States | | | | 2.8 | |
| | | | | | | |
Total | | | | | | 44.3 | % |
| | | | | | | |
For the purpose of determining the Fund’s top ten holdings, securities of the same issuer are aggregated to determine the weight in the Fund.
The accompanying notes are an integral part of the financial statements.
| | |
| Artisan Partners Funds | | 39 |
ARTISAN GLOBAL SMALL CAP FUND
Schedule of Investments – September 30, 2016
Dollar values in thousands
| | | | | | | | | | |
| | | Shares
Held | | Value |
| COMMON STOCKS - 96.3% | | | | | | | | | | |
| | | | | | | | | | |
| CANADA - 2.9% | | | | | | | | | | |
Cogeco Communications, Inc. | | | | 45,571 | | | | $ | 2,249 | |
| | | | | | | | | | |
| DENMARK - 4.5% | | | | | | | | | | |
Scandinavian Tobacco Group AS(1) | | | | 205,787 | | | | | 3,513 | |
| | | | | | | | | | |
| FINLAND - 4.5% | | | | | | | | | | |
Huhtamaki Oyj(1) | | | | 74,016 | | | | | 3,447 | |
| | | | | | | | | | |
| FRANCE - 5.4% | | | | | | | | | | |
Elis S.A.(1) | | | | 194,364 | | | | | 3,209 | |
Euronext N.V.(1) | | | | 22,502 | | | | | 960 | |
| | | | | | | | | | |
| | | | | | | | | 4,169 | |
| GERMANY - 9.4% | | | | | | | | | | |
Borussia Dortmund GmbH & Co. KGaA(1) | | | | 178,076 | | | | | 970 | |
Gerresheimer AG(1) | | | | 27,071 | | | | | 2,300 | |
Tele Columbus AG(1)(2) | | | | 455,018 | | | | | 3,965 | |
| | | | | | | | | | |
| | | | | | | | | 7,235 | |
| ITALY - 9.9% | | | | | | | | | | |
Ei Towers S.p.A.(1)(2) | | | | 40,971 | | | | | 2,160 | |
Enav S.p.A.(1)(2) | | | | 318,174 | | | | | 1,307 | |
Infrastrutture Wireless Italiane S.p.A.(1) | | | | 384,117 | | | | | 1,889 | |
RAI Way S.p.A.(1) | | | | 564,054 | | | | | 2,282 | |
| | | | | | | | | | |
| | | | | | | | | 7,638 | |
| JAPAN - 1.9% | | | | | | | | | | |
Seria Co., Ltd.(1) | | | | 17,900 | | | | | 1,450 | |
| | | | | | | | | | |
| NETHERLANDS - 4.0% | | | | | | | | | | |
InterXion Holding N.V.(2) | | | | 85,735 | | | | | 3,105 | |
| | | | | | | | | | |
| SINGAPORE - 1.7% | | | | | | | | | | |
SATS Ltd.(1) | | | | 367,400 | | | | | 1,341 | |
| | | | | | | | | | |
| SOUTH AFRICA - 0.3% | | | | | | | | | | |
Distell Group Ltd.(1) | | | | 17,146 | | | | | 211 | |
| SPAIN - 10.0% | | | | | | | | | | |
Cellnex Telecom SAU(1) | | | | 101,286 | | | | | 1,832 | |
Ebro Foods S.A.(1) | | | | 127,538 | | | | | 2,966 | |
Inmobiliaria Colonial S.A.(1) | | | | 399,121 | | | | | 2,903 | |
Melia Hotels International S.A.(1) | | | | 5,686 | | | | | 71 | |
| | | | | | | | | | |
| | | | | | | | | 7,772 | |
| SWEDEN - 8.6% | | | | | | | | | | |
Cloetta AB, Class B(1) | | | | 1,049,257 | | | | | 3,804 | |
Com Hem Holding AB(1) | | | | 304,357 | | | | | 2,813 | |
| | | | | | | | | | |
| | | | | | | | | 6,617 | |
| TAIWAN - 4.4% | | | | | | | | | | |
Ginko International Co., Ltd.(1) | | | | 339,000 | | | | | 3,370 | |
| | | | | | | | | | |
| THAILAND - 1.7% | | | | | | | | | | |
Bangkok Airways Co., Ltd.(1) | | | | 1,732,500 | | | | | 1,238 | |
Big C Supercenter PCL(1) | | | | 9,169 | | | | | 56 | |
Big C Supercenter PCL (DR)(1) | | | | 9,000 | | | | | 54 | |
| | | | | | | | | | |
| | | | | | | | | 1,348 | |
| UNITED KINGDOM - 13.9% | | | | | | | | | | |
AA plc(1) | | | | 227,252 | | | | | 871 | |
Berendsen plc(1) | | | | 102,662 | | | | | 1,657 | |
Britvic plc(1) | | | | 201,668 | | | | | 1,576 | |
Cairn Homes plc(1)(2) | | | | 808,339 | | | | | 976 | |
Domino’s Pizza Group plc(1) | | | | 209,566 | | | | | 1,014 | |
Merlin Entertainments plc(1) | | | | 161,546 | | | | | 922 | |
Mitchells & Butlers plc(1) | | | | 489,279 | | | | | 1,743 | |
Virgin Money Holdings UK plc(1) | | | | 500,387 | | | | | 2,018 | |
| | | | | | | | | | |
| | | | | | | | | 10,777 | |
| UNITED STATES - 13.2% | | | | | | | | | | |
Allegion plc | | | | 4,110 | | | | | 283 | |
Cable One, Inc. | | | | 6,862 | | | | | 4,008 | |
GCP Applied Technologies, Inc.(2) | | | | 67,828 | | | | | 1,921 | |
Patheon N.V.(2) | | | | 33,321 | | | | | 987 | |
Penumbra, Inc.(2) | | | | 12,708 | | | | | 966 | |
Snyder’s-Lance, Inc. | | | | 61,526 | | | | | 2,066 | |
| | | | | | | | | | |
| | | | | | | | | 10,231 | |
| | | | | | | | | | |
Total common stocks
(Cost $69,339) | | | | | | | | | 74,473 | |
| | |
| 40 | | Artisan Partners Funds |
| | | | | | | | | | |
| | | Principal
Amount | | Value |
SHORT-TERM INVESTMENTS (CASH EQUIVALENTS) - 2.9% | | | | | | | | | | |
Repurchase agreement with Fixed Income Clearing Corporation, 0.03%, dated 9/30/16,
due 10/3/16, maturity value $2,231
(Cost $2,231)(3) | | | $ | 2,231 | | | | $ | 2,231 | |
| | | | | | | | | | |
| | | | | | | | | | |
Total investments - 99.2%
(Cost $71,570) | | | | | | | | | 76,704 | |
| | | | | | | | | | |
Other assets less liabilities - 0.8% | | | | | | | | | 591 | |
| | | | | | | | | | |
| | | | | | | | | | |
Total net assets - 100.0%(4) | | | | | | | | $ | 77,295 | |
| | | | | | | | | | |
| (1) | Valued at a fair value in accordance with procedures established by the board of directors of Artisan Partners Funds. In total, securities valued at a fair value were $58,888, or 76.2% of total net assets. See notes 2(a) and 4 in Notes to Financial Statements for additional information. |
| (2) | Non-income producing security. |
| | | | | | | | | | | | | | | |
Security | | Rate | | Maturity | | Value |
U.S. Treasury Note | | | | 0.125 | % | | | | 4/15/2017 | | | | $ | 2,279 | |
| (4) | Percentages for the various classifications relate to total net assets. |
Company names are as reported by a data service provider and in some cases are translations; a company’s legal name may be different.
(DR) Depositary Receipt, voting rights may vary.
| | | | | | | | | | |
| PORTFOLIO DIVERSIFICATION - September 30, 2016 | |
Dollar values in thousands | |
| | | Value | | Percentage
of Total
Investments |
Consumer Discretionary | | | $ | 20,521 | | | | | 26.7 | % |
Consumer Staples | | | | 14,246 | | | | | 18.6 | |
Financials | | | | 2,978 | | | | | 3.9 | |
Health Care | | | | 7,623 | | | | | 9.9 | |
Industrials | | | | 9,035 | | | | | 11.8 | |
Information Technology | | | | 3,105 | | | | | 4.1 | |
Materials | | | | 5,368 | | | | | 7.0 | |
Real Estate | | | | 2,903 | | | | | 3.8 | |
Telecommunication Services | | | | 8,694 | | | | | 11.3 | |
Short-term investments | | | | 2,231 | | | | | 2.9 | |
| | | | | | | | | | |
Total investments | | | $ | 76,704 | | | | | 100.0 | % |
| | | | | | | | | | |
| TRADING CURRENCIES - September 30, 2016 | |
Dollar values in thousands | |
| | | Value | | Percentage
of Total
Investments |
British pound | | | $ | 9,801 | | | | | 12.8 | % |
Canadian dollar | | | | 2,249 | | | | | 2.9 | |
Danish krone | | | | 3,513 | | | | | 4.6 | |
Euro | | | | 31,237 | | | | | 40.7 | |
Japanese yen | | | | 1,450 | | | | | 1.9 | |
Singapore dollar | | | | 1,341 | | | | | 1.7 | |
South African rand | | | | 211 | | | | | 0.3 | |
Swedish krona | | | | 6,617 | | | | | 8.6 | |
Taiwan dollar | | | | 3,370 | | | | | 4.4 | |
Thai baht | | | | 1,348 | | | | | 1.8 | |
U.S. dollar | | | | 15,567 | | | | | 20.3 | |
| | | | | | | | | | |
Total investments | | | $ | 76,704 | | | | | 100.0 | % |
| | | | | | | | | | |
| | | | | | | | | | |
| TOP TEN HOLDINGS - September 30, 2016 | |
Company Name | | Country | | Percentage
of Total
Net Assets |
Cable One, Inc. | | | | United States | | | | | 5.2 | % |
Tele Columbus AG | | | | Germany | | | | | 5.1 | |
Cloetta AB | | | | Sweden | | | | | 4.9 | |
Scandinavian Tobacco Group AS | | | | Denmark | | | | | 4.5 | |
Huhtamaki Oyj | | | | Finland | | | | | 4.5 | |
Ginko International Co., Ltd. | | | | Taiwan | | | | | 4.4 | |
Elis S.A. | | | | France | | | | | 4.2 | |
InterXion Holding N.V. | | | | Netherlands | | | | | 4.0 | |
Ebro Foods S.A. | | | | Spain | | | | | 3.8 | |
Inmobiliaria Colonial S.A. | | | | Spain | | | | | 3.8 | |
| | | | | | | | | | |
Total | | | | | | | | | 44.4 | % |
| | | | | | | | | | |
For the purpose of determining the Fund’s top ten holdings, securities of the same issuer are aggregated to determine the weight in the Fund.
The accompanying notes are an integral part of the financial statements.
| | |
| Artisan Partners Funds | | 41 |
ARTISAN GLOBAL VALUE FUND
Schedule of Investments – September 30, 2016
Dollar values in thousands
| | | | | | | | | | |
| | | Shares
Held | | Value |
| COMMON STOCKS - 88.9% | | | | | | | | | | |
| | | | | | | | | | |
| BELGIUM - 1.8% | | | | | | | | | | |
Groupe Bruxelles Lambert S.A.(1) | | | | 416,914 | | | | $ | 36,961 | |
| | | | | | | | | | |
| BRAZIL - 3.2% | | | | | | | | | | |
Telefonica Brasil S.A. (DR) | | | | 4,509,297 | | | | | 65,250 | |
| | �� | | | | | | | | |
| CANADA - 1.5% | | | | | | | | | | |
Imperial Oil Ltd. | | | | 1,025,971 | | | | | 32,094 | |
| | | | | | | | | | |
| CHINA - 2.9% | | | | | | | | | | |
Baidu, Inc. (DR)(2) | | | | 332,575 | | | | | 60,552 | |
| | | | | | | | | | |
| DENMARK - 4.5% | | | | | | | | | | |
Carlsberg AS, Class B(1) | | | | 412,506 | | | | | 39,410 | |
ISS AS(1) | | | | 1,277,328 | | | | | 53,142 | |
| | | | | | | | | | |
| | | | | | | | | 92,552 | |
| INDIA - 0.1% | | | | | | | | | | |
HCL Technologies Ltd.(1) | | | | 94,448 | | | | | 1,133 | |
| | | | | | | | | | |
| JAPAN - 0.2% | | | | | | | | | | |
Bridgestone Corp.(1) | | | | 115,100 | | | | | 4,245 | |
Sugi Holdings Co., Ltd.(1) | | | | 14,800 | | | | | 803 | |
| | | | | | | | | | |
| | | | | | | | | 5,048 | |
| KOREA - 5.4% | | | | | | | | | | |
Kia Motors Corp.(1) | | | | 616,833 | | | | | 23,710 | |
Samsung Electronics Co., Ltd.(1) | | | | 60,524 | | | | | 88,211 | |
| | | | | | | | | | |
| | | | | | | | | 111,921 | |
| NETHERLANDS - 2.3% | | | | | | | | | | |
ING Groep N.V.(1) | | | | 3,874,428 | | | | | 47,760 | |
| | | | | | | | | | |
| NORWAY - 1.3% | | | | | | | | | | |
Orkla ASA(1) | | | | 2,599,064 | | | | | 26,852 | |
| | | | | | | | | | |
| SWITZERLAND - 7.5% | | | | | | | | | | |
ABB Ltd.(1)(2) | | | | 3,158,981 | | | | | 70,930 | |
Adecco Group AG(1) | | | | 125,083 | | | | | 7,044 | |
Cie Financiere Richemont S.A.(1) | | | | 439,593 | | | | | 26,766 | |
Pargesa Holding S.A.(1) | | | | 2,453 | | | | | 168 | |
UBS Group AG(1) | | | | 3,729,778 | | | | | 50,645 | |
| | | | | | | | | | |
| | | | | | | | | 155,553 | |
| UNITED KINGDOM - 10.3% | | | | | | | | | | |
Amec Foster Wheeler plc(1) | | | | 2,392,491 | | | | | 17,817 | |
Compass Group plc(1) | | | | 1,122,778 | | | | | 21,774 | |
Diageo plc(1) | | | | 798,526 | | | | | 22,896 | |
IMI plc (1) | | | | 1,106,570 | | | | | 15,384 | |
Lloyds Banking Group plc(1) | | | | 47,172,913 | | | | | 33,409 | |
Royal Bank of Scotland Group plc(1)(2) | | | | 21,808,413 | | | | | 50,643 | |
Tesco plc (1)(2) | | | | 21,597,264 | | | | | 51,179 | |
| | | | | | | | | | |
| | | | | | | | | 213,102 | |
| UNITED STATES - 47.9% | | | | | | | | | | |
Alphabet, Inc., Class A(2) | | | | 30,548 | | | | | 24,562 | |
Alphabet, Inc., Class C(2)(3) | | | | 21,375 | | | | | 16,615 | |
American Express Co. | | | | 639,849 | | | | | 40,976 | |
Aon plc | | | | 311,243 | | | | | 35,012 | |
Arch Capital Group Ltd.(2) | | | | 1,002,497 | | | | | 79,458 | |
Bank of New York Mellon Corp. | | | | 1,932,766 | | | | | 77,079 | |
Cisco Systems, Inc. | | | | 1,988,465 | | | | | 63,074 | |
Citigroup, Inc. | | | | 1,468,183 | | | | | 69,342 | |
Citizens Financial Group, Inc. | | | | 1,429,867 | | | | | 35,332 | |
FedEx Corp. | | | | 163,605 | | | | | 28,578 | |
Johnson & Johnson | | | | 460,634 | | | | | 54,415 | |
Marsh & McLennan Cos., Inc. | | | | 984,854 | | | | | 66,231 | |
Medtronic plc | | | | 850,012 | | | | | 73,441 | |
Microsoft Corp. | | | | 1,272,342 | | | | | 73,287 | |
Oracle Corp. | | | | 2,317,276 | | | | | 91,023 | |
Progressive Corp. | | | | 862,647 | | | | | 27,173 | |
QUALCOMM, Inc. | | | | 1,073,871 | | | | | 73,560 | |
TE Connectivity Ltd. | | | | 446,344 | | | | | 28,736 | |
United Technologies Corp. | | | | 325,068 | | | | | 33,027 | |
| | | | | | | | | | |
| | | | | | | | | 990,921 | |
| | | | | | | | | | |
Total common stocks
(Cost $1,647,661) | | | | | | | | | 1,839,699 | |
| | |
| 42 | | Artisan Partners Funds |
| | | | | | | | | | |
| | | Principal
Amount | | Value |
SHORT-TERM INVESTMENTS
(CASH EQUIVALENTS) - 11.2% | | | | | | | | | | |
Repurchase agreement with Fixed Income Clearing Corporation, 0.03%, dated 9/30/16, due 10/3/16,
maturity value $232,610
(Cost $232,609)(4) | | | $ | 232,609 | | | | $ | 232,609 | |
| | | | | | | | | | |
| | | | | | | | | | |
Total investments - 100.1%
(Cost $1,880,270) | | | | | | | | | 2,072,308 | |
| | | | | | | | | | |
Other assets less liabilities - (0.1)% | | | | | | | | | (3,041 | ) |
| | | | | | | | | | |
| | | | | | | | | | |
Total net assets - 100.0%(5) | | | | | | | | $ | 2,069,267 | |
| | | | | | | | | | |
| (1) | Valued at a fair value in accordance with procedures established by the board of directors of Artisan Partners Funds. In total, securities valued at a fair value were $690,882, or 33.4% of total net assets. See notes 2(a) and 4 in Notes to Financial Statements for additional information. |
| (2) | Non-income producing security. |
| | | | | | | | | | | | | | | |
Security | | Rate | | Maturity | | Value |
U.S. Treasury Note | | | | 0.125 | % | | | | 4/15/2017 | | | | $ | 237,267 | |
| (5) | Percentages for the various classifications relate to total net assets. |
Company names are as reported by a data service provider and in some cases are translations; a company’s legal name may be different.
(DR) Depositary Receipt, voting rights may vary.
| | | | | | | | | | |
| PORTFOLIO DIVERSIFICATION - September 30, 2016 | |
Dollar values in thousands | |
| | | Value | | Percentage
of Total
Investments |
Consumer Discretionary | | | $ | 76,495 | | | | | 3.7 | % |
Consumer Staples | | | | 141,140 | | | | | 6.8 | |
Energy | | | | 49,911 | | | | | 2.4 | |
Financials | | | | 650,189 | | | | | 31.4 | |
Health Care | | | | 127,856 | | | | | 6.2 | |
Industrials | | | | 208,105 | | | | | 10.0 | |
Information Technology | | | | 520,753 | | | | | 25.1 | |
Telecommunication Services | | | | 65,250 | | | | | 3.2 | |
Short-term investments | | | | 232,609 | | | | | 11.2 | |
| | | | | | | | | | |
Total investments | | | $ | 2,072,308 | | | | | 100.0 | % |
| | | | | | | | | | |
| TRADING CURRENCIES - September 30, 2016 | |
Dollar values in thousands | |
| | | Value | | Percentage
of Total
Investments |
British pound | | | $ | 213,102 | | | | | 10.3 | % |
Canadian dollar | | | | 32,094 | | | | | 1.5 | |
Danish krone | | | | 92,552 | | | | | 4.5 | |
Euro | | | | 84,721 | | | | | 4.1 | |
Indian rupee | | | | 1,133 | | | | | 0.1 | |
Japanese yen | | | | 5,048 | | | | | 0.2 | |
Korean won | | | | 111,921 | | | | | 5.4 | |
Norwegian krone | | | | 26,852 | | | | | 1.3 | |
Swiss franc | | | | 155,553 | | | | | 7.5 | |
U.S. dollar | | | | 1,349,332 | | | | | 65.1 | |
| | | | | | | | | | |
Total investments | | | $ | 2,072,308 | | | | | 100.0 | % |
| | | | | | | | | | |
| | | | | | | | | | | | | | | | | | | | | | | | |
| FOREIGN CURRENCY FORWARD CONTRACTS - September 30, 2016 | |
Dollar values in thousands | |
Counterparty | | Contract
Settlement
Date | | Contract Amount | | Unrealized
Appreciation/
(Depreciation) |
| | | Deliver | | Receive | |
| State Street Bank and Trust Company | | 11/17/2016 | | CNH | | | | 342,057 | | | | | USD | | | | | 51,569 | | | | $ | 436 | |
| State Street Bank and Trust Company | | 11/17/2016 | | USD | | | | 10,204 | | | | | CNH | | | | | 68,378 | | | | | 17 | |
| State Street Bank and Trust Company | | 11/17/2016 | | CNH | | | | 42,889 | | | | | USD | | | | | 6,385 | | | | | (27 | ) |
| | | | | | | | | | | | | | | | | | | | | | | | |
| | | | | | | | | | | | | | | | | | | | | | $ | 426 | |
| | | | | | | | | | | | | | | | | | | | | | | | |
CNH - Chinese yuan renminbi offshore
USD- U.S. dollar
| | | | | | | |
| TOP TEN HOLDINGS - September 30, 2016 | |
Company Name | | Country | | Percentage
of Total
Net Assets |
Oracle Corp. | | United States | | | | 4.4 | % |
Samsung Electronics Co., Ltd. | | Korea | | | | 4.3 | |
Arch Capital Group Ltd. | | United States | | | | 3.8 | |
Bank of New York Mellon Corp. | | United States | | | | 3.7 | |
QUALCOMM, Inc. | | United States | | | | 3.6 | |
Medtronic plc | | United States | | | | 3.6 | |
Microsoft Corp. | | United States | | | | 3.5 | |
ABB Ltd. | | Switzerland | | | | 3.4 | |
Citigroup, Inc. | | United States | | | | 3.4 | |
Marsh & McLennan Cos., Inc. | | United States | | | | 3.2 | |
| | | | | | | |
Total | | | | | | 36.9 | % |
| | | | | | | |
For the purpose of determining the Fund’s top ten holdings, securities of the same issuer are aggregated to determine the weight in the Fund.
The accompanying notes are an integral part of the financial statements.
| | |
| Artisan Partners Funds | | 43 |
ARTISAN HIGH INCOME FUND
Schedule of Investments – September 30, 2016
Dollar values in thousands
| | | | | | | | | | |
| | | Principal
Amount | | Value |
| CORPORATE BONDS - 70.8% | | | | | | | | | | |
| | | | | | | | | | |
| AGRICULTURE - 0.7% | | | | | | | | | | |
Pinnacle Operating Corp., 9.00%, 11/15/2020(1) | | | $ | 17,859 | | | | $ | 12,412 | |
| | | | | | | | | | |
| AUTO PARTS & EQUIPMENT - 0.6% | | | | | | | | | | |
Allison Transmission, Inc., 5.00%, 10/1/2024(1) | | | | 10,000 | | | | | 10,229 | |
| | | | | | | | | | |
| BUILDING MATERIALS - 1.6% | | | | | | | | | | |
Ply Gem Industries, Inc.,
6.50%, 2/1/2022 | | | | 23,165 | | | | | 23,860 | |
6.50%, 2/1/2022 | | | | 4,000 | | | | | 4,060 | |
| | | | | | | | | | |
| | | | | | | | | 27,920 | |
| CHEMICALS - 3.1% | | | | | | | | | | |
A Schulman, Inc.,
6.88%, 6/1/2023(1) | | | | 15,500 | | | | | 15,655 | |
GCP Applied Technologies, Inc.,
9.50%, 2/1/2023(1) | | | | 8,750 | | | | | 9,953 | |
Momentive Performance Materials, Inc., escrow,
10.00%, 10/15/2020(2)(3)(4) | | | | 2,000 | | | | | – | |
Platform Specialty Products Corp.,
6.50%, 2/1/2022(1) | | | | 29,600 | | | | | 28,786 | |
10.38%, 5/1/2021(1) | | | | 1,000 | | | | | 1,080 | |
| | | | | | | | | | |
| | | | | | | | | 55,474 | |
| COMPUTERS - 0.3% | | | | | | | | | | |
Diamond 1 Finance Corp. / Diamond 2 Finance Corp.,
5.88%, 6/15/2021(1) | | | | 2,500 | | | | | 2,656 | |
7.13%, 6/15/2024(1) | | | | 2,500 | | | | | 2,750 | |
| | | | | | | | | | |
| | | | | | | | | 5,406 | |
| DIVERSIFIED FINANCIAL SERVICES - 5.3% | | | | | | | | | | |
Alliance Data Systems Corp.,
5.38%, 8/1/2022(1) | | | | 3,328 | | | | | 3,245 | |
6.38%, 4/1/2020(1) | | | | 14,306 | | | | | 14,574 | |
Double Eagle Acquisition Sub, Inc.,
7.50%, 10/1/2024(1)(5) | | | | 2,000 | | | | | 2,035 | |
Infinity Acquisition LLC / Infinity Acquisition Finance Corp.,
7.25%, 8/1/2022(1) | | | | 34,880 | | | | | 30,346 | |
NFP Corp.,
9.00%, 7/15/2021(1) | | | | 34,740 | | | | | 35,691 | |
Quicken Loans, Inc.,
5.75%, 5/1/2025(1) | | | | 10,000 | | | | | 9,925 | |
| | | | | | | | | | |
| | | | | | | | | 95,816 | |
| ENTERTAINMENT - 1.5% | | | | | | | | | | |
Scientific Games International, Inc.,
6.25%, 9/1/2020 | | | | 4,500 | | | | | 3,465 | |
10.00%, 12/1/2022 | | | | 25,000 | | | | | 23,125 | |
| | | | | | | | | | |
| | | | | | | | | 26,590 | |
| FOOD - 0.7% | | | | | | | | | | |
US Foods, Inc.,
5.88%, 6/15/2024(1) | | | | 12,000 | | | | | 12,480 | |
| | | | | | | | | | |
| HEALTHCARE-SERVICES - 3.7% | | | | | | | | | | |
CHS/Community Health Systems, Inc.,
6.88%, 2/1/2022 | | | | 5,000 | | | | | 4,300 | |
HCA, Inc.,
5.38%, 2/1/2025 | | | | 17,000 | | | | | 17,553 | |
Opal Acquisition, Inc.,
8.88%, 12/15/2021(1) | | | | 55,315 | | | | | 45,358 | |
| | | | | | | | | | |
| | | | | | | | | 67,211 | |
| INSURANCE - 10.9% | | | | | | | | | | |
Hub Holdings LLC / Hub Holdings Finance, Inc., PIK,
8.13%, 7/15/2019(1) | | | | 24,142 | | | | | 23,538 | |
HUB International Ltd.,
7.88%, 10/1/2021(1) | | | | 26,484 | | | | | 27,014 | |
USI, Inc.,
7.75%, 1/15/2021(1) | | | | 101,242 | | | | | 102,760 | |
Wayne Merger Sub LLC,
8.25%, 8/1/2023(1) | | | | 11,250 | | | | | 11,433 | |
York Risk Services Holding Corp.,
8.50%, 10/1/2022(1) | | | | 38,850 | | | | | 30,206 | |
| | | | | | | | | | |
| | | | | | | | | 194,951 | |
| MACHINERY-DIVERSIFIED - 5.1% | | | | | | | | | | |
Cloud Crane LLC,
10.13%, 8/1/2024(1) | | | | 35,000 | | | | | 36,313 | |
Gardner Denver, Inc.,
6.88%, 8/15/2021(1) | | | | 48,876 | | | | | 45,821 | |
SPX FLOW, Inc.,
5.63%, 8/15/2024(1) | | | | 5,000 | | | | | 5,075 | |
5.88%, 8/15/2026(1) | | | | 5,000 | | | | | 5,081 | |
| | | | | | | | | | |
| | | | | | | | | 92,290 | |
| MEDIA - 4.7% | | | | | | | | | | |
Altice Financing S.A.,
6.63%, 2/15/2023(1)(6) | | | | 1,000 | | | | | 1,026 | |
Altice Finco S.A.,
7.63%, 2/15/2025(1)(6) | | | | 4,040 | | | | | 4,060 | |
Cablevision Systems Corp.,
5.88%, 9/15/2022 | | | | 5,000 | | | | | 4,550 | |
8.00%, 4/15/2020 | | | | 17,767 | | | | | 18,611 | |
CCO Holdings LLC / CCO Holdings Capital Corp.,
5.13%, 5/1/2023(1) | | | | 2,500 | | | | | 2,609 | |
5.50%, 5/1/2026(1) | | | | 5,000 | | | | | 5,238 | |
| | |
| 44 | | Artisan Partners Funds |
| | | | | | | | | | |
| | | Principal
Amount | | Value |
| MEDIA (CONTINUED) | | | | | | | | | | |
5.88%, 4/1/2024(1) | | | $ | 5,000 | | | | $ | 5,335 | |
Cequel Communications Holdings I LLC / Cequel Capital Corp.,
7.75%, 7/15/2025(1) | | | | 2,000 | | | | | 2,160 | |
CSC Holdings LLC,
5.50%, 4/15/2027(1) | | | | 10,000 | | | | | 10,225 | |
10.13%, 1/15/2023(1) | | | | 7,000 | | | | | 8,076 | |
Virgin Media Secured Finance plc,
5.25%, 1/15/2026(1)(6) | | | | 14,000 | | | | | 14,210 | |
5.50%, 8/15/2026(1)(6) | | | | 8,000 | | | | | 8,160 | |
| | | | | | | | | | |
| | | | | | | | | 84,260 | |
| MISCELLANEOUS MANUFACTURING - 0.7% | | | | | | |
Gates Global LLC / Gates Global Co., 6.00%, 7/15/2022(1) | | | | 13,000 | | | | | 12,350 | |
| | | | | | | | | | |
| OIL & GAS - 9.3% | | | | | | | | | | |
Callon Petroleum Co.,
6.13%, 10/1/2024(1)(5) | | | | 28,500 | | | | | 29,497 | |
Clayton Williams Energy, Inc.,
7.75%, 4/1/2019 | | | | 14,399 | | | | | 14,075 | |
Endeavor Energy Resources L.P. / EER Finance, Inc.,
7.00%, 8/15/2021(1) | | | | 28,387 | | | | | 29,168 | |
8.13%, 9/15/2023(1) | | | | 20,000 | | | | | 21,300 | |
Extraction Oil & Gas Holdings LLC / Extraction Finance Corp.,
7.88%, 7/15/2021(1) | | | | 2,000 | | | | | 2,075 | |
Laredo Petroleum, Inc.,
5.63%, 1/15/2022 | | | | 13,862 | | | | | 13,446 | |
7.38%, 5/1/2022 | | | | 8,223 | | | | | 8,501 | |
Midstates Petroleum Co., Inc. / Midstates Petroleum Co. LLC,
10.00%, 6/1/2020(7) | | | | 13,300 | | | | | 8,911 | |
Seven Generations Energy Ltd.,
6.75%, 5/1/2023(1)(6) | | | | 26,670 | | | | | 27,670 | |
6.88%, 6/30/2023(1)(6) | | | | 1,775 | | | | | 1,842 | |
Whiting Petroleum Corp.,
5.00%, 3/15/2019 | | | | 10,000 | | | | | 9,675 | |
| | | | | | | | | | |
| | | | | | | | | 166,160 | |
| PIPELINES - 6.2% | | | | | | | | | | |
Antero Midstream Partners L.P. / Antero Midstream Finance Corp.,
5.38%, 9/15/2024(1) | | | | 4,000 | | | | | 4,050 | |
Kinder Morgan Energy Partners L.P.,
4.25%, 9/1/2024 | | | | 22,724 | | | | | 23,401 | |
Williams Partners L.P. / ACMP Finance Corp.,
4.88%, 5/15/2023 | | | | 59,029 | | | | | 59,734 | |
4.88%, 3/15/2024 | | | | 22,886 | | | | | 23,140 | |
| | | | | | | | | | |
| | | | | | | | | 110,325 | |
| REAL ESTATE INVESTMENT TRUSTS (REITS) - 3.9% | | | | | | | | | | |
Vereit Operating Partnership L.P.,
4.13%, 6/1/2021 | | | | 2,500 | | | | | 2,581 | |
4.60%, 2/6/2024 | | | | 56,393 | | | | | 58,649 | |
4.88%, 6/1/2026 | | | | 8,600 | | | | | 9,094 | |
| | | | | | | | | | |
| | | | | | | | | 70,324 | |
| RETAIL - 2.4% | | | | | | | | | | |
Chinos Intermediate Holdings A, Inc., PIK,
7.75%, 5/1/2019(1) | | | | 5,648 | | | | | 2,118 | |
Group 1 Automotive, Inc.,
5.00%, 6/1/2022 | | | | 21,160 | | | | | 21,266 | |
5.25%, 12/15/2023(1) | | | | 2,553 | | | | | 2,562 | |
Penske Automotive Group, Inc.,
5.50%, 5/15/2026 | | | | 16,500 | | | | | 16,459 | |
| | | | | | | | | | |
| | | | | | | | | 42,405 | |
| SEMICONDUCTORS - 0.6% | | | | | | | | | | |
Microsemi Corp.,
9.13%, 4/15/2023(1) | | | | 9,000 | | | | | 10,260 | |
| | | | | | | | | | |
| SOFTWARE - 6.4% | | | | | | | | | | |
First Data Corp.,
5.75%, 1/15/2024(1) | | | | 21,000 | | | | | 21,577 | |
7.00%, 12/1/2023(1) | | | | 26,500 | | | | | 28,024 | |
Infor Software Parent LLC / Infor Software Parent, Inc., PIK,
7.13%, 5/1/2021(1) | | | | 18,500 | | | | | 17,945 | |
Infor US, Inc.,
6.50%, 5/15/2022 | | | | 4,000 | | | | | 4,050 | |
Informatica LLC,
7.13%, 7/15/2023(1) | | | | 28,790 | | | | | 26,775 | |
JDA Escrow LLC / JDA Bond Finance, Inc.,
7.38%, 10/15/2024(1)(5) | | | | 1,000 | | | | | 1,027 | |
Solera LLC / Solera Finance Inc.,
10.50%, 3/1/2024(1) | | | | 12,989 | | | | | 14,483 | |
| | | | | | | | | | |
| | | | | | | | | 113,881 | |
| TELECOMMUNICATIONS - 3.1% | | | | | | | | | | |
CenturyLink, Inc.,
6.45%, 6/15/2021 | | | | 12,000 | | | | | 12,855 | |
Intelsat Jackson Holdings S.A.,
8.00%, 2/15/2024(1)(6) | | | | 18,000 | | | | | 18,045 | |
T-Mobile USA, Inc.,
6.00%, 4/15/2024 | | | | 7,000 | | | | | 7,490 | |
6.13%, 1/15/2022 | | | | 8,000 | | | | | 8,500 | |
6.38%, 3/1/2025 | | | | 4,500 | | | | | 4,894 | |
6.50%, 1/15/2024 | | | | 4,000 | | | | | 4,327 | |
| | | | | | | | | | |
| | | | | | | | | 56,111 | |
Total Corporate Bonds
(Cost $1,230,807) | | | | | | | | | 1,266,855 | |
| | | | | | | | | | |
| BANK LOANS - 21.4%(8) | | | | | | | | | | |
| | | | | | | | | | |
| AEROSPACE/DEFENSE - 1.1% | | | | | | | | | | |
Jazz Acquisition, Inc. First Lien Term Loan,
4.50%, 6/19/2021 | | | | 14,731 | | | | | 13,589 | |
Jazz Acquisition, Inc. Second Lien Term Loan,
7.75%, 6/19/2022 | | | | 7,000 | | | | | 5,740 | |
| | | | | | | | | | |
| | | | | | | | | 19,329 | |
| AGRICULTURE - 0.5% | | | | | | | | | | |
Pinnacle Operating Corp. First Lien Term Loan B,
4.75%, 11/15/2018(2) | | | | 9,019 | | | | | 8,207 | |
| | | | | | | | | | |
| | |
| Artisan Partners Funds | | 45 |
| | | | | | | | | | |
| | | Principal
Amount | | Value |
| AUTO PARTS & EQUIPMENT - 0.3% | | | | | | | | | | |
BBB Industries US Holdings, Inc. Second Lien Term Loan B,
9.75%, 11/3/2022(2) | | | $ | 6,500 | | | | $ | 5,964 | |
| | | | | | | | | | |
| CHEMICALS - 0.4% | | | | | | | | | | |
MacDermid, Inc. First Lien Term Loan B2,
5.50%, 6/7/2020 | | | | 2,977 | | | | | 2,988 | |
MacDermid, Inc. First Lien Term Loan B3,
5.50%, 6/7/2020 | | | | 4,975 | | | | | 4,994 | |
| | | | | | | | | | |
| | | | | | | | | 7,982 | |
| COMMERCIAL SERVICES - 0.4% | | | | | | | | | | |
CHG Healthcare Services, Inc. First Lien Term Loan B,
4.75%, 6/7/2023 | | | | 1,990 | | | | | 2,008 | |
TruGreen L.P. First Lien Term Loan B,
6.50%, 4/13/2023 | | | | 5,985 | | | | | 6,022 | |
| | | | | | | | | | |
| | | | | | | | | 8,030 | |
DIVERSIFIED FINANCIAL
SERVICES - 0.5% | | | | | | | | | | |
LBM Borrower LLC Second Lien Term Loan,
10.25%, 8/20/2023 | | | | 10,000 | | | | | 9,508 | |
| | | | | | | | | | |
| FOOD - 0.3% | | | | | | | | | | |
Chobani LLC First Lien Term Loan B,
5.25%, 10/7/2023(4) | | | | 5,000 | | | | | 5,000 | |
| | | | | | | | | | |
| HEALTHCARE-PRODUCTS - 0.3% | | | | | | | | | | |
Immucor, Inc. First Lien Term Loan B2,
5.00%, 8/17/2018 | | | | 4,961 | | | | | 4,829 | |
| | | | | | | | | | |
| HEALTHCARE-SERVICES - 1.0% | | | | | | | | | | |
inVentiv Health, Inc. First Lien Term Loan B,
4.75%, 9/29/2023 | | | | 5,000 | | | | | 5,011 | |
Opal Acquisition, Inc. First Lien Term Loan B,
5.00%, 11/27/2020 | | | | 13,689 | | | | | 12,782 | |
| | | | | | | | | | |
| | | | | | | | | 17,793 | |
| INSURANCE - 2.6% | | | | | | | | | | |
AssuredPartners, Inc. First Lien Term Loan,
5.75%, 10/21/2022 | | | | 14,932 | | | | | 14,993 | |
AssuredPartners, Inc. Second Lien Term
Loan,
10.00%, 10/20/2023 | | | | 13,000 | | | | | 12,821 | |
York Risk Services Holding Corp. First Lien Term Loan B,
4.75%, 10/1/2021 | | | | 21,340 | | | | | 19,500 | |
| | | | | | | | | | |
| | | | | | | | | 47,314 | |
| INTERNET - 3.0% | |
iParadigms Holdings LLC Second Lien Term Loan,
8.25%, 7/29/2022(2) | | | | 8,768 | | | | | 8,570 | |
The Active Network, Inc. Second Lien Term Loan,
9.50%, 11/15/2021 | | | | 45,217 | | | | | 44,426 | |
| | | | | | | | | | |
| | | | | | | | | 52,996 | |
| INVESTMENT COMPANIES - 0.8% | |
UFC Holdings LLC First Lien Term Loan B,
5.00%, 8/18/2023 | | | | 10,000 | | | | | 10,081 | |
UFC Holdings LLC Second Lien Term Loan,
8.50%, 8/18/2024 | | | | 5,000 | | | | | 5,063 | |
| | | | | | | | | | |
| | | | | | | | | 15,144 | |
| LODGING - 0.3% | |
Station Casinos LLC First Lien Term Loan B,
3.75%, 6/8/2023 | | | | 5,985 | | | | | 6,023 | |
| | | | | | | | | | |
| MACHINERY-DIVERSIFIED - 0.7% | |
Gardner Denver, Inc. First Lien Term Loan,
4.25%, 7/30/2020 | | | | 12,870 | | | | | 12,451 | |
| | | | | | | | | | |
| METAL FABRICATE/HARDWARE - 0.6% | |
WireCo WorldGroup, Inc. First Lien Term Loan,
6.50%, 9/30/2023 | | | | 10,000 | | | | | 10,029 | |
| | | | | | | | | | |
| OIL & GAS - 2.3% | |
Callon Petroleum Co. Second Lien Term Loan B,
8.50%, 10/8/2021 | | | | 35,500 | | | | | 35,840 | |
Chesapeake Energy Corp. First Lien Term Loan,
8.50%, 8/23/2021 | | | | 5,000 | | | | | 5,245 | |
| | | | | | | | | | |
| | | | | | | | | 41,085 | |
| OIL & GAS SERVICES - 0.4% | |
Cactus Wellhead LLC First Lien Term Loan B,
7.00%, 7/31/2020 | | | | 7,828 | | | | | 6,008 | |
RGL Reservoir Operations, Inc. First Lien Term Loan,
6.00%, 8/14/2021(2)(6) | | | | 8,820 | | | | | 1,764 | |
| | | | | | | | | | |
| | | | | | | | | 7,772 | |
| RETAIL - 1.7% | |
99 Cents Only Stores LLC First Lien Term Loan B2,
4.50%, 1/11/2019 | | | | 6,500 | | | | | 5,022 | |
J. Crew Group, Inc. First Lien Term Loan B,
4.00%, 3/5/2021 | | | | 30,977 | | | | | 24,518 | |
| | | | | | | | | | |
| | | | | | | | | 29,540 | |
| SOFTWARE - 3.7% | |
Ascend Learning LLC Second Lien Term Loan,
9.50%, 11/30/2020 | | | | 15,642 | | | | | 15,407 | |
Cvent, Inc. First Lien Term Loan B,
6.00%, 6/17/2023 | | | | 8,500 | | | | | 8,543 | |
Renaissance Learning, Inc. Second Lien Term Loan,
8.00%, 4/11/2022 | | | | 43,035 | | | | | 42,102 | |
| | | | | | | | | | |
| | | | | | | | | 66,052 | |
| TELECOMMUNICATIONS - 0.5% | |
Intelsat Jackson Holdings S.A. First Lien Term Loan B2,
3.75%, 6/30/2019(6) | | | | 9,000 | | | | | 8,548 | |
| | | | | | | | | | |
Total Bank Loans
(Cost $385,076) | | | | | | | | | 383,596 | |
| | |
| 46 | | Artisan Partners Funds |
| | | | | | | | | | |
| | | Principal
Amount | | Value |
| CONVERTIBLE DEBENTURES - 0.3% | |
| | | | | | | | | | |
| REAL ESTATE INVESTMENT TRUSTS (REITS) - 0.3% | | | | | | | | | | |
VEREIT, Inc., 3.75%, 12/15/2020 | | | $ | 5,000 | | | | $ | 5,106 | |
| | | | | | | | | | |
Total convertible debentures
(Cost $4,696) | | | | | | | | | 5,106 | |
| | | | | | | | | | |
SHORT-TERM INVESTMENTS
(CASH EQUIVALENTS) - 10.3% | |
Repurchase agreement with Fixed Income Clearing Corporation, 0.03%, dated 9/30/16, due 10/3/16, maturity value $183,716
(Cost $183,716)(9) | | | | 183,716 | | | | | 183,716 | |
| | | | | | | | | | |
| | | | | | | | | | |
Total investments - 102.8%
(Cost $1,804,295) | | | | | | | | | 1,839,273 | |
| | | | | | | | | | |
Other assets less liabilities - (2.8)% | | | | | (50,272 | ) |
| | | | | | | | | | |
| | | | | | | | | | |
Total net assets - 100.0%(10) | | | | $ | 1,789,001 | |
| | | | | | | | | | |
| (1) | Security exempt from registration pursuant to Rule 144A under the Securities Act of 1933. These securities are considered liquid under procedures established by the board of directors of Artisan Partners Funds and may be resold in transactions exempt from registration, normally to qualified institutional buyers. |
| (2) | Security has been deemed illiquid under procedures established by the board of directors of Artisan Partners Funds. In total, the value of securities deemed illiquid was $24,505, or 1.4% of total net assets. |
| (3) | Represents escrow account for past due interest. |
| (4) | Valued at a fair value in accordance with procedures established by the board of directors of Artisan Partners Funds. In total, securities valued at a fair value were $5,000, or 0.3% of total net assets. See notes 2(a) and 4 in Notes to Financial Statements for additional information. |
| (5) | When-Issued security. |
| (6) | The Fund considers the company to be from outside of the United States. See the Fund’s Statement of Additional Information for a description of the methodology used for country classifications. |
| | | | | | | | | | |
Security | | Country | | Trading Currency |
Altice Financing S.A.,
6.63%, 2/15/2023 | | Luxembourg | | U.S. dollar |
Altice Finco S.A.,
7.63%, 2/15/2025 | | Luxembourg | | U.S. dollar |
Intelsat Jackson Holdings S.A.,
8.00%, 2/15/2024 | | Luxembourg | | U.S. dollar |
Intelsat Jackson Holdings S.A. First Lien Term Loan B2,
3.75%, 6/30/2019 | | Luxembourg | | U.S. dollar |
RGL Reservoir Operations, Inc.,
6.00%, 8/14/2021 | | Canada | | U.S. dollar |
Seven Generations Energy Ltd.
6.75%, 5/1/2023 | | Canada | | U.S. dollar |
6.88%, 6/30/2023 | | Canada | | U.S. dollar |
Virgin Media Secured Finance plc
5.25%, 1/15/2026 | | United Kingdom | | U.S. dollar |
5.50%, 8/15/2026 | | United Kingdom | | U.S. dollar |
| (7) | Non-income producing security, bond is in default. |
| (8) | Floating rate instruments, the rate disclosed was as of September 30, 2016. |
| | | | | | | | | | | | | | | |
Security | | Rate | | Maturity | | Value |
U.S. Treasury Note | | | | 0.125 | % | | | | 4/15/2017 | | | | $ | 185,252 | |
U.S. Treasury Bond | | | | 3.000 | % | | | | 11/15/2044 | | | | | 2,144 | |
| | | | | | | | | | | | | | | |
| | | | | | | | | | | | | $ | 187,396 | |
| | | | | | | | | | | | | | | |
| (10) | Percentages for the various classifications relate to total net assets. |
Company names are as reported by a data service provider and in some cases are translations; a company’s legal name may be different.
(PIK) Payment-in-kind security, may pay interest/dividend in additional par/shares.
| | | | | |
| CREDIT DIVERSIFICATION - September 30, 2016 (Unaudited) | |
| | | Percentage
of Total
Investments |
BBB | | | | 9.6 | % |
BB | | | | 10.7 | |
B | | | | 36.4 | |
CCC | | | | 29.7 | |
Unrated | | | | 3.6 | |
Short Term | | | | 10.0 | |
| | | | | |
Total | | | | 100.0 | % |
| | | | | |
Credit quality ratings apply to the underlying holdings of the Fund and not the Fund itself. The credit quality ratings shown above reflect the highest rating assigned by either Standard & Poor’s or Moody’s Investor Services (shown using the rating scale of Standard & Poor’s). Investments designated as unrated are not rated by either rating agency. Credit quality ratings are subjective opinions, not statements of fact, and are subject to change.
High yield securities are speculative, have a higher degree of default risk than higher-rated securities and may increase the Fund’s volatility. The Fund may invest a significant portion of its assets in high-yield securities that are rated in the lower rating categories by one or more nationally recognized statistical rating organization (for example, CCC or lower by Standard & Poor’s or Fitch Ratings Inc. or Caa or lower by Moody’s) or, if unrated, are determined by the Adviser to be of comparable quality.
| | |
| Artisan Partners Funds | | 47 |
| | | | | | | |
| TOP TEN HOLDINGS - September 30, 2016 | |
Company Name | | Country | | Percentage
of Total
Net Assets |
USI, Inc. | | United States | | | | 5.7 | % |
Williams Partners L.P. / ACMP Finance Corp. | | United States | | | | 4.6 | |
Vereit Operating Partnership L.P. | | United States | | | | 4.2 | |
Callon Petroleum Co. | | United States | | | | 3.7 | |
Gardner Denver, Inc. | | United States | | | | 3.3 | |
Opal Acquisition, Inc. | | United States | | | | 3.3 | |
HUB Holding LLC | | United States | | | | 2.8 | |
Endeavor Energy Resources L.P. / EER Finance, Inc. | | United States | | | | 2.8 | |
York Risk Services Holding Corp. | | United States | | | | 2.8 | |
First Data Corp. | | United States | | | | 2.8 | |
| | | | | | | |
Total | | | | | | 36.0 | % |
| | | | | | | |
For the purpose of determining the Fund’s top ten holdings, securities of the same issuer are aggregated to determine the weight in the Fund.
The accompanying notes are an integral part of the financial statements.
| | |
| 48 | | Artisan Partners Funds |
ARTISAN INTERNATIONAL FUND
Schedule of Investments – September 30, 2016
Dollar values in thousands
| | | | | | | | | | |
| | | Shares
Held | | Value |
| COMMON STOCKS AND EQUITY-LINKED SECURITIES - 96.5% | | | | | | | | | | |
| | | | | | | | | | |
| BELGIUM - 1.5% | | | | | | | | | | |
Telenet Group Holding N.V.(1)(2) | | | | 2,814,194 | | | | $ | 146,780 | |
UCB S.A.(2) | | | | 1,230,970 | | | | | 95,179 | |
| | | | | | | | | | |
| | | | | | | | | 241,959 | |
| CANADA - 3.0% | | | | | | | | | | |
Canadian Pacific Railway Ltd. | | | | 2,391,439 | | | | | 365,173 | |
Rogers Communications, Inc.(3) | | | | 2,826,231 | | | | | 119,904 | |
| | | | | | | | | | |
| | | | | | | | | 485,077 | |
| CHINA - 4.6% | | | | | | | | | | |
Alibaba Group Holding Ltd. (DR)(1) | | | | 3,983,510 | | | | | 421,416 | |
China Construction Bank Corp., Class H(2) | | | | 58,311,215 | | | | | 43,522 | |
China Mobile Ltd.(2) | | | | 17,347,000 | | | | | 212,984 | |
Ctrip.com International Ltd. (DR)(1) | | | | 1,244,823 | | | | | 57,971 | |
| | | | | | | | | | |
| | | | | | | | | 735,893 | |
| DENMARK - 0.5% | | | | | | | | | | |
ISS AS(2) | | | | 1,911,145 | | | | | 79,512 | |
| | | | | | | | | | |
| FRANCE - 6.7% | | | | | | | | | | |
Danone S.A.(2) | | | | 4,664,268 | | | | | 345,960 | |
L’Oreal S.A.(2) | | | | 603,247 | | | | | 113,890 | |
LVMH Moet Hennessy Louis Vuitton SE(2) | | | | 475,507 | | | | | 81,063 | |
Pernod Ricard S.A.(2) | | | | 1,554,430 | | | | | 183,915 | |
Zodiac Aerospace(2) | | | | 13,973,789 | | | | | 340,242 | |
| | | | | | | | | | |
| | | | | | | | | 1,065,070 | |
| GERMANY - 17.5% | | | | | | | | | | |
Allianz SE(2) | | | | 2,074,903 | | | | | 307,983 | |
Bayer AG(2) | | | | 1,574,627 | | | | | 158,162 | |
Beiersdorf AG(2) | | | | 3,234,138 | | | | | 305,049 | |
Deutsche Boerse AG(1)(2) | | | | 7,313,413 | | | | | 592,181 | |
Deutsche Post AG(2) | | | | 5,155,487 | | | | | 161,118 | |
Linde AG(2) | | | | 3,810,469 | | | | | 647,570 | |
RTL Group S.A.(2) | | | | 659,958 | | | | | 54,768 | |
Vonovia SE(2) | | | | 6,632,932 | | | | | 251,162 | |
Wirecard AG(2)(4) | | | | 6,298,195 | | | | | 327,136 | |
| | | | | | | | | | |
| | | | | | | | | 2,805,129 | |
| HONG KONG - 3.7% | | | | | | | | | | |
AIA Group Ltd.(2) | | | | 88,205,332 | | | | | 590,985 | |
| | | | | | | | | | |
| INDONESIA - 0.1% | | | | | | | | | | |
Bank Rakyat Indonesia Persero Tbk PT(2) | | | | 24,614,000 | | | | | 23,093 | |
| | | | | | | | | | |
| IRELAND - 1.9% | | | | | | | | | | |
Ryanair Holdings plc, Equity-Linked Security(2)(3)(5)(6) | | | | 21,488,591 | | | | | 296,918 | |
| | | | | | | | | | |
| ITALY - 1.0% | | | | | | | | | | |
Atlantia S.p.A.(2) | | | | 6,073,880 | | | | | 154,217 | |
| | | | | | | | | | |
| JAPAN - 12.9% | | | | | | | | | | |
Calbee, Inc.(2) | | | | 3,263,600 | | | | | 123,415 | |
Japan Tobacco, Inc.(2) | | | | 18,478,583 | | | | | 754,944 | |
KDDI Corp.(2) | | | | 10,223,400 | | | | | 314,600 | |
NGK Insulators Ltd.(2) | | | | 4,205,148 | | | | | 87,075 | |
Nippon Telegraph & Telephone Corp.(2) | | | | 6,565,800 | | | | | 299,863 | |
NTT DOCOMO, Inc.(2) | | | | 17,518,133 | | | | | 444,160 | |
Seven & i Holdings Co., Ltd.(2) | | | | 807,700 | | | | | 38,172 | |
| | | | | | | | | | |
| | | | | | | | | 2,062,229 | |
| KOREA - 0.0%† | | | | | | | | | | |
Orion Corp.(2) | | | | 2,079 | | | | | 1,562 | |
| | | | | | | | | | |
| NETHERLANDS - 0.9% | | | | | | | | | | |
ASML Holding N.V.(2) | | | | 961,182 | | | | | 105,402 | |
Heineken N.V.(2) | | | | 446,186 | | | | | 39,244 | |
| | | | | | | | | | |
| | | | | | | | | 144,646 | |
| SPAIN - 1.8% | | | | | | | | | | |
Grifols S.A.(2) | | | | 4,853,075 | | | | | 104,564 | |
Grifols S.A. (DR) | | | | 11,013,123 | | | | | 175,879 | |
| | | | | | | | | | |
| | | | | | | | | 280,443 | |
| SWEDEN - 1.1% | | | | | | | | | | |
Swedbank AB, Class A(2) | | | | 7,318,304 | | | | | 171,859 | |
| | | | | | | | | | |
| SWITZERLAND - 7.8% | | | | | | | | | | |
Actelion Ltd.(1)(2) | | | | 1,378,739 | | | | | 238,697 | |
Nestle S.A.(2) | | | | 10,302,080 | | | | | 811,738 | |
Roche Holding AG(2)(3) | | | | 766,285 | | | | | 189,837 | |
| | | | | | | | | | |
| | | | | | | | | 1,240,272 | |
| TAIWAN - 2.0% | | | | | | | | | | |
Taiwan Semiconductor Manufacturing Co., Ltd.(2) | | | | 53,446,000 | | | | | 313,448 | |
| | | | | | | | | | |
| THAILAND - 0.1% | | | | | | | | | | |
Thai Beverage PCL(2) | | | | 33,801,100 | | | | | 24,068 | |
| | | | | | | | | | |
| UNITED KINGDOM - 8.1% | | | | | | | | | | |
Babcock International Group plc(2) | | | | 7,736,730 | | | | | 103,799 | |
British American Tobacco plc(2) | | | | 4,207,544 | | | | | 269,082 | |
Imperial Brands plc(2) | | | | 5,006,004 | | | | | 258,038 | |
| | |
| Artisan Partners Funds | | 49 |
| | | | | | | | | | |
| | | Shares
Held | | Value |
| UNITED KINGDOM (CONTINUED) | | | | | | | | | | |
Lloyds Banking Group plc(2) | | | | 100,660,094 | | | | $ | 71,288 | |
St James’s Place plc(2) | | | | 1,257,476 | | | | | 15,483 | |
Unilever plc(2) | | | | 9,269,657 | | | | | 439,447 | |
Wolseley plc(2) | | | | 2,560,691 | | | | | 144,339 | |
| | | | | | | | | | |
| | | | | | | | | 1,301,476 | |
| UNITED STATES - 21.3% | | | | | | | | | | |
Allegion plc | | | | 243,012 | | | | | 16,746 | |
Amazon.com, Inc.(1) | | | | 238,410 | | | | | 199,623 | |
Aon plc | | | | 4,111,322 | | | | | 462,483 | |
Coca-Cola European Partners plc | | | | 8,117,942 | | | | | 323,906 | |
Cognizant Technology Solutions Corp., Class A(1) | | | | 4,950,350 | | | | | 236,181 | |
Delphi Automotive plc | | | | 2,100,648 | | | | | 149,818 | |
Liberty Global plc, Class A(1) | | | | 9,219,798 | | | | | 315,133 | |
Liberty Global plc, Series C(1)(3) | | | | 13,582,927 | | | | | 448,780 | |
Liberty Global plc LiLAC, Class A(1) | | | | 1,027,654 | | | | | 28,353 | |
Liberty Global plc LiLAC, Class C(1)(3) | | | | 1,566,946 | | | | | 43,953 | |
Medtronic plc | | | | 9,618,303 | | | | | 831,021 | |
WABCO Holdings, Inc.(1) | | | | 1,298,860 | | | | | 147,459 | |
Willis Towers Watson plc | | | | 1,535,279 | | | | | 203,839 | |
| | | | | | | | | | |
| | | | | | | | | 3,407,295 | |
| | | | | | | | | | |
Total common stocks and equity-linked securities
(Cost $13,659,335) | | | | | | | | | 15,425,151 | |
| | | | | | | | | | |
| PREFERRED STOCKS - 1.8% | |
| | | | | | | | | | |
| GERMANY - 1.8% | |
Henkel AG & Co. KGaA (2)(3) | | | | 2,084,548 | | | | | 283,343 | |
| | | | | | | | | | |
Total preferred stocks
(Cost $175,703) | | | | | | | | | 283,343 | |
| | |
| | | Principal
Amount | | |
SHORT-TERM INVESTMENTS
(CASH EQUIVALENTS) - 0.9% | | | | | | | | | | |
Repurchase agreement with Fixed Income Clearing Corporation, 0.03%, dated 9/30/16, due 10/3/16, maturity value $142,619
(Cost $142,619)(7) | | | $ | 142,619 | | | | $ | 142,619 | |
| | | | | | | | | | |
Total investments - 99.2%
(Cost $13,977,657) | | | | | | | | | 15,851,113 | |
| | | | | | | | | | |
Other assets less liabilities - 0.8% | | | | | 134,362 | |
| | | | | | | | | | |
| | | | | | | | | | |
Total net assets - 100.0%(8) | | | | | | | | $ | 15,985,475 | |
| | | | | | | | | | |
| † | Amount rounds to less than 0.1%. |
| (1) | Non-income producing security. |
| (2) | Valued at a fair value in accordance with procedures established by the board of directors of Artisan Partners Funds. In total, securities valued at a fair value were $11,160,856, or 69.8% of total net assets. See notes 2(a) and 4 in Notes to Financial Statements for additional information. |
| (4) | Affiliated company as defined by the Investment Company Act of 1940, as amended. See note 12 in Notes to Financial Statements for additional information. |
| (5) | Security is restricted. The security was acquired in a transaction pursuant to Rule 144A under the Securities Act of 1933, as amended, on the date or during the period noted below. The shares of the security may be resold in transactions exempt from registration to qualified institutional buyers. |
| | | | | | | | | | | | | | | | | | | | |
Security | | Acquisition
Date | | Cost | | Value | | Percentage
of Total
Net Assets |
Ryanair Holdings plc | | 11/14/2013-
7/1/2016 | | | $ | 236,342 | | | | $ | 296,918 | | | | | 1.9 | % |
| (6) | Security is an equity-linked security issued by HSBC Bank plc. As described in 2(h) in Notes to Financial Statements, equity-linked securities are subject to counterparty risk with respect to the bank or broker-dealer that issues them. |
| | | | | | | | | | | | | | | |
Security | | Rate | | Maturity | | Value |
U.S. Treasury Note | | | | 0.125 | % | | | | 4/15/2017 | | | | $ | 145,472 | |
| (8) | Percentages for the various classifications relate to total net assets. |
Company names are as reported by a data service provider and in some cases are translations; a company’s legal name may be different.
(DR) Depositary Receipt, voting rights may vary.
| | | | | | | | | | |
| PORTFOLIO DIVERSIFICATION - September 30, 2016 | |
Dollar values in thousands | |
| | | Value | | Percentage
of Total
Investments |
Consumer Discretionary | | | $ | 1,526,242 | | | | | 9.6 | % |
Consumer Staples | | | | 4,315,773 | | | | | 27.2 | |
Financials | | | | 2,482,716 | | | | | 15.7 | |
Health Care | | | | 1,793,339 | | | | | 11.3 | |
Industrials | | | | 1,896,598 | | | | | 12.0 | |
Information Technology | | | | 1,403,583 | | | | | 8.8 | |
Materials | | | | 647,570 | | | | | 4.1 | |
Real Estate | | | | 251,162 | | | | | 1.6 | |
Telecommunication Services | | | | 1,391,511 | | | | | 8.8 | |
Short-term investments | | | | 142,619 | | | | | 0.9 | |
| | | | | | | | | | |
Total investments | | | $ | 15,851,113 | | | | | 100.0 | % |
| | | | | | | | | | |
| | |
| 50 | | Artisan Partners Funds |
| | | | | | | | | | |
| TRADING CURRENCIES - September 30, 2016 | |
Dollar values in thousands | | | | | | |
| | | Value | | Percentage
of Total
Investments |
British pound | | | $ | 1,301,476 | | | | | 8.2 | % |
Canadian dollar | | | | 119,904 | | | | | 0.8 | |
Danish krone | | | | 79,512 | | | | | 0.5 | |
Euro | | | | 4,798,928 | | | | | 30.3 | |
Hong Kong dollar | | | | 847,491 | | | | | 5.3 | |
Indonesian rupiah | | | | 23,093 | | | | | 0.1 | |
Japanese yen | | | | 2,062,229 | | | | | 13.0 | |
Korean won | | | | 1,562 | | | | | – | (1) |
Singapore dollar | | | | 24,068 | | | | | 0.2 | |
Swedish krona | | | | 171,859 | | | | | 1.1 | |
Swiss franc | | | | 1,240,272 | | | | | 7.8 | |
Taiwan dollar | | | | 313,448 | | | | | 2.0 | |
U.S. dollar | | | | 4,867,271 | | | | | 30.7 | |
| | | | | | | | | | |
Total investments | | | $ | 15,851,113 | | | | | 100.0 | % |
| | | | | | | | | | |
| (1) | Represents less than 0.1% of total investments. |
| | | | | | | |
| TOP TEN HOLDINGS - September 30, 2016 | |
Company Name | | Country | | Percentage
of Total
Net Assets |
Liberty Global plc | | United States | | | | 5.2 | % |
Medtronic plc | | United States | | | | 5.2 | |
Nestle S.A. | | Switzerland | | | | 5.1 | |
Japan Tobacco, Inc. | | Japan | | | | 4.7 | |
Linde AG | | Germany | | | | 4.1 | |
Deutsche Boerse AG | | Germany | | | | 3.7 | |
AIA Group Ltd. | | Hong Kong | | | | 3.7 | |
Aon plc | | United States | | | | 2.9 | |
NTT DOCOMO, Inc. | | Japan | | | | 2.8 | |
Unilever plc | | United Kingdom | | | | 2.7 | |
| | | | | | | |
Total | | | | | | 40.1 | % |
| | | | | | | |
For the purpose of determining the Fund’s top ten holdings, securities of the same issuer are aggregated to determine the weight in the Fund.
The accompanying notes are an integral part of the financial statements.
| | |
| Artisan Partners Funds | | 51 |
ARTISAN INTERNATIONAL SMALL CAP FUND
Schedule of Investments – September 30, 2016
Dollar values in thousands
| | | | | | | | | | |
| | | Shares
Held | | Value |
| COMMON STOCKS - 97.2% | | | | | | | | | | |
| | | | | | | | | | |
| CANADA - 2.5% | | | | | | | | | | |
Manitoba Telecom Services, Inc. | | | | 607,163 | | | | $ | 17,447 | |
Morneau Shepell, Inc. | | | | 165,500 | | | | | 2,396 | |
| | | | | | | | | | |
| | | | | | | | | 19,843 | |
| DENMARK - 8.2% | | | | | | | | | | |
Royal Unibrew AS(1) | | | | 736,972 | | | | | 36,440 | |
Scandinavian Tobacco Group AS(1) | | | | 1,700,692 | | | | | 29,029 | |
| | | | | | | | | | |
| | | | | | | | | 65,469 | |
| FINLAND - 2.0% | | | | | | | | | | |
Huhtamaki Oyj(1) | | | | 331,869 | | | | | 15,456 | |
| | | | | | | | | | |
| FRANCE - 6.2% | | | | | | | | | | |
Bonduelle SCA(1) | | | | 453,221 | | | | | 11,557 | |
Elis S.A.(1) | | | | 1,588,812 | | | | | 26,228 | |
Euronext N.V.(1) | | | | 275,605 | | | | | 11,760 | |
| | | | | | | | | | |
| | | | | | | | | 49,545 | |
| GERMANY - 14.4% | | | | | | | | | | |
Gerresheimer AG(1) | | | | 245,959 | | | | | 20,900 | |
Takkt AG(1) | | | | 1,367,264 | | | | | 30,661 | |
Wirecard AG(1) | | | | 1,214,571 | | | | | 63,086 | |
| | | | | | | | | | |
| | | | | | | | | 114,647 | |
| INDONESIA - 0.2% | | | | | | | | | | |
Media Nusantara Citra Tbk PT(1) | | | | 12,467,000 | | | | | 1,930 | |
| | | | | | | | | | |
| ITALY - 11.8% | | | | | | | | | | |
Davide Campari-Milano S.p.A.(1) | | | | 1,402,445 | | | | | 15,800 | |
Ei Towers S.p.A.(1)(2) | | | | 403,088 | | | | | 21,249 | |
Enav S.p.A.(1)(2) | | | | 4,266,812 | | | | | 17,527 | |
Hera S.p.A.(1) | | | | 3,839,170 | | | | | 10,344 | |
Infrastrutture Wireless Italiane S.p.A.(1) | | | | 4,294,431 | | | | | 21,124 | |
RAI Way S.p.A.(1) | | | | 1,948,318 | | | | | 7,882 | |
| | | | | | | | | | |
| | | | | | | | | 93,926 | |
| JAPAN - 6.7% | | | | | | | | | | |
Cosmos Pharmaceutical Corp.(1) | | | | 90,857 | | | | | 19,491 | |
Dip Corp.(1) | | | | 129,600 | | | | | 4,009 | |
Sugi Holdings Co., Ltd.(1) | | | | 465,500 | | | | | 25,246 | |
Zenkoku Hosho Co., Ltd.(1) | | | | 107,125 | | | | | 4,429 | |
| | | | | | | | | | |
| | | | | | | | | 53,175 | |
| NETHERLANDS - 3.3% | | | | | | | | | | |
InterXion Holding N.V.(2) | | | | 717,075 | | | | | 25,972 | |
| | | | | | | | | | |
| SINGAPORE - 2.1% | | | | | | | | | | |
SATS Ltd.(1) | | | | 4,537,900 | | | | | 16,569 | |
| | | | | | | | | | |
| SOUTH AFRICA - 0.3% | | | | | | | | | | |
Pioneer Foods Group Ltd.(1) | | | | 175,559 | | | | | 2,227 | |
| | | | | | | | | | |
| SPAIN - 6.1% | |
Cellnex Telecom SAU(1) | | | | 1,269,883 | | | | | 22,969 | |
Ebro Foods S.A.(1) | | | | 919,006 | | | | | 21,370 | |
Euskaltel S.A.(1)(2) | | | | 303,030 | | | | | 3,009 | |
Melia Hotels International S.A.(1) | | | | 58,342 | | | | | 728 | |
| | | | | | | | | | |
| | | | | | | | | 48,076 | |
| SWEDEN - 4.3% | |
Cloetta AB, Class B(1) | | | | 9,331,704 | | | | | 33,829 | |
| | | | | | | | | | |
| SWITZERLAND - 4.2% | |
Comet Holding AG(1)(2) | | | | 36,167 | | | | | 33,058 | |
| | | | | | | | | | |
| TAIWAN - 4.4% | |
Ginko International Co., Ltd.(1) | | | | 3,545,000 | | | | | 35,243 | |
| | | | | | | | | | |
| UNITED KINGDOM - 20.5% | |
AA plc(1) | | | | 5,925,998 | | | | | 22,712 | |
Babcock International Group plc(1) | | | | 2,040,727 | | | | | 27,379 | |
BCA Marketplace plc(1) | | | | 3,908,867 | | | | | 9,120 | |
Berendsen plc(1) | | | | 910,582 | | | | | 14,693 | |
Britvic plc(1) | | | | 1,765,652 | | | | | 13,800 | |
Dignity plc(1) | | | | 820,519 | | | | | 29,802 | |
Domino’s Pizza Group plc(1) | | | | 1,791,314 | | | | | 8,667 | |
HomeServe plc(1) | | | | 2,854,780 | | | | | 21,267 | |
Safestore Holdings plc(1) | | | | 3,143,117 | | | | | 15,685 | |
| | | | | | | | | | |
| | | | | | | | | 163,125 | |
| | | | | | | | | | |
Total common stocks
(Cost $621,509) | | | | | | | | | 772,090 | |
| | |
| | | Principal
Amount | | |
SHORT-TERM INVESTMENTS
(CASH EQUIVALENTS) - 1.5% | | | | | | | | | | |
Repurchase agreement with Fixed Income Clearing Corporation, 0.03%, dated 9/30/16, due 10/3/16,
maturity value $12,429
(Cost $12,429)(3) | | | $ | 12,429 | | | | $ | 12,429 | |
| | | | | | | | | | |
Total investments - 98.7%
(Cost $633,938) | | | | | | | | | 784,519 | |
| | | | | | | | | | |
Other assets less liabilities - 1.3% | | | | | | | | | 10,017 | |
| | | | | | | | | | |
| | | | | | | | | | |
Total net assets - 100.0%(4) | | | | | | | | $ | 794,536 | |
| | | | | | | | | | |
| | |
| 52 | | Artisan Partners Funds |
| (1) | Valued at a fair value in accordance with procedures established by the board of directors of Artisan Partners Funds. In total, securities valued at a fair value were $726,275, or 91.4% of total net assets. See notes 2(a) and 4 in Notes to Financial Statements for additional information. |
| (2) | Non-income producing security. |
| | | | | | | | | | | | | | | |
Security | | Rate | | Maturity | | Value |
U.S. Treasury Note | | | | 0.125 | % | | | | 4/15/2017 | | | | $ | 12,681 | |
| (4) | Percentages for the various classifications relate to total net assets. |
Company names are as reported by a data service provider and in some cases are translations; a company’s legal name may be different.
| | | | | | | | | | |
| PORTFOLIO DIVERSIFICATION - September 30, 2016 | |
Dollar values in thousands | |
| | | Value | | Percentage
of Total
Investments |
Consumer Discretionary | | | $ | 111,502 | | | | | 14.2 | % |
Consumer Staples | | | | 208,789 | | | | | 26.6 | |
Financials | | | | 16,189 | | | | | 2.1 | |
Health Care | | | | 56,143 | | | | | 7.1 | |
Industrials | | | | 126,059 | | | | | 16.1 | |
Information Technology | | | | 126,125 | | | | | 16.1 | |
Materials | | | | 15,456 | | | | | 2.0 | |
Real Estate | | | | 15,685 | | | | | 2.0 | |
Telecommunication Services | | | | 85,798 | | | | | 10.9 | |
Utilities | | | | 10,344 | | | | | 1.3 | |
Short-term investments | | | | 12,429 | | | | | 1.6 | |
| | | | | | | | | | |
Total investments | | | $ | 784,519 | | | | | 100.0 | % |
| | | | | | | | | | |
TRADING CURRENCIES - September 30, 2016 | |
Dollar values in thousands | |
| | | Value | | Percentage
of Total
Investments |
British pound | | | $ | 163,125 | | | | | 20.8 | % |
Canadian dollar | | | | 19,843 | | | | | 2.5 | |
Danish krone | | | | 65,469 | | | | | 8.3 | |
Euro | | | | 321,650 | | | | | 41.0 | |
Indonesian rupiah | | | | 1,930 | | | | | 0.3 | |
Japanese yen | | | | 53,175 | | | | | 6.8 | |
Singapore dollar | | | | 16,569 | | | | | 2.1 | |
South African rand | | | | 2,227 | | | | | 0.3 | |
Swedish krona | | | | 33,829 | | | | | 4.3 | |
Swiss franc | | | | 33,058 | | | | | 4.2 | |
Taiwan dollar | | | | 35,243 | | | | | 4.5 | |
U.S. dollar | | | | 38,401 | | | | | 4.9 | |
| | | | | | | | | | |
Total investments | | | $ | 784,519 | | | | | 100.0 | % |
| | | | | | | | | | |
| | | | | | | |
| TOP TEN HOLDINGS - September 30, 2016 | |
Company Name | | Country | | Percentage
of Total
Net Assets |
Wirecard AG | | Germany | | | | 7.9 | % |
Royal Unibrew AS | | Denmark | | | | 4.6 | |
Ginko International Co., Ltd. | | Taiwan | | | | 4.4 | |
Cloetta AB | | Sweden | | | | 4.3 | |
Comet Holding AG | | Switzerland | | | | 4.2 | |
Takkt AG | | Germany | | | | 3.9 | |
Dignity plc | | United Kingdom | | | | 3.8 | |
Scandinavian Tobacco Group AS | | Denmark | | | | 3.6 | |
Babcock International Group plc | | United Kingdom | | | | 3.4 | |
Elis S.A. | | France | | | | 3.3 | |
| | | | | | | |
Total | | | | | | 43.4 | % |
| | | | | | | |
For the purpose of determining the Fund’s top ten holdings, securities of the same issuer are aggregated to determine the weight in the Fund.
The accompanying notes are an integral part of the financial statements.
| | |
| Artisan Partners Funds | | 53 |
ARTISAN INTERNATIONAL VALUE FUND
Schedule of Investments – September 30, 2016
Dollar values in thousands
| | | | | | | | | | |
| | | Shares
Held | | Value |
| COMMON STOCKS - 87.3% | | | | | | | | | | |
| | | | | | | | | | |
| BELGIUM - 2.5% | | | | | | | | | | |
Groupe Bruxelles Lambert S.A.(1) | | | | 3,448,708 | | | | $ | 305,744 | |
| | | | | | | | | | |
| BRAZIL - 3.0% | | | | | | | | | | |
Telefonica Brasil S.A. (DR) | | | | 25,145,140 | | | | | 363,850 | |
| | | | | | | | | | |
| CANADA - 1.7% | | | | | | | | | | |
Imperial Oil Ltd. | | | | 6,441,685 | | | | | 201,507 | |
| | | | | | | | | | |
| CHINA - 3.9% | | | | | | | | | | |
Baidu, Inc. (DR)(2) | | | | 2,599,412 | | | | | 473,275 | |
| | | | | | | | | | |
| DENMARK - 5.2% | | | | | | | | | | |
Carlsberg AS, Class B(1) | | | | 2,808,772 | | | | | 268,343 | |
ISS AS(1) | | | | 8,569,394 | | | | | 356,525 | |
| | | | | | | | | | |
| | | | | | | | | 624,868 | |
| FRANCE - 1.9% | | | | | | | | | | |
Sodexo S.A.(1) | | | | 906,726 | | | | | 107,920 | |
Vivendi S.A.(1) | | | | 5,682,949 | | | | | 114,517 | |
| | | | | | | | | | |
| | | | | | | | | 222,437 | |
| INDIA - 1.6% | | | | | | | | | | |
HCL Technologies Ltd.(1) | | | | 15,749,743 | | | | | 188,887 | |
| | | | | | | | | | |
| JAPAN - 5.0% | | | | | | | | | | |
Credit Saison Co., Ltd.(1) | | | | 3,917,547 | | | | | 64,980 | |
Stanley Electric Co., Ltd.(1)(3) | | | | 9,167,804 | | | | | 246,594 | |
Sugi Holdings Co., Ltd.(1) | | | | 86,800 | | | | | 4,708 | |
Tokyo Electron Ltd.(1) | | | | 3,291,835 | | | | | 290,491 | |
| | | | | | | | | | |
| | | | | | | | | 606,773 | |
| KOREA - 5.5% | | | | | | | | | | |
Kia Motors Corp.(1) | | | | 2,142,321 | | | | | 82,348 | |
Samsung Electronics Co., Ltd.(1) | | | | 394,480 | | | | | 574,934 | |
| | | | | | | | | | |
| | | | | | | | | 657,282 | |
| NETHERLANDS - 4.1% | | | | | | | | | | |
ING Groep N.V.(1) | | | | 34,521,902 | | | | | 425,554 | |
RELX N.V.(1) | | | | 3,925,931 | | | | | 70,498 | |
| | | | | | | | | | |
| | | | | | | | | 496,052 | |
| NORWAY - 1.9% | | | | | | | | | | |
Aker Solutions ASA(1)(2) | | | | 11,545,697 | | | | | 54,162 | |
Orkla ASA(1) | | | | 16,383,290 | | | | | 169,264 | |
TGS Nopec Geophysical Co. ASA(1) | | | | 562,673 | | | | | 10,167 | |
| | | | | | | | | | |
| | | | | | | | | 233,593 | |
| SWITZERLAND - 17.0% | | | | | | | | | | |
ABB Ltd.(1)(2) | | | | 22,120,530 | | | | | 496,683 | |
Adecco Group AG(1) | | | | 2,894,146 | | | | | 162,980 | |
Cie Financiere Richemont S.A.(1) | | | | 3,815,031 | | | | | 232,288 | |
Novartis AG(1) | | | | 3,046,447 | | | | | 239,577 | |
Panalpina Welttransport Holding AG(1)(3) | | | | 2,261,132 | | | | | 315,402 | |
Pargesa Holding S.A.(1) | | | | 1,265,602 | | | | | 86,627 | |
UBS Group AG(1) | | | | 38,426,353 | | | | | 521,779 | |
| | | | | | | | | | |
| | | | | | | | | 2,055,336 | |
| UNITED KINGDOM - 20.8% | | | | | | | | | | |
Amec Foster Wheeler plc(1) | | | | 16,058,095 | | | | | 119,586 | |
Compass Group plc(1) | | | | 29,638,619 | | | | | 574,766 | |
Diageo plc(1) | | | | 5,135,759 | | | | | 147,258 | |
IMI plc(1) | | | | 7,431,427 | | | | | 103,316 | |
Lloyds Banking Group plc(1) | | | | 290,422,430 | | | | | 205,680 | |
QinetiQ Group plc(1) | | | | 20,017,166 | | | | | 61,438 | |
RELX plc(1) | | | | 20,533,597 | | | | | 389,658 | |
Royal Bank of Scotland Group plc(1)(2) | | | | 147,992,960 | | | | | 343,668 | |
Tesco plc(1)(2) | | | | 135,124,818 | | | | | 320,206 | |
Unilever plc (DR) | | | | 2,443,679 | | | | | 115,830 | |
Vesuvius plc(1)(3) | | | | 28,706,714 | | | | | 130,704 | |
| | | | | | | | | | |
| | | | | | | | | 2,512,110 | |
| UNITED STATES - 13.2% | | | | | | | | | | |
Accenture plc, Class A | | | | 1,021,703 | | | | | 124,821 | |
Aon plc | | | | 1,939,584 | | | | | 218,184 | |
Arch Capital Group Ltd.(2)(3) | | | | 6,462,064 | | | | | 512,183 | |
Medtronic plc | | | | 4,816,785 | | | | | 416,170 | |
TE Connectivity Ltd. | | | | 5,076,125 | | | | | 326,801 | |
| | | | | | | | | | |
| | | | | | | | | 1,598,159 | |
| | | | | | | | | | |
Total common stocks
(Cost $8,944,007) | | | | | | | | | 10,539,873 | |
| | | | | | | | | | |
| PREFERRED STOCKS - 0.4% | | | | | | | | | | |
| | | | | | | | | | |
| KOREA - 0.4% | | | | | | | | | | |
Samsung Electronics Co., Ltd.(1)(4) | | | | 42,024 | | | | | 49,611 | |
| | | | | | | | | | |
Total preferred stocks
(Cost $36,987) | | | | | | | | | 49,611 | |
| | |
| 54 | | Artisan Partners Funds |
| | | | | | | | | | |
| | | Principal
Amount | | Value |
| SHORT-TERM INVESTMENTS (CASH EQUIVALENTS) - 12.2% | | | | | | | | | | |
| Repurchase agreement with Fixed Income Clearing Corporation, 0.03%, dated 9/30/16, due 10/3/16, maturity value $1,471,594 (Cost $1,471,590)(5) | | | $ | 1,471,590 | | | | $ | 1,471,590 | |
| | | | | | | | | | |
| | | | | | | | | | |
Total investments - 99.9%
(Cost $10,452,584) | | | | | | | | | 12,061,074 | |
| | | | | | | | | | |
Other assets less liabilities - 0.1% | | | | | | | | | 14,791 | |
| | | | | | | | | | |
| | | | | | | | | | |
Total net assets - 100.0%(6) | | | | | | | | $ | 12,075,865 | |
| | | | | | | | | | |
| (1) | Valued at a fair value in accordance with procedures established by the board of directors of Artisan Partners Funds. In total, securities valued at a fair value were $7,836,863, or 64.9% of total net assets. See notes 2(a) and 4 in Notes to Financial Statements for additional information. |
| (2) | Non-income producing security. |
| (3) | Affiliated company as defined by the Investment Company Act of 1940, as amended. See note 12 in Notes to Financial Statements for additional information. |
| | | | | | | | | | | | | | | |
Security | | Rate | | Maturity | | Value |
U.S. Treasury Note | | | | 0.125 | % | | | | 4/15/2017 | | | | $ | 64,000 | |
U.S. Treasury Bond | | | | 3.000 | % | | | | 11/15/2044 | | | | | 859,758 | |
U.S. Treasury Bond | | | | 3.625 | % | | | | 2/15/2044 | | | | | 577,272 | |
| | | | | | | | | | | | | | | |
| | | | | | | | | | | | | $ | 1,501,030 | |
| | | | | | | | | | | | | | | |
| (6) | Percentages for the various classifications relate to total net assets. |
Company names are as reported by a data service provider and in some cases are translations; a company’s legal name may be different.
(DR) Depositary Receipt, voting rights may vary.
| | | | | | | | | | |
| PORTFOLIO DIVERSIFICATION - September 30, 2016 | |
Dollar values in thousands | |
| | | Value | | Percentage
of Total
Investments |
Consumer Discretionary | | | $ | 1,358,433 | | | | | 11.3 | % |
Consumer Staples | | | | 1,025,609 | | | | | 8.5 | |
Energy | | | | 385,422 | | | | | 3.2 | |
Financials | | | | 2,684,399 | | | | | 22.3 | |
Health Care | | | | 655,747 | | | | | 5.4 | |
Industrials | | | | 2,087,204 | | | | | 17.3 | |
Information Technology | | | | 2,028,820 | | | | | 16.8 | |
Telecommunication Services | | | | 363,850 | | | | | 3.0 | |
Short-term investments | | | | 1,471,590 | | | | | 12.2 | |
| | | | | | | | | | |
Total investments | | | $ | 12,061,074 | | | | | 100.0 | % |
| | | | | | | | | | |
| | | | | | | | | | |
| TRADING CURRENCIES - September 30, 2016 | |
Dollar values in thousands | |
| | | Value | | Percentage
of Total
Investments |
British pound | | | $ | 2,396,280 | | | | | 19.9 | % |
Canadian dollar | | | | 201,507 | | | | | 1.7 | |
Danish krone | | | | 624,868 | | | | | 5.2 | |
Euro | | | | 1,024,233 | | | | | 8.5 | |
Indian rupee | | | | 188,887 | | | | | 1.6 | |
Japanese yen | | | | 606,773 | | | | | 5.0 | |
Korean won | | | | 706,893 | | | | | 5.9 | |
Norwegian krone | | | | 233,593 | | | | | 1.9 | |
Swiss franc | | | | 2,055,336 | | | | | 17.0 | |
U.S. dollar | | | | 4,022,704 | | | | | 33.3 | |
| | | | | | | | | | |
Total investments | | | $ | 12,061,074 | | | | | 100.0 | % |
| | | | | | | | | | |
| | | | | | | | | | | | | | | | | | | | | | | | |
| FOREIGN CURRENCY FORWARD CONTRACTS - September 30, 2016 | |
Dollar values in thousands | |
Counterparty | | Contract
Settlement
Date | | Contract Amount | | Unrealized
Appreciation/
(Depreciation) |
| | | Deliver | | Receive | |
| State Street Bank and Trust Company | | 11/17/2016 | | CNH | | | | 2,841,326 | | | | | USD | | | | | 428,362 | | | | $ | 3,620 | |
| State Street Bank and Trust Company | | 11/17/2016 | | USD | | | | 68,849 | | | | | CNH | | | | | 461,352 | | | | | 118 | |
| State Street Bank and Trust Company | | 11/17/2016 | | CNH | | | | 272,586 | | | | | USD | | | | | 40,504 | | | | | (244 | ) |
| State Street Bank and Trust Company | | 2/3/2017 | | JPY | | | | 22,967,000 | | | | | USD | | | | | 227,395 | | | | | (386 | ) |
| | | | | | | | | | | | | | | | | | | | | | | | |
| | | | | | | | | | | | | | | | | | | | | | $ | 3,108 | |
| | | | | | | | | | | | | | | | | | | | | | | | |
JPY - Japanese yen
CNH - Chinese yuan renminbi offshore
USD - U.S. dollar
| | |
| Artisan Partners Funds | | 55 |
| | | | | | | |
| TOP TEN HOLDINGS - September 30, 2016 | |
Company Name | | Country | | Percentage
of Total
Net Assets |
Samsung Electronics Co., Ltd. | | Korea | | | | 5.2 | % |
Compass Group plc | | United Kingdom | | | | 4.8 | |
UBS Group AG | | Switzerland | | | | 4.3 | |
Arch Capital Group Ltd. | | United States | | | | 4.2 | |
ABB Ltd. | | Switzerland | | | | 4.1 | |
Baidu, Inc. | | China | | | | 3.9 | |
ING Groep N.V. | | Netherlands | | | | 3.5 | |
Medtronic plc | | United States | | | | 3.5 | |
RELX plc | | United Kingdom | | | | 3.2 | |
Telefonica Brasil S.A. | | Brazil | | | | 3.0 | |
| | | | | | | |
Total | | | | | | 39.7 | % |
| | | | | | | |
For the purpose of determining the Fund’s top ten holdings, securities of the same issuer are aggregated to determine the weight in the Fund.
The accompanying notes are an integral part of the financial statements.
| | |
| 56 | | Artisan Partners Funds |
ARTISAN MID CAP FUND
Schedule of Investments – September 30, 2016
Dollar values in thousands
| | | | | | | | | | |
| | | Shares
Held | | Value |
| COMMON STOCKS - 95.6% | | | | | |
| | | | | | | | | | |
| CONSUMER DISCRETIONARY - 18.0% | | | | | | |
Auto Components - 1.5% | | | | | | | | | | |
Delphi Automotive plc | | | | 1,723,141 | | | | $ | 122,894 | |
| | | | | | | | | | |
Distributors - 4.8% | | | | | | | | | | |
LKQ Corp. (1) | | | | 10,890,690 | | | | | 386,184 | |
| | | | | | | | | | |
Hotels, Restaurants & Leisure - 1.5% | | | | | | |
Aramark | | | | 3,296,288 | | | | | 125,358 | |
| | | | | | | | | | |
Household Durables - 1.3% | | | | | | | | | | |
Newell Brands, Inc. | | | | 1,958,837 | | | | | 103,152 | |
| | | | | | | | | | |
Internet & Direct Marketing Retail - 1.1% | | | | | | |
Ctrip.com International Ltd. (DR)(1)(2) | | | | 1,967,050 | | | | | 91,605 | |
| | | | | | | | | | |
Media - 1.3% | | | | | | | | | | |
CBS Corp., Class B(3) | | | | 1,871,077 | | | | | 102,423 | |
| | | | | | | | | | |
Multiline Retail - 1.4% | | | | | | | | | | |
Dollar Tree, Inc.(1) | | | | 1,396,291 | | | | | 110,209 | |
| | | | | | | | | | |
Specialty Retail - 4.5% | | | | | | | | | | |
Advance Auto Parts, Inc. | | | | 252,470 | | | | | 37,648 | |
Michaels Cos., Inc.(1) | | | | 3,481,122 | | | | | 84,139 | |
O’Reilly Automotive, Inc.(1) | | | | 169,807 | | | | | 47,565 | |
Tractor Supply Co. | | | | 1,162,590 | | | | | 78,300 | |
Ulta Salon Cosmetics & Fragrance, Inc.(1) | | | | 481,963 | | | | | 114,698 | |
| | | | | | | | | | |
| | | | | | | | | 362,350 | |
Textiles, Apparel & Luxury Goods - 0.6% | | | | | | |
Lululemon Athletica, Inc.(1) | | | | 743,323 | | | | | 45,328 | |
| | | | | | | | | | |
| CONSUMER STAPLES - 2.8% | | | | | | | | | | |
Beverages - 1.6% | | | | | | | | | | |
Monster Beverage Corp.(1) | | | | 875,566 | | | | | 128,542 | |
| | | | | | | | | | |
Food Products - 1.2% | | | | | | | | | | |
WhiteWave Foods Co.(1) | | | | 1,740,285 | | | | | 94,724 | |
| | | | | | | | | | |
| ENERGY - 3.1% | | | | | | | | | | |
Oil, Gas & Consumable Fuels - 3.1% | | | | | | |
Cimarex Energy Co. | | | | 725,638 | | | | | 97,504 | |
Concho Resources, Inc.(1) | | | | 1,116,360 | | | | | 153,332 | |
| | | | | | | | | | |
| | | | | | | | | 250,836 | |
| FINANCIALS - 6.4% | | | | | | | | | | |
Banks - 1.1% | | | | | | | | | | |
SVB Financial Group(1) | | | | 762,671 | | | | | 84,306 | |
| | | | | | | | | | |
Capital Markets - 5.3% | | | | | |
Intercontinental Exchange, Inc. | | | | 330,971 | | | | | 89,150 | |
S&P Global, Inc. | | | | 2,677,095 | | | | | 338,813 | |
| | | | | | | | | | |
| | | | | | | | | 427,963 | |
| HEALTH CARE - 21.4% | | | | | | | | | | |
Biotechnology - 4.4% | | | | | | | | | | |
Regeneron Pharmaceuticals, Inc.(1) | | | | 620,987 | | | | | 249,649 | |
Seattle Genetics, Inc.(1) | | | | 1,969,675 | | | | | 106,382 | |
| | | | | | | | | | |
| | | | | | | | | 356,031 | |
Health Care Equipment & Supplies - 9.8% | | | | | | |
Becton Dickinson & Co. | | | | 980,216 | | | | | 176,174 | |
Boston Scientific Corp.(1) | | | | 15,139,603 | | | | | 360,323 | |
DexCom, Inc.(1) | | | | 2,146,862 | | | | | 188,194 | |
Intuitive Surgical, Inc.(1) | | | | 91,951 | | | | | 66,649 | |
| | | | | | | | | | |
| | | | | | | | | 791,340 | |
Health Care Providers & Services - 4.0% | | | | | | |
Amsurg Corp.(1) | | | | 1,445,292 | | | | | 96,907 | |
Cigna Corp. | | | | 1,467,299 | | | | | 191,218 | |
Envision Healthcare Holdings, Inc.(1) | | | | 1,569,414 | | | | | 34,951 | |
| | | | | | | | | | |
| | | | | | | | | 323,076 | |
Health Care Technology - 3.2% | | | | | | | | | | |
athenahealth, Inc.(1) | | | | 705,825 | | | | | 89,019 | |
Cerner Corp.(1) | | | | 1,211,990 | | | | | 74,840 | |
Veeva Systems, Inc., Class A(1) | | | | 2,300,861 | | | | | 94,980 | |
| | | | | | | | | | |
| | | | | | | | | 258,839 | |
| INDUSTRIALS - 19.8% | | | | | | | | | | |
Building Products - 3.3% | | | | | | | | | | |
AO Smith Corp. | | | | 423,322 | | | | | 41,820 | |
Fortune Brands Home & Security, Inc. | | | | 3,880,775 | | | | | 225,473 | |
| | | | | | | | | | |
| | | | | | | | | 267,293 | |
Commercial Services & Supplies - 2.7% | | | | | | |
Cintas Corp. | | | | 111,382 | | | | | 12,542 | |
Waste Connections, Inc. | | | | 2,684,542 | | | | | 200,535 | |
| | | | | | | | | | |
| | | | | | | | | 213,077 | |
Electrical Equipment - 3.1% | | | | | | | | | | |
Acuity Brands, Inc. | | | | 449,052 | | | | | 118,819 | |
AMETEK, Inc. | | | | 1,963,957 | | | | | 93,838 | |
Hubbell, Inc. | | | | 353,776 | | | | | 38,116 | |
| | | | | | | | | | |
| | | | | | | | | 250,773 | |
Industrial Conglomerates - 1.0% | | | | | | |
Roper Technologies, Inc. | | | | 445,661 | | | | | 81,320 | |
| | |
| Artisan Partners Funds | | 57 |
| | | | | | | | | | |
| | | Shares
Held | | Value |
Machinery - 1.7% | | | | | | | | | | |
Middleby Corp.(1) | | | | 760,477 | | | | $ | 94,010 | |
Wabtec Corp. | | | | 527,866 | | | | | 43,101 | |
| | | | | | | | | | |
| | | | | | | | | 137,111 | |
Professional Services - 6.9% | | | | | | | | | | |
IHS Markit Ltd.(1) | | | | 10,543,695 | | | | | 395,916 | |
Nielsen Holdings plc | | | | 1,198,282 | | | | | 64,192 | |
Verisk Analytics, Inc.(1) | | | | 1,225,819 | | | | | 99,634 | |
| | | | | | | | | | |
| | | | | | | | | 559,742 | |
Trading Companies & Distributors - 1.1% | | | | | | |
HD Supply Holdings, Inc.(1) | | | | 2,759,672 | | | | | 88,254 | |
| | | | | | | | | | |
| INFORMATION TECHNOLOGY - 21.9% | | | | | | |
Communications Equipment - 2.9% | | | | | | |
Harris Corp. | | | | 461,219 | | | | | 42,252 | |
Motorola Solutions, Inc. | | | | 1,181,406 | | | | | 90,118 | |
Palo Alto Networks, Inc.(1) | | | | 645,654 | | | | | 102,872 | |
| | | | | | | | | | |
| | | | | | | | | 235,242 | |
Electronic Equipment, Instruments & Components - 0.3% | | | | | | |
Trimble Navigation Ltd.(1) | | | | 726,429 | | | | | 20,747 | |
| | | | | | | | | | |
IT Services - 7.0% | | | | | | | | | | |
Fidelity National Information Services, Inc. | | | | 1,092,114 | | | | | 84,126 | |
Gartner, Inc.(1) | | | | 1,025,959 | | | | | 90,746 | |
Global Payments, Inc. | | | | 3,755,048 | | | | | 288,237 | |
Vantiv, Inc., Class A(1) | | | | 1,833,376 | | | | | 103,164 | |
| | | | | | | | | | |
| | | | | | | | | 566,273 | |
Semiconductors & Semiconductor Equipment - 2.7% | | | | | | |
NVIDIA Corp. | | | | 1,736,626 | | | | | 118,994 | |
NXP Semiconductors N.V.(1)(2) | | | | 955,749 | | | | | 97,496 | |
| | | | | | | | | | |
| | | | | | | | | 216,490 | |
Software - 9.0% | | | | | | | | | | |
Activision Blizzard, Inc. | | | | 2,211,421 | | | | | 97,966 | |
Atlassian Corp. plc, Class A(1) | | | | 737,136 | | | | | 22,092 | |
Electronic Arts, Inc.(1) | | | | 2,587,006 | | | | | 220,930 | |
Guidewire Software, Inc.(1) | | | | 2,154,593 | | | | | 129,233 | |
Intuit, Inc. | | | | 532,427 | | | | | 58,572 | |
Workday, Inc., Class A(1) | | | | 2,143,139 | | | | | 196,504 | |
| | | | | | | | | | |
| | | | | | | | | 725,297 | |
| | | | | | | | | | |
| MATERIALS - 1.5% | | | | | | | | | | |
Chemicals - 1.5% | | | | | | | | | | |
RPM International, Inc. | | | | 2,316,603 | | | | | 124,448 | |
| | | | | | | | | | |
| TELECOMMUNICATION SERVICES - 0.7% | | | | | | |
Diversified Telecommunication Services - 0.7% | | | | | | | | | | |
Level 3 Communications, Inc.(1) | | | | 1,227,348 | | | | | 56,924 | |
| | | | | | | | | | |
Total common stocks (Cost $5,674,086) | | | | | | | | | 7,708,151 | |
| | | Principal
Amount | | Value |
| SHORT-TERM INVESTMENTS (CASH EQUIVALENTS) - 5.3% | | | | | | | | | | |
Repurchase agreement with Fixed Income Clearing Corporation, 0.03%, dated 9/30/16, due 10/3/16, maturity value $430,263
(Cost $430,262)(4) | | | $ | 430,262 | | | | | 430,262 | |
| | | | | | | | | | |
| | | | | | | | | | |
Total investments - 100.9% (Cost $6,104,348) | | | | | | | | | 8,138,413 | |
| | | | | | | | | | |
Other assets less liabilities - (0.9)% | | | | | | | | | (71,124 | ) |
| | | | | | | | | | |
| | | | | | | | | | |
Total net assets - 100.0%(5) | | | | | | | | $ | 8,067,289 | |
| | | | | | | | | | |
| (1) | Non-income producing security. |
| (2) | The Fund considers the company to be from outside of the United States. See the Fund’s Statement of Additional Information for a description of the methodology used for country classifications. |
| | | | | | | | | | | | | | | |
Security | | Country | | Trading Currency |
Ctrip.com International Ltd. (DR) | | China | | U.S. dollar |
NXP Semiconductors N.V. | | Netherlands | | U.S. dollar |
| | | | | | | | | | | | | | | |
Security | | Rate | | Maturity | | Value |
U.S. Treasury Note | | 0.125% | | 4/15/2017 | | $438,871 |
| (5) | Percentages for the various classifications relate to total net assets. |
Company names are as reported by a data service provider and in some cases are translations; a company’s legal name may be different.
(DR) Depositary Receipt, voting rights may vary.
| | |
| 58 | | Artisan Partners Funds |
| | | | | | | |
| TOP TEN HOLDINGS - September 30, 2016 | |
Company Name | | Country | | Percentage
of Total
Net Assets |
IHS Markit Ltd. | | United States | | | | 4.9 | % |
LKQ Corp. | | United States | | | | 4.8 | |
Boston Scientific Corp. | | United States | | | | 4.5 | |
S&P Global, Inc. | | United States | | | | 4.2 | |
Global Payments, Inc. | | United States | | | | 3.6 | |
Regeneron Pharmaceuticals, Inc. | | United States | | | | 3.1 | |
Fortune Brands Home & Security, Inc. | | United States | | | | 2.8 | |
Electronic Arts, Inc. | | United States | | | | 2.7 | |
Waste Connections, Inc. | | United States | | | | 2.5 | |
Workday, Inc. | | United States | | | | 2.4 | |
| | | | | | | |
Total | | | | | | 35.5 | % |
| | | | | | | |
For the purpose of determining the Fund’s top ten holdings, securities of the same issuer are aggregated to determine the weight in the Fund.
The accompanying notes are an integral part of the financial statements.
| | |
| Artisan Partners Funds | | 59 |
ARTISAN MID CAP VALUE FUND
Schedule of Investments – September 30, 2016
Dollar values in thousands
| | | | | | | | | | |
| | | Shares
Held | | Value |
| COMMON STOCKS - 93.4% | | | | | |
| | | | | | | | | | |
| CONSUMER DISCRETIONARY - 18.2% | | | | | | | | | | |
Auto Components - 1.9% | | | | | | | | | | |
Gentex Corp. | | | | 4,593,600 | | | | $ | 80,663 | |
| | | | | | | | | | |
Automobiles - 1.8% | | | | | | | | | | |
Harley-Davidson, Inc. | | | | 1,400,220 | | | | | 73,637 | |
| | | | | | | | | | |
Diversified Consumer Services - 1.8% | | | | | | | | | | |
H&R Block, Inc. | | | | 3,251,907 | | | | | 75,282 | |
| | | | | | | | | | |
Internet & Direct Marketing Retail - 4.5% | | | | | | | | | | |
Liberty Interactive Corp. QVC Group, Class A(1) | | | | 5,000,310 | | | | | 100,056 | |
Liberty Ventures, Series A(1) | | | | 2,198,901 | | | | | 87,670 | |
| | | | | | | | | | |
| | | | | | | | | 187,726 | |
Media - 5.3% | | | | | | | | | | |
News Corp., Class A(2) | | | | 6,276,637 | | | | | 87,747 | |
Omnicom Group, Inc. | | | | 1,119,454 | | | | | 95,154 | |
TEGNA, Inc. | | | | 1,760,964 | | | | | 38,495 | |
| | | | | | | | | | |
| | | | | | | | | 221,396 | |
Specialty Retail - 1.9% | | | | | | | | | | |
AutoNation, Inc.(1) | | | | 1,642,638 | | | | | 80,013 | |
| | | | | | | | | | |
Textiles, Apparel & Luxury Goods - 1.0% | | | | | | | | | | |
Coach, Inc. | | | | 1,207,869 | | | | | 44,160 | |
| | | | | | | | | | |
| ENERGY - 10.6% | | | | | | | | | | |
Energy Equipment & Services - 0.5% | | | | | | | | | | |
Helmerich & Payne, Inc. | | | | 345,343 | | | | | 23,242 | |
| | | | | | | | | | |
Oil, Gas & Consumable Fuels - 10.1% | | | | | | | | | | |
Apache Corp. | | | | 2,206,479 | | | | | 140,928 | |
Devon Energy Corp. | | | | 3,907,648 | | | | | 172,366 | |
Hess Corp. | | | | 2,032,655 | | | | | 108,991 | |
| | | | | | | | | | |
| | | | | | | | | 422,285 | |
| FINANCIALS - 22.4% | | | | | | | | | | |
Banks - 4.3% | | | | | | | | | | |
Fifth Third Bancorp | | | | 5,260,742 | | | | | 107,635 | |
M&T Bank Corp. | | | | 633,024 | | | | | 73,494 | |
| | | | | | | | | | |
| | | | | | | | | 181,129 | |
Capital Markets - 1.3% | | | | | | | | | | |
Intercontinental Exchange, Inc. | | | | 200,413 | | | | | 53,983 | |
| | | | | | | | | | |
Insurance - 15.1% | | | | | | | | | | |
Alleghany Corp.(1) | | | | 235,573 | | | | | 123,681 | |
Allied World Assurance Co. Holdings AG | | | | 1,715,232 | | | | | 69,330 | |
Allstate Corp. | | | | 1,129,475 | | | | | 78,137 | |
Aon plc | | | | 713,330 | | | | | 80,242 | |
Arch Capital Group Ltd.(1) | | | | 1,168,292 | | | | | 92,599 | |
Loews Corp. | | | | 1,422,476 | | | | | 58,535 | |
Progressive Corp. | | | | 1,094,654 | | | | | 34,482 | |
Torchmark Corp. | | | | 1,467,259 | | | | | 93,743 | |
| | | | | | | | | | |
| | | | | | | | | 630,749 | |
Real Estate Investment Trusts (REITs) - 1.7% | | | | | | | | | | |
American Capital Agency Corp. | | | | 3,542,181 | | | | | 69,214 | |
| | | | | | | | | | |
| HEALTH CARE - 1.6% | | | | | | | | | | |
Health Care Providers & Services - 1.6% | | | | | | | | | | |
AmerisourceBergen Corp. | | | | 852,611 | | | | | 68,874 | |
| | | | | | | | | | |
| INDUSTRIALS - 15.3% | | | | | | | | | | |
Aerospace & Defense - 1.8% | | | | | | | | | | |
Rockwell Collins, Inc. | | | | 915,267 | | | | | 77,193 | |
| | | | | | | | | | |
Construction &
Engineering - 5.3% | | | | | | | | | | |
Fluor Corp. | | | | 1,817,056 | | | | | 93,251 | |
Jacobs Engineering Group, Inc.(1) | | | | 2,040,581 | | | | | 105,539 | |
Quanta Services, Inc.(1) | | | | 823,616 | | | | | 23,053 | |
| | | | | | | | | | |
| | | | | | | | | 221,843 | |
Electrical Equipment - 0.5% | | | | | | | | | | |
Hubbell, Inc. | | | | 176,914 | | | | | 19,061 | |
| | | | | | | | | | |
Machinery - 1.0% | | | | | | | | | | |
Kennametal, Inc. | | | | 1,365,984 | | | | | 39,641 | |
| | | | | | | | | | |
Marine - 1.8% | | | | | | | | | | |
Kirby Corp.(1) | | | | 1,228,208 | | | | | 76,345 | |
| | | | | | | | | | |
Road & Rail - 1.8% | | | | | | | | | | |
Ryder System, Inc. | | | | 1,147,547 | | | | | 75,681 | |
| | | | | | | | | | |
Trading Companies & Distributors - 3.1% | | | | | | | | | | |
Air Lease Corp. | | | | 4,555,135 | | | | | 130,186 | |
| | |
| 60 | | Artisan Partners Funds |
| | | | | | | | | | |
| | | Shares
Held | | Value |
| INFORMATION TECHNOLOGY - 14.3% | | | | | | | | | | |
Electronic Equipment, Instruments & Components - 8.6% | | | | | | | | | | |
Arrow Electronics, Inc.(1) | | | | 1,924,189 | | | | $ | 123,090 | |
Avnet, Inc. | | | | 2,789,002 | | | | | 114,516 | |
FLIR Systems, Inc. | | | | 1,468,220 | | | | | 46,132 | |
Keysight Technologies, Inc.(1) | | | | 2,460,805 | | | | | 77,983 | |
| | | | | | | | | | |
| | | | | | | | | 361,721 | |
Internet Software & Services - 2.0% | | | | | | | | | | |
IAC/InterActiveCorp | | | | 1,305,522 | | | | | 81,556 | |
| | | | | | | | | | |
Semiconductors & Semiconductor
Equipment - 1.9% | | | | | | | | | | |
Analog Devices, Inc. | | | | 1,250,531 | | | | | 80,597 | |
| | | | | | | | | | |
Software - 1.8% | | | | | | | | | | |
Synopsys, Inc.(1) | | | | 1,235,225 | | | | | 73,310 | |
| | | | | | | | | | |
| MATERIALS - 9.5% | | | | | | | | | | |
Chemicals - 5.0% | | | | | | | | | | |
Agrium, Inc.(3) | | | | 402,471 | | | | | 36,500 | |
Celanese Corp., Series A | | | | 1,531,063 | | | | | 101,908 | |
Mosaic Co. | | | | 2,871,478 | | | | | 70,236 | |
| | | | | | | | | | |
| | | | | | | | | 208,644 | |
Metals & Mining - 4.5% | | | | | | | | | | |
Goldcorp, Inc.(3) | | | | 5,256,968 | | | | | 86,845 | |
Kinross Gold Corp.(1)(3) | | | | 11,101,499 | | | | | 46,737 | |
Nucor Corp. | | | | 1,115,727 | | | | | 55,173 | |
| | | | | | | | | | |
| | | | | | | | | 188,755 | |
| UTILITIES - 1.5% | | | | | | | | | | |
Electric Utilities - 1.5% | | | | | | | | | | |
OGE Energy Corp. | | | | 1,968,808 | | | | | 62,254 | |
| | | | | | | | | | |
Total common stocks
(Cost $2,791,518) | | | | | | | | | 3,909,140 | |
| | |
| | | Principal
Amount | | |
SHORT-TERM INVESTMENTS (CASH EQUIVALENTS) - 6.9% | | | | | | | | | | |
Repurchase agreement with Fixed Income Clearing Corporation, 0.03%, dated 9/30/16, due 10/3/16, maturity value $287,531 (Cost $287,530)(4) | | | $ | 287,530 | | | | $ | 287,530 | |
| | | | | | | | | | |
Total investments - 100.3%
(Cost $3,079,048) | | | | | | | | | 4,196,670 | |
| | | | | | | | | | |
Other assets less liabilities - (0.3)% | | | | | (13,068 | ) |
| | | | | | | | | | |
| | | | | | | | | | |
Total net assets - 100.0%(5) | | | | $ | 4,183,602 | |
| | | | | | | | | | |
| (1) | Non-income producing security. |
| (3) | The Fund considers the company to be from outside of the United States. See the Fund’s Statement of Additional Information for a description of the methodology used for country classifications. |
| | | | | | | | | | | | | | | |
Security | | Country | | Trading Currency |
Agrium, Inc. | | Canada | | U.S. dollar |
Goldcorp, Inc. | | Canada | | U.S. dollar |
Kinross Gold Corp. | | Canada | | U.S. dollar |
| | | | | | | | | | | | | | | |
Security | | Rate | | Maturity | | Value |
U.S. Treasury Note | | | | 0.125 | % | | | | 4/15/2017 | | | | $ | 293,282 | |
| (5) | Percentages for the various classifications relate to total net assets. |
Company names are as reported by a data service provider and in some cases are translations; a company’s legal name may be different.
| | | | | | | | | | |
| TOP TEN HOLDINGS - September 30, 2016 | |
Company Name | | Country | | Percentage
of Total
Net Assets |
Devon Energy Corp. | | | | United States | | | | | 4.1 | % |
Apache Corp. | | | | United States | | | | | 3.4 | |
Air Lease Corp. | | | | United States | | | | | 3.1 | |
Alleghany Corp. | | | | United States | | | | | 3.0 | |
Arrow Electronics, Inc. | | | | United States | | | | | 2.9 | |
Avnet, Inc. | | | | United States | | | | | 2.7 | |
Hess Corp. | | | | United States | | | | | 2.6 | |
Fifth Third Bancorp | | | | United States | | | | | 2.6 | |
Jacobs Engineering Group, Inc. | | | | United States | | | | | 2.5 | |
Celanese Corp. | | | | United States | | | | | 2.4 | |
| | | | | | | | | | |
Total | | | | | | | | | 29.3 | % |
| | | | | | | | | | |
For the purpose of determining the Fund’s top ten holdings, securities of the same issuer are aggregated to determine the weight in the Fund.
The accompanying notes are an integral part of the financial statements.
| | |
| Artisan Partners Funds | | 61 |
ARTISAN SMALL CAP FUND
Schedule of Investments – September 30, 2016
Dollar values in thousands
| | | | | | | | | | |
| | | Shares
Held | | Value |
| COMMON STOCKS - 93.5% | | | | | |
| | | | | | | | | | |
| CONSUMER DISCRETIONARY - 11.2% | | | | | | | | | | |
Auto Components - 1.7% | | | | | | | | | | |
Gentherm, Inc.(1) | | | | 404,152 | | | | $ | 12,699 | |
Visteon Corp. | | | | 137,288 | | | | | 9,838 | |
| | | | | | | | | | |
| | | | | | | | | 22,537 | |
Distributors - 2.3% | | | | | | | | | | |
LKQ Corp.(1) | | | | 836,666 | | | | | 29,668 | |
| | | | | | | | | | |
Diversified Consumer Services - 2.4% | | | | | | | | | | |
Bright Horizons Family Solutions, Inc.(1) | | | | 457,704 | | | | | 30,616 | |
| | | | | | | | | | |
Hotels, Restaurants & Leisure - 1.2% | | | | | | | | | | |
Dunkin’ Brands Group, Inc. | | | | 289,806 | | | | | 15,093 | |
| | | | | | | | | | |
Media - 0.5% | | | | | | | | | | |
Imax Corp.(1) | | | | 217,538 | | | | | 6,302 | |
| | | | | | | | | | |
Multiline Retail - 1.3% | | | | | | | | | | |
Ollie’s Bargain Outlet Holdings, Inc.(1) | | | | 618,558 | | | | | 16,212 | |
| | | | | | | | | | |
Specialty Retail - 1.8% | | | | | | | | | | |
Burlington Stores, Inc.(1) | | | | 286,085 | | | | | 23,179 | |
| | | | | | | | | | |
| CONSUMER STAPLES - 0.8% | | | | | | | | | | |
Food & Staples Retailing - 0.8% | | | | | | | | | | |
PriceSmart, Inc. | | | | 117,787 | | | | | 9,866 | |
| | | | | | | | | | |
| ENERGY - 1.2% | | | | | | | | | | |
Oil, Gas & Consumable Fuels - 1.2% | | | | | | | | | | |
Diamondback Energy, Inc.(1) | | | | 107,113 | | | | | 10,340 | |
RSP Permian, Inc.(1) | | | | 140,302 | | | | | 5,441 | |
| | | | | | | | | | |
| | | | | | | | | 15,781 | |
| FINANCIALS - 1.3% | | | | | | | | | | |
Banks - 0.6% | | | | | | | | | | |
SVB Financial Group(1) | | | | 70,298 | | | | | 7,771 | |
| | | | | | | | | | |
Diversified Financial Services - 0.7% | | | | | | | | | | |
Bats Global Markets, Inc. | | | | 306,451 | | | | | 9,233 | |
| | | | | | | | | | |
| HEALTH CARE - 22.2% | | | | | | | | | | |
Biotechnology - 5.5% | | | | | | | | | | |
Agios Pharmaceuticals, Inc.(1) | | | | 32,642 | | | | | 1,724 | |
Alnylam Pharmaceuticals, Inc.(1) | | | | 119,147 | | | | | 8,076 | |
Cepheid, Inc.(1) | | | | 627,742 | | | | | 33,076 | |
DBV Technologies S.A. (DR)(1)(2) | | | | 295,980 | | | | | 10,753 | |
Seattle Genetics, Inc.(1) | | | | 310,985 | | | | | 16,796 | |
| | | | | | | | | | |
| | | | | | | | | 70,425 | |
Health Care Equipment & Supplies - 9.2% | | | | | | | | | | |
DexCom, Inc.(1) | | | | 698,780 | | | | | 61,255 | |
GenMark Diagnostics, Inc.(1) | | | | 1,109,886 | | | | | 13,097 | |
Glaukos Corp.(1) | | | | 66,620 | | | | | 2,514 | |
Integra LifeSciences Holdings Corp.(1) | | | | 110,809 | | | | | 9,147 | |
Nevro Corp.(1) | | | | 309,864 | | | | | 32,347 | |
| | | | | | | | | | |
| | | | | | | | | 118,360 | |
Health Care Providers & Services - 2.0% | | | | | | | | | | |
HealthEquity, Inc.(1) | | | | 193,347 | | | | | 7,318 | |
Surgical Care Affiliates, Inc.(1) | | | | 387,315 | | | | | 18,886 | |
| | | | | | | | | | |
| | | | | | | | | 26,204 | |
Health Care Technology - 4.5% | | | | | | | | | | |
athenahealth, Inc.(1) | | | | 231,763 | | | | | 29,230 | |
Veeva Systems, Inc., Class A(1) | | | | 680,483 | | | | | 28,090 | |
| | | | | | | | | | |
| | | | | | | | | 57,320 | |
Life Sciences Tools & Services - 1.0% | | | | | | | | | | |
NeoGenomics, Inc.(1) | | | | 1,512,808 | | | | | 12,435 | |
| | | | | | | | | | |
| INDUSTRIALS - 21.9% | | | | | | | | | | |
Aerospace & Defense - 6.7% | | | | | | | | | | |
BWX Technologies, Inc. | | | | 240,246 | | | | | 9,218 | |
Taser International, Inc.(1) | | | | 1,495,591 | | | | | 42,789 | |
Teledyne Technologies, Inc.(1) | | | | 313,726 | | | | | 33,860 | |
| | | | | | | | | | |
| | | | | | | | | 85,867 | |
Building Products - 0.6% | | | | | | | | | | |
Masonite International Corp.(1) | | | | 132,002 | | | | | 8,206 | |
| | | | | | | | | | |
Commercial Services & Supplies - 0.8% | | | | | | | | | | |
Brady Corp., Class A(3) | | | | 281,590 | | | | | 9,746 | |
| | | | | | | | | | |
Electrical Equipment - 6.0% | | | | | | | | | | |
Acuity Brands, Inc. | | | | 290,656 | | | | | 76,908 | |
| | |
| 62 | | Artisan Partners Funds |
| | | | | | | | | | |
| | | Shares
Held | | Value |
Machinery - 6.9% | | | | | | | | | | |
Donaldson Co., Inc. | | | | 433,134 | | | | $ | 16,169 | |
IDEX Corp. | | | | 289,266 | | | | | 27,067 | |
John Bean Technologies Corp. | | | | 478,402 | | | | | 33,751 | |
Proto Labs, Inc.(1) | | | | 189,452 | | | | | 11,350 | |
| | | | | | | | | | |
| | | | | | | | | 88,337 | |
Professional Services - 0.9% | | | | | | | | | | |
Dun & Bradstreet Corp. | | | | 88,755 | | | | | 12,126 | |
| | | | | | | | | | |
| INFORMATION TECHNOLOGY - 34.9% | | | | | | | | | | |
Electronic Equipment, Instruments & Components - 3.6% | | | | | | | | | | |
Cognex Corp. | | | | 758,074 | | | | | 40,072 | |
National Instruments Corp. | | | | 225,990 | | | | | 6,418 | |
| | | | | | | | | | |
| | | | | | | | | 46,490 | |
Internet Software & Services - 10.7% | | | | | | | | | | |
Benefitfocus, Inc.(1) | | | | 579,843 | | | | | 23,147 | |
CoStar Group, Inc.(1) | | | | 178,951 | | | | | 38,748 | |
Match Group, Inc.(1) | | | | 186,805 | | | | | 3,323 | |
MercadoLibre, Inc. | | | | 71,298 | | | | | 13,188 | |
Pandora Media, Inc.(1) | | | | 1,219,890 | | | | | 17,481 | |
Q2 Holdings, Inc.(1) | | | | 929,793 | | | | | 26,648 | |
SPS Commerce, Inc.(1) | | | | 193,957 | | | | | 14,239 | |
| | | | | | | | | | |
| | | | | | | | | 136,774 | |
Software - 20.6% | | | | | | | | | | |
ACI Worldwide, Inc.(1) | | | | 477,745 | | | | | 9,259 | |
Aspen Technology, Inc.(1) | | | | 150,422 | | | | | 7,038 | |
Atlassian Corp. plc, Class A(1) | | | | 491,697 | | | | | 14,736 | |
Blackbaud, Inc. | | | | 274,180 | | | | | 18,189 | |
Ellie Mae, Inc.(1) | | | | 260,174 | | | | | 27,396 | |
Guidewire Software, Inc.(1) | | | | 663,896 | | | | | 39,821 | |
HubSpot, Inc.(1) | | | | 112,899 | | | | | 6,505 | |
Manhattan Associates, Inc.(1) | | | | 155,346 | | | | | 8,951 | |
Paylocity Holding Corp.(1) | | | | 178,167 | | | | | 7,921 | |
Proofpoint, Inc.(1) | | | | 485,685 | | | | | 36,354 | |
Take-Two Interactive Software, Inc.(1) | | | | 431,323 | | | | | 19,444 | |
Tyler Technologies, Inc.(1) | | | | 160,174 | | | | | 27,427 | |
Ultimate Software Group, Inc.(1) | | | | 202,421 | | | | | 41,373 | |
| | | | | | | | | | |
| | | | | | | | | 264,414 | |
| | | | | | | | | | |
Total common stocks
(Cost $693,185) | | | | | | | | | 1,199,870 | |
| | | Principal
Amount | | Value |
SHORT-TERM INVESTMENTS
(CASH EQUIVALENTS) - 6.5% | | | | | | | | | | |
Repurchase agreement with Fixed Income Clearing Corporation, 0.03%,
dated 9/30/16, due 10/3/16,
maturity value $82,971
(Cost $82,971)(4) | | | $ | 82,971 | | | | $ | 82,971 | |
| | | | | | | | | | |
Total investments - 100.0%
(Cost $776,156) | | | | | | | | | 1,282,841 | |
| | | | | | | | | | |
Other assets less liabilities - (0.0)%† | | | | | | | | | (319 | ) |
| | | | | | | | | | |
| | | | | | | | | | |
Total net assets - 100.0%(5) | | | | | | | | $ | 1,282,522 | |
| | | | | | | | | | |
| † | Amount rounds to less than 0.1%. |
| (1) | Non-income producing security. |
| (2) | The Fund considers the company to be from outside of the United States. See the Fund’s Statement of Additional Information for a description of the methodology used for country classifications. |
| | | | | | | | | | |
Security | | Country | | Trading
Currency |
DBV Technologies S.A. (DR) | | France | | U.S. dollar |
| | | | | | | | | | | | | | | |
Security | | Rate | | Maturity | | Value |
U.S. Treasury Note | | | | 0.125 | % | | | | 4/15/2017 | | | | $ | 84,633 | |
| (5) | Percentages for the various classifications relate to total net assets. |
Company names are as reported by a data service provider and in some cases are translations; a company’s legal name may be different.
(DR) Depositary Receipt, voting rights may vary.
| | | | | | | |
| TOP TEN HOLDINGS - September 30, 2016 | |
Company Name | | Country | | Percentage
of Total
Net Assets |
Acuity Brands, Inc. | | United States | | | | 6.0 | % |
DexCom, Inc. | | United States | | | | 4.8 | |
Taser International, Inc. | | United States | | | | 3.3 | |
Ultimate Software Group, Inc. | | United States | | | | 3.2 | |
Cognex Corp. | | United States | | | | 3.1 | |
Guidewire Software, Inc. | | United States | | | | 3.1 | |
CoStar Group, Inc. | | United States | | | | 3.0 | |
Proofpoint, Inc. | | United States | | | | 2.8 | |
Teledyne Technologies, Inc. | | United States | | | | 2.6 | |
John Bean Technologies Corp. | | United States | | | | 2.6 | |
| | | | | | | |
| | Total | | | | 34.5 | % |
| | | | | | | |
For the purpose of determining the Fund’s top ten holdings, securities of the same issuer are aggregated to determine the weight in the Fund.
The accompanying notes are an integral part of the financial statements.
| | |
| Artisan Partners Funds | | 63 |
ARTISAN VALUE FUND
Schedule of Investments – September 30, 2016
Dollar values in thousands
| | | | | | | | | | |
| | | Shares
Held | | Value |
| COMMON STOCKS - 88.7% | | | | | |
| | | | | | | | | | |
| CONSUMER DISCRETIONARY - 16.1% | | | | | | | | | | |
Auto Components - 3.1% | | | | | | | | | | |
Cie Generale des Etablissements Michelin(1)(2) | | | | 225,007 | | | | $ | 24,881 | |
| | | | | | | | | | |
Internet & Direct Marketing Retail - 4.9% | | | | | | | | | | |
Liberty Interactive Corp. QVC Group, Class A(3) | | | | 1,067,380 | | | | | 21,358 | |
Liberty Ventures, Series A(3) | | | | 463,015 | | | | | 18,461 | |
| | | | | | | | | | |
| | | | | | | | | 39,819 | |
Media - 8.1% | | | | | | | | | | |
CBS Corp., Class B(4) | | | | 384,643 | | | | | 21,055 | |
News Corp., Class A(4) | | | | 1,172,883 | | | | | 16,397 | |
Time Warner, Inc. | | | | 353,810 | | | | | 28,167 | |
| | | | | | | | | | |
| | | | | | | | | 65,619 | |
| ENERGY - 15.1% | | | | | | | | | | |
Oil, Gas & Consumable Fuels - 15.1% | | | | | | | | | | |
Apache Corp. | | | | 618,104 | | | | | 39,478 | |
Devon Energy Corp. | | | | 949,998 | | | | | 41,904 | |
EOG Resources, Inc. | | | | 161,862 | | | | | 15,654 | |
Hess Corp. | | | | 465,757 | | | | | 24,974 | |
| | | | | | | | | | |
| | | | | | | | | 122,010 | |
| FINANCIALS - 17.4% | | | | | | | | | | |
Banks - 3.3% | | | | | | | | | | |
Citigroup, Inc. | | | | 569,909 | | | | | 26,917 | |
| | | | | | | | | | |
Capital Markets - 3.0% | | | | | | | | | | |
Goldman Sachs Group, Inc. | | | | 150,248 | | | | | 24,231 | |
| | | | | | | | | | |
Diversified Financial Services - 3.7% | | | | | | | | | | |
Berkshire Hathaway, Inc., Class B(3) | | | | 208,107 | | | | | 30,065 | |
| | | | | | | | | | |
Insurance - 5.0% | | | | | | | | | | |
Alleghany Corp.(3) | | | | 38,160 | | | | | 20,035 | |
Chubb Ltd. | | | | 160,929 | | | | | 20,220 | |
| | | | | | | | | | |
| | | | | | | | | 40,255 | |
Real Estate Investment Trusts (REITs) - 2.4% | | | | | | | | | | |
American Capital Agency Corp. | | | | 966,435 | | | | | 18,884 | |
| | | | | | | | | | |
| HEALTH CARE - 2.0% | | | | | | | | | | |
Biotechnology - 2.0% | | | | | | | | | | |
Gilead Sciences, Inc. | | | | 200,863 | | | | | 15,893 | |
| INDUSTRIALS - 8.7% | | | | | | | | | | |
Construction & Engineering - 3.2% | | | | | | | | | | |
Jacobs Engineering Group, Inc.(3) | | | | 506,109 | | | | | 26,176 | |
| | | | | | | | | | |
Road & Rail - 1.9% | | | | | | | | | | |
Union Pacific Corp. | | | | 160,897 | | | | | 15,692 | |
| | | | | | | | | | |
Trading Companies & Distributors - 3.6% | | | | | | | | | | |
Air Lease Corp. | | | | 1,007,764 | | | | | 28,802 | |
| | | | | | | | | | |
| INFORMATION TECHNOLOGY - 14.9% | | | | | | | | | | |
Communications Equipment - 2.1% | | | | | | | | | | |
Cisco Systems, Inc. | | | | 523,941 | | | | | 16,619 | |
| | | | | | | | | | |
Electronic Equipment, Instruments & Components - 4.0% | | | | | | | | | | |
Arrow Electronics, Inc.(3) | | | | 263,639 | | | | | 16,865 | |
Avnet, Inc. | | | | 381,483 | | | | | 15,664 | |
| | | | | | | | | | |
| | | | | | | | | 32,529 | |
Internet Software & Services - 2.2% | | | | | | | | | | |
Alphabet, Inc., Class C(3)(4) | | | | 22,841 | | | | | 17,754 | |
| | | | | | | | | | |
Semiconductors & Semiconductor Equipment - 2.0% | | | | | | | | | | |
QUALCOMM, Inc. | | | | 237,527 | | | | | 16,271 | |
| | | | | | | | | | |
Software - 1.8% | | | | | | | | | | |
Oracle Corp. | | | | 369,508 | | | | | 14,514 | |
| | | | | | | | | | |
Technology Hardware, Storage & Peripherals - 2.8% | | | | | | | | | | |
Apple, Inc. | | | | 197,917 | | | | | 22,375 | |
| | | | | | | | | | |
| MATERIALS - 14.5% | | | | | | | | | | |
Chemicals - 8.6% | | | | | | | | | | |
Agrium, Inc.(1) | | | | 101,921 | | | | | 9,243 | |
Celanese Corp., Series A | | | | 240,234 | | | | | 15,990 | |
LyondellBasell Industries N.V., Class A | | | | 345,734 | | | | | 27,887 | |
Mosaic Co. | | | | 672,185 | | | | | 16,442 | |
| | | | | | | | | | |
| | | | | | | | | 69,562 | |
Metals & Mining - 5.9% | | | | | | | | | | |
Goldcorp, Inc.(1) | | | | 1,808,817 | | | | | 29,882 | |
Kinross Gold Corp.(1)(3) | | | | 4,261,185 | | | | | 17,939 | |
| | | | | | | | | | |
| | | | | | | | | 47,821 | |
| | | | | | | | | | |
Total common stocks
(Cost $578,763) | | | | | | | | | 716,689 | |
| | |
| 64 | | Artisan Partners Funds |
| | | | | | | | | | |
| | | Shares
Held | | Value |
| PREFERRED STOCKS - 5.9% | | | | | | | | | | |
| INFORMATION TECHNOLOGY - 5.9% | | | | | | | | | | |
Technology Hardware, Storage & Peripherals - 5.9% | | | | | | | | | | |
Samsung Electronics Co., Ltd.(1)(2)(4) | | | | 40,561 | | | | $ | 47,883 | |
| | | | | | | | | | |
Total preferred stocks
(Cost $25,667) | | | | | | | | | 47,883 | |
| | |
| | | Principal
Amount | | |
| SHORT-TERM INVESTMENTS (CASH EQUIVALENTS) - 4.9% | | | | | | | | | | |
Repurchase agreement with Fixed Income Clearing Corporation, 0.03%, dated 9/30/16, due 10/3/16, maturity value $39,180
(Cost $39,180)(5) | | | $ | 39,180 | | | | $ | 39,180 | |
| | | | | | | | | | |
| | | | | | | | | | |
Total investments - 99.5%
(Cost $643,610) | | | | | | | | | 803,752 | |
| | | | | | | | | | |
Other assets less liabilities - 0.5% | | | | | 3,861 | |
| | | | | | | | | | |
| | | | | | | | | | |
Total net assets - 100.0%(6) | | | | $ | 807,613 | |
| | | | | | | | | | |
| (1) | The Fund considers the company to be from outside of the United States. See the Fund’s Statement of Additional Information for a description of the methodology used for country classifications. |
| | | | | | | | | | |
Security | | Country | | Trading Currency |
Agrium, Inc. | | Canada | | U.S. dollar |
Cie Generale des Etablissements Michelin | | France | | Euro |
Goldcorp, Inc. | | Canada | | U.S. dollar |
Kinross Gold Corp. | | Canada | | U.S. dollar |
Samsung Electronics Co., Ltd. | | Korea | | Korean won |
| (2) | Valued at a fair value in accordance with procedures established by the board of directors of Artisan Partners Funds. In total, securities valued at a fair value were $72,764, or 9.0% of total net assets. See notes 2(a) and 4 in Notes to Financial Statements for additional information. |
| (3) | Non-income producing security. |
| | | | | | | | | | | | | | | |
Security | | Rate | | Maturity | | Value |
U.S. Treasury Note | | | | 0.125 | % | | | | 4/15/2017 | | | | $ | 39,966 | |
| (6) | Percentages for the various classifications relate to total net assets. |
Company names are as reported by a data service provider and in some cases are translations; a company’s legal name may be different.
| | | | | | | | | | |
| TRADING CURRENCIES - September 30, 2016 | |
Dollar values in thousands | |
| | | Value | | Percentage
of Total
Investments |
Euro | | | $ | 24,881 | | | | | 3.1 | % |
Korean won | | | | 47,883 | | | | | 6.0 | |
U.S. dollar | | | | 730,988 | | | | | 90.9 | |
| | | | | | | | | | |
Total investments | | | $ | 803,752 | | | | | 100.0 | % |
| | | | | | | | | | |
| | | | | | | |
| TOP TEN HOLDINGS - September 30, 2016 | |
Company Name | | Country | | Percentage
of Total
Net Assets |
Samsung Electronics Co., Ltd. | | Korea | | | | 5.9 | % |
Devon Energy Corp. | | United States | | | | 5.2 | |
Apache Corp. | | United States | | | | 4.9 | |
Berkshire Hathaway, Inc. | | United States | | | | 3.7 | |
Goldcorp, Inc. | | Canada | | | | 3.7 | |
Air Lease Corp. | | United States | | | | 3.6 | |
Time Warner, Inc. | | United States | | | | 3.5 | |
LyondellBasell Industries N.V. | | United States | | | | 3.5 | |
Citigroup, Inc. | | United States | | | | 3.3 | |
Jacobs Engineering Group, Inc. | | United States | | | | 3.2 | |
| | | | | | | |
Total | | | | | | 40.5 | % |
| | | | | | | |
For the purpose of determining the Fund’s top ten holdings, securities of the same issuer are aggregated to determine the weight in the Fund.
The accompanying notes are an integral part of the financial statements.
| | |
| Artisan Partners Funds | | 65 |
ARTISAN PARTNERS FUNDS
Statements of Assets and Liabilities – September 30, 2016
Dollar values in thousands
| | | | | | | | | | | | | | | | | | | | |
| | | DEVELOPING WORLD | | EMERGING MARKETS | | GLOBAL EQUITY | | GLOBAL
OPPORTUNITIES |
| ASSETS: | | | | | | | | | | | | | | | | | | | | |
Investments in securities, unaffiliated, at value | | | $ | 813,737 | | | | $ | 36,266 | | | | $ | 252,891 | | | | $ | 1,715,382 | |
Short-term investments (repurchase agreements), at value | | | | 71,649 | | | | | 618 | | | | | 2,408 | | | | | 118,529 | |
Total investments | | | | 885,386 | | | | | 36,884 | | | | | 255,299 | | | | | 1,833,911 | |
Cash | | | | – | (1) | | | | 1 | | | | | – | (1) | | | | – | (1) |
Foreign currency | | | | 1,154 | | | | | 21 | | | | | 25 | | | | | 61 | |
Receivable from investments sold | | | | – | | | | | – | | | | | 3,094 | | | | | 1,462 | |
Receivable from fund shares sold | | | | 3,589 | | | | | 117 | | | | | 49 | | | | | 1,708 | |
Dividends and interest receivable | | | | 470 | | | | | 74 | | | | | 366 | | | | | 2,017 | |
Other assets(2) | | | | 6 | | | | | 174 | | | | | 82 | | | | | 79 | |
Total assets | | | | 890,605 | | | | | 37,271 | | | | | 258,915 | | | | | 1,839,238 | |
| LIABILITIES: | | | | | | | | | | | | | | | | | | | | |
Unrealized loss on foreign currency forward contracts | | | | – | | | | | – | | | | | – | | | | | 94 | |
Payable for investments purchased | | | | 3,892 | | | | | 106 | | | | | 992 | | | | | 803 | |
Payable for fund shares redeemed | | | | 280 | | | | | 316 | | | | | 192 | | | | | 406 | |
Payable for operating expenses | | | | 241 | | | | | 116 | | | | | 144 | | | | | 432 | |
Payable for deferred director’s compensation | | | | 3 | | | | | 2 | | | | | 3 | | | | | 15 | |
Payable for foreign taxes | | | | 1,545 | * | | | | 41 | * | | | | 10 | | | | | 51 | |
Total liabilities | | | | 5,961 | | | | | 581 | | | | | 1,341 | | | | | 1,801 | |
Total net assets | | | $ | 884,644 | | | | $ | 36,690 | | | | $ | 257,574 | | | | $ | 1,837,437 | |
| NET ASSETS CONSIST OF: | | | | | | | | | | | | | | | | | | | | |
Fund shares issued and outstanding | | | $ | 766,248 | | | | $ | 172,786 | | | | $ | 243,142 | | | | $ | 1,410,063 | |
Net unrealized appreciation on investments and foreign currency related transactions | | | | 116,261 | | | | | 2,184 | | | | | 33,426 | | | | | 436,634 | |
Accumulated undistributed net investment income (loss) | | | | 1,553 | | | | | 95 | | | | | 181 | | | | | (8,025 | ) |
Accumulated undistributed net realized gains (losses) on investments and foreign currency related transactions | | | | 582 | | | | | (138,375 | ) | | | | (19,175 | ) | | | | (1,235 | ) |
Total net assets | | | $ | 884,644 | | | | $ | 36,690 | | | | $ | 257,574 | | | | $ | 1,837,437 | |
| SUPPLEMENTARY INFORMATION: | | | | | | | | | | | | | | | | | | | | |
Net assets | | | | | | | | | | | | | | | | | | | | |
Investor Shares | | | $ | 266,122 | | | | $ | 30,135 | | | | $ | 145,817 | | | | $ | 781,877 | |
Advisor Shares | | | $ | 340,831 | | | | | | | | | | | | | | $ | 193,230 | |
Institutional Shares | | | $ | 277,691 | | | | $ | 6,555 | | | | $ | 111,757 | | | | $ | 862,330 | |
Shares outstanding (Indefinite number of shares authorized, $0.01 par value) | | | | | | | | | | | | | | | | | | | | |
Investor Shares | | | | 25,317,306 | | | | | 2,362,834 | | | | | 8,814,148 | | | | | 35,962,869 | |
Advisor Shares | | | | 32,338,077 | | | | | | | | | | | | | | | 8,879,071 | |
Institutional Shares | | | | 26,307,293 | | | | | 518,022 | | | | | 6,739,014 | | | | | 39,394,438 | |
Net asset value per share | | | | | | | | | | | | | | | | | | | | |
Investor Shares | | | $ | 10.51 | | | | $ | 12.75 | | | | $ | 16.54 | | | | $ | 21.74 | |
Advisor Shares | | | $ | 10.54 | | | | | | | | | | | | | | $ | 21.76 | |
Institutional Shares | | | $ | 10.56 | | | | $ | 12.65 | | | | $ | 16.58 | | | | $ | 21.89 | |
Cost of securities of unaffiliated issuers held | | | $ | 767,632 | | | | $ | 34,691 | | | | $ | 221,867 | | | | $ | 1,397,088 | |
Cost of foreign currency | | | $ | 1,153 | | | | $ | 21 | | | | $ | 25 | | | | $ | 61 | |
| | | | |
*Including foreign taxes on unrealized gains | | | $ | 1,499 | | | | $ | 5 | | | | | | | | | | | |
| (1) | Amount rounds to less than $1. |
| (2) | Includes the amount that the custodian has offered to reimburse the Fund for certain out-of-pocket expenses it incorrectly charged the Fund between 1998 and 2015. See note 16 in Notes to Financial Statements for additional information. |
The accompanying notes are an integral part of the financial statements.
| | |
| 66 | | Artisan Partners Funds |
ARTISAN PARTNERS FUNDS
Statements of Assets and Liabilities – September 30, 2016 (Continued)
Dollar values in thousands
| | | | | | | | | | | | | | | | | | | | |
| | | GLOBAL SMALL CAP | | GLOBAL VALUE | | HIGH INCOME | | INTERNATIONAL |
| ASSETS: | | | | | | | | | | | | | | | | | | | | |
Investments in securities, unaffiliated, at value | | | $ | 74,473 | | | | $ | 1,839,699 | | | | $ | 1,655,557 | | | | $ | 15,381,358 | |
Investments in securities, affiliated, at value | | | | – | | | | | – | | | | | – | | | | | 327,136 | |
Short-term investments (repurchase agreements), at value | | | | 2,231 | | | | | 232,609 | | | | | 183,716 | | | | | 142,619 | |
Total investments | | | | 76,704 | | | | | 2,072,308 | | | | | 1,839,273 | | | | | 15,851,113 | |
Cash | | | | 1 | | | | | 1 | | | | | – | (1) | | | | 30 | |
Foreign currency | | | | 2 | | | | | 495 | | | | | – | | | | | 8,751 | |
Unrealized gain on foreign currency forward contracts | | | | – | | | | | 453 | | | | | – | | | | | – | |
Receivable from investments sold | | | | 335 | | | | | – | | | | | 12,232 | | | | | 151,380 | |
Receivable from fund shares sold | | | | 534 | | | | | 4,504 | | | | | 10,576 | | | | | 11,122 | |
Dividends and interest receivable | | | | 104 | | | | | 4,155 | | | | | 25,419 | | | | | 69,965 | |
Other assets(2) | | | | 31 | | | | | 79 | | | | | 15 | | | | | 551 | |
Total assets | | | | 77,711 | | | | | 2,081,995 | | | | | 1,887,515 | | | | | 16,092,912 | |
| LIABILITIES: | | | | | | | | | | | | | | | | | | | | |
Unrealized loss on foreign currency forward contracts | | | | – | | | | | 27 | | | | | – | | | | | – | |
Dividends payable | | | | – | | | | | – | | | | | 1,597 | | | | | – | |
Payable for investments purchased | | | | 177 | | | | | 10,856 | | | | | 92,523 | | | | | 82,841 | |
Payable for fund shares redeemed | | | | 74 | | | | | 1,100 | | | | | 3,908 | | | | | 18,146 | |
Payable for operating expenses | | | | 159 | | | | | 555 | | | | | 475 | | | | | 4,391 | |
Payable for deferred director’s compensation | | | | 2 | | | | | 19 | | | | | 11 | | | | | 197 | |
Payable for foreign taxes | | | | 4 | | | | | 171 | | | | | – | | | | | 1,862 | |
Total liabilities | | | | 416 | | | | | 12,728 | | | | | 98,514 | | | | | 107,437 | |
Total net assets | | | $ | 77,295 | | | | $ | 2,069,267 | | | | $ | 1,789,001 | | | | $ | 15,985,475 | |
| NET ASSETS CONSIST OF: | | | | | | | | | | | | | | | | | | | | |
Fund shares issued and outstanding | | | $ | 98,161 | | | | $ | 1,838,677 | | | | $ | 1,753,247 | | | | $ | 14,490,352 | |
Net unrealized appreciation on investments and foreign currency related transactions | | | | 5,131 | | | | | 192,430 | | | | | 34,978 | | | | | 1,871,193 | |
Accumulated undistributed net investment income (loss) | | | | (289 | ) | | | | 12,682 | | | | | (1,610 | ) | | | | 186,639 | |
Accumulated undistributed net realized gains (losses) on investments and foreign currency related transactions | | | | (25,708 | ) | | | | 25,478 | | | | | 2,386 | | | | | (562,709 | ) |
Total net assets | | | $ | 77,295 | | | | $ | 2,069,267 | | | | $ | 1,789,001 | | | | $ | 15,985,475 | |
| SUPPLEMENTARY INFORMATION: | | | | | | | | | | | | | | | | | | | | |
Net assets | | | | | | | | | | | | | | | | | | | | |
Investor Shares | | | $ | 77,295 | | | | $ | 748,254 | | | | $ | 544,969 | | | | $ | 7,930,361 | |
Advisor Shares | | | | | | | | $ | 403,036 | | | | $ | 1,244,032 | | | | $ | 2,782,189 | |
Institutional Shares | | | | | | | | $ | 917,977 | | | | | | | | | $ | 5,272,925 | |
Shares outstanding (Indefinite number of shares authorized, $0.01 par value) | | | | | | | | | | | | | | | | | | | | |
Investor Shares | | | | 7,581,481 | | | | | 48,904,879 | | | | | 55,304,662 | | | | | 280,263,205 | |
Advisor Shares | | | | | | | | | 26,383,308 | | | | | 126,269,449 | | | | | 98,291,152 | |
Institutional Shares | | | | | | | | | 59,929,345 | | | | | | | | | | 184,921,793 | |
Net asset value per share | | | | | | | | | | | | | | | | | | | | |
Investor Shares | | | $ | 10.20 | | | | $ | 15.30 | | | | $ | 9.85 | | | | $ | 28.30 | |
Advisor Shares | | | | | | | | $ | 15.28 | | | | $ | 9.85 | | | | $ | 28.31 | |
Institutional Shares | | | | | | | | $ | 15.32 | | | | | | | | | $ | 28.51 | |
Cost of securities of unaffiliated issuers held | | | $ | 71,570 | | | | $ | 1,880,270 | | | | $ | 1,804,295 | | | | $ | 13,699,909 | |
Cost of securities of affiliated issuers held | | | $ | – | | | | $ | – | | | | $ | – | | | | $ | 277,748 | |
Cost of foreign currency | | | $ | 2 | | | | $ | 497 | | | | $ | – | | | | $ | 8,769 | |
| (1) | Amount rounds to less than $1. |
| (2) | Includes the amount that the custodian has offered to reimburse the Fund for certain out-of-pocket expenses it incorrectly charged the Fund between 1998 and 2015. See note 16 in Notes to Financial Statements for additional information. |
The accompanying notes are an integral part of the financial statements.
| | |
| Artisan Partners Funds | | 67 |
ARTISAN PARTNERS FUNDS
Statements of Assets and Liabilities – September 30, 2016 (Continued)
Dollar values in thousands
| | | | | | | | | | | | | | | |
| | | INTERNATIONAL
SMALL CAP | | INTERNATIONAL
VALUE | | MID CAP |
| ASSETS: | | | | | | | | | | | | | | | |
Investments in securities, unaffiliated, at value | | | $ | 772,090 | | | | $ | 9,384,601 | | | | $ | 7,708,151 | |
Investments in securities, affiliated, at value | | | | – | | | | | 1,204,883 | | | | | – | |
Short-term investments (repurchase agreements), at value | | | | 12,429 | | | | | 1,471,590 | | | | | 430,262 | |
Total investments | | | | 784,519 | | | | | 12,061,074 | | | | | 8,138,413 | |
Cash | | | | 1 | | | | | – | (1) | | | | 1 | |
Foreign currency | | | | 166 | | | | | 3,118 | | | | | – | |
Unrealized gain on foreign currency forward contracts | | | | – | | | | | 3,738 | | | | | – | |
Receivable from investments sold | | | | 12,552 | | | | | – | | | | | 7,172 | |
Receivable from fund shares sold | | | | 940 | | | | | 5,488 | | | | | 24,746 | |
Dividends and interest receivable | | | | 1,390 | | | | | 42,769 | | | | | 824 | |
Other assets(2) | | | | 132 | | | | | 255 | | | | | 177 | |
Total assets | | | | 799,700 | | | | | 12,116,442 | | | | | 8,171,333 | |
| LIABILITIES: | | | | | | | | | | | | | | | |
Unrealized loss on foreign currency forward contracts | | | | – | | | | | 630 | | | | | – | |
Payable for investments purchased | | | | 4,469 | | | | | 11,696 | | | | | 46,267 | |
Payable for fund shares redeemed | | | | 336 | | | | | 21,947 | | | | | 55,819 | |
Payable for operating expenses | | | | 306 | | | | | 2,543 | | | | | 1,860 | |
Payable for deferred director’s compensation | | | | 10 | | | | | 122 | | | | | 98 | |
Payable for foreign taxes | | | | 43 | | | | | 3,639 | * | | | | – | |
Total liabilities | | | | 5,164 | | | | | 40,577 | | | | | 104,044 | |
Total net assets | | | $ | 794,536 | | | | $ | 12,075,865 | | | | $ | 8,067,289 | |
| NET ASSETS CONSIST OF: | | | | | | | | | | | | | | | |
Fund shares issued and outstanding | | | $ | 632,711 | | | | $ | 10,178,418 | | | | $ | 5,622,195 | |
Net unrealized appreciation on investments and foreign currency related transactions | | | | 150,537 | | | | | 1,608,698 | | | | | 2,034,065 | |
Accumulated undistributed net investment income (loss) | | | | (376 | ) | | | | 73,433 | | | | | (36,664 | ) |
Accumulated undistributed net realized gains on investments and foreign currency related transactions | | | | 11,664 | | | | | 215,316 | | | | | 447,693 | |
Total net assets | | | $ | 794,536 | | | | $ | 12,075,865 | | | | $ | 8,067,289 | |
| SUPPLEMENTARY INFORMATION: | | | | | | | | | | | | | | | |
Net assets | | | | | | | | | | | | | | | |
Investor Shares | | | $ | 585,000 | | | | $ | 5,500,119 | | | | $ | 3,232,399 | |
Advisor Shares | | | | | | | | $ | 3,537,587 | | | | $ | 445,648 | |
Institutional Shares | | | $ | 209,536 | | | | $ | 3,038,159 | | | | $ | 4,389,242 | |
Shares outstanding (Indefinite number of shares authorized, $0.01 par value) | | | | | | | | | | | | | | | |
Investor Shares | | | | 25,249,888 | | | | | 163,936,128 | | | | | 78,194,752 | |
Advisor Shares | | | | | | | | | 105,364,787 | | | | | 10,755,595 | |
Institutional Shares | | | | 9,038,265 | | | | | 90,129,629 | | | | | 99,427,408 | |
Net asset value per share | | | | | | | | | | | | | | | |
Investor Shares | | | $ | 23.17 | | | | $ | 33.55 | | | | $ | 41.34 | |
Advisor Shares | | | | | | | | $ | 33.57 | | | | $ | 41.43 | |
Institutional Shares | | | $ | 23.18 | | | | $ | 33.71 | | | | $ | 44.15 | |
Cost of securities of unaffiliated issuers held | | | $ | 633,938 | | | | $ | 9,758,133 | | | | $ | 6,104,348 | |
Cost of securities of affiliated issuers held | | | $ | – | | | | $ | 694,451 | | | | $ | – | |
Cost of foreign currency | | | $ | 167 | | | | $ | 3,129 | | | | $ | – | |
| | | |
*Including foreign taxes on unrealized gains | | | | | | | | $ | 2,139 | | | | | | |
| (1) | Amount rounds to less than $1. |
| (2) | Includes the amount that the custodian has offered to reimburse the Fund for certain out-of-pocket expenses it incorrectly charged the Fund between 1998 and 2015. See note 16 in Notes to Financial Statements for additional information. |
The accompanying notes are an integral part of the financial statements.
| | |
| 68 | | Artisan Partners Funds |
ARTISAN PARTNERS FUNDS
Statements of Assets and Liabilities – September 30, 2016 (Continued)
Dollar values in thousands
| | | | | | | | | | | | | | | |
| | | MID CAP VALUE | | SMALL CAP | | VALUE |
| ASSETS: | | | | | | | | | | | | | | | |
Investments in securities, unaffiliated, at value | | | $ | 3,909,140 | | | | $ | 1,199,870 | | | | $ | 764,572 | |
Short-term investments (repurchase agreements), at value | | | | 287,530 | | | | | 82,971 | | | | | 39,180 | |
Total investments | | | | 4,196,670 | | | | | 1,282,841 | | | | | 803,752 | |
Cash | | | | 1 | | | | | – | (1) | | | | 1 | |
Receivable from investments sold | | | | 26,503 | | | | | 377 | | | | | 7,706 | |
Receivable from fund shares sold | | | | 2,800 | | | | | 828 | | | | | 723 | |
Dividends and interest receivable | | | | 5,603 | | | | | 11 | | | | | 980 | |
Other assets(2) | | | | 195 | | | | | 54 | | | | | 45 | |
Total assets | | | | 4,231,772 | | | | | 1,284,111 | | | | | 813,207 | |
| LIABILITIES: | | | | | | | | | | | | | | | |
Payable for investments purchased | | | | 16,739 | | | | | 215 | | | | | 4,239 | |
Payable for fund shares redeemed | | | | 29,671 | | | | | 816 | | | | | 939 | |
Payable for operating expenses | | | | 1,649 | | | | | 544 | | | | | 397 | |
Payable for deferred director’s compensation | | | | 82 | | | | | 14 | | | | | 12 | |
Payable for foreign taxes | | | | 29 | | | | | – | | | | | 7 | |
Total liabilities | | | | 48,170 | | | | | 1,589 | | | | | 5,594 | |
Total net assets | | | $ | 4,183,602 | | | | $ | 1,282,522 | | | | $ | 807,613 | |
| NET ASSETS CONSIST OF: | | | | | | | | | | | | | | | |
Fund shares issued and outstanding | | | $ | 3,045,434 | | | | $ | 785,961 | | | | $ | 699,763 | |
Net unrealized appreciation on investments and foreign currency related transactions | | | | 1,117,622 | | | | | 506,685 | | | | | 160,112 | |
Accumulated undistributed net investment income (loss) | | | | 29,675 | | | | | (7,965 | ) | | | | 4,781 | |
Accumulated undistributed net realized losses on investments and foreign currency related transactions | | | | (9,129 | ) | | | | (2,159 | ) | | | | (57,043 | ) |
Total net assets | | | $ | 4,183,602 | | | | $ | 1,282,522 | | | | $ | 807,613 | |
| SUPPLEMENTARY INFORMATION: | | | | | | | | | | | | | | | |
Net assets | | | | | | | | | | | | | | | |
Investor Shares | | | $ | 2,416,461 | | | | $ | 764,298 | | | | $ | 457,969 | |
Advisor Shares | | | $ | 1,025,855 | | | | | | | | | $ | 251,643 | |
Institutional Shares | | | $ | 741,286 | | | | $ | 518,224 | | | | $ | 98,001 | |
Shares outstanding (Indefinite number of shares authorized, $0.01 par value) | | | | | | | | | | | | | | | |
Investor Shares | | | | 112,884,468 | | | | | 25,536,836 | | | | | 34,964,556 | |
Advisor Shares | | | | 48,004,349 | | | | | | | | | | 19,281,571 | |
Institutional Shares | | | | 34,631,783 | | | | | 17,164,335 | | | | | 7,485,798 | |
Net asset value per share | | | | | | | | | | | | | | | |
Investor Shares | | | $ | 21.41 | | | | $ | 29.93 | | | | $ | 13.10 | |
Advisor Shares | | | $ | 21.37 | | | | | | | | | $ | 13.05 | |
Institutional Shares | | | $ | 21.40 | | | | $ | 30.19 | | | | $ | 13.09 | |
Cost of securities of unaffiliated issuers held | | | $ | 3,079,048 | | | | $ | 776,156 | | | | $ | 643,610 | |
| (1) | Amount rounds to less than $1. |
| (2) | Includes the amount that the custodian has offered to reimburse the Fund for certain out-of-pocket expenses it incorrectly charged the Fund between 1998 and 2015. See note 16 in Notes to Financial Statements for additional information. |
The accompanying notes are an integral part of the financial statements.
| | |
| Artisan Partners Funds | | 69 |
ARTISAN PARTNERS FUNDS
Statements of Operations – For the Year Ended September 30, 2016
Dollar values in thousands
| | | | | | | | | | | | | | | | | | | | |
| | | DEVELOPING
WORLD | | EMERGING MARKETS | | GLOBAL EQUITY | | GLOBAL
OPPORTUNITIES |
| INVESTMENT INCOME: | | | | | | | | | | | | | | | | | | | | |
Dividends, from unaffiliated issuers(1) | | | $ | 8,424 | | | | $ | 863 | | | | $ | 3,584 | | | | $ | 12,905 | |
Dividends, from affiliated issuers(2) | | | | – | | | | | – | | | | | 246 | | | | | 305 | |
Interest | | | | 13 | | | | | – | (3) | | | | 1 | | | | | 27 | |
Total investment income | | | | 8,437 | | | | | 863 | | | | | 3,831 | | | | | 13,237 | |
| EXPENSES: | | | | | | | | | | | | | | | | | | | | |
Management fees | | | | 5,513 | | | | | 403 | | | | | 2,841 | | | | | 13,809 | |
Transfer agent fees | | | | | | | | | | | | | | | | | | | | |
Investor Shares | | | | 374 | | | | | 121 | | | | | 504 | | | | | 1,632 | |
Advisor Shares | | | | 187 | | | | | | | | | | | | | | | 151 | |
Institutional Shares | | | | 14 | | | | | 20 | | | | | 15 | | | | | 21 | |
Shareholder communications | | | | | | | | | | | | | | | | | | | | |
Investor Shares | | | | 89 | | | | | 13 | | | | | 40 | | | | | 157 | |
Advisor Shares | | | | 5 | | | | | | | | | | | | | | | 7 | |
Institutional Shares | | | | 3 | | | | | 13 | | | | | 11 | | | | | 12 | |
Custodian fees^ | | | | 195 | | | | | (110 | ) | | | | (6 | ) | | | | 139 | |
Accounting fees | | | | 64 | | | | | 89 | | | | | 73 | | | | | 88 | |
Professional fees | | | | 73 | | | | | 97 | | | | | 82 | | | | | 103 | |
Offering fees | | | | 42 | | | | | – | | | | | – | | | | | – | |
Registration fees | | | | | | | | | | | | | | | | | | | | |
Investor Shares | | | | 71 | | | | | 23 | | | | | 52 | | | | | 36 | |
Advisor Shares | | | | 44 | | | | | | | | | | | | | | | 34 | |
Institutional Shares | | | | 23 | | | | | 20 | | | | | 17 | | | | | – | |
Director’s fees | | | | 16 | | | | | 6 | | | | | 10 | | | | | 52 | |
Other operating expenses | | | | 13 | | | | | 7 | | | | | 12 | | | | | 40 | |
Total operating expenses | | | | 6,726 | | | | | 702 | | | | | 3,651 | | | | | 16,281 | |
Less amounts waived or paid by the Adviser | | | | (34 | ) | | | | (300 | ) | | | | – | | | | | – | |
Net expenses | | | | 6,692 | | | | | 402 | | | | | 3,651 | | | | | 16,281 | |
Net investment income (loss) | | | | 1,745 | | | | | 461 | | | | | 180 | | | | | (3,044 | ) |
| NET REALIZED AND UNREALIZED GAINS (LOSSES) ON INVESTMENTS: | |
Net realized gain (loss) on: | | | | | | | | | | | | | | | | | | | | |
Investments, from unaffiliated issuers(4) | | | | 2,068 | | | | | (1,612 | ) | | | | (17,343 | ) | | | | 13,619 | |
Investments, from affiliated issuers | | | | – | | | | | – | | | | | (1,339 | ) | | | | 4,396 | |
Foreign currency related transactions | | | | (27 | ) | | | | (71 | ) | | | | 4 | | | | | (8,581 | ) |
Total realized gain (loss) | | | | 2,041 | | | | | (1,683 | ) | | | | (18,678 | ) | | | | 9,434 | |
Net increase (decrease) in unrealized appreciation or depreciation on: | | | | | | | | | | | | | | | | | | | | |
Investments, from unaffiliated issuers(5) | | | | 125,023 | | | | | 8,127 | | | | | 30,978 | | | | | 276,088 | |
Investments, from affiliated issuers | | | | – | | | | | – | | | | | 3,090 | | | | | (3,451 | ) |
Foreign currency related transactions | | | | 14 | | | | | 4 | | | | | 1 | | | | | 1,426 | |
Total increase in unrealized appreciation or depreciation | | | | 125,037 | | | | | 8,131 | | | | | 34,069 | | | | | 274,063 | |
Net gain on investments and foreign currency related transactions | | | | 127,078 | | | | | 6,448 | | | | | 15,391 | | | | | 283,497 | |
Net increase in net assets resulting from operations | | | $ | 128,823 | | | | $ | 6,909 | | | | $ | 15,571 | | | | $ | 280,453 | |
(1) Net of foreign taxes withheld on dividends, unaffiliated issuers | | | $ | 577 | | | | $ | 92 | | | | $ | 217 | | | | $ | 164 | |
(2) Net of foreign taxes withheld on dividends, affiliated issuers | | | | – | | | | | – | | | | | 19 | | | | | 34 | |
(3) Amount rounds to less than $1. | | | | | | | | | | | | | | | | | | | | |
(4) Net of foreign taxes on realized gains | | | | – | | | | | 6 | | | | | – | | | | | – | |
(5) Net of increase (decrease) in foreign taxes on unrealized gains | | | | 1,499 | | | | | (21 | ) | | | | – | | | | | – | |
^ Custodian fees were reduced by the amount that the custodian has offered to reimburse the Fund for certain out-of-pocket expenses it incorrectly charged the Fund between 1998 and 2015. See note 16 in Notes to Financial Statements for additional information. | |
The accompanying notes are an integral part of the financial statements.
| | |
| 70 | | Artisan Partners Funds |
ARTISAN PARTNERS FUNDS
Statements of Operations – For the Year Ended September 30, 2016 (Continued)
Dollar values in thousands
| | | | | | | | | | | | | | | | | | | | |
| | | GLOBAL SMALL CAP | | GLOBAL VALUE | | HIGH INCOME | | INTERNATIONAL |
| INVESTMENT INCOME: | | | | | | | | | | | | | | | | | | | | |
Dividends, from unaffiliated issuers(1) | | | $ | 1,515 | | | | $ | 32,805 | | | | $ | – | | | | $ | 367,494 | |
Dividends, from affiliated issuers(2) | | | | 76 | | | | | 1,173 | | | | | – | | | | | 7,006 | |
Interest | | | | 1 | | | | | 37 | | | | | 100,702 | | | | | 110 | |
Total investment income | | | | 1,592 | | | | | 34,015 | | | | | 100,702 | | | | | 374,610 | |
| EXPENSES: | | | | | | | | | | | | | | | | | | | | |
Management fees | | | | 1,142 | | | | | 16,964 | | | | | 9,447 | | | | | 157,116 | |
Transfer agent fees | | | | | | | | | | | | | | | | | | | | |
Investor Shares | | | | 323 | | | | | 1,696 | | | | | 1,213 | | | | | 20,707 | |
Advisor Shares | | | | | | | | | 310 | | | | | 692 | | | | | 1,800 | |
Institutional Shares | | | | | | | | | 23 | | | | | | | | | | 31 | |
Shareholder communications | | | | | | | | | | | | | | | | | | | | |
Investor Shares | | | | 55 | | | | | 185 | | | | | 82 | | | | | 1,514 | |
Advisor Shares | | | | | | | | | 34 | | | | | 24 | | | | | 128 | |
Institutional Shares | | | | | | | | | 18 | | | | | | | | | | 71 | |
Custodian fees(3) | | | | 43 | | | | | 149 | | | | | 30 | | | | | 2,406 | |
Accounting fees | | | | 87 | | | | | 88 | | | | | 118 | | | | | 88 | |
Professional fees | | | | 90 | | | | | 85 | | | | | 154 | | | | | 510 | |
Registration fees | | | | | | | | | | | | | | | | | | | | |
Investor Shares | | | | 37 | | | | | 60 | | | | | 56 | | | | | 121 | |
Advisor Shares | | | | | | | | | 52 | | | | | 90 | | | | | – | |
Institutional Shares | | | | | | | | | 28 | | | | | | | | | | – | |
Director’s fees | | | | 6 | | | | | 58 | | | | | 42 | | | | | 599 | |
Other operating expenses | | | | 7 | | | | | 44 | | | | | 23 | | | | | 165 | |
Total operating expenses | | | | 1,790 | | | | | 19,794 | | | | | 11,971 | | | | | 185,256 | |
Less amounts waived or paid by the Adviser | | | | (107 | ) | | | | – | | | | | – | | | | | – | |
Net expenses | | | | 1,683 | | | | | 19,794 | | | | | 11,971 | | | | | 185,256 | |
Net investment income (loss) | | | | (91 | ) | | | | 14,221 | | | | | 88,731 | | | | | 189,354 | |
| NET REALIZED AND UNREALIZED GAINS (LOSSES) ON INVESTMENTS: | | | | | | | | | | | |
Net realized gain (loss) on: | | | | | | | | | | | | | | | | | | | | |
Investments, from unaffiliated issuers | | | | (17,725 | ) | | | | 49,170 | | | | | 1,980 | | | | | (194,516 | ) |
Investments, from affiliated issuers | | | | (891 | ) | | | | (4,125 | ) | | | | – | | | | | (14,393 | ) |
Foreign currency related transactions | | | | 6 | | | | | 71 | | | | | – | | | | | (2,591 | ) |
Total realized gain (loss) | | | | (18,610 | ) | | | | 45,116 | | | | | 1,980 | | | | | (211,500 | ) |
Net increase (decrease) in unrealized appreciation or depreciation on: | | | | | | | | | | | | | | | | | | | | |
Investments, from unaffiliated issuers | | | | 10,912 | | | | | 156,731 | | | | | 82,863 | | | | | 900,103 | |
Investments, from affiliated issuers | | | | 2,030 | | | | | (12,575 | ) | | | | – | | | | | 49,388 | |
Foreign currency related transactions | | | | 3 | | | | | 448 | | | | | – | | | | | – | |
Total increase in unrealized appreciation or depreciation | | | | 12,945 | | | | | 144,604 | | | | | 82,863 | | | | | 949,491 | |
Net gain (loss) on investments and foreign currency related transactions | | | | (5,665 | ) | | | | 189,720 | | | | | 84,843 | | | | | 737,991 | |
Net increase (decrease) in net assets resulting from operations | | | $ | (5,756 | ) | | | $ | 203,941 | | | | $ | 173,574 | | | | $ | 927,345 | |
| | | | |
(1) Net of foreign taxes withheld on dividends, unaffiliated issuers | | | $ | 179 | | | | $ | 1,304 | | | | $ | – | | | | $ | 29,999 | |
(2) Net of foreign taxes withheld on dividends, affiliated issuers | | | | – | | | | | 204 | | | | | – | | | | | 332 | |
| (3) | Custodian fees were reduced by the amount that the custodian has offered to reimburse the Fund for certain out-of-pocket expenses it incorrectly charged the Fund between 1998 and 2015. See note 16 in Notes to Financial Statements for additional information. |
The accompanying notes are an integral part of the financial statements.
| | |
| Artisan Partners Funds | | 71 |
ARTISAN PARTNERS FUNDS
Statements of Operations – For the Year Ended September 30, 2016 (Continued)
Dollar values in thousands
| | | | | | | | | | | | | | | |
| | | INTERNATIONAL
SMALL CAP | | INTERNATIONAL
VALUE | | MID CAP |
| INVESTMENT INCOME: | | | | | | | | | | | | | | | |
Dividends, from unaffiliated issuers(1) | | | $ | 11,876 | | | | $ | 218,509 | | | | $ | 35,562 | |
Dividends, from affiliated issuers(2) | | | | 1,408 | | | | | 23,903 | | | | | – | |
Interest | | | | 10 | | | | | 190 | | | | | 97 | |
Total investment income | | | | 13,294 | | | | | 242,602 | | | | | 35,659 | |
| EXPENSES: | | | | | | | | | | | | | | | |
Management fees | | | | 11,362 | | | | | 102,909 | | | | | 77,112 | |
Transfer agent fees | | | | | | | | | | | | | | | |
Investor Shares | | | | 1,677 | | | | | 10,872 | | | | | 7,858 | |
Advisor Shares | | | | | | | | | 1,867 | | | | | 308 | |
Institutional Shares | | | | 8 | | | | | 25 | | | | | 33 | |
Shareholder communications | | | | | | | | | | | | | | | |
Investor Shares | | | | 80 | | | | | 355 | | | | | 489 | |
Advisor Shares | | | | | | | | | 324 | | | | | 82 | |
Institutional Shares | | | | 6 | | | | | 21 | | | | | 154 | |
Custodian fees^ | | | | 172 | | | | | 1,788 | | | | | 181 | |
Accounting fees | | | | 79 | | | | | 87 | | | | | 60 | |
Professional fees | | | | 104 | | | | | 318 | | | | | 232 | |
Registration fees | | | | | | | | | | | | | | | |
Investor Shares | | | | 49 | | | | | 124 | | | | | 77 | |
Advisor Shares | | | | | | | | | – | | | | | 17 | |
Institutional Shares | | | | 23 | | | | | – | | | | | 13 | |
Director’s fees | | | | 32 | | | | | 378 | | | | | 292 | |
Other operating expenses | | | | 20 | | | | | 6 | | | | | 201 | |
Total operating expenses | | | | 13,612 | | | | | 119,074 | | | | | 87,109 | |
Less amounts waived or paid by the Adviser | | | | – | | | | | – | | | | | – | |
Net expenses | | | | 13,612 | | | | | 119,074 | | | | | 87,109 | |
Net investment income (loss) | | | | (318 | ) | | | | 123,528 | | | | | (51,450 | ) |
| NET REALIZED AND UNREALIZED GAINS (LOSSES) ON INVESTMENTS: | |
Net realized gain (loss) on: | | | | | | | | | | | | | | | |
Investments, from unaffiliated issuers | | | | 14,861 | | | | | 323,011 | | | | | 628,865 | |
Investments, from affiliated issuers | | | | 12,247 | | | | | (58,105 | ) | | | | 111,985 | |
Foreign currency related transactions | | | | 244 | | | | | (45,667 | ) | | | | – | |
Total realized gain | | | | 27,352 | | | | | 219,239 | | | | | 740,850 | |
Net increase (decrease) in unrealized appreciation or depreciation on: | | | | | | | | | | | | | | | |
Investments, from unaffiliated issuers(3) | | | | (20,319 | ) | | | | 421,598 | | | | | 69,027 | |
Investments, from affiliated issuers | | | | 14,920 | | | | | 234,917 | | | | | (107,530 | ) |
Foreign currency related transactions | | | | 10 | | | | | 12,996 | | | | | – | |
Total increase (decrease) in unrealized appreciation or depreciation | | | | (5,389 | ) | | | | 669,511 | | | | | (38,503 | ) |
Net gain on investments and foreign currency related transactions | | | | 21,963 | | | | | 888,750 | | | | | 702,347 | |
Net increase in net assets resulting from operations | | | $ | 21,645 | | | | $ | 1,012,278 | | | | $ | 650,897 | |
| | | |
(1) Net of foreign taxes withheld on dividends, unaffiliated issuers | | | $ | 1,365 | | | | $ | 14,437 | | | | $ | 59 | |
(2) Net of foreign taxes withheld on dividends, affiliated issuers | | | | 32 | | | | | 2,955 | | | | | – | |
(3) Net of increase in foreign taxes on unrealized gains | | | | – | | | | | 2,139 | | | | | – | |
^ Custodian fees were reduced by the amount that the custodian has offered to reimburse the Fund for certain out-of-pocket expenses it incorrectly charged the Fund between 1998 and 2015. See note 16 in Notes to Financial Statements for additional information. | |
The accompanying notes are an integral part of the financial statements.
| | |
| 72 | | Artisan Partners Funds |
ARTISAN PARTNERS FUNDS
Statements of Operations – For the Year Ended September 30, 2016 (Continued)
Dollar values in thousands
| | | | | | | | | | | | | | | |
| | | MID CAP VALUE | | SMALL CAP | | VALUE |
| INVESTMENT INCOME: | | | | | | | | | | | | | | | |
Dividends, from unaffiliated issuers(1) | | | $ | 87,986 | | | | $ | 2,936 | | | | $ | 15,240 | |
Dividends, from affiliated issuers | | | | 840 | | | | | – | | | | | 157 | |
Interest | | | | 64 | | | | | 17 | | | | | 10 | |
Total investment income | | | | 88,890 | | | | | 2,953 | | | | | 15,407 | |
| EXPENSES: | | | | | | | | | | | | | | | |
Management fees | | | | 47,523 | | | | | 11,675 | | | | | 6,347 | |
Transfer agent fees | | | | | | | | | | | | | | | |
Investor Shares | | | | 6,663 | | | | | 1,699 | | | | | 710 | |
Advisor Shares | | | | 704 | | | | | | | | | | 329 | |
Institutional Shares | | | | 23 | | | | | 21 | | | | | 20 | |
Shareholder communications | | | | | | | | | | | | | | | |
Investor Shares | | | | 36 | | | | | 215 | | | | | 59 | |
Advisor Shares | | | | 255 | | | | | | | | | | 111 | |
Institutional Shares | | | | 7 | | | | | 25 | | | | | 12 | |
Custodian fees(2) | | | | 51 | | | | | (9 | ) | | | | 38 | |
Accounting fees | | | | 59 | | | | | 59 | | | | | 58 | |
Professional fees | | | | 178 | | | | | 77 | | | | | 74 | |
Registration fees | | | | | | | | | | | | | | | |
Investor Shares | | | | 75 | | | | | 42 | | | | | 43 | |
Advisor Shares | | | | 11 | | | | | | | | | | – | |
Institutional Shares | | | | 38 | | | | | 39 | | | | | 19 | |
Director’s fees | | | �� | 187 | | | | | 42 | | | | | 31 | |
Other operating expenses | | | | 134 | | | | | 29 | | | | | 15 | |
Total operating expenses | | | | 55,944 | | | | | 13,914 | | | | | 7,866 | |
Less amounts waived or paid by the Adviser | | | | (88 | ) | | | | – | | | | | – | |
Net expenses | | | | 55,856 | | | | | 13,914 | | | | | 7,866 | |
Net investment income (loss) | | | | 33,034 | | | | | (10,961 | ) | | | | 7,541 | |
| NET REALIZED AND UNREALIZED GAINS (LOSSES) ON INVESTMENTS: | |
Net realized gain (loss) on: | | | | | | | | | | | | | | | |
Investments, from unaffiliated issuers | | | | 187,060 | | | | | 12,003 | | | | | (33,155 | ) |
Investments, from affiliated issuers | | | | (19,253 | ) | | | | – | | | | | (4,698 | ) |
Foreign currency related transactions | | | | – | | | | | – | | | | | (59 | ) |
Total realized gain (loss) | | | | 167,807 | | | | | 12,003 | | | | | (37,912 | ) |
Net increase (decrease) in unrealized appreciation or depreciation on: | | | | | | | | | | | | | | | |
Investments, from unaffiliated issuers | | | | 481,001 | | | | | 172,409 | | | | | 213,568 | |
Investments, from affiliated issuers | | | | (22,061 | ) | | | | – | | | | | 13,519 | |
Foreign currency related transactions | | | | – | | | | | – | | | | | 1 | |
Total increase in unrealized appreciation or depreciation | | | | 458,940 | | | | | 172,409 | | | | | 227,088 | |
Net gain on investments and foreign currency related transactions | | | | 626,747 | | | | | 184,412 | | | | | 189,176 | |
Net increase in net assets resulting from operations | | | $ | 659,781 | | | | $ | 173,451 | | | | $ | 196,717 | |
| | | |
(1) Net of foreign taxes withheld on dividends, unaffiliated issuers | | | $ | 208 | | | | $ | – | | | | $ | 247 | |
| (2) | Custodian fees were reduced by the amount that the custodian has offered to reimburse the Fund for certain out-of-pocket expenses it incorrectly charged the Fund between 1998 and 2015. See note 16 in Notes to Financial Statements for additional information. |
The accompanying notes are an integral part of the financial statements.
| | |
| Artisan Partners Funds | | 73 |
ARTISAN PARTNERS FUNDS
Statements of Changes in Net Assets
Dollar values in thousands
| | | | | | | | | | | | | | | | | | | | |
| | | DEVELOPING WORLD | | EMERGING MARKETS |
| | | Year Ended
9/30/2016 | | Year Ended
9/30/2015(1) | | Year Ended
9/30/2016 | | Year Ended
9/30/2015 |
| OPERATIONS: | | | | | | | | | | | | | | | | | | | | |
Net investment income (loss) | | | $ | 1,745 | | | | $ | (48 | ) | | | $ | 461 | | | | $ | 242 | |
Net realized gain (loss) on: | | | | | | | | | | | | | | | | | | | | |
Investments, from unaffiliated issuers | | | | 2,068 | | | | | (1,448 | ) | | | | (1,612 | ) | | | | 19,178 | |
Foreign currency related transactions | | | | (27 | ) | | | | (1 | ) | | | | (71 | ) | | | | (532 | ) |
Net increase (decrease) in unrealized appreciation or depreciation on: | | | | | | | | | | | | | | | | | | | | |
Investments, from unaffiliated issuers | | | | 125,023 | | | | | (8,768 | ) | | | | 8,127 | | | | | (38,593 | ) |
Foreign currency related transactions | | | | 14 | | | | | (8 | ) | | | | 4 | | | | | 3 | |
Net increase (decrease) in net assets resulting from operations | | | | 128,823 | | | | | (10,273 | ) | | | | 6,909 | | | | | (19,702 | ) |
| DISTRIBUTIONS PAID TO SHAREHOLDERS: | | | | | | | | | | | | | | | | | | | | |
Net investment income: | | | | | | | | | | | | | | | | | | | | |
Investor Shares | | | | – | | | | | – | | | | | – | | | | | (405 | ) |
Institutional Shares | | | | – | | | | | – | | | | | – | | | | | (3,071 | ) |
Total distributions paid to shareholders | | | | – | | | | | – | | | | | – | | | | | (3,476 | ) |
| FUND SHARE ACTIVITIES: | | | | | | | | | | | | | | | | | | | | |
Net increase (decrease) in net assets resulting from fund share activities | | | | 636,990 | | | | | 129,104 | | | | | (21,022 | ) | | | | (331,370 | ) |
Total increase (decrease) in net assets | | | | 765,813 | | | | | 118,831 | | | | | (14,113 | ) | | | | (354,548 | ) |
Net assets, beginning of period | | | | 118,831 | | | | | – | | | | | 50,803 | | | | | 405,351 | |
Net assets, end of period | | | $ | 884,644 | | | | $ | 118,831 | | | | $ | 36,690 | | | | $ | 50,803 | |
Accumulated undistributed net investment income (loss) | | | $ | 1,553 | | | | $ | (48 | ) | | | $ | 95 | | | | $ | (425 | ) |
| (1) | For the period from commencement of operations (June 29, 2015) through September 30, 2015. |
The accompanying notes are an integral part of the financial statements.
| | |
| 74 | | Artisan Partners Funds |
ARTISAN PARTNERS FUNDS
Statements of Changes in Net Assets (Continued)
Dollar values in thousands
| | | | | | | | | | | | | | | | | | | | |
| | | GLOBAL EQUITY | | GLOBAL OPPORTUNITIES |
| | | Year Ended
9/30/2016 | | Year Ended
9/30/2015 | | Year Ended
9/30/2016 | | Year Ended
9/30/2015 |
| OPERATIONS: | | | | | | | | | | | | | | | | | | | | |
Net investment income (loss) | | | $ | 180 | | | | $ | (518 | ) | | | $ | (3,044 | ) | | | $ | 2,579 | |
Net realized gain (loss) on: | | | | | | | | | | | | | | | | | | | | |
Investments, from unaffiliated issuers | | | | (17,343 | ) | | | | 10,712 | | | | | 13,619 | | | | | 6,414 | |
Investments, from affiliated issuers | | | | (1,339 | ) | | | | (2,210 | ) | | | | 4,396 | | | | | (500 | ) |
Foreign currency related transactions | | | | 4 | | | | | (51 | ) | | | | (8,581 | ) | | | | 4,037 | |
Net increase (decrease) in unrealized appreciation or depreciation on: | | | | | | | | | | | | | | | | | | | | |
Investments, from unaffiliated issuers | | | | 30,978 | | | | | (12,053 | ) | | | | 276,088 | | | | | (24,156 | ) |
Investments, from affiliated issuers | | | | 3,090 | | | | | (2,496 | ) | | | | (3,451 | ) | | | | (5,162 | ) |
Foreign currency related transactions | | | | 1 | | | | | 10 | | | | | 1,426 | | | | | (2,924 | ) |
Net increase (decrease) in net assets resulting from operations | | | | 15,571 | | | | | (6,606 | ) | | | | 280,453 | | | | | (19,712 | ) |
| DISTRIBUTIONS PAID TO SHAREHOLDERS: | | | | | | | | | | | | | | | | | | | | |
Net investment income: | | | | | | | | | | | | | | | | | | | | |
Investor Shares | | | | – | | | | | – | | | | | (686 | ) | | | | (2,108 | ) |
Advisor Shares | | | | | | | | | | | | | | (106 | ) | | | | – | |
Institutional Shares | | | | – | | | | | – | | | | | (1,743 | ) | | | | (2,576 | ) |
Net realized gains on investment transactions: | | | | | | | | | | | | | | | | | | | | |
Investor Shares | | | | (4,572 | ) | | | | (7,233 | ) | | | | (4,507 | ) | | | | (16,250 | ) |
Advisor Shares | | | | | | | | | | | | | | (360 | ) | | | | – | |
Institutional Shares | | | | (2,290 | ) | | | | – | | | | | (3,955 | ) | | | | (10,211 | ) |
Total distributions paid to shareholders | | | | (6,862 | ) | | | | (7,233 | ) | | | | (11,357 | ) | | | | (31,145 | ) |
| FUND SHARE ACTIVITIES: | | | | | | | | | | | | | | | | | | | | |
Net increase (decrease) in net assets resulting from fund share activities | | | | (47,515 | ) | | | | 73,949 | | | | | 212,419 | | | | | 247,071 | |
Total increase (decrease) in net assets | | | | (38,806 | ) | | | | 60,110 | | | | | 481,515 | | | | | 196,214 | |
Net assets, beginning of period | | | | 296,380 | | | | | 236,270 | | | | | 1,355,922 | | | | | 1,159,708 | |
Net assets, end of period | | | $ | 257,574 | | | | $ | 296,380 | | | | $ | 1,837,437 | | | | $ | 1,355,922 | |
Accumulated undistributed net investment income (loss) | | | $ | 181 | | | | $ | (1 | ) | | | $ | (8,025 | ) | | | $ | 3,948 | |
The accompanying notes are an integral part of the financial statements.
| | |
| Artisan Partners Funds | | 75 |
ARTISAN PARTNERS FUNDS
Statements of Changes in Net Assets (Continued)
Dollar values in thousands
| | | | | | | | | | | | | | | | | | | | |
| | | GLOBAL SMALL CAP | | GLOBAL VALUE |
| | | Year Ended
9/30/2016 | | Year Ended
9/30/2015 | | Year Ended
9/30/2016 | | Year Ended
9/30/2015 |
| OPERATIONS: | | | | | | | | | | | | | | | | | | | | |
Net investment income (loss) | | | $ | (91 | ) | | | $ | (507 | ) | | | $ | 14,221 | | | | $ | 10,111 | |
Net realized gain (loss) on: | | | | | | | | | | | | | | | | | | | | |
Investments, from unaffiliated issuers | | | | (17,725 | ) | | | | (3,750 | ) | | | | 49,170 | | | | | 87,706 | |
Investments, from affiliated issuers | | | | (891 | ) | | | | (3,309 | ) | | | | (4,125 | ) | | | | (4,067 | ) |
Foreign currency related transactions | | | | 6 | | | | | (53 | ) | | | | 71 | | | | | 3,022 | |
Net increase (decrease) in unrealized appreciation or depreciation on: | | | | | | | | | | | | | | | | | | | | |
Investments, from unaffiliated issuers | | | | 10,912 | | | | | 3,374 | | | | | 156,731 | | | | | (166,279 | ) |
Investments, from affiliated issuers | | | | 2,030 | | | | | (1,259 | ) | | | | (12,575 | ) | | | | 7,112 | |
Foreign currency related transactions | | | | 3 | | | | | 2 | | | | | 448 | | | | | (1,437 | ) |
Net increase (decrease) in net assets resulting from operations | | | | (5,756 | ) | | | | (5,502 | ) | | | | 203,941 | | | | | (63,832 | ) |
| DISTRIBUTIONS PAID TO SHAREHOLDERS: | | | | | | | | | | | | | | | | | | | | |
Net investment income: | | | | | | | | | | | | | | | | | | | | |
Investor Shares | | | | – | | | | | (250 | ) | | | | (2,818 | ) | | | | (6,402 | ) |
Advisor Shares | | | | | | | | | | | | | | (1,461 | ) | | | | – | |
Institutional Shares | | | | | | | | | | | | | | (3,594 | ) | | | | (3,909 | ) |
Net realized gains on investment transactions: | | | | | | | | | | | | | | | | | | | | |
Investor Shares | | | | – | | | | | (2,100 | ) | | | | (43,889 | ) | | | | (35,854 | ) |
Advisor Shares | | | | | | | | | | | | | | (11,719 | ) | | | | – | |
Institutional Shares | | | | | | | | | | | | | | (26,885 | ) | | | | (15,333 | ) |
Total distributions paid to shareholders | | | | – | | | | | (2,350 | ) | | | | (90,366 | ) | | | | (61,498 | ) |
| FUND SHARE ACTIVITIES: | | | | | | | | | | | | | | | | | | | | |
Net increase (decrease) in net assets resulting from fund share activities | | | | (47,044 | ) | | | | (28,165 | ) | | | | 430,386 | | | | | (216,544 | ) |
Total increase (decrease) in net assets | | | | (52,800 | ) | | | | (36,017 | ) | | | | 543,961 | | | | | (341,874 | ) |
Net assets, beginning of period | | | | 130,095 | | | | | 166,112 | | | | | 1,525,306 | | | | | 1,867,180 | |
Net assets, end of period | | | $ | 77,295 | | | | $ | 130,095 | | | | $ | 2,069,267 | | | | $ | 1,525,306 | |
Accumulated undistributed net investment income (loss) | | | $ | (289 | ) | | | $ | (311 | ) | | | $ | 12,682 | | | | $ | 7,501 | |
The accompanying notes are an integral part of the financial statements.
| | |
| 76 | | Artisan Partners Funds |
ARTISAN PARTNERS FUNDS
Statements of Changes in Net Assets (Continued)
Dollar values in thousands
| | | | | | | | | | | | | | | | | | | | |
| | | HIGH INCOME | | INTERNATIONAL |
| | | Year Ended
9/30/2016 | | Year Ended
9/30/2015 | | Year Ended
9/30/2016 | | Year Ended
9/30/2015 |
| OPERATIONS: | | | | | | | | | | | | | | | | | | | | |
Net investment income | | | $ | 88,731 | | | | $ | 41,650 | | | | $ | 189,354 | | | | $ | 109,203 | |
Net realized gain (loss) on: | | | | | | | | | | | | | | | | | | | | |
Investments, from unaffiliated issuers | | | | 1,980 | | | | | 4,468 | | | | | (194,516 | ) | | | | (102,009 | ) |
Investments, from affiliated issuers | | | | – | | | | | – | | | | | (14,393 | ) | | | | 56,701 | |
Foreign currency related transactions | | | | – | | | | | (216 | ) | | | | (2,591 | ) | | | | (5,379 | ) |
Net increase (decrease) in unrealized appreciation or depreciation on: | | | | | | | | | | | | | | | | | | | | |
Investments, from unaffiliated issuers | | | | 82,863 | | | | | (40,918 | ) | | | | 900,103 | | | | | (1,738,726 | ) |
Investments, from affiliated issuers | | | | – | | | | | – | | | | | 49,388 | | | | | (260,710 | ) |
Foreign currency related transactions | | | | – | | | | | (222 | ) | | | | – | | | | | (672 | ) |
Net increase (decrease) in net assets resulting from operations | | | | 173,574 | | | | | 4,762 | | | | | 927,345 | | | | | (1,941,592 | ) |
| DISTRIBUTIONS PAID TO SHAREHOLDERS: | | | | | | | | | | | | | | | | | | | | |
Net investment income: | | | | | | | | | | | | | | | | | | | | |
Investor Shares | | | | (31,811 | ) | | | | (24,905 | ) | | | | (47,225 | ) | | | | (104,597 | ) |
Advisor Shares | | | | (56,920 | ) | | | | (16,745 | ) | | | | (18,156 | ) | | | | – | |
Institutional Shares | | | | | | | | | | | | | | (38,522 | ) | | | | (35,466 | ) |
Net realized gains on investment transactions: | | | | | | | | | | | | | | | | | | | | |
Investor Shares | | | | (1,721 | ) | | | | (1,377 | ) | | | | – | | | | | – | |
Advisor Shares | | | | (2,208 | ) | | | | (1,005 | ) | | | | – | | | | | – | |
Institutional Shares | | | | – | | | | | – | | | | | – | | | | | – | |
Total distributions paid to shareholders | | | | (92,660 | ) | | | | (44,032 | ) | | | | (103,903 | ) | | | | (140,063 | ) |
| FUND SHARE ACTIVITIES: | | | | | | | | | | | | | | | | | | | | |
Net increase (decrease) in net assets resulting from fund share activities | | | | 794,028 | | | | | 447,338 | | | | | (2,433,050 | ) | | | | 2,142,912 | |
Total increase (decrease) in net assets | | | | 874,942 | | | | | 408,068 | | | | | (1,609,608 | ) | | | | 61,257 | |
Net assets, beginning of period | | | | 914,059 | | | | | 505,991 | | | | | 17,595,083 | | | | | 17,533,826 | |
Net assets, end of period | | | $ | 1,789,001 | | | | $ | 914,059 | | | | $ | 15,985,475 | | | | $ | 17,595,083 | |
Accumulated undistributed net investment income (loss) | | | $ | (1,610 | ) | | | $ | (3 | ) | | | $ | 186,639 | | | | $ | 103,515 | |
The accompanying notes are an integral part of the financial statements.
| | |
| Artisan Partners Funds | | 77 |
ARTISAN PARTNERS FUNDS
Statements of Changes in Net Assets (Continued)
Dollar values in thousands
| | | | | | | | | | | | | | | | | | | | |
| | | INTERNATIONAL SMALL CAP | | INTERNATIONAL VALUE |
| | | Year Ended
9/30/2016 | | Year Ended
9/30/2015 | | Year Ended
9/30/2016 | | Year Ended
9/30/2015 |
| OPERATIONS: | | | | | | | | | | | | | | | | | | | | |
Net investment income (loss) | | | $ | (318 | ) | | | $ | 1,360 | | | | $ | 123,528 | | | | $ | 78,562 | |
Net realized gain (loss) on: | | | | | | | | | | | | | | | | | | | | |
Investments, from unaffiliated issuers | | | | 14,861 | | | | | 58,434 | | | | | 323,011 | | | | | 812,186 | |
Investments, from affiliated issuers | | | | 12,247 | | | | | (16,392 | ) | | | | (58,105 | ) | | | | (16,011 | ) |
Foreign currency related transactions | | | | 244 | | | | | (293 | ) | | | | (45,667 | ) | | | | 117,893 | |
Net increase (decrease) in unrealized appreciation or depreciation on: | | | | | | | | | | | | | | | | | | | | |
Investments, from unaffiliated issuers | | | | (20,319 | ) | | | | (12,675 | ) | | | | 421,598 | | | | | (1,369,714 | ) |
Investments, from affiliated issuers | | | | 14,920 | | | | | (11,030 | ) | | | | 234,917 | | | | | (71,468 | ) |
Foreign currency related transactions | | | | 10 | | | | | 44 | | | | | 12,996 | | | | | (56,314 | ) |
Net increase (decrease) in net assets resulting from operations | | | | 21,645 | | | | | 19,448 | | | | | 1,012,278 | | | | | (504,866 | ) |
| DISTRIBUTIONS PAID TO SHAREHOLDERS: | | | | | | | | | | | | | | | | | | | | |
Net investment income: | | | | | | | | | | | | | | | | | | | | |
Investor Shares | | | | (1,285 | ) | | | | – | | | | | (43,280 | ) | | | | (132,953 | ) |
Advisor Shares | | | | | | | | | | | | | | (29,338 | ) | | | | – | |
Institutional Shares | | | | – | | | | | | | | | | (27,773 | ) | | | | (44,007 | ) |
Net realized gains on investment transactions: | | | | | | | | | | | | | | | | | | | | |
Investor Shares | | | | (31,795 | ) | | | | (59,359 | ) | | | | (263,808 | ) | | | | (440,577 | ) |
Advisor Shares | | | | | | | | | | | | | | (144,431 | ) | | | | – | |
Institutional Shares | | | | – | | | | | | | | | | (132,236 | ) | | | | (128,108 | ) |
Total distributions paid to shareholders | | | | (33,080 | ) | | | | (59,359 | ) | | | | (640,866 | ) | | | | (745,645 | ) |
| FUND SHARE ACTIVITIES: | | | | | | | | | | | | | | | | | | | | |
Net increase (decrease) in net assets resulting from fund share activities | | | | (155,064 | ) | | | | (89,145 | ) | | | | 1,085,464 | | | | | 459,664 | |
Total increase (decrease) in net assets | | | | (166,499 | ) | | | | (129,056 | ) | | | | 1,456,876 | | | | | (790,847 | ) |
Net assets, beginning of period | | | | 961,035 | | | | | 1,090,091 | | | | | 10,618,989 | | | | | 11,409,836 | |
Net assets, end of period | | | $ | 794,536 | | | | $ | 961,035 | | | | $ | 12,075,865 | | | | $ | 10,618,989 | |
Accumulated undistributed net investment income (loss) | | | $ | (376 | ) | | | $ | 983 | | | | $ | 73,433 | | | | $ | 103,892 | |
The accompanying notes are an integral part of the financial statements.
| | |
| 78 | | Artisan Partners Funds |
ARTISAN PARTNERS FUNDS
Statements of Changes in Net Assets (Continued)
Dollar values in thousands
| | | | | | | | | | | | | | | | | | | | |
| | | MID CAP | | MID CAP VALUE |
| | | Year Ended
9/30/2016 | | Year Ended
9/30/2015 | | Year Ended
9/30/2016 | | Year Ended
9/30/2015 |
| OPERATIONS: | | | | | | | | | | | | | | | | | | | | |
Net investment income (loss) | | | $ | (51,450 | ) | | | $ | (62,414 | ) | | | $ | 33,034 | | | | $ | 78,150 | |
Net realized gain (loss) on: | | | | | | | | | | | | | | | | | | | | |
Investments, from unaffiliated issuers | | | | 628,623 | | | | | 1,278,012 | | | | | 187,060 | | | | | 1,364,322 | |
Investments, from affiliated issuers | | | | 112,227 | | | | | 8,468 | | | | | (19,253 | ) | | | | (107,549 | ) |
Foreign currency related transactions | | | | – | | | | | – | | | | | – | | | | | – | |
Net increase (decrease) in unrealized appreciation or depreciation on: | | | | | | | | | | | | | | | | | | | | |
Investments, from unaffiliated issuers | | | | 69,027 | | | | | (824,223 | ) | | | | 481,001 | | | | | (1,696,969 | ) |
Investments, from affiliated issuers | | | | (107,530 | ) | | | | (47,458 | ) | | | | (22,061 | ) | | | | (201,469 | ) |
Foreign currency related transactions | | | | – | | | | | – | | | | | – | | | | | – | |
Net increase (decrease) in net assets resulting from operations | | | | 650,897 | | | | | 352,385 | | | | | 659,781 | | | | | (563,515 | ) |
| DISTRIBUTIONS PAID TO SHAREHOLDERS: | | | | | | | | | | | | | | | | | | | | |
Net investment income: | | | | | | | | | | | | | | | | | | | | |
Investor Shares | | | | – | | | | | – | | | | | (16,855 | ) | | | | (56,887 | ) |
Advisor Shares | | | | – | | | | | – | | | | | (6,131 | ) | | | | – | |
Institutional Shares | | | | – | | | | | – | | | | | (8,894 | ) | | | | (15,736 | ) |
Net realized gains on investment transactions: | | | | | | | | | | | | | | | | | | | | |
Investor Shares | | | | (558,234 | ) | | | | (525,174 | ) | | | | (633,415 | ) | | | | (856,469 | ) |
Advisor Shares | | | | (60,916 | ) | | | | – | | | | | (132,262 | ) | | | | – | |
Institutional Shares | | | | (615,647 | ) | | | | (429,114 | ) | | | | (185,540 | ) | | | | (163,097 | ) |
Total distributions paid to shareholders | | | | (1,234,797 | ) | | | | (954,288 | ) | | | | (983,097 | ) | | | | (1,092,189 | ) |
| FUND SHARE ACTIVITIES: | | | | | | | | | | | | | | | | | | | | |
Net decrease in net assets resulting from fund share activities | | | | (172,619 | ) | | | | (75,706 | ) | | | | (2,012,842 | ) | | | | (2,832,587 | ) |
Total decrease in net assets | | | | (756,519 | ) | | | | (677,609 | ) | | | | (2,336,158 | ) | | | | (4,488,291 | ) |
Net assets, beginning of period | | | | 8,823,808 | | | | | 9,501,417 | | | | | 6,519,760 | | | | | 11,008,051 | |
Net assets, end of period | | | $ | 8,067,289 | | | | $ | 8,823,808 | | | | $ | 4,183,602 | | | | $ | 6,519,760 | |
Accumulated undistributed net investment income (loss) | | | $ | (36,664 | ) | | | $ | (48,099 | ) | | | $ | 29,675 | | | | $ | 30,984 | |
The accompanying notes are an integral part of the financial statements.
| | |
| Artisan Partners Funds | | 79 |
ARTISAN PARTNERS FUNDS
Statements of Changes in Net Assets (Continued)
Dollar values in thousands
| | | | | | | | | | | | | | | | | | | | |
| | | SMALL CAP | | VALUE |
| | | Year Ended
9/30/2016 | | Year Ended
9/30/2015 | | Year Ended
9/30/2016 | | Year Ended
9/30/2015 |
| OPERATIONS: | | | | | | | | | | | | | | | | | | | | |
Net investment income (loss) | | | $ | (10,961 | ) | | | $ | (13,975 | ) | | | $ | 7,541 | | | | $ | 11,433 | |
Net realized gain (loss) on: | | | | | | | | | | | | | | | | | | | | |
Investments, from unaffiliated issuers | | | | 12,003 | | | | | 190,485 | | | | | (33,155 | ) | | | | 144,073 | |
Investments, from affiliated issuers | | | | – | | | | | (5,281 | ) | | | | (4,698 | ) | | | | (11,716 | ) |
Foreign currency related transactions | | | | – | | | | | – | | | | | (59 | ) | | | | (109 | ) |
Net increase (decrease) in unrealized appreciation or depreciation on: | | | | | | | | | | | | | | | | | | | | |
Investments, from unaffiliated issuers | | | | 172,409 | | | | | (55,269 | ) | | | | 213,568 | | | | | (241,201 | ) |
Investments, from affiliated issuers | | | | – | | | | | 3,813 | | | | | 13,519 | | | | | (32,727 | ) |
Foreign currency related transactions | | | | – | | | | | – | | | | | 1 | | | | | (16 | ) |
Net increase (decrease) in net assets resulting from operations | | | | 173,451 | | | | | 119,773 | | | | | 196,717 | | | | | (130,263 | ) |
| DISTRIBUTIONS PAID TO SHAREHOLDERS: | | | | | | | | | | | | | | | | | | | | |
Net investment income: | | | | | | | | | | | | | | | | | | | | |
Investor Shares | | | | – | | | | | – | | | | | (1,731 | ) | | | | (9,207 | ) |
Advisor Shares | | | | | | | | | | | | | | (5,135 | ) | | | | – | |
Institutional Shares | | | | – | | | | | – | | | | | (1,725 | ) | | | | (3,246 | ) |
Net realized gains on investment transactions: | | | | | | | | | | | | | | | | | | | | |
Investor Shares | | | | (81,079 | ) | | | | – | | | | | (30,415 | ) | | | | (74,612 | ) |
Advisor Shares | | | | | | | | | | | | | | (44,468 | ) | | | | – | |
Institutional Shares | | | | (36,970 | ) | | | | – | | | | | (14,645 | ) | | | | (19,962 | ) |
Total distributions paid to shareholders | | | | (118,049 | ) | | | | – | | | | | (98,119 | ) | | | | (107,027 | ) |
| FUND SHARE ACTIVITIES: | | | | | | | | | | | | | | | | | | | | |
Net decrease in net assets resulting from fund share activities | | | | (26,140 | ) | | | | (326,206 | ) | | | | (279,682 | ) | | | | (250,633 | ) |
Total increase (decrease) in net assets | | | | 29,262 | | | | | (206,433 | ) | | | | (181,084 | ) | | | | (487,923 | ) |
Net assets, beginning of period | | | | 1,253,260 | | | | | 1,459,693 | | | | | 988,697 | | | | | 1,476,620 | |
Net assets, end of period | | | $ | 1,282,522 | | | | $ | 1,253,260 | | | | $ | 807,613 | | | | $ | 988,697 | |
Accumulated undistributed net investment income (loss) | | | $ | (7,965 | ) | | | $ | (10,074 | ) | | | $ | 4,781 | | | | $ | 7,097 | |
The accompanying notes are an integral part of the financial statements.
| | |
| 80 | | Artisan Partners Funds |
[THIS PAGE INTENTIONALLY LEFT BLANK]
ARTISAN PARTNERS FUNDS
Financial Highlights – For a share outstanding throughout each period
The financial highlights tables are intended to help you understand the Fund’s financial performance for the past five years or, if shorter, the period of a Fund’s operations. Certain information reflects financial results for a single Fund share. The total returns in the table represent the rate that an investor would have earned or lost on an investment in the Fund (assuming reinvestment of all dividends and distributions).
| | | | | | | | | | | | | | | | | | | | | | | | | | | | | | | | | | | | |
| | | | | | | | | | | | | | | Less Distributions From | | | | | | | |
| | | Net
Asset
Value,
Beginning
of Period | | | Net
Investment
Income (Loss)(1)* | | | Net Realized
and Unrealized
Gain (Loss) on
Investments | | | Total
from
Operations | | | Net
Investment
Income | | | Net
Realized
Gains | | | Total
Distributions | | | Redemption
Fees^ | | | Net
Asset
Value,
End
of Period | |
| DEVELOPING WORLD FUND | | | | | | | | | | | | | | | | | | | | | | | | | | | | | |
Investor Shares | | | | | | | | | | | | | | | | | | | | | | | | | | | | | | | | | | | | |
9/30/2016 | | $ | 8.39 | | | | 0.02 | | | | 2.10 | | | | 2.12 | | | | — | | | | — | | | | — | | | | — | | | $ | 10.51 | |
9/30/2015(5) | | $ | 10.00 | | | | — | (6) | | | (1.61 | ) | | | (1.61 | ) | | | — | | | | — | | | | — | | | | — | | | $ | 8.39 | |
Advisor Shares | | | | | | | | | | | | | | | | | | | | | | | | | | | | | | | | | | | | |
9/30/2016 | | $ | 8.39 | | | | 0.03 | | | | 2.12 | | | | 2.15 | | | | — | | | | — | | | | — | | | | — | | | $ | 10.54 | |
9/30/2015(5) | | $ | 10.00 | | | | (0.01 | ) | | | (1.60 | ) | | | (1.61 | ) | | | — | | | | — | | | | — | | | | — | | | $ | 8.39 | |
Institutional Shares | | | | | | | | | | | | | | | | | | | | | | | | | | | | | | | | | | | | |
9/30/2016 | | $ | 8.39 | | | | 0.04 | | | | 2.13 | | | | 2.17 | | | | — | | | | — | | | | — | | | | — | | | $ | 10.56 | |
9/30/2015(5) | | $ | 10.00 | | | | (0.01 | ) | | | (1.60 | ) | | | (1.61 | ) | | | — | | | | — | | | | — | | | | — | | | $ | 8.39 | |
| EMERGING MARKETS FUND | | | | | | | | | | | | | | | | | | | | | | | | | | | | | |
Investor Shares(7) | | | | | | | | | | | | | | | | | | | | | | | | | | | | | | | | | | | | |
9/30/2016* | | $ | 9.90 | | | | 0.19 | | | | 2.66 | | | | 2.85 | | | | — | | | | — | | | | — | | | | — | | | $ | 12.75 | |
9/30/2015 | | $ | 12.54 | | | | 0.02 | | | | (2.56 | ) | | | (2.54 | ) | | | (0.10 | ) | | | — | | | | (0.10 | ) | | | — | | | $ | 9.90 | |
9/30/2014 | | $ | 12.32 | | | | 0.08 | | | | 0.20 | | | | 0.28 | | | | (0.06 | ) | | | — | | | | (0.06 | ) | | | — | | | $ | 12.54 | |
9/30/2013 | | $ | 12.76 | | | | 0.10 | | | | (0.38 | ) | | | (0.28 | ) | | | (0.16 | ) | | | — | | | | (0.16 | ) | | | — | | | $ | 12.32 | |
9/30/2012 | | $ | 11.38 | | | | 0.10 | | | | 1.38 | | | | 1.48 | | | | (0.07 | ) | | | (0.03 | ) | | | (0.10 | ) | | | — | | | $ | 12.76 | |
Institutional Shares | | | | | | | | | | | | | | | | | | | | | | | | | | | | | | | | | | | | |
9/30/2016* | | $ | 9.83 | | | | 0.03 | | | | 2.79 | | | | 2.82 | | | | — | | | | — | | | | — | | | | — | | | $ | 12.65 | |
9/30/2015 | | $ | 12.52 | | | | 0.02 | | | | (2.53 | ) | | | (2.51 | ) | | | (0.18 | ) | | | — | | | | (0.18 | ) | | | — | | | $ | 9.83 | |
9/30/2014 | | $ | 12.32 | | | | 0.12 | | | | 0.20 | | | | 0.32 | | | | (0.12 | ) | | | — | | | | (0.12 | ) | | | — | | | $ | 12.52 | |
9/30/2013 | | $ | 12.75 | | | | 0.14 | | | | (0.37 | ) | | | (0.23 | ) | | | (0.20 | ) | | | — | | | | (0.20 | ) | | | — | | | $ | 12.32 | |
9/30/2012 | | $ | 11.37 | | | | 0.15 | | | | 1.36 | | | | 1.51 | | | | (0.10 | ) | | | (0.03 | ) | | | (0.13 | ) | | | — | | | $ | 12.75 | |
| GLOBAL EQUITY FUND | | | | | | | | | | | | | | | | | | | | | | | | | | | | | |
Investor Shares | | | | | | | | | | | | | | | | | | | | | | | | | | | | | | | | | | | | |
9/30/2016 | | $ | 15.73 | | | | (0.01 | ) | | | 1.17 | | | | 1.16 | | | | — | | | | (0.35 | ) | | | (0.35 | ) | | | — | | | $ | 16.54 | |
9/30/2015 | | $ | 16.18 | | | | (0.03 | ) | | | 0.07 | | | | 0.04 | | | | — | | | | (0.49 | ) | | | (0.49 | ) | | | — | | | $ | 15.73 | |
9/30/2014 | | $ | 15.72 | | | | (0.02 | ) | | | 1.23 | | | | 1.21 | | | | — | | | | (0.75 | ) | | | (0.75 | ) | | | — | | | $ | 16.18 | |
9/30/2013 | | $ | 13.05 | | | | (0.01 | ) | | | 3.23 | | | | 3.22 | | | | (0.03 | ) | | | (0.52 | ) | | | (0.55 | ) | | | — | | | $ | 15.72 | |
9/30/2012 | | $ | 9.83 | | | | 0.05 | | | | 3.38 | | | | 3.43 | | | | (0.03 | ) | | | (0.18 | ) | | | (0.21 | ) | | | — | | | $ | 13.05 | |
Institutional Shares | | | | | | | | | | | | | | | | | | | | | | | | | | | | | | | | | | | | |
9/30/2016(8) | | $ | 16.44 | | | | 0.06 | | | | 0.43 | | | | 0.49 | | | | — | | | | (0.35 | ) | | | (0.35 | ) | | | — | | | $ | 16.58 | |
Footnotes are presented on Page 93.
The accompanying notes are an integral part of the financial statements.
| | |
| 82 | | Artisan Partners Funds |
ARTISAN PARTNERS FUNDS
Financial Highlights – continued
| | | | | | | | | | | | | | | | | | | | | | | | |
| | | Total
Return(2) | | | Net Assets,
End
of Period
(000) | | | Ratio of
Expenses
to Average
Net Assets(3)(4) | | | Ratio of
Expenses
to Average
Net Assets
Excluding
Waivers(3) | | | Ratio
of Net
Investment
Income (Loss)
to Average
Net Assets(3)(4) | | | Portfolio
Turnover
Rate(2) | |
| DEVELOPING WORLD FUND | | | | | | | | | | | | | | | | | |
Investor Shares | | | | | | | | | | | | | | | | | | | | | | | | |
9/30/2016 | | | 25.27 | % | | $ | 266,122 | | | | 1.50 | % | | | 1.52 | % | | | 0.25 | % | | | 47.59 | % |
9/30/2015(5) | | | (16.10 | )% | | $ | 20,642 | | | | 1.50 | % | | | 2.23 | % | | | (0.20 | )% | | | 9.00 | % |
Advisor Shares | | | | | | | | | | | | | | | | | | | | | | | | |
9/30/2016 | | | 25.63 | % | | $ | 340,831 | | | | 1.25 | % | | | n/a | | | | 0.28 | % | | | 47.59 | % |
9/30/2015(5) | | | (16.10 | )% | | $ | 58,196 | | | | 1.40 | % | | | 1.96 | % | | | (0.37 | )% | | | 9.00 | % |
Institutional Shares | | | | | | | | | | | | | | | | | | | | | | | | |
9/30/2016 | | | 25.86 | % | | $ | 277,691 | | | | 1.15 | % | | | n/a | | | | 0.44 | % | | | 47.59 | % |
9/30/2015(5) | | | (16.10 | )% | | $ | 39,993 | | | | 1.40 | % | | | 2.03 | % | | | (0.44 | )% | | | 9.00 | % |
| EMERGING MARKETS FUND | | | | | | | | | | | | | | | | | |
Investor Shares(7) | | | | | | | | | | | | | | | | | | | | | | | | |
9/30/2016* | | | 28.79 | % | | $ | 30,135 | | | | 0.94 | % | | | 1.85 | % | | | 1.68 | % | | | 45.79 | % |
9/30/2015 | | | (20.44 | )% | | $ | 22,842 | | | | 1.50 | % | | | 1.79 | % | | | 0.16 | % | | | 28.03 | % |
9/30/2014 | | | 2.29 | % | | $ | 67,065 | | | | 1.50 | % | | | 1.51 | % | | | 0.64 | % | | | 32.26 | % |
9/30/2013 | | | (2.25 | )% | | $ | 199,920 | | | | 1.48 | % | | | n/a | | | | 0.76 | % | | | 35.89 | % |
9/30/2012 | | | 13.10 | % | | $ | 292,420 | | | | 1.48 | % | | | n/a | | | | 0.85 | % | | | 38.19 | % |
Institutional Shares | | | | | | | | | | | | | | | | | | | | | | | | |
9/30/2016* | | | 28.69 | % | | $ | 6,555 | | | | 1.26 | % | | | 1.79 | % | | | 0.29 | % | | | 45.79 | % |
9/30/2015 | | | (20.43 | )% | | $ | 27,961 | | | | 1.36 | % | | | n/a | | | | 0.16 | % | | | 28.03 | % |
9/30/2014 | | | 2.65 | % | | $ | 338,286 | | | | 1.19 | % | | | n/a | | | | 0.96 | % | | | 32.26 | % |
9/30/2013 | | | (1.91 | )% | | $ | 462,471 | | | | 1.18 | % | | | n/a | | | | 1.15 | % | | | 35.89 | % |
9/30/2012 | | | 13.47 | % | | $ | 494,836 | | | | 1.16 | % | | | n/a | | | | 1.25 | % | | | 38.19 | % |
| GLOBAL EQUITY FUND | | | | | | | | | | | | | | | | | |
Investor Shares | | | | | | | | | | | | | | | | | | | | | | | | |
9/30/2016 | | | 7.40 | % | | $ | 145,817 | | | | 1.37 | % | | | n/a | | | | (0.09 | )% | | | 96.23 | % |
9/30/2015 | | | 0.20 | % | | $ | 296,380 | | | | 1.37 | % | | | n/a | | | | (0.19 | )% | | | 78.44 | % |
9/30/2014 | | | 7.94 | % | | $ | 236,270 | | | | 1.46 | % | | | n/a | | | | (0.14 | )% | | | 89.24 | % |
9/30/2013 | | | 25.51 | % | | $ | 156,091 | | | | 1.50 | % | | | 1.77 | % | | | (0.08 | )% | | | 126.40 | % |
9/30/2012 | | | 35.43 | % | | $ | 15,538 | | | | 1.50 | % | | | 3.05 | % | | | 0.43 | % | | | 98.03 | % |
Institutional Shares | | | | | | | | | | | | | | | | | | | | | | | | |
9/30/2016(8) | | | 3.01 | % | | $ | 111,757 | | | | 1.11 | % | | | n/a | | | | 0.37 | % | | | 96.23 | % |
Footnotes are presented on Page 93.
The accompanying notes are an integral part of the financial statements.
| | |
| Artisan Partners Funds | | 83 |
ARTISAN PARTNERS FUNDS
Financial Highlights – For a share outstanding throughout each period
| | | | | | | | | | | | | | | | | | | | | | | | | | | | | | | | | | | | |
| | | | | | | | | | | | | | | Less Distributions From | | | | | | | |
| | | Net
Asset
Value,
Beginning
of Period | | | Net
Investment
Income (Loss)(1) | | | Net Realized
and Unrealized
Gain (Loss) on
Investments | | | Total
from
Operations | | | Net
Investment
Income | | | Net
Realized
Gains | | | Total
Distributions | | | Redemption
Fees^ | | | Net
Asset
Value,
End
of Period | |
| GLOBAL OPPORTUNITIES FUND | | | | | | | | | | | | | | | | | | | | | | | | | | | | | |
Investor Shares | | | | | | | | | | | | | | | | | | | | | | | | | | | | | | | | | | | | |
9/30/2016 | | $ | 18.35 | | | | (0.06 | ) | | | 3.59 | | | | 3.53 | | | | (0.02 | ) | | | (0.12 | ) | | | (0.14 | ) | | | — | | | $ | 21.74 | |
9/30/2015 | | $ | 18.92 | | | | 0.01 | | | | (0.09 | ) | | | (0.08 | ) | | | (0.06 | ) | | | (0.43 | ) | | | (0.49 | ) | | | — | | | $ | 18.35 | |
9/30/2014 | | $ | 17.29 | | | | 0.01 | | | | 1.62 | | | | 1.63 | | | | — | | | | — | | | | — | | | | — | | | $ | 18.92 | |
9/30/2013 | | $ | 14.27 | | | | (0.05 | ) | | | 3.07 | | | | 3.02 | | �� | | — | | | | — | | | | — | | | | — | | | $ | 17.29 | |
9/30/2012 | | $ | 10.90 | | | | (0.06 | ) | | | 3.54 | | | | 3.48 | | | | — | | | | (0.11 | ) | | | (0.11 | ) | | | — | | | $ | 14.27 | |
Advisor Shares | | | | | | | | | | | | | | | | | | | | | | | | | | | | | | | | | | | | |
9/30/2016 | | $ | 18.37 | | | | (0.03 | ) | | | 3.58 | | | | 3.55 | | | | (0.04 | ) | | | (0.12 | ) | | | (0.16 | ) | | | — | | | $ | 21.76 | |
9/30/2015(9) | | $ | 19.16 | | | | 0.02 | | | | (0.81 | ) | | | (0.79 | ) | | | — | | | | — | | | | — | | | | — | | | $ | 18.37 | |
Institutional Shares | | | | | | | | | | | | | | | | | | | | | | | | | | | | | | | | | | | | |
9/30/2016 | | $ | 18.46 | | | | (0.01 | ) | | | 3.61 | | | | 3.60 | | | | (0.05 | ) | | | (0.12 | ) | | | (0.17 | ) | | | — | | | $ | 21.89 | |
9/30/2015 | | $ | 19.04 | | | | 0.07 | | | | (0.11 | ) | | | (0.04 | ) | | | (0.11 | ) | | | (0.43 | ) | | | (0.54 | ) | | | — | | | $ | 18.46 | |
9/30/2014 | | $ | 17.35 | | | | 0.07 | | | | 1.62 | | | | 1.69 | | | | — | | | | — | | | | — | | | | — | | | $ | 19.04 | |
9/30/2013 | | $ | 14.29 | | | | (0.01 | ) | | | 3.07 | | | | 3.06 | | | | — | | | | — | | | | — | | | | — | | | $ | 17.35 | |
9/30/2012 | | $ | 10.88 | | | | 0.01 | | | | 3.51 | | | | 3.52 | | | | — | | | | (0.11 | ) | | | (0.11 | ) | | | — | | | $ | 14.29 | |
| GLOBAL SMALL CAP FUND | | | | | | | | | | | | | | | | | | | | | | | | | | | | | |
Investor Shares | | | | | | | | | | | | | | | | | | | | | | | | | | | | | | | | | | | | |
9/30/2016 | | $ | 10.63 | | | | (0.01 | ) | | | (0.42 | ) | | | (0.43 | ) | | | — | | | | — | | | | — | | | | — | | | $ | 10.20 | |
9/30/2015 | | $ | 11.07 | | | | (0.04 | ) | | | (0.24 | ) | | | (0.28 | ) | | | (0.02 | ) | | | (0.14 | ) | | | (0.16 | ) | | | — | | | $ | 10.63 | |
9/30/2014 | | $ | 10.61 | | | | 0.01 | | | | 0.48 | | | | 0.49 | | | | (0.01 | ) | | | (0.02 | ) | | | (0.03 | ) | | | — | | | $ | 11.07 | |
9/30/2013(10) | | $ | 10.00 | | | | 0.01 | | | | 0.60 | | | | 0.61 | | | | — | | | | — | | | | — | | | | — | | | $ | 10.61 | |
| GLOBAL VALUE FUND | | | | | | | | | | | | | | | | | | | | | | | | | | | | | |
Investor Shares | | | | | | | | | | | | | | | | | | | | | | | | | | | | | | | | | | | | |
9/30/2016 | | $ | 14.47 | | | | 0.10 | | | | 1.58 | | | | 1.68 | | | | (0.05 | ) | | | (0.80 | ) | | | (0.85 | ) | | | — | | | $ | 15.30 | |
9/30/2015 | | $ | 15.63 | | | | 0.07 | | | | (0.71 | ) | | | (0.64 | ) | | | (0.08 | ) | | | (0.44 | ) | | | (0.52 | ) | | | — | | | $ | 14.47 | |
9/30/2014 | | $ | 14.44 | | | | 0.09 | | | | 1.45 | | | | 1.54 | | | | (0.09 | ) | | | (0.26 | ) | | | (0.35 | ) | | | — | | | $ | 15.63 | |
9/30/2013 | | $ | 11.58 | | | | 0.06 | | | | 2.89 | | | | 2.95 | | | | (0.06 | ) | | | (0.03 | ) | | | (0.09 | ) | | | — | | | $ | 14.44 | |
9/30/2012 | | $ | 9.28 | | | | 0.05 | | | | 2.42 | | | | 2.47 | | | | — | | | | (0.17 | ) | | | (0.17 | ) | | | — | | | $ | 11.58 | |
Advisor Shares | | | | | | | | | | | | | | | | | | | | | | | | | | | | | | | | | | | | |
9/30/2016 | | $ | 14.48 | | | | 0.13 | | | | 1.57 | | | | 1.70 | | | | (0.10 | ) | | | (0.80 | ) | | | (0.90 | ) | | | — | | | $ | 15.28 | |
9/30/2015(9) | | $ | 15.60 | | | | 0.05 | | | | (1.17 | ) | | | (1.12 | ) | | | — | | | | — | | | | — | | | | — | | | $ | 14.48 | |
Institutional Shares | | | | | | | | | | | | | | | | | | | | | | | | | | | | | | | | | | | | |
9/30/2016 | | $ | 14.50 | | | | 0.14 | | | | 1.59 | | | | 1.73 | | | | (0.11 | ) | | | (0.80 | ) | | | (0.91 | ) | | | — | | | $ | 15.32 | |
9/30/2015 | | $ | 15.67 | | | | 0.11 | | | | (0.73 | ) | | | (0.62 | ) | | | (0.11 | ) | | | (0.44 | ) | | | (0.55 | ) | | | — | | | $ | 14.50 | |
9/30/2014 | | $ | 14.46 | | | | 0.13 | | | | 1.45 | | | | 1.58 | | | | (0.11 | ) | | | (0.26 | ) | | | (0.37 | ) | | | — | | | $ | 15.67 | |
9/30/2013 | | $ | 11.58 | | | | 0.07 | | | | 2.91 | | | | 2.98 | | | | (0.07 | ) | | | (0.03 | ) | | | (0.10 | ) | | | — | | | $ | 14.46 | |
9/30/2012(11) | | $ | 10.75 | | | | 0.01 | | | | 0.82 | | | | 0.83 | | | | — | | | | — | | | | — | | | | — | | | $ | 11.58 | |
Footnotes are presented on Page 93.
The accompanying notes are an integral part of the financial statements.
| | |
| 84 | | Artisan Partners Funds |
ARTISAN PARTNERS FUNDS
Financial Highlights – continued
| | | | | | | | | | | | | | | | | | | | | | | | |
| | | Total
Return(2) | | | Net Assets,
End
of Period
(000) | | | Ratio of
Expenses
to Average
Net Assets(3)(4) | | | Ratio of
Expenses
to Average
Net Assets
Excluding
Waivers(3) | | | Ratio
of Net
Investment
Income (Loss)
to Average
Net Assets(3)(4) | | | Portfolio
Turnover
Rate(2) | |
| GLOBAL OPPORTUNITIES FUND | | | | | | | | | | | | | | | | | |
Investor Shares | | | | | | | | | | | | | | | | | | | | | | | | |
9/30/2016 | | | 19.29 | % | | $ | 781,877 | | | | 1.17 | % | | | n/a | | | | (0.33 | )% | | | 34.62 | % |
9/30/2015 | | | (0.46 | )% | | $ | 669,846 | | | | 1.19 | % | | | n/a | | | | 0.07 | % | | | 55.53 | % |
9/30/2014 | | | 9.43 | % | | $ | 724,237 | | | | 1.20 | % | | | n/a | | | | 0.07 | % | | | 45.14 | % |
9/30/2013 | | | 21.16 | % | | $ | 542,242 | | | | 1.28 | % | | | n/a | | | | (0.29 | )% | | | 41.76 | % |
9/30/2012 | | | 32.37 | % | | $ | 228,090 | | | | 1.34 | % | | | n/a | | | | (0.46 | )% | | | 43.30 | % |
Advisor Shares | | | | | | | | | | | | | | | | | | | | | | | | |
9/30/2016 | | | 19.37 | % | | $ | 193,230 | | | | 1.08 | % | | | n/a | | | | (0.16 | )% | | | 34.62 | % |
9/30/2015(9) | | | (4.12 | )% | | $ | 54,172 | | | | 1.10 | % | | | 1.46 | % | | | 0.24 | % | | | 55.53 | % |
Institutional Shares | | | | | | | | | | | | | | | | | | | | | | | | |
9/30/2016 | | | 19.60 | % | | $ | 862,330 | | | | 0.92 | % | | | n/a | | | | (0.07 | )% | | | 34.62 | % |
9/30/2015 | | | (0.23 | )% | | $ | 631,904 | | | | 0.95 | % | | | n/a | | | | 0.36 | % | | | 55.53 | % |
9/30/2014 | | | 9.74 | % | | $ | 435,471 | | | | 0.97 | % | | | n/a | | | | 0.35 | % | | | 45.14 | % |
9/30/2013 | | | 21.41 | % | | $ | 211,907 | | | | 1.03 | % | | | n/a | | | | (0.05 | )% | | | 41.76 | % |
9/30/2012 | | | 32.68 | % | | $ | 84,183 | | | | 1.08 | % | | | n/a | | | | 0.07 | % | | | 43.30 | % |
| GLOBAL SMALL CAP FUND | | | | | | | | | | | | | | | | | |
Investor Shares | | | | | | | | | | | | | | | | | | | | | | | | |
9/30/2016 | | | (4.05 | )% | | $ | 77,295 | | | | 1.47 | % | | | 1.57 | % | | | (0.08 | )% | | | 87.35 | % |
9/30/2015 | | | (2.56 | )% | | $ | 130,095 | | | | 1.50 | % | | | 1.53 | % | | | (0.36 | )% | | | 89.66 | % |
9/30/2014 | | | 4.62 | % | | $ | 166,112 | | | | 1.50 | % | | | 1.55 | % | | | 0.09 | % | | | 72.15 | % |
9/30/2013(10) | | | 6.10 | % | | $ | 39,578 | | | | 1.50 | % | | | 2.51 | % | | | 0.37 | % | | | 9.98 | % |
| GLOBAL VALUE FUND | | | | | | | | | | | | | | | | | |
Investor Shares | | | | | | | | | | | | | | | | | | | | | | | | |
9/30/2016 | | | 11.86 | % | | $ | 748,254 | | | | 1.26 | % | | | n/a | | | | 0.70 | % | | | 20.52 | % |
9/30/2015 | | | (4.32 | )% | | $ | 826,965 | | | | 1.28 | % | | | n/a | | | | 0.46 | % | | | 19.41 | % |
9/30/2014 | | | 10.75 | % | | $ | 1,308,060 | | | | 1.30 | % | | | n/a | | | | 0.59 | % | | | 25.41 | % |
9/30/2013 | | | 25.68 | % | | $ | 783,265 | | | | 1.37 | % | | | n/a | | | | 0.45 | % | | | 30.79 | % |
9/30/2012 | | | 26.90 | % | | $ | 217,057 | | | | 1.50 | % | | | 1.51 | % | | | 0.50 | % | | | 22.34 | % |
Advisor Shares | | | | | | | | | | | | | | | | | | | | | | | | |
9/30/2016 | | | 12.00 | % | | $ | 403,036 | | | | 1.14 | % | | | n/a | | | | 0.88 | % | | | 20.52 | % |
9/30/2015(9) | | | (7.18 | )% | | $ | 185,741 | | | | 1.20 | % | | | 1.23 | % | | | 0.70 | % | | | 19.41 | % |
Institutional Shares | | | | | | | | | | | | | | | | | | | | | | | | |
9/30/2016 | | | 12.18 | % | | $ | 917,977 | | | | 1.03 | % | | | n/a | | | | 0.97 | % | | | 20.52 | % |
9/30/2015 | | | (4.16 | )% | | $ | 512,600 | | | | 1.03 | % | | | n/a | | | | 0.73 | % | | | 19.41 | % |
9/30/2014 | | | 11.05 | % | | $ | 559,120 | | | | 1.04 | % | | | n/a | | | | 0.82 | % | | | 25.41 | % |
9/30/2013 | | | 25.98 | % | | $ | 361,556 | | | | 1.10 | % | | | n/a | | | | 0.54 | % | | | 30.79 | % |
9/30/2012(11) | | | 7.72 | % | | $ | 48,849 | | | | 1.50 | % | | | 2.43 | % | | | 0.32 | % | | | 22.34 | % |
Footnotes are presented on Page 93.
The accompanying notes are an integral part of the financial statements.
| | |
| Artisan Partners Funds | | 85 |
ARTISAN PARTNERS FUNDS
Financial Highlights – For a share outstanding throughout each period
| | | | | | | | | | | | | | | | | | | | | | | | | | | | | | | | | | | | |
| | | | | | | | | | | | | | | Less Distributions From | | | | | | | |
| | | Net
Asset
Value,
Beginning
of Period | | | Net
Investment
Income (Loss)(1) | | | Net Realized
and Unrealized
Gain (Loss) on
Investments | | | Total
from
Operations | | | Net
Investment
Income | | | Net
Realized
Gains | | | Total
Distributions | | | Redemption
Fees^ | | | Net
Asset
Value,
End
of Period | |
| HIGH INCOME FUND | | | | | | | | | | | | | | | | | | | | | | | | | | | | | |
Investor Shares | | | | | | | | | | | | | | | | | | | | | | | | | | | | | | | | | | | | |
9/30/2016 | | $ | 9.49 | | | | 0.63 | | | | 0.40 | | | | 1.03 | | | | (0.63 | ) | | | (0.04 | ) | | | (0.67 | ) | | | — | | | $ | 9.85 | |
9/30/2015 | | $ | 9.97 | | | | 0.61 | | | | (0.44 | ) | | | 0.17 | | | | (0.61 | ) | | | (0.04 | ) | | | (0.65 | ) | | | — | | | $ | 9.49 | |
9/30/2014(12) | | $ | 10.00 | | | | 0.27 | | | | (0.07 | ) | | | 0.20 | | | | (0.24 | ) | | | — | | | | (0.24 | ) | | | 0.01 | | | $ | 9.97 | |
Advisor Shares | | | | | | | | | | | | | | | | | | | | | | | | | | | | | | | | | | | | |
9/30/2016 | | $ | 9.49 | | | | 0.64 | | | | 0.41 | | | | 1.05 | | | | (0.65 | ) | | | (0.04 | ) | | | (0.69 | ) | | | — | | | $ | 9.85 | |
9/30/2015 | | $ | 9.97 | | | | 0.63 | | | | (0.44 | ) | | | 0.19 | | | | (0.63 | ) | | | (0.04 | ) | | | (0.67 | ) | | | — | | | $ | 9.49 | |
9/30/2014(12) | | $ | 10.00 | | | | 0.28 | | | | (0.08 | ) | | | 0.20 | | | | (0.24 | ) | | | — | | | | (0.24 | ) | | | 0.01 | | | $ | 9.97 | |
| INTERNATIONAL FUND | | | | | | | | | | | | | | | | | | | | | | | | | | | | | |
Investor Shares | | | | | | | | | | | | | | | | | | | | | | | | | | | | | | | | | | | | |
9/30/2016 | | $ | 26.97 | | | | 0.27 | | | | 1.19 | | | | 1.46 | | | | (0.13 | ) | | | — | | | | (0.13 | ) | | | — | | | $ | 28.30 | |
9/30/2015 | | $ | 30.04 | | | | 0.17 | | | | (3.01 | ) | | | (2.84 | ) | | | (0.23 | ) | | | — | | | | (0.23 | ) | | | — | | | $ | 26.97 | |
9/30/2014 | | $ | 28.66 | | | | 0.26 | | | | 1.41 | | | | 1.67 | | | | (0.29 | ) | | | — | | | | (0.29 | ) | | | — | | | $ | 30.04 | |
9/30/2013 | | $ | 23.54 | | | | 0.31 | | | | 5.08 | | | | 5.39 | | | | (0.27 | ) | | | — | | | | (0.27 | ) | | | — | | | $ | 28.66 | |
9/30/2012 | | $ | 18.37 | | | | 0.28 | | | | 5.17 | | | | 5.45 | | | | (0.28 | ) | | | — | | | | (0.28 | ) | | | — | | | $ | 23.54 | |
Advisor Shares | | | | | | | | | | | | | | | | | | | | | | | | | | | | | | | | | | | | |
9/30/2016 | | $ | 27.00 | | | | 0.34 | | | | 1.17 | | | | 1.51 | | | | (0.20 | ) | | | — | | | | (0.20 | ) | | | — | | | $ | 28.31 | |
9/30/2015(9) | | $ | 31.25 | | | | 0.07 | | | | (4.32 | ) | | | (4.25 | ) | | | — | | | | — | | | | — | | | | — | | | $ | 27.00 | |
Institutional Shares | | | | | | | | | | | | | | | | | | | | | | | | | | | | | | | | | | | | |
9/30/2016 | | $ | 27.19 | | | | 0.36 | | | | 1.17 | | | | 1.53 | | | | (0.21 | ) | | | — | | | | (0.21 | ) | | | — | | | $ | 28.51 | |
9/30/2015 | | $ | 30.27 | | | | 0.21 | | | | (3.00 | ) | | | (2.79 | ) | | | (0.29 | ) | | | — | | | | (0.29 | ) | | | — | | | $ | 27.19 | |
9/30/2014 | | $ | 28.86 | | | | 0.32 | | | | 1.43 | | | | 1.75 | | | | (0.34 | ) | | | — | | | | (0.34 | ) | | | — | | | $ | 30.27 | |
9/30/2013 | | $ | 23.70 | | | | 0.38 | | | | 5.10 | | | | 5.48 | | | | (0.32 | ) | | | — | | | | (0.32 | ) | | | — | | | $ | 28.86 | |
9/30/2012 | | $ | 18.50 | | | | 0.33 | | | | 5.21 | | | | 5.54 | | | | (0.34 | ) | | | — | | | | (0.34 | ) | | | — | | | $ | 23.70 | |
| INTERNATIONAL SMALL CAP FUND | | | | | | | | | | | | | | | | | | | | | |
Investor Shares | | | | | | | | | | | | | | | | | | | | | | | | | | | | | | | | | | | | |
9/30/2016 | | $ | 23.37 | | | | (0.02 | ) | | | 0.63 | | | | 0.61 | | | | (0.03 | ) | | | (0.78 | ) | | | (0.81 | ) | | | — | | | $ | 23.17 | |
9/30/2015 | | $ | 24.30 | | | | 0.03 | | | | 0.42 | | | | 0.45 | | | | — | | | | (1.38 | ) | | | (1.38 | ) | | | — | | | $ | 23.37 | |
9/30/2014 | | $ | 26.39 | | | | (0.01 | ) | | | (0.35 | ) | | | (0.36 | ) | | | (0.12 | ) | | | (1.61 | ) | | | (1.73 | ) | | | — | | | $ | 24.30 | |
9/30/2013 | | $ | 20.75 | | | | 0.05 | | | | 5.82 | | | | 5.87 | | | | (0.23 | ) | | | — | | | | (0.23 | ) | | | — | | | $ | 26.39 | |
9/30/2012 | | $ | 16.44 | | | | 0.24 | | | | 4.14 | | | | 4.38 | | | | (0.07 | ) | | | — | | | | (0.07 | ) | | | — | | | $ | 20.75 | |
Institutional Shares | | | | | | | | | | | | | | | | | | | | | | | | | | | | | | | | | | | | |
9/30/2016(13) | | $ | 22.54 | | | | 0.04 | | | | 0.60 | | | | 0.64 | | | | — | | | | — | | | | — | | | | — | | | $ | 23.18 | |
Footnotes are presented on Page 93.
The accompanying notes are an integral part of the financial statements.
| | |
| 86 | | Artisan Partners Funds |
ARTISAN PARTNERS FUNDS
Financial Highlights – continued
| | | | | | | | | | | | | | | | | | | | | | | | |
| | | Total
Return(2) | | | Net Assets,
End
of Period
(000) | | | Ratio of
Expenses
to Average
Net Assets(3)(4) | | | Ratio of
Expenses
to Average
Net Assets
Excluding
Waivers(3) | | | Ratio
of Net
Investment
Income (Loss)
to Average
Net Assets(3)(4) | | | Portfolio
Turnover
Rate(2) | |
| HIGH INCOME FUND | | | | | | | | | | | | | | | | | |
Investor Shares | | | | | | | | | | | | | | | | | | | | | | | | |
9/30/2016 | | | 11.40 | % | | $ | 544,969 | | | | 1.03 | % | | | n/a | | | | 6.66 | % | | | 69.41 | % |
9/30/2015 | | | 1.73 | % | | $ | 424,685 | | | | 1.09 | % | | | n/a | | | | 6.20 | % | | | 91.33 | % |
9/30/2014(12) | | | 2.08 | % | | $ | 278,360 | | | | 1.11 | % | | | n/a | | | | 5.01 | % | | | 56.46 | % |
Advisor Shares | | | | | | | | | | | | | | | | | | | | | | | | |
9/30/2016 | | | 11.61 | % | | $ | 1,244,032 | | | | 0.84 | % | | | n/a | | | | 6.81 | % | | | 69.41 | % |
9/30/2015 | | | 1.88 | % | | $ | 489,374 | | | | 0.93 | % | | | n/a | | | | 6.38 | % | | | 91.33 | % |
9/30/2014(12) | | | 2.12 | % | | $ | 227,631 | | | | 0.99 | % | | | n/a | | | | 5.20 | % | | | 56.46 | % |
| INTERNATIONAL FUND | | | | | | | | | | | | | | | | | |
Investor Shares | | | | | | | | | | | | | | | | | | | | | | | | |
9/30/2016 | | | 5.39 | % | | $ | 7,930,361 | | | | 1.19 | % | | | n/a | | | | 0.98 | % | | | 64.65 | % |
9/30/2015 | | | (9.55 | )% | | $ | 10,156,292 | | | | 1.17 | % | | | n/a | | | | 0.54 | % | | | 45.02 | % |
9/30/2014 | | | 5.85 | % | | $ | 13,607,488 | | | | 1.17 | % | | | n/a | | | | 0.85 | % | | | 46.49 | % |
9/30/2013 | | | 23.11 | % | | $ | 9,829,540 | | | | 1.20 | % | | | n/a | | | | 1.21 | % | | | 42.00 | % |
9/30/2012 | | | 30.05 | % | | $ | 6,877,615 | | | | 1.19 | % | | | n/a | | | | 1.32 | % | | | 55.39 | % |
Advisor Shares | | | | | | | | | | | | | | | | | | | | | | | | |
9/30/2016 | | | 5.58 | % | | $ | 2,782,189 | | | | 1.01 | % | | | n/a | | | | 1.23 | % | | | 64.65 | % |
9/30/2015(9) | | | (13.60 | )% | | $ | 2,465,135 | | | | 1.07 | % | | | 1.07 | % | | | 0.47 | % | | | 45.02 | % |
Institutional Shares | | | | | | | | | | | | | | | | | | | | | | | | |
9/30/2016 | | �� | 5.64 | % | | $ | 5,272,925 | | | | 0.95 | % | | | n/a | | | | 1.27 | % | | | 64.65 | % |
9/30/2015 | | | (9.34 | )% | | $ | 4,973,656 | | | | 0.95 | % | | | n/a | | | | 0.70 | % | | | 45.02 | % |
9/30/2014 | | | 6.10 | % | | $ | 3,926,338 | | | | 0.95 | % | | | n/a | | | | 1.05 | % | | | 46.49 | % |
9/30/2013 | | | 23.35 | % | | $ | 3,591,684 | | | | 0.97 | % | | | n/a | | | | 1.43 | % | | | 42.00 | % |
9/30/2012 | | | 30.37 | % | | $ | 2,772,675 | | | | 0.98 | % | | | n/a | | | | 1.52 | % | | | 55.39 | % |
| INTERNATIONAL SMALL CAP FUND | | | | | | | | | | | | | | | | | |
Investor Shares | | | | | | | | | | | | | | | | | | | | | | | | |
9/30/2016 | | | 2.50 | % | | $ | 585,000 | | | | 1.51 | % | | | n/a | | | | (0.07 | )% | | | 69.82 | % |
9/30/2015 | | | 2.02 | % | | $ | 961,035 | | | | 1.52 | % | | | n/a | | | | 0.13 | % | | | 43.84 | % |
9/30/2014 | | | (1.66 | )% | | $ | 1,090,091 | | | | 1.50 | % | | | n/a | | | | (0.05 | )% | | | 57.94 | % |
9/30/2013 | | | 28.50 | % | | $ | 996,150 | | | | 1.51 | % | | | n/a | | | | 0.19 | % | | | 59.47 | % |
9/30/2012 | | | 26.77 | % | | $ | 716,049 | | | | 1.50 | % | | | n/a | | | | 1.27 | % | | | 42.01 | % |
Institutional Shares | | | | | | | | | | | | | | | | | | | | | | | | |
9/30/2016(13) | | | 2.84 | % | | $ | 209,536 | | | | 1.37 | % | | | n/a | | | | 0.41 | % | | | 69.82 | % |
Footnotes are presented on Page 93.
The accompanying notes are an integral part of the financial statements.
| | |
| Artisan Partners Funds | | 87 |
ARTISAN PARTNERS FUNDS
Financial Highlights – For a share outstanding throughout each period
| | | | | | | | | | | | | | | | | | | | | | | | | | | | | | | | | | | | |
| | | | | | | | | | | | | | | Less Distributions From | | | | | | | |
| | | Net
Asset
Value,
Beginning
of Period | | | Net
Investment
Income (Loss)(1) | | | Net Realized
and Unrealized
Gain (Loss) on
Investments | | | Total
from
Operations | | | Net
Investment
Income | | | Net
Realized
Gains | | | Total
Distributions | | | Redemption
Fees^ | | | Net
Asset
Value,
End
of Period | |
| INTERNATIONAL VALUE FUND | | | | | | | | | | | | | | | | | | | | | | | | | | | | | |
Investor Shares | | | | | | | | | | | | | | | | | | | | | | | | | | | | | | | | | | | | |
9/30/2016 | | $ | 32.62 | | | | 0.32 | | | | 2.57 | | | | 2.89 | | | | (0.28 | ) | | | (1.68 | ) | | | (1.96 | ) | | | — | | | $ | 33.55 | |
9/30/2015 | | $ | 36.56 | | | | 0.21 | | | | (1.79 | ) | | | (1.58 | ) | | | (0.55 | ) | | | (1.81 | ) | | | (2.36 | ) | | | — | | | $ | 32.62 | |
9/30/2014 | | $ | 37.01 | | | | 0.32 | | | | 2.01 | | | | 2.33 | | | | (0.63 | ) | | | (2.15 | ) | | | (2.78 | ) | | | — | | | $ | 36.56 | |
9/30/2013 | | $ | 28.72 | | | | 0.28 | | | | 8.44 | | | | 8.72 | | | | (0.29 | ) | | | (0.14 | ) | | | (0.43 | ) | | | — | | | $ | 37.01 | |
9/30/2012 | | $ | 23.44 | | | | 0.29 | | | | 5.07 | | | | 5.36 | | | | (0.01 | ) | | | (0.07 | ) | | | (0.08 | ) | | | — | | | $ | 28.72 | |
Advisor Shares | | | | | | | | | | | | | | | | | | | | | | | | | | | | | | | | | | | | |
9/30/2016 | | $ | 32.66 | | | | 0.39 | | | | 2.54 | | | | 2.93 | | | | (0.34 | ) | | | (1.68 | ) | | | (2.02 | ) | | | — | | | $ | 33.57 | |
9/30/2015(9) | | $ | 35.54 | | | | 0.15 | | | | (3.03 | ) | | | (2.88 | ) | | | — | | | | — | | | | — | | | | — | | | $ | 32.66 | |
Institutional Shares | | | | | | | | | | | | | | | | | | | | | | | | | | | | | | | | | | | | |
9/30/2016 | | $ | 32.77 | | | | 0.40 | | | | 2.57 | | | | 2.97 | | | | (0.35 | ) | | | (1.68 | ) | | | (2.03 | ) | | | — | | | $ | 33.71 | |
9/30/2015 | | $ | 36.71 | | | | 0.30 | | | | (1.81 | ) | | | (1.51 | ) | | | (0.62 | ) | | | (1.81 | ) | | | (2.43 | ) | | | — | | | $ | 32.77 | |
9/30/2014 | | $ | 37.12 | | | | 0.41 | | | | 2.00 | | | | 2.41 | | | | (0.67 | ) | | | (2.15 | ) | | | (2.82 | ) | | | — | | | $ | 36.71 | |
9/30/2013 | | $ | 28.80 | | | | 0.34 | | | | 8.46 | | | | 8.80 | | | | (0.34 | ) | | | (0.14 | ) | | | (0.48 | ) | | | — | | | $ | 37.12 | |
9/30/2012 | | $ | 23.47 | | | | 0.34 | | | | 5.09 | | | | 5.43 | | | | (0.03 | ) | | | (0.07 | ) | | | (0.10 | ) | | | — | | | $ | 28.80 | |
| MID CAP FUND | | | | | | | | | | | | | | | | | | | | | | | | | | | | | |
Investor Shares | | | | | | | | | | | | | | | | | | | | | | | | | | | | | | | | | | | | |
9/30/2016 | | $ | 44.42 | | | | (0.30 | ) | | | 3.78 | | | | 3.48 | | | | — | | | | (6.56 | ) | | | (6.56 | ) | | | — | | | $ | 41.34 | |
9/30/2015 | | $ | 47.67 | | | | (0.36 | ) | | | 1.99 | | | | 1.63 | | | | — | | | | (4.88 | ) | | | (4.88 | ) | | | — | | | $ | 44.42 | |
9/30/2014 | | $ | 48.69 | | | | (0.36 | ) | | | 3.14 | | | | 2.78 | | | | — | | | | (3.80 | ) | | | (3.80 | ) | | | — | | | $ | 47.67 | |
9/30/2013 | | $ | 38.80 | | | | (0.26 | ) | | | 11.97 | | | | 11.71 | | | | — | | | | (1.82 | ) | | | (1.82 | ) | | | — | | | $ | 48.69 | |
9/30/2012 | | $ | 31.14 | | | | (0.28 | ) | | | 7.94 | | | | 7.66 | | | | — | | | | — | | | | — | | | | — | | | $ | 38.80 | |
Advisor Shares | | | | | | | | | | | | | | | | | | | | | | | | | | | | | | | | | | | | |
9/30/2016 | | $ | 44.46 | | | | (0.24 | ) | | | 3.77 | | | | 3.53 | | | | — | | | | (6.56 | ) | | | (6.56 | ) | | | — | | | $ | 41.43 | |
9/30/2015(9) | | $ | 46.88 | | | | (0.17 | ) | | | (2.25 | ) | | | (2.42 | ) | | | — | | | | — | | | | — | | | | — | | | $ | 44.46 | |
Institutional Shares | | | | | | | | | | | | | | | | | | | | | | | | | | | | | | | | | | | | |
9/30/2016 | | $ | 46.92 | | | | (0.22 | ) | | | 4.01 | | | | 3.79 | | | | — | | | | (6.56 | ) | | | (6.56 | ) | | | — | | | $ | 44.15 | |
9/30/2015 | | $ | 49.98 | | | | (0.26 | ) | | | 2.08 | | | | 1.82 | | | | — | | | | (4.88 | ) | | | (4.88 | ) | | | — | | | $ | 46.92 | |
9/30/2014 | | $ | 50.75 | | | | (0.24 | ) | | | 3.27 | | | | 3.03 | | | | — | | | | (3.80 | ) | | | (3.80 | ) | | | — | | | $ | 49.98 | |
9/30/2013 | | $ | 40.27 | | | | (0.17 | ) | | | 12.47 | | | | 12.30 | | | | — | | | | (1.82 | ) | | | (1.82 | ) | | | — | | | $ | 50.75 | |
9/30/2012 | | $ | 32.23 | | | | (0.20 | ) | | | 8.24 | | | | 8.04 | | | | — | | | | — | | | | — | | | | — | | | $ | 40.27 | |
Footnotes are presented on Page 93.
The accompanying notes are an integral part of the financial statements.
| | |
| 88 | | Artisan Partners Funds |
ARTISAN PARTNERS FUNDS
Financial Highlights – continued
| | | | | | | | | | | | | | | | | | | | | | | | |
| | | Total
Return(2) | | | Net Assets,
End
of Period
(000) | | | Ratio of
Expenses
to Average
Net Assets(3)(4) | | | Ratio of
Expenses
to Average
Net Assets
Excluding
Waivers(3) | | | Ratio
of Net
Investment
Income (Loss)
to Average
Net Assets(3)(4) | | | Portfolio
Turnover
Rate(2) | |
| INTERNATIONAL VALUE FUND | | | | | | | | | | | | | | | | | |
Investor Shares | | | | | | | | | | | | | | | | | | | | | | | | |
9/30/2016 | | | 9.02 | % | | $ | 5,500,119 | | | | 1.18 | % | | | n/a | | | | 0.98 | % | | | 17.79 | % |
9/30/2015 | | | (4.67 | )% | | $ | 5,229,869 | | | | 1.17 | % | | | n/a | | | | 0.60 | % | | | 23.74 | % |
9/30/2014 | | | 6.50 | % | | $ | 8,953,691 | | | | 1.16 | % | | | n/a | | | | 0.86 | % | | | 20.45 | % |
9/30/2013 | | | 30.71 | % | | $ | 8,158,057 | | | | 1.16 | % | | | n/a | | | | 0.85 | % | | | 32.99 | % |
9/30/2012 | | | 22.94 | % | | $ | 5,081,735 | | | | 1.17 | % | | | n/a | | | | 1.08 | % | | | 20.42 | % |
Advisor Shares | | | | | | | | | | | | | | | | | | | | | | | | |
9/30/2016 | | | 9.17 | % | | $ | 3,537,587 | | | | 1.02 | % | | | n/a | | | | 1.21 | % | | | 17.79 | % |
9/30/2015(9) | | | (8.10 | )% | | $ | 2,782,652 | | | | 1.06 | % | | | 1.07 | % | | | 0.87 | % | | | 23.74 | % |
Institutional Shares | | | | | | | | | | | | | | | | | | | | | | | | |
9/30/2016 | | | 9.27 | % | | $ | 3,038,159 | | | | 0.96 | % | | | n/a | | | | 1.26 | % | | | 17.79 | % |
9/30/2015 | | | (4.44 | )% | | $ | 2,606,468 | | | | 0.96 | % | | | n/a | | | | 0.86 | % | | | 23.74 | % |
9/30/2014 | | | 6.73 | % | | $ | 2,456,145 | | | | 0.96 | % | | | n/a | | | | 1.09 | % | | | 20.45 | % |
9/30/2013 | | | 30.92 | % | | $ | 2,292,085 | | | | 0.97 | % | | | n/a | | | | 1.03 | % | | | 32.99 | % |
9/30/2012 | | | 23.19 | % | | $ | 1,557,500 | | | | 0.98 | % | | | n/a | | | | 1.29 | % | | | 20.42 | % |
| MID CAP FUND | | | | | | | | | | | | | | | | | |
Investor Shares | | | | | | | | | | | | | | | | | | | | | | | | |
9/30/2016 | | | 8.08 | % | | $ | 3,232,399 | | | | 1.18 | % | | | n/a | | | | (0.75 | )% | | | 40.35 | % |
9/30/2015 | | | 3.20 | % | | $ | 3,909,986 | | | | 1.19 | % | | | n/a | | | | (0.76 | )% | | | 51.39 | % |
9/30/2014 | | | 6.04 | % | | $ | 5,220,973 | | | | 1.20 | % | | | n/a | | | | (0.74 | )% | | | 55.19 | % |
9/30/2013 | | | 31.53 | % | | $ | 5,525,387 | | | | 1.22 | % | | | n/a | | | | (0.64 | )% | | | 43.72 | % |
9/30/2012 | | | 24.63 | % | | $ | 5,115,836 | | | | 1.22 | % | | | n/a | | | | (0.78 | )% | | | 46.21 | % |
Advisor Shares | | | | | | | | | | | | | | | | | | | | | | | | |
9/30/2016 | | | 8.19 | % | | $ | 445,648 | | | | 1.05 | % | | | n/a | | | | (0.62 | )% | | | 40.35 | % |
9/30/2015(9) | | | (5.16 | )% | | $ | 431,658 | | | | 1.10 | % | | | 1.12 | % | | | (0.73 | )% | | | 51.39 | % |
Institutional Shares | | | | | | | | | | | | | | | | | | | | | | | | |
9/30/2016 | | | 8.33 | % | | $ | 4,389,242 | | | | 0.95 | % | | | n/a | | | | (0.52 | )% | | | 40.35 | % |
9/30/2015 | | | 3.45 | % | | $ | 4,482,164 | | | | 0.95 | % | | | n/a | | | | (0.53 | )% | | | 51.39 | % |
9/30/2014 | | | 6.30 | % | | $ | 4,280,444 | | | | 0.95 | % | | | n/a | | | | (0.49 | )% | | | 55.19 | % |
9/30/2013 | | | 31.89 | % | | $ | 3,551,382 | | | | 0.96 | % | | | n/a | | | | (0.39 | )% | | | 43.72 | % |
9/30/2012 | | | 24.95 | % | | $ | 1,602,109 | | | | 0.97 | % | | | n/a | | | | (0.51 | )% | | | 46.21 | % |
Footnotes are presented on Page 93.
The accompanying notes are an integral part of the financial statements.
| | |
| Artisan Partners Funds | | 89 |
ARTISAN PARTNERS FUNDS
Financial Highlights – For a share outstanding throughout each period
| | | | | | | | | | | | | | | | | | | | | | | | | | | | | | | | | | | | |
| | | | | | | | | | | | | | | Less Distributions From | | | | | | | |
| | | Net
Asset
Value,
Beginning
of Period | | | Net Investment
Income (Loss)(1) | | | Net Realized
and Unrealized
Gain (Loss) on
Investments | | | Total
from
Operations | | | Net
Investment
Income | | | Net
Realized
Gains | | | Total
Distributions | | | Redemption
Fees^ | | | Net
Asset
Value,
End
of Period | |
| MID CAP VALUE FUND | | | | | | | | | | | | | | | | | | | | | | | | | | | | | |
Investor Shares | | | | | | | | | | | | | | | | | | | | | | | | | | | | | | | | | | | | |
9/30/2016 | | $ | 22.22 | | | | 0.12 | | | | 2.70 | | | | 2.82 | | | | (0.09 | ) | | | (3.54 | ) | | | (3.63 | ) | | | — | | | $ | 21.41 | |
9/30/2015 | | $ | 27.00 | | | | 0.20 | | | | (2.21 | ) | | | (2.01 | ) | | | (0.17 | ) | | | (2.60 | ) | | | (2.77 | ) | | | — | | | $ | 22.22 | |
9/30/2014 | | $ | 26.34 | | | | 0.12 | | | | 1.74 | | | | 1.86 | | | | (0.11 | ) | | | (1.09 | ) | | | (1.20 | ) | | | — | | | $ | 27.00 | |
9/30/2013 | | $ | 21.12 | | | | 0.15 | | | | 6.22 | | | | 6.37 | | | | (0.12 | ) | | | (1.03 | ) | | | (1.15 | ) | | | — | | | $ | 26.34 | |
9/30/2012 | | $ | 18.88 | | | | 0.14 | | | | 3.72 | | | | 3.86 | | | | (0.13 | ) | | | (1.49 | ) | | | (1.62 | ) | | | — | | | $ | 21.12 | |
Advisor Shares | | | | | | | | | | | | | | | | | | | | | | | | | | | | | | | | | | | | |
9/30/2016 | | $ | 22.23 | | | | 0.14 | | | | 2.70 | | | | 2.84 | | | | (0.16 | ) | | | (3.54 | ) | | | (3.70 | ) | | | — | | | $ | 21.37 | |
9/30/2015(9) | | $ | 25.12 | | | | 0.12 | | | | (3.01 | ) | | | (2.89 | ) | | | — | | | | — | | | | — | | | | — | | | $ | 22.23 | |
Institutional Shares | | | | | | | | | | | | | | | | | | | | | | | | | | | | | | | | | | | | |
9/30/2016 | | $ | 22.25 | | | | 0.16 | | | | 2.70 | | | | 2.86 | | | | (0.17 | ) | | | (3.54 | ) | | | (3.71 | ) | | | — | | | $ | 21.40 | |
9/30/2015 | | $ | 27.05 | | | | 0.26 | | | | (2.22 | ) | | | (1.96 | ) | | | (0.24 | ) | | | (2.60 | ) | | | (2.84 | ) | | | — | | | $ | 22.25 | |
9/30/2014 | | $ | 26.38 | | | | 0.20 | | | | 1.73 | | | | 1.93 | | | | (0.17 | ) | | | (1.09 | ) | | | (1.26 | ) | | | — | | | $ | 27.05 | |
9/30/2013 | | $ | 21.15 | | | | 0.21 | | | | 6.23 | | | | 6.44 | | | | (0.18 | ) | | | (1.03 | ) | | | (1.21 | ) | | | — | | | $ | 26.38 | |
9/30/2012(14) | | $ | 20.93 | | | | 0.21 | | | | 0.01 | | | | 0.22 | | | | — | | | | — | | | | — | | | | — | | | $ | 21.15 | |
| SMALL CAP FUND | | | | | | | | | | | | | | | | | | | | | | | | | | | | | |
Investor Shares | | | | | | | | | | | | | | | | | | | | | | | | | | | | | | | | | | | | |
9/30/2016 | | $ | 28.55 | | | | (0.27 | ) | | | 4.36 | | | | 4.09 | | | | — | | | | (2.71 | ) | | | (2.71 | ) | | | — | | | $ | 29.93 | |
9/30/2015 | | $ | 26.76 | | | | (0.30 | ) | | | 2.09 | | | | 1.79 | | | | — | | | | — | | | | — | | | | — | | | $ | 28.55 | |
9/30/2014 | | $ | 27.65 | | | | (0.31 | ) | | | (0.58 | ) | | | (0.89 | ) | | | — | | | | — | | | | — | | | | — | | | $ | 26.76 | |
9/30/2013 | | $ | 20.90 | | | | (0.20 | ) | | | 6.95 | | | | 6.75 | | | | — | | | | — | | | | — | | | | — | | | $ | 27.65 | |
9/30/2012 | | $ | 16.01 | | | | (0.15 | ) | | | 5.04 | | | | 4.89 | | | | — | | | | — | | | | — | | | | — | | | $ | 20.90 | |
Institutional Shares | | | | | | | | | | | | | | | | | | | | | | | | | | | | | | | | | | | | |
9/30/2016 | | $ | 28.72 | | | | (0.20 | ) | | | 4.38 | | | | 4.18 | | | | — | | | | (2.71 | ) | | | (2.71 | ) | | | — | | | $ | 30.19 | |
9/30/2015 | | $ | 26.85 | | | | (0.24 | ) | | | 2.11 | | | | 1.87 | | | | — | | | | — | | | | — | | | | — | | | $ | 28.72 | |
9/30/2014 | | $ | 27.70 | | | | (0.25 | ) | | | (0.60 | ) | | | (0.85 | ) | | | — | | | | — | | | | — | | | | — | | | $ | 26.85 | |
9/30/2013 | | $ | 20.89 | | | | (0.17 | ) | | | 6.98 | | | | 6.81 | | | | — | | | | — | | | | — | | | | — | | | $ | 27.70 | |
9/30/2012(15) | | $ | 19.62 | | | | (0.18 | ) | | | 1.45 | | | | 1.27 | | | | — | | | | — | | | | — | | | | — | | | $ | 20.89 | |
Footnotes are presented on Page 93.
The accompanying notes are an integral part of the financial statements.
| | |
| 90 | | Artisan Partners Funds |
ARTISAN PARTNERS FUNDS
Financial Highlights – continued
| | | | | | | | | | | | | | | | | | | | | | | | |
| | | Total
Return(2) | | | Net Assets,
End
of Period
(000) | | | Ratio of
Expenses
to Average
Net Assets(3)(4) | | | Ratio of
Expenses
to Average
Net Assets
Excluding
Waivers(3) | | | Ratio
of Net
Investment
Income (Loss)
to Average
Net Assets(3)(4) | | | Portfolio
Turnover
Rate(2) | |
| MID CAP VALUE FUND | | | | | | | | | | | | | | | | | |
Investor Shares | | | | | | | | | | | | | | | | | | | | | | | | |
9/30/2016 | | | 14.10 | % | | $ | 2,416,461 | | | | 1.16 | % | | | 1.16 | % | | | 0.59 | % | | | 26.62 | % |
9/30/2015 | | | (8.45 | )% | | $ | 4,345,131 | | | | 1.19 | % | | | n/a | | | | 0.81 | % | | | 31.18 | % |
9/30/2014 | | | 7.18 | % | | $ | 9,305,582 | | | | 1.19 | % | | | n/a | | | | 0.46 | % | | | 25.67 | % |
9/30/2013 | | | 31.64 | % | | $ | 9,429,674 | | | | 1.20 | % | | | n/a | | | | 0.65 | % | | | 25.73 | % |
9/30/2012 | | | 21.35 | % | | $ | 7,753,814 | | | | 1.20 | % | | | n/a | | | | 0.67 | % | | | 27.86 | % |
Advisor Shares | | | | | | | | | | | | | | | | | | | | | | | | |
9/30/2016 | | | 14.22 | % | | $ | 1,025,855 | | | | 1.05 | % | | | 1.06 | % | | | 0.70 | % | | | 26.62 | % |
9/30/2015(9) | | | (11.50 | )% | | $ | 938,389 | | | | 1.09 | % | | | 1.11 | % | | | 1.00 | % | | | 31.18 | % |
Institutional Shares | | | | | | | | | | | | | | | | | | | | | | | | |
9/30/2016 | | | 14.29 | % | | $ | 741,286 | | | | 0.95 | % | | | 0.95 | % | | | 0.81 | % | | | 26.62 | % |
9/30/2015 | | | (8.25 | )% | | $ | 1,236,240 | | | | 0.96 | % | | | n/a | | | | 1.03 | % | | | 31.18 | % |
9/30/2014 | | | 7.44 | % | | $ | 1,702,469 | | | | 0.95 | % | | | n/a | | | | 0.72 | % | | | 25.67 | % |
9/30/2013 | | | 31.97 | % | | $ | 1,366,366 | | | | 0.98 | % | | | n/a | | | | 0.86 | % | | | 25.73 | % |
9/30/2012(14) | | | 1.05 | % | | $ | 275,727 | | | | 1.01 | % | | | n/a | | | | 1.04 | % | | | 27.86 | % |
| SMALL CAP FUND | | | | | | | | | | | | | | | | | |
Investor Shares | | | | | | | | | | | | | | | | | | | | | | | | |
9/30/2016 | | | 15.27 | % | | $ | 764,298 | | | | 1.25 | % | | | n/a | | | | (1.00 | )% | | | 27.00 | % |
9/30/2015 | | | 6.69 | % | | $ | 863,536 | | | | 1.23 | % | | | n/a | | | | (1.01 | )% | | | 45.31 | % |
9/30/2014 | | | (3.22 | )% | | $ | 1,231,921 | | | | 1.21 | % | | | n/a | | | | (1.09 | )% | | | 38.67 | % |
9/30/2013 | | | 32.30 | % | | $ | 1,330,188 | | | | 1.25 | % | | | n/a | | | | (0.88 | )% | | | 42.43 | % |
9/30/2012 | | | 30.54 | % | | $ | 676,139 | | | | 1.28 | % | | | n/a | | | | (0.77 | )% | | | 69.56 | % |
Institutional Shares | | | | | | | | | | | | | | | | | | | | | | | | |
9/30/2016 | | | 15.51 | % | | $ | 518,224 | | | | 1.01 | % | | | n/a | | | | (0.76 | )% | | | 27.00 | % |
9/30/2015 | | | 6.96 | % | | $ | 389,724 | | | | 1.02 | % | | | n/a | | | | (0.79 | )% | | | 45.31 | % |
9/30/2014 | | | (3.07 | )% | | $ | 227,772 | | | | 1.00 | % | | | n/a | | | | (0.88 | )% | | | 38.67 | % |
9/30/2013 | | | 32.60 | % | | $ | 224,770 | | | | 1.06 | % | | | n/a | | | | (0.74 | )% | | | 42.43 | % |
9/30/2012(15) | | | 6.47 | % | | $ | 50,754 | | | | 1.42 | % | | | n/a | | | | (0.93 | )% | | | 69.56 | % |
Footnotes are presented on Page 93.
The accompanying notes are an integral part of the financial statements.
| | |
| Artisan Partners Funds | | 91 |
ARTISAN PARTNERS FUNDS
Financial Highlights – For a share outstanding throughout each period
| | | | | | | | | | | | | | | | | | | | | | | | | | | | | | | | | | | | |
| | | | | | | | | | | | | | | Less Distributions From | | | | | | | |
| | | Net
Asset
Value,
Beginning
of Period | | | Net
Investment
Income(1) | | | Net Realized
and Unrealized
Gain (Loss) on
Investments | | | Total
from
Operations | | | Net
Investment
Income | | | Net
Realized
Gains | | | Total
Distributions | | | Redemption
Fees^ | | | Net
Asset
Value,
End
of Period | |
| VALUE FUND | | | | | | | | | | | | | | | | | | | | | | | | | | | | | |
Investor Shares | | | | | | | | | | | | | | | | | | | | | | | | | | | | | | | | | | | | |
9/30/2016 | | $ | 11.56 | | | | 0.09 | | | | 2.61 | | | | 2.70 | | | | (0.06 | ) | | | (1.10 | ) | | | (1.16 | ) | | | — | | | $ | 13.10 | |
9/30/2015 | | $ | 14.14 | | | | 0.11 | | | | (1.66 | ) | | | (1.55 | ) | | | (0.11 | ) | | | (0.92 | ) | | | (1.03 | ) | | | — | | | $ | 11.56 | |
9/30/2014 | | $ | 13.38 | | | | 0.15 | | | | 1.35 | | | | 1.50 | | | | (0.09 | ) | | | (0.65 | ) | | | (0.74 | ) | | | — | | | $ | 14.14 | |
9/30/2013 | | $ | 11.32 | | | | 0.12 | | | | 2.02 | | | | 2.14 | | | | (0.08 | ) | | | — | | | | (0.08 | ) | | | — | | | $ | 13.38 | |
9/30/2012 | | $ | 9.11 | | | | 0.08 | | | | 2.21 | | | | 2.29 | | | | (0.08 | ) | | | — | | | | (0.08 | ) | | | — | | | $ | 11.32 | |
Advisor Shares | | | | | | | | | | | | | | | | | | | | | | | | | | | | | | | | | | | | |
9/30/2016 | | $ | 11.57 | | | | 0.10 | | | | 2.61 | | | | 2.71 | | | | (0.13 | ) | | | (1.10 | ) | | | (1.23 | ) | | | — | | | $ | 13.05 | |
9/30/2015(9) | | $ | 13.41 | | | | 0.07 | | | | (1.91 | ) | | | (1.84 | ) | | | — | | | | — | | | | — | | | | — | | | $ | 11.57 | |
Institutional Shares | | | | | | | | | | | | | | | | | | | | | | | | | | | | | | | | | | | | |
9/30/2016 | | $ | 11.60 | | | �� | 0.11 | | | | 2.61 | | | | 2.72 | | | | (0.13 | ) | | | (1.10 | ) | | | (1.23 | ) | | | — | | | $ | 13.09 | |
9/30/2015 | | $ | 14.19 | | | | 0.14 | | | | (1.66 | ) | | | (1.52 | ) | | | (0.15 | ) | | | (0.92 | ) | | | (1.07 | ) | | | — | | | $ | 11.60 | |
9/30/2014 | | $ | 13.42 | | | | 0.18 | | | | 1.35 | | | | 1.53 | | | | (0.11 | ) | | | (0.65 | ) | | | (0.76 | ) | | | — | | | $ | 14.19 | |
9/30/2013 | | $ | 11.35 | | | | 0.15 | | | | 2.03 | | | | 2.18 | | | | (0.11 | ) | | | — | | | | (0.11 | ) | | | — | | | $ | 13.42 | |
9/30/2012 | | $ | 9.12 | | | | 0.11 | | | | 2.21 | | | | 2.32 | | | | (0.09 | ) | | | — | | | | (0.09 | ) | | | — | | | $ | 11.35 | |
Footnotes are presented on Page 93.
The accompanying notes are an integral part of the financial statements.
| | |
| 92 | | Artisan Partners Funds |
ARTISAN PARTNERS FUNDS
Financial Highlights – continued
| | | | | | | | | | | | | | | | | | | | | | | | |
| | | Total
Return(2) | | | Net Assets,
End
of Period
(000) | | | Ratio of
Expenses
to Average
Net Assets(3)(4) | | | Ratio of
Expenses
to Average
Net Assets
Excluding
Waivers(3) | | | Ratio
of Net
Investment
Income
to Average
Net Assets(3)(4) | | | Portfolio
Turnover
Rate(2) | |
| VALUE FUND | | | | | | | | | | | | | | | | | |
Investor Shares | | | | | | | | | | | | | | | | | | | | | | | | |
9/30/2016 | | | 24.64 | % | | $ | 457,969 | | | | 0.96 | % | | | n/a | | | | 0.75 | % | | | 52.05 | % |
9/30/2015 | | | (11.90 | )% | | $ | 341,852 | | | | 1.00 | % | | | n/a | | | | 0.78 | % | | | 74.07 | % |
9/30/2014 | | | 11.52 | % | | $ | 1,172,529 | | | | 0.98 | % | | | n/a | | | | 1.06 | % | | | 53.36 | % |
9/30/2013 | | | 18.97 | % | | $ | 1,164,460 | | | | 1.04 | % | | | n/a | | | | 0.94 | % | | | 57.90 | % |
9/30/2012 | | | 25.42 | % | | $ | 677,753 | | | | 1.06 | % | | | n/a | | | | 0.74 | % | | | 66.13 | % |
Advisor Shares | | | | | | | | | | | | | | | | | | | | | | | | |
9/30/2016 | | | 24.73 | % | | $ | 251,643 | | | | 0.84 | % | | | n/a | | | | 0.89 | % | | | 52.05 | % |
9/30/2015(9) | | | (13.72 | )% | | $ | 466,702 | | | | 0.86 | % | | | n/a | | | | 1.12 | % | | | 74.07 | % |
Institutional Shares | | | | | | | | | | | | | | | | | | | | | | | | |
9/30/2016 | | | 24.78 | % | | $ | 98,001 | | | | 0.77 | % | | | n/a | | | | 0.95 | % | | | 52.05 | % |
9/30/2015 | | | (11.69 | )% | | $ | 180,143 | | | | 0.75 | % | | | n/a | | | | 1.07 | % | | | 74.07 | % |
9/30/2014 | | | 11.77 | % | | $ | 304,091 | | | | 0.74 | % | | | n/a | | | | 1.31 | % | | | 53.36 | % |
9/30/2013 | | | 19.43 | % | | $ | 249,170 | | | | 0.76 | % | | | n/a | | | | 1.21 | % | | | 57.90 | % |
9/30/2012 | | | 25.64 | % | | $ | 157,727 | | | | 0.79 | % | | | n/a | | | | 1.02 | % | | | 66.13 | % |
| (1) | Computed based on average shares outstanding. |
| (2) | Periods less than twelve months (where applicable) are not annualized. |
| (3) | Periods less than twelve months (where applicable) are annualized. |
| (4) | Includes the effect of expenses waived or paid by the Adviser, if applicable. |
| (5) | For the period from commencement of operations (June 29, 2015) through September 30, 2015. |
| (6) | Amount is between $0.005 and $(0.005) per share. |
| (7) | Effective February 14, 2014, Emerging Markets Fund’s Advisor Shares were redesignated as Investor Shares. |
| (8) | For the period from commencement of operations (October 15, 2015) through September 30, 2016. |
| (9) | For the period from commencement of operations (April 1, 2015) through September 30, 2015. |
| (10) | For the period from commencement of operations (June 25, 2013) through September 30, 2013. |
| (11) | For the period from commencement of operations (July 17, 2012) through September 30, 2012. |
| (12) | For the period from commencement of operations (March 19, 2014) through September 30, 2014. |
| (13) | For the period from commencement of operations (April 12, 2016) through September 30, 2016. |
| (14) | For the period from commencement of operations (February 1, 2012) through September 30, 2012. |
| (15) | For the period from commencement of operations (May 7, 2012) through September 30, 2012. |
| ^ | Unless otherwise indicated, amount rounds to less than $0.01 per share, if applicable. |
| * | Refer to note 16 to the financial statements for discussion of prior period custodian out-of-pocket expenses that the custodian has offered to reimburse and the impact of these reimbursements on the September 30, 2016 Net Investment Income, Total Return, Ratio of Expenses to Average Net Assets, Ratio of Expenses to Average Net Assets Excluding Waivers and Ratio of Net Investment Income to Average Net Assets. |
The accompanying notes are an integral part of the financial statements.
| | |
| Artisan Partners Funds | | 93 |
ARTISAN PARTNERS FUNDS
Notes to Financial Statements – September 30, 2016
Artisan Partners Funds, Inc. (“Artisan Partners Funds”) was incorporated on January 5, 1995, as a Wisconsin corporation and is registered under the Investment Company Act of 1940, as amended (the “1940 Act”). Artisan Partners Funds is a series company comprised of fourteen open-end, diversified mutual funds which follows specialized accounting and reporting under Accounting Standards Codification Topic 946, Financial Services – Investment Companies. The following funds (each a “Fund” and collectively the “Funds”) are included in this report:
| | | | | | | | | | | | | | | |
| Fund Name | | Investor Shares Inception Date | | Advisor Shares Inception Date | | Institutional Shares Inception Date |
Artisan Developing World Fund (“Developing World Fund” or “Developing World”) | | | | June 29, 2015 | | | | | June 29, 2015 | | | | | June 29, 2015 | |
Artisan Emerging Markets Fund (“Emerging Markets Fund” or “Emerging Markets”) | | | | June 2, 2008 | | | | | N/A | | | | | June 26, 2006 | |
Artisan Global Equity Fund (“Global Equity Fund” or “Global Equity”) | | | | March 29, 2010 | | | | | N/A | | | | | October 15, 2015 | |
Artisan Global Opportunities Fund (“Global Opportunities Fund” or “Global Opportunities”) | | | | September 22, 2008 | | | | | April 1, 2015 | | | | | July 26, 2011 | |
Artisan Global Small Cap Fund (“Global Small Cap Fund” or “Global Small Cap”) | | | | June 25, 2013 | | | | | N/A | | | | | N/A | |
Artisan Global Value Fund (“Global Value Fund” or “Global Value”) | | | | December 10, 2007 | | | | | April 1, 2015 | | | | | July 17, 2012 | |
Artisan High Income Fund (“High Income Fund” or “High Income”) | | | | March 19, 2014 | | | | | March 19, 2014 | | | | | N/A | |
Artisan International Fund (“International Fund” or “International”) | | | | December 28, 1995 | | | | | April 1, 2015 | | | | | July 1, 1997 | |
Artisan International Small Cap Fund (“International Small Cap Fund” or “International Small Cap”) | | | | December 21, 2001 | | | | | N/A | | | | | April 12, 2016 | |
Artisan International Value Fund (“International Value Fund” or “International Value”) | | | | September 23, 2002 | | | | | April 1, 2015 | | | | | October 1, 2006 | |
Artisan Mid Cap Fund (“Mid Cap Fund” or “Mid Cap”) | | | | June 27, 1997 | | | | | April 1, 2015 | | | | | July 1, 2000 | |
Artisan Mid Cap Value Fund (“Mid Cap Value Fund” or “Mid Cap Value”) | | | | March 28, 2001 | | | | | April 1, 2015 | | | | | February 1, 2012 | |
Artisan Small Cap Fund (“Small Cap Fund” or “Small Cap”) | | | | March 28, 1995 | | | | | N/A | | | | | May 7, 2012 | |
Artisan Value Fund (“Value Fund” or “Value”) | | | | March 27, 2006 | | | | | April 1, 2015 | | | | | July 26, 2011 | |
The investment objective of each Fund (except Developing World Fund and High Income Fund) is to seek maximum long-term capital growth. Developing World Fund’s investment objective is to seek long-term capital appreciation. High Income Fund’s investment objective is to seek to provide total return through a combination of current income and capital appreciation. Each Fund has offered shares of capital stock of the classes designated Investor Shares, Advisor Shares and Institutional Shares, as applicable, since the inception dates listed above. Advisor Shares of the Funds are generally available for investment only by employee benefit plans, clients of financial advisors, clients of sponsored fee-based programs and other investors that meet the minimum investment requirements. Institutional Shares are designed for certain employee benefit plans as well as institutional and other investors who are able to meet the high minimum investment requirements.
| | |
| 94 | | Artisan Partners Funds |
NOTES TO FINANCIAL STATEMENTS
Each class of shares has equal rights with respect to portfolio assets and voting privileges with respect to the Fund in general. Each class of shares has exclusive voting rights with respect to any matters involving only that class. The classes of a Fund pay pro rata the costs of management of that Fund’s portfolio, including the management fee. Each class of a Fund bears the cost of its own transfer agency and shareholder servicing arrangements, and any other class-specific expenses, which may result in differing expenses by class. Because of the different expenses, the Advisor Shares or Institutional Shares of a Fund generally may have a lower expense ratio and correspondingly higher total return than the Investor Shares of the same Fund.
The investment adviser for each Fund is Artisan Partners Limited Partnership (the “Adviser” or “Artisan Partners”). The Adviser is wholly owned by Artisan Partners Holdings LP (“Artisan Holdings”).
| (2) | Summary of significant accounting policies: |
The following is a summary of significant accounting policies of the Funds in effect during the period covered by the financial statements, which were in accordance with United States generally accepted accounting principles (“US GAAP”).
| (a) | Valuation – The net asset value (“NAV”) of each Fund was determined as of the close of regular session trading on the New York Stock Exchange (“NYSE”) (usually 4:00 p.m., Eastern Time) each day the NYSE was open for regular session trading. For financial reporting purposes, information available subsequent to the close of NYSE trading and up to the date of the financial statements was considered in determining a fair value for investments held in each Fund and the resulting NAV presented. |
| | In determining each Fund’s NAV, each equity security traded on a securities exchange, including the Nasdaq Stock Market, or over-the-counter was valued at the closing price as of the time of valuation on the exchange or market designated by the Funds’ accounting agent or pricing vendor as the principal exchange (each, a “principal exchange”). The closing price provided by the pricing vendor for an exchange may differ from the price quoted elsewhere and may represent information such as last sales price, an official closing price, a closing auction price or other information, depending on exchange or market convention. Absent closing price information for an equity security from the principal exchange as of the time of valuation, the security was valued using (i) the closing price on another exchange on which the security traded (if such price was made available by a pricing vendor) or (ii) the most recent bid quotation on the principal exchange or, if such bid was not available, from a secondary exchange or in the over-the-counter market. |
| | Fixed income securities were valued at market value. Market values were generally evaluations based on the judgment of the Funds’ pricing vendors, which may consider, among other factors, the prices at which securities actually trade, broker-dealer quotations, pricing formulas, estimates of market values obtained from yield data relating to investments or securities with similar characteristics and/or discounted cash flow models that might be applicable. |
| | Securities or other assets for which market quotations were not readily available, were valued by the Fund’s valuation committee at a fair value determined in good faith |
| | |
| Artisan Partners Funds | | 95 |
NOTES TO FINANCIAL STATEMENTS
| | under procedures established by and under the general supervision of the board of directors of the Funds. A market quotation was considered to be not readily available, and a Fund may therefore have used fair value pricing, if, among other things, there were no quotations, pricing data was not provided by an approved pricing vendor, the valuation committee believed that the quotation, price or market value resulting from the Funds’ valuation procedures did not reflect a fair value of the security or asset, or the value of the security or asset might have been materially affected by events occurring after the close of the market in which the security or asset was principally traded but before the time for determination of NAV (a “subsequent event”). A subsequent event might include a company-specific development, a development that might affect an entire market or region, a potentially global development or a significant change in values of market indices, exchange traded funds or other financial instruments in the U.S. or other markets. The Funds monitored for subsequent events using several tools. In fair valuing non-U.S. equity securities, the Funds may have used adjustment factors provided by a third party research service when there were subsequent events or expected or unexpected market closures. The third party research service utilized statistical data based on historical performance of securities, markets and other data in developing factors used to estimate a fair value. |
| | When fair value pricing is employed, the value of a security or asset used by a Fund to calculate its NAV may differ from quoted or published prices for the same security or asset. Estimates of fair values utilized by the Funds as described above may differ from the value realized on the sale of those securities or assets and the differences may have been material to the NAV of the applicable Fund. |
| (b) | Taxes – No provision was made for federal income taxes or excise taxes since each Fund intends to (i) comply with the provisions of Subchapter M of the Internal Revenue Code applicable to regulated investment companies and (ii) distribute to its shareholders substantially all of its taxable income as well as net realized gains from the sale of investment securities. The Funds may utilize earnings and profits distributed to shareholders on redemptions of Fund shares as part of the dividends paid deduction. |
| | The Funds have analyzed the tax positions taken on federal income tax returns for all remaining open tax years (fiscal years 2013 through 2016) and have concluded that, as of September 30, 2016, no provision for income tax would be required in the Funds’ financial statements. The Funds’ federal and state income and federal excise tax returns for tax years for which the applicable statutes of limitations have not expired are subject to examination by the Internal Revenue Service and each state’s department of revenue. |
| | As of and during the year ended September 30, 2016, the Funds did not have any liabilities for any unrecognized tax benefits. The Funds recognize interest and penalties, if any, related to unrecognized tax benefits as income tax expense in the Statements of Operations. During the year ended September 30, 2016, the Funds did not incur any interest or penalties. |
| | The Funds may be subject to taxes imposed on realized and unrealized gains on securities of certain foreign countries in which the Funds invest. The foreign tax expense, if any, was recorded on an accrual basis and is included in “Net realized gain (loss) on investments” and “Net increase (decrease) in unrealized appreciation or |
| | |
| 96 | | Artisan Partners Funds |
NOTES TO FINANCIAL STATEMENTS
| | depreciation on investments” on the accompanying Statements of Operations. The amount of foreign tax owed, if any, is included in “Payable for foreign taxes” on the accompanying Statements of Assets and Liabilities and is comprised of withholding taxes on foreign dividends and taxes on unrealized gains. |
| (c) | Portfolio transactions – For financial reporting purposes, security transactions and shareholder transactions were recorded on trade date in accordance with US GAAP. Net realized gains and losses on securities were computed on specific security lot identification. |
| (d) | Restricted securities – The Funds may invest in securities that are subject to strict restrictions on resale and there may be no liquid secondary market or ready purchaser for such securities. These securities generally may be resold in transactions exempt from registration or to the public if the securities are registered. Disposal of these securities may involve time consuming negotiations and expenses, and prompt sale at an acceptable price may be difficult. Information regarding restricted securities, if any, is included in each Fund’s Schedule of Investments footnotes. |
| (e) | Foreign currency translation – Values of foreign investments, open foreign currency forward contracts, payables for capital gains taxes, payables and receivables for securities transactions, dividend and reclaim receivables, other receivables and payables, and cash denominated in a foreign currency were translated into U.S. dollars using a spot market rate of exchange as of the time of determination of each Fund’s NAV on the day of valuation. Purchases and sales of investments and dividend and interest income were translated into U.S. dollars using the current spot market rate of exchange on the date of such transactions. The portion of security gains or losses resulting from changes in foreign exchange rates was included with net realized and unrealized gain or loss from investments, as appropriate, for both financial reporting and tax purposes. |
| | The Funds may enter into foreign currency spot contracts and foreign currency forward contracts. Foreign currency spot contracts are typically used to facilitate the purchase and sale of non-U.S. securities and generally settle within three business days. Foreign currency forward contracts are typically used to hedge against foreign currency exchange rate risks, which the Funds may face as a result of direct or indirect exposure to particular currencies (including through U.S. dollar denominated depositary receipts and participation certificates). The Funds could be exposed to loss if the counterparties fail to perform under these contracts. Open foreign currency spot contracts and foreign currency forward contracts, if any, were recorded at market value and recorded in the Statements of Assets and Liabilities. Realized and unrealized gains and losses were reported as foreign currency related transactions and are recorded in the Statements of Operations. For tax purposes, these foreign exchange gains and losses were treated as ordinary income or loss. |
| | As of September 30, 2016, Global Opportunities Fund, Global Value Fund and International Value Fund had outstanding foreign currency forward contracts, as shown on the Schedules of Investments. Foreign currency spot contracts are not separately disclosed in the Schedules of Investments. |
| | Other foreign currency related transaction gains and losses may result from currency gains and losses realized on the difference between the amounts of dividends and |
| | |
| Artisan Partners Funds | | 97 |
NOTES TO FINANCIAL STATEMENTS
| | foreign withholding taxes accrued on the Funds’ books and the U.S. dollar equivalent of the amounts actually received or paid. The net increase (decrease) in unrealized appreciation or depreciation on foreign currency related transactions arose from changes in the values of assets and liabilities, other than investments in securities, resulting from changes in foreign exchange rates. |
| (f) | Repurchase agreements – Each Fund may enter into repurchase agreements with institutions that the Adviser determines are creditworthy pursuant to criteria adopted by the board of directors. Repurchase agreements were recorded at repurchase price plus accrued interest and were collateralized in an amount greater than or equal to the repurchase price plus accrued interest. Collateral (in the form of U.S. government securities) was held by the Funds’ custodian and, in the event of default on the obligation of the counterparty to repurchase, the Funds had the right to liquidate the collateral and apply the proceeds in satisfaction of the obligation. |
| | Repurchase agreements shown on the Schedules of Investments are presented at gross value. At September 30, 2016, the value of the related collateral exceeded the value of the repurchase agreements, reducing the net settlement amount to zero. Details of the collateral are included within the Schedules of Investments. |
| (g) | Depositary receipts – Each Fund may invest in depositary receipts. Depositary receipts are typically issued by a financial institution (a “depositary”), evidencing ownership interests in a security issued by an issuer and deposited with the depositary. |
| (h) | Equity-linked securities – Developing World Fund, Emerging Markets Fund, Global Equity Fund, Global Opportunities Fund, Global Small Cap Fund, Global Value Fund, International Fund, International Small Cap Fund, International Value Fund and Value Fund may invest in equity-linked securities. Equity-linked securities are designed to provide synthetic exposure to one or more underlying securities. An investment in an equity-linked security typically entitles the holder to a return equal to the market return of the underlying security or securities. There is no off-balance sheet risk associated with equity-linked securities and the Funds’ potential loss is limited to the purchase price of the securities. The Funds are exposed to credit risk associated with the counterparty to the transaction. |
| (i) | Use of estimates – The preparation of financial statements in conformity with US GAAP requires management to make estimates and assumptions that affect the reported amounts and disclosures in the financial statements. Actual results could differ from those estimates. |
| (j) | Indemnifications – In the normal course of business, the Funds may enter into contracts in which the Funds agree to indemnify the other party or parties against various potential costs or liabilities. A Fund’s maximum exposure under such arrangements is unknown. As of September 30, 2016, no claim has been made for indemnification pursuant to any such agreement of the Funds. |
| (k) | When-Issued/Delayed Delivery Securities – Each Fund may purchase or sell when-issued and delayed delivery securities. Securities purchased on a when-issued or delayed delivery basis are purchased for delivery beyond the normal settlement date at a stated price, and no income accrues to the Fund on such securities prior to delivery date. Payment and delivery for when-issued and delayed delivery securities can take |
| | |
| 98 | | Artisan Partners Funds |
NOTES TO FINANCIAL STATEMENTS
| | place a month or more after the date of the transaction. When a Fund enters into a purchase transaction on a when-issued or delayed delivery basis, the Fund will hold liquid investments in an amount at least equal in value to the Fund’s commitments to purchase such securities. Purchasing securities on a when issued or delayed delivery basis may involve a risk that the market price at the time of delivery may be lower than the agreed upon purchase price. |
| (l) | Other – Dividend income less foreign taxes withheld, if any, was generally recorded on the ex-dividend date. In some cases, the information was not available to the Fund on the ex-dividend date. In such cases, which may have included private placements and foreign securities, dividends were recorded as soon after the ex-dividend date as reliable information became available to the Funds. Non-cash dividends included in dividend income, if any, were generally recorded at the fair market value of securities received. Interest income was recorded on the accrual basis and includes accretion of discounts and amortization of premiums. Distributions to shareholders were recorded on the ex-dividend date. Expenses attributable to the Funds were generally allocated to each Fund based on net assets. However, other expense allocation methodologies were also used, depending on the nature of the expense item. Income and expenses not specific to a particular class and realized and unrealized gains and losses were allocated daily to each class of shares based upon the relative net asset value of outstanding shares. Expenses attributable to a particular Fund or class were allocated directly to that Fund or class, respectively. |
| | The character of income and net realized gains and losses may differ in some instances for financial statement and tax purposes and may result in reclassification of permanent differences among certain capital accounts to more appropriately conform financial accounting to tax characterizations of dividend and capital gain distributions. |
| | Prior to February 1, 2016, Developing World Fund, Emerging Markets Fund, Global Equity Fund, Global Opportunities Fund, Global Small Cap Fund, Global Value Fund, High Income Fund, International Fund, International Small Cap Fund and International Value Fund generally imposed a 2% redemption fee on shares held 90 days or less. Effective, February 1, 2016, the board of directors of the Funds approved eliminating the redemption fee for all Funds except High Income Fund. Those redemption fees were recorded as a reduction in the cost of shares redeemed and had the primary effect of increasing paid-in capital. Each Fund reserved the right to waive or reduce the 2% redemption fee on shares held 90 days or less at its discretion when the Fund believed such waiver was in the best interests of the Fund, including, but not limited to, when it determined that imposition of the redemption fee was not necessary to protect the Fund from the effects of short-term trading. The Funds waived the fee on redemption of shares held by certain authorized agents or other Fund intermediaries and otherwise in accordance with the Funds’ prospectus. |
| (m) | Unfunded Commitments – Pursuant to the terms of certain term loan agreements, High Income Fund is obligated to fund term loan commitments at the borrower’s discretion. High Income Fund reserves against such contingent obligations by segregating cash and/or other liquid assets. During the period, High Income Fund had unfunded loan commitments; however, as of September 30, 2016 there were no such obligations requiring segregation in connection with unfunded commitments. |
| | |
| Artisan Partners Funds | | 99 |
NOTES TO FINANCIAL STATEMENTS
Markets may perform poorly and the returns from the securities in which a Fund invests may underperform returns from the general securities markets. Securities markets may experience periods of high volatility and reduced liquidity in response to governmental actions or intervention, economic or market developments, or other external factors. The value of a company’s securities may rise or fall in response to company, market, economic or other news.
Foreign securities may underperform U.S. securities and may be more volatile than U.S. securities. Risks relating to investments in foreign securities (including, but not limited to, depositary receipts and participation certificates) and to securities of issuers with significant exposure to foreign markets include: currency exchange rate fluctuation; less available public information about the issuers of securities; less stringent regulatory standards; lack of uniform accounting, auditing and financial reporting standards; and country risks including less liquidity, high inflation rates, unfavorable economic practices, political instability and expropriation and nationalization risks.
The risks of foreign securities typically are greater in emerging and less developed markets. For example, in addition to the risks associated with investments in any foreign country, political, legal and economic structures in these less developed countries may be new and changing rapidly, which may cause instability and greater risk of loss. These securities markets may be less developed, and securities in those markets are generally more volatile and less liquid than those in developed markets. Investing in emerging market countries may involve substantial risk due to, among other reasons, limited information; higher brokerage costs; different accounting, auditing and financial reporting standards; less developed legal systems and thinner trading markets as compared to those in developed countries; different clearing and settlement procedures and custodial services; and currency blockages or transfer restrictions. Emerging market countries also are more likely to experience high levels of inflation, deflation or currency devaluations, which could hurt their economies and securities markets. Certain emerging markets also may face other significant internal or external risks, including a heightened risk of war and ethnic, religious and racial conflicts. In addition, governments in many emerging market countries participate to a significant degree in their economies and securities markets, which may impair investment and economic growth of companies in those markets. Such markets may also be heavily reliant on foreign capital and, therefore, vulnerable to capital flight.
The values of debt securities change in response to various factors, including, for example, market related factors, such as changes in interest rates or changes in the actual or perceived ability of an issuer to meet its obligations. In general, the values of debt securities fall in response to increases in interest rates. The value of a security with a longer duration will generally be more sensitive to changes in interest rates than a similar security with a shorter duration. As a result, changes in interest rates in the U.S. and outside the U.S. may affect the Fund’s debt investments unfavorably. Given the current historically low interest rate environment, risks associated with rising rates are heightened. If interest rates rise, repayments of principal on certain debt securities, including loans, may occur at a slower rate than expected and the expected length of repayment of those securities could increase as a result.
| | |
| 100 | | Artisan Partners Funds |
NOTES TO FINANCIAL STATEMENTS
An issuer or counterparty may fail to pay its obligations to a Fund when they are due. Financial strength and solvency (or the perceived financial strength or solvency) of an issuer are the primary factors influencing credit risk. Changes in the financial condition of an issuer or counterparty, changes in specific economic, social or political conditions that affect a particular type of security or other instrument or an issuer, and changes in economic, social or political conditions generally can increase the risk of default by an issuer or counterparty, which can affect a security’s or other instrument’s credit quality or value and an issuer’s or counterparty’s ability to pay interest and principal when due. The values of lower quality debt, including loans, tend to be particularly sensitive to these changes.
Debt securities in which a Fund invests may be rated below investment grade by the major rating agencies, or may be unrated securities that are determined by the Adviser to be of comparable quality. Debt securities of below investment grade quality are high yield, high risk bonds, commonly known as “junk bonds.” These bonds are predominantly speculative. They are usually issued by companies without long track records of sales and earnings, or by companies with questionable credit strength. These bonds have a higher degree of default risk and may be less liquid than higher-rated bonds. These securities may be subject to greater price volatility due to such factors as specific corporate developments, interest rate sensitivity, negative perceptions of junk bonds generally, and less secondary market liquidity. This potential lack of liquidity may make it more difficult for the Fund to accurately value these securities.
Investments in loans are generally subject to the same risks as investments in other types of debt obligations, including, among others, the credit risk of nonpayment of principal and interest. In addition, in many cases loans are subject to the risks associated with below investment grade securities. Because there is typically limited public information available regarding loan investments, High Income Fund is particularly dependent on the analytical abilities of the Adviser. High Income Fund may invest in loans made in connection with highly leveraged transactions, which are subject to greater credit and liquidity risks than other types of loans. Although the loans in which High Income Fund invests may be secured by specific collateral, there can be no assurance that liquidation of such collateral would satisfy the borrower’s obligation in the event of nonpayment of scheduled interest or principal, or that such collateral could be readily liquidated. In the event of the bankruptcy of a borrower, High Income Fund could experience delays or limitations with respect to its ability to realize the benefits of the collateral securing a loan or could recover nothing of what it is owed on the loan. Uncollateralized (i.e., non-secured) loans are subject to greater risk of loss (i.e., nonpayment) in the event of default than secured loans since they do not afford the Fund recourse to collateral. Investments in loans may be difficult to value and may be illiquid, including due to legal or contractual restrictions on resale. Transactions in many loans settle on a delayed basis, and High Income Fund may not receive the proceeds from the sale of a loan for a substantial period after the sale. As a result, sale proceeds related to the sale of loans may not be available to make additional investments until a substantial period after the sale of the loans. It is unclear whether the protections of the securities laws against fraud and misrepresentation extend to certain loans and other forms of direct indebtedness.
See the Funds’ prospectus and statement of additional information regarding the risks of investing in shares of the Funds.
| | |
| Artisan Partners Funds | | 101 |
NOTES TO FINANCIAL STATEMENTS
| (4) | Fair value measurements: |
Under US GAAP for fair value measurement, accounting standards clarify the definition of fair value for financial reporting, establish a framework for measuring fair value and require additional disclosures about the use of fair value measurements. In accordance with this standard, fair value is defined as the price that each Fund would receive upon selling an investment in an orderly transaction to an independent buyer in the principal or most advantageous market of the investment. The standard establishes a three-tier hierarchy to distinguish between (1) inputs that reflect the assumptions market participants would use in pricing an asset or liability developed based on the market data obtained from sources independent of the reporting entity (observable inputs) and (2) inputs that reflect the reporting entity’s own assumptions about the assumptions market participants would use in pricing an asset or liability developed based on the best information available in the circumstances (unobservable inputs) and to establish classification of fair value measurements for disclosure purposes. Various inputs are used in determining the value of the Funds’ investments. The three-tier hierarchy of inputs is summarized in three broad levels:
| | • | | Level 1 – unadjusted quoted prices in active markets for identical investments |
| | • | | Level 2 – other significant observable inputs (including but not limited to quoted prices for similar securities, interest rates, credit risks and securities trading primarily outside the U.S. where the applicable trading market was closed or whose value the Fund adjusted as a result of significant market movements following the close of local trading) |
| | • | | Level 3 – significant unobservable inputs (including the Funds’ own assumptions in determining a fair value of investments) |
The inputs or methodology used for valuing securities are not necessarily an indication of the risk or liquidity associated with investing in those securities. A description of the valuation techniques and fair value leveling applied to the Funds’ major classes of assets are as follows:
Bank Loans & Corporate Bonds – Evaluated prices obtained from pricing vendors may use various observable and unobservable inputs, including, but not limited to, recent trading activity, broker-dealers quotations, pricing formulas, estimates of market values obtained from yield data relating to investments with similar characteristics and/or discounted cash flow models that might be applicable. When the approved pricing vendors do not provide an evaluated price, or the provided price is determined by the valuation committee to not represent a fair value, securities may be valued using quotes from dealers that make markets in the securities or pricing models as approved by the valuation committee, or the valuation committee will determine a fair value in accordance with the Funds’ fair value procedures. Bank loans and corporate bonds are generally categorized as Level 2 of the fair value hierarchy unless key inputs are unobservable, in which case they would be categorized as Level 3.
Equity Securities – Exchange-traded equity securities are valued using the closing price on the principal exchange in which the security trades. Absent a current closing price, the
| | |
| 102 | | Artisan Partners Funds |
NOTES TO FINANCIAL STATEMENTS
securities are valued using the closing price from another exchange on which the security is traded or the most recent bid quotation on the principal exchange. If the valuation committee determines the resulting price does not represent a fair value, the valuation committee will determine a fair value based on the information available.
Foreign equity securities prices may be adjusted for significant events such as company-specific news, regional events or significant market movement subsequent to the close of the local exchange on which the security is traded. The Funds utilize a third party research service to assist in determining fair values of foreign equity securities. Equity securities valued at a current day closing price or bid quotation are generally categorized as Level 1 of the fair value hierarchy. Foreign equity securities in which the closing price or bid quotation are adjusted for significant events, or local market holidays or other unscheduled market closures, are generally categorized as Level 2. Equity securities fair valued in good faith by the valuation committee are generally categorized as Level 2 or 3, depending on the observability of the inputs utilized.
Equity-Linked Securities – Equity-linked securities, such as participation certificates, participation notes or access notes, are valued by referencing the underlying security. Equity-linked securities are generally categorized as Level 2.
Other Instruments – Foreign currency forward contracts are valued based upon forward currency exchange rates as of the close of regular session trading on the NYSE. Repurchase agreements are valued at cost plus accrued interest. Foreign currency forward contracts and repurchase agreements are generally categorized as Level 2.
The following table summarizes each Fund’s investments by major security type, based on the inputs used to determine their fair values as of September 30, 2016 (in thousands):
| | | | | | | | | | | | | | | | | | | | |
| Fund | | Level 1 - Unadjusted
Quoted Prices | | Level 2 - Other Significant
Observable Inputs | | Level 3 -Significant
Unobservable Inputs | | Total |
Developing World | | | | | | | | | | | | | | | | | | | | |
Common Stocks(1) | | | | | | | | | | | | | | | | | | | | |
Developed Markets | | | $ | 132,827 | | | | $ | 105,790 | | | | $ | - | | | | $ | 238,617 | |
Emerging Asia | | | | 82,861 | | | | | 256,901 | | | | | - | | | | | 339,762 | |
Europe, Middle East & Africa | | | | 8,945 | | | | | 82,569 | | | | | - | | | | | 91,514 | |
Latin America | | | | 140,206 | | | | | - | | | | | - | | | | | 140,206 | |
Equity-Linked
Securities(1) | | | | | | | | | | | | | | | | | | | | |
Europe, Middle East & Africa | | | | - | | | | | 3,638 | | | | | - | | | | | 3,638 | |
Repurchase Agreement | | | | - | | | | | 71,649 | | | | | - | | | | | 71,649 | |
Total Investments | | | $ | 364,839 | | | | $ | 520,547 | | | | $ | - | | | | $ | 885,386 | |
| | |
| Artisan Partners Funds | | 103 |
NOTES TO FINANCIAL STATEMENTS
| | | | | | | | | | | | | | | | | | | | |
| Fund | | Level 1 - Unadjusted
Quoted Prices | | Level 2 - Other Significant
Observable Inputs | | Level 3 -Significant
Unobservable Inputs | | Total |
Emerging Markets | | | | | | | | | | | | | | | | | | | | |
Common Stocks(1) | | | | | | | | | | | | | | | | | | | | |
Developed Markets | | | $ | - | | | | $ | 1,631 | | | | $ | - | | | | $ | 1,631 | |
Emerging Asia | | | | 2,493 | | | | | 15,853 | | | | | - | (3) | | | | 18,346 | |
Europe, Middle East & Africa | | | | 203 | | | | | 5,633 | | | | | - | | | | | 5,836 | |
Latin America | | | | 6,129 | | | | | - | | | | | - | | | | | 6,129 | |
Preferred Stocks(1) | | | | | | | | | | | | | | | | | | | | |
Emerging Asia | | | | - | | | | | 2,421 | | | | | - | | | | | 2,421 | |
Europe, Middle East & Africa | | | | - | | | | | 911 | | | | | - | | | | | 911 | |
Latin America | | | | 992 | | | | | - | | | | | - | | | | | 992 | |
Repurchase Agreement | | | | - | | | | | 618 | | | | | - | | | | | 618 | |
Total Investments | | | $ | 9,817 | | | | $ | 27,067 | | | | $ | - | | | | $ | 36,884 | |
Global Equity | | | | | | | | | | | | | | | | | | | | |
Common Stocks(1) | | | | | | | | | | | | | | | | | | | | |
Americas | | | $ | 165,689 | | | | $ | - | | | | $ | - | | | | $ | 165,689 | |
Emerging Markets | | | | 3,455 | | | | | 11,821 | | | | | - | | | | | 15,276 | |
Europe | | | | 5,505 | | | | | 45,867 | | | | | - | | | | | 51,372 | |
Pacific Basin | | | | - | | | | | 20,554 | | | | | - | | | | | 20,554 | |
Repurchase Agreement | | | | - | | | | | 2,408 | | | | | - | | | | | 2,408 | |
Total Investments | | | $ | 174,649 | | | | $ | 80,650 | | | | $ | - | | | | $ | 255,299 | |
Global Opportunities | | | | | | | | | | | | | | | | | | | | |
Common Stocks(1) | | | | | | | | | | | | | | | | | | | | |
Americas | | | $ | 1,004,806 | | | | $ | - | | | | $ | - | | | | $ | 1,004,806 | |
Emerging Markets | | | | 35,246 | | | | | 121,955 | | | | | - | | | | | 157,201 | |
Europe | | | | 18,178 | | | | | 277,432 | | | | | - | | | | | 295,610 | |
Pacific Basin | | | | - | | | | | 257,765 | | | | | - | | | | | 257,765 | |
Repurchase Agreement | | | | - | | | | | 118,529 | | | | | - | | | | | 118,529 | |
Total Investments | | | | 1,058,230 | | | | | 775,681 | | | | | - | | | | | 1,833,911 | |
Foreign Currency Forward Contracts(2) | | | | - | | | | | (94 | ) | | | | - | | | | | (94 | ) |
Total | | | $ | 1,058,230 | | | | $ | 775,587 | | | | $ | - | | | | $ | 1,833,817 | |
Global Small Cap | | | | | | | | | | | | | | | | | | | | |
Common Stocks(1) | | | | | | | | | | | | | | | | | | | | |
Americas | | | $ | 12,480 | | | | $ | - | | | | $ | - | | | | $ | 12,480 | |
Emerging Markets | | | | - | | | | | 4,929 | | | | | - | | | | | 4,929 | |
Europe | | | | 3,105 | | | | | 51,168 | | | | | - | | | | | 54,273 | |
Pacific Basin | | | | - | | | | | 2,791 | | | | | - | | | | | 2,791 | |
Repurchase Agreement | | | | - | | | | | 2,231 | | | | | - | | | | | 2,231 | |
Total Investments | | | $ | 15,585 | | | | $ | 61,119 | | | | $ | - | | | | $ | 76,704 | |
| | |
| 104 | | Artisan Partners Funds |
NOTES TO FINANCIAL STATEMENTS
| | | | | | | | | | | | | | | | | | | | |
| Fund | | Level 1 - Unadjusted
Quoted Prices | | Level 2 - Other Significant
Observable Inputs | | Level 3 -Significant
Unobservable Inputs | | Total |
Global Value | | | | | | | | | | | | | | | | | | | | |
Common Stocks(1) | | | | | | | | | | | | | | | | | | | | |
Americas | | | $ | 1,023,015 | | | | $ | - | | | | $ | - | | | | $ | 1,023,015 | |
Emerging Markets | | | | 125,802 | | | | | 113,054 | | | | | - | | | | | 238,856 | |
Europe | | | | - | | | | | 572,780 | | | | | - | | | | | 572,780 | |
Pacific Basin | | | | - | | | | | 5,048 | | | | | - | | | | | 5,048 | |
Repurchase Agreement | | | | - | | | | | 232,609 | | | | | - | | | | | 232,609 | |
Total Investments | | | | 1,148,817 | | | | | 923,491 | | | | | - | | | | | 2,072,308 | |
Foreign Currency Forward Contracts(2) | | | | - | | | | | 426 | | | | | - | | | | | 426 | |
Total | | | $ | 1,148,817 | | | | $ | 923,917 | | | | $ | - | | | | $ | 2,072,734 | |
High Income | | | | | | | | | | | | | | | | | | | | |
Corporate Bonds(1) | | | $ | - | | | | $ | 1,266,855 | | | | $ | - | (4) | | | $ | 1,266,855 | |
Bank Loans(1) | | | | - | | | | | 383,596 | | | | | - | | | | | 383,596 | |
Convertible Debentures(1) | | | | - | | | | | 5,106 | | | | | - | | | | | 5,106 | |
Repurchase Agreement | | | | - | | | | | 183,716 | | | | | - | | | | | 183,716 | |
Total Investments | | | $ | - | | | | $ | 1,839,273 | | | | $ | - | | | | $ | 1,839,273 | |
International | | | | | | | | | | | | | | | | | | | | |
Common Stocks(1) | | | | | | | | | | | | | | | | | | | | |
Americas | | | $ | 3,892,372 | | | | $ | - | | | | $ | - | | | | $ | 3,892,372 | |
Emerging Markets | | | | 479,387 | | | | | 618,677 | | | | | - | | | | | 1,098,064 | |
Europe | | | | 175,879 | | | | | 7,308,704 | | | | | - | | | | | 7,484,583 | |
Pacific Basin | | | | - | | | | | 2,653,214 | | | | | - | | | | | 2,653,214 | |
Equity-Linked Securities(1) | | | | | | | | | | | | | | | | | | | | |
Europe | | | | - | | | | | 296,918 | | | | | - | | | | | 296,918 | |
Preferred Stocks(1) | | | | | | | | | | | | | | | | | | | | |
Europe | | | | - | | | | | 283,343 | | | | | - | | | | | 283,343 | |
Repurchase Agreement | | | | - | | | | | 142,619 | | | | | - | | | | | 142,619 | |
Total Investments | | | $ | 4,547,638 | | | | $ | 11,303,475 | | | | $ | - | | | | $ | 15,851,113 | |
International Small Cap | | | | | | | | | | | | | | | | | | | | |
Common Stocks(1) | | | | | | | | | | | | | | | | | | | | |
Americas | | | $ | 19,843 | | | | $ | - | | | | $ | - | | | | $ | 19,843 | |
Emerging Markets | | | | - | | | | | 39,400 | | | | | - | | | | | 39,400 | |
Europe | | | | 25,972 | | | | | 617,131 | | | | | - | | | | | 643,103 | |
Pacific Basin | | | | - | | | | | 69,744 | | | | | - | | | | | 69,744 | |
Repurchase Agreement | | | | - | | | | | 12,429 | | | | | - | | | | | 12,429 | |
Total Investments | | | $ | 45,815 | | | | $ | 738,704 | | | | $ | - | | | | $ | 784,519 | |
| | |
| Artisan Partners Funds | | 105 |
NOTES TO FINANCIAL STATEMENTS
| | | | | | | | | | | | | | | | | | | | |
| Fund | | Level 1 - Unadjusted
Quoted Prices | | Level 2 - Other Significant
Observable Inputs | | Level 3 -Significant
Unobservable Inputs | | Total |
International Value | | | | | | | | | | | | | | | | | | | | |
Common Stocks(1) | | | | | | | | | | | | | | | | | | | | |
Americas | | | $ | 1,799,666 | | | | $ | - | | | | $ | - | | | | $ | 1,799,666 | |
Emerging Markets | | | | 837,125 | | | | | 846,169 | | | | | - | | | | | 1,683,294 | |
Europe | | | | 115,830 | | | | | 6,334,310 | | | | | - | | | | | 6,450,140 | |
Pacific Basin | | | | - | | | | | 606,773 | | | | | - | | | | | 606,773 | |
Preferred Stocks(1) | | | | | | | | | | | | | | | | | | | | |
Emerging Markets | | | | - | | | | | 49,611 | | | | | - | | | | | 49,611 | |
Repurchase Agreement | | | | - | | | | | 1,471,590 | | | | | - | | | | | 1,471,590 | |
Total Investments | | | | 2,752,621 | | | | | 9,308,453 | | | | | - | | | | | 12,061,074 | |
Foreign Currency Forward Contracts(2) | | | | - | | | | | 3,108 | | | | | - | | | | | 3,108 | |
Total | | | $ | 2,752,621 | | | | $ | 9,311,561 | | | | $ | - | | | | $ | 12,064,182 | |
Mid Cap | | | | | | | | | | | | | | | | | | | | |
Common Stocks(1) | | | $ | 7,708,151 | | | | $ | - | | | | $ | - | | | | $ | 7,708,151 | |
Repurchase Agreement | | | | - | | | | | 430,262 | | | | | - | | | | | 430,262 | |
Total Investments | | | $ | 7,708,151 | | | | $ | 430,262 | | | | $ | - | | | | $ | 8,138,413 | |
Mid Cap Value | | | | | | | | | | | | | | | | | | | | |
Common Stocks(1) | | | $ | 3,909,140 | | | | $ | - | | | | $ | - | | | | $ | 3,909,140 | |
Repurchase Agreement | | | | - | | | | | 287,530 | | | | | - | | | | | 287,530 | |
Total Investments | | | $ | 3,909,140 | | | | $ | 287,530 | | | | $ | - | | | | $ | 4,196,670 | |
Small Cap | | | | | | | | | | | | | | | | | | | | |
Common Stocks(1) | | | $ | 1,199,870 | | | | $ | - | | | | $ | - | | | | $ | 1,199,870 | |
Repurchase Agreement | | | | - | | | | | 82,971 | | | | | - | | | | | 82,971 | |
Total Investments | | | $ | 1,199,870 | | | | $ | 82,971 | | | | $ | - | | | | $ | 1,282,841 | |
Value | | | | | | | | | | | | | | | | | | | | |
Common Stocks(1) | | | $ | 691,808 | | | | $ | 24,881 | | | | $ | - | | | | $ | 716,689 | |
Preferred Stocks(1) | | | | - | | | | | 47,883 | | | | | - | | | | | 47,883 | |
Repurchase Agreement | | | | - | | | | | 39,180 | | | | | - | | | | | 39,180 | |
Total Investments | | | $ | 691,808 | | | | $ | 111,944 | | | | $ | - | | | | $ | 803,752 | |
|
(1) See the Fund’s Schedule of Investments for sector or country classifications. (2) Foreign currency forward contracts are valued at unrealized appreciation (depreciation). (3) Common stock, valued at $0. (4) Corporate bond escrow, valued at $0. | |
Transfers between investment levels may occur as the markets fluctuate and/or the availability of data used in an investment’s valuation changes. The Funds recognize transfers between the levels as of the end of the period. At September 30, 2016 and September 30, 2015, the fair value of certain securities was determined based on other observable inputs, such as quoted prices for securities of the same issuer that trade on a different exchange, or were adjusted due to developments that occurred between the time of the close of foreign
| | |
| 106 | | Artisan Partners Funds |
NOTES TO FINANCIAL STATEMENTS
markets on which they trade and the close of regular session trading on the NYSE, which resulted in their Level 2 classification. There were no transfers from Level 1 to Level 2 or Level 2 to Level 1 during the period. During the period, one security held in High Income Fund was transferred from Level 2 to Level 3 due to lack of observable inputs and was fair valued in good faith by the valuation committee.
Information about Level 3 fair value measurements (dollar values in thousands):
| | | | | | | | | | | | | | |
| Assets | | Fair Value at
September 30, 2016 | | Valuation
Technique(s) | | Unobservable
Input(s) | | Impact to Fair
Value from an
Increase in
Input |
Emerging Markets Fund |
Common Stock | | | $ | - | | | Discounts for illiquidity and uncertainty | | Last quote in inactive market less 100% discount | | N/A |
High Income Fund |
Corporate Bond escrow | | | | - | | | Discounts for uncertainty of collectability | | Last quote in inactive market less 100% discount | | N/A |
As of September 30, 2016, the reconciliation of assets in which significant unobservable inputs (Level 3) were used in determining fair value is as follows (in thousands):
| | | | | | | | | | |
| | | Emerging Markets Fund | | High Income Fund |
Balance as of September 30, 2015 | | | $ | 74 | | | | $ | - | |
Transfers into Level 3 | | | | - | | | | | - | * |
Net change in unrealized appreciation (depreciation) | | | | 53 | | | | | - | |
Purchases | | | | - | | | | | - | |
Sales | | | | - | | | | | - | |
Realized Gain/Loss | | | | (127 | ) | | | | - | |
Transfers out of Level 3 | | | | - | | | | | - | |
| | | | | | | | | | |
Balance as of September 30, 2016 | | | $ | - | | | | $ | - | |
| | | | | | | | | | |
Net change in unrealized appreciation (depreciation) for investments held as of September 30, 2016 | | | $ | (73 | ) | | | $ | - | |
| | | | | | | | | | |
| | |
* Amount transferred into Level 3 at $0. | | | | | | | | | | |
Each Fund is a party to various master netting agreements. While the terms and conditions of these agreements may vary, all transactions under any such agreement constitute a single contractual relationship. Each party’s obligation to make any payments, deliveries or other transfers in respect of any transaction under such an agreement may be netted against the other party’s obligations under such agreement. A default by a party in performance with respect to one transaction under such an agreement would give the other party the right to terminate all transactions under such agreement and calculate one net amount owed from one party to the other.
| | |
| Artisan Partners Funds | | 107 |
NOTES TO FINANCIAL STATEMENTS
The following tables present information about the offsetting of derivative instruments and collateral amounts (in thousands):
| | | | | | | | | | | | | | | | | | | | | | |
| | | Gross Amounts Not Offset in the Statements of Assets and Liabilities |
Fund | | Counterparty | | Gross Asset Amounts
Presented in Statement of
Assets and Liabilities | | Financial
Instrument | | Collateral
Received | | Net Amount
(Not Less Than $0) |
Global Value | | State Street Bank and Trust Company | | | $ | 453 | | | | $ | (27 | ) | | | $ | - | | | | $ | 426 | |
International Value | | State Street Bank and Trust Company | | | | 3,738 | | | | | (630 | ) | | | | - | | | | | 3,108 | |
| |
| | | Gross Amounts Not Offset in the Statements of Assets and Liabilities |
Fund | | Counterparty | | Gross Liability Amounts
Presented in Statement of
Assets and Liabilities | | Financial
Instrument | | Collateral
Pledged | | Net Amount
(Not Less Than $0) |
Global Opportunities | | State Street Bank and Trust Company | | | $ | 94 | | | | $ | - | | | | $ | - | | | | $ | 94 | |
Global Value | | State Street Bank and Trust Company | | | | 27 | | | | | (27 | ) | | | | - | | | | | - | |
International Value | | State Street Bank and Trust Company | | | | 630 | | | | | (630 | ) | | | | - | | | | | - | |
| (6) | Transfer agent and authorized agent fees: |
Each Fund paid fees to, and reimbursed certain expenses of, the Funds’ transfer agent during the period. In addition, the Funds have authorized certain financial services companies, broker-dealers, banks or other authorized agents, and in some cases, other organizations designated by an authorized agent (with their designees, collectively “authorized agents”) to accept purchase, exchange and redemption orders on the Funds’ behalf. For Investor Shares or Advisor Shares of the Funds, some authorized agents do not charge investors a direct transaction fee, but instead charge a fee for accounting and shareholder services that the agent provided to Fund shareholders on the Fund’s behalf. Those services typically included recordkeeping, transaction processing for shareholders’ accounts and other services. Generally, the fee was either a per account charge based on the number of accounts to which the authorized agent provided such services, or was a percentage (as of September 30, 2016 up to 0.40% annually for Investor Shares and 0.15% annually for Advisor Shares) of the average value of Fund shares held in such accounts. Each Fund paid a portion of such fees, which are intended to compensate the authorized agent for its provision of services of the type that would be provided by the Funds’ transfer agent or other service providers if the shares were registered on the books of the Funds’ transfer agent. The balance of the fees incurred during the period was paid by the Adviser. Institutional Shares of the Funds do not pay fees to intermediaries in connection with recordkeeping, transaction processing for shareholders’ accounts or any other services that an intermediary may provide to its clients. The Funds’ expenses incurred for services provided by authorized agents are included in “Transfer agent fees” in the Statements of
| | |
| 108 | | Artisan Partners Funds |
NOTES TO FINANCIAL STATEMENTS
Operations. The table below shows the fees and expenses to the Funds’ transfer agent and the fees to authorized agents incurred by each class of each Fund during the year ended September 30, 2016 (in thousands):
| | | | | | | | | | | | | | | |
| | | Year Ended 9/30/2016 |
| Fund | | Fees and Expenses
to Transfer Agent | | Fees to
Authorized
Agents | | Total |
Artisan Developing World Fund - Investor Shares | | | $ | 59 | | | | $ | 315 | | | | $ | 374 | |
Artisan Developing World Fund - Advisor Shares | | | | 57 | | | | | 130 | | | | | 187 | |
Artisan Developing World Fund - Institutional Shares | | | | 14 | | | | | - | | | | | 14 | |
Artisan Emerging Markets Fund - Investor Shares | | | | 62 | | | | | 59 | | | | | 121 | |
Artisan Emerging Markets Fund - Institutional Shares | | | | 20 | | | | | - | | | | | 20 | |
Artisan Global Equity Fund - Investor Shares | | | | 70 | | | | | 434 | | | | | 504 | |
Artisan Global Equity Fund - Institutional Shares | | | | 15 | | | | | - | | | | | 15 | |
Artisan Global Opportunities Fund - Investor Shares | | | | 82 | | | | | 1,550 | | | | | 1,632 | |
Artisan Global Opportunities Fund - Advisor Shares | | | | 60 | | | | | 91 | | | | | 151 | |
Artisan Global Opportunities Fund - Institutional Shares | | | | 21 | | | | | - | | | | | 21 | |
Artisan Global Small Cap Fund - Investor Shares | | | | 68 | | | | | 255 | | | | | 323 | |
Artisan Global Value Fund - Investor Shares | | | | 88 | | | | | 1,608 | | | | | 1,696 | |
Artisan Global Value Fund - Advisor Shares | | | | 62 | | | | | 248 | | | | | 310 | |
Artisan Global Value Fund - Institutional Shares | | | | 23 | | | | | - | | | | | 23 | |
Artisan High Income Fund - Investor Shares | | | | 67 | | | | | 1,146 | | | | | 1,213 | |
Artisan High Income Fund - Advisor Shares | | | | 68 | | | | | 624 | | | | | 692 | |
Artisan International Fund - Investor Shares | | | | 407 | | | | | 20,300 | | | | | 20,707 | |
Artisan International Fund - Advisor Shares | | | | 295 | | | | | 1,505 | | | | | 1,800 | |
Artisan International Fund - Institutional Shares | | | | 31 | | | | | - | | | | | 31 | |
Artisan International Small Cap Fund - Investor Shares | | | | 88 | | | | | 1,589 | | | | | 1,677 | |
Artisan International Small Cap Fund - Institutional Shares | | | | 8 | | | | | - | | | | | 8 | |
Artisan International Value Fund - Investor Shares | | | | 115 | | | | | 10,757 | | | | | 10,872 | |
Artisan International Value Fund - Advisor Shares | | | | 222 | | | | | 1,645 | | | | | 1,867 | |
Artisan International Value Fund - Institutional Shares | | | | 25 | | | | | - | | | | | 25 | |
Artisan Mid Cap Fund - Investor Shares | | | | 128 | | | | | 7,730 | | | | | 7,858 | |
Artisan Mid Cap Fund - Advisor Shares | | | | 63 | | | | | 245 | | | | | 308 | |
Artisan Mid Cap Fund - Institutional Shares | | | | 33 | | | | | - | | | | | 33 | |
Artisan Mid Cap Value Fund - Investor Shares | | | | 196 | | | | | 6,467 | | | | | 6,663 | |
Artisan Mid Cap Value Fund - Advisor Shares | | | | 69 | | | | | 635 | | | | | 704 | |
Artisan Mid Cap Value Fund - Institutional Shares | | | | 23 | | | | | - | | | | | 23 | |
Artisan Small Cap Fund - Investor Shares | | | | 106 | | | | | 1,593 | | | | | 1,699 | |
Artisan Small Cap Fund - Institutional Shares | | | | 21 | | | | | - | | | | | 21 | |
Artisan Value Fund - Investor Shares | | | | 79 | | | | | 631 | | | | | 710 | |
Artisan Value Fund - Advisor Shares | | | | 63 | | | | | 266 | | | | | 329 | |
Artisan Value Fund - Institutional Shares | | | | 20 | | | | | - | | | | | 20 | |
| | |
| Artisan Partners Funds | | 109 |
NOTES TO FINANCIAL STATEMENTS
Each Fund except High Income Fund has the ability to direct transactions in equity securities to various brokers that have agreed to rebate a portion of the commissions generated. During the period, such cash rebates were made directly to the applicable Fund and were included in net realized gain or loss on investments in the Statements of Operations for the year ended September 30, 2016 as follows (in thousands):
| | | | | |
Developing World | | | $ | - | (1) |
Emerging Markets | | | | 3 | |
Global Equity | | | | - | (1) |
Global Opportunities | | | | 19 | |
Global Small Cap | | | | - | (1) |
Global Value | | | | 7 | |
International | | | | 85 | |
International Small Cap | | | | 1 | |
International Value | | | | 52 | |
Mid Cap | | | | 120 | |
Mid Cap Value | | | | 219 | |
Small Cap | | | | 9 | |
Value | | | | 45 | |
|
(1)Amount rounds to less than $1. | |
| (8) | Derivative Transactions: |
The fair value of derivative instruments as reported in the Statements of Assets and Liabilities as of September 30, 2016 was as follows (in thousands):
| | | | | | | | | |
| Fund | | Risk Exposure Category | | Statement of Assets and Liabilities location | | Value |
| Global Opportunities | | Foreign currency forward contracts | | Unrealized loss on foreign currency forward contracts | | | $ | (94 | ) |
| Global Value | | Foreign currency forward contracts | | Unrealized gain on foreign currency forward contracts | | | $ | 453 | |
| | | Foreign currency forward contracts | | Unrealized loss on foreign currency forward contracts | | | $ | (27 | ) |
| International Value | | Foreign currency forward contracts | | Unrealized gain on foreign currency forward contracts | | | $ | 3,738 | |
| | | Foreign currency forward contracts | | Unrealized loss on foreign currency forward contracts | | | $ | (630 | ) |
The effect of derivative instruments on the Statements of Operations for the year ended September 30, 2016 was as follows (in thousands):
Amount of Realized Gain (Loss) on Derivatives Recognized in Income
| | | | | | | | | |
| Fund | | Risk Exposure Category | | Statement of Operations location | | Value |
| Global Opportunities | | Foreign currency forward contracts | | Net realized loss on foreign currency related transactions | | | $ | (8,486 | ) |
| Global Value | | Foreign currency forward contracts | | Net realized gain on foreign currency related transactions | | | $ | 217 | |
| International Value | | Foreign currency forward contracts | | Net realized loss on foreign currency related transactions | | | $ | (42,178 | ) |
| | |
| 110 | | Artisan Partners Funds |
NOTES TO FINANCIAL STATEMENTS
Change in Unrealized Appreciation on Derivatives Recognized in Income
| | | | | | | | | |
| Fund | | Risk Exposure Category | | Statement of Operations location | | Value |
| Global Opportunities | | Foreign currency forward contracts | | Net increase in unrealized appreciation or depreciation on foreign currency related transactions | | | $ | 1,366 | |
| Global Value | | Foreign currency forward contracts | | Net increase in unrealized appreciation or depreciation on foreign currency related transactions | | | $ | 426 | |
| International Value | | Foreign currency forward contracts | | Net increase in unrealized appreciation or depreciation on foreign currency related transactions | | | $ | 12,375 | |
Volume of derivative activity
| | | | | | | | | | | | | | | |
| Fund | | Contracts Closed(1) | | Contracts Opened(1) | | Contracts Open at September 30, 2016 |
| Global Opportunities | | 3 | | 3 | | | | 1 | |
| Global Value | | 3 | | 6 | | | | 3 | |
| International Value | | 4 | | 7 | | | | 4 | |
| (1) | During the year ended September 30, 2016. |
| (9) | Related Party Transactions: |
| (a) | Investment Advisory Agreement - The Adviser, with which the officers and a director of the Funds are affiliated, provided investment advisory and administrative services to the Funds during the year ended September 30, 2016. In exchange for those services, each Fund pays a monthly management fee to the Adviser as follows: |
| | Developing World Fund and Emerging Markets Fund |
| | | | | |
Average Daily Net Assets | | Annual Rate |
Less than $1 billion | | | | 1.050 | % |
$1 billion to $2 billion | | | | 1.025 | |
$2 billion to $3.5 billion | | | | 1.000 | |
$3.5 billion to $5 billion | | | | 0.975 | |
Greater than $5 billion | | | | 0.950 | |
| | Global Equity Fund and Global Value Fund |
| | | | | |
Average Daily Net Assets | | Annual Rate |
Less than $1 billion | | | | 1.000 | % |
$1 billion to $4 billion | | | | 0.975 | |
$4 billion to $8 billion | | | | 0.950 | |
$8 billion to $12 billion | | | | 0.925 | |
Greater than $12 billion | | | | 0.900 | |
| | |
| Artisan Partners Funds | | 111 |
NOTES TO FINANCIAL STATEMENTS
| | Global Opportunities Fund |
| | | | | |
Average Daily Net Assets | | Annual Rate |
Less than $1 billion | | | | 0.900 | % |
$1 billion to $4 billion | | | | 0.875 | |
$4 billion to $8 billion | | | | 0.850 | |
$8 billion to $12 billion | | | | 0.825 | |
Greater than $12 billion | | | | 0.800 | |
| | | | | |
Average Daily Net Assets | | Annual Rate |
All | | | | 1.000 | % |
| | | | | |
Average Daily Net Assets | | Annual Rate |
Less than $1 billion | | | | 0.725 | % |
$1 billion to $2 billion | | | | 0.700 | |
$2 billion to $3.5 billion | | | | 0.675 | |
$3.5 billion to $10 billion | | | | 0.650 | |
Greater than $10 billion | | | | 0.625 | |
| | | | | |
Average Daily Net Assets | | Annual Rate |
Less than $500 million | | | | 1.000 | % |
$500 million to $750 million | | | | 0.975 | |
$750 million to $1 billion | | | | 0.950 | |
$1 billion to $12 billion | | | | 0.925 | |
Greater than $12 billion | | | | 0.900 | |
| | International Small Cap Fund |
| | | | | |
Average Daily Net Assets | | Annual Rate |
All | | | | 1.250 | % |
| | International Value Fund, Mid Cap Fund, Mid Cap Value Fund, and Small Cap Fund |
| | | | | |
Average Daily Net Assets | | Annual Rate |
Less than $500 million | | | | 1.000 | % |
$500 million to $750 million | | | | 0.975 | |
$750 million to $1 billion | | | | 0.950 | |
Greater than $1 billion | | | | 0.925 | |
| | | | | |
Average Daily Net Assets | | Annual Rate |
Less than $50 million | | | | 0.800 | % |
$50 million to $100 million | | | | 0.760 | |
$100 million to $500 million | | | | 0.720 | |
$500 million to $7.5 billion | | | | 0.680 | |
Greater than $7.5 billion | | | | 0.640 | |
| | |
| 112 | | Artisan Partners Funds |
NOTES TO FINANCIAL STATEMENTS
| (b) | Expense Waivers and Reimbursements - The Adviser has contractually agreed to bear certain expenses and waive its management fees to the extent necessary to cause annualized ordinary expenses (excluding taxes, interest, all commissions and other normal charges incident to the purchase and sale of portfolio securities, and extraordinary charges such as litigation costs, but including management fees paid to the Adviser) not to exceed the percentages of average daily net assets indicated below. This contract continues through January 31, 2018, at which time Artisan Partners will determine whether to renew, revise or discontinue it. The table below shows the current expense limit as a percent of average daily net assets and amounts waived by the Adviser during the year ended September 30, 2016 (dollar values in thousands): |
| | | | | | | | | | |
| Fund | | Expense Limit as a % of
Average Daily Net Assets | | Expenses
Waived |
Artisan Developing World Fund - Investor Shares | | | | 1.50 | % | | | $ | 34 | |
Artisan Developing World Fund - Advisor Shares | | | | 1.40 | % | | | | - | |
Artisan Developing World Fund - Institutional Shares | | | | 1.40 | % | | | | - | |
Artisan Emerging Markets Fund - Investor Shares | | | | 1.50 | % | | | | 229 | |
Artisan Emerging Markets Fund - Institutional Shares | | | | 1.50 | % | | | | 71 | |
Artisan Global Equity Fund - Investor Shares | | | | 1.50 | % | | | | - | |
Artisan Global Equity Fund - Institutional Shares | | | | 1.50 | % | | | | - | |
Artisan Global Opportunities Fund - Advisor Shares | | | | 1.10 | % | | | | - | |
Artisan Global Small Cap Fund - Investor Shares | | | | 1.50 | % | | | | 107 | |
Artisan Global Value Fund - Advisor Shares | | | | 1.20 | % | | | | - | |
Artisan High Income Fund - Investor Shares | | | | 1.25 | % | | | | - | |
Artisan High Income Fund - Advisor Shares | | | | 1.25 | % | | | | - | |
Artisan International Fund - Advisor Shares | | | | 1.07 | % | | | | - | |
Artisan International Value Fund - Advisor Shares | | | | 1.06 | % | | | | - | |
Artisan Mid Cap Fund - Advisor Shares | | | | 1.10 | % | | | | - | |
Artisan Mid Cap Value Fund - Advisor Shares | | | | 1.09 | % | | | | - | |
Artisan Value Fund - Advisor Shares | | | | 0.88 | % | | | | - | |
| | The Adviser voluntarily waived its management fee in aggregate the amount of $175,000, allocated equally among Artisan Small Cap Value Fund prior to the Reorganization (defined in Note 15) and Artisan Mid Cap Value Fund after the Reorganization. See Note 15 for additional information. The Funds had no material receivables from or payable to the Adviser as of September 30, 2016. |
| (c) | Officers and Directors – The officers and directors of the Funds who are affiliated with the Adviser receive no compensation from the Funds. The compensation paid to directors of the Funds who are not affiliated persons of the Adviser for their services as such is based on an annual fee of $260,000, payable quarterly, subject to an additional increase of $10,000 upon commencement of operations of any new series of Artisan Partners Funds and a decrease of $10,000 for any terminated series of Artisan Partners Funds. Effective July 1, 2016, the amount of the annual retainer decreased by $10,000 from $270,000 to $260,000, due to the merger of Artisan Small Cap Value Fund with and into Artisan Mid Cap Value Fund. In addition, the independent chair of the board of directors receives an additional $60,000 annually, payable quarterly, the |
| | |
| Artisan Partners Funds | | 113 |
NOTES TO FINANCIAL STATEMENTS
| | independent chair of the audit committee receives an additional $45,000 annually, payable quarterly and the independent chair of the education committee (effective February 9, 2016) and the independent chair of the governance and nominating committee each receives an additional $30,000 annually, payable quarterly. If more than seven in-person meetings or four telephonic meetings are held in a calendar year, the board will pay each director an additional meeting attendance fee of $5,000 for each such in-person meeting and $1,000 for each such telephonic meeting. Additionally, each director is entitled to reimbursement of expenses related to his or her duties as a director of the Funds. These fees were generally allocated to each of the Funds based on net assets, subject to a minimum allocation of $1,500 to each Fund per quarter. |
| | Artisan Partners Funds has adopted a deferred compensation plan for directors who are not affiliated persons of the Adviser that enables directors to elect to defer receipt of all or a portion of the annual compensation they are entitled to receive from the Funds. For purposes of determining the amount owed to the directors under the plan, deferred amounts were invested in shares of the Funds as selected by the individual directors. Each Fund purchased shares of the Funds selected for deferral by the directors in amounts equal to their investment, resulting in a Fund asset equal to the deferred compensation liability. Such assets were included as a component of “Other assets” on the Statement of Assets and Liabilities. Deferral of directors’ fees under the plan did not affect the net assets of the Funds, and did not materially affect the Funds’ assets, liabilities or net investment income per share. Amounts will be deferred until distributed in accordance with the plan. |
| (d) | Distribution – Shares of the Funds are offered for sale by Artisan Partners Distributors LLC (“Distributors”). Distributors is wholly owned by Artisan Holdings. All distribution expenses relating to the Funds are paid by the Adviser. |
| (10) | Line of credit arrangement: |
Artisan Partners Funds is party to a line of credit agreement with a syndicate of financial institutions, including State Street Bank and Trust Company (“SSB”), as lenders and SSB as administrative agent, that expires in June 2017. Under the line of credit, each Fund can borrow an amount that shall not exceed the lesser of (a) 33 1/3% of its adjusted net assets, with adjusted net assets being total assets less total liabilities (excluding indebtedness for borrowed money) after giving effect to the borrowing, and (b) the maximum amount the Fund is permitted to borrow pursuant to applicable law, pursuant to the Fund’s prospectus limitations on indebtedness, pursuant to any vote of the shareholders of the Fund, or pursuant to any limitation on borrowings in any applicable agreement with any governmental authority or regulator or any other applicable agreement or document to which such Fund is a party; provided that the aggregate borrowings by all the Funds may not exceed $150 million. The Funds paid a commitment fee at the annual rate of 0.180% (0.125% prior to June 15, 2016) on the unused portion of the line of credit and interest was charged on any borrowings at the higher of (i) the current overnight Federal Funds rate (but, in any event, not less than 0.00%) plus 1.25% or (ii) the one month LIBOR rate (but, in any event, not less than 0.00%) plus 1.25%. The Funds also paid an agent’s fee to SSB, an up-front fee to the lenders and the Funds’ and SSB’s legal expenses in connection with the line of credit, each as incurred. The fees are allocated to each Fund based on net assets. The use of the line of credit was generally restricted to temporary borrowing for extraordinary or emergency purposes. During the year ended September 30, 2016, there were no
| | |
| 114 | | Artisan Partners Funds |
NOTES TO FINANCIAL STATEMENTS
borrowings under the line of credit for any of the Funds, except for Emerging Markets Fund, Global Small Cap Fund and International Small Cap Fund, which had maximum borrowings of approximately $1,750,000, $14,250,000 and $8,100,000, respectively. Fees and interest expense, if any, related to the line of credit are included in other operating expenses in the Statement of Operations.
| (11) | Investment transactions: |
The cost of securities purchased and the proceeds from the sale of securities (excluding short-term securities) for the year ended September 30, 2016 were as follows (in thousands):
| | | | | | | | | | |
| Fund | | Security
Purchases | | Security
Sales |
Developing World | | | $ | 808,040 | | | | $ | 228,585 | |
Emerging Markets | | | | 17,208 | | | | | 36,483 | |
Global Equity | | | | 267,282 | | | | | 317,406 | |
Global Opportunities | | | | 702,278 | | | | | 500,397 | |
Global Small Cap | | | | 92,800 | | | | | 129,549 | |
Global Value | | | | 594,793 | | | | | 318,471 | |
High Income | | | | 1,547,339 | | | | | 845,432 | |
International | | | | 10,588,373 | | | | | 12,536,642 | |
International Small Cap | | | | 590,162 | | | | | 714,432 | |
International Value | | | | 2,229,148 | | | | | 1,731,167 | |
Mid Cap | | | | 3,193,705 | | | | | 4,397,918 | |
Mid Cap Value | | | | 1,270,352 | | | | | 4,259,489 | |
Small Cap | | | | 307,903 | | | | | 443,031 | |
Value | | | | 442,497 | | | | | 821,427 | |
| (12) | Transactions in securities of affiliates: |
The table below shows information about securities of Fund “affiliates” (as defined below) that were held by a Fund, purchased or sold by a Fund, or from which dividends were received by a Fund during the year ended September 30, 2016 (dollar values in thousands). Each Fund identifies a company as an affiliate for the purpose of this report if the Fund owned voting securities that it believed represented 5% or more of that company’s outstanding voting securities (as defined by the 1940 Act) during the year ended September 30, 2016.
| | | | | | | | | | | | | | | | | | | | | | | | | | | | | | | | | | | | | |
| | | | | As of
9/30/2015 | | | | | | Net
Realized
Gain (Loss) | | | | As of
9/30/2016 |
| Fund | | Security | | Share
Balance | | Purchase
Cost | | Sales
Cost | | | Dividend
Income@ | | Share
Balance | | Value |
| Global Equity | |
| | | Ginko International Co., Ltd.§ | | | | 791,000 | | | | $ | 701 | | | | $ | 2,314 | | | | $ | (1,318 | ) | | | $ | 137 | | | | | 627,000 | | | | $ | 6,233 | |
| | | ISS AS^† | | | | - | | | | | 3,767 | | | | | 391 | | | | | 23 | | | | | 97 | | | | | 94,642 | | | | | 3,938 | |
| | | Wirecard AG^† | | | | 98,055 | | | | | 380 | | | | | 928 | | | | | (44 | ) | | | | 12 | | | | | 84,238 | | | | | 4,375 | |
| | | Total# | | | | | | | | $ | 4,848 | | | | $ | 3,633 | | | | $ | (1,339 | ) | | | $ | 246 | | | | | | | | | $ | - | |
| | |
| Artisan Partners Funds | | 115 |
NOTES TO FINANCIAL STATEMENTS
| | | | | | | | | | | | | | | | | | | | | | | | | | | | | | | | | | | | | |
| | | | | As of
9/30/2015 | | | | | | Net
Realized
Gain (Loss) | | | | As of
9/30/2016 |
| Fund | | Security | | Share
Balance | | Purchase
Cost | | Sales
Cost | | | Dividend
Income@ | | Share
Balance | | Value |
| Global Opportunities | | | | | | | | | | | | | | | | | | | | | | | | | | | | | | | | | | | |
| | | IHS, Inc., Class A§ | | | | 581,487 | | | | $ | 9,370 | | | | $ | 2,105 | | | | $ | 4,352 | | | | $ | - | | | | | - | | | | $ | - | |
| | | Stanley Electric Co., Ltd.^ | | | | 686,400 | | | | | 9,680 | | | | | 412 | | | | | 44 | | | | | 305 | | | | | 1,121,046 | | | | | 30,154 | |
| | | Total# | | | | | | | | $ | 19,050 | | | | $ | 2,517 | | | | $ | 4,396 | | | | $ | 305 | | | | | | | | | $ | - | |
| Global Small Cap | | | | | | | | | | | | | | | | | | | | | | | | | | | | | | | | | | | |
| | | Ginko International Co., Ltd.§ | | | | 444,000 | | | | $ | 309 | | | | $ | 1,330 | | | | $ | (891 | ) | | | $ | 76 | | | | | 339,000 | | | | $ | 3,370 | |
| | | Total# | | | | | | | | $ | 309 | | | | $ | 1,330 | | | | $ | (891 | ) | | | $ | 76 | | | | | | | | | $ | - | |
| Global Value | | | | | | | | | | | | | | | | | | | | | | | | | | | | | | | | | | | | | |
| | | Arch Capital Group Ltd.^ | | | | 824,053 | | | | $ | 16,556 | | | | $ | 3,592 | | | | $ | 819 | | | | $ | - | | | | | 1,002,497 | | | | $ | 79,458 | |
| | | ISS AS^ | | | | 1,159,246 | | | | | 9,358 | | | | | 4,709 | | | | | 363 | | | | | 1,154 | | | | | 1,277,328 | | | | | 53,142 | |
| | | Joy Global, Inc.§ | | | | 603,577 | | | | | 1,578 | | | | | 19,153 | | | | | (5,307 | ) | | | | 19 | | | | | - | | | | | - | |
| | | Total# | | | | | | | | $ | 27,492 | | | | $ | 27,454 | | | | $ | (4,125 | ) | | | $ | 1,173 | | | | | | | | | $ | - | |
| International | | | | | | | | | | | | | | | | | | | | | | | | | | | | | | | | | | | | | |
| | | ISS AS^† | | | | - | | | | $ | 75,664 | | | | $ | 1,458 | | | | $ | (67 | ) | | | $ | 1,017 | | | | | 1,911,145 | | | | $ | 79,512 | |
| | | Wirecard AG† | | | | 657,781 | | | | | 261,499 | | | | | 11,625 | | | | | (2,010 | ) | | | | 862 | | | | | 6,298,195 | | | | | 327,136 | |
| | | Zodiac Aerospace§† | | | | 12,663,986 | | | | | 57,986 | | | | | 23,461 | | | | | (12,316 | ) | | | | 5,127 | | | | | 13,973,789 | | | | | 340,242 | |
| | | Total# | | | | | | | | $ | 395,149 | | | | $ | 36,544 | | | | $ | (14,393 | ) | | | $ | 7,006 | | | | | | | | | $ | 327,136 | |
| International Small Cap | | | | | | | | | | | | | | | | | | | | | | | | | | | | | | | | | | | |
| | | Comet Holding AG§ | | | | 40,085 | | | | $ | - | | | | $ | 3,067 | | | | $ | (320 | ) | | | $ | 453 | | | | | 36,167 | | | | $ | 33,058 | |
| | | Ginko International Co., Ltd.§ | | | | 4,043,000 | | | | | - | | | | | 5,121 | | | | | (3,553 | ) | | | | 773 | | | | | 3,545,000 | | | | | 35,243 | |
| | | Wirecard AG^† | | | | 1,621,708 | | | | | - | | | | | 19,743 | | | | | 16,120 | | | | | 182 | | | | | 1,214,571 | | | | | 63,086 | |
| | | Total# | | | | | | | | $ | - | | | | $ | 27,931 | | | | $ | 12,247 | | | | $ | 1,408 | | | | | | | | | $ | - | |
| International Value | | | | | | | | | | | | | | | | | | | | | | | | | | | | | | | | | | | |
| | | Aker Solutions ASA§ | | | | 17,389,284 | | | | $ | 6,314 | | | | $ | 30,671 | | | | $ | (62,839 | ) | | | $ | - | | | | | 11,545,697 | | | | $ | 54,162 | |
| | | Arch Capital Group Ltd. | | | | 6,225,338 | | | | | 36,389 | | | | | 19,517 | | | | | 3,341 | | | | | - | | | | | 6,462,064 | | | | | 512,183 | |
| | | ISS AS^ | | | | 8,567,470 | | | | | 20,985 | | | | | 21,441 | | | | | 2,331 | | | | | 8,383 | | | | | 8,569,394 | | | | | 356,525 | |
| | | Panalpina Welttransport Holding AG | | | | 1,988,088 | | | | | 34,148 | | | | | 2,362 | | | | | (1,220 | ) | | | | 6,690 | | | | | 2,261,132 | | | | | 315,402 | |
| | | Stanley Electric Co., Ltd. | | | | 9,306,804 | | | | | 6,763 | | | | | 8,545 | | | | | 282 | | | | | 2,654 | | | | | 9,167,804 | | | | | 246,594 | |
| | | Vesuvius plc | | | | 23,945,533 | | | | | 22,951 | | | | | - | | | | | - | | | | | 6,176 | | | | | 28,706,714 | | | | | 130,704 | |
| | | Total# | | | | | | | | $ | 127,550 | | | | $ | 82,536 | | | | $ | (58,105 | ) | | | $ | 23,903 | | | | | | | | | $ | 1,204,883 | |
| Mid Cap | | | | | | | | | | | | | | | | | | | | | | | | | | | | | | | | | | | | | |
| | | IHS, Inc., Class A§ | | | | 3,101,243 | | | | $ | - | | | | $ | 75,687 | | | | $ | 111,985 | | | | $ | - | | | | | - | | | | $ | - | |
| | | Total# | | | | | | | | $ | - | | | | $ | 75,687 | | | | $ | 111,985 | | | | $ | - | | | | | | | | | $ | - | |
| Mid Cap Value | | | | | | | | | | | | | | | | | | | | | | | | | | | | | | | | | | | |
| | | Air Lease Corp.^† | | | | - | | | | $ | 172,879 | | | | $ | 43,295 | | | | $ | (5,189 | ) | | | $ | 746 | | | | | 4,555,135 | | | | $ | 130,186 | |
| | | Arch Capital Group Ltd.^ | | | | 2,442,126 | | | | | - | | | | | 91,486 | | | | | 66,507 | | | | | - | | | | | 1,168,292 | | | | | 92,599 | |
| | | Joy Global, Inc.§ | | | | 4,199,074 | | | | | 2,181 | | | | | 98,978 | | | | | (80,571 | ) | | | | 94 | | | | | - | | | | | - | |
| | | Total# | | | | | | | | $ | 175,060 | | | | $ | 233,759 | | | | $ | (19,253 | ) | | | $ | 840 | | | | | | | | | $ | - | |
| | |
| 116 | | Artisan Partners Funds |
NOTES TO FINANCIAL STATEMENTS
| | | | | | | | | | | | | | | | | | | | | | | | | | | | | | | | | | | | | |
| | | | | As of
9/30/2015 | | | | | | Net
Realized
Gain (Loss) | | | | As of
9/30/2016 |
| Fund | | Security | | Share
Balance | | Purchase
Cost | | Sales
Cost | | | Dividend
Income@ | | Share
Balance | | Value |
| Value | | | |
| | | Air Lease Corp.^† | | | | - | | | | $ | 27,745 | | | | $ | 1,200 | | | | $ | 30 | | | | $ | 119 | | | | | 1,007,764 | | | | $ | 28,802 | |
| | | Arch Capital Group Ltd.§ | | | | 361,651 | | | | | - | | | | | 24,576 | | | | | 16,403 | | | | | - | | | | | - | | | | | - | |
| | | Joy Global, Inc.§ | | | | 1,677,990 | | | | | 612 | | | | | 36,451 | | | | | (21,131 | ) | | | | 38 | | | | | - | | | | | - | |
| | | Total# | | | | | | | | $ | 28,357 | | | | $ | 62,227 | | | | $ | (4,698 | ) | | | $ | 157 | | | | | | | | | $ | - | |
| @ | Net of foreign taxes withheld, if any. |
| # | Total value as of September 30, 2016 is presented for only those issuers that were affiliates as of September 30, 2016. |
| § | Issuer was no longer an affiliate as of September 30, 2016. |
| ^ | Issuer was no longer an affiliate as of September 30, 2016. For the year ended September 30, 2015, the Funds identified a company as an affiliate for the purpose of this report if one or more Fund owned, in the aggregate, voting securities that it believed represented 5% or more of that company’s outstanding voting securities. |
| † | Issuer was not an affiliate as of September 30, 2015. |
| (13) | Information for Federal income tax purposes: |
For Federal income tax purposes, the cost of investments, gross unrealized appreciation, gross unrealized depreciation and net unrealized appreciation (depreciation) on investments as of September 30, 2016 was as follows (in thousands):
| | | | | | | | | | | | | | | | | | | | |
| Fund | | Cost of
Investments | | Gross
Unrealized
Appreciation | | Gross
Unrealized
Depreciation | | Net
Unrealized
Appreciation on
Investments |
Developing World | | | $ | 770,638 | | | | $ | 124,216 | | | | $ | (9,468 | ) | | | $ | 114,748 | |
Emerging Markets | | | | 36,310 | | | | | 8,969 | | | | | (8,395 | ) | | | | 574 | |
Global Equity | | | | 222,943 | | | | | 36,600 | | | | | (4,244 | ) | | | | 32,356 | |
Global Opportunities | | | | 1,401,288 | | | | | 442,735 | | | | | (10,112 | ) | | | | 432,623 | |
Global Small Cap | | | | 71,883 | | | | | 8,026 | | | | | (3,205 | ) | | | | 4,821 | |
Global Value | | | | 1,900,520 | | | | | 303,354 | | | | | (131,566 | ) | | | | 171,788 | |
High Income | | | | 1,804,590 | | | | | 76,131 | | | | | (41,448 | ) | | | | 34,683 | |
International | | | | 14,016,368 | | | | | 2,034,174 | | | | | (199,429 | ) | | | | 1,834,745 | |
International Small Cap | | | | 635,315 | | | | | 172,261 | | | | | (23,057 | ) | | | | 149,204 | |
International Value | | | | 10,534,686 | | | | | 2,537,529 | | | | | (1,011,141 | ) | | | | 1,526,388 | |
Mid Cap | | | | 6,124,718 | | | | | 2,030,493 | | | | | (16,798 | ) | | | | 2,013,695 | |
Mid Cap Value | | | | 3,155,646 | | | | | 1,097,536 | | | | | (56,512 | ) | | | | 1,041,024 | |
Small Cap | | | | 783,275 | | | | | 501,908 | | | | | (2,342 | ) | | | | 499,566 | |
Value | | | | 673,776 | | | | | 143,692 | | | | | (13,716 | ) | | | | 129,976 | |
The difference between cost of investments for financial reporting and cost of investments for Federal income tax purposes was due primarily to timing differences in recognizing certain gains and losses on security transactions (e.g., wash sale loss deferrals and passive foreign investment company transactions).
| | |
| Artisan Partners Funds | | 117 |
NOTES TO FINANCIAL STATEMENTS
The tax characterization of ordinary income dividends and long-term capital gain distributions paid during the year ended September 30, 2016 and the year ended September 30, 2015 were as follows (in thousands):
| | | | | | | | | | | | | | | | | | | | |
| | | Year Ended 9/30/2016 | | Year or Period Ended 9/30/2015 |
| Fund | | Ordinary
Income
Dividends | | Long-Term
Capital Gain
Distributions | | Ordinary
Income
Dividends | | Long-Term
Capital Gain
Distributions |
Developing World | | | $ | - | | | | $ | - | | | | $ | - | (1) | | | $ | - | (1) |
Emerging Markets | | | | - | | | | | - | | | | | 3,476 | | | | | - | |
Global Equity | | | | 5,313 | | | | | 1,549 | | | | | 5,271 | | | | | 1,962 | |
Global Opportunities | | | | 2,530 | | | | | 8,827 | | | | | 4,684 | | | | | 26,461 | |
Global Small Cap | | | | - | | | | | - | | | | | 1,155 | | | | | 1,195 | |
Global Value | | | | 10,008 | | | | | 80,358 | | | | | 44,958 | | | | | 16,540 | |
High Income | | | | 92,447 | | | | | 213 | | | | | 44,032 | | | | | - | |
International | | | | 103,903 | | | | | - | | | | | 140,063 | | | | | - | |
International Small Cap | | | | 1,554 | | | | | 31,526 | | | | | 249 | | | | | 59,110 | |
International Value | | | | 100,391 | | | | | 540,475 | | | | | 303,204 | | | | | 442,441 | |
Mid Cap | | | | - | | | | | 1,234,797 | | | | | - | | | | | 954,288 | |
Mid Cap Value | | | | 31,880 | | | | | 951,217 | | | | | 163,488 | | | | | 928,701 | |
Small Cap | | | | - | | | | | 118,049 | | | | | - | | | | | - | |
Value | | | | 8,634 | | | | | 89,485 | | | | | 38,081 | | | | | 68,946 | |
| (1) | For the period from commencement of operations (June 29, 2015) through September 30, 2015. |
Ordinary income dividends and long-term capital gain distributions were determined in accordance with income tax regulations that impose treatment that is different from the treatment that would result from the application of US GAAP for such items as net short-term gains, wash sale loss deferrals, passive foreign investment company transactions, foreign currency transactions, net investment losses and qualified late year ordinary losses.
Gains on redemptions in-kind for Global Opportunities Fund and Mid Cap Fund of approximately $9,534,000 and $31,368,000, respectively, were included in net realized gain on investments in the Statements of Operations for the year ended September 30, 2016, and were not recognized for Federal income tax purposes. These net realized gains represented permanent book/tax differences and were reclassified to “Fund shares issued and outstanding” on the accompanying Statements of Assets and Liabilities.
In addition, the Funds may periodically record reclassifications among certain capital accounts to reflect differences between financial reporting and income tax basis distributions. The reclassifications were reported in order to reflect the tax treatment for certain permanent differences that exist between income tax regulations and US GAAP. The reclassifications generally relate to net operating losses, Section 988 currency gains and losses, PFIC gains and losses, and utilization of earnings and profits distributed to shareholders on redemption of shares. These reclassifications have no impact on the net asset values of the Funds.
| | |
| 118 | | Artisan Partners Funds |
NOTES TO FINANCIAL STATEMENTS
In order to meet certain excise tax distribution requirements, the Funds are required to measure and distribute annually, net capital gains realized during a twelve-month period ending October 31 and net investment income earned during a twelve-month period ending December 31. In connection with these requirements, the Funds are permitted for tax purposes to defer into their next fiscal year qualified late year losses. Qualified late year capital losses are any net capital losses incurred between November 1 and the end of the Funds’ fiscal year, September 30, 2016. Qualified late year ordinary losses are specified losses generally incurred between January 1 and the end of the Funds’ fiscal year, September 30, 2016.
Additional tax information as of and for the year ended September 30, 2016 follows (in thousands):
| | | | | | | | | | | | | | | | | | | | | | | | | |
| Fund | | Undistributed
Ordinary
Income | | Undistributed Long-Term Gain | | Qualified
Late Year
Capital
Losses | | Qualified
Late Year
Ordinary
Losses | | Other
Deferred
Gains
(Losses)(1) |
Developing World | | | $ | 5,144 | | | | $ | - | | | �� | $ | - | | | | $ | - | | | | $ | (1,496 | ) |
Emerging Markets | | | | 335 | | | | | - | | | | | - | | | | | - | | | | | (10 | ) |
Global Equity | | | | 186 | | | | | - | | | | | 15,762 | | | | | - | | | | | (12 | ) |
Global Opportunities | | | | - | | | | | 2,928 | | | | | - | | | | | 8,062 | | | | | (115 | ) |
Global Small Cap | | | | - | | | | | - | | | | | - | | | | | 288 | | | | | (4 | ) |
Global Value | | | | 25,478 | | | | | 33,377 | | | | | - | | | | | - | | | | | (53 | ) |
High Income | | | | 2,679 | | | | | - | | | | | - | | | | | - | | | | | (1,608 | ) |
International | | | | 187,214 | | | | | - | | | | | - | | | | | - | | | | | (2,838 | ) |
International Small Cap | | | | - | | | | | 13,080 | | | | | - | | | | | 350 | | | | | (109 | ) |
International Value | | | | 133,491 | | | | | 240,580 | | | | | - | | | | | - | | | | | (3,012 | ) |
Mid Cap | | | | - | | | | | 468,063 | | | | | - | | | | | 36,574 | | | | | (90 | ) |
Mid Cap Value | | | | 29,750 | | | | | 67,617 | | | | | - | | | | | - | | | | | (223 | ) |
Small Cap | | | | - | | | | | 4,959 | | | | | - | | | | | 7,951 | | | | | (13 | ) |
Value | | | | 4,792 | | | | | - | | | | | 26,493 | | | | | - | | | | | (425 | ) |
| (1) | Other deferred gains and losses relate to (a) gains or losses on transactions that occurred subsequent to year end that affected the distributable earnings at September 30, 2016 such as wash sales, (b) unrealized gains and losses on open foreign currency contracts and (c) other items. |
As of September 30, 2016, the Funds had capital loss carryovers shown in the table below (in thousands). To the extent the Funds realize future net capital gains, those gains will be offset by any unused capital loss carryover.
| | | | | | | | | | |
| Fund | | Unlimited – ST | | Unlimited – LT |
Emerging Markets | | | $ | 6,324 | | | | $ | 130,671 | (1) |
Global Equity | | | | 2,336 | | | | | - | |
Global Small Cap | | | | 19,613 | | | | | 5,782 | |
International | | | | 523,998 | | | | | - | |
| (1) | Due to an equity shift in the ordinary course of business, the utilization of certain capital loss carryovers is subject to annual limitations of $1,815, pursuant to IRC Section 382-383. Developing World Fund utilized previous year capital loss carryover of $954. |
| | |
| Artisan Partners Funds | | 119 |
NOTES TO FINANCIAL STATEMENTS
| (14) | Fund share activities: |
Capital share transactions for the Funds were as follows (dollar values in thousands):
| | | | | | | | | | | | | | | | | | | | |
| | | DEVELOPING WORLD |
| | Year Ended
9/30/2016 | | Period Ended(1)
9/30/2015 |
| | | Shares | | Amount | | Shares | | Amount |
| Proceeds from shares issued | | | | | | | | | | | | | | | | | | | | |
Investor Shares | | | | 25,510,958 | | | | $ | 235,668 | | | | | 2,482,172 | | | | $ | 24,067 | |
Advisor Shares | | | | 27,577,662 | | | | | 257,536 | | | | | 7,039,240 | | | | | 63,619 | |
Institutional Shares | | | | 23,398,700 | | | | | 207,318 | | | | | 4,770,304 | | | | | 42,512 | |
| Cost of shares redeemed(2) | | | | | | | | | | | | | | | | | | | | |
Investor Shares | | | | (2,654,618 | ) | | | | (25,741 | ) | | | | (21,206 | ) | | | | (187 | ) |
Advisor Shares | | | | (2,177,959 | ) | | | | (20,029 | ) | | | | (100,866 | ) | | | | 42,512 | |
Institutional Shares | | | | (1,857,381 | ) | | | | (17,762 | ) | | | | (4,330 | ) | | | | (41 | ) |
| Net increase from fund share transactions | | | | | | | | | | | | | | | | | | | | |
Investor Shares | | | | 22,856,340 | | | | | 209,927 | | | | | 2,460,966 | | | | | 23,880 | |
Advisor Shares | | | | 25,399,703 | | | | | 237,507 | | | | | 6,938,374 | | | | | 62,753 | |
Institutional Shares | | | | 21,541,319 | | | | | 189,556 | | | | | 4,765,974 | | | | | 42,471 | |
| Redemption Fee(7) | | | | | | | | | | | | | | | | | | | | |
Investor Shares | | | | - | | | | | 3 | | | | | - | | | | | - | |
Advisor Shares | | | | - | | | | | 11 | | | | | - | | | | | 1 | |
Institutional Shares | | | | - | | | | | 8 | | | | | - | | | | | 1 | |
| |
| | | EMERGING MARKETS |
| | | Year Ended
9/30/2016 | | Year Ended
9/30/2015 |
| | | Shares | | Amount | | Shares | | Amount |
| Proceeds from shares issued | | | | | | | | | | | | | | | | | | | | |
Investor Shares | | | | 556,699 | | | | $ | 6,394 | | | | | 725,726 | | | | $ | 8,420 | |
Institutional Shares | | | | 442,477 | | | | | 4,804 | | | | | 192,586 | | | | | 2,260 | |
| Net asset value of shares issued in reinvestment of dividends and distributions | | | | | | | | | | | | | | | | | | | | |
Investor Shares | | | | - | | | | | - | | | | | 26,044 | | | | | 323 | |
Institutional Shares | | | | - | | | | | - | | | | | 246,662 | | | | | 3,036 | |
| Cost of shares redeemed(2) | | | | | | | | | | | | | | | | | | | | |
Investor Shares | | | | (501,250 | ) | | | | (5,560 | ) | | | | (3,793,631 | ) | | | | (46,053 | ) |
Institutional Shares | | | | (2,770,213 | ) | | | | (26,660 | ) | | | | (24,604,592 | ) | | | | (299,356 | ) |
| Net increase from fund share transactions | | | | | | | | | | | | | | | | | | | | |
Investor Shares | | | | 55,449 | | | | | 834 | | | | | (3,041,861 | ) | | | | (37,310 | ) |
Institutional Shares | | | | (2,327,736 | ) | | | | (21,856 | ) | | | | (24,165,344 | ) | | | | (294,060 | ) |
| Redemption Fee(7) | | | | | | | | | | | | | | | | | | | | |
Investor Shares | | | | - | | | | | - | (3) | | | | - | | | | | 1 | |
Institutional Shares | | | | - | | | | | - | (3) | | | | - | | | | | 1 | |
|
| Footnotes are presented on Page 126. | |
| | |
| 120 | | Artisan Partners Funds |
NOTES TO FINANCIAL STATEMENTS
| | | | | | | | | | | | | | | | | | | | |
| | | GLOBAL EQUITY |
| | | Year Ended
9/30/2016 | | Year Ended
9/30/2015 |
| | | Shares | | Amount | | Shares | | Amount |
| Proceeds from shares issued | | | | | | | | | | | | | | | | | | | | |
Investor Shares | | | | 3,634,815 | | | | $ | 57,870 | | | | | 5,990,024 | | | | $ | 103,286 | |
Institutional Shares(4) | | | | 7,405,905 | | | | | 121,004 | | | | | | | | | | | |
| Net asset value of shares issued in reinvestment of dividends and distributions | | | | | | | | | | | | | | | | | | | | |
Investor Shares | | | | 279,484 | | | | | 4,536 | | | | | 426,772 | | | | | 6,888 | |
Institutional Shares(4) | | | | 125,405 | | | | | 2,035 | | | | | | | | | | | |
| Cost of shares redeemed(2) | | | | | | | | | | | | | | | | | | | | |
Investor Shares | | | | (13,938,823 | ) | | | | (220,239 | ) | | | | (2,177,979 | ) | | | | (36,225 | ) |
Institutional Shares(4) | | | | (792,296 | ) | | | | (12,721 | ) | | | | | | | | | | |
| Net increase from fund share transactions | | | | | | | | | | | | | | | | | | | | |
Investor Shares | | | | (10,024,524 | ) | | | | (157,833 | ) | | | | 4,238,817 | | | | | 73,949 | |
Institutional Shares(4) | | | | 6,739,014 | | | | | 110,318 | | | | | | | | | | | |
| Redemption Fee(7) | | | | | | | | | | | | | | | | | | | | |
Investor Shares | | | | - | | | | | 15 | | | | | - | | | | | 15 | |
Institutional Shares(8) | | | | - | | | | | 3 | | | | | | | | | | | |
| |
| | | GLOBAL OPPORTUNITIES |
| | | Year Ended
9/30/2016 | | Year Ended
9/30/2015 |
| | | Shares | | Amount | | Shares | | Amount |
| Proceeds from shares issued | | | | | | | | | | | | | | | | | | | | |
Investor Shares | | | | 11,034,782 | | | | $ | 216,158 | | | | | 11,483,092 | | | | $ | 222,023 | |
Advisor Shares(5) | | | | 8,125,784 | | | | | 153,704 | | | | | 3,060,198 | | | | | 60,686 | |
Institutional Shares | | | | 8,347,726 | | | | | 165,431 | | | | | 15,093,830 | | | | | 291,773 | |
| Net asset value of shares issued in reinvestment of dividends and distributions | | | | | | | | | | | | | | | | | | | | |
Investor Shares | | | | 234,399 | | | | | 4,660 | | | | | 870,398 | | | | | 16,233 | |
Advisor Shares(5) | | | | 19,955 | | | | | 397 | | | | | - | | | | | - | |
Institutional Shares | | | | 261,065 | | | | | 5,213 | | | | | 663,613 | | | | | 12,423 | |
| Cost of shares redeemed(2) | | | | | | | | | | | | | | | | | | | | |
Investor Shares | | | | (11,806,409 | ) | | | | (222,635 | ) | | | | (14,131,841 | ) | | | | (268,712 | ) |
Advisor Shares(5) | | | | (2,215,682 | ) | | | | (41,703 | ) | | | | (111,184 | ) | | | | (2,080 | ) |
Institutional Shares | | | | (3,442,200 | ) | | | | (68,806 | ) | | | | (4,405,311 | ) | | | | (85,275 | ) |
| Net increase from fund share transactions | | | | | | | | | | | | | | | | | | | | |
Investor Shares | | | | (537,228 | ) | | | | (1,817 | ) | | | | (1,778,351 | ) | | | | (30,456 | ) |
Advisor Shares(5) | | | | 5,930,057 | | | | | 112,398 | | | | | 2,949,014 | | | | | 58,606 | |
Institutional Shares | | | | 5,166,591 | | | | | 101,838 | | | | | 11,352,132 | | | | | 218,921 | |
| Redemption Fee(7) | | | | | | | | | | | | | | | | | | | | |
Investor Shares | | | | - | | | | | 18 | | | | | - | | | | | 47 | |
Advisor Shares(5) | | | | - | | | | | 2 | | | | | - | | | | | 1 | |
Institutional Shares | | | | - | | | | | 17 | | | | | - | | | | | 37 | |
|
| Footnotes are presented on Page 126. | |
| | |
| Artisan Partners Funds | | 121 |
NOTES TO FINANCIAL STATEMENTS
| | | | | | | | | | | | | | | | | | | | |
| | | GLOBAL SMALL CAP |
| | | Year Ended
9/30/2016 | | Year Ended
9/30/2015 |
| | | Shares | | Amount | | Shares | | Amount |
| Proceeds from shares issued | | | | | | | | | | | | | | | | | | | | |
Investor Shares | | | | 2,049,706 | | | | $ | 21,185 | | | | | 3,486,318 | | | | $ | 39,736 | |
| Net asset value of shares issued in reinvestment of dividends and distributions | | | | | | | | | | | | | | | | | | | | |
Investor Shares | | | | - | | | | | - | | | | | 207,315 | | | | | 2,258 | |
| Cost of shares redeemed(2) | | | | | | | | | | | | | | | | | | | | |
Investor Shares | | | | (6,701,817 | ) | | | | (68,229 | ) | | | | (6,469,894 | ) | | | | (70,159 | ) |
| Net increase from fund share transactions | | | | | | | | | | | | | | | | | | | | |
Investor Shares | | | | (4,652,111 | ) | | | | (47,044 | ) | | | | (2,776,261 | ) | | | | (28,165 | ) |
| Redemption Fee(7) | | | | | | | | | | | | | | | | | | | | |
Investor Shares | | | | - | | | | | 1 | | | | | - | | | | | 23 | |
| |
| | | GLOBAL VALUE |
| | | Year Ended
9/30/2016 | | Year Ended
9/30/2015 |
| | | Shares | | Amount | | Shares | | Amount |
| Proceeds from shares issued | | | | | | | | | | | | | | | | | | | | |
Investor Shares | | | | 16,731,457 | | | | $ | 240,631 | | | | | 13,065,129 | | | | $ | 203,547 | |
Advisor Shares(5) | | | | 19,177,721 | | | | | 270,051 | | | | | 15,119,397 | | | | | 239,218 | |
Institutional Shares | | | | 30,026,308 | | | | | 435,264 | | | | | 6,841,958 | | | | | 107,154 | |
| Net asset value of shares issued in reinvestment of dividends and distributions | | | | | | | | | | | | | | | | | | | | |
Investor Shares | | | | 2,899,237 | | | | | 42,416 | | | | | 2,495,215 | | | | | 38,676 | |
Advisor Shares(5) | | | | 898,964 | | | | | 13,116 | | | | | - | | | | | - | |
Institutional Shares | | | | 1,850,984 | | | | | 27,061 | | | | | 1,142,541 | | | | | 17,709 | |
| Cost of shares redeemed(2) | | | | | | | | | | | | | | | | | | | | |
Investor Shares | | | | (27,881,197 | ) | | | | (398,314 | ) | | | | (42,080,729 | ) | | | | (660,169 | ) |
Advisor Shares(5) | | | | (6,524,720 | ) | | | | (93,401 | ) | | | | (2,288,054 | ) | | | | (35,332 | ) |
Institutional Shares | | | | (7,289,587 | ) | | | | (106,438 | ) | | | | (8,334,147 | ) | | | | (127,347 | ) |
| Net increase from fund share transactions | | | | | | | | | | | | | | | | | | | | |
Investor Shares | | | | (8,250,503 | ) | | | | (115,267 | ) | | | | (26,520,385 | ) | | | | (417,946 | ) |
Advisor Shares(5) | | | | 13,551,965 | | | | | 189,766 | | | | | 12,831,343 | | | | | 203,886 | |
Institutional Shares | | | | 24,587,705 | | | | | 355,887 | | | | | (349,648 | ) | | | | (2,484 | ) |
| Redemption Fee(7) | | | | | | | | | | | | | | | | | | | | |
Investor Shares | | | | - | | | | | 11 | | | | | - | | | | | 22 | |
Advisor Shares(5) | | | | - | | | | | 3 | | | | | - | | | | | 1 | |
Institutional Shares | | | | - | | | | | 7 | | | | | - | | | | | 10 | |
|
| Footnotes are presented on Page 126. | |
| | |
| 122 | | Artisan Partners Funds |
NOTES TO FINANCIAL STATEMENTS
| | | | | | | | | | | | | | | | | | | | |
| | | HIGH INCOME |
| | | Year Ended
9/30/2016 | | Year Ended
9/30/2015 |
| | | Shares | | Amount | | Shares | | Amount |
| Proceeds from shares issued | | | | | | | | | | | | | | | | | | | | |
Investor Shares | | | | 49,101,971 | | | | $ | 455,138 | | | | | 36,305,325 | | | | $ | 357,528 | |
Advisor Shares | | | | 92,250,798 | | | | | 860,209 | | | | | 34,913,905 | | | | | 340,359 | |
| Net asset value of shares issued in reinvestment of dividends and distributions | | | | | | | | | | | | | | | | | | | | |
Investor Shares | | | | 3,331,270 | | | | | 31,441 | | | | | 2,462,806 | | | | | 24,265 | |
Advisor Shares | | | | 4,836,987 | | | | | 45,817 | | | | | 1,718,353 | | | | | 16,903 | |
| Cost of shares redeemed(2) | | | | | | | | | | | | | | | | | | | | |
Investor Shares | | | | (41,889,746 | ) | | | | (389,022 | ) | | | | (21,933,691 | ) | | | | (214,101 | ) |
Advisor Shares | | | | (22,406,478 | ) | | | | (209,555 | ) | | | | (7,881,274 | ) | | | | (77,616 | ) |
| Net increase from fund share transactions | | | | | | | | | | | | | | | | | | | | |
Investor Shares | | | | 10,543,495 | | | | | 97,557 | | | | | 16,834,440 | | | | | 167,692 | |
Advisor Shares | | | | 74,681,307 | | | | | 696,471 | | | | | 28,750,984 | | | | | 279,646 | |
| Redemption Fee | | | | | | | | | | | | | | | | | | | | |
Investor Shares | | | | - | | | | | 48 | | | | | - | | | | | 55 | |
Advisor Shares | | | | - | | | | | 75 | | | | | - | | | | | 37 | |
| |
| | | INTERNATIONAL |
| | | Year Ended
9/30/2016 | | Year Ended
9/30/2015 |
| | | Shares | | Amount | | Shares | | Amount |
| Proceeds from shares issued | | | | | | | | | | | | | | | | | | | | |
Investor Shares | | | | 51,661,914 | | | | $ | 1,434,057 | | | | | 147,055,771 | | | | $ | 4,507,517 | |
Advisor Shares(5) | | | | 47,637,297 | | | | | 1,305,844 | | | | | 96,826,212 | | | | | 2,962,302 | |
Institutional Shares | | | | 33,419,767 | | | | | 935,902 | | | | | 77,326,034 | | | | | 2,444,786 | |
| Net asset value of shares issued in reinvestment of dividends and distributions | | | | | | | | | | | | | | | | | | | | |
Investor Shares | | | | 1,401,879 | | | | | 41,103 | | | | | 2,544,638 | | | | | 77,510 | |
Advisor Shares(5) | | | | 345,252 | | | | | 10,112 | | | | | - | | | | | - | |
Institutional Shares | | | | 993,447 | | | | | 29,297 | | | | | 1,100,365 | | | | | 33,727 | |
| Cost of shares redeemed(2) | | | | | | | | | | | | | | | | | | | | |
Investor Shares | | | | (149,318,292 | ) | | | | (4,137,577 | ) | | | | (226,093,060 | ) | | | | (6,957,199 | ) |
Advisor Shares(5) | | | | (40,977,617 | ) | | | | (1,140,807 | ) | | | | (5,539,992 | ) | | | | (161,570 | ) |
Institutional Shares | | | | (32,404,078 | ) | | | | (910,981 | ) | | | | (25,232,697 | ) | | | | (764,161 | ) |
| Net increase from fund share transactions | | | | | | | | | | | | | | | | | | | | |
Investor Shares | | | | (96,254,499 | ) | | | | (2,662,417 | ) | | | | (76,492,651 | ) | | | | (2,372,172 | ) |
Advisor Shares(5) | | | | 7,004,932 | | | | | 175,149 | | | | | 91,286,220 | | | | | 2,800,732 | |
Institutional Shares | | | | 2,009,136 | | | | | 54,218 | | | | | 53,193,702 | | | | | 1,714,352 | |
| Redemption Fee(7) | | | | | | | | | | | | | | | | | | | | |
Investor Shares | | | | - | | | | | 207 | | | | | - | | | | | 632 | |
Advisor Shares(5) | | | | - | | | | | 56 | | | | | - | | | | | 48 | |
Institutional Shares | | | | - | | | | | 110 | | | | | - | | | | | 221 | |
|
| Footnotes are presented on Page 126. | |
| | |
| Artisan Partners Funds | | 123 |
NOTES TO FINANCIAL STATEMENTS
| | | | | | | | | | | | | | | | | | | | |
| | | INTERNATIONAL SMALL CAP |
| | | Year Ended
9/30/2016 | | Year Ended
9/30/2015 |
| | | Shares | | Amount | | Shares | | Amount |
| Proceeds from shares issued | | | | | | | | | | | | | | | | | | | | |
Investor Shares | | | | 5,051,377 | | | | $ | 115,977 | | | | | 9,139,826 | | | | $ | 216,914 | |
Institutional Shares(6) | | | | 9,341,916 | | | | | 214,450 | | | | | | | | | | | |
| Net asset value of shares issued in reinvestment of dividends and distributions | | | | | | | | | | | | | | | | | | | | |
Investor Shares | | | | 1,255,016 | | | | | 30,070 | | | | | 2,307,280 | | | | | 52,352 | |
| Cost of shares redeemed(2) | | | | | | | | | | | | | | | | | | | | |
Investor Shares | | | | (22,185,163 | ) | | | | (508,625 | ) | | | | (15,184,996 | ) | | | | (358,411 | ) |
Institutional Shares(6) | | | | (303,651 | ) | | | | (6,936 | ) | | | | | | | | | | |
| Net increase from fund share transactions | | | | | | | | | | | | | | | | | | | | |
Investor Shares | | | | (15,878,770 | ) | | | | (362,578 | ) | | | | (3,737,890 | ) | | | | (89,145 | ) |
Institutional Shares(6) | | | | 9,038,265 | | | | | 207,514 | | | | | | | | | | | |
| Redemption Fee(7) | | | | | | | | | | | | | | | | | | | | |
Investor Shares | | | | - | | | | | 8 | | | | | - | | | | | 100 | |
| |
| | | INTERNATIONAL VALUE |
| | | Year Ended
9/30/2016 | | Year Ended
9/30/2015 |
| | | Shares | | Amount | | Shares | | Amount |
| Proceeds from shares issued | | | | | | | | | | | | | | | | | | | | |
Investor Shares | | | | 47,088,149 | | | | $ | 1,500,660 | | | | | 31,255,164 | | | | $ | 1,094,030 | |
Advisor Shares(5) | | | | 35,011,493 | | | | | 1,121,238 | | | | | 88,342,651 | | | | | 3,201,754 | |
Institutional Shares | | | | 17,411,794 | | | | | 545,932 | | | | | 13,743,888 | | | | | 488,598 | |
| Net asset value of shares issued in reinvestment of dividends and distributions | | | | | | | | | | | | | | | | | | | | |
Investor Shares | | | | 8,459,988 | | | | | 275,965 | | | | | 12,755,664 | | | | | 439,815 | |
Advisor Shares(5) | | | | 3,361,638 | | | | | 109,589 | | | | | - | | | | | - | |
Institutional Shares | | | | 4,580,121 | | | | | 149,816 | | | | | 4,718,738 | | | | | 163,127 | |
| Cost of shares redeemed(2) | | | | | | | | | | | | | | | | | | | | |
Investor Shares | | | | (51,914,531 | ) | | | | (1,660,103 | ) | | | | (128,639,622 | ) | | | | (4,610,540 | ) |
Advisor Shares(5) | | | | (18,209,215 | ) | | | | (584,652 | ) | | | | (3,141,780 | ) | | | | (110,601 | ) |
Institutional Shares | | | | (11,395,479 | ) | | | | (372,981 | ) | | | | (5,839,111 | ) | | | | (206,519 | ) |
| Net increase from fund share transactions | | | | | | | | | | | | | | | | | | | | |
Investor Shares | | | | 3,633,606 | | | | | 116,522 | | | | | (84,628,794 | ) | | | | (3,076,695 | ) |
Advisor Shares(5) | | | | 20,163,916 | | | | | 646,175 | | | | | 85,200,871 | | | | | 3,091,153 | |
Institutional Shares | | | | 10,596,436 | | | | | 322,767 | | | | | 12,623,515 | | | | | 445,206 | |
| Redemption Fee(7) | | | | | | | | | | | | | | | | | | | | |
Investor Shares | | | | - | | | | | 51 | | | | | - | | | | | 258 | |
Advisor Shares(5) | | | | - | | | | | 29 | | | | | - | | | | | 17 | |
Institutional Shares | | | | - | | | | | 26 | | | | | - | | | | | 84 | |
|
| Footnotes are presented on Page 126. | |
| | |
| 124 | | Artisan Partners Funds |
NOTES TO FINANCIAL STATEMENTS
| | | | | | | | | | | | | | | | | | | | |
| | | MID CAP |
| | | Year Ended
9/30/2016 | | Year Ended
9/30/2015 |
| | | Shares | | Amount | | Shares | | Amount |
| Proceeds from shares issued | | | | | | | | | | | | | | | | | | | | |
Investor Shares | | | | 12,274,626 | | | | $ | 483,930 | | | | | 15,426,811 | | | | $ | 725,344 | |
Advisor Shares(5) | | | | 5,531,740 | | | | | 215,168 | | | | | 10,165,671 | | | | | 477,696 | |
Institutional Shares | | | | 20,866,664 | | | | | 865,759 | | | | | 22,831,337 | | | | | 1,139,342 | |
| Net asset value of shares issued in reinvestment of dividends and distributions | | | | | | | | | | | | | | | | | | | | |
Investor Shares | | | | 13,498,668 | | | | | 548,721 | | | | | 11,374,388 | | | | | 516,511 | |
Advisor Shares(5) | | | | 1,454,647 | | | | | 59,204 | | | | | - | | | | | - | |
Institutional Shares | | | | 11,820,328 | | | | | 512,175 | | | | | 7,427,509 | | | | | 355,555 | |
| Cost of shares redeemed | | | | | | | | | | | | | | | | | | | | |
Investor Shares | | | | (35,594,332 | ) | | | | (1,405,056 | ) | | | | (48,310,957 | ) | | | | (2,268,772 | ) |
Advisor Shares(5) | | | | (5,940,104 | ) | | | | (233,998 | ) | | | | (456,359 | ) | | | | (21,553 | ) |
Institutional Shares | | | | (28,782,660 | ) | | | | (1,218,522 | ) | | | | (20,378,837 | ) | | | | (999,829 | ) |
| Net increase from fund share transactions | | | | | | | | | | | | | | | | | | | | |
Investor Shares | | | | (9,821,038 | ) | | | | (372,405 | ) | | | | (21,509,758 | ) | | | | (1,026,917 | ) |
Advisor Shares(5) | | | | 1,046,283 | | | | | 40,374 | | | | | 9,709,312 | | | | | 456,143 | |
Institutional Shares | | | | 3,904,332 | | | | | 159,412 | | | | | 9,880,009 | | | | | 495,068 | |
| |
| | | MID CAP VALUE |
| | | Year Ended
9/30/2016 | | Year Ended
9/30/2015 |
| | | Shares | | Amount | | Shares | | Amount |
| Proceeds from shares issued | | | | | | | | | | | | | | | | | | | | |
Investor Shares | | | | 21,012,810 | | | | $ | 421,158 | | | | | 31,813,156 | | | | $ | 793,122 | |
Advisor Shares(5) | | | | 31,045,727 | | | | | 624,233 | | | | | 45,158,916 | | | | | 1,089,164 | |
Institutional Shares | | | | 9,468,071 | | | | | 192,098 | | | | | 12,667,895 | | | | | 316,894 | |
| Net assets of shares issued in connection with reorganization (Note 15) | | | | | | | | | | | | | | | | | | | | |
Investor Shares | | | | 7,811,036 | | | | | 158,252 | | | | | - | | | | | - | |
Advisor Shares | | | | - | | | | | - | | | | | - | | | | | - | |
Institutional Shares | | | | 1,132,957 | | | | | 22,942 | | | | | - | | | | | - | |
| Net asset value of shares issued in reinvestment of dividends and distributions | | | | | | | | | | | | | | | | | | | | |
Investor Shares | | | | 30,822,218 | | | | | 608,122 | | | | | 34,608,529 | | | | | 856,326 | |
Advisor Shares(5) | | | | 6,940,383 | | | | | 136,656 | | | | | - | | | | | - | |
Institutional Shares | | | | 9,166,146 | | | | | 180,573 | | | | | 6,672,374 | | | | | 165,029 | |
| Cost of shares redeemed | | | | | | | | | | | | | | | | | | | | |
Investor Shares | | | | (142,312,936 | ) | | | | (2,880,371 | ) | | | | (215,480,203 | ) | | | | (5,321,117 | ) |
Advisor Shares(5) | | | | (32,185,555 | ) | | | | (652,584 | ) | | | | (2,955,122 | ) | | | | (69,518 | ) |
Institutional Shares | | | | (40,692,466 | ) | | | | (823,921 | ) | | | | (26,713,793 | ) | | | | (662,487 | ) |
| Net increase from fund share transactions | | | | | | | | | | | | | | | | | | | | |
Investor Shares | | | | (82,666,872 | ) | | | | (1,692,839 | ) | | | | (149,058,518 | ) | | | | (3,671,669 | ) |
Advisor Shares(5) | | | | 5,800,555 | | | | | 108,305 | | | | | 42,203,794 | | | | | 1,019,646 | |
Institutional Shares | | | | (20,925,292 | ) | | | | (428,308 | ) | | | | (7,373,524 | ) | | | | (180,564 | ) |
|
| Footnotes are presented on Page 126. | |
| | |
| Artisan Partners Funds | | 125 |
NOTES TO FINANCIAL STATEMENTS
| | | | | | | | | | | | | | | | | | | | |
| | | SMALL CAP |
| | | Year Ended
9/30/2016 | | Year Ended
9/30/2015 |
| | | Shares | | Amount | | Shares | | Amount |
| Proceeds from shares issued | | | | | | | | | | | | | | | | | | | | |
Investor Shares | | | | 3,529,128 | | | | $ | 93,275 | | | | | 7,647,814 | | | | $ | 224,751 | |
Institutional Shares | | | | 6,619,254 | | | | | 176,255 | | | | | 6,778,115 | | | | | 212,353 | |
| Net asset value of shares issued in reinvestment of dividends and distributions | | | | | | | | | | | | | | | | | | | | |
Investor Shares | | | | 2,914,671 | | | | | 79,454 | | | | | - | | | | | - | |
Institutional Shares | | | | 975,362 | | | | | 26,764 | | | | | - | | | | | - | |
| Cost of shares redeemed(2) | | | | | | | | | | | | | | | | | | | | |
Investor Shares | | | | (11,148,753 | ) | | | | (294,375 | ) | | | | (23,445,692 | ) | | | | (712,457 | ) |
Institutional Shares | | | | (4,000,656 | ) | | | | (107,513 | ) | | | | (1,689,913 | ) | | | | (50,853 | ) |
| Net increase from fund share transactions | | | | | | | | | | | | | | | | | | | | |
Investor Shares | | | | (4,704,954 | ) | | | | (121,646 | ) | | | | (15,797,878 | ) | | | | (487,706 | ) |
Institutional Shares | | | | 3,593,960 | | | | | 95,506 | | | | | 5,088,202 | | | | | 161,500 | |
| |
| | | VALUE |
| | | Year Ended
9/30/2016 | | Year Ended
9/30/2015 |
| | | Shares | | Amount | | Shares | | Amount |
| Proceeds from shares issued | | | | | | | | | | | | | | | | | | | | |
Investor Shares | | | | 18,521,071 | | | | $ | 226,573 | | | | | 11,665,383 | | | | $ | 156,568 | |
Advisor Shares(5) | | | | 10,882,442 | | | | | 123,696 | | | | | 42,917,968 | | | | | 586,042 | |
Institutional Shares | | | | 1,408,356 | | | | | 15,603 | | | | | 2,476,950 | | | | | 33,068 | |
| Net asset value of shares issued in reinvestment of dividends and distributions | | | | | | | | | | | | | | | | | | | | |
Investor Shares | | | | 2,697,247 | | | | | 31,342 | | | | | 6,223,025 | | | | | 82,455 | |
Advisor Shares(5) | | | | 4,281,589 | | | | | 49,538 | | | | | - | | | | | - | |
Institutional Shares | | | | 1,334,487 | | | | | 15,480 | | | | | 1,579,906 | | | | | 20,950 | |
| Cost of shares redeemed | | | | | | | | | | | | | | | | | | | | |
Investor Shares | | | | (15,821,093 | ) | | | | (185,610 | ) | | | | (71,220,630 | ) | | | | (963,970 | ) |
Advisor Shares(5) | | | | (36,227,623 | ) | | | | (430,315 | ) | | | | (2,572,805 | ) | | | | (33,290 | ) |
Institutional Shares | | | | (10,788,989 | ) | | | | (125,989 | ) | | | | (9,955,117 | ) | | | | (132,456 | ) |
| Net increase from fund share transactions | | | | | | | | | | | | | | | | | | | | |
Investor Shares | | | | 5,397,225 | | | | | 72,305 | | | | | (53,332,222 | ) | | | | (724,947 | ) |
Advisor Shares(5) | | | | (21,063,592 | ) | | | | (257,081 | ) | | | | 40,345,163 | | | | | 552,752 | |
Institutional Shares | | | | (8,046,146 | ) | | | | (94,906 | ) | | | | (5,898,261 | ) | | | | (78,438 | ) |
| (1) | For the period from commencement of operations (June 29, 2015) through September 30, 2015. |
| (2) | Net of redemption fees. |
| (3) | Amount rounds to less than $1. |
| (4) | For the period from commencement of operations (October 15, 2015) through September 30, 2016. |
| (5) | For the period from commencement of operations (April 1, 2015) through September 30, 2015. |
| (6) | For the period from commencement of operations (April 12, 2016) through September 30, 2016. |
| (7) | Effective, February 1, 2016, the board of directors of the Funds approved eliminating the redemption fee for all Funds except High Income Fund. |
| (8) | For the period from commencement of operations (October 15, 2015) through January 31, 2016. See footnote (7) above. |
| | |
| 126 | | Artisan Partners Funds |
NOTES TO FINANCIAL STATEMENTS
On February 22, 2016, the board of directors approved a proposal to merge Artisan Small Cap Value Fund (“Small Cap Value Fund”) with and into Mid Cap Value Fund (the “Reorganization”). On May 23, 2016, Mid Cap Value Fund acquired all assets and assumed all liabilities of Small Cap Value Fund, in a tax-free exchange for Federal income tax purposes, pursuant to the Agreement and Plan of Reorganization approved by the board of directors (the “Merger Agreement”).
Pursuant to the Merger Agreement, the Adviser paid all costs directly related to the Reorganization other than any transaction costs associated with buying and selling portfolio securities as part of repositioning the Funds’ portfolio, which were borne by the respective Fund incurring such costs. Total transaction costs of approximately $240,000 were incurred by Small Cap Value Fund to reposition the Fund prior to May 23, 2016. Mid Cap Value Fund did not incur any transaction costs in connection with the Reorganization. Additionally, the Adviser voluntarily waived its management fee in the amount of $175,000, allocated equally between Small Cap Value Fund before the Reorganization and Mid Cap Value Fund after the Reorganization.
The value of shares issued by Mid Cap Value Fund is presented in the Statements of Changes in Net Assets. The following table sets forth the number of shares issued by Mid Cap Value Fund, the net assets of Small Cap Value Fund immediately prior to the Reorganization, and the net assets of Mid Cap Value Fund immediately prior to and after the Reorganization (dollar values in thousands):
| | | | | | | | | | | | | | | | | | | | | | | | | |
| Share Class | | Small Cap
Value Fund
Shares
Outstanding | | Small Cap
Value Fund
Net Assets1 | | Mid Cap
Value Fund
Shares Issued
In Acquisition | | Mid Cap
Value Fund
Net Assets
Before
Reorganization | | Mid Cap
Value Fund
Net Assets
After
Reorganization |
Investor | | | | 14,808,137 | | | | $ | 158,252 | | | | | 7,811,036 | | | | $ | 2,842,082 | | | | $ | 3,000,334 | |
Advisor | | | | n/a | | | | | n/a | | | | | n/a | | | | $ | 921,530 | | | | $ | 921,530 | |
Institutional | | | | 2,137,137 | | | | $ | 22,942 | | | | | 1,132,957 | | | | $ | 887,708 | | | | $ | 910,650 | |
Total | | | | 16,945,274 | | | | $ | 181,194 | | | | | 8,943,993 | | | | $ | 4,651,320 | | | | $ | 4,832,514 | |
| 1 | Includes approximately $29,923 of net unrealized appreciation. |
Assuming the Reorganization had been completed on October 1, 2015, the beginning of the period for Mid Cap Value Fund, Mid Cap Value Fund’s pro forma results of operations for the year ended September 30, 2016 would have been as follows (in thousands):
| | | | | |
Net investment income | | | $ | 33,245 | |
Net realized gain and unrealized gain on investments | | | $ | 655,484 | |
Net increase in net assets from operations | | | $ | 688,729 | |
Because the combined investment portfolios have been managed as a single integrated portfolio since the closing date of the Reorganization, it is not practicable to separate the amounts of revenue and earnings of Small Cap Value Fund that have been included in Mid Cap Value Fund’s Statement of Operations since May 23, 2016.
| | |
| Artisan Partners Funds | | 127 |
NOTES TO FINANCIAL STATEMENTS
| (16) | Custodian Out-of-Pocket Expense Reimbursements: |
On May 20, 2016, SSB, the Funds’ custodian, provided each Fund with an offer to reimburse the Fund for certain out-of-pocket expenses it charged the Fund between 1998 and 2015. The incorrect charges were due to inaccurate billing rates used by SSB for certain out-of-pocket expenses that should have been adjusted over time but were not. SSB has estimated, and offered to reimburse, the amount of the difference in what was and what should have been charged, plus interest. The Funds continue to review the information provided by SSB in anticipation of settling the matter. For each Fund, the reimbursement amount offered by SSB is included in “Other Assets” on the Statements of Assets and Liabilities and reduced “Custodian fees” on the Statement of Operations.
Based on the information provided by SSB, the Funds believe the impact of these reimbursements is immaterial for each Fund except Emerging Markets Fund. SSB has proposed to reimburse Emerging Markets Fund approximately $172,000, representing 0.5% of Emerging Markets Fund’s net assets at September 30, 2016.
For Emerging Markets Fund the impact of the reimbursement offered is as follows for the September 30, 2016 Net Investment Income, Total Return, Ratio of Expenses to Average Net Assets, Ratio of Expenses to Average Net Assets Excluding Waivers and Ratio of Net Investment Income to Average Net Assets:
| | | | | | | | | | | | | | | | | | | | | | | | | |
| | | Impact On
Net
Investment
Income | | Impact On
Total
Return | | Impact on
Ratio of
Expenses to
Average Net
Assets | | Impact On
Ratio of
Expenses to
Average Net
Asset
Excluding
Waivers | | Impact On
Ratio of Net
Investment
Income to
Average Net
Assets |
| EMERGING MARKETS FUND | | | | | | | | | | | | | | | | | | | | | | | | | |
Investor Shares | | | $ | 0.07 | | | | | 0.61 | % | | | | (0.56 | )% | | | | (0.56 | )% | | | | 0.56 | % |
Institutional Shares | | | $ | 0.03 | | | | | 0.61 | % | | | | (0.24 | )% | | | | (0.25 | )% | | | | 0.24 | % |
On November 18, 2016, the board of directors approved a plan of liquidation with respect to Global Small Cap Fund. Under the plan of liquidation, Global Small Cap Fund will redeem all of its outstanding shares and distribute pro rata to its shareholders all remaining assets, after paying, or setting aside the amount to pay, any expenses and liabilities. The liquidation is expected to occur as of the close of business on or about January 20, 2017.
The Funds have evaluated all other subsequent events through the date of issuance of the Funds’ financial statements and have determined there is no impact to the Funds’ financial statements.
| | |
| 128 | | Artisan Partners Funds |
Report of Independent Registered Public Accounting Firm
The Board of Directors and Shareholders of Artisan Partners Funds, Inc.
We have audited the accompanying statements of assets and liabilities, including the schedules of investments, of Artisan Partners Funds, Inc. (comprising, respectively, Artisan Developing World Fund, Artisan Emerging Markets Fund, Artisan Global Equity Fund, Artisan Global Opportunities Fund, Artisan Global Small Cap Fund, Artisan Global Value Fund, Artisan High Income Fund, Artisan International Fund, Artisan International Small Cap Fund, Artisan International Value Fund, Artisan Mid Cap Fund, Artisan Mid Cap Value Fund, Artisan Small Cap Fund, and Artisan Value Fund (the “Funds”)) as of September 30, 2016, and the related statements of operations for the year then ended, and the statements of changes in net assets and the financial highlights for each of the periods indicated therein. These financial statements and financial highlights are the responsibility of the Funds’ management. Our responsibility is to express an opinion on these financial statements and financial highlights based on our audits.
We conducted our audits in accordance with the standards of the Public Company Accounting Oversight Board (United States). Those standards require that we plan and perform the audit to obtain reasonable assurance about whether the financial statements and financial highlights are free of material misstatement. We were not engaged to perform an audit of the Funds’ internal control over financial reporting. Our audits included consideration of internal control over financial reporting as a basis for designing audit procedures that are appropriate in the circumstances, but not for the purpose of expressing an opinion on the effectiveness of the Funds’ internal control over financial reporting. Accordingly, we express no such opinion. An audit also includes examining, on a test basis, evidence supporting the amounts and disclosures in the financial statements and financial highlights, assessing the accounting principles used and significant estimates made by management, and evaluating the overall financial statement presentation. Our procedures included confirmation of securities owned as of September 30, 2016, by correspondence with the custodian, brokers, and agent banks or by other appropriate auditing procedures where replies from brokers and agent banks were not received. We believe that our audits provide a reasonable basis for our opinion.
In our opinion, the financial statements and financial highlights referred to above present fairly, in all material respects, the financial position of each of the respective portfolios of Artisan Partners Funds, Inc. at September 30, 2016, the results of their operations for the year then ended, and the changes in their net assets and the financial highlights for each of the periods indicated therein, in conformity with U.S. generally accepted accounting principles.

Minneapolis, Minnesota
November 23, 2016
| | |
| Artisan Partners Funds | | 129 |
NOTES TO FINANCIAL STATEMENTS
Other Federal tax information (unaudited):
The Internal Revenue Code requires that shareholders be notified of certain information regarding long-term capital gains, qualified dividend income and the dividends received deduction for corporate shareholders. This data is informational only. Every year in January, shareholders are sent a Form 1099-DIV which provides the federal tax status of dividends and distributions received during the calendar year. Shareholders are advised to consult their own tax advisor with respect to the specific tax consequences of investment in the Funds.
Each Fund hereby designates the following amounts as (i) long-term capital gain distributions for purposes of the dividends paid deduction (including earnings and profits distributed to shareholders on redemption of Fund shares, in thousands), (ii) the amount of ordinary dividends paid during the fiscal year ended September 30, 2016 that are considered qualified dividend income as defined in the Jobs and Growth Tax Relief Reconciliation Act of 2003, and (iii) the amount of ordinary dividends paid during the fiscal year ended September 30, 2016 that are eligible for the dividends received deduction available to certain corporate shareholders.
| | | | | | | | | | | | | | | |
| Fund | | Long-Term Capital Gains | | Qualified Dividend Income | | Dividends Received Deduction |
Developing World | | | $ | - | | | | | n/a | | | | | n/a | |
Emerging Markets | | | | - | | | | | n/a | | | | | n/a | |
Global Equity | | | | 1,549 | | | | | 46.15 | % | | | | 14.90 | % |
Global Opportunities | | | | 8,867 | | | | | 100.00 | % | | | | 100.00 | % |
Global Small Cap | | | | - | | | | | n/a | | | | | n/a | |
Global Value | | | | 84,343 | | | | | 100.00 | % | | | | 99.39 | % |
High Income | | | | 213 | | | | | n/a | | | | | n/a | |
International | | | | - | | | | | 100.00 | % | | | | 1.95 | % |
International Small Cap | | | | 43,687 | | | | | 100.00 | % | | | | 0.00 | % |
International Value | | | | 556,940 | | | | | 100.00 | % | | | | 2.81 | % |
Mid Cap | | | | 1,280,207 | | | | | n/a | | | | | n/a | |
Mid Cap Value | | | | 1,010,836 | | | | | 100.00 | % | | | | 100.00 | % |
Small Cap | | | | 118,049 | | | | | n/a | | | | | n/a | |
Value | | | | 89,485 | | | | | 100.00 | % | | | | 100.00 | % |
| | |
| 130 | | Artisan Partners Funds |
SHAREHOLDER EXPENSE EXAMPLE (UNAUDITED)
As a shareholder of Artisan Partners Funds, you may incur transaction costs, including redemption fees, and you will incur ongoing costs, including management fees and other Fund expenses. This example is intended to help you understand your ongoing costs (in dollars) of investing in a Fund and to compare these costs with the ongoing costs of investing in other mutual funds.
The example is based on an investment of $1,000 invested at the beginning of the period and held for the entire period from April 1, 2016 to September 30, 2016.
Actual Expenses
The first line under the name of each Fund in the table below provides information about actual account values and actual expenses. You may use the information in this line, together with the amount you invested, to estimate the expenses that you paid over the period. Simply divide your account value by $1,000 (for example, an $8,600 account value divided by $1,000 = 8.6), then multiply the result by the number in the first line under the name of your Fund under the heading entitled “Expenses Paid During Period” to estimate the expenses you paid on your account during this period.
Hypothetical Example for Comparison Purposes
The second line under each Fund’s name in the table below provides information about hypothetical account values and hypothetical expenses based on each Fund’s actual expense ratio for the six months ended September 30, 2016 and an assumed rate of return of 5% per year before expenses, which is not the Fund’s actual return. The hypothetical account values and expenses may not be used to estimate the actual ending account balances or expenses you paid for the period. You may use this information to compare the ongoing costs of investing in each Fund and other funds. To do so, compare the 5% hypothetical example with the 5% hypothetical examples that appear in the shareholder reports of the other funds.
Please note that the expenses shown in the table are meant to highlight your ongoing costs only and do not reflect any transactional costs, such as redemption fees. Therefore, the second line of the table is useful in comparing ongoing costs only, and will not help you determine the relative costs of owning different funds. If these transactional costs were included, your costs would have been higher.
| | | | | | | | | | | | | | | | | | | | |
| | | Beginning
Account Value
4/1/2016 | | Ending
Account Value
9/30/2016 | | Expenses Paid During
Period
4/1/2016-9/30/2016(1) | | Expense
Ratio(2)(3)* |
Artisan Developing World Fund | | | | | | | | | | | | | | | | | | | | |
Investor Shares | | | | | | | | | | | | | | | | | | | | |
Actual | | | $ | 1,000.00 | | | | $ | 1,137.40 | | | | $ | 8.02 | | | | | 1.50 | % |
Hypothetical (5% return before expenses) | | | $ | 1,000.00 | | | | $ | 1,017.50 | | | | $ | 7.57 | | | | | 1.50 | % |
Advisor Shares | | | | | | | | | | | | | | | | | | | | |
Actual | | | $ | 1,000.00 | | | | $ | 1,139.50 | | | | $ | 6.69 | | | | | 1.25 | % |
Hypothetical (5% return before expenses) | | | $ | 1,000.00 | | | | $ | 1,018.75 | | | | $ | 6.31 | | | | | 1.25 | % |
Institutional Shares | | | | | | | | | | | | | | | | | | | | |
Actual | | | $ | 1,000.00 | | | | $ | 1,140.40 | | | | $ | 6.05 | | | | | 1.13 | % |
Hypothetical (5% return before expenses) | | | $ | 1,000.00 | | | | $ | 1,019.35 | | | | $ | 5.70 | | | | | 1.13 | % |
| | |
| Artisan Partners Funds | | 131 |
SHAREHOLDER EXPENSE EXAMPLE (UNAUDITED)
| | | | | | | | | | | | | | | | | | | | |
| | | Beginning
Account Value
4/1/2016 | | Ending
Account Value
9/30/2016 | | Expenses Paid During
Period
4/1/2016-9/30/2016(1) | | Expense
Ratio(2)(3)* |
Artisan Emerging Markets Fund | | | | | | | | | | | | | | | | | | | | |
Investor Shares | | | | | | | | | | | | | | | | | | | | |
Actual | | | $ | 1,000.00 | | | | $ | 1,134.30 | | | | $ | 2.45 | | | | | 0.46 | % |
Hypothetical (5% return before expenses) | | | $ | 1,000.00 | | | | $ | 1,022.70 | | | | $ | 2.33 | | | | | 0.46 | % |
Institutional Shares | | | | | | | | | | | | | | | | | | | | |
Actual | | | $ | 1,000.00 | | | | $ | 1,133.50 | | | | $ | 2.03 | | | | | 0.38 | % |
Hypothetical (5% return before expenses) | | | $ | 1,000.00 | | | | $ | 1,023.10 | | | | $ | 1.92 | | | | | 0.38 | % |
Artisan Global Equity Fund | | | | | | | | | | | | | | | | | | | | |
Investor Shares | | | | | | | | | | | | | | | | | | | | |
Actual | | | $ | 1,000.00 | | | | $ | 1,090.30 | | | | $ | 7.00 | | | | | 1.34 | % |
Hypothetical (5% return before expenses) | | | $ | 1,000.00 | | | | $ | 1,018.30 | | | | $ | 6.76 | | | | | 1.34 | % |
Institutional Shares | | | | | | | | | | | | | | | | | | | | |
Actual | | | $ | 1,000.00 | | | | $ | 1,091.50 | | | | $ | 5.59 | | | | | 1.07 | % |
Hypothetical (5% return before expenses) | | | $ | 1,000.00 | | | | $ | 1,019.65 | | | | $ | 5.40 | | | | | 1.07 | % |
Artisan Global Opportunities Fund | | | | | | | | | | | | | | | | | | | | |
Investor Shares | | | | | | | | | | | | | | | | | | | | |
Actual | | | $ | 1,000.00 | | | | $ | 1,116.60 | | | | $ | 6.14 | | | | | 1.16 | % |
Hypothetical (5% return before expenses) | | | $ | 1,000.00 | | | | $ | 1,019.20 | | | | $ | 5.86 | | | | | 1.16 | % |
Advisor Shares | | | | | | | | | | | | | | | | | | | | |
Actual | | | $ | 1,000.00 | | | | $ | 1,117.00 | | | | $ | 5.72 | | | | | 1.08 | % |
Hypothetical (5% return before expenses) | | | $ | 1,000.00 | | | | $ | 1,019.60 | | | | $ | 5.45 | | | | | 1.08 | % |
Institutional Shares | | | | | | | | | | | | | | | | | | | | |
Actual | | | $ | 1,000.00 | | | | $ | 1,118.00 | | | | $ | 4.87 | | | | | 0.92 | % |
Hypothetical (5% return before expenses) | | | $ | 1,000.00 | | | | $ | 1,020.40 | | | | $ | 4.65 | | | | | 0.92 | % |
Artisan Global Small Cap Fund | | | | | | | | | | | | | | | | | | | | |
Investor Shares | | | | | | | | | | | | | | | | | | | | |
Actual | | | $ | 1,000.00 | | | | $ | 995.10 | | | | $ | 7.18 | | | | | 1.44 | % |
Hypothetical (5% return before expenses) | | | $ | 1,000.00 | | | | $ | 1,017.80 | | | | $ | 7.26 | | | | | 1.44 | % |
Artisan Global Value Fund | | | | | | | | | | | | | | | | | | | | |
Investor Shares | | | | | | | | | | | | | | | | | | | | |
Actual | | | $ | 1,000.00 | | | | $ | 1,059.60 | | | | $ | 6.59 | | | | | 1.28 | % |
Hypothetical (5% return before expenses) | | | $ | 1,000.00 | | | | $ | 1,018.60 | | | | $ | 6.46 | | | | | 1.28 | % |
Advisor Shares | | | | | | | | | | | | | | | | | | | | |
Actual | | | $ | 1,000.00 | | | | $ | 1,060.40 | | | | $ | 5.98 | | | | | 1.16 | % |
Hypothetical (5% return before expenses) | | | $ | 1,000.00 | | | | $ | 1,019.20 | | | | $ | 5.86 | | | | | 1.16 | % |
Institutional Shares | | | | | | | | | | | | | | | | | | | | |
Actual | | | $ | 1,000.00 | | | | $ | 1,060.90 | | | | $ | 5.26 | | | | | 1.02 | % |
Hypothetical (5% return before expenses) | | | $ | 1,000.00 | | | | $ | 1,019.90 | | | | $ | 5.15 | | | | | 1.02 | % |
| | |
| 132 | | Artisan Partners Funds |
SHAREHOLDER EXPENSE EXAMPLE (UNAUDITED)
| | | | | | | | | | | | | | | | | | | | |
| | | Beginning
Account Value
4/1/2016 | | Ending
Account Value
9/30/2016 | | Expenses Paid During
Period
4/1/2016-9/30/2016(1) | | Expense
Ratio(2)(3)* |
Artisan High Income Fund | | | | | | | | | | | | | | | | | | | | |
Investor Shares | | | | | | | | | | | | | | | | | | | | |
Actual | | | $ | 1,000.00 | | | | $ | 1,110.00 | | | | $ | 5.43 | | | | | 1.03 | % |
Hypothetical (5% return before expenses) | | | $ | 1,000.00 | | | | $ | 1,019.85 | | | | $ | 5.20 | | | | | 1.03 | % |
Advisor Shares | | | | | | | | | | | | | | | | | | | | |
Actual | | | $ | 1,000.00 | | | | $ | 1,112.30 | | | | $ | 4.44 | | | | | 0.84 | % |
Hypothetical (5% return before expenses) | | | $ | 1,000.00 | | | | $ | 1,020.80 | | | | $ | 4.24 | | | | | 0.84 | % |
Artisan International Fund | | | | | | | | | | | | | | | | | | | | |
Investor Shares | | | | | | | | | | | | | | | | | | | | |
Actual | | | $ | 1,000.00 | | | | $ | 1,023.90 | | | | $ | 6.02 | | | | | 1.19 | % |
Hypothetical (5% return before expenses) | | | $ | 1,000.00 | | | | $ | 1,019.05 | | | | $ | 6.01 | | | | | 1.19 | % |
Advisor Shares | | | | | | | | | | | | | | | | | | | | |
Actual | | | $ | 1,000.00 | | | | $ | 1,024.60 | | | | $ | 5.16 | | | | | 1.02 | % |
Hypothetical (5% return before expenses) | | | $ | 1,000.00 | | | | $ | 1,019.90 | | | | $ | 5.15 | | | | | 1.02 | % |
Institutional Shares | | | | | | | | | | | | | | | | | | | | |
Actual | | | $ | 1,000.00 | | | | $ | 1,025.20 | | | | $ | 4.76 | | | | | 0.94 | % |
Hypothetical (5% return before expenses) | | | $ | 1,000.00 | | | | $ | 1,020.30 | | | | $ | 4.75 | | | | | 0.94 | % |
Artisan International Small Cap Fund | | | | | | | | | | | | | | | | | | | | |
Investor Shares | | | | | | | | | | | | | | | | | | | | |
Actual | | | $ | 1,000.00 | | | | $ | 1,023.00 | | | | $ | 7.59 | | | | | 1.50 | % |
Hypothetical (5% return before expenses) | | | $ | 1,000.00 | | | | $ | 1,017.50 | | | | $ | 7.57 | | | | | 1.50 | % |
Institutional Shares(4) | | | | | | | | | | | | | | | | | | | | |
Actual | | | $ | 1,000.00 | | | | $ | 1,028.40 | | | | $ | 6.44 | | | | | 1.36 | % |
Hypothetical (5% return before expenses) | | | $ | 1,000.00 | | | | $ | 1,017.01 | | | | $ | 6.41 | | | | | 1.36 | % |
Artisan International Value Fund | | | | | | | | | | | | | | | | | | | | |
Investor Shares | | | | | | | | | | | | | | | | | | | | |
Actual | | | $ | 1,000.00 | | | | $ | 1,049.70 | | | | $ | 6.10 | | | | | 1.19 | % |
Hypothetical (5% return before expenses) | | | $ | 1,000.00 | | | | $ | 1,019.05 | | | | $ | 6.01 | | | | | 1.19 | % |
Advisor Shares | | | | | | | | | | | | | | | | | | | | |
Actual | | | $ | 1,000.00 | | | | $ | 1,050.40 | | | | $ | 5.28 | | | | | 1.03 | % |
Hypothetical (5% return before expenses) | | | $ | 1,000.00 | | | | $ | 1,019.85 | | | | $ | 5.20 | | | | | 1.03 | % |
Institutional Shares | | | | | | | | | | | | | | | | | | | | |
Actual | | | $ | 1,000.00 | | | | $ | 1,050.80 | | | | $ | 4.92 | | | | | 0.96 | % |
Hypothetical (5% return before expenses) | | | $ | 1,000.00 | | | | $ | 1,020.20 | | | | $ | 4.85 | | | | | 0.96 | % |
| | |
| Artisan Partners Funds | | 133 |
SHAREHOLDER EXPENSE EXAMPLE (UNAUDITED)
| | | | | | | | | | | | | | | | | | | | |
| | | Beginning
Account Value
4/1/2016 | | Ending
Account Value
9/30/2016 | | Expenses Paid During
Period
4/1/2016-9/30/2016(1) | | Expense
Ratio(2)(3)* |
Artisan Mid Cap Fund | | | | | | | | | | | | | | | | | | | | |
Investor Shares | | | | | | | | | | | | | | | | | | | | |
Actual | | | $ | 1,000.00 | | | | $ | 1,095.10 | | | | $ | 6.18 | | | | | 1.18 | % |
Hypothetical (5% return before expenses) | | | $ | 1,000.00 | | | | $ | 1,019.10 | | | | $ | 5.96 | | | | | 1.18 | % |
Advisor Shares | | | | | | | | | | | | | | | | | | | | |
Actual | | | $ | 1,000.00 | | | | $ | 1,095.50 | | | | $ | 5.61 | | | | | 1.07 | % |
Hypothetical (5% return before expenses) | | | $ | 1,000.00 | | | | $ | 1,019.65 | | | | $ | 5.40 | | | | | 1.07 | % |
Institutional Shares | | | | | | | | | | | | | | | | | | | | |
Actual | | | $ | 1,000.00 | | | | $ | 1,096.30 | | | | $ | 4.98 | | | | | 0.95 | % |
Hypothetical (5% return before expenses) | | | $ | 1,000.00 | | | | $ | 1,020.25 | | | | $ | 4.80 | | | | | 0.95 | % |
Artisan Mid Cap Value Fund | | | | | | | | | | | | | | | | | | | | |
Investor Shares | | | | | | | | | | | | | | | | | | | | |
Actual | | | $ | 1,000.00 | | | | $ | 1,075.30 | | | | $ | 5.81 | | | | | 1.12 | % |
Hypothetical (5% return before expenses) | | | $ | 1,000.00 | | | | $ | 1,019.40 | | | | $ | 5.65 | | | | | 1.12 | % |
Advisor Shares | | | | | | | | | | | | | | | | | | | | |
Actual | | | $ | 1,000.00 | | | | $ | 1,075.50 | | | | $ | 5.66 | | | | | 1.09 | % |
Hypothetical (5% return before expenses) | | | $ | 1,000.00 | | | | $ | 1,019.55 | | | | $ | 5.50 | | | | | 1.09 | % |
Institutional Shares | | | | | | | | | | | | | | | | | | | | |
Actual | | | $ | 1,000.00 | | | | $ | 1,075.90 | | | | $ | 4.88 | | | | | 0.94 | % |
Hypothetical (5% return before expenses) | | | $ | 1,000.00 | | | | $ | 1,020.30 | | | | $ | 4.75 | | | | | 0.94 | % |
Artisan Small Cap Fund | | | | | | | | | | | | | | | | | | | | |
Investor Shares | | | | | | | | | | | | | | | | | | | | |
Actual | | | $ | 1,000.00 | | | | $ | 1,191.00 | | | | $ | 7.12 | | | | | 1.30 | % |
Hypothetical (5% return before expenses) | | | $ | 1,000.00 | | | | $ | 1,018.50 | | | | $ | 6.56 | | | | | 1.30 | % |
Institutional Shares | | | | | | | | | | | | | | | | | | | | |
Actual | | | $ | 1,000.00 | | | | $ | 1,192.30 | | | | $ | 5.54 | | | | | 1.01 | % |
Hypothetical (5% return before expenses) | | | $ | 1,000.00 | | | | $ | 1,019.95 | | | | $ | 5.10 | | | | | 1.01 | % |
Artisan Value Fund | | | | | | | | | | | | | | | | | | | | |
Investor Shares | | | | | | | | | | | | | | | | | | | | |
Actual | | | $ | 1,000.00 | | | | $ | 1,115.80 | | | | $ | 5.13 | | | | | 0.97 | % |
Hypothetical (5% return before expenses) | | | $ | 1,000.00 | | | | $ | 1,020.15 | | | | $ | 4.90 | | | | | 0.97 | % |
Advisor Shares | | | | | | | | | | | | | | | | | | | | |
Actual | | | $ | 1,000.00 | | | | $ | 1,116.30 | | | | $ | 4.55 | | | | | 0.86 | % |
Hypothetical (5% return before expenses) | | | $ | 1,000.00 | | | | $ | 1,020.70 | | | | $ | 4.34 | | | | | 0.86 | % |
Institutional Shares | | | | | | | | | | | | | | | | | | | | |
Actual | | | $ | 1,000.00 | | | | $ | 1,116.90 | | | | $ | 4.08 | | | | | 0.77 | % |
Hypothetical (5% return before expenses) | | | $ | 1,000.00 | | | | $ | 1,021.15 | | | | $ | 3.89 | | | | | 0.77 | % |
| | |
| 134 | | Artisan Partners Funds |
SHAREHOLDER EXPENSE EXAMPLE (UNAUDITED)
| (1) | Expenses are equal to the Fund’s ratio of expenses to average net assets for the six month period ended September 30, 2016, multiplied by the average account value over the period, multiplied by 183/366 (to reflect the one-half year period). |
| (2) | Annualized ratio of expenses to average net assets for the six-month period ended September 30, 2016. |
| (3) | Expense ratio includes the effect of expenses waived or paid by the Adviser, if applicable. |
| (4) | The account value and the expenses paid for International Small Cap Fund – Institutional Shares have been presented for the period from commencement of operations (April 12, 2016) through September 30, 2016. Assuming a six-month period, and the actual account values as of September 30, 2016, and the expenses paid during the period 4/1/2016-9/30/2016 would have been as follows: |
| | | | | | | | | | | | | | | |
| | | Beginning
Account Value
4/1/2016 | | Ending
Account Value
9/30/2016 | | Expenses Paid During
Period
4/1/2016-9/30/2016 |
Artisan International Small Cap Fund | | | | | | | | | | | | | | | |
Institutional Shares | | | | | | | | | | | | | | | |
Actual | | | $ | 1,000.00 | | | | $ | 1,028.40 | | | | $ | 6.90 | |
Hypothetical (5% return before expenses) | | | $ | 1,000.00 | | | | $ | 1,018.20 | | | | $ | 6.86 | |
| * | Includes the amount that the custodian offered to reimburse the Fund for certain out-of-pocket expenses it incorrectly charged the Funds between 1998 and 2015. See note 16 for additional information. |
| | |
| Artisan Partners Funds | | 135 |
FACTORS CONSIDERED IN RENEWING THE FUNDS’ ADVISORY AGREEMENTS
Artisan Partners is responsible for management of the Funds’ investment portfolios and for overall management of the Funds’ business and affairs pursuant to an investment advisory agreement (the “Advisory Agreement”) between Artisan Partners Funds and Artisan Partners. With respect to each series of Artisan Partners Funds, the Advisory Agreement, after an initial two-year term, may be continued from year to year only so long as the continuation is approved at least annually (a) by the vote of a majority of the directors of Artisan Partners Funds who are not “interested persons” of Artisan Partners Funds or Artisan Partners (the “independent directors”) cast in person at a meeting called for the purpose of voting on such approval, and (b) by the board of directors or by the vote of a majority (as defined in the 1940 Act) of the outstanding shares of the Fund.
The directors of Artisan Partners Funds held a meeting on April 27, 2016 (the “April 27 Meeting”), at which they gave preliminary consideration to information bearing on the continuation of the Advisory Agreement with respect to all of the series of Artisan Partners Funds other than Artisan Small Cap Value Fund (the “Funds”) for the period from July 1, 2016 through June 30, 2017. The primary purpose of the April 27 Meeting was to allow the directors ample opportunity to consider matters they deemed relevant in connection with the approval of the Advisory Agreement (in addition to materials they review at meetings throughout the year), and to request any additional information they considered reasonably necessary to their deliberations, without undue time constraints.
At their regular quarterly meeting held on May 10, 2016 (the “May 10 Meeting”), the directors, including the independent directors, considered and unanimously approved the continuation through June 30, 2017 of the Advisory Agreement with respect to all Funds. The independent directors were assisted in their evaluation of the Advisory Agreement and the factors that they deemed to be material, including those factors described below, by independent legal counsel, from whom they received separate legal advice and with whom they met separately from Artisan Partners in connection with the contract review meetings. The directors did not consider continuation of the Advisory Agreement with respect to Small Cap Value Fund due to the planned merger of that fund with and into Mid Cap Value Fund, which occurred May 23, 2016.
Prior to the April 27 Meeting, independent counsel to the independent directors sent to Artisan Partners requests for information to be provided to the directors in connection with their consideration of the Advisory Agreement. Artisan Partners provided materials to the directors in response to those requests as well as other information Artisan Partners believed was useful in evaluating the approval of the Advisory Agreement. Artisan Partners provided extensive reports prepared by Broadridge Financial Solutions, Inc. (“Broadridge”), an independent source of investment company data (in prior years branded as “Lipper reports”), which included information relating to each Fund’s performance and expenses compared to the performance and expenses of a relatively small peer group and a larger peer universe of mutual funds. Artisan Partners also provided additional reports prepared by Broadridge comparing certain of the Funds’ performance and expenses to peer groups and peer universes with a different style classification that Artisan Partners believed was more appropriate for comparative purposes than the style classification originally selected by Broadridge. These supplemental reports were provided for Global Equity Fund, Global Opportunities Fund, Global Value Fund, International Fund, International Value Fund, Mid Cap Fund and Value Fund.
| | |
| 136 | | Artisan Partners Funds |
FACTORS CONSIDERED IN RENEWING THE FUNDS’ ADVISORY AGREEMENTS
The directors also received and reviewed a memorandum from independent counsel regarding the directors’ responsibilities in evaluating the Advisory Agreement. The directors recognized that the management and fee arrangements for the Funds are the result of years of review and discussion between the independent directors and Artisan Partners, that certain aspects of such arrangements may receive greater scrutiny in some years than in others and that the directors’ conclusions may be based, in part, on their consideration of these same arrangements and information received during the course of the year and in prior years.
In evaluating the Advisory Agreement, the directors reviewed the available information and discussed with representatives of Artisan Partners each Fund’s operations; the nature, extent and quality of the advisory and other services provided by Artisan Partners to the Funds; the management fees and total expense ratios of each class of shares of the Funds; possible economies of scale; and other benefits (in addition to advisory fee revenues) derived or potentially derived by Artisan Partners from its relationship with the Funds. In addition to the third-party reports by Broadridge and the memorandum from independent counsel, the directors reviewed information provided prior to and presented at the April 27 Meeting and the May 10 Meeting, concerning, among other things, the following:
| • | | Artisan Partners’ organization and operations, financial condition and stability and ownership structure; |
| • | | Artisan Partners’ personnel, business and financial model, and methods, including Artisan Partners’ assessment of its ability to attract and retain capable personnel; Artisan Partners’ research and decision-making processes; the adequacy and sophistication of technology and systems with respect to investment and administrative matters; Artisan Partners’ liquidity management tools, policies and procedures; and steps taken or expected to be taken to comply with proposed regulatory changes related to liquidity risk management and use of derivatives; |
| • | | The terms of the Advisory Agreement, including the scope of services performed by Artisan Partners; and how the services performed by Artisan Partners under the Advisory Agreement differ from those performed for other investment companies and accounts; |
| • | | Each Fund’s short- and long-term investment performance (including past 1-, 3-, 5- and 10-year and since-inception periods, as applicable), including comparisons for various time periods with (a) other Artisan Partners client accounts managed with similar investment objectives, (b) other mutual funds having similar investment objectives, and (c) appropriate market indices; |
| • | | The Funds’ experience applying valuation procedures, including fair valuation of assets for which market quotations are not readily available and any anticipated or proposed changes to the procedures; |
| • | | Any litigation pending, threatened or settled involving Artisan Partners, and the results of any audits, investigations or examinations thereof by the Securities and Exchange Commission or other governmental or regulatory authorities; |
| • | | Information regarding fee arrangements, including a comparison of the total expense ratio of each share class of each Fund with other mutual funds; the structure of the advisory fees, including the method of computing fees and the frequency of payment of |
| | |
| Artisan Partners Funds | | 137 |
FACTORS CONSIDERED IN RENEWING THE FUNDS’ ADVISORY AGREEMENTS
| | fees; a comparison of the advisory fees with fees charged by other advisory organizations for managing mutual funds with similar investment objectives; and information regarding expense limitation arrangements and the expenses other than advisory fees that the Funds bear, either at the level of the Fund as a whole or on a class-specific basis; |
| • | | Artisan Partners’ assessment of whether it is realizing economies of scale in providing services to the Funds and, if so, whether, how and, if quantifiable, to what extent the economies of scale are shared with the Funds, and the adequacy of existing breakpoints (reduced fee levels on assets in excess of stated thresholds) in advisory fees and whether further breakpoints are appropriate; |
| • | | A comparison of the fee arrangements for the Funds with fees charged by Artisan Partners for subadvising other U.S. mutual funds and for managing other accounts, and trends in fees charged by Artisan Partners for such services; |
| • | | Information regarding third-party intermediary and service arrangements and related payments by the Funds and Artisan Partners, including, among other information, information on amounts paid to financial intermediaries during the year ended December 31, 2015, the nature of services provided by such intermediaries, any caps or limitations placed on related payments, and the process employed by Artisan Partners for entering into and overseeing such intermediary arrangements; |
| • | | Potential “fall-out” benefits to Artisan Partners or its affiliates from their relationships with the Funds, in addition to advisory fees, including any benefits to Artisan Partners or its affiliates in selling other products, and the method of estimating the value of any such benefits; |
| • | | Matters relating to brokerage and portfolio transactions, including Artisan Partners’ practices regarding selection of brokers and dealers to execute portfolio transactions and regarding negotiation of commission rates and allocation of brokerage for research and other services; |
| • | | The estimated profitability to Artisan Partners of its relationship with each Fund on both a pre-tax and post-tax basis for the three most recent 12-month periods; the assumptions and allocation methodologies utilized for such profitability analysis; and, with respect to Mid Cap Value Fund, supplemental pro forma profitability information assuming the merger of Mid Cap Value Fund and Small Cap Value Fund had occurred immediately prior to the most recent measurement period; |
| • | | Potential for conflicts of interest between the Funds and Artisan Partners and circumstances and actions addressing or bearing on potential conflicts of interest; and |
| • | | Compliance and related matters, including Artisan Partners’ programs for monitoring compliance with federal and state securities and other applicable laws and regulations, the investment policies and restrictions of registered investment company clients and Subchapter M of the Internal Revenue Code; and information regarding personnel who perform significant compliance and legal services for the Funds. |
Following the April 27 Meeting and executive sessions with their independent counsel, the independent directors requested certain follow-up information from Artisan Partners. Artisan Partners provided this follow-up information prior to the May 10
| | |
| 138 | | Artisan Partners Funds |
FACTORS CONSIDERED IN RENEWING THE FUNDS’ ADVISORY AGREEMENTS
Meeting. At the May 10 Meeting, Artisan Partners presented certain additional information to the directors regarding the Funds, and the independent directors and their independent counsel reviewed with the full board the information discussed at the April 27 Meeting and during their executive sessions. The directors then considered whether any further discussion or review was necessary, concluding that the April 27 Meeting and the information reviewed by the independent directors prior to and at the May 10 Meeting provided a sufficient basis for taking action on the continuation of the Advisory Agreement with respect to each Fund for an additional year. The directors then reviewed and affirmed each of the following conclusions:
The nature, extent and quality of Artisan Partners’ services. The directors concluded that the nature and extent of Artisan Partners’ services to the Funds was appropriate and consistent with, and in some cases more advantageous to the Funds than, the terms of the Advisory Agreement. The directors concluded that the quality of Artisan Partners’ services has been consistently high, with no material deficiencies.
The investment performance of each Fund. With respect to each Fund, the directors concluded that the Fund’s performance (including absolute performance and, where applicable, outperformance of peers and relevant benchmarks over long-term periods) or other relevant factors supported continuation of the Fund’s advisory arrangements under the Advisory Agreement. In the case of each Fund that had performance that lagged that of a relevant peer group or benchmark for certain (although not necessarily all) periods, the directors concluded that other factors relevant to performance supported continuation of the advisory arrangements. These factors included either or both of the following: (1) that underperformance was attributable, to a significant extent, to investment decisions (such as security selection, sector allocation or risk mitigation) by Artisan Partners that were reasonable and consistent with the Fund’s investment objective and policies; and (2) that the Fund’s more recent or long-term performance, as applicable, was competitive when compared to relevant performance benchmarks or peer groups. With respect to each of Emerging Markets Fund, Mid Cap Value Fund and Value Fund, following extensive discussion, the directors determined that the Fund’s performance supported renewal of the Fund’s advisory arrangement, but that the board would continue to monitor closely the performance of the Fund. The directors noted that Artisan Partners had provided supplemental analysis regarding each of those Funds and responded to questions regarding efforts to address periods of underperformance, and that all three Funds had exhibited improving relative performance in 2016 in comparison to earlier periods. The directors also noted Artisan Partners’ past record of improving the performance of other Funds that experienced periods of underperformance.
The costs of the services and profitability of Artisan Partners. The directors concluded that the costs of the services provided by Artisan Partners, and the estimated profitability it realizes, are reasonable in relation to the nature and quality of services provided with respect to each Fund, based on the assumptions and methodology for calculating such costs and profitability presented to the directors by Artisan Partners.
Comparisons of the services rendered and the amounts payable under the Advisory Agreement with those under other investment advisory agreements. The directors concluded that the fees payable by the Funds to Artisan Partners are reasonable in relation to the nature and quality of the services provided. In reaching this conclusion, the directors
| | |
| Artisan Partners Funds | | 139 |
FACTORS CONSIDERED IN RENEWING THE FUNDS’ ADVISORY AGREEMENTS
compared the fees payable by the Funds to the fees paid by other mutual funds that are in the same Broadridge peer category or universe. The directors also considered the fees Artisan Partners receives from, and the scope of services it provides to, other Artisan Partners clients, including its separate account clients and UCITS funds, and the U.S. mutual funds and collective investment trusts for which it serves as sub-adviser, noting the significantly broader scope of services that Artisan Partners provides to the Funds as compared to the other types of clients. In reaching their conclusion, the directors also took into account the costs and risks assumed by Artisan Partners in connection with launching and maintaining publicly-offered mutual funds, and how those costs and risks differ from those associated with other components of Artisan Partners’ business. In addition, the directors noted that Artisan Partners has contractually agreed to maintain certain expense limitations through January 31, 2017, for Developing World Fund, Emerging Markets Fund, Global Equity Fund, Global Opportunities Fund (Advisor Shares), Global Small Cap Fund, Global Value Fund (Advisor Shares), High Income Fund, International Fund (Advisor Shares), International Value Fund (Advisor Shares), Mid Cap Fund (Advisor Shares), Mid Cap Value Fund (Advisor Shares) and Value Fund (Advisor Shares).
The extent to which economies of scale would be realized as each Fund grows and whether fee levels reflect these economies of scale for the benefit of Fund investors. The directors concluded that the shareholders of Global Opportunities Fund, Global Value Fund, High Income Fund, International Fund, International Value Fund, Mid Cap Fund, Mid Cap Value Fund, Small Cap Fund and Value Fund have appropriately benefited from economies of scale under the management fee structures of their advisory arrangements. The directors concluded that the shareholders of each of Developing World Fund, Emerging Markets Fund and Global Equity Fund would likely benefit from economies of scale if the Fund’s assets reach the level at which it will be able to take advantage of the investment advisory fee breakpoints in the Advisory Agreement. They also concluded that Artisan Partners had not achieved (nor was it likely to achieve) economies of scale in the management of International Small Cap Fund because the Fund closed to new investors at a relatively modest asset level. The directors also considered that the fee rate for Global Small Cap Fund had been set at a level that was intended to be appropriate for its anticipated eventual asset size, thus not requiring adjustment through breakpoints.
Other benefits derived by the Funds or Artisan Partners. The directors concluded that, other than the services provided by Artisan Partners pursuant to the Advisory Agreement and the management fees to be paid in return, the Funds and Artisan Partners may potentially benefit from their relationship with each other in several ways. For Artisan Partners, the directors concluded the primary fall-out benefits include: (1) the potential conversion of Fund shareholders to separate account clients, and the ability otherwise to attract new clients and investment talent, (2) the acquisition of research products and services in return for brokerage commissions paid by the Funds (“soft dollars”) and (3) reputational benefits as a result of its association with the Funds. The directors concluded that, although Artisan Partners may derive such additional benefits, the Funds also could benefit from potential institutional shareholders who might choose to invest in the Funds because they want Artisan Partners’ services, but do not meet Artisan Partners’ minimum separate account size requirements. The directors also concluded that the Funds benefit from Artisan Partners’ use of soft dollars generated with respect to its separate account clients, and from reputational benefits as a result of their association with Artisan Partners.
| | |
| 140 | | Artisan Partners Funds |
FACTORS CONSIDERED IN RENEWING THE FUNDS’ ADVISORY AGREEMENTS
At the conclusion of the foregoing discussions, the board approved the Advisory Agreement for the period from July 1, 2016 through June 30, 2017 for each Fund by the unanimous vote of all directors and also by the unanimous vote of all the independent directors.
| | |
| Artisan Partners Funds | | 141 |
NOTES ON MANAGEMENT’S DISCUSSION OF FUND PERFORMANCE AND PORTFOLIO HOLDINGS’ CLASSIFICATION
The discussions of each Fund included in this report include statistical information about the portfolios of each of the Funds. Except as otherwise noted, that information is as of September 30, 2016. That information will vary with changes in a Fund’s portfolio investments. The performance information for each Fund relative to its benchmark index discussed in this report was prepared by the Adviser using information reported by FactSet Research Systems, Inc. (“FactSet”). For the purposes of assigning portfolio securities to a particular country in this report, the Adviser considers an issuer to be from a particular country as designated by its securities information vendors. However, the Adviser in its own judgment may consider an issuer to be from a country other than the country designated by the securities information vendors. A vendor’s criteria may include the identity of the jurisdiction of the issuer’s incorporation, the main equity trading market for the issuer’s securities, the geographical distribution of the issuer’s operations and the location of the issuer’s headquarters. The Adviser may also consider other criteria such as the source of a company’s revenues. Over time, country designations may change.
For the purposes of assigning portfolio securities to a particular sector and industry, the Adviser assigns equity securities in accordance with the sector and industry classifications of the Global Industry Classification Standard (GICS®) developed by MSCI Inc. and Standard & Poor’s (to the extent available) as primary sources and FactSet (to the extent available) as a secondary source for this information. The Adviser assigns debt securities in accordance with the industry groups developed by Bloomberg Finance L.P. In the event the Adviser’s securities information vendors do not classify a security to a particular sector or industry, or if the published classification appears to be erroneous, the Adviser classifies the security according to its own judgment, using other securities information vendors, the company description and other publicly available information about the company’s peer group. Sector and industry classifications may change over time.
The names of portfolio securities reflected in this report are as reported by the Funds’ data providers, may not represent the legal name of the entity and, in some cases, are translations of non-English names.
Definition of Portfolio Statistic
Market Capitalization is the aggregate value of all of a company’s outstanding equity securities.
Descriptions of Indices
Each Fund’s performance is compared in this report to changes in one or more indices, including in all cases a broad-based index of changes in prices of securities in the markets in which the Fund invests. All of the indices are unmanaged and their returns include reinvested dividends. Unlike the Funds’ returns, the returns of each index do not include the payment of sales commissions or other expenses that would be incurred in the purchase or sale of the securities included in that index. An investment cannot be made directly in an index. Fair value pricing is not employed by market indices.
| | |
| 142 | | Artisan Partners Funds |
NOTES ON MANAGEMENT’S DISCUSSION OF FUND PERFORMANCE AND PORTFOLIO HOLDINGS’ CLASSIFICATION
The indices to which the Funds are compared are:
Artisan Developing World and Artisan Emerging Markets Funds – Morgan Stanley Capital International Emerging Markets Index (MSCI Emerging Markets) is a market-weighted index of companies in emerging markets.
Artisan Global Equity, Artisan Global Opportunities, Artisan Global Small Cap and Artisan Global Value Funds – Morgan Stanley Capital International All Country World Index (MSCI ACWI) is a market-weighted index of global developed and emerging markets.
Artisan Global Small Cap Fund – Morgan Stanley Capital International All Country World Small Cap Index (MSCI ACWI Small Cap) – is a market-weighted index of small cap securities of global developed and emerging markets.
Artisan High Income Fund – BofA Merrill Lynch U.S. High Yield Master II Total Return Index tracks the performance of below investment grade U.S. dollar-denominated corporate bonds publicly issued in the U.S. domestic market.
Artisan International, Artisan International Small Cap and Artisan International Value Funds – Morgan Stanley Capital International EAFE Index (MSCI EAFE) is a market-weighted index of companies in developed markets, excluding the U.S. and Canada. MSCI EAFE’s average annual return since inception of the International Fund is based upon a starting date of December 31, 1995.
Artisan International Fund – Morgan Stanley Capital All Country World Index ex USA (MSCI ACWI ex USA) is a market-weighted index of global developed and emerging markets, excluding the U.S.
Artisan International Small Cap Fund – Morgan Stanley Capital International EAFE Small Cap Index (MSCI EAFE Small Cap) is a market-weighted index of small companies in developed markets, excluding the U.S. and Canada.
Artisan International Value Fund – Morgan Stanley Capital International EAFE Value Index (MSCI EAFE Value) is a market-weighted index of companies in developed markets, excluding the U.S. and Canada, that exhibits value investment style characteristics according to MSCI’s methodology.
Artisan Mid Cap and Artisan Mid Cap Value Funds – Russell Midcap® Index is a market-weighted index of about 800 medium-sized U.S. companies.
Artisan Mid Cap Fund – Russell Midcap® Growth Index is a market-weighted index of those medium-sized companies included in the Russell Midcap® Index with higher price-to-book and higher forecasted growth values.
Artisan Mid Cap Value Fund – Russell Midcap® Value Index is a market-weighted index of those medium-sized companies included in the Russell Midcap® Index with lower price-to-book ratios and lower forecasted growth values.
Artisan Small Cap Fund – Russell 2000® Index is a market-weighted index of about 2,000 small U.S. companies.
| | |
| Artisan Partners Funds | | 143 |
NOTES ON MANAGEMENT’S DISCUSSION OF FUND PERFORMANCE AND PORTFOLIO HOLDINGS’ CLASSIFICATION
Artisan Small Cap Fund – Russell 2000® Growth Index is a market-weighted index of those small companies included in the Russell 2000® Index with higher price-to-book ratios and higher forecasted growth values.
Artisan Value Fund – Russell 1000® Index is a market-weighted index of about 1,000 large U.S. companies.
Artisan Value Fund – Russell 1000® Value Index is a market-weighted index of those large companies included in the Russell 1000® Index with lower price-to-book ratios and lower forecasted growth values.
Trademarks
Trademarks and copyrights relating to the indices and products of portfolio companies mentioned in this report, if any, are owned by their respective owners. Except as otherwise indicated, the trademarks, including names, logos, slogans and service marks appearing in this report are the property of the Adviser and may not be copied, reproduced, published or in any way used without written permission.
The Global Industry Classification Standard (“GICS”) was developed by and is the exclusive property and a service mark of MSCI Inc. (“MSCI”) and Standard & Poor’s, a division of The McGraw-Hill Companies, Inc. (“S&P”) and is licensed for use by the Adviser. Neither MSCI, S&P nor any third party involved in making or compiling the GICS or any GICS classifications makes any express or implied warranties or representations with respect to such standard or classification (or the results to be obtained by the use thereof), and all such parties hereby expressly disclaim all warranties of originality, accuracy, completeness, merchantability and fitness for a particular purpose with respect to any of such standard or classification. Without limiting any of the foregoing, in no event shall MSCI, S&P, any of their affiliates or any third party involved in making or compiling the GICS or any GICS classifications have any liability for any direct, indirect, special, punitive, consequential or any other damages (including lost profits) even if notified of the possibility of such damages.
MSCI makes no express or implied warranties or representations and shall have no liability whatsoever with respect to any MSCI data contained herein. The MSCI data may not be further redistributed or used to create indices or financial products. This report is not approved or produced by MSCI.
For the BofA Merrill Lynch U.S. High Yield Master II Total Return Index the source is BofA Merrill Lynch, used with permission. BofA Merrill Lynch is licensing the BofA Merrill Lynch indices “as is,” makes no warranties regarding same, does not guarantee the suitability, quality, accuracy, timeliness, and/or completeness of the BofA Merrill Lynch indices or any data included in, related to, or derived there from, assumes no liability in connection with their use, and does not sponsor, endorse, or recommend Artisan Partners, or any of its products or services.
Russell Investment Group is the source and owner of the Russell Index data contained or reflected in this material and all trademarks and copyrights related thereto. The presentation may contain confidential information and unauthorized use, disclosure, copying, dissemination or redistribution is strictly prohibited. This is a presentation of Artisan Partners Funds. Russell Investment Group is not responsible for the formatting or configuration of this material or for any inaccuracy in Artisan Partners Funds’ presentation thereof.
| | |
| 144 | | Artisan Partners Funds |
PROXY VOTING POLICIES AND PROCEDURES
You may obtain a description of Artisan Partners Funds’ proxy voting policies and procedures, without charge, upon request by calling 800.344.1770. That information also is included in Artisan Partners Funds’ statement of additional information, which is available without charge, on Artisan Partners Funds’ website at www.artisanpartners.com and on the Securities and Exchange Commission’s website at www.sec.gov.
Information relating to how each Fund voted proxies relating to portfolio securities held during the twelve-month period ended June 30 is available without charge, on Artisan Partners Funds’ website at www.artisanpartners.com and on the Securities and Exchange Commission’s website at www.sec.gov.
INFORMATION ABOUT PORTFOLIO SECURITIES
Artisan Partners Funds files a complete schedule of portfolio holdings with the Securities and Exchange Commission for the quarters ending December 31 and June 30 (the first and third quarters of the Funds’ fiscal year) on Form N-Q. The Funds’ Forms N-Q are available on the Securities and Exchange Commission’s website at www.sec.gov. You also may review and copy those documents by visiting the Securities and Exchange Commission’s Public Reference Room in Washington, D.C. Information on the operation of the Public Reference Room may be obtained by calling the Securities and Exchange Commission at 800.SEC.0330.
| | |
| Artisan Partners Funds | | 145 |
DIRECTORS AND OFFICERS
The board of directors has overall responsibility for the conduct of the affairs of Artisan Partners Funds. Each director serves an indefinite term of unlimited duration until the next annual meeting of shareholders and until the election and qualification of his or her successor or until he or she retires, resigns or is removed from office. Artisan Partners Funds’ bylaws further provide that each director must retire by the end of the calendar year in which he or she attains the age of 75. The board of directors may fill any vacancy on the board provided that after such appointment at least two-thirds of the directors have been elected by the shareholders. The shareholders may remove a director by a vote of a majority of the outstanding shares of the Funds at any meeting of shareholders called for the purpose of removing such director.
The board of directors elects the officers of Artisan Partners Funds. Each officer serves until the election and qualification of his or her successor, or until he or she sooner dies, resigns, or is removed or disqualified. The board of directors may remove any officer with or without cause at any time.
The names and ages of the directors and officers as of November 11, 2016, the position each holds with the Funds, the date each was first elected to office, their principal business occupations and other directorships they have held during at least the last five years are shown below. Each director oversees all fourteen series of Artisan Partners Funds.
| | | | | | | | |
| | | | | |
Name and Age at 11/11/16 | | Position(s)
Held with
Artisan Partners Funds | | Date First Elected
or Appointed to Office | | Principal Occupation(s) during at least the
Past 5 Years | | Other Public Company or
Registered Investment
Company Directorships Held |
| Directors who are not “interested persons” of Artisan Partners Funds: |
| David A. Erne – 73 | | Director | | 3/27/95 | | Of counsel to the law firm Reinhart Boerner Van Deuren s.c., Milwaukee, WI. | | None. |
| Gail L. Hanson – 60 | | Director | | 1/1/12 | | Chief Financial Officer, Aurora Health Care (not for profit health care provider); from September 2004 to February 2011, Deputy Executive Director, State of Wisconsin Investment Board. | | Director, Northwestern Mutual Series Fund, Inc. (investment company) (27 portfolios). |
| Thomas R. Hefty – 69 | | Director and Independent Chair of the Board of Directors | | Director since 3/27/95; Independent Chair since 1/1/15 | | Retired; from January 2007 to February 2008, President, Kern Family Foundation (private, grant-making organization); until December 2006, of counsel to the law firm Reinhart Boerner Van Deuren s.c., Milwaukee, WI; until December 2006, Adjunct Professor, Department of Business and Economics, Ripon College; until December 2002, Chairman of the Board and Chief Executive Officer of Cobalt Corporation (provider of managed care and specialty business services). | | None. |
| | |
| 146 | | Artisan Partners Funds |
DIRECTORS AND OFFICERS
| | | | | | | | |
| | | | | |
Name and Age at 11/11/16 | | Position(s)
Held with
Artisan Partners
Funds | | Date First Elected
or Appointed to Office | | Principal Occupation(s) during at least the
Past 5 Years | | Other Public Company or
Registered Investment
Company Directorships Held |
| Peter M. Lebovitz – 61 | | Director | | 7/1/14 | | Managing Partner, Harkness Partners, LLC (provider of strategic consulting to investment management firms). | | None. |
| Patrick S. Pittard – 70 | | Director | | 8/9/01 | | Distinguished Executive in Residence (teaching position), University of Georgia; until December 2012, Chairman and Chief Executive Officer, ACT Bridge, Inc. (enterprise talent management firm); until October 2001, Chairman of the Board, President and Chief Executive Officer of Heidrick & Struggles International, Inc. (executive search firm). | | Director, Lincoln National Corporation (insurance and investment management company). |
| R. Scott Trumbull – 68 | | Director | | 11/13/12 | | Until 2015, Chairman and Director, Franklin Electric Co., Inc. (manufacturer of water and fuel pumping systems); until 2014, Chief Executive Officer, Franklin Electric Co., Inc. | | Director, Welltower Inc. (investor in health care real estate); Director, Columbus McKinnon Corporation (designer, manufacturer and marketer of material handling products). |
| Director who is an “interested person” of Artisan Partners Funds and Officer: |
| Eric R. Colson – 47* | | Director, President and Chief Executive Officer | | President and Chief Executive Officer since 2/9/10; Director since 11/12/13 | | President, Chief Executive Officer and Director of Artisan Partners Asset Management Inc. (since March 2013) and Chairman (since August 2015); Managing Director, Chief Executive Officer and since April 2013 President of Artisan Partners; President and Chief Executive Officer of Artisan Investments GP LLC; President and Chief Executive Officer of Artisan Partners Holdings LP (since March 2013); prior thereto, Managing Director and Chief Operating Officer – Investment Operations of Artisan Partners. | | None. |
| | |
| Artisan Partners Funds | | 147 |
DIRECTORS AND OFFICERS
| | | | | | | | |
| | | | | |
Name and Age at 11/11/16 | | Position(s)
Held with
Artisan Partners
Funds | | Date First Elected
or Appointed to Office | | Principal Occupation(s) during at least the
Past 5 Years | | Other Public Company or
Registered Investment
Company Directorships Held |
| Officers: |
| Brooke J. Billick – 62 | | Chief Compliance Officer | | 8/19/04 | | Chief Compliance Officer – U.S. Mutual Funds and Associate Counsel of Artisan Partners; Chief Compliance Officer of Artisan Partners Distributors LLC; until January 2012, Chief Compliance Officer of Artisan Partners. | | None. |
| Gregory K. Ramirez – 46 | | Chief Financial Officer, Vice President and Treasurer | | 2/8/11 | | Managing Director and since April 2013, Vice President and Assistant Treasurer of Artisan Partners; Senior Vice President (since October 2013) of Artisan Partners Asset Management Inc.; Chairman and President of Artisan Partners Distributors LLC; prior thereto, Vice President, Treasurer and Chief Financial Officer of Artisan Partners Distributors LLC; until February 2011, Assistant Secretary and Assistant Treasurer of Artisan Partners Funds. | | None. |
| Sarah A. Johnson – 44 | | General Counsel, Vice President and Secretary | | 2/8/11 | | Managing Director, Vice President (since April 2013), Secretary (since October 2013), Chief Compliance Officer (January 2012 – September 2013) and General Counsel (since October 2013) of Artisan Partners; prior thereto Associate Counsel of Artisan Partners; Executive Vice President, Chief Legal Officer and Secretary (since October 2013) of Artisan Partners Asset Management Inc.; Vice President and Secretary of Artisan Partners Distributors, LLC; until February 2011, Assistant Secretary of Artisan Partners Funds. | | None. |
| Laura E. Simpson – 40 | | Vice President and Assistant Secretary | | 2/10/15 | | Deputy General Counsel (since January 2015) of Artisan Partners; prior thereto, Associate Counsel; until March 2011, Counsel, Invesco Ltd. | | None. |
| Shannon K. Jagodinski – 39 | | Vice President and Assistant Treasurer | | Vice President since 2/10/15; Assistant Treasurer since 2/14/12 | | Director (since January 2016) of Vehicle Administration of Artisan Partners; prior thereto, Senior Manager. | | None. |
| | |
| 148 | | Artisan Partners Funds |
DIRECTORS AND OFFICERS
| | | | | | | | |
| | | | | |
Name and Age at 11/11/16 | | Position(s)
Held with
Artisan Partners
Funds | | Date First Elected
or Appointed to Office | | Principal Occupation(s) during at least the
Past 5 Years | | Other Public Company or
Registered Investment
Company Directorships Held |
| Blake A. Rigel, 45 | | Assistant Treasurer | | 2/9/16 | | Director of Global Taxation of Artisan Partners since September 2015; until September 2015, Special Tax Counsel, Kramer, Levin, Naftalis & Frankel. | | None. |
| * | Mr. Colson is an “interested person” of Artisan Partners Funds, as defined in the 1940 Act, because he is President and Chief Executive Officer of Artisan Partners Funds and holds various positions with Artisan Partners and its affiliates. |
| | |
| Artisan Partners Funds | | 149 |

ARTISAN PARTNERS FUNDS
P.O. BOX 8412
BOSTON, MA 02266-8412

Item 2. Code of Ethics.
(a) Registrant has adopted a code of ethics (the “Code”) that applies to its principal executive officer, principal financial officer and principal accounting officer (the “Covered Officers”).
(b) No disclosures are required pursuant to this Item 2(b).
(c) During the period covered by the report, registrant did not make any substantive amendments to the Code.
(d) During the period covered by the report, registrant did not grant any waivers, including implicit waivers, from the provisions of the Code.
(e) Not applicable.
(f) A copy of the Code is filed as Exhibit (a)(1) to this Form N-CSR.
Item 3. Audit Committee Financial Expert.
Registrant’s board of directors has determined that Gail L. Hanson, member and chairman of the registrant’s audit committee, Thomas R. Hefty, member of the registrant’s audit committee, Peter M. Lebovitz, member of the registrant’s audit committee, and R. Scott Trumbull, member of the registrant’s audit committee, each qualify as an audit committee financial expert, as such term is defined in Instruction 2(b) to Item 3 of Form N-CSR. Ms. Hanson, Mr. Hefty, Mr. Lebovitz and Mr. Trumbull are “independent” as such term is defined in paragraph (a)(2) of Item 3 of Form N-CSR.
Under applicable securities laws, a person who is determined to be an audit committee financial expert will not be deemed an “expert” for any purpose, including, without limitation, for the purposes of Section 11 of the Securities Act of 1933, as a result of being designated or identified as an audit committee financial expert. The designation or identification of a person as an audit committee financial expert does not impose on such person any duties, obligations, or liabilities that are greater than the duties, obligations, and liabilities imposed on such person as a member of the audit committee and board of directors in the absence of such designation or identification.
Item 4. Principal Accountant Fees and Services.
Aggregate fees billed to the registrant for professional services rendered by the registrant’s principal accountant, Ernst & Young LLP, are summarized in the tables below. The tables summarize fees billed (or to be billed) by the registrant’s principal accountant for work performed relating to each applicable period identified below.
Fees:
| | | | | | | | |
| | | Fiscal Year Ended
September 30, 2016 | | | Fiscal Year Ended
September 30, 2015 | |
Audit Fees (a) | | $ | 377,500 | | | $ | 365,300 | |
Audit-Related Fees (b) | | $ | 73,800 | | | $ | 66,200 | |
Tax Fees (c) | | $ | 366,970 | | | $ | 374,096 | |
All Other Fees (d) | | $ | — | | | | — | |
(a) “Audit Fees” include amounts for professional services rendered by the principal accountant for the audit of the registrant’s annual financial statements and services that are normally provided by the accountant in connection with statutory and regulatory filings or engagements, including for 2016, portions of which have not
been billed at the time of this filing and fees billed for consents issued in conjunction with the registrant’s post-effective amendments to the Funds’ registration statements filed for each of the last two fiscal years. The fees billed during the fiscal year ended September 30, 2016 also include consents issued in conjunction with the registrant’s post-effective amendments to the Funds’ registration statements filed in connection with the initial offering of Institutional Shares of Artisan International Small Cap Fund and in conjunction with the initial offering of Institutional Shares of Artisan Global Equity Fund. The fees billed during the fiscal year ended September 30, 2015 also include the consent issued in conjunction with the registrant’s post-effective amendments to the Funds’ registration statements filed in connection with the initial offering of Investor Shares, Advisor Shares and Institutional Shares of Artisan Developing World Fund.
(b) “Audit-Related Fees” include amounts for assurance and related services by the principal accountant that are reasonably related to the performance of the audit of the registrant’s financial statements. Audit-related fees have not been reported under the item “audit fees” in the chart above.
The fees billed by Ernst & Young LLP during the fiscal years ended September 30, 2016 and September 30, 2015 include fees incurred for services for review procedures performed in conjunction with the semiannual reports to shareholders as of March 31, 2016 and March 31, 2015.
(c) “Tax Fees” include amounts for professional services rendered by the principal accountant for tax compliance, tax advice and tax planning.
The fees shown in the table above for the fiscal year ended September 30, 2016 include fees for (1) the review and preparation of the Funds’ income tax returns for the fiscal year ended September 30, 2016, which have not been billed as of the time of this filing; (2) the review of excise tax calculations and preparation of excise tax returns for the calendar year ended December 31, 2016, which also have not yet been billed as of the time of this filing; (3) the use of a PFIC database supplied by Ernst & Young LLP for the fiscal year ended September 30, 2015 and the excise year ended December 31, 2015, and the semiannual period ended March 31, 2016; (4) the use of a Qualified Foreign Corporation (QFC) Database supplied by Ernst & Young LLP for the calendar year ended December 31, 2015; (5) the use of a Global Withholding Tax Reporter Database supplied by Ernst & Young LLP for the fiscal year ended September 30, 2016; and (6) the filing of reclaims of tax amounts withheld by foreign countries.
The fees shown in the table above for the fiscal year ended September 30, 2015 include fees for (1) the review and preparation of the Funds’ income tax returns for the fiscal year ended September 30, 2015; (2) the review of excise tax calculations and preparation of excise tax returns for the calendar year ended December 31, 2015; (3) the use of a PFIC database supplied by Ernst & Young LLP for the fiscal year ended September 30, 2014 and the excise year ended December 31, 2014, and the semiannual period ended March 31, 2015; (4) the use of a Qualified Foreign Corporation (QFC) Database supplied by Ernst & Young LLP for the calendar year ended December 31, 2014; (5) the use of a Global Withholding Tax Reporter Database supplied by Ernst & Young LLP for the fiscal year ended September 30, 2015; and (6) the filing of reclaims of tax amounts withheld by foreign countries
(d) None.
(e)(1) During its regularly scheduled periodic meetings, the registrant’s audit committee considers any requests to pre-approve any audit, audit-related, tax and other services to be provided by the principal accountants of the registrant. The audit committee has authorized its chairman to exercise that authority in the intervals between meetings; and the chairman presents any such pre-approvals to the audit committee at its next regularly scheduled meeting. Under paragraph (c)(7)(i)(C) of Rule 2-01 of Regulation S-X, pre-approval of non-audit services may be waived provided that: 1) the aggregate fees for all such services provided constitutes no more than five percent of the total amount of fees paid by the registrant to its principal accountant during the fiscal year in which services are provided, 2) such services were not recognized by the registrant at the time of engagement as non-audit services and 3) such services are promptly brought to the attention of the audit committee of the registrant and approved prior to the completion of the audit.
(e)(2) No services included in Items 4(b) – (d) above were approved pursuant to paragraph (c)(7)(i)(C) of Rule 2-01 of Regulation S-X.
(f) Not applicable.
(g) The aggregate fees for the fiscal years ended September 30, 2016 and September 30, 2015 by the registrant’s principal accountant for non-audit services rendered to the registrant are shown in the tables above and described under Items 4(b) – (d) above. For the registrant’s fiscal years ended September 30, 2016 and September 30, 2015, Ernst & Young LLP served as the registrant’s principal accountant and provided no services and billed no fees for non-audit services rendered to the registrant’s adviser or entities controlling, controlled by or under common control with the adviser.
(h) The audit committee of the registrant’s board of directors has considered whether the provision of non-audit services that were rendered to the registrant’s investment adviser, and any entity controlling, controlled by or under common control with the investment adviser that provides ongoing services to the registrant that were not pre-approved pursuant to paragraph (c)(7)(ii) of Rule 2-01 of Regulation S-X is compatible with maintaining the principal accountant’s independence. The provisions of Rule 2-01(c)(7) were effective on May 6, 2003. No such services were rendered on or after May 6, 2003.
Item 5. Audit Committee of Listed Registrants.
Not applicable.
Item 6. Schedule of Investments.
The Schedules of Investments in securities of unaffiliated issuers as of September 30, 2016 are included as part of the annual reports to shareholders filed under Item 1 of this Form N-CSR.
Item 7. Disclosure of Proxy Voting Policies and Procedures for Closed-End Management Investment Companies.
Not applicable.
Item 8. Portfolio Managers of Closed-End Management Investment Companies.
Not applicable.
Item 9. Purchases of Equity Securities by Closed-End Management Investment Company and Affiliated Purchasers.
Not applicable.
Item 10. Submission of Matters to a Vote of Security Holders.
No material changes to report.
Item 11. Controls and Procedures.
(a) The registrant’s principal executive and principal financial officers have concluded, based on an evaluation of the registrant’s disclosure controls and procedures (as defined in Rule 30a-3(c) under the Investment Company Act of 1940, the “Disclosure Controls”) as of a date within 90 days prior to the filing date (the “Filing Date”) of this Form N-CSR (the “Report”), that the Disclosure Controls are effectively designed to provide reasonable assurance that the information required to be disclosed by the registrant in the Report is recorded, processed, summarized and reported by the Filing Date, including ensuring that information required to be disclosed in the Report is accumulated and communicated to the registrant’s management, including the registrant’s principal executive officer and principal financial officer, as appropriate to allow timely decisions regarding required disclosure.
(b) There were no changes in the registrant’s internal controls over financial reporting (as defined in Rule 30a-3(d) under the Investment Company Act of 1940) that occurred during the second fiscal quarter of the period covered by this report that have materially affected, or are reasonably likely to materially affect, the registrant’s internal control over financial reporting.
Item 12. Exhibits.
| | | | |
(a) | | (1) | | Code of Ethics for Principal Executive Officer, Principal Financial Officer and Principal Accounting Officer (as referenced in Item 2 above), attached hereto as Exhibit (a)(1) |
| | |
| | (2) | | Certifications of Eric R. Colson, Principal Executive Officer and Gregory K. Ramirez, Principal Financial Officer pursuant to Rule 30a-2(a) under the Investment Company Act of 1940 (17 CFR 270.30a-2(a)), attached hereto as Exhibits (a)(2)(i) and (a)(2)(ii) |
| | |
(b) | | | | Certification of Eric R. Colson, Principal Executive Officer and Gregory K. Ramirez, Principal Financial Officer pursuant to Section 906 of the Sarbanes-Oxley Act of 2002, attached hereto as Exhibit (b) |
SIGNATURES
Pursuant to the requirements of the Securities Exchange Act of 1934 and the Investment Company Act of 1940, the registrant has duly caused this report to be signed on its behalf by the undersigned, thereunto duly authorized.
| | |
| Artisan Partners Funds, Inc. |
| |
| By: | | /s/ Eric R. Colson |
| | Eric R. Colson |
| | Principal Executive Officer |
| |
| Date: | | December 2, 2016 |
Pursuant to the requirements of the Securities Exchange Act of 1934 and the Investment Company Act of 1940, this report has been signed below by the following persons on behalf of the registrant and in the capacities and on the dates indicated.
| | |
|
| |
| By: | | /s/ Eric R. Colson |
| | Eric R. Colson |
| | Principal Executive Officer |
| |
| Date: | | December 2, 2016 |
|
|
| |
| By: | | /s/ Gregory K. Ramirez |
| | Gregory K. Ramirez |
| | Principal Financial Officer |
| |
| Date: | | December 2, 2016 |