UNITED STATES
SECURITIES AND EXCHANGE COMMISSION
Washington, D.C. 20549
FORMN-CSR
CERTIFIED SHAREHOLDER REPORT OF REGISTERED
MANAGEMENT INVESTMENT COMPANIES
Investment Company Act file number811-08932
Artisan Partners Funds, Inc.
(Exact name of registrant as specified in charter)
875 East Wisconsin Avenue, Suite 800
Milwaukee, Wisconsin 53202
(Address of principal executive offices) (Zip Code)
| | |
| Sarah A. Johnson | | John M. Loder |
| Artisan Partners Funds, Inc. | | Ropes & Gray LLP |
| 875 East Wisconsin Avenue, Suite 800 | | Prudential Tower, 800 Boylston Street |
| Milwaukee, Wisconsin 53202 | | Boston, Massachusetts 02199 |
(Name and address of agents for service)
Registrant’s telephone number, including area code:(414) 390-6100
Date of fiscal year end: 9/30
Date of reporting period: 9/30/19
FormN-CSR is to be used by management investment companies to file reports with the Commission not later than 10 days after the transmission to stockholders of any report that is required to be transmitted to stockholders under Rule30e-1 under the Investment Company Act of 1940 (17 CFR270.30e-1). The Commission may use the information provided on FormN-CSR in its regulatory, disclosure review, inspection, and policymaking roles.
A registrant is required to disclose the information specified by FormN-CSR, and the Commission will make this information public. A registrant is not required to respond to the collection of information contained in FormN-CSR unless the Form displays a currently valid Office of Management and Budget (“OMB”) control number. Please direct comments concerning the accuracy of the information collection burden estimate and any suggestions for reducing the burden to Secretary, Securities and Exchange Commission, 450 Fifth Street, NW, Washington, DC 20549-0609. The OMB has reviewed this collection of information under the clearance requirements of 44 U.S.C. § 3507.
Item 1. Report to Shareholders.
ARTISAN PARTNERS FUNDS
| | | | | | |
| | | Share Class |
| | | Investor | | Advisor | | Institutional |
Artisan Developing World Fund | | ARTYX | | APDYX | | APHYX |
Artisan Global Discovery Fund | | APFDX | | N/A | | N/A |
Artisan Global Equity Fund | | ARTHX | | N/A | | APHHX |
Artisan Global Opportunities Fund | | ARTRX | | APDRX | | APHRX |
Artisan Global Value Fund | | ARTGX | | APDGX | | APHGX |
Artisan High Income Fund | | ARTFX | | APDFX | | APHFX |
Artisan International Fund | | ARTIX | | APDIX | | APHIX |
Artisan International Small-Mid Fund | | ARTJX | | APDJX | | APHJX |
Artisan International Value Fund | | ARTKX | | APDKX | | APHKX |
Artisan Mid Cap Fund | | ARTMX | | APDMX | | APHMX |
Artisan Mid Cap Value Fund | | ARTQX | | APDQX | | APHQX |
Artisan Small Cap Fund | | ARTSX | | APDSX | | APHSX |
Artisan Sustainable Emerging Markets Fund | | ARTZX | | N/A | | APHEX |
Artisan Thematic Fund | | ARTTX | | APDTX | | N/A |
Artisan Value Fund | | ARTLX | | APDLX | | APHLX |
Beginning on March 31, 2021, as permitted by regulations adopted by the Securities and Exchange Commission (the “SEC”), paper copies of the Funds’ annual and semi-annual shareholder reports will no longer be sent by mail, unless you specifically request paper copies of the reports from the Funds or from your financial intermediary, such as a broker-dealer or bank. Instead, the reports will be made available online at http://hosted.rightprospectus.com/Artisan, and you will be notified by mail each time a report is posted and provided with a website link to access the report.
If you already elected to receive shareholder reports electronically, you will not be affected by this change and you need not take any action. You may elect to receive shareholder reports and other communications from a Fund electronically anytime by contacting your financial intermediary or, if you invest directly with a Fund, by calling 800.344.1770 or by enrolling on the Funds’ website at www.artisanpartners.com.
You may elect to receive all future reports in paper free of charge. If you invest through a financial intermediary, you can contact your financial intermediary to request that you continue to receive paper copies of your shareholder reports. If you invest directly with a Fund, you can call 800.344.1770 to let the Fund know you wish to continue receiving paper copies of your shareholder reports. Your election to receive reports in paper will apply to all Funds held in your account if you invest through your financial intermediary or all Funds held with the fund complex if you invest directly with a Fund.
TABLE OF CONTENTS
ARTISAN PARTNERS FUNDS
P.O. BOX 219322
KANSAS CITY, MO 64121-9322
This report and the audited financial statements contained herein are provided for the general information of the shareholders of Artisan Partners Funds. Before investing, investors should consider carefully each Fund’s investment objective, risks and charges and expenses. For a prospectus or summary prospectus, which contain that information and more information about each Fund, please call 800.344.1770 or visit our website atwww.artisanpartners.com. Read it carefully before you invest or send money.
Company discussions are for illustration only and are not intended as recommendations of individual stocks. The discussions present information about the companies believed to be accurate, and the views of the portfolio managers, as of September 30, 2019. That information and those views may change, and the Funds disclaim any obligation to advise shareholders of any such changes.
Artisan Partners Funds offered through Artisan Partners Distributors LLC, member FINRA.
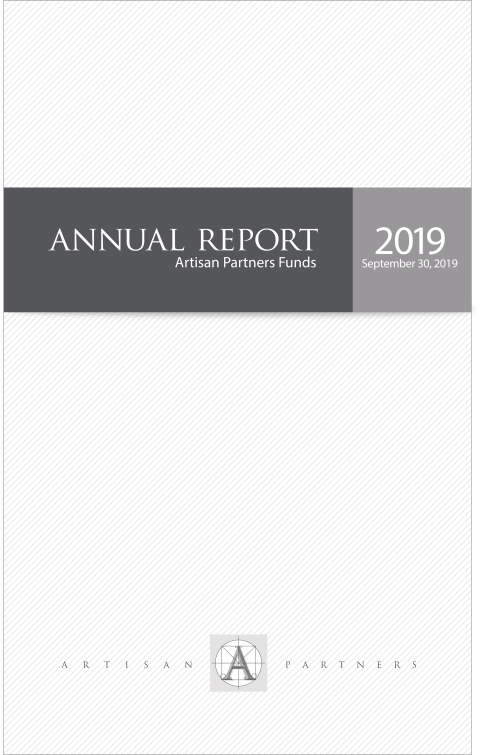
ARTISAN DEVELOPING WORLD FUND
PERFORMANCE HISTORY
GROWTH OF AN ASSUMED $10,000 INVESTMENT(6/29/2015 to 9/30/2019)
AVERAGE ANNUAL TOTAL RETURNS(as of 9/30/2019)
| | | | | | | | | | | | | | | |
| Fund / Index | | 1-Year | | 3-Year | | Since
Inception |
Artisan Developing World Fund – Investor Shares (6/29/2015) | | | | 20.33 | % | | | | 9.95 | % | | | | 8.17 | % |
Artisan Developing World Fund – Advisor Shares (6/29/2015) | | | | 20.59 | | | | | 10.15 | | | | | 8.38 | |
Artisan Developing World Fund – Institutional Shares (6/29/2015) | | | | 20.71 | | | | | 10.22 | | | | | 8.48 | |
MSCI Emerging Markets Index | | | | -2.02 | | | | | 5.97 | | | | | 3.48 | * |
| * | | As of Investor, Advisor and Institutional Shares inception date. |
The performance quoted represents past performance, which does not guarantee future results. The investment return and principal value of an investment in the Fund will fluctuate, so that an investor’s shares in the Fund, when redeemed, may be worth more or less than their original cost. Current performance may be lower or higher than the performance data quoted. For the most recent month-end performance, visit www.artisanpartners.com or call 800.344.1770. The table above does not reflect the deduction of taxes that a shareholder would pay on distributions or sale of Fund shares. See Notes on Management’s Discussion of Fund Performance and Portfolio Holdings’ Classification for a description of the index.
INVESTING ENVIRONMENT
During the one-year period ended September 30, 2019, global equities were mixed. Though emerging and European markets finished in slightly negative territory, US markets delivered positive results. Growing concerns over global economic growth dominated markets during the period, especially in the face of diverging direction on monetary policy, US-China trade tensions and uncertainty surrounding Brexit, in addition to a formal impeachment inquiry of President Trump late in the period.
SECTOR DIVERSIFICATION
| | | | | | | | | | |
| Sector | | 9/30/2018 | | 9/30/2019 |
Communication Services | | | | 14.3 | % | | | | 14.3 | % |
Consumer Discretionary | | | | 29.6 | | | | | 28.1 | |
Consumer Staples | | | | 15.7 | | | | | 14.6 | |
Financials | | | | 19.1 | | | | | 16.3 | |
Health Care | | | | 0.8 | | | | | 3.3 | |
Industrials | | | | 5.2 | | | | | 1.0 | |
Information Technology | | | | 9.5 | | | | | 16.4 | |
Real Estate | | | | 1.0 | | | | | – | |
Other assets less liabilities | | | | 4.8 | | | | | 6.0 | |
| | | | | 100.0 | % | | | | 100.0 | % |
PERFORMANCE DISCUSSION
Top contributors within the portfolio during the period included: US-based online trading site for Latin American markets MercadoLibre, Chinese premium spirits company Kweichow Moutai, Chinese educational services provider TAL Education, Singaporean provider of information technology services Sea and Brazilian stock exchange Brasil Bolsa Balcao. Bottom contributors during the period included: Chinese Internet search engine operator Baidu, US-based entertainment streaming business Netflix, Netherlands-based payment solutions provider Adyen, Indian premium motorcycle manufacturer Eicher Motors and US-based provider of safety, infotainment and electronic control components to the automotive market Aptiv.
REGION ALLOCATION
| | | | | | | | | | |
| Region | | 9/30/2018 | | 9/30/2019 |
Emerging Asia | | | | 46.4 | % | | | | 47.5 | % |
Developed Markets | | | | 28.7 | | | | | 30.8 | |
Latin America | | | | 13.3 | | | | | 11.8 | |
Europe, Middle East and Africa | | | | 6.8 | | | | | 4.0 | |
PORTFOLIO CHANGES
During the period, we identified the following new investment opportunities for the portfolio: Singaporean provider of information technology services Sea, US-based technology company NVIDIA, Netherlands-based payment solutions provider Adyen, Brazilian stock exchange Brasil Bolsa Balcao and Chinese pharmaceutical company Hengrui. We funded these purchases in part through exiting our positions in Unilever, Baidu, Hikvision, Aptiv and Eicher Motors.
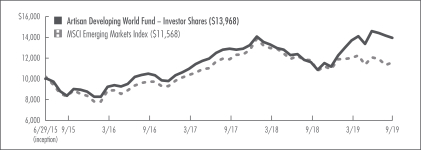
ARTISAN GLOBAL DISCOVERY FUND
PERFORMANCE HISTORY
GROWTH OF AN ASSUMED $10,000 INVESTMENT(8/21/2017 to 9/30/2019)
AVERAGE ANNUAL TOTAL RETURNS(as of 9/30/2019)
| | | | | | | | | | |
| Fund / Index | | 1-Year | | Since
Inception |
Artisan Global Discovery Fund – Investor Shares (8/21/2017) | | | | 7.98 | % | | | | 15.18 | % |
MSCI ACWI Index | | | | 1.38 | | | | | 6.95 | * |
| * | | As of Investor Shares inception date. |
The performance quoted represents past performance, which does not guarantee future results. The investment return and principal value of an investment in the Fund will fluctuate, so that an investor’s shares in the Fund, when redeemed, may be worth more or less than their original cost. Current performance may be lower or higher than the performance data quoted. For the most recent month-end performance, visit www.artisanpartners.com or call 800.344.1770. The graph and table above do not reflect the deduction of taxes that a shareholder would pay on distributions or sale of Fund shares.The Fund’s performance reflects Artisan Partners Limited Partnership’s (the “Adviser” or “Artisan Partners”) contractual agreement to limit the Fund’s expenses, which has had a material impact on performance and performance would have been lower in its absence. See Notes on Management’s Discussion of Fund Performance and Portfolio Holdings’ Classification for a description of the index.
INVESTING ENVIRONMENT
During the one-year period ended September 30, 2019, global equities were mixed. Though emerging and European markets finished in slightly negative territory, US markets delivered positive results. Growing concerns over global economic growth dominated markets during the period, especially in the face of diverging direction on monetary policy, US-China trade tensions and uncertainty surrounding Brexit, in addition to a formal impeachment inquiry of President Trump late in the period.
SECTOR DIVERSIFICATION
| | | | | | | | | | |
| Sector | | 9/30/2018 | | 9/30/2019 |
Communication Services | | | | 5.9 | % | | | | 4.9 | % |
Consumer Discretionary | | | | 11.7 | | | | | 7.2 | |
Consumer Staples | | | | 4.4 | | | | | 3.2 | |
Energy | | | | 3.8 | | | | | – | |
Financials | | | | 11.4 | | | | | 5.6 | |
Health Care | | | | 11.7 | | | | | 19.8 | |
Industrials | | | | 20.4 | | | | | 26.3 | |
Information Technology | | | | 27.7 | | | | | 24.4 | |
Materials | | | | – | | | | | 1.7 | |
Other assets less liabilities | | | | 3.0 | | | | | 6.9 | |
| | | | | 100.0 | % | | | | 100.0 | % |
PERFORMANCE DISCUSSION
Top contributors within the portfolio during the period included: US-based manufacturer of microbatteries Varta, Brazilian healthcare company Notre Dame Intermedica, US-based analytics software provider Tableau, US-based electronic transaction processing provider Global Payments and US-based cloud computing company Veeva Systems. Bottom contributors during the period included: US-based supplier of nuclear components and fuel to the US government BWX Technologies, US-based biopharmaceutical company Alexion, Canadian premium outerwear brand Canada Goose, US-based provider of workflow software utilized by public relations professionals Cision and US-based bank holding company Webster.
REGION ALLOCATION
| | | | | | | | | | |
| Region | | 9/30/2018 | | 9/30/2019 |
Americas | | | | 61.0 | % | | | | 55.8 | % |
Europe | | | | 22.4 | | | | | 26.7 | |
Pacific Basin | | | | 8.6 | | | | | 6.0 | |
Emerging Markets | | | | 5.0 | | | | | 4.6 | |
PORTFOLIO CHANGES
During the period, we identified the following new investment opportunities for the portfolio: Danish wind power company Vestas Wind Systems, the UK’s primary stock exchange London Stock Exchange Group, US-based provider of data center and cloud networking equipment Arista, UK-based luxury fashion house Burberry and Swiss supplier of pharmaceutical, healthcare and life science products Lonza Group. We funded these purchases in part through exiting our positions in Tableau, Webster, ASML, Noble Energy and Nintendo.
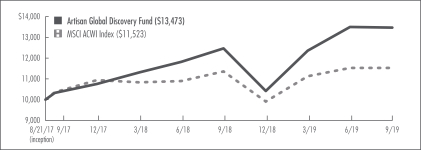
ARTISAN GLOBAL EQUITY FUND
PERFORMANCE HISTORY
GROWTH OF AN ASSUMED $10,000 INVESTMENT(3/29/2010 to 9/30/2019)
AVERAGE ANNUAL TOTAL RETURNS(as of 9/30/2019)
| | | | | | | | | | | | | | | | | | | | |
| Fund / Index | | 1-Year | | 3-Year | | 5-Year | | Since
Inception |
Artisan Global Equity Fund – Investor Shares (3/29/2010) | | | | 6.90 | % | | | | 13.81 | % | | | | 9.67 | % | | | | 11.84 | % |
Artisan Global Equity Fund – Institutional Shares (10/15/2015) | | | | 7.10 | | | | | 14.09 | | | | | n/a | | | | | 11.33 | |
MSCI ACWI Index | | | | 1.38 | | | | | 9.71 | | | | | 6.65 | | | | | 7.94 | * |
| * | | As of Investor Shares inception date. |
The performance quoted represents past performance, which does not guarantee future results. The investment return and principal value of an investment in the Fund will fluctuate, so that an investor’s shares in the Fund, when redeemed, may be worth more or less than their original cost. Current performance may be lower or higher than the performance data quoted. For the most recent month-end performance, visit www.artisanpartners.com or call 800.344.1770. The graph and table above do not reflect the deduction of taxes that a shareholder would pay on distributions or sale of Fund shares.The Investor Shares’ performance reflects Artisan Partners’ contractual agreement to limit the Fund’s expenses, which has had a material impact on performance and performance would have been lower in its absence. See Notes on Management’s Discussion of Fund Performance and Portfolio Holdings’ Classification for a description of the index.
INVESTING ENVIRONMENT
During the one-year period ended September 30, 2019, global equities were mixed. Though emerging and European markets finished in slightly negative territory, US markets delivered positive results. Growing concerns over global economic growth dominated markets during the period, especially in the face of diverging direction on monetary policy, US-China trade tensions and uncertainty surrounding Brexit, in addition to a formal impeachment inquiry of President Trump late in the period.
SECTOR DIVERSIFICATION
| | | | | | | | | | |
| Sector | | 9/30/2018 | | 9/30/2019 |
Communication Services | | | | 5.2 | % | | | | 5.9 | % |
Consumer Discretionary | | | | 0.1 | | | | | 7.5 | |
Consumer Staples | | | | 8.4 | | | | | 5.5 | |
Energy | | | | 3.5 | | | | | 3.3 | |
Financials | | | | 18.4 | | | | | 16.4 | |
Health Care | | | | 14.2 | | | | | 18.9 | |
Industrials | | | | 16.0 | | | | | 9.1 | |
Information Technology | | | | 24.3 | | | | | 26.5 | |
Materials | | | | 5.9 | | | | | 4.0 | |
Utilities | | | | 0.6 | | | | | – | |
Other assets less liabilities | | | | 3.4 | | | | | 2.9 | |
| | | | | 100.0 | % | | | | 100.0 | % |
PERFORMANCE DISCUSSION
Top contributors within the portfolio during the period included: Brazilian oil and natural gas supplier Petrobras, German gases and engineering company Linde, Germany-based European exchange operator Deutsche Boerse, the UK’s primary stock exchange London Stock Exchange Group andUS-based operator of global commodity and financial markets Intercontinental Exchange. Bottom contributors during the period included: German Internet payment and processing services provider Wirecard, US-based radiation therapy technology developer ViewRay, US-based developer and manufacturer of defense and security solutions company Raytheon, US-based biopharmaceutical company Bristol-Myers Squibb and Netherlands-based diversified financial services provider ING.
REGION ALLOCATION
| | | | | | | | | | |
| Region | | 9/30/2018 | | 9/30/2019 |
Americas | | | | 47.2 | % | | | | 49.4 | % |
Europe | | | | 40.8 | | | | | 36.1 | |
Pacific Basin | | | | 3.6 | | | | | 6.8 | |
Emerging Markets | | | | 5.0 | | | | | 4.8 | |
PORTFOLIO CHANGES
During the period, we identified the following new investment opportunities for the portfolio: US-based provider of payment processing and information management solutions WEX, US-based online retailer Amazon.com, US-based biopharmaceutical company ACADIA Pharmaceuticals, US-based discount retail store operator Dollar Tree and Japan-based developer and manufacturer of medical, industrial and semiconductor equipment as well as scientific and metrology instruments Jeol. We funded these purchases in part through exiting our positions in Raytheon, Elekta, Abbott Laboratories, Johnson & Johnson and Air Liquide.
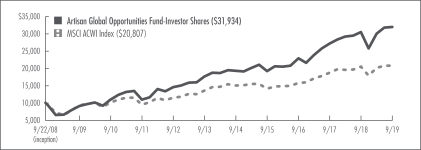
ARTISAN GLOBAL OPPORTUNITIES FUND
PERFORMANCE HISTORY
GROWTH OF AN ASSUMED $10,000 INVESTMENT(9/22/2008 to 9/30/2019)
AVERAGE ANNUAL TOTAL RETURNS(as of 9/30/2019)
| | | | | | | | | | | | | | | | | | | | | | | | | |
| Fund / Index | | 1-Year | | 3-Year | | 5-Year | | 10-Year | | Since
Inception |
Artisan Global Opportunities Fund – Investor Shares (9/22/2008) | | | | 4.85 | % | | | | 11.67 | % | | | | 10.58 | % | | | | 13.33 | % | | | | 11.11 | % |
Artisan Global Opportunities Fund – Advisor Shares (4/1/2015) | | | | 5.03 | | | | | 11.82 | | | | | n/a | | | | | n/a | | | | | 11.02 | |
Artisan Global Opportunities Fund – Institutional Shares (7/26/2011) | | | | 5.11 | | | | | 11.93 | | | | | 10.84 | | | | | n/a | | | | | 11.32 | |
MSCI ACWI Index | | | | 1.38 | | | | | 9.71 | | | | | 6.65 | | | | | 8.35 | | | | | 6.87 | * |
| * | As of Investor Shares inception date. |
The performance quoted represents past performance, which does not guarantee future results. The investment return and principal value of an investment in the Fund will fluctuate, so that an investor’s shares in the Fund, when redeemed, may be worth more or less than their original cost. Current performance may be lower or higher than the performance data quoted. For the most recent month-end performance, visit www.artisanpartners.com or call 800.344.1770. The graph and table above do not reflect the deduction of taxes that a shareholder would pay on distributions or sale of Fund shares. The Investor Shares’ and Advisor Shares’ performance reflects Artisan Partners’ contractual agreement to limit the Fund’s expenses, which has had a material impact on performance and performance would have been lower in its absence. See Notes on Management’s Discussion of Fund Performance and Portfolio Holdings’ Classification for a description of the index.
INVESTING ENVIRONMENT
During the one-year period ended September 30, 2019, global equities were mixed. Though emerging and European markets finished in slightly negative territory, US markets delivered positive results. Growing concerns over global economic growth dominated markets during the period, especially in the face of diverging direction on monetary policy, US-China trade tensions and uncertainty surrounding Brexit, in addition to a formal impeachment inquiry of President Trump late in the period.
SECTOR DIVERSIFICATION
| | | | | | | | | | |
| Sector | | 9/30/2018 | | 9/30/2019 |
Communication Services | | | | 10.5 | % | | | | 7.1 | % |
Consumer Discretionary | | | | 14.8 | | | | | 10.7 | |
Consumer Staples | | | | 7.1 | | | | | 3.2 | |
Energy | | | | 5.3 | | | | | – | |
Financials | | | | 11.8 | | | | | 8.7 | |
Health Care | | | | 13.3 | | | | | 22.0 | |
Industrials | | | | 9.0 | | | | | 17.0 | |
Information Technology | | | | 22.8 | | | | | 22.2 | |
Materials | | | | 1.2 | | | | | 1.4 | |
Utilities | | | | – | | | | | 1.4 | |
Other assets less liabilities | | | | 4.2 | | | | | 6.3 | |
| | | | | 100.0 | % | | | | 100.0 | % |
PERFORMANCE DISCUSSION
Top contributors within the portfolio during the period included: US-based processing and technology services company IHS Markit, US-based online payments processing company Worldpay, the UK’s primary stock exchange London Stock Exchange Group, US-based defense, communications and electronics equipment provider L3Harris and Australian enterprise software designer and developer Atlassian. Bottom contributors during the period included: UK-based manufacturer of premium carbonated mixers Fevertree Drinks, US-based developer and publisher of interactive entertainment Activision Blizzard, Spanish global distribution systems provider for airlines Amadeus IT Group, US-based oil and gas exploration and production company Pioneer Natural Resources and Japanese cosmetic and toiletry products manufacturer Shiseido.
REGION ALLOCATION
| | | | | | | | | | |
| Region | | 9/30/2018 | | 9/30/2019 |
Americas | | | | 49.7 | % | | | | 54.4 | % |
Europe | | | | 25.6 | | | | | 25.7 | |
Pacific Basin | | | | 15.1 | | | | | 7.9 | |
Emerging Markets | | | | 5.4 | | | | | 5.7 | |
PORTFOLIO CHANGES
During the period, we identified the following new investment opportunities for the portfolio: US-based software provider Microsoft, US-based defense, communications and electronics equipment provider L3Harris Technologies, US-based provider of microprocessors for PCs and servers, graphics processors and processors for several game consoles Advanced Micro Devices, US-based provider of data center and cloud networking equipment Arista and Danish wind power company Vestas Wind Systems. We funded these purchases in part through exiting our positions in Pioneer Natural Resources, Shiseido, Nintendo, Noble Energy and ASML.
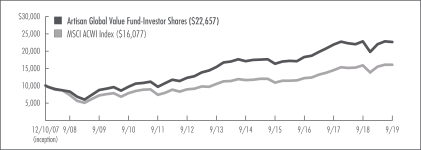
ARTISAN GLOBAL VALUE FUND
PERFORMANCE HISTORY
GROWTH OF AN ASSUMED $10,000 INVESTMENT(12/10/2007 to 9/30/2019)
AVERAGE ANNUAL TOTAL RETURNS(as of 9/30/2019)
| | | | | | | | | | | | | | | | | | | | | | | | | |
| Fund / Index | | 1-Year | | 3-Year | | 5-Year | | 10-Year | | Since
Inception |
Artisan Global Value Fund – Investor Shares (12/10/2007) | | | | -0.50 | % | | | | 7.52 | % | | | | 5.88 | % | | | | 10.04 | % | | | | 7.17 | % |
Artisan Global Value Fund – Advisor Shares (4/1/2015) | | | | -0.40 | | | | | 7.66 | | | | | n/a | | | | | n/a | | | | | 5.96 | |
Artisan Global Value Fund – Institutional Shares (7/17/2012) | | | | -0.30 | | | | | 7.76 | | | | | 6.11 | | | | | n/a | | | | | 10.31 | |
MSCI ACWI Index | | | | 1.38 | | | | | 9.71 | | | | | 6.65 | | | | | 8.35 | | | | | 4.10 | * |
| * | | As of Investor Shares inception date. |
The performance quoted represents past performance, which does not guarantee future results. The investment return and principal value of an investment in the Fund will fluctuate, so that an investor’s shares in the Fund, when redeemed, may be worth more or less than their original cost. Current performance may be lower or higher than the performance data quoted. For the most recent month-end performance information, visit www.artisanpartners.com or call 800.344.1770. The graph and table above do not reflect the deduction of taxes that a shareholder would pay on distributions or sale of Fund shares. The Investor Shares’ performance reflects Artisan Partners’ contractual agreement to limit the Fund’s expenses, which has had a material impact on performance and performance would have been lower in its absence. See Notes on Management’s Discussion of Fund Performance and Portfolio Holdings’ Classification for a description of the index.
| | |
| 10 | | Artisan Partners Funds |
INVESTING ENVIRONMENT
During the one-year period ended September 30, 2019, global equities were mixed. Though emerging and European markets finished in slightly negative territory, US markets delivered positive results. Growing concerns over global economic growth dominated markets during the period, especially in the face of diverging direction on monetary policy, US-China trade tensions and uncertainty surrounding Brexit, in addition to a formal impeachment inquiry of President Trump late in the period.
SECTOR DIVERSIFICATION
| | | | | | | | | | |
| Sector | | 9/30/2018 | | 9/30/2019 |
Communication Services | | | | 10.8 | % | | | | 11.7 | % |
Consumer Discretionary | | | | 8.6 | | | | | 12.0 | |
Consumer Staples | | | | 6.0 | | | | | 4.0 | |
Energy | | | | 2.2 | | | | | 1.6 | |
Financials | | | | 30.6 | | | | | 31.5 | |
Health Care | | | | 9.8 | | | | | 7.8 | |
Industrials | | | | 8.9 | | | | | 10.8 | |
Information Technology | | | | 13.1 | | | | | 14.0 | |
Materials | | | | 1.5 | | | | | – | |
Other assets less liabilities | | | | 8.5 | | | | | 6.6 | |
| | | | | 100.0 | % | | | | 100.0 | % |
PERFORMANCE DISCUSSION
Top contributors within the portfolio during the period included: Brazilian telecommunications company Telefonica Brasil, US-based dental supply manufacturer DENTSPLY SIRONA, US-based insurance company Arch Capital, Netherlands-based global semiconductor manufacturer NXP Semiconductors and US-based professional services firm Marsh & McLennan. Bottom contributors during the period included: Chinese Internet search engine operator Baidu, US-based package and freight delivery company FedEx, US-based wireless communications equipment manufacturer QUALCOMM, Swiss financial services provider UBS Group and US-based engineering and construction firm Fluor.
REGION ALLOCATION
| | | | | | | | | | |
| Region | | 9/30/2018 | | 9/30/2019 |
Americas | | | | 47.5 | % | | | | 53.8 | % |
Europe | | | | 29.1 | | | | | 29.0 | |
Emerging Markets | | | | 13.5 | | | | | 10.6 | |
Pacific Basin | | | | 1.4 | | | | | – | |
PORTFOLIO CHANGES
During the period, we identified the following new investment opportunities for the portfolio: US-based social networking website operator Facebook, US-based IT services vendor Cognizant Technology Solutions, US-based provider of online travel and related services Booking Holdings, UK-based defense, security and aerospace company BAE Systems and US-based insurance company Wells Fargo. We funded these purchases in part through exiting our positions in QUALCOMM, GlaxoSmithKline, Johnson & Johnson, LafargeHolcim and ISS.
| | |
| Artisan Partners Funds | | 11 |
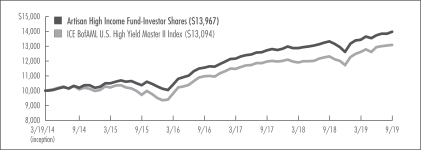
ARTISAN HIGH INCOME FUND
PERFORMANCE HISTORY
GROWTH OF AN ASSUMED $10,000 INVESTMENT(3/19/2014 to 9/30/2019)
AVERAGE ANNUAL TOTAL RETURNS(as of 9/30/2019)
| | | | | | | | | | | | | | | | | | | | |
| Fund / Index | | 1-Year | | 3-Year | | 5-Year | | Since
Inception |
Artisan High Income Fund – Investor Shares (3/19/2014) | | | | 4.81 | % | | | | 6.48 | % | | | | 6.47 | % | | | | 6.22 | % |
Artisan High Income Fund – Advisor Shares (3/19/2014) | | | | 4.98 | | | | | 6.66 | | | | | 6.65 | | | | | 6.39 | |
Artisan High Income Fund – Institutional Shares (10/3/2016) | | | | 5.08 | | | | | n/a | | | | | n/a | | | | | 6.67 | |
ICE BofAML U.S. High Yield Master II Index | | | | 6.30 | | | | | 6.07 | | | | | 5.36 | | | | | 4.99 | * |
| * | | As of Investor and Advisor Shares inception date. |
The performance quoted represents past performance, which does not guarantee future results. The investment return and principal value of an investment in the Fund will fluctuate, so that an investor’s shares in the Fund, when redeemed, may be worth more or less than their original cost. Current performance may be lower or higher than the performance data quoted. For the most recent month-end performance, visit www.artisanpartners.com or call 800.344.1770. The graph and table above does not reflect the deduction of taxes that a shareholder would pay on distributions or sale of Fund shares.The performance shown does not reflect the deduction of a 2% redemption fee on shares held by an investor for 90 days or less and, if reflected, the fee would reduce the performance quoted. Unlike the Index, the Fund may hold loans and other security types. At times, this can cause material differences in relative performance. See Notes on Management’s Discussion of Fund Performance and Portfolio Holdings’ Classification for a description of the index.
| | |
| 12 | | Artisan Partners Funds |
INVESTING ENVIRONMENT
Non-investment grade credit markets posted broadly positive returns during the12-month period ended September 30, 2019. Risk sentiment was buoyed by a global shift to more accommodative monetary policy amid persistent global growth fears. While the investing environment was marked by an uptick in risk asset volatility, credit markets were propelled by a combination of strong fundamentals and favorable supply/demand dynamics.
PERFORMANCE DISCUSSION
Top contributors within the portfolio during the period included: US-based multinational conglomerate General Electric, US-based telecommunications and mass media company Charter Communications, UK-based independent insurance broker Ardonagh Group, US-based lender Springleaf Finance and US-based wireless network operator T-Mobile USA. Bottom contributors during the period included: US-based oil and gas company E&P EP Energy, US-based multi-brand specialty retailer J Crew Group, US-based agricultural products and service provider Pinnacle Operating Corp, US-based independent energy company Halcon Resources Group and US-based women’s retailer Ascena Retail Group. The use of derivatives, including U.S. Treasury futures used as a hedge on interest rates, had a negative overall impact on performance during the period.
PORTFOLIO COMPOSITION
| | | | | | | | | | |
| Type | | 9/30/2018 | | 9/30/2019 |
Corporate Bonds | | | | 71.0 | % | | | | 64.0 | % |
Bank Loans | | | | 22.5 | | | | | 28.7 | |
Convertible Debentures | | | | 0.5 | | | | | – | |
Preferred Stocks | | | | 0.2 | | | | | 0.1 | |
Common Stock | | | | 0.1 | | | | | 0.0 | † |
Other assets less liabilities | | | | 5.7 | | | | | 7.2 | |
| | | | | 100.0 | % | | | | 100.0 | % |
| † | | Amount rounds to less than 0.1% |
PORTFOLIO CHANGES
During the period, we identified the following new investment opportunities for the portfolio: US-based multinational conglomerate General Electric, US-based real estate and relocation services provider Realogy Group, Malta-based private aviation company VistaJet, US-based REIT operator Uniti Group and US-based car manufacturer Tesla. We funded these purchases in part through exiting our positions in First Data Corp, York Risk Services, Iron Mountain, Compass Group and Service Master.
| | |
| Artisan Partners Funds | | 13 |
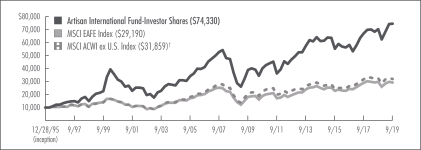
ARTISAN INTERNATIONAL FUND
PERFORMANCE HISTORY
GROWTH OF AN ASSUMED $10,000 INVESTMENT(12/28/1995 to 9/30/2019)
AVERAGE ANNUAL TOTAL RETURNS(as of 9/30/2019)
| | | | | | | | | | | | | | | | | | | | | | | | | |
| Fund / Index | | 1-Year | | 3-Year | | 5-Year | | 10-Year | | Since
Inception |
Artisan International Fund – Investor Shares (12/28/1995) | | | | 6.29 | % | | | | 8.61 | % | | | | 4.08 | % | | | | 6.77 | % | | | | 8.81 | % |
Artisan International Fund – Advisor Shares (4/1/2015) | | | | 6.46 | | | | | 8.76 | | | | | n/a | | | | | n/a | | | | | 3.62 | |
Artisan International Fund – Institutional Shares (7/1/1997) | | | | 6.52 | | | | | 8.84 | | | | | 4.31 | | | | | 7.01 | | | | | 7.82 | |
MSCI EAFE Index | | | | -1.34 | | | | | 6.48 | | | | | 3.27 | | | | | 4.90 | | | | | 4.61 | * |
MSCI ACWI ex U.S. Index† | | | | -1.23 | | | | | 6.33 | | | | | 2.90 | | | | | 4.45 | | | | | 5.00 | * |
| * | | As of Investor Shares inception date. |
| † | | The performance of the Index represents linked performance data for the MSCI ACWI ex U.S. (Gross) Index from inception to 12/31/2000 and the MSCI ACWI ex U.S. (Net) Index from 1/1/2001 forward. |
The performance quoted represents past performance, which does not guarantee future results. The investment return and principal value of an investment in the Fund will fluctuate, so that an investor’s shares in the Fund, when redeemed, may be worth more or less than their original cost. Current performance may be lower or higher than the performance data quoted. For the most recent month-end performance, visit www.artisanpartners.com or call 800.344.1770. The graph and table above do not reflect the deduction of taxes that a shareholder would pay on distributions or sale of Fund shares. See Notes on Management’s Discussion of Fund Performance and Portfolio Holdings’ Classification for a description of each index.
| | |
| 14 | | Artisan Partners Funds |
INVESTING ENVIRONMENT
During the one-year period ended September 30, 2019, global equities were mixed. Though emerging and European markets finished in slightly negative territory, US markets delivered positive results. Growing concerns over global economic growth dominated markets during the period, especially in the face of diverging direction on monetary policy, US-China trade tensions and uncertainty surrounding Brexit, in addition to a formal impeachment inquiry of President Trump late in the period.
SECTOR DIVERSIFICATION
| | | | | | | | | | |
| Sector | | 9/30/2018 | | 9/30/2019 |
Communication Services | | | | 0.2 | % | | | | 2.2 | % |
Consumer Discretionary | | | | – | | | | | 4.2 | |
Consumer Staples | | | | 10.9 | | | | | 6.1 | |
Energy | | | | 3.2 | | | | | 4.1 | |
Financials | | | | 27.5 | | | | | 30.2 | |
Health Care | | | | 9.5 | | | | | 11.6 | |
Industrials | | | | 22.0 | | | | | 15.7 | |
Information Technology | | | | 7.8 | | | | | 7.9 | |
Materials | | | | 13.0 | | | | | 14.8 | |
Utilities | | | | 0.8 | | | | | – | |
Other assets less liabilities | | | | 5.1 | | | | | 3.2 | |
| | | | | 100.0 | % | | | | 100.0 | % |
PERFORMANCE DISCUSSION
Top contributors within the portfolio during the period included: Swiss multinational packaged food provider Nestle, German gases and engineering company Linde, Germany-based European exchange operator Deutsche Boerse, Brazilian oil and natural gas supplier Petrobras and the UK’s primary stock exchange London Stock Exchange Group. Bottom contributors during the period included: German Internet payment and processing services provider Wirecard, UK-based manufacturer of several medical products and technologies in the areas of wound management and skin care ConvaTec, Irish low-cost airline Ryanair Holdings, Netherlands-based diversified financial services provider ING and Swiss distributor of HVAC products Ferguson.
REGION ALLOCATION
| | | | | | | | | | |
| Region | | 9/30/2018 | | 9/30/2019 |
Europe | | | | 72.0 | % | | | | 65.7 | % |
Americas | | | | 10.3 | | | | | 14.5 | |
Emerging Markets | | | | 7.2 | | | | | 8.0 | |
Pacific Basin | | | | 5.4 | | | | | 8.0 | |
Middle East | | | | – | | | | | 0.6 | |
PORTFOLIO CHANGES
During the period, we identified the following new investment opportunities for the portfolio: US-based Internet search engine operator Alphabet, US-based online retailer Amazon.com, UK-based provider of a range of insurance brokerage, reinsurance and risk management consulting services Willis Towers Watson, UK-based alcoholic beverage producer Diageo and US-based operator of global commodity and financial markets Intercontinental Exchange. We funded these purchases in part through exiting our positions in Canadian Pacific Railway, Ferguson, Anheuser-Busch, Henkel and Sonova Holding.
| | |
| Artisan Partners Funds | | 15 |
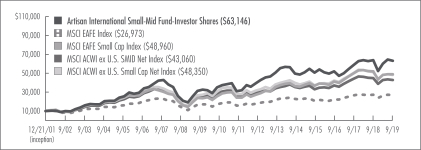
ARTISAN INTERNATIONAL SMALL-MID FUND
PERFORMANCE HISTORY
GROWTH OF AN ASSUMED $10,000 INVESTMENT(12/21/2001 to 9/30/2019)
AVERAGE ANNUAL TOTAL RETURNS(as of 9/30/2019)
| | | | | | | | | | | | | | | | | | | | | | | | | |
| Fund / Index | | 1-Year | | 3-Year | | 5-Year | | 10-Year | | Since
Inception |
Artisan International Small-Mid Fund – Investor Shares (12/21/2001) | | | | -1.38 | % | | | | 6.63 | % | | | | 4.86 | % | | | | 7.28 | % | | | | 10.92 | % |
Artisan International Small-Mid Fund – Advisor Shares (12/4/2018) | | | | n/a | | | | | n/a | | | | | n/a | | | | | n/a | | | | | 14.36 | (1) |
Artisan International Small-Mid Fund – Institutional Shares (4/12/2016) | | | | -1.18 | | | | | 6.85 | | | | | n/a | | | | | n/a | | | | | 6.76 | |
MSCI ACWI ex U.S. SMID Net Index(2) | | | | -4.54 | | | | | 5.03 | | | | | 3.90 | | | | | 5.69 | | | | | 8.56 | * |
MSCI ACWI ex U.S. Small Cap Net Index(3) | | | | -5.63 | | | | | 4.64 | | | | | 3.98 | | | | | 6.13 | | | | | 9.27 | * |
MSCI EAFE Index | | | | -1.34 | | | | | 6.48 | | | | | 3.27 | | | | | 4.90 | | | | | 5.74 | * |
MSCI EAFE Small Cap Index | | | | -5.93 | | | | | 5.94 | | | | | 6.02 | | | | | 7.45 | | | | | 9.35 | * |
| * | | As of Investor Shares inception date. |
| (1) | | For the period from commencement of operations 12/4/2018 through 9/30/2019; not annualized. |
| (2) | | Effective December 4, 2018, the Fund’s primary benchmark was changed from the MSCI EAFE Index to the MSCI ACWI ex U.S. SMID Net Index, which provides a more appropriate comparison in light of the Fund’s investment strategy. |
| (3) | | Effective December 4, 2018, the Fund’s secondary benchmark was changed from the MSCI EAFE Small Cap Index to the MSCI ACWI ex U.S. Small Cap Net Index, which provides a more appropriate comparison in light of the Fund’s investment strategy. |
Effective December 4, 2018, the Fund’s principal investment strategies changed to reflect, among other things, greater flexibility to invest in small- and medium-sized companies. The Fund’s performance prior to December 4, 2018 would have been different if the Fund were managed using the current investment strategies. The performance quoted represents past performance, which does not guarantee future results. The investment return and principal value of an investment in the Fund will fluctuate, so that an investor’s shares in the Fund, when redeemed, may be worth more or less than their original cost. Current performance may be lower or higher than the performance data quoted. For the most recent month-end performance, visit www.artisanpartners.com or call 800.344.1770. The graph and table above do not reflect the deduction of taxes that a shareholder would pay on distributions or sale of Fund shares. See Notes on Management’s Discussion of Fund Performance and Portfolio Holdings’ Classification for a description of each index.
| | |
| 16 | | Artisan Partners Funds |
INVESTING ENVIRONMENT
During the one-year period ended September 30, 2019, global equities were mixed. Though emerging and European markets finished in slightly negative territory, US markets delivered positive results. Growing concerns over global economic growth dominated markets during the period, especially in the face of diverging direction on monetary policy, US-China trade tensions and uncertainty surrounding Brexit, in addition to a formal impeachment inquiry of President Trump late in the period.
SECTOR DIVERSIFICATION
| | | | | | | | | | |
| Sector | | 9/30/2018 | | 9/30/2019 |
Communication Services | | | | 6.4 | % | | | | 2.5 | % |
Consumer Discretionary | | | | 11.5 | | | | | 9.5 | |
Consumer Staples | | | | 1.6 | | | | | 8.8 | |
Financials | | | | 18.2 | | | | | 3.5 | |
Health Care | | | | 14.8 | | | | | 24.8 | |
Industrials | | | | 13.2 | | | | | 16.9 | |
Information Technology | | | | 17.0 | | | | | 26.8 | |
Materials | | | | 2.4 | | | | | 2.7 | |
Real Estate | | | | 4.4 | | | | | 1.2 | |
Other assets less liabilities | | | | 10.5 | | | | | 3.3 | |
| | | | | 100.0 | % | | | | 100.0 | % |
PERFORMANCE DISCUSSION
Top contributors within the portfolio during the period included: Israel-based manufacturer and distributer of smart energy solutions SolarEdge Technologies, US-based biopharmaceutical company ACADIA Pharmaceuticals, Israel-based provider of cloud-based and on-premise enterprise software solutions Nice, Israel-based manufacturer of high-performance interconnect solutions for data centers Mellanox Technologies and Japanese provider of ERP (enterprise resource planning) system software for SMEs (small- & medium-sized enterprises) Obic. Bottom contributors during the period included: Swedish provider of synthetic magnetic resonance imaging solutions SyntheticMR, Japanese online delivery service Yume No Machi, US-based radiation therapy technology developer ViewRay, Israel-based generics- and neurology-focused global pharmaceutical company Teva Pharmaceutical Industries and Irish hotel group that owns and operates hotels in Ireland and the UK Dalata Hotel Group.
REGION ALLOCATION
| | | | | | | | | | |
| Region | | 9/30/2018 | | 9/30/2019 |
Europe | | | | 69.8 | % | | | | 48.0 | % |
Pacific Basin | | | | 9.0 | | | | | 22.3 | |
Americas | | | | 6.9 | | | | | 16.2 | |
Emerging Markets | | | | 3.8 | | | | | 4.9 | |
Middle East | | | | – | | | | | 5.3 | |
PORTFOLIO CHANGES
During the period, we identified the following new investment opportunities for the portfolio: Israel-based provider of cloud-based and on-premise enterprise software solutions Nice, Swiss developer, producer and distributor of laboratory instruments and solutions Tecan Group, Japanese courier service company SG, Japanese provider of ERP (enterprise resource planning) system software for SMEs (small- & medium-sized enterprises) Obic and US-based manufacturer and marketer of lighting-class LEDs, lighting products and products for power and radio frequency applications Cree. We funded these purchases in part through exiting our positions in InterXion Holding, NEX Group, Wirecard, Euronext and Cellnex Telecom.
| | |
| Artisan Partners Funds | | 17 |
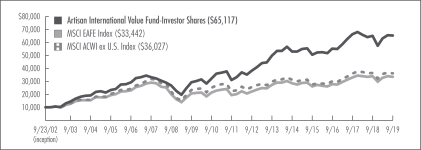
ARTISAN INTERNATIONAL VALUE FUND
PERFORMANCE HISTORY
GROWTH OF AN ASSUMED $10,000 INVESTMENT(9/23/2002 to 9/30/2019)
AVERAGE ANNUAL TOTAL RETURNS(as of 9/30/2019)
| | | | | | | | | | | | | | | | | | | | | | | | | |
| Fund / Index | | 1-Year | | 3-Year | | 5-Year | | 10-Year | | Since
Inception |
Artisan International Value Fund – Investor Shares (9/23/2002) | | | | 0.38 | % | | | | 5.75 | % | | | | 4.21 | % | | | | 8.34 | % | | | | 11.64 | % |
Artisan International Value Fund – Advisor Shares (4/1/2015) | | | | 0.52 | | | | | 5.90 | | | | | n/a | | | | | n/a | | | | | 3.97 | |
Artisan International Value Fund – Institutional Shares (10/1/2006) | | | | 0.63 | | | | | 5.99 | | | | | 4.45 | | | | | 8.58 | | | | | 6.57 | |
MSCI EAFE Index | | | | -1.34 | | | | | 6.48 | | | | | 3.27 | | | | | 4.90 | | | | | 7.35 | * |
MSCI ACWI ex U.S. Index | | | | -1.23 | | | | | 6.33 | | | | | 2.90 | | | | | 4.45 | | | | | 7.82 | * |
| * | | As of Investor Shares inception date. |
The performance quoted represents past performance, which does not guarantee future results. The investment return and principal value of an investment in the Fund will fluctuate, so that an investor’s shares in the Fund, when redeemed, may be worth more or less than their original cost. Current performance may be lower or higher than the performance data quoted. For the most recent month-end performance, visit www.artisanpartners.com or call 800.344.1770. The graph and table above do not reflect the deduction of taxes that a shareholder would pay on distributions or sale of Fund shares. See Notes on Management’s Discussion of Fund Performance and Portfolio Holdings’ Classification for a description of each index.
| | |
| 18 | | Artisan Partners Funds |
INVESTING ENVIRONMENT
During the one-year period ended September 30, 2019, global equities were mixed. Though emerging and European markets finished in slightly negative territory, US markets delivered positive results. Growing concerns over global economic growth dominated markets during the period, especially in the face of diverging direction on monetary policy, US-China trade tensions and uncertainty surrounding Brexit, in addition to a formal impeachment inquiry of President Trump late in the period.
SECTOR DIVERSIFICATION
| | | | | | | | | | |
| Sector | | 9/30/2018 | | 9/30/2019 |
Communication Services | | | | 10.7 | % | | | | 10.2 | % |
Consumer Discretionary | | | | 9.7 | | | | | 11.5 | |
Consumer Staples | | | | 7.7 | | | | | 7.0 | |
Energy | | | | 3.2 | | | | | 2.4 | |
Financials | | | | 22.3 | | | | | 21.3 | |
Health Care | | | | 8.7 | | | | | 5.0 | |
Industrials | | | | 11.0 | | | | | 11.0 | |
Information Technology | | | | 11.3 | | | | | 12.2 | |
Materials | | | | 2.3 | | | | | 4.5 | |
Other assets less liabilities | | | | 13.1 | | | | | 14.9 | |
| | | | | 100.0 | % | | | | 100.0 | % |
PERFORMANCE DISCUSSION
Top contributors within the portfolio during the period included: US-based insurance company Arch Capital Group, Brazilian telecommunications company Telefonica Brasil, Switzerland-based global provider of forwarding and logistics services, specializing in intercontinental air freight and ocean freight shipments Panalpina Welttransport, UK-based catering service provider Compass Group and Swiss multinational packaged food provider Nestle. Bottom contributors during the period included: Chinese Internet search engine operator Baidu, Swiss financial services provider UBS Group, Spanish bank Bankia, Swiss provider of power and automation technologies ABB and Canadian oil and gas company Imperial Oil.
REGION ALLOCATION
| | | | | | | | | | |
| Region | | 9/30/2018 | | 9/30/2019 |
Europe | | | | 55.5 | % | | | | 55.8 | % |
Emerging Markets | | | | 16.4 | | | | | 18.4 | |
Americas | | | | 13.6 | | | | | 10.3 | |
Pacific Basin | | | | 1.4 | | | | | 0.6 | |
PORTFOLIO CHANGES
During the period, we identified the following new investment opportunities for the portfolio: German-based designer, manufacturer and distributor of dialysis equipment and supplier and provider of essential kidney dialysis services Fresenius Medical Care, Irish global building materials company CRH, UK-based provider of a range of insurance brokerage, reinsurance and risk management consulting services Willis Towers Watson, UK-based consumer goods company Reckitt Benckiser Group and German developer and manufacturer of lighting, electronic components and systems Hella. We funded these purchases in part through exiting our positions in Medtronic, Aon, GlaxoSmithKline, Carlsberg and Allergan.
| | |
| Artisan Partners Funds | | 19 |
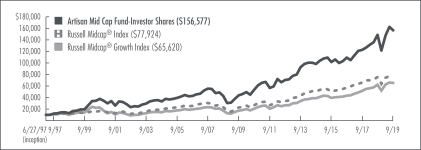
ARTISAN MID CAP FUND
PERFORMANCE HISTORY
GROWTH OF AN ASSUMED $10,000 INVESTMENT(6/27/1997 to 9/30/2019)
AVERAGE ANNUAL TOTAL RETURNS(as of 9/30/2019)
| | | | | | | | | | | | | | | | | | | | | | | | | |
| Fund / Index | | 1-Year | | 3-Year | | 5-Year | | 10-Year | | Since
Inception |
Artisan Mid Cap Fund – Investor Shares (6/27/1997) | | | | 5.11 | % | | | | 12.62 | % | | | | 9.76 | % | | | | 13.51 | % | | | | 13.15 | % |
Artisan Mid Cap Fund – Advisor Shares (4/1/2015) | | | | 5.36 | | | | | 12.81 | | | | | n/a | | | | | n/a | | | | | 8.99 | |
Artisan Mid Cap Fund – Institutional Shares (7/1/2000) | | | | 5.41 | | | | | 12.89 | | | | | 10.02 | | | | | 13.79 | | | | | 8.47 | |
Russell Midcap® Index | | | | 3.19 | | | | | 10.69 | | | | | 9.10 | | | | | 13.07 | | | | | 9.66 | * |
Russell Midcap® Growth Index | | | | 5.20 | | | | | 14.50 | | | | | 11.12 | | | | | 14.08 | | | | | 8.82 | * |
| * | As of Investor Shares inception date. |
The performance quoted represents past performance, which does not guarantee future results. The investment return and principal value of an investment in the Fund will fluctuate, so that an investor’s shares in the Fund, when redeemed, may be worth more or less than their original cost. Current performance may be lower or higher than the performance data quoted. For the most recent month-end performance, visit www.artisanpartners.com or call 800.344.1770. The graph and table above do not reflect the deduction of taxes that a shareholder would pay on distributions or sale of Fund shares. See Notes on Management’s Discussion of Fund Performance and Portfolio Holdings’ Classification for a description of each index.
| | |
| 20 | | Artisan Partners Funds |
INVESTING ENVIRONMENT
During the one-year period ended September 30, 2019, US stock returns were mixed: they advanced in the large- and mid-cap spaces while they retreated within the small-cap category. Though the US Federal Reserve’s decision to cut interest rates buoyed markets, concerns over global growth, US-China trade tensions and a formal impeachment inquiry of President Trump tempered market returns. From a style standpoint, value outperformed growth in the large- and small-cap categories but trailed growth in the mid-cap space.
SECTOR DIVERSIFICATION
| | | | | | | | | | |
| Sector | | 9/30/2018 | | 9/30/2019 |
Communication Services | | | | 3.9 | % | | | | 5.1 | % |
Consumer Discretionary | | | | 10.9 | | | | | 11.5 | |
Consumer Staples | | | | 1.5 | | | | | – | |
Energy | | | | 2.3 | | | | | – | |
Financials | | | | 9.6 | | | | | 3.1 | |
Health Care | | | | 17.4 | | | | | 24.6 | |
Industrials | | | | 17.2 | | | | | 15.9 | |
Information Technology | | | | 32.5 | | | | | 36.5 | |
Materials | | | | 2.0 | | | | | – | |
Other assets less liabilities | | | | 2.7 | | | | | 3.3 | |
| | | | | 100.0 | % | | | | 100.0 | % |
PERFORMANCE DISCUSSION
Top contributors within the portfolio during the period included: analytics software provider Tableau, cloud computing company Veeva Systems, Australian enterprise software designer and developer Atlassian, electronic transaction processing provider Global Payments and online payments processing company Worldpay. Bottom contributors during the period included: oil exploration and production company Concho Resources, banking franchise specializing in the West Coast tech community SVB Financial, biotechnology company Neurocrine Biosciences, Canadian premium outerwear brand Canada Goose and biopharmaceutical company Alexion.
REGION ALLOCATION
| | | | | | | | | | |
| Region | | 9/30/2018 | | 9/30/2019 |
Americas | | | | 92.4 | % | | | | 87.4 | % |
Europe | | | | 2.9 | | | | | 7.1 | |
Emerging Markets | | | | 1.0 | | | | | 2.2 | |
Pacific Basin | | | | 1.0 | | | | | – | |
PORTFOLIO CHANGES
During the period, we identified the following new investment opportunities for the portfolio: provider of data center and cloud networking equipment Arista, medical device firm DexCom, entertainment company Hasbro, biotechnology company Ascendis Pharma and off-price discount retailer Burlington. We funded these purchases in part through exiting our positions in Tableau, Concho Resources, TD Ameritrade, Stanley Black & Decker and SVB Financial.
| | |
| Artisan Partners Funds | | 21 |
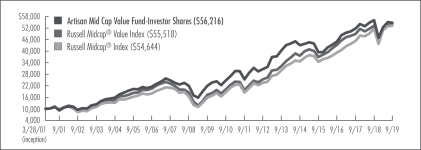
ARTISAN MID CAP VALUE FUND
PERFORMANCE HISTORY
GROWTH OF AN ASSUMED $10,000 INVESTMENT(3/28/2001 to 9/30/2019)
AVERAGE ANNUAL TOTAL RETURNS(as of 9/30/2019)
| | | | | | | | | | | | | | | | | | | | |
| Fund / Index | | 1-Year | | | 3-Year | | | 5-Year | | | 10-Year | | | Since
Inception | |
Artisan Mid Cap Value Fund – Investor Shares (3/28/2001) | | | -2.49 | % | | | 6.80 | % | | | 4.94 | % | | | 9.64 | % | | | 9.78 | % |
Artisan Mid Cap Value Fund – Advisor Shares (4/1/2015) | | | -2.32 | | | | 6.95 | | | | n/a | | | | n/a | | | | 4.83 | |
Artisan Mid Cap Value Fund – Institutional Shares (2/1/2012) | | | -2.22 | | | | 7.05 | | | | 5.17 | | | | n/a | | | | 8.31 | |
Russell Midcap® Index | | | 3.19 | | | | 10.69 | | | | 9.10 | | | | 13.07 | | | | 9.61 | * |
Russell Midcap® Value Index | | | 1.60 | | | | 7.82 | | | | 7.55 | | | | 12.29 | | | | 9.70 | * |
| * | As of Investor Shares inception date. |
The performance quoted represents past performance, which does not guarantee future results. The investment return and principal value of an investment in the Fund will fluctuate, so that an investor’s shares in the Fund, when redeemed, may be worth more or less than their original cost. Current performance may be lower or higher than the performance data quoted. For the most recent month-end performance, visit www.artisanpartners.com or call 800.344.1770. The graph and table above do not reflect the deduction of taxes that a shareholder would pay on distributions or sale of Fund shares. See Notes on Management’s Discussion of Fund Performance and Portfolio Holdings’ Classification for a description of each index.
| | |
| 22 | | Artisan Partners Funds |
INVESTING ENVIRONMENT
During the one-year period ended September 30, 2019, US stock returns were mixed: they advanced in the large- and mid-cap spaces while they retreated within the small-cap category. Though the US Federal Reserve’s decision to cut interest rates buoyed markets, concerns over global growth, US-China trade tensions and a formal impeachment inquiry of President Trump tempered market returns. From a style standpoint, value outperformed growth in the large- and small-cap categories but trailed growth in the mid-cap space.
SECTOR DIVERSIFICATION
| | | | | | | | | | |
| Sector | | 9/30/2018 | | 9/30/2019 |
Communication Services | | | | 13.6 | % | | | | 11.9 | % |
Consumer Discretionary | | | | 13.7 | | | | | 15.1 | |
Consumer Staples | | | | 3.0 | | | | | 2.8 | |
Energy | | | | 10.7 | | | | | 1.7 | |
Financials | | | | 21.3 | | | | | 28.6 | |
Health Care | | | | 1.1 | | | | | 4.0 | |
Industrials | | | | 15.7 | | | | | 12.0 | |
Information Technology | | | | 4.5 | | | | | 7.0 | |
Materials | | | | 7.7 | | | | | 8.2 | |
Real Estate | | | | 2.7 | | | | | 4.3 | |
Other assets less liabilities | | | | 6.0 | | | | | 4.4 | |
| | | | | 100.0 | % | | | | 100.0 | % |
PERFORMANCE DISCUSSION
Top contributors within the portfolio during the period included: dental supply manufacturer DENTSPLY SIRONA, insurance company Arch Capital Group, developer of automatic-dimming mirrors Gentex, automotive company AutoNation and semiconductor company specializing in high performance analog signal processing chips Analog Devices. Bottom contributors during the period included: engineering and construction firm Fluor, automotive parts and equipment provider Delphi Technologies, independent oil and gas exploration and production company Cimarex Energy, oil and gas company Devon Energy and video and Internet commerce company Qurate Retail.
PORTFOLIO CHANGES
During the period, we identified the following new investment opportunities for the portfolio: camper and RV manufacturer Thor Industries, dental supply manufacturer DENTSPLY SIRONA, provider of online brokerage and financial services E*TRADE Financial, enterprise data storage and solutions company NetApp and multi-bank holding company BOK Financial. We funded these purchases in part through exiting our positions in Qurate Retail, Hess, Fluor, Cimarex Energy and TripAdvisor.
| | |
| Artisan Partners Funds | | 23 |
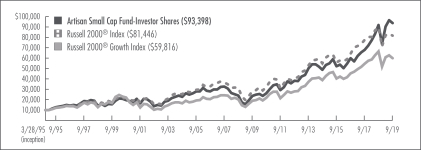
ARTISAN SMALL CAP FUND
PERFORMANCE HISTORY
GROWTH OF AN ASSUMED $10,000 INVESTMENT(3/28/1995 to 9/30/2019)
AVERAGE ANNUAL TOTAL RETURNS(as of 9/30/2019)
| | | | | | | | | | | | | | | | | | | | | | | | | |
| Fund / Index | | 1-Year | | 3-Year | | 5-Year | | 10-Year | | Since
Inception |
Artisan Small Cap Fund – Investor Shares (3/28/1995) | | | | 2.02 | % | | | | 16.00 | % | | | | 13.93 | % | | | | 14.83 | % | | | | 9.54 | % |
Artisan Small Cap Fund – Advisor Shares (2/1/2017) | | | | 2.16 | | | | | n/a | | | | | n/a | | | | | n/a | | | | | 18.92 | |
Artisan Small Cap Fund – Institutional Shares (5/7/2012) | | | | 2.25 | | | | | 16.23 | | | | | 14.18 | | | | | n/a | | | | | 14.11 | |
Russell 2000® Index | | | | -8.89 | | | | | 8.23 | | | | | 8.19 | | | | | 11.19 | | | | | 8.93 | * |
Russell 2000® Growth Index | | | | -9.63 | | | | | 9.79 | | | | | 9.08 | | | | | 12.25 | | | | | 7.57 | * |
| * | | As of Investor Shares inception date. |
The performance quoted represents past performance, which does not guarantee future results. The investment return and principal value of an investment in the Fund will fluctuate, so that an investor’s shares in the Fund, when redeemed, may be worth more or less than their original cost. Current performance may be lower or higher than the performance data quoted. For the most recent month-end performance, visit www.artisanpartners.com or call 800.344.1770. The graph and table above do not reflect the deduction of taxes that a shareholder would pay on distributions or sale of Fund shares. See Notes on Management’s Discussion of Fund Performance and Portfolio Holdings’ Classification for a description of each index.
| | |
| 24 | | Artisan Partners Funds |
INVESTING ENVIRONMENT
During the one-year period ended September 30, 2019, US stock returns were mixed: they advanced in the large- and mid-cap spaces while they retreated within the small-cap category. Though the US Federal Reserve’s decision to cut interest rates buoyed markets, concerns over global growth, US-China trade tensions and a formal impeachment inquiry of President Trump tempered market returns. From a style standpoint, value outperformed growth in the large- and small-cap categories but trailed growth in the mid-cap space.
SECTOR DIVERSIFICATION
| | | | | | | | | | |
| Sector | | 9/30/2018 | | 9/30/2019 |
Communication Services | | | | 2.2 | % | | | | 5.6 | % |
Consumer Discretionary | | | | 13.8 | | | | | 9.8 | |
Energy | | | | 1.6 | | | | | – | |
Financials | | | | 3.6 | | | | | 3.4 | |
Health Care | | | | 19.8 | | | | | 22.5 | |
Industrials | | | | 20.3 | | | | | 16.1 | |
Information Technology | | | | 35.7 | | | | | 37.5 | |
Materials | | | | 1.2 | | | | | 1.2 | |
Other assets less liabilities | | | | 1.8 | | | | | 3.9 | |
| | | | | 100.0 | % | | | | 100.0 | % |
PERFORMANCE DISCUSSION
Top contributors within the portfolio during the period included: cloud computing company Veeva Systems, non-linear entertainment devices manufacturer Roku, analytics software provider Tableau, provider of secure, cloud-based virtual banking solutions to regional and community banks Q2 and provider of electronic components used in marine, environmental and industrials applications Teledyne. Bottom contributors during the period included: Canadian premium outerwear brand Canada Goose, provider of workflow software utilized by public relations professionals Cision, provider of health savings accounts and related services to individuals HealthEquity, automotive cockpit electronics supplier Visteon and biotechnology company Neurocrine Biosciences.
PORTFOLIO CHANGES
During the period, we identified the following new investment opportunities for the portfolio: provider of mobile and online messaging solutions LivePerson, provider of unified, cloud-based spend-management software Coupa, designer, manufacturer, marketer and distributor of photovoltaic solar power systems and solar modules First Solar, provider of analytics, data, information and workflow solutions Clarivate Analytics and provider of on demand products and services for the rental house industry RealPage. We funded these purchases in part through exiting our positions in Veeva Systems, Proofpoint, Tableau, Visteon and Curtiss-Wright.
| | |
| Artisan Partners Funds | | 25 |
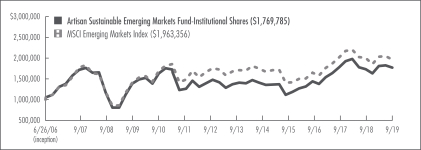
ARTISAN SUSTAINABLE EMERGING MARKETS FUND
PERFORMANCE HISTORY
GROWTH OF AN ASSUMED $1,000,000 INVESTMENT(6/26/2006 to 9/30/2019)
AVERAGE ANNUAL TOTAL RETURNS(as of 9/30/2019)
| | | | | | | | | | | | | | | | | | | | | | | | | |
| Fund / Index | | 1-Year | | 3-Year | | 5-Year | | 10-Year | | Since
Inception |
Artisan Sustainable Emerging Markets Fund – Investor Shares (6/2/2008) | | | | 1.91 | % | | | | 6.98 | % | | | | 4.64 | % | | | | 2.30 | % | | | | -0.42 | % |
Artisan Sustainable Emerging Markets Fund – Institutional Shares (6/26/2006) | | | | 2.04 | | | | | 7.07 | | | | | 4.68 | | | | | 2.47 | | | | | 4.40 | |
MSCI Emerging Markets Index | | | | -2.02 | | | | | 5.97 | | | | | 2.33 | | | | | 3.37 | | | | | 5.22 | * |
| * | | As of Institutional Shares inception date. |
The performance quoted represents past performance, which does not guarantee future results. The investment return and principal value of an investment in the Fund will fluctuate, so that an investor’s shares in the Fund, when redeemed, may be worth more or less than their original cost. Current performance may be lower or higher than the performance data quoted. For the most recent month-end performance, visit www.artisanpartners.com or call 800.344.1770. The graph and table above do not reflect the deduction of taxes that a shareholder would pay on distributions or sale of Fund shares. The Fund’s performance reflects Artisan Partners’ contractual agreement to limit the Fund’s expenses, which has had a material impact on performance and performance would have been lower in its absence. See Notes on Management’s Discussion of Fund Performance and Portfolio Holdings’ Classification for a description of the index.
| | |
| 26 | | Artisan Partners Funds |
INVESTING ENVIRONMENT
During the one-year period ended September 30, 2019, global equities were mixed. Though emerging and European markets finished in slightly negative territory, US markets delivered positive results. Growing concerns over global economic growth dominated markets during the period, especially in the face of diverging direction on monetary policy, US-China trade tensions and uncertainty surrounding Brexit, in addition to a formal impeachment inquiry of President Trump late in the period.
SECTOR DIVERSIFICATION
| | | | | | | | | | |
| Sector | | 9/30/2018 | | 9/30/2019 |
Communication Services | | | | 9.6 | % | | | | 4.1 | % |
Consumer Discretionary | | | | 14.0 | | | | | 21.3 | |
Consumer Staples | | | | 1.6 | | | | | 2.3 | |
Energy | | | | 7.8 | | | | | 7.9 | |
Financials | | | | 19.8 | | | | | 19.5 | |
Health Care | | | | 8.9 | | | | | 7.2 | |
Industrials | | | | 8.9 | | | | | 9.5 | |
Information Technology | | | | 17.4 | | | | | 16.8 | |
Materials | | | | 6.6 | | | | | 6.9 | |
Real Estate | | | | 1.4 | | | | | 1.8 | |
Utilities | | | | 1.3 | | | | | 1.1 | |
Other assets less liabilities | | | | 2.7 | | | | | 1.6 | |
| | | | | 100.0 | % | | | | 100.0 | % |
PERFORMANCE DISCUSSION
Top contributors within the portfolio during the period included: Chinese pharmaceutical company Sino Biopharmaceutical, Russian mining company Polyus, Brazilian management software company Linx, Indian retail and corporate bank ICICI Bank and Brazilian developer of educational content for K-12 private schools Arco Platform. Bottom contributors during the period included: Chinese Internet search engine operator Baidu, Korean manufacturer of bio-healthcare products Samsung Biologics, Chinese oil and gas company China Petroleum & Chemical, UK-based provider of port and harbor services Global Ports and Korean biopharmaceutical manufacturer Medy-Tox.
REGION ALLOCATION
| | | | | | | | | | |
| Region | | 9/30/2018 | | 9/30/2019 |
Emerging Asia | | | | 61.3 | % | | | | 58.4 | % |
Europe, Middle East and Africa | | | | 17.9 | | | | | 18.9 | |
Latin America | | | | 13.5 | | | | | 17.3 | |
Developed Markets | | | | 4.6 | | | | | 3.9 | |
PORTFOLIO CHANGES
During the period, we identified the following new investment opportunities for the portfolio: Brazilian retailer Grupo SBF, Brazilian developer of educational content for K-12 private schools Arco Platform, Indian medical diagnostics company Metropolis, UK-based independent rail car operator Globaltrans and Chinese household electrical appliances company Haier Smart Home. We funded these purchases in part through exiting our positions in Digital China, Emaar Development, NAVER, Grupo Supervielle and Godrej.
| | |
| Artisan Partners Funds | | 27 |
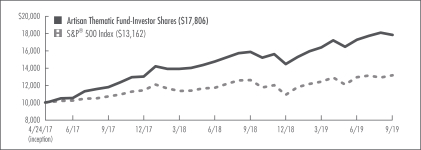
ARTISAN THEMATIC FUND
PERFORMANCE HISTORY
GROWTH OF AN ASSUMED $10,000 INVESTMENT(4/24/2017 to 9/30/2019)
AVERAGE ANNUAL TOTAL RETURNS(as of 9/30/2019)
| | | | | | | | | | |
| Fund / Index | | 1-Year | | Since
Inception |
Artisan Thematic Fund – Investor Shares (4/24/2017) | | | | 12.35 | % | | | | 26.73 | % |
Artisan Thematic Fund – Advisor Shares (7/31/2018) | | | | 12.49 | | | | | 14.50 | |
S&P 500® Index | | | | 4.25 | | | | | 11.94 | * |
| * | | As of Investor Shares inception date. |
The performance quoted represents past performance, which does not guarantee future results. The investment return and principal value of an investment in the Fund will fluctuate, so that an investor’s shares in the Fund, when redeemed, may be worth more or less than their original cost. Current performance may be lower or higher than the performance data quoted. The Fund’s investments in initial public offerings (IPOs) made a material contribution to performance. IPO investments may contribute significantly to a small portfolio’s return, an effect that will generally decrease as assets grow. IPO investments may be unavailable in the future. For the most recent month-end performance, visit www.artisanpartners.com or call 800.344.1770. The graph and table above do not reflect the deduction of taxes that a shareholder would pay on distributions or sale of Fund shares.The Investor Shares’ performance reflects Artisan Partners’ contractual agreement to limit the Fund’s expenses, which has had a material impact on performance and performance would have been lower in its absence. See Notes on Management’s Discussion of Fund Performance and Portfolio Holdings’ Classification for a description of the index.
| | |
| 28 | | Artisan Partners Funds |
INVESTING ENVIRONMENT
During the one-year period ended September 30, 2019, global equities were mixed. Though emerging and European markets finished in slightly negative territory, US markets delivered positive results. Growing concerns over global economic growth dominated markets during the period, especially in the face of diverging direction on monetary policy, US-China trade tensions and uncertainty surrounding Brexit, in addition to a formal impeachment inquiry of President Trump late in the period.
SECTOR DIVERSIFICATION
| | | | | | | | | | |
| Sector | | 9/30/2018 | | 9/30/2019 |
Communications | | | | 3.8 | % | | | | – | % |
Communication Services | | | | – | | | | | 15.4 | |
Consumer Discretionary | | | | – | | | | | 3.3 | |
Consumer Staples | | | | 4.1 | | | | | – | |
Financials | | | | 27.1 | | | | | 4.9 | |
Health Care | | | | 9.4 | | | | | 12.7 | |
Industrials | | | | 11.8 | | | | | 5.1 | |
Information Technology | | | | – | | | | | 28.9 | |
Materials | | | | – | | | | | 7.9 | |
Technology | | | | 26.9 | | | | | | |
Real Estate | | | | – | | | | | 9.0 | |
Other assets less liabilities | | | | 16.9 | | | | | 12.8 | |
| | | | | 100.0 | % | | | | 100.0 | % |
PERFORMANCE DISCUSSION*
Top contributors within the portfolio during the period included: US-based provider of technology services to the financial services industry Fidelity National Information Services, US-based software virtualization company VMware, US-based online payments processing company Worldpay, US-based processing and technology services company IHS Markit and US-based provider of risk and information solutions to businesses and consumers Transunion. Bottom contributors during the period included: US-based software company Splunk, US-based music streaming platform Spotify, US-based payment automation company Bottomline Technologies, Chinese Internet company Tencent and US-based security company Northrop Grumman. The use of derivatives, including options used to hedge short-term portfolio volatility, had a negative overall impact on performance during the period.
PORTFOLIO CHANGES
During the period, we identified the following new investment opportunities for the portfolio: US-based provider of technology services to the financial services industry Fidelity National Information Services, French supplier of industrial gasses and services Air Liquide, US-based medical technology company Becton Dickinson, US-based wireless carrier T-Mobile and US-based provider of research and technology solutions in health care IQVIA. We funded these purchases in part through exiting our positions in CME Group, Intercontinental Exchange, Lamb Weston, Airbus and Automatic Data Processing.
| * | | For options, exposures have been delta-adjusted to determine contribution to return. |
| | |
| Artisan Partners Funds | | 29 |
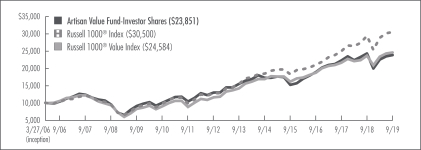
ARTISAN VALUE FUND
PERFORMANCE HISTORY
GROWTH OF AN ASSUMED $10,000 INVESTMENT(3/27/2006 to 9/30/2019)
AVERAGE ANNUAL TOTAL RETURNS(as of 9/30/2019)
| | | | | | | | | | | | | | | | | | | | | | | | | |
| Fund / Index | | 1-Year | | 3-Year | | 5-Year | | 10-Year | | Since
Inception |
Artisan Value Fund – Investor Shares (3/27/2006) | | | | -1.80 | % | | | | 7.94 | % | | | | 6.67 | % | | | | 10.07 | % | | | | 6.64 | % |
Artisan Value Fund – Advisor Shares (4/1/2015) | | | | -1.59 | | | | | 8.12 | | | | | n/a | | | | | n/a | | | | | 7.08 | |
Artisan Value Fund – Institutional Shares (7/26/2011) | | | | -1.57 | | | | | 8.20 | | | | | 6.90 | | | | | n/a | | | | | 8.94 | |
Russell 1000® Index | | | | 3.87 | | | | | 13.19 | | | | | 10.62 | | | | | 13.23 | | | | | 8.60 | * |
Russell 1000® Value Index | | | | 4.00 | | | | | 9.43 | | | | | 7.79 | | | | | 11.46 | | | | | 6.88 | * |
| * | | As of Investor Shares inception date. |
The performance quoted represents past performance, which does not guarantee future results. The investment return and principal value of an investment in the Fund will fluctuate, so that an investor’s shares in the Fund, when redeemed, may be worth more or less than their original cost. Current performance may be lower or higher than the performance data quoted. For the most recent month-end performance, visit www.artisanpartners.com or call 800.344.1770. The graph and table above do not reflect the deduction of taxes that a shareholder would pay on distributions or sale of Fund shares. The Advisor Shares’ performance reflects Artisan Partners’ contractual agreement to limit the Fund’s expenses, which has had a material impact on performance and performance would have been lower in its absence. See Notes on Management’s Discussion of Fund Performance and Portfolio Holdings’ Classification for a description of each index.
| | |
| 30 | | Artisan Partners Funds |
INVESTING ENVIRONMENT
During the one-year period ended September 30, 2019, US stock returns were mixed: they advanced in the large- and mid-cap spaces while they retreated within the small-cap category. Though the US Federal Reserve’s decision to cut interest rates buoyed markets, concerns over global growth, US-China trade tensions and a formal impeachment inquiry of President Trump tempered market returns. From a style standpoint, value outperformed growth in the large- and small-cap categories but trailed growth in the mid-cap space.
SECTOR DIVERSIFICATION
| | | | | | | | | | |
| Sector | | 9/30/2018 | | 9/30/2019 |
Communication Services | | | | 13.6 | % | | | | 14.9 | % |
Consumer Discretionary | | | | 10.8 | | | | | 9.5 | |
Consumer Staples | | | | – | | | | | 3.8 | |
Energy | | | | 11.6 | | | | | 2.0 | |
Financials | | | | 19.9 | | | | | 23.8 | |
Health Care | | | | 7.0 | | | | | 8.5 | |
Industrials | | | | 5.5 | | | | | 10.9 | |
Information Technology | | | | 13.7 | | | | | 16.0 | |
Materials | | | | 9.6 | | | | | 7.7 | |
Real Estate | | | | 2.0 | | | | | – | |
Other assets less liabilities | | | | 6.3 | | | | | 2.9 | |
| | | | | 100.0 | % | | | | 100.0 | % |
PERFORMANCE DISCUSSION
Top contributors within the portfolio during the period included: Netherlands-based global semiconductor manufacturer NXP Semiconductors, media and television broadcasting company Comcast, global investment management firm Oaktree Capital, automotive company AutoNation and developer and manufacturer of defense and security solutions company Raytheon. Bottom contributors during the period included: oil and gas company EOG Resources, oil and gas company Apache, broadcasting and television company CBS, oil and gas company Devon Energy and video and Internet commerce company Qurate Retail.
REGION ALLOCATION
| | | | | | | | | | |
| Region | | 9/30/2018 | | 9/30/2019 |
Americas | | | | 87.0 | % | | | | 83.2 | % |
Europe | | | | 4.2 | | | | | 11.1 | |
Emerging Markets | | | | 2.5 | | | | | 2.8 | |
PORTFOLIO CHANGES
During the period, we identified the following new investment opportunities for the portfolio: provider of online travel and related services Booking Holdings, developer and manufacturer of defense and security solutions company Raytheon, French pharmaceutical company Sanofi, package and freight delivery company FedEx and tobacco product company Altria Group. We funded these purchases in part through exiting our positions in Occidental Petroleum, Hess, Qurate Retail, LyondellBasell Industries and Apache.
| | |
| Artisan Partners Funds | | 31 |
ARTISAN DEVELOPING WORLD FUND
Schedule of Investments – September 30, 2019
Shares and dollar values in thousands
| | | | | | | | | | |
| | | Shares
Held | | Value |
| COMMON STOCKS - 94.1% |
| | | | | | | | | | |
| ARGENTINA - 5.0% |
MercadoLibre, Inc.* | | | | 241 | | | | $ | 132,698 | |
| | | | | | | | | | |
| BRAZIL - 6.3% |
B3 SA - Brasil Bolsa Balcao | | | | 7,798 | | | | | 82,239 | |
Lojas Renner SA* | | | | 2,431 | | | | | 29,465 | |
Raia Drogasil SA* | | | | 1,181 | | | | | 27,238 | |
StoneCo Ltd., Class A* | | | | 843 | | | | | 29,334 | |
| | | | | | | | | | |
| | | | | | | | | 168,276 | |
| CHINA - 27.7% |
Alibaba Group Holding Ltd., ADR* | | | | 967 | | | | | 161,645 | |
Foshan Haitian Flavouring & Food Co. Ltd., Class A | | | | 1,920 | | | | | 29,561 | |
Huazhu Group Ltd., ADR | | | | 1,871 | | | | | 61,767 | |
Jiangsu Hengrui Medicine Co. Ltd., Class A | | | | 5,085 | | | | | 57,467 | |
Kweichow Moutai Co. Ltd., Class A | | | | 755 | | | | | 121,691 | |
Shanghai International Airport Co. Ltd., Class A | | | | 2,361 | | | | | 26,392 | |
TAL Education Group, ADR* | | | | 3,550 | | | | | 121,568 | |
Tencent Holdings Ltd. | | | | 2,950 | | | | | 124,262 | |
Yifeng Pharmacy Chain Co. Ltd., Class A | | | | 172 | | | | | 1,897 | |
Zhangzhou Pientzehuang Pharmaceutical Co. Ltd., Class A | | | | 2,171 | | | | | 30,990 | |
| | | | | | | | | | |
| | | | | | | | | 737,240 | |
| FRANCE - 5.2% |
Hermes International | | | | 42 | | | | | 28,851 | |
LVMH Moet Hennessy Louis Vuitton SE | | | | 199 | | | | | 79,190 | |
Remy Cointreau SA | | | | 220 | | | | | 29,191 | |
| | | | | | | | | | |
| | | | | | | | | 137,232 | |
| HONG KONG - 5.9% |
AIA Group Ltd. | | | | 13,182 | | | | | 124,542 | |
Hong Kong Exchanges & Clearing Ltd. | | | | 1,089 | | | | | 31,942 | |
| | | | | | | | | | |
| | | | | | | | | 156,484 | |
| INDIA - 9.5% |
HDFC Bank Ltd., ADR | | | | 3,202 | | | | | 182,657 | |
Titan Co. Ltd. | | | | 3,896 | | | | | 69,979 | |
| | | | | | | | | | |
| | | | | | | | | 252,636 | |
| MACAU - 2.4% |
Galaxy Entertainment Group Ltd. | | | | 10,147 | | | | | 63,114 | |
| | | | | | | | | | |
| NETHERLANDS - 5.8% |
Adyen NV* | | | | 187 | | | | | 123,315 | |
ASML Holding NV, NYRS | | | | 123 | | | | | 30,655 | |
| | | | | | | | | | |
| | | | | | | | | 153,970 | |
| | | | | | | | | | |
| PERU - 0.4% |
Credicorp Ltd. | | | | 57 | | | | | 11,930 | |
| | | | | | | | | | |
| PHILIPPINES - 0.6% |
Puregold Price Club, Inc. | | | | 20,549 | | | | | 15,482 | |
| | | | | | | | | | |
| POLAND - 0.5% |
Dino Polska SA* | | | | 364 | | | | | 14,250 | |
| | | | | | | | | | |
| RUSSIA - 3.5% |
Yandex NV, Class A* | | | | 2,659 | | | | | 93,089 | |
| | | | | | | | | | |
| THAILAND - 7.4% |
CP ALL PCL(1) | | | | 24,339 | | | | | 64,657 | |
Sea Ltd., ADR* | | | | 4,252 | | | | | 131,602 | |
| | | | | | | | | | |
| | | | | | | | | 196,259 | |
| UNITED KINGDOM - 2.2% |
Diageo plc | | | | 1,430 | | | | | 58,616 | |
| | | | | | | | | | |
| UNITED STATES - 11.7% |
Estee Lauder Cos., Inc. (The), Class A | | | | 137 | | | | | 27,315 | |
Netflix, Inc.* | | | | 118 | | | | | 31,703 | |
NVIDIA Corp. | | | | 755 | | | | | 131,495 | |
Visa, Inc., Class A | | | | 711 | | | | | 122,324 | |
| | | | | | | | | | |
| | | | | | | | | 312,837 | |
| | | | | | | | | | |
Total common stocks
(Cost $1,958,879) | | | | | 2,504,113 | |
| | | | | | |
| SHORT-TERM INVESTMENTS - 4.7% |
| | | | | | | | | | |
| INVESTMENT COMPANIES - 4.7% |
BlackRock Liquidity Funds Treasury Trust Fund - Institutional Class, 2.10% | | | | 42,190 | | | | | 42,190 | |
Federated Treasury Obligations Fund - Institutional Class, 1.96% | | | | 40,949 | | | | | 40,949 | |
Fidelity Investments Money Market Treasury Portfolio - Institutional Class, 2.04% | | | | 40,949 | | | | | 40,949 | |
| | | | | | | | | | |
Total short-term investments
(Cost $124,088) | | | | | 124,088 | |
| | | | | | | | | | |
| | | | | | |
Total investments - 98.8%
(Cost $2,082,967) | | | | | 2,628,201 | |
| | | | | | | | | | |
Other assets less liabilities - 1.2% | | | | | 33,574 | |
| | | | | | | | | | |
| | | | | | | | | | |
Total net assets - 100.0%(2) | | | | $ | 2,661,775 | |
| | | | | | | | | | |
| | |
| 32 | | Artisan Partners Funds |
| * | | Non-income producing security. |
| (1) | | Valued at a fair value in accordance with procedures established by the board of directors of Artisan Partners Funds. In total, securities valued at a fair value were $64,657 or 2.4% of total net assets. See notes 2(a) and 4 in Notes to Financial Statements for additional information. |
| (2) | | Percentages for the various classifications relate to total net assets. |
Company names are as reported by a data service provider and in some cases are translations; a company’s legal name may be different.
| | |
| Abbreviations |
ADR | | American Depositary Receipt |
NYRS | | New York Registry Shares |
| | | | | | | | | | |
| PORTFOLIO DIVERSIFICATION |
Dollar values in thousands | |
| | | Value | | Percentage
of Total
Investments |
Communication Services | | | $ | 380,656 | | | | | 14.5 | % |
Consumer Discretionary | | | | 748,277 | | | | | 28.5 | |
Consumer Staples | | | | 389,898 | | | | | 14.8 | |
Financials | | | | 433,310 | | | | | 16.5 | |
Health Care | | | | 88,457 | | | | | 3.4 | |
Industrials | | | | 26,392 | | | | | 1.0 | |
Information Technology | | | | 437,123 | | | | | 16.6 | |
Short-Term Investments | | | | 124,088 | | | | | 4.7 | |
| | | | | | | | | | |
Total investments | | | $ | 2,628,201 | | | | | 100.0 | % |
| | | | | | | | | | |
| | | | | | | | | | |
| TRADING CURRENCIES |
Dollar values in thousands | |
| | | Value | | Percentage
of Total
Investments |
Brazilian real | | | $ | 138,942 | | | | | 5.3 | % |
British pound | | | | 58,616 | | | | | 2.2 | |
Chinese yuan renminbi offshore | | | | 267,998 | | | | | 10.2 | |
Euro | | | | 260,547 | | | | | 9.9 | |
Hong Kong dollar | | | | 343,860 | | | | | 13.1 | |
Indian rupee | | | | 69,979 | | | | | 2.7 | |
Philippine peso | | | | 15,482 | | | | | 0.6 | |
Polish zloty | | | | 14,250 | | | | | 0.5 | |
Thai baht | | | | 64,657 | | | | | 2.5 | |
U.S. dollar | | | | 1,393,870 | | | | | 53.0 | |
| | | | | | | | | | |
Total investments | | | $ | 2,628,201 | | | | | 100.0 | % |
| | | | | | | | | | |
| | | | | | | |
| TOP TEN HOLDINGS |
Company Name | | Country | | Percentage
of Total
Net Assets |
HDFC Bank Ltd. | | India | | | | 6.9 | % |
Alibaba Group Holding Ltd. | | China | | | | 6.1 | |
MercadoLibre, Inc. | | Argentina | | | | 5.0 | |
Sea Ltd. | | Thailand | | | | 4.9 | |
NVIDIA Corp. | | United States | | | | 4.9 | |
AIA Group Ltd. | | Hong Kong | | | | 4.7 | |
Tencent Holdings Ltd. | | China | | | | 4.7 | |
Adyen NV | | Netherlands | | | | 4.6 | |
Visa, Inc. | | United States | | | | 4.6 | |
Kweichow Moutai Co. Ltd. | | China | | | | 4.6 | |
| | | | | | | |
Total | | | | | | 51.0 | % |
| | | | | | | |
For the purpose of determining the Fund’s top ten holdings, securities of the same issuer are aggregated to determine the weight in the Fund.
The accompanying notes are an integral part of the financial statements.
| | |
| Artisan Partners Funds | | 33 |
ARTISAN GLOBAL DISCOVERY FUND
Schedule of Investments – September 30, 2019
Shares and dollar values in thousands
| | | | | | | | | | |
| | | Shares
Held | | Value |
| COMMON STOCKS - 93.1% |
| | | | | | | | | | |
| AUSTRALIA - 1.5% |
Treasury Wine Estates Ltd. | | | | 124 | | | | $ | 1,555 | |
| | | | | | | | | | |
| BRAZIL - 3.2% |
Notre Dame Intermedica Participacoes SA | | | | 185 | | | | | 2,423 | |
Pagseguro Digital Ltd., Class A* | | | | 22 | | | | | 1,014 | |
| | | | | | | | | | |
| | | | | | | | | 3,437 | |
| CANADA - 2.0% |
CAE, Inc. | | | | 38 | | | | | 965 | |
Canada Goose Holdings, Inc.* | | | | 26 | | | | | 1,134 | |
| | | | | | | | | | |
| | | | | | | | | 2,099 | |
| CHINA - 0.5% |
Tencent Music Entertainment Group, ADR* | | | | 42 | | | | | 539 | |
| | | | | | | | | | |
| DENMARK - 5.7% |
Ascendis Pharma A/S, ADR* | | | | 13 | | | | | 1,255 | |
Genmab A/S* | | | | 13 | | | | | 2,570 | |
Vestas Wind Systems A/S | | | | 29 | | | | | 2,270 | |
| | | | | | | | | | |
| | | | | | | | | 6,095 | |
| FRANCE - 1.3% |
Orpea | | | | 12 | | | | | 1,441 | |
| | | | | | | | | | |
| GERMANY - 5.0% |
Puma SE | | | | 22 | | | | | 1,664 | |
Varta AG* | | | | 38 | | | | | 3,699 | |
| | | | | | | | | | |
| | | | | | | | | 5,363 | |
| HONG KONG - 3.4% |
Techtronic Industries Co. Ltd. | | | | 529 | | | | | 3,685 | |
| | | | | | | | | | |
| INDIA - 0.9% |
Varun Beverages Ltd. | | | | 109 | | | | | 961 | |
| | | | | | | | | | |
| JAPAN - 1.1% |
Hoya Corp. | | | | 15 | | | | | 1,224 | |
| | | | | | | | | | |
| LUXEMBOURG - 1.2% |
Eurofins Scientific SE | | | | 3 | | | | | 1,326 | |
| | | | | | | | | | |
| NETHERLANDS - 3.2% |
Adyen NV* | | | | 1 | | | | | 721 | |
IMCD NV | | | | 21 | | | | | 1,561 | |
Koninklijke DSM NV | | | | 9 | | | | | 1,105 | |
| | | | | | | | | | |
| | | | | | | | | 3,387 | |
| SPAIN - 1.3% |
Amadeus IT Group SA | | | | 20 | | | | | 1,433 | |
| | | | | | | | | | |
| SWITZERLAND - 2.3% |
Aluflexpack AG* | | | | 35 | | | | | 751 | |
Lonza Group AG* | | | | 5 | | | | | 1,758 | |
| | | | | | | | | | |
| | | | | | | | | 2,509 | |
| UNITED KINGDOM - 6.6% |
B&M European Value Retail SA | | | | 249 | | | | | 1,162 | |
Burberry Group plc | | | | 66 | | | | | 1,759 | |
Clarivate Analytics plc* | | | | 81 | | | | | 1,360 | |
Fevertree Drinks plc | | | | 30 | | | | | 896 | |
London Stock Exchange Group plc | | | | 21 | | | | | 1,882 | |
| | | | | | | | | | |
| | | | | | | | | 7,059 | |
| UNITED STATES - 53.9% |
Advanced Micro Devices, Inc.* | | | | 52 | | | | | 1,514 | |
Alexion Pharmaceuticals, Inc.* | | | | 17 | | | | | 1,685 | |
Arista Networks, Inc.* | | | | 8 | | | | | 1,843 | |
Atlassian Corp. plc, Class A* | | | | 7 | | | | | 868 | |
Boston Scientific Corp.* | | | | 84 | | | | | 3,420 | |
Burlington Stores, Inc.* | | | | 5 | | | | | 976 | |
BWX Technologies, Inc. | | | | 33 | | | | | 1,912 | |
Ceridian HCM Holding, Inc.* | | | | 20 | | | | | 975 | |
Cintas Corp. | | | | 4 | | | | | 1,115 | |
Cognex Corp. | | | | 21 | | | | | 1,049 | |
Cree, Inc.* | | | | 31 | | | | | 1,537 | |
DexCom, Inc.* | | | | 5 | | | | | 796 | |
First Republic Bank | | | | 26 | | | | | 2,542 | |
First Solar, Inc.* | | | | 24 | | | | | 1,418 | |
Fortive Corp. | | | | 25 | | | | | 1,742 | |
Gardner Denver Holdings, Inc.* | | | | 64 | | | | | 1,814 | |
Global Payments, Inc. | | | | 37 | | | | | 5,910 | |
Guidewire Software, Inc.* | | | | 37 | | | | | 3,903 | |
IHS Markit Ltd.* | | | | 51 | | | | | 3,384 | |
New York Times Co. (The), Class A | | | | 54 | | | | | 1,529 | |
Novanta, Inc.* | | | | 15 | | | | | 1,242 | |
Ollie’s Bargain Outlet Holdings, Inc.* | | | | 9 | | | | | 521 | |
Progressive Corp. (The) | | | | 21 | | | | | 1,624 | |
RealPage, Inc.* | | | | 19 | | | | | 1,173 | |
ServiceMaster Global Holdings, Inc.* | | | | 10 | | | | | 553 | |
Skyworks Solutions, Inc. | | | | 12 | | | | | 918 | |
Take-Two Interactive Software, Inc.* | | | | 8 | | | | | 985 | |
Teledyne Technologies, Inc.* | | | | 14 | | | | | 4,666 | |
Veeva Systems, Inc., Class A* | | | | 19 | | | | | 2,840 | |
WellCare Health Plans, Inc.* | | | | 2 | | | | | 514 | |
Zoom Video Communications, Inc., Class A* | | | | 8 | | | | | 646 | |
| | |
| 34 | | Artisan Partners Funds |
| | | | | | | | | | |
| | | Shares
Held | | Value |
| UNITED STATES (CONTINUED) |
Zynga, Inc., Class A* | | | | 377 | | | | $ | 2,196 | |
| | | | | | | | | | |
| | | | | | | | | 57,810 | |
| | | | | | | | | | |
Total common stocks
(Cost $84,338) | | | | | 99,923 | |
| | | | | | |
| SHORT-TERM INVESTMENTS - 6.6% |
| | | | | | | | | | |
| INVESTMENT COMPANIES - 6.6% |
BlackRock Liquidity Funds Treasury Trust Fund - Institutional Class, 2.10% | | | | 2,411 | | | | | 2,411 | |
Federated Treasury Obligations Fund - Institutional Class, 1.96% | | | | 2,340 | | | | | 2,340 | |
Fidelity Investments Money Market Treasury Portfolio - Institutional Class, 2.04% | | | | 2,340 | | | | | 2,340 | |
| | | | | | | | | | |
Total short-term investments
(Cost $7,091) | | | | | 7,091 | |
| | | | | | | | | | |
| | | | | | |
Total investments - 99.7%
(Cost $91,429) | | | | | 107,014 | |
| | | | | | | | | | |
Other assets less liabilities - 0.3% | | | | | 309 | |
| | | | | | | | | | |
| | | | | | | | | | |
Total net assets - 100.0%(1) | | | | $ | 107,323 | |
| | | | | | | | | | |
| * | | Non-income producing security. |
| (1) | | Percentages for the various classifications relate to total net assets. |
Company names are as reported by a data service provider and in some cases are translations; a company’s legal name may be different.
| | |
| Abbreviation |
ADR | | American Depositary Receipt |
| | | | | | | | | | |
| PORTFOLIO DIVERSIFICATION |
Dollar values in thousands | |
| | | Value | | Percentage
of Total
Investments |
Communication Services | | | $ | 5,249 | | | | | 4.9 | % |
Consumer Discretionary | | | | 7,769 | | | | | 7.3 | |
Consumer Staples | | | | 3,412 | | | | | 3.2 | |
Financials | | | | 6,048 | | | | | 5.7 | |
Health Care | | | | 21,252 | | | | | 19.9 | |
Industrials | | | | 28,173 | | | | | 26.3 | |
Information Technology | | | | 26,164 | | | | | 24.4 | |
Materials | | | | 1,856 | | | | | 1.7 | |
Short-Term Investments | | | | 7,091 | | | | | 6.6 | |
| | | | | | | | | | |
Total investments | | | $ | 107,014 | | | | | 100.0 | % |
| | | | | | | | | | |
| | | | | | | | | | |
| TRADING CURRENCIES |
Dollar values in thousands | |
| | | Value | | Percentage
of Total
Investments |
Australian dollar | | | $ | 1,555 | | | | | 1.5 | % |
Brazilian real | | | | 2,423 | | | | | 2.3 | |
British pound | | | | 5,699 | | | | | 5.3 | |
Canadian dollar | | | | 965 | | | | | 0.9 | |
Danish krone | | | | 4,840 | | | | | 4.5 | |
Euro | | | | 12,950 | | | | | 12.1 | |
Hong Kong dollar | | | | 3,685 | | | | | 3.4 | |
Indian rupee | | | | 961 | | | | | 0.9 | |
Japanese yen | | | | 1,224 | | | | | 1.1 | |
Swiss franc | | | | 2,509 | | | | | 2.4 | |
U.S. dollar | | | | 70,203 | | | | | 65.6 | |
| | | | | | | | | | |
Total investments | | | $ | 107,014 | | | | | 100.0 | % |
| | | | | | | | | | |
| | | | | | | |
| TOP TEN HOLDINGS |
Company Name | | Country | | Percentage
of Total
Net Assets |
Global Payments, Inc. | | United States | | | | 5.5 | % |
Teledyne Technologies, Inc. | | United States | | | | 4.3 | |
Guidewire Software, Inc. | | United States | | | | 3.6 | |
Varta AG | | Germany | | | | 3.4 | |
Techtronic Industries Co. Ltd. | | Hong Kong | | | | 3.4 | |
Boston Scientific Corp. | | United States | | | | 3.2 | |
IHS Markit Ltd. | | United States | | | | 3.2 | |
Veeva Systems, Inc. | | United States | | | | 2.6 | |
Genmab A/S | | Denmark | | | | 2.4 | |
First Republic Bank | | United States | | | | 2.4 | |
| | | | | | | |
Total | | | | | | 34.0 | % |
| | | | | | | |
For the purpose of determining the Fund’s top ten holdings, securities of the same issuer are aggregated to determine the weight in the Fund.
The accompanying notes are an integral part of the financial statements.
| | |
| Artisan Partners Funds | | 35 |
ARTISAN GLOBAL EQUITY FUND
Schedule of Investments – September 30, 2019
Shares and dollar values in thousands
| | | | | | | | | | |
| | | Shares
Held | | Value |
| COMMON STOCKS - 97.1% |
| | | | | | | | | | |
| BRAZIL - 3.6% |
Petrobras Distribuidora SA | | | | 106 | | | | $ | 701 | |
Petroleo Brasileiro SA, ADR* | | | | 283 | | | | | 4,100 | |
Petroleo Brasileiro SA (Preference) | | | | 644 | | | | | 4,262 | |
| | | | | | | | | | |
| | | | | | | | | 9,063 | |
| CANADA - 2.0% |
CAE, Inc. | | | | 33 | | | | | 847 | |
Canada Goose Holdings, Inc.* | | | | 11 | | | | | 488 | |
TMX Group Ltd. | | | | 43 | | | | | 3,724 | |
| | | | | | | | | | |
| | | | | | | | | 5,059 | |
| CHINA - 0.3% |
ANTA Sports Products Ltd. | | | | 91 | | | | | 753 | |
| | | | | | | | | | |
| DENMARK - 2.2% |
Carlsberg A/S, Class B | | | | 4 | | | | | 566 | |
Genmab A/S* | | | | 24 | | | | | 4,938 | |
| | | | | | | | | | |
| | | | | | | | | 5,504 | |
| FRANCE - 3.3% |
Airbus SE | | | | 47 | | | | | 6,144 | |
Ipsen SA | | | | 7 | | | | | 621 | |
Safran SA | | | | 10 | | | | | 1,618 | |
| | | | | | | | | | |
| | | | | | | | | 8,383 | |
| GERMANY - 9.6% |
Deutsche Boerse AG | | | | 77 | | | | | 11,967 | |
KION Group AG | | | | 20 | | | | | 1,053 | |
MorphoSys AG* | | | | 11 | | | | | 1,187 | |
Wirecard AG | | | | 64 | | | | | 10,223 | |
| | | | | | | | | | |
| | | | | | | | | 24,430 | |
| GREECE - 0.8% |
JUMBO SA | | | | 114 | | | | | 2,162 | |
| | | | | | | | | | |
| HONG KONG - 1.7% |
AIA Group Ltd. | | | | 451 | | | | | 4,257 | |
| | | | | | | | | | |
| INDIA - 0.1% |
Varun Beverages Ltd. | | | | 28 | | | | | 250 | |
| | | | | | | | | | |
| IRELAND - 0.8% |
Amarin Corp. plc, ADR* | | | | 135 | | | | | 2,048 | |
| | | | | | | | | | |
| ITALY - 1.9% |
Davide Campari-Milano SpA | | | | 279 | | | | | 2,518 | |
Intesa Sanpaolo SpA | | | | 1,005 | | | | | 2,384 | |
| | | | | | | | | | |
| | | | | | | | | 4,902 | |
| JAPAN - 5.1% |
Ariake Japan Co. Ltd. | | | | 16 | | | | | 1,262 | |
Daiichi Sankyo Co. Ltd. | | | | 15 | | | | | 969 | |
Jeol Ltd. | | | | 172 | | | | | 4,077 | |
OBIC Business Consultants Co. Ltd. | | | | 71 | | | | | 2,857 | |
Obic Co. Ltd. | | | | 23 | | | | | 2,609 | |
Recruit Holdings Co. Ltd. | | | | 41 | | | | | 1,239 | |
| | | | | | | | | | |
| | | | | | | | | 13,013 | |
| NETHERLANDS - 5.4% |
ING Groep NV | | | | 476 | | | | | 4,981 | |
InterXion Holding NV* | | | | 109 | | | | | 8,901 | |
| | | | | | | | | | |
| | | | | | | | | 13,882 | |
| NORWAY - 0.6% |
Mowi ASA | | | | 69 | | | | | 1,589 | |
| | | | | | | | | | |
| SPAIN - 0.7% |
Almirall SA | | | | 108 | | | | | 1,886 | |
| | | | | | | | | | |
| SWITZERLAND - 5.7% |
Idorsia Ltd.* | | | | 67 | | | | | 1,646 | |
Lonza Group AG* | | | | 17 | | | | | 5,641 | |
Medacta Group SA* | | | | 39 | | | | | 3,204 | |
Nestle SA | | | | 38 | | | | | 4,119 | |
| | | | | | | | | | |
| | | | | | | | | 14,610 | |
| UNITED KINGDOM - 5.8% |
AVEVA Group plc | | | | 88 | | | | | 3,984 | |
Linde plc | | | | 53 | | | | | 10,275 | |
London Stock Exchange Group plc | | | | 5 | | | | | 434 | |
| | | | | | | | | | |
| | | | | | | | | 14,693 | |
| UNITED STATES - 47.5% |
ACADIA Pharmaceuticals, Inc.* | | | | 135 | | | | | 4,843 | |
Alphabet, Inc., Class A* | | | | 3 | | | | | 3,842 | |
Alphabet, Inc., Class C* | | | | 3 | | | | | 3,830 | |
Amazon.com, Inc.* | | | | 3 | | | | | 5,048 | |
Anaplan, Inc.* | | | | 82 | | | | | 3,835 | |
Aramark | | | | 61 | | | | | 2,650 | |
Baxter International, Inc. | | | | 30 | | | | | 2,611 | |
Bio-Rad Laboratories, Inc., Class A* | | | | 12 | | | | | 4,008 | |
CME Group, Inc. | | | | 7 | | | | | 1,426 | |
Danaher Corp. | | | | 26 | | | | | 3,694 | |
Dolby Laboratories, Inc., Class A | | | | 22 | | | | | 1,404 | |
Dollar Tree, Inc.* | | | | 39 | | | | | 4,451 | |
Facebook, Inc., Class A* | | | | 26 | | | | | 4,557 | |
Fidelity National Information Services, Inc. | | | | 75 | | | | | 10,015 | |
Global Payments, Inc. | | | | 11 | | | | | 1,773 | |
Halozyme Therapeutics, Inc.* | | | | 57 | | | | | 879 | |
| | |
| 36 | | Artisan Partners Funds |
| | | | | | | | | | |
| | | Shares
Held | | Value |
| UNITED STATES (CONTINUED) |
IHS Markit Ltd.* | | | | 67 | | | | $ | 4,451 | |
Intercontinental Exchange, Inc. | | | | 91 | | | | | 8,420 | |
IPG Photonics Corp.* | | | | 13 | | | | | 1,806 | |
L3Harris Technologies, Inc. | | | | 22 | | | | | 4,607 | |
Lamb Weston Holdings, Inc. | | | | 17 | | | | | 1,271 | |
Mastercard, Inc., Class A | | | | 25 | | | | | 6,775 | |
Microsoft Corp. | | | | 20 | | | | | 2,754 | |
Mondelez International, Inc., Class A | | | | 46 | | | | | 2,556 | |
Morningstar, Inc. | | | | 7 | | | | | 974 | |
Norfolk Southern Corp. | | | | 18 | | | | | 3,235 | |
PayPal Holdings, Inc.* | | | | 41 | | | | | 4,263 | |
PerkinElmer, Inc. | | | | 46 | | | | | 3,890 | |
Progressive Corp. (The) | | | | 42 | | | | | 3,234 | |
TJX Cos., Inc. (The) | | | | 53 | | | | | 2,965 | |
ViewRay, Inc.* | | | | 748 | | | | | 2,169 | |
WEX, Inc.* | | | | 30 | | | | | 5,992 | |
World Wrestling Entertainment, Inc., Class A | | | | 39 | | | | | 2,784 | |
| | | | | | | | | | |
| | | | | | | | | 121,012 | |
| | | | | | | | | | |
Total common stocks
(Cost $190,688) | | | | | | | | | 247,496 | |
| | | | | | | | | | |
| SHORT-TERM INVESTMENTS - 2.5% |
| | | | | | | | | | |
| INVESTMENT COMPANIES - 2.5% |
BlackRock Liquidity Funds Treasury Trust Fund - Institutional Class, 2.10% | | | | 2,135 | | | | | 2,135 | |
Federated Treasury Obligations Fund - Institutional Class, 1.96% | | | | 2,073 | | | | | 2,073 | |
Fidelity Investments Money Market Treasury Portfolio - Institutional Class, 2.04% | | | | 2,072 | | | | | 2,072 | |
| | | | | | | | | | |
Total short-term investments
(Cost $6,280) | | | | | | | | | 6,280 | |
| | | | | | | | | | |
| | | | | | | | | | |
Total investments - 99.6%
(Cost $196,968) | | | | | | | | | 253,776 | |
| | | | | | | | | | |
Other assets less liabilities - 0.4% | | | | | | | | | 1,179 | |
| | | | | | | | | | |
| | | | | | | | | | |
Total net assets - 100.0%(1) | | | | | | | | $ | 254,955 | |
| | | | | | | | | | |
| * | | Non-income producing security. |
| (1) | | Percentages for the various classifications relate to total net assets. |
Company names are as reported by a data service provider and in some cases are translations; a company’s legal name may be different.
| | |
| Abbreviations |
ADR | | American Depositary Receipt |
Preference | | A special type of equity investment that shares in the earnings of the company and may have a dividend preference. Preference shares may also have liquidation preference. |
| | | | | | | | | | |
| PORTFOLIO DIVERSIFICATION |
Dollar values in thousands | |
| | | Value | | Percentage
of Total
Investments |
Communication Services | | | $ | 15,013 | | | | | 5.9 | % |
Consumer Discretionary | | | | 19,218 | | | | | 7.6 | |
Consumer Staples | | | | 14,131 | | | | | 5.6 | |
Energy | | | | 8,362 | | | | | 3.3 | |
Financials | | | | 41,801 | | | | | 16.5 | |
Health Care | | | | 48,311 | | | | | 19.0 | |
Industrials | | | | 23,194 | | | | | 9.1 | |
Information Technology | | | | 67,191 | | | | | 26.5 | |
Materials | | | | 10,275 | | | | | 4.0 | |
Short-Term Investments | | | | 6,280 | | | | | 2.5 | |
| | | | | | | | | | |
Total investments | | | $ | 253,776 | | | | | 100.0 | % |
| | | | | | | | | | |
| | | | | | | | | | |
| TRADING CURRENCIES |
Dollar values in thousands | |
| | | Value | | Percentage
of Total
Investments |
Brazilian real | | | $ | 4,963 | | | | | 2.0 | % |
British pound | | | | 4,418 | | | | | 1.8 | |
Canadian dollar | | | | 4,571 | | | | | 1.8 | |
Danish krone | | | | 5,504 | | | | | 2.2 | |
Euro | | | | 57,019 | | | | | 22.3 | |
Hong Kong dollar | | | | 5,010 | | | | | 2.0 | |
Indian rupee | | | | 250 | | | | | 0.1 | |
Japanese yen | | | | 13,013 | | | | | 5.1 | |
Norwegian krone | | | | 1,589 | | | | | 0.6 | |
Swiss franc | | | | 14,610 | | | | | 5.8 | |
U.S. dollar | | | | 142,829 | | | | | 56.3 | |
| | | | | | | | | | |
Total investments | | | $ | 253,776 | | | | | 100.0 | % |
| | | | | | | | | | |
| | |
| Artisan Partners Funds | | 37 |
| | | | | | | |
| TOP TEN HOLDINGS |
Company Name | | Country | | Percentage
of Total
Net Assets |
Deutsche Boerse AG | | Germany | | | | 4.7 | % |
Linde plc | | United Kingdom | | | | 4.0 | |
Wirecard AG | | Germany | | | | 4.0 | |
Fidelity National Information Services, Inc. | | United States | | | | 3.9 | |
InterXion Holding NV | | Netherlands | | | | 3.5 | |
Intercontinental Exchange, Inc. | | United States | | | | 3.3 | |
Petroleo Brasileiro SA | | Brazil | | | | 3.3 | |
Alphabet, Inc. | | United States | | | | 3.0 | |
Mastercard, Inc. | | United States | | | | 2.7 | |
Airbus SE | | France | | | | 2.4 | |
| | | | | | | |
Total | | | | | | 34.8 | % |
| | | | | | | |
For the purpose of determining the Fund’s top ten holdings, securities of the same issuer are aggregated to determine the weight in the Fund.
The accompanying notes are an integral part of the financial statements.
| | |
| 38 | | Artisan Partners Funds |
ARTISAN GLOBAL OPPORTUNITIES FUND
Schedule of Investments – September 30, 2019
Shares and dollar values in thousands
| | | | | | | | | | |
| | | Shares
Held | | Value |
| COMMON STOCKS - 93.7% |
| | | | | | | | | | |
| AUSTRALIA - 1.4% |
Treasury Wine Estates Ltd. | | | | 3,819 | | | | $ | 47,871 | |
| | | | | | | | | | |
| BRAZIL - 1.7% |
Pagseguro Digital Ltd., Class A* | | | | 1,233 | | | | | 57,101 | |
| | | | | | | | | | |
| CHINA - 3.0% |
Budweiser Brewing Co. APAC Ltd.* | | | | 4,957 | | | | | 17,835 | |
Tencent Holdings Ltd. | | | | 1,981 | | | | | 83,451 | |
| | | | | | | | | | |
| | | | | | | | | 101,286 | |
| DENMARK - 4.9% |
Genmab A/S* | | | | 495 | | | | | 100,380 | |
Vestas Wind Systems A/S | | | | 870 | | | | | 67,506 | |
| | | | | | | | | | |
| | | | | | | | | 167,886 | |
| GERMANY - 1.9% |
adidas AG | | | | 213 | | | | | 66,325 | |
| | | | | | | | | | |
| HONG KONG - 3.7% |
Techtronic Industries Co. Ltd. | | | | 18,098 | | | | | 125,959 | |
| | | | | | | | | | |
| INDIA - 1.1% |
HDFC Bank Ltd., ADR | | | | 648 | | | | | 36,959 | |
| | | | | | | | | | |
| JAPAN - 2.8% |
Hoya Corp. | | | | 484 | | | | | 39,501 | |
Keyence Corp. | | | | 87 | | | | | 54,015 | |
| | | | | | | | | | |
| | | | | | | | | 93,516 | |
| NETHERLANDS - 2.1% |
Adyen NV* | | | | 35 | | | | | 23,386 | |
Koninklijke DSM NV | | | | 390 | | | | | 46,920 | |
| | | | | | | | | | |
| | | | | | | | | 70,306 | |
| SPAIN - 2.0% |
Amadeus IT Group SA | | | | 605 | | | | | 43,367 | |
Iberdrola SA | | | | 2,475 | | | | | 25,720 | |
| | | | | | | | | | |
| | | | | | | | | 69,087 | |
| SWITZERLAND - 4.4% |
Lonza Group AG* | | | | 315 | | | | | 106,520 | |
Temenos AG* | | | | 253 | | | | | 42,407 | |
| | | | | | | | | | |
| | | | | | | | | 148,927 | |
| UNITED KINGDOM - 10.3% |
AstraZeneca plc | | | | 1,617 | | | | | 144,373 | |
Burberry Group plc | | | | 2,470 | | | | | 66,036 | |
Fevertree Drinks plc | | | | 1,462 | | | | | 43,568 | |
London Stock Exchange Group plc | | | | 1,050 | | | | | 94,373 | |
| | | | | | | | | | |
| | | | | | | | | 348,350 | |
| UNITED STATES - 54.4% |
Activision Blizzard, Inc. | | | | 1,338 | | | | | 70,819 | |
Advanced Micro Devices, Inc.* | | | | 2,571 | | | | | 74,536 | |
Agilent Technologies, Inc. | | | | 701 | | | | | 53,683 | |
Alexion Pharmaceuticals, Inc.* | | | | 622 | | | | | 60,918 | |
Alphabet, Inc., Class A* | | | | 70 | | | | | 85,965 | |
Amazon.com, Inc.* | | | | 30 | | | | | 52,366 | |
Anthem, Inc. | | | | 256 | | | | | 61,466 | |
Aptiv plc | | | | 1,025 | | | | | 89,639 | |
Arista Networks, Inc.* | | | | 286 | | | | | 68,230 | |
Atlassian Corp. plc, Class A* | | | | 275 | | | | | 34,540 | |
Bank of America Corp. | | | | 3,901 | | | | | 113,779 | |
Boston Scientific Corp.* | | | | 2,200 | | | | | 89,520 | |
Ceridian HCM Holding, Inc.* | | | | 757 | | | | | 37,368 | |
Fidelity National Information Services, Inc. | | | | 867 | | | | | 115,106 | |
Fortive Corp. | | | | 890 | | | | | 61,035 | |
IHS Markit Ltd.* | | | | 3,092 | | | | | 206,812 | |
Illumina, Inc.* | | | | 127 | | | | | 38,557 | |
L3Harris Technologies, Inc. | | | | 552 | | | | | 115,119 | |
Lowe’s Cos., Inc. | | | | 824 | | | | | 90,641 | |
Microsoft Corp. | | | | 898 | | | | | 124,871 | |
NextEra Energy, Inc. | | | | 98 | | | | | 22,722 | |
Progressive Corp. (The) | | | | 655 | | | | | 50,634 | |
Veeva Systems, Inc., Class A* | | | | 331 | | | | | 50,466 | |
Visa, Inc., Class A | | | | 333 | | | | | 57,283 | |
Zoom Video Communications, Inc., Class A* | | | | 270 | | | | | 20,550 | |
| | | | | | | | | | |
| | | | | | | | | 1,846,625 | |
| | | | | | | | | | |
Total common stocks
(Cost $2,444,151) | | | | | 3,180,198 | |
| | | | | | |
| SHORT-TERM INVESTMENTS - 6.1% |
| | | | | | | | | | |
| INVESTMENT COMPANIES - 6.1% |
BlackRock Liquidity Funds Treasury Trust Fund - Institutional Class, 2.10% | | | | 70,012 | | | | | 70,012 | |
Federated Treasury Obligations Fund - Institutional Class, 1.96% | | | | 67,953 | | | | | 67,953 | |
Fidelity Investments Money Market Treasury Portfolio - Institutional Class, 2.04% | | | | 67,952 | | | | | 67,952 | |
| | | | | | | | | | |
Total short-term investments
(Cost $205,917) | | | | | 205,917 | |
| | | | | | | | | | |
| | | | | | |
Total investments - 99.8%
(Cost $2,650,068) | | | | | 3,386,115 | |
| | | | | | | | | | |
Other assets less liabilities - 0.2% | | | | | 8,836 | |
| | | | | | | | | | |
| | | | | | | | | | |
Total net assets - 100.0%(1) | | | | $ | 3,394,951 | |
| | | | | | | | | | |
| | |
| Artisan Partners Funds | | 39 |
| * | | Non-income producing security. |
| (1) | | Percentages for the various classifications relate to total net assets. |
Company names are as reported by a data service provider and in some cases are translations; a company’s legal name may be different.
| | |
| Abbreviation |
ADR | | American Depositary Receipt |
| | | | | | | | | | |
| PORTFOLIO DIVERSIFICATION |
Dollar values in thousands | |
| | | Value | | Percentage
of Total
Investments |
Communication Services | | | $ | 240,235 | | | | | 7.1 | % |
Consumer Discretionary | | | | 365,007 | | | | | 10.8 | |
Consumer Staples | | | | 109,274 | | | | | 3.2 | |
Financials | | | | 295,745 | | | | | 8.7 | |
Health Care | | | | 745,384 | | | | | 22.0 | |
Industrials | | | | 576,431 | | | | | 17.0 | |
Information Technology | | | | 752,760 | | | | | 22.3 | |
Materials | | | | 46,920 | | | | | 1.4 | |
Utilities | | | | 48,442 | | | | | 1.4 | |
Short-Term Investments | | | | 205,917 | | | | | 6.1 | |
| | | | | | | | | | |
Total investments | | | $ | 3,386,115 | | | | | 100.0 | % |
| | | | | | | | | | |
| | | | | | | | | | |
| TRADING CURRENCIES |
Dollar values in thousands | |
| | | Value | | Percentage
of Total
Investments |
Australian dollar | | | $ | 47,871 | | | | | 1.4 | % |
British pound | | | | 348,350 | | | | | 10.3 | |
Danish krone | | | | 167,886 | | | | | 4.9 | |
Euro | | | | 205,718 | | | | | 6.1 | |
Hong Kong dollar | | | | 227,245 | | | | | 6.7 | |
Japanese yen | | | | 93,516 | | | | | 2.8 | |
Swiss franc | | | | 148,927 | | | | | 4.4 | |
U.S. dollar | | | | 2,146,602 | | | | | 63.4 | |
| | | | | | | | | | |
Total investments | | | $ | 3,386,115 | | | | | 100.0 | % |
| | | | | | | | | | |
| | | | | | | |
| TOP TEN HOLDINGS |
Company Name | | Country | | Percentage
of Total
Net Assets |
IHS Markit Ltd. | | United States | | | | 6.1 | % |
AstraZeneca plc | | United Kingdom | | | | 4.3 | |
Techtronic Industries Co. Ltd. | | Hong Kong | | | | 3.7 | |
Microsoft Corp. | | United States | | | | 3.7 | |
L3Harris Technologies, Inc. | | United States | | | | 3.4 | |
Fidelity National Information Services, Inc. | | United States | | | | 3.4 | |
Bank of America Corp. | | United States | | | | 3.4 | |
Lonza Group AG | | Switzerland | | | | 3.1 | |
Genmab A/S | | Denmark | | | | 3.0 | |
London Stock Exchange Group plc | | United Kingdom | | | | 2.8 | |
| | | | | | | |
Total | | | | | | 36.9 | % |
| | | | | | | |
For the purpose of determining the Fund’s top ten holdings, securities of the same issuer are aggregated to determine the weight in the Fund.
The accompanying notes are an integral part of the financial statements.
| | |
| 40 | | Artisan Partners Funds |
ARTISAN GLOBAL VALUE FUND
Schedule of Investments – September 30, 2019
Shares and dollar values in thousands
| | | | | | | | | | |
| | | Shares
Held | | Value |
| | | | | | | | | | |
| COMMON STOCKS - 93.4% |
| | | | | | | | | | |
| BELGIUM - 1.8% |
Groupe Bruxelles Lambert SA | | | | 569 | | | | $ | 54,598 | |
| | | | | | | | | | |
| BRAZIL - 2.8% |
Telefonica Brasil SA, ADR | | | | 6,548 | | | | | 86,232 | |
| | | | | | | | | | |
| CANADA - 1.6% |
Imperial Oil Ltd. | | | | 1,906 | | | | | 49,640 | |
| | | | | | | | | | |
| CHINA - 1.5% |
Baidu, Inc., ADR* | | | | 452 | | | | | 46,478 | |
| | | | | | | | | | |
| FRANCE - 1.2% |
Sodexo SA | | | | 337 | | | | | 37,794 | |
| | | | | | | | | | |
| INDIA - 0.7% |
Bharti Infratel Ltd. | | | | 6,286 | | | | | 22,821 | |
| | | | | | | | | | |
| NETHERLANDS - 5.3% |
ING Groep NV | | | | 4,321 | | | | | 45,235 | |
NXP Semiconductors NV | | | | 1,078 | | | | | 117,629 | |
| | | | | | | | | | |
| | | | | | | | | 162,864 | |
| SOUTH KOREA - 5.6% |
Hyundai Motor Co. | | | | 206 | | | | | 23,107 | |
Samsung Electronics Co. Ltd. | | | | 3,613 | | | | | 148,172 | |
| | | | | | | | | | |
| | | | | | | | | 171,279 | |
| SPAIN - 0.4% |
Bankia SA | | | | 5,992 | | | | | 11,315 | |
| | | | | | | | | | |
| SWITZERLAND - 10.9% |
ABB Ltd. | | | | 5,261 | | | | | 103,370 | |
Cie Financiere Richemont SA | | | | 1,214 | | | | | 89,030 | |
Nestle SA | | | | 444 | | | | | 48,212 | |
UBS Group AG* | | | | 8,294 | | | | | 94,155 | |
| | | | | | | | | | |
| | | | | | | | | 334,767 | |
| UNITED KINGDOM - 9.4% |
BAE Systems plc | | | | 8,953 | | | | | 62,749 | |
IMI plc | | | | 2,460 | | | | | 29,037 | |
Lloyds Banking Group plc | | | | 121,327 | | | | | 80,735 | |
Royal Bank of Scotland Group plc | | | | 16,714 | | | | | 42,664 | |
Tesco plc | | | | 25,333 | | | | | 75,068 | |
| | | | | | | | | | |
| | | | | | | | | 290,253 | |
| UNITED STATES - 52.2% |
Advance Auto Parts, Inc. | | | | 279 | | | | | 46,173 | |
Allergan plc | | | | 387 | | | | | 65,212 | |
| | | | | | | | | | |
| UNITED STATES (CONTINUED) |
Alphabet, Inc., Class A* | | | | 61 | | | | | 74,971 | |
Alphabet, Inc., Class C* | | | | 28 | | | | | 34,663 | |
American Express Co. | | | | 705 | | | | | 83,401 | |
Aon plc | | | | 255 | | | | | 49,446 | |
Arch Capital Group Ltd.* | | | | 2,170 | | | | | 91,077 | |
Bank of New York Mellon Corp. (The) | | | | 2,384 | | | | | 107,780 | |
Booking Holdings, Inc.* | | | | 35 | | | | | 68,191 | |
Citigroup, Inc. | | | | 1,506 | | | | | 104,042 | |
Cognizant Technology Solutions Corp., Class A | | | | 1,163 | | | | | 70,082 | |
DENTSPLY SIRONA, Inc. | | | | 1,708 | | | | | 91,079 | |
Expedia Group, Inc. | | | | 787 | | | | | 105,803 | |
Facebook, Inc., Class A* | | | | 532 | | | | | 94,660 | |
FedEx Corp. | | | | 588 | | | | | 85,611 | |
Marsh & McLennan Cos., Inc. | | | | 929 | | | | | 92,935 | |
Medtronic plc | | | | 770 | | | | | 83,643 | |
Oracle Corp. | | | | 1,720 | | | | | 94,662 | |
Progressive Corp. (The) | | | | 783 | | | | | 60,479 | |
United Technologies Corp. | | | | 384 | | | | | 52,381 | |
Wells Fargo & Co. | | | | 986 | | | | | 49,715 | |
| | | | | | | | | | |
| | | | | | | | | 1,606,006 | |
| | | | | | | | | | |
Total common stocks
(Cost $2,411,361) | | | | | 2,874,047 | |
| | | | | | |
| SHORT-TERM INVESTMENTS - 6.0% |
| | | | | | | | | | |
| INVESTMENT COMPANIES - 6.0% |
BlackRock Liquidity Funds Treasury Trust Fund - Institutional Class, 2.10% | | | | 62,566 | | | | | 62,566 | |
Federated Treasury Obligations Fund - Institutional Class, 1.96% | | | | 60,726 | | | | | 60,726 | |
Fidelity Investments Money Market Treasury Portfolio - Institutional Class, 2.04% | | | | 60,725 | | | | | 60,725 | |
| | | | | | | | | | |
Total short-term investments
(Cost $184,017) | | | | | 184,017 | |
| | | | | | | | | | |
| | | | | | |
Total investments - 99.4%
(Cost $2,595,378) | | | | | 3,058,064 | |
| | | | | | | | | | |
Other assets less liabilities - 0.6% | | | | | 17,814 | |
| | | | | | | | | | |
| | | | | | | | | | |
Total net assets - 100.0%(1) | | | | $ | 3,075,878 | |
| | | | | | | | | | |
| | |
| Artisan Partners Funds | | 41 |
| * | | Non-income producing security. |
| (1) | | Percentages for the various classifications relate to total net assets. |
Company names are as reported by a data service provider and in some cases are translations; a company’s legal name may be different.
| | |
| Abbreviation |
ADR | | American Depositary Receipt |
| | | | | | | | | | | | | | | | |
| FOREIGN CURRENCY FORWARD CONTRACTS |
Values in thousands |
| | | | | | | | | | | | | | |
Currency
Purchased | | Currency Sold | | Counterparty | | Settlement
Date | | Unrealized
Appreciation
(Depreciation) |
USD 67,818 | | CNH 461,300 | | JPM | | | | 11/13/2019 | | | | $ | 3,286 | |
| | | | | | | | | | | | | | |
Total unrealized appreciation | | | | | | | | | 3,286 | |
| | | | | | | | | | | | | | |
CNH 181,271 | | USD 26,010 | | JPM | | | | 11/13/2019 | | | | | (652 | ) |
| | | | | | | | | | | | | | |
Total unrealized depreciation | | | | | | | | | (652 | ) |
| | | | | | | | | | | | | | |
Net unrealized appreciation | | | | | | | | $ | 2,634 | |
| | | | | | | | | | | | | | |
| | |
CNH | | Chinese yuan renminbi offshore |
USD | | U.S. dollar |
JPM | | JPMorgan Chase Bank, N.A. |
| | | | | | | | | | |
| PORTFOLIO DIVERSIFICATION |
Dollar values in thousands | |
| | | Value | | Percentage
of Total
Investments |
Communication Services | | | $ | 359,825 | | | | | 11.8 | % |
Consumer Discretionary | | | | 370,098 | | | | | 12.1 | |
Consumer Staples | | | | 123,280 | | | | | 4.0 | |
Energy | | | | 49,640 | | | | | 1.6 | |
Financials | | | | 967,577 | | | | | 31.6 | |
Health Care | | | | 239,934 | | | | | 7.9 | |
Industrials | | | | 333,148 | | | | | 10.9 | |
Information Technology | | | | 430,545 | | | | | 14.1 | |
Short-Term Investments | | | | 184,017 | | | | | 6.0 | |
| | | | | | | | | | |
Total investments | | | $ | 3,058,064 | | | | | 100.0 | % |
| | | | | | | | | | |
| | | | | | | | | | |
| TRADING CURRENCIES |
Dollar values in thousands | |
| | | Value | | Percentage
of Total
Investments |
British pound | | | $ | 290,253 | | | | | 9.5 | % |
Canadian dollar | | | | 49,640 | | | | | 1.6 | |
Euro | | | | 148,942 | | | | | 5.0 | |
Indian rupee | | | | 22,821 | | | | | 0.7 | |
Korean won | | | | 171,279 | | | | | 5.6 | |
Swiss franc | | | | 334,767 | | | | | 10.9 | |
U.S. dollar | | | | 2,040,362 | | | | | 66.7 | |
| | | | | | | | | | |
Total investments | | | $ | 3,058,064 | | | | | 100.0 | % |
| | | | | | | | | | |
| | | | | | | |
| TOP TEN HOLDINGS |
Company Name | | Country | | Percentage
of Total
Net Assets |
Samsung Electronics Co. Ltd. | | South Korea | | | | 4.8 | % |
NXP Semiconductors NV | | Netherlands | | | | 3.8 | |
Alphabet, Inc. | | United States | | | | 3.6 | |
Bank of New York Mellon Corp. (The) | | United States | | | | 3.5 | |
Expedia Group, Inc. | | United States | | | | 3.4 | |
Citigroup, Inc. | | United States | | | | 3.4 | |
ABB Ltd. | | Switzerland | | | | 3.4 | |
Oracle Corp. | | United States | | | | 3.1 | |
Facebook, Inc. | | United States | | | | 3.1 | |
UBS Group AG | | Switzerland | | | | 3.1 | |
| | | | | | | |
Total | | | | | | 35.2 | % |
| | | | | | | |
For the purpose of determining the Fund’s top ten holdings, securities of the same issuer are aggregated to determine the weight in the Fund.
The accompanying notes are an integral part of the financial statements.
| | |
| 42 | | Artisan Partners Funds |
ARTISAN HIGH INCOME FUND
Schedule of Investments – September 30, 2019
Shares and dollar values in thousands
| | | | | | | | | | |
| | | Principal
Amount | | Value |
| CORPORATE BONDS - 64.0% |
| | | | | | | | | | |
| AGRICULTURE - 0.1% |
Pinnacle Operating Corp.
9.00%, 5/15/2023(1)(2) | | | $ | 13,301 | | | | $ | 4,655 | |
| | | | | | | | | | |
| AUTO MANUFACTURERS - 1.3% |
Tesla, Inc. 5.30%, 8/15/2025(1) | | | | 55,500 | | | | | 49,811 | |
| | | | | | | | | | |
| AUTO PARTS & EQUIPMENT - 0.5% |
Truck Hero, Inc. 8.50%, 4/21/2024(1) | | | | 17,250 | | | | | 17,078 | |
| | | | | | | | | | |
| CHEMICALS - 0.4% |
NOVA Chemicals Corp.
5.25%, 6/1/2027(1)(3) | | | | 13,000 | | | | | 13,531 | |
Starfruit Finco BV 8.00%, 10/1/2026(1)(3) | | | | 3,000 | | | | | 2,993 | |
| | | | | | | | | | |
| | | | | | | | | 16,524 | |
| DISTRIBUTION/WHOLESALE - 1.0% |
Core & Main Holdings LP 8.63% Cash,
9.38% PIK, 9/15/2024(1)(4) | | | | 36,875 | | | | | 37,152 | |
| | | | | | | | | | |
| DIVERSIFIED FINANCIAL SERVICES - 3.4% |
NFP Corp. 6.88%, 7/15/2025(1) | | | | 86,258 | | | | | 85,611 | |
Springleaf Finance Corp.
7.13%, 3/15/2026 | | | | 30,000 | | | | | 33,280 | |
TMX Finance LLC 11.13%, 4/1/2023(1) | | | | 9,500 | | | | | 8,788 | |
| | | | | | | | | | |
| | | | | | | | | 127,679 | |
| ENGINEERING & CONSTRUCTION - 3.3% |
Great Lakes Dredge & Dock Corp.
8.00%, 5/15/2022 | | | | 30,120 | | | | | 32,102 | |
New Enterprise Stone & Lime Co., Inc.
10.13%, 4/1/2022(1) | | | | 20,530 | | | | | 21,095 | |
Tutor Perini Corp. 6.88%, 5/1/2025(1) | | | | 73,821 | | | | | 71,606 | |
| | | | | | | | | | |
| | | | | | | | | 124,803 | |
| FOOD - 0.6% |
H-Food Holdings LLC 8.50%, 6/1/2026(1) | | | | 30,465 | | | | | 22,696 | |
| | | | | | | | | | |
| HAND/MACHINE TOOLS - 1.1% |
Werner FinCo LP 8.75%, 7/15/2025(1) | | | | 47,719 | | | | | 40,800 | |
| | | | | | | | | | |
| HEALTHCARE-SERVICES - 2.9% |
Acadia Healthcare Co., Inc. | | | | | | | | | | |
5.13%, 7/1/2022 | | | | 4,500 | | | | | 4,534 | |
5.63%, 2/15/2023 | | | | 16,285 | | | | | 16,590 | |
6.50%, 3/1/2024 | | | | 6,365 | | | | | 6,620 | |
| HEALTHCARE-SERVICES (CONTINUED) |
Community Health Systems, Inc.
8.00%, 3/15/2026(1) | | | | 14,036 | | | | | 14,001 | |
Eagle Holding Co. II LLC 7.63% Cash,
8.38% PIK, 5/15/2022(1)(4) | | | | 13,228 | | | | | 13,327 | |
HCA, Inc. 5.50%, 6/15/2047 | | | | 10,000 | | | | | 11,306 | |
Polaris Intermediate Corp. 8.50% Cash, 9.25% PIK, 12/1/2022(1)(4) | | | | 14,250 | | | | | 12,112 | |
Surgery Center Holdings, Inc.
10.00%, 4/15/2027(1) | | | | 31,000 | | | | | 31,465 | |
| | | | | | | | | | |
| | | | | | | | | 109,955 | |
| HOLDING COMPANIES-DIVERSIFIED - 1.4% |
VistaJet Malta Finance plc
10.50%, 6/1/2024(1)(3) | | | | 56,035 | | | | | 54,354 | |
| | | | | | | | | | |
| INSURANCE - 9.3% |
Acrisure LLC | | | | | | |
7.00%, 11/15/2025(1) | | | | 68,816 | | | | | 64,157 | |
10.13%, 8/1/2026(1) | | | | 19,446 | | | | | 20,321 | |
Aon Corp. 8.21%, 1/1/2027 | | | | 23,398 | | | | | 29,715 | |
Ardonagh Midco 3 plc | | | | | | |
8.63%, 7/15/2023(1)(3) | | | | 105,318 | | | | | 101,632 | |
8.63%, 7/15/2023(1)(3) | | | | 55,290 | | | | | 52,802 | |
AssuredPartners, Inc.
7.00%, 8/15/2025(1) | | | | 30,355 | | | | | 30,355 | |
GTCR AP Finance, Inc.
8.00%, 5/15/2027(1) | | | | 33,000 | | | | | 33,907 | |
HUB International Ltd.
7.00%, 5/1/2026(1) | | | | 20,064 | | | | | 20,641 | |
| | | | | | | | | | |
| | | | | | | | | 353,530 | |
| MACHINERY-DIVERSIFIED - 0.8% |
SPX FLOW, Inc. 5.63%, 8/15/2024(1) | | | | 29,250 | | | | | 30,201 | |
| | | | | | | | | | |
| MEDIA - 9.2% |
Altice Luxembourg SA | | | | | | |
7.75%, 5/15/2022(1)(3) | | | | 1,106 | | | | | 1,130 | |
7.63%, 2/15/2025(1)(3) | | | | 35,000 | | | | | 36,487 | |
Cablevision Systems Corp.
5.88%, 9/15/2022 | | | | 44,077 | | | | | 47,493 | |
CCO Holdings LLC | | | | | | |
5.50%, 5/1/2026(1) | | | | 54,580 | | | | | 57,167 | |
5.13%, 5/1/2027(1) | | | | 51,000 | | | | | 53,231 | |
CSC Holdings LLC | | | | | | |
7.50%, 4/1/2028(1) | | | | 15,000 | | | | | 16,892 | |
Diamond Sports Group LLC | | | | | | | | | | |
5.38%, 8/15/2026(1) | | | | 2,950 | | | | | 3,060 | |
6.63%, 8/15/2027(1) | | | | 3,934 | | | | | 4,076 | |
| | |
| Artisan Partners Funds | | 43 |
| | | | | | | | | | |
| | | Principal
Amount | | Value |
| MEDIA (CONTINUED) |
Virgin Media Secured Finance plc
5.50%, 8/15/2026(1)(3) | | | $ | 27,999 | | | | $ | 29,372 | |
Walt Disney Co. (The)
6.20%, 12/15/2034(1) | | | | 31,184 | | | | | 44,376 | |
Ziggo BV
5.50%, 1/15/2027(1)(3) | | | | 50,966 | | | | | 53,132 | |
| | | | | | | | | | |
| | | | | | | | | 346,416 | |
| MINING - 0.2% | | |
Compass Minerals International, Inc.
4.88%, 7/15/2024(1) | | | | 7,935 | | | | | 7,816 | |
| | | | | | | | | | |
| MISCELLANEOUS MANUFACTURING - 7.2% | | |
FXI Holdings, Inc.
7.88%, 11/1/2024(1) | | | | 23,000 | | | | | 20,010 | |
General Electric Co.
Series D, (ICE LIBOR USD 3 Month + 3.33%), 5.00%, 1/21/2021(5)(6) | | | | 24,477 | | | | | 23,223 | |
6.75%, 3/15/2032 | | | | 142,917 | | | | | 179,760 | |
5.88%, 1/14/2038 | | | | 10,000 | | | | | 12,013 | |
6.88%, 1/10/2039 | | | | 28,671 | | | | | 37,948 | |
| | | | | | | | | | |
| | | | | | | | | 272,954 | |
| OIL & GAS - 5.9% | | | | |
Carrizo Oil & Gas, Inc.
8.25%, 7/15/2025 | | | | 13,810 | | | | | 13,528 | |
Endeavor Energy Resources LP | | | | | | | | | | |
5.50%, 1/30/2026(1) | | | | 15,065 | | | | | 15,667 | |
5.75%, 1/30/2028(1) | | | | 32,700 | | | | | 34,744 | |
EP Energy LLC
7.75%, 5/15/2026(1) | | | | 40,841 | | | | | 30,631 | |
Laredo Petroleum, Inc. | | | | | | | | | | |
5.63%, 1/15/2022 | | | | 11,270 | | | | | 10,594 | |
6.25%, 3/15/2023 | | | | 43,031 | | | | | 37,760 | |
Moss Creek Resources Holdings, Inc.
7.50%, 1/15/2026(1) | | | | 17,000 | | | | | 12,516 | |
Northern Oil and Gas, Inc.
8.50% Cash, 9.50% PIK, 5/15/2023(4) | | | | 7,525 | | | | | 7,751 | |
Seven Generations Energy Ltd. | | | | | | | | | | |
6.75%, 5/1/2023(1)(3) | | | | 37,774 | | | | | 38,152 | |
6.88%, 6/30/2023(1)(3) | | | | 15,440 | | | | | 15,787 | |
5.38%, 9/30/2025(1)(3) | | | | 6,000 | | | | | 5,940 | |
| | | | | | | | | | |
| | | | | | | | | 223,070 | |
| OIL & GAS SERVICES - 1.2% | | |
FTS International, Inc.
6.25%, 5/1/2022 | | | | 54,659 | | | | | 44,547 | |
| | | | | | | | | | |
| PACKAGING & CONTAINERS - 2.2% | | |
Crown Cork & Seal Co., Inc.
7.38%, 12/15/2026 | | | | 3,913 | | | | | 4,754 | |
LABL Escrow Issuer LLC | | | | | | | | | | |
6.75%, 7/15/2026(1) | | | | 38,750 | | | | | 40,276 | |
10.50%, 7/15/2027(1) | | | | 40,500 | | | | | 40,905 | |
| | | | | | | | | | |
| | | | | | | | | 85,935 | |
| REAL ESTATE - 1.8% | | | | |
Realogy Group LLC | | | | | | | | | | |
4.88%, 6/1/2023(1) | | | | 54,475 | | | | | 50,934 | |
9.38%, 4/1/2027(1) | | | | 20,000 | | | | | 18,581 | |
| | | | | | | | | | |
| | | | | | | | | 69,515 | |
REAL ESTATE INVESTMENT TRUSTS
(REITS) - 0.7% | | | | |
Uniti Group LP
7.13%, 12/15/2024(1) | | | | 20,071 | | | | | 17,412 | |
VEREIT Operating Partnership LP
4.88%, 6/1/2026 | | | | 6,535 | | | | | 7,239 | |
| | | | | | | | | | |
| | | | | | | | | 24,651 | |
| RETAIL - 5.8% | | | | |
Beacon Roofing Supply, Inc.
4.88%, 11/1/2025(1) | | | | 51,500 | | | | | 50,534 | |
Ferrellgas LP | | | | | | | | | | |
6.50%, 5/1/2021 | | | | 72,075 | | | | | 61,264 | |
6.75%, 6/15/2023 | | | | 3,816 | | | | | 3,215 | |
Ferrellgas Partners LP | | | | | | | | | | |
8.63%, 6/15/2020 | | | | 18,635 | | | | | 14,023 | |
8.63%, 6/15/2020 | | | | 7,316 | | | | | 5,505 | |
Michaels Stores, Inc.
8.00%, 7/15/2027(1) | | | | 47,530 | | | | | 47,589 | |
Sonic Automotive, Inc.
5.00%, 5/15/2023 | | | | 36,479 | | | | | 36,935 | |
| | | | | | | | | | |
| | | | | | | | | 219,065 | |
| SOFTWARE - 0.8% | | | | |
Ascend Learning LLC | | | | | | | | | | |
6.88%, 8/1/2025(1) | | | | 25,313 | | | | | 26,326 | |
6.88%, 8/1/2025(1) | | | | 4,063 | | | | | 4,205 | |
| | | | | | | | | | |
| | | | | | | | | 30,531 | |
| TELECOMMUNICATIONS - 2.9% | | | | |
Frontier Communications Corp.
8.50%, 4/1/2026(1) | | | | 29,000 | | | | | 28,997 | |
T-Mobile USA, Inc. | | | | | | | | | | |
6.50%, 1/15/2026 | | | | 26,750 | | | | | 28,761 | |
4.50%, 2/1/2026 | | | | 39,540 | | | | | 40,699 | |
4.75%, 2/1/2028 | | | | 10,000 | | | | | 10,465 | |
| | | | | | | | | | |
| | | | | | | | | 108,922 | |
| | | | | | | | | | |
Total corporate bonds
(Cost $2,381,387) | | | | | | | | | 2,422,660 | |
| | | | | | | | | | |
| | | | | | | | | | |
| BANK LOANS - 28.7% | | | | |
| | | | | | | | | | |
| AEROSPACE/DEFENSE - 0.5% | | | | |
Jazz Acquisition, Inc. First Lien Term Loan B (ICE LIBOR USD 3 Month + 4.25%),
6.35%, 5/1/2029(6) | | | | 20,000 | | | | | 20,000 | |
| | | | | | | | | | |
| AGRICULTURE - 0.2% | | | | |
Pinnacle Operating Corp. First Lien Term Loan B
(ICE LIBOR USD 1 Month + 5.50%),
9.29%, 11/15/2021(4)(6) | | | | 9,413 | | | | | 7,033 | |
| | |
| 44 | | Artisan Partners Funds |
| | | | | | | | | | |
| | | Principal
Amount | | Value |
| AUTO PARTS & EQUIPMENT - 1.3% | | | | |
Cerence, Inc, Term Loan B
(ICE LIBOR USD 6 Month + 0.00%),
7.79%, 10/1/2024(6)(10) | | | $ | 18,500 | | | | $ | 17,390 | |
Panther BF Aggregator 2 LP First Lien Term Loan B
(ICE LIBOR USD 1 Month + 3.50%),
5.54%, 4/30/2026(6) | | | | 29,500 | | | | | 29,187 | |
| | | | | | | | | | |
| | | | | | | | | 46,577 | |
| CHEMICALS - 1.4% | | | | |
Emerald Performance Materials LLC First Lien Term Loan
(ICE LIBOR USD 1 Month + 3.50%), 5.54%, 7/30/2021(6) | | | | 43,402 | | | | | 43,330 | |
Starfruit US Holdco LLC First Lien Term Loan B (ICE LIBOR USD 1 Month + 3.25%),
5.29%, 10/1/2025(6) | | | | 9,950 | | | | | 9,731 | |
| | | | | | | | | | |
| | | | | | | | | 53,061 | |
| | | | | | | | | | |
| COMMERCIAL SERVICES - 2.1% | | | | |
Digital Room Holdings, Inc. First Lien Term Loan B
(ICE LIBOR USD 1 Month + 5.00%),
7.04%, 5/21/2026(6) | | | | 21,945 | | | | | 20,889 | |
Midas Intermediate Holdco II LLC First Lien Term Loan B
(ICE LIBOR USD 3 Month + 2.75%), 4.85%, 8/18/2021(6) | | | | 47,142 | | | | | 45,398 | |
Servpro Borrower LLC First Lien Term Loan B (ICE LIBOR USD 3 Month + 2.50%),
7.50%, 3/26/2026(6) | | | | 11,443 | | | | | 11,414 | |
| | | | | | | | | | |
| | | | | | | | | 77,701 | |
| DIVERSIFIED FINANCIAL SERVICES - 0.5% | | |
AG Merger Sub II, Inc., Term Loan B
(ICE LIBOR USD 1 Month + 5.00%),
7.04%, 7/31/2026(6) | | | | 20,000 | | | | | 19,575 | |
| | | | | | | | | | |
| FOOD - 1.2% | | | | |
Shearer’s Foods LLC First Lien Term Loan
(ICE LIBOR USD 1 Month + 4.25%),
6.29%, 6/30/2021(6) | | | | 45,593 | | | | | 45,436 | |
| | | | | | | | | | |
| FOOD SERVICE - 3.0% | | | | |
TKC Holdings, Inc. First Lien Term Loan
(ICE LIBOR USD 1 Month + 3.75%),
5.80%, 2/1/2023(6) | | | | 67,299 | | | | | 66,001 | |
TKC Holdings, Inc. Second Lien Term Loan
(ICE LIBOR USD 1 Month + 8.00%),
10.05%, 2/1/2024(6) | | | | 50,174 | | | | | 48,948 | |
| | | | | | | | | | |
| | | | | | | | | 114,949 | |
| | | | | | | | | | |
| HEALTHCARE-SERVICES - 1.6% | | | | |
DentalCorp Perfect Smile ULC Second Lien Term Loan
(ICE LIBOR USD 1 Month + 7.50%), 9.54%, 6/1/2026(6) | | | | 11,050 | | | | | 10,843 | |
| HEALTHCARE-SERVICES (CONTINUED) | | | | |
Heartland Dental LLC First Lien Term Loan
(ICE LIBOR USD 1 Month + 3.75%),
5.79%, 4/30/2025(6) | | | | 31,013 | | | | | 30,315 | |
MPH Acquisition Holdings LLC, Term Loan B (ICE LIBOR USD 3 Month + 2.75%),
4.85%, 6/7/2023(6) | | | | 19,500 | | | | | 18,545 | |
| | | | | | | | | | |
| | | | | | | | | 59,703 | |
| INSURANCE - 3.4% | | | | |
Acrisure LLC First Lien Term Loan B
(ICE LIBOR USD 1 Month + 4.25%),
6.35%, 11/22/2023(6) | | | | 13,894 | | | | | 13,807 | |
AssuredPartners, Inc. First Lien Term Loan B (ICE LIBOR USD 1 Month + 3.50%),
5.54%, 10/22/2024(6) | | | | 19,546 | | | | | 19,440 | |
Hub International Ltd., Term Loan B
(ICE LIBOR USD 3 Month + 3.00%),
5.27%, 4/25/2025(6) | | | | 39,899 | | | | | 39,406 | |
USI, Inc. First Lien Term Loan B
(ICE LIBOR USD 3 Month + 3.00%),
5.10%, 5/16/2024(6) | | | | 58,158 | | | | | 57,153 | |
| | | | | | | | | | |
| | | | | | | | | 129,806 | |
| LEISURE TIME - 0.3% | | | | |
Topgolf International, Inc. First Lien Term Loan B
(ICE LIBOR USD 1 Month + 5.50%),
7.54%, 2/8/2026(6) | | | | 11,502 | | | | | 11,545 | |
| | | | | | | | | | |
| MACHINERY-DIVERSIFIED - 0.3% | | | | |
STS Operating, Inc. First Lien Term Loan
(ICE LIBOR USD 1 Month + 4.25%),
6.29%, 12/11/2024(6) | | | | 9,862 | | | | | 9,628 | |
| | | | | | | | | | |
| MEDIA - 0.2% |
Diamond Sports Group LLC, Term Loan B
(ICE LIBOR USD 1 Month + 3.25%),
5.30%, 8/24/2026(6) | | | | 7,000 | | | | | 7,035 | |
| | | | | | | | | | |
| METAL FABRICATE/HARDWARE - 1.3% |
Anvil International LLC First Lien Term Loan (ICE LIBOR USD 1 Month + 5.00%),
7.05%, 5/28/2026(6) | | | | 32,500 | | | | | 30,388 | |
Werner FinCo L.P. First Lien Term Loan B
(ICE LIBOR USD 1 Month + 4.00%),
6.04%, 7/24/2024(6) | | | | 19,663 | | | | | 19,123 | |
| | | | | | | | | | |
| | | | | | | | | 49,511 | |
| MISCELLANEOUS MANUFACTURING - 1.0% |
Utex Industries, Inc. First Lien Term Loan B
(ICE LIBOR USD 1 Month + 4.00%),
6.04%, 5/21/2021(6) | | | | 42,897 | | | | | 36,248 | |
| | |
| Artisan Partners Funds | | 45 |
| | | | | | | | | | |
| | | Principal
Amount | | Value |
| PACKAGING & CONTAINERS - 0.5% |
Kloeckner Pentaplast of America, Inc., Term Loan B
(ICE LIBOR USD 1 Month + 4.25%),
6.29%, 6/30/2022(6) | | | $ | 22,319 | | | | $ | 19,697 | |
| | | | | | | | | | |
| PHARMACEUTICALS - 1.0% | | | | |
Endo International plc, Term Loan B
(ICE LIBOR USD 1 Month + 4.25%),
6.31%, 4/29/2024(6) | | | | 19,949 | | | | | 18,122 | |
Lanai Holdings III, Inc. First Lien Term Loan B
(ICE LIBOR USD 3 Month + 4.75%),
7.01%, 8/29/2022(6) | | | | 21,845 | | | | | 20,152 | |
| | | | | | | | | | |
| | | | | | | | | 38,274 | |
| REAL ESTATE INVESTMENT TRUSTS (REITS) - 1.0% |
Uniti Group LP First Lien Term Loan B
(ICE LIBOR USD 1 Month + 5.00%),
7.04%, 10/24/2022(6) | | | | 38,416 | | | | | 37,419 | |
| | | | | | | | | | |
| RETAIL - 1.5% |
Ascena Retail Group, Inc. First Lien Term Loan B
(ICE LIBOR USD 1 Month + 4.50%),
6.56%, 8/21/2022(6) | | | | 14,000 | | | | | 7,717 | |
Neiman Marcus Group Ltd. LLC First Lien Term Loan
(ICE LIBOR USD 1 Month + 6.00%),
8.06%, 10/25/2023(6) | | | | 29,149 | | | | | 22,094 | |
Portillo’s Holdings LLC First Lien Term Loan
(ICE LIBOR USD 3 Month + 4.50%),
6.60%, 8/2/2021(6) | | | | 574 | | | | | 573 | |
SRS Distribution, Inc. First Lien Term Loan B
(ICE LIBOR USD 1 Month + 3.25%),
5.29%, 5/23/2025(6) | | | | 28,967 | | | | | 28,194 | |
| | | | | | | | | | |
| | | | | | | | | 58,578 | |
| | | | | | | | | | |
| SOFTWARE - 5.1% |
Renaissance Holdings Corp. First Lien Term Loan
(ICE LIBOR USD 1 Month + 3.25%),
5.29%, 5/24/2025(6) | | | | 35,355 | | | | | 34,635 | |
Renaissance Holdings Corp. Second Lien Term Loan
(ICE LIBOR USD 1 Month + 7.00%),
9.04%, 5/25/2026(6) | | | | 22,617 | | | | | 21,727 | |
Vertafore, Inc. First Lien Term Loan B
(ICE LIBOR USD 1 Month + 3.25%),
5.29%, 7/2/2025(6) | | | | 65,615 | | | | | 63,671 | |
Vertafore, Inc. Second Lien Term Loan
(ICE LIBOR USD 1 Month + 7.25%),
9.29%, 7/2/2026(6) | | | | 75,000 | | | | | 73,562 | |
| | | | | | | | | | |
| | | | | | | | | 193,595 | |
| TELECOMMUNICATIONS - 0.3% |
CommScope, Inc. First Lien Term Loan B2
(ICE LIBOR USD 1 Month + 3.25%),
5.29%, 4/6/2026(6) | | | | 12,000 | | | | | 11,947 | |
| | | | | | | | | | |
| TRANSPORTATION - 1.0% | | | | |
SIRVA Worldwide, Inc. First Lien Term Loan | | | | | | | | | | |
(ICE LIBOR USD 3 Month + 5.50%),
7.54%, 8/4/2025(7) | | | | 26,552 | | | | | 25,622 | |
(ICE LIBOR USD 3 Month + 5.50%),
7.60%, 8/4/2025(7) | | | | 661 | | | | | 638 | |
(ICE LIBOR USD 3 Month + 5.50%),
7.62%, 8/4/2025(7) | | | | 7,048 | | | | | 6,802 | |
(ICE LIBOR USD 3 Month + 5.50%),
7.76%, 8/4/2025(7) | | | | 6,952 | | | | | 6,708 | |
| | | | | | | | | | |
| | | | | | | | | 39,770 | |
| | | | | | | | | | |
Total bank loans
(Cost $1,113,836) | | | | | | | | | 1,087,088 | |
| | |
| | | Shares
Held | | |
| PREFERRED STOCKS - 0.1% | | | | |
| | | | | | | | | | |
| AGRICULTURE - 0.0%(7) | | | | |
Pinnacle Agriculture Holdings LLC*(2)(8)(9) | | | | 9,263 | | | | | 322 | |
| | | | | | | | | | |
| APPAREL - 0.1% | | | | |
Chinos Holdings, Inc., 5.00%
Cash, 2.00% Capitalization(1)(4)(5) | | | | 4,631 | | | | | 2,543 | |
| | | | | | | | | | |
Total preferred stocks
(Cost $8,333) | | | | | | | | | 2,865 | |
| | | | | | | | | | |
| COMMON STOCK - 0.0%(7) |
| | | | | | | | | | |
| RETAIL - 0.0%(7) |
Chinos Holdings, Inc., Class A* | | | | 406 | | | | $ | 372 | |
| | | | | | | | | | |
Total common stock
(Cost $–) | | | | | | | | | 372 | |
| | |
| | | Principal
Amount | | |
| CORPORATE BOND ESCROW - 0.0% |
| | | | | | | | | | |
| OIL & GAS - 0.0% |
Mid-States Petroleum, Inc. (escrow shares)
10.00%, 6/1/2020(8)(9) | | | $ | 13,300 | | | | | – | |
| | | | | | | | | | |
Total corporate bond escrow
(Cost $–) | | | | | | | | | – | |
| | | | | | | | | | |
| | |
| 46 | | Artisan Partners Funds |
| | | | | | | | | | |
| | |
| | | Shares
Held | | Value |
| SHORT-TERM INVESTMENTS - 5.6% |
| | | | | | | | | | |
| INVESTMENT COMPANIES - 5.6% |
BlackRock Liquidity Funds Treasury Trust Fund - Institutional Class, 2.10% | | | $ | 72,482 | | | | $ | 72,482 | |
Federated Treasury Obligations Fund - Institutional Class, 1.96% | | | | 70,350 | | | | | 70,350 | |
Fidelity Investments Money Market Treasury Portfolio - Institutional Class, 2.04% | | | | 70,350 | | | | | 70,350 | |
| | | | | | | | | | |
Total short-term investments
(Cost $213,182) | | | | | | | | | 213,182 | |
| | | | | | | | | | |
| | | | | | | | | | |
Total investments - 98.4%
(Cost $3,716,738) | | | | | | | | | 3,726,167 | |
| | | | | | | | | | |
Other assets less liabilities - 1.6% | | | | | | | | | 62,145 | |
| | | | | | | | | | |
| | | | | | | | | | |
Total net assets - 100.0%(11) | | | | | | | | $ | 3,788,312 | |
| | | | | | | | | | |
| * | | Non-income producing security. |
| (1) | | Security exempt from registration pursuant to Rule 144A under the Securities Act of 1933, as amended. May be resold in transactions exempt from registration, normally to qualified institutional buyers. |
| (2) | | Security is restricted. Security was acquired in a transaction pursuant to Rule 144A under the Securities Act of 1933, as amended, on the date or during the period noted below. |
| | | | | | | | | | | | | | | | | | | | |
| Security | | Acquisition
Date(s) | | Cost | | Value | | Percentage
of Total
Net Assets |
Pinnacle Operating Corp., 9.00%, 05/15/2023 | | |
| 3/28/2014-
3/24/2017 |
| | | $ | 15,067 | | | | $ | 4,655 | | | | | 0.1 | % |
Pinnacle Agriculture Holdings LLC | | | | 3/10/2017 | | | | | 6,546 | | | | | 322 | | | | | 0.0 | %(7) |
| (3) | | The Fund considers the company to be from outside the United States. See the Fund’s Statement of Additional Information for a description of the methodology used for country classifications. |
| | | | | | | | | | |
| Security | | Country | | Trading
Currency |
Altice Luxembourg SA,
7.75%, 5/15/2022 | | Luxembourg | | U.S. dollar |
Altice Luxembourg SA,
7.63%, 2/15/2025 | | Luxembourg | | U.S. dollar |
Ardonagh Midco 3 plc,
8.63%, 7/15/2023 | | United Kingdom | | U.S. dollar |
Ardonagh Midco 3 plc,
8.63%, 7/15/2023 | | United Kingdom | | U.S. dollar |
NOVA Chemicals Corp.,
5.25%, 6/1/2027 | | Canada | | U.S. dollar |
Seven Generations Energy Ltd.,
6.75%, 5/1/2023 | | Canada | | U.S. dollar |
Seven Generations Energy Ltd.,
6.88%, 6/30/2023 | | Canada | | U.S. dollar |
Seven Generations Energy Ltd.,
5.38%, 9/30/2025 | | Canada | | U.S. dollar |
Starfruit Finco BV,
8.00%, 10/1/2026 | | Netherlands | | U.S. dollar |
Virgin Media Secured Finance plc,
5.50%, 8/15/2026 | | United Kingdom | | U.S. dollar |
VistaJet Malta Finance plc,
10.50%, 6/1/2024 | | Switzerland | | U.S. dollar |
Ziggo BV,
5.50%, 1/15/2027 | | Netherlands | | U.S. dollar |
| (4) | | Paymentin-kind security. |
| (5) | | Perpetual security. The rate reflected was the rate in effect on September 30, 2019. The maturity date reflects the next call date. |
| (6) | | Variable or floating rate security, linked to the referenced benchmark. The interest rate shown is the current rate as of September 30, 2019. |
| (7) | | Amount rounds to less than 0.1%. |
| (8) | | Valued at a fair value in accordance with procedures established by the board of directors of Artisan Partners Funds. In total, securities valued at a fair value were $322 or less than 0.1% of total net assets. See notes 2(a) and 4 in Notes to Financial Statements for additional information. |
| (9) | | Security is valued using significant unobservable inputs and is classified as Level 3 in the fair value hierarchy. |
| (10) | | When-issued security. |
| (11) | | Percentages for the various classifications relate to total net assets. |
Company names are as reported by a data service provider and in some cases are translations; a company’s legal name may be different.
| | |
| Abbreviations |
ICE | | Intercontinental Exchange |
LIBOR | | London Interbank Offered Rate |
USD | | U.S. dollar |
UNFUNDED LOAN COMMITMENTS
Pursuant to the terms of the following bank loan agreements, the portfolio had unfunded loan commitments of $692 or less than 0.1% of the total net assets as of September 30, 2019, which could be drawn at the option of the borrower:
| | | | | | | | | | | | | | | |
| Borrower | | Unfunded
Commitment
Amount | | Unfunded
Value | | Unrealized
(Depreciation) |
Heartland Dental LLC First Lien Delayed Draw Term Loan | | | $ | 692 | | | | $ | 682 | | | | $ | (10 | ) |
| | | | | | | | | | | | | | | |
| | | $ | 692 | | | | $ | 682 | | | | $ | (10 | ) |
| | | | | | | | | | | | | | | |
| | |
| Artisan Partners Funds | | 47 |
| | | | | | | | | | | | | | | | | | | | | | | | | | | | | | |
| FUTURES CONTRACTS |
Dollar values in thousands | |
| Description | | Number of
Contracts | | Expiration
Date | | Trading
Currency | | Notional
Amount | | Notional
Value | | Unrealized
Appreciation |
| Short Positions Contracts | | | | | | |
| U.S. Treasury 10 Year Note | | | | (1,505 | ) | | | | 12/19/2019 | | | | | USD | | | | $ | 150,500 | | | | $ | (196,120 | ) | | | $ | 1,535 | |
| U.S. Treasury Long Bond | | | | (200 | ) | | | | 12/19/2019 | | | | | USD | | | | | 20,000 | | | | | (32,463 | ) | | | | 462 | |
| | | | | | | | | | | | | | | | | | | | | | | | | | | | | | |
| | | | | | | | | | | | | | | | | | | | | | | | | | | | $ | 1,997 | |
| | | | | | | | | | | | | | | | | | | | | | | | | | | | | | |
The Fund has recorded an asset of $124 as of September 30, 2019, related to the current day’s variation margin related to these contracts.
| | | | | | | |
| TOP TEN HOLDINGS |
Company Name | | Country | | Percentage
of Total
Net Assets |
General Electric Co. | | United States | | | | 6.7 | % |
Ardonagh Midco 3 plc | | United Kingdom | | | | 4.1 | |
CCO Holdings LLC | | United States | | | | 2.9 | |
NFP Corp. | | United States | | | | 2.3 | |
Acrisure LLC | | United States | | | | 2.2 | |
LABL Escrow Issuer LLC | | United States | | | | 2.1 | |
T-Mobile USA, Inc. | | United States | | | | 2.1 | |
Vertafore, Inc. Second Lien Term Loan | | United States | | | | 1.9 | |
Tutor Perini Corp. | | United States | | | | 1.9 | |
Realogy Group LLC | | United States | | | | 1.8 | |
| | | | | | | |
Total | | | | | | 28.0 | % |
| | | | | | | |
For the purpose of determining the Fund’s top ten holdings, securities of the same issuer are aggregated to determine the weight in the Fund.
The accompanying notes are an integral part of the financial statements.
| | |
| 48 | | Artisan Partners Funds |
ARTISAN INTERNATIONAL FUND
Schedule of Investments – September 30, 2019
Shares and dollar values in thousands
| | | | | | | | | | |
| | | Shares
Held | | Value |
| | | | | | | | | | |
COMMON STOCKS AND EQUITY-LINKED
SECURITY - 96.8% | | |
| | | | | | | | | | |
| BRAZIL - 4.8% |
B3 SA - Brasil Bolsa Balcao | | | | 4,472 | | | | $ | 47,165 | |
Petrobras Distribuidora SA | | | | 4,452 | | | | | 29,443 | |
Petroleo Brasileiro SA, ADR* | | | | 14,480 | | | | | 209,525 | |
Petroleo Brasileiro SA (Preference) | | | | 33,977 | | | | | 224,960 | |
| | | | | | | | | | |
| | | | | | | | | 511,093 | |
| CANADA - 1.4% |
Canadian National Railway Co. | | | | 852 | | | | | 76,568 | |
Dollarama, Inc. | | | | 1,189 | | | | | 42,571 | |
TMX Group Ltd. | | | | 282 | | | | | 24,347 | |
| | | | | | | | | | |
| | | | | | | | | 143,486 | |
| CHINA - 0.3% |
ANTA Sports Products Ltd. | | | | 3,912 | | | | | 32,368 | |
| | | | | | | | | | |
| DENMARK - 3.1% |
Carlsberg A/S, Class B | | | | 163 | | | | | 24,036 | |
DSV A/S | | | | 108 | | | | | 10,259 | |
Genmab A/S* | | | | 1,090 | | | | | 221,171 | |
Novo Nordisk A/S, Class B | | | | 1,292 | | | | | 66,400 | |
| | | | | | | | | | |
| | | | | | | | | 321,866 | |
| FRANCE - 14.0% |
Air Liquide SA | | | | 2,852 | | | | | 405,947 | |
Airbus SE | | | | 2,934 | | | | | 381,207 | |
Amundi SA | | | | 1,159 | | | | | 80,856 | |
BNP Paribas SA | | | | 3,888 | | | | | 189,321 | |
Eiffage SA | | | | 1,235 | | | | | 128,057 | |
Safran SA | | | | 610 | | | | | 96,104 | |
Schneider Electric SE | | | | 445 | | | | | 39,012 | |
Vinci SA | | | | 1,442 | | | | | 155,271 | |
| | | | | | | | | | |
| | | | | | | | | 1,475,775 | |
| GERMANY - 19.0% |
Allianz SE | | | | 1,102 | | | | | 256,766 | |
Beiersdorf AG | | | | 477 | | | | | 56,232 | |
Deutsche Boerse AG | | | | 4,372 | | | | | 683,388 | |
Deutsche Post AG | | | | 8,941 | | | | | 298,657 | |
SAP SE | | | | 532 | | | | | 62,549 | |
Symrise AG | | | | 1,118 | | | | | 108,614 | |
Wirecard AG | | | | 3,354 | | | | | 536,531 | |
| | | | | | | | | | |
| | | | | | | | | 2,002,737 | |
| HONG KONG - 3.6% |
AIA Group Ltd. | | | | 40,280 | | | | | 380,560 | |
| | | | | | | | | | |
| INDIA - 1.8% |
Housing Development Finance Corp. Ltd. | | | | 6,839 | | | | | 190,791 | |
| | | | | | | | | | |
| IRELAND - 2.7% |
Amarin Corp. plc, ADR* | | | | 5,501 | | | | | 83,394 | |
Ryanair Holdings plc, Equity-Linked Security*(1)(2)(3) | | | | 17,608 | | | | | 202,567 | |
| | | | | | | | | | |
| | | | | | | | | 285,961 | |
| ISRAEL - 0.6% |
Nice Ltd., ADR* | | | | 447 | | | | | 64,291 | |
| | | | | | | | | | |
| ITALY - 3.3% |
Assicurazioni Generali SpA | | | | 8,429 | | | | | 163,356 | |
Intesa Sanpaolo SpA | | | | 76,230 | | | | | 180,756 | |
| | | | | | | | | | |
| | | | | | | | | 344,112 | |
| JAPAN - 4.3% |
Daiichi Sankyo Co. Ltd. | | | | 651 | | | | | 40,959 | |
Nippon Shinyaku Co. Ltd. | | | | 2,350 | | | | | 197,527 | |
Recruit Holdings Co. Ltd. | | | | 1,680 | | | | | 51,064 | |
Taiyo Nippon Sanso Corp. | | | | 8,397 | | | | | 169,524 | |
| | | | | | | | | | |
| | | | | | | | | 459,074 | |
| MACAU - 0.6% |
Wynn Macau Ltd. | | | | 32,611 | | | | | 63,660 | |
| | | | | | | | | | |
| NETHERLANDS - 4.5% |
Adyen NV* | | | | 134 | | | | | 88,012 | |
ING Groep NV | | | | 23,429 | | | | | 245,255 | |
Koninklijke DSM NV | | | | 1,215 | | | | | 146,159 | |
| | | | | | | | | | |
| | | | | | | | | 479,426 | |
| RUSSIA - 0.5% |
MMC Norilsk Nickel PJSC, ADR | | | | 2,048 | | | | | 52,420 | |
| | | | | | | | | | |
| SWEDEN - 0.6% |
Hennes & Mauritz AB, Class B | | | | 3,012 | | | | | 58,384 | |
| | | | | | | | | | |
| SWITZERLAND - 7.9% |
Idorsia Ltd.* | | | | 1,960 | | | | | 48,188 | |
Lonza Group AG* | | | | 465 | | | | | 157,124 | |
Nestle SA | | | | 4,014 | | | | | 435,453 | |
Novartis AG | | | | 1,429 | | | | | 123,879 | |
UBS Group AG* | | | | 6,246 | | | | | 70,910 | |
| | | | | | | | | | |
| | | | | | | | | 835,554 | |
| UNITED KINGDOM - 10.7% |
AVEVA Group plc | | | | 1,872 | | | | | 85,178 | |
Diageo plc | | | | 3,133 | | | | | 128,395 | |
Experian plc | | | | 4,009 | | | | | 128,099 | |
Linde plc | | | | 3,519 | | | | | 682,661 | |
London Stock Exchange Group plc | | | | 245 | | | | | 22,016 | |
RELX plc | | | | 3,636 | | | | | 86,401 | |
| | | | | | | | | | |
| | | | | | | | | 1,132,750 | |
| | |
| Artisan Partners Funds | | 49 |
| | | | | | | | | | |
| | | Shares
Held | | Value |
| | | | | | | | | | |
| UNITED STATES - 13.1% |
Alphabet, Inc., Class A* | | | | 96 | | | | $ | 117,551 | |
Alphabet, Inc., Class C* | | | | 95 | | | | | 115,373 | |
Amazon.com, Inc.* | | | | 121 | | | | | 210,524 | |
Aon plc | | | | 1,720 | | | | | 332,927 | |
Intercontinental Exchange, Inc. | | | | 1,366 | | | | | 126,056 | |
Medtronic plc | | | | 2,650 | | | | | 287,825 | |
Willis Towers Watson plc | | | | 1,003 | | | | | 193,486 | |
| | | | | | | | | | |
| | | | | | | | | 1,383,742 | |
Total common stocks and equity-linked security
(Cost $7,544,721) | | | | | | | | | 10,218,050 | |
| | | | | | | | | | |
| | | | | | |
| SHORT-TERM INVESTMENTS - 3.0% |
| | | | | | | | | | |
| INVESTMENT COMPANIES - 3.0% |
BlackRock Liquidity Funds Treasury Trust Fund - Institutional Class, 2.10% | | | | 109,186 | | | | | 109,186 | |
Federated Treasury Obligations Fund - Institutional Class, 1.96% | | | | 105,974 | | | | | 105,974 | |
Fidelity Investments Money Market Treasury Portfolio - Institutional Class, 2.04% | | | | 105,975 | | | | | 105,975 | |
| | | | | | | | | | |
Total short-term investments
(Cost $321,135) | | | | | | | | | 321,135 | |
| | | | | | | | | | |
| | | | | | |
Total investments - 99.8%
(Cost $7,865,856) | | | | | | | | | 10,539,185 | |
| | | | | | | | | | |
Other assets less liabilities - 0.2% | | | | | | | | | 19,923 | |
| | | | | | | | | | |
| | | | | | | | | | |
Total net assets - 100.0%(4) | | | | | | | | $ | 10,559,108 | |
| | | | | | | | | | |
| * | | Non-income producing security. |
| (1) | | Valued at fair value in accordance with procedures established by the board of directors of Artisan Partners Fund. In total, securities valued at fair value were $202,567 or 1.9% of total net assets. |
| (2) | | Security is restricted. Security was acquired in a transaction pursuant to Rule 144A under the Securities Act of 1933, as amended, on the date or during the period noted below. |
| | | | | | | | | | | | | | | | | | | | |
| Security | | Acquisition
Date | | Cost | | Value | | Percentage
of Total
Net Assets |
Ryanair Holdings plc | | |
| 11/14/2013-
7/5/2019 |
| | | $ | 238,908 | | | | $ | 202,567 | | | | | 1.9 | % |
| (3) | | Security is an equity-linked security issued by HSBC Bank plc. As described in 2(g) in Notes to Financial Statements, equity-linked securities are subject to counterparty risk with respect to the bank or broker-dealer that issues them. |
| (4) | | Percentages for the various classifications relate to total net assets. |
Company names are as reported by a data service provider and in some cases are translations; a company’s legal name may be different.
| | |
| Abbreviations |
ADR | | American Depositary Receipt |
Preference | | A special type of equity investment that shares in the earnings of the company and may have a dividend preference. Preference shares may also have liquidation preference. |
| | | | | | | | | | |
| PORTFOLIO DIVERSIFICATION |
Dollar values in thousands | |
| | | Value | | Percentage
of Total
Investments |
Communication Services | | | $ | 232,924 | | | | | 2.2 | % |
Consumer Discretionary | | | | 436,950 | | | | | 4.2 | |
Consumer Staples | | | | 644,116 | | | | | 6.1 | |
Energy | | | | 434,485 | | | | | 4.1 | |
Financials | | | | 3,187,956 | | | | | 30.3 | |
Health Care | | | | 1,226,467 | | | | | 11.6 | |
Industrials | | | | 1,653,266 | | | | | 15.7 | |
Information Technology | | | | 836,561 | | | | | 7.9 | |
Materials | | | | 1,565,325 | | | | | 14.9 | |
Short-Term Investments | | | | 321,135 | | | | | 3.0 | |
| | | | | | | | | | |
Total investments | | | $ | 10,539,185 | | | | | 100.0 | % |
| | | | | | | | | | |
| | | | | | | | | | |
| TRADING CURRENCIES |
Dollar values in thousands | |
| | | Value | | Percentage
of Total
Investments |
Brazilian real | | | $ | 301,568 | | | | | 2.9 | % |
British pound | | | | 450,089 | | | | | 4.2 | |
Canadian dollar | | | | 66,918 | | | | | 0.7 | |
Danish krone | | | | 321,866 | | | | | 3.1 | |
Euro | | | | 4,984,711 | | | | | 47.3 | |
Hong Kong dollar | | | | 476,588 | | | | | 4.5 | |
Indian rupee | | | | 190,791 | | | | | 1.8 | |
Japanese yen | | | | 459,074 | | | | | 4.4 | |
Swedish krona | | | | 58,384 | | | | | 0.6 | |
Swiss franc | | | | 835,554 | | | | | 7.9 | |
U.S. dollar | | | | 2,393,642 | | | | | 22.6 | |
| | | | | | | | | | |
Total investments | | | $ | 10,539,185 | | | | | 100.0 | % |
| | | | | | | | | | |
| | |
| 50 | | Artisan Partners Funds |
| | | | | | | |
| TOP TEN HOLDINGS |
Company Name | | Country | | Percentage
of Total
Net Assets |
Deutsche Boerse AG | | Germany | | | | 6.5 | % |
Linde plc | | United Kingdom | | | | 6.5 | |
Wirecard AG | | Germany | | | | 5.1 | |
Nestle SA | | Switzerland | | | | 4.1 | |
Petroleo Brasileiro SA | | Brazil | | | | 4.1 | |
Air Liquide SA | | France | | | | 3.8 | |
Airbus SE | | France | | | | 3.6 | |
AIA Group Ltd. | | Hong Kong | | | | 3.6 | |
Aon plc | | United States | | | | 3.2 | |
Deutsche Post AG | | Germany | | | | 2.8 | |
| | | | | | | |
Total | | | | | | 43.3 | % |
| | | | | | | |
For the purpose of determining the Fund’s top ten holdings, securities of the same issuer are aggregated to determine the weight in the Fund.
The accompanying notes are an integral part of the financial statements.
| | |
| Artisan Partners Funds | | 51 |
ARTISAN INTERNATIONAL SMALL-MID FUND
Schedule of Investments – September 30, 2019
Shares and dollar values in thousands
| | | | | | | | | | |
| | | Shares
Held | | Value |
| COMMON STOCKS - 96.7% | | | | |
| | | | | | | | | | |
| AUSTRALIA - 1.6% | | | | |
Megaport Ltd.* | | | | 753 | | | | $ | 4,618 | |
Treasury Wine Estates Ltd. | | | | 1,140 | | | | | 14,289 | |
| | | | | | | | | | |
| | | | | | | | | 18,907 | |
| BELGIUM - 0.1% | | | | |
Galapagos NV* | | | | 7 | | | | | 1,090 | |
| | | | | | | | | | |
| BRAZIL - 3.6% | | | | |
BK Brasil Operacao e Assessoria a Restaurantes SA* | | | | 1,734 | | | | | 8,577 | |
Linx SA | | | | 330 | | | | | 2,591 | |
Notre Dame Intermedica Participacoes SA | | | | 744 | | | | | 9,759 | |
Petrobras Distribuidora SA | | | | 1,554 | | | | | 10,276 | |
Rumo SA* | | | | 2,094 | | | | | 12,377 | |
| | | | | | | | | | |
| | | | | | | | | 43,580 | |
| CANADA - 5.1% | | | | |
Altus Group Ltd. | | | | 493 | | | | | 14,861 | |
BELLUS Health, Inc.* | | | | 124 | | | | | 789 | |
BlackBerry Ltd.* | | | | 1,292 | | | | | 6,767 | |
CAE, Inc. | | | | 643 | | | | | 16,330 | |
Descartes Systems Group, Inc. (The)* | | | | 199 | | | | | 8,025 | |
Kinaxis, Inc.* | | | | 43 | | | | | 2,779 | |
Morneau Shepell, Inc. | | | | 513 | | | | | 12,760 | |
| | | | | | | | | | |
| | | | | | | | | 62,311 | |
| DENMARK - 4.8% | | | | |
ALK-Abello A/S* | | | | 20 | | | | | 4,019 | |
Ambu A/S, Class B | | | | 401 | | | | | 6,643 | |
Carlsberg A/S, Class B | | | | 106 | | | | | 15,596 | |
DSV A/S | | | | 106 | | | | | 10,100 | |
Genmab A/S* | | | | 52 | | | | | 10,517 | |
SimCorp A/S | | | | 90 | | | | | 7,920 | |
Vestas Wind Systems A/S | | | | 55 | | | | | 4,263 | |
| | | | | | | | | | |
| | | | | | | | | 59,058 | |
| FINLAND - 1.5% | | | | |
Metso OYJ | | | | 396 | | | | | 14,785 | |
Vaisala OYJ, Class A | | | | 142 | | | | | 3,933 | |
| | | | | | | | | | |
| | | | | | | | | 18,718 | |
| FRANCE - 0.7% | | | | |
DBV Technologies SA, ADR* | | | | 253 | | | | | 2,174 | |
Lectra | | | | 173 | | | | | 3,417 | |
Valneva SE* | | | | 769 | | | | | 2,430 | |
| | | | | | | | | | |
| | | | | | | | | 8,021 | |
| GERMANY - 6.7% | | | | |
AIXTRON SE* | | | | 781 | | | | | 7,964 | |
| GERMANY (CONTINUED) | | | | |
Basler AG | | | | 90 | | | | | 4,053 | |
Carl Zeiss Meditec AG | | | | 131 | | | | | 14,923 | |
Gerresheimer AG | | | | 84 | | | | | 6,030 | |
Hypoport AG* | | | | 28 | | | | | 6,965 | |
Jenoptik AG | | | | 343 | | | | | 8,497 | |
MorphoSys AG* | | | | 93 | | | | | 10,222 | |
Symrise AG | | | | 140 | | | | | 13,594 | |
XING SE | | | | 34 | | | | | 9,206 | |
| | | | | | | | | | |
| | | | | | | | | 81,454 | |
| ICELAND - 1.3% | | | | |
Ossur HF | | | | 2,058 | | | | | 15,623 | |
| | | | | | | | | | |
| IRELAND - 0.2% | | | | |
Amarin Corp. plc, ADR* | | | | 119 | | | | | 1,811 | |
| | | | | | | | | | |
| ISRAEL - 5.3% | | | | |
Kornit Digital Ltd.* | | | | 230 | | | | | 7,074 | |
Nice Ltd., ADR* | | | | 244 | | | | | 35,018 | |
Radware Ltd.* | | | | 460 | | | | | 11,167 | |
Tel Aviv Stock Exchange Ltd.*(1) | | | | 2,019 | | | | | 6,255 | |
Teva Pharmaceutical Industries Ltd., ADR* | | | | 805 | | | | | 5,536 | |
| | | | | | | | | | |
| | | | | | | | | 65,050 | |
| ITALY - 1.5% | | | | |
Davide Campari-Milano SpA | | | | 1,604 | | | | | 14,494 | |
Salvatore Ferragamo SpA | | | | 175 | | | | | 3,241 | |
| | | | | | | | | | |
| | | | | | | | | 17,735 | |
| JAPAN - 20.7% | | | | |
Ariake Japan Co. Ltd. | | | | 123 | | | | | 9,582 | |
Azbil Corp. | | | | 751 | | | | | 20,069 | |
Fuji Soft, Inc. | | | | 360 | | | | | 15,207 | |
Fujitec Co. Ltd. | | | | 144 | | | | | 1,860 | |
Harmonic Drive Systems, Inc. | | | | 166 | | | | | 7,216 | |
JCR Pharmaceuticals Co. Ltd. | | | | 90 | | | | | 6,864 | |
Jeol Ltd. | | | | 645 | | | | | 15,279 | |
Kobe Bussan Co. Ltd. | | | | 257 | | | | | 12,457 | |
MonotaRO Co. Ltd. | | | | 115 | | | | | 3,003 | |
Morinaga & Co. Ltd. | | | | 283 | | | | | 13,717 | |
Nippon Shinyaku Co. Ltd. | | | | 143 | | | | | 11,988 | |
NuFlare Technology, Inc. | | | | 63 | | | | | 4,469 | |
OBIC Business Consultants Co. Ltd. | | | | 346 | | | | | 14,012 | |
Obic Co. Ltd. | | | | 190 | | | | | 21,649 | |
Rakus Co. Ltd. | | | | 630 | | | | | 9,765 | |
Rohm Co. Ltd. | | | | 198 | | | | | 15,130 | |
Rohto Pharmaceutical Co. Ltd. | | | | 274 | | | | | 7,479 | |
Sagami Rubber Industries Co. Ltd. | | | | 276 | | | | | 3,902 | |
| | |
| 52 | | Artisan Partners Funds |
| | | | | | | | | | |
| | | Shares
Held | | Value |
| JAPAN (CONTINUED) | | | | |
SCSK Corp. | | | | 280 | | | | $ | 13,110 | |
SG Holdings Co. Ltd. | | | | 938 | | | | | 22,946 | |
Yamaha Corp. | | | | 295 | | | | | 13,210 | |
Yokogawa Electric Corp. | | | | 546 | | | | | 9,980 | |
| | | | | | | | | | |
| | | | | | | | | 252,894 | |
| NETHERLANDS - 3.3% | | | | |
Argenx SE* | | | | 80 | | | | | 9,117 | |
IMCD NV | | | | 172 | | | | | 12,692 | |
Koninklijke DSM NV | | | | 156 | | | | | 18,755 | |
| | | | | | | | | | |
| | | | | | | | | 40,564 | |
| SPAIN - 2.0% | | | | |
Almirall SA | | | | 1,088 | | | | | 19,037 | |
Grupo Catalana Occidente SA | | | | 185 | | | | | 5,874 | |
| | | | | | | | | | |
| | | | | | | | | 24,911 | |
| SWEDEN - 4.3% | | | | |
Beijer Ref AB | | | | 395 | | | | | 8,986 | |
Biotage AB | | | | 638 | | | | | 6,632 | |
Cellavision AB | | | | 247 | | | | | 9,576 | |
Elekta AB, Class B | | | | 634 | | | | | 8,348 | |
Fortnox AB | | | | 256 | | | | | 4,302 | |
MIPS AB | | | | 400 | | | | | 6,792 | |
Thule Group AB | | | | 426 | | | | | 8,059 | |
| | | | | | | | | | |
| | | | | | | | | 52,695 | |
| SWITZERLAND - 6.7% | | | | |
Baloise Holding AG | | | | 86 | | | | | 15,322 | |
Belimo Holding AG | | | | 3 | | | | | 16,024 | |
Burckhardt Compression Holding AG | | | | 29 | | | | | 7,362 | |
Lonza Group AG* | | | | 41 | | | | | 13,709 | |
Tecan Group AG | | | | 109 | | | | | 25,944 | |
Ypsomed Holding AG* | | | | 27 | | | | | 3,484 | |
| | | | | | | | | | |
| | | | | | | | | 81,845 | |
| UNITED KINGDOM - 16.2% | | | | |
Abcam plc | | | | 440 | | | | | 6,188 | |
ASOS plc* | | | | 124 | | | | | 3,769 | |
Aston Martin Lagonda Global Holdings plc* | | | | 461 | | | | | 2,983 | |
Auto Trader Group plc | | | | 1,278 | | | | | 8,014 | |
AVEVA Group plc | | | | 328 | | | | | 14,941 | |
B&M European Value Retail SA | | | | 2,814 | | | | | 13,127 | |
Blue Prism Group plc* | | | | 169 | | | | | 1,971 | |
boohoo Group plc* | | | | 3,561 | | | | | 11,616 | |
Britvic plc | | | | 1,337 | | | | | 16,165 | |
Codemasters Group Holdings plc* | | | | 2,340 | | | | | 6,359 | |
ConvaTec Group plc | | | | 4,993 | | | | | 10,755 | |
Electrocomponents plc | | | | 1,824 | | | | | 14,438 | |
HomeServe plc | | | | 646 | | | | | 9,426 | |
Howden Joinery Group plc | | | | 1,888 | | | | | 13,007 | |
JD Sports Fashion plc | | | | 1,202 | | | | | 11,103 | |
Joules Group plc | | | | 867 | | | | | 2,949 | |
Moneysupermarket.com Group plc | | | | 1,576 | | | | | 7,334 | |
Orchard Therapeutics plc, ADR* | | | | 122 | | | | | 1,454 | |
| UNITED KINGDOM (CONTINUED) | | | | |
Oxford Biomedica plc* | | | | 306 | | | | | 2,032 | |
Rotork plc | | | | 1,643 | | | | | 6,294 | |
Spirax-Sarco Engineering plc | | | | 74 | | | | | 7,118 | |
SSP Group plc | | | | 1,711 | | | | | 13,046 | |
St James’s Place plc | | | | 594 | | | | | 7,148 | |
YouGov plc | | | | 1,082 | | | | | 7,132 | |
| | | | | | | | | | |
| | | | | | | | | 198,369 | |
| UNITED STATES - 11.1% | | | | |
ACADIA Pharmaceuticals, Inc.* | | | | 412 | | | | | 14,828 | |
Cognex Corp. | | | | 137 | | | | | 6,729 | |
Cree, Inc.* | | | | 439 | | | | | 21,522 | |
Fluidigm Corp.* | | | | 308 | | | | | 1,428 | |
Gardner Denver Holdings, Inc.* | | | | 467 | | | | | 13,205 | |
Heron Therapeutics, Inc.* | | | | 453 | | | | | 8,375 | |
Hookipa Pharma, Inc.* | | | | 101 | | | | | 756 | |
Intersect ENT, Inc.* | | | | 379 | | | | | 6,440 | |
IPG Photonics Corp.* | | | | 23 | | | | | 3,158 | |
LivaNova plc* | | | | 102 | | | | | 7,540 | |
Medicines Co. (The)* | | | | 71 | | | | | 3,551 | |
Model N, Inc.* | | | | 227 | | | | | 6,291 | |
NanoString Technologies, Inc.* | | | | 236 | | | | | 5,094 | |
Odonate Therapeutics, Inc.* | | | | 55 | | | | | 1,430 | |
Quotient Ltd.* | | | | 582 | | | | | 4,523 | |
SailPoint Technologies Holding, Inc.* | | | | 139 | | | | | 2,606 | |
SolarEdge Technologies, Inc.* | | | | 256 | | | | | 21,420 | |
Vericel Corp.* | | | | 357 | | | | | 5,399 | |
ViewRay, Inc.* | | | | 558 | | | | | 1,618 | |
| | | | | | | | | | |
| | | | | | | | | 135,913 | |
| | | | | | | | | | |
Total common stocks
(Cost $1,083,544) | | | | | | | | | 1,180,549 | |
| | | | | | | | | | |
| SHORT-TERM INVESTMENTS - 3.3% |
| | | | | | | | | | |
| INVESTMENT COMPANIES - 3.3% |
BlackRock Liquidity Funds Treasury Trust Fund - Institutional Class, 2.10% | | | | 13,655 | | | | | 13,655 | |
Federated Treasury Obligations Fund - Institutional Class, 1.96% | | | | 13,253 | | | | | 13,253 | |
Fidelity Investments Money Market Treasury Portfolio - Institutional Class, 2.04% | | | | 13,253 | | | | | 13,253 | |
| | | | | | | | | | |
Total short-term investments
(Cost $40,161) | | | | | | | | | 40,161 | |
| | | | | | | | | | |
| | | | | | | | | | |
Total investments - 100.0%
(Cost $1,123,705) | | | | | | | | | 1,220,710 | |
| | | | | | | | | | |
Other assets less liabilities - 0.0%(2) | | | | | | | | | 298 | |
| | | | | | | | | | |
| | | | | | | | | | |
Total net assets - 100.0%(3) | | | | | | | | $ | 1,221,008 | |
| | | | | | | | | | |
| | |
| Artisan Partners Funds | | 53 |
| * | | Non-income producing security. |
| (1) | | Valued at a fair value in accordance with procedures established by the board of directors of Artisan Partners Funds. In total, securities valued at a fair value were $6,255 or 0.5% of total net assets. See notes 2(a) and 4 in Notes to Financial Statements for additional information. |
| (2) | | Amount rounds to less than 0.1% |
| (3) | | Percentages for the various classifications relate to total net assets. |
Company names are as reported by a data service provider and in some cases are translations; a company’s legal name may be different.
| | |
| Abbreviation |
ADR | | American Depositary Receipt |
| | | | | | | | | | |
| PORTFOLIO DIVERSIFICATION |
Dollar values in thousands | |
| | | Value | | Percentage
of Total
Investments |
Communication Services | | | $ | 30,711 | | | | | 2.6 | % |
Consumer Discretionary | | | | 116,082 | | | | | 9.5 | |
Consumer Staples | | | | 107,681 | | | | | 8.8 | |
Financials | | | | 41,564 | | | | | 3.4 | |
Health Care | | | | 302,955 | | | | | 24.8 | |
Industrials | | | | 206,828 | | | | | 16.9 | |
Information Technology | | | | 327,518 | | | | | 26.8 | |
Materials | | | | 32,349 | | | | | 2.7 | |
Real Estate | | | | 14,861 | | | | | 1.2 | |
Short-Term Investments | | | | 40,161 | | | | | 3.3 | |
| | | | | | | | | | |
Total investments | | | $ | 1,220,710 | | | | | 100.0 | % |
| | | | | | | | | | |
| | | | | | | | | | |
| TRADING CURRENCIES |
Dollar values in thousands | |
| | | Value | | Percentage
of Total
Investments |
Australian dollar | | | $ | 18,907 | | | | | 1.6 | % |
Brazilian real | | | | 43,580 | | | | | 3.6 | |
British pound | | | | 196,915 | | | | | 16.2 | |
Canadian dollar | | | | 61,522 | | | | | 5.0 | |
Danish krone | | | | 74,681 | | | | | 6.1 | |
Euro | | | | 190,319 | | | | | 15.6 | |
Israeli shekel | | | | 6,255 | | | | | 0.5 | |
Japanese yen | | | | 252,894 | | | | | 20.7 | |
Swedish krona | | | | 52,695 | | | | | 4.3 | |
Swiss franc | | | | 81,845 | | | | | 6.7 | |
U.S. dollar | | | | 241,097 | | | | | 19.7 | |
| | | | | | | | | | |
Total investments | | | $ | 1,220,710 | | | | | 100.0 | % |
| | | | | | | | | | |
| | | | | | | |
| TOP TEN HOLDINGS |
Company Name | | Country | | Percentage
of Total
Net Assets |
Nice Ltd. | | Israel | | | | 2.9 | % |
Tecan Group AG | | Switzerland | | | | 2.1 | |
SG Holdings Co. Ltd. | | Japan | | | | 1.9 | |
Obic Co. Ltd. | | Japan | | | | 1.8 | |
Cree, Inc. | | United States | | | | 1.8 | |
SolarEdge Technologies, Inc. | | United States | | | | 1.8 | |
Azbil Corp. | | Japan | | | | 1.6 | |
Almirall SA | | Spain | | | | 1.6 | |
Koninklijke DSM NV | | Netherlands | | | | 1.5 | |
CAE, Inc. | | Canada | | | | 1.3 | |
| | | | | | | |
Total | | | | | | 18.3 | % |
| | | | | | | |
For the purpose of determining the Fund’s top ten holdings, securities of the same issuer are aggregated to determine the weight in the Fund.
The accompanying notes are an integral part of the financial statements.
| | |
| 54 | | Artisan Partners Funds |
ARTISAN INTERNATIONAL VALUE FUND
Schedule of Investments – September 30, 2019
Shares and dollar values in thousands
| | | | | | | | | | |
| | | Shares
Held | | Value |
| COMMON STOCKS - 85.1% | | | | |
| | | | | | | | | | |
| BELGIUM - 2.3% | | | | |
Groupe Bruxelles Lambert SA | | | | 3,374 | | | | $ | 324,021 | |
| | | | | | | | | | |
| BRAZIL - 3.0% | | | | |
Telefonica Brasil SA, ADR | | | | 32,548 | | | | | 428,662 | |
| | | | | | | | | | |
| CANADA - 1.9% | | | | |
Imperial Oil Ltd. | | | | 10,652 | | | | | 277,392 | |
| | | | | | | | | | |
| CHINA - 2.2% | | | | |
Baidu, Inc., ADR* | | | | 3,010 | | | | | 309,292 | |
| | | | | | | | | | |
| DENMARK - 2.5% | | | | |
DSV A/S | | | | 3,699 | | | | | 351,953 | |
| | | | | | | | | | |
| FRANCE - 3.7% | | | | |
Sodexo SA | | | | 2,856 | | | | | 320,677 | |
Vivendi SA | | | | 7,644 | | | | | 209,784 | |
| | | | | | | | | | |
| | | | | | | | | 530,461 | |
| GERMANY - 3.2% | | | | |
Fresenius Medical Care AG & Co. KGaA | | | | 5,297 | | | | | 356,200 | |
Hella GmbH & Co. KGaA | | | | 2,144 | | | | | 95,867 | |
| | | | | | | | | | |
| | | | | | | | | 452,067 | |
| INDIA - 3.3% | | | | |
Bharti Infratel Ltd. | | | | 46,219 | | | | | 167,804 | |
HCL Technologies Ltd. | | | | 20,075 | | | | | 306,101 | |
| | | | | | | | | | |
| | | | | | | | | 473,905 | |
| IRELAND - 2.0% | | | | |
CRH plc | | | | 8,381 | | | | | 288,559 | |
| | | | | | | | | | |
| JAPAN - 0.6% | | | | |
Seven & i Holdings Co. Ltd. | | | | 2,167 | | | | | 82,796 | |
Z Holdings Corp. | | | | 133 | | | | | 373 | |
| | | | | | | | | | |
| | | | | | | | | 83,169 | |
| NETHERLANDS - 5.0% | | | | |
ING Groep NV | | | | 40,611 | | | | | 425,108 | |
NXP Semiconductors NV | | | | 2,698 | | | | | 294,457 | |
| | | | | | | | | | |
| | | | | | | | | 719,565 | |
| SOUTH KOREA - 9.9% | | | | |
Hyundai Motor Co. | | | | 1,301 | | | | | 145,795 | |
Hyundai Motor Co. (Preference) | | | | 257 | | | | | 18,247 | |
NAVER Corp. | | | | 2,624 | | | | | 344,350 | |
Samsung Electronics Co. Ltd. | | | | 20,377 | | | | | 835,611 | |
Samsung Electronics Co. Ltd. (Preference) | | | | 2,295 | | | | | 75,795 | |
| | | | | | | | | | |
| | | | | | | | | 1,419,798 | |
| SPAIN - 1.0% | | | | |
Bankia SA | | | | 79,439 | | | | | 150,007 | |
| | | | | | | | | | |
| SWITZERLAND - 18.5% | | | | |
ABB Ltd. | | | | 27,633 | | | | | 542,950 | |
Cie Financiere Richemont SA | | | | 5,326 | | | | | 390,725 | |
LafargeHolcim Ltd.* | | | | 7,269 | | | | | 357,749 | |
Nestle SA | | | | 3,197 | | | | | 346,814 | |
Novartis AG | | | | 4,176 | | | | | 362,107 | |
Pargesa Holding SA | | | | 1,306 | | | | | 100,440 | |
UBS Group AG* | | | | 46,893 | | | | | 532,334 | |
| | | | | | | | | | |
| | | | | | | | | 2,633,119 | |
| UNITED KINGDOM - 17.6% | | | | |
Compass Group plc | | | | 26,057 | | | | | 670,560 | |
IMI plc | | | | 10,458 | | | | | 123,465 | |
John Wood Group plc | | | | 14,443 | | | | | 67,465 | |
Lloyds Banking Group plc | | | | 427,747 | | | | | 284,637 | |
Reckitt Benckiser Group plc | | | | 1,900 | | | | | 148,239 | |
RELX plc | | | | 18,799 | | | | | 446,695 | |
RELX plc | | | | 4,063 | | | | | 96,672 | |
Royal Bank of Scotland Group plc | | | | 98,265 | | | | | 250,826 | |
Tesco plc | | | | 142,711 | | | | | 422,884 | |
| | | | | | | | | | |
| | | | | | | | | 2,511,443 | |
| UNITED STATES - 8.4% | | | | |
Arch Capital Group Ltd.* | | | | 17,794 | | | | | 747,002 | |
TE Connectivity Ltd. | | | | 2,370 | | | | | 220,817 | |
Willis Towers Watson plc | | | | 1,162 | | | | | 224,288 | |
| | | | | | | | | | |
| | | | | | | | | 1,192,107 | |
| | | | | | | | | | |
Total common stocks
(Cost $10,278,154) | | | | | | | | | 12,145,520 | |
| | | | | | | | | | |
| SHORT-TERM INVESTMENTS - 14.0% | | |
| | | | | | | | | | |
| INVESTMENT COMPANIES - 14.0% | | |
BlackRock Liquidity Funds Treasury Trust Fund - Institutional Class, 2.10% | | | | 677,189 | | | | | 677,189 | |
Federated Treasury Obligations Fund - Institutional Class, 1.96% | | | | 657,271 | | | | | 657,271 | |
Fidelity Investments Money Market Treasury Portfolio - Institutional Class, 2.04% | | | | 657,271 | | | | | 657,271 | |
| | | | | | | | | | |
Total short-term investments
(Cost $1,991,731) | | | | | | | | | 1,991,731 | |
| | | | | | | | | | |
| | | | | | | | | | |
Total investments - 99.1%
(Cost $12,269,885) | | | | | | | | | 14,137,251 | |
| | | | | | | | | | |
Other assets less liabilities - 0.9% | | | | | | | | | 130,859 | |
| | | | | | | | | | |
| | | | | | | | | | |
Total net assets - 100.0%(1) | | | | | | | | $ | 14,268,110 | |
| | | | | | | | | | |
| | |
| Artisan Partners Funds | | 55 |
| * | | Non-income producing security. |
| (1) | | Percentages for the various classifications relate to total net assets. |
Company names are as reported by a data service provider and in some cases are translations; a company’s legal name may be different.
| | |
| Abbreviations |
ADR | | American Depositary Receipt |
Preference | | A special type of equity investment that shares in the earnings of the company and may have a dividend preference. Preference shares may also have liquidation preference. |
| | | | | | | | | | | | | | | | | |
| FOREIGN CURRENCY FORWARD CONTRACTS |
Values in thousands |
| | | | | | | | | | | | | | |
Currency
Purchased | | Currency
Sold | | Counterparty | | Settlement
Date | | Unrealized
Appreciation
(Depreciation) |
JPY 2,306,319 | | USD 21,326 | | JPM | | | | 10/23/2019 | | | | $ | 37 | |
USD 186,016 | | JPY 19,866,572 | | JPM | | | | 10/23/2019 | | | | | 1,998 | |
USD 388,960 | | CNH 2,645,709 | | JPM | | | | 11/13/2019 | | | | | 18,847 | |
| | | | | | | | | | | | | | |
Total unrealized appreciation | | | | | | | | | 20,882 | |
| | | | | | | | | | | | | | |
JPY 9,380,418 | | USD 87,127 | | JPM | | | | 10/23/2019 | | | | | (239 | ) |
CNH 846,207 | | USD 120,744 | | JPM | | | | 11/13/2019 | | | | | (2,367 | ) |
| | | | | | | | | | | | | | |
Total unrealized depreciation | | | | | | | | | (2,606 | ) |
| | | | | | | | | | | | | | |
Net unrealized appreciation | | | | | | | | $ | 18,276 | |
| | | | | | | | | | | | | | |
| | |
CNH | | Chinese yuan renminbi offshore |
JPY | | Japanese yen |
USD | | U.S. dollar |
JPM | | JPMorgan Chase Bank, N.A. |
| | | | | | | | | | |
| PORTFOLIO DIVERSIFICATION |
Dollar values in thousands | |
| | | Value | | Percentage
of Total
Investments |
Communication Services | | | $ | 1,460,265 | | | | | 10.3 | % |
Consumer Discretionary | | | | 1,641,871 | | | | | 11.6 | |
Consumer Staples | | | | 1,000,733 | | | | | 7.1 | |
Energy | | | | 344,857 | | | | | 2.4 | |
Financials | | | | 3,038,663 | | | | | 21.5 | |
Health Care | | | | 718,307 | | | | | 5.1 | |
Industrials | | | | 1,561,735 | | | | | 11.0 | |
Information Technology | | | | 1,732,781 | | | | | 12.3 | |
Materials | | | | 646,308 | | | | | 4.6 | |
Short-Term Investments | | | | 1,991,731 | | | | | 14.1 | |
| | | | | | | | | | |
Total investments | | | $ | 14,137,251 | | | | | 100.0 | % |
| | | | | | | | | | |
| | | | | | | | | | |
| TRADING CURRENCIES |
Dollar values in thousands | |
| | | Value | | Percentage
of Total
Investments |
British pound | | | $ | 2,414,771 | | | | | 17.1 | % |
Canadian dollar | | | | 277,392 | | | | | 2.0 | |
Danish krone | | | | 351,953 | | | | | 2.5 | |
Euro | | | | 2,266,895 | | | | | 16.1 | |
Indian rupee | | | | 473,905 | | | | | 3.3 | |
Japanese yen | | | | 83,169 | | | | | 0.6 | |
Korean won | | | | 1,419,798 | | | | | 10.0 | |
Swiss franc | | | | 2,633,119 | | | | | 18.6 | |
U.S. dollar | | | | 4,216,249 | | | | | 29.8 | |
| | | | | | | | | | |
Total investments | | | $ | 14,137,251 | | | | | 100.0 | % |
| | | | | | | | | | |
| | | | | | | |
| TOP TEN HOLDINGS |
Company Name | | Country | | Percentage
of Total
Net Assets |
Samsung Electronics Co. Ltd. | | South Korea | | | | 6.4 | % |
Arch Capital Group Ltd. | | United States | | | | 5.2 | |
Compass Group plc | | United Kingdom | | | | 4.7 | |
RELX plc | | United Kingdom | | | | 3.8 | |
ABB Ltd. | | Switzerland | | | | 3.8 | |
UBS Group AG | | Switzerland | | | | 3.7 | |
Telefonica Brasil SA | | Brazil | | | | 3.0 | |
ING Groep NV | | Netherlands | | | | 3.0 | |
Tesco plc | | United Kingdom | | | | 3.0 | |
Cie Financiere Richemont SA | | Switzerland | | | | 2.7 | |
| | | | | | | |
Total | | | | | | 39.3 | % |
| | | | | | | |
For the purpose of determining the Fund’s top ten holdings, securities of the same issuer are aggregated to determine the weight in the Fund.
The accompanying notes are an integral part of the financial statements.
| | |
| 56 | | Artisan Partners Funds |
ARTISAN MID CAP FUND
Schedule of Investments – September 30, 2019
Shares and dollar values in thousands
| | | | | | | | | | |
| | | Shares
Held | | Value |
| COMMON STOCKS - 96.7% |
| | | | | | | | | | |
| AEROSPACE & DEFENSE - 3.4% |
L3Harris Technologies, Inc. | | | | 820 | | | | $ | 171,128 | |
| | | | | | | | | | |
| AUTO COMPONENTS - 1.6% |
Aptiv plc | | | | 914 | | | | | 79,908 | |
| | | | | | | | | | |
| BANKS - 0.8% |
First Republic Bank | | | | 441 | | | | | 42,647 | |
| | | | | | | | | | |
| BIOTECHNOLOGY - 8.5% |
Alexion Pharmaceuticals, Inc.* | | | | 692 | | | | | 67,789 | |
Argenx SE, ADR*(1) | | | | 411 | | | | | 46,835 | |
Ascendis Pharma A/S, ADR*(1) | | | | 723 | | | | | 69,598 | |
Exact Sciences Corp.* | | | | 854 | | | | | 77,136 | |
Genmab A/S*(1) | | | | 568 | | | | | 115,266 | |
Sage Therapeutics, Inc.* | | | | 224 | | | | | 31,484 | |
Sarepta Therapeutics, Inc.* | | | | 305 | | | | | 22,962 | |
| | | | | | | | | | |
| | | | | | | | | 431,070 | |
| BUILDING PRODUCTS - 1.0% |
Masco Corp. | | | | 1,177 | | | | | 49,042 | |
| | | | | | | | | | |
| CAPITAL MARKETS - 0.6% |
MSCI, Inc. | | | | 138 | | | | | 29,988 | |
| | | | | | | | | | |
| COMMERCIAL SERVICES & SUPPLIES - 1.1% |
Cintas Corp. | | | | 202 | | | | | 54,126 | |
| | | | | | | | | | |
| COMMUNICATIONS EQUIPMENT - 4.4% |
Arista Networks, Inc.* | | | | 374 | | | | | 89,399 | |
Motorola Solutions, Inc. | | | | 768 | | | | | 130,882 | |
| | | | | | | | | | |
| | | | | | | | | 220,281 | |
| DIVERSIFIED CONSUMER SERVICES - 1.1% |
ServiceMaster Global Holdings, Inc.* | | | | 1,027 | | | | | 57,436 | |
| | | | | | | | | | |
ELECTRONIC EQUIPMENT, INSTRUMENTS &
COMPONENTS - 2.3% |
Cognex Corp. | | | | 1,299 | | | | | 63,812 | |
Trimble, Inc.* | | | | 1,329 | | | | | 51,594 | |
| | | | | | | | | | |
| | | | | | | | | 115,406 | |
| ENTERTAINMENT - 3.7% |
Spotify Technology SA* | | | | 270 | | | | | 30,819 | |
Take-Two Interactive Software, Inc.* | | | | 387 | | | | | 48,495 | |
Zynga, Inc., Class A* | | | | 18,396 | | | | | 107,063 | |
| | | | | | | | | | |
| | | | | | | | | 186,377 | |
| HEALTH CARE EQUIPMENT & SUPPLIES - 8.0% |
ABIOMED, Inc.* | | | | 229 | | | | | 40,765 | |
Boston Scientific Corp.* | | | | 3,689 | | | | | 150,100 | |
DexCom, Inc.* | | | | 590 | | | | | 88,076 | |
Edwards Lifesciences Corp.* | | | | 275 | | | | | 60,412 | |
West Pharmaceutical Services, Inc. | | | | 473 | | | | | 67,041 | |
| | | | | | | | | | |
| | | | | | | | | 406,394 | |
| HEALTH CARE PROVIDERS & SERVICES - 1.3% |
Centene Corp.* | | | | 621 | | | | | 26,874 | |
WellCare Health Plans, Inc.* | | | | 145 | | | | | 37,481 | |
| | | | | | | | | | |
| | | | | | | | | 64,355 | |
| HEALTH CARE TECHNOLOGY - 3.3% |
Veeva Systems, Inc., Class A* | | | | 1,111 | | | | | 169,572 | |
| | | | | | | | | | |
| HOTELS, RESTAURANTS & LEISURE - 0.9% |
Chipotle Mexican Grill, Inc.* | | | | 55 | | | | | 46,370 | |
| | | | | | | | | | |
| INDUSTRIAL CONGLOMERATES - 2.7% |
Roper Technologies, Inc. | | | | 376 | | | | | 134,234 | |
| | | | | | | | | | |
| INSURANCE - 1.6% |
Progressive Corp. (The) | | | | 1,069 | | | | | 82,544 | |
| | | | | | | | | | |
| INTERNET & DIRECT MARKETING RETAIL - 1.6% |
Ctrip.com International Ltd., ADR*(1) | | | | 1,064 | | | | | 31,157 | |
Wayfair, Inc., Class A* | | | | 435 | | | | | 48,785 | |
| | | | | | | | | | |
| | | | | | | | | 79,942 | |
| IT SERVICES - 12.4% |
Adyen NV*(1) | | | | 56 | | | | | 36,578 | |
Broadridge Financial Solutions, Inc. | | | | 465 | | | | | 57,832 | |
Fidelity National Information Services, Inc. | | | | 1,299 | | | | | 172,501 | |
Global Payments, Inc. | | | | 1,753 | | | | | 278,688 | |
Pagseguro Digital Ltd., Class A*(1) | | | | 1,780 | | | | | 82,411 | |
| | | | | | | | | | |
| | | | | | | | | 628,010 | |
| LEISURE PRODUCTS - 1.5% |
Hasbro, Inc. | | | | 642 | | | | | 76,185 | |
| | | | | | | | | | |
| LIFE SCIENCES TOOLS & SERVICES - 3.0% |
Agilent Technologies, Inc. | | | | 783 | | | | | 60,010 | |
Lonza Group AG*(1) | | | | 268 | | | | | 90,496 | |
| | | | | | | | | | |
| | | | | | | | | 150,506 | |
| MACHINERY - 2.4% |
Fortive Corp. | | | | 1,075 | | | | | 73,679 | |
Gardner Denver Holdings, Inc.* | | | | 1,756 | | | | | 49,670 | |
| | | | | | | | | | |
| | | | | | | | | 123,349 | |
| | |
| Artisan Partners Funds | | 57 |
| | | | | | | | | | |
| | | Shares
Held | | Value |
| MEDIA - 1.4% |
New York Times Co. (The), Class A | | | | 2,503 | | | | $ | 71,298 | |
| | | | | | | | | | |
| MULTILINE RETAIL - 0.3% |
Ollie’s Bargain Outlet Holdings, Inc.* | | | | 279 | | | | | 16,347 | |
| | | | | | | | | | |
| PHARMACEUTICALS - 0.5% |
Catalent, Inc.* | | | | 508 | | | | | 24,233 | |
| | | | | | | | | | |
| PROFESSIONAL SERVICES - 5.4% |
IHS Markit Ltd.* | | | | 2,604 | | | | | 174,184 | |
TransUnion | | | | 1,206 | | | | | 97,828 | |
| | | | | | | | | | |
| | | | | | | | | 272,012 | |
SEMICONDUCTORS & SEMICONDUCTOR
EQUIPMENT - 5.4% | | | | |
Advanced Micro Devices, Inc.* | | | | 3,457 | | | | | 100,215 | |
Cree, Inc.* | | | | 1,483 | | | | | 72,689 | |
First Solar, Inc.* | | | | 1,047 | | | | | 60,765 | |
Skyworks Solutions, Inc. | | | | 504 | | | | | 39,907 | |
| | | | | | | | | | |
| | | | | | | | | 273,576 | |
| SOFTWARE - 12.1% |
Atlassian Corp. plc, Class A* | | | | 1,576 | | | | | 197,733 | |
Ceridian HCM Holding, Inc.* | | | | 1,123 | | | | | 55,440 | |
Coupa Software, Inc.* | | | | 131 | | | | | 17,009 | |
Guidewire Software, Inc.* | | | | 1,466 | | | | | 154,479 | |
HubSpot, Inc.* | | | | 477 | | | | | 72,263 | |
Trade Desk, Inc. (The), Class A* | | | | 105 | | | | | 19,698 | |
Zoom Video Communications, Inc., Class A* | | | | 789 | | | | | 60,141 | |
Zscaler, Inc.* | | | | 766 | | | | | 36,196 | |
| | | | | | | | | | |
| | | | | | | | | 612,959 | |
| SPECIALTY RETAIL - 1.2% |
Burlington Stores, Inc.* | | | | 315 | | | | | 62,905 | |
| | | | | | | | | | |
| TEXTILES, APPAREL & LUXURY GOODS - 3.2% |
Canada Goose Holdings, Inc.*(1) | | | | 1,604 | | | | | 70,508 | |
Lululemon Athletica, Inc.* | | | | 331 | | | | | 63,672 | |
Under Armour, Inc., Class A* | | | | 1,419 | | | | | 28,302 | |
| | | | | | | | | | |
| | | | | | | | | 162,482 | |
| | | | | | | | | | |
Total common stocks
(Cost $3,437,541) | | | | | 4,894,682 | |
| | | | | | | | | | |
| SHORT-TERM INVESTMENTS - 3.3% |
| | | | | | | | | | |
| INVESTMENT COMPANIES - 3.3% |
BlackRock Liquidity Funds Treasury Trust Fund - Institutional Class, 2.10% | | | | 56,201 | | | | | 56,201 | |
Federated Treasury Obligations Fund - Institutional Class, 1.96% | | | | 54,549 | | | | | 54,549 | |
Fidelity Investments Money Market Treasury Portfolio - Institutional Class, 2.04% | | | | 54,548 | | | | | 54,548 | |
| | | | | | | | | | |
Total short-term investments
(Cost $165,298) | | | | | 165,298 | |
| | | | | | | | | | |
Total investments - 100.0%
(Cost $3,602,839) | | | | | | | | | 5,059,980 | |
| | | | | | | | | | |
Other assets less liabilities - 0.0%(2) | | | | | | | | | (1,508 | ) |
| | | | | | | | | | |
| | | | | | | | | | |
Total net assets - 100.0%(3) | | | | | | | | $ | 5,058,472 | |
| | | | | | | | | | |
| * | | Non-income producing security. |
| (1) | | The Fund considers the company to be from outside the United States. See the Fund’s Statement of Additional Information for a description of the methodology used for country classifications. |
| | | | | | | | | | |
| Security | | Country | | Trading
Currency |
Adyen NV | | Netherlands | | Euro |
Argenx SE | | Netherlands | | U.S. dollar |
Ascendis Pharma A/S | | Denmark | | U.S. dollar |
Canada Goose Holdings, Inc. | | Canada | | U.S. dollar |
Ctrip.com International Ltd. | | China | | U.S. dollar |
Genmab A/S | | Denmark | | Danish krone |
Lonza Group AG | | Switzerland | | Swiss franc |
Pagseguro Digital Ltd. | | Brazil | | U.S. dollar |
| (2) | | Amount rounds to less than 0.1%. |
| (3) | | Percentages for the various classifications relate to total net assets. |
Company names are as reported by a data service provider and in some cases are translations; a company’s legal name may be different.
| | |
| Abbreviation |
ADR | | American Depositary Receipt |
| | | | | | | | | | |
PORTFOLIO DIVERSIFICATION Dollar values in thousands |
| | | Value | | Percentage
of Total
Investments |
Communication Services | | | $ | 257,675 | | | | | 5.1 | % |
Consumer Discretionary | | | | 581,575 | | | | | 11.5 | |
Financials | | | | 155,179 | | | | | 3.0 | |
Health Care | | | | 1,246,130 | | | | | 24.6 | |
Industrials | | | | 803,891 | | | | | 15.9 | |
Information Technology | | | | 1,850,232 | | | | | 36.6 | |
Short-Term Investments | | | | 165,298 | | | | | 3.3 | |
| | | | | | | | | | |
Total investments | | | $ | 5,059,980 | | | | | 100.0 | % |
| | | | | | | | | | |
| | |
| 58 | | Artisan Partners Funds |
| | | | | | | | | | |
| TRADING CURRENCIES |
Dollar values in thousands | |
| | | Value | | Percentage
of Total
Investments |
Danish krone | | | $ | 115,266 | | | | | 2.3 | % |
Euro | | | | 36,578 | | | | | 0.7 | |
Swiss franc | | | | 90,496 | | | | | 1.8 | |
U.S. dollar | | | | 4,817,640 | | | | | 95.2 | |
| | | | | | | | | | |
Total investments | | | $ | 5,059,980 | | | | | 100.0 | % |
| | | | | | | | | | |
| | | | | | | |
| TOP TEN HOLDINGS |
Company Name | | Country | | Percentage
of Total
Net Assets |
Global Payments, Inc. | | United States | | | | 5.5 | % |
Atlassian Corp. plc | | United States | | | | 3.9 | |
IHS Markit Ltd. | | United States | | | | 3.4 | |
Fidelity National Information Services, Inc. | | United States | | | | 3.4 | |
L3Harris Technologies, Inc. | | United States | | | | 3.4 | |
Veeva Systems, Inc. | | United States | | | | 3.3 | |
Guidewire Software, Inc. | | United States | | | | 3.1 | |
Boston Scientific Corp. | | United States | | | | 3.0 | |
Roper Technologies, Inc. | | United States | | | | 2.7 | |
Motorola Solutions, Inc. | | United States | | | | 2.6 | |
| | | | | | | |
Total | | | | | | 34.3 | % |
| | | | | | | |
For the purpose of determining the Fund’s top ten holdings, securities of the same issuer are aggregated to determine the weight in the Fund.
The accompanying notes are an integral part of the financial statements.
| | |
| Artisan Partners Funds | | 59 |
ARTISAN MID CAP VALUE FUND
Schedule of Investments – September 30, 2019
Shares and dollar values in thousands
| | | | | | | | | | |
| | | Shares
Held | | Value |
| COMMON STOCKS - 95.6% | | | | |
| | | | | | | | | | |
| AUTO COMPONENTS - 4.0% | | | | |
Delphi Technologies plc | | | | 1,981 | | | | $ | 26,543 | |
Gentex Corp. | | | | 2,364 | | | | | 65,088 | |
| | | | | | | | | | |
| | | | | | | | | 91,631 | |
| AUTOMOBILES - 2.9% | | | | |
Thor Industries, Inc. | | | | 1,149 | | | | | 65,065 | |
| | | | | | | | | | |
| BANKS - 10.0% | | | | |
BOK Financial Corp. | | | | 521 | | | | | 41,202 | |
Fifth Third Bancorp | | | | 1,739 | | | | | 47,606 | |
M&T Bank Corp. | | | | 391 | | | | | 61,750 | |
Pinnacle Financial Partners, Inc. | | | | 635 | | | | | 36,042 | |
SunTrust Banks, Inc. | | | | 574 | | | | | 39,483 | |
| | | | | | | | | | |
| | | | | | | | | 226,083 | |
| CAPITAL MARKETS - 3.2% | | | | |
E*TRADE Financial Corp. | | | | 1,057 | | | | | 46,169 | |
Intercontinental Exchange, Inc. | | | | 298 | | | | | 27,535 | |
| | | | | | | | | | |
| | | | | | | | | 73,704 | |
| CHEMICALS - 8.2% | | | | |
Axalta Coating Systems Ltd.* | | | | 1,731 | | | | | 52,188 | |
Celanese Corp. | | | | 754 | | | | | 92,223 | |
Nutrien Ltd.(1) | | | | 819 | | | | | 40,836 | |
| | | | | | | | | | |
| | | | | | | | | 185,247 | |
| CONSTRUCTION & ENGINEERING - 1.2% | | | | |
Jacobs Engineering Group, Inc. | | | | 295 | | | | | 26,962 | |
| | | | | | | | | | |
| CONSUMER FINANCE - 2.4% | | | | |
Synchrony Financial | | | | 1,624 | | | | | 55,368 | |
| | | | | | | | | | |
| DIVERSIFIED CONSUMER SERVICES - 2.1% |
H&R Block, Inc. | | | | 1,977 | | | | | 46,697 | |
| | | | | | | | | | |
| DIVERSIFIED TELECOMMUNICATION SERVICES - 2.7% |
GCI Liberty, Inc., Class A* | | | | 982 | | | | | 60,936 | |
| | | | | | | | | | |
ELECTRONIC EQUIPMENT, INSTRUMENTS &
COMPONENTS - 1.9% |
Arrow Electronics, Inc.* | | | | 579 | | | | | 43,193 | |
| | | | | | | | | | |
| ENTERTAINMENT - 1.1% | | | | |
Lions Gate Entertainment Corp., Class A* | | | | 1,332 | | | | | 12,319 | |
Lions Gate Entertainment Corp., Class B* | | | | 1,549 | | | | | 13,541 | |
| | | | | | | | | | |
| | | | | | | | | 25,860 | |
EQUITY REAL ESTATE INVESTMENT TRUSTS
(REITS) - 4.3% | | |
Equity Commonwealth | | | | 1,443 | | | | | 49,421 | |
STORE Capital Corp. | | | | 678 | | | | | 25,360 | |
Weyerhaeuser Co. | | | | 831 | | | | | 23,018 | |
| | | | | | | | | | |
| | | | | | | | | 97,799 | |
| FOOD & STAPLES RETAILING - 2.8% | | | | |
Kroger Co. (The) | | | | 2,453 | | | | | 63,240 | |
| | | | | | | | | | |
| HEALTH CARE EQUIPMENT & SUPPLIES - 2.1% |
DENTSPLY SIRONA, Inc. | | | | 907 | | | | | 48,339 | |
| | | | | | | | | | |
| HEALTH CARE PROVIDERS & SERVICES - 1.9% |
AmerisourceBergen Corp. | | | | 512 | | | | | 42,121 | |
| | | | | | | | | | |
| INSURANCE - 12.9% | | | | |
Aon plc | | | | 286 | | | | | 55,442 | |
Arch Capital Group Ltd.* | | | | 1,745 | | | | | 73,257 | |
Fairfax Financial Holdings Ltd.(1) | | | | 25 | | | | | 11,164 | |
Globe Life, Inc. | | | | 736 | | | | | 70,473 | |
Loews Corp. | | | | 704 | | | | | 36,267 | |
Progressive Corp. (The) | | | | 598 | | | | | 46,232 | |
| | | | | | | | | | |
| | | | | | | | | 292,835 | |
| INTERACTIVE MEDIA & SERVICES - 2.0% |
IAC/InterActiveCorp* | | | | 210 | | | | | 45,805 | |
| | | | | | | | | | |
| INTERNET & DIRECT MARKETING RETAIL - 2.6% |
Expedia Group, Inc. | | | | 448 | | | | | 60,212 | |
| | | | | | | | | | |
| MARINE - 2.6% | | | | |
Kirby Corp.* | | | | 710 | | | | | 58,372 | |
| | | | | | | | | | |
| MEDIA - 6.1% | | | | |
CBS Corp., Class B | | | | 1,023 | | | | | 41,309 | |
News Corp., Class A | | | | 3,048 | | | | | 42,430 | |
Omnicom Group, Inc. | | | | 698 | | | | | 54,652 | |
| | | | | | | | | | |
| | | | | | | | | 138,391 | |
| OIL, GAS & CONSUMABLE FUELS - 1.7% |
Devon Energy Corp. | | | | 818 | | | | | 19,685 | |
Marathon Petroleum Corp. | | | | 322 | | | | | 19,579 | |
| | | | | | | | | | |
| | | | | | | | | 39,264 | |
| ROAD & RAIL - 4.9% | | | | |
AMERCO | | | | 164 | | | | | 64,072 | |
Ryder System, Inc. | | | | 928 | | | | | 48,048 | |
| | | | | | | | | | |
| | | | | | | | | 112,120 | |
| | |
| 60 | | Artisan Partners Funds |
| | | | | | | | | | |
| | | Shares
Held | | Value |
SEMICONDUCTORS & SEMICONDUCTOR
EQUIPMENT - 3.2% | | | | |
Analog Devices, Inc. | | | | 641 | | | | $ | 71,671 | |
| | | | | | | | | | |
| SPECIALTY RETAIL - 3.5% | | | | |
AutoNation, Inc.* | | | | 1,575 | | | | | 79,862 | |
| | | | | | | | | | |
TECHNOLOGY HARDWARE, STORAGE &
PERIPHERALS - 2.0% | | | | |
NetApp, Inc. | | | | 854 | | | | | 44,855 | |
| | | | | | | | | | |
| TRADING COMPANIES & DISTRIBUTORS - 3.3% |
Air Lease Corp. | | | | 1,794 | | | | | 75,023 | |
| | | | | | | | | | |
Total common stocks
(Cost $1,490,931) | | | | | | | | | 2,170,655 | |
| | | | | | | | | | |
| SHORT-TERM INVESTMENTS - 4.3% | | | | |
| | | | | | | | | | |
| INVESTMENT COMPANIES - 4.3% | | | | |
BlackRock Liquidity Funds Treasury Trust Fund - Institutional Class, 2.10% | | | | 32,978 | | | | | 32,978 | |
Federated Treasury Obligations Fund - Institutional Class, 1.96% | | | | 32,009 | | | | | 32,009 | |
Fidelity Investments Money Market Treasury Portfolio - Institutional Class, 2.04% | | | | 32,009 | | | | | 32,009 | |
| | | | | | | | | | |
Total short-term investments
(Cost $96,996) | | | | | | | | | 96,996 | |
| | | | | | | | | | |
| | | | | | | | | | |
Total investments - 99.9%
(Cost $1,587,927) | | | | | | | | | 2,267,651 | |
| | | | | | | | | | |
Other assets less liabilities - 0.1% | | | | | | | | | 1,926 | |
| | | | | | | | | | |
| | | | | | | | | | |
Total net assets - 100.0%(2) | | | | | | | | $ | 2,269,577 | |
| | | | | | | | | | |
| * | | Non-income producing security. |
| (1) | | The Fund considers the company to be from outside the United States. See the Fund’s Statement of Additional Information for a description of the methodology used for country classifications. |
| | | | | | | | | | |
| Security | | Country | | Trading
Currency |
Fairfax Financial Holdings Ltd. | | Canada | | | | U.S. dollar | |
Nutrien Ltd. | | Canada | | | | U.S. dollar | |
| (2) | | Percentages for the various classifications relate to total net assets. |
Company names are as reported by a data service provider and in some cases are translations; a company’s legal name may be different.
| | | | | | | | | | |
| PORTFOLIO DIVERSIFICATION |
Dollar values in thousands | |
| | | Value | | Percentage
of Total
Investments |
Communication Services | | | $ | 270,992 | | | | | 12.0 | % |
Consumer Discretionary | | | | 343,467 | | | | | 15.1 | |
Consumer Staples | | | | 63,240 | | | | | 2.8 | |
Energy | | | | 39,264 | | | | | 1.7 | |
Financials | | | | 647,990 | | | | | 28.6 | |
Health Care | | | | 90,460 | | | | | 4.0 | |
Industrials | | | | 272,477 | | | | | 12.0 | |
Information Technology | | | | 159,719 | | | | | 7.0 | |
Materials | | | | 185,247 | | | | | 8.2 | |
Real Estate | | | | 97,799 | | | | | 4.3 | |
Short-Term Investments | | | | 96,996 | | | | | 4.3 | |
| | | | | | | | | | |
Total investments | | | $ | 2,267,651 | | | | | 100.0 | % |
| | | | | | | | | | |
| | | | | | | |
| TOP TEN HOLDINGS |
Company Name | | Country | | Percentage
of Total
Net Assets |
Celanese Corp. | | United States | | | | 4.1 | % |
AutoNation, Inc. | | United States | | | | 3.5 | |
Air Lease Corp. | | United States | | | | 3.3 | |
Arch Capital Group Ltd. | | United States | | | | 3.2 | |
Analog Devices, Inc. | | United States | | | | 3.2 | |
Globe Life, Inc. | | United States | | | | 3.1 | |
Gentex Corp. | | United States | | | | 2.9 | |
Thor Industries, Inc. | | United States | | | | 2.9 | |
AMERCO | | United States | | | | 2.8 | |
Kroger Co. (The) | | United States | | | | 2.8 | |
| | | | | | | |
Total | | | | | | 31.8 | % |
| | | | | | | |
For the purpose of determining the Fund’s top ten holdings, securities of the same issuer are aggregated to determine the weight in the Fund.
The accompanying notes are an integral part of the financial statements.
| | |
| Artisan Partners Funds | | 61 |
ARTISAN SMALL CAP FUND
Schedule of Investments – September 30, 2019
Shares and dollar values in thousands
| | | | | | | | | | |
| | | Shares
Held | | Value |
| COMMON STOCKS - 96.1% | | | | |
| | | | | | | | | | |
| AEROSPACE & DEFENSE - 8.8% | | | | |
BWX Technologies, Inc. | | | | 617 | | | | $ | 35,323 | |
Cubic Corp. | | | | 430 | | | | | 30,260 | |
Teledyne Technologies, Inc.* | | | | 297 | | | | | 95,717 | |
| | | | | | | | | | |
| | | | | | | | | 161,300 | |
| BANKS - 1.7% | | | | |
Webster Financial Corp. | | | | 680 | | | | | 31,857 | |
| | | | | | | | | | |
| BIOTECHNOLOGY - 9.5% | | | | |
Acceleron Pharma, Inc.* | | | | 439 | | | | | 17,328 | |
Agios Pharmaceuticals, Inc.* | | | | 228 | | | | | 7,394 | |
Argenx SE, ADR*(1) | | | | 243 | | | | | 27,704 | |
Ascendis Pharma A/S, ADR*(1) | | | | 308 | | | | | 29,672 | |
Halozyme Therapeutics, Inc.* | | | | 1,614 | | | | | 25,037 | |
Iovance Biotherapeutics, Inc.* | | | | 710 | | | | | 12,925 | |
Neurocrine Biosciences, Inc.* | | | | 170 | | | | | 15,288 | |
Orchard Therapeutics plc, ADR*(1) | | | | 919 | | | | | 10,923 | |
Radius Health, Inc.* | | | | 595 | | | | | 15,331 | |
Sage Therapeutics, Inc.* | | | | 65 | | | | | 9,073 | |
Veracyte, Inc.* | | | | 190 | | | | | 4,550 | |
| | | | | | | | | | |
| | | | | | | | | 175,225 | |
| CAPITAL MARKETS - 1.7% | | | | |
Morningstar, Inc. | | | | 92 | | | | | 13,414 | |
Virtu Financial, Inc., Class A | | | | 1,066 | | | | | 17,443 | |
| | | | | | | | | | |
| | | | | | | | | 30,857 | |
| CHEMICALS - 1.2% | | | | |
Ingevity Corp.* | | | | 264 | | | | | 22,380 | |
| | | | | | | | | | |
| DIVERSIFIED CONSUMER SERVICES - 5.1% |
Bright Horizons Family Solutions, Inc.* | | | | 234 | | | | | 35,609 | |
Chegg, Inc.* | | | | 1,615 | | | | | 48,382 | |
ServiceMaster Global Holdings, Inc.* | | | | 182 | | | | | 10,164 | |
| | | | | | | | | | |
| | | | | | | | | 94,155 | |
ELECTRONIC EQUIPMENT, INSTRUMENTS &
COMPONENTS - 3.4% |
Cognex Corp. | | | | 283 | | | | | 13,926 | |
Coherent, Inc.* | | | | 72 | | | | | 10,996 | |
Novanta, Inc.* | | | | 466 | | | | | 38,095 | |
| | | | | | | | | | |
| | | | | | | | | 63,017 | |
| ENTERTAINMENT - 4.3% | | | | |
Glu Mobile, Inc.* | | | | 1,840 | | | | | 9,181 | |
World Wrestling Entertainment, Inc., Class A | | | | 243 | | | | | 17,314 | |
Zynga, Inc., Class A* | | | | 8,973 | | | | | 52,221 | |
| | | | | | | | | | |
| | | | | | | | | 78,716 | |
| HEALTH CARE EQUIPMENT & SUPPLIES - 7.3% |
DexCom, Inc.* | | | | 410 | | | | | 61,154 | |
Glaukos Corp.* | | | | 633 | | | | | 39,570 | |
Insulet Corp.* | | | | 81 | | | | | 13,413 | |
Mesa Laboratories, Inc. | | | | 41 | | | | | 9,699 | |
Tactile Systems Technology, Inc.* | | | | 246 | | | | | 10,430 | |
| | | | | | | | | | |
| | | | | | | | | 134,266 | |
| HEALTH CARE PROVIDERS & SERVICES - 1.2% |
HealthEquity, Inc.* | | | | 367 | | | | | 20,951 | |
| | | | | | | | | | |
| HEALTH CARE TECHNOLOGY - 3.1% | | | | |
Tabula Rasa HealthCare, Inc.* | | | | 575 | | | | | 31,579 | |
Teladoc Health, Inc.* | | | | 380 | | | | | 25,764 | |
| | | | | | | | | | |
| | | | | | | | | 57,343 | |
| IT SERVICES - 0.7% | | | | |
LiveRamp Holdings, Inc.* | | | | 310 | | | | | 13,301 | |
| | | | | | | | | | |
| LIFE SCIENCES TOOLS & SERVICES - 1.4% |
NeoGenomics, Inc.* | | | | 1,305 | | | | | 24,950 | |
| | | | | | | | | | |
| MACHINERY - 6.0% | | | | |
Donaldson Co., Inc. | | | | 508 | | | | | 26,471 | |
Gardner Denver Holdings, Inc.* | | | | 1,491 | | | | | 42,170 | |
John Bean Technologies Corp. | | | | 421 | | | | | 41,829 | |
| | | | | | | | | | |
| | | | | | | | | 110,470 | |
| MEDIA - 1.3% | | | | |
New York Times Co. (The), Class A | | | | 848 | | | | | 24,156 | |
| | | | | | | | | | |
| MULTILINE RETAIL - 1.5% | | | | |
Ollie’s Bargain Outlet Holdings, Inc.* | | | | 462 | | | | | 27,063 | |
| | | | | | | | | | |
| PROFESSIONAL SERVICES - 1.3% | | | | |
Clarivate Analytics plc*(1) | | | | 1,439 | | | | | 24,269 | |
| | | | | | | | | | |
SEMICONDUCTORS & SEMICONDUCTOR
EQUIPMENT - 6.3% | | | | |
Ambarella, Inc.* | | | | 278 | | | | | 17,458 | |
Cree, Inc.* | | | | 705 | | | | | 34,559 | |
First Solar, Inc.* | | | | 488 | | | | | 28,300 | |
Monolithic Power Systems, Inc. | | | | 230 | | | | | 35,724 | |
| | | | | | | | | | |
| | | | | | | | | 116,041 | |
| SOFTWARE - 27.1% | | | | |
ACI Worldwide, Inc.* | | | | 1,347 | | | | | 42,205 | |
Altair Engineering, Inc., Class A* | | | | 343 | | | | | 11,881 | |
Avalara, Inc.* | | | | 237 | | | | | 15,918 | |
Blackline, Inc.* | | | | 883 | | | | | 42,239 | |
Coupa Software, Inc.* | | | | 305 | | | | | 39,477 | |
| | |
| 62 | | Artisan Partners Funds |
| | | | | | | | | | |
| | | Shares
Held | | Value |
| SOFTWARE (CONTINUED) | | | | |
Guidewire Software, Inc.* | | | | 588 | | | | $ | 61,919 | |
HubSpot, Inc.* | | | | 302 | | | | | 45,711 | |
LivePerson, Inc.* | | | | 1,362 | | | | | 48,632 | |
PROS Holdings, Inc.* | | | | 155 | | | | | 9,260 | |
Q2 Holdings, Inc.* | | | | 1,031 | | | | | 81,326 | |
RealPage, Inc.* | | | | 376 | | | | | 23,645 | |
Trade Desk, Inc. (The), Class A* | | | | 67 | | | | | 12,554 | |
Tyler Technologies, Inc.* | | | | 173 | | | | | 45,443 | |
Zscaler, Inc.* | | | | 379 | | | | | 17,895 | |
| | | | | | | | | | |
| | | | | | | | | 498,105 | |
| SPECIALTY RETAIL - 1.3% | | | | |
Floor & Decor Holdings, Inc., Class A* | | | | 471 | | | | | 24,069 | |
| | | | | | | | | | |
| TEXTILES, APPAREL & LUXURY GOODS - 1.9% |
Canada Goose Holdings, Inc.*(1) | | | | 786 | | | | | 34,539 | |
| | | | | | | | | | |
Total common stocks
(Cost $1,227,789) | | | | | | | | | 1,767,030 | |
| | | | | | | | | | |
| SHORT-TERM INVESTMENTS - 4.1% |
| | | | | | | | | | |
| INVESTMENT COMPANIES - 4.1% |
BlackRock Liquidity Funds Treasury Trust Fund - Institutional Class, 2.10% | | | | 25,308 | | | | | 25,308 | |
Federated Treasury Obligations Fund - Institutional Class, 1.96% | | | | 24,563 | | | | | 24,563 | |
Fidelity Investments Money Market Treasury Portfolio - Institutional Class, 2.04% | | | | 24,563 | | | | | 24,563 | |
| | | | | | | | | | |
Total short-term investments
(Cost $74,434) | | | | | | | | | 74,434 | |
| | | | | | | | | | |
| | | | | | | | | | |
Total investments - 100.2%
(Cost $1,302,223) | | | | | | | | | 1,841,464 | |
| | | | | | | | | | |
Other assets less liabilities - (0.2%) | | | | | | | | | (4,496 | ) |
| | | | | | | | | | |
| | | | | | | | | | |
Total net assets - 100.0%(2) | | | | | | | | $ | 1,836,968 | |
| | | | | | | | | | |
| * | | Non-income producing security. |
| (1) | | The Fund considers the company to be from outside the United States. See the Fund’s Statement of Additional Information for a description of the methodology used for country classifications. |
| | | | | | | | | | |
| Security | | Country | | Trading
Currency |
Argenx SE | | Netherlands | | | | U.S. dollar | |
Ascendis Pharma A/S | | Denmark | | | | U.S. dollar | |
Canada Goose Holdings, Inc. | | Canada | | | | U.S. dollar | |
Clarivate Analytics plc | | United Kingdom | | | | U.S. dollar | |
Orchard Therapeutics plc | | United Kingdom | | | | U.S. dollar | |
| (2) | | Percentages for the various classifications relate to total net assets. |
Company names are as reported by a data service provider and in some cases are translations; a company’s legal name may be different.
| | |
| Abbreviation |
ADR | | American Depositary Receipt |
| | | | | | | | | | |
| PORTFOLIO DIVERSIFICATION |
Dollar values in thousands | |
| | | Value | | Percentage
of Total
Investments |
Communication Services | | | $ | 102,872 | | | | | 5.6 | % |
Consumer Discretionary | | | | 179,826 | | | | | 9.8 | |
Financials | | | | 62,714 | | | | | 3.4 | |
Health Care | | | | 412,735 | | | | | 22.4 | |
Industrials | | | | 296,039 | | | | | 16.1 | |
Information Technology | | | | 690,464 | | | | | 37.5 | |
Materials | | | | 22,380 | | | | | 1.2 | |
Short-Term Investments | | | | 74,434 | | | | | 4.0 | |
| | | | | | | | | | |
Total investments | | | $ | 1,841,464 | | | | | 100.0 | % |
| | | | | | | | | | |
| | | | | | | |
| TOP TEN HOLDINGS |
Company Name | | Country | | Percentage
of Total
Net Assets |
Teledyne Technologies, Inc. | | United States | | | | 5.2 | % |
Q2 Holdings, Inc. | | United States | | | | 4.4 | |
Guidewire Software, Inc. | | United States | | | | 3.4 | |
DexCom, Inc. | | United States | | | | 3.3 | |
Zynga, Inc. | | United States | | | | 2.8 | |
LivePerson, Inc. | | United States | | | | 2.6 | |
Chegg, Inc. | | United States | | | | 2.6 | |
HubSpot, Inc. | | United States | | | | 2.5 | |
Tyler Technologies, Inc. | | United States | | | | 2.5 | |
Blackline, Inc. | | United States | | | | 2.3 | |
| | | | | | | |
Total | | | | | | 31.6 | % |
| | | | | | | |
For the purpose of determining the Fund’s top ten holdings, securities of the same issuer are aggregated to determine the weight in the Fund.
The accompanying notes are an integral part of the financial statements.
| | |
| Artisan Partners Funds | | 63 |
ARTISAN SUSTAINABLE EMERGING MARKETS FUND
Schedule of Investments – September 30, 2019
Shares and dollar values in thousands
| | | | | | | | | | |
| | | Shares
Held | | Value |
| COMMON STOCKS - 98.4% |
| | | | | | | | | | |
| ARGENTINA - 2.1% |
Despegar.com Corp.* | | | | 23 | | | | $ | 266 | |
MercadoLibre, Inc.* | | | | 2 | | | | | 832 | |
| | | | | | | | | | |
| | | | | | | | | 1,098 | |
| BRAZIL - 9.4% |
Arco Platform Ltd., Class A* | | | | 8 | | | | | 414 | |
Cia Energetica de Minas Gerais (Preference) | | | | 166 | | | | | 575 | |
CVC Brasil Operadora e Agencia de Viagens SA | | | | 38 | | | | | 508 | |
Grupo SBF SA* | | | | 95 | | | | | 518 | |
Itau Unibanco Holding SA (Preference) | | | | 114 | | | | | 958 | |
Linx SA | | | | 70 | | | | | 551 | |
Petroleo Brasileiro SA* | | | | 103 | | | | | 747 | |
Vale SA* | | | | 53 | | | | | 611 | |
| | | | | | | | | | |
| | | | | | | | | 4,882 | |
| CHILE - 1.6% |
Empresa Nacional de Telecomunicaciones SA* | | | | 38 | | | | | 332 | |
SACI Falabella | | | | 87 | | | | | 484 | |
| | | | | | | | | | |
| | | | | | | | | 816 | |
| CHINA - 18.6% |
Alibaba Group Holding Ltd., ADR* | | | | 19 | | | | | 3,216 | |
Baidu, Inc., ADR* | | | | 5 | | | | | 486 | |
China Life Insurance Co. Ltd., Class H | | | | 279 | | | | | 646 | |
China Petroleum & Chemical Corp., Class H | | | | 1,159 | | | | | 689 | |
China Traditional Chinese Medicine Holdings Co. Ltd. | | | | 1,524 | | | | | 700 | |
Ctrip.com International Ltd., ADR* | | | | 17 | | | | | 505 | |
Haier Smart Home Co. Ltd., Class A | | | | 161 | | | | | 345 | |
iQIYI, Inc., ADR* | | | | 20 | | | | | 315 | |
Noah Holdings Ltd., ADR* | | | | 21 | | | | | 619 | |
Prosus NV* | | | | 7 | | | | | 499 | |
Sinopharm Group Co. Ltd., Class H | | | | 208 | | | | | 652 | |
Tencent Music Entertainment Group, ADR* | | | | 21 | | | | | 272 | |
Zhuzhou CRRC Times Electric Co. Ltd., Class H | | | | 178 | | | | | 736 | |
| | | | | | | | | | |
| | | | | | | | | 9,680 | |
| COLOMBIA - 1.1% |
Banco Davivienda SA (Preference) | | | | 49 | | | | | 589 | |
| | | | | | | | | | |
| CZECH REPUBLIC - 0.9% |
Moneta Money Bank A/S | | | | 149 | | | | | 460 | |
| | | | | | | | | | |
| GEORGIA - 0.7% |
Georgia Healthcare Group plc | | | | 143 | | | | | 352 | |
| | | | | | | | | | |
| GREECE - 2.0% |
Alpha Bank AE* | | | | 230 | | | | | 430 | |
| GREECE (CONTINUED) |
JUMBO SA | | | | 33 | | | | | 628 | |
| | | | | | | | | | |
| | | | | | | | | 1,058 | |
| HONG KONG - 3.8% |
AIA Group Ltd. | | | | 96 | | | | | 905 | |
China High Precision Automation Group Ltd.*(1)(2) | | | | 9,066 | | | | | – | |
Sino Biopharmaceutical Ltd. | | | | 866 | | | | | 1,100 | |
| | | | | | | | | | |
| | | | | | | | | 2,005 | |
| INDIA - 10.9% |
Havells India Ltd. | | | | 52 | | | | | 527 | |
ICICI Bank Ltd. | | | | 212 | | | | | 1,299 | |
Kajaria Ceramics Ltd. | | | | 104 | | | | | 806 | |
Metropolis Healthcare Ltd.* | | | | 23 | | | | | 407 | |
Phoenix Mills Ltd. (The) | | | | 69 | | | | | 674 | |
Reliance Industries Ltd. | | | | 85 | | | | | 1,604 | |
Westlife Development Ltd.* | | | | 84 | | | | | 350 | |
| | | | | | | | | | |
| | | | | | | | | 5,667 | |
| INDONESIA - 4.5% |
Astra International Tbk. PT | | | | 1,074 | | | | | 500 | |
Bank Rakyat Indonesia Persero Tbk. PT | | | | 2,434 | | | | | 706 | |
Indofood CBP Sukses Makmur Tbk. PT | | | | 642 | | | | | 544 | |
Telekomunikasi Indonesia Persero Tbk. PT | | | | 1,996 | | | | | 606 | |
| | | | | | | | | | |
| | | | | | | | | 2,356 | |
| MALAYSIA - 0.4% |
AirAsia Group Bhd. | | | | 482 | | | | | 203 | |
| | | | | | | | | | |
| MEXICO - 0.7% |
Cemex SAB de CV | | | | 1,003 | | | | | 390 | |
| | | | | | | | | | |
| PANAMA - 1.2% |
Copa Holdings SA, Class A | | | | 6 | | | | | 627 | |
| | | | | | | | | | |
| PERU - 1.2% |
Credicorp Ltd. | | | | 3 | | | | | 605 | |
| | | | | | | | | | |
| RUSSIA - 9.2% |
Globaltrans Investment plc, GDR | | | | 46 | | | | | 399 | |
LSR Group PJSC, GDR | | | | 116 | | | | | 253 | |
Lukoil PJSC, ADR | | | | 13 | | | | | 1,076 | |
MMC Norilsk Nickel PJSC, ADR | | | | 29 | | | | | 753 | |
Polyus PJSC, GDR | | | | 22 | | | | | 1,293 | |
Sberbank of Russia PJSC(1) | | | | 253 | | | | | 888 | |
Yandex NV, Class A* | | | | 3 | | | | | 103 | |
| | | | | | | | | | |
| | | | | | | | | 4,765 | |
| SOUTH AFRICA - 4.1% |
FirstRand Ltd. | | | | 117 | | | | | 479 | |
| | |
| 64 | | Artisan Partners Funds |
| | | | | | | | | | |
| | | Shares
Held | | Value |
| SOUTH AFRICA (CONTINUED) |
Foschini Group Ltd. (The) | | | | 59 | | | | $ | 634 | |
Naspers Ltd., Class N | | | | 7 | | | | | 1,031 | |
| | | | | | | | | | |
| | | | | | | | | 2,144 | |
| SOUTH KOREA - 11.9% |
BGF retail Co. Ltd. | | | | 2 | | | | | 278 | |
Kia Motors Corp. | | | | 9 | | | | | 351 | |
LG Chem Ltd. | | | | 2 | | | | | 533 | |
Medy-Tox, Inc. | | | | 2 | | | | | 454 | |
Samsung Biologics Co. Ltd.* | | | | 2 | | | | | 458 | |
Samsung Electronics Co. Ltd. | | | | 84 | | | | | 3,445 | |
Shinhan Financial Group Co. Ltd. | | | | 19 | | | | | 664 | |
| | | | | | | | | | |
| | | | | | | | | 6,183 | |
| TAIWAN - 11.3% |
E Ink Holdings, Inc.(1) | | | | 757 | | | | | 687 | |
MediaTek, Inc.(1) | | | | 96 | | | | | 1,142 | |
Sunny Friend Environmental Technology Co. Ltd.(1) | | | | 128 | | | | | 1,120 | |
Taiwan Semiconductor Manufacturing Co. Ltd.(1) | | | | 333 | | | | | 2,930 | |
| | | | | | | | | | |
| | | | | | | | | 5,879 | |
| THAILAND - 0.8% |
Bangkok Bank PCL, NVDR | | | | 69 | | | | | 394 | |
| | | | | | | | | | |
| TURKEY - 2.0% |
Global Ports Holding plc | | | | 143 | | | | | 543 | |
Turkiye Sinai Kalkinma Bankasi A/S* | | | | 2,882 | | | | | 485 | |
| | | | | | | | | | |
| | | | | | | | | 1,028 | |
| | | | | | | | | | |
Total common stocks
(Cost $45,212) | | | | | | | | | 51,181 | |
| | | | | | |
| SHORT-TERM INVESTMENTS - 0.7% |
| | | | | | | | | | |
| INVESTMENT COMPANIES - 0.7% |
BlackRock Liquidity Funds Treasury Trust Fund - Institutional Class, 2.10% | | | | 122 | | | | | 122 | |
Federated Treasury Obligations Fund - Institutional Class, 1.96% | | | | 119 | | | | | 119 | |
Fidelity Investments Money Market Treasury Portfolio - Institutional Class, 2.04% | | | | 119 | | | | | 119 | |
| | | | | | | | | | |
Total short-term investments
(Cost $360) | | | | | | | | | 360 | |
| | | | | | | | | | |
| | | | | | |
Total investments - 99.1%
(Cost $45,572) | | | | | | | | | 51,541 | |
| | | | | | | | | | |
Other assets less liabilities - 0.9% | | | | | | | | | 491 | |
| | | | | | | | | | |
| | | | | | |
Total net assets - 100.0%(3) | | | | | | | | $ | 52,032 | |
| | | | | | | | | | |
| * | | Non-income producing security. |
| (1) | | Valued at a fair value in accordance with procedures established by the board of directors of Artisan Partners Funds. In total, securities valued at a fair value were $6,767 or 13.0% of total net assets. See notes 2(a) and 4 in Notes to Financial Statements for additional information. |
| (2) | | Security is valued using significant unobservable inputs and is classified as Level 3 in the fair value hierarchy. |
| (3) | | Percentages for the various classifications relate to total net assets. |
Company names are as reported by a data service provider and in some cases are translations; a company’s legal name may be different.
| | |
| Abbreviations |
ADR | | American Depositary Receipt |
GDR | | Global Depositary Receipt |
NVDR | | Non-Voting Depositary Receipt |
Preference | | A special type of equity investment that shares in the earnings of the company and may have a dividend preference. Preference shares may also have liquidation preference. |
| | | | | | | | | | |
| PORTFOLIO DIVERSIFICATION |
Dollar values in thousands | |
| | | Value | | Percentage
of Total
Investments |
Communication Services | | | $ | 2,114 | | | | | 4.1 | % |
Consumer Discretionary | | | | 11,081 | | | | | 21.5 | |
Consumer Staples | | | | 1,174 | | | | | 2.3 | |
Energy | | | | 4,116 | | | | | 8.0 | |
Financials | | | | 10,127 | | | | | 19.7 | |
Health Care | | | | 3,771 | | | | | 7.3 | |
Industrials | | | | 4,961 | | | | | 9.6 | |
Information Technology | | | | 8,755 | | | | | 17.0 | |
Materials | | | | 3,580 | | | | | 6.9 | |
Real Estate | | | | 927 | | | | | 1.8 | |
Utilities | | | | 575 | | | | | 1.1 | |
Short-Term Investments | | | | 360 | | | | | 0.7 | |
| | | | | | | | | | |
Total investments | | | $ | 51,541 | | | | | 100.0 | % |
| | | | | | | | | | |
| | |
| Artisan Partners Funds | | 65 |
| | | | | | | | | | |
| TRADING CURRENCIES |
Dollar values in thousands | |
| | | Value | | Percentage
of Total
Investments |
Brazilian real | | | $ | 4,468 | | | | | 8.7 | % |
British pound | | | | 895 | | | | | 1.7 | |
Chilean peso | | | | 816 | | | | | 1.6 | |
Chinese yuan renminbi offshore | | | | 345 | | | | | 0.7 | |
Colombian peso | | | | 589 | | | | | 1.1 | |
Czech koruna | | | | 460 | | | | | 0.9 | |
Euro | | | | 1,557 | | | | | 3.0 | |
Hong Kong dollar | | | | 5,428 | | | | | 10.5 | |
Indian rupee | | | | 5,667 | | | | | 11.0 | |
Indonesian rupiah | | | | 2,356 | | | | | 4.6 | |
Korean won | | | | 6,183 | | | | | 12.0 | |
Malaysian ringgit | | | | 203 | | | | | 0.4 | |
Mexican peso | | | | 390 | | | | | 0.7 | |
New Taiwan dollar | | | | 5,879 | | | | | 11.4 | |
South African rand | | | | 2,144 | | | | | 4.2 | |
Thai baht | | | | 394 | | | | | 0.8 | |
Turkish lira | | | | 485 | | | | | 0.9 | |
U.S. dollar | | | | 13,282 | | | | | 25.8 | |
| | | | | | | | | | |
Total investments | | | $ | 51,541 | | | | | 100.0 | % |
| | | | | | | | | | |
| | | | | | | |
| TOP TEN HOLDINGS |
Company Name | | Country | | Percentage
of Total
Net Assets |
Samsung Electronics Co. Ltd. | | South Korea | | | | 6.6 | % |
Alibaba Group Holding Ltd. | | China | | | | 6.2 | |
Taiwan Semiconductor Manufacturing Co. Ltd. | | Taiwan | | | | 5.6 | |
Reliance Industries Ltd. | | India | | | | 3.1 | |
ICICI Bank Ltd. | | India | | | | 2.5 | |
Polyus PJSC | | Russia | | | | 2.5 | |
MediaTek, Inc. | | Taiwan | | | | 2.2 | |
Sunny Friend Environmental Technology Co. Ltd. | | Taiwan | | | | 2.2 | |
Sino Biopharmaceutical Ltd. | | Hong Kong | | | | 2.1 | |
Lukoil PJSC | | Russia | | | | 2.1 | |
| | | | | | | |
Total | | | | | | 35.1 | % |
| | | | | | | |
For the purpose of determining the Fund’s top ten holdings, securities of the same issuer are aggregated to determine the weight in the Fund.
The accompanying notes are an integral part of the financial statements.
| | |
| 66 | | Artisan Partners Funds |
ARTISAN THEMATIC FUND
Schedule of Investments – September 30, 2019
Shares and dollar values in thousands
| | | | | | | | | | |
| | | Shares
Held | | Value |
| COMMON STOCKS - 87.1% |
| | | | | | | | | | |
| CAPITAL MARKETS - 4.9% |
BlackRock, Inc. | | | | 46 | | | | $ | 20,527 | |
Moody’s Corp. | | | | 33 | | | | | 6,799 | |
S&P Global, Inc. | | | | 28 | | | | | 6,740 | |
| | | | | | | | | | |
| | | | | | | | | 34,066 | |
| CHEMICALS - 7.8% |
Air Liquide SA(1) | | | | 194 | | | | | 27,578 | |
Linde plc(1) | | | | 138 | | | | | 26,707 | |
| | | | | | | | | | |
| | | | | | | | | 54,285 | |
| EQUITY REAL ESTATE INVESTMENT TRUSTS (REITS) - 9.0% |
American Tower Corp. | | | | 69 | | | | | 15,270 | |
CoreSite Realty Corp. | | | | 58 | | | | | 7,070 | |
Equinix, Inc. | | | | 43 | | | | | 24,717 | |
SBA Communications Corp. | | | | 62 | | | | | 15,019 | |
| | | | | | | | | | |
| | | | | | | | | 62,076 | |
| HEALTH CARE EQUIPMENT & SUPPLIES - 5.7% |
Becton Dickinson and Co. | | | | 100 | | | | | 25,399 | |
Danaher Corp. | | | | 48 | | | | | 6,885 | |
Medtronic plc | | | | 64 | | | | | 6,917 | |
| | | | | | | | | | |
| | | | | | | | | 39,201 | |
| HOTELS, RESTAURANTS & LEISURE - 3.3% |
Hilton Worldwide Holdings, Inc. | | | | 149 | | | | | 13,899 | |
Marriott International, Inc., Class A | | | | 71 | | | | | 8,818 | |
| | | | | | | | | | |
| | | | | | | | | 22,717 | |
| INTERACTIVE MEDIA & SERVICES - 3.7% |
Alphabet, Inc., Class A* | | | | 11 | | | | | 13,419 | |
Facebook, Inc., Class A* | | | | 68 | | | | | 12,075 | |
| | | | | | | | | | |
| | | | | | | | | 25,494 | |
| IT SERVICES - 15.7% |
Fidelity National Information Services, Inc. | | | | 372 | | | | | 49,430 | |
Fiserv, Inc.* | | | | 85 | | | | | 8,758 | |
Global Payments, Inc. | | | | 108 | | | | | 17,189 | |
InterXion Holding NV*(1) | | | | 122 | | | | | 9,965 | |
VeriSign, Inc.* | | | | 37 | | | | | 6,891 | |
Visa, Inc., Class A | | | | 94 | | | | | 16,130 | |
| | | | | | | | | | |
| | | | | | | | | 108,363 | |
| LIFE SCIENCES TOOLS & SERVICES - 7.0% |
IQVIA Holdings, Inc.* | | | | 143 | | | | | 21,296 | |
Thermo Fisher Scientific, Inc. | | | | 94 | | | | | 27,355 | |
| | | | | | | | | | |
| | | | | | | | | 48,651 | |
| MEDIA - 8.4% |
Altice USA, Inc., Class A* | | | | 592 | | | | | 16,988 | |
| MEDIA (CONTINUED) |
Charter Communications, Inc., Class A* | | | | 50 | | | | | 20,472 | |
Comcast Corp., Class A | | | | 453 | | | | | 20,424 | |
| | | | | | | | | | |
| | | | | | | | | 57,884 | |
| PROFESSIONAL SERVICES - 5.1% |
IHS Markit Ltd.* | | | | 428 | | | | | 28,598 | |
TransUnion | | | | 86 | | | | | 6,983 | |
| | | | | | | | | | |
| | | | | | | | | 35,581 | |
SEMICONDUCTORS & SEMICONDUCTOR
EQUIPMENT - 7.5% | | |
Analog Devices, Inc. | | | | 124 | | | | | 13,854 | |
Marvell Technology Group Ltd. | | | | 348 | | | | | 8,689 | |
NVIDIA Corp. | | | | 107 | | | | | 18,604 | |
Texas Instruments, Inc. | | | | 81 | | | | | 10,514 | |
| | | | | | | | | | |
| | | | | | | | | 51,661 | |
| Software - 5.8% |
Microsoft Corp. | | | | 212 | | | | | 29,447 | |
VMware, Inc., Class A | | | | 70 | | | | | 10,569 | |
| | | | | | | | | | |
| | | | | | | | | 40,016 | |
| WIRELESS TELECOMMUNICATION SERVICES - 3.2% |
T-Mobile US, Inc.* | | | | 282 | | | | | 22,188 | |
| | | | | | | | | | |
| | | | | | | | | | |
Total common stocks
(Cost $556,418) | | | | | 602,183 | |
| | | | | | | | | | |
| | |
| | | No. of
Contracts ‡ | | |
| OPTION PURCHASED - 0.1% |
| | | | | | | | | | |
| CALL OPTION - 0.1% |
| | | | | | | | | | |
Interactive Media & Services - 0.1% | |
Alphabet, Inc.
11/15/2019 at USD 1,275.00;
Notional Amount: USD 942
(Cost $1,296) | | | | 417 | | | | | 943 | |
| | |
| | | Shares
Held | | |
| SHORT-TERM INVESTMENTS - 12.5% |
| | | | | | | | | | |
| INVESTMENT COMPANIES - 12.5% |
BlackRock Liquidity Funds Treasury Trust Fund - Institutional Class, 2.10% | | | | 29,270 | | | | | 29,270 | |
Federated Treasury Obligations Fund - Institutional Class, 1.96% | | | | 28,410 | | | | | 28,410 | |
| | |
| Artisan Partners Funds | | 67 |
| | | | | | | | | | |
| | | Shares
Held | | Value |
| INVESTMENT COMPANIES (CONTINUED) |
Fidelity Investments Money Market Treasury Portfolio - Institutional Class, 2.04% | | | | 28,410 | | | | $ | 28,410 | |
| | | | | | | | | | |
Total short-term investments
(Cost $86,090) | | | | | 86,090 | |
| | | | | | | | | | |
| | | | | | | | | | |
Total investments - 99.7%
(Cost $643,804) | | | | | 689,216 | |
| | | | | | | | | | |
Other assets less liabilities - 0.3% | | | | | 2,263 | |
| | | | | | | | | | |
| | | | | | | | | | |
Total net assets - 100.0%(2) | | | | $ | 691,479 | |
| | | | | | | | | | |
| * | | Non-income producing security. |
| ‡ | | One contract is equal to 100 shares. |
| (1) | | The Fund considers the company to be from outside the United States. See the Fund’s Statement of Additional Information for a description of the methodology used for country classifications. |
| | | | | | | | | | |
| Security | | Country | | Trading
Currency |
Air Liquide SA | | France | | Euro |
InterXion Holding NV | | Netherlands | | U.S. dollar |
Linde plc | | United Kingdom | | U.S. dollar |
| (2) | | Percentages for the various classifications relate to total net assets. |
Company names are as reported by a data service provider and in some cases are translations; a company’s legal name may be different.
| | |
| Abbreviation |
USD | | U.S . dollar |
| | | | | | | | | | | | | | | | | | | | | | |
| FOREIGN CURRENCY FORWARD CONTRACTS |
Values in thousands |
| | | | | | | | | | | | | | |
Currency
Purchased | | Currency
Sold | | Counterparty | | Settlement
Date | | Unrealized
Appreciation
(Depreciation) |
CNH 85,968 | | USD 12,018 | | JPM | | | | 11/13/2019 | | | | $ | 8 | |
USD 68,972 | | CNH 488,723 | | JPM | | | | 11/13/2019 | | | | | 604 | |
USD 33,217 | | EUR 29,897 | | JPM | | | | 12/12/2019 | | | | | 451 | |
| | | | | | | | | | | | | | |
Total unrealized appreciation | | | | | | | | | 1,063 | |
| | | | | | | | | | | | | | |
| FOREIGN CURRENCY FORWARD CONTRACTS (CONTINUED) |
Values in thousands | |
Currency
Purchased | | Currency
Sold | | Counterparty | | Settlement
Date | | Unrealized
Appreciation
(Depreciation) |
CNH 494,813 | | USD 69,602 | | JPM | | | | 11/13/2019 | | | | $ | (381 | ) |
USD 12,853 | | CNH 92,058 | | JPM | | | | 11/13/2019 | | | | | (25 | ) |
EUR 5,848 | | USD 6,518 | | JPM | | | | 12/12/2019 | | | | | (109 | ) |
| | | | | | | | | | | | | | |
Total unrealized depreciation | | | | | | | | | (515 | ) |
| | | | | | | | | | | | | | |
Net unrealized appreciation | | | | | | | | $ | 548 | |
| | | | | | | | | | | | | | |
| | |
CNH | | Chinese yuan renminbi offshore |
EUR | | Euro |
USD | | U.S. dollar |
JPM | | JPMorgan Chase Bank, N.A. |
|
| PORTFOLIO DIVERSIFICATION |
Dollar values in thousands |
| | | | | | | | | | |
| | | Value | | Percentage
of Total
Investments |
Communication Services | | | $ | 105,566 | | | | | 15.3 | % |
Consumer Discretionary | | | | 22,717 | | | | | 3.3 | |
Financials | | | | 34,066 | | | | | 4.9 | |
Health Care | | | | 87,852 | | | | | 12.8 | |
Industrials | | | | 35,581 | | | | | 5.2 | |
Information Technology | | | | 200,040 | | | | | 29.0 | |
Materials | | | | 54,285 | | | | | 7.9 | |
Real Estate | | | | 62,076 | | | | | 9.0 | |
Option Purchased | | | | 943 | | | | | 0.1 | |
Short-Term Investments | | | | 86,090 | | | | | 12.5 | |
| | | | | | | | | | |
Total investments | | | $ | 689,216 | | | | | 100.0 | % |
| | | | | | | | | | |
| | | | | | | | | | |
| TRADING CURRENCIES |
Dollar values in thousands | |
| | | Value | | Percentage
of Total
Investments |
Euro | | | $ | 27,578 | | | | | 4.0 | % |
U.S. dollar | | | | 661,638 | | | | | 96.0 | |
| | | | | | | | | | |
Total investments | | | $ | 689,216 | | | | | 100.0 | % |
| | | | | | | | | | |
| | |
| 68 | | Artisan Partners Funds |
| | | | | | | |
| TOP TEN HOLDINGS | | | | |
Company Name | | Country | | Percentage
of Total
Net Assets |
Fidelity National Information Services, Inc. | | United States | | | | 7.1 | % |
Microsoft Corp. | | United States | | | | 4.3 | |
IHS Markit Ltd. | | United States | | | | 4.1 | |
Air Liquide SA | | France | | | | 4.0 | |
Thermo Fisher Scientific, Inc. | | United States | | | | 4.0 | |
Linde plc | | United Kingdom | | | | 3.8 | |
Becton Dickinson and Co. | | United States | | | | 3.7 | |
Equinix, Inc. | | United States | | | | 3.6 | |
T-Mobile US, Inc. | | United States | | | | 3.2 | |
IQVIA Holdings, Inc. | | United States | | | | 3.1 | |
| | | | | | | |
Total | | | | | | 40.9 | % |
| | | | | | | |
For the purpose of determining the Fund’s top ten holdings, securities of the same issuer are aggregated to determine the weight in the Fund.
The accompanying notes are an integral part of the financial statements.
| | |
| Artisan Partners Funds | | 69 |
ARTISAN VALUE FUND
Schedule of Investments – September 30, 2019
Shares and dollar values in thousands
| | | | | | | | | | |
| | | Shares
Held | | Value |
| COMMON STOCKS - 97.1% | | | | |
| | | | | | | | | | |
| AEROSPACE & DEFENSE - 3.1% | | |
Raytheon Co. | | | | 65 | | | | $ | 12,698 | |
| | | | | | | | | | |
| AIR FREIGHT & LOGISTICS - 2.8% | | |
FedEx Corp. | | | | 79 | | | | | 11,513 | |
| | | | | | | | | | |
| AUTO COMPONENTS - 2.8% | | | | |
Cie Generale des Etablissements Michelin SCA(1) | | | | 101 | | | | | 11,275 | |
| | | | | | | | | | |
| BANKS - 7.8% | | | | |
Citigroup, Inc. | | | | 231 | | | | | 15,935 | |
SunTrust Banks, Inc. | | | | 121 | | | | | 8,330 | |
Wells Fargo & Co. | | | | 154 | | | | | 7,749 | |
| | | | | | | | | | |
| | | | | | | | | 32,014 | |
| CAPITAL MARKETS - 5.5% | | | | |
Brookfield Asset Management, Inc., Class A(1) | | | | 86 | | | | | 4,573 | |
E*TRADE Financial Corp. | | | | 185 | | | | | 8,087 | |
Goldman Sachs Group, Inc. (The) | | | | 47 | | | | | 9,827 | |
| | | | | | | | | | |
| | | | | | | | | 22,487 | |
| CHEMICALS - 7.7% | | | | |
Celanese Corp. | | | | 91 | | | | | 11,128 | |
Dow, Inc. | | | | 88 | | | | | 4,199 | |
DuPont de Nemours, Inc. | | | | 94 | | | | | 6,698 | |
Nutrien Ltd.(1) | | | | 187 | | | | | 9,310 | |
| | | | | | | | | | |
| | | | | | | | | 31,335 | |
| COMMUNICATIONS EQUIPMENT - 3.0% | | |
Cisco Systems, Inc. | | | | 248 | | | | | 12,239 | |
| | | | | | | | | | |
| CONSTRUCTION & ENGINEERING - 1.2% | | |
Jacobs Engineering Group, Inc. | | | | 55 | | | | | 5,072 | |
| | | | | | | | | | |
| CONSUMER FINANCE - 3.2% | | | | |
Synchrony Financial | | | | 387 | | | | | 13,201 | |
| | | | | | | | | | |
| DIVERSIFIED FINANCIAL SERVICES - 4.5% | | |
Berkshire Hathaway, Inc., Class B* | | | | 89 | | | | | 18,452 | |
| | | | | | | | | | |
| DIVERSIFIED TELECOMMUNICATION SERVICES - 1.1% |
GCI Liberty, Inc., Class A* | | | | 73 | | | | | 4,509 | |
| | | | | | | | | | |
| HEALTH CARE EQUIPMENT & SUPPLIES - 3.0% |
Medtronic plc | | | | 111 | | | | | 12,093 | |
| | | | | | | | | | |
| INSURANCE - 2.7% | | | | |
Chubb Ltd. | | | | 67 | | | | | 10,893 | |
| INTERACTIVE MEDIA & SERVICES - 8.0% | | |
Alphabet, Inc., Class C* | | | | 17 | | | | | 20,290 | |
Facebook, Inc., Class A* | | | | 70 | | | | | 12,530 | |
| | | | | | | | | | |
| | | | | | | | | 32,820 | |
| INTERNET & DIRECT MARKETING RETAIL - 3.6% |
Booking Holdings, Inc.* | | | | 7 | | | | | 14,631 | |
| | | | | | | | | | |
| MEDIA - 5.8% | | | | |
CBS Corp., Class B | | | | 211 | | | | | 8,512 | |
Comcast Corp., Class A | | | | 334 | | | | | 15,072 | |
| | | | | | | | | | |
| | | | | | | | | 23,584 | |
| OIL, GAS & CONSUMABLE FUELS - 2.0% | | |
Devon Energy Corp. | | | | 141 | | | | | 3,399 | |
EOG Resources, Inc. | | | | 66 | | | | | 4,914 | |
| | | | | | | | | | |
| | | | | | | | | 8,313 | |
| PHARMACEUTICALS - 5.6% | | | | |
Allergan plc | | | | 62 | | | | | 10,471 | |
Sanofi(1) | | | | 133 | | | | | 12,288 | |
| | | | | | | | | | |
| | | | | | | | | 22,759 | |
SEMICONDUCTORS & SEMICONDUCTOR
EQUIPMENT - 3.9% | | | | |
NXP Semiconductors NV(1) | | | | 146 | | | | | 15,960 | |
| | | | | | | | | | |
| SOFTWARE - 1.6% | | | | |
Oracle Corp. | | | | 115 | | | | | 6,326 | |
| | | | | | | | | | |
| SPECIALTY RETAIL - 3.2% | | | | |
AutoNation, Inc.* | | | | 254 | | | | | 12,885 | |
| | | | | | | | | | |
TECHNOLOGY HARDWARE, STORAGE &
PERIPHERALS - 7.5% | | | | |
Apple, Inc. | | | | 87 | | | | | 19,453 | |
Samsung Electronics Co. Ltd. (Preference)(1) | | | | 342 | | | | | 11,308 | |
| | | | | | | | | | |
| | | | | | | | | 30,761 | |
| TOBACCO - 3.8% | | | | |
Altria Group, Inc. | | | | 237 | | | | | 9,692 | |
Swedish Match AB(1) | | | | 142 | | | | | 5,892 | |
| | | | | | | | | | |
| | | | | | | | | 15,584 | |
| TRADING COMPANIES & DISTRIBUTORS - 3.7% |
Air Lease Corp. | | | | 360 | | | | | 15,058 | |
| | | | | | | | | | |
Total common stocks
(Cost $289,116) | | | | | | | | | 396,462 | |
| | |
| 70 | | Artisan Partners Funds |
| | | | | | | | | | |
| | | Shares
Held | | Value |
| SHORT-TERM INVESTMENTS - 3.7% | | |
| | | | | | | | | | |
| INVESTMENT COMPANIES - 3.7% | | | | |
BlackRock Liquidity Funds Treasury Trust Fund - Institutional Class, 2.10% | | | | 5,120 | | | | $ | 5,120 | |
Federated Treasury Obligations Fund - Institutional Class, 1.96% | | | | 4,969 | | | | | 4,969 | |
Fidelity Investments Money Market Treasury Portfolio - Institutional Class, 2.04% | | | | 4,969 | | | | | 4,969 | |
| | | | | | | | | | |
Total short-term investments
(Cost $15,058) | | | | | | | | | 15,058 | |
| | | | | | | | | | |
| | | | | | | | | | |
Total investments - 100.8%
(Cost $304,174) | | | | | | | | | 411,520 | |
| | | | | | | | | | |
Other assets less liabilities - (0.8%) | | | | | | | | | (3,222 | ) |
| | | | | | | | | | |
| | | | | | | | | | |
Total net assets - 100.0%(2) | | | | | | | | $ | 408,298 | |
| | | | | | | | | | |
| * | | Non-income producing security. |
| (1) | | The Fund considers the company to be from outside the United States. See the Fund’s Statement of Additional Information for a description of the methodology used for country classifications. |
| | | | | | | | | | |
| Security | | Country | | Trading
Currency |
Brookfield Asset Management, Inc. | | Canada | | U.S. dollar |
Cie Generale des Etablissements Michelin SCA | | France | | Euro |
Nutrien Ltd. | | Canada | | U.S. dollar |
NXP Semiconductors NV | | Netherlands | | U.S. dollar |
Samsung Electronics Co. Ltd. (Preference) | | South Korea | | Korean won |
Sanofi | | France | | Euro |
Swedish Match AB | | Sweden | | Swedish krona |
| (2) | | Percentages for the various classifications relate to total net assets. |
Company names are as reported by a data service provider and in some cases are translations; a company’s legal name may be different.
| | |
| Abbreviations |
Preference | | A special type of equity investment that shares in the earnings of the company and may have a dividend preference. Preference shares may also have liquidation preference. |
| | | | | | | | | | |
| PORTFOLIO DIVERSIFICATION |
Dollar values in thousands | |
| | | Value | | Percentage
of Total
Investments |
Communication Services | | | $ | 60,913 | | | | | 14.8 | % |
Consumer Discretionary | | | | 38,791 | | | | | 9.4 | |
Consumer Staples | | | | 15,584 | | | | | 3.8 | |
Energy | | | | 8,313 | | | | | 2.0 | |
Financials | | | | 97,047 | | | | | 23.6 | |
Health Care | | | | 34,852 | | | | | 8.4 | |
Industrials | | | | 44,341 | | | | | 10.8 | |
Information Technology | | | | 65,286 | | | | | 15.9 | |
Materials | | | | 31,335 | | | | | 7.6 | |
Short-Term Investments | | | | 15,058 | | | | | 3.7 | |
| | | | | | | | | | |
Total investments | | | $ | 411,520 | | | | | 100.0 | % |
| | | | | | | | | | |
| | | | | | | | | | |
| TRADING CURRENCIES |
Dollar values in thousands | |
| | | Value | | Percentage
of Total
Investments |
Euro | | | $ | 23,563 | | | | | 5.7 | % |
Korean won | | | | 11,308 | | | | | 2.8 | |
Swedish krona | | | | 5,892 | | | | | 1.4 | |
U.S. dollar | | | | 370,757 | | | | | 90.1 | |
| | | | | | | | | | |
Total investments | | | $ | 411,520 | | | | | 100.0 | % |
| | | | | | | | | | |
| | | | | | | |
| TOP TEN HOLDINGS |
Company Name | | Country | | Percentage
of Total
Net Assets |
Alphabet, Inc. | | United States | | | | 5.0 | % |
Apple, Inc. | | United States | | | | 4.8 | |
Berkshire Hathaway, Inc. | | United States | | | | 4.5 | |
NXP Semiconductors NV | | Netherlands | | | | 3.9 | |
Citigroup, Inc. | | United States | | | | 3.9 | |
Comcast Corp. | | United States | | | | 3.7 | |
Air Lease Corp. | | United States | | | | 3.7 | |
Booking Holdings, Inc. | | United States | | | | 3.6 | |
Synchrony Financial | | United States | | | | 3.2 | |
AutoNation, Inc. | | United States | | | | 3.2 | |
| | | | | | | |
Total | | | | | | 39.5 | % |
| | | | | | | |
For the purpose of determining the Fund’s top ten holdings, securities of the same issuer are aggregated to determine the weight in the Fund.
The accompanying notes are an integral part of the financial statements.
| | |
| Artisan Partners Funds | | 71 |
ARTISAN PARTNERS FUNDS
Statements of Assets and Liabilities – September 30, 2019
Dollar values in thousands
| | | | | | | | | | | | | | | | | | | | |
| | | DEVELOPING
WORLD | | GLOBAL
DISCOVERY | | GLOBAL EQUITY | | GLOBAL
OPPORTUNITIES |
| ASSETS: | | | | | | | | | | | | | | | | | | | | |
Investments in securities, unaffiliated, at value | | | $ | 2,504,113 | | | | $ | 99,923 | | | | $ | 247,496 | | | | $ | 3,180,198 | |
Short-term investments (investment companies), at value | | | | 124,088 | | | | | 7,091 | | | | | 6,280 | | | | | 205,917 | |
Total investments | | | | 2,628,201 | | | | | 107,014 | | | | | 253,776 | | | | | 3,386,115 | |
Cash | | | | – | | | | | – | | | | | – | | | | | – | |
Foreign currency | | | | 21,470 | | | | | 3 | | | | | 343 | | | | | – | (1) |
Receivable from investments sold | | | | 33,881 | | | | | 899 | | | | | 3,813 | | | | | 18,481 | |
Receivable from fund shares sold | | | | 4,701 | | | | | 179 | | | | | 77 | | | | | 2,470 | |
Dividends and interest receivable | | | | 2,385 | | | | | 36 | | | | | 360 | | | | | 1,639 | |
Other assets | | | | 84 | | | | | 5 | | | | | 15 | | | | | 134 | |
Total assets | | | | 2,690,722 | | | | | 108,136 | | | | | 258,384 | | | | | 3,408,839 | |
| LIABILITIES: | | | | | | | | | | | | | | | | | | | | |
Payable for investments purchased | | | | 26,662 | | | | | 690 | | | | | 2,279 | | | | | 11,478 | |
Payable for fund shares redeemed | | | | 1,174 | | | | | 2 | | | | | 905 | | | | | 1,258 | |
Payable for management fees | | | | 377 | | | | | 14 | | | | | 35 | | | | | 411 | |
Payable for operating expenses | | | | 656 | | | | | 102 | | | | | 196 | | | | | 615 | |
Payable for deferred director’s compensation | | | | 78 | | | | | 5 | | | | | 14 | | | | | 126 | |
Total liabilities | | | | 28,947 | | | | | 813 | | | | | 3,429 | | | | | 13,888 | |
Total net assets | | | $ | 2,661,775 | | | | $ | 107,323 | | | | $ | 254,955 | | | | $ | 3,394,951 | |
| NET ASSETS CONSIST OF: | | | | | | | | | | | | | | | | | | | | |
Fund shares issued and outstanding | | | $ | 2,203,255 | | | | $ | 93,181 | | | | $ | 187,561 | | | | $ | 2,447,849 | |
Total distributable earnings | | | | 458,520 | | | | | 14,142 | | | | | 67,394 | | | | | 947,102 | |
Total net assets | | | $ | 2,661,775 | | | | $ | 107,323 | | | | $ | 254,955 | | | | $ | 3,394,951 | |
| SUPPLEMENTARY INFORMATION: | | | | | | | | | | | | | | | | | | | | |
Net assets | | | | | | | | | | | | | | | | | | | | |
Investor Shares | | | $ | 255,336 | | | | $ | 107,323 | | | | $ | 118,936 | | | | $ | 1,052,916 | |
Advisor Shares | | | $ | 1,585,519 | | | | | | | | | | | | | | $ | 615,920 | |
Institutional Shares | | | $ | 820,920 | | | | | | | | | $ | 136,019 | | | | $ | 1,726,115 | |
Shares outstanding (Indefinite number of shares authorized, $0.01 par value) | | | | | | | | | | | | | | | | | | | | |
Investor Shares | | | | 18,999,323 | | | | | 8,017,482 | | | | | 5,774,121 | | | | | 38,911,425 | |
Advisor Shares | | | | 117,399,938 | | | | | | | | | | | | | | | 22,639,844 | |
Institutional Shares | | | | 60,593,398 | | | | | | | | | | 6,568,937 | | | | | 62,837,837 | |
Net asset value per share | | | | | | | | | | | | | | | | | | | | |
Investor Shares | | | $ | 13.44 | | | | $ | 13.39 | | | | $ | 20.60 | | | | $ | 27.06 | |
Advisor Shares | | | $ | 13.51 | | | | | | | | | | | | | | $ | 27.21 | |
Institutional Shares | | | $ | 13.55 | | | | | | | | | $ | 20.71 | | | | $ | 27.47 | |
Cost of total investments | | | $ | 2,082,967 | | | | $ | 91,429 | | | | $ | 196,968 | | | | $ | 2,650,068 | |
Cost of foreign currency held | | | $ | 22,506 | | | | $ | 3 | | | | $ | 394 | | | | $ | – | (1) |
| | | | | |
(1) Amount rounds to less than $1 | | | | | | | | | | | | | | | | | | | | |
The accompanying notes are an integral part of the financial statements.
| | |
| 72 | | Artisan Partners Funds |
ARTISAN PARTNERS FUNDS
Statements of Assets and Liabilities – September 30, 2019 (Continued)
Dollar values in thousands
| | | | | | | | | | | | | | | | | | | | |
| | | GLOBAL VALUE | | HIGH INCOME | | INTERNATIONAL | | INTERNATIONAL
SMALL-MID |
| ASSETS: | | | | | | | | | | | | | | | | | | | | |
Investments in securities, unaffiliated, at value | | | $ | 2,874,047 | | | | $ | 3,512,985 | | | | $ | 10,218,050 | | | | $ | 1,180,549 | |
Short-term investments (investment companies), at value | | | | 184,017 | | | | | 213,182 | | | | | 321,135 | | | | | 40,161 | |
Total investments | | | | 3,058,064 | | | | | 3,726,167 | | | | | 10,539,185 | | | | | 1,220,710 | |
Cash | | | | – | | | | | 6,259 | | | | | – | | | | | – | |
Due from broker | | | | – | | �� | | | 2,812 | | | | | – | | | | | – | |
Foreign currency | | | | 930 | | | | | – | | | | | 15,429 | | | | | 173 | |
Unrealized appreciation on foreign currency forward contracts | | | | 3,286 | | | | | – | | | | | – | | | | | – | |
Receivable from investments sold | | | | 12,175 | | | | | 112,588 | | | | | 33,864 | | | | | 1,540 | |
Receivable from fund shares sold | | | | 1,167 | | | | | 5,963 | | | | | 13,013 | | | | | 1,892 | |
Receivable for variation margin on futures contracts | | | | – | | | | | 124 | | | | | – | | | | | – | |
Dividends and interest receivable | | | | 14,264 | | | | | 47,768 | | | | | 31,388 | | | | | 2,574 | |
Other assets | | | | 153 | | | | | 128 | | | | | 747 | | | | | 36 | |
Total assets | | | | 3,090,039 | | | | | 3,901,809 | | | | | 10,633,626 | | | | | 1,226,925 | |
| LIABILITIES: | | | | | | | | | | | | | | | | | | | | |
Unrealized depreciation on unfunded loan commitments | | | | – | | | | | 10 | | | | | – | | | | | – | |
Unrealized depreciation on foreign currency forward contracts | | | | 652 | | | | | – | | | | | – | | | | | – | |
Payable for investments purchased | | | | 11,251 | | | | | 99,594 | | | | | 60,434 | | | | | 1,752 | |
Payable for fund shares redeemed | | | | 1,150 | | | | | 9,015 | | | | | 9,277 | | | | | 3,609 | |
Dividends payable | | | | – | | | | | 3,591 | | | | | – | | | | | – | |
Payable for management fees | | | | 413 | | | | | 360 | | | | | 1,346 | | | | | 176 | |
Payable for operating expenses | | | | 553 | | | | | 809 | | | | | 2,737 | | | | | 345 | |
Payable for deferred director’s compensation | | | | 142 | | | | | 118 | | | | | 724 | | | | | 35 | |
Total liabilities | | | | 14,161 | | | | | 113,497 | | | | | 74,518 | | | | | 5,917 | |
Total net assets | | | $ | 3,075,878 | | | | $ | 3,788,312 | | | | $ | 10,559,108 | | | | $ | 1,221,008 | |
| NET ASSETS CONSIST OF: | | | | | | | | | | | | | | | | | | | | |
Fund shares issued and outstanding | | | $ | 2,684,587 | | | | $ | 3,840,710 | | | | $ | 7,492,325 | | | | $ | 1,138,197 | |
Total distributable earnings (loss) | | | | 391,291 | | | | | (52,398 | ) | | | | 3,066,783 | | | | | 82,811 | |
Total net assets | | | $ | 3,075,878 | | | | $ | 3,788,312 | | | | $ | 10,559,108 | | | | $ | 1,221,008 | |
| SUPPLEMENTARY INFORMATION: | | | | | | | | | | | | | | | | | | | | |
Net assets | | | | | | | | | | | | | | | | | | | | |
Investor Shares | | | $ | 506,067 | | | | $ | 873,574 | | | | $ | 3,903,758 | | | | $ | 177,807 | |
Advisor Shares | | | $ | 599,418 | | | | $ | 2,194,146 | | | | $ | 2,141,985 | | | | $ | 434,784 | |
Institutional Shares | | | $ | 1,970,393 | | | | $ | 720,592 | | | | $ | 4,513,365 | | | | $ | 608,417 | |
Shares outstanding (Indefinite number of shares authorized, $0.01 par value) | | | | | | | | | | | | | | | | | | | | |
Investor Shares | | | | 29,564,758 | | | | | 90,404,146 | | | | | 120,050,067 | | | | | 13,068,670 | |
Advisor Shares | | | | 35,069,110 | | | | | 227,101,890 | | | | | 65,988,856 | | | | | 31,928,356 | |
Institutional Shares | | | | 114,928,979 | | | | | 74,596,832 | | | | | 137,932,971 | | | | | 44,213,731 | |
Net asset value per share | | | | | | | | | | | | | | | | | | | | |
Investor Shares | | | $ | 17.12 | | | | $ | 9.66 | | | | $ | 32.52 | | | | $ | 13.61 | |
Advisor Shares | | | $ | 17.09 | | | | $ | 9.66 | | | | $ | 32.46 | | | | $ | 13.62 | |
Institutional Shares | | | $ | 17.14 | | | | $ | 9.66 | | | | $ | 32.72 | | | | $ | 13.76 | |
Cost of total investments | | | $ | 2,595,378 | | | | $ | 3,716,738 | | | | $ | 7,865,856 | | | | $ | 1,123,705 | |
Cost of foreign currency held | | | $ | 929 | | | | $ | – | | | | $ | 17,309 | | | | $ | 173 | |
The accompanying notes are an integral part of the financial statements.
| | |
| Artisan Partners Funds | | 73 |
ARTISAN PARTNERS FUNDS
Statements of Assets and Liabilities – September 30, 2019 (Continued)
Dollar values in thousands
| | | | | | | | | | | | | | | | | | | | |
| | | INTERNATIONAL
VALUE | | MID CAP | | MID CAP
VALUE | | SMALL CAP |
| ASSETS: | | | | | | | | | | | | | | | | | | | | |
Investments in securities, unaffiliated, at value | | | $ | 12,145,520 | | | | $ | 4,894,682 | | | | $ | 2,170,655 | | | | $ | 1,767,030 | |
Short-term investments (investment companies), at value | | | | 1,991,731 | | | | | 165,298 | | | | | 96,996 | | | | | 74,434 | |
Total investments | | | | 14,137,251 | | | | | 5,059,980 | | | | | 2,267,651 | | | | | 1,841,464 | |
Cash | | | | – | | | | | – | | | | | – | | | | | – | |
Foreign currency | | | | 5,482 | | | | | – | (1) | | | | – | | | | | – | |
Unrealized appreciation on foreign currency forward contracts | | | | 20,882 | | | | | – | | | | | – | | | | | – | |
Receivable from investments sold | | | | 38,856 | | | | | 19,547 | | | | | 3,748 | | | | | – | |
Receivable from fund shares sold | | | | 15,461 | | | | | 4,585 | | | | | 1,502 | | | | | 2,480 | |
Dividends and interest receivable | | | | 85,018 | | | | | 1,071 | | | | | 3,049 | | | | | 234 | |
Other assets | | | | 711 | | | | | 362 | | | | | 232 | | | | | 80 | |
Total assets | | | | 14,303,661 | | | | | 5,085,545 | | | | | 2,276,182 | | | | | 1,844,258 | |
| LIABILITIES: | | | | | | | | | | | | | | | | | | | | |
Unrealized depreciation on foreign currency forward contracts | | | | 2,606 | | | | | – | | | | | – | | | | | – | |
Payable for investments purchased | | | | 19,422 | | | | | 19,888 | | | | | – | | | | | 4,701 | |
Payable for fund shares redeemed | | | | 8,383 | | | | | 5,096 | | | | | 5,290 | | | | | 1,803 | |
Payable for management fees | | | | 1,813 | | | | | 650 | | | | | 295 | | | | | 242 | |
Payable for operating expenses | | | | 2,649 | | | | | 1,088 | | | | | 791 | | | | | 469 | |
Payable for deferred director’s compensation | | | | 678 | | | | | 351 | | | | | 229 | | | | | 75 | |
Total liabilities | | | | 35,551 | | | | | 27,073 | | | | | 6,605 | | | | | 7,290 | |
Total net assets | | | $ | 14,268,110 | | | | $ | 5,058,472 | | | | $ | 2,269,577 | | | | $ | 1,836,968 | |
| NET ASSETS CONSIST OF: | | | | | | | | | | | | | | | | | | | | |
Fund shares issued and outstanding | | | $ | 12,163,992 | | | | $ | 3,189,227 | | | | $ | 1,393,877 | | | | $ | 1,173,176 | |
Total distributable earnings | | | | 2,104,118 | | | | | 1,869,245 | | | | | 875,700 | | | | | 663,792 | |
Total net assets | | | $ | 14,268,110 | | | | $ | 5,058,472 | | | | $ | 2,269,577 | | | | $ | 1,836,968 | |
| SUPPLEMENTARY INFORMATION: | | | | | | | | | | | | | | | | | | | | |
Net assets | | | | | | | | | | | | | | | | | | | | |
Investor Shares | | | $ | 2,761,826 | | | | $ | 1,599,647 | | | | $ | 842,896 | | | | $ | 611,745 | |
Advisor Shares | | | $ | 4,336,510 | | | | $ | 429,052 | | | | $ | 630,296 | | | | $ | 589,147 | |
Institutional Shares | | | $ | 7,169,774 | | | | $ | 3,029,773 | | | | $ | 796,385 | | | | $ | 636,076 | |
Shares outstanding (Indefinite number of shares authorized, $0.01 par value) | | | | | | | | | | | | | | | | | | | | |
Investor Shares | | | | 79,202,395 | | | | | 43,042,848 | | | | | 42,545,379 | | | | | 18,443,594 | |
Advisor Shares | | | | 124,563,131 | | | | | 11,435,798 | | | | | 31,880,022 | | | | | 17,692,056 | |
Institutional Shares | | | | 205,088,976 | | | | | 72,932,915 | | | | | 40,227,971 | | | | | 18,800,405 | |
Net asset value per share | | | | | | | | | | | | | | | | | | | | |
Investor Shares | | | $ | 34.87 | | | | $ | 37.16 | | | | $ | 19.81 | | | | $ | 33.17 | |
Advisor Shares | | | $ | 34.81 | | | | $ | 37.52 | | | | $ | 19.77 | | | | $ | 33.30 | |
Institutional Shares | | | $ | 34.96 | | | | $ | 41.54 | | | | $ | 19.80 | | | | $ | 33.83 | |
Cost of total investments | | | $ | 12,269,885 | | | | $ | 3,602,839 | | | | $ | 1,587,927 | | | | $ | 1,302,223 | |
Cost of foreign currency held | | | $ | 5,450 | | | | $ | – | (1) | | | $ | – | | | | $ | – | |
| | | | |
(1) Amount rounds to less than $1 | | | | | | | | | | | | | | | | | | | | |
The accompanying notes are an integral part of the financial statements.
| | |
| 74 | | Artisan Partners Funds |
ARTISAN PARTNERS FUNDS
Statements of Assets and Liabilities – September 30, 2019 (Continued)
Dollar values in thousands
| | | | | | | | | | | | | | | |
| | | SUSTAINABLE
EMERGING
MARKETS | | THEMATIC | | VALUE |
| ASSETS: | | | | | | | | | | | | | | | |
Investments in securities, unaffiliated, at value | | | $ | 51,181 | | | | $ | 603,126 | | | | $ | 396,462 | |
Short-term investments (investment companies), at value | | | | 360 | | | | | 86,090 | | | | | 15,058 | |
Total investments | | | | 51,541 | | | | | 689,216 | | | | | 411,520 | |
Cash | | | | – | (1) | | | | – | | | | | – | |
Foreign currency | | | | 112 | | | | | – | | | | | – | (1) |
Unrealized appreciation on foreign currency forward contracts | | | | – | | | | | 1,063 | | | | | – | |
Receivable from investments sold | | | | 818 | | | | | 31,913 | | | | | 201 | |
Receivable from fund shares sold | | | | 41 | | | | | 2,449 | | | | | 648 | |
Receivable from the Adviser | | | | 5 | | | | | – | | | | | – | |
Dividends and interest receivable | | | | 63 | | | | | 306 | | | | | 557 | |
Other assets | | | | 9 | | | | | 9 | | | | | 37 | |
Total assets | | | | 52,589 | | | | | 724,956 | | | | | 412,963 | |
| LIABILITIES: | | | | | | | | | | | | | | | |
Unrealized depreciation on foreign currency forward contracts | | | | – | | | | | 515 | | | | | – | |
Payable for investments purchased | | | | 188 | | | | | 32,517 | | | | | 4,004 | |
Payable for fund shares redeemed | | | | 11 | | | | | 143 | | | | | 367 | |
Payable for management fees | | | | 7 | | | | | 94 | | | | | 48 | |
Payable for operating expenses | | | | 189 | | | | | 200 | | | | | 211 | |
Payable for deferred director’s compensation | | | | 9 | | | | | 8 | | | | | 35 | |
Payable for foreign taxes | | | | 153 | (2) | | | | – | | | | | – | |
Total liabilities | | | | 557 | | | | | 33,477 | | | | | 4,665 | |
Total net assets | | | $ | 52,032 | | | | $ | 691,479 | | | | $ | 408,298 | |
| NET ASSETS CONSIST OF: | | | | | | | | | | | | | | | |
Fund shares issued and outstanding | | | $ | 180,866 | | | | $ | 625,765 | | | | $ | 292,364 | |
Total distributable earnings (loss) | | | | (128,834 | ) | | | | 65,714 | | | | | 115,934 | |
Total net assets | | | $ | 52,032 | | | | $ | 691,479 | | | | $ | 408,298 | |
| SUPPLEMENTARY INFORMATION: | | | | | | | | | | | | | | | |
Net assets | | | | | | | | | | | | | | | |
Investor Shares | | | $ | 45,717 | | | | $ | 170,186 | | | | $ | 131,134 | |
Advisor Shares | | | | | | | | $ | 521,293 | | | | $ | 108,557 | |
Institutional Shares | | | $ | 6,315 | | | | | | | | | $ | 168,607 | |
Shares outstanding (Indefinite number of shares authorized, $0.01 par value) | | | | | | | | | | | | | | | |
Investor Shares | | | | 3,003,951 | | | | | 10,885,311 | | | | | 10,179,818 | |
Advisor Shares | | | | | | | | | 33,295,193 | | | | | 8,461,153 | |
Institutional Shares | | | | 414,146 | | | | | | | | | | 13,111,557 | |
Net asset value per share | | | | | | | | | | | | | | | |
Investor Shares | | | $ | 15.22 | | | | $ | 15.63 | | | | $ | 12.88 | |
Advisor Shares | | | | | | | | $ | 15.66 | | | | $ | 12.83 | |
Institutional Shares | | | $ | 15.25 | | | | | | | | | $ | 12.86 | |
Cost of total investments | | | $ | 45,572 | | | | $ | 643,804 | | | | $ | 304,174 | |
Cost of foreign currency held | | | $ | 119 | | | | $ | – | | | | $ | – | (1) |
| | | | |
(1) Amount rounds to less than $1 | | | | | | | | | | | | | | | |
(2) Including foreign taxes on unrealized gains | | | $ | 127 | | | | | – | | | | | – | |
The accompanying notes are an integral part of the financial statements.
| | |
| Artisan Partners Funds | | 75 |
ARTISAN PARTNERS FUNDS
Statements of Operations — For the Year Ended September 30, 2019
Dollar values in thousands
| | | | | | | | | | | | | | | | | | | | |
| | | DEVELOPING
WORLD | | GLOBAL
DISCOVERY | | GLOBAL EQUITY | | GLOBAL
OPPORTUNITIES |
| INVESTMENT INCOME: | | | | | | | | | | | | | | | | | | | | |
Dividends, from unaffiliated issuers(2) | | | $ | 21,093 | | | | $ | 665 | | | | $ | 3,241 | | | | $ | 35,797 | |
Interest | | | | – | | | | | – | (1) | | | | – | (1) | | | | 4 | |
Total investment income | | | | 21,093 | | | | | 665 | | | | | 3,241 | | | | | 35,801 | |
| EXPENSES: | | | | | | | | | | | | | | | | | | | | |
Management fees | | | | 23,713 | | | | | 834 | | | | | 2,550 | | | | | 27,982 | |
Transfer agent fees | | | | | | | | | | | | | | | | | | | | |
Investor Shares | | | | 774 | | | | | 147 | | | | | 279 | | | | | 2,479 | |
Advisor Shares | | | | 1,107 | | | | | | | | | | | | | | | 479 | |
Institutional Shares | | | | 38 | | | | | | | | | | 33 | | | | | 39 | |
Custodian fees | | | | 424 | | | | | 31 | | | | | 75 | | | | | 169 | |
Accounting fees | | | | 77 | | | | | 79 | | | | | 77 | | | | | 76 | |
Professional fees | | | | 194 | | | | | 50 | | | | | 84 | | | | | 158 | |
Registration fees | | | | | | | | | | | | | | | | | | | | |
Investor Shares | | | | 38 | | | | | 32 | | | | | 26 | | | | | 48 | |
Advisor Shares | | | | 105 | | | | | | | | | | | | | | | 40 | |
Institutional Shares | | | | 23 | | | | | | | | | | 43 | | | | | 46 | |
Director’s fees | | | | 86 | | | | | 6 | | | | | 10 | | | | | 123 | |
Other operating expenses | | | | 315 | | | | | 19 | | | | | 39 | | | | | 221 | |
Total operating expenses | | | | 26,894 | | | | | 1,198 | | | | | 3,216 | | | | | 31,860 | |
Net investment income (loss) | | | | (5,801 | ) | | | | (533 | ) | | | | 25 | | | | | 3,941 | |
| NET REALIZED AND UNREALIZED GAINS (LOSSES) ON INVESTMENTS: | | | | | | | | | | | |
Net realized gain (loss) on: | | | | | | | | | | | | | | | | | | | | |
Investments, from unaffiliated issuers | | | | 17,101 | | | | | (1,024 | ) | | | | 13,230 | | | | | 222,938 | |
Foreign currency related transactions | | | | 220 | | | | | 1 | | | | | (14 | ) | | | | (30 | ) |
Total realized gain (loss) | | | | 17,321 | | | | | (1,023 | ) | | | | 13,216 | | | | | 222,908 | |
Net increase (decrease) in unrealized appreciation or depreciation on: | | | | | | | | | | | | | | | | | | | | |
Investments, from unaffiliated issuers | | | | 360,537 | | | | | 9,229 | | | | | (4,529 | ) | | | | (90,528 | ) |
Foreign currency related transactions | | | | (995 | ) | | | | – | (1) | | | | (63 | ) | | | | (23 | ) |
Total increase (decrease) in unrealized appreciation or depreciation | | | | 359,542 | | | | | 9,229 | | | | | (4,592 | ) | | | | (90,551 | ) |
Net gain on investments and foreign currency related transactions | | | | 376,863 | | | | | 8,206 | | | | | 8,624 | | | | | 132,357 | |
Net increase in net assets resulting from operations | | | $ | 371,062 | | | | $ | 7,673 | | | | $ | 8,649 | | | | $ | 136,298 | |
| | | | |
(1) Amount rounds to less than $1 | | | | | | | | | | | | | | | | | | | | |
(2) Net of foreign taxes withheld on dividends, unaffiliated issuers | | | $ | 804 | | | | $ | 27 | | | | $ | 224 | | | | $ | 741 | |
The accompanying notes are an integral part of the financial statements.
| | |
| 76 | | Artisan Partners Funds |
ARTISAN PARTNERS FUNDS
Statements of Operations — For the Year Ended September 30, 2019 (Continued)
Dollar values in thousands
| | | | | | | | | | | | | | | | | | | | |
| | | GLOBAL VALUE | | HIGH INCOME | | INTERNATIONAL | | INTERNATIONAL
SMALL-MID |
| INVESTMENT INCOME: | | | | | | | | | | | | | | | | | | | | |
Dividends, from unaffiliated issuers (1) | | | $ | 81,683 | | | | $ | 4,355 | | | | $ | 233,084 | | | | $ | 9,626 | |
Interest | | | | – | | | | | 245,286 | | | | | – | | | | | – | |
Total investment income | | | | 81,683 | | | | | 249,641 | | | | | 233,084 | | | | | 9,626 | |
| EXPENSES: | | | | | | | | | | | | | | | | | | | | |
Management fees | | | | 31,725 | | | | | 23,534 | | | | | 101,697 | | | | | 7,763 | |
Transfer agent fees | | | | | | | | | | | | | | | | | | | | |
Investor Shares | | | | 1,366 | | | | | 2,602 | | | | | 9,288 | | | | | 418 | |
Advisor Shares | | | | 570 | | | | | 1,783 | | | | | 1,643 | | | | | 172 | |
Institutional Shares | | | | 40 | | | | | 39 | | | | | 53 | | | | | 35 | |
Custodian fees | | | | 195 | | | | | 60 | | | | | 1,188 | | | | | 191 | |
Accounting fees | | | | 76 | | | | | 161 | | | | | 76 | | | | | 76 | |
Professional fees | | | | 166 | | | | | 175 | | | | | 512 | | | | | 193 | |
Registration fees | | | | | | | | | | | | | | | | | | | | |
Investor Shares | | | | 29 | | | | | 80 | | | | | 127 | | | | | 37 | |
Advisor Shares | | | | 48 | | | | | 92 | | | | | 53 | | | | | 63 | |
Institutional Shares | | | | 46 | | | | | 43 | | | | | 140 | | | | | 35 | |
Director’s fees | | | | 129 | | | | | 127 | | | | | 439 | | | | | 24 | |
Other operating expenses | | | | 211 | | | | | 387 | | | | | 634 | | | | | 90 | |
Total operating expenses | | | | 34,601 | | | | | 29,083 | | | | | 115,850 | | | | | 9,097 | |
Net investment income | | | | 47,082 | | | | | 220,558 | | | | | 117,234 | | | | | 529 | |
| NET REALIZED AND UNREALIZED GAINS (LOSSES) ON INVESTMENTS: | | | | | | | | | | | |
Net realized gain (loss) on: | | | | | | | | | | | | | | | | | | | | |
Investments, from unaffiliated issuers | | | | (765 | ) | | | | (48,346 | ) | | | | 450,782 | | | | | 21,077 | |
Investments, from affiliated issuers | | | | – | | | | | – | | | | | – | | | | | (1,952 | ) |
Foreign currency forward contracts | | | | (1,519 | ) | | | | – | | | | | – | | | | | – | |
Foreign currency related transactions | | | | (180 | ) | | | | – | | | | | (753 | ) | | | | (266 | ) |
Futures contracts | | | | – | | | | | (15,310 | ) | | | | – | | | | | – | |
Total realized gain (loss) | | | | (2,464 | ) | | | | (63,656 | ) | | | | 450,029 | | | | | 18,859 | |
Net increase (decrease) in unrealized appreciation or depreciation on: | | | | | | | | | | | | | | | | | | | | |
Investments, from unaffiliated issuers | | | | (91,871 | ) | | | | 6,849 | | | | | (27,454 | ) | | | | 30,363 | |
Investments, from affiliated issuers | | | | – | | | | | – | | | | | – | | | | | (1,745 | ) |
Foreign currency forward contracts | | | | 2,772 | | | | | – | | | | | – | | | | | – | |
Foreign currency related transactions | | | | (108 | ) | | | | – | | | | | (1,749 | ) | | | | (46 | ) |
Futures contracts | | | | – | | | | | 1,580 | | | | | – | | | | | – | |
Unfunded loan commitments | | | | – | | | | | (33 | ) | | | | – | | | | | – | |
Total increase (decrease) in unrealized appreciation or depreciation | | | | (89,207 | ) | | | | 8,396 | | | | | (29,203 | ) | | | | 28,572 | |
Net gain (loss) on investments and foreign currency related transactions | | | | (91,671 | ) | | | | (55,260 | ) | | | | 420,826 | | | | | 47,431 | |
Net increase (decrease) in net assets resulting from operations | | | $ | (44,589 | ) | | | $ | 165,298 | | | | $ | 538,060 | | | | $ | 47,960 | |
| | | | |
(1) Net of foreign taxes withheld on dividends, unaffiliated issuers | | | $ | 4,164 | | | | $ | – | | | | $ | 21,590 | | | | $ | 792 | |
The accompanying notes are an integral part of the financial statements.
| | |
| Artisan Partners Funds | | 77 |
ARTISAN PARTNERS FUNDS
Statements of Operations — For the Year Ended September 30, 2019 (Continued)
Dollar values in thousands
| | | | | | | | | | | | | | | | | | | | |
| | | INTERNATIONAL
VALUE | | MID CAP | | MID CAP
VALUE | | SMALL CAP |
| INVESTMENT INCOME: | | | | | | | | | | | | | | | | | | | | |
Dividends, from unaffiliated issuers (2) | | | $ | 414,489 | | | | $ | 28,579 | | | | $ | 44,075 | | | | $ | 5,359 | |
Interest | | | | – | | | | | – | | | | | – | | | | | – | (1) |
Total investment income | | | | 414,489 | | | | | 28,579 | | | | | 44,075 | | | | | 5,359 | |
| EXPENSES: | | | | | | | | | | | | | | | | | | | | |
Management fees | | | | 129,146 | | | | | 48,440 | | | | | 24,374 | | | | | 16,547 | |
Transfer agent fees | | | | | | | | | | | | | | | | | | | | |
Investor Shares | | | | 6,810 | | | | | 3,854 | | | | | 2,162 | | | | | 1,184 | |
Advisor Shares | | | | 3,525 | | | | | 433 | | | | | 527 | | | | | 465 | |
Institutional Shares | | | | 49 | | | | | 56 | | | | | 39 | | | | | 37 | |
Custodian fees | | | | 1,185 | | | | | 105 | | | | | 56 | | | | | 35 | |
Accounting fees | | | | 76 | | | | | 76 | | | | | 51 | | | | | 51 | |
Professional fees | | | | 523 | | | | | 230 | | | | | 157 | | | | | 96 | |
Registration fees | | | | | | | | | | | | | | | | | | | | |
Investor Shares | | | | 202 | | | | | 56 | | | | | 41 | | | | | 26 | |
Advisor Shares | | | | 144 | | | | | 38 | | | | | 36 | | | | | 43 | |
Institutional Shares | | | | 112 | | | | | 77 | | | | | 45 | | | | | 36 | |
Director’s fees | | | | 548 | | | | | 205 | | | | | 104 | | | | | 66 | |
Other operating expenses | | | | 1,056 | | | | | 292 | | | | | 358 | | | | | 131 | |
Total operating expenses | | | | 143,376 | | | | | 53,862 | | | | | 27,950 | | | | | 18,717 | |
Net investment income (loss) | | | | 271,113 | | | | | (25,283 | ) | | | | 16,125 | | | | | (13,358 | ) |
| NET REALIZED AND UNREALIZED GAINS (LOSSES) ON INVESTMENTS: | | | | | | | | | | | |
Net realized gain (loss) on: | | | | | | | | | | | | | | | | | | | | |
Investments, from unaffiliated issuers (3) | | | | 259,418 | | | | | 537,218 | | | | | 287,026 | | | | | 146,505 | |
Investments, from affiliated issuers | | | | 29,177 | | | | | – | | | | | – | | | | | – | |
Foreign currency forward contracts | | | | (11,337 | ) | | | | – | | | | | – | | | | | – | |
Foreign currency related transactions | | | | (1,525 | ) | | | | (9 | ) | | | | – | | | | | – | |
Total realized gain | | | | 275,733 | | | | | 537,209 | | | | | 287,026 | | | | | 146,505 | |
Net increase (decrease) in unrealized appreciation or depreciation on: | | | | | | | | | | | | | | | | | | | | |
Investments, from unaffiliated issuers | | | | (665,619 | ) | | | | (373,052 | ) | | | | (433,551 | ) | | | | (104,719 | ) |
Investments, from affiliated issuers | | | | 97,201 | | | | | – | | | | | – | | | | | – | |
Foreign currency forward contracts | | | | 17,654 | | | | | – | | | | | – | | | | | – | |
Foreign currency related transactions | | | | (891 | ) | | | | (4 | ) | | | | 1 | | | | | – | |
Total decrease in unrealized appreciation or depreciation | | | | (551,655 | ) | | | | (373,056 | ) | | | | (433,550 | ) | | | | (104,719 | ) |
Net gain (loss) on investments and foreign currency related transactions | | | | (275,922 | ) | | | | 164,153 | | | | | (146,524 | ) | | | | 41,786 | |
Net increase (decrease) in net assets resulting from operations | | | $ | (4,809 | ) | | | $ | 138,870 | | | | $ | (130,399 | ) | | | $ | 28,428 | |
| | | | |
(1) Amount rounds to less than $1 | | | | | | | | | | | | | | | | | | | | |
(2) Net of foreign taxes withheld on dividends, unaffiliated issuers | | | $ | 30,358 | | | | $ | – | | | | $ | 434 | | | | $ | – | |
(3) Net of foreign taxes on realized gains | | | | 18 | | | | | – | | | | | – | | | | | – | |
The accompanying notes are an integral part of the financial statements.
| | |
| 78 | | Artisan Partners Funds |
ARTISAN PARTNERS FUNDS
Statements of Operations — For the Year Ended September 30, 2019 (Continued)
Dollar values in thousands
| | | | | | | | | | | | | | | |
| | | SUSTAINABLE
EMERGING
MARKETS | | THEMATIC | | VALUE |
| INVESTMENT INCOME: | | | | | | | | | | | | | | | |
Dividends, from unaffiliated issuers (2) | | | $ | 1,383 | | | | $ | 4,873 | | | | $ | 8,087 | |
Interest | | | | – | (1) | | | | – | | | | | – | (1) |
Total investment income | | | | 1,383 | | | | | 4,873 | | | | | 8,087 | |
| EXPENSES: | | | | | | | | | | | | | | | |
Management fees | | | | 544 | | | | | 3,916 | | | | | 3,073 | |
Transfer agent fees | | | | | | | | | | | | | | | |
Investor Shares | | | | 151 | | | | | 400 | | | | | 363 | |
Advisor Shares | | | | | | | | | 231 | | | | | 121 | |
Institutional Shares | | | | 34 | | | | | | | | | | 36 | |
Custodian fees | | | | 84 | | | | | 38 | | | | | 25 | |
Accounting fees | | | | 77 | | | | | 76 | | | | | 76 | |
Professional fees | | | | 113 | | | | | 91 | | | | | 63 | |
Registration fees | | | | | | | | | | | | | | | |
Investor Shares | | | | 22 | | | | | 45 | | | | | 22 | |
Advisor Shares | | | | | | | | | 32 | | | | | 20 | |
Institutional Shares | | | | 19 | | | | | | | | | | 39 | |
Director’s fees | | | | 6 | | | | | 13 | | | | | 17 | |
Other operating expenses | | | | 32 | | | | | 47 | | | | | 74 | |
Total operating expenses | | | | 1,082 | | | | | 4,889 | | | | | 3,929 | |
Less amounts waived or paid by the Adviser | | | | (357 | ) | | | | – | | | | | (50 | ) |
Net expenses | | | | 725 | | | | | 4,889 | | | | | 3,879 | |
Net investment income (loss) | | | | 658 | | | | | (16 | ) | | | | 4,208 | |
| NET REALIZED AND UNREALIZED GAINS (LOSSES) ON INVESTMENTS: | |
Net realized gain (loss) on: | | | | | | | | | | | | | | | |
Investments, from unaffiliated issuers (3) | | | | (1,098 | ) | | | | 20,511 | | | | | 12,405 | |
Foreign currency forward contracts | | | | – | | | | | 2,980 | | | | | – | |
Foreign currency related transactions | | | | (38 | ) | | | | (7 | ) | | | | 1 | |
Written options | | | | – | | | | | (2,175 | ) | | | | – | |
Total realized gain (loss) | | | | (1,136 | ) | | | | 21,309 | | | | | 12,406 | |
Net increase (decrease) in unrealized appreciation or depreciation on: | | | | | | | | | | | | | | | |
Investments, from unaffiliated issuers (4) | | | | 1,435 | | | | | 39,516 | | | | | (30,321 | ) |
Foreign currency forward contracts | | | | – | | | | | 473 | | | | | – | |
Foreign currency related transactions | | | | (6 | ) | | | | – | (1) | | | | – | |
Written options | | | | – | | | | | 4 | | | | | – | |
Total increase (decrease) in unrealized appreciation or depreciation | | | | 1,429 | | | | | 39,993 | | | | | (30,321 | ) |
Net gain (loss) on investments and foreign currency related transactions | | | | 293 | | | | | 61,302 | | | | | (17,915 | ) |
Net increase (decrease) in net assets resulting from operations | | | $ | 951 | | | | $ | 61,286 | | | | $ | (13,707 | ) |
| | | |
(1) Amount rounds to less than $1 | | | | | | | | | | | | | | | |
(2) Net of foreign taxes withheld on dividends, unaffiliated issuers | | | $ | 134 | | | | $ | 143 | | | | $ | 283 | |
(3) Net of foreign taxes on realized gains | | | | 19 | | | | | – | | | | | – | |
(4) Net of Increase in foreign taxes on unrealized gains | | | | 96 | | | | | – | | | | | – | |
The accompanying notes are an integral part of the financial statements.
| | |
| Artisan Partners Funds | | 79 |
ARTISAN PARTNERS FUNDS
Statements of Changes in Net Assets
Dollar values in thousands
| | | | | | | | | | | | | | | | | | | | |
| | | DEVELOPING WORLD | | GLOBAL DISCOVERY |
| | | Year Ended
9/30/2019 | | Year Ended
9/30/2018 | | Year Ended
9/30/2019 | | Year Ended
9/30/2018 |
| OPERATIONS: | | | | | | | | | | | | | | | | | | | | |
Net investment income (loss) | | | $ | (5,801 | ) | | | $ | 4,259 | | | | $ | (533 | ) | | | $ | (276 | ) |
Net realized gain (loss) on: | | | | | | | | | | | | | | | | | | | | |
Investments, from unaffiliated issuers | | | | 17,101 | | | | | (87,813 | ) | | | | (1,024 | ) | | | | 194 | |
Foreign currency related transactions | | | | 220 | | | | | (1,989 | ) | | | | 1 | | | | | (1 | ) |
Net increase (decrease) in unrealized appreciation or depreciation on: | | | | | | | | | | | | | | | | | | | | |
Investments, from unaffiliated issuers | | | | 360,537 | | | | | (170,497 | ) | | | | 9,229 | | | | | 5,981 | |
Foreign currency related transactions | | | | (995 | ) | | | | 7 | | | | | – | (1) | | | | – | |
Net increase (decrease) in net assets resulting from operations | | | | 371,062 | | | | | (256,033 | ) | | | | 7,673 | | | | | 5,898 | |
| DISTRIBUTIONS TO SHAREHOLDERS: | | | | | | | | | | | | | | | | | | | | |
Investor Shares | | | | (45 | ) | | | | (17,577 | ) | | | | — | | | | | (90 | ) |
Advisor Shares | | | | (609 | ) | | | | (26,894 | ) | | | | | | | | | | |
Institutional Shares | | | | (230 | ) | | | | (25,296 | ) | | | | | | | | | | |
Total distributions to shareholders | | | | (884 | ) | | | | (69,767 | ) | | | | — | | | | | (90 | ) |
| FUND SHARE ACTIVITIES: | | | | | | | | | | | | | | | | | | | | |
Net increase in net assets resulting from fund share activities | | | | 100,622 | | | | | 548,203 | | | | | 24,329 | | | | | 56,352 | |
Total increase in net assets | | | | 470,800 | | | | | 222,403 | | | | | 32,002 | | | | | 62,160 | |
Net assets, beginning of year | | | | 2,190,975 | | | | | 1,968,572 | | | | | 75,321 | | | | | 13,161 | |
Net assets, end of year | | | $ | 2,661,775 | | | | $ | 2,190,975 | | | | $ | 107,323 | | | | $ | 75,321 | |
|
(1) Amount rounds to less than $1 | |
The accompanying notes are an integral part of the financial statements.
| | |
| 80 | | Artisan Partners Funds |
ARTISAN PARTNERS FUNDS
Statements of Changes in Net Assets (Continued)
Dollar values in thousands
| | | | | | | | | | | | | | | | | | | | |
| | | GLOBAL EQUITY | | GLOBAL OPPORTUNITIES |
| | | Year Ended
9/30/2019 | | Year Ended
9/30/2018 | | Year Ended
9/30/2019 | | Year Ended
9/30/2018 |
| OPERATIONS: | | | | | | | | | | | | | | | | | | | | |
Net investment income | | | $ | 25 | | | | $ | 1,020 | | | | $ | 3,941 | | | | $ | 367 | |
Net realized gain (loss) on: | | | | | | | | | | | | | | | | | | | | |
Investments, from unaffiliated issuers | | | | 13,230 | | | | | 45,074 | | | | | 222,938 | | | | | 204,821 | |
Foreign currency related transactions | | | | (14 | ) | | | | (51 | ) | | | | (30 | ) | | | | (224 | ) |
Net increase (decrease) in unrealized appreciation or depreciation on: | | | | | | | | | | | | | | | | | | | | |
Investments, from unaffiliated issuers | | | | (4,529 | ) | | | | 1,987 | | | | | (90,528 | ) | | | | 138,235 | |
Foreign currency related transactions | | | | (63 | ) | | | | (3 | ) | | | | (23 | ) | | | | 45 | |
Net increase in net assets resulting from operations | | | | 8,649 | | | | | 48,027 | | | | | 136,298 | | | | | 343,244 | |
| DISTRIBUTIONS TO SHAREHOLDERS: | | | | | | | | | | | | | | | | | | | | |
Investor Shares | | | | (16,503 | ) | | | | (912 | ) | | | | (68,096 | ) | | | | (41,081 | ) |
Advisor Shares | | | | | | | | | | | | | | (31,641 | ) | | | | (17,255 | ) |
Institutional Shares | | | | (24,802 | ) | | | | (1,168 | ) | | | | (93,750 | ) | | | | (56,726 | ) |
Total distributions to shareholders | | | | (41,305 | ) | | | | (2,080 | ) | | | | (193,487 | ) | | | | (115,062 | ) |
| FUND SHARE ACTIVITIES: | | | | | | | | | | | | | | | | | | | | |
Net increase (decrease) in net assets resulting from fund share activities | | | | (32,416 | ) | | | | (17,298 | ) | | | | 47,054 | | | | | 473,489 | |
Total increase (decrease) in net assets | | | | (65,072 | ) | | | | 28,649 | | | | | (10,135 | ) | | | | 701,671 | |
Net assets, beginning of year | | | | 320,027 | | | | | 291,378 | | | | | 3,405,086 | | | | | 2,703,415 | |
Net assets, end of year | | | $ | 254,955 | | | | $ | 320,027 | | | | $ | 3,394,951 | | | | $ | 3,405,086 | |
The accompanying notes are an integral part of the financial statements.
| | |
| Artisan Partners Funds | | 81 |
ARTISAN PARTNERS FUNDS
Statements of Changes in Net Assets (Continued)
Dollar values in thousands
| | | | | | | | | | | | | | | | | | | | |
| | | GLOBAL VALUE | | HIGH INCOME |
| | | Year Ended
9/30/2019 | | Year Ended
9/30/2018 | | Year Ended
9/30/2019 | | Year Ended
9/30/2018 |
| OPERATIONS: | | | | | | | | | | | | | | | | | | | | |
Net investment income | | | $ | 47,082 | | | | $ | 42,730 | | | | $ | 220,558 | | | | $ | 164,552 | |
Net realized gain (loss) on: | | | | | | | | | | | | | | | | | | | | |
Investments, from unaffiliated issuers | | | | (765 | ) | | | | 170,655 | | | | | (48,346 | ) | | | | 17,617 | |
Foreign currency forward contracts | | | | (1,519 | ) | | | | (9,307 | ) | | | | – | | | | | – | |
Foreign currency related transactions | | | | (180 | ) | | | | 7,163 | | | | | – | | | | | – | |
Futures contracts | | | | – | | | | | – | | | | | (15,310 | ) | | | | 1,241 | |
Net increase (decrease) in unrealized appreciation or depreciation on: | | | | | | | | | | | | | | | | | | | | |
Investments, from unaffiliated issuers | | | | (91,871 | ) | | | | (90,039 | ) | | | | 6,849 | | | | | (49,777 | ) |
Foreign currency forward contracts | | | | 2,772 | | | | | 3,929 | | | | | – | | | | | – | |
Foreign currency related transactions | | | | (108 | ) | | | | (112 | ) | | | | – | | | | | – | |
Futures contracts | | | | – | | | | | – | | | | | 1,580 | | | | | (1 | ) |
Unfunded loan commitments | | | | – | | | | | – | | | | | (33 | ) | | | | 23 | |
Net increase (decrease) in net assets resulting from operations | | | | (44,589 | ) | | | | 125,019 | | | | | 165,298 | | | | | 133,655 | |
| DISTRIBUTIONS TO SHAREHOLDERS: | | | | | | | | | | | | | | | | | | | | |
Investor Shares | | | | (36,013 | ) | | | | (16,006 | ) | | | | (69,933 | ) | | | | (60,684 | ) |
Advisor Shares | | | | (44,524 | ) | | | | (17,624 | ) | | | | (131,657 | ) | | | | (130,761 | ) |
Institutional Shares | | | | (118,223 | ) | | | | (34,390 | ) | | | | (32,024 | ) | | | | (21,787 | ) |
Total distributions to shareholders | | | | (198,760 | ) | | | | (68,020 | ) | | | | (233,614 | ) | | | | (213,232 | ) |
| FUND SHARE ACTIVITIES: | | | | | | | | | | | | | | | | | | | | |
Net increase (decrease) in net assets resulting from fund share activities | | | | (400,923 | ) | | | | 583,045 | | | | | 610,675 | | | | | 881,988 | |
Total increase (decrease) in net assets | | | | (644,272 | ) | | | | 640,044 | | | | | 542,359 | | | | | 802,411 | |
Net assets, beginning of year | | | | 3,720,150 | | | | | 3,080,106 | | | | | 3,245,953 | | | | | 2,443,542 | |
Net assets, end of year | | | $ | 3,075,878 | | | | $ | 3,720,150 | | | | $ | 3,788,312 | | | | $ | 3,245,953 | |
The accompanying notes are an integral part of the financial statements.
| | |
| 82 | | Artisan Partners Funds |
ARTISAN PARTNERS FUNDS
Statements of Changes in Net Assets (Continued)
Dollar values in thousands
| | | | | | | | | | | | | | | | | | | | |
| | | INTERNATIONAL | | INTERNATIONALSMALL-MID |
| | | Year Ended
9/30/2019 | | Year Ended
9/30/2018 | | Year Ended
9/30/2019 | | Year Ended
9/30/2018 |
| OPERATIONS: | | | | | | | | | | | | | | | | | | | | |
Net investment income (loss) | | | $ | 117,234 | | | | $ | 170,737 | | | | $ | 529 | | | | $ | (1,530 | ) |
Net realized gain (loss) on: | | | | | | | | | | | | | | | | | | | | |
Investments, from unaffiliated issuers | | | | 450,782 | | | | | 1,199,635 | | | | | 21,077 | | | | | 102,246 | |
Investments, from affiliated issuers | | | | – | | | | | – | | | | | (1,952 | ) | | | | (77 | ) |
Foreign currency related transactions | | | | (753 | ) | | | | (3,737 | ) | | | | (266 | ) | | | | (107 | ) |
Net increase (decrease) in unrealized appreciation or depreciation on: | | | | | | | | | | | | | | | | | | | | |
Investments, from unaffiliated issuers | | | | (27,454 | ) | | | | (716,021 | ) | | | | 30,363 | | | | | (61,878 | ) |
Investments, from affiliated issuers | | | | – | | | | | – | | | | | (1,745 | ) | | | | 2,772 | |
Foreign currency related transactions | | | | (1,749 | ) | | | | (857 | ) | | | | (46 | ) | | | | (19 | ) |
Net increase in net assets resulting from operations | | | | 538,060 | | | | | 649,757 | | | | | 47,960 | | | | | 41,407 | |
| DISTRIBUTIONS TO SHAREHOLDERS: | | | | | | | | | | | | | | | | | | | | |
Investor Shares | | | | (359,809 | ) | | | | (38,619 | ) | | | | (74,416 | ) | | | | (36,616 | ) |
Advisor Shares | | | | (186,300 | ) | | | | (20,271 | ) | | | | – | | | | | | |
Institutional Shares | | | | (449,372 | ) | | | | (54,804 | ) | | | | (30,412 | ) | | | | (26,081 | ) |
Total distributions to shareholders | | | | (995,481 | ) | | | | (113,694 | ) | | | | (104,828 | ) | | | | (62,697 | ) |
| FUND SHARE ACTIVITIES: | | | | | | | | | | | | | | | | | | | | |
Net increase (decrease) in net assets resulting from fund share activities | | | | (1,900,318 | ) | | | | (1,653,643 | ) | | | | 873,751 | | | | | (137,518 | ) |
Total increase (decrease) in net assets | | | | (2,357,739 | ) | | | | (1,117,580 | ) | | | | 816,883 | | | | | (158,808 | ) |
Net assets, beginning of year | | | | 12,916,847 | | | | | 14,034,427 | | | | | 404,125 | | | | | 562,933 | |
Net assets, end of year | | | $ | 10,559,108 | | | | $ | 12,916,847 | | | | $ | 1,221,008 | | | | $ | 404,125 | |
The accompanying notes are an integral part of the financial statements.
| | |
| Artisan Partners Funds | | 83 |
ARTISAN PARTNERS FUNDS
Statements of Changes in Net Assets (Continued)
Dollar values in thousands
| | | | | | | | | | | | | | | | | | | | |
| | | INTERNATIONAL VALUE | | MID CAP |
| | | Year Ended
9/30/2019 | | Year Ended
9/30/2018 | | Year Ended
9/30/2019 | | Year Ended
9/30/2018 |
| OPERATIONS: | | | | | | | | | | | | | | | | | | | | |
Net investment income (loss) | | | $ | 271,113 | | | | $ | 198,813 | | | | $ | (25,283 | ) | | | $ | (30,816 | ) |
Net realized gain (loss) on: | | | | | | | | | | | | | | | | | | | | |
Investments, from unaffiliated issuers | | | | 259,418 | | | | | 710,473 | | | | | 537,218 | | | | | 1,325,617 | |
Investments, from affiliated issuers | | | | 29,177 | | | | | 1,181 | | | | | – | | | | | – | |
Foreign currency forward contracts | | | | (11,337 | ) | | | | (57,057 | ) | | | | – | | | | | – | |
Foreign currency related transactions | | | | (1,525 | ) | | | | 32,857 | | | | | (9 | ) | | | | (167 | ) |
Net increase (decrease) in unrealized appreciation or depreciation on: | | | | | | | | | | | | | | | | | | | | |
Investments, from unaffiliated issuers | | | | (665,619 | ) | | | | (1,597,541 | ) | | | | (373,052 | ) | | | | (53,709 | ) |
Investments, from affiliated issuers | | | | 97,201 | | | | | 391,080 | | | | | – | | | | | – | |
Foreign currency forward contracts | | | | 17,654 | | | | | 17,891 | | | | | – | | | | | – | |
Foreign currency related transactions | | | | (891 | ) | | | | (471 | ) | | | | (4 | ) | | | | 15 | |
Net increase (decrease) in net assets resulting from operations | | | | (4,809 | ) | | | | (302,774 | ) | | | | 138,870 | | | | | 1,240,940 | |
| DISTRIBUTIONS TO SHAREHOLDERS: | | | | | | | | | | | | | | | | | | | | |
Investor Shares | | | | (170,987 | ) | | | | (164,573 | ) | | | | (345,115 | ) | | | | (292,322 | ) |
Advisor Shares | | | | (253,519 | ) | | | | (173,254 | ) | | | | (106,197 | ) | | | | (76,242 | ) |
Institutional Shares | | | | (416,576 | ) | | | | (267,787 | ) | | | | (557,303 | ) | | | | (500,170 | ) |
Total distributions to shareholders | | | | (841,082 | ) | | | | (605,614 | ) | | | | (1,008,615 | ) | | | | (868,734 | ) |
| FUND SHARE ACTIVITIES: | | | | | | | | | | | | | | | | | | | | |
Net increase (decrease) in net assets resulting from fund share activities | | | | (236,695 | ) | | | | 1,303,172 | | | | | (236,474 | ) | | | | (1,188,104 | ) |
Total increase (decrease) in net assets | | | | (1,082,586 | ) | | | | 394,784 | | | | | (1,106,219 | ) | | | | (815,898 | ) |
Net assets, beginning of year | | | | 15,350,696 | | | | | 14,955,912 | | | | | 6,164,691 | | | | | 6,980,589 | |
Net assets, end of year | | | $ | 14,268,110 | | | | $ | 15,350,696 | | | | $ | 5,058,472 | | | | $ | 6,164,691 | |
The accompanying notes are an integral part of the financial statements.
| | |
| 84 | | Artisan Partners Funds |
ARTISAN PARTNERS FUNDS
Statements of Changes in Net Assets (Continued)
Dollar values in thousands
| | | | | | | | | | | | | | | | | | | | |
| | | MID CAP VALUE | | SMALL CAP |
| | | Year Ended
9/30/2019 | | Year Ended
9/30/2018 | | Year Ended
9/30/2019 | | Year Ended
9/30/2018 |
| OPERATIONS: | | | | | | | | | | | | | | | | | | | | |
Net investment income (loss) | | | $ | 16,125 | | | | $ | 6,687 | | | | $ | (13,358 | ) | | | $ | (11,704 | ) |
Net realized gain (loss) on: | | | | | | | | | | | | | | | | | | | | |
Investments, from unaffiliated issuers | | | | 287,026 | | | | | 436,692 | | | | | 146,505 | | | | | 307,089 | |
Net increase (decrease) in unrealized appreciation or depreciation on: | | | | | | | | | | | | | | | | | | | | |
Investments, from unaffiliated issuers | | | | (433,551 | ) | | | | (130,183 | ) | | | | (104,719 | ) | | | | 156,773 | |
Foreign currency related transactions | | | | 1 | | | | | – | | | | | – | | | | | – | |
Net increase (decrease) in net assets resulting from operations | | | | (130,399 | ) | | | | 313,196 | | | | | 28,428 | | | | | 452,158 | |
| DISTRIBUTIONS TO SHAREHOLDERS: | | | | | | | | | | | | | | | | | | | | |
Investor Shares | | | | (148,246 | ) | | | | (177,746 | ) | | | | (67,769 | ) | | | | (63,823 | ) |
Advisor Shares | | | | (116,973 | ) | | | | (102,557 | ) | | | | (68,313 | ) | | | | (47,808 | ) |
Institutional Shares | | | | (131,142 | ) | | | | (99,593 | ) | | | | (108,871 | ) | | | | (75,707 | ) |
Total distributions to shareholders | | | | (396,361 | ) | | | | (379,896 | ) | | | | (244,953 | ) | | | | (187,338 | ) |
| FUND SHARE ACTIVITIES: | | | | | | | | | | | | | | | | | | | | |
Net increase (decrease) in net assets resulting from fund share activities | | | | (507,601 | ) | | | | (681,308 | ) | | | | 247,614 | | | | | 256,968 | |
Total increase (decrease) in net assets | | | | (1,034,361 | ) | | | | (748,008 | ) | | | | 31,089 | | | | | 521,788 | |
Net assets, beginning of year | | | | 3,303,938 | | | | | 4,051,946 | | | | | 1,805,879 | | | | | 1,284,091 | |
Net assets, end of year | | | $ | 2,269,577 | | | | $ | 3,303,938 | | | | $ | 1,836,968 | | | | $ | 1,805,879 | |
The accompanying notes are an integral part of the financial statements.
| | |
| Artisan Partners Funds | | 85 |
ARTISAN PARTNERS FUNDS
Statements of Changes in Net Assets (Continued)
Dollar values in thousands
| | | | | | | | | | | | | | | | | | | | |
| | | SUSTAINABLE EMERGING MARKETS | | THEMATIC |
| | | Year Ended
9/30/2019 | | Year Ended
9/30/2018 | | Year Ended
9/30/2019 | | Year Ended
9/30/2018 |
| OPERATIONS: | | | | | | | | | | | | | | | | | | | | |
Net investment income (loss) | | | $ | 658 | | | | $ | 512 | | | | $ | (16 | ) | | | $ | (116 | ) |
Net realized gain (loss) on: | | | | | | | | | | | | | | | | | | | | |
Investments, from unaffiliated issuers | | | | (1,098 | ) | | | | 2,784 | | | | | 20,511 | | | | | 9,387 | |
Foreign currency forward contracts | | | | – | | | | | – | | | | | 2,980 | | | | | 15 | |
Foreign currency related transactions | | | | (38 | ) | | | | (22 | ) | | | | (7 | ) | | | | (6 | ) |
Written options | | | | – | | | | | – | | | | | (2,175 | ) | | | | (2,417 | ) |
Securities sold short | | | | – | | | | | – | | | | | – | | | | | 29 | |
Net increase (decrease) in unrealized appreciation or depreciation on: | | | | | | | | | | | | | | | | | | | | |
Investments, from unaffiliated issuers | | | | 1,435 | | | | | (5,284 | ) | | | | 39,516 | | | | | 4,866 | |
Foreign currency forward contracts | | | | – | | | | | – | | | | | 473 | | | | | 69 | |
Foreign currency related transactions | | | | (6 | ) | | | | – | (1) | | | | – | (1) | | | | – | (1) |
Written options | | | | – | | | | | – | | | | | 4 | | | | | (2 | ) |
Net increase (decrease) in net assets resulting from operations | | | | 951 | | | | | (2,010 | ) | | | | 61,286 | | | | | 11,825 | |
| DISTRIBUTIONS TO SHAREHOLDERS: | | | | | | | | | | | | | | | | | | | | |
Investor Shares | | | | (449 | ) | | | | (238 | ) | | | | (4,461 | ) | | | | (1,606 | ) |
Advisor Shares | | | | | | | | | | | | | | (2,027 | ) | | | | | |
Institutional Shares | | | | (34 | ) | | | | (44 | ) | | | | | | | | | | |
Total distributions to shareholders | | | | (483 | ) | | | | (282 | ) | | | | (6,488 | ) | | | | (1,606 | ) |
| FUND SHARE ACTIVITIES: | | | | | | | | | | | | | | | | | | | | |
Net increase (decrease) in net assets resulting from fund share activities | | | | (3,840 | ) | | | | 6,558 | | | | | 518,873 | | | | | 92,296 | |
Total increase (decrease) in net assets | | | | (3,372 | ) | | | | 4,266 | | | | | 573,671 | | | | | 102,515 | |
Net assets, beginning of year | | | | 55,404 | | | | | 51,138 | | | | | 117,808 | | | | | 15,293 | |
Net assets, end of year | | | $ | 52,032 | | | | $ | 55,404 | | | | $ | 691,479 | | | | $ | 117,808 | |
|
(1) Amount rounds to less than $1 | |
The accompanying notes are an integral part of the financial statements.
| | |
| 86 | | Artisan Partners Funds |
ARTISAN PARTNERS FUNDS
Statements of Changes in Net Assets (Continued)
Dollar values in thousands
| | | | | | | | | | |
| | | VALUE |
| | | Year Ended
9/30/2019 | | Year Ended
9/30/2018 |
| OPERATIONS: | | | | | | | | | | |
Net investment income | | | $ | 4,208 | | | | $ | 4,752 | |
Net realized gain (loss) on: | | | | | | | | | | |
Investments, from unaffiliated issuers | | | | 12,405 | | | | | 80,018 | |
Foreign currency related transactions | | | | 1 | | | | | 20 | |
Net increase (decrease) in unrealized appreciation or depreciation on: | | | | | | | | | | |
Investments, from unaffiliated issuers | | | | (30,321 | ) | | | | (29,587 | ) |
Foreign currency related transactions | | | | – | | | | | – | (1) |
Net increase (decrease) in net assets resulting from operations | | | | (13,707 | ) | | | | 55,203 | |
| DISTRIBUTIONS TO SHAREHOLDERS: | | | | | | | | | | |
Investor Shares | | | | (20,958 | ) | | | | (20,140 | ) |
Advisor Shares | | | | (15,288 | ) | | | | (17,636 | ) |
Institutional Shares | | | | (21,766 | ) | | | | (23,446 | ) |
Total distributions to shareholders | | | | (58,012 | ) | | | | (61,222 | ) |
| FUND SHARE ACTIVITIES: | | | | | | | | | | |
Net decrease in net assets resulting from fund share activities | | | | (20,709 | ) | | | | (145,445 | ) |
Total decrease in net assets | | | | (92,428 | ) | | | | (151,464 | ) |
Net assets, beginning of year | | | | 500,726 | | | | | 652,190 | |
Net assets, end of year | | | $ | 408,298 | | | | $ | 500,726 | |
|
(1) Amount rounds to less than $1 | |
The accompanying notes are an integral part of the financial statements.
| | |
| Artisan Partners Funds | | 87 |
ARTISAN PARTNERS FUNDS
Financial Highlights – For a share outstanding throughout each period
| | | | | | | | | | | | | | | | | | | | | | | | | | | | | | | | |
| | | | | | | | | | | | | | | Less Distributions From | | | | |
| | | Net
Asset
Value,
Beginning
of Period | | | Net
Investment
Income (Loss)(1) | | | Net Realized
and Unrealized
Gain (Loss) on
Investments | | | Total
from
Operations | | | Net
Investment
Income | | | Net
Realized
Gains | | | Total
Distributions | | | Net
Asset
Value,
End of
Period | |
| DEVELOPING WORLD FUND | |
Investor Shares | | | | | | | | | | | | | | | | | | | | | | | | | | | | | | | | |
9/30/2019 | | $ | 11.17 | | | | (0.07 | ) | | | 2.34 | | | | 2.27 | | | | — | (5) | | | — | | | | — | (5) | | $ | 13.44 | |
9/30/2018 | | $ | 12.83 | | | | — | (5) | | | (1.23 | ) | | | (1.23 | ) | | | (0.02 | ) | | | (0.41 | ) | | | (0.43 | ) | | $ | 11.17 | |
9/30/2017 | | $ | 10.51 | | | | 0.03 | | | | 2.34 | | | | 2.37 | | | | (0.01 | ) | | | (0.04 | ) | | | (0.05 | ) | | $ | 12.83 | |
9/30/2016 | | $ | 8.39 | | | | 0.02 | | | | 2.10 | | | | 2.12 | | | | — | | | | — | | | | — | | | $ | 10.51 | |
9/30/2015(6) | | $ | 10.00 | | | | — | (5) | | | (1.61 | ) | | | (1.61 | ) | | | — | | | | — | | | | — | | | $ | 8.39 | |
Advisor Shares | | | | | | | | | | | | | | | | | | | | | | | | | | | | | | | | |
9/30/2019 | | $ | 11.21 | | | | (0.03 | ) | | | 2.34 | | | | 2.31 | | | | (0.01 | ) | | | — | | | | (0.01 | ) | | $ | 13.51 | |
9/30/2018 | | $ | 12.87 | | | | 0.03 | | | | (1.25 | ) | | | (1.22 | ) | | | (0.03 | ) | | | (0.41 | ) | | | (0.44 | ) | | $ | 11.21 | |
9/30/2017 | | $ | 10.54 | | | | 0.05 | | | | 2.35 | | | | 2.40 | | | | (0.03 | ) | | | (0.04 | ) | | | (0.07 | ) | | $ | 12.87 | |
9/30/2016 | | $ | 8.39 | | | | 0.03 | | | | 2.12 | | | | 2.15 | | | | — | | | | — | | | | — | | | $ | 10.54 | |
9/30/2015(6) | | $ | 10.00 | | | | (0.01 | ) | | | (1.60 | ) | | | (1.61 | ) | | | — | | | | — | | | | — | | | $ | 8.39 | |
Institutional Shares | | | | | | | | | | | | | | | | | | | | | | | | | | | | | | | | |
9/30/2019 | | $ | 11.23 | | | | (0.02 | ) | | | 2.34 | | | | 2.32 | | | | — | (5) | | | — | | | | — | (5) | | $ | 13.55 | |
9/30/2018 | | $ | 12.89 | | | | 0.04 | | | | (1.25 | ) | | | (1.21 | ) | | | (0.04 | ) | | | (0.41 | ) | | | (0.45 | ) | | $ | 11.23 | |
9/30/2017 | | $ | 10.56 | | | | 0.06 | | | | 2.34 | | | | 2.40 | | | | (0.03 | ) | | | (0.04 | ) | | | (0.07 | ) | | $ | 12.89 | |
9/30/2016 | | $ | 8.39 | | | | 0.04 | | | | 2.13 | | | | 2.17 | | | | — | | | | — | | | | — | | | $ | 10.56 | |
9/30/2015(6) | | $ | 10.00 | | | | (0.01 | ) | | | (1.60 | ) | | | (1.61 | ) | | | — | | | | — | | | | — | | | $ | 8.39 | |
| GLOBAL DISCOVERY FUND | |
Investor Shares | | | | | | | | | | | | | | | | | | | | | | | | | | | | | | | | |
9/30/2019 | | $ | 12.40 | | | | (0.08 | ) | | | 1.07 | | | | 0.99 | | | | — | | | | — | | | | — | | | $ | 13.39 | |
9/30/2018 | | $ | 10.32 | | | | (0.09 | ) | | | 2.23 | | | | 2.14 | | | | — | (5) | | | (0.06 | ) | | | (0.06 | ) | | $ | 12.40 | |
9/30/2017(7) | | $ | 10.00 | | | | (0.01 | ) | | | 0.33 | | | | 0.32 | | | | — | | | | — | | | | — | | | $ | 10.32 | |
| GLOBAL EQUITY FUND | |
Investor Shares | | | | | | | | | | | | | | | | | | | | | | | | | | | | | | | | |
9/30/2019 | | $ | 22.66 | | | | (0.02 | ) | | | 1.02 | | | | 1.00 | | | | (0.03 | ) | | | (3.03 | ) | | | (3.06 | ) | | $ | 20.60 | |
9/30/2018 | | $ | 19.60 | | | | 0.03 | | | | 3.17 | | | | 3.20 | | | | — | | | | (0.14 | ) | | | (0.14 | ) | | $ | 22.66 | |
9/30/2017 | | $ | 16.54 | | | | (0.03 | ) | | | 3.09 | | | | 3.06 | | | | — | | | | — | | | | — | | | $ | 19.60 | |
9/30/2016 | | $ | 15.73 | | | | (0.01 | ) | | | 1.17 | | | | 1.16 | | | | — | | | | (0.35 | ) | | | (0.35 | ) | | $ | 16.54 | |
9/30/2015 | | $ | 16.18 | | | | (0.03 | ) | | | 0.07 | | | | 0.04 | | | | — | | | | (0.49 | ) | | | (0.49 | ) | | $ | 15.73 | |
Institutional Shares | | | | | | | | | | | | | | | | | | | | | | | | | | | | | | | | |
9/30/2019 | | $ | 22.80 | | | | 0.02 | | | | 1.01 | | | | 1.03 | | | | (0.09 | ) | | | (3.03 | ) | | | (3.12 | ) | | $ | 20.71 | |
9/30/2018 | | $ | 19.66 | | | | 0.10 | | | | 3.18 | | | | 3.28 | | | | — | | | | (0.14 | ) | | | (0.14 | ) | | $ | 22.80 | |
9/30/2017 | | $ | 16.58 | | | | 0.01 | | | | 3.10 | | | | 3.11 | | | | (0.03 | ) | | | — | | | | (0.03 | ) | | $ | 19.66 | |
9/30/2016(8) | | $ | 16.44 | | | | 0.06 | | | | 0.43 | | | | 0.49 | | | | — | | | | (0.35 | ) | | | (0.35 | ) | | $ | 16.58 | |
Footnotes are presented on Pages 101-102.
The accompanying notes are an integral part of the financial statements.
| | |
| 88 | | Artisan Partners Funds |
ARTISAN PARTNERS FUNDS
Financial Highlights – continued
| | | | | | | | | | | | | | | | | | | | | | | | |
| | | | | | |
| | | Total
Return(2) | | | Net Assets,
End of
Period
(000) | | | Ratio of
Expenses
to Average
Net Assets(3)(4) | | | Ratio of
Expenses
to Average
Net Assets
Excluding
Waivers(3) | | | Ratio
of Net
Investment
Income (Loss)
to Average
Net Assets(3)(4) | | | Portfolio
Turnover
Rate(2) | |
| DEVELOPING WORLD FUND | |
Investor Shares | | | | | | | | | | | | | | | | | | | | | | | | |
9/30/2019 | | | 20.33 | % | | $ | 255,336 | | | | 1.35 | % | | | n/a | | | | (0.56 | )% | | | 159.86 | % |
9/30/2018 | | | (9.99 | )% | | $ | 477,908 | | | | 1.36 | % | | | n/a | | | | (0.02 | )% | | | 121.12 | % |
9/30/2017 | | | 22.70 | % | | $ | 520,406 | | | | 1.40 | % | | | n/a | | | | 0.26 | % | | | 45.04 | % |
9/30/2016 | | | 25.27 | % | | $ | 266,122 | | | | 1.50 | % | | | 1.52 | % | | | 0.25 | % | | | 47.59 | % |
9/30/2015(6) | | | (16.10 | )% | | $ | 20,642 | | | | 1.50 | % | | | 2.23 | % | | | (0.20 | )% | | | 9.00 | % |
Advisor Shares | | | | | | | | | | | | | | | | | | | | | | | | |
9/30/2019 | | | 20.59 | % | | $ | 1,585,519 | | | | 1.18 | % | | | n/a | | | | (0.23 | )% | | | 159.86 | % |
9/30/2018 | | | (9.87 | )% | | $ | 1,031,825 | | | | 1.18 | % | | | n/a | | | | 0.22 | % | | | 121.12 | % |
9/30/2017 | | | 22.94 | % | | $ | 763,998 | | | | 1.21 | % | | | n/a | | | | 0.47 | % | | | 45.04 | % |
9/30/2016 | | | 25.63 | % | | $ | 340,831 | | | | 1.25 | % | | | n/a | | | | 0.28 | % | | | 47.59 | % |
9/30/2015(6) | | | (16.10 | )% | | $ | 58,196 | | | | 1.40 | % | | | 1.96 | % | | | (0.37 | )% | | | 9.00 | % |
Institutional Shares | | | | | | | | | | | | | | | | | | | | | | | | |
9/30/2019 | | | 20.71 | % | | $ | 820,920 | | | | 1.08 | % | | | n/a | | | | (0.15 | )% | | | 159.86 | % |
9/30/2018 | | | (9.80 | )% | | $ | 681,242 | | | | 1.08 | % | | | n/a | | | | 0.29 | % | | | 121.12 | % |
9/30/2017 | | | 22.99 | % | | $ | 684,168 | | | | 1.12 | % | | | n/a | | | | 0.50 | % | | | 45.04 | % |
9/30/2016 | | | 25.86 | % | | $ | 277,691 | | | | 1.15 | % | | | n/a | | | | 0.44 | % | | | 47.59 | % |
9/30/2015(6) | | | (16.10 | )% | | $ | 39,993 | | | | 1.40 | % | | | 2.03 | % | | | (0.44 | )% | | | 9.00 | % |
| GLOBAL DISCOVERY FUND | |
Investor Shares | | | | | | | | | | | | | | | | | | | | | | | | |
9/30/2019 | | | 7.98 | % | | $ | 107,323 | | | | 1.40 | % | | | n/a | | | | (0.62 | )% | | | 52.30 | % |
9/30/2018 | | | 20.90 | % | | $ | 75,321 | | | | 1.50 | % | | | 1.71 | % | | | (0.75 | )% | | | 38.71 | % |
9/30/2017(7) | | | 3.20 | % | | $ | 13,161 | | | | 1.50 | % | | | 4.55 | % | | | (0.83 | )% | | | 1.85 | % |
| GLOBAL EQUITY FUND | |
Investor Shares | | | | | | | | | | | | | | | | | | | | | | | | |
9/30/2019 | | | 6.90 | % | | $ | 118,936 | | | | 1.38 | % | | | n/a | | | | (0.09 | )% | | | 91.33 | % |
9/30/2018 | | | 16.38 | % | | $ | 123,225 | | | | 1.36 | % | | | n/a | | | | 0.13 | % | | | 120.14 | % |
9/30/2017 | | | 18.50 | % | | $ | 131,813 | | | | 1.40 | % | | | n/a | | | | (0.20 | )% | | | 109.89 | % |
9/30/2016 | | | 7.40 | % | | $ | 145,817 | | | | 1.37 | % | | | n/a | | | | (0.09 | )% | | | 96.23 | % |
9/30/2015 | | | 0.20 | % | | $ | 296,380 | | | | 1.37 | % | | | n/a | | | | (0.19 | )% | | | 78.44 | % |
Institutional Shares | | | | | | | | | | | | | | | | | | | | | | | | |
9/30/2019 | | | 7.10 | % | | $ | 136,019 | | | | 1.16 | % | | | n/a | | | | 0.09 | % | | | 91.33 | % |
9/30/2018 | | | 16.73 | % | | $ | 196,802 | | | | 1.10 | % | | | n/a | | | | 0.45 | % | | | 120.14 | % |
9/30/2017 | | | 18.78 | % | | $ | 159,565 | | | | 1.16 | % | | | n/a | | | | 0.03 | % | | | 109.89 | % |
9/30/2016(8) | | | 3.01 | % | | $ | 111,757 | | | | 1.11 | % | | | n/a | | | | 0.37 | % | | | 96.23 | % |
Footnotes are presented on Pages 101-102.
The accompanying notes are an integral part of the financial statements.
| | |
| Artisan Partners Funds | | 89 |
ARTISAN PARTNERS FUNDS
Financial Highlights – For a share outstanding throughout each period
| | | | | | | | | | | | | | | | | | | | | | | | | | | | | | | | |
| | | | | | | | | | | | | | | Less Distributions From | | | | |
| | | Net
Asset
Value,
Beginning
of Period | | | Net
Investment
Income (Loss)(1) | | | Net Realized
and Unrealized
Gain (Loss) on
Investments | | | Total
from
Operations | | | Net
Investment
Income | | | Net
Realized
Gains | | | Total
Distributions | | | Net
Asset
Value,
End of
Period | |
| GLOBAL OPPORTUNITIES FUND | |
Investor Shares | | | | | | | | | | | | | | | | | | | | | | | | | | | | | | | | |
9/30/2019 | | $ | 27.66 | | | | (0.01 | ) | | | 1.01 | | | | 1.00 | | | | — | | | | (1.60 | ) | | | (1.60 | ) | | $ | 27.06 | |
9/30/2018 | | $ | 25.69 | | | | (0.03 | ) | | | 3.07 | | | | 3.04 | | | | — | | | | (1.07 | ) | | | (1.07 | ) | | $ | 27.66 | |
9/30/2017 | | $ | 21.74 | | | | (0.08 | ) | | | 4.06 | | | | 3.98 | | | | — | | | | (0.03 | ) | | | (0.03 | ) | | $ | 25.69 | |
9/30/2016 | | $ | 18.35 | | | | (0.06 | ) | | | 3.59 | | | | 3.53 | | | | (0.02 | ) | | | (0.12 | ) | | | (0.14 | ) | | $ | 21.74 | |
9/30/2015 | | $ | 18.92 | | | | 0.01 | | | | (0.09 | ) | | | (0.08 | ) | | | (0.06 | ) | | | (0.43 | ) | | | (0.49 | ) | | $ | 18.35 | |
Advisor Shares | | | | | | | | | | | | | | | | | | | | | | | | | | | | | | | | |
9/30/2019 | | $ | 27.76 | | | | 0.03 | | | | 1.02 | | | | 1.05 | | | | — | | | | (1.60 | ) | | | (1.60 | ) | | $ | 27.21 | |
9/30/2018 | | $ | 25.75 | | | | 0.01 | | | | 3.07 | | | | 3.08 | | | | — | | | | (1.07 | ) | | | (1.07 | ) | | $ | 27.76 | |
9/30/2017 | | $ | 21.76 | | | | (0.05 | ) | | | 4.07 | | | | 4.02 | | | | — | | | | (0.03 | ) | | | (0.03 | ) | | $ | 25.75 | |
9/30/2016 | | $ | 18.37 | | | | (0.03 | ) | | | 3.58 | | | | 3.55 | | | | (0.04 | ) | | | (0.12 | ) | | | (0.16 | ) | | $ | 21.76 | |
9/30/2015(9) | | $ | 19.16 | | | | 0.02 | | | | (0.81 | ) | | | (0.79 | ) | | | — | | | | — | | | | — | | | $ | 18.37 | |
Institutional Shares | | | | | | | | | | | | | | | | | | | | | | | | | | | | | | | | |
9/30/2019 | | $ | 27.99 | | | | 0.06 | | | | 1.02 | | | | 1.08 | | | | — | (5) | | | (1.60 | ) | | | (1.60 | ) | | $ | 27.47 | |
9/30/2018 | | $ | 25.92 | | | | 0.03 | | | | 3.11 | | | | 3.14 | | | | — | | | | (1.07 | ) | | | (1.07 | ) | | $ | 27.99 | |
9/30/2017 | | $ | 21.89 | | | | (0.03 | ) | | | 4.09 | | | | 4.06 | | | | — | | | | (0.03 | ) | | | (0.03 | ) | | $ | 25.92 | |
9/30/2016 | | $ | 18.46 | | | | (0.01 | ) | | | 3.61 | | | | 3.60 | | | | (0.05 | ) | | | (0.12 | ) | | | (0.17 | ) | | $ | 21.89 | |
9/30/2015 | | $ | 19.04 | | | | 0.07 | | | | (0.11 | ) | | | (0.04 | ) | | | (0.11 | ) | | | (0.43 | ) | | | (0.54 | ) | | $ | 18.46 | |
| GLOBAL VALUE FUND | |
Investor Shares | | | | | | | | | | | | | | | | | | | | | | | | | | | | | | | | |
9/30/2019 | | $ | 18.24 | | | | 0.21 | | | | (0.38 | ) | | | (0.17 | ) | | | (0.15 | ) | | | (0.80 | ) | | | (0.95 | ) | | $ | 17.12 | |
9/30/2018 | | $ | 17.87 | | | | 0.18 | | | | 0.55 | | | | 0.73 | | | | (0.12 | ) | | | (0.24 | ) | | | (0.36 | ) | | $ | 18.24 | |
9/30/2017 | | $ | 15.30 | | | | 0.10 | | | | 2.88 | | | | 2.98 | | | | (0.11 | ) | | | (0.30 | ) | | | (0.41 | ) | | $ | 17.87 | |
9/30/2016 | | $ | 14.47 | | | | 0.10 | | | | 1.58 | | | | 1.68 | | | | (0.05 | ) | | | (0.80 | ) | | | (0.85 | ) | | $ | 15.30 | |
9/30/2015 | | $ | 15.63 | | | | 0.07 | | | | (0.71 | ) | | | (0.64 | ) | | | (0.08 | ) | | | (0.44 | ) | | | (0.52 | ) | | $ | 14.47 | |
Advisor Shares | | | | | | | | | | | | | | | | | | | | | | | | | | | | | | | | |
9/30/2019 | | $ | 18.22 | | | | 0.23 | | | | (0.39 | ) | | | (0.16 | ) | | | (0.17 | ) | | | (0.80 | ) | | | (0.97 | ) | | $ | 17.09 | |
9/30/2018 | | $ | 17.86 | | | | 0.21 | | | | 0.54 | | | | 0.75 | | | | (0.15 | ) | | | (0.24 | ) | | | (0.39 | ) | | $ | 18.22 | |
9/30/2017 | | $ | 15.28 | | | | 0.13 | | | | 2.87 | | | | 3.00 | | | | (0.12 | ) | | | (0.30 | ) | | | (0.42 | ) | | $ | 17.86 | |
9/30/2016 | | $ | 14.48 | | | | 0.13 | | | | 1.57 | | | | 1.70 | | | | (0.10 | ) | | | (0.80 | ) | | | (0.90 | ) | | $ | 15.28 | |
9/30/2015(9) | | $ | 15.60 | | | | 0.05 | | | | (1.17 | ) | | | (1.12 | ) | | | — | | | | — | | | | — | | | $ | 14.48 | |
Institutional Shares | | | | | | | | | | | | | | | | | | | | | | | | | | | | | | | | |
9/30/2019 | | $ | 18.27 | | | | 0.26 | | | | (0.40 | ) | | | (0.14 | ) | | | (0.19 | ) | | | (0.80 | ) | | | (0.99 | ) | | $ | 17.14 | |
9/30/2018 | | $ | 17.90 | | | | 0.24 | | | | 0.54 | | | | 0.78 | | | | (0.17 | ) | | | (0.24 | ) | | | (0.41 | ) | | $ | 18.27 | |
9/30/2017 | | $ | 15.32 | | | | 0.14 | | | | 2.87 | | | | 3.01 | | | | (0.13 | ) | | | (0.30 | ) | | | (0.43 | ) | | $ | 17.90 | |
9/30/2016 | | $ | 14.50 | | | | 0.14 | | | | 1.59 | | | | 1.73 | | | | (0.11 | ) | | | (0.80 | ) | | | (0.91 | ) | | $ | 15.32 | |
9/30/2015 | | $ | 15.67 | | | | 0.11 | | | | (0.73 | ) | | | (0.62 | ) | | | (0.11 | ) | | | (0.44 | ) | | | (0.55 | ) | | $ | 14.50 | |
Footnotes are presented on Pages 101-102.
The accompanying notes are an integral part of the financial statements.
| | |
| 90 | | Artisan Partners Funds |
ARTISAN PARTNERS FUNDS
Financial Highlights – continued
| | | | | | | | | | | | | | | | | | | | | | | | |
| | | | | | |
| | | Total
Return(2) | | | Net Assets,
End of
Period
(000) | | | Ratio of
Expenses
to Average
Net Assets(3)(4) | | | Ratio of
Expenses
to Average
Net Assets
Excluding
Waivers(3) | | | Ratio
of Net
Investment
Income (Loss)
to Average
Net Assets(3)(4) | | | Portfolio
Turnover
Rate(2) | |
| GLOBAL OPPORTUNITIES FUND | |
Investor Shares | | | | | | | | | | | | | | | | | | | | | | | | |
9/30/2019 | | | 4.85 | % | | $ | 1,052,916 | | | | 1.15 | % | | | n/a | | | | (0.02 | )% | | | 48.64 | % |
9/30/2018 | | | 12.19 | % | | $ | 1,176,471 | | | | 1.15 | % | | | n/a | | | | (0.13 | )% | | | 44.27 | % |
9/30/2017 | | | 18.36 | % | | $ | 974,286 | | | | 1.15 | % | | | n/a | | | | (0.35 | )% | | | 34.13 | % |
9/30/2016 | | | 19.29 | % | | $ | 781,877 | | | | 1.17 | % | | | n/a | | | | (0.33 | )% | | | 34.62 | % |
9/30/2015 | | | (0.46 | )% | | $ | 669,846 | | | | 1.19 | % | | | n/a | | | | 0.07 | % | | | 55.53 | % |
Advisor Shares | | | | | | | | | | | | | | | | | | | | | | | | |
9/30/2019 | | | 5.03 | % | | $ | 615,920 | | | | 1.01 | % | | | n/a | | | | 0.11 | % | | | 48.64 | % |
9/30/2018 | | | 12.32 | % | | $ | 583,463 | | | | 1.00 | % | | | n/a | | | | 0.03 | % | | | 44.27 | % |
9/30/2017 | | | 18.53 | % | | $ | 398,375 | | | | 1.03 | % | | | n/a | | | | (0.20 | )% | | | 34.13 | % |
9/30/2016 | | | 19.37 | % | | $ | 193,230 | | | | 1.08 | % | | | n/a | | | | (0.16 | )% | | | 34.62 | % |
9/30/2015(9) | | | (4.12 | )% | | $ | 54,172 | | | | 1.10 | % | | | 1.46 | % | | | 0.24 | % | | | 55.53 | % |
Institutional Shares | | | | | | | | | | | | | | | | | | | | | | | | |
9/30/2019 | | | 5.11 | % | | $ | 1,726,115 | | | | 0.91 | % | | | n/a | | | | 0.23 | % | | | 48.64 | % |
9/30/2018 | | | 12.48 | % | | $ | 1,645,152 | | | | 0.91 | % | | | n/a | | | | 0.11 | % | | | 44.27 | % |
9/30/2017 | | | 18.60 | % | | $ | 1,330,754 | | | | 0.93 | % | | | n/a | | | | (0.11 | )% | | | 34.13 | % |
9/30/2016 | | | 19.60 | % | | $ | 862,330 | | | | 0.92 | % | | | n/a | | | | (0.07 | )% | | | 34.62 | % |
9/30/2015 | | | (0.23 | )% | | $ | 631,904 | | | | 0.95 | % | | | n/a | | | | 0.36 | % | | | 55.53 | % |
| GLOBAL VALUE FUND | | | | | | | | | | | | | | | | | | | | | | | | |
Investor Shares | | | | | | | | | | | | | | | | | | | | | | | | |
9/30/2019 | | | (0.50 | )% | | $ | 506,067 | | | | 1.25 | % | | | n/a | | | | 1.25 | % | | | 31.18 | % |
9/30/2018 | | | 4.16 | % | | $ | 724,848 | | | | 1.25 | % | | | n/a | | | | 1.00 | % | | | 27.98 | % |
9/30/2017 | | | 19.95 | % | | $ | 811,771 | | | | 1.25 | % | | | n/a | | | | 0.59 | % | | | 12.67 | % |
9/30/2016 | | | 11.86 | % | | $ | 748,254 | | | | 1.26 | % | | | n/a | | | | 0.70 | % | | | 20.52 | % |
9/30/2015 | | | (4.32 | )% | | $ | 826,965 | | | | 1.28 | % | | | n/a | | | | 0.46 | % | | | 19.41 | % |
Advisor Shares | | | | | | | | | | | | | | | | | | | | | | | | |
9/30/2019 | | | (0.40 | )% | | $ | 599,418 | | | | 1.10 | % | | | n/a | | | | 1.38 | % | | | 31.18 | % |
9/30/2018 | | | 4.27 | % | | $ | 851,738 | | | | 1.10 | % | | | n/a | | | | 1.14 | % | | | 27.98 | % |
9/30/2017 | | | 20.16 | % | | $ | 796,869 | | | | 1.10 | % | | | n/a | | | | 0.78 | % | | | 12.67 | % |
9/30/2016 | | | 12.00 | % | | $ | 403,036 | | | | 1.14 | % | | | n/a | | | | 0.88 | % | | | 20.52 | % |
9/30/2015(9) | | | (7.18 | )% | | $ | 185,741 | | | | 1.20 | % | | | 1.23 | % | | | 0.70 | % | | | 19.41 | % |
Institutional Shares | | | | | | | | | | | | | | | | | | | | | | | | |
9/30/2019 | | | (0.30 | )% | | $ | 1,970,393 | | | | 1.01 | % | | | n/a | | | | 1.54 | % | | | 31.18 | % |
9/30/2018 | | | 4.40 | % | | $ | 2,143,564 | | | | 1.01 | % | | | n/a | | | | 1.31 | % | | | 27.98 | % |
9/30/2017 | | | 20.23 | % | | $ | 1,471,466 | | | | 1.02 | % | | | n/a | | | | 0.84 | % | | | 12.67 | % |
9/30/2016 | | | 12.18 | % | | $ | 917,977 | | | | 1.03 | % | | | n/a | | | | 0.97 | % | | | 20.52 | % |
9/30/2015 | | | (4.16 | )% | | $ | 512,600 | | | | 1.03 | % | | | n/a | | | | 0.73 | % | | | 19.41 | % |
Footnotes are presented on Pages 101-102.
The accompanying notes are an integral part of the financial statements.
| | |
| Artisan Partners Funds | | 91 |
ARTISAN PARTNERS FUNDS
Financial Highlights – For a share outstanding throughout each period
| | | | | | | | | | | | | | | | | | | | | | | | | | | | | | | | |
| | | | | | | | | | | | | | | Less Distributions From | | | | |
| | | Net
Asset
Value,
Beginning
of Period | | | Net
Investment
Income (Loss)(1) | | | Net Realized
and Unrealized
Gain (Loss) on
Investments | | | Total
from
Operations | | | Net
Investment
Income | | | Net
Realized
Gains | | | Total
Distributions | | | Net
Asset
Value,
End of
Period | |
| HIGH INCOME FUND | |
Investor Shares | | | | | | | | | | | | | | | | | | | | | | | | | | | | | | | | |
9/30/2019 | | $ | 9.87 | | | | 0.61 | | | | (0.17 | ) | | | 0.44 | | | | (0.60 | ) | | | (0.05 | ) | | | (0.65 | ) | | $ | 9.66 | |
9/30/2018 | | $ | 10.20 | | | | 0.58 | | | | (0.13 | ) | | | 0.45 | | | | (0.58 | ) | | | (0.20 | ) | | | (0.78 | ) | | $ | 9.87 | |
9/30/2017 | | $ | 9.85 | | | | 0.59 | | | | 0.37 | | | | 0.96 | | | | (0.59 | ) | | | (0.02 | ) | | | (0.61 | ) | | $ | 10.20 | |
9/30/2016 | | $ | 9.49 | | | | 0.63 | | | | 0.40 | | | | 1.03 | | | | (0.63 | ) | | | (0.04 | ) | | | (0.67 | ) | | $ | 9.85 | |
9/30/2015 | | $ | 9.97 | | | | 0.61 | | | | (0.44 | ) | | | 0.17 | | | | (0.61 | ) | | | (0.04 | ) | | | (0.65 | ) | | $ | 9.49 | |
Advisor Shares | | | | | | | | | | | | | | | | | | | | | | | | | | | | | | | | |
9/30/2019 | | $ | 9.87 | | | | 0.63 | | | | (0.17 | ) | | | 0.46 | | | | (0.62 | ) | | | (0.05 | ) | | | (0.67 | ) | | $ | 9.66 | |
9/30/2018 | | $ | 10.20 | | | | 0.60 | | | | (0.13 | ) | | | 0.47 | | | | (0.60 | ) | | | (0.20 | ) | | | (0.80 | ) | | $ | 9.87 | |
9/30/2017 | | $ | 9.85 | | | | 0.60 | | | | 0.38 | | | | 0.98 | | | | (0.61 | ) | | | (0.02 | ) | | | (0.63 | ) | | $ | 10.20 | |
9/30/2016 | | $ | 9.49 | | | | 0.64 | | | | 0.41 | | | | 1.05 | | | | (0.65 | ) | | | (0.04 | ) | | | (0.69 | ) | | $ | 9.85 | |
9/30/2015 | | $ | 9.97 | | | | 0.63 | | | | (0.44 | ) | | | 0.19 | | | | (0.63 | ) | | | (0.04 | ) | | | (0.67 | ) | | $ | 9.49 | |
Institutional Shares | | | | | | | | | | | | | | | | | | | | | | | | | | | | | | | | |
9/30/2019 | | $ | 9.87 | | | | 0.64 | | | | (0.17 | ) | | | 0.47 | | | | (0.63 | ) | | | (0.05 | ) | | | (0.68 | ) | | $ | 9.66 | |
9/30/2018 | | $ | 10.19 | | | | 0.61 | | | | (0.12 | ) | | | 0.49 | | | | (0.61 | ) | | | (0.20 | ) | | | (0.81 | ) | | $ | 9.87 | |
9/30/2017(10) | | $ | 9.85 | | | | 0.59 | | | | 0.36 | | | | 0.95 | | | | (0.59 | ) | | | (0.02 | ) | | | (0.61 | ) | | $ | 10.19 | |
| INTERNATIONAL FUND | |
Investor Shares | | | | | | | | | | | | | | | | | | | | | | | | | | | | | | | | |
9/30/2019 | | $ | 33.49 | | | | 0.29 | | | | 1.38 | | | | 1.67 | | | | (0.37 | ) | | | (2.27 | ) | | | (2.64 | ) | | $ | 32.52 | |
9/30/2018 | | $ | 32.28 | | | | 0.35 | | | | 1.08 | | | | 1.43 | | | | (0.22 | ) | | | — | | | | (0.22 | ) | | $ | 33.49 | |
9/30/2017 | | $ | 28.30 | | | | 0.20 | | | | 4.08 | | | | 4.28 | | | | (0.30 | ) | | | — | | | | (0.30 | ) | | $ | 32.28 | |
9/30/2016 | | $ | 26.97 | | | | 0.27 | | | | 1.19 | | | | 1.46 | | | | (0.13 | ) | | | — | | | | (0.13 | ) | | $ | 28.30 | |
9/30/2015 | | $ | 30.04 | | | | 0.17 | | | | (3.01 | ) | | | (2.84 | ) | | | (0.23 | ) | | | — | | | | (0.23 | ) | | $ | 26.97 | |
Advisor Shares | | | | | | | | | | | | | | | | | | | | | | | | | | | | | | | | |
9/30/2019 | | $ | 33.45 | | | | 0.34 | | | | 1.37 | | | | 1.71 | | | | (0.43 | ) | | | (2.27 | ) | | | (2.70 | ) | | $ | 32.46 | |
9/30/2018 | | $ | 32.25 | | | | 0.43 | | | | 1.05 | | | | 1.48 | | | | (0.28 | ) | | | — | | | | (0.28 | ) | | $ | 33.45 | |
9/30/2017 | | $ | 28.31 | | | | 0.23 | | | | 4.08 | | | | 4.31 | | | | (0.37 | ) | | | — | | | | (0.37 | ) | | $ | 32.25 | |
9/30/2016 | | $ | 27.00 | | | | 0.34 | | | | 1.17 | | | | 1.51 | | | | (0.20 | ) | | | — | | | | (0.20 | ) | | $ | 28.31 | |
9/30/2015(9) | | $ | 31.25 | | | | 0.07 | | | | (4.32 | ) | | | (4.25 | ) | | | — | | | | — | | | | — | | | $ | 27.00 | |
Institutional Shares | | | | | | | | | | | | | | | | | | | | | | | | | | | | | | | | |
9/30/2019 | | $ | 33.71 | | | | 0.35 | | | | 1.39 | | | | 1.74 | | | | (0.46 | ) | | | (2.27 | ) | | | (2.73 | ) | | $ | 32.72 | |
9/30/2018 | | $ | 32.50 | | | | 0.46 | | | | 1.05 | | | | 1.51 | | | | (0.30 | ) | | | — | | | | (0.30 | ) | | $ | 33.71 | |
9/30/2017 | | $ | 28.51 | | | | 0.30 | | | | 4.08 | | | | 4.38 | | | | (0.39 | ) | | | — | | | | (0.39 | ) | | $ | 32.50 | |
9/30/2016 | | $ | 27.19 | | | | 0.36 | | | | 1.17 | | | | 1.53 | | | | (0.21 | ) | | | — | | | | (0.21 | ) | | $ | 28.51 | |
9/30/2015 | | $ | 30.27 | | | | 0.21 | | | | (3.00 | ) | | | (2.79 | ) | | | (0.29 | ) | | | — | | | | (0.29 | ) | | $ | 27.19 | |
Footnotes are presented on Pages 101-102.
The accompanying notes are an integral part of the financial statements.
| | |
| 92 | | Artisan Partners Funds |
ARTISAN PARTNERS FUNDS
Financial Highlights – continued
| | | | | | | | | | | | | | | | | | | | | | | | |
| | | | | | |
| | | Total
Return(2) | | | Net Assets,
End of
Period
(000) | | | Ratio of
Expenses
to Average
Net Assets(3)(4) | | | Ratio of
Expenses
to Average
Net Assets
Excluding
Waivers(3) | | | Ratio
of Net
Investment
Income (Loss)
to Average
Net Assets(3)(4) | | | Portfolio
Turnover
Rate(2) | |
| HIGH INCOME FUND | |
Investor Shares | | | | | | | | | | | | | | | | | | | | | | | | |
9/30/2019 | | | 4.81 | % | | $ | 873,574 | | | | 0.98 | % | | | n/a | | | | 6.41 | % | | | 74.82 | % |
9/30/2018 | | | 4.66 | % | | $ | 986,645 | | | | 0.99 | % | | | n/a | | | | 5.88 | % | | | 79.10 | % |
9/30/2017 | | | 10.07 | % | | $ | 632,387 | | | | 1.00 | % | | | n/a | | | | 5.88 | % | | | 92.44 | % |
9/30/2016 | | | 11.40 | % | | $ | 544,969 | | | | 1.03 | % | | | n/a | | | | 6.66 | % | | | 69.41 | % |
9/30/2015 | | | 1.73 | % | | $ | 424,685 | | | | 1.09 | % | | | n/a | | | | 6.20 | % | | | 91.33 | % |
Advisor Shares | | | | | | | | | | | | | | | | | | | | | | | | |
9/30/2019 | | | 4.98 | % | | $ | 2,194,146 | | | | 0.82 | % | | | n/a | | | | 6.56 | % | | | 74.82 | % |
9/30/2018 | | | 4.83 | % | | $ | 1,970,272 | | | | 0.82 | % | | | n/a | | | | 6.03 | % | | | 79.10 | % |
9/30/2017 | | | 10.27 | % | | $ | 1,548,786 | | | | 0.82 | % | | | n/a | | | | 6.04 | % | | | 92.44 | % |
9/30/2016 | | | 11.61 | % | | $ | 1,244,032 | | | | 0.84 | % | | | n/a | | | | 6.81 | % | | | 69.41 | % |
9/30/2015 | | | 1.88 | % | | $ | 489,374 | | | | 0.93 | % | | | n/a | | | | 6.38 | % | | | 91.33 | % |
Institutional Shares | | | | | | | | | | | | | | | | | | | | | | | | |
9/30/2019 | | | 5.08 | % | | $ | 720,592 | | | | 0.73 | % | | | n/a | | | | 6.64 | % | | | 74.82 | % |
9/30/2018 | | | 5.02 | % | | $ | 289,036 | | | | 0.74 | % | | | n/a | | | | 6.13 | % | | | 79.10 | % |
9/30/2017(10) | | | 9.94 | % | | $ | 262,369 | | | | 0.78 | % | | | n/a | | | | 5.94 | % | | | 92.44 | % |
| INTERNATIONAL FUND | |
Investor Shares | | | | | | | | | | | | | | | | | | | | | | | | |
9/30/2019 | | | 6.29 | % | | $ | 3,903,758 | | | | 1.19 | % | | | n/a | | | | 0.95 | % | | | 41.01 | % |
9/30/2018 | | | 4.45 | % | | $ | 4,733,866 | | | | 1.18 | % | | | n/a | | | | 1.06 | % | | | 55.16 | % |
9/30/2017 | | | 15.39 | % | | $ | 5,808,005 | | | | 1.18 | % | | | n/a | | | | 0.70 | % | | | 57.60 | % |
9/30/2016 | | | 5.39 | % | | $ | 7,930,361 | | | | 1.19 | % | | | n/a | | | | 0.98 | % | | | 64.65 | % |
9/30/2015 | | | (9.55 | )% | | $ | 10,156,292 | | | | 1.17 | % | | | n/a | | | | 0.54 | % | | | 45.02 | % |
Advisor Shares | | | | | | | | | | | | | | | | | | | | | | | | |
9/30/2019 | | | 6.46 | % | | $ | 2,141,985 | | | | 1.04 | % | | | n/a | | | | 1.11 | % | | | 41.01 | % |
9/30/2018 | | | 4.58 | % | | $ | 2,367,026 | | | | 1.04 | % | | | n/a | | | | 1.29 | % | | | 55.16 | % |
9/30/2017 | | | 15.56 | % | | $ | 2,357,528 | | | | 1.04 | % | | | n/a | | | | 0.82 | % | | | 57.60 | % |
9/30/2016 | | | 5.58 | % | | $ | 2,782,189 | | | | 1.01 | % | | | n/a | | | | 1.23 | % | | | 64.65 | % |
9/30/2015(9) | | | (13.60 | )% | | $ | 2,465,135 | | | | 1.07 | % | | | 1.07 | % | | | 0.47 | % | | | 45.02 | % |
Institutional Shares | | | | | | | | | | | | | | | | | | | | | | | | |
9/30/2019 | | | 6.52 | % | | $ | 4,513,365 | | | | 0.96 | % | | | n/a | | | | 1.15 | % | | | 41.01 | % |
9/30/2018 | | | 4.67 | % | | $ | 5,815,955 | | | | 0.95 | % | | | n/a | | | | 1.36 | % | | | 55.16 | % |
9/30/2017 | | | 15.66 | % | | $ | 5,868,894 | | | | 0.96 | % | | | n/a | | | | 1.05 | % | | | 57.60 | % |
9/30/2016 | | | 5.64 | % | | $ | 5,272,925 | | | | 0.95 | % | | | n/a | | | | 1.27 | % | | | 64.65 | % |
9/30/2015 | | | (9.34 | )% | | $ | 4,973,656 | | | | 0.95 | % | | | n/a | | | | 0.70 | % | | | 45.02 | % |
Footnotes are presented on Pages 101-102.
The accompanying notes are an integral part of the financial statements.
| | |
| Artisan Partners Funds | | 93 |
ARTISAN PARTNERS FUNDS
Financial Highlights – For a share outstanding throughout each period
| | | | | | | | | | | | | | | | | | | | | | | | | | | | | | | | |
| | | | | | | | | | | | | | | Less Distributions From | | | | |
| | | Net
Asset
Value,
Beginning
of Period | | | Net
Investment
Income (Loss)(1) | | | Net Realized
and Unrealized
Gain (Loss) on
Investments | | | Total
from
Operations | | | Net
Investment
Income | | | Net
Realized
Gains | | | Total
Distributions | | | Net
Asset
Value,
End of
Period | |
| INTERNATIONALSMALL-MID FUND | |
Investor Shares | |
9/30/2019 | | $ | 23.47 | | | | (0.03 | ) | | | (1.56 | ) | | | (1.59 | ) | | | — | | | | (8.27 | ) | | | (8.27 | ) | | $ | 13.61 | |
9/30/2018 | | $ | 24.69 | | | | (0.10 | ) | | | 2.05 | | | | 1.95 | | | | — | | | | (3.17 | ) | | | (3.17 | ) | | $ | 23.47 | |
9/30/2017 | | $ | 23.17 | | | | (0.03 | ) | | | 2.75 | | | | 2.72 | | | | — | | | | (1.20 | ) | | | (1.20 | ) | | $ | 24.69 | |
9/30/2016 | | $ | 23.37 | | | | (0.02 | ) | | | 0.63 | | | | 0.61 | | | | (0.03 | ) | | | (0.78 | ) | | | (0.81 | ) | | $ | 23.17 | |
9/30/2015 | | $ | 24.30 | | | | 0.03 | | | | 0.42 | | | | 0.45 | | | | — | | | | (1.38 | ) | | | (1.38 | ) | | $ | 23.37 | |
Advisor Shares | |
9/30/2019(11) | | $ | 11.91 | | | | 0.01 | | | | 1.70 | | | | 1.71 | | | | — | | | | — | | | | — | | | $ | 13.62 | |
Institutional Shares | |
9/30/2019 | | $ | 23.59 | | | | 0.03 | | | | (1.59 | ) | | | (1.56 | ) | | | — | | | | (8.27 | ) | | | (8.27 | ) | | $ | 13.76 | |
9/30/2018 | | $ | 24.75 | | | | (0.04 | ) | | | 2.05 | | | | 2.01 | | | | — | | | | (3.17 | ) | | | (3.17 | ) | | $ | 23.59 | |
9/30/2017 | | $ | 23.18 | | | | 0.06 | | | | 2.71 | | | | 2.77 | | | | — | | | | (1.20 | ) | | | (1.20 | ) | | $ | 24.75 | |
9/30/2016(12) | | $ | 22.54 | | | | 0.04 | | | | 0.60 | | | | 0.64 | | | | — | | | | — | | | | — | | | $ | 23.18 | |
| INTERNATIONAL VALUE FUND | |
Investor Shares | |
9/30/2019 | | $ | 36.85 | | | | 0.61 | | | | (0.64 | ) | | | (0.03 | ) | | | (0.65 | ) | | | (1.30 | ) | | | (1.95 | ) | | $ | 34.87 | |
9/30/2018 | | $ | 39.08 | | | | 0.42 | | | | (1.14 | ) | | | (0.72 | ) | | | (0.41 | ) | | | (1.10 | ) | | | (1.51 | ) | | $ | 36.85 | |
9/30/2017 | | $ | 33.55 | | | | 0.27 | | | | 6.27 | | | | 6.54 | | | | (0.26 | ) | | | (0.75 | ) | | | (1.01 | ) | | $ | 39.08 | |
9/30/2016 | | $ | 32.62 | | | | 0.32 | | | | 2.57 | | | | 2.89 | | | | (0.28 | ) | | | (1.68 | ) | | | (1.96 | ) | | $ | 33.55 | |
9/30/2015 | | $ | 36.56 | | | | 0.21 | | | | (1.79 | ) | | | (1.58 | ) | | | (0.55 | ) | | | (1.81 | ) | | | (2.36 | ) | | $ | 32.62 | |
Advisor Shares | |
9/30/2019 | | $ | 36.85 | | | | 0.65 | | | | (0.63 | ) | | | 0.02 | | | | (0.76 | ) | | | (1.30 | ) | | | (2.06 | ) | | $ | 34.81 | |
9/30/2018 | | $ | 39.11 | | | | 0.48 | | | | (1.16 | ) | | | (0.68 | ) | | | (0.48 | ) | | | (1.10 | ) | | | (1.58 | ) | | $ | 36.85 | |
9/30/2017 | | $ | 33.57 | | | | 0.33 | | | | 6.27 | | | | 6.60 | | | | (0.31 | ) | | | (0.75 | ) | | | (1.06 | ) | | $ | 39.11 | |
9/30/2016 | | $ | 32.66 | | | | 0.39 | | | | 2.54 | | | | 2.93 | | | | (0.34 | ) | | | (1.68 | ) | | | (2.02 | ) | | $ | 33.57 | |
9/30/2015(9) | | $ | 35.54 | | | | 0.15 | | | | (3.03 | ) | | | (2.88 | ) | | | — | | | | — | | | | — | | | $ | 32.66 | |
Institutional Shares | |
9/30/2019 | | $ | 37.02 | | | | 0.69 | | | | (0.64 | ) | | | 0.05 | | | | (0.81 | ) | | | (1.30 | ) | | | (2.11 | ) | | $ | 34.96 | |
9/30/2018 | | $ | 39.28 | | | | 0.53 | | | | (1.18 | ) | | | (0.65 | ) | | | (0.51 | ) | | | (1.10 | ) | | | (1.61 | ) | | $ | 37.02 | |
9/30/2017 | | $ | 33.71 | | | | 0.42 | | | | 6.23 | | | | 6.65 | | | | (0.33 | ) | | | (0.75 | ) | | | (1.08 | ) | | $ | 39.28 | |
9/30/2016 | | $ | 32.77 | | | | 0.40 | | | | 2.57 | | | | 2.97 | | | | (0.35 | ) | | | (1.68 | ) | | | (2.03 | ) | | $ | 33.71 | |
9/30/2015 | | $ | 36.71 | | | | 0.30 | | | | (1.81 | ) | | | (1.51 | ) | | | (0.62 | ) | | | (1.81 | ) | | | (2.43 | ) | | $ | 32.77 | |
Footnotes are presented on Pages 101-102.
The accompanying notes are an integral part of the financial statements.
| | |
| 94 | | Artisan Partners Funds |
ARTISAN PARTNERS FUNDS
Financial Highlights – continued
| | | | | | | | | | | | | | | | | | | | | | | | |
| | | | | | |
| | | Total
Return(2) | | | Net Assets,
End of
Period
(000) | | | Ratio of
Expenses
to Average
Net Assets(3)(4) | | | Ratio of
Expenses
to Average
Net Assets
Excluding
Waivers(3) | | | Ratio
of Net
Investment
Income (Loss)
to Average
Net Assets(3)(4) | | | Portfolio
Turnover
Rate(2) | |
| INTERNATIONALSMALL-MID FUND | |
Investor Shares | |
9/30/2019 | | | (1.38 | )% | | $ | 177,807 | | | | 1.43 | % | | | n/a | | | | (0.24 | )% | | | 55.98 | % |
9/30/2018 | | | 8.70 | % | | $ | 228,317 | | | | 1.55 | % | | | n/a | | | | (0.44 | )% | | | 59.53 | % |
9/30/2017 | | | 13.09 | % | | $ | 307,580 | | | | 1.57 | % | | | n/a | | | | (0.16 | )% | | | 79.09 | % |
9/30/2016 | | | 2.50 | % | | $ | 585,000 | | | | 1.51 | % | | | n/a | | | | (0.07 | )% | | | 69.82 | % |
9/30/2015 | | | 2.02 | % | | $ | 961,035 | | | | 1.52 | % | | | n/a | | | | 0.13 | % | | | 43.84 | % |
Advisor Shares | | | | | | | | | | | | | | | | | | | | | | | | |
9/30/2019(11) | | | 14.36 | % | | $ | 434,784 | | | | 1.25 | % | | | n/a | | | | 0.13 | % | | | 55.98 | % |
Institutional Shares | |
9/30/2019 | | | (1.18 | )% | | $ | 608,417 | | | | 1.16 | % | | | n/a | | | | 0.20 | % | | | 55.98 | % |
9/30/2018 | | | 8.94 | % | | $ | 175,808 | | | | 1.35 | % | | | n/a | | | | (0.17 | )% | | | 59.53 | % |
9/30/2017 | | | 13.31 | % | | $ | 255,353 | | | | 1.37 | % | | | n/a | | | | 0.29 | % | | | 79.09 | % |
9/30/2016(12) | | | 2.84 | % | | $ | 209,536 | | | | 1.37 | % | | | n/a | | | | 0.41 | % | | | 69.82 | % |
| INTERNATIONAL VALUE FUND | |
Investor Shares | |
9/30/2019 | | | 0.38 | % | | $ | 2,761,826 | | | | 1.19 | % | | | n/a | | | | 1.80 | % | | | 23.69 | % |
9/30/2018 | | | (1.99 | )% | | $ | 3,371,735 | | | | 1.18 | % | | | n/a | | | | 1.11 | % | | | 21.55 | % |
9/30/2017 | | | 20.19 | % | | $ | 4,350,119 | | | | 1.19 | % | | | n/a | | | | 0.78 | % | | | 11.67 | % |
9/30/2016 | | | 9.02 | % | | $ | 5,500,119 | | | | 1.18 | % | | | n/a | | | | 0.98 | % | | | 17.79 | % |
9/30/2015 | | | (4.67 | )% | | $ | 5,229,869 | | | | 1.17 | % | | | n/a | | | | 0.60 | % | | | 23.74 | % |
Advisor Shares | |
9/30/2019 | | | 0.52 | % | | $ | 4,336,510 | | | | 1.05 | % | | | n/a | | | | 1.93 | % | | | 23.69 | % |
9/30/2018 | | | (1.87 | )% | | $ | 4,683,702 | | | | 1.04 | % | | | n/a | | | | 1.27 | % | | | 21.55 | % |
9/30/2017 | | | 20.41 | % | | $ | 4,323,659 | | | | 1.04 | % | | | n/a | | | | 0.93 | % | | | 11.67 | % |
9/30/2016 | | | 9.17 | % | | $ | 3,537,587 | | | | 1.02 | % | | | n/a | | | | 1.21 | % | | | 17.79 | % |
9/30/2015(9) | | | (8.10 | )% | | $ | 2,782,652 | | | | 1.06 | % | | | 1.07 | % | | | 0.87 | % | | | 23.74 | % |
Institutional Shares | |
9/30/2019 | | | 0.63 | % | | $ | 7,169,774 | | | | 0.95 | % | | | n/a | | | | 2.03 | % | | | 23.69 | % |
9/30/2018 | | | (1.79 | )% | | $ | 7,295,259 | | | | 0.95 | % | | | n/a | | | | 1.41 | % | | | 21.55 | % |
9/30/2017 | | | 20.48 | % | | $ | 6,282,134 | | | | 0.97 | % | | | n/a | | | | 1.18 | % | | | 11.67 | % |
9/30/2016 | | | 9.27 | % | | $ | 3,038,159 | | | | 0.96 | % | | | n/a | | | | 1.26 | % | | | 17.79 | % |
9/30/2015 | | | (4.44 | )% | | $ | 2,606,468 | | | | 0.96 | % | | | n/a | | | | 0.86 | % | | | 23.74 | % |
Footnotes are presented on Pages 101-102.
The accompanying notes are an integral part of the financial statements.
| | |
| Artisan Partners Funds | | 95 |
ARTISAN PARTNERS FUNDS
Financial Highlights – For a share outstanding throughout each period
| | | | | | | | | | | | | | | | | | | | | | | | | | | | | | | | |
| | | | | | | | | | | | | | | Less Distributions From | | | | |
| | | Net
Asset
Value,
Beginning
of Period | | | Net
Investment
Income (Loss)(1) | | | Net Realized
and Unrealized
Gain (Loss) on
Investments | | | Total
from
Operations | | | Net
Investment
Income | | | Net
Realized
Gains | | | Total
Distributions | | | Net
Asset
Value,
End of
Period | |
| MID CAP FUND | |
Investor Shares | |
9/30/2019 | | $ | 44.83 | | | | (0.23 | ) | | | 0.53 | | | | 0.30 | | | | — | | | | (7.97 | ) | | | (7.97 | ) | | $ | 37.16 | |
9/30/2018 | | $ | 42.58 | | | | (0.26 | ) | | | 8.21 | | | | 7.95 | | | | — | | | | (5.70 | ) | | | (5.70 | ) | | $ | 44.83 | |
9/30/2017 | | $ | 41.34 | | | | (0.27 | ) | | | 4.85 | | | | 4.58 | | | | — | | | | (3.34 | ) | | | (3.34 | ) | | $ | 42.58 | |
9/30/2016 | | $ | 44.42 | | | | (0.30 | ) | | | 3.78 | | | | 3.48 | | | | — | | | | (6.56 | ) | | | (6.56 | ) | | $ | 41.34 | |
9/30/2015 | | $ | 47.67 | | | | (0.36 | ) | | | 1.99 | | | | 1.63 | | | | — | | | | (4.88 | ) | | | (4.88 | ) | | $ | 44.42 | |
Advisor Shares | |
9/30/2019 | | $ | 45.10 | | | | (0.17 | ) | | | 0.56 | | | | 0.39 | | | | — | | | | (7.97 | ) | | | (7.97 | ) | | $ | 37.52 | |
9/30/2018 | | $ | 42.75 | | | | (0.20 | ) | | | 8.25 | | | | 8.05 | | | | — | | | | (5.70 | ) | | | (5.70 | ) | | $ | 45.10 | |
9/30/2017 | | $ | 41.43 | | | | (0.22 | ) | | | 4.88 | | | | 4.66 | | | | — | | | | (3.34 | ) | | | (3.34 | ) | | $ | 42.75 | |
9/30/2016 | | $ | 44.46 | | | | (0.24 | ) | | | 3.77 | | | | 3.53 | | | | — | | | | (6.56 | ) | | | (6.56 | ) | | $ | 41.43 | |
9/30/2015(9) | | $ | 46.88 | | | | (0.17 | ) | | | (2.25 | ) | | | (2.42 | ) | | | — | | | | — | | | | — | | | $ | 44.46 | |
Institutional Shares | |
9/30/2019 | | $ | 48.89 | | | | (0.16 | ) | | | 0.78 | | | | 0.62 | | | | — | | | | (7.97 | ) | | | (7.97 | ) | | $ | 41.54 | |
9/30/2018 | | $ | 45.84 | | | | (0.18 | ) | | | 8.93 | | | | 8.75 | | | | — | | | | (5.70 | ) | | | (5.70 | ) | | $ | 48.89 | |
9/30/2017 | | $ | 44.15 | | | | (0.19 | ) | | | 5.22 | | | | 5.03 | | | | — | | | | (3.34 | ) | | | (3.34 | ) | | $ | 45.84 | |
9/30/2016 | | $ | 46.92 | | | | (0.22 | ) | | | 4.01 | | | | 3.79 | | | | — | | | | (6.56 | ) | | | (6.56 | ) | | $ | 44.15 | |
9/30/2015 | | $ | 49.98 | | | | (0.26 | ) | | | 2.08 | | | | 1.82 | | | | — | | | | (4.88 | ) | | | (4.88 | ) | | $ | 46.92 | |
| MID CAP VALUE FUND | |
Investor Shares | |
9/30/2019 | | $ | 23.56 | | | | 0.10 | | | | (0.90 | ) | | | (0.80 | ) | | | (0.05 | ) | | | (2.90 | ) | | | (2.95 | ) | | $ | 19.81 | |
9/30/2018 | | $ | 23.98 | | | | 0.02 | | | | 1.86 | | | | 1.88 | | | | (0.02 | ) | | | (2.28 | ) | | | (2.30 | ) | | $ | 23.56 | |
9/30/2017 | | $ | 21.41 | | | | 0.06 | | | | 3.11 | | | | 3.17 | | | | (0.16 | ) | | | (0.44 | ) | | | (0.60 | ) | | $ | 23.98 | |
9/30/2016 | | $ | 22.22 | | | | 0.12 | | | | 2.70 | | | | 2.82 | | | | (0.09 | ) | | | (3.54 | ) | | | (3.63 | ) | | $ | 21.41 | |
9/30/2015 | | $ | 27.00 | | | | 0.20 | | | | (2.21 | ) | | | (2.01 | ) | | | (0.17 | ) | | | (2.60 | ) | | | (2.77 | ) | | $ | 22.22 | |
Advisor Shares | |
9/30/2019 | | $ | 23.53 | | | | 0.13 | | | | (0.90 | ) | | | (0.77 | ) | | | (0.09 | ) | | | (2.90 | ) | | | (2.99 | ) | | $ | 19.77 | |
9/30/2018 | | $ | 23.94 | | | | 0.05 | | | | 1.85 | | | | 1.90 | | | | (0.03 | ) | | | (2.28 | ) | | | (2.31 | ) | | $ | 23.53 | |
9/30/2017 | | $ | 21.37 | | | | 0.09 | | | | 3.10 | | | | 3.19 | | | | (0.18 | ) | | | (0.44 | ) | | | (0.62 | ) | | $ | 23.94 | |
9/30/2016 | | $ | 22.23 | | | | 0.14 | | | | 2.70 | | | | 2.84 | | | | (0.16 | ) | | | (3.54 | ) | | | (3.70 | ) | | $ | 21.37 | |
9/30/2015(9) | | $ | 25.12 | | | | 0.12 | | | | (3.01 | ) | | | (2.89 | ) | | | — | | | | — | | | | — | | | $ | 22.23 | |
Institutional Shares | |
9/30/2019 | | $ | 23.56 | | | | 0.14 | | | | (0.89 | ) | | | (0.75 | ) | | | (0.11 | ) | | | (2.90 | ) | | | (3.01 | ) | | $ | 19.80 | |
9/30/2018 | | $ | 23.98 | | | | 0.07 | | | | 1.85 | | | | 1.92 | | | | (0.06 | ) | | | (2.28 | ) | | | (2.34 | ) | | $ | 23.56 | |
9/30/2017 | | $ | 21.40 | | | | 0.11 | | | | 3.11 | | | | 3.22 | | | | (0.20 | ) | | | (0.44 | ) | | | (0.64 | ) | | $ | 23.98 | |
9/30/2016 | | $ | 22.25 | | | | 0.16 | | | | 2.70 | | | | 2.86 | | | | (0.17 | ) | | | (3.54 | ) | | | (3.71 | ) | | $ | 21.40 | |
9/30/2015 | | $ | 27.05 | | | | 0.26 | | | | (2.22 | ) | | | (1.96 | ) | | | (0.24 | ) | | | (2.60 | ) | | | (2.84 | ) | | $ | 22.25 | |
Footnotes are presented on Pages 101-102.
The accompanying notes are an integral part of the financial statements.
| | |
| 96 | | Artisan Partners Funds |
ARTISAN PARTNERS FUNDS
Financial Highlights – continued
| | | | | | | | | | | | | | | | | | | | | | | | |
| | | | | | |
| | | Total
Return(2) | | | Net Assets,
End of
Period
(000) | | | Ratio of
Expenses
to Average
Net Assets(3)(4) | | | Ratio of
Expenses
to Average
Net Assets
Excluding
Waivers(3) | | | Ratio
of Net
Investment
Income (Loss)
to Average
Net Assets(3)(4) | | | Portfolio
Turnover
Rate(2) | |
| MID CAP FUND | | | | | | | | | | | | | | | | | | | | | | | | |
Investor Shares | | | | | | | | | | | | | | | | | | | | | | | | |
9/30/2019 | | | 5.11 | % | | $ | 1,599,647 | | | | 1.19 | % | | | n/a | | | | (0.63 | )% | | | 47.96 | % |
9/30/2018 | | | 21.12 | % | | $ | 2,003,621 | | | | 1.18 | % | | | n/a | | | | (0.62 | )% | | | 49.83 | % |
9/30/2017 | | | 12.19 | % | | $ | 2,277,750 | | | | 1.18 | % | | | n/a | | | | (0.68 | )% | | | 42.59 | % |
9/30/2016 | | | 8.08 | % | | $ | 3,232,399 | | | | 1.18 | % | | | n/a | | | | (0.75 | )% | | | 40.35 | % |
9/30/2015 | | | 3.20 | % | | $ | 3,909,986 | | | | 1.19 | % | | | n/a | | | | (0.76 | )% | | | 51.39 | % |
Advisor Shares | | | | | | | | | | | | | | | | | | | | | | | | |
9/30/2019 | | | 5.36 | % | | $ | 429,052 | | | | 1.04 | % | | | n/a | | | | (0.48 | )% | | | 47.96 | % |
9/30/2018 | | | 21.26 | % | | $ | 644,777 | | | | 1.04 | % | | | n/a | | | | (0.48 | )% | | | 49.83 | % |
9/30/2017 | | | 12.36 | % | | $ | 583,658 | | | | 1.05 | % | | | n/a | | | | (0.54 | )% | | | 42.59 | % |
9/30/2016 | | | 8.19 | % | | $ | 445,648 | | | | 1.05 | % | | | n/a | | | | (0.62 | )% | | | 40.35 | % |
9/30/2015(9) | | | (5.16 | )% | | $ | 431,658 | | | | 1.10 | % | | | 1.12 | % | | | (0.73 | )% | | | 51.39 | % |
Institutional Shares | | | | | | | | | | | | | | | | | | | | | | | | |
9/30/2019 | | | 5.41 | % | | $ | 3,029,773 | | | | 0.96 | % | | | n/a | | | | (0.41 | )% | | | 47.96 | % |
9/30/2018 | | | 21.37 | % | | $ | 3,516,293 | | | | 0.95 | % | | | n/a | | | | (0.39 | )% | | | 49.83 | % |
9/30/2017 | | | 12.45 | % | | $ | 4,119,181 | | | | 0.95 | % | | | n/a | | | | (0.45 | )% | | | 42.59 | % |
9/30/2016 | | | 8.33 | % | | $ | 4,389,242 | | | | 0.95 | % | | | n/a | | | | (0.52 | )% | | | 40.35 | % |
9/30/2015 | | | 3.45 | % | | $ | 4,482,164 | | | | 0.95 | % | | | n/a | | | | (0.53 | )% | | | 51.39 | % |
| MID CAP VALUE FUND | | | | | | | | | | | | | | | | | | | | | | | | |
Investor Shares | | | | | | | | | | | | | | | | | | | | | | | | |
9/30/2019 | | | (2.49 | )% | | $ | 842,896 | | | | 1.20 | % | | | n/a | | | | 0.52 | % | | | 19.18 | % |
9/30/2018 | | | 8.55 | % | | $ | 1,294,179 | | | | 1.19 | % | | | n/a | | | | 0.07 | % | | | 19.15 | % |
9/30/2017 | | | 15.08 | % | | $ | 1,957,786 | | | | 1.17 | % | | | n/a | | | | 0.25 | % | | | 23.92 | % |
9/30/2016 | | | 14.10 | % | | $ | 2,416,461 | | | | 1.16 | % | | | 1.16 | % | | | 0.59 | % | | | 26.62 | % |
9/30/2015 | | | (8.45 | )% | | $ | 4,345,131 | | | | 1.19 | % | | | n/a | | | | 0.81 | % | | | 31.18 | % |
Advisor Shares | | | | | | | | | | | | | | | | | | | | | | | | |
9/30/2019 | | | (2.32 | )% | | $ | 630,296 | | | | 1.06 | % | | | n/a | | | | 0.66 | % | | | 19.18 | % |
9/30/2018 | | | 8.68 | % | | $ | 951,667 | | | | 1.05 | % | | | n/a | | | | 0.24 | % | | | 19.15 | % |
9/30/2017 | | | 15.23 | % | | $ | 1,053,640 | | | | 1.06 | % | | | n/a | | | | 0.40 | % | | | 23.92 | % |
9/30/2016 | | | 14.22 | % | | $ | 1,025,855 | | | | 1.05 | % | | | 1.06 | % | | | 0.70 | % | | | 26.62 | % |
9/30/2015(9) | | | (11.50 | )% | | $ | 938,389 | | | | 1.09 | % | | | 1.11 | % | | | 1.00 | % | | | 31.18 | % |
Institutional Shares | | | | | | | | | | | | | | | | | | | | | | | | |
9/30/2019 | | | (2.22 | )% | | $ | 796,385 | | | | 0.98 | % | | | n/a | | | | 0.72 | % | | | 19.18 | % |
9/30/2018 | | | 8.75 | % | | $ | 1,058,092 | | | | 0.98 | % | | | n/a | | | | 0.30 | % | | | 19.15 | % |
9/30/2017 | | | 15.37 | % | | $ | 1,040,520 | | | | 0.97 | % | | | n/a | | | | 0.48 | % | | | 23.92 | % |
9/30/2016 | | | 14.29 | % | | $ | 741,286 | | | | 0.95 | % | | | 0.95 | % | | | 0.81 | % | | | 26.62 | % |
9/30/2015 | | | (8.25 | )% | | $ | 1,236,240 | | | | 0.96 | % | | | n/a | | | | 1.03 | % | | | 31.18 | % |
Footnotes are presented on Pages 101-102.
The accompanying notes are an integral part of the financial statements.
| | |
| Artisan Partners Funds | | 97 |
ARTISAN PARTNERS FUNDS
Financial Highlights – For a share outstanding throughout each period
| | | | | | | | | | | | | | | | | | | | | | | | | | | | | | | | |
| | | | | | | | | | | | | | | Less Distributions From | | | | |
| | | Net
Asset
Value,
Beginning
of Period | | | Net
Investment
Income (Loss)(1) | | | Net Realized
and Unrealized
Gain (Loss) on
Investments | | | Total
from
Operations | | | Net
Investment
Income | | | Net
Realized
Gains | | | Total
Distributions | | | Net
Asset
Value,
End of
Period | |
| SMALL CAP FUND | |
Investor Shares | |
9/30/2019 | | $ | 38.97 | | | | (0.29 | ) | | | (0.08 | ) | | | (0.37 | ) | | | — | | | | (5.43 | ) | | | (5.43 | ) | | $ | 33.17 | |
9/30/2018 | | $ | 33.61 | | | | (0.31 | ) | | | 10.64 | | | | 10.33 | | | | — | | | | (4.97 | ) | | | (4.97 | ) | | $ | 38.97 | |
9/30/2017 | | $ | 29.93 | | | | (0.29 | ) | | | 4.30 | | | | 4.01 | | | | — | | | | (0.33 | ) | | | (0.33 | ) | | $ | 33.61 | |
9/30/2016 | | $ | 28.55 | | | | (0.27 | ) | | | 4.36 | | | | 4.09 | | | | — | | | | (2.71 | ) | | | (2.71 | ) | | $ | 29.93 | |
9/30/2015 | | $ | 26.76 | | | | (0.30 | ) | | | 2.09 | | | | 1.79 | | | | — | | | | — | | | | — | | | $ | 28.55 | |
Advisor Shares | |
9/30/2019 | | $ | 39.05 | | | | (0.25 | ) | | | (0.07 | ) | | | (0.32 | ) | | | — | | | | (5.43 | ) | | | (5.43 | ) | | $ | 33.30 | |
9/30/2018 | | $ | 33.63 | | | | (0.26 | ) | | | 10.65 | | | | 10.39 | | | | — | | | | (4.97 | ) | | | (4.97 | ) | | $ | 39.05 | |
9/30/2017(13) | | $ | 29.23 | | | | (0.18 | ) | | | 4.58 | | | | 4.40 | | | | — | | | | — | | | | — | | | $ | 33.63 | |
Institutional Shares | |
9/30/2019 | | $ | 39.54 | | | | (0.23 | ) | | | (0.05 | ) | | | (0.28 | ) | | | — | | | | (5.43 | ) | | | (5.43 | ) | | $ | 33.83 | |
9/30/2018 | | $ | 33.98 | | | | (0.24 | ) | | | 10.77 | | | | 10.53 | | | | — | | | | (4.97 | ) | | | (4.97 | ) | | $ | 39.54 | |
9/30/2017 | | $ | 30.19 | | | | (0.23 | ) | | | 4.35 | | | | 4.12 | | | | — | | | | (0.33 | ) | | | (0.33 | ) | | $ | 33.98 | |
9/30/2016 | | $ | 28.72 | | | | (0.20 | ) | | | 4.38 | | | | 4.18 | | | | — | | | | (2.71 | ) | | | (2.71 | ) | | $ | 30.19 | |
9/30/2015 | | $ | 26.85 | | | | (0.24 | ) | | | 2.11 | | | | 1.87 | | | | — | | | | — | | | | — | | | $ | 28.72 | |
| SUSTAINABLE EMERGING MARKETS FUND | |
Investor Shares | |
9/30/2019 | | $ | 15.08 | | | | 0.18 | | | | 0.10 | | | | 0.28 | | | | (0.14 | ) | | | — | | | | (0.14 | ) | | $ | 15.22 | |
9/30/2018 | | $ | 15.58 | | | | 0.15 | | | | (0.56 | ) | | | (0.41 | ) | | | (0.09 | ) | | | — | | | | (0.09 | ) | | $ | 15.08 | |
9/30/2017 | | $ | 12.75 | | | | 0.08 | | | | 2.87 | | | | 2.95 | | | | (0.12 | ) | | | — | | | | (0.12 | ) | | $ | 15.58 | |
9/30/2016(14) | | $ | 9.90 | | | | 0.19 | | | | 2.66 | | | | 2.85 | | | | — | | | | — | | | | — | | | $ | 12.75 | |
9/30/2015 | | $ | 12.54 | | | | 0.02 | | | | (2.56 | ) | | | (2.54 | ) | | | (0.10 | ) | | | — | | | | (0.10 | ) | | $ | 9.90 | |
Institutional Shares | |
9/30/2019 | | $ | 15.03 | | | | 0.20 | | | | 0.10 | | | | 0.30 | | | | (0.08 | ) | | | — | | | | (0.08 | ) | | $ | 15.25 | |
9/30/2018 | | $ | 15.50 | | | | 0.14 | | | | (0.53 | ) | | | (0.39 | ) | | | (0.08 | ) | | | — | | | | (0.08 | ) | | $ | 15.03 | |
9/30/2017 | | $ | 12.65 | | | | 0.08 | | | | 2.86 | | | | 2.94 | | | | (0.09 | ) | | | — | | | | (0.09 | ) | | $ | 15.50 | |
9/30/2016(14) | | $ | 9.83 | | | | 0.03 | | | | 2.79 | | | | 2.82 | | | | — | | | | — | | | | — | | | $ | 12.65 | |
9/30/2015 | | $ | 12.52 | | | | 0.02 | | | | (2.53 | ) | | | (2.51 | ) | | | (0.18 | ) | | | — | | | | (0.18 | ) | | $ | 9.83 | |
Footnotes are presented on Pages 101-102.
The accompanying notes are an integral part of the financial statements.
| | |
| 98 | | Artisan Partners Funds |
ARTISAN PARTNERS FUNDS
Financial Highlights – continued
| | | | | | | | | | | | | | | | | | | | | | | | |
| | | | | | |
| | | Total
Return(2) | | | Net Assets,
End of
Period
(000) | | | Ratio of
Expenses
to Average
Net Assets(3)(4) | | | Ratio of
Expenses
to Average
Net Assets
Excluding
Waivers(3) | | | Ratio
of Net
Investment
Income (Loss)
to Average
Net Assets(3)(4) | | | Portfolio
Turnover
Rate(2) | |
| SMALL CAP FUND | | | | | | | | | | | | | | | | | | | | | | | | |
Investor Shares | | | | | | | | | | | | | | | | | | | | | | | | |
9/30/2019 | | | 2.02 | % | | $ | 611,745 | | | | 1.20 | % | | | n/a | | | | (0.88 | )% | | | 47.32 | % |
9/30/2018 | | | 34.71 | % | | $ | 495,803 | | | | 1.20 | % | | | n/a | | | | (0.90 | )% | | | 43.85 | % |
9/30/2017 | | | 13.56 | % | | $ | 461,398 | | | | 1.21 | % | | | n/a | | | | (0.96 | )% | | | 35.37 | % |
9/30/2016 | | | 15.27 | % | | $ | 764,298 | | | | 1.25 | % | | | n/a | | | | (1.00 | )% | | | 27.00 | % |
9/30/2015 | | | 6.69 | % | | $ | 863,536 | | | | 1.23 | % | | | n/a | | | | (1.01 | )% | | | 45.31 | % |
Advisor Shares | | | | | | | | | | | | | | | | | | | | | | | | |
9/30/2019 | | | 2.16 | % | | $ | 589,147 | | | | 1.08 | % | | | n/a | | | | (0.77 | )% | | | 47.32 | % |
9/30/2018 | | | 34.89 | % | | $ | 495,650 | | | | 1.06 | % | | | n/a | | | | (0.75 | )% | | | 43.85 | % |
9/30/2017(13) | | | 15.05 | % | | $ | 324,762 | | | | 1.12 | % | | | n/a | | | | (0.86 | )% | | | 35.37 | % |
Institutional Shares | | | | | | | | | | | | | | | | | | | | | | | | |
9/30/2019 | | | 2.25 | % | | $ | 636,076 | | | | 0.99 | % | | | n/a | | | | (0.69 | )% | | | 47.32 | % |
9/30/2018 | | | 34.94 | % | | $ | 814,426 | | | | 1.01 | % | | | n/a | | | | (0.70 | )% | | | 43.85 | % |
9/30/2017 | | | 13.81 | % | | $ | 497,931 | | | | 1.01 | % | | | n/a | | | | (0.75 | )% | | | 35.37 | % |
9/30/2016 | | | 15.51 | % | | $ | 518,224 | | | | 1.01 | % | | | n/a | | | | (0.76 | )% | | | 27.00 | % |
9/30/2015 | | | 6.96 | % | | $ | 389,724 | | | | 1.02 | % | | | n/a | | | | (0.79 | )% | | | 45.31 | % |
| SUSTAINABLE EMERGING MARKETS FUND | |
Investor Shares | |
9/30/2019 | | | 1.91 | % | | $ | 45,717 | | | | 1.35 | % | | | 1.93 | % | | | 1.19 | % | | | 30.58 | % |
9/30/2018 | | | (2.70 | )% | | $ | 49,562 | | | | 1.41 | %* | | | 1.78 | % | | | 0.89 | % | | | 35.24 | % |
9/30/2017 | | | 23.47 | % | | $ | 42,429 | | | | 1.50 | % | | | 2.19 | % | | | 0.61 | % | | | 26.22 | % |
9/30/2016(14) | | | 28.79 | % | | $ | 30,135 | | | | 0.94 | % | | | 1.85 | % | | | 1.68 | % | | | 45.79 | % |
9/30/2015 | | | (20.44 | )% | | $ | 22,842 | | | | 1.50 | % | | | 1.79 | % | | | 0.16 | % | | | 28.03 | % |
Institutional Shares | |
9/30/2019 | | | 2.04 | % | | $ | 6,315 | | | | 1.20 | % | | | 2.47 | % | | | 1.34 | % | | | 30.58 | % |
9/30/2018 | | | (2.57 | )% | | $ | 5,842 | | | | 1.33 | %* | | | 2.00 | % | | | 0.87 | % | | | 35.24 | % |
9/30/2017 | | | 23.47 | % | | $ | 8,709 | | | | 1.50 | % | | | 2.23 | % | | | 0.57 | % | | | 26.22 | % |
9/30/2016(14) | | | 28.69 | % | | $ | 6,555 | | | | 1.26 | % | | | 1.79 | % | | | 0.29 | % | | | 45.79 | % |
9/30/2015 | | | (20.43 | )% | | $ | 27,961 | | | | 1.36 | % | | | n/a | | | | 0.16 | % | | | 28.03 | % |
Footnotes are presented on Pages 101-102.
The accompanying notes are an integral part of the financial statements.
| | |
| Artisan Partners Funds | | 99 |
ARTISAN PARTNERS FUNDS
Financial Highlights – For a share outstanding throughout each period
| | | | | | | | | | | | | | | | | | | | | | | | | | | | | | | | |
| | | | | | | | | | | | | | | Less Distributions From | | | | |
| | | Net
Asset
Value,
Beginning
of Period | | | Net
Investment
Income (Loss)(1) | | | Net Realized
and Unrealized
Gain (Loss) on
Investments | | | Total
from
Operations | | | Net
Investment
Income | | | Net
Realized
Gains | | | Total
Distributions | | | Net
Asset
Value,
End of
Period | |
| THEMATIC FUND | |
Investor Shares | |
9/30/2019 | | $ | 14.39 | | | | (0.01 | ) | | | 1.70 | | | | 1.69 | | | | — | (5) | | | (0.45 | ) | | | (0.45 | ) | | $ | 15.63 | |
9/30/2018 | | $ | 11.79 | | | | (0.04 | ) | | | 3.82 | | | | 3.78 | | | | — | | | | (1.18 | ) | | | (1.18 | ) | | $ | 14.39 | |
9/30/2017(16) | | $ | 10.00 | | | | (0.02 | ) | | | 1.81 | | | | 1.79 | | | | — | | | | — | | | | — | | | $ | 11.79 | |
Advisor Shares | |
9/30/2019 | | $ | 14.39 | | | | 0.01 | | | | 1.71 | | | | 1.72 | | | | — | | | | (0.45 | ) | | | (0.45 | ) | | $ | 15.66 | |
9/30/2018(17) | | $ | 13.82 | | | | — | (5) | | | 0.57 | | | | 0.57 | | | | — | | | | — | | | | — | | | $ | 14.39 | |
| VALUE FUND | |
Investor Shares | |
9/30/2019 | | $ | 15.10 | | | | 0.11 | | | | (0.56 | ) | | | (0.45 | ) | | | (0.10 | ) | | | (1.67 | ) | | | (1.77 | ) | | $ | 12.88 | |
9/30/2018 | | $ | 15.25 | | | | 0.11 | | | | 1.19 | | | | 1.30 | | | | (0.05 | ) | | | (1.40 | ) | | | (1.45 | ) | | $ | 15.10 | |
9/30/2017 | | $ | 13.10 | | | | 0.07 | | | | 2.17 | | | | 2.24 | | | | (0.09 | ) | | | — | | | | (0.09 | ) | | $ | 15.25 | |
9/30/2016 | | $ | 11.56 | | | | 0.09 | | | | 2.61 | | | | 2.70 | | | | (0.06 | ) | | | (1.10 | ) | | | (1.16 | ) | | $ | 13.10 | |
9/30/2015 | | $ | 14.14 | | | | 0.11 | | | | (1.66 | ) | | | (1.55 | ) | | | (0.11 | ) | | | (0.92 | ) | | | (1.03 | ) | | $ | 11.56 | |
Advisor Shares | |
9/30/2019 | | $ | 15.04 | | | | 0.13 | | | | (0.55 | ) | | | (0.42 | ) | | | (0.12 | ) | | | (1.67 | ) | | | (1.79 | ) | | $ | 12.83 | |
9/30/2018 | | $ | 15.22 | | | | 0.12 | | | | 1.19 | | | | 1.31 | | | | (0.09 | ) | | | (1.40 | ) | | | (1.49 | ) | | $ | 15.04 | |
9/30/2017 | | $ | 13.05 | | | | 0.10 | | | | 2.15 | | | | 2.25 | | | | (0.08 | ) | | | — | | | | (0.08 | ) | | $ | 15.22 | |
9/30/2016 | | $ | 11.57 | | | | 0.10 | | | | 2.61 | | | | 2.71 | | | | (0.13 | ) | | | (1.10 | ) | | | (1.23 | ) | | $ | 13.05 | |
9/30/2015(9) | | $ | 13.41 | | | | 0.07 | | | | (1.91 | ) | | | (1.84 | ) | | | — | | | | — | | | | — | | | $ | 11.57 | |
Institutional Shares | |
9/30/2019 | | $ | 15.08 | | | | 0.14 | | | | (0.56 | ) | | | (0.42 | ) | | | (0.13 | ) | | | (1.67 | ) | | | (1.80 | ) | | $ | 12.86 | |
9/30/2018 | | $ | 15.26 | | | | 0.14 | | | | 1.19 | | | | 1.33 | | | | (0.11 | ) | | | (1.40 | ) | | | (1.51 | ) | | $ | 15.08 | |
9/30/2017 | | $ | 13.09 | | | | 0.12 | | | | 2.15 | | | | 2.27 | | | | (0.10 | ) | | | — | | | | (0.10 | ) | | $ | 15.26 | |
9/30/2016 | | $ | 11.60 | | | | 0.11 | | | | 2.61 | | | | 2.72 | | | | (0.13 | ) | | | (1.10 | ) | | | (1.23 | ) | | $ | 13.09 | |
9/30/2015 | | $ | 14.19 | | | | 0.14 | | | | (1.66 | ) | | | (1.52 | ) | | | (0.15 | ) | | | (0.92 | ) | | | (1.07 | ) | | $ | 11.60 | |
Footnotes are presented on Pages 101-102.
The accompanying notes are an integral part of the financial statements.
| | |
| 100 | | Artisan Partners Funds |
ARTISAN PARTNERS FUNDS
Financial Highlights – continued
| | | | | | | | | | | | | | | | | | | | | | | | |
| | | | | | |
| | | Total
Return(2) | | | Net Assets,
End of
Period
(000) | | | Ratio of
Expenses
to Average
Net Assets(3)(4) | | | Ratio of
Expenses
to Average
Net Assets
Excluding
Waivers(3) | | | Ratio
of Net
Investment
Income (Loss)
to Average
Net Assets(3)(4) | | | Portfolio
Turnover
Rate(2) | |
| THEMATIC FUND | |
Investor Shares | |
9/30/2019 | | | 12.35 | % | | $ | 170,186 | | | | 1.37 | % | | | n/a | | | | (0.07 | )% | | | 368.38 | % |
9/30/2018 | | | 34.31 | % | | $ | 79,673 | | | | 1.51 | %(15) | | | 1.70 | %(15) | | | (0.27 | )% | | | 355.37 | % |
9/30/2017(16) | | | 18.00 | % | | $ | 15,293 | | | | 1.52 | %(15) | | | 2.70 | %(15) | | | (0.49 | )% | | | 170.19 | % |
Advisor Shares | | | | | | | | | | | | | | | | | | | | | | | | |
9/30/2019 | | | 12.49 | % | | $ | 521,293 | | | | 1.17 | % | | | n/a | | | | 0.04 | % | | | 368.38 | % |
9/30/2018(17) | | | 4.12 | % | | $ | 38,135 | | | | 1.40 | %(15) | | | 2.74 | %(15) | | | 0.16 | % | | | 355.37 | % |
| VALUE FUND | |
Investor Shares | |
9/30/2019 | | | (1.80 | )% | | $ | 131,134 | | | | 1.06 | % | | | n/a | | | | 0.87 | % | | | 28.36 | % |
9/30/2018 | | | 9.32 | % | | $ | 184,869 | | | | 1.01 | % | | | n/a | | | | 0.72 | % | | | 24.53 | % |
9/30/2017 | | | 17.16 | % | | $ | 216,981 | | | | 1.01 | % | | | n/a | | | | 0.50 | % | | | 44.17 | % |
9/30/2016 | | | 24.64 | % | | $ | 457,969 | | | | 0.96 | % | | | n/a | | | | 0.75 | % | | | 52.05 | % |
9/30/2015 | | | (11.90 | )% | | $ | 341,852 | | | | 1.00 | % | | | n/a | | | | 0.78 | % | | | 74.07 | % |
Advisor Shares | |
9/30/2019 | | | (1.59 | )% | | $ | 108,557 | | | | 0.88 | % | | | 0.93 | % | | | 1.06 | % | | | 28.36 | % |
9/30/2018 | | | 9.43 | % | | $ | 130,949 | | | | 0.88 | % | | | 0.89 | % | | | 0.83 | % | | | 24.53 | % |
9/30/2017 | | | 17.37 | % | | $ | 181,340 | | | | 0.85 | % | | | n/a | | | | 0.71 | % | | | 44.17 | % |
9/30/2016 | | | 24.73 | % | | $ | 251,643 | | | | 0.84 | % | | | n/a | | | | 0.89 | % | | | 52.05 | % |
9/30/2015(9) | | | (13.72 | )% | | $ | 466,702 | | | | 0.86 | % | | | n/a | | | | 1.12 | % | | | 74.07 | % |
Institutional Shares | |
9/30/2019 | | | (1.57 | )% | | $ | 168,607 | | | | 0.84 | % | | | n/a | | | | 1.09 | % | | | 28.36 | % |
9/30/2018 | | | 9.56 | % | | $ | 184,908 | | | | 0.80 | % | | | n/a | | | | 0.94 | % | | | 24.53 | % |
9/30/2017 | | | 17.46 | % | | $ | 253,869 | | | | 0.80 | % | | | n/a | | | | 0.82 | % | | | 44.17 | % |
9/30/2016 | | | 24.78 | % | | $ | 98,001 | | | | 0.77 | % | | | n/a | | | | 0.95 | % | | | 52.05 | % |
9/30/2015 | | | (11.69 | )% | | $ | 180,143 | | | | 0.75 | % | | | n/a | | | | 1.07 | % | | | 74.07 | % |
| * | | Expense limit from October 1, 2017 to February 20, 2018 was 1.50%. Expense limit was lowered effective February 21, 2018 to 1.35% for Investor Shares and 1.20% for Institutional Shares. |
| (1) | | Computed based on average shares outstanding. |
| (2) | | Periods less than twelve months (where applicable) are not annualized. |
| (3) | | Periods less than twelve months (where applicable) are annualized. |
| (4) | | Includes the effect of expenses waived or paid by the Adviser, if applicable. |
| (5) | | Amount is between $0.005 and $(0.005) per share. |
| (6) | | For the period from commencement of operations (June 29, 2015) through September 30, 2015. |
| (7) | | For the period from commencement of operations (August 21, 2017) through September 30, 2017. |
| (8) | | For the period from commencement of operations (October 15, 2015) through September 30, 2016. |
The accompanying notes are an integral part of the financial statements.
| | |
| Artisan Partners Funds | | 101 |
ARTISAN PARTNERS FUNDS
Financial Highlights – For a share outstanding throughout each period
| (9) | | For the period from commencement of operations (April 1, 2015) through September 30, 2015. |
| (10) | | For the period from commencement of operations (October 3, 2016) through September 30, 2017. |
| (11) | | For the period from commencement of operations (December 5, 2018) through September 30, 2019. |
| (12) | | For the period from commencement of operations (April 12, 2016) through September 30, 2016. |
| (13) | | For the period from commencement of operations (February 1, 2017) through September 30, 2017. |
| (14) | | In the fiscal year ended September 30, 2016, Sustainable Emerging Markets Fund recognized anon-recurring reimbursement from the Fund’s former custodian of approximately $172,000 in connection with certainout-of-pocket expenses the custodian charged the Fund between 1998 and 2015. The reimbursement represented 0.5% of the Fund’s net assets of September 30, 2016. The impact of the reimbursement is as follows for the September 30, 2016 Net Investment Income per share, Total Return, Ratio of Expenses to Average Net Assets, Ratio of Expenses to Average Net Assets Excluding Waivers and Ratio of Net Investment Income to Average Net Assets: |
| | | | | | | | | | | | | | | | | | | | | | | | | |
| | | Impact On
Net Investment
Income | | Impact On
Total
Return | | Impact On
Ratio of
Expenses to
Average
Net Assets | | Impact On
Ratio of
Expenses to
Average
Net Assets
Excluding
Waivers | | Impact On
Ratio of
Net Investment
Income to
Average
Net Assets |
Sustainable Emerging Markets Fund | | | | | | | | | | | | | | | | | | | | | | | | | |
Investor Shares | | | $ | 0.07 | | | | | 0.61% | | | | | (0.56 | )% | | | | (0.56 | )% | | | | 0.56% | |
Institutional Shares | | | $ | 0.03 | | | | | 0.61% | | | | | (0.24 | )% | | | | (0.25 | )% | | | | 0.24% | |
| (15) | | Includes interest expense and dividend payments for securities sold short. The ratios excluding such expenses are listed below. Refer to 2(m) in Notes to Financial Statements for additional information. |
| | | | | | | | | | |
| | | Ratio of Expenses to
Average Net Assets@
(annualized) | | Ratio of Expenses to
Average Net Assets
Excluding Waivers
(annualized) |
| THEMATIC FUND | | | | | | | | | | |
Investor Shares | | | | | | | | | | |
9/30/2018 | | | | 1.50% | | | | | 1.69% | |
9/30/2017# | | | | 1.50% | | | | | 2.69% | |
Advisor Shares | | | | | | | | | | |
9/30/2018& | | | | 1.40% | | | | | 2.74% | |
| | @ | | Includes the effect of expenses waived or paid by the Adviser, if applicable. |
| | # | | For the period from commencement of operations (April 24, 2017) through September 30, 2017. |
| | & | | For the period from commencement of operations (July 31, 2018) through September 30, 2018. |
| (16) | | For the period from commencement of operations (April 24, 2017) through September 30, 2017. |
| (17) | | For the period from commencement of operations (July 31, 2018) through September 30, 2018. |
The accompanying notes are an integral part of the financial statements.
| | |
| 102 | | Artisan Partners Funds |
ARTISAN PARTNERS FUNDS
Notes to Financial Statements – September 30, 2019
Artisan Partners Funds, Inc. (“Artisan Partners Funds”) was incorporated on January 5, 1995, as a Wisconsin corporation and is registered under the Investment Company Act of 1940, as amended (the “1940 Act”). As of September 30, 2019, Artisan Partners Funds is a series company comprised of fifteen series and follows specialized accounting and reporting under FASB Accounting Standards Codification Topic 946, Financial Services – Investment Companies. The following funds (each a “Fund” and collectively the “Funds”) are included in this report:
| | | | | | | | | | | | | | | |
| Fund Name | | Investor Shares
Inception Date | | Advisor Shares
Inception Date | | Institutional Shares
Inception Date |
Artisan Developing World Fund (“Developing World Fund”) | | June 29, 2015 | | June 29, 2015 | | June 29, 2015 |
Artisan Global Discovery Fund (“Global Discovery Fund”) | | August 21, 2017 | | N/A | | N/A |
Artisan Global Equity Fund (“Global Equity Fund”) | | March 29, 2010 | | N/A | | October 15, 2015 |
Artisan Global Opportunities Fund (“Global Opportunities Fund”) | | September 22, 2008 | | April 1, 2015 | | July 26, 2011 |
Artisan Global Value Fund (“Global Value Fund”) | | December 10, 2007 | | April 1, 2015 | | July 17, 2012 |
Artisan High Income Fund (“High Income Fund”) | | March 19, 2014 | | March 19, 2014 | | October 3, 2016 |
Artisan International Fund (“International Fund”) | | December 28, 1995 | | April 1, 2015 | | July 1, 1997 |
Artisan International Small-Mid Fund* (“International Small-Mid Fund”) | | December 21, 2001 | | December 4, 2018 | | April 12, 2016 |
Artisan International Value Fund (“International Value Fund”) | | September 23, 2002 | | April 1, 2015 | | October 1, 2006 |
Artisan Mid Cap Fund (“Mid Cap Fund”) | | June 27, 1997 | | April 1, 2015 | | July 1, 2000 |
Artisan Mid Cap Value Fund (“Mid Cap Value Fund”) | | March 28, 2001 | | April 1, 2015 | | February 1, 2012 |
Artisan Small Cap Fund (“Small Cap Fund”) | | March 28, 1995 | | February 1, 2017 | | May 7, 2012 |
Artisan Sustainable Emerging Markets Fund** (“Sustainable Emerging Markets Fund”) | | June 2, 2008 | | N/A | | June 26, 2006 |
Artisan Thematic Fund (“Thematic Fund”) | | April 24, 2017 | | July 31, 2018 | | N/A |
Artisan Value Fund (“Value Fund”) | | March 27, 2006 | | April 1, 2015 | | July 26, 2011 |
| * | | Effective December 4, 2018, Artisan International Small Cap Fund changed its name to Artisan International Small-Mid Fund. |
| ** | | Effective April 1, 2019, Artisan Emerging Markets Fund changed its name to Artisan Sustainable Emerging Markets Fund. |
Each Fund is an open-end, diversified mutual fund except Thematic Fund, which is an open-end, non-diversified mutual fund. The investment objective of each Fund (except Developing World Fund, High Income Fund and Thematic Fund) is to seek maximum long- term capital growth. Developing World Fund’s investment objective is to seek long-term capital appreciation. High Income Fund’s investment objective is to seek to provide total return through a combination of current income and capital appreciation. Thematic Fund’s investment objective is to seek maximum long-term capital appreciation. Each Fund has offered shares of capital stock of the classes designated Investor Shares, Advisor Shares and Institutional Shares, as applicable, since the inception dates listed above. Advisor Shares of the Funds are generally available for investment only by employee benefit plans, clients of certain financial intermediaries that trade through omnibus accounts and other investors
| | |
| Artisan Partners Funds | | 103 |
NOTES TO FINANCIAL STATEMENTS
that meet the minimum investment requirements. Institutional Shares are designed for certain employee benefit plans, clients of certain financial intermediaries that trade through omnibus accounts and institutional and other investors who are able to meet the minimum investment requirements.
Each class of shares has equal rights with respect to portfolio assets and voting privileges with respect to the Fund in general. Each class of shares has exclusive voting rights with respect to any matters involving only that class. The classes of a Fund pay pro rata the costs of management of that Fund’s portfolio, including the management fee. Each class of a Fund bears the cost of its own transfer agency and shareholder servicing arrangements, and any other class-specific expenses, which will result in differing expenses by class. Because of the different expenses, the Advisor Shares or Institutional Shares of a Fund typically will have a lower expense ratio and correspondingly higher total return than the Investor Shares of the same Fund.
The investment adviser for each Fund is Artisan Partners Limited Partnership (the “Adviser” or “Artisan Partners”). The Adviser is managed by its general partner, Artisan Investments GP LLC, a Delaware limited liability company wholly owned by Artisan Partners Holdings LP (“Artisan Holdings”). Artisan Holdings is a limited partnership under the laws of Delaware whose sole general partner is Artisan Partners Asset Management Inc., a publicly traded Delaware corporation.
| (2) | Summary of significant accounting policies: |
The following is a summary of significant accounting policies of the Funds in effect during the period covered by the financial statements, which were in accordance with United States generally accepted accounting principles (“US GAAP”).
| (a) | Valuation – The net asset value (“NAV”) of the shares of each class of each Fund was determined as of the close of regular session trading on the New York Stock Exchange (“NYSE”) (usually 4:00 p.m., Eastern Time) each day the NYSE was open for regular session trading. For financial reporting purposes, information available subsequent to the close of NYSE trading and up to the date of the financial statements was considered in determining a fair value for investments held in each Fund and the resulting NAV presented. The NAV of each class of shares was determined by dividing the value of each Fund’s securities and other assets attributed to that class, less its liabilities attributed to that class, by the number of outstanding shares of that class of that Fund. |
| | In determining each Fund’s NAV for financial reporting purposes, each equity security and exchange traded fund (“ETF”) traded on a securities exchange, including the Nasdaq Stock Market, orover-the-counter was valued at the closing price on the exchange or market designated by the Funds’ accounting agent or pricing vendor as the principal exchange (each, a “principal exchange”). The closing price provided by the pricing vendor for an exchange may differ from the price quoted elsewhere and may represent information such as last sales price, an official closing price, a closing auction price or other information, depending on exchange or market convention. Absent closing price information for an equity security from the principal exchange, the security was valued using (i) the closing price on another exchange on which the security traded (if such price was made available by a pricing vendor) or (ii) the most |
| | |
| 104 | | Artisan Partners Funds |
NOTES TO FINANCIAL STATEMENTS
| | recent bid quotation on the principal exchange or, if such bid was not available, from a secondary exchange or in theover-the-counter market. Equity-linked securities, such as participation certificates, participation notes or access notes, are valued by referencing the underlying security if market quotations are not readily available. Exchange traded option contracts were valued at the mid price (average of the bid price and ask price) as provided by the pricing vendor at the close of trading on the contract’s principal exchange. Exchange traded futures contracts were valued at the settlement price as provided by the pricing vendor at the close of trading on the principal exchange. Shares ofopen-end investment companies were valued at the latest net asset value reported by the investment company. |
| | Fixed income securities were valued at market value. Market values were generally evaluations based on the judgment of the Funds’ pricing vendors, which may consider, among other factors, the prices at which securities actually trade, broker-dealer quotations, pricing formulas, estimates of market values obtained from yield data relating to investments or securities with similar characteristics and/or discounted cash flow models that might be applicable. |
| | Securities or other assets for which market quotations were not readily available were valued by the Funds’ valuation committee at a fair value determined in good faith under procedures established by and under the general supervision of the board of directors of the Funds. A market quotation was considered to be not readily available, and a Fund therefore used fair value pricing, if, among other things, there were no quotations, pricing data was not provided by an approved pricing vendor, the valuation committee believed that the quotation, price or market value resulting from the Funds’ valuation procedures did not reflect a fair value of the security or asset, or the value of the security or asset might have been materially affected by events occurring after the close of the market in which the security or asset was principally traded but before the time for determination of NAV (a “subsequent event”). A subsequent event could include a company-specific development, a development that might affect an entire market or region, a potentially global development or a significant change in values of market indices, ETFs or other financial instruments in the U.S. or other markets. The Funds monitored for subsequent events using several tools. In fair valuingnon-U.S. equity securities and equity-linked securities, the Funds have used adjustment factors provided by a third party research service when there were subsequent events or expected or unexpected market closures. The third party research service utilized statistical data based on historical performance of securities, markets and other data in developing factors used to estimate a fair value. |
| | When fair value pricing is employed, the value of a security or asset used by a Fund to calculate its NAV may differ from quoted or published prices for the same security or asset. Estimates of fair values utilized by the Funds as described above could differ in the future from the value realized on the sale of those securities or assets and the differences could be material to the NAV of the applicable Fund. |
| (b) | Taxes – No provision was made for federal income taxes or excise taxes since each Fund intends to (i) comply with the provisions of Subchapter M of the Internal Revenue Code applicable to regulated investment companies and (ii) distribute to its shareholders substantially all of its taxable income as well as net realized gains from |
| | |
| Artisan Partners Funds | | 105 |
NOTES TO FINANCIAL STATEMENTS
| | the sale of investment securities. The Funds utilize earnings and profits distributed to shareholders on redemptions of Fund shares as part of the dividends paid deduction. |
| | The Funds have analyzed the tax positions taken on federal income tax returns for all remaining open tax years (fiscal years 2016 through 2019) and have concluded that, as of September 30, 2019, no provision for income tax would be required in the Funds’ financial statements. The Funds’ federal and state income and federal excise tax returns for tax years for which the applicable statutes of limitations have not expired are subject to examination by the Internal Revenue Service and Wisconsin Department of Revenue. |
| | As of and during the year ended September 30, 2019, the Funds did not have any liabilities for unrecognized tax benefits. The Funds recognize interest and penalties, if any, related to unrecognized tax benefits as income tax expense in the Statements of Operations. During the year ended September 30, 2019, the Funds did not incur any material interest or penalties. |
| | The Funds are subject to taxes imposed on foreign dividend income and realized and unrealized gains on securities traded in certain foreign countries in which the Funds invest. Withholding taxes on foreign dividends have been accrued based on the Funds’ understanding of the applicable country’s tax rules and rates. ’The foreign tax imposed on realized and unrealized gains, if any, was recorded on an accrual basis and is included in “Net realized gain (loss) on investments” and “Net increase (decrease) in unrealized appreciation or depreciation on investments“, as applicable, on the accompanying Statements of Operations. The amount of foreign tax owed, if any, is included in “Payable for foreign taxes” on the accompanying Statements of Assets and Liabilities and is comprised of withholding taxes on foreign dividends and taxes on unrealized gains. |
| (c) | Portfolio transactions – For financial reporting purposes, security transactions and shareholder transactions were recorded on trade date in accordance with US GAAP. Net realized gains and losses on securities were computed on specific security lot identification. |
| (d) | Restricted securities – The Funds may invest in securities that are subject to restrictions on resale and there may be no liquid secondary market or ready purchaser for such securities. These securities generally may be resold in transactions exempt from registration or to the public if the securities are registered. Disposal of these securities may involve time consuming negotiations and expenses, and prompt sale at an acceptable price may be difficult. Information regarding restricted securities, if any, is included in the footnotes to each Fund’s Schedule of Investments. |
| (e) | Foreign currency translation – Values of foreign investments, open foreign currency forward contracts, payables for foreign taxes, payables and receivables for securities transactions, dividend and reclaim receivables, other receivables and payables, and cash denominated in a foreign currency were translated into U.S. dollars using a spot market rate of exchange as of the time of determination of each Fund’s NAV on the day of valuation. Purchases and sales of investments and dividend and interest income were translated into U.S. dollars using the current spot market rate of exchange on the date of such transactions. The portion of security gains or losses resulting from |
| | |
| 106 | | Artisan Partners Funds |
NOTES TO FINANCIAL STATEMENTS
| | changes in foreign exchange rates was included with net realized and unrealized gain or loss from investments, as appropriate, for both financial reporting and tax purposes. |
| | The Funds may enter into foreign currency spot contracts and foreign currency forward contracts. Foreign currency spot contracts are typically used to facilitate the purchase and sale ofnon-U.S. securities and generally settle within three business days. Foreign currency forward contracts are typically used to hedge against foreign currency exchange rate risks, which the Funds may face as a result of direct or indirect exposure to particular currencies (including through U.S. dollar denominated depositary receipts and equity-linked securities). The Funds could be exposed to loss if the counterparties fail to perform under these contracts. Open foreign currency spot contracts and foreign currency forward contracts, if any, were recorded at market value and unrealized gains and losses on foreign currency forward contracts are presented separately on the Statements of Assets and Liabilities. Realized and unrealized gains and losses were reported as foreign currency related transactions and are recorded in the Statements of Operations. For tax purposes, these foreign exchange gains and losses were treated as ordinary income or loss. |
| | As of September 30, 2019, Global Value Fund, International Value Fund and Thematic Fund had outstanding foreign currency forward contracts, as shown on the Schedules of Investments. Foreign currency spot contracts are not separately disclosed on the Schedules of Investments but are included in other assets less liabilities. |
| | Other foreign currency related transaction gains and losses may result from currency gains and losses realized on the difference between the amounts of dividends and foreign taxes accrued on the Funds’ books and the U.S. dollar equivalent of the amounts actually received or paid. The net increase (decrease) in unrealized appreciation or depreciation on foreign currency related transactions arose from changes in the values of assets and liabilities, other than investments in securities, resulting from changes in foreign exchange rates. |
| (f) | Depositary receipts – Each Fund may invest in depositary receipts. Depositary receipts are typically issued by a financial institution (a “depositary”), evidencing ownership interests in a security issued by an issuer and deposited with the depositary. |
| (g) | Equity-linked securities – Developing World Fund, Global Discovery Fund, Global Equity Fund, Global Opportunities Fund, Global Value Fund, International Fund, International Small-Mid Fund, International Value Fund, Sustainable Emerging Markets Fund, Thematic Fund and Value Fund may invest in equity-linked securities. Equity-linked securities are designed to provide synthetic exposure to one or more underlying securities. An investment in an equity-linked security typically entitles the holder to a return equal to the market return of the underlying security or securities. There is nooff-balance sheet risk associated with equity-linked securities and the Funds’ potential loss is limited to the purchase price of the securities. The Funds are exposed to credit risk associated with the counterparty to the transaction. |
| (h) | Use of estimates – The preparation of financial statements in conformity with US GAAP requires management to make estimates and assumptions that affect the reported amounts and disclosures in the financial statements. Actual results could differ from those estimates. |
| | |
| Artisan Partners Funds | | 107 |
NOTES TO FINANCIAL STATEMENTS
| (i) | Indemnifications – Artisan Partners Funds indemnifies its officers and directors for certain liabilities that may arise from the performance of their duties to Artisan Partners Funds. In the normal course of business, the Funds may also enter into contracts in which the Funds agree to indemnify the other party or parties against various potential costs or liabilities. A Fund’s maximum exposure under such arrangements is unknown. As of September 30, 2019, no claim has been made for indemnification pursuant to any such agreement of the Funds. |
| (j) | When-Issued/Delayed Delivery Securities – Each Fund may purchase or sell when- issued and delayed delivery securities. Securities purchased on a when-issued or delayed delivery basis are purchased for delivery beyond the normal settlement date at a stated price, and no income accrues to the Fund on such securities prior to delivery date. Payment and delivery for when-issued and delayed delivery securities can take place a month or more after the date of the transaction. When a Fund enters into a purchase transaction on a when-issued or delayed delivery basis, the Fund will segregate liquid assets in an amount at least equal in value to the Fund’s commitments to purchase such securities. Purchasing securities on a when issued or delayed delivery basis may involve a risk that the market price at the time of delivery may be lower than the agreed upon purchase price. |
| (k) | Unfunded Commitments – Pursuant to the terms of certain term loan agreements, High Income Fund is obligated to fund term loan commitments at the borrower’s discretion. High Income Fund reserves against such contingent obligations by segregating liquid assets. Unfunded commitments were recorded at market value and unrealized gains and losses are presented separately on the Statement of Assets and Liabilities. |
| (l) | Redemption Fees – Artisan High Income Fund generally imposes a 2% redemption fee on the redemption or exchange of shares owned for 90 days or less. Redemption fees were recorded as a reduction in the cost of shares redeemed and had the primary effect of increasingpaid-in capital. The Fund reserved the right to waive or reduce the 2% redemption fee on shares held 90 days or less at its discretion when the Fund believed such waiver was in the best interests of the Fund, including, but not limited to, when it determined that imposition of the redemption fee was not necessary to protect the Fund from the effects of short-term trading. The Fund waived the redemption fee for shares held by certain authorized agents or other Fund intermediaries and otherwise in accordance with the Fund’s prospectus. |
| (m) | Securities Sold Short – The Funds may sell securities short or maintain a short position in anticipation of the decline in the market value of a particular security (a short sale), including securities that the Funds do not own. To complete a short sale, the Funds must borrow the security to make delivery to the buyer. The Funds are required to pay the lender any dividends or interest on the security, which accrues during the period of the loan. |
| | In order to terminate the short sale, the Fund that borrowed the security is obligated to return the security borrowed by purchasing it at market price at the time of termination. The price of the security at termination may differ from the price at which the security was sold. The Fund will incur a loss, as a result of the short sale, if |
| | |
| 108 | | Artisan Partners Funds |
NOTES TO FINANCIAL STATEMENTS
| | the price of the security increases between the date of the short sale and when the Fund terminates the short sale. This loss may be unlimited. The Fund will realize a gain if the security declines in price between those dates. The gain is limited to the price at which the Fund sold the security short. The amount of any economic gain will be decreased, and the amount of any economic loss increased, by the amount of any premium, dividends or interest the Fund may be required to pay in connection with a short sale. |
| | The Funds may reinvest short sale proceeds. Because the Funds may invest the proceeds of a short sale, the effect of short selling is similar to the effect of leverage. Each Fund generally must segregate cash or other liquid assets for the benefit of its counterparty to secure its obligation to purchase the security, so that the total of the amounts segregated is equal to the market value of the securities sold short. The Funds incur expenses as a result of executing short sales. |
| | During the year ended September 30, 2019, no Funds engaged in short sales. |
| (n) | Other – Dividend income less foreign taxes accrued or withheld, if any, was generally recorded on theex-dividend date. In some cases, the information was not available to the Funds on theex-dividend date. In such cases, which may have included private placements and foreign securities, dividends were recorded as soon after theex-dividend date as reliable information became available to the Funds.Non-cash dividends included in dividend income, if any, were generally recorded at the fair market value of securities received. Interest income was recorded on the accrual basis and includes accretion of discounts and amortization of premiums. Distributions to shareholders were recorded on theex-dividend date. Expenses attributable to the Funds were generally allocated to each Fund based on net assets. However, other expense allocation methodologies were also used, depending on the nature of the expense item. Income and expenses not specific to a particular class and realized and unrealized gains and losses were allocated daily to each class of shares based upon the relative net asset value of outstanding shares. Expenses attributable to a particular Fund or class were allocated directly to that Fund or class, respectively. |
| | The character of income and net realized gains and losses may differ in some instances for financial statement and tax purposes and may result in reclassification of permanent differences among certain capital accounts to more appropriately conform financial accounting to tax characterizations of dividend and capital gain distributions. |
Markets may perform poorly and the returns from the securities in which a Fund invests may underperform returns from the general securities markets. Securities markets may experience periods of high volatility and reduced liquidity in response to governmental actions or intervention, economic or market developments, or other external factors. The value of a company’s securities may rise or fall in response to company, market, economic or other news.
Foreign securities may underperform U.S. securities and may be more volatile than U.S. securities. Risks relating to investments in foreign securities (including, but not limited to, depositary receipts and equity-linked securities) and to securities of issuers with significant
| | |
| Artisan Partners Funds | | 109 |
NOTES TO FINANCIAL STATEMENTS
exposure to foreign markets include: currency exchange rate fluctuation; less available public information about the issuers of securities; less stringent regulatory standards; lack of uniform accounting, auditing and financial reporting standards; and country risks including less liquidity, high inflation rates, unfavorable economic practices, political instability and expropriation and nationalization risks.
The risks of foreign securities typically are greater in emerging and less developed markets. For example, in addition to the risks associated with investments in any foreign country, political, legal and economic structures in these less developed countries may be new and changing rapidly, which may cause instability and greater risk of loss. These securities markets may be less developed, and securities in those markets are generally more volatile and less liquid than those in developed markets. Investing in emerging market countries may involve substantial risk due to, among other reasons, limited information; higher brokerage costs; different accounting, auditing and financial reporting standards; less developed legal systems and thinner trading markets as compared to those in developed countries; different clearing and settlement procedures and custodial services; and currency blockages or transfer restrictions. Emerging market countries also are more likely to experience high levels of inflation, deflation or currency devaluations, which could hurt their economies and securities markets. Certain emerging markets also may face other significant internal or external risks, including a heightened risk of war and ethnic, religious and racial conflicts. In addition, governments in many emerging market countries participate to a significant degree in their economies and securities markets, which may impair investment and economic growth of companies in those markets. Such markets may also be heavily reliant on foreign capital and, therefore, vulnerable to capital flight.
The values of debt securities change in response to various factors, including, for example, market related factors, such as changes in interest rates or changes in the actual or perceived ability of an issuer to meet its obligations. In general, the values of debt securities fall in response to increases in interest rates. The value of a security with a longer duration will generally be more sensitive to changes in interest rates than a similar security with a shorter duration. As a result, changes in interest rates in the U.S. and outside the U.S. may affect the Fund’s debt investments unfavorably. Given the low interest rate environment, risks associated with rising rates are heightened. If interest rates rise, repayments of principal on certain debt securities, including loans, may occur at a slower rate than expected and the expected length of repayment of those securities could increase as a result.
An issuer or counterparty may fail to pay its obligations to a Fund when they are due. Financial strength and solvency (or the perceived financial strength or solvency) of an issuer are the primary factors influencing credit risk. Changes in the financial condition of an issuer or counterparty, changes in specific economic, social or political conditions that affect a particular type of security or other instrument of an issuer, and changes in economic, social or political conditions generally can increase the risk of default by an issuer or counterparty, which can affect a security’s or other instrument’s credit quality or value and an issuer’s or counterparty’s ability to pay interest and principal when due. The values of lower quality debt, including loans, tend to be particularly sensitive to these changes.
Debt securities in which a Fund invests may be rated below investment grade by the major rating agencies, or may be unrated securities that are determined by the Adviser to be of
| | |
| 110 | | Artisan Partners Funds |
NOTES TO FINANCIAL STATEMENTS
comparable quality. Debt securities of below investment grade quality are high yield, high risk bonds, commonly known as “junk bonds.” These bonds are predominantly speculative. They are usually issued by companies without long track records of sales and earnings, or by companies with questionable credit strength. These bonds have a higher degree of default risk and may be less liquid thanhigher-rated bonds. These securities may be subject to greater price volatility due to such factors as specific corporate developments, interest rate sensitivity, negative perceptions of junk bonds generally, and less secondary market liquidity. This potential lack of liquidity may make it more difficult for the Fund to accurately value these securities.
Investments in loans are generally subject to the same risks as investments in other types of debt obligations, including, among others, the credit risk of nonpayment of principal and interest. In addition, in many cases loans are subject to the risks associated with below investment grade securities. High Income Fund may invest in loans made in connection with highly leveraged transactions, which are subject to greater credit and liquidity risks than other types of loans. Although the loans in which High Income Fund invests may be secured by specific collateral, there can be no assurance that liquidation of such collateral would satisfy the borrower’s obligation in the event of nonpayment of scheduled interest or principal, or that such collateral could be readily liquidated. In the event of the bankruptcy of a borrower, High Income Fund could experience delays or limitations with respect to its ability to realize the benefits of the collateral securing a loan or could recover nothing of what it is owed on the loan. Uncollateralized (i.e.,non-secured) loans are subject to greater risk of loss (i.e., nonpayment) in the event of default than secured loans since they do not afford the Fund recourse to collateral. Investments in loans may be difficult to value and may be illiquid, including due to legal or contractual restrictions on resale. Transactions in many loans settle on a delayed basis, and High Income Fund may not receive the proceeds from the sale of a loan for a substantial period after the sale. As a result, sale proceeds related to the sale of loans may not be available to make additional investments until a substantial period after the sale of the loans. It is unclear whether the protections of the securities laws against fraud and misrepresentation extend to certain loans and other forms of direct indebtedness.
As anon-diversified fund, Thematic Fund may invest a larger portion of its assets in securities of a smaller number of issues than a diversified fund, which means a single issuer’s performance may affect Fund performance more than if the Fund were invested in a larger number of issuers.
See the Funds’ prospectus and statement of additional information regarding the risks of investing in shares of the Funds.
| (4) | Fair value measurements: |
Under US GAAP for fair value measurement, accounting standards clarify the definition of fair value for financial reporting, establish a framework for measuring fair value and require additional disclosures about the use of fair value measurements. In accordance with this standard, fair value is defined as the price that each Fund would receive upon selling an investment in an orderly transaction to an independent buyer in the principal or most advantageous market of the investment. The standard establishes a three-tier hierarchy to distinguish between (1) inputs that reflect the assumptions market participants would use in
| | |
| Artisan Partners Funds | | 111 |
NOTES TO FINANCIAL STATEMENTS
pricing an asset or liability developed based on the market data obtained from sources independent of the reporting entity (observable inputs) and (2) inputs that reflect the reporting entity’s own assumptions about the assumptions market participants would use in pricing an asset or liability developed based on the best information available in the circumstances (unobservable inputs) and to establish classification of fair value measurements for disclosure purposes. Various inputs are used in determining the value of the Funds’ investments. The three-tier hierarchy of inputs is summarized in three broad levels:
| | • | | Level 1 – unadjusted quoted prices in active markets for identical investments |
| | • | | Level 2 – other significant observable inputs (including but not limited to quoted prices for similar securities, interest rates, credit risks and securities trading primarily outside the U.S. where the applicable trading market was closed or factors were applied to prices as a result of significant market movements following the close of local trading) |
| | • | | Level 3 – significant unobservable inputs (including the Funds’ own assumptions in determining a fair value of investments) |
The inputs or methodology used for valuing securities are not necessarily an indication of the risk or liquidity associated with investing in those securities. A description of the valuation techniques for the Funds’ major classes of assets are found in Note 2(a). A description of the fair value leveling techniques are described below:
Equity securities, ETFs, investment companies, exchange traded options contracts and exchange traded futures contracts are generally categorized as Level 1. Bank loans, corporate bonds, equity-linked securities, foreign currency forward contracts, foreign equity securities in which the closing price or bid quotation are adjusted for significant events, or local market holidays or other unscheduled market closures, are generally categorized as Level 2. Securities fair valued in good faith by the valuation committee are generally categorized as Level 2 or 3, depending on the observability of the inputs utilized.
The following table summarizes each Fund’s investments by major security type, based on the inputs used to determine their fair values as of September 30, 2019 (in thousands):
| | | | | | | | | | | | | | | | | | | | |
| Fund | | Level 1 - Unadjusted
Quoted Prices | | Level 2 - Other Significant
Observable Inputs | | Level 3 - Significant
Unobservable Inputs | | Total |
| | | | | | | | | | | | | | | | | | | | |
Developing World | | | | | | | | | | | | | | | | | | | | |
Common Stocks(1) | | | | | | | | | | | | | | | | | | | | |
Developed Markets | | | $ | 819,139 | | | | $ | - | | | | $ | - | | | | $ | 819,139 | |
Emerging Asia | | | | 1,200,074 | | | | | 64,657 | | | | | - | | | | | 1,264,731 | |
Europe, Middle East & Africa | | | | 107,339 | | | | | - | | | | | - | | | | | 107,339 | |
Latin America | | | | 312,904 | | | | | - | | | | | - | | | | | 312,904 | |
Investment Companies | | | | 124,088 | | | | | - | | | | | - | | | | | 124,088 | |
Total Investments | | | $ | 2,563,544 | | | | $ | 64,657 | | | | $ | - | | | | $ | 2,628,201 | |
| | |
| 112 | | Artisan Partners Funds |
NOTES TO FINANCIAL STATEMENTS
| | | | | | | | | | | | | | | | | | | | |
| Fund | | Level 1 - Unadjusted
Quoted Prices | | Level 2 - Other Significant
Observable Inputs | | Level 3 - Significant
Unobservable Inputs | | Total |
| | | | | | | | | | | | | | | | | | | | |
Global Discovery | | | | | | | | | | | | | | | | | | | | |
Common Stocks(1) | | | | | | | | | | | | | | | | | | | | |
Americas | | | $ | 59,909 | | | | $ | - | | | | $ | - | | | | $ | 59,909 | |
Emerging Markets | | | | 4,937 | | | | | - | | | | | - | | | | | 4,937 | |
Europe | | | | 28,613 | | | | | - | | | | | - | | | | | 28,613 | |
Pacific Basin | | | | 6,464 | | | | | - | | | | | - | | | | | 6,464 | |
Investment Companies | | | | 7,091 | | | | | - | | | | | - | | | | | 7,091 | |
Total Investments | | | $ | 107,014 | | | | $ | - | | | | $ | - | | | | $ | 107,014 | |
Global Equity | | | | | | | | | | | | | | | | | | | | |
Common Stocks(1) | | | | | | | | | | | | | | | | | | | | |
Americas | | | $ | 126,071 | | | | $ | - | | | | $ | - | | | | $ | 126,071 | |
Emerging Markets | | | | 12,228 | | | | | - | | | | | - | | | | | 12,228 | |
Europe | | | | 91,927 | | | | | - | | | | | - | | | | | 91,927 | |
Pacific Basin | | | | 17,270 | | | | | - | | | | | - | | | | | 17,270 | |
Investment Companies | | | | 6,280 | | | | | - | | | | | - | | | | | 6,280 | |
Total Investments | | | $ | 253,776 | | | | $ | - | | | | $ | - | | | | $ | 253,776 | |
Global Opportunities | | | | | | | | | | | | | | | | | | | | |
Common Stocks(1) | | | | | | | | | | | | | | | | | | | | |
Americas | | | $ | 1,846,625 | | | | $ | - | | | | $ | - | | | | $ | 1,846,625 | |
Emerging Markets | | | | 195,346 | | | | | - | | | | | - | | | | | 195,346 | |
Europe | | | | 870,881 | | | | | - | | | | | - | | | | | 870,881 | |
Pacific Basin | | | | 267,346 | | | | | - | | | | | - | | | | | 267,346 | |
Investment Companies | | | | 205,917 | | | | | - | | | | | - | | | | | 205,917 | |
Total Investments | | | $ | 3,386,115 | | | | $ | - | | | | $ | - | | | | $ | 3,386,115 | |
Global Value | | | | | | | | | | | | | | | | | | | | |
Common Stocks(1) | | | | | | | | | | | | | | | | | | | | |
Americas | | | $ | 1,655,646 | | | | $ | - | | | | $ | - | | | | $ | 1,655,646 | |
Emerging Markets | | | | 326,810 | | | | | - | | | | | - | | | | | 326,810 | |
Europe | | | | 891,591 | | | | | - | | | | | - | | | | | 891,591 | |
Investment Companies | | | | 184,017 | | | | | - | | | | | - | | | | | 184,017 | |
Total Investments | | | | 3,058,064 | | | | | - | | | | | - | | | | | 3,058,064 | |
Foreign Currency Forward Contracts(2) | | | | - | | | | | 2,634 | | | | | - | | | | | 2,634 | |
Total | | | $ | 3,058,064 | | | | $ | 2,634 | | | | $ | - | | | | $ | 3,060,698 | |
| | |
| Artisan Partners Funds | | 113 |
NOTES TO FINANCIAL STATEMENTS
| | | | | | | | | | | | | | | | | | | | |
| Fund | | Level 1 - Unadjusted
Quoted Prices | | Level 2 - Other Significant
Observable Inputs | | Level 3 - Significant
Unobservable Inputs | | Total |
| | | | | | | | | | | | | | | | | | | | |
High Income | | | | | | | | | | | | | | | | | | | | |
Corporate Bonds(1) | | | $ | - | | | | $ | 2,422,660 | | | | $ | - | | | | $ | 2,422,660 | |
Loan Participations(1) | | | | - | | | | | 1,087,088 | | | | | - | | | | | 1,087,088 | |
Preferred Stocks(1) | | | | - | | | | | 2,543 | | | | | 322 | | | | | 2,865 | |
Common Stock(1) | | | | - | | | | | 372 | | | | | - | | | | | 372 | |
Corporate Bond Escrow(1) | | | | - | | | | | - | | | | | - | (4) | | | | - | |
Investment Companies | | | | 213,182 | | | | | - | | | | | - | | | | | 213,182 | |
Total Investments | | | | 213,182 | | | | | 3,512,663 | | | | | 322 | | | | | 3,726,167 | |
Futures(2) | | | | 1,997 | | | | | - | | | | | - | | | | | 1,997 | |
Total | | | $ | 215,179 | | | | $ | 3,512,663 | | | | $ | 322 | | | | $ | 3,728,164 | |
International | | | | | | | | | | | | | | | | | | | | |
Common Stocks and Equity-Linked Security(1) | | | | | | | | | | | | | | | | | | | | |
Americas | | | $ | 1,527,228 | | | | $ | - | | | | $ | - | | | | $ | 1,527,228 | |
Emerging Markets | | | | 850,332 | | | | | - | | | | | - | | | | | 850,332 | |
Europe | | | | 6,733,998 | | | | | 202,567 | | | | | - | | | | | 6,936,565 | |
Middle East | | | | 64,291 | | | | | - | | | | | - | | | | | 64,291 | |
Pacific Basin | | | | 839,634 | | | | | - | | | | | - | | | | | 839,634 | |
Investment Companies | | | | 321,135 | | | | | - | | | | | - | | | | | 321,135 | |
Total Investments | | | $ | 10,336,618 | | | | $ | 202,567 | | | | $ | - | | | | $ | 10,539,185 | |
InternationalSmall-Mid | | | | | | | | | | | | | | | | | | | | |
Common Stocks(1) | | | | | | | | | | | | | | | | | | | | |
Americas | | | $ | 198,224 | | | | $ | - | | | | $ | - | | | | $ | 198,224 | |
Emerging Markets | | | | 59,203 | | | | | - | | | | | - | | | | | 59,203 | |
Europe | | | | 586,271 | | | | | - | | | | | - | | | | | 586,271 | |
Middle East | | | | 58,795 | | | | | 6,255 | | | | | - | | | | | 65,050 | |
Pacific Basin | | | | 271,801 | | | | | - | | | | | - | | | | | 271,801 | |
Investment Companies | | | | 40,161 | | | | | - | | | | | - | | | | | 40,161 | |
Total Investments | | | $ | 1,214,455 | | | | $ | 6,255 | | | | $ | - | | | | $ | 1,220,710 | |
International Value | | | | | | | | | | | | | | | | | | | | |
Common Stocks(1) | | | | | | | | | | | | | | | | | | | | |
Americas | | | $ | 1,469,499 | | | | $ | - | | | | $ | - | | | | $ | 1,469,499 | |
Emerging Markets | | | | 2,631,657 | | | | | - | | | | | - | | | | | 2,631,657 | |
Europe | | | | 7,961,195 | | | | | - | | | | | - | | | | | 7,961,195 | |
Pacific Basin | | | | 83,169 | | | | | - | | | | | - | | | | | 83,169 | |
Investment Companies | | | | 1,991,731 | | | | | - | | | | | - | | | | | 1,991,731 | |
Total Investments | | | | 14,137,251 | | | | | - | | | | | - | | | | | 14,137,251 | |
Foreign Currency Forward Contracts(2) | | | | - | | | | | 18,276 | | | | | - | | | | | 18,276 | |
Total | | | $ | 14,137,251 | | | | $ | 18,276 | | | | $ | - | | | | $ | 14,155,527 | |
| | |
| 114 | | Artisan Partners Funds |
NOTES TO FINANCIAL STATEMENTS
| | | | | | | | | | | | | | | | | | | | |
| Fund | | Level 1 - Unadjusted
Quoted Prices | | Level 2 - Other Significant
Observable Inputsv | | Level 3 - Significant
Unobservable Inputs | | Total |
| | | | | | | | | | | | | | | | | | | | |
Mid Cap | | | | | | | | | | | | | | | | | | | | |
Common Stocks(1) | | | $ | 4,894,682 | | | | $ | - | | | | $ | - | | | | $ | 4,894,682 | |
Investment Companies | | | | 165,298 | | | | | - | | | | | - | | | | | 165,298 | |
Total Investments | | | $ | 5,059,980 | | | | $ | - | | | | $ | - | | | | $ | 5,059,980 | |
Mid Cap Value | | | | | | | �� | | | | | | | | | | | | | |
Common Stocks(1) | | | $ | 2,170,655 | | | | $ | - | | | | $ | - | | | | $ | 2,170,655 | |
Investment Companies | | | | 96,996 | | | | | - | | | | | - | | | | | 96,996 | |
Total Investments | | | $ | 2,267,651 | | | | $ | - | | | | $ | - | | | | $ | 2,267,651 | |
Small Cap | | | | | | | | | | | | | | | | | | | | |
Common Stocks(1) | | | $ | 1,767,030 | | | | $ | - | | | | $ | - | | | | $ | 1,767,030 | |
Investment Companies | | | | 74,434 | | | | | - | | | | | - | | | | | 74,434 | |
Total Investments | | | $ | 1,841,464 | | | | $ | - | | | | $ | - | | | | $ | 1,841,464 | |
Sustainable Emerging Markets | | | | | | | | | | | | | | | | | | | | |
Common Stocks(1) | | | | | | | | | | | | | | | | | | | | |
Developed Markets | | | $ | 2,005 | | | | $ | - | | | | $ | - | | | | $ | 2,005 | |
Emerging Asia | | | | 24,483 | | | | | 5,879 | | | | | - | (3) | | | | 30,362 | |
Europe, Middle East & Africa | | | | 9,807 | | | | | - | | | | | - | | | | | 9,807 | |
Latin America | | | | 9,007 | | | | | - | | | | | - | | | | | 9,007 | |
Investment Companies | | | | 360 | | | | | - | | | | | - | | | | | 360 | |
Total Investments | | | $ | 45,662 | | | | $ | 5,879 | | | | $ | - | | | | $ | 51,541 | |
Thematic | | | | | | | | | | | | | | | | | | | | |
Common Stocks(1) | | | $ | 602,183 | | | | $ | - | | | | $ | - | | | | $ | 602,183 | |
Options Purchased | | | | 943 | | | | | - | | | | | - | | | | | 943 | |
Investment Companies | | | | 86,090 | | | | | - | | | | | - | | | | | 86,090 | |
Total Investments | | | | 689,216 | | | | | - | | | | | - | | | | | 689,216 | |
Foreign Currency Forward Contracts(2) | | | | - | | | | | 548 | | | | | - | | | | | 548 | |
Total | | | $ | 689,216 | | | | $ | 548 | | | | $ | - | | | | $ | 689,764 | |
Value | | | | | | | | | | | | | | | | | | | | |
Common Stocks(1) | | | $ | 396,462 | | | | $ | - | | | | $ | - | | | | $ | 396,462 | |
Investment Companies | | | | 15,058 | | | | | - | | | | | - | | | | | 15,058 | |
Total Investments | | | $ | 411,520 | | | | $ | - | | | | $ | - | | | | $ | 411,520 | |
|
(1)See the Fund’s Schedule of Investments for industry or country classifications. (2)Foreign currency forward contracts are valued at unrealized appreciation (depreciation). (3)Common stock, valued at $0. (4)Corporate bond escrow, valued at $0. | |
| | |
| Artisan Partners Funds | | 115 |
NOTES TO FINANCIAL STATEMENTS
Information about Level 3 fair value measurements (dollar values in thousands):
| | | | | | | | | |
| Assets | | Fair Value at
September 30, 2019 | | Unobservable
Input(s) | | Impact to Fair
Value from an
Increase in
Input |
High Income Fund | | | | | | | | | |
Corporate Bond Escrow | | | $ | - | | | Last quote in inactive market less 100% discount | | N/A |
Preferred Stock | | | $ | 322 | (1) | | Enterprise value, volatility, 25% discount | | Increase (enterprise value, volatility), decrease (discount) |
Sustainable Emerging Markets Fund | | | | | | | | | |
Common Stock | | | $ | - | | | Last quote in inactive market less 100% discount | | N/A |
(1)In estimating the fair value, management used a Black Scholes option pricing model. Management has also adjusted the value to reflect illiquidity and non-transferability of assets. |
As of September 30, 2019, the reconciliation of assets in which significant unobservable inputs (Level 3) were used in determining fair value is as follows (in thousands):
| | | | | | | | | | | | | | | |
| | | High Income Fund | | Sustainable Emerging
Markets Fund | | Thematic Fund |
Balance as of September 30, 2018 | | | $ | 4,308 | (1) | | | $ | - | (1) | | | $ | 639 | |
Transfers into Level 3 | | | | - | | | | | - | | | | | - | |
Net change in unrealized appreciation (depreciation) | | | | (3,986 | ) | | | | - | | | | | - | |
Purchases | | | | - | | | | | - | | | | | - | |
Sales | | | | - | | | | | - | | | | | (639 | ) |
Realized Gain/Loss | | | | - | | | | | - | | | | | - | |
Transfers out of Level 3 | | | | - | | | | | - | | | | | - | |
| | | | | | | | | | | | | | | |
Balance as of September 30, 2019 | | | $ | 322 | (1) | | | $ | - | (1) | | | $ | - | |
| | | | | | | | | | | | | | | |
Net change in unrealized appreciation (depreciation) for investments held as of September 30, 2019 | | | $ | (3,986 | ) | | | $ | - | | | | $ | - | |
| | | | | | | | | | | | | | | |
(1)Includes one or more securities valued at $0. | |
| (5) | Transfer agent and authorized agent fees: |
Each Fund paid fees to, and reimbursed certain expenses of, the Funds’ transfer agent during the period. In addition, the Funds have authorized certain financial services companies, broker-dealers, banks or other authorized agents, and in some cases, other organizations designated by an authorized agent (with their designees, collectively “authorized agents”) to accept purchase, exchange and redemption orders on the Funds’ behalf. Some authorized agents charge a fee for accounting and shareholder services that the agent provided to Fund shareholders on the Fund’s behalf. Those services typically included recordkeeping, transaction processing for shareholders’ accounts and other services. Generally, the fee was either a per account charge based on the number of accounts to which the authorized agent provided such services, or was a percentage of the average value of Fund shares held in such
| | |
| 116 | | Artisan Partners Funds |
NOTES TO FINANCIAL STATEMENTS
accounts. For Investor Shares and Advisor Shares, each Fund paid all or a portion of such fees, which are intended to compensate the authorized agent for its provision of services of the type that would be provided by the Funds’ transfer agent or other service providers if the shares were registered on the books of the Funds’ transfer agent. The balance of the fees incurred during the period was paid by the Adviser at its own expense. Institutional Shares of the Funds do not pay fees to intermediaries in connection with recordkeeping, transaction processing for shareholders’ accounts or any other services that an intermediary may provide to its clients. The Funds’ expenses incurred for services provided by authorized agents are included in “Transfer agent fees” in the Statements of Operations. The table below shows the fees and expenses to the Funds’ transfer agent and the fees to authorized agents incurred by each class of each Fund during the year ended September 30, 2019 (in thousands):
| | | | | | | | | | | | | | | |
| | | Year Ended 9/30/2019 |
| Fund | | Fees and Expenses
to Transfer Agent | | Fees to
Authorized
Agents | | Total |
Artisan Developing World Fund - Investor Shares | | | $ | 45 | | | | $ | 729 | | | | $ | 774 | |
Artisan Developing World Fund - Advisor Shares | | | | 40 | | | | | 1,067 | | | | | 1,107 | |
Artisan Developing World Fund - Institutional Shares | | | | 38 | | | | | - | | | | | 38 | |
Artisan Global Discovery Fund - Investor Shares | | | | 36 | | | | | 111 | | | | | 147 | |
Artisan Global Equity Fund - Investor Shares | | | | 46 | | | | | 233 | | | | | 279 | |
Artisan Global Equity Fund - Institutional Shares | | | | 33 | | | �� | | - | | | | | 33 | |
Artisan Global Opportunities Fund - Investor Shares | | | | 79 | | | | | 2,400 | | | | | 2,479 | |
Artisan Global Opportunities Fund - Advisor Shares | | | | 38 | | | | | 441 | | | | | 479 | |
Artisan Global Opportunities Fund - Institutional Shares | | | | 39 | | | | | - | | | | | 39 | |
Artisan Global Value Fund - Investor Shares | | | | 71 | | | | | 1,295 | | | | | 1,366 | |
Artisan Global Value Fund - Advisor Shares | | | | 38 | | | | | 532 | | | | | 570 | |
Artisan Global Value Fund - Institutional Shares | | | | 40 | | | | | - | | | | | 40 | |
Artisan High Income Fund - Investor Shares | | | | 47 | | | | | 2,555 | | | | | 2,602 | |
Artisan High Income Fund - Advisor Shares | | | | 50 | | | | | 1,733 | | | | | 1,783 | |
Artisan High Income Fund - Institutional Shares | | | | 39 | | | | | - | | | | | 39 | |
Artisan International Fund - Investor Shares | | | | 310 | | | | | 8,978 | | | | | 9,288 | |
Artisan International Fund - Advisor Shares | | | | 42 | | | | | 1,601 | | | | | 1,643 | |
Artisan International Fund - Institutional Shares | | | | 53 | | | | | - | | | | | 53 | |
Artisan InternationalSmall-Mid Fund - Investor Shares | | | | 63 | | | | | 355 | | | | | 418 | |
Artisan InternationalSmall-Mid Fund - Advisor Shares(1) | | | | 30 | | | | | 142 | | | | | 172 | |
Artisan InternationalSmall-Mid Fund - Institutional Shares | | | | 35 | | | | | - | | | | | 35 | |
Artisan International Value Fund - Investor Shares | | | | 123 | | | | | 6,687 | | | | | 6,810 | |
Artisan International Value Fund - Advisor Shares | | | | 51 | | | | | 3,474 | | | | | 3,525 | |
Artisan International Value Fund - Institutional Shares | | | | 49 | | | | | - | | | | | 49 | |
Artisan Mid Cap Fund - Investor Shares | | | | 144 | | | | | 3,710 | | | | | 3,854 | |
Artisan Mid Cap Fund - Advisor Shares | | | | 39 | | | | | 394 | | | | | 433 | |
| | |
| Artisan Partners Funds | | 117 |
NOTES TO FINANCIAL STATEMENTS
| | | | | | | | | | | | | | | |
| | | Year Ended 9/30/2019 |
| Fund | | Fees and Expenses
to Transfer Agent | | Fees to
Authorized
Agents | | Total |
Artisan Mid Cap Fund - Institutional Shares | | | $ | 56 | | | | $ | - | | | | $ | 56 | |
Artisan Mid Cap Value Fund - Investor Shares | | | | 146 | | | | | 2,016 | | | | | 2,162 | |
Artisan Mid Cap Value Fund - Advisor Shares | | | | 44 | | | | | 483 | | | | | 527 | |
Artisan Mid Cap Value Fund - Institutional Shares | | | | 39 | | | | | - | | | | | 39 | |
Artisan Small Cap Fund - Investor Shares | | | | 118 | | | | | 1,066 | | | | | 1,184 | |
Artisan Small Cap Fund - Advisor Shares | | | | 36 | | | | | 429 | | | | | 465 | |
Artisan Small Cap Fund - Institutional Shares | | | | 37 | | | | | - | | | | | 37 | |
Artisan Sustainable Emerging Markets Fund - Investor Shares | | | | 36 | | | | | 115 | | | | | 151 | |
Artisan Sustainable Emerging Markets Fund - Institutional Shares | | | | 34 | | | | | - | | | | | 34 | |
Artisan Thematic Fund - Investor Shares | | | | 40 | | | | | 360 | | | | | 400 | |
Artisan Thematic Fund - Advisor Shares | | | | 37 | | | | | 194 | | | | | 231 | |
Artisan Value Fund - Investor Shares | | | | 57 | | | | | 306 | | | | | 363 | |
Artisan Value Fund - Advisor Shares | | | | 36 | | | | | 85 | | | | | 121 | |
Artisan Value Fund - Institutional Shares | | | | 36 | | | | | - | | | | | 36 | |
|
(1)For the period from commencement of operations (December 4, 2018) through September 30, 2019. | |
| (6) | Derivative Transactions: |
A Fund may invest in derivatives for any purpose consistent with its investment objective and guidelines, as set forth in its then-current prospectus and statement of additional information including, without limitation, to improve expected risk-adjusted returns, to reduce exposure to certain risks, for hedging purposes and to obtain economic exposure to certain issuers.
Foreign Currency Forward Contracts
Foreign currency forward contracts are contractual agreements to purchase or sell a specified currency at a specified future date (or within a specified time period) and at a price set at the time of the contract. Forward contracts usually are entered into with banks and broker-dealers and are not exchange traded.
Forward currency transactions may involve currencies of the different countries to which a Fund may have exposure and serve as hedges against possible variations in the exchange rate between these currencies. Forward currency transactions may be used for transaction hedging and portfolio hedging involving either specific transactions or portfolio positions (including positions obtained through, among other instruments, participation certificates and depositary receipts that may be denominated in U.S. dollars or foreign currencies). A Fund may not engage in speculative currency exchange transactions. Global Value Fund, International Value Fund and Thematic Fund each used foreign currency contracts for hedging currency exposure during the year ended September 30, 2019.
| | |
| 118 | | Artisan Partners Funds |
NOTES TO FINANCIAL STATEMENTS
At the maturity of a forward contract to deliver a particular currency, a Fund may either sell the portfolio security related to such contract and make delivery of the currency, or it may retain the security and either acquire the currency on the spot market or terminate its contractual obligation to deliver the currency by purchasing an offsetting contract with the same currency trader obligating it to purchase on the same maturity date the same amount of the currency. The Fund will earmark or segregate liquid assets to cover any unrealized losses.
Futures Transactions
A Fund may invest in futures contracts for hedging, risk management or portfolio management purposes, including to offset changes in the value of securities held or expected to be acquired or be disposed of, to minimize fluctuations in foreign currencies, or to gain exposure to a particular market or instrument. High Income Fund used futures contracts to manage duration exposure during the year ended September 30, 2019.
A futures contract provides for the future sale by one party and purchase by another party of a specified amount of a financial instrument or money at a specified time and price. To the extent it uses futures contracts, a Fund will be required to deposit margin and other assets with its futures clearing brokers, shown as due from broker in the Statements of Assets and Liabilities.
There are risks associated with a Fund’s transactions in futures contracts, including that the success of an investment strategy may depend on the ability of the Fund’s portfolio managers to predict movements in the prices of individual securities, fluctuations in markets and movement in interest rates.
When a Fund invests in futures contracts, it will cover its position by earmarking or segregating an amount of liquid assets equal to the market value of the futures positions held less margin deposits, and that amount will bemarked-to-market on a daily basis.
Options Transactions
A Fund may purchase and write (sell) put options and call options on securities or indexes.
An option on a security (or index) is a contract that gives the purchaser (holder) of the option, in return for a premium, the right to buy from or sell to the seller of the option the security underlying the option at a specified exercise price at any time during the term of the option. Premiums paid on options purchased and premiums received on options written, as well as the daily fluctuation in market value, are included in investments in securities, at value and written options, at value, respectively, in the Statements of Assets and Liabilities. When a Fund writes options, it will cover its obligation by earmarking or segregating liquid assets.
If a written option expires, a Fund realizes a gain equal to the premium received at the time the option was written. If a purchased option expires, the Fund realizes a loss equal to the premium paid. A Fund will realize a gain from a closing purchase transaction if the cost of the closing option is less than the premium received from writing the option, or if it is more, the Fund will realize a loss. If the premium received from writing a closing sale transaction is more than the premium paid to purchase the option, the Fund will realize a gain, or if it is less, the Fund will realize a loss. Realized gain or loss on options purchased and options
| | |
| Artisan Partners Funds | | 119 |
NOTES TO FINANCIAL STATEMENTS
written are included in net realized gain (loss) on investments and net realized gain (loss) on written options, respectively, in the Statements of Operations. The Fund as writer of an option bears the market risk of an unfavorable change in the price of the security underlying the written option.
There are risks associated with a Fund investing in options contracts including significant differences between the securities markets, the currency markets, and the options markets that could result in an imperfect correlation between these markets, causing a given transaction not to achieve its objective. During the year ended September 30, 2019, Thematic Fund used options transactions to magnify alpha and minimize downside market risk.
The fair value of derivative instruments as reported in the Statements of Assets and Liabilities as of September 30, 2019 was as follows (in thousands):
| | | | | | | | | | | |
| Fund | | Risk Exposure Category | | Derivative Instrument | | Statements of Assets and Liabilities Location | | Value |
| Global Value | | Foreign currency | | Foreign currency forward contracts | | Unrealized appreciation on foreign currency forward contracts | | | $ | 3,286 | |
| | | Foreign currency | | Foreign currency forward contracts | | Unrealized depreciation on foreign currency forward contracts | | | $ | (652 | ) |
| High Income | | Interest rate | | Futures contracts | | Due from broker Receivable for variation margin on futures contracts | | | $
| 2,812
124 |
|
| International Value | | Foreign currency | | Foreign currency forward contracts | | Unrealized appreciation on foreign currency forward contracts | | | $ | 20,882 | |
| | | Foreign currency | | Foreign currency forward contracts | | Unrealized depreciation on foreign currency forward contracts | | | $ | (2,606 | ) |
| Thematic | | Foreign currency | | Foreign currency forward contracts | | Unrealized appreciation on foreign currency forward contracts | | | $ | 1,063 | |
| | | Foreign currency | | Foreign currency forward contracts | | Unrealized depreciation on foreign currency forward contracts | | | $ | (515 | ) |
| | | Equity | | Options purchased | | Investments in securities, unaffiliated, at value | | | $ | 943 | |
The effect of derivative instruments in the amount of realized gain (loss) and change in net unrealized appreciation (depreciation) recognized on the Statements of Operations for the year ended September 30, 2019 was as follows (in thousands):
| | | | | | | | | | | | | | | | | | |
| Fund | | Risk Exposure
Category | | Derivative
Instrument | | Statements of
Operations Location | | Net Realized
Gain (Loss) | | Statements of
Operations Location | | Unrealized
Appreciation
(Depreciation) |
| Global Value | | Foreign currency | | Foreign currency forward contracts | | Net realized loss on foreign currency forward contracts | | | $ | (1,519 | ) | | Net increase in unrealized appreciation or depreciation on foreign currency forward contracts | | | $ | 2,772 | |
| High Income | | Interest rate | | Futures contracts | | Net realized loss on futures contracts | | | $ | (15,310 | ) | | Net increase in unrealized appreciation or depreciation on futures contracts | | | $ | 1,580 | |
| | |
| 120 | | Artisan Partners Funds |
NOTES TO FINANCIAL STATEMENTS
| | | | | | | | | | | | | | | | | | |
| Fund | | Risk Exposure
Category | | Derivative
Instrument | | Statements of
Operations Location | | Net Realized
Gain (Loss) | | Statements of
Operations Location | | Unrealized
Appreciation
(Depreciation) |
| International Value | | Foreign currency | | Foreign currency forward contracts | | Net realized loss on foreign currency forward contracts | | | $ | (11,337 | ) | | Net increase in unrealized appreciation or depreciation on foreign currency forward contracts | | | $ | 17,654 | |
| Thematic | | Foreign currency | | Foreign currency forward contracts | | Net realized gain on foreign currency forward contracts | | | $ | 2,980 | | | Net increase in unrealized appreciation or depreciation on foreign currency forward contracts | | | $ | 473 | |
| | | Equity | | Options purchased | | Net realized gain on investments, from unaffiliated issuers | | | $ | 657 | | | Net decrease in unrealized appreciation or depreciation on investments, from unaffiliated issuers | | | $ | (505 | ) |
| | | Equity | | Written options contracts | | Net realized loss on written options | | | $ | (2,175 | ) | | Net increase in unrealized appreciation or depreciation on written options | | | $ | 4 | |
The average monthly amount outstanding for each derivative type as of September 30, 2019 was as follows (dollar value in thousands):
| | | | | | | |
| Fund | | Derivative Type | | Average Monthly Notional Amount |
Global Value | | Foreign currency forward contracts | | | $ | 94,379 | |
International Value | | Foreign currency forward contracts | | | $ | 600,969 | |
Thematic | | Foreign currency forward contracts | | | $ | 93,397 | |
| | |
| Fund | | Derivative Type | | Average Monthly Notional Amount |
High Income | | Futures contracts | | | $ | 144,391 | |
| | |
| Fund | | Derivative Type | | Average Monthly Notional Amount |
Thematic | | Options purchased | | | $ | 6,773 | |
| | | Written options contracts | | | $ | 181 | |
Master Netting Agreements
Each Fund is a party to various master netting agreements. While the terms and conditions of these agreements may vary, all transactions under any such agreement constitute a single contractual relationship. Each party’s obligation to make any payments, deliveries or other transfers in respect of any transaction under such an agreement may be netted against the other party’s obligations under such agreement. A default by a party in performance with respect to one transaction under such an agreement would give the other party the right to terminate all transactions under such agreement and calculate one net amount owed from one party to the other. Exchange traded options and exchange traded futures are not subject to master netting agreements.
| | |
| Artisan Partners Funds | | 121 |
NOTES TO FINANCIAL STATEMENTS
The following tables present information about the offsetting of derivative instruments and collateral amounts (in thousands) for foreign currency forward contracts:
| | | | | | | | | | | | | | | | | | | | | | |
| | | Gross Amounts Not Offset in the Statements of Assets and Liabilities |
| Fund | | Counterparty | | Gross Asset Amounts
Presented in Statements of
Assets and Liabilities | | Financial
Instrument | | Collateral
Received | | Net Amount
(Not Less Than $0) |
Global Value | | JPMorgan Chase Bank N.A. | | | $ | 3,286 | | | | $ | (652 | ) | | | $ | - | | | | $ | 2,634 | |
International Value | | JPMorgan Chase Bank N.A. | | | | 20,882 | | | | | (2,606 | ) | | | | - | | | | | 18,276 | |
Thematic | | JPMorgan Chase Bank N.A. | | | | 1,063 | | | | | (515 | ) | | | | - | | | | | 548 | |
| |
| | | Gross Amounts Not Offset in the Statements of Assets and Liabilities |
| Fund | | Counterparty | | Gross Liability Amounts
Presented in Statements of
Assets and Liabilities | | Financial
Instrument | | Collateral
Received | | Net Amount
(Not Less Than $0) |
Global Value | | JPMorgan Chase Bank N.A. | | | $ | 652 | | | | $ | (652 | ) | | | $ | - | | | | $ | - | |
International Value | | JPMorgan Chase Bank N.A. | | | | 2,606 | | | | | (2,606 | ) | | | | - | | | | | - | |
Thematic | | JPMorgan Chase Bank N.A. | | | | 515 | | | | | (515 | ) | | | | - | | | | | - | |
| (7) | Related Party Transactions: |
| (a) | Investment Advisory Agreement – The Adviser, with which the officers and a director of the Funds are affiliated, provided investment advisory and administrative services to the Funds during the year ended September 30, 2019. In exchange for those services, each Fund paid a monthly management fee to the Adviser as follows: |
Developing World Fund
| | | | | |
| Average Daily Net Assets | | Annual Rate |
Less than $1 billion | | | | 1.050 | % |
$1 billion to $2 billion | | | | 1.025 | |
$2 billion to $3.5 billion | | | | 1.000 | |
$3.5 billion to $5 billion | | | | 0.975 | |
Greater than $5 billion | | | | 0.950 | |
Global Discovery Fund
| | | | | |
| Average Daily Net Assets | | Annual Rate |
Less than $1 billion | | | | 0.975 | % |
$1 billion to $2 billion | | | | 0.950 | |
$2 billion to $3.5 billion | | | | 0.925 | |
$3.5 billion to $5 billion | | | | 0.900 | |
Greater than $5 billion | | | | 0.875 | |
| | |
| 122 | | Artisan Partners Funds |
NOTES TO FINANCIAL STATEMENTS
Global Equity Fund and Global Value Fund
| | | | | |
| Average Daily Net Assets | | Annual Rate |
Less than $1 billion | | | | 1.000 | % |
$1 billion to $4 billion | | | | 0.975 | |
$4 billion to $8 billion | | | | 0.950 | |
$8 billion to $12 billion | | | | 0.925 | |
Greater than $12 billion | | | | 0.900 | |
Global Opportunities Fund
| | | | | |
| Average Daily Net Assets | | Annual Rate |
Less than $1 billion | | | | 0.900 | % |
$1 billion to $4 billion | | | | 0.875 | |
$4 billion to $8 billion | | | | 0.850 | |
$8 billion to $12 billion | | | | 0.825 | |
Greater than $12 billion | | | | 0.800 | |
High Income Fund
| | | | | |
| Average Daily Net Assets | | Annual Rate |
Less than $1 billion | | | | 0.725 | % |
$1 billion to $2 billion | | | | 0.700 | |
$2 billion to $3.5 billion | | | | 0.675 | |
$3.5 billion to $10 billion | | | | 0.650 | |
Greater than $10 billion | | | | 0.625 | |
International Fund
| | | | | |
| Average Daily Net Assets | | Annual Rate |
Less than $500 million | | | | 1.000 | % |
$500 million to $750 million | | | | 0.975 | |
$750 million to $1 billion | | | | 0.950 | |
$1 billion to $12 billion | | | | 0.925 | |
Greater than $12 billion | | | | 0.900 | |
InternationalSmall-Mid Fund (Prior to December 1, 2018):
| | | | | |
| Average Daily Net Assets | | Annual Rate |
All | | | | 1.250 | % |
InternationalSmall-Mid Fund (Effective December 1 , 2018):
| | | | | |
| Average Daily Net Assets | | Annual Rate |
Less than $2 billion | | | | 1.050 | % |
$2 billion to $3 billion | | | | 1.025 | |
$3 billion to $4 billion | | | | 1.000 | |
$4 billion to $5 billion | | | | 0.975 | |
Greater than $5 billion | | | | 0.950 | |
| | |
| Artisan Partners Funds | | 123 |
NOTES TO FINANCIAL STATEMENTS
International Value Fund, Mid Cap Fund, Mid Cap Value Fund, and Small Cap Fund
| | | | | |
| Average Daily Net Assets | | Annual Rate |
Less than $500 million | | | | 1.000 | % |
$500 million to $750 million | | | | 0.975 | |
$750 million to $1 billion | | | | 0.950 | |
Greater than $1 billion | | | | 0.925 | |
Sustainable Emerging Markets Fund and Thematic Fund
| | | | | |
| Average Daily Net Assets | | Annual Rate |
Less than $1 billion | | | | 1.000 | % |
$1 billion to $2 billion | | | | 0.975 | |
$2 billion to $3.5 billion | | | | 0.950 | |
$3.5 billion to $5 billion | | | | 0.925 | |
Greater than $5 billion | | | | 0.900 | |
Value Fund
| | | | | |
| Average Daily Net Assets | | Annual Rate |
Less than $50 million | | | | 0.800 | % |
$50 million to $100 million | | | | 0.760 | |
$100 million to $500 million | | | | 0.720 | |
$500 million to $7.5 billion | | | | 0.680 | |
Greater than $7.5 billion | | | | 0.640 | |
| (b) | Expense Waivers and Reimbursements – The Adviser has contractually agreed to bear certain expenses and waive its management fees to the extent necessary to cause total annual fund operating expenses (excluding taxes, interest, all commissions and other normal charges incident to the purchase and sale of portfolio securities, acquired fund fees and expenses, borrowing costs such as dividends on securities sold short, and extraordinary charges such as litigation costs, but including management fees paid to the Adviser) not to exceed the percentages of average daily net assets indicated below. This contract continues through the date shown on the table below at which time Artisan Partners will determine whether to renew, revise or discontinue it. The table below shows the current expense limit as a percent of average daily net assets and amounts waived by the Adviser during the year ended September 30, 2019 (dollar values in thousands): |
For the year ended September 30, 2019, no operating expenses were reimbursed by the Adviser. The Funds had no material receivables from or payables to the Adviser at September 30, 2019.
| | | | | | | | | | | | | | | |
| Fund | | Expense Limit as a % of
Average Daily Net Assets | | Management Fees
Waived | | Continues
Through |
Artisan Global Discovery Fund - Investor Shares | | | | 1.50 | % | | | $ | - | | | | | January 31, 2021 | |
Artisan InternationalSmall-Mid Fund - Investor Shares(1) | | | | 1.50 | % | | | | - | | | | | January 31, 2020 | |
Artisan InternationalSmall-Mid Fund - Advisor Shares(1) | | | | 1.40 | % | | | | - | | | | | January 31, 2020 | |
Artisan InternationalSmall-Mid Fund - Institutional Shares(1) | | | | 1.35 | % | | | | - | | | | | January 31, 2020 | |
Artisan Sustainable Emerging Markets Fund - Investor Shares | | | | 1.35 | % | | | | 277 | | | | | January 31, 2021 | |
| | |
| 124 | | Artisan Partners Funds |
NOTES TO FINANCIAL STATEMENTS
| | | | | | | | | | | | | | | |
| Fund | | Expense Limit as a % of
Average Daily Net Assets | | Expenses
Waived | | Continues
Through |
Artisan Sustainable Emerging Markets Fund - Institutional Shares | | | | 1.20 | % | | | $ | 80 | | | | | January 31, 2021 | |
Artisan Thematic Fund - Investor Shares | | | | 1.50 | % | | | | - | | | | | January 31, 2021 | |
Artisan Thematic Fund - Advisor Shares | | | | 1.40 | % | | | | - | | | | | January 31, 2021 | |
Artisan Value Fund - Advisor Shares | | | | 0.88 | % | | | | 50 | | | | | January 31, 2021 | |
| | | |
(1)Effective December 1, 2018. | | | | | | | | | | | | | | | |
| (c) | Officers and Directors – The officers and directors of the Funds who are affiliated with the Adviser receive no compensation from the Funds. For the year ended September 30, 2019, directors of the Funds who are not affiliated persons of the Adviser (“independent directors”) received compensation for their services based on an annual fee of $275,000, subject to an additional increase of $10,000 upon commencement of operations of any new series of Artisan Partners Funds and a decrease of $10,000 for any terminated series of Artisan Partners Funds. |
In addition, the independent chair and each committee chair receives an annual supplemental retainer as follows:
| | | | | |
| | | Amount |
Independent board chair | | | $ | 85,000 | * |
Audit committee chair | | | $ | 45,000 | |
Governance and nominating committee chair | | | $ | 30,000 | |
Education committee chair | | | $ | 30,000 | |
|
* Prior to January 1, 2019, Independent board chair received an annual supplemental retainer of $60,000. | |
| | If more than sevenin-person meetings or four telephonic meetings are held in a calendar year, each director is paid an additional meeting attendance fee of $5,000 for each suchin-person meeting and $1,000 for each such telephonic meeting. These fees were generally allocated to each of the Funds based on net assets, subject to a minimum allocation of $1,500 to each Fund per quarter. Additionally, each director is entitled to reimbursement of expenses related to his or her duties as a director of the Funds. |
| | Artisan Partners Funds has adopted a deferred compensation plan for directors who are not affiliated persons of the Adviser that enables directors to elect to defer receipt of all or a portion of the annual compensation they are entitled to receive from the Funds. For purposes of determining the amount owed to the directors under the plan, deferred amounts were invested in shares of the Funds as selected by the individual directors. Each Fund purchased shares of the Funds selected for deferral by the directors in amounts equal to their investment, resulting in a Fund asset equal to the deferred compensation liability. Such assets were included as a component of “Other assets” on the Statements of Assets and Liabilities. Deferral of directors’ fees under the plan did not affect the net assets of the Funds, and did not materially affect the Funds’ assets, liabilities or net investment income per share. Amounts will be deferred until distributed in accordance with the plan. |
| (d) | Distribution – Shares of the Funds are offered for sale by Artisan Partners Distributors LLC (“Distributors”). Distributors is wholly owned by Artisan Holdings. All distribution expenses relating to the Funds are paid by the Adviser. |
| | |
| Artisan Partners Funds | | 125 |
NOTES TO FINANCIAL STATEMENTS
| (8) | Line of credit arrangement: |
Artisan Partners Funds is party to a line of credit agreement (“The Agreement”) with a syndicate of lenders, led by JPMorgan Chase Bank N.A., as lender and administrative agent that expires on June 10, 2020. Under the line of credit, each Fund can borrow an amount that would not exceed the lesser of (a) 33 1/3% of its adjusted net assets, with adjusted net assets being total assets less total liabilities (excluding indebtedness for borrowed money) after giving effect to the borrowing, and (b) the maximum amount the Fund is permitted to borrow pursuant to applicable law, pursuant to the Fund’s prospectus limitations on indebtedness, pursuant to any vote of the shareholders of the Fund, or pursuant to any limitation on borrowings in any applicable agreement with any governmental authority or regulator or any other applicable agreement or document to which such Fund was a party; provided that the aggregate borrowings by all the Funds may not exceed $200 million. The Funds paid a commitment fee at the annual rate of 0.15% on the unused portion of the line of credit and interest was charged on any borrowings at the highest of (i) the Eurodollar Rate, as defined in The Agreement, for aone-month interest period commencing two business days after such day (but, in any event, not less than 0.00%) plus 1.00%, (ii) the federal funds effective rate in effect on such day (but, in any event, not less than 0.00%) plus 1.00% or (iii) the overnight bank funding rate in effect on such day (but, in any event, not less than 0.00%) plus 1.00%. The Funds also paid an agent’s fee and arrangement fee to JPMorgan Chase Bank N.A. and the Funds’ and administrative agent legal expenses in connection with the line of credit, each as incurred. The fees are allocated to each Fund based on average net assets. The use of the line of credit was generally restricted to temporary borrowing for extraordinary or emergency purposes. During the year ended September 30, 2019, there were no borrowings under the line of credit for any of the Funds, except for the Global Equity Fund and Sustainable Emerging Markets Fund which had average borrowings of $6,100,000 and $828,000, respectively, with corresponding average borrowing rates of 3.52% and 3.51%, respectively. All fees and interest expense, related to the line of credit are included in other operating expenses in the Statements of Operations. There were no borrowings outstanding at September 30, 2019.
| (9) | Investment transactions: |
The cost of securities purchased and the proceeds from the sale of securities (excluding securities sold short, derivatives and short-term securities) for the year ended September 30, 2019 were as follows (in thousands):
| | | | | | | | | | |
| Fund | | Security Purchases | | Security Sales |
Developing World | | | $ | 3,541,200 | | | | $ | 3,500,599 | |
Global Discovery | | | | 60,680 | | | | | 42,058 | |
Global Equity | | | | 229,574 | | | | | 299,714 | |
Global Opportunities | | | | 1,458,290 | | | | | 1,671,653 | |
Global Value | | | | 941,651 | | | | | 1,202,528 | |
High Income | | | | 2,871,588 | | | | | 2,396,532 | |
International | | | | 4,351,639 | | | | | 6,769,736 | |
International Small-Mid | | | | 1,160,222 | | | | | 388,818 | |
International Value | | | | 3,009,600 | | | | | 3,916,831 | |
| | |
| 126 | | Artisan Partners Funds |
NOTES TO FINANCIAL STATEMENTS
| | | | | | | | | | |
| Fund | | Security Purchases | | Security Sales |
Mid Cap | | | $ | 2,431,692 | | | | $ | 3,632,102 | |
Mid Cap Value | | | | 472,357 | | | | | 1,259,317 | |
Small Cap | | | | 796,062 | | | | | 843,212 | |
Sustainable Emerging Markets | | | | 16,238 | | | | | 19,441 | |
Thematic | | | | 1,696,569 | | | | | 1,251,932 | |
Value | | | | 114,436 | | | | | 169,575 | |
| (10) | Transactions in securities of affiliates: |
The table below shows information about securities of Fund “affiliates” (as defined below) that were held by a Fund, purchased or sold by a Fund, or from which dividends were received by a Fund during the year ended September 30, 2019 (shares and dollar values in thousands). Each Fund identifies a company as an affiliate for the purpose of this report if the Fund owned voting securities that it believed represented 5% or more of that company’s outstanding voting securities (as defined by the 1940 Act) during the year ended September 30, 2019.
Transactions in securities of affiliates:
| | | | | | | | | | | | | | | | | | | | | | | | | | | | | | | | | | | | | | | | | | | | | | | |
| | | | | As of
9/30/2018 | | | | | | Net
Realized
Gain/
(Loss) | | Net Increase
(Decrease) in
Unrealized
Appreciation
or Depreciation | | As of
9/30/2019 | | Value |
| Fund | | Security | | Share
Balance | | Value | | Purchases
Cost | | Sales
Proceeds | | Dividend
Income@ | | Share
Balance |
| International Small-Mid Fund | | | | | | | | | | | | | | | | | | | | | | | | | | | | | | | | | | | | | | | | | | | | | |
| | | SyntheticMR AB† | | | | 299 | | | | $ | 13,242 | | | | $ | - | | | | $ | (9,545 | ) | | | $ | (1,952 | ) | | | $ | (1,745 | ) | | | $ | - | | | | $ | - | | | | $ | - | |
| | | Total | | | | | | | | $ | 13,242 | | | | $ | - | | | | $ | (9,545 | ) | | | $ | (1,952 | ) | | | $ | (1,745 | ) | | | $ | - | | | | $ | - | | | | $ | - | |
| International Value | | | | | | | | | | | | | | | | | | | | | | | | | | | | | | | | | | | | | | | | | | | | | |
| | | Arch Capital Group Ltd.*† | | | | 20,447 | | | | $ | 609,528 | | | | $ | 1,467 | | | | $ | (93,445 | ) | | | $ | 18,467 | | | | $ | 210,985 | | | | $ | - | | | | $ | 17,794 | | | | $ | 747,002 | |
| | | Panalpina Welttransport Holding AG† | | | | 2,295 | | | | | 334,457 | | | | | - | | | | | (231,383 | ) | | | | 10,710 | | | | | (113,784 | ) | | | | - | | | | | - | | | | | - | |
| | | Total# | | | | | | | | $ | 943,985 | | | | $ | 1,467 | | | | $ | (324,828 | ) | | | $ | 29,177 | | | | $ | 97,201 | | | | $ | - | | | | $ | - | | | | $ | - | |
| @ | | Net of foreign taxes withheld, if any. |
| † | | Issuer was not an affiliate as of September 30, 2019. |
| * | | Non-income producing security. |
| # | | Total value as of September 30, 2019 is presented only for those issuers that were affiliates as of September 30, 2019. |
| | |
| Artisan Partners Funds | | 127 |
NOTES TO FINANCIAL STATEMENTS
| (11) | Information for Federal income tax purposes: |
For Federal income tax purposes, the cost of investments, gross unrealized appreciation, gross unrealized depreciation and net unrealized appreciation (depreciation) on investments as of September 30, 2019 was as follows (in thousands):
| | | | | | | | | | | | | | | | | | | | |
| Fund | | Cost of
Investments | | Gross
Unrealized
Appreciation | | Gross
Unrealized
Depreciation | | Net
Unrealized
Appreciation
on Investments |
Developing World | | | $ | 2,150,936 | | | | $ | 510,268 | | | | $ | (33,003 | ) | | | $ | 477,265 | |
Global Discovery | | | | 91,736 | | | | | 17,306 | | | | | (2,028 | ) | | | | 15,278 | |
Global Equity | | | | 198,257 | | | | | 62,589 | | | | | (7,070 | ) | | | | 55,519 | |
Global Opportunities | | | | 2,657,866 | | | | | 778,250 | | | | | (50,001 | ) | | | | 728,249 | |
Global Value | | | | 2,670,186 | | | | | 548,518 | | | | | (158,006 | ) | | | | 390,512 | |
High Income | | | | 3,719,774 | | | | | 109,443 | | | | | (101,053 | ) | | | | 8,390 | |
International | | | | 7,934,948 | | | | | 2,790,351 | | | | | (186,114 | ) | | | | 2,604,237 | |
InternationalSmall-Mid | | | | 1,125,783 | | | | | 142,864 | | | | | (47,937 | ) | | | | 94,927 | |
International Value | | | | 12,472,841 | | | | | 2,718,787 | | | | | (1,036,101 | ) | | | | 1,682,686 | |
Mid Cap | | | | 3,630,676 | | | | | 1,596,264 | | | | | (166,960 | ) | | | | 1,429,304 | |
Mid Cap Value | | | | 1,605,184 | | | | | 752,605 | | | | | (90,138 | ) | | | | 662,467 | |
Small Cap | | | | 1,312,933 | | | | | 564,086 | | | | | (35,555 | ) | | | | 528,531 | |
Sustainable Emerging Markets | | | | 47,749 | | | | | 14,377 | | | | | (10,585 | ) | | | | 3,792 | |
Thematic | | | | 648,770 | | | | | 44,349 | | | | | (3,355 | ) | | | | 40,994 | |
Value | | | | 306,452 | | | | | 112,005 | | | | | (6,937 | ) | | | | 105,068 | |
The difference between cost of investments for financial reporting and cost of investments for Federal income tax purposes was due primarily to timing differences in recognizing certain gains and losses on security transactions (e.g., wash sale loss deferrals and passive foreign investment company transactions).
The tax characterization of ordinary income dividends and long-term capital gain distributions paid during the year ended September 30, 2019 and the year ended September 30, 2018 were as follows (in thousands):
| | | | | | | | | | | | | | | | | | | | |
| | | Year Ended
9/30/2019 | | Year Ended
9/30/2018 |
| Fund | | Ordinary
Income
Dividends | | Long-Term
Capital Gain
Distributions | | Ordinary
Income
Dividends | | Long-Term
Capital Gain
Distributions |
Developing World | | | $ | 884 | | | | $ | - | | | | $ | 50,440 | | | | $ | 19,327 | |
Global Discovery | | | | - | | | | | - | | | | | 90 | | | | | - | |
Global Equity | | | | 19,425 | | | | | 21,880 | | | | | 865 | | | | | 1,215 | |
Global Opportunities | | | | 164 | | | | | 193,323 | | | | | 2,036 | | | | | 113,026 | |
Global Value | | | | 58,023 | | | | | 140,737 | | | | | 45,330 | | | | | 22,690 | |
| | |
| 128 | | Artisan Partners Funds |
NOTES TO FINANCIAL STATEMENTS
| | | | | | | | | | | | | | | | | | | | |
| | | Year Ended
9/30/2019 | | Year Ended
9/30/2018 |
| Fund | | Ordinary
Income
Dividends | | Long-Term
Capital Gain
Distributions | | Ordinary
Income
Dividends | | Long-Term
Capital Gain
Distributions |
High Income | | | $ | 224,141 | | | | $ | 9,473 | | | | $ | 204,540 | | | | $ | 8,692 | |
International | | | | 155,282 | | | | | 840,199 | | | | | 113,694 | | | | | - | |
InternationalSmall-Mid | | | | 24,199 | | | | | 80,629 | | | | | 577 | | | | | 62,120 | |
International Value | | | | 323,055 | | | | | 518,027 | | | | | 215,160 | | | | | 390,454 | |
Mid Cap | | | | 49,923 | | | | | 958,692 | | | | | - | | | | | 868,734 | |
Mid Cap Value | | | | 11,916 | | | | | 384,445 | | | | | 29,409 | | | | | 350,487 | |
Small Cap | | | | 3,057 | | | | | 241,896 | | | | | - | | | | | 187,338 | |
Sustainable Emerging Markets | | | | 483 | | | | | - | | | | | 282 | | | | | - | |
Thematic | | | | 6,488 | | | | | - | | | | | 1,606 | | | | | - | |
Value | | | | 7,316 | | | | | 50,696 | | | | | 14,966 | | | | | 46,256 | |
Ordinary income dividends and long-term capital gain distributions were determined in accordance with income tax regulations that impose treatment that is different from the treatment that would result from the application of US GAAP for such items as net short-term gains, wash sale loss deferrals, passive foreign investment company transactions, foreign currency transactions, net investment losses and qualified late year ordinary losses.
Gains on redemptions in-kind for Global Value Fund, International Fund, and Mid Cap Fund of approximately $62,008,000, $12,735,000, and $24,571,000, respectively, were included in net realized gain on investments in the Statements of Operations for the year ended September 30, 2019, and were not recognized for Federal income tax purposes. These net realized gains represent permanent book/tax differences and have been reclassified to “Fund shares issued and outstanding” on the accompanying Statements of Assets and Liabilities.
In addition, the Funds may periodically record reclassifications among certain capital accounts to reflect differences between financial reporting and income tax basis distributions. The reclassifications were recorded in order to reflect the tax treatment for certain permanent differences that exist between income tax regulations and US GAAP. The reclassifications generally relate to net operating losses, Section 988 currency gains and losses, PFIC gains and losses, and utilization of earnings and profits distributed to shareholders on redemption of Fund shares. These reclassifications have no impact on the net asset values of the Funds.
In order to meet certain excise tax distribution requirements, the Funds are required to measure and distribute annually, net capital gains realized during a twelve-month period ending October 31 and net investment income earned during a twelve-month period ending December 31. In connection with these requirements, the Funds are permitted for tax purposes to defer into their next fiscal year qualified late year losses. Qualified late year capital losses are any net capital losses incurred between November 1 and the end of the Funds’ fiscal year, September 30, 2019. Qualified late year ordinary losses are specified losses generally incurred between January 1 and the end of the Funds’ fiscal year, September 30, 2019.
| | |
| Artisan Partners Funds | | 129 |
NOTES TO FINANCIAL STATEMENTS
Additional tax information as of and for the year ended September 30, 2019 follows (in thousands):
| | | | | | | | | | | | | | | | | | | | | | | | | |
| Fund | | Undistributed
Ordinary
Income | | Undistributed
Long-Term
Gain | | Qualified
Late Year
Capital
Losses | | Qualified
Late Year
Ordinary
Losses | | Other
Deferred
Gains
(Losses)(1) |
Developing World | | | $ | - | | | | $ | - | | | | $ | - | | | | $ | 2,544 | | | | $ | (70 | ) |
Global Discovery | | | | - | | | | | - | | | | | - | | | | | 379 | | | | | (4 | ) |
Global Equity | | | | 34 | | | | | 11,916 | | | | | - | | | | | - | | | | | (12 | ) |
Global Opportunities | | | | 3,683 | | | | | 215,306 | | | | | - | | | | | - | | | | | (109 | ) |
Global Value | | | | 39,947 | | | | | - | | | | | 38,940 | | | | | - | | | | | (122 | ) |
High Income | | | | - | | | | | - | | | | | 57,085 | | | | | - | | | | | (104 | ) |
International | | | | 108,895 | | | | | 356,783 | | | | | - | | | | | - | | | | | (590 | ) |
InternationalSmall-Mid | | | | 980 | | | | | - | | | | | 13,040 | | | | | - | | | | | (29 | ) |
International Value | | | | 95,784 | | | | | 326,940 | | | | | - | | | | | - | | | | | (573 | ) |
Mid Cap | | | | - | | | | | 458,474 | | | | | - | | | | | 18,249 | | | | | (286 | ) |
Mid Cap Value | | | | 9,591 | | | | | 203,824 | | | | | - | | | | | - | | | | | (181 | ) |
Small Cap | | | | - | | | | | 145,607 | | | | | - | | | | | 10,283 | | | | | (64 | ) |
Sustainable Emerging Markets | | | | 602 | | | | | - | | | | | - | | | | | - | | | | | (7 | ) |
Thematic | | | | 28,700 | | | | | - | | | | | - | | | | | - | | | | | (3,980 | ) |
Value | | | | 4,009 | | | | | 6,883 | | | | | - | | | | | - | | | | | (28 | ) |
| (1) | | Other deferred gains and losses relate to (a) distribution payable at year end and (b) other items. |
As of September 30, 2019, the Funds had capital loss carryovers shown in the table below (in thousands). To the extent the Funds realize future net capital gains, those gains will be offset by any unused capital loss carryover.
| | | | | | | | | | | | | | | |
| Fund | | Unexpiring – ST | | Unexpiring – LT | | Utilized in CY |
Developing World Fund | | | $ | 15,081 | | | | $ | - | | | | $ | - | |
Global Discovery Fund | | | | 752 | | | | | - | | | | | - | |
Sustainable Emerging Markets | | | | 6,152 | (1) | | | | 126,933 | (1) | | | | - | |
| (1) | | Due to an equity shift in the ordinary course of business, the utilization of certain capital loss carryovers is subject to annual limitations of $1,323, pursuant to IRC Section 382-383. |
| (12) | Fund share activities: |
Capital share transactions for the Funds were as follows (dollar values in thousands):
| | | | | | | | | | | | | | | | | | | | |
| | | DEVELOPING WORLD |
| | | Year Ended
9/30/2019 | | Year Ended
9/30/2018 |
| | | Shares | | Amount | | Shares | | Amount |
| Proceeds from shares issued | | | | | | | | | | | | | | | | | | | | |
Investor Shares | | | | 10,823,456 | | | | $ | 137,819 | | | | | 10,059,119 | | | | $ | 125,081 | |
Advisor Shares | | | | 55,107,662 | | | | | 703,128 | | | | | 46,099,312 | | | | | 578,570 | |
Institutional Shares | | | | 23,125,642 | | | | | 305,820 | | | | | 18,120,657 | | | | | 230,737 | |
| | |
| 130 | | Artisan Partners Funds |
NOTES TO FINANCIAL STATEMENTS
| | | | | | | | | | | | | | | | | | | | |
| | | DEVELOPING WORLD |
| | | Year Ended
9/30/2019 | | Year Ended
9/30/2018 |
| | | Shares | | Amount | | Shares | | Amount |
| Net asset value of shares issued in reinvestment of dividends and distributions | | | | | | | | | | | | | | | | | | | | |
Investor Shares | | | | 4,176 | | | | $ | 45 | | | | | 1,377,040 | | | | $ | 17,447 | |
Advisor Shares | | | | 54,828 | | | | | 587 | | | | | 2,095,611 | | | | | 26,615 | |
Institutional Shares | | | | 15,022 | | | | | 161 | | | | | 1,263,067 | | | | | 16,066 | |
| Cost of shares redeemed | | | | | | | | | | | | | | | | | | | | |
Investor Shares | | | | (34,620,833 | ) | | | | (419,240 | ) | | | | (9,211,887 | ) | | | | (112,853 | ) |
Advisor Shares | | | | (29,796,271 | ) | | | | (357,426 | ) | | | | (15,546,970 | ) | | | | (189,227 | ) |
Institutional Shares | | | | (23,187,676 | ) | | | | (270,272 | ) | | | | (11,837,626 | ) | | | | (144,233 | ) |
| Net increase (decrease) from fund share transactions | | | | | | | | | | | | | | | | | | | | |
Investor Shares | | | | (23,793,201 | ) | | | | (281,376 | ) | | | | 2,224,272 | | | | | 29,675 | |
Advisor Shares | | | | 25,366,219 | | | | | 346,289 | | | | | 32,647,953 | | | | | 415,958 | |
Institutional Shares | | | | (47,012 | ) | | | | 35,709 | | | | | 7,546,098 | | | | | 102,570 | |
| |
| | | GLOBAL DISCOVERY |
| | | Year Ended
9/30/2019 | | Year Ended
9/30/2018 |
| | | Shares | | Amount | | Shares | | Amount |
| Proceeds from shares issued | | | | | | | | | | | | | | | | | | | | |
Investor Shares | | | | 2,378,587 | | | | $ | 29,701 | | | | | 4,921,088 | | | | $ | 57,769 | |
| Net asset value of shares issued in reinvestment of dividends and distributions | | | | | | | | | | | | | | | | | | | | |
Investor Shares | | | | - | | | | | - | | | | | 8,470 | | | | | 90 | |
| Cost of shares redeemed | | | | | | | | | | | | | | | | | | | | |
Investor Shares | | | | (435,055 | ) | | | | (5,372 | ) | | | | (130,889 | ) | | | | (1,507 | ) |
| Net increase (decrease) from fund share transactions | | | | | | | | | | | | | | | | | | | | |
Investor Shares | | | | 1,943,532 | | | | | 24,329 | | | | | 4,798,669 | | | | | 56,352 | |
| | | | |
| Footnotes are presented on Page 138. | | | | | | | | | | | | | | | | | | | | |
| |
| | | GLOBAL EQUITY |
| | | Year Ended
9/30/2019 | | Year Ended
9/30/2018 |
| | | Shares | | Amount | | Shares | | Amount |
| Proceeds from shares issued | | | | | | | | | | | | | | | | | | | | |
Investor Shares | | | | 731,933 | | | | $ | 14,016 | | | | | 894,923 | | | | $ | 19,211 | |
Institutional Shares | | | | 171,143 | | | | | 3,413 | | | | | 2,446,487 | | | | | 52,725 | |
| Net asset value of shares issued in reinvestment of dividends and distributions | | | | | | | | | | | | | | | | | | | | |
Investor Shares | | | | 941,420 | | | | | 16,381 | | | | | 43,999 | | | | | 905 | |
Institutional Shares | | | | 1,202,762 | | | | | 21,000 | | | | | 43,773 | | | | | 904 | |
| Cost of shares redeemed | | | | | | | | | | | | | | | | | | | | |
Investor Shares | | | | (1,336,032 | ) | | | | (25,358 | ) | | | | (2,227,243 | ) | | | | (47,781 | ) |
Institutional Shares | | | | (3,437,662 | ) | | | | (61,868 | ) | | | | (1,972,458 | ) | | | | (43,262 | ) |
| Net increase (decrease) from fund share transactions | | | | | | | | | | | | | | | | | | | | |
Investor Shares | | | | 337,321 | | | | | 5,039 | | | | | (1,288,321 | ) | | | | (27,665 | ) |
Institutional Shares | | | | (2,063,757 | ) | | | | (37,455 | ) | | | | 517,802 | | | | | 10,367 | |
| | |
| Artisan Partners Funds | | 131 |
NOTES TO FINANCIAL STATEMENTS
| | | | | | | | | | | | | | | | | | | | |
| | | GLOBAL OPPORTUNITIES |
| | | Year Ended
9/30/2019 | | Year Ended
9/30/2018 |
| | | Shares | | Amount | | Shares | | Amount |
| Proceeds from shares issued | | | | | | | | | | | | | | | | | | | | |
Investor Shares | | | | 10,488,574 | | | | $ | 261,783 | | | | | 13,726,994 | | | | $ | 367,897 | |
Advisor Shares | | | | 10,439,536 | | | | | 260,719 | | | | | 8,769,136 | | | | | 236,035 | |
Institutional Shares | | | | 7,224,185 | | | | | 185,549 | | | | | 15,967,423 | | | | | 430,512 | |
| Net asset value of shares issued in reinvestment of dividends and distributions | | | | | | | | | | | | | | | | | | | | |
Investor Shares | | | | 2,997,356 | | | | | 66,661 | | | | | 1,584,555 | | | | | 40,295 | |
Advisor Shares | | | | 1,201,182 | | | | | 26,822 | | | | | 568,901 | | | | | 14,501 | |
Institutional Shares | | | | 3,965,498 | | | | | 89,343 | | | | | 2,083,657 | | | | | 53,509 | |
| Cost of shares redeemed | | | | | | | | | | | | | | | | | | | | |
Investor Shares | | | | (17,107,731 | ) | | | | (425,648 | ) | | | | (10,703,492 | ) | | | | (285,816 | ) |
Advisor Shares | | | | (10,015,864 | ) | | | | (239,082 | ) | | | | (3,796,036 | ) | | | | (101,634 | ) |
Institutional Shares | | | | (7,129,637 | ) | | | | (179,093 | ) | | | | (10,606,879 | ) | | | | (281,810 | ) |
| Net increase (decrease) from fund share transactions | | | | | | | | | | | | | | | | | | | | |
Investor Shares | | | | (3,621,801 | ) | | | | (97,204 | ) | | | | 4,608,057 | | | | | 122,376 | |
Advisor Shares | | | | 1,624,854 | | | | | 48,459 | | | | | 5,542,001 | | | | | 148,902 | |
Institutional Shares | | | | 4,060,046 | | | | | 95,799 | | | | | 7,444,201 | | | | | 202,211 | |
| | | | |
| Footnotes are presented on Page 138. | | | | | | | | | | | | | | | | | | | | |
| |
| | | GLOBAL VALUE |
| | | Year Ended
9/30/2019 | | Year Ended
9/30/2018 |
| | | Shares | | Amount | | Shares | | Amount |
| Proceeds from shares issued | | | | | | | | | | | | | | | | | | | | |
Investor Shares | | | | 4,783,247 | | | | $ | 78,302 | | | | | 8,171,141 | | | | $ | 148,960 | |
Advisor Shares | | | | 13,166,159 | | | | | 215,279 | | | | | 16,504,741 | | | | | 299,868 | |
Institutional Shares | | | | 26,324,214 | | | | | 444,741 | | | | | 47,575,164 | | | | | 874,432 | |
| Net asset value of shares issued in reinvestment of dividends and distributions | | | | | | | | | | | | | | | | | | | | |
Investor Shares | | | | 2,203,257 | | | | | 34,745 | | | | | 862,022 | | | | | 15,430 | |
Advisor Shares | | | | 2,494,520 | | | | | 39,239 | | | | | 878,354 | | | | | 15,687 | |
Institutional Shares | | | | 7,205,226 | | | | | 113,554 | | | | | 1,801,378 | | | | | 32,227 | |
| Cost of shares redeemed | | | | | | | | | | | | | | | | | | | | |
Investor Shares | | | | (17,156,092 | ) | | | | (282,202 | ) | | | | (14,714,980 | ) | | | | (267,531 | ) |
Advisor Shares | | | | (27,340,625 | ) | | | | (438,508 | ) | | | | (15,263,386 | ) | | | | (277,204 | ) |
Institutional Shares | | | | (35,904,636 | ) | | | | (606,073 | ) | | | | (14,264,894 | ) | | | | (258,824 | ) |
| Net increase from fund share transactions | | | | | | | | | | | | | | | | | | | | |
Investor Shares | | | | (10,169,588 | ) | | | | (169,155 | ) | | | | (5,681,817 | ) | | | | (103,141 | ) |
Advisor Shares | | | | (11,679,946 | ) | | | | (183,990 | ) | | | | 2,119,709 | | | | | 38,351 | |
Institutional Shares | | | | (2,375,196 | ) | | | | (47,778 | ) | | | | 35,111,648 | | | | | 647,835 | |
| | |
| 132 | | Artisan Partners Funds |
NOTES TO FINANCIAL STATEMENTS
| | | | | | | | | | | | | | | | | | | | |
| | | HIGH INCOME |
| | | Year Ended
9/30/2019 | | Year Ended
9/30/2018 |
| | | Shares | | Amount | | Shares | | Amount |
| Proceeds from shares issued | | | | | | | | | | | | | | | | | | | | |
Investor Shares | | | | 40,068,585 | | | | $ | 383,620 | | | | | 52,982,023 | | | | $ | 525,563 | |
Advisor Shares | | | | 101,573,843 | | | | | 975,734 | | | | | 90,626,264 | | | | | 894,455 | |
Institutional Shares | | | | 54,800,505 | | | | | 525,586 | | | | | 14,181,878 | | | | | 140,330 | |
| Net asset value of shares issued in reinvestment of dividends and distributions | | | | | | | | | | | | | | | | | | | | |
Investor Shares | | | | 7,166,820 | | | | | 68,535 | | | | | 6,054,891 | | | | | 59,913 | |
Advisor Shares | | | | 11,187,807 | | | | | 106,928 | | | | | 10,210,062 | | | | | 101,122 | |
Institutional Shares | | | | 1,939,438 | | | | | 18,549 | | | | | 1,479,716 | | | | | 14,633 | |
| Cost of shares redeemed(1) | | | | | | | | | | | | | | | | | | | | |
Investor Shares | | | | (56,815,106 | ) | | | | (545,615 | ) | | | | (21,064,786 | ) | | | | (208,470 | ) |
Advisor Shares | | | | (85,331,929 | ) | | | | (813,883 | ) | | | | (53,046,958 | ) | | | | (525,731 | ) |
Institutional Shares | | | | (11,442,251 | ) | | | | (108,779 | ) | | | | (12,099,222 | ) | | | | (119,827 | ) |
| Net increase (decrease) from fund share transactions | | | | | | | | | | | | | | | | | | | | |
Investor Shares | | | | (9,579,701 | ) | | | | (93,460 | ) | | | | 37,972,128 | | | | | 377,006 | |
Advisor Shares | | | | 27,429,721 | | | | | 268,779 | | | | | 47,789,368 | | | | | 469,846 | |
Institutional Shares | | | | 45,297,692 | | | | | 435,356 | | | | | 3,562,372 | | | | | 35,136 | |
| Redemption Fees | | | | | | | | | | | | | | | | | | | | |
Investor Shares | | | | | | | | | 182 | | | | | | | | | | 66 | |
Advisor Shares | | | | | | | | | 60 | | | | | | | | | | 135 | |
Institutional Shares | | | | | | | | | 51 | | | | | | | | | | 22 | |
| | | | |
| Footnotes are presented on Page 138. | | | | | | | | | | | | | | | | | | | | |
| |
| | | INTERNATIONAL |
| | | Year Ended
9/30/2019 | | Year Ended
9/30/2018 |
| | | Shares | | Amount | | Shares | | Amount |
| Proceeds from shares issued | | | | | | | | | | | | | | | | | | | | |
Investor Shares | | | | 10,706,655 | | | | $ | 317,165 | | | | | 12,231,661 | | | | $ | 410,685 | |
Advisor Shares | | | | 15,483,004 | | | | | 460,976 | | | | | 19,209,481 | | | | | 645,784 | |
Institutional Shares | | | | 23,207,787 | | | | | 699,493 | | | | | 42,106,834 | | | | | 1,418,636 | |
| Net asset value of shares issued in reinvestment of dividends and distributions | | | | | | | | | | | | | | | | | | | | |
Investor Shares | | | | 11,600,621 | | | | | 323,778 | | | | | 1,064,716 | | | | | 35,370 | |
Advisor Shares | | | | 5,691,388 | | | | | 158,391 | | | | | 488,021 | | | | | 16,173 | |
Institutional Shares | | | | 14,686,471 | | | | | 411,662 | | | | | 1,481,697 | | | | | 49,444 | |
| Cost of shares redeemed | | | | | | | | | | | | | | | | | | | | |
Investor Shares | | | | (43,606,751 | ) | | | | (1,300,908 | ) | | | | (51,871,032 | ) | | | | (1,741,579 | ) |
Advisor Shares | | | | (25,940,371 | ) | | | | (771,962 | ) | | | | (22,045,534 | ) | | | | (739,129 | ) |
Institutional Shares | | | | (72,474,184 | ) | | | | (2,198,913 | ) | | | | (51,674,141 | ) | | | | (1,749,027 | ) |
| Net increase (decrease) from fund share transactions | | | | | | | | | | | | | | | | | | | | |
Investor Shares | | | | (21,299,475 | ) | | | | (659,965 | ) | | | | (38,574,655 | ) | | | | (1,295,524 | ) |
Advisor Shares | | | | (4,765,979 | ) | | | | (152,595 | ) | | | | (2,348,032 | ) | | | | (77,172 | ) |
Institutional Shares | | | | (34,579,926 | ) | | | | (1,087,758 | ) | | | | (8,085,610 | ) | | | | (280,947 | ) |
| | |
| Artisan Partners Funds | | 133 |
NOTES TO FINANCIAL STATEMENTS
| | | | | | | | | | | | | | | | | | | | |
| | | INTERNATIONALSMALL-MID |
| | | Year Ended
9/30/2019 | | Year Ended
9/30/2018 |
| | | Shares | | Amount | | Shares | | Amount |
| Proceeds from shares issued | | | | | | | | | | | | | | | | | | | | |
Investor Shares | | | | 19,570,891 | | | | $ | 259,647 | | | | | 537,522 | | | | $ | 12,628 | |
Advisor Shares(2) | | | | 34,266,775 | | | | | 445,781 | | | | | - | | | | | - | |
Institutional Shares | | | | 44,341,958 | | | | | 568,478 | | | | | 2,344,430 | | | | | 56,281 | |
| Net asset value of shares issued in reinvestment of dividends and distributions | | | | | | | | | | | | | | | | | | | | |
Investor Shares | | | | 6,042,101 | | | | | 71,297 | | | | | 1,564,424 | | | | | 34,589 | |
Institutional Shares | | | | 2,321,129 | | | | | 27,645 | | | | | 1,019,667 | | | | | 22,627 | |
| Cost of shares redeemed | | | | | | | | | | | | | | | | | | | | |
Investor Shares | | | | (22,272,988 | ) | | | | (303,209 | ) | | | | (4,833,359 | ) | | | | (114,365 | ) |
Advisor Shares(2) | | | | (2,338,419 | ) | | | | (30,810 | ) | | | | - | | | | | - | |
Institutional Shares | | | | (9,902,299 | ) | | | | (165,078 | ) | | | | (6,227,618 | ) | | | | (149,278 | ) |
| Net increase (decrease) from fund share transactions | | | | | | | | | | | | | | | | | | | | |
Investor Shares | | | | 3,340,004 | | | | | 27,735 | | | | | (2,731,413 | ) | | | | (67,148 | ) |
Advisor Shares(2) | | | | 31,928,356 | | | | | 414,971 | | | | | - | | | | | - | |
Institutional Shares | | | | 36,760,788 | | | | | 431,045 | | | | | (2,863,521 | ) | | | | (70,370 | ) |
| | | | |
| Footnotes are presented on Page 138. | | | | | | | | | | | | | | | | | | | | |
| |
| | | INTERNATIONAL VALUE |
| | | Year Ended
9/30/2019 | | Year Ended
9/30/2018 |
| | | Shares | | Amount | | Shares | | Amount |
| Proceeds from shares issued | | | | | | | | | | | | | | | | | | | | |
Investor Shares | | | | 17,181,741 | | | | $ | 566,870 | | | | | 16,174,770 | | | | $ | 615,911 | |
Advisor Shares | | | | 55,930,382 | | | | | 1,883,823 | | | | | 46,636,344 | | | | | 1,755,719 | |
Institutional Shares | | | | 53,977,435 | | | | | 1,838,927 | | | | | 50,015,872 | | | | | 1,924,457 | |
| Net asset value of shares issued in reinvestment of dividends and distributions | | | | | | | | | | | | | | | | | | | | |
Investor Shares | | | | 4,667,506 | | | | | 151,018 | | | | | 3,852,996 | | | | | 146,915 | |
Advisor Shares | | | | 6,951,902 | | | | | 224,468 | | | | | 4,179,121 | | | | | 159,141 | |
Institutional Shares | | | | 11,815,554 | | | | | 383,339 | | | | | 6,596,633 | | | | | 252,189 | |
| Cost of shares redeemed | | | | | | | | | | | | | | | | | | | | |
Investor Shares | | | | (34,155,527 | ) | | | | (1,142,463 | ) | | | | (39,825,069 | ) | | | | (1,504,667 | ) |
Advisor Shares | | | | (65,424,379 | ) | | | | (2,193,737 | ) | | | | (34,270,041 | ) | | | | (1,307,775 | ) |
Institutional Shares | | | | (57,769,381 | ) | | | | (1,948,940 | ) | | | | (19,495,925 | ) | | | | (738,718 | ) |
| Net increase from fund share transactions | | | | | | | | | | | | | | | | | | | | |
Investor Shares | | | | (12,306,280 | ) | | �� | | (424,575 | ) | | | | (19,797,303 | ) | | | | (741,841 | ) |
Advisor Shares | | | | (2,542,095 | ) | | | | (85,446 | ) | | | | 16,545,424 | | | | | 607,085 | |
Institutional Shares | | | | 8,023,608 | | | | | 273,326 | | | | | 37,116,580 | | | | | 1,437,928 | |
| | |
| 134 | | Artisan Partners Funds |
NOTES TO FINANCIAL STATEMENTS
| | | | | | | | | | | | | | | | | | | | |
| | | MID CAP |
| | | Year Ended
9/30/2019 | | Year Ended
9/30/2018 |
| | | Shares | | Amount | | Shares | | Amount |
| Proceeds from shares issued | | | | | | | | | | | | | | | | | | | | |
Investor Shares | | | | 7,019,704 | | | | $ | 246,165 | | | | | 9,266,909 | | | | $ | 385,999 | |
Advisor Shares | | | | 4,547,679 | | | | | 156,900 | | | | | 4,935,883 | | | | | 202,980 | |
Institutional Shares | | | | 15,492,066 | | | | | 609,991 | | | | | 12,754,032 | | | | | 567,882 | |
| Net asset value of shares issued in reinvestment of dividends and distributions | | | | | | | | | | | | | | | | | | | | |
Investor Shares | | | | 10,474,763 | | | | | 310,996 | | | | | 7,652,678 | | | | | 290,725 | |
Advisor Shares | | | | 3,462,860 | | | | | 103,539 | | | | | 1,953,425 | | | | | 74,562 | |
Institutional Shares | | | | 13,653,184 | | | | | 452,057 | | | | | 9,741,704 | | | | | 402,820 | |
| Cost of shares redeemed | | | | | | | | | | | | | | | | | | | | |
Investor Shares | | | | (19,140,419 | ) | | | | (652,918 | ) | | | | (25,721,010 | ) | | | | (1,058,185 | ) |
Advisor Shares | | | | (10,871,038 | ) | | | | (385,708 | ) | | | | (6,245,937 | ) | | | | (256,861 | ) |
Institutional Shares | | | | (28,131,526 | ) | | | | (1,077,496 | ) | | | | (40,436,435 | ) | | | | (1,798,026 | ) |
| Net increase (decrease) from fund share transactions | | | | | | | | | | | | | | | | | | | | |
Investor Shares | | | | (1,645,952 | ) | | | | (95,757 | ) | | | | (8,801,423 | ) | | | | (381,461 | ) |
Advisor Shares | | | | (2,860,499 | ) | | | | (125,269 | ) | | | | 643,371 | | | | | 20,681 | |
Institutional Shares | | | | 1,013,724 | | | | | (15,448 | ) | | | | (17,940,699 | ) | | | | (827,324 | ) |
| | | | |
| Footnotes are presented on Page 138. | | | | | | | | | | | | | | | | | | | | |
| |
| | | MID CAP VALUE |
| | | Year Ended
9/30/2019 | | Year Ended
9/30/2018 |
| | | Shares | | Amount | | Shares | | Amount |
| Proceeds from shares issued | | | | | | | | | | | | | | | | | | | | |
Investor Shares | | | | 4,118,149 | | | | $ | 78,810 | | | | | 6,708,755 | | | | $ | 154,486 | |
Advisor Shares | | | | 6,129,279 | | | | | 115,969 | | | | | 12,606,232 | | | | | 291,525 | |
Institutional Shares | | | | 7,859,752 | | | | | 147,544 | | | | | 11,481,376 | | | | | 267,039 | |
| Net asset value of shares issued in reinvestment of dividends and distributions | | | | | | | | | | | | | | | | | | | | |
Investor Shares | | | | 6,988,947 | | | | | 128,812 | | | | | 7,240,181 | | | | | 158,850 | |
Advisor Shares | | | | 6,302,400 | | | | | 115,775 | | | | | 4,486,111 | | | | | 98,201 | |
Institutional Shares | | | | 6,423,116 | | | | | 118,057 | | | | | 4,163,714 | | | | | 91,185 | |
| Cost of shares redeemed | | | | | | | | | | | | | | | | | | | | |
Investor Shares | | | | (23,499,458 | ) | | | | (454,175 | ) | | | | (40,643,257 | ) | | | | (938,576 | ) |
Advisor Shares | | | | (20,993,417 | ) | | | | (397,077 | ) | | | | (20,657,441 | ) | | | | (479,704 | ) |
Institutional Shares | | | | (18,960,199 | ) | | | | (361,316 | ) | | | | (14,128,650 | ) | | | | (324,314 | ) |
| Net increase (decrease) from fund share transactions | | | | | | | | | | | | | | | | | | | | |
Investor Shares | | | | (12,392,362 | ) | | | | (246,553 | ) | | | | (26,694,321 | ) | | | | (625,240 | ) |
Advisor Shares | | | | (8,561,738 | ) | | | | (165,333 | ) | | | | (3,565,098 | ) | | | | (89,978 | ) |
Institutional Shares | | | | (4,677,331 | ) | | | | (95,715 | ) | | | | 1,516,440 | | | | | 33,910 | |
| | |
| Artisan Partners Funds | | 135 |
NOTES TO FINANCIAL STATEMENTS
| | | | | | | | | | | | | | | | | | | | |
| | | SMALL CAP |
| | | Year Ended
9/30/2019 | | Year Ended
9/30/2018 |
| | | Shares | | Amount | | Shares | | Amount |
| Proceeds from shares issued | | | | | | | | | | | | | | | | | | | | |
Investor Shares | | | | 7,446,889 | | | | $ | 230,298 | | | | | 1,412,985 | | | | $ | 48,605 | |
Advisor Shares | | | | 9,266,354 | | | | | 302,352 | | | | | 3,692,268 | | | | | 126,758 | |
Institutional Shares | | | | 5,187,271 | | | | | 170,869 | | | | | 7,818,442 | | | | | 266,957 | |
| Net asset value of shares issued in reinvestment of dividends and distributions | | | | | | | | | | | | | | | | | | | | |
Investor Shares | | | | 2,430,870 | | | | | 66,436 | | | | | 2,026,759 | | | | | 62,201 | |
Advisor Shares | | | | 2,463,339 | | | | | 67,520 | | | | | 1,554,204 | | | | | 47,745 | |
Institutional Shares | | | | 2,991,395 | | | | | 83,221 | | | | | 1,925,549 | | | | | 59,885 | |
| Cost of shares redeemed | | | | | | | | | | | | | | | | | | | | |
Investor Shares | | | | (4,158,119 | ) | | | | (129,235 | ) | | | | (4,443,679 | ) | | | | (148,652 | ) |
Advisor Shares | | | | (6,729,775 | ) | | | | (216,222 | ) | | | | (2,211,217 | ) | | | | (76,903 | ) |
Institutional Shares | | | | (9,973,734 | ) | | | | (327,625 | ) | | | | (3,802,704 | ) | | | | (129,628 | ) |
| Net increase (decrease) from fund share transactions | | | | | | | | | | | | | | | | | | | | |
Investor Shares | | | | 5,719,640 | | | | | 167,499 | | | | | (1,003,935 | ) | | | | (37,846 | ) |
Advisor Shares | | | | 4,999,918 | | | | | 153,650 | | | | | 3,035,255 | | | | | 97,600 | |
Institutional Shares | | | | (1,795,068 | ) | | | | (73,535 | ) | | | | 5,941,287 | | | | | 197,214 | |
| | | | |
| Footnotes are presented on Page 138. | | | | | | | | | | | | | | | | | | | | |
| |
| | | SUSTAINABLE EMERGING MARKETS |
| | | Year Ended
9/30/2019 | | Year Ended
9/30/2018 |
| | | Shares | | Amount | | Shares | | Amount |
| Proceeds from shares issued | | | | | | | | | | | | | | | | | | | | |
Investor Shares | | | | 791,333 | | | | $ | 11,736 | | | | | 1,266,888 | | | | $ | 20,884 | |
Institutional Shares | | | | 174,596 | | | | | 2,502 | | | | | 97,462 | | | | | 1,556 | |
| Net asset value of shares issued in reinvestment of dividends and distributions | | | | | | | | | | | | | | | | | | | | |
Investor Shares | | | | 31,799 | | | | | 448 | | | | | 14,393 | | | | | 236 | |
Institutional Shares | | | | 2,423 | | | | | 34 | | | | | 2,697 | | | | | 44 | |
| Cost of shares redeemed | | | | | | | | | | | | | | | | | | | | |
Investor Shares | | | | (1,105,533 | ) | | | | (16,326 | ) | | | | (718,712 | ) | | | | (11,786 | ) |
Institutional Shares | | | | (151,648 | ) | | | | (2,234 | ) | | | | (273,245 | ) | | | | (4,376 | ) |
| Net increase from fund share transactions | | | | | | | | | | | | | | | | | | | | |
Investor Shares | | | | (282,401 | ) | | | | (4,142 | ) | | | | 562,569 | | | | | 9,334 | |
Institutional Shares | | | | 25,371 | | | | | 302 | | | | | (173,086 | ) | | | | (2,776 | ) |
| | |
| 136 | | Artisan Partners Funds |
NOTES TO FINANCIAL STATEMENTS
| | | | | | | | | | | | | | | | | | | | |
| | | THEMATIC |
| | | Year Ended
9/30/2019 | | Year Ended
9/30/2018 |
| | | Shares | | Amount | | Shares | | Amount |
| Proceeds from shares issued | | | | | | | | | | | | | | | | | | | | |
Investor Shares | | | | 13,144,592 | | | | $ | 182,276 | | | | | 7,383,091 | | | | $ | 98,926 | |
Advisor Shares(3) | | | | 32,450,161 | | | | | 471,224 | | | | | 2,705,885 | | | | | 38,552 | |
| Net asset value of shares issued in reinvestment of dividends and distributions | | | | | | | | | | | | | | | | | | | | |
Investor Shares | | | | 330,654 | | | | | 4,341 | | | | | 137,916 | | | | | 1,605 | |
Advisor Shares(3) | | | | 154,349 | | | | | 2,027 | | | | | - | | | | | - | |
| Cost of shares redeemed | | | | | | | | | | | | | | | | | | | | |
Investor Shares | | | | (8,126,367 | ) | | | | (113,951 | ) | | | | (3,281,368 | ) | | | | (45,978 | ) |
Advisor Shares(3) | | | | (1,958,713 | ) | | | | (27,044 | ) | | | | (56,489 | ) | | | | (809 | ) |
| Net increase (decrease) from fund share transactions | | | | | | | | | | | | | | | | | | | | |
Investor Shares | | | | 5,348,879 | | | | | 72,666 | | | | | 4,239,639 | | | | | 54,553 | |
Advisor Shares(3) | | | | 30,645,797 | | | | | 446,207 | | | | | 2,649,396 | | | | | 37,743 | |
| | | | |
| Footnotes are presented on Page 138. | | | | | | | | | | | | | | | | | | | | |
| |
| | | VALUE |
| | | Year Ended
9/30/2019 | | Year Ended
9/30/2018 |
| | | Shares | | Amount | | Shares | | Amount |
| Proceeds from shares issued | | | | | | | | | | | | | | | | | | | | |
Investor Shares | | | | 839,973 | | | | $ | 10,378 | | | | | 924,217 | | | | $ | 13,504 | |
Advisor Shares | | | | 1,923,105 | | | | | 23,461 | | | | | 1,850,689 | | | | | 26,816 | |
Institutional Shares | | | | 2,222,289 | | | | | 26,576 | | | | | 1,600,865 | | | | | 23,342 | |
| Net asset value of shares issued in reinvestment of dividends and distributions | | | | | | | | | | | | | | | | | | | | |
Investor Shares | | | | 1,770,989 | | | | | 20,721 | | | | | 1,403,230 | | | | | 19,631 | |
Advisor Shares | | | | 1,301,934 | | | | | 15,155 | | | | | 1,258,181 | | | | | 17,514 | |
Institutional Shares | | | | 1,764,071 | | | | | 20,569 | | | | | 1,608,478 | | | | | 22,438 | |
| Cost of shares redeemed | | | | | | | | | | | | | | | | | | | | |
Investor Shares | | | | (4,676,664 | ) | | | | (57,055 | ) | | | | (4,310,747 | ) | | | | (63,167 | ) |
Advisor Shares | | | | (3,469,952 | ) | | | | (42,251 | ) | | | | (6,318,388 | ) | | | | (93,599 | ) |
Institutional Shares | | | | (3,139,093 | ) | | | | (38,263 | ) | | | | (7,579,995 | ) | | | | (111,924 | ) |
| Net increase (decrease) from fund share transactions | | | | | | | | | | | | | | | | | | | | |
Investor Shares | | | | (2,065,702 | ) | | | | (25,956 | ) | | | | (1,983,300 | ) | | | | (30,032 | ) |
Advisor Shares | | | | (244,913 | ) | | | | (3,635 | ) | | | | (3,209,518 | ) | | | | (49,269 | ) |
Institutional Shares | | | | 847,267 | | | | | 8,882 | | | | | (4,370,652 | ) | | | | (66,144 | ) |
| (1) | | Net of redemption fees. |
| (2) | | For the period from commencement of operations (December 4, 2018) through September 30, 2019. |
| (3) | | For the period from commencement of operations (July 31, 2018) through September 30, 2018. |
The Funds have evaluated subsequent events through the date of issuance, November 26, 2019, of the Funds’ financial statements and have determined there is no impact to the Funds’ financial statements.
| | |
| Artisan Partners Funds | | 137 |
NOTES TO FINANCIAL STATEMENTS
| (14) | Additional Information: |
Effective November 15, 2019, Global Equity Fund will pay a monthly management fee to the Adviser as follows:
| | | | | |
| Average Daily Net Assets | | Annual Rate |
Less than $1 billion | | | | 0.900 | % |
$1 billion to $2 billion | | | | 0.875 | |
$2 billion to $3.5 billion | | | | 0.850 | |
$3.5 billion to $5 billion | | | | 0.825 | |
Greater than $5 billion | | | | 0.800 | |
| | |
| 138 | | Artisan Partners Funds |
Report of Independent Registered Public Accounting Firm
To the Shareholders and the Board of Directors of Artisan Partners Funds, Inc.
Opinion on the Financial Statements
We have audited the accompanying statements of assets and liabilities of Artisan Partners Funds, Inc. (comprising Artisan Developing World Fund, Artisan Global Discovery Fund, Artisan Global Equity Fund, Artisan Global Opportunities Fund, Artisan Global Value Fund, Artisan High Income Fund, Artisan International Fund, Artisan International Small-Mid Fund (formerly Artisan International Small Cap Fund), Artisan International Value Fund, Artisan Mid Cap Fund, Artisan Mid Cap Value Fund, Artisan Small Cap Fund, Artisan Sustainable Emerging Markets Fund (formerly Artisan Emerging Markets Fund), Artisan Thematic Fund, and Artisan Value Fund (collectively referred to as the “Funds”)), including the schedules of investments, as of September 30, 2019, and the related statements of operations, changes in net assets, and the financial highlights for each of the periods indicated in the table below and the related notes (collectively referred to as the “financial statements”). In our opinion, the financial statements present fairly, in all material respects, the financial position of each of the Funds comprising Artisan Partners Funds, Inc. at September 30, 2019, and the results of their operations, changes in net assets and financial highlights for each of the periods indicated in the table below, in conformity with U.S. generally accepted accounting principles.
| | | | | | |
Funds comprising Artisan Partners
Funds, Inc. | | Statements of operations | | Statements of changes in net assets | | Financial highlights |
Artisan Global Equity Fund Artisan Global Opportunities Fund Artisan Global Value Fund Artisan High Income Fund Artisan International Fund Artisan International Small-Mid Fund Artisan International Value Fund Artisan Mid Cap Fund Artisan Mid Cap Value Fund Artisan Small Cap Fund Artisan Sustainable Emerging Markets Fund Artisan Value Fund | | For the year ended September 30, 2019 | | For each of the two years in the period ended September 30, 2019 | | For each of the five years in the period ended September 30, 2019 |
| Artisan Developing World Fund | | For the year ended September 30, 2019 | | For each of the two years in the period ended September 30, 2019 | | For each of the four years in the period ended September 30, 2019, and the period from June 29, 2015 (commencement of operations) through September 30, 2015 |
| Artisan Thematic Fund | | For the year ended September 30, 2019 | | For each of the two years in the period ended September 30, 2019 | | For each of the two years in the period ended September 30, 2019 and the period from April 24, 2017 (commencement of operations) through September 30, 2017 |
| | |
| Artisan Partners Funds | | 139 |
| | | | | | |
Funds comprising Artisan Partners
Funds, Inc. | | Statements of operations | | Statements of changes in net assets | | Financial highlights |
| Artisan Global Discovery Fund | | For the year ended September 30, 2019 | | For each of the two years in the period ended September 30, 2019 | | For each of the two years in the period ended September 30, 2019 and the period from August 21, 2017 (commencement of operations) through September 30, 2017 |
Basis for Opinion
These financial statements are the responsibility of the Funds’ management. Our responsibility is to express an opinion on each of the Fund’s financial statements based on our audits. We are a public accounting firm registered with the Public Company Accounting Oversight Board (United States) (“PCAOB”) and are required to be independent with respect to the Funds in accordance with the U.S. federal securities laws and the applicable rules and regulations of the Securities and Exchange Commission and the PCAOB.
We conducted our audits in accordance with the standards of the PCAOB. Those standards require that we plan and perform the audit to obtain reasonable assurance about whether the financial statements are free of material misstatement, whether due to error or fraud. The Funds are not required to have, nor were we engaged to perform, an audit of the Funds’ internal control over financial reporting. As part of our audits we are required to obtain an understanding of internal control over financial reporting but not for the purpose of expressing an opinion on the effectiveness of the Funds’ internal control over financial reporting. Accordingly, we express no such opinion.
Our audits included performing procedures to assess the risks of material misstatement of the financial statements, whether due to error or fraud, and performing procedures that respond to those risks. Such procedures included examining, on a test basis, evidence regarding the amounts and disclosures in the financial statements. Our procedures included confirmation of securities owned as of September 30, 2019, by correspondence with the custodians, brokers, and agent banks or by other appropriate auditing procedures where replies from brokers and agent banks were not received. Our audits also included evaluating the accounting principles used and significant estimates made by management, as well as evaluating the overall presentation of the financial statements. We believe that our audits provide a reasonable basis for our opinion.

We have served as the auditor of one or more Artisan Partners Funds investment companies since 2003.
Minneapolis, Minnesota
November 26, 2019
| | |
| 140 | | Artisan Partners Funds |
NOTES TO FINANCIAL STATEMENTS
Other Federal tax information (unaudited):
The Internal Revenue Code requires that shareholders be notified of certain information regarding long-term capital gains, qualified dividend income and the dividends received deduction for corporate shareholders. This data is informational only. Every year in January, shareholders are sent a Form1099-DIV which provides the federal tax status of dividends and distributions received during the calendar year. Shareholders are advised to consult their own tax advisor with respect to the specific tax consequences of investment in the Funds.
Each Fund hereby designates the following amounts as (i) long-term capital gain distributions for purposes of the dividends paid deduction (including earnings and profits distributed to shareholders on redemption of Fund shares, in thousands), (ii) the amount of ordinary dividends paid during the year ended September 30, 2019 that are considered qualified dividend income as defined in the Jobs and Growth Tax Relief Reconciliation Act of 2003, and (iii) the amount of ordinary dividends paid during the year ended September 30, 2019 that are eligible for the dividends received deduction available to certain corporate shareholders.
| | | | | | | | | | | | | | | |
| Fund | | Long-Term Capital Gains | | Qualified Dividend Income | | Dividends Received Deduction |
Developing World | | | $ | - | | | | | 100.00 | % | | | | 100.00 | % |
Global Discovery | | | | - | | | | | N/A | | | | | N/A | |
Global Equity | | | | 22,703 | | | | | 14.76 | | | | | 4.99 | |
Global Opportunities | | | | 203,151 | | | | | 100.00 | | | | | 100.00 | |
Global Value | | | | 140,737 | | | | | 100.00 | | | | | 33.98 | |
High Income | | | | 9,473 | | | | | N/A | | | | | N/A | |
International | | | | 854,689 | | | | | 100.00 | | | | | 0.75 | |
InternationalSmall-Mid | | | | 80,629 | | | | | 34.36 | | | | | 0.07 | |
International Value | | | | 550,188 | | | | | 100.00 | | | | | N/A | |
Mid Cap | | | | 995,336 | | | | | 45.84 | | | | | 42.40 | |
Mid Cap Value | | | | 429,385 | | | | | 100.00 | | | | | 100.00 | |
Small Cap | | | | 250,111 | | | | | 100.00 | | | | | 100.00 | |
Sustainable Emerging Markets | | | | - | | | | | 100.00 | | | | | N/A | |
Thematic | | | | - | | | | | 23.25 | | | | | 36.87 | |
Value | | | | 51,971 | | | | | 91.89 | | | | | 61.72 | |
| | |
| Artisan Partners Funds | | 141 |
SHAREHOLDER EXPENSE EXAMPLE (UNAUDITED)
As a shareholder of Artisan Partners Funds, you may incur transaction costs, including redemption fees, and you will incur ongoing costs, including management fees and other Fund expenses. This example is intended to help you understand your ongoing costs (in dollars) of investing in a Fund and to compare these costs with the ongoing costs of investing in other mutual funds.
The example is based on an investment of $1,000 invested at the beginning of the period and held for the entire period from April 1, 2019 to September 30, 2019.
Actual Expenses
The first line under the name of each Fund in the table below provides information about actual account values and actual expenses. You may use the information in this line, together with the amount you invested, to estimate the expenses that you paid over the period. Simply divide your account value by $1,000 (for example, an $8,600 account value divided by $1,000 = 8.6), then multiply the result by the number in the first line under the name of your Fund under the heading entitled “Expenses Paid During Period” to estimate the expenses you paid on your account during this period.
Hypothetical Example for Comparison Purposes
The second line under each Fund’s name in the table below provides information about hypothetical account values and hypothetical expenses based on each Fund’s actual expense ratio for the six months ended September 30, 2019 and an assumed rate of return of 5% per year before expenses, which is not the Fund’s actual return. The hypothetical account values and expenses may not be used to estimate the actual ending account balances or expenses you paid for the period. You may use this information to compare the ongoing costs of investing in each Fund and other funds. To do so, compare the 5% hypothetical example with the 5% hypothetical examples that appear in the shareholder reports of the other funds.
Please note that the expenses shown in the table are meant to highlight your ongoing costs only and do not reflect any transactional costs, such as redemption fees. Therefore, the second line of the table is useful in comparing ongoing costs only, and will not help you determine the relative costs of owning different funds. If these transactional costs were included, your costs would have been higher.
| | | | | | | | | | | | | | | | | | | | |
| | | Beginning
Account Value
4/1/2019 | | Ending
Account Value
9/30/2019 | | Expenses Paid During
Period
4/1/2019-9/30/2019(1) | | Expense
Ratio(2)(3) |
Artisan Developing World Fund | | | | | | | | | | | | | | | | | | | | |
Investor Shares | | | | | | | | | | | | | | | | | | | | |
Actual | | | $ | 1,000.00 | | | | $ | 1,018.20 | | | | $ | 6.37 | | | | | 1.26 | % |
Hypothetical (5% return before expenses) | | | $ | 1,000.00 | | | | $ | 1,018.75 | | | | $ | 6.38 | | | | | 1.26 | % |
Advisor Shares | | | | | | | | | | | | | | | | | | | | |
Actual | | | $ | 1,000.00 | | | | $ | 1,018.90 | | | | $ | 5.97 | | | | | 1.18 | % |
Hypothetical (5% return before expenses) | | | $ | 1,000.00 | | | | $ | 1,019.15 | | | | $ | 5.97 | | | | | 1.18 | % |
Institutional Shares | | | | | | | | | | | | | | | | | | | | |
Actual | | | $ | 1,000.00 | | | | $ | 1,019.60 | | | | $ | 5.47 | | | | | 1.08 | % |
Hypothetical (5% return before expenses) | | | $ | 1,000.00 | | | | $ | 1,019.65 | | | | $ | 5.47 | | | | | 1.08 | % |
| | |
| 142 | | Artisan Partners Funds |
SHAREHOLDER EXPENSE EXAMPLE (UNAUDITED)
| | | | | | | | | | | | | | | | | | | | |
| | | Beginning
Account Value
4/1/2019 | | Ending
Account Value
9/30/2019 | | Expenses Paid During
Period
4/1/2019-9/30/2019(1) | | Expense
Ratio(2)(3) |
Artisan Global Discovery Fund | | | | | | | | | | | | | | | | | | | | |
Investor Shares | | | | | | | | | | | | | | | | | | | | |
Actual | | | $ | 1,000.00 | | | | $ | 1,089.50 | | | | $ | 7.23 | | | | | 1.38 | % |
Hypothetical (5% return before expenses) | | | $ | 1,000.00 | | | | $ | 1,018.15 | | | | $ | 6.98 | | | | | 1.38 | % |
Artisan Global Equity Fund | | | | | | | | | | | | | | | | | | | | |
Investor Shares | | | | | | | | | | | | | | | | | | | | |
Actual | | | $ | 1,000.00 | | | | $ | 1,080.80 | | | | $ | 7.20 | | | | | 1.38 | % |
Hypothetical (5% return before expenses) | | | $ | 1,000.00 | | | | $ | 1,018.15 | | | | $ | 6.98 | | | | | 1.38 | % |
Institutional Shares | | | | | | | | | | | | | | | | | | | | |
Actual | | | $ | 1,000.00 | | | | $ | 1,082.00 | | | | $ | 6.16 | | | | | 1.18 | % |
Hypothetical (5% return before expenses) | | | $ | 1,000.00 | | | | $ | 1,019.15 | | | | $ | 5.97 | | | | | 1.18 | % |
Artisan Global Opportunities Fund | | | | | | | | | | | | | | | | | | | | |
Investor Shares | | | | | | | | | | | | | | | | | | | | |
Actual | | | $ | 1,000.00 | | | | $ | 1,064.90 | | | | $ | 5.90 | | | | | 1.14 | % |
Hypothetical (5% return before expenses) | | | $ | 1,000.00 | | | | $ | 1,019.35 | | | | $ | 5.77 | | | | | 1.14 | % |
Advisor Shares | | | | | | | | | | | | | | | | | | | | |
Actual | | | $ | 1,000.00 | | | | $ | 1,065.80 | | | | $ | 5.13 | | | | | 0.99 | % |
Hypothetical (5% return before expenses) | | | $ | 1,000.00 | | | | $ | 1,020.10 | | | | $ | 5.01 | | | | | 0.99 | % |
Institutional Shares | | | | | | | | | | | | | | | | | | | | |
Actual | | | $ | 1,000.00 | | | | $ | 1,066.00 | | | | $ | 4.71 | | | | | 0.91 | % |
Hypothetical (5% return before expenses) | | | $ | 1,000.00 | | | | $ | 1,020.51 | | | | $ | 4.61 | | | | | 0.91 | % |
Artisan Global Value Fund | | | | | | | | | | | | | | | | | | | | |
Investor Shares | | | | | | | | | | | | | | | | | | | | |
Actual | | | $ | 1,000.00 | | | | $ | 1,031.30 | | | | $ | 6.26 | | | | | 1.23 | % |
Hypothetical (5% return before expenses) | | | $ | 1,000.00 | | | | $ | 1,018.90 | | | | $ | 6.23 | | | | | 1.23 | % |
Advisor Shares | | | | | | | | | | | | | | | | | | | | |
Actual | | | $ | 1,000.00 | | | | $ | 1,032.00 | | | | $ | 5.45 | | | | | 1.07 | % |
Hypothetical (5% return before expenses) | | | $ | 1,000.00 | | | | $ | 1,019.70 | | | | $ | 5.42 | | | | | 1.07 | % |
Institutional Shares | | | | | | | | | | | | | | | | | | | | |
Actual | | | $ | 1,000.00 | | | | $ | 1,031.90 | | | | $ | 5.14 | | | | | 1.01 | % |
Hypothetical (5% return before expenses) | | | $ | 1,000.00 | | | | $ | 1,020.00 | | | | $ | 5.11 | | | | | 1.01 | % |
| | |
| Artisan Partners Funds | | 143 |
SHAREHOLDER EXPENSE EXAMPLE (UNAUDITED)
| | | | | | | | | | | | | | | | | | | | |
| | | Beginning
Account Value
4/1/2019 | | Ending
Account Value
9/30/2019 | | Expenses Paid During
Period
4/1/2019-9/30/2019(1) | | Expense
Ratio(2)(3) |
Artisan High Income Fund | | | | | | | | | | | | | | | | | | | | |
Investor Shares | | | | | | | | | | | | | | | | | | | | |
Actual | | | $ | 1,000.00 | | | | $ | 1,039.30 | | | | $ | 5.01 | | | | | 0.98 | % |
Hypothetical (5% return before expenses) | | | $ | 1,000.00 | | | | $ | 1,020.16 | | | | $ | 4.96 | | | | | 0.98 | % |
Advisor Shares | | | | | | | | | | | | | | | | | | | | |
Actual | | | $ | 1,000.00 | | | | $ | 1,040.20 | | | | $ | 4.19 | | | | | 0.82 | % |
Hypothetical (5% return before expenses) | | | $ | 1,000.00 | | | | $ | 1,020.96 | | | | $ | 4.15 | | | | | 0.82 | % |
Institutional Shares | | | | | | | | | | | | | | | | | | | | |
Actual | | | $ | 1,000.00 | | | | $ | 1,040.70 | | | | $ | 3.73 | | | | | 0.73 | % |
Hypothetical (5% return before expenses) | | | $ | 1,000.00 | | | | $ | 1,021.41 | | | | $ | 3.70 | | | | | 0.73 | % |
Artisan International Fund | | | | | | | | | | | | | | | | | | | | |
Investor Shares | | | | | | | | | | | | | | | | | | | | |
Actual | | | $ | 1,000.00 | | | | $ | 1,086.20 | | | | $ | 6.17 | | | | | 1.18 | % |
Hypothetical (5% return before expenses) | | | $ | 1,000.00 | | | | $ | 1,019.15 | | | | $ | 5.97 | | | | | 1.18 | % |
Advisor Shares | | | | | | | | | | | | | | | | | | | | |
Actual | | | $ | 1,000.00 | | | | $ | 1,087.10 | | | | $ | 5.39 | | | | | 1.03 | % |
Hypothetical (5% return before expenses) | | | $ | 1,000.00 | | | | $ | 1,019.90 | | | | $ | 5.22 | | | | | 1.03 | % |
Institutional Shares | | | | | | | | | | | | | | | | | | | | |
Actual | | | $ | 1,000.00 | | | | $ | 1,087.40 | | | | $ | 5.02 | | | | | 0.96 | % |
Hypothetical (5% return before expenses) | | | $ | 1,000.00 | | | | $ | 1,020.26 | | | | $ | 4.86 | | | | | 0.96 | % |
Artisan InternationalSmall-Mid Fund | | | | | | | | | | | | | | | | | | | | |
Investor Shares | | | | | | | | | | | | | | | | | | | | |
Actual | | | $ | 1,000.00 | | | | $ | 1,046.90 | | | | $ | 7.29 | | | | | 1.42 | % |
Hypothetical (5% return before expenses) | | | $ | 1,000.00 | | | | $ | 1,017.95 | | | | $ | 7.18 | | | | | 1.42 | % |
Advisor Shares | | | | | | | | | | | | | | | | | | | | |
Actual | | | $ | 1,000.00 | | | | $ | 1,047.70 | | | | $ | 6.42 | | | | | 1.25 | % |
Hypothetical (5% return before expenses) | | | $ | 1,000.00 | | | | $ | 1,018.80 | | | | $ | 6.33 | | | | | 1.25 | % |
Institutional Shares | | | | | | | | | | | | | | | | | | | | |
Actual | | | $ | 1,000.00 | | | | $ | 1,048.00 | | | | $ | 5.85 | | | | | 1.14 | % |
Hypothetical (5% return before expenses) | | | $ | 1,000.00 | | | | $ | 1,019.35 | | | | $ | 5.77 | | | | | 1.14 | % |
Artisan International Value Fund | | | | | | | | | | | | | | | | | | | | |
Investor Shares | | | | | | | | | | | | | | | | | | | | |
Actual | | | $ | 1,000.00 | | | | $ | 1,032.20 | | | | $ | 6.11 | | | | | 1.20 | % |
Hypothetical (5% return before expenses) | | | $ | 1,000.00 | | | | $ | 1,019.05 | | | | $ | 6.07 | | | | | 1.20 | % |
Advisor Shares | | | | | | | | | | | | | | | | | | | | |
Actual | | | $ | 1,000.00 | | | | $ | 1,032.90 | | | | $ | 5.30 | | | | | 1.04 | % |
Hypothetical (5% return before expenses) | | | $ | 1,000.00 | | | | $ | 1,019.85 | | | | $ | 5.27 | | | | | 1.04 | % |
Institutional Shares | | | | | | | | | | | | | | | | | | | | |
Actual | | | $ | 1,000.00 | | | | $ | 1,033.50 | | | | $ | 4.89 | | | | | 0.96 | % |
Hypothetical (5% return before expenses) | | | $ | 1,000.00 | | | | $ | 1,020.26 | | | | $ | 4.86 | | | | | 0.96 | % |
| | |
| 144 | | Artisan Partners Funds |
SHAREHOLDER EXPENSE EXAMPLE (UNAUDITED)
| | | | | | | | | | | | | | | | | | | | |
| | | Beginning
Account Value
4/1/2019 | | Ending
Account Value
9/30/2019 | | Expenses Paid During
Period
4/1/2019-9/30/2019(1) | | Expense
Ratio(2)(3) |
Artisan Mid Cap Fund | | | | | | | | | | | | | | | | | | | | |
Investor Shares | | | | | | | | | | | | | | | | | | | | |
Actual | | | $ | 1,000.00 | | | | $ | 1,059.30 | | | | $ | 6.09 | | | | | 1.18 | % |
Hypothetical (5% return before expenses) | | | $ | 1,000.00 | | | | $ | 1,019.15 | | | | $ | 5.97 | | | | | 1.18 | % |
Advisor Shares | | | | | | | | | | | | | | | | | | | | |
Actual | | | $ | 1,000.00 | | | | $ | 1,061.10 | | | | $ | 5.17 | | | | | 1.00 | % |
Hypothetical (5% return before expenses) | | | $ | 1,000.00 | | | | $ | 1,020.05 | | | | $ | 5.06 | | | | | 1.00 | % |
Institutional Shares | | | | | | | | | | | | | | | | | | | | |
Actual | | | $ | 1,000.00 | | | | $ | 1,060.50 | | | | $ | 4.96 | | | | | 0.96 | % |
Hypothetical (5% return before expenses) | | | $ | 1,000.00 | | | | $ | 1,020.26 | | | | $ | 4.86 | | | | | 0.96 | % |
Artisan Mid Cap Value Fund | | | | | | | | | | | | | | | | | | | | |
Investor Shares | | | | | | | | | | | | | | | | | | | | |
Actual | | | $ | 1,000.00 | | | | $ | 1,044.30 | | | | $ | 6.10 | | | | | 1.19 | % |
Hypothetical (5% return before expenses) | | | $ | 1,000.00 | | | | $ | 1,019.10 | | | | $ | 6.02 | | | | | 1.19 | % |
Advisor Shares | | | | | | | | | | | | | | | | | | | | |
Actual | | | $ | 1,000.00 | | | | $ | 1,045.50 | | | | $ | 5.28 | | | | | 1.03 | % |
Hypothetical (5% return before expenses) | | | $ | 1,000.00 | | | | $ | 1,019.90 | | | | $ | 5.22 | | | | | 1.03 | % |
Institutional Shares | | | | | | | | | | | | | | | | | | | | |
Actual | | | $ | 1,000.00 | | | | $ | 1,046.00 | | | | $ | 5.03 | | | | | 0.98 | % |
Hypothetical (5% return before expenses) | | | $ | 1,000.00 | | | | $ | 1,020.16 | | | | $ | 4.96 | | | | | 0.98 | % |
Artisan Small Cap Fund | | | | | | | | | | | | | | | | | | | | |
Investor Shares | | | | | | | | | | | | | | | | | | | | |
Actual | | | $ | 1,000.00 | | | | $ | 1,034.60 | | | | $ | 6.07 | | | | | 1.19 | % |
Hypothetical (5% return before expenses) | | | $ | 1,000.00 | | | | $ | 1,019.10 | | | | $ | 6.02 | | | | | 1.19 | % |
Advisor Shares | | | | | | | | | | | | | | | | | | | | |
Actual | | | $ | 1,000.00 | | | | $ | 1,034.80 | | | | $ | 5.66 | | | | | 1.11 | % |
Hypothetical (5% return before expenses) | | | $ | 1,000.00 | | | | $ | 1,019.50 | | | | $ | 5.62 | | | | | 1.11 | % |
Institutional Shares | | | | | | | | | | | | | | | | | | | | |
Actual | | | $ | 1,000.00 | | | | $ | 1,035.50 | | | | $ | 5.00 | | | | | 0.98 | % |
Hypothetical (5% return before expenses) | | | $ | 1,000.00 | | | | $ | 1,020.16 | | | | $ | 4.96 | | | | | 0.98 | % |
Artisan Sustainable Emerging Markets Fund | | | | | | | | | | | | | | | | | | | | |
Investor Shares | | | | | | | | | | | | | | | | | | | | |
Actual | | | $ | 1,000.00 | | | | $ | 978.10 | | | | $ | 6.69 | | | | | 1.35 | % |
Hypothetical (5% return before expenses) | | | $ | 1,000.00 | | | | $ | 1,018.30 | | | | $ | 6.83 | | | | | 1.35 | % |
Institutional Shares | | | | | | | | | | | | | | | | | | | | |
Actual | | | $ | 1,000.00 | | | | $ | 978.80 | | | | $ | 5.95 | | | | | 1.20 | % |
Hypothetical (5% return before expenses) | | | $ | 1,000.00 | | | | $ | 1,019.05 | | | | $ | 6.07 | | | | | 1.20 | % |
| | |
| Artisan Partners Funds | | 145 |
SHAREHOLDER EXPENSE EXAMPLE (UNAUDITED)
| | | | | | | | | | | | | | | | | | | | |
| | | Beginning
Account Value
4/1/2019 | | Ending
Account Value
9/30/2019 | | Expenses Paid During
Period
4/1/2019-9/30/2019(1) | | Expense
Ratio(2)(3) |
Artisan Thematic Fund | | | | | | | | | | | | | | | | | | | | |
Investor Shares | | | | | | | | | | | | | | | | | | | | |
Actual | | | $ | 1,000.00 | | | | $ | 1,086.90 | | | | $ | 7.11 | | | | | 1.36 | % |
Hypothetical (5% return before expenses) | | | $ | 1,000.00 | | | | $ | 1,018.25 | | | | $ | 6.88 | | | | | 1.36 | % |
Advisor Shares | | | | | | | | | | | | | | | | | | | | |
Actual | | | $ | 1,000.00 | | | | $ | 1,087.60 | | | | $ | 6.07 | | | | | 1.16 | % |
Hypothetical (5% return before expenses) | | | $ | 1,000.00 | | | | $ | 1,019.25 | | | | $ | 5.87 | | | | | 1.16 | % |
Artisan Value Fund | | | | | | | | | | | | | | | | | | | | |
Investor Shares | | | | | | | | | | | | | | | | | | | | |
Actual | | | $ | 1,000.00 | | | | $ | 1,056.60 | | | | $ | 5.46 | | | | | 1.06 | % |
Hypothetical (5% return before expenses) | | | $ | 1,000.00 | | | | $ | 1,019.75 | | | | $ | 5.37 | | | | | 1.06 | % |
Advisor Shares | | | | | | | | | | | | | | | | | | | | |
Actual | | | $ | 1,000.00 | | | | $ | 1,057.70 | | | | $ | 4.54 | | | | | 0.88 | % |
Hypothetical (5% return before expenses) | | | $ | 1,000.00 | | | | $ | 1,020.66 | | | | $ | 4.46 | | | | | 0.88 | % |
Institutional Shares | | | | | | | | | | | | | | | | | | | | |
Actual | | | $ | 1,000.00 | | | | $ | 1,057.60 | | | | $ | 4.38 | | | | | 0.85 | % |
Hypothetical (5% return before expenses) | | | $ | 1,000.00 | | | | $ | 1,020.81 | | | | $ | 4.31 | | | | | 0.85 | % |
| (1) | | Expenses are equal to the Fund’s ratio of expenses to average net assets for the six month period ended September 30, 2019, multiplied by the average account value over the period, multiplied by183/365 (to reflect theone-half year period). |
| (2) | | Annualized ratio of expenses to average net assets for thesix-month period ended September 30, 2019. |
| (3) | | Expense ratio includes the effect of expenses waived or paid by the Adviser, if applicable. |
| | |
| 146 | | Artisan Partners Funds |
FACTORS CONSIDERED IN RENEWING THE FUNDS’ ADVISORY AGREEMENTS
Artisan Partners is responsible for management of the Funds’ (as defined below) investment portfolios and for overall management of the Funds’ business and affairs pursuant to an investment advisory agreement (the “Advisory Agreement”) between Artisan Partners Funds and Artisan Partners. With respect to each Fund, the Advisory Agreement, after an initialtwo-year term, may be continued from year to year only so long as the continuation is approved at least annually (a) by the vote of a majority of the directors of Artisan Partners Funds who are not “interested persons” of Artisan Partners Funds or Artisan Partners (the “independent directors”) cast in person at a meeting called for the purpose of voting on such approval, and (b) by the board of directors or by the vote of a majority (as defined in the 1940 Act) of the outstanding shares of the Fund.
The directors of Artisan Partners Funds held a meeting on May13-14, 2019 (the“May 13-14 Meeting”), at which they gave preliminary consideration to information bearing on the continuation of the Advisory Agreement with respect to each of the series of Artisan Partners Funds (for purpose of this discussion, the “Funds”) for the period from July 1, 2019 through June 30, 2020. The primary purpose of the May13-14 Meeting was to allow the directors ample opportunity to consider matters they deemed relevant in connection with the continuation of the Advisory Agreement (in addition to materials they review at meetings throughout the year), and to request any additional information they considered reasonably necessary to their deliberations, without undue time constraints.
At their regular quarterly meeting held on May29-30, 2019 (the “May29-30 Meeting”), the directors, including the independent directors, considered and unanimously approved the continuation through June 30, 2020 of the Advisory Agreement with respect to each of the Funds. The independent directors were assisted in their evaluation of the Advisory Agreement and the factors that they deemed to be material, including those factors described below, by independent legal counsel, from whom they received separate legal advice and with whom they met separately from Artisan Partners in connection with the contract review meetings.
Prior to the May13-14 Meeting, independent counsel to the independent directors sent to Artisan Partners requests for information to be provided to the directors in connection with their consideration of the Advisory Agreement. Artisan Partners provided materials to the directors in response to those requests as well as other information Artisan Partners believed was useful in evaluating the approval of the Advisory Agreement. Artisan Partners provided reports prepared by Broadridge Financial Solutions, Inc. (“Broadridge”), an independent source of investment company data, that included information relating to each Fund’s performance, expenses and fees compared to the performance, expenses and fees of a relatively small peer group and a larger peer universe of mutual funds selected by Broadridge (the “Broadridge Peer Groups”). Artisan Partners also provided additional reports prepared by Broadridge comparing the performance and expenses of certain of the Funds to peer universes with a different style classification that Artisan Partners believed was more appropriate for comparative purposes than the style classification used by Broadridge to compile the Broadridge Peer Groups (the “Supplemental Peer Universes”). These supplemental reports were provided for Global Discovery Fund and International Value Fund.
| | |
| Artisan Partners Funds | | 147 |
FACTORS CONSIDERED IN RENEWING THE FUNDS’ ADVISORY AGREEMENTS
The directors also received and reviewed a memorandum from independent counsel regarding the directors’ responsibilities in evaluating the Advisory Agreement. The directors recognized that the management and fee arrangements for the Funds are the result of years of review and discussion between the independent directors and Artisan Partners, that certain aspects of such arrangements may receive greater scrutiny from the directors in some years than in others and that the directors’ conclusions may be based, in part, on their consideration of these same arrangements and information received during the course of the year and in prior years.
In evaluating the Advisory Agreement, the directors reviewed the available information and discussed with representatives of Artisan Partners each Fund’s operations; the nature, extent and quality of the advisory and other services provided by Artisan Partners to the Funds; the management fees and total expense ratios of each class of shares of the Funds; possible economies of scale; and other benefits (in addition to advisory fee revenues) derived or potentially derived by Artisan Partners from its relationship with the Funds. In addition to the third-party reports by Broadridge and the memorandum from independent counsel, the directors reviewed information provided prior to and presented at the May13-14 Meeting and theMay 29-30 Meeting, concerning, among other things, the following:
| • | | Artisan Partners’ organization and operations, financial condition and stability and ownership structure; |
| • | | Artisan Partners’ personnel and business and financial model and methods, including Artisan Partners’ assessment of its ability to attract and retain capable personnel and Artisan Partners’ succession planning processes with respect to the leadership of the Funds’ portfolio management teams and senior management of Artisan Partners; Artisan Partners’ research and decision-making processes; the adequacy and sophistication of technology and systems with respect to investment and administrative matters; and Artisan Partners’ liquidity management tools and the Funds’ liquidity risk management program; |
| • | | The terms of the Advisory Agreement, including the scope of services performed by Artisan Partners; and how the services performed by Artisan Partners under the Advisory Agreement differ from those performed for other investment companies and accounts; |
| • | | Each Fund’s short- and long-term investment performance (including past1-,3-,5- and10-year and since-inception periods, as applicable), including comparisons for various time periods with (a) other Artisan Partners client accounts managed with similar investment objectives, (b) other mutual funds having similar investment objectives, and (c) appropriate market indices; |
| • | | Actions that Artisan Partners has taken or is contemplating taking with respect to Artisan Value Fund and Artisan Mid Cap Value Fund to help address each Fund’s underperformance; |
| • | | The Funds’ experience applying their valuation procedures, including fair valuation of assets for which market quotations are not readily available; |
| • | | Any litigation pending, threatened or settled involving Artisan Partners, and the results of any inspections, investigations or examinations thereof by the Securities and Exchange Commission or other governmental or regulatory authorities since January 1, 2018; |
| | |
| 148 | | Artisan Partners Funds |
FACTORS CONSIDERED IN RENEWING THE FUNDS’ ADVISORY AGREEMENTS
| • | | Information regarding fee arrangements, including a comparison of the total expense ratio of each share class of each Fund with other mutual funds; the structure of the management fees, including the method of computing fees and the frequency of payment of fees and Artisan Partners’ process for determining proposed management fee rates for new funds; a comparison of the management fees with fees charged by other investment advisers for managing mutual funds with similar investment objectives; information regarding expense limitation arrangements and effective annual management fee rates for each of the Funds for the calendar year ended December 31, 2018; the expenses other than management fees that the Funds bear, either at the level of the Fund as a whole or on a class-specific basis; and Artisan Partners’ assessment of the current competitiveness of the Funds’ management fee rates and total expense ratios; |
| • | | Artisan Partners’ assessment of whether it is realizing economies of scale in providing services to the Funds and, if so, whether, how and, if quantifiable, to what extent the economies of scale are shared with the Funds, and the adequacy of existing breakpoints (reduced fee levels on assets in excess of stated thresholds) in advisory fees and whether further breakpoints are appropriate; |
| • | | A comparison of the fee arrangements for the Funds with fees charged by Artisan Partners for subadvising other U.S. mutual funds and for managing other accounts, and trends in fees charged by Artisan Partners for such services; |
| • | | Information regarding third-party intermediary and service arrangements and related payments by the Funds and Artisan Partners, including, among other information, information on amounts paid to financial intermediaries during the year ended December 31, 2018, the nature of services provided by such intermediaries, any caps or limitations placed on related payments, and the process employed by Artisan Partners for entering into and overseeing such intermediary arrangements; |
| • | | Potential“fall-out” benefits to Artisan Partners or its affiliates from their relationships with the Funds, in addition to advisory fees, including any benefits to Artisan Partners or its affiliates in selling other products, and the method of estimating the value of any such benefits; |
| • | | Matters relating to brokerage and portfolio transactions, including Artisan Partners’ practices regarding selection of brokers and dealers to execute portfolio transactions and regarding negotiation of commission rates and allocation of brokerage for research and other services; |
| • | | The estimated profitability to Artisan Partners of its relationship with each Fund on both apre-tax andpost-tax basis for calendar 2016, 2017 and 2018; and the assumptions and allocation methodologies utilized for such profitability analysis; |
| • | | Potential for conflicts of interest between the Funds and Artisan Partners and circumstances and actions addressing or bearing on potential conflicts of interest; |
| • | | Compliance and related matters, including Artisan Partners’ programs for monitoring compliance with federal and state securities and other applicable laws and regulations, the investment policies and restrictions of registered investment company clients and Subchapter M of the Internal Revenue Code; and information regarding personnel who perform significant compliance and legal services for the Funds; and |
| • | | Artisan Partners’ risk assessment and risk management processes. |
| | |
| Artisan Partners Funds | | 149 |
FACTORS CONSIDERED IN RENEWING THE FUNDS’ ADVISORY AGREEMENTS
Following the May13-14 Meeting and executive sessions with their independent counsel, the independent directors requested certainfollow-up information from Artisan Partners. Artisan Partners provided thisfollow-up information prior to the May29-30 Meeting. At the May29-30 Meeting, Artisan Partners presented certain additional information to the directors regarding the Funds, and the independent directors and their independent counsel reviewed with the full board the information discussed at the May13-14 Meeting and during their executive sessions. The directors then considered whether any further discussion or review was necessary, concluding that the May13-14 Meeting and the information reviewed by the independent directors prior to and at the May29-30 Meeting provided a sufficient basis for taking action on the continuation of the Advisory Agreement with respect to each Fund for an additional year. The directors then reviewed and affirmed each of the following conclusions:
The nature, extent and quality of Artisan Partners’ services. The directors concluded that the nature and extent of Artisan Partners’ services to the Funds were appropriate and consistent with, and in some cases more advantageous to the Funds than, the terms of the Advisory Agreement. The directors concluded that the quality of Artisan Partners’ services has been consistently high, with no material deficiencies.
The investment performance of each Fund. With respect to each Fund, the directors concluded that the Fund’s performance (including absolute performance and, where applicable, outperformance of peers and relevant benchmarks over long-term periods) or other relevant factors supported continuation of the Fund’s advisory arrangements under the Advisory Agreement. In the case of each Fund that had performance that lagged that of a relevant peer group or benchmark for certain (although not necessarily all) periods, the directors concluded that other factors relevant to performance supported continuation of the advisory arrangements. These factors included either or both of the following: (1) that underperformance was attributable, to a significant extent, to investment decisions (such as security selection, sector allocation or risk mitigation) by Artisan Partners that were reasonable and consistent with the Fund’s investment objective and policies; and (2) that the Fund’s more recent or long-term performance, as applicable, was competitive when compared to relevant performance benchmarks or peer groups. With respect to Mid Cap Value Fund and Value Fund, following extensive discussion, the directors determined that the factors relating to each such Fund’s performance supported renewal of the Advisory Agreement with respect to such Fund, but that the board would continue to monitor the performance of those Funds closely, including through holding additionalin-person meetings with the Funds’ portfolio management team over the course of the following year. The directors noted that Artisan Partners had provided thorough and thoughtful analysis regarding its continued confidence in the Funds’ investment team. The directors also noted Artisan Partners’ past record of improving the performance of other Funds that experienced periods of underperformance.
The costs of the services and profitability of Artisan Partners.The directors concluded that the costs of the services provided by Artisan Partners, and the estimated profitability it realizes, are reasonable in relation to the nature and quality of services provided with respect to each Fund, based on the assumptions and methodology for calculating such costs and profitability presented to the directors by Artisan Partners.
| | |
| 150 | | Artisan Partners Funds |
FACTORS CONSIDERED IN RENEWING THE FUNDS’ ADVISORY AGREEMENTS
Comparisons of the services rendered and the amounts payable under the Advisory Agreement with those under other investment advisory agreements. The directors concluded that the fees payable by the Funds to Artisan Partners are reasonable in relation to the nature and quality of the services provided. In reaching this conclusion, the directors compared the fees payable by the Funds to the fees paid by other mutual funds that are in the same Broadridge Peer Groups and Supplemental Peer Universes. The directors also considered the fees Artisan Partners receives from, and the scope of services it provides to, other Artisan Partners clients, including its separate account clients and UCITS funds, and the U.S. mutual funds and collective investment trusts for which it serves assub-adviser, noting the significantly broader scope of services that Artisan Partners provides to the Funds as compared to the other types of clients. In reaching their conclusion, the directors also took into account the costs and risks assumed by Artisan Partners in connection with launching and maintaining publicly-offered mutual funds, and how those costs and risks differ from those associated with other components of Artisan Partners’ business. In addition, the directors noted that Artisan Partners has contractually agreed to maintain certain expense limitations through January 31, 2021 for Global Discovery Fund (Investor and Institutional Shares), Sustainable Emerging Markets Fund (Investor and Institutional Shares), Thematic Fund (Investor, Advisor and Institutional Shares) and Value Fund (Advisor Shares).
The extent to which economies of scale would be realized as each Fund grows and whether fee levels reflect these economies of scale for the benefit of Fund investors. The directors concluded that the shareholders of Developing World Fund, Global Opportunities Fund, Global Value Fund, High Income Fund, International Fund, International Value Fund, Mid Cap Fund, Mid Cap Value Fund, Small Cap Fund and Value Fund have appropriately benefited from economies of scale under the management fee structures of their advisory arrangements. The directors concluded that the shareholders of each of Global Discovery Fund, Global Equity Fund, InternationalSmall-Mid Fund, Sustainable Emerging Markets Fund and Thematic Fund would likely benefit from economies of scale if the Fund’s assets reach the level at which it will be able to take advantage of the investment advisory fee breakpoints in the Advisory Agreement.
Other benefits derived by the Funds or Artisan Partners. The directors concluded that, in addition to the services provided by Artisan Partners pursuant to the Advisory Agreement and the management fees to be paid in return, the Funds and Artisan Partners may potentially benefit from their relationship with each other in several ways. For Artisan Partners, the directors concluded the primaryfall-out benefits include (1) the potential conversion of Fund shareholders to separate account clients of Artisan Partners, and the ability otherwise to attract new clients and investment talent to Artisan Partners, (2) the acquisition of research products and services by Artisan Partners, for the benefit of its clients including the Funds, in return for brokerage commissions paid by the Funds (“soft dollars”) and (3) reputational benefits as a result of its association with the Funds. The directors concluded that, although Artisan Partners may derive such additional benefits, the Funds also could benefit from potential institutional shareholders who might choose to invest in the Funds because they want Artisan Partners’ services, but do not meet Artisan Partners’ minimum separate account size requirements. The directors also concluded that the Funds benefit from Artisan Partners’ use of research obtained through soft dollars generated with respect to its other clients, and from reputational benefits as a result of their association with Artisan Partners.
| | |
| Artisan Partners Funds | | 151 |
FACTORS CONSIDERED IN RENEWING THE FUNDS’ ADVISORY AGREEMENTS
At the conclusion of the foregoing discussions, the board approved the Advisory Agreement for the period from July 1, 2019 through June 30, 2020 for each Fund by the unanimous vote of all directors and also by the unanimous vote of all the independent directors.
| | |
| 152 | | Artisan Partners Funds |
NOTES ON MANAGEMENT’S DISCUSSION OF FUND PERFORMANCE AND PORTFOLIO HOLDINGS’ CLASSIFICATION
The discussions of each Fund included in this report include statistical information about the portfolios of each of the Funds. Except as otherwise noted, that information is as of September 30, 2019. That information will vary with changes in a Fund’s portfolio investments. The performance information for each Fund relative to its benchmark index discussed in this report was prepared by the Adviser using information reported by FactSet Research Systems, Inc. (“FactSet”).
For the purposes of assigning portfolio securities to a particular country in this report, the Adviser considers an issuer to be from a particular country as designated by its securities information vendors. However, the Adviser in its own judgment may consider an issuer to be from a country other than the country designated by the securities information vendors. A vendor’s criteria may include the identity of the jurisdiction of the issuer’s incorporation, the main equity trading market for the issuer’s securities, the geographical distribution of the issuer’s operations and the location of the issuer’s headquarters. The Adviser may also consider other criteria such as the source of a company’s revenues. Over time, country designations may change.
For the purposes of assigning portfolio securities to a particular sector and industry in this report, the Adviser assigns equity securities in accordance with the sector and industry classifications of the Global Industry Classification Standard (GICS®) developed by MSCI Inc. and Standard & Poor’s (to the extent available) as primary and FactSet (to the extent available) as a secondary source for this information. The Adviser assigns debt securities in accordance with the classifications developed by Bloomberg Finance L.P. In the event the Adviser’s securities information vendors do not classify a security to a particular sector or industry, or if the Adviser determines that a different classification is more appropriate, the Adviser classifies the security according to its own judgment, using other securities information vendors, the company description and/or other publicly available information. Sector and industry classifications may change over time.
The names of portfolio securities reflected in this report are as reported by the Funds’ data providers, may not represent the legal name of the entity and, in some cases, are translations ofnon-English names.
Definition of Portfolio Statistic
Market Capitalizationis the aggregate value of all of a company’s outstanding equity securities.
Descriptions of Indices
Each Fund’s performance is compared in this report to changes in one or more indices, including in all cases a broad-based index of changes in prices of securities in the markets in which the Fund invests. All of the indices are unmanaged and their returns include reinvested dividends. Unlike the Funds’ returns, the returns of each index do not include the payment of sales commissions or other expenses that would be incurred in the purchase or sale of the securities included in that index. An investment cannot be made directly in an index. Fair value pricing is not employed by market indices.
| | |
| Artisan Partners Funds | | 153 |
NOTES ON MANAGEMENT’S DISCUSSION OF FUND PERFORMANCE AND PORTFOLIO HOLDINGS’ CLASSIFICATION
The indices to which the Funds are compared are:
Artisan Developing World and Artisan Sustainable Emerging Markets Funds – Morgan Stanley Capital International Emerging Markets Index (MSCI Emerging Markets Index)is a market-weighted index of companies in emerging markets.
Artisan Global Discovery, Artisan Global Equity, Artisan Global Opportunities and Artisan Global Value Funds – Morgan Stanley Capital International All Country World Index (MSCI ACWI Index)is a market-weighted index of global developed and emerging markets.
Artisan High Income Fund – ICE BofAML U.S. High Yield Master II Indextracks the performance of below investment grade U.S. dollar-denominated corporate bonds publicly issued in the U.S. domestic market.
Artisan International, Artisan International Small-Mid and Artisan International Value Funds – Morgan Stanley Capital International EAFE Index (MSCI EAFE Index)is a market-weighted index of companies in developed markets, excluding the U.S. and Canada. MSCI EAFE’s average annual return since inception of the International Fund is based upon a starting date of December 31, 1995.
Artisan International and Artisan International Value Funds – Morgan Stanley Capital International All Country World Index ex U.S. (MSCI ACWI ex U.S. Index)is a market-weighted index of global developed and emerging markets, excluding the U.S.
Artisan International Small-Mid Fund – Morgan Stanley Capital International EAFE Small Cap Index (MSCI EAFE Small Cap Index) is a market-weighted index of small companies in developed markets, excluding U.S. and Canada.
Artisan International Small-Mid Fund – Morgan Stanley Capital International All Country World ex U.S. SMID Net Index (MSCI ACWI ex U.S. SMID Net Index)is a market-weighted index of mid and small cap companies in developed and emerging markets, excluding the U.S.
Artisan International Small-Mid Fund – Morgan Stanley Capital International All Country World Index ex U.S. Small Cap Net Index (MSCI ACWI ex U.S. Small Cap Net Index) is a market-weighted index of small cap companies in developed and emerging markets, excluding the U.S.
Artisan Mid Cap and Artisan Mid Cap Value Funds – Russell Midcap® Indexis a market-weighted index of about 800medium-sized U.S. companies.
Artisan Mid Cap Fund – Russell Midcap® Growth Indexis a market-weighted index of thosemedium-sized companies included in the Russell Midcap® Index with higherprice-to-book and higher forecasted growth values.
Artisan Mid Cap Value Fund – Russell Midcap® Value Indexis a market-weighted index of thosemedium-sized companies included in the Russell Midcap® Index with lowerprice-to-book ratios and lower forecasted growth values.
Artisan Small Cap Fund – Russell 2000® Indexis a market-weighted index of about 2,000 small U.S. companies.
Artisan Small Cap Fund – Russell 2000® Growth Indexis a market-weighted index of those small companies included in the Russell 2000® Index with higherprice-to-book ratios and higher forecasted growth values.
| | |
| 154 | | Artisan Partners Funds |
NOTES ON MANAGEMENT’S DISCUSSION OF FUND PERFORMANCE AND PORTFOLIO HOLDINGS’ CLASSIFICATION
Artisan Thematic Fund – S&P 500® Index –The S&P 500® is amarket-cap-weighted index that measures the performance of 500 U.S. companies focused on theLarge-cap sector of the market.
Artisan Value Fund – Russell 1000® Indexis a market-weighted index of about 1,000 large U.S. companies.
Artisan Value Fund – Russell 1000® Value Indexis a market-weighted index of those large companies included in the Russell 1000® Index with lowerprice-to-book ratios and lower forecasted growth values.
Trademarks
Trademarks and copyrights relating to the indices and products of portfolio companies mentioned in this report, if any, are owned by their respective owners. Except as otherwise indicated, the trademarks, including names, logos, slogans and service marks appearing in this report are the property of the Adviser and may not be copied, reproduced, published or in any way used without written permission.
The Global Industry Classification Standard (“GICS”) was developed by and is the exclusive property and a service mark of MSCI Inc. (“MSCI”) and Standard & Poor’s, a division of The McGraw-Hill Companies, Inc. (“S&P”) and is licensed for use by the Adviser. Neither MSCI, S&P nor any third party involved in making or compiling the GICS or any GICS classifications makes any express or implied warranties or representations with respect to such standard or classification (or the results to be obtained by the use thereof), and all such parties hereby expressly disclaim all warranties of originality, accuracy, completeness, merchantability and fitness for a particular purpose with respect to any of such standard or classification. Without limiting any of the foregoing, in no event shall MSCI, S&P, any of their affiliates or any third party involved in making or compiling the GICS or any GICS classifications have any liability for any direct, indirect, special, punitive, consequential or any other damages (including lost profits) even if notified of the possibility of such damages.
MSCI makes no express or implied warranties or representations and shall have no liability whatsoever with respect to any MSCI data contained herein. The MSCI data may not be further redistributed or used to create indices or financial products. This report is not approved or produced by MSCI.
For the ICE BofAML U.S. High Yield Master II Index the source is ICE Data Indices, LLC, used with permission. ICE Data Indices, LLC permits use of the ICE BofAML indices and related data on an “as is” basis, makes no warranties regarding same, does not guarantee the suitability, quality, accuracy, timeliness, and/or completeness of the ICE BofAML indices or any data included in, related to, or derived there from, assumes no liability in connection with their use, and does not sponsor, endorse, or recommend Artisan Partners, or any of its products or services.
Frank Russell Company (“Russell”) is the source and owner of the trademarks, service marks and copyrights related to the Russell Indexes. Russell® is a trademark of Frank Russell Company. Neither Russell nor its licensors accept any liability for any errors or omissions in the Russell Indexes and/or Russell ratings or underlying data and no party may rely on any Russell Indexes and/or Russell ratings and/or underlying data contained in this communication. No further distribution of Russell Data is permitted without Russell’s express written consent. Russell does not promote, sponsor or endorse the content of this communication.
| | |
| Artisan Partners Funds | | 155 |
NOTES ON MANAGEMENT’S DISCUSSION OF FUND PERFORMANCE AND PORTFOLIO HOLDINGS’ CLASSIFICATION
The S&P 500® Index is a product of S&P Dow Jones Indices LLC (“S&P DJI”) and/or its affiliates and has been licensed for use. Copyright© 2018 S&P Dow Jones Indices LLC, a division of S&P Global, Inc. All rights reserved. Redistribution or reproduction in whole or in part are prohibited without written permission of S&P Dow Jones Indices LLC. S&P® is a registered trademark of S&P Global and Dow Jones® is a registered trademark of Dow Jones Trademark Holdings LLC (“Dow Jones”). None of S&P DJI, Dow Jones, their affiliates or third party licensors makes any representation or warranty, express or implied, as to the ability of any index to accurately represent the asset class or market sector that it purports to represent and none shall have any liability for any errors, omissions, or interruptions of any index or the data included therein.
PROXY VOTING POLICIES AND PROCEDURES
You may obtain a description of Artisan Partners Funds’ proxy voting policies and procedures, without charge, upon request by calling 800.344.1770. That information also is included in Artisan Partners Funds’ statement of additional information, which is available without charge, on Artisan Partners Funds’ website at www.artisanpartners.com and on the SEC’s website at www.sec.gov.
Information relating to how each Fund voted proxies relating to portfolio securities held during the twelve-month period ended June 30 is available without charge, on Artisan Partners Funds’ website at www.artisanpartners.com and on the SEC’s website at www.sec.gov.
INFORMATION ABOUT PORTFOLIO SECURITIES
Effective for reporting periods on or after March 1, 2019, each Fund files a complete schedule of portfolio holdings with the SEC for the first and third quarters of each fiscal year as an exhibit to its reports on Form N-PORT. Prior to March 1, 2019, the Funds filed a complete schedule of portfolio holdings with the SEC for the first and third quarters of each fiscal year on Form N-Q. You can find SEC filings on the SEC’s website at www.sec.gov.
| | |
| 156 | | Artisan Partners Funds |
DIRECTORS AND OFFICERS
The board of directors has overall responsibility for the conduct of the affairs of Artisan Partners Funds. Each director serves an indefinite term until the next annual meeting of shareholders at which the directors are elected and until the election and qualification of his or her successor or until he or she retires, resigns or is removed from office. Artisan Partners Funds’ bylaws provide that each director must retire by the end of the calendar year in which he or she attains the age of 72, provided, however, that each director who was a director as of August 17, 2018 and who attained the age of 72 on or before December 31, 2018 shall retire as a director as of the end of the calendar year in which he or she attains the age of 75. The board of directors may fill any vacancy on the board provided that after such appointment at leasttwo-thirds of the directors have been elected by the shareholders. The shareholders may remove a director by a vote of a majority of the outstanding shares of the Funds at any meeting of shareholders called for the purpose of removing such director.
The board of directors elects the officers of Artisan Partners Funds. Each officer holds office for one year and until the election and qualification of his or her successor, or until he or she sooner dies, resigns, or is removed or disqualified. The board of directors may remove any officer, with or without cause, at any time.
The names and ages of the directors and officers as of November 15, 2019, the position each holds with the Funds, the date each was first elected to office, their principal business occupations and other directorships they have held during at least the last five years are shown below. Each director oversees all fifteen series of Artisan Partners Funds.
| | | | | | | | |
| | | | | |
Name and Age at 11/15/19 | | Position(s)
Held with
Artisan Partners Funds | | Date First Elected
or Appointed to Office | | Principal Occupation(s) during at least the
Past 5 Years | | Other Public Company or
Registered Investment
Company Directorships Held |
| |
| Directors who are not “interested persons” of Artisan Partners Funds: |
| | | | | |
| Coleen Downs Dinneen – 58 | | Director, Chair of the Education Committee | | 1/1/18 | | Retired; until 2016, Executive Vice President and General Counsel, Natixis Global Asset Management – U.S. Distribution and Chief Legal Officer and Secretary, Natixis/Loomis Funds. | | None. |
| | | | | |
| Gail L. Hanson – 63 | | Director and Independent Chair of the Board of Directors | | Director since 1/1/12; Independent Chair since 1/1/19 | | Retired; from February 2011 to April 2018, Chief Financial Officer, Aurora Health Care (not for profit health care provider); from September 2004 to February 2011, Deputy Executive Director, State of Wisconsin Investment Board. | | Director, Northwestern Mutual Series Fund, Inc. (investment company) (27 portfolios). |
| | |
| Artisan Partners Funds | | 157 |
DIRECTORS AND OFFICERS
| | | | | | | | |
| | | | | |
Name and Age at 11/15/19 | | Position(s)
Held with
Artisan Partners Funds | | Date First Elected
or Appointed to Office | | Principal Occupation(s) during at least the
Past 5 Years | | Other Public Company or
Registered Investment
Company Directorships Held |
| | | | | |
| Thomas R. Hefty – 72 | | Director | | 3/27/95 | | Retired; from January 2007 to February 2008, President, Kern Family Foundation (private, grant-making organization); until December 2006, of counsel to the law firm Reinhart Boerner Van Deuren s.c., Milwaukee, WI; until December 2006, Adjunct Professor, Department of Business and Economics, Ripon College; until December 2002, Chairman of the Board and Chief Executive Officer of Cobalt Corporation (provider of managed care and specialty business services). | | None. |
| | | | | |
| Bonnie L. Howard – 66 | | Director, Chair of the Audit Committee | | 3/9/18 | | Director, Chair of the Risk Oversight Committee and member of the Audit Committee, Assured Guaranty Ltd. (August 2012 to present); Director, BMO Financial Corp and BMO Harris Bank, N.A. (September 2013 to April 2018); until December 2011, Chief Auditor and Global Head of Emerging Risk, Citigroup, Inc. | | Director, Assured Guaranty Ltd (insurance company). |
| | | | | |
| Peter M. Lebovitz – 64 | | Director, Chair of the Governance and Nominating Committee | | 7/1/14 | | Managing Partner, Harkness Partners, LLC (provider of strategic consulting to investment management firms). | | Director and Chair, Weiss Strategic Interval Fund (closed-end fund). |
| | | | | |
| Patrick S. Pittard – 73 | | Director | | 8/9/01 | | Chairman, PatrickPittard Advisors, LLC (consulting firm); since July 2018, Owner and Chief Executive Officer of BDI DataLynk, LLC (fiber optics training company); Distinguished Executive in Residence (teaching position), University of Georgia; from November 2016 to May 2018, Chairman and Chief Executive Officer of Southern Fiber Company (fiber network company). | | Director, Lincoln National Corporation (insurance and investment management company) and Lincoln New York (an affiliate of Lincoln National Corporation). |
| | |
| 158 | | Artisan Partners Funds |
DIRECTORS AND OFFICERS
| | | | | | | | |
| | | | | |
Name and Age at 11/15/19 | | Position(s)
Held with
Artisan Partners Funds | | Date First Elected
or Appointed to Office | | Principal Occupation(s) during at least the
Past 5 Years | | Other Public Company or
Registered Investment
Company Directorships Held |
| |
| Director who is an “interested person” of Artisan Partners Funds and Officer: |
| | | | | |
| Eric R. Colson – 50* | | Director, President and Chief Executive Officer | | President and Chief Executive Officer since 2/9/10; Director since 11/12/13 | | President, Chief Executive Officer and Director of Artisan Partners Asset Management Inc. and Chair (since August 2015); Managing Director, Chief Executive Officer and President of Artisan Partners. | | None. |
| * | | Mr. Colson is an “interested person” of Artisan Partners Funds, as defined in the 1940 Act, because he is President and Chief Executive Officer of Artisan Partners Funds and holds various positions with Artisan Partners and its affiliates and beneficially owns interests in Artisan Partners and/or its parent company. |
| | |
| Artisan Partners Funds | | 159 |
DIRECTORS AND OFFICERS
| | | | | | | | |
| | | | | |
Name and Age at 11/15/19 | | Position(s)
Held with
Artisan Partners
Funds | | Date First
Elected or
Appointed to Office | | Principal Occupation(s) during at least the
Past 5 Years | | Other Public Company or
Registered Investment
Company Directorships Held |
| |
| Officers: |
| | | | | |
| Brooke J. Billick – 65 | | Chief Compliance Officer | | 8/19/04 | | Chief Compliance Officer – U.S. Mutual Funds and Associate Counsel of Artisan Partners until November 2019; Chief Compliance Officer of Artisan Partners Distributors LLC. | | None. |
| | | | | |
| Gregory K. Ramirez – 49 | | Chief Financial Officer, Vice President and Treasurer | | 2/8/11 | | Managing Director and Vice President of Artisan Partners; Executive Vice President of Artisan Partners Asset Management Inc.; Chair and President of Artisan Partners Distributors LLC; prior thereto, Vice President, Treasurer and Chief Financial Officer of Artisan Partners Distributors LLC; Director of Artisan Partners Global Funds plc.; Director of Artisan Credit Opportunities Offshore Fund Ltd (since October 2016); Director of Artisan Thematic Offshore Fund Ltd (since July 2017). | | None. |
| | | | | |
| Sarah A. Johnson – 47 | | General Counsel, Vice President and Secretary | | 2/8/11 | | Managing Director, Vice President, Secretary and General Counsel of Artisan Partners; Executive Vice President, Chief Legal Officer and Secretary of Artisan Partners Asset Management Inc.; Vice President and Secretary of Artisan Partners Distributors, LLC. | | None. |
| | | | | |
| Laura E. Simpson – 43 | | Vice President and Assistant Secretary | | 2/10/15 | | Deputy General Counsel (since January 2015) of Artisan Partners; prior thereto, Associate Counsel; Director (since January 2018) of Artisan Partners Global Funds plc. | | None. |
| | | | | |
| Shannon K. Jagodinski – 42 | | Vice President and Assistant Treasurer | | Vice President since 2/10/15; Assistant Treasurer since 2/14/12 | | Director (since January 2016) of Vehicle Administration of Artisan Partners; prior thereto, Senior Manager. | | None. |
| | | | | |
| Timothy K. Weston – 44 | | Vice President | | 2/13/19 | | Associate General Counsel of Artisan Partners. | | None. |
| | | | | |
| Blake A. Rigel – 49 | | Assistant Treasurer | | 2/9/16 | | Global Tax Director and Tax Counsel of Artisan Partners since September 2015; until September 2015, Special Tax Counsel, Kramer, Levin, Naftalis & Frankel. | | None. |
| | |
| 160 | | Artisan Partners Funds |
DIRECTORS AND OFFICERS
The business address of the officers and the director affiliated with Artisan Partners is 875 E. Wisconsin Avenue, Suite 800, Milwaukee, Wisconsin 53202. The address of the other directors is c/o Artisan Partners Funds, 875 E. Wisconsin Avenue, Suite 800, Milwaukee, Wisconsin 53202.
Artisan Partners Funds’ statement of additional information (SAI) contains further information about the directors. Please call 800.344.1770 or visit our website at www.artisanpartners.com for a free copy of the SAI.
| | |
| Artisan Partners Funds | | 161 |

ARTISAN PARTNERS FUNDS
P.O. BOX 219322
KANSAS CITY, MO 64121-9322

Item 2. Code of Ethics.
(a) Registrant has adopted a code of ethics (the “Code”) that applies to its principal executive officer, principal financial officer and principal accounting officer (the “Covered Officers”).
(b) No disclosures are required pursuant to this Item 2(b).
(c) During the period covered by the report, registrant did not make any amendments to the Code.
(d) During the period covered by the report, registrant did not grant any waivers, including implicit waivers, from the provisions of the Code.
(e) Not applicable.
(f) A copy of the Code is filed as Exhibit (a)(1) to this FormN-CSR.
Item 3. Audit Committee Financial Expert.
Registrant’s board of directors has determined that Gail L. Hanson, member of the registrant’s audit committee, Thomas R. Hefty, member of the registrant’s audit committee, Peter M. Lebovitz, member of the registrant’s audit committee, and Bonnie Howard, member and chair of the registrant’s audit committee, each qualify as an audit committee financial expert, as such term is defined in Instruction 2(b) to Item 3 of FormN-CSR. Ms. Hanson, Mr. Hefty, Mr. Lebovitz and Ms. Howard are “independent” as such term is defined in paragraph (a)(2) of Item 3 of FormN-CSR.
Under applicable securities laws, a person who is determined to be an audit committee financial expert will not be deemed an “expert” for any purpose, including, without limitation, for the purposes of Section 11 of the Securities Act of 1933, as a result of being designated or identified as an audit committee financial expert. The designation or identification of a person as an audit committee financial expert does not impose on such person any duties, obligations, or liabilities that are greater than the duties, obligations, and liabilities imposed on such person as a member of the audit committee and board of directors in the absence of such designation or identification.
Item 4. Principal Accountant Fees and Services.
Aggregate fees billed to the Corporation for professional services rendered by Ernst & Young for the 2019 and 2018 fiscal years of the Corporation are summarized in the table below. The table summarizes fees billed (or to be billed) by Ernst & Young for work performed relating to each applicable period identified below.
Fees:
| | | | | | | | |
| | | Fiscal Year Ended
September 30, 2019 | | | Fiscal Year Ended
September 30, 2018 | |
Audit Fees (a) | | $ | 488,790 | | | $ | 435,340 | |
Audit-Related Fees (b) | | $ | — | | | $ | 78,580 | |
Tax Fees (c) | | $ | 307,457 | | | $ | 323,911 | |
All Other Fees (d) | | $ | — | | | | — | |
(a) “Audit Fees” include amounts for professional services rendered by Ernst & Young for the audit of the Corporation’s annual financial statements and services that are normally provided by Ernst & Young in connection with statutory and regulatory filings or engagements, including for 2019, portions of which had not been billed as of September 30, 2019, and fees billed for consents issued in conjunction with the Corporation’s post-effective amendments to the Funds’ registration statements filed for each of the last two fiscal years. The fees billed during the fiscal year ended September 30, 2019 also include a consent issued in conjunction with the Corporation’s post-effective amendments to the Funds’ registration statements filed in connection with the initial offering of Advisor Shares of Artisan InternationalSmall-Mid Fund. The fees billed during the fiscal year ended September 30, 2018 also include consents issued in conjunction with the Corporation’s post-effective amendments to the Funds’ registration statements filed in connection with the initial offering of Advisor Shares and Institutional Shares of Artisan Thematic Fund.
(b) “Audit-Related Fees” include amounts for assurance and related services by Ernst & Young that are reasonably related to the performance of the audit of the Corporation’s financial statements. Audit-related fees have not been reported under the item “audit fees” in the chart above.
The fees billed by Ernst & Young for the fiscal year ended September 30, 2018 include fees incurred for services for review procedures performed in conjunction with the semiannual report to shareholders as of March 31, 2018.
(c) “Tax Fees” include amounts for professional services rendered by Ernst & Young for tax compliance, tax advice and tax planning.
The fees shown in the table above for the fiscal year ended September 30, 2019 include fees for (1) the review and preparation of the Funds’ income tax returns for the fiscal year ended September 30, 2019, which had not been billed as of September 30, 2019; (2) the review of excise tax calculations and preparation of excise tax returns for the calendar year ended December 31, 2019, which also had not been billed as of September 30, 2019; (3) the use of a PFIC database supplied by Ernst & Young for the fiscal year ended September 30, 2018, the excise year ended December 31, 2018 and the semiannual period ended March 31, 2019; (4) the use of a Qualified Foreign Corporation (QFC) Database supplied by Ernst & Young for the calendar year ended December 31, 2018; and (5) the use of a Global Withholding Tax Reporter Database supplied by Ernst & Young for the fiscal year ended September 30, 2019.
The fees shown in the table above for the fiscal year ended September 30, 2018 include fees for (1) the review and preparation of the Funds’ income tax returns for the fiscal year ended September 30, 2018; (2) the review of excise tax calculations and preparation of excise tax returns for the calendar year ended December 31, 2018; (3) the use of a PFIC database supplied by Ernst & Young for the fiscal year ended September 30, 2017, the excise year ended December 31, 2017 and the semiannual period ended March 31, 2018; (4) the use of a Qualified Foreign Corporation (QFC) Database supplied by Ernst & Young for the calendar year ended December 31, 2017; and (5) the use of a Global Withholding Tax Reporter Database supplied by Ernst & Young for the fiscal year ended September 30, 2018.
(d) None.
(e)(1) During its regularly scheduled periodic meetings, the registrant’s audit committee considers any requests topre-approve any audit, audit-related, tax and other services to be provided by the principal accountants of the registrant. The audit committee has authorized its chair to exercise that authority in the intervals between meetings; and the chair presents any suchpre-approvals to the audit committee at its next regularly scheduled meeting. Under paragraph (c)(7)(i)(C) of Rule2-01 of SEC RegulationS-X,pre-approval ofnon-audit services may be waived provided that: 1) the aggregate fees for all such services provided constitutes no more than five percent of the total amount of fees paid by the registrant to its principal accountant during the fiscal year in which services are provided, 2) such services were not recognized by the registrant at the time of engagement asnon-audit services and 3) such services are promptly brought to the attention of the audit committee of the registrant and approved prior to the completion of the audit.
(e)(2) No services included in Items 4(b) – (d) above were approved pursuant to paragraph (c)(7)(i)(C) of Rule2-01 of RegulationS-X.
(f) Not applicable.
(g) The aggregate fees for the fiscal years ended September 30, 2019 and September 30, 2018 by the registrant’s principal accountant fornon-audit services rendered to the registrant are shown in the tables above and described under Items 4(b) – (d) above. For the registrant’s fiscal years ended September 30, 2019 and September 30, 2018, Ernst & Young LLP served as the registrant’s principal accountant and provided no services and billed no fees fornon-audit services rendered to the registrant’s adviser or entities controlling, controlled by or under common control with the adviser that provides ongoing services to the registrant.
(h) The audit committee of the registrant’s board of directors has considered whether the provision ofnon-audit services that were rendered to the registrant’s investment adviser, and any entity controlling, controlled by or under common control with the investment adviser that provides ongoing services to the registrant that were notpre-approved pursuant to paragraph (c)(7)(ii) of Rule2-01 of RegulationS-X is compatible with maintaining the principal accountant’s independence. The provisions of Rule2-01(c)(7) were effective on May 6, 2003. No such services were rendered on or after May 6, 2003.
Item 5. Audit Committee of Listed Registrants.
Not applicable.
Item 6. Schedule of Investments.
The Schedules of Investments in securities of unaffiliated issuers as of September 30, 2019 are included as part of the annual reports to shareholders filed under Item 1 of this FormN-CSR.
Item 7. Disclosure of Proxy Voting Policies and Procedures forClosed-End Management Investment Companies.
Not applicable.
Item 8. Portfolio Managers ofClosed-End Management Investment Companies.
Not applicable.
Item 9. Purchases of Equity Securities byClosed-End Management Investment Company and Affiliated Purchasers.
Not applicable.
Item 10. Submission of Matters to a Vote of Security Holders.
No material changes to report.
Item 11. Controls and Procedures.
(a) The registrant’s principal executive and principal financial officers have concluded, based on an evaluation of the registrant’s disclosure controls and procedures (as defined in Rule30a-3(c) under the Investment Company Act of 1940, the “Disclosure Controls”) as of a date within 90 days prior to the filing date (the “Filing Date”) of this FormN-CSR (the “Report”), that the Disclosure Controls are effectively designed to provide reasonable assurance that the information required to be disclosed by the registrant in the Report is recorded, processed, summarized and reported by the Filing Date, including ensuring that information required to be disclosed in the Report is accumulated and communicated to the registrant’s management, including the registrant’s principal executive officer and principal financial officer, as appropriate to allow timely decisions regarding required disclosure.
(b) There were no changes in the registrant’s internal controls over financial reporting (as defined in Rule30a-3(d) under the Investment Company Act of 1940) that occurred during the second fiscal quarter of the period covered by this report that have materially affected, or are reasonably likely to materially affect, the registrant’s internal control over financial reporting.
Item 12. Disclosure of Securities Lending Activities forClosed-End Management Investment Companies.
Not applicable.
Item 13. Exhibits.
| | | | | | | |
(a) | | | | (1 | ) | | Code of Ethics for Principal Executive Officer, Principal Financial Officer and Principal Accounting Officer (as referenced in Item 2 above), attached hereto as Exhibit (a)(1) |
| | |
| | | | (2 | ) | | Certifications of Eric R. Colson, Principal Executive Officer and Gregory K. Ramirez, Principal Financial Officer pursuant to Rule30a-2(a) under the Investment Company Act of 1940 (17 CFR270.30a-2(a)), attached hereto as Exhibits (a)(2)(i) and (a)(2)(ii) |
| | |
| (b) | | | | | | | Certification of Eric R. Colson, Principal Executive Officer and Gregory K. Ramirez, Principal Financial Officer pursuant to Section 906 of the Sarbanes-Oxley Act of 2002, attached hereto as Exhibit (b) |
SIGNATURES
Pursuant to the requirements of the Securities Exchange Act of 1934 and the Investment Company Act of 1940, the registrant has duly caused this report to be signed on its behalf by the undersigned, thereunto duly authorized.
| | |
| Artisan Partners Funds, Inc. |
| |
| By: | | /s/ Eric R. Colson |
| | Eric R. Colson |
| | Principal Executive Officer |
| |
| Date: | | December 6, 2019 |
Pursuant to the requirements of the Securities Exchange Act of 1934 and the Investment Company Act of 1940, this report has been signed below by the following persons on behalf of the registrant and in the capacities and on the dates indicated.
| | |
| By: | | /s/ Eric R. Colson |
| | Eric R. Colson |
| | Principal Executive Officer |
| |
| Date: | | December 6, 2019 |
| |
| By: | | /s/ Gregory K. Ramirez |
| | Gregory K. Ramirez |
| | Principal Financial Officer |
| |
| Date: | | December 6, 2019 |