UNITED STATES
SECURITIES AND EXCHANGE COMMISSION
Washington, D.C. 20549
FORM N-CSR
CERTIFIED SHAREHOLDER REPORT OF REGISTERED
MANAGEMENT INVESTMENT COMPANIES
Investment Company Act file number 811-08932
Artisan Partners Funds, Inc.
(Exact name of registrant as specified in charter)
875 East Wisconsin Avenue, Suite 800
Milwaukee, Wisconsin 53202
(Address of principal executive offices) (Zip Code)
| Sarah A. Johnson | Nathan Briggs | |
| Artisan Partners Funds, Inc. | Simpson Thacher & Bartlett LLP | |
| 875 East Wisconsin Avenue, Suite 800 | 900 G Street, N.W. | |
| Milwaukee, Wisconsin 53202 | Washington, D.C. 20001 |
(Name and address of agents for service)
Registrant’s telephone number, including area code: (414) 390-6100
Date of fiscal year end: 9/30
Date of reporting period: 9/30/22
Form N-CSR is to be used by management investment companies to file reports with the Commission not later than 10 days after the transmission to stockholders of any report that is required to be transmitted to stockholders under Rule 30e-1 under the Investment Company Act of 1940 (17 CFR 270.30e-1). The Commission may use the information provided on Form N-CSR in its regulatory, disclosure review, inspection, and policymaking roles.
A registrant is required to disclose the information specified by Form N-CSR, and the Commission will make this information public. A registrant is not required to respond to the collection of information contained in Form N-CSR unless the Form displays a currently valid Office of Management and Budget (“OMB”) control number. Please direct comments concerning the accuracy of the information collection burden estimate and any suggestions for reducing the burden to Secretary, Securities and Exchange Commission, 450 Fifth Street, NW, Washington, DC 20549-0609. The OMB has reviewed this collection of information under the clearance requirements of 44 U.S.C. § 3507.
Item 1. Report to Shareholders.
ARTISAN PARTNERS FUNDS
| Share Class | ||||||
| Investor | Advisor | Institutional | ||||
Artisan Developing World Fund | ARTYX | APDYX | APHYX | |||
Artisan Emerging Markets Debt Opportunities Fund | APFOX | APDOX | APHOX | |||
Artisan Floating Rate Fund | ARTUX | APDUX | APHUX | |||
Artisan Focus Fund | ARTTX | APDTX | APHTX | |||
Artisan Global Discovery Fund | APFDX | APDDX | APHDX | |||
Artisan Global Equity Fund | ARTHX | APDHX | APHHX | |||
Artisan Global Opportunities Fund | ARTRX | APDRX | APHRX | |||
Artisan Global Unconstrained Fund | APFPX | APDPX | APHPX | |||
Artisan Global Value Fund | ARTGX | APDGX | APHGX | |||
Artisan High Income Fund | ARTFX | APDFX | APHFX | |||
Artisan International Fund | ARTIX | APDIX | APHIX | |||
Artisan International Explorer Fund | N/A | ARDBX | ARHBX | |||
Artisan International Small-Mid Fund | ARTJX | APDJX | APHJX | |||
Artisan International Value Fund | ARTKX | APDKX | APHKX | |||
Artisan Mid Cap Fund | ARTMX | APDMX | APHMX | |||
Artisan Mid Cap Value Fund | ARTQX | APDQX | APHQX | |||
Artisan Select Equity Fund | ARTNX | APDNX | APHNX | |||
Artisan Small Cap Fund | ARTSX | APDSX | APHSX | |||
Artisan Sustainable Emerging Markets Fund | ARTZX | APDEX | APHEX | |||
Artisan Value Fund | ARTLX | APDLX | APHLX | |||
Artisan Value Income Fund | APFWX | APDWX | APHWX | |||
As currently permitted by regulations previously adopted by the Securities and Exchange Commission (the “SEC”), paper copies of the Funds’ annual and semi-annual shareholder reports are not currently being sent by mail, unless you specifically request paper copies of the reports from the Funds or from your financial intermediary, such as a broker-dealer or bank. Instead, the reports are made available online at https://connect.rightprospectus.com/Artisan, and you will be notified by mail each time a report is posted and provided with a website link to access the report.
If you already elected to receive shareholder reports electronically, you will not be affected by this change and you need not take any action. You may elect to receive shareholder reports and other communications from a Fund electronically anytime by contacting your financial intermediary or, if you invest directly with a Fund, by calling 800.344.1770 or by enrolling on the Funds’ website at www.artisanpartners.com.
You may elect to receive all future reports in paper free of charge. If you invest through a financial intermediary, you can contact your financial intermediary to request that you continue to receive paper copies of your shareholder reports. If you invest directly with a Fund, you can call 800.344.1770 to let the Fund know you wish to continue receiving paper copies of your shareholder reports. Your election to receive reports in paper will apply to all Funds held in your account if you invest through your financial intermediary or all Funds held with the fund complex if you invest directly with a Fund.
ARTISAN PARTNERS FUNDS
P.O. BOX 219322
KANSAS CITY, MO 64121-9322
This report and the audited financial statements contained herein are provided for the general information of the shareholders of Artisan Partners Funds. Before investing, investors should consider carefully each Fund’s investment objective, risks and charges and expenses. For a prospectus or summary prospectus, which contain that information and more information about each Fund, please call 800.344.1770 or visit our website at www.artisanpartners.com. Read it carefully before you invest or send money.
Company discussions are for illustration only and are not intended as recommendations of individual stocks. The discussions present information about the companies believed to be accurate, and the views of the portfolio managers, as of 30 September 2022. That information and those views may change, and the Funds disclaim any obligation to advise shareholders of any such changes.
Artisan Partners Funds offered through Artisan Partners Distributors LLC, member FINRA.
PERFORMANCE HISTORY
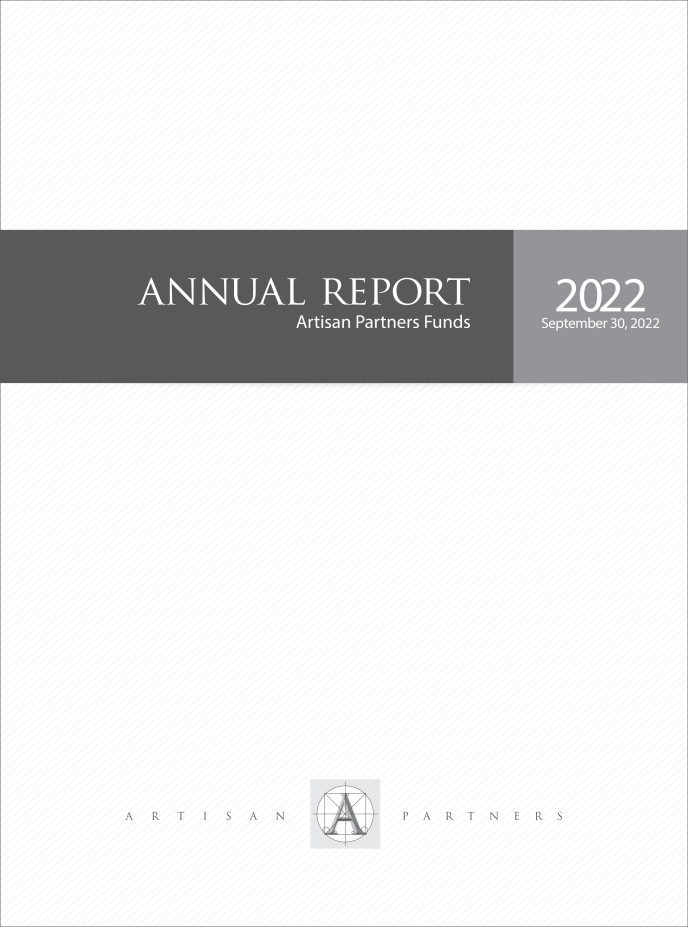
GROWTH OF AN ASSUMED $10,000 INVESTMENT (6/29/2015 to 9/30/2022)
AVERAGE ANNUAL TOTAL RETURNS (as of 9/30/2022)
| Fund / Index | 1-Year | �� | 3-Year | 5-Year | Since Inception | |||||||||||||||
Artisan Developing World Fund – Investor Shares (6/29/2015) | -48.39 | % | 0.84 | % | 2.12 | % | 5.08 | % | ||||||||||||
Artisan Developing World Fund – Advisor Shares (6/29/2015) | -48.32 | 0.99 | 2.28 | 5.26 | ||||||||||||||||
Artisan Developing World Fund – Institutional Shares (6/29/2015) | -48.27 | 1.09 | 2.38 | 5.36 | ||||||||||||||||
MSCI Emerging Markets Index | -28.11 | -2.07 | -1.81 | 1.15 | * | |||||||||||||||
| * | As of Investor, Advisor and Institutional Shares inception date. |
The performance quoted represents past performance, which does not guarantee future results. The investment return and principal value of an investment in the Fund will fluctuate, so that an investor’s shares in the Fund, when redeemed, may be worth more or less than their original cost. Current performance may be lower or higher than the performance data quoted. For the most recent month-end performance, visit www.artisanpartners.com or call 800.344.1770. The graph and table above do not reflect the deduction of taxes that a shareholder would pay on distributions or sale of Fund shares. See Notes on Management’s Discussion of Fund Performance and Portfolio Holdings’ Classification for a description of the index.
INVESTING ENVIRONMENT
During the one-year period ended September 30, 2022, emerging markets struggled, even more so than their US and European counterparts. Country-level returns were mixed during the period. Indonesia was the top contributor in the MSCI Emerging Markets Index, while China was the main detractor, partially due to continued COVID-19 restrictions in China. It was a volatile period for global markets, which were plagued by inflation, global growth concerns and tighter financial conditions. These challenges, combined with the COVID-19 pandemic and the war in Ukraine, have fostered uncertainty in the marketplace.
SECTOR DIVERSIFICATION
| Sector | 9/30/2022 | 9/30/2021 | ||||||||
Communication Services | 16.3 | % | 22.4 | % | ||||||
Consumer Discretionary | 25.4 | 26.0 | ||||||||
Consumer Staples | 5.4 | 5.3 | ||||||||
Financials | 5.0 | 3.1 | ||||||||
Health Care | 12.3 | 14.5 | ||||||||
Industrials | – | 2.1 | ||||||||
Information Technology | 32.1 | 25.6 | ||||||||
Real Estate | 2.0 | – | ||||||||
Other assets less liabilities | 1.5 | 1.0 | ||||||||
| 100.0 | % | 100.0 | % | |||||||
PERFORMANCE DISCUSSION
Top contributors within the portfolio during the period included: Chinese operator of an integrated online and offline platform for housing transactions and services KE Holdings, US-based software provider Snowflake, Chinese online direct sales company JD.com, Brazilian financial services and technology company NU Holdings and Brazilian financial technology solutions provider StoneCo. Bottom contributors during the period included: Singaporean provider of information technology services Sea, US-based technology and social media services provider Snap, US provider of software solutions Unity Software, US-based technology company NVIDIA and Chinese online entertainment company Bilibili.
REGION ALLOCATION
| Region | 9/30/2022 | 9/30/2021 | ||||||||
Developed Markets | 62.2 | % | 51.8 | % | ||||||
Emerging Asia | 27.5 | 40.0 | ||||||||
Latin America | 8.8 | 6.1 | ||||||||
Europe, Middle East and Africa | – | 1.1 | ||||||||
FUND CHANGES
During the period, we identified the following new investment opportunities for the portfolio: US-based software provider Snowflake, US-based manufacturer of orthodontia products Align Technology, Chinese operator of an integrated online and offline platform for housing transactions and services KE Holdings, Brazilian financial services and technology company NU Holdings and US-based financial transaction processing service provider Mastercard. We funded these purchases in part through exiting our positions in Farfetch, Aier Eye Hospital, Alibaba, Uber and StoneCo.
As of March 3, 2022 through period end, Russian securities within the portfolio had been valued at zero due to sanctions related to the war in Ukraine.
| 2 | Artisan Partners Funds |
ARTISAN EMERGING MARKETS DEBT OPPORTUNITIES FUND
PERFORMANCE HISTORY
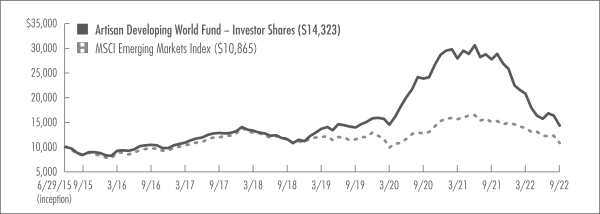
GROWTH OF AN ASSUMED $10,000 INVESTMENT (4/7/2022 to 9/30/2022)
AVERAGE ANNUAL TOTAL RETURNS (as of 9/30/2022)
| Fund / Index | Since Inception† | ||||
Artisan Emerging Markets Debt Opportunities Fund – Investor Shares (4/7/2022) | -1.72 | % | |||
Artisan Emerging Markets Debt Opportunities Fund – Advisor Shares (4/7/2022) | -1.78 | ||||
Artisan Emerging Markets Debt Opportunities Fund – Institutional Shares (4/7/2022) | -1.65 | ||||
JP Morgan EMB Hard Currency/Local Currency 50/50 | -11.38 | * | |||
| † | For the period of commencement of operations 4/7/2022 through 9/30/2022; not annualized. |
| * | As of Investor, Advisor and Institutional Shares inception date. |
The performance quoted represents past performance, which does not guarantee future results. The investment return and principal value of an investment in the Fund will fluctuate, so that an investor’s shares in the Fund, when redeemed, may be worth more or less than their original cost. Current performance may be lower or higher than the performance data quoted. For the most recent month-end performance, visit www.artisanpartners.com or call 800.344.1770. The graph and table above do not reflect the deduction of taxes that a shareholder would pay on distributions or sale of Fund shares. The performance shown does not reflect the deduction of a 2% redemption fee on shares held by an investor for 90 days or less and, if reflected, the fee would reduce the performance quoted. Unlike the Index, the Fund may hold loans and other security types. At times, this can cause material differences in relative performance. The Fund’s performance reflects Artisan Partners Limited Partnership’s (the “Adviser” or “Artisan Partners”) contractual agreement to limit the Fund’s expenses, which has had a material impact on performance and performance would have been lower in its absence. See Notes on Management’s Discussion of Fund Performance and Portfolio Holdings’ Classification for a description of the index.
INVESTING ENVIRONMENT
Risk assets continued to face headwinds since the launch of the fund in April 2022. High inflation, tighter financial conditions and concerns over slower global economic growth all weighed on financial markets, including emerging markets debt, which declined for the reporting period. Many central banks around the world continue to tighten monetary policy as a means of curbing inflation. The U.S. Federal Reserve raised interest rates by 75 basis points for the third consecutive time in September, bringing the Fed funds rate to a range of 3% to 3.25% and to the highest level since before the 2008 financial crisis. Recent Fed action is taking place against the backdrop of tightening monetary policy by other central banks in developed and emerging markets, including the ECB, which raised rates again in September to 0.75%. Several EM central banks were particularly hawkish during the inception to date period, including Hungary, Poland, Czech Republic, Colombia, Chile, Peru and the Philippines.
PERFORMANCE DISCUSSION
Top contributors within the portfolio during the period included exposures to: Uzbek sovereign credit and currency, Zambian local interest rates and currency, and Dominican sovereign credit and currency. Bottom contributors within the portfolio during the period included exposures to: Colombian local interest rates and corporate credit, Hungarian currency and Egyptian sovereign credit.
PORTFOLIO COMPOSITION
| Type | 9/30/2022 | ||||
Sovereign Government Bonds | 71.2 | % | |||
Corporate Bonds | 10.4 | ||||
Other assets less liabilities | 18.4 | ||||
| 100.0 | % | ||||
FUND CHANGES
During the period, relative to weightings within the J.P. Morgan EMB Hard Currency/Local Currency 50/50 Index, we increased our investments in: Romania, Mexico, Dominican Republic, and Serbia. We funded these allocations in part though decreasing our investments in: South Africa, Czech Republic, Indonesia, Turkey and Malaysia.
| Artisan Partners Funds | 3 |
PERFORMANCE HISTORY
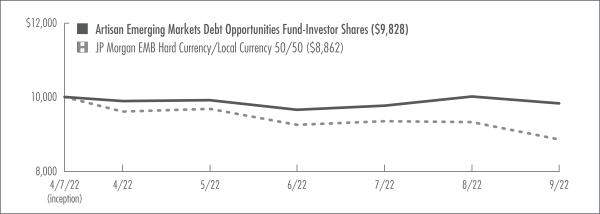
GROWTH OF AN ASSUMED $10,000 INVESTMENT (12/1/2021 to 9/30/2022)
AVERAGE ANNUAL TOTAL RETURNS (as of 9/30/2022)
| Fund / Index | Since Inception† | ||||
Artisan Floating Rate Fund – Investor Shares (12/1/2021) | -4.17 | % | |||
Artisan Floating Rate Fund – Advisor Shares (12/1/2021) | -4.09 | ||||
Artisan Floating Rate Fund – Institutional Shares (12/1/2021) | -4.07 | ||||
Credit Suisse Leveraged Loan Total Return Index | -2.73 | * | |||
| † | For the period of commencement of operations 12/1/2021 through 9/30/2022; not annualized. |
| * | As of Investor, Advisor and Institutional Shares inception date. |
The performance quoted represents past performance, which does not guarantee future results. The investment return and principal value of an investment in the Fund will fluctuate, so that an investor’s shares in the Fund, when redeemed, may be worth more or less than their original cost. Current performance may be lower or higher than the performance data quoted. For the most recent month-end performance, visit www.artisanpartners.com or call 800.344.1770. The graph and table above do not reflect the deduction of taxes that a shareholder would pay on distributions or sale of Fund shares. The performance shown does not reflect the deduction of a 2% redemption fee on shares held by an investor for 90 days or less and, if reflected, the fee would reduce the performance quoted. Unlike the Index, the Fund may hold loans and other security types. At times, this can cause material differences in relative performance. The Fund’s performance reflects Artisan Partners’ contractual agreement to limit the Fund’s expenses, which has had a material impact on performance and performance would have been lower in its absence. See Notes on Management’s Discussion of Fund Performance and Portfolio Holdings’ Classification for a description of the index.
INVESTING ENVIRONMENT
Non-investment grade credit markets declined during the period between the Fund’s inception on December 1, 2021 and September 30, 2022. The macro backdrop of tightening financial conditions, sequentially slowing growth and 40-year highs in inflation led to widespread volatility across interest rates and risk assets. With expectations for a slowing global economy, investors pushed yields and credit spreads to their highest levels since 2020. As a result, higher-rated credits held up best throughout the volatility as growth concerns and higher borrowing costs had a disproportionate impact on more levered credits.
PERFORMANCE DISCUSSION
Top contributors within the portfolio during the period included: US-based food distributor Dairyland USA, US-based home remodeling company PHRG Intermediate, US-based aviation company Atlantic Aviation, US-based insurance broker Alliant Holdings and US-based education company Renaissance Learning. Bottom contributors during the period included: US-based consumer loyalty solutions provider Loyalty Ventures, US-based global investment banking and securities firm Goldman Sachs, US-based food and commissary provider TKC Holdings, US-based commercial fiber optic business Gridiron Fiber and US-based financial advisor Edelman Financial Engines.
PORTFOLIO COMPOSITION
| Type | 9/30/2022 | ||||
Bank Loans | 86.6 | % | |||
Corporate Bonds | 4.0 | ||||
Warrants | – | ||||
Other assets less liabilities | 9.4 | ||||
| 100.0 | % | ||||
FUND CHANGES
During the period, we identified the following new investment opportunities for the portfolio: US-based day care provider KUEHG, US-based food distributor Dairyland USA, US-based legal services company WMB Holdings, US-based wealth management company Focus Financial Partners and US-based distribution and supply chain services company BCPE Empire Holdings. We funded these purchases in part through exiting our positions in DiversiTech Holdings, HUB Holdings, Loyalty Ventures, JPMorgan Chase and SRS Distribution.
| 4 | Artisan Partners Funds |
PERFORMANCE HISTORY
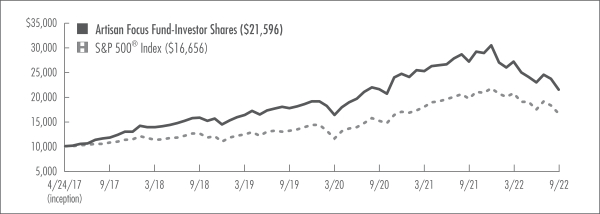
GROWTH OF AN ASSUMED $10,000 INVESTMENT (4/24/2017 to 9/30/2022)
AVERAGE ANNUAL TOTAL RETURNS (as of 9/30/2022)
| Fund / Index | 1-Year | 3-Year | 5-Year | Since Inception | ||||||||||||||||
Artisan Focus Fund – Investor Shares (4/24/2017) | -20.76 | % | 6.64 | % | 12.85 | % | 15.22 | % | ||||||||||||
Artisan Focus Fund – Advisor Shares (7/31/2018) | -20.60 | 6.82 | n/a | 8.92 | ||||||||||||||||
Artisan Focus Fund – Institutional Shares (2/3/2020) | -20.56 | n/a | n/a | 4.47 | ||||||||||||||||
S&P 500® Index | -15.47 | 8.16 | 9.24 | 9.84 | * | |||||||||||||||
| * | As of Investor Shares inception date. |
The performance quoted represents past performance, which does not guarantee future results. The investment return and principal value of an investment in the Fund will fluctuate, so that an investor’s shares in the Fund, when redeemed, may be worth more or less than their original cost. Current performance may be lower or higher than the performance data quoted. The Fund’s investments in initial public offerings (IPOs) have made a material contribution to performance during some or all of the periods shown above. IPO investments may contribute significantly to a small portfolio’s return, an effect that will generally decrease as assets grow. IPO investments may be unavailable in the future. For the most recent month-end performance, visit www.artisanpartners.com or call 800.344.1770. The graph and table above do not reflect the deduction of taxes that a shareholder would pay on distributions or sale of Fund shares. The Investor Shares’ performance reflects Artisan Partners’ contractual agreement to limit the Fund’s expenses, which has had a material impact on performance and performance would have been lower in its absence. See Notes on Management’s Discussion of Fund Performance and Portfolio Holdings’ Classification for a description of the index.
INVESTING ENVIRONMENT
During the one-year period ended September 30, 2022, US equities struggled. Large-cap stocks held up better than small- and mid-cap stocks, but all were down meaningfully. From a style perspective, value outperformed growth during the period. Sector returns were all negative, except for energy and utilities. It was a volatile period for global markets, which were plagued by inflation, global growth concerns and tighter financial conditions. These challenges, combined with the COVID-19 pandemic and the war in Ukraine, have fostered uncertainty in the marketplace.
SECTOR DIVERSIFICATION
| Sector | 9/30/2022 | 9/30/2021 | ||||||||
Communication Services | 7.8 | % | 7.0 | % | ||||||
Consumer Discretionary | 3.4 | 2.6 | ||||||||
Consumer Staples | 4.2 | – | ||||||||
Energy | 1.3 | – | ||||||||
Financials | 9.5 | 11.4 | ||||||||
Health Care | 23.8 | 4.9 | ||||||||
Industrials | 15.2 | 17.3 | ||||||||
Information Technology | 16.2 | 35.9 | ||||||||
Materials | 0.5 | 8.0 | ||||||||
Real Estate | 7.6 | 6.3 | ||||||||
Utilities | 6.3 | 1.2 | ||||||||
Other assets less liabilities | 4.2 | 5.4 | ||||||||
| 100.0 | % | 100.0 | % | |||||||
| Artisan Partners Funds | 5 |
PERFORMANCE DISCUSSION*
Top contributors within the portfolio during the period included: US-based liquefied natural gas company Cheniere Energy, US-based healthcare company UnitedHealth Group, US-based wireless network operator T-Mobile, US-based semiconductor company Advanced Micro Devices and US-based pharmaceutical and health information technology company McKesson. Bottom contributors during the period included: US-based online retailer Amazon, US-based data provider IHS Markit, US-based business and financial management solutions provider Intuit, US-based beauty products manufacturer Estee Lauder and US-based multinational hospitality company Hilton Worldwide. The use of derivatives, including options used to hedge short-term portfolio volatility, had a negative overall impact on performance during the period.
FUND CHANGES
During the period, we identified the following new investment opportunities for the portfolio: US-based healthcare company UnitedHealth Group, US-based online retailer Amazon, Canadian owned transcontinental freight railway Canadian Pacific Railway, US-based electric power and energy infrastructure company NextEra Energy and US-based pharmaceutical and health information technology company McKesson. We funded these purchases in part through exiting our positions in Analog Devices, Linde, Johnson Controls, Accenture and Meta.
| * | For options, exposures have been delta-adjusted to determine contribution to return. |
| 6 | Artisan Partners Funds |
PERFORMANCE HISTORY
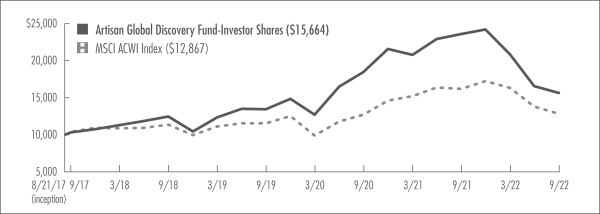
GROWTH OF AN ASSUMED $10,000 INVESTMENT (8/21/2017 to 9/30/2022)
AVERAGE ANNUAL TOTAL RETURNS (as of 9/30/2022)
| Fund / Index | 1-Year | 3-Year | 5-Year | Since Inception | ||||||||||||||||
Artisan Global Discovery Fund – Investor Shares (8/21/2017) | -33.87 | % | 5.15 | % | 8.70 | % | 9.18 | % | ||||||||||||
Artisan Global Discovery Fund – Advisor Shares (2/3/2020) | -33.79 | n/a | n/a | 1.59 | ||||||||||||||||
Artisan Global Discovery Fund – Institutional Shares (2/3/2020) | -33.65 | n/a | n/a | 1.77 | ||||||||||||||||
MSCI ACWI Index | -20.66 | 3.75 | 4.44 | 5.06 | * | |||||||||||||||
| * | As of Investor Shares inception date. |
The performance quoted represents past performance, which does not guarantee future results. The investment return and principal value of an investment in the Fund will fluctuate, so that an investor’s shares in the Fund, when redeemed, may be worth more or less than their original cost. Current performance may be lower or higher than the performance data quoted. For the most recent month-end performance, visit www.artisanpartners.com or call 800.344.1770. The graph and table above do not reflect the deduction of taxes that a shareholder would pay on distributions or sale of Fund shares. The Investor Shares’ and Advisor Shares’ performance reflects Artisan Partners’ contractual agreement to limit the Fund’s expenses, which has had a material impact on performance and performance would have been lower in its absence. See Notes on Management’s Discussion of Fund Performance and Portfolio Holdings’ Classification for a description of the index.
INVESTING ENVIRONMENT
During the one-year period ended September 30, 2022, global equities struggled. While US markets led, US, European and emerging markets were all down meaningfully during the period. It was a volatile period for global markets, which were plagued by inflation, global growth concerns and tighter financial conditions. These challenges, combined with the COVID-19 pandemic and the war in Ukraine, have fostered uncertainty in the marketplace.
SECTOR DIVERSIFICATION
| Sector | 9/30/2022 | 9/30/2021 | ||||||||
Communication Services | 2.1 | % | 3.5 | % | ||||||
Consumer Discretionary | 3.9 | 5.6 | ||||||||
Financials | 13.9 | 11.5 | ||||||||
Health Care | 25.1 | 21.8 | ||||||||
Industrials | 17.4 | 17.7 | ||||||||
Information Technology | 31.6 | 30.6 | ||||||||
Materials | 0.7 | 2.2 | ||||||||
Real Estate | 0.9 | 1.3 | ||||||||
Utilities | – | 1.5 | ||||||||
Other assets less liabilities | 4.4 | 4.3 | ||||||||
| 100.0 | % | 100.0 | % | |||||||
PERFORMANCE DISCUSSION
Top contributors within the portfolio during the period included: US-based designer and manufacturer of engineered fabricated metal products and services Valmont, Dutch biotechnology company Argenx, US-based provider of data center and cloud networking equipment Arista, US-based social gaming operator Zynga, US-based global supplier of advanced semiconductors ON Semiconductor. Bottom contributors during the period included: Hong Kong-based power tools company Techtronic Industries, US-based provider of cloud-based inbound marketing and sales software HubSpot, US-based cloud computing company Veeva Systems, Australian enterprise software designer and developer Atlassian and US-based semiconductor company Advanced Micro Devices.
REGION ALLOCATION
| Region | 9/30/2022 | 9/30/2021 | ||||||||
Americas | 64.8 | % | 60.7 | % | ||||||
Europe | 21.3 | 25.0 | ||||||||
Pacific Basin | 5.7 | 7.6 | ||||||||
Emerging Markets | 3.8 | 2.4 | ||||||||
FUND CHANGES
During the period, we identified the following new investment opportunities for the portfolio: US-based contract manufacturing supplier to the pharmaceuticals industry Catalent, US-based global supplier of advanced semiconductors ON Semiconductor, Dutch biotechnology company Argenx, US-based cloud software provider Workiva and Norwegian machine-to-machine wireless connectivity supplier Nordic Semiconductor. We funded these purchases in part through exiting our positions in Fortive, Burlington, Ceridian HCM Holdings, Blackline and Banco Bilbao Vizcaya Argentaria.
| Artisan Partners Funds | 7 |
PERFORMANCE HISTORY
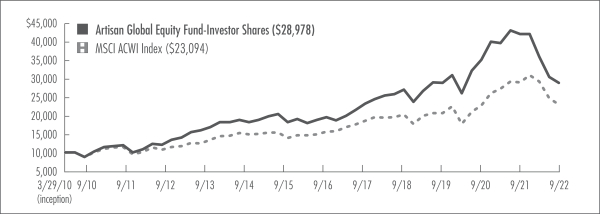
GROWTH OF AN ASSUMED $10,000 INVESTMENT (3/29/2010 to 9/30/2022)
AVERAGE ANNUAL TOTAL RETURNS (as of 9/30/2022)
| Fund / Index | 1-Year | 3-Year | 5-Year | 10-Year | Since Inception | ||||||||||||||||||||
Artisan Global Equity Fund – Investor Shares (3/29/2010) | -31.48 | % | -0.01 | % | 4.46 | % | 7.95 | % | 8.88 | % | |||||||||||||||
Artisan Global Equity Fund – Advisor Shares (8/5/2020) | -31.48 | n/a | n/a | n/a | -8.39 | ||||||||||||||||||||
Artisan Global Equity Fund – Institutional Shares (10/15/2015) | -31.34 | 0.19 | 4.69 | n/a | 6.39 | ||||||||||||||||||||
MSCI ACWI Index | -20.66 | 3.75 | 4.44 | 7.28 | 6.92 | * | |||||||||||||||||||
| * | As of Investor Shares inception date. |
The performance quoted represents past performance, which does not guarantee future results. The investment return and principal value of an investment in the Fund will fluctuate, so that an investor’s shares in the Fund, when redeemed, may be worth more or less than their original cost. Current performance may be lower or higher than the performance data quoted. For the most recent month-end performance, visit www.artisanpartners.com or call 800.344.1770. The graph and table above do not reflect the deduction of taxes that a shareholder would pay on distributions or sale of Fund shares. The Investor Shares’ and Advisor Shares’ performance reflects Artisan Partners’ contractual agreement to limit the Fund’s expenses, which has had a material impact on performance and performance would have been lower in its absence. See Notes on Management’s Discussion of Fund Performance and Portfolio Holdings’ Classification for a description of the index.
INVESTING ENVIRONMENT
During the one-year period ended September 30, 2022, global equities struggled. While US markets led, US, European and emerging markets were all down meaningfully during the period. It was a volatile period for global markets, which were plagued by inflation, global growth concerns and tighter financial conditions. These challenges, combined with the COVID-19 pandemic and the war in Ukraine, have fostered uncertainty in the marketplace.
SECTOR DIVERSIFICATION
| Sector | 9/30/2022 | 9/30/2021 | ||||||||
Communication Services | 7.6 | % | 8.9 | % | ||||||
Consumer Discretionary | 11.5 | 8.1 | ||||||||
Consumer Staples | 4.9 | 1.6 | ||||||||
Energy | 18.4 | 1.2 | ||||||||
Financials | 12.8 | 4.5 | ||||||||
Health Care | 15.6 | 19.9 | ||||||||
Industrials | 15.1 | 24.8 | ||||||||
Information Technology | 6.6 | 23.9 | ||||||||
Materials | 0.7 | 2.0 | ||||||||
Utilities | 1.9 | 1.6 | ||||||||
Other assets less liabilities | 4.9 | 3.5 | ||||||||
| 100.0 | % | 100.0 | % | |||||||
PERFORMANCE DISCUSSION
Top contributors within the portfolio during the period included: US-based natural gas producer EQT, Dutch biotechnology company Argenx, UK-based compliance software developer Ideagen, US-based contract logistics provider GXO Logistics and US-based wireless network operator T-Mobile. Bottom contributors during the period included: Russian commercial bank Sberbank, US-based genetics testing company Natera, Russian ore and non-metallic mineral processer MMC Norilsk Nickel, US-based Internet search engine operator Alphabet and German provider of mail and logistics services Deutsche Post.
REGION ALLOCATION
| Region | 9/30/2022 | 9/30/2021 | ||||||||
Americas | 50.4 | % | 49.6 | % | ||||||
Europe | 37.2 | 34.2 | ||||||||
Emerging Markets | 4.2 | 8.1 | ||||||||
Pacific Basin | 3.3 | 2.7 | ||||||||
Middle East | – | 1.9 | ||||||||
| 8 | Artisan Partners Funds |
FUND CHANGES
During the period, we identified the following new investment opportunities for the portfolio: US-based provider of technology and information solutions to the oil and gas industry Schlumberger, Netherlands-based oil and gas company Shell, US-based natural gas producer EQT, US-based exchange for global commodities Intercontinental Exchange and US-based provider of equipment and components used in oil and gas drilling NOV. We funded these purchases in part through exiting our positions in Johnson Controls, Vertiv, GXO Logistics, CM.com and Altair Engineering.
As of March 3, 2022 through period end, Russian securities within the portfolio had been valued at zero due to sanctions related to the war in Ukraine.
| Artisan Partners Funds | 9 |
ARTISAN GLOBAL OPPORTUNITIES FUND
PERFORMANCE HISTORY
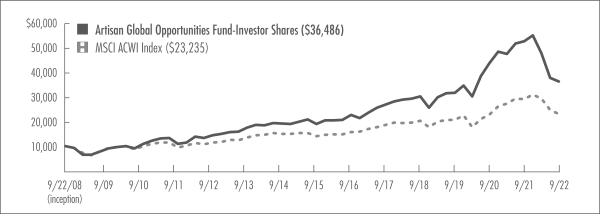
GROWTH OF AN ASSUMED $10,000 INVESTMENT (9/22/2008 to 9/30/2022)
AVERAGE ANNUAL TOTAL RETURNS (as of 9/30/2022)
| Fund / Index | 1-Year | 3-Year | 5-Year | 10-Year | Since Inception | ||||||||||||||||||||
Artisan Global Opportunities Fund – Investor Shares (9/22/2008) | -31.13 | % | 4.54 | % | 6.09 | % | 9.62 | % | 9.67 | % | |||||||||||||||
Artisan Global Opportunities Fund – Advisor Shares (4/1/2015) | -31.03 | 4.68 | 6.24 | n/a | 8.44 | ||||||||||||||||||||
Artisan Global Opportunities Fund – Institutional Shares (7/26/2011) | -30.97 | 4.79 | 6.35 | 9.88 | 9.53 | ||||||||||||||||||||
MSCI ACWI Index | -20.66 | 3.75 | 4.44 | 7.28 | 6.20 | * | |||||||||||||||||||
| * | As of Investor Shares inception date. |
The performance quoted represents past performance, which does not guarantee future results. The investment return and principal value of an investment in the Fund will fluctuate, so that an investor’s shares in the Fund, when redeemed, may be worth more or less than their original cost. Current performance may be lower or higher than the performance data quoted. For the most recent month-end performance, visit www.artisanpartners.com or call 800.344.1770. The graph and table above do not reflect the deduction of taxes that a shareholder would pay on distributions or sale of Fund shares. The Investor Shares’ performance reflects Artisan Partners’ contractual agreement to limit the Fund’s expenses, which has had a material impact on performance and performance would have been lower in its absence. See Notes on Management’s Discussion of Fund Performance and Portfolio Holdings’ Classification for a description of the index.
INVESTING ENVIRONMENT
During the one-year period ended September 30, 2022, global equities struggled. While US markets led, US, European and emerging markets were all down meaningfully during the period. It was a volatile period for global markets, which were plagued by inflation, global growth concerns and tighter financial conditions. These challenges, combined with the COVID-19 pandemic and the war in Ukraine, have fostered uncertainty in the marketplace.
SECTOR DIVERSIFICATION
| Sector | 9/30/2022 | 9/30/2021 | ||||||||
Communication Services | 3.8 | % | 7.6 | % | ||||||
Consumer Discretionary | 11.7 | 10.8 | ||||||||
Financials | 15.1 | 10.0 | ||||||||
Health Care | 24.5 | 22.3 | ||||||||
Industrials | 10.9 | 15.3 | ||||||||
Information Technology | 23.8 | 22.2 | ||||||||
Materials | 0.5 | 2.3 | ||||||||
Utilities | 5.5 | 3.9 | ||||||||
Other assets less liabilities | 4.2 | 5.6 | ||||||||
| 100.0 | % | 100.0 | % | |||||||
PERFORMANCE DISCUSSION
Top contributors within the portfolio during the period included: US-based provider of data center and cloud networking equipment Arista, US-based owner and operator of quick service Mexican restaurants Chipotle Mexican Grill, Spanish developer and operator of renewable power generation Iberdrola, US-based global supplier of advanced semiconductors ON Semiconductor and US-based insurance holding company Progressive. Bottom contributors during the period included: Hong Kong-based power tools company Techtronic Industries, US-based semiconductor company Advanced Micro Devices, US-based cloud computing company Veeva Systems, Canadian eCommerce platform Shopify and Swedish telecommunications company Telefonaktiebolaget LM Ericsson.
REGION ALLOCATION
| Region | 9/30/2022 | 9/30/2021 | ||||||||
Americas | 58.4 | % | 57.6 | % | ||||||
Europe | 26.4 | 25.2 | ||||||||
Pacific Basin | 9.9 | 10.8 | ||||||||
Emerging Markets | 1.1 | 0.8 | ||||||||
FUND CHANGES
During the period, we identified the following new investment opportunities for the portfolio: US-based global supplier of advanced semiconductors ON Semiconductor, Danish pharmaceutical company Novo Nordisk, US-based owner and operator of quick service Mexican restaurants Chipotle Mexican Grill, US-based insurance holding company Progressive and US-based car manufacturer Tesla. We funded these purchases in part through exiting our positions Activision Blizzard, Shopify, Netflix, Dexcom and Fortive.
| 10 | Artisan Partners Funds |
ARTISAN GLOBAL UNCONSTRAINED FUND
PERFORMANCE HISTORY
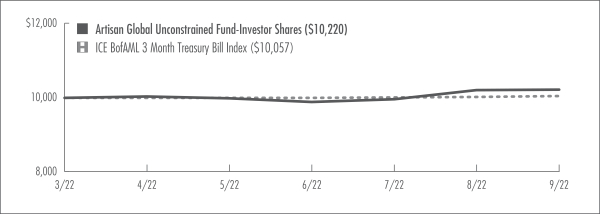
GROWTH OF AN ASSUMED $10,000 INVESTMENT (3/31/2022 to 9/30/2022)
AVERAGE ANNUAL TOTAL RETURNS (as of 9/30/2022)
| Fund / Index | Since Inception† | ||||
Artisan Global Unconstrained Fund – Investor Shares (3/31/2022) | 2.10 | % | |||
Artisan Global Unconstrained Fund – Advisor Shares (3/31/2022) | 2.24 | ||||
Artisan Global Unconstrained Fund – Institutional Shares (3/31/2022) | 2.27 | ||||
ICE BofAML 3 Month Treasury Bill Index | 0.57 | * | |||
| † | For the period of commencement of operations 3/31/2022 through 9/30/2022; not annualized. |
| * | As of Investor, Advisor and Institutional Shares inception date. |
The performance quoted represents past performance, which does not guarantee future results. The investment return and principal value of an investment in the Fund will fluctuate, so that an investor’s shares in the Fund, when redeemed, may be worth more or less than their original cost. Current performance may be lower or higher than the performance data quoted. For the most recent month-end performance, visit www.artisanpartners.com or call 800.344.1770. The graph and table above do not reflect the deduction of taxes that a shareholder would pay on distributions or sale of Fund shares. The performance shown does not reflect the deduction of a 2% redemption fee on shares held by an investor for 90 days or less and, if reflected, the fee would reduce the performance quoted. Unlike the Index, the Fund may hold loans and other security types. At times, this can cause material differences in relative performance. The Fund’s performance reflects Artisan Partners’ contractual agreement to limit the Fund’s expenses, which has had a material impact on performance and performance would have been lower in its absence. See Notes on Management’s Discussion of Fund Performance and Portfolio Holdings’ Classification for a description of the index.
INVESTING ENVIRONMENT
Risk assets continued to face headwinds since the launch of the fund in March 2022. High inflation, tighter financial conditions and concerns over slower global economic growth all weighed on financial markets, including emerging markets debt, which declined for the reporting period. Many central banks around the world continue to tighten monetary policy as a means of curbing inflation. The U.S. Federal Reserve raised interest rates by 75 basis points for the third consecutive time in September, bringing the Fed funds rate to a range of 3% to 3.25% and to the highest level since before the 2008 financial crisis. Recent Fed action is taking place against the backdrop of tightening monetary policy by other central banks in developed and emerging markets, including the ECB, which raised rates again in September to 0.75%. Several EM central banks were particularly hawkish during the inception-to-date period, including Hungary, Poland, Czech Republic, Colombia, Chile, Peru and the Philippines.
PERFORMANCE DISCUSSION
Top contributors within the portfolio during the period included exposures to: South African sovereign credit and currency, Uzbek sovereign credit and currency, and Zambian local interest rates and currency. Bottom contributors within the portfolio during the period included exposures to: Egyptian sovereign credit, Serbian sovereign credit and Romanian sovereign credit.
PORTFOLIO COMPOSITION
| Type | 9/30/2022 | ||||
Sovereign Government Bonds | 47.1 | % | |||
Corporate Bonds | 10.8 | ||||
Exchange Traded Funds | 0.2 | ||||
Options Purchased | –^ | ||||
Other assets less liabilities | 41.9 | ||||
| 100.0 | % | ||||
| ^ | Amount rounds to less than 0.1% |
FUND CHANGES
During the period, we increased our investments in: Dominican Republic, Uzbekistan, Serbia, Hungary and Colombia. We funded these allocations in part through decreasing our investments in: Guatemala, Uruguay, Uganda, Czech Republic and Albania.
| Artisan Partners Funds | 11 |
PERFORMANCE HISTORY
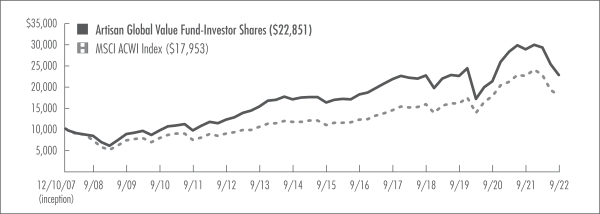
GROWTH OF AN ASSUMED $10,000 INVESTMENT (12/10/2007 to 9/30/2022)
AVERAGE ANNUAL TOTAL RETURNS (as of 9/30/2022)
| Fund / Index | 1-Year | 3-Year | 5-Year | 10-Year | Since Inception | ||||||||||||||||||||
Artisan Global Value Fund – Investor Shares (12/10/2007) | -21.10 | % | 0.29 | % | 0.89 | % | 6.45 | % | 5.74 | % | |||||||||||||||
Artisan Global Value Fund – Advisor Shares (4/1/2015) | -21.01 | 0.43 | 1.02 | n/a | 3.71 | ||||||||||||||||||||
Artisan Global Value Fund – Institutional Shares (7/17/2012) | -20.92 | 0.54 | 1.13 | 6.70 | 7.34 | ||||||||||||||||||||
MSCI ACWI Index | -20.66 | 3.75 | 4.44 | 7.28 | 4.03 | * | |||||||||||||||||||
| * | As of Investor Shares inception date. |
The performance quoted represents past performance, which does not guarantee future results. The investment return and principal value of an investment in the Fund will fluctuate, so that an investor’s shares in the Fund, when redeemed, may be worth more or less than their original cost. Current performance may be lower or higher than the performance data quoted. For the most recent month-end performance information, visit www.artisanpartners.com or call 800.344.1770. The graph and table above do not reflect the deduction of taxes that a shareholder would pay on distributions or sale of Fund shares. The Investor Shares’ performance reflects Artisan Partners’ contractual agreement to limit the Fund’s expenses, which has had a material impact on performance and performance would have been lower in its absence. See Notes on Management’s Discussion of Fund Performance and Portfolio Holdings’ Classification for a description of the index.
INVESTING ENVIRONMENT
During the one-year period ended September 30, 2022, global equities struggled. While US markets led, US, European and emerging markets were all down meaningfully during the period. It was a volatile period for global markets, which were plagued by inflation, global growth concerns and tighter financial conditions. These challenges, combined with the COVID-19 pandemic and the war in Ukraine, have fostered uncertainty in the marketplace.
SECTOR DIVERSIFICATION
| Sector | 9/30/2022 | 9/30/2021 | ||||||||
Communication Services | 10.8 | % | 13.8 | % | ||||||
Consumer Discretionary | 14.4 | 16.9 | ||||||||
Consumer Staples | 4.5 | 5.6 | ||||||||
Energy | 4.6 | 2.8 | ||||||||
Financials | 31.8 | 27.6 | ||||||||
Health Care | 14.8 | 14.3 | ||||||||
Industrials | 6.7 | 4.6 | ||||||||
Information Technology | 5.7 | 4.9 | ||||||||
Materials | 2.8 | 3.2 | ||||||||
Other assets less liabilities | 3.9 | 6.3 | ||||||||
| 100.0 | % | 100.0 | % | |||||||
PERFORMANCE DISCUSSION
Top contributors within the portfolio during the period included: US-based health benefits company Elevance, US-based insurance holding company Progressive, UK-based defense, security and aerospace company BAE Systems, Canadian oil and gas company Imperial Oil and Netherlands-based oil and gas company Shell. Bottom contributors during the period included: US-based social networking website operator Meta, Netherlands-based health technology company Koninklijke Philips, Korean electronic products and solutions manufacturer Samsung Electronics, Chinese e-commerce company Alibaba and German cement producer HeidelbergCement.
REGION ALLOCATION
| Region | 9/30/2022 | 9/30/2021 | ||||||||
Americas | 46.5 | % | 46.3 | % | ||||||
Europe | 38.6 | 36.0 | ||||||||
Emerging Markets | 8.0 | 8.7 | ||||||||
Pacific Basin | 3.0 | 2.7 | ||||||||
FUND CHANGES
During the period, we identified the following new investment opportunities for the portfolio: UK-based provider of a range of insurance brokerage, reinsurance and risk management consulting services Willis Towers Watson, US-based provider of etch equipment to the semiconductor industry Lam Research Corp, US-based provider of sensing, electrical protection, control and power management solutions Sensata Technologies Holding, German commercial vehicle manufacturer Daimler Truck and French energy company TotalEnergies. We funded these purchases in part through exiting our positions in Booking Holdings and Tesco.
| 12 | Artisan Partners Funds |
PERFORMANCE HISTORY
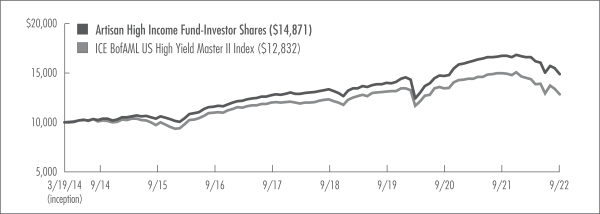
GROWTH OF AN ASSUMED $10,000 INVESTMENT (3/19/2014 to 9/30/2022)
AVERAGE ANNUAL TOTAL RETURNS (as of 9/30/2022)
| Fund / Index | 1-Year | 3-Year | 5-Year | Since Inception | ||||||||||||||||
Artisan High Income Fund – Investor Shares (3/19/2014) | -11.00 | % | 2.11 | % | 3.15 | % | 4.76 | % | ||||||||||||
Artisan High Income Fund – Advisor Shares (3/19/2014) | -10.88 | 2.23 | 3.29 | 4.91 | ||||||||||||||||
Artisan High Income Fund – Institutional Shares (10/3/2016) | -10.81 | 2.33 | 3.41 | 4.47 | ||||||||||||||||
ICE BofAML US High Yield Master II Index | -14.06 | -0.67 | 1.41 | 2.96 | * | |||||||||||||||
| * | As of Investor and Advisor Shares inception date. |
The performance quoted represents past performance, which does not guarantee future results. The investment return and principal value of an investment in the Fund will fluctuate, so that an investor’s shares in the Fund, when redeemed, may be worth more or less than their original cost. Current performance may be lower or higher than the performance data quoted. For the most recent month-end performance, visit www.artisanpartners.com or call 800.344.1770. The graph and table above does not reflect the deduction of taxes that a shareholder would pay on distributions or sale of Fund shares. The performance shown does not reflect the deduction of a 2% redemption fee on shares held by an investor for 90 days or less and, if reflected, the fee would reduce the performance quoted. Unlike the Index, the Fund may hold loans and other security types. At times, this can cause material differences in relative performance. See Notes on Management’s Discussion of Fund Performance and Portfolio Holdings’ Classification for a description of the index.
INVESTING ENVIRONMENT
Non-investment grade credit markets declined during the one-year period ended September 30, 2022. The macro backdrop of tightening financial conditions, sequentially slowing growth and 40-year highs in inflation led to widespread volatility across interest rates and risk assets. With expectations for a slowing global economy, investors pushed yields and credit spreads to their highest levels since 2020. As a result, higher-rated credits held up best throughout the volatility as growth concerns and higher borrowing costs had a disproportionate impact on more levered credits.
PERFORMANCE DISCUSSION
Top contributors within the portfolio during the period included: US-based sealing products manufacturer UTEX Industries, UK-based independent insurance broker Ardonagh Group, US-based oil and gas company Callon Petroleum, US-based automotive repair company Service King and US-based email and web security appliances company Barracuda Networks. Bottom contributors during the period included: US-based cruise ship operator Carnival, US-based retailer Nordstrom, French telecom company Altice France, US-based telecommunications and mass media company Charter Communications and US-based provider of life insurance and wealth management solutions NFP Corp.
PORTFOLIO COMPOSITION
| Type | 9/30/2022 | 9/30/2021 | ||||||||
Corporate Bonds | 72.4 | % | 61.4 | % | ||||||
Bank Loans | 14.9 | 35.0 | ||||||||
Common Stocks | 0.4 | 0.2 | ||||||||
Convertible Bonds | – | 0.1 | ||||||||
Warrants | – | |||||||||
Other assets less liabilities | 12.3 | 3.3 | ||||||||
| 100.0 | % | 100.0 | ||||||||
FUND CHANGES
During the period, we identified the following new investment opportunities for the portfolio: US-based special purpose acquisition company BellRing Brands, US-based automotive repair company Service King, US-based business services provider Nexus Buyer, Canadian aircraft company Bombardier and Netherlands-based cable operator Ziggo. We funded these purchases in part through exiting our positions in General Electric, Shearer’s Foods, RealPage, Epicor Software and ICON.
| Artisan Partners Funds | 13 |
PERFORMANCE HISTORY
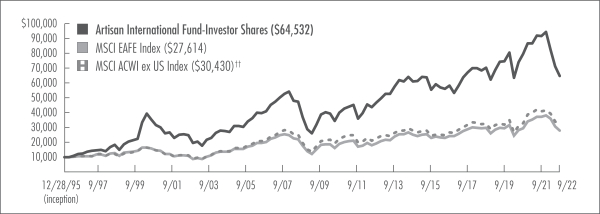
GROWTH OF AN ASSUMED $10,000 INVESTMENT (12/28/1995 to 9/30/2022)
AVERAGE ANNUAL TOTAL RETURNS (as of 9/30/2022)
| Fund / Index | 1-Year | 3-Year | 5-Year | 10-Year | Since Inception | ||||||||||||||||||||
Artisan International Fund – Investor Shares (12/28/1995) | -29.32 | % | -4.60 | % | -0.73 | % | 3.29 | % | 7.22 | % | |||||||||||||||
Artisan International Fund – Advisor Shares (4/1/2015) | -29.24 | -4.47 | -0.59 | n/a | 0.31 | ||||||||||||||||||||
Artisan International Fund – Institutional Shares (7/1/1997) | -29.14 | -4.37 | -0.50 | 3.52 | 6.30 | ||||||||||||||||||||
MSCI EAFE Index | -25.13 | -1.83 | -0.84 | 3.67 | 3.87 | * | |||||||||||||||||||
MSCI ACWI ex US Index†† | -25.17 | -1.52 | -0.81 | 3.01 | 4.25 | * | |||||||||||||||||||
| * | As of Investor Shares inception date. |
| †† | The performance of the Index represents linked performance data for the MSCI ACWI ex US (Gross) Index from Investor Shares’ inception date to 12/31/2000 and the MSCI ACWI ex US (Net) Index from 1/1/2001 forward. |
The performance quoted represents past performance, which does not guarantee future results. The investment return and principal value of an investment in the Fund will fluctuate, so that an investor’s shares in the Fund, when redeemed, may be worth more or less than their original cost. Current performance may be lower or higher than the performance data quoted. For the most recent month-end performance, visit www.artisanpartners.com or call 800.344.1770. The graph and table above do not reflect the deduction of taxes that a shareholder would pay on distributions or sale of Fund shares. See Notes on Management’s Discussion of Fund Performance and Portfolio Holdings’ Classification for a description of each index.
INVESTING ENVIRONMENT
During the one-year period ended September 30, 2022, global equities struggled. While US markets led, US, European and emerging markets were all down meaningfully during the period. It was a volatile period for global markets, which were plagued by inflation, global growth concerns and tighter financial conditions. These challenges, combined with the COVID-19 pandemic and the war in Ukraine, have fostered uncertainty in the marketplace.
SECTOR DIVERSIFICATION
| Sector | 9/30/2022 | 9/30/2021 | ||||||||
Communication Services | 7.1 | % | 6.4 | % | ||||||
Consumer Discretionary | 9.6 | 9.8 | ||||||||
Consumer Staples | 7.7 | 3.4 | ||||||||
Energy | 10.8 | 1.4 | ||||||||
Financials | 21.2 | 21.3 | ||||||||
Health Care | 12.9 | 15.0 | ||||||||
Industrials | 14.9 | 15.4 | ||||||||
Information Technology | 3.2 | 11.0 | ||||||||
Materials | 8.6 | 12.2 | ||||||||
Utilities | – | 0.3 | ||||||||
Other assets less liabilities | 4.0 | 3.8 | ||||||||
| 100.0 | % | 100.0 | % | |||||||
PERFORMANCE DISCUSSION
Top contributors within the portfolio during the period included: Dutch biotechnology company Argenx, Germany-based European exchange operator Deutsche Boerse, US-based IT outsourcing and consulting firm Accenture, UK-based banking and financial services institution HSBC Holdings and Swiss temporary staffing company Adecco Group. Bottom contributors during the period included: Russian commercial bank Sberbank, Russian ore and non-metallic mineral processer MMC Norilsk Nickel, German provider of mail and logistics services Deutsche Post, British multinational bank Barclays and Irish low-cost carrier Ryanair Holdings.
REGION ALLOCATION
| Region | 9/30/2022 | 9/30/2021 | ||||||||
Europe | 69.2 | % | 70.1 | % | ||||||
Americas | 24.0 | 11.8 | ||||||||
Emerging Markets | 1.6 | 6.4 | ||||||||
Pacific Basin | 1.2 | 4.0 | ||||||||
Middle East | – | 3.9 | ||||||||
| 14 | Artisan Partners Funds |
FUND CHANGES
During the period, we identified the following new investment opportunities for the portfolio: Netherlands-based oil and gas company Shell, US-based provider of technology and information solutions to the oil and gas industry Schlumberger, Swiss manufacturer of luxury goods Cie Financiere Richemont, Canadian freight railway Canadian National Railway and French luxury goods manufacturer LVMH. We funded these purchases in part through exiting our positions in Nice, Siemens, Sony Group, Hoya Corp and DSV.
As of March 3, 2022 through period end, Russian securities within the portfolio had been valued at zero due to sanctions related to the war in Ukraine.
| Artisan Partners Funds | 15 |
ARTISAN INTERNATIONAL EXPLORER FUND
PERFORMANCE HISTORY
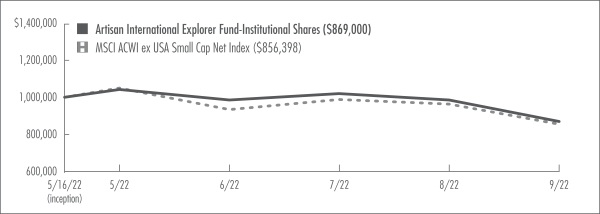
GROWTH OF AN ASSUMED $1,000,000 INVESTMENT (5/16/2022 to 9/30/2022)
AVERAGE ANNUAL TOTAL RETURNS (as of 9/30/2022)
| Fund / Index | Since Inception† | ||||
Artisan International Explorer Fund – Advisor Shares (5/16/2022) | -13.10 | % | |||
Artisan International Explorer Fund – Institutional Shares (5/16/2022) | -13.10 | ||||
MSCI ACWI ex USA Small Cap Net Index | -14.36 | * | |||
| † | For the period of commencement 5/16/2022 through 9/30/2022; not annualized. |
| * | As of Advisor and Institutional Shares inception date. |
The performance quoted represents past performance, which does not guarantee future results. The investment return and principal value of an investment in the Fund will fluctuate, so that an investor’s shares in the Fund, when redeemed, may be worth more or less than their original cost. Current performance may be lower or higher than the performance data quoted. For the most recent month-end performance, visit www.artisanpartners.com or call 800.344.1770. The graph and table above do not reflect the deduction of taxes that a shareholder would pay on distributions or sale of Fund shares. The Fund’s performance reflects Artisan Partners’ contractual agreement to limit the Fund’s expenses, which has had a material impact on performance and performance would have been lower in its absence. See Notes on Management’s Discussion of Fund Performance and Portfolio Holdings’ Classification for a description of the index.
INVESTING ENVIRONMENT
During the period between the Fund’s May 16, 2022 inception and September 30, 2022, global equities declined. US markets held up slightly better than their European and emerging markets counterparts, but all were down. It was a volatile period for global markets, which were plagued by inflation, global growth concerns and tighter financial conditions. These challenges, combined with the COVID-19 pandemic and the war in Ukraine, have fostered uncertainty in the marketplace.
SECTOR DIVERSIFICATION
| Sector | 9/30/2022 | ||||
Communication Services | 11.1 | % | |||
Consumer Discretionary | 17.3 | ||||
Consumer Staples | 1.0 | ||||
Financials | 9.4 | ||||
Health Care | 7.5 | ||||
Industrials | 21.5 | ||||
Information Technology | 13.8 | ||||
Materials | 2.7 | ||||
Real Estate | 2.4 | ||||
Other assets less liabilities | 13.3 | ||||
| 100.0 | % | ||||
PERFORMANCE DISCUSSION
Top contributors within the portfolio during the period included: UK-based information services business Euromoney, Indonesian retailer and local operator Mitra Adiperkasa (MAPI), Japanese researcher and developer of software solutions Zuken, Canadian automotive collision repair company Boyd Group Services and UK-based supplier of specialty plastic and fiber products Essentra. Bottom contributors during the period included: Argentinian provider of online travel booking services Despegar, Norwegian software solutions provider Sikri Holding, UK-based residential property services provider LSL Property Services, Irish homebuilder company Glenveagh Properties and South African retail building materials distributor Cashbuild.
REGION ALLOCATION
| Region | 9/30/2022 | ||||
Europe | 39.0 | % | |||
Emerging Markets | 22.6 | ||||
Americas | 14.0 | ||||
Pacific Basin | 11.1 | ||||
FUND CHANGES
During the period, we identified the following new investment opportunities for the portfolio: Indonesian retailer and local operator Mitra Adiperkasa (MAPI), Indian credit rating company Care Ratings, Japanese copyright management and consulting business NexTone, Swiss designer, developer and producer of delivery devices Medmix and UK-based supplier of specialty plastic and fiber products Essentra. We funded these purchases in part through exiting our positions in Electro Optic Systems.
| 16 | Artisan Partners Funds |
ARTISAN INTERNATIONAL SMALL-MID FUND
PERFORMANCE HISTORY
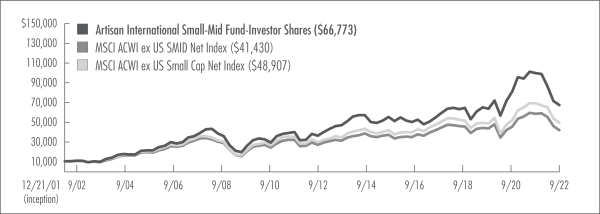
GROWTH OF AN ASSUMED $10,000 INVESTMENT (12/21/2001 to 9/30/2022)
AVERAGE ANNUAL TOTAL RETURNS (as of 9/30/2022)
| Fund / Index | 1-Year | 3-Year | 5-Year | 10-Year | Since Inception | ||||||||||||||||||||
Artisan International Small-Mid Fund – Investor Shares (12/21/2001) | -32.53 | % | 1.90 | % | 2.56 | % | 5.42 | % | 9.57 | % | |||||||||||||||
Artisan International Small-Mid Fund – Advisor Shares (12/4/2018) | -32.47 | 2.04 | n/a | n/a | 5.23 | ||||||||||||||||||||
Artisan International Small-Mid Fund – Institutional Shares (4/12/2016) | -32.38 | 2.15 | 2.79 | n/a | 4.59 | ||||||||||||||||||||
MSCI ACWI ex US SMID Net Index | -28.85 | -1.28 | -1.25 | 3.74 | 7.08 | * | |||||||||||||||||||
MSCI ACWI ex US Small Cap Net Index | -28.93 | 0.38 | -0.56 | 4.44 | 7.94 | * | |||||||||||||||||||
| * | As of Investor Shares inception date. |
The performance quoted represents past performance, which does not guarantee future results. The investment return and principal value of an investment in the Fund will fluctuate, so that an investor’s shares in the Fund, when redeemed, may be worth more or less than their original cost. Current performance may be lower or higher than the performance data quoted. For the most recent month-end performance, visit www.artisanpartners.com or call 800.344.1770. The graph and table above do not reflect the deduction of taxes that a shareholder would pay on distributions or sale of Fund shares. See Notes on Management’s Discussion of Fund Performance and Portfolio Holdings’ Classification for a description of each index.
INVESTING ENVIRONMENT
During the one-year period ended September 30, 2022, global equities struggled. While US markets led, US, European and emerging markets were all down meaningfully during the period. It was a volatile period for global markets, which were plagued by inflation, global growth concerns and tighter financial conditions. These challenges, combined with the COVID-19 pandemic and the war in Ukraine, have fostered uncertainty in the marketplace.
SECTOR DIVERSIFICATION
| Sector | 9/30/2022 | 9/30/2021 | ||||||||
Communication Services | 1.0 | % | 0.6 | % | ||||||
Consumer Discretionary | 3.1 | 6.6 | ||||||||
Consumer Staples | 5.7 | 6.4 | ||||||||
Energy | 1.6 | 0.9 | ||||||||
Financials | 2.3 | 2.2 | ||||||||
Health Care | 23.5 | 23.5 | ||||||||
Industrials | 24.4 | 27.5 | ||||||||
Information Technology | 27.0 | 25.6 | ||||||||
Materials | 1.9 | 1.7 | ||||||||
Real Estate | 1.3 | 1.2 | ||||||||
Other assets less liabilities | 8.2 | 3.8 | ||||||||
| 100.0 | % | 100.0 | % | |||||||
PERFORMANCE DISCUSSION
Top contributors within the portfolio during the period included: US-based medical imaging manufacturer Lantheus, French engineering company GTT, US-based manufacturer of lighting products and radio frequency applications Wolfspeed, US-based pharmaceutical manufacturer Zogenix and US-based application software developer Agilysys. Bottom contributors during the period included: Israeli commercial printing solutions company Kornit Digital, Israeli provider of cloud-based and on-premise enterprise software solutions Nice, UK-based packaged holiday business Jet2, Japanese courier service company SG Holdings and Danish life supporting and training equipment provider Ambu.
REGION ALLOCATION
| Region | 9/30/2022 | 9/30/2021 | ||||||||
Europe | 39.8 | % | 43.9 | % | ||||||
Americas | 24.1 | 19.5 | ||||||||
Pacific Basin | 13.3 | 17.6 | ||||||||
Middle East | 8.0 | 9.1 | ||||||||
Emerging Markets | 6.6 | 6.1 | ||||||||
FUND CHANGES
During the period, we identified the following new investment opportunities for the portfolio: Swedish biopharmaceutical company Swedish Orphan Biovitrum (SOBI), US-based dental products manufacturer and marketer Envista Holdings, German manufacturer of glass and plastic products Gerresheimer, Canadien provider of cloud based software solutions Lightspeed Commerce and French entertainment and multimedia company Ubisoft. We funded these purchases in part through exiting our positions in Comet Holding, Siegfried Holding, B&M, ASOS and Roland.
| Artisan Partners Funds | 17 |
ARTISAN INTERNATIONAL VALUE FUND
PERFORMANCE HISTORY
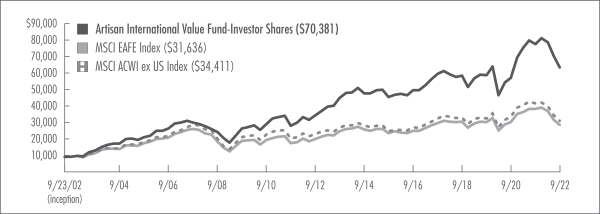
GROWTH OF AN ASSUMED $10,000 INVESTMENT (9/23/2002 to 9/30/2022)
AVERAGE ANNUAL TOTAL RETURNS (as of 9/30/2022)
| Fund / Index | 1-Year | 3-Year | 5-Year | 10-Year | Since Inception | ||||||||||||||||||||
Artisan International Value Fund – Investor Shares (9/23/2002) | -18.40 | % | 2.63 | % | 1.24 | % | 6.34 | % | 10.24 | % | |||||||||||||||
Artisan International Value Fund – Advisor Shares (4/1/2015) | -18.27 | 2.78 | 1.38 | n/a | 3.49 | ||||||||||||||||||||
Artisan International Value Fund – Institutional Shares (10/1/2006) | -18.20 | 2.87 | 1.47 | 6.58 | 5.87 | ||||||||||||||||||||
MSCI EAFE Index | -25.13 | -1.83 | -0.84 | 3.67 | 5.92 | * | |||||||||||||||||||
MSCI ACWI ex US Index | -25.17 | -1.52 | -0.81 | 3.01 | 6.37 | * | |||||||||||||||||||
| * | As of Investor Shares inception date. |
The performance quoted represents past performance, which does not guarantee future results. The investment return and principal value of an investment in the Fund will fluctuate, so that an investor’s shares in the Fund, when redeemed, may be worth more or less than their original cost. Current performance may be lower or higher than the performance data quoted. For the most recent month-end performance, visit www.artisanpartners.com or call 800.344.1770. The graph and table above do not reflect the deduction of taxes that a shareholder would pay on distributions or sale of Fund shares. See Notes on Management’s Discussion of Fund Performance and Portfolio Holdings’ Classification for a description of each index.
INVESTING ENVIRONMENT
During the one-year period ended September 30, 2022, global equities struggled. While US markets led, US, European and emerging markets were all down meaningfully during the period. It was a volatile period for global markets, which were plagued by inflation, global growth concerns and tighter financial conditions. These challenges, combined with the COVID-19 pandemic and the war in Ukraine, have fostered uncertainty in the marketplace.
SECTOR DIVERSIFICATION
| Sector | 9/30/2022 | 9/30/2021 | ||||||||
Communication Services | 6.4 | % | 8.2 | % | ||||||
Consumer Discretionary | 18.5 | 12.3 | ||||||||
Consumer Staples | 13.5 | 10.7 | ||||||||
Energy | 1.6 | 5.0 | ||||||||
Financials | 17.4 | 19.2 | ||||||||
Health Care | 7.8 | 6.1 | ||||||||
Industrials | 13.7 | 10.3 | ||||||||
Information Technology | 10.0 | 11.3 | ||||||||
Materials | 4.4 | 4.7 | ||||||||
Other assets less liabilities | 6.7 | 12.2 | ||||||||
| 100.0 | % | 100.0 | % | |||||||
PERFORMANCE DISCUSSION
Top contributors within the portfolio during the period included: Canadian integrated energy company Suncor, US-based insurance company Arch Capital, Italian manufacturer of seamless steel pipe products Tenaris, Canadian oil and gas company Imperial Oil and Brazilian telecommunications company Telefonica Brasil. Bottom contributors during the period included: Korean electronic products and solutions manufacturer Samsung Electronics, Korean internet search and e-commerce platform NAVER, French food company Danone, Chinese e-commerce company Alibaba and German designer, manufacturer and distributor of dialysis equipment and supplier and provider of essential kidney dialysis services Fresenius Medical Care.
REGION ALLOCATION
| Region | 9/30/2022 | 9/30/2021 | ||||||||
Europe | 53.1 | % | 53.7 | % | ||||||
Emerging Markets | 19.7 | 20.1 | ||||||||
Americas | 18.1 | 12.9 | ||||||||
Pacific Basin | 2.4 | 1.2 | ||||||||
FUND CHANGES
During the period, we identified the following new investment opportunities for the portfolio: UK-based provider of a range of insurance brokerage, reinsurance and risk management consulting services Willis Towers Watson, US-based navigation and communications provider Garmin, Netherlands-based health technology company Koninklijke Philips, US-based provider of sensing, electrical protection, control and power management solutions Sensata Technologies Holding and UK-based consumer goods company Associated British Foods. We funded these purchases in part through exiting our positions in Imperial Oil, Tenaris, Credit Suisse, Tesco and Hella.
| 18 | Artisan Partners Funds |
PERFORMANCE HISTORY
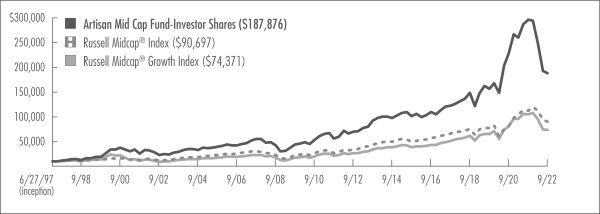
GROWTH OF AN ASSUMED $10,000 INVESTMENT (6/27/1997 to 9/30/2022)
AVERAGE ANNUAL TOTAL RETURNS (as of 9/30/2022)
| Fund / Index | 1-Year | 3-Year | 5-Year | 10-Year | Since Inception | ||||||||||||||||||||
Artisan Mid Cap Fund – Investor Shares (6/27/1997) | -36.55 | % | 6.26 | % | 8.84 | % | 10.30 | % | 12.31 | % | |||||||||||||||
Artisan Mid Cap Fund – Advisor Shares (4/1/2015) | -36.46 | 6.41 | 9.01 | n/a | 7.95 | ||||||||||||||||||||
Artisan Mid Cap Fund – Institutional Shares (7/1/2000) | -36.41 | 6.51 | 9.10 | 10.57 | 8.21 | ||||||||||||||||||||
Russell Midcap® Index | -19.39 | 5.19 | 6.48 | 10.30 | 9.12 | * | |||||||||||||||||||
Russell Midcap® Growth Index | -29.50 | 4.26 | 7.62 | 10.85 | 8.27 | * | |||||||||||||||||||
| * | As of Investor Shares inception date. |
The performance quoted represents past performance, which does not guarantee future results. The investment return and principal value of an investment in the Fund will fluctuate, so that an investor’s shares in the Fund, when redeemed, may be worth more or less than their original cost. Current performance may be lower or higher than the performance data quoted. For the most recent month-end performance, visit www.artisanpartners.com or call 800.344.1770. The graph and table above do not reflect the deduction of taxes that a shareholder would pay on distributions or sale of Fund shares. See Notes on Management’s Discussion of Fund Performance and Portfolio Holdings’ Classification for a description of each index.
INVESTING ENVIRONMENT
During the one-year period ended September 30, 2022, US equities struggled. Large-cap stocks held up better than small- and mid-cap stocks, but all were down meaningfully. From a style perspective, value outperformed growth during the period. Sector returns were all negative, except for energy and utilities. It was a volatile period for global markets, which were plagued by inflation, global growth concerns and tighter financial conditions. These challenges, combined with the COVID-19 pandemic and the war in Ukraine, have fostered uncertainty in the marketplace.
SECTOR DIVERSIFICATION
| Sector | 9/30/2022 | 9/30/2021 | ||||||||
Communication Services | 4.1 | % | 8.5 | % | ||||||
Consumer Discretionary | 8.7 | 13.3 | ||||||||
Financials | 13.0 | 10.9 | ||||||||
Health Care | 25.3 | 21.5 | ||||||||
Industrials | 10.5 | 9.9 | ||||||||
Information Technology | 34.5 | 32.0 | ||||||||
Materials | – | 1.2 | ||||||||
Other assets less liabilities | 3.9 | 2.7 | ||||||||
| 100.0 | % | 100.0 | % | |||||||
PERFORMANCE DISCUSSION
Top contributors within the portfolio during the period included: Dutch biotechnology company Argenx, US-based independent broker-dealer LPL Financial Holdings, US-based social gaming operator Zynga, US-based supplier of equipment, consumables and services for biologic manufacturing needs Repligen and US-based provider of data center and cloud networking equipment Arista. Bottom contributors during the period included: US-based provider of cloud-based inbound marketing and sales software HubSpot, US-based provider of dating products Match Group, US-based banking franchise specializing in the West Coast tech community SVB Financial, US-based contract manufacturing supplier to the pharmaceuticals industry Catalent and Australian enterprise software designer and developer Atlassian.
REGION ALLOCATION
| Region | 9/30/2022 | 9/30/2021 | ||||||||
Americas | 85.0 | % | 88.2 | % | ||||||
Europe | 10.1 | 8.5 | ||||||||
Middle East | 1.0 | 0.6 | ||||||||
FUND CHANGES
During the period, we identified the following new investment opportunities for the portfolio: US-based global supplier of advanced semiconductors ON Semiconductor, US-based supplier of equipment, consumables and services for biologic manufacturing needs Repligen, US-based designer of analog power-management chips for a wide variety of industrial and consumer devices Monolithic Power, US-based ride-hailing and food delivery services company Uber and US-based provider of specialty insurance solutions for brokers, agents and carriers Ryan Specialty Holdings. We funded these purchases in part through exiting our positions in Ceridian HCM Holding, Wayfair, TransUnion, Chegg and Roku.
| Artisan Partners Funds | 19 |
PERFORMANCE HISTORY
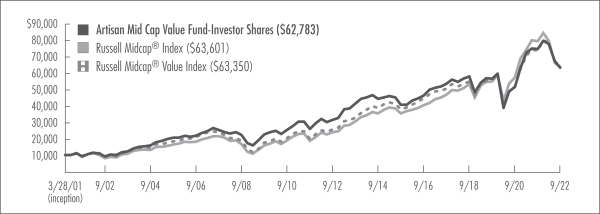
GROWTH OF AN ASSUMED $10,000 INVESTMENT (3/28/2001 to 9/30/2022)
AVERAGE ANNUAL TOTAL RETURNS (as of 9/30/2022)
| Fund / Index | 1-Year | 3-Year | 5-Year | 10-Year | Since Inception | ||||||||||||||||||||
Artisan Mid Cap Value Fund – Investor Shares (3/28/2001) | -15.39 | % | 3.75 | % | 3.40 | % | 7.20 | % | 8.92 | % | |||||||||||||||
Artisan Mid Cap Value Fund – Advisor Shares (4/1/2015) | -15.29 | 3.90 | 3.55 | n/a | 4.46 | ||||||||||||||||||||
Artisan Mid Cap Value Fund – Institutional Shares (2/1/2012) | -15.21 | 3.96 | 3.62 | 7.44 | 7.07 | ||||||||||||||||||||
Russell Midcap® Index | -19.39 | 5.19 | 6.48 | 10.30 | 8.98 | * | |||||||||||||||||||
Russell Midcap® Value Index | -13.56 | 4.50 | 4.76 | 9.44 | 8.96 | * | |||||||||||||||||||
| * | As of Investor Shares inception date. |
The performance quoted represents past performance, which does not guarantee future results. The investment return and principal value of an investment in the Fund will fluctuate, so that an investor’s shares in the Fund, when redeemed, may be worth more or less than their original cost. Current performance may be lower or higher than the performance data quoted. For the most recent month-end performance, visit www.artisanpartners.com or call 800.344.1770. The graph and table above do not reflect the deduction of taxes that a shareholder would pay on distributions or sale of Fund shares. See Notes on Management’s Discussion of Fund Performance and Portfolio Holdings’ Classification for a description of each index.
INVESTING ENVIRONMENT
During the one-year period ended September 30, 2022, US equities struggled. Large-cap stocks held up better than small- and mid-cap stocks, but all were down meaningfully. From a style perspective, value outperformed growth during the period. Sector returns were all negative, except for energy and utilities. It was a volatile period for global markets, which were plagued by inflation, global growth concerns and tighter financial conditions. These challenges, combined with the COVID-19 pandemic and the war in Ukraine, have fostered uncertainty in the marketplace.
SECTOR DIVERSIFICATION
| Sector | 9/30/2022 | 9/30/2021 | ||||||||
Communication Services | 13.6 | % | 13.0 | % | ||||||
Consumer Discretionary | 15.4 | 19.4 | ||||||||
Consumer Staples | 6.3 | 5.9 | ||||||||
Energy | 2.8 | 2.0 | ||||||||
Financials | 20.3 | 17.1 | ||||||||
Health Care | 5.3 | 6.2 | ||||||||
Industrials | 11.5 | 13.5 | ||||||||
Information Technology | 8.5 | 7.5 | ||||||||
Materials | 3.5 | 3.8 | ||||||||
Real Estate | 7.3 | 8.3 | ||||||||
Utilities | 2.9 | 2.2 | ||||||||
Other assets less liabilities | 2.6 | 1.1 | ||||||||
| 100.0 | % | 100.0 | % | |||||||
PERFORMANCE DISCUSSION
Top contributors within the portfolio during the period included: US-based tax preparation, accounting and consumer financial services company H&R Block, US-based agricultural chemical and seed company Corteva, US-based healthcare company Centene, US-based insurance holding company Progressive and US-based family-controlled bank First Citizens. Bottom contributors during the period included: US-based online travel company Expedia, US-based provider of internet media and services IAC, US-based consumer financial services company Synchrony Financial, US-based alternative asset manager Carlyle and US-based dental supply manufacturer DENTSPLY SIRONA.
FUND CHANGES
During the period, we identified the following new investment opportunities for the portfolio: US-based family-controlled bank First Citizens, US-based entertainment company Warner Bros Discovery, US-based cable company Cable One, US-based alternative asset manager Carlyle and US-based industrial technology company Vontier. We funded these purchases in part through exiting our positions in Thor Industries, Kirby, Lions Gate Entertainment, PS Business Parks and Vimeo.
| 20 | Artisan Partners Funds |
PERFORMANCE HISTORY
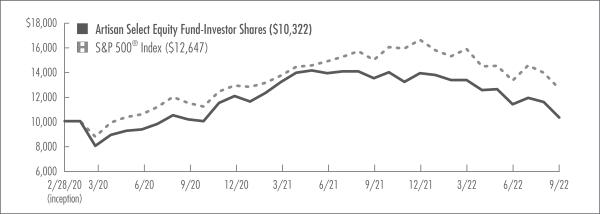
GROWTH OF AN ASSUMED $10,000 INVESTMENT (2/28/2020 to 9/30/2022)
AVERAGE ANNUAL TOTAL RETURNS (as of 9/30/2022)
| Fund / Index | 1-Year | Since Inception | ||||||||
Artisan Select Equity Fund – Investor Shares (2/28/2020) | -23.43 | % | 1.23 | % | ||||||
Artisan Select Equity Fund – Advisor Shares (2/28/2020) | -23.26 | 1.35 | ||||||||
Artisan Select Equity Fund – Institutional Shares (2/28/2020) | -23.33 | 1.37 | ||||||||
S&P 500® Index | -15.47 | 9.50 | * | |||||||
| * | As of Investor, Advisor and Institutional Shares inception date. |
The performance quoted represents past performance, which does not guarantee future results. The investment return and principal value of an investment in the Fund will fluctuate, so that an investor’s shares in the Fund, when redeemed, may be worth more or less than their original cost. Current performance may be lower or higher than the performance data quoted. For the most recent month-end performance, visit www.artisanpartners.com or call 800.344.1770. The graph and table above do not reflect the deduction of taxes that a shareholder would pay on distributions or sale of Fund shares. The Fund’s performance reflects Artisan Partners’ contractual agreement to limit the Fund’s expenses, which has had a material impact on performance and performance would have been lower in its absence. See Notes on Management’s Discussion of Fund Performance and Portfolio Holdings’ Classification for a description of the index.
INVESTING ENVIRONMENT
During the one-year period ended September 30, 2022, US equities struggled. Large-cap stocks held up better than small- and mid-cap stocks, but all were down meaningfully. From a style perspective, value outperformed growth during the period. Sector returns were all negative, except for energy and utilities. It was a volatile period for global markets, which were plagued by inflation, global growth concerns and tighter financial conditions. These challenges, combined with the COVID-19 pandemic and the war in Ukraine, have fostered uncertainty in the marketplace.
SECTOR DIVERSIFICATION
| Sector | 9/30/2022 | 9/30/2021 | ||||||||
Communication Services | 9.5 | % | 11.9 | % | ||||||
Consumer Discretionary | 17.8 | 20.0 | ||||||||
Consumer Staples | 4.7 | 4.5 | ||||||||
Financials | 34.0 | 26.1 | ||||||||
Health Care | 10.0 | 10.6 | ||||||||
Industrials | 3.1 | 5.3 | ||||||||
Information Technology | 6.3 | 4.7 | ||||||||
Materials | 9.9 | 9.6 | ||||||||
Other assets less liabilities | 4.7 | 7.3 | ||||||||
| 100.0 | % | 100.0 | % | |||||||
PERFORMANCE DISCUSSION
Top contributors within the portfolio during the period included: US-based health benefits company Elevance, US-based insurance holding company Progressive, UK-based defense, security and aerospace company BAE Systems, US-based reinsurance company Alleghany and US-based organic grocery store chain Sprouts Farmers Market. Bottom contributors during the period included: US-based social networking website operator Meta, US-based dental supply manufacturer DENTSPLY SIRONA, Chinese e-commerce company Alibaba, German cement producer HeidelbergCement and Korean electronic products and solutions manufacturer Samsung Electronics.
REGION ALLOCATION
| Region | 9/30/2022 | 9/30/2021 | ||||||||
Americas | 77.9 | % | 74.1 | % | ||||||
Europe | 9.0 | 10.1 | ||||||||
Emerging Markets | 8.4 | 8.5 | ||||||||
FUND CHANGES
During the period, we identified the following new investment opportunities for the portfolio: US-based reinsurance company Alleghany, US-based food service, facilities and uniform services provider Aramark and US-based provider of etch equipment to the semiconductor industry Lam Research Corp. We funded these purchases in part through exiting our positions in Booking Holdings, BAE Systems and Sprouts Farmers Market.
| Artisan Partners Funds | 21 |
PERFORMANCE HISTORY
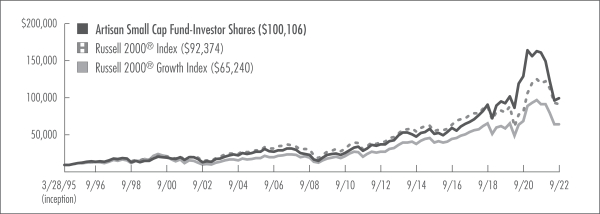
GROWTH OF AN ASSUMED $10,000 INVESTMENT (3/28/1995 to 9/30/2022)
AVERAGE ANNUAL TOTAL RETURNS (as of 9/30/2022)
| Fund / Index | 1-Year | 3-Year | 5-Year | 10-Year | Since Inception | ||||||||||||||||||||
Artisan Small Cap Fund – Investor Shares (3/28/1995) | -38.24 | % | 2.35 | % | 8.06 | % | 10.17 | % | 8.74 | % | |||||||||||||||
Artisan Small Cap Fund – Advisor Shares (2/1/2017) | -38.16 | 2.48 | 8.21 | | n/a | 9.90 | |||||||||||||||||||
Artisan Small Cap Fund – Institutional Shares (5/7/2012) | -38.12 | 2.58 | 8.29 | 10.41 | 10.66 | ||||||||||||||||||||
Russell 2000® Index | -23.50 | 4.29 | 3.55 | 8.55 | 8.42 | * | |||||||||||||||||||
Russell 2000® Growth Index | -29.27 | 2.94 | 3.60 | 8.81 | 7.06 | * | |||||||||||||||||||
| * | As of Investor Shares inception date. |
The performance quoted represents past performance, which does not guarantee future results. The investment return and principal value of an investment in the Fund will fluctuate, so that an investor’s shares in the Fund, when redeemed, may be worth more or less than their original cost. Current performance may be lower or higher than the performance data quoted. For the most recent month-end performance, visit www.artisanpartners.com or call 800.344.1770. The graph and table above do not reflect the deduction of taxes that a shareholder would pay on distributions or sale of Fund shares. See Notes on Management’s Discussion of Fund Performance and Portfolio Holdings’ Classification for a description of each index.
INVESTING ENVIRONMENT
During the one-year period ended September 30, 2022, US equities struggled. Large-cap stocks held up better than small- and mid-cap stocks, but all were down meaningfully. From a style perspective, value outperformed growth during the period. Sector returns were all negative, except for energy and utilities. It was a volatile period for global markets, which were plagued by inflation, global growth concerns and tighter financial conditions. These challenges, combined with the COVID-19 pandemic and the war in Ukraine, have fostered uncertainty in the marketplace.
SECTOR DIVERSIFICATION
| Sector | 9/30/2022 | 9/30/2021 | ||||||||
Communication Services | 0.6 | % | 4.5 | % | ||||||
Consumer Discretionary | 11.0 | 14.1 | ||||||||
Consumer Staples | 0.6 | 1.6 | ||||||||
Financials | 3.3 | 1.9 | ||||||||
Health Care | 33.3 | 27.7 | ||||||||
Industrials | 12.6 | 9.5 | ||||||||
Information Technology | 38.2 | 38.7 | ||||||||
Real Estate | – | 0.5 | ||||||||
Other assets less liabilities | 0.4 | 1.5 | ||||||||
| 100.0 | % | 100.0 | % | |||||||
PERFORMANCE DISCUSSION
Top contributors within the portfolio during the period included: US-based developer of medical devices Shockwave, Dutch biotechnology company Argenx, US-based biopharmaceutical company Halozyme Therapeutics, US-based social gaming operator Zynga and US-based designer and manufacturer of engineered fabricated metal products and services Valmont. Bottom contributors during the period included: US-based cancer diagnostics lab NeoGenomics, US-based provider of cloud-based accounting software Blackline, US-based provider of secure, cloud-based virtual banking solutions to regional and community banks Q2 Holdings, US-based developer of molecular tests designed to minimize ambiguity in the treatment of patients with cancer Veracyte and US-based digital education company Chegg.
FUND CHANGES
During the period, we identified the following new investment opportunities for the portfolio: US-based provider of data analytics DoubleVerify Holdings, US-based developer of semiconductors Allegro MicroSystems, US-based technology developer for monitoring suspected heartbeat arrhythmias iRhythm, US-based retailer of swimming pool supplies Leslie’s and US-based cloud-based provider of payroll and related software Ceridian HCM Holding. We funded these purchases in part through exiting our positions in NeoGenomics, LivePerson, Zynga, Avalara and YETI.
| 22 | Artisan Partners Funds |
ARTISAN SUSTAINABLE EMERGING MARKETS FUND
PERFORMANCE HISTORY
GROWTH OF AN ASSUMED $1,000,000 INVESTMENT (6/26/2006 to 9/30/2022)
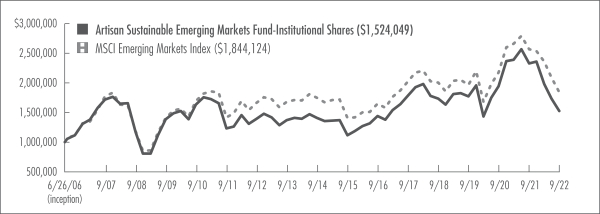
AVERAGE ANNUAL TOTAL RETURNS (as of 9/30/2022)
| Fund / Index | 1-Year | 3-Year | 5-Year | 10-Year | Since Inception | ||||||||||||||||||||
Artisan Sustainable Emerging Markets Fund – Investor Shares (6/2/2008) | -34.51 | % | -4.99 | % | -3.19 | % | 0.73 | % | -1.39 | % | |||||||||||||||
Artisan Sustainable Emerging Markets Fund – Advisor Shares (4/27/2022) | n/a | n/a | n/a | n/a | -14.65 | † | |||||||||||||||||||
Artisan Sustainable Emerging Markets Fund – Institutional Shares (6/26/2006) | -34.46 | -4.86 | -3.06 | 0.87 | 2.62 | ||||||||||||||||||||
MSCI Emerging Markets Index | -28.11 | -2.07 | -1.81 | 1.05 | 3.83 | * | |||||||||||||||||||
| † | For the period from commencement of operations 4/27/2002 through 9/30/2022. |
| * | As of Institutional Shares inception date. |
The performance quoted represents past performance, which does not guarantee future results. The investment return and principal value of an investment in the Fund will fluctuate, so that an investor’s shares in the Fund, when redeemed, may be worth more or less than their original cost. Current performance may be lower or higher than the performance data quoted. For the most recent month-end performance, visit www.artisanpartners.com or call 800.344.1770. The graph and table above do not reflect the deduction of taxes that a shareholder would pay on distributions or sale of Fund shares. The Fund’s performance reflects Artisan Partners’ contractual agreement to limit the Fund’s expenses, which has had a material impact on performance and performance would have been lower in its absence. See Notes on Management’s Discussion of Fund Performance and Portfolio Holdings’ Classification for a description of the index.
INVESTING ENVIRONMENT
During the one-year period ended September 30, 2022, emerging markets struggled, even more so than their US and European counterparts. Country-level returns were mixed during the period. Indonesia was the top contributor in the MSCI Emerging Markets Index, while China was the main detractor, partially due to continued COVID-19 restrictions in China. It was a volatile period for global markets, which were plagued by inflation, global growth concerns and tighter financial conditions. These challenges, combined with the COVID-19 pandemic and the war in Ukraine, have fostered uncertainty in the marketplace.
SECTOR DIVERSIFICATION
| Sector | 9/30/2022 | 9/30/2021 | ||||||||
Communication Services | 4.9 | % | 6.0 | % | ||||||
Consumer Discretionary | 13.9 | 15.2 | ||||||||
Consumer Staples | 3.5 | 3.1 | ||||||||
Energy | 3.1 | 4.4 | ||||||||
Financials | 20.1 | 18.9 | ||||||||
Health Care | 6.2 | 6.4 | ||||||||
Industrials | 13.6 | 12.5 | ||||||||
Information Technology | 26.2 | 23.6 | ||||||||
Materials | 3.3 | 5.4 | ||||||||
Real Estate | 1.6 | – | ||||||||
Utilities | – | 1.3 | ||||||||
Other assets less liabilities | 3.6 | 3.2 | ||||||||
| 100.0 | % | 100.0 | % | |||||||
PERFORMANCE DISCUSSION
Top contributors within the portfolio during the period included: Taiwanese electronic paper producer E Ink, Indian retail and corporate bank ICICI Bank, Brazilian bank Itau Unibanco, Egyptian banking and financial services provider Commercial International Bank Egypt and Chilean telecom company Empresa Nacional de Telecomunicaciones. Bottom contributors during the period included: Taiwanese integrated circuits manufacturer Taiwan Semiconductor Manufacturing Co, Korean electronic products and solutions manufacturer Samsung Electronics, Chinese e-commerce company Alibaba, Russian mining company Polyus and Russian oil and gas company Lukoil.
REGION ALLOCATION
| Region | 9/30/2022 | 9/30/2021 | ||||||||
Emerging Asia | 65.4 | % | 62.1 | % | ||||||
Latin America | 16.7 | 14.6 | ||||||||
Europe, Middle East and Africa | 7.6 | 16.8 | ||||||||
Developed Markets | 6.7 | 3.3 | ||||||||
FUND CHANGES
During the period, we identified the following new investment opportunities for the portfolio: Mexico-based real estate developer Vesta, Indian digital services and consulting company Infosys, Greek industrial conglomerate Mytilineos, Argentinian software solutions company Globant and South African telecom
| Artisan Partners Funds | 23 |
company MTN Group. We funded these purchases in part through exiting our positions in Kajaria Ceramics, Commercial International Bank Egypt, Focus Energia, JUMBO and Metropolis Healthcare.
As of March 3, 2022 through period end, Russian securities within the portfolio had been valued at zero due to sanctions related to the war in Ukraine.
| 24 | Artisan Partners Funds |
PERFORMANCE HISTORY
GROWTH OF AN ASSUMED $10,000 INVESTMENT (3/27/2006 to 9/30/2022)
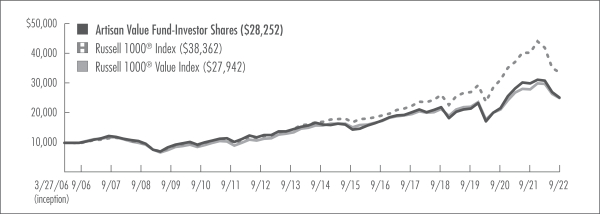
AVERAGE ANNUAL TOTAL RETURNS (as of 9/30/2022)
| Fund / Index | 1-Year | 3-Year | 5-Year | 10-Year | Since Inception | ||||||||||||||||||||
Artisan Value Fund – Investor Shares (3/27/2006) | -16.50 | % | 5.81 | % | 4.92 | % | 8.06 | % | 6.49 | % | |||||||||||||||
Artisan Value Fund – Advisor Shares (4/1/2015) | -16.35 | 5.98 | 5.09 | | n/a | 6.64 | |||||||||||||||||||
Artisan Value Fund – Institutional Shares (7/26/2011) | -16.34 | 6.04 | 5.16 | 8.31 | 8.15 | ||||||||||||||||||||
Russell 1000® Index | -17.22 | 7.95 | 9.00 | 11.60 | 8.48 | * | |||||||||||||||||||
Russell 1000® Value Index | -11.36 | 4.36 | 5.29 | 9.17 | 6.42 | * | |||||||||||||||||||
| * | As of Investor Shares inception date. |
The performance quoted represents past performance, which does not guarantee future results. The investment return and principal value of an investment in the Fund will fluctuate, so that an investor’s shares in the Fund, when redeemed, may be worth more or less than their original cost. Current performance may be lower or higher than the performance data quoted. For the most recent month-end performance, visit www.artisanpartners.com or call 800.344.1770. The graph and table above do not reflect the deduction of taxes that a shareholder would pay on distributions or sale of Fund shares. The Advisor Shares’ performance reflects Artisan Partners’ contractual agreement to limit the Fund’s expenses, which has had a material impact on performance and performance would have been lower in its absence. See Notes on Management’s Discussion of Fund Performance and Portfolio Holdings’ Classification for a description of each index.
INVESTING ENVIRONMENT
During the one-year period ended September 30, 2022, US equities struggled. Large-cap stocks held up better than small- and mid-cap stocks, but all were down meaningfully. From a style perspective, value outperformed growth during the period. Sector returns were all negative, except for energy and utilities. It was a volatile period for global markets, which were plagued by inflation, global growth concerns and tighter financial conditions. These challenges, combined with the COVID-19 pandemic and the war in Ukraine, have fostered uncertainty in the marketplace.
SECTOR DIVERSIFICATION
| Sector | 9/30/2022 | 9/30/2021 | ||||||||
Communication Services | 17.7 | % | 16.0 | % | ||||||
Consumer Discretionary | 11.3 | 13.4 | ||||||||
Consumer Staples | 6.6 | 6.9 | ||||||||
Energy | 6.8 | 5.0 | ||||||||
Financials | 18.8 | 19.7 | ||||||||
Health Care | 11.8 | 13.4 | ||||||||
Industrials | 14.2 | 14.2 | ||||||||
Information Technology | 10.7 | 7.6 | ||||||||
Materials | – | 1.4 | ||||||||
Other assets less liabilities | 2.1 | 2.4 | ||||||||
| 100.0 | % | 100.0 | % | |||||||
PERFORMANCE DISCUSSION
Top contributors within the portfolio during the period included: US-based healthcare company that develops and commercializes pharmaceutical products Vertex Pharmaceuticals, US-based shale-focused E&P firm EOG Resources, US-based health insurance provider Cigna, US-based security company Northrop Grumman and US-based insurance company Arch Capital. Bottom contributors during the period included: Netherlands-based health technology company Koninklijke Philips, US-based social networking website operator Meta, US-based media and television broadcasting company Comcast, US-based Internet search engine operator Alphabet and Korean electronic products and solutions manufacturer Samsung Electronics.
REGION ALLOCATION
| Region | 9/30/2022 | 9/30/2021 | ||||||||
Americas | 83.8 | % | 77.8 | % | ||||||
Europe | 9.9 | 14.8 | ||||||||
Emerging Markets | 4.2 | 5.0 | ||||||||
FUND CHANGES
During the period, we identified the following new investment opportunities for the portfolio: US-based retail electronic payments network provider Visa, US-based entertainment
| Artisan Partners Funds | 25 |
streaming business Netflix, US-based information management and electronic commerce systems provider Fiserv, US-based commercial bank Bank of America and French multinational aircraft engine, rocket engine, aerospace-component and defense company Safran. We funded these purchases in part through exiting our positions in Sanofi, Fresenius Medical Care, Swedish Match, Cie Generale des Etablissements Michelin and Celanese.
| 26 | Artisan Partners Funds |
PERFORMANCE HISTORY
GROWTH OF AN ASSUMED $10,000 INVESTMENT (2/28/2022 to 9/30/2022)
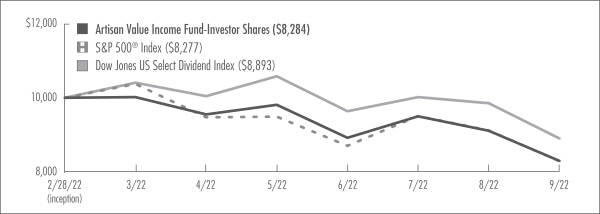
AVERAGE ANNUAL TOTAL RETURNS (as of 9/30/2022)
| Fund / Index | Since Inception† | ||||
Artisan Value Income Fund – Investor Shares (2/28/2022) | -17.16 | % | |||
Artisan Value Income Fund – Advisor Shares (2/28/2022) | -17.11 | ||||
Artisan Value Income Fund – Institutional Shares (2/28/2022) | -17.10 | ||||
S&P 500® Index | -17.23 | * | |||
Dow Jones US Select Dividend Index | -11.07 | * | |||
| † | For the period from commencement of operations 2/28/2022 through 9/30/2022; not annualized. |
| * | As of Investor, Advisor and Institutional Shares inception date. |
The performance quoted represents past performance, which does not guarantee future results. The investment return and principal value of an investment in the Fund will fluctuate, so that an investor’s shares in the Fund, when redeemed, may be worth more or less than their original cost. Current performance may be lower or higher than the performance data quoted. For the most recent month-end performance, visit www.artisanpartners.com or call 800.344.1770. The graph and table above do not reflect the deduction of taxes that a shareholder would pay on distributions or sale of Fund shares. Unlike the Index, the Fund may hold loans and other security types. At times, this can cause material differences in relative performance. The Fund’s performance reflects Artisan Partners’ contractual agreement to limit the Fund’s expenses, which has had a material impact on performance and performance would have been lower in its absence. See Notes on Management’s Discussion of Fund Performance and Portfolio Holdings’ Classification for a description of the index.
INVESTING ENVIRONMENT
During the period between the Fund’s February 28, 2022 inception and September 30, 2022, US equities struggled. Large-cap stocks held up better than small- and mid-cap stocks, but all were down. From a style perspective, value outperformed growth during the period. Sector returns were all negative, except for energy. It was a volatile period for global markets, which were plagued by inflation, global growth concerns and tighter financial conditions. These challenges, combined with the COVID-19 pandemic and the war in Ukraine, have fostered uncertainty in the marketplace.
SECTOR DIVERSIFICATION
| Sector | 9/30/2022 | ||||
Communication Services | 5.8 | % | |||
Consumer Discretionary | 6.2 | ||||
Consumer Staples | 14.3 | ||||
Energy | 4.5 | ||||
Financials | 21.7 | ||||
Health Care | 6.9 | ||||
Industrials | 14.4 | ||||
Information Technology | 7.0 | ||||
Real Estate | 9.3 | ||||
Utilities | 7.9 | ||||
Other assets less liabilities | 2.0 | ||||
| 100.0 | % | ||||
PERFORMANCE DISCUSSION
Top contributors within the portfolio during the period included: US-based tax preparation, accounting and consumer financial services company H&R Block, Swedish tobacco company Swedish Match, US-based health solutions provider Merck, US-based real estate investment trust services provider STORE Capital and US-based self-managed real estate investment trust company PS Business Parks. Bottom contributors during the period included: Netherlands-based health technology company Koninklijke Philips, Korean electronic products and solutions manufacturer Samsung Electronics, US-based media and television broadcasting company Comcast, US-based alternative asset manager Carlyle and US-based outdoor advertising company Lamar Advertising.
REGION ALLOCATION
| Region | 9/30/2022 | ||||
Americas | 86.5 | % | |||
Europe | 9.6 | ||||
Emerging Markets | 1.9 | ||||
FUND CHANGES
During the period, we identified the following new investment opportunities for the portfolio: US-based cable company Cable One, US-based aerospace company Boeing, US-based commercial bank Bank of America, US-based ski resort owner and operator Vail Resorts and US-based asset manager GCM Grosvenor. We funded these purchases in part through exiting our positions in Swedish Match, Twitter, Cie Generale des Etablissements Michelin, Fresenius Medical Care and PS Business Parks.
| Artisan Partners Funds | 27 |
ARTISAN PARTNERS FUNDS, INC
DEFINITIONS OF ABBREVIATIONS AND FOOTNOTES
for the Schedules of Investments
Investment Footnotes
| * | Non-income producing security | |
| # | Percentages for the various classifications relate to total net assets | |
| ^ | Amount rounds to less than $1, 0.1% or 1 share | |
| ‡ | One contract is equal to 100 shares. |
| Company names are as reported by a data service provider and in some cases are translations; a company’s legal name may be different. |
Investment abbreviations/descriptions
| ADR | American Depositary Receipt | |
| BOA | Bank of America | |
| BUBOR | Budapest Interbank Offered Rate | |
| CDI | Certificate of Interbank Deposit | |
| CITI | Citibank, N.A. | |
| ETF | Exchange Traded Fund | |
| GDR | Global Depositary Receipt | |
| ICE | Intercontinental Exchange | |
| JIBAR | Johannesburg Interbank Average Rate | |
| JPM | JPMorganChase Bank, N.A. | |
| LIBOR | London Interbank Offered Rate | |
| NYRS | New York Registry Shares | |
| PIK | Payment-In-Kind | |
| Preference | A special type of equity investment that shares in the earnings of the company and may have a dividend preference. Preference shares may also have liquidatio preference. | |
| PRIBOR | Prague Interbank Offered Rate | |
| SCB | Standard Chartered Bank | |
| SOFR | Secured Overnight Financing Rate | |
| SPDR | Standard & Poor’s Depository Receipts | |
| TIIE | Mexican Interbank Equilibrium Interest Rate | |
| THOR | Thai Overnight Repurchase Rate | |
| UBS AG | Union Bank of Switzerland | |
| WIBOR | Warsaw Interbank Offer Rate |
Currency abbreviations
AUD Australian dollar | CZK Czech koruna | |
BRL Brazilian real | DKK Danish krone | |
CAD Canadian dollar | DOP Dominican peso | |
CHF Swiss franc | EUR Euro | |
CLP Chilean peso | GBP British pound | |
CNY Chinese yuan | HKD Hong Kong dollar |
| 28 | Artisan Partners Funds |
HUF Hungarian forint | RON Romanian leu | |
IDR Indonesian rupiah | RSD Serbian dinar | |
ILS Israel new shekel | SEK Swedish krona | |
INR Indian rupee | SGD Singapore dollar | |
ISK Iceland krona | THB Thailand baht | |
JPY Japanese yen | TWD New Taiwan dollar | |
KRW Korean won | UGX Ugandan shilling | |
KZT Kazakhstan tenge | USD U.S. dollar | |
MXN Mexican peso | UZS Uzbekistani som | |
MYR Malaysia ringgit | VND Vietnamese dong | |
NOK Norwegian krone | ZAR South African rand | |
PEN Peruvian nuevo sol | ZMW Zambian kwacha | |
PLN Polish zloty |
| Artisan Partners Funds | 29 |
Schedule of Investments – September 30, 2022
Shares and dollar values in thousands
| Shares Held | Value | |||||||||
| COMMON STOCKS - 98.5% | ||||||||||
| BRAZIL - 8.1% | ||||||||||
MercadoLibre, Inc.* | 240 | $ | 199,002 | |||||||
NU Holdings Ltd., Class A* | 14,434 | 63,507 | ||||||||
|
| |||||||||
| 262,509 | ||||||||||
| CHINA - 24.5% | ||||||||||
Bilibili, Inc., ADR* | 4,202 | 64,369 | ||||||||
China Tourism Group Duty Free Corp. Ltd., Class A(1) | 1,134 | 31,494 | ||||||||
JD Health International, Inc.*(1) | 13,298 | 75,803 | ||||||||
Kanzhun Ltd., ADR* | 1,928 | 32,537 | ||||||||
KE Holdings, Inc., ADR* | 3,773 | 66,106 | ||||||||
Kweichow Moutai Co. Ltd., Class A(1) | 400 | 105,241 | ||||||||
Meituan, Class B*(1) | 7,703 | 161,438 | ||||||||
Shenzhen Mindray Bio-Medical Electronics Co. Ltd., Class A(1) | 1,847 | 77,988 | ||||||||
Tencent Holdings Ltd.(1) | 2,232 | 75,376 | ||||||||
Wuxi Biologics Cayman, Inc.*(1) | 11,451 | 68,606 | ||||||||
Zhangzhou Pientzehuang Pharmaceutical Co. Ltd., Class A(1) | 1,004 | 37,659 | ||||||||
|
| |||||||||
| 796,617 | ||||||||||
| FRANCE - 5.2% | ||||||||||
Hermes International(1) | 32 | 37,690 | ||||||||
LVMH Moet Hennessy Louis Vuitton SE(1) | 175 | 102,818 | ||||||||
Sartorius Stedim Biotech(1) | 97 | 29,582 | ||||||||
|
| |||||||||
| 170,090 | ||||||||||
| INDIA - 3.0% | ||||||||||
HDFC Bank Ltd., ADR | 1,707 | 99,716 | ||||||||
| NETHERLANDS - 7.9% | ||||||||||
Adyen NV*(1) | 122 | 151,474 | ||||||||
ASML Holding NV, NYRS | 251 | 104,333 | ||||||||
|
| |||||||||
| 255,807 | ||||||||||
| RUSSIA - 0.0% | ||||||||||
Yandex NV, Class A*(1)(2)(3) | 1,677 | – | ||||||||
| SINGAPORE - 6.0% | ||||||||||
Sea Ltd., ADR* | 3,488 | 195,503 | ||||||||
| UNITED STATES - 43.1% | ||||||||||
Airbnb, Inc., Class A* | 2,061 | 216,469 | ||||||||
Align Technology, Inc.* | 377 | 78,110 | ||||||||
Crowdstrike Holdings, Inc., Class A* | 1,030 | 169,754 | ||||||||
Estee Lauder Cos., Inc. (The), Class A | 330 | 71,333 | ||||||||
Mastercard, Inc., Class A | 125 | 35,679 | ||||||||
Netflix, Inc.* | 358 | 84,362 | ||||||||
NVIDIA Corp. | 1,750 | 212,480 | ||||||||
Snap, Inc., Class A* | 7,920 | 77,775 | ||||||||
Snowflake, Inc., Class A* | 486 | 82,633 | ||||||||
Unity Software, Inc.* | 3,220 | 102,583 | ||||||||
Veeva Systems, Inc., Class A* | 665 | 109,668 | ||||||||
Visa, Inc., Class A | 901 | 160,023 | ||||||||
|
| |||||||||
| 1,400,869 | ||||||||||
| URUGUAY - 0.7% | ||||||||||
Dlocal Ltd.* | 1,102 | 22,623 | ||||||||
|
| |||||||||
Total common stocks |
| 3,203,734 | ||||||||
Total investments - 98.5% |
| 3,203,734 | ||||||||
Other assets less liabilities - 1.5% |
| 47,872 | ||||||||
|
| |||||||||
Total net assets - 100.0%# |
| $ | 3,251,606 | |||||||
|
| |||||||||
| (1) | Valued at a fair value in accordance with procedures established by the board of directors of Artisan Partners Funds. In total, securities valued at a fair value were $955,169, or 29.4% of total net assets. See notes 2(a) and 4 in Notes to Financial Statements for additional information. |
| (2) | Security is valued using significant unobservable inputs and is classified as Level 3 in the fair value hierarchy. |
| (3) | Security is restricted. |
Security | Acquisition Dates | Cost | Value | Percentage of Total Net Assets | ||||||||||||||||
Yandex NV | 10/13/2021 - 01/25/2022 | $ | 48,814 | $ | – | 0.0 | % | |||||||||||||
| PORTFOLIO DIVERSIFICATION | ||||||||||
| Dollar values in thousands | ||||||||||
| Value | Percentage of Total Investments | |||||||||
Communication Services | $ | 529,922 | 16.5 | % | ||||||
Consumer Discretionary | 824,714 | 25.7 | ||||||||
Consumer Staples | 176,574 | 5.5 | ||||||||
Financials | 163,223 | 5.1 | ||||||||
Health Care | 401,613 | 12.5 | ||||||||
Information Technology | 1,041,582 | 32.6 | ||||||||
Real Estate | 66,106 | 2.1 | ||||||||
|
|
|
| |||||||
Total investments | $ | 3,203,734 | 100.0 | % | ||||||
|
|
|
| |||||||
| TRADING CURRENCIES | ||||||||||
| Dollar values in thousands | ||||||||||
| Value | Percentage of Total Investments | |||||||||
CNY | $ | 252,382 | 7.9 | % | ||||||
EUR | 321,564 | 10.0 | ||||||||
HKD | 381,223 | 11.9 | ||||||||
USD | 2,248,565 | 70.2 | ||||||||
|
|
|
| |||||||
Total investments | $ | 3,203,734 | 100.0 | % | ||||||
|
|
|
| |||||||
| TOP TEN HOLDINGS | ||||||||||
Company Name | Country | Percentage of Total Net Assets | ||||||||
Airbnb, Inc. | United States | 6.7 | % | |||||||
NVIDIA Corp. | United States | 6.5 | ||||||||
MercadoLibre, Inc. | Brazil | 6.1 | ||||||||
Sea Ltd. | Singapore | 6.0 | ||||||||
Crowdstrike Holdings, Inc. | United States | 5.2 | ||||||||
Meituan | China | 5.0 | ||||||||
Visa, Inc. | United States | 4.9 | ||||||||
Adyen NV | Netherlands | 4.7 | ||||||||
Veeva Systems, Inc. | United States | 3.4 | ||||||||
Kweichow Moutai Co. Ltd. | China | 3.2 | ||||||||
|
| |||||||||
Total | 51.7 | % | ||||||||
|
| |||||||||
Definitions of abbreviations and footnotes are detailed on page 28.
The accompanying notes are an integral part of the financial statements.
| 30 | Artisan Partners Funds |
Artisan Emerging Markets Debt Opportunities Fund
Schedule of Investments – September 30, 2022
Principal amount, shares and values in thousands and reported in USD unless otherwise stated
| Principal Amount | Market Value | |||||||||
| SOVEREIGN GOVERNMENT BONDS - 71.2% | ||||||||||
| ALBANIA - 1.3% | ||||||||||
Republic of Albania 3.50%, 10/9/2025 | EUR | 300 | $ | 265 | ||||||
| ANGOLA - 3.0% | ||||||||||
Republic of Angola | 458 | 459 | ||||||||
6.93%, 2/19/2027 | 186 | 167 | ||||||||
|
| |||||||||
| 626 | ||||||||||
| ARMENIA - 0.9% | ||||||||||
Republic of Armenia |
| |||||||||
3.60%, 2/2/2031 | 290 | 196 | ||||||||
| BAHAMAS - 1.2% | ||||||||||
Commonwealth of the Bahamas |
| |||||||||
5.75%, 1/16/2024 | 306 | 251 | ||||||||
| BENIN - 2.9% | ||||||||||
Benin Government Bond |
| |||||||||
4.88%, 1/19/2032 | EUR | 930 | 620 | |||||||
| BRAZIL - 3.4% | ||||||||||
Notas do Tesouro Nacional |
| |||||||||
10.00%, 1/1/2025 | BRL | 2,662 | 480 | |||||||
10.00%, 1/1/2029 | BRL | 1,355 | 231 | |||||||
|
| |||||||||
| 711 | ||||||||||
| CAMEROON - 2.8% | ||||||||||
Republic of Cameroon |
| |||||||||
9.50%, 11/19/2025 | 600 | 588 | ||||||||
| COLOMBIA - 2.0% | ||||||||||
Republic of Colombia |
| |||||||||
2.63%, 3/15/2023 | 425 | 419 | ||||||||
| DOMINICAN REPUBLIC - 7.2% | ||||||||||
Dominican Republic Government Bond |
| |||||||||
8.90%, 2/15/2023 | DOP | 39,950 | 744 | |||||||
11.50%, 5/10/2024 | DOP | 3,700 | 70 | |||||||
6.88%, 1/29/2026 | 100 | 97 | ||||||||
9.75%, 6/5/2026 | DOP | 16,000 | 289 | |||||||
4.88%, 9/23/2032 | 300 | 226 | ||||||||
5.30%, 1/21/2041 | 150 | 101 | ||||||||
|
| |||||||||
| 1,527 | ||||||||||
| EGYPT - 2.5% | ||||||||||
Arab Republic of Egypt |
| |||||||||
4.75%, 4/11/2025 | EUR | 400 | 308 | |||||||
8.75%, 9/30/2051 | 400 | 220 | ||||||||
|
| |||||||||
| 528 | ||||||||||
| EL SALVADOR - 0.5% | ||||||||||
Republic of El Salvador |
| |||||||||
7.75%, 1/24/2023 | 120 | 109 | ||||||||
| INDONESIA - 3.2% | ||||||||||
Republic of Indonesia |
| |||||||||
8.25%, 5/15/2036 | IDR | 9,854,000 | 680 | |||||||
| IRAQ - 4.5% | ||||||||||
Republic of Iraq | ||||||||||
6.75%, 3/9/2023 | 400 | 388 | ||||||||
5.80%, 1/15/2028 | 698 | 572 | ||||||||
|
| |||||||||
| 960 | ||||||||||
| IVORY COAST - 2.7% | ||||||||||
Republic of Cote d’Ivoire | ||||||||||
5.25%, 3/22/2030 | EUR | 445 | 318 | |||||||
4.88%, 1/30/2032 | EUR | 400 | 262 | |||||||
|
| |||||||||
| 580 | ||||||||||
| KENYA - 2.4% | ||||||||||
Republic of Kenya | ||||||||||
7.00%, 5/22/2027 | 675 | 517 | ||||||||
| MACEDONIA - 3.9% | ||||||||||
Republic of North Macedonia | ||||||||||
5.63%, 7/26/2023 | EUR | 748 | 726 | |||||||
2.75%, 1/18/2025 | EUR | 120 | 107 | |||||||
|
| |||||||||
| 833 | ||||||||||
| MEXICO - 0.9% | ||||||||||
United Mexican States | ||||||||||
4.75%, 4/27/2032 | 220 | 197 | ||||||||
| MONGOLIA - 1.9% | ||||||||||
State of Mongolia | ||||||||||
8.75%, 3/9/2024 | 415 | 393 | ||||||||
| NIGERIA - 2.8% | ||||||||||
Federal Republic of Nigeria | ||||||||||
9.25%, 1/21/2049 | 232 | 148 | ||||||||
Nigeria Government Bond | ||||||||||
7.63%, 11/21/2025(3) | 521 | 451 | ||||||||
|
| |||||||||
| 599 | ||||||||||
| OMAN - 0.9% | ||||||||||
Sultanate of Oman Government Bond | ||||||||||
7.38%, 10/28/2032 | 200 | 200 | ||||||||
| PARAGUAY - 2.7% | ||||||||||
Republic of Paraguay | ||||||||||
4.63%, 1/25/2023 | 205 | 204 | ||||||||
3.85%, 6/28/2033 | 250 | 196 | ||||||||
6.10%, 8/11/2044 | 216 | 179 | ||||||||
|
| |||||||||
| 579 | ||||||||||
| PERU - 1.4% | ||||||||||
Republic of Peru | ||||||||||
6.15%, 8/12/2032 | PEN | 1,400 | 290 | |||||||
| ROMANIA - 2.8% | ||||||||||
Romania Government Bond | ||||||||||
6.63%, 9/27/2029(3) | EUR | 190 | 176 | |||||||
3.62%, 5/26/2030 | EUR | 400 | 294 | |||||||
4.63%, 4/3/2049 | EUR | 200 | 129 | |||||||
|
| |||||||||
| 599 | ||||||||||
| SERBIA - 4.0% | ||||||||||
Republic of Serbia | ||||||||||
3.13%, 5/15/2027 | EUR | 200 | 159 | |||||||
1.50%, 6/26/2029 | EUR | 295 | 191 | |||||||
1.65%, 3/3/2033 | EUR | 905 | 489 | |||||||
|
| |||||||||
| 839 | ||||||||||
| TUNISIA - 0.7% | ||||||||||
Tunisian Republic |
| |||||||||
6.75%, 10/31/2023 | EUR | 205 | 152 | |||||||
| Artisan Partners Funds | 31 |
| Principal Amount | Market Value | |||||||||
| UZBEKISTAN - 5.9% | ||||||||||
Republic of Uzbekistan |
| |||||||||
14.50%, 11/25/2023 | UZS | 10,000,000 | $ | 872 | ||||||
5.38%, 2/20/2029 | 450 | 376 | ||||||||
|
| |||||||||
| 1,248 | ||||||||||
| ZAMBIA - 2.8% | ||||||||||
Republic of Zambia |
| |||||||||
11.00%, 6/17/2024 | ZMW | 4,848 | 265 | |||||||
10.00%, 6/28/2024 | ZMW | 4,367 | 238 | |||||||
10.00%, 9/20/2024 | ZMW | 1,757 | 93 | |||||||
|
| |||||||||
| 596 | ||||||||||
|
| |||||||||
Total sovereign government bonds |
| 15,102 | ||||||||
| CORPORATE BONDS - 10.4% | ||||||||||
| BRAZIL - 3.1% | ||||||||||
Cosan Overseas Ltd. |
| |||||||||
8.25%, 11/5/2022(2) | 196 | 193 | ||||||||
MC Brazil Downstream Trading SARL |
| |||||||||
7.25%, 6/30/2031 | 300 | 226 | ||||||||
Unigel Luxembourg SA |
| |||||||||
8.75%, 10/1/2026 | 253 | 241 | ||||||||
|
| |||||||||
| 660 | ||||||||||
| CHILE - 1.0% | ||||||||||
ATP Tower Holdings LLC |
| |||||||||
4.05%, 4/27/2026(3) | 270 | 215 | ||||||||
| CHINA - 0.5% | ||||||||||
CAR, Inc. |
| |||||||||
9.75%, 3/31/2024 | 128 | 106 | ||||||||
| COLOMBIA - 2.8% | ||||||||||
Aris Mining Corp. |
| |||||||||
6.88%, 8/9/2026 | 277 | 201 | ||||||||
EnfraGen Energia Sur SA |
| |||||||||
5.38%, 12/30/2030 | 280 | 166 | ||||||||
Gran Tierra Energy International Holdings Ltd. |
| |||||||||
6.25%, 2/15/2025 | 275 | 227 | ||||||||
|
| |||||||||
| �� | 594 | |||||||||
| CZECH REPUBLIC - 0.4% | ||||||||||
Energo-Pro A/S |
| |||||||||
4.50%, 5/4/2024 | 100 | 91 | ||||||||
| MEXICO - 1.1% | ||||||||||
Electricidad Firme de Mexico Holdings SA de CV |
| |||||||||
4.90%, 11/20/2026 | 277 | 226 | ||||||||
| PERU - 0.5% | ||||||||||
PetroTal Corp. |
| |||||||||
12.00%, 2/16/2024(3) | 100 | 102 | ||||||||
| TANZANIA - 1.0% | ||||||||||
HTA Group Ltd. |
| |||||||||
7.00%, 12/18/2025(3) | 240 | 208 | ||||||||
|
| |||||||||
Total corporate bonds |
| 2,202 | ||||||||
| No. of Contracts‡ | Value | |||||||||
| OPTIONS PURCHASED - 0.0%^ | ||||||||||
| PUT INTEREST RATE SWAPTIONS - 0.0%^ | ||||||||||
Option to enter into interest rate swap expiring 4/12/2024 to pay 4% and receive 1D SOFR (Cost $4) | 196 | 7 | ||||||||
|
| |||||||||
| 7 | ||||||||||
|
| |||||||||
Total options purchased | 7 | |||||||||
| Principal Amount | ||||||||||
| SHORT-TERM INVESTMENTS - 14.9% | ||||||||||
| U.S. TREASURY OBLIGATIONS - 14.9% | ||||||||||
U.S. Treasury Bills |
| |||||||||
0.60%(4), 10/04/2022 | $ | 1,450 | 1,450 | |||||||
1.78%(4), 10/11/2022 | 1,700 | 1,699 | ||||||||
|
| |||||||||
Total short-term investments |
| 3,149 | ||||||||
Total investments - 96.5% |
| 20,460 | ||||||||
Other assets less liabilities - 3.5% |
| 739 | ||||||||
|
| |||||||||
Total net assets - 100.0%# |
| $ | 21,199 | |||||||
|
| |||||||||
| (1) | Variable or floating rate security, linked to the referenced benchmark. The interest rate shown is the current rate as of September 30, 2022. |
| (2) | Perpetual security. The rate reflected was the rate in effect on September 30, 2022. The maturity date reflects the next call date. |
| (3) | Security exempt from registration pursuant to Rule 144A under the Securities Act of 1933. May be resold in transactions exempt from registration, normally to qualified institutional buyers. |
| (4) | Yield to maturity. |
| PORTFOLIO DIVERSIFICATION | ||||||||||
| Dollar values in thousands | ||||||||||
| Value | Percentage of Total Investments | |||||||||
Energy | $ | 839 | 4.1 | % | ||||||
Foreign Government Securities | 15,102 | 73.8 | ||||||||
Industrials | 529 | 2.6 | ||||||||
Materials | 442 | 2.2 | ||||||||
Options Purchased | 7 | 0.0 | ||||||||
Utilities | 392 | 1.9 | ||||||||
Short-Term Investments | 3,149 | 15.4 | ||||||||
|
|
|
| |||||||
Total investments | $ | 20,460 | 100.0 | % | ||||||
|
|
|
| |||||||
| TRADING CURRENCIES | ||||||||||
| Dollar values in thousands | ||||||||||
| Value | Percentage of Total Investments | |||||||||
BRL | $ | 711 | 3.5 | % | ||||||
DOP | 1,103 | 5.4 | ||||||||
EUR | 4,287 | 20.9 | ||||||||
IDR | 680 | 3.3 | ||||||||
PEN | 290 | 1.4 | ||||||||
USD | 11,921 | 58.3 | ||||||||
UZS | 872 | 4.3 | ||||||||
ZMW | 596 | 2.9 | ||||||||
|
|
|
| |||||||
Total investments | $ | 20,460 | 100.0 | % | ||||||
|
|
|
| |||||||
| 32 | Artisan Partners Funds |
| FOREIGN CURRENCY FORWARD CONTRACTS | ||||||||||||||||||||||||||||
| Values in thousands | ||||||||||||||||||||||||||||
Currency Purchased | Currency Sold | Counterparty | Settlement Date | Unrealized Appreciation (Depreciation) | ||||||||||||||||||||||||
| USD | 729 | BRL | ** | 3,696 | CITI | 10/4/2022 | $ | 44 | ||||||||||||||||||||
| USD | 638 | UGX | ** | 2,448,670 | SCB | 10/4/2022 | 3 | |||||||||||||||||||||
| USD | 317 | PEN | ** | 1,226 | CITI | 10/11/2022 | 10 | |||||||||||||||||||||
| RSD | 26,550 | EUR | 224 | JPM | 10/24/2022 | 1 | ||||||||||||||||||||||
| RSD | 50,700 | EUR | 428 | SCB | 10/24/2022 | 3 | ||||||||||||||||||||||
| MXN | 19,247 | USD | 941 | SCB | 10/31/2022 | 9 | ||||||||||||||||||||||
| USD | 480 | BRL | ** | 2,592 | CITI | 11/3/2022 | 3 | |||||||||||||||||||||
| UZS** | 567,859 | USD | 50 | JPM | 11/4/2022 | 1 | (1) | |||||||||||||||||||||
| KZT** | 410,890 | USD | 834 | SCB | 12/9/2022 | 12 | ||||||||||||||||||||||
| EUR | 68 | USD | 67 | SCB | 12/21/2022 | 1 | ||||||||||||||||||||||
| USD | 4,531 | EUR | 4,504 | SCB | 12/21/2022 | 89 | ||||||||||||||||||||||
|
| |||||||||||||||||||||||||||
| Total unrealized appreciation |
| 176 | ||||||||||||||||||||||||||
|
| |||||||||||||||||||||||||||
| BRL** | 1,104 | USD | 206 | SCB | 10/4/2022 | (2 | ) | |||||||||||||||||||||
| UGX** | 2,448,670 | USD | 669 | JPM | 10/4/2022 | (34 | ) | |||||||||||||||||||||
| RON | 7,965 | EUR | 1,633 | JPM | 10/6/2022 | (24 | ) | |||||||||||||||||||||
| IDR** | 1,900,000 | USD | 128 | SCB | 11/21/2022 | (4 | ) | |||||||||||||||||||||
| USD | 400 | IDR | ** | 6,100,000 | CITI | 11/21/2022 | –^ | |||||||||||||||||||||
| HUF | 540,534 | EUR | 1,304 | SCB | 12/2/2022 | (53 | ) | |||||||||||||||||||||
| PLN | 3,192 | EUR | 664 | SCB | 12/6/2022 | (16 | ) | |||||||||||||||||||||
| EUR | 157 | USD | 158 | SCB | 12/21/2022 | (3 | ) | |||||||||||||||||||||
| USD | 400 | EUR | 410 | SCB | 12/21/2022 | (5 | ) | |||||||||||||||||||||
|
| |||||||||||||||||||||||||||
| Total unrealized depreciation |
| (141 | ) | |||||||||||||||||||||||||
|
| |||||||||||||||||||||||||||
| Net unrealized appreciation |
| $ | 35 | |||||||||||||||||||||||||
|
| |||||||||||||||||||||||||||
| ** | Non-deliverable. |
| (1) | Valued using significant unobservable inputs and is classified as Level 3 in the fair value hierarchy. |
| FUTURES CONTRACTS | ||||||||||||||||||||||||||||||
| Dollar values in thousands | ||||||||||||||||||||||||||||||
| Description | Number of Contracts | Expiration Date | Trading Currency | Notional Amount | Notional Value | Unrealized Appreciation | ||||||||||||||||||||||||
Short Positions Contracts |
| |||||||||||||||||||||||||||||
Euro-Bobl | (12 | ) | 12/8/2022 | EUR | $ | (1,200 | ) | $ | (1,408 | ) | $ | 30 | ||||||||||||||||||
Euro-Bund | (10 | ) | 12/8/2022 | EUR | (1,000 | ) | (1,357 | ) | 50 | |||||||||||||||||||||
Euro-Schatz | (11 | ) | 12/8/2022 | EUR | (1,100 | ) | (1,155 | ) | 10 | |||||||||||||||||||||
U.S. Treasury 2 Year Note | (20 | ) | 12/30/2022 | USD | (4,000 | ) | (4,108 | ) | 63 | |||||||||||||||||||||
U.S. Treasury 5 Year Note | (13 | ) | 12/30/2022 | USD | (1,300 | ) | (1,398 | ) | 34 | |||||||||||||||||||||
U.S. Treasury 10 Year Note | (19 | ) | 12/20/2022 | USD | (1,900 | ) | (2,129 | ) | 96 | |||||||||||||||||||||
U.S. Treasury Long Bond | (3 | ) | 12/20/2022 | USD | (300 | ) | (379 | ) | 28 | |||||||||||||||||||||
|
| |||||||||||||||||||||||||||||
Net unrealized appreciation | $ | 311 | ||||||||||||||||||||||||||||
|
| |||||||||||||||||||||||||||||
The Fund has recorded a liability of $5 as of September 30, 2022, related to the current day’s variation margin related to these contracts.
| Centrally Cleared Credit Default Swap-Sell Protection | |||||||||||||||||||||
| (Dollar values in thousands) | |||||||||||||||||||||
| Reference Entity | Financing | Frequency of | Termination | Notional Amount | Upfront | Unrealized | Value | ||||||||||||||
| Republic of South Africa | 1.00 | Quarterly | 6/20/2023 | USD 205 | (2) | 1 | (1) | ||||||||||||||
|
|
|
|
|
|
| |||||||||||||||
| Total | (2) | 1 | (1) | ||||||||||||||||||
|
|
| |||||||||||||||||||
The Fund has recorded a liability of $3 as of September 30, 2022, related to the current day’s variation margin related to these contracts.
| Artisan Partners Funds | 33 |
| Centrally Cleared Interest Rate Swaps | ||||||||||||||
| (Values in thousands) | ||||||||||||||
Floating Rate Index (Frequency) | Fixed Rate (%) | Fund Pays/ | Termination Date | Notional Amount | Upfront | Unrealized | Value | |||||||
| 1 day CDI at termination | 11.39 at termination | Pay | 1/2/2032 | BRL 640 | – | 3 | 3 | |||||||
|
|
| ||||||||||||
| Net unrealized appreciation and value | – | 3 | 3 | |||||||||||
|
|
| ||||||||||||
| 4 week TIIE monthly | 8.55 monthly | Pay | 4/2/2027 | MXN 13,500 | – | (19) | (19) | |||||||
| 4 week TIIE monthly | 8.65 monthly | Pay | 5/17/2032 | MXN 8,570 | – | (15) | (15) | |||||||
| 4 week TIIE monthly | 8.73 monthly | Pay | 6/21/2032 | MXN 7,200 | – | (10) | (10) | |||||||
| 4 week TIIE monthly | 8.72 monthly | Pay | 9/1/2032 | MXN 4,100 | – | (6) | (6) | |||||||
|
|
| ||||||||||||
| Net unrealized depreciation and value | – | (50) | (50) | |||||||||||
|
|
| ||||||||||||
| Total | – | (47) | (47) | |||||||||||
|
|
| ||||||||||||
The Fund has recorded a liability of $9 as of September 30, 2022, related to the current day’s variation margin related to these contracts.
| TOP TEN HOLDINGS | ||||||
Company Name | Country | Percentage of Total Net Assets | ||||
Dominican Republic Government Bond | Dominican Republic | 7.2 | % | |||
Republic of Uzbekistan | Uzbekistan | 5.9 | ||||
Republic of Iraq | Iraq | 4.5 | ||||
Republic of Serbia | Serbia | 4.0 | ||||
Republic of North Macedonia | Macedonia | 3.9 | ||||
Notas do Tesouro Nacional | Brazil | 3.4 | ||||
Republic of Indonesia | Indonesia | 3.2 | ||||
Republic of Angola | Angola | 3.0 | ||||
Benin Government Bond | Benin | 2.9 | ||||
Romania Government Bond | Romania | 2.8 | ||||
|
| |||||
Total | 40.8 | % | ||||
|
| |||||
Definitions of abbreviations and footnotes are detailed on page 28.
The accompanying notes are an integral part of the financial statements.
| 34 | Artisan Partners Funds |
Schedule of Investments – September 30, 2022
Principal amount, shares and dollar values in thousands
| Principal Amount | Value | |||||||||
| BANK LOANS - 86.6% | ||||||||||
| AEROSPACE/DEFENSE - 3.2% | ||||||||||
Jazz Acquisition, Inc. First Lien Term Loan B (SOFR + 4.25%), 7.38%, 6/19/2026(1) | $ | 466 | $ | 443 | ||||||
TransDigm, Inc. First Lien Term Loan G (ICE LIBOR USD 3 Month + 2.25%), 5.92%, 8/22/2024(1) | 1,100 | 1,071 | ||||||||
|
| |||||||||
| 1,514 | ||||||||||
| AUTO PARTS & EQUIPMENT - 0.5% | ||||||||||
Wheel Pros, Inc. First Lien Term Loan (ICE LIBOR USD 1 Month + 4.50%), 7.55%, 5/11/2028(1) | 332 | 243 | ||||||||
| BUILDING MATERIALS - 0.8% | ||||||||||
CP Atlas Buyer, Inc. First Lien Term Loan B1 (ICE LIBOR USD 1 Month + 3.75%), 6.27%, 11/23/2027(1) | 412 | 358 | ||||||||
| CHEMICALS - 1.1% | ||||||||||
CPC Acquisition Corp. First Lien Term Loan B (ICE LIBOR USD 3 Month + 3.75%), 7.42%, 12/29/2027(1) | 59 | 46 | ||||||||
Iris Holding, Inc. First Lien Term Loan | ||||||||||
(SOFR + 4.75%), 7.41%, 6/28/2028(1) | 250 | 229 | ||||||||
(SOFR + 4.75%), 7.89%, 6/28/2028(1) | 250 | 229 | ||||||||
|
| |||||||||
| 504 | ||||||||||
| COMMERCIAL SERVICES - 16.1% | ||||||||||
Corporation Service Co. Term Loan B (SOFR + 3.25%), 7.14%, 8/31/2029(1) | 1,000 | 974 | ||||||||
Digital Room Holdings, Inc. First Lien Term Loan B (ICE LIBOR USD 1 Month + 5.25%), 8.37%, 12/21/2028(1) | 577 | 517 | ||||||||
Employbridge Holding Co. First Lien Term Loan B (ICE LIBOR USD 3 Month + 4.75%), 8.42%, 7/19/2028(1) | 1,499 | 1,331 | ||||||||
KUEHG Corp. First Lien Term Loan B (ICE LIBOR USD 1 Month + 3.75%), 6.87%, 2/21/2025(1) | 2,411 | 2,273 | ||||||||
National Intergovernmental Purchasing Alliance Co. First Lien Term Loan (ICE LIBOR USD 3 Month + 3.50%), 6.53%, 5/23/2025(1) | 363 | 350 | ||||||||
National Intergovernmental Purchasing Alliance Co. Second Lien Term Loan (ICE LIBOR USD 3 Month + 7.50%), 9.75%, 5/26/2026(1) | 315 | 309 | ||||||||
New SK Holdco Sub LLC First Lien Term Loan (SOFR + 6.75%), 9.70%, 6/30/2027(1) | 514 | 461 | ||||||||
Spin Holdco, Inc. First Lien Term Loan B (ICE LIBOR USD 3 Month + 4.00%), 7.14%, 3/4/2028(1) | 750 | 656 | ||||||||
Trans Union LLC First Lien Term Loan B5 (ICE LIBOR USD 1 Month + 1.75%), 4.87%, 11/16/2026(1) | 746 | 718 | ||||||||
|
| |||||||||
| 7,589 | ||||||||||
| DISTRIBUTION/WHOLESALE - 2.0% | ||||||||||
BCPE Empire Holdings, Inc. First Lien Term Loan (SOFR + 4.63%), 7.76%, 6/11/2026(1) | 995 | 948 | ||||||||
| DIVERSIFIED FINANCIAL SERVICES - 5.8% | ||||||||||
Advisor Group Holdings, Inc. First Lien Term Loan B1 (ICE LIBOR USD 1 Month + 4.50%), 7.62%, 7/31/2026(1) | 119 | 113 | ||||||||
Edelman Financial Engines Center LLC First Lien Term Loan B (ICE LIBOR USD 1 Month + 3.50%), 6.62%, 4/7/2028(1) | 639 | 585 | ||||||||
Edelman Financial Engines Center LLC Second Lien Term Loan (ICE LIBOR USD 1 Month + 6.75%), 9.87%, 7/20/2026(1) | 1,250 | 1,100 | ||||||||
Focus Financial Partners LLC First Lien Term Loan B3 (ICE LIBOR USD 1 Month + 2.00%), 5.12%, 7/3/2024(1) | 995 | 969 | ||||||||
|
| |||||||||
| 2,767 | ||||||||||
| ENGINEERING & CONSTRUCTION - 1.0% | ||||||||||
KKR Apple Bidco LLC First Lien Term Loan (SOFR + 4.00%), 7.06%, 9/22/2028(1) | 500 | 489 | ||||||||
| ENTERTAINMENT - 0.2% | ||||||||||
J&J Ventures Gaming LLC First Lien Term Loan (ICE LIBOR USD 3 Month + 4.00%), 7.67%, 4/26/2028(1) | 104 | 98 | ||||||||
| FOOD - 4.3% | ||||||||||
B&G Foods, Inc. First Lien Term Loan B4 (ICE LIBOR USD 1 Month + 2.50%), 5.62%, 10/10/2026(1) | 985 | 930 | ||||||||
Dairyland USA Corp. First Lien Term Loan (SOFR + 4.75%), 7.93%, 8/23/2029(1) | 1,000 | 993 | ||||||||
Shearer’s Foods LLC First Lien Term Loan B (ICE LIBOR USD 1 Month + 3.50%), 6.62%, 9/23/2027(1) | 119 | 110 | ||||||||
|
| |||||||||
| 2,033 | ||||||||||
| FOOD SERVICE - 2.5% | ||||||||||
TKC Holdings, Inc. First Lien Term Loan (ICE LIBOR USD 3 Month + 5.50%), 9.18%, 5/15/2028(1) | 1,218 | 1,034 | ||||||||
TKC Midco 1 LLC First Lien Term Loan 12.00%, 2/15/2027 | 187 | 160 | ||||||||
|
| |||||||||
| 1,194 | ||||||||||
| HEALTHCARE-PRODUCTS - 1.5% | ||||||||||
Medline Borrower LP First Lien Term Loan B (ICE LIBOR USD 1 Month + 3.25%), 6.37%, 10/23/2028(1) | 768 | 705 | ||||||||
| HEALTHCARE-SERVICES - 0.4% | ||||||||||
Surgery Center Holdings, Inc. First Lien Term Loan (ICE LIBOR USD 1 Month + 3.75%), 6.51%, 8/31/2026(1) | 203 | 192 | ||||||||
| HOME FURNISHINGS - 0.2% | ||||||||||
Weber-Stephen Products LLC First Lien Term Loan B (ICE LIBOR USD 1 Month + 3.25%), 6.37%, 10/30/2027(1) | 128 | 103 | ||||||||
| HOUSEHOLD PRODUCTS/WARES - 1.9% | ||||||||||
VC GB Holdings I Corp. First Lien Term Loan (ICE LIBOR USD 3 Month + 3.50%), 6.38%, 7/21/2028(1) | 1,052 | 916 | ||||||||
| INSURANCE - 9.5% | ||||||||||
Acrisure LLC First Lien Term Loan B3 (ICE LIBOR USD 1 Month + 4.25%), 7.37%, 2/15/2027(1) | 233 | 219 | ||||||||
Alliant Holdings Intermediate LLC First Lien Term Loan B (ICE LIBOR USD 1 Month + 3.25%), 6.37%, 5/9/2025(1) | 340 | 325 | ||||||||
AssuredPartners, Inc. First Lien Term Loan (SOFR + 3.50%), 6.53%, 2/12/2027(1) | 1,244 | 1,175 | ||||||||
AssuredPartners, Inc. First Lien Term Loan B (ICE LIBOR USD 1 Month + 3.50%), 6.62%, 2/12/2027(1) | 575 | 543 | ||||||||
BroadStreet Partners, Inc. First Lien Term Loan B (ICE LIBOR USD 1 Month + 3.00%), 6.12%, 1/27/2027(1) | 739 | 697 | ||||||||
USI, Inc. First Lien Term Loan B (ICE LIBOR USD 3 Month + 2.75%), 6.42%, 5/16/2024(1) | 1,504 | 1,461 | ||||||||
|
| |||||||||
| 4,420 | ||||||||||
| INTERNET - 1.5% | ||||||||||
Arches Buyer, Inc. First Lien Term Loan (ICE LIBOR USD 1 Month + 3.25%), 6.37%, 12/6/2027(1) | 796 | 714 | ||||||||
| INVESTMENT COMPANIES - 2.4% | ||||||||||
Nexus Buyer LLC Second Lien Term Loan (ICE LIBOR USD 1 Month + 6.25%), 9.37%, 11/5/2029(1) | 1,211 | 1,140 | ||||||||
| LEISURE TIME - 3.2% | ||||||||||
Carnival Corp. First Lien Term Loan B (ICE LIBOR USD 3 Month + 3.25%), 6.13%, 10/18/2028(1) | 581 | 506 | ||||||||
MajorDrive Holdings IV LLC First Lien Term Loan B (ICE LIBOR USD 3 Month + 4.00%), 7.13%, 6/1/2028(1) | 119 | 109 | ||||||||
NCL Corp., Ltd. First Lien Term Loan A (ICE LIBOR USD 3 Month + 1.75%), 5.42%, 1/2/2024(1) | 957 | 894 | ||||||||
|
| |||||||||
| 1,509 | ||||||||||
| PHARMACEUTICALS - 1.5% | ||||||||||
Corgi Bidco, Inc. Term Loan (SOFR + 5.00%), 8.78%, 9/20/2029(1) | 500 | 466 | ||||||||
Sharp Midco LLC First Lien Term Loan B (ICE LIBOR USD 3 Month + 4.00%), 7.67%, 12/31/2028(1) | 244 | 229 | ||||||||
|
| |||||||||
| 695 | ||||||||||
| Artisan Partners Funds | 35 |
| Principal Amount | Value | |||||||||
| RETAIL - 1.9% | ||||||||||
Fogo De Chao, Inc. First Lien Term Loan (ICE LIBOR USD 1 Month + 4.25%), 7.37%, 4/7/2025(1) | $ | 863 | $ | 805 | ||||||
Portillo’s Holdings LLC First Lien Term Loan (ICE LIBOR USD 1 Month + 5.50%), 8.62%, 9/6/2024(1) | 83 | 82 | ||||||||
|
| |||||||||
| 887 | ||||||||||
| SOFTWARE - 16.0% | ||||||||||
Applied Systems, Inc. First Lien Term Loan B (ICE LIBOR USD 3 Month + 3.00%), 6.67%, 9/19/2024(1) | 232 | 226 | ||||||||
Applied Systems, Inc. Second Lien Term Loan (ICE LIBOR USD 3 Month + 5.50%), 9.17%, 9/19/2025(1) | 118 | 116 | ||||||||
Central Parent, Inc. First Lien Term Loan B (SOFR + 4.50%), 6.61%, 7/6/2029(1) | 500 | 481 | ||||||||
CommerceHub, Inc. First Lien Term Loan B (ICE LIBOR USD 1 Month + 4.00%), 7.12%, 12/29/2027(1) | 496 | 443 | ||||||||
CommerceHub, Inc. Second Lien Term Loan B (ICE LIBOR USD 1 Month + 7.00%), 10.12%, 12/29/2028(1) | 60 | 48 | ||||||||
Epicor Software Corp. First Lien Term Loan C (ICE LIBOR USD 1 Month + 3.25%), 6.37%, 7/30/2027(1) | 580 | 542 | ||||||||
Finastra USA, Inc. First Lien Term Loan B (ICE LIBOR USD 3 Month + 3.50%), 6.87%, 6/13/2024(1) | 203 | 176 | ||||||||
Matrix Parent, Inc. First Lien Term Loan (SOFR + 5.00%), 8.10%, 3/1/2029(1) | 927 | 853 | ||||||||
Orchid Finco LLC First Lien Term Loan B (SOFR + 4.75%), 7.58%, 7/27/2027(1) | 839 | 793 | ||||||||
RealPage, Inc. First Lien Term Loan B (ICE LIBOR USD 1 Month + 3.00%), 5.52%, 4/24/2028(1) | 432 | 404 | ||||||||
Renaissance Holdings Corp. First Lien Term Loan | ||||||||||
(ICE LIBOR USD 1 Month + 3.25%), 5.77%, 5/30/2025(1) | 233 | 221 | ||||||||
(SOFR + 4.50%), 7.10%, 3/30/2029(1) | 1,000 | 956 | ||||||||
Renaissance Holdings Corp. Second Lien Term Loan (ICE LIBOR USD 1 Month + 7.00%), 10.12%, 5/29/2026(1) | 120 | 114 | ||||||||
SS&C Technologies Holdings, Inc. First Lien Term Loan B3 (ICE LIBOR USD 1 Month + 1.75%), 4.87%, 4/16/2025(1) | 456 | 440 | ||||||||
SS&C Technologies Holdings, Inc. First Lien Term Loan B4 (ICE LIBOR USD 1 Month + 1.75%), 4.87%, 4/16/2025(1) | 370 | 357 | ||||||||
UKG, Inc. First Lien Term Loan (ICE LIBOR USD 3 Month + 3.25%), 5.54%, 5/4/2026(1) | 283 | 268 | ||||||||
UKG, Inc. Second Lien Term Loan (ICE LIBOR USD 3 Month + 5.25%), 7.54%, 5/3/2027(1) | 257 | 242 | ||||||||
Virgin Pulse, Inc. First Lien Term Loan B (ICE LIBOR USD 1 Month + 4.00%), 7.12%, 4/6/2028(1) | 989 | 859 | ||||||||
|
| |||||||||
| 7,539 | ||||||||||
| TELECOMMUNICATIONS - 6.7% | ||||||||||
Delta Topco, Inc. First Lien Term Loan B (ICE LIBOR USD 3 Month + 3.75%), 5.84%, 12/1/2027(1) | 203 | 184 | ||||||||
Delta Topco, Inc. Second Lien Term Loan (ICE LIBOR USD 3 Month + 7.25%), 9.34%, 12/1/2028(1) | 75 | 66 | ||||||||
Gridiron Fiber Corp. First Lien Term Loan B (ICE LIBOR USD 3 Month + 4.50%), 8.17%, 10/4/2028(1) | 2,189 | 1,980 | ||||||||
Maxar Technologies, Inc. First Lien Term Loan B (SOFR + 4.25%), 7.38%, 6/14/2029(1) | 998 | 936 | ||||||||
|
| |||||||||
| 3,166 | ||||||||||
| TRANSPORTATION - 2.4% | ||||||||||
SIRVA Worldwide, Inc. First Lien Term Loan | ||||||||||
(ICE LIBOR USD 3 Month + 5.50%), 8.31%, 8/4/2025(1) | 201 | 181 | ||||||||
(ICE LIBOR USD 3 Month + 5.50%), 8.57%, 8/4/2025(1) | 159 | 143 | ||||||||
(ICE LIBOR USD 3 Month + 5.50%), 8.62%, 8/4/2025(1) | 891 | 802 | ||||||||
(ICE LIBOR USD 3 Month + 5.50%), 9.17%, 8/4/2025(1) | 27 | 24 | ||||||||
|
| |||||||||
| 1,150 | ||||||||||
|
| |||||||||
Total bank loans | 40,873 | |||||||||
| CORPORATE BONDS - 4.0% | ||||||||||
| BANKS - 1.1% | ||||||||||
Goldman Sachs Capital II (ICE LIBOR USD 3 Month + 0.77%, 4.00% Floor), 4.00%, 12/19/2022(1)(2) | 720 | 516 | ||||||||
| DIVERSIFIED FINANCIAL SERVICES - 0.4% | ||||||||||
AG TTMT Escrow Issuer LLC 8.63%, 9/30/2027(3) | 194 | 182 | ||||||||
| INSURANCE - 0.5% | ||||||||||
Acrisure LLC 4.25%, 2/15/2029(3) | 320 | 251 | ||||||||
| INTERNET - 1.0% | ||||||||||
Arches Buyer, Inc. 4.25%, 6/1/2028(3) | 585 | 456 | ||||||||
| MISCELLANEOUS MANUFACTURING - 1.0% | ||||||||||
General Electric Co. Series D, (ICE LIBOR USD 3 Month + 3.33%), 6.62%, 12/15/2022(1)(2) | 510 | 477 | ||||||||
|
| |||||||||
Total corporate bonds | 1,882 | |||||||||
| No. of Warrants | ||||||||||
| WARRANTS - 0.0% | ||||||||||
| DIVERSIFIED FINANCIAL SERVICES - 0.0% | ||||||||||
Carnelian Point Holdings LP, expiring 6/30/2027, strike price 10 | 1 | – | ||||||||
| Shares Held | ||||||||||
| SHORT-TERM INVESTMENTS - 10.8% | ||||||||||
| INVESTMENT COMPANIES - 10.8% | ||||||||||
BlackRock Liquidity Funds Treasury Trust Fund - Institutional Class, 2.81% | 1,742 | $ | 1,742 | |||||||
Federated Treasury Obligations Fund - Institutional Class, 2.85% | 1,691 | 1,691 | ||||||||
Fidelity Investments Money Market Treasury Portfolio - Institutional Class, 2.89% | 1,691 | 1,691 | ||||||||
|
| |||||||||
Total short-term investments | 5,124 | |||||||||
Total investments - 101.4% | 47,879 | |||||||||
Other assets less liabilities - (1.4%) | (646 | ) | ||||||||
|
| |||||||||
Total net assets - 100.0%# | $ | 47,233 | ||||||||
|
| |||||||||
| (1) | Variable or floating rate security, linked to the referenced benchmark. The interest rate shown is the current rate as of September 30, 2022. |
| (2) | Perpetual security. The rate reflected was the rate in effect on September 30, 2022. The maturity date reflects the next call date. |
| (3) | Security exempt from registration pursuant to Rule 144A under the Securities Act of 1933. May be resold in transactions exempt from registration, normally to qualified institutional buyers. |
| (4) | Valued at a fair value in accordance with procedures established by the board of directors of Artisan Partners Funds. In total, securities valued at a fair value were $–, or 0.0% of total net assets. See notes 2(a) and 4 in Notes to Financial Statements for additional information. |
| (5) | Defaulted security. |
| PORTFOLIO DIVERSIFICATION | ||||||||||
| Dollar values in thousands | ||||||||||
| Value | Percentage of Total Investments | |||||||||
Communication Services | $ | 3,264 | 6.8 | % | ||||||
Consumer Discretionary | 3,690 | 7.7 | ||||||||
Consumer Staples | 4,143 | 8.7 | ||||||||
Financials | 10,226 | 21.4 | ||||||||
Health Care | 1,592 | 3.3 | ||||||||
Industrials | 10,627 | 22.2 | ||||||||
Information Technology | 8,709 | 18.2 | ||||||||
Materials | 504 | 1.0 | ||||||||
Short-Term Investment | 5,124 | 10.7 | ||||||||
|
|
|
| |||||||
Total investments | $ | 47,879 | 100.0 | % | ||||||
|
|
|
| |||||||
| 36 | Artisan Partners Funds |
| TOP TEN HOLDINGS | ||||||||
Company Name | Country | Percentage of Total Net Assets | ||||||
KUEHG Corp. | United States | 4.8 | % | |||||
Gridiron Fiber Corp. | United States | 4.2 | ||||||
USI, Inc. | United States | 3.1 | ||||||
Employbridge Holding Co. | United States | 2.8 | ||||||
AssuredPartners, Inc. | United States | 2.5 | ||||||
SIRVA Worldwide, Inc. | United States | 2.4 | ||||||
Nexus Buyer LLC | United States | 2.4 | ||||||
Edelman Financial Engines Center LLC | United States | 2.3 | ||||||
TransDigm, Inc. | United States | 2.3 | ||||||
Renaissance Holdings Corp. | United States | 2.3 | ||||||
|
| |||||||
Total | 29.1 | % | ||||||
|
| |||||||
Definitions of abbreviations and footnotes are detailed on page 28.
The accompanying notes are an integral part of the financial statements.
| Artisan Partners Funds | 37 |
Schedule of Investments – September 30, 2022
Shares and dollar values in thousands
| Shares Held | Value | |||||||||
| COMMON STOCKS - 92.4% | ||||||||||
| AEROSPACE & DEFENSE - 6.4% | ||||||||||
Northrop Grumman Corp. | 109 | $ | 51,195 | |||||||
TransDigm Group, Inc. | 99 | 51,808 | ||||||||
|
| |||||||||
| 103,003 | ||||||||||
| BEVERAGES - 2.3% | ||||||||||
Monster Beverage Corp.* | 420 | 36,492 | ||||||||
| CAPITAL MARKETS - 5.4% | ||||||||||
Moody’s Corp. | 66 | 16,041 | ||||||||
S&P Global, Inc. | 230 | 70,189 | ||||||||
|
| |||||||||
| 86,230 | ||||||||||
| CHEMICALS - 0.5% | ||||||||||
Linde plc(1) | 31 | 8,352 | ||||||||
| COMMUNICATIONS EQUIPMENT - 3.5% | ||||||||||
Motorola Solutions, Inc. | 255 | 57,160 | ||||||||
| CONSTRUCTION & ENGINEERING - 1.3% | ||||||||||
Quanta Services, Inc. | 160 | 20,340 | ||||||||
| ELECTRIC UTILITIES - 6.3% | ||||||||||
NextEra Energy, Inc. | 1,295 | 101,524 | ||||||||
| EQUITY REAL ESTATE INVESTMENT TRUSTS (REITS) - 7.6% | ||||||||||
American Tower Corp. | 398 | 85,556 | ||||||||
SBA Communications Corp. | 128 | 36,438 | ||||||||
|
| |||||||||
| 121,994 | ||||||||||
| HEALTH CARE EQUIPMENT & SUPPLIES - 2.1% | ||||||||||
Edwards Lifesciences Corp.* | 408 | 33,746 | ||||||||
| HEALTH CARE PROVIDERS & SERVICES - 13.2% | ||||||||||
Elevance Health, Inc. | 36 | 16,177 | ||||||||
McKesson Corp. | 218 | 74,256 | ||||||||
UnitedHealth Group, Inc. | 242 | 122,409 | ||||||||
|
| |||||||||
| 212,842 | ||||||||||
| INSURANCE - 4.1% | ||||||||||
Aon plc, Class A | 246 | 65,820 | ||||||||
| IT SERVICES - 3.6% | ||||||||||
Visa, Inc., Class A | 326 | 57,868 | ||||||||
| LIFE SCIENCES TOOLS & SERVICES - 8.5% | ||||||||||
Danaher Corp. | 262 | 67,543 | ||||||||
Thermo Fisher Scientific, Inc. | 137 | 69,409 | ||||||||
|
| |||||||||
| 136,952 | ||||||||||
| OIL, GAS & CONSUMABLE FUELS - 1.3% | ||||||||||
Cheniere Energy, Inc. | 126 | 20,844 | ||||||||
| PERSONAL PRODUCTS - 2.0% | ||||||||||
Estee Lauder Cos., Inc. (The), Class A | 146 | 31,469 | ||||||||
| ROAD & RAIL - 7.5% | ||||||||||
Canadian National Railway Co.(1) | 148 | 15,972 | ||||||||
Canadian Pacific Railway Ltd.(1) | 1,573 | 104,983 | ||||||||
|
| |||||||||
| 120,955 | ||||||||||
| SOFTWARE - 9.0% | ||||||||||
Atlassian Corp. plc, Class A* | 38 | 8,094 | ||||||||
Intuit, Inc. | 21 | 8,027 | ||||||||
Microsoft Corp. | 445 | 103,645 | ||||||||
Oracle Corp. | 397 | 24,271 | ||||||||
|
| |||||||||
| 144,037 | ||||||||||
| WIRELESS TELECOMMUNICATION SERVICES - 7.8% | ||||||||||
T-Mobile US, Inc.* | 941 | 126,271 | ||||||||
|
| |||||||||
Total common stocks | 1,485,899 | |||||||||
| No. of Contracts‡ | ||||||||||
| OPTIONS PURCHASED - 3.4% | ||||||||||
| CALL OPTIONS - 3.4% | ||||||||||
| INTERNET & DIRECT MARKETING RETAIL - 3.3% | ||||||||||
Amazon.com, Inc. 6/16/2023 at USD 70.00; Notional Amount: USD 129,261 | 11,439 | 53,849 | ||||||||
| SOFTWARE - 0.1% | ||||||||||
Intuit, Inc. 1/20/2023 at USD 420.00; Notional Amount: USD 23,549 | 608 | 1,492 | ||||||||
|
| |||||||||
Total call options | 55,341 | |||||||||
|
| |||||||||
Total options purchased | 55,341 | |||||||||
| Shares Held | ||||||||||
| SHORT-TERM INVESTMENT - 1.9% | ||||||||||
| INVESTMENT COMPANY - 1.9% | ||||||||||
BlackRock Liquidity Funds Treasury Trust Fund - Institutional Class, 2.81% (Cost $30,961) | 30,961 | 30,961 | ||||||||
|
| |||||||||
Total investments - 97.7% | 1,572,201 | |||||||||
Other assets less liabilities - 2.3% | 36,241 | |||||||||
|
| |||||||||
Total net assets - 100.0%# | $ | 1,608,442 | ||||||||
|
| |||||||||
| (1) | The Fund considers the company to be from outside the United States. See the Fund’s Statement of Additional Information for a description of the methodology used for country classifications. |
| Security | Country | Trading Currency | ||||||||
Canadian National Railway Co. | Canada | USD | ||||||||
Canadian Pacific Railway Ltd. | Canada | USD | ||||||||
Linde plc | United Kingdom | USD | ||||||||
| 38 | Artisan Partners Funds |
| PORTFOLIO DIVERSIFICATION | ||||||||||
| Dollar values in thousands | ||||||||||
| Value | Percentage of Total Investments | |||||||||
Communication Services | $ | 126,271 | 8.0 | % | ||||||
Consumer Discretionary | 53,849 | 3.4 | ||||||||
Consumer Staples | 67,961 | 4.3 | ||||||||
Energy | 20,844 | 1.3 | ||||||||
Financials | 152,050 | 9.7 | ||||||||
Health Care | 383,539 | 24.4 | ||||||||
Industrials | 244,299 | 15.5 | ||||||||
Information Technology | 260,557 | 16.6 | ||||||||
Materials | 8,352 | 0.5 | ||||||||
Real Estate | 121,994 | 7.8 | ||||||||
Utilities | 101,524 | 6.5 | ||||||||
Short-Term Investment | 30,961 | 2.0 | ||||||||
|
|
|
| |||||||
Total investments | $ | 1,572,201 | 100.0 | % | ||||||
|
|
|
| |||||||
| FOREIGN CURRENCY FORWARD CONTRACTS | ||||||||||||||||||||||||||||
| Values in thousands | ||||||||||||||||||||||||||||
Currency Purchased | Currency Sold | Counterparty | Settlement Date | Unrealized Appreciation (Depreciation) | ||||||||||||||||||||||||
| USD | 132,505 | CAD | 169,879 | JPM | 11/9/2022 | $ | 9,533 | |||||||||||||||||||||
|
| |||||||||||||||||||||||||||
| Total unrealized appreciation | 9,533 | |||||||||||||||||||||||||||
|
| |||||||||||||||||||||||||||
| CAD | 15,705 | USD | 11,917 | JPM | 11/9/2022 | (549 | ) | |||||||||||||||||||||
| USD | 3,249 | CAD | 4,493 | JPM | 11/9/2022 | (4 | ) | |||||||||||||||||||||
|
| |||||||||||||||||||||||||||
| Total unrealized depreciation | (553 | ) | ||||||||||||||||||||||||||
|
| |||||||||||||||||||||||||||
| Net unrealized appreciation | $ | 8,980 | ||||||||||||||||||||||||||
|
| |||||||||||||||||||||||||||
| TOP TEN HOLDINGS | |||||||
Company Name | Country | Percentage of Total Net Assets | |||||
T-Mobile US, Inc. | United States | 7.8 | % | ||||
UnitedHealth Group, Inc. | United States | 7.6 | |||||
Canadian Pacific Railway Ltd. | Canada | 6.5 | |||||
Microsoft Corp. | United States | 6.4 | |||||
NextEra Energy, Inc. | United States | 6.3 | |||||
American Tower Corp. | United States | 5.3 | |||||
McKesson Corp. | United States | 4.6 | |||||
S&P Global, Inc. | United States | 4.4 | |||||
Thermo Fisher Scientific, Inc. | United States | 4.3 | |||||
Danaher Corp. | United States | 4.2 | |||||
|
| ||||||
Total | 57.4 | % | |||||
|
| ||||||
Definitions of abbreviations and footnotes are detailed on page 28.
The accompanying notes are an integral part of the financial statements.
| Artisan Partners Funds | 39 |
Schedule of Investments – September 30, 2022
Shares and dollar values in thousands
| Shares Held | Value | |||||||||
| COMMON STOCKS - 95.6% | ||||||||||
| BRAZIL - 2.2% | ||||||||||
Hapvida Participacoes e Investimentos SA* | 2,011 | $ | 2,834 | |||||||
NU Holdings Ltd., Class A* | 541 | 2,378 | ||||||||
|
| |||||||||
| 5,212 | ||||||||||
| CANADA - 2.0% | ||||||||||
Altus Group Ltd. | 62 | 1,997 | ||||||||
CAE, Inc.* | 168 | 2,582 | ||||||||
|
| |||||||||
| 4,579 | ||||||||||
| CHINA - 0.7% | ||||||||||
Silergy Corp.(1) | 127 | 1,665 | ||||||||
| DENMARK - 5.4% | ||||||||||
Ascendis Pharma A/S, ADR* | 73 | 7,526 | ||||||||
Genmab A/S*(1) | 7 | 2,161 | ||||||||
Vestas Wind Systems A/S(1) | 153 | 2,808 | ||||||||
|
| |||||||||
| 12,495 | ||||||||||
| FINLAND - 1.3% | ||||||||||
Metso Outotec OYJ(1) | 473 | 3,133 | ||||||||
| GERMANY - 3.3% | ||||||||||
CTS Eventim AG & Co. KGaA*(1) | 67 | 2,773 | ||||||||
Gerresheimer AG(1) | 32 | 1,583 | ||||||||
Puma SE(1) | 71 | 3,308 | ||||||||
|
| |||||||||
| 7,664 | ||||||||||
| HONG KONG - 4.1% | ||||||||||
Techtronic Industries Co. Ltd.(1) | 998 | 9,432 | ||||||||
| ICELAND - 0.8% | ||||||||||
Marel HF(1) | 641 | 1,942 | ||||||||
| ITALY - 0.5% | ||||||||||
Moncler SpA(1) | 29 | 1,197 | ||||||||
| JAPAN - 1.6% | ||||||||||
Obic Co. Ltd.(1) | 28 | 3,765 | ||||||||
| LUXEMBOURG - 1.6% | ||||||||||
Eurofins Scientific SE(1) | 61 | 3,621 | ||||||||
| NETHERLANDS - 3.2% | ||||||||||
Argenx SE, ADR* | 17 | 5,869 | ||||||||
Koninklijke DSM NV(1) | 15 | 1,681 | ||||||||
|
| |||||||||
| 7,550 | ||||||||||
| NORWAY - 1.1% | ||||||||||
Nordic Semiconductor ASA*(1) | 194 | 2,539 | ||||||||
| UNITED KINGDOM - 4.9% | ||||||||||
CNH Industrial NV(1) | 474 | 5,286 | ||||||||
London Stock Exchange Group plc(1) | 55 | 4,626 | ||||||||
Smiths Group plc(1) | 81 | 1,357 | ||||||||
|
| |||||||||
| 11,269 | ||||||||||
| UNITED STATES - 62.9% | ||||||||||
Advanced Micro Devices, Inc.* | 106 | 6,689 | ||||||||
Arista Networks, Inc.* | 37 | 4,187 | ||||||||
Atlassian Corp. plc, Class A* | 32 | 6,673 | ||||||||
Azenta, Inc. | 28 | 1,183 | ||||||||
Bentley Systems, Inc., Class B | 70 | 2,137 | ||||||||
Bill.com Holdings, Inc.* | 12 | 1,582 | ||||||||
| UNITED STATES (CONTINUED) | ||||||||||
Boston Scientific Corp.* | 245 | 9,489 | ||||||||
Catalent, Inc.* | 102 | 7,359 | ||||||||
Cooper Cos., Inc. (The) | 8 | 2,229 | ||||||||
Datadog, Inc., Class A* | 9 | 812 | ||||||||
First Republic Bank | 33 | 4,321 | ||||||||
Five Below, Inc.* | 15 | 2,017 | ||||||||
Generac Holdings, Inc.* | 4 | 716 | ||||||||
Global Payments, Inc. | 51 | 5,531 | ||||||||
Guidewire Software, Inc.* | 28 | 1,706 | ||||||||
HubSpot, Inc.* | 17 | 4,627 | ||||||||
Ingersoll Rand, Inc. | 148 | 6,412 | ||||||||
iRhythm Technologies, Inc.* | 18 | 2,232 | ||||||||
Lattice Semiconductor Corp.* | 119 | 5,875 | ||||||||
MACOM Technology Solutions Holdings, Inc.* | 25 | 1,312 | ||||||||
Morningstar, Inc. | 19 | 3,975 | ||||||||
Nasdaq, Inc. | 121 | 6,851 | ||||||||
Novanta, Inc.* | 13 | 1,541 | ||||||||
ON Semiconductor Corp.* | 117 | 7,311 | ||||||||
Papa John’s International, Inc. | 35 | 2,447 | ||||||||
S&P Global, Inc. | 5 | 1,519 | ||||||||
SVB Financial Group* | 16 | 5,384 | ||||||||
Take-Two Interactive Software, Inc.* | 19 | 2,117 | ||||||||
Teledyne Technologies, Inc.* | 15 | 4,977 | ||||||||
Tradeweb Markets, Inc., Class A | 56 | 3,159 | ||||||||
Valmont Industries, Inc. | 26 | 6,996 | ||||||||
Veeva Systems, Inc., Class A* | 74 | 12,190 | ||||||||
Wolfspeed, Inc.* | 27 | 2,765 | ||||||||
Workiva, Inc.* | 51 | 3,943 | ||||||||
Zscaler, Inc.* | 23 | 3,856 | ||||||||
|
| |||||||||
| 146,120 | ||||||||||
|
| |||||||||
Total common stocks |
| 222,183 | ||||||||
| SHORT-TERM INVESTMENT - 4.0% | ||||||||||
| INVESTMENT COMPANY - 4.0% | ||||||||||
BlackRock Liquidity Funds Treasury Trust Fund - Institutional Class, 2.81% (Cost $9,356) | 9,356 | 9,356 | ||||||||
|
| |||||||||
Total investments - 99.6% |
| 231,539 | ||||||||
Other assets less liabilities - 0.4% |
| 862 | ||||||||
|
| |||||||||
Total net assets - 100.0%# |
| $ | 232,401 | |||||||
|
| |||||||||
| (1) | Valued at a fair value in accordance with procedures established by the board of directors of Artisan Partners Funds. In total, securities valued at a fair value were $52,877, or 22.8% of total net assets. See notes 2(a) and 4 in Notes to Financial Statements for additional information. |
| 40 | Artisan Partners Funds |
| PORTFOLIO DIVERSIFICATION | ||||||||||
| Dollar values in thousands | ||||||||||
| Value | Percentage of Total Investments | |||||||||
Communication Services | $ | 4,890 | 2.1 | % | ||||||
Consumer Discretionary | 8,969 | 3.9 | ||||||||
Financials | 32,213 | 13.9 | ||||||||
Health Care | 58,276 | 25.2 | ||||||||
Industrials | 40,664 | 17.6 | ||||||||
Information Technology | 73,493 | 31.7 | ||||||||
Materials | 1,681 | 0.7 | ||||||||
Real Estate | 1,997 | 0.9 | ||||||||
Short-Term Investment | 9,356 | 4.0 | ||||||||
|
|
|
| |||||||
Total investments | $ | 231,539 | 100.0 | % | ||||||
|
|
|
| |||||||
| TRADING CURRENCIES | ||||||||||
| Dollar values in thousands | ||||||||||
| Value | Percentage of Total Investments | |||||||||
BRL | $ | 2,834 | 1.2 | % | ||||||
CAD | 4,579 | 2.0 | ||||||||
DKK | 4,969 | 2.1 | ||||||||
EUR | 24,524 | 10.6 | ||||||||
GBP | 5,983 | 2.6 | ||||||||
HKD | 9,432 | 4.1 | ||||||||
JPY | 3,765 | 1.6 | ||||||||
NOK | 2,539 | 1.1 | ||||||||
TWD | 1,665 | 0.7 | ||||||||
USD | 171,249 | 74.0 | ||||||||
|
|
|
| |||||||
Total investments | $ | 231,539 | 100.0 | % | ||||||
|
|
|
| |||||||
| TOP TEN HOLDINGS | ||||||||||
Company Name | Country | Percentage of Total Net Assets | ||||||||
Veeva Systems, Inc. | United States | 5.2 | % | |||||||
Boston Scientific Corp. | United States | 4.1 | ||||||||
Techtronic Industries Co. Ltd. | Hong Kong | 4.1 | ||||||||
Ascendis Pharma A/S | Denmark | 3.2 | ||||||||
Catalent, Inc. | United States | 3.2 | ||||||||
ON Semiconductor Corp. | United States | 3.1 | ||||||||
Valmont Industries, Inc. | United States | 3.0 | ||||||||
Nasdaq, Inc. | United States | 2.9 | ||||||||
Advanced Micro Devices, Inc. | United States | 2.9 | ||||||||
Atlassian Corp. plc | United States | 2.9 | ||||||||
|
| |||||||||
Total | 34.6 | % | ||||||||
|
| |||||||||
Definitions of abbreviations and footnotes are detailed on page 28.
The accompanying notes are an integral part of the financial statements.
| Artisan Partners Funds | 41 |
Schedule of Investments – September 30, 2022
Shares and dollar values in thousands
| Shares Held | Value | |||||||||
| COMMON STOCKS - 95.1% | ||||||||||
| BELGIUM - 1.1% | ||||||||||
UCB SA(1) | 29 | $ | 2,015 | |||||||
| CANADA - 5.1% | ||||||||||
Canadian National Railway Co. | 23 | 2,446 | ||||||||
Canadian Pacific Railway Ltd. | 85 | 5,654 | ||||||||
Descartes Systems Group, Inc. (The)* | 14 | 914 | ||||||||
|
| |||||||||
| 9,014 | ||||||||||
| CHINA - 3.0% | ||||||||||
CGN Power Co. Ltd., Class H(1) | 6,255 | 1,353 | ||||||||
China Longyuan Power Group Corp. Ltd., Class H(1) | 1,616 | 2,021 | ||||||||
China Tourism Group Duty Free Corp. Ltd., Class A(1) | 67 | 1,863 | ||||||||
|
| |||||||||
| 5,237 | ||||||||||
| DENMARK - 4.2% | ||||||||||
Ascendis Pharma A/S, ADR* | 25 | 2,549 | ||||||||
Novo Nordisk A/S, ADR | 3 | 294 | ||||||||
Novo Nordisk A/S, Class B(1) | 22 | 2,163 | ||||||||
ROCKWOOL A/S, Class B(1) | 15 | 2,369 | ||||||||
|
| |||||||||
| 7,375 | ||||||||||
| FINLAND - 0.7% | ||||||||||
Neste OYJ(1) | 28 | 1,197 | ||||||||
| FRANCE - 4.1% | ||||||||||
BNP Paribas SA(1) | 75 | 3,151 | ||||||||
Capgemini SE(1) | 3 | 423 | ||||||||
LVMH Moet Hennessy Louis Vuitton SE(1) | 4 | 2,485 | ||||||||
Pernod Ricard SA(1) | 6 | 1,178 | ||||||||
|
| |||||||||
| 7,237 | ||||||||||
| GERMANY - 2.7% | ||||||||||
Brenntag SE(1) | 11 | 682 | ||||||||
Deutsche Post AG(1) | 67 | 2,042 | ||||||||
Dr Ing hc F Porsche AG (Preference)*(1) | 20 | 1,652 | ||||||||
KION Group AG(1) | 23 | 447 | ||||||||
|
| |||||||||
| 4,823 | ||||||||||
| INDIA - 1.2% | ||||||||||
Reliance Industries Ltd.(1) | 74 | 2,127 | ||||||||
| ITALY - 2.3% | ||||||||||
BFF Bank SpA(1) | 601 | 3,988 | ||||||||
| JAPAN - 2.7% | ||||||||||
Azbil Corp.(1) | 134 | 3,497 | ||||||||
Toyota Industries Corp.(1) | 25 | 1,190 | ||||||||
|
| |||||||||
| 4,687 | ||||||||||
| LUXEMBOURG - 1.2% | ||||||||||
Majorel Group Luxembourg SA(1) | 102 | 2,073 | ||||||||
| NETHERLANDS - 9.9% | ||||||||||
Argenx SE, ADR* | 17 | 6,115 | ||||||||
Argenx SE*(1) | –^ | 61 | ||||||||
ING Groep NV(1) | 415 | 3,561 | ||||||||
Shell plc(1) | 290 | 7,207 | ||||||||
Shell plc, ADR | 12 | 583 | ||||||||
|
| |||||||||
| 17,527 | ||||||||||
| NORWAY - 0.6% | ||||||||||
Volue ASA*(1) | 419 | 1,129 | ||||||||
| RUSSIA - 0.0% | ||||||||||
MMC Norilsk Nickel PJSC, ADR(1)(2)(3) | 136 | – | ||||||||
Sberbank of Russia PJSC*(1)(2)(3) | 1,137 | – | ||||||||
|
| |||||||||
| – | ||||||||||
| SINGAPORE - 0.6% | ||||||||||
DBS Group Holdings Ltd.(1) | 46 | 1,064 | ||||||||
| SPAIN - 1.6% | ||||||||||
Ferrovial SA(1) | 121 | 2,740 | ||||||||
| SWEDEN - 2.3% | ||||||||||
Nibe Industrier AB, Class B(1) | 362 | 3,215 | ||||||||
Viaplay Group AB, Class B*(1) | 43 | 838 | ||||||||
|
| |||||||||
| 4,053 | ||||||||||
| SWITZERLAND - 3.0% | ||||||||||
Barry Callebaut AG(1) | 1 | 1,444 | ||||||||
Cie Financiere Richemont SA(1) | 18 | 1,718 | ||||||||
UBS Group AG(1) | 141 | 2,041 | ||||||||
|
| |||||||||
| 5,203 | ||||||||||
| UNITED KINGDOM - 3.5% | ||||||||||
BAE Systems plc(1) | 110 | 971 | ||||||||
Barclays plc(1) | 1,302 | 2,075 | ||||||||
Linde plc(1) | 4 | 1,203 | ||||||||
Unilever plc(1) | 45 | 1,966 | ||||||||
|
| |||||||||
| 6,215 | ||||||||||
| UNITED STATES - 45.3% | ||||||||||
Alphabet, Inc., Class A* | 38 | 3,615 | ||||||||
Alphabet, Inc., Class C* | 32 | 3,104 | ||||||||
Amazon.com, Inc.* | 54 | 6,099 | ||||||||
Aon plc, Class A | 10 | 2,695 | ||||||||
Booking Holdings, Inc.* | 2 | 3,163 | ||||||||
Charles River Laboratories International, Inc.* | 8 | 1,491 | ||||||||
Chesapeake Energy Corp. | 28 | 2,602 | ||||||||
Darling Ingredients, Inc.* | 61 | 4,052 | ||||||||
Devon Energy Corp. | 37 | 2,246 | ||||||||
EQT Corp. | 117 | 4,779 | ||||||||
Halozyme Therapeutics, Inc.* | 200 | 7,896 | ||||||||
Intercontinental Exchange, Inc. | 44 | 3,990 | ||||||||
Microsoft Corp. | 9 | 2,209 | ||||||||
Natera, Inc.* | 48 | 2,123 | ||||||||
Norfolk Southern Corp. | 12 | 2,548 | ||||||||
NOV, Inc. | 241 | 3,901 | ||||||||
Schlumberger NV | 215 | 7,708 | ||||||||
Stryker Corp. | 14 | 2,818 | ||||||||
TJX Cos., Inc. (The) | 52 | 3,257 | ||||||||
T-Mobile US, Inc.* | 44 | 5,894 | ||||||||
Trane Technologies plc | 16 | 2,352 | ||||||||
Visa, Inc., Class A | 7 | 1,262 | ||||||||
|
| |||||||||
| 79,804 | ||||||||||
|
| |||||||||
Total common stocks |
| 167,508 | ||||||||
| 42 | Artisan Partners Funds |
| Shares Held | Value | |||||||||
| SHORT-TERM INVESTMENT - 1.4% | ||||||||||
| INVESTMENT COMPANY - 1.4% | ||||||||||
BlackRock Liquidity Funds Treasury Trust Fund - Institutional Class, 2.81% | 2,519 | $ | 2,519 | |||||||
|
| |||||||||
Total investments - 96.5% |
| 170,027 | ||||||||
Other assets less liabilities - 3.5% |
| 6,224 | ||||||||
|
| |||||||||
Total net assets - 100.0%# |
| $ | 176,251 | |||||||
|
| |||||||||
| (1) | Valued at a fair value in accordance with procedures established by the board of directors of Artisan Partners Funds. In total, securities valued at a fair value were $69,149, or 39.2% of total net assets. See notes 2(a) and 4 in Notes to Financial Statements for additional information. |
| (2) | Security is valued using significant unobservable inputs and is classified as Level 3 in the fair value hierarchy. |
| (3) | Security is restricted. |
| Security | Acquisition Dates | Cost | Value | Percentage of Total Net Assets | ||||||||||||||||
MMC Norilsk Nickel PJSC | 01/12/2022 - 01/14/2022 | $ | 4,291 | $ | – | 0.0 | % | |||||||||||||
Sberbank of Russia PJSC | 09/16/2021 - 02/11/2022 | 4,750 | – | 0.0 | % | |||||||||||||||
| PORTFOLIO DIVERSIFICATION | ||||||||||
| Dollar values in thousands | ||||||||||
| Value | Percentage of Total Investments | |||||||||
Communication Services | $ | 13,451 | 7.9 | % | ||||||
Consumer Discretionary | 20,237 | 11.9 | ||||||||
Consumer Staples | 8,640 | 5.1 | ||||||||
Energy | 32,350 | 19.0 | ||||||||
Financials | 22,565 | 13.2 | ||||||||
Health Care | 27,525 | 16.2 | ||||||||
Industrials | 26,656 | 15.7 | ||||||||
Information Technology | 11,507 | 6.8 | ||||||||
Materials | 1,203 | 0.7 | ||||||||
Utilities | 3,374 | 2.0 | ||||||||
Short-Term Investment | 2,519 | 1.5 | ||||||||
|
|
|
| |||||||
Total investments | $ | 170,027 | 100.0 | % | ||||||
|
|
|
| |||||||
| TRADING CURRENCIES | ||||||||||
| Dollar values in thousands | ||||||||||
| Value | Percentage of Total Investments | |||||||||
CAD | $ | 9,014 | 5.3 | % | ||||||
CHF | 5,203 | 3.1 | ||||||||
CNY | 1,863 | 1.1 | ||||||||
DKK | 4,532 | 2.7 | ||||||||
EUR | 28,898 | 17.0 | ||||||||
GBP | 12,219 | 7.2 | ||||||||
HKD | 3,374 | 2.0 | ||||||||
INR | 2,127 | 1.2 | ||||||||
JPY | 4,687 | 2.7 | ||||||||
NOK | 1,129 | 0.7 | ||||||||
RUB | 0 | 0.0 | ||||||||
SEK | 4,053 | 2.4 | ||||||||
SGD | 1,064 | 0.6 | ||||||||
USD | 91,864 | 54.0 | ||||||||
|
|
|
| |||||||
Total investments | $ | 170,027 | 100.0 | % | ||||||
|
|
|
| |||||||
| TOP TEN HOLDINGS | ||||||||||
Company Name | Country | Percentage of Total Net Assets | ||||||||
Halozyme Therapeutics, Inc. | United States | 4.5 | % | |||||||
Shell plc | Netherlands | 4.4 | ||||||||
Schlumberger NV | United States | 4.4 | ||||||||
Alphabet, Inc. | United States | 3.8 | ||||||||
Argenx SE | Netherlands | 3.5 | ||||||||
Amazon.com, Inc. | United States | 3.5 | ||||||||
T-Mobile US, Inc. | United States | 3.3 | ||||||||
Canadian Pacific Railway Ltd. | Canada | 3.2 | ||||||||
EQT Corp. | United States | 2.7 | ||||||||
Darling Ingredients, Inc. | United States | 2.3 | ||||||||
|
| |||||||||
Total | 35.6 | % | ||||||||
|
| |||||||||
Definitions of abbreviations and footnotes are detailed on page 28.
The accompanying notes are an integral part of the financial statements.
| Artisan Partners Funds | 43 |
Artisan Global Opportunities Fund
Schedule of Investments – September 30, 2022
Shares and dollar values in thousands
| Shares Held | Value | |||||||||
| COMMON STOCKS - 95.8% | ||||||||||
| BRAZIL - 1.0% | ||||||||||
NU Holdings Ltd., Class A* | 7,524 | $ | 33,106 | |||||||
| DENMARK - 5.1% | ||||||||||
Genmab A/S*(1) | 138 | 44,592 | ||||||||
Novo Nordisk A/S, Class B(1) | 778 | 77,544 | ||||||||
Vestas Wind Systems A/S(1) | 2,106 | 38,616 | ||||||||
|
| |||||||||
| 160,752 | ||||||||||
| GERMANY - 1.5% | ||||||||||
BioNTech SE, ADR | 233 | 31,404 | ||||||||
Volkswagen AG (Preference)(1) | 120 | 14,823 | ||||||||
|
| |||||||||
| 46,227 | ||||||||||
| HONG KONG - 6.2% | ||||||||||
AIA Group Ltd.(1) | 6,879 | 57,110 | ||||||||
Techtronic Industries Co. Ltd.(1) | 14,930 | 141,048 | ||||||||
|
| |||||||||
| 198,158 | ||||||||||
| JAPAN - 3.7% | ||||||||||
Hoya Corp.(1) | 506 | 48,601 | ||||||||
Keyence Corp.(1) | 206 | 68,260 | ||||||||
|
| |||||||||
| 116,861 | ||||||||||
| NETHERLANDS - 1.6% | ||||||||||
Adyen NV*(1) | 27 | 33,340 | ||||||||
Koninklijke DSM NV(1) | 149 | 16,926 | ||||||||
|
| |||||||||
| 50,266 | ||||||||||
| SPAIN - 0.5% | ||||||||||
Banco Bilbao Vizcaya Argentaria SA(1) | 3,926 | 17,635 | ||||||||
| SWEDEN - 3.9% | ||||||||||
Hexagon AB, Class B(1) | 6,431 | 59,627 | ||||||||
Telefonaktiebolaget LM Ericsson, Class B(1) | 10,919 | 63,592 | ||||||||
|
| |||||||||
| 123,219 | ||||||||||
| SWITZERLAND - 7.1% | ||||||||||
Cie Financiere Richemont SA(1) | 156 | 14,672 | ||||||||
Lonza Group AG(1) | 247 | 119,916 | ||||||||
UBS Group AG(1) | 6,196 | 89,510 | ||||||||
|
| |||||||||
| 224,098 | ||||||||||
| UNITED KINGDOM - 6.8% | ||||||||||
AstraZeneca plc(1) | 771 | 84,744 | ||||||||
CNH Industrial NV(1) | 6,452 | 72,035 | ||||||||
London Stock Exchange Group plc(1) | 703 | 59,321 | ||||||||
|
| |||||||||
| 216,100 | ||||||||||
| UNITED STATES - 58.4% | ||||||||||
Advanced Micro Devices, Inc.* | 2,282 | 144,616 | ||||||||
Airbnb, Inc., Class A* | 659 | 69,247 | ||||||||
Alphabet, Inc., Class A* | 1,265 | 121,018 | ||||||||
Aptiv plc* | 475 | 37,149 | ||||||||
Arista Networks, Inc.* | 603 | 68,066 | ||||||||
Atlassian Corp. plc, Class A* | 598 | 125,998 | ||||||||
Boston Scientific Corp.* | 3,272 | 126,723 | ||||||||
Charles Schwab Corp. (The) | 1,364 | 98,014 | ||||||||
Chipotle Mexican Grill, Inc.* | 52 | 77,711 | ||||||||
Danaher Corp. | 329 | 84,957 | ||||||||
Fidelity National Information Services, Inc. | 692 | 52,260 | ||||||||
Generac Holdings, Inc.* | 117 | 20,842 | ||||||||
Ingersoll Rand, Inc. | 1,687 | 72,971 | ||||||||
Lowe’s Cos., Inc. | 257 | 48,293 | ||||||||
Lululemon Athletica, Inc.* | 253 | 70,664 | ||||||||
Microsoft Corp. | 181 | 42,067 | ||||||||
| UNITED STATES (CONTINUED) | ||||||||||
NextEra Energy, Inc. | 2,225 | 174,426 | ||||||||
ON Semiconductor Corp.* | 1,592 | 99,237 | ||||||||
Progressive Corp. (The) | 640 | 74,432 | ||||||||
S&P Global, Inc. | 51 | 15,482 | ||||||||
SVB Financial Group* | 99 | 33,253 | ||||||||
Tesla, Inc.* | 145 | 38,345 | ||||||||
Veeva Systems, Inc., Class A* | 956 | 157,665 | ||||||||
|
| |||||||||
| 1,853,436 | ||||||||||
Total common stocks |
| 3,039,858 | ||||||||
| SHORT-TERM INVESTMENT - 3.4% | ||||||||||
| INVESTMENT COMPANY - 3.4% | ||||||||||
BlackRock Liquidity Funds Treasury Trust Fund - Institutional Class, 2.81% (Cost $107,854) | 107,854 | 107,854 | ||||||||
|
| |||||||||
Total investments - 99.2% |
| 3,147,712 | ||||||||
Other assets less liabilities - 0.8% |
| 26,353 | ||||||||
|
| |||||||||
Total net assets - 100.0%# |
| $ | 3,174,065 | |||||||
|
| |||||||||
| (1) | Valued at a fair value in accordance with procedures established by the board of directors of Artisan Partners Funds. In total, securities valued at a fair value were $1,121,912, or 35.3% of total net assets. See notes 2(a) and 4 in Notes to Financial Statements for additional information. |
| PORTFOLIO DIVERSIFICATION | ||||||||||
| Dollar values in thousands | ||||||||||
| Value | Percentage of Total Investments | |||||||||
Communication Services | $ | 121,018 | 3.8 | % | ||||||
Consumer Discretionary | 370,904 | 11.8 | ||||||||
Financials | 477,863 | 15.2 | ||||||||
Health Care | 776,146 | 24.7 | ||||||||
Industrials | 345,512 | 11.0 | ||||||||
Information Technology | 757,063 | 24.1 | ||||||||
Materials | 16,926 | 0.5 | ||||||||
Utilities | 174,426 | 5.5 | ||||||||
Short-Term Investment | 107,854 | 3.4 | ||||||||
|
|
|
| |||||||
Total investments | $ | 3,147,712 | 100.0 | % | ||||||
|
|
|
| |||||||
| TRADING CURRENCIES | ||||||||||
| Dollar values in thousands | ||||||||||
| Value | Percentage of Total Investments | |||||||||
CHF | $ | 224,098 | 7.1 | % | ||||||
DKK | 160,752 | 5.1 | ||||||||
EUR | 154,759 | 4.9 | ||||||||
GBP | 144,065 | 4.6 | ||||||||
HKD | 198,158 | 6.3 | ||||||||
JPY | 116,861 | 3.7 | ||||||||
SEK | 123,219 | 3.9 | ||||||||
USD | 2,025,800 | 64.4 | ||||||||
|
|
|
| |||||||
Total investments | $ | 3,147,712 | 100.0 | % | ||||||
|
|
|
| |||||||
| 44 | Artisan Partners Funds |
| TOP TEN HOLDINGS | |||||||
Company Name | Country | Percentage of Total Net Assets | |||||
NextEra Energy, Inc. | United States | 5.5 | % | ||||
Veeva Systems, Inc. | United States | 5.0 | |||||
Advanced Micro Devices, Inc. | United States | 4.6 | |||||
Techtronic Industries Co. Ltd. | Hong Kong | 4.4 | |||||
Boston Scientific Corp. | United States | 4.0 | |||||
Atlassian Corp. plc | United States | 4.0 | |||||
Alphabet, Inc. | United States | 3.8 | |||||
Lonza Group AG | Switzerland | 3.8 | |||||
ON Semiconductor Corp. | United States | 3.1 | |||||
Charles Schwab Corp. (The) | United States | 3.1 | |||||
|
| ||||||
Total | 41.3 | % | |||||
|
| ||||||
Definitions of abbreviations and footnotes are detailed on page 28.
The accompanying notes are an integral part of the financial statements.
| Artisan Partners Funds | 45 |
Artisan Global Unconstrained Fund
Schedule of Investments – September 30, 2022
Principal amount, shares and values in thousands and reported in USD unless otherwise stated
| Principal Amount | Market Value | |||||||||
| SOVEREIGN GOVERNMENT BONDS - 60.3% | ||||||||||
| Albania - 1.2% | ||||||||||
Republic of Albania | EUR | 200 | $ | 177 | ||||||
| Angola - 2.6% | ||||||||||
Republic of Angola | ||||||||||
(ICE LIBOR USD 6 Month + 7.50%), 10.45%, 7/1/2023(1) | $ | 300 | 301 | |||||||
6.93%, 2/19/2027 | 103 | 92 | ||||||||
|
| |||||||||
| 393 | ||||||||||
|
| |||||||||
| Armenia - 1.0% | ||||||||||
Republic of Armenia 3.60%, 2/2/2031 | 210 | 142 | ||||||||
| Bahamas - 1.1% | ||||||||||
Commonwealth of the Bahamas 5.75%, 1/16/2024 | 199 | 163 | ||||||||
| Benin - 1.8% | ||||||||||
Benin Government Bond 4.88%, 1/19/2032 | EUR | 400 | 267 | |||||||
| Brazil - 0.6% | ||||||||||
Notas do Tesouro Nacional 10.00%, 1/1/2031 | BRL | 540 | 90 | |||||||
| Cameroon - 2.6% | ||||||||||
Republic of Cameroon 9.50%, 11/19/2025 | 400 | 392 | ||||||||
| Colombia - 1.8% | ||||||||||
Republic of Colombia 2.63%, 3/15/2023 | 275 | 271 | ||||||||
| Dominican Republic - 6.2% | ||||||||||
Dominican Republic Government Bond | ||||||||||
8.90%, 2/15/2023 | DOP | 22,350 | 416 | |||||||
11.50%, 5/10/2024 | DOP | 4,700 | 89 | |||||||
9.75%, 6/5/2026 | DOP | 5,500 | 99 | |||||||
4.88%, 9/23/2032 | 300 | 226 | ||||||||
5.30%, 1/21/2041 | 150 | 101 | ||||||||
|
| |||||||||
| 931 | ||||||||||
|
| |||||||||
| Egypt - 4.2% | ||||||||||
Arab Republic of Egypt | ||||||||||
4.75%, 4/16/2026 | EUR | 750 | 518 | |||||||
8.75%, 9/30/2051 | 200 | 110 | ||||||||
|
| |||||||||
| 628 | ||||||||||
|
| |||||||||
| El Salvador - 0.5% | ||||||||||
Republic of El Salvador 7.75%, 1/24/2023 | 85 | 77 | ||||||||
| Iceland - 4.6% | ||||||||||
Republic of Iceland 7.25%, 10/26/2022 | ISK | 100,445 | 697 | |||||||
| Iraq - 4.5% | ||||||||||
Republic of Iraq 6.75%, 3/9/2023 | 400 | 388 | ||||||||
5.80%, 1/15/2028 | $ | 358 | 293 | |||||||
|
| |||||||||
| 681 | ||||||||||
|
| |||||||||
| Ivory Coast - 2.2% | ||||||||||
Republic of Cote d’Ivoire |
| |||||||||
5.38%, 7/23/2024 | 215 | 193 | ||||||||
4.88%, 1/30/2032 | EUR | 200 | 131 | |||||||
|
| |||||||||
| 324 | ||||||||||
|
| |||||||||
| Kenya - 2.0% | ||||||||||
Republic of Kenya | 400 | 307 | ||||||||
| Macedonia - 4.3% | ||||||||||
Republic of North Macedonia | ||||||||||
5.63%, 7/26/2023 | EUR | 580 | 563 | |||||||
2.75%, 1/18/2025 | EUR | 100 | 89 | |||||||
|
| |||||||||
| 652 | ||||||||||
|
| |||||||||
| Mongolia - 1.6% | ||||||||||
State of Mongolia 8.75%, 3/9/2024 | 260 | 246 | ||||||||
| Nigeria - 1.7% | ||||||||||
Nigeria Government Bond 7.63%, 11/21/2025(3) | 286 | 247 | ||||||||
| Paraguay - 2.9% | ||||||||||
Republic of Paraguay | ||||||||||
4.63%, 1/25/2023 | 115 | 114 | ||||||||
3.85%, 6/28/2033 | 200 | 157 | ||||||||
6.10%, 8/11/2044 | 200 | 166 | ||||||||
|
| |||||||||
| 437 | ||||||||||
|
| |||||||||
| Peru - 0.7% | ||||||||||
Republic of Peru 6.15%, 8/12/2032 | PEN | 500 | 104 | |||||||
| Romania - 2.6% | ||||||||||
Romania Government Bond | ||||||||||
6.63%, 9/27/2029(3) | EUR | 130 | 121 | |||||||
3.62%, 5/26/2030 | EUR | 270 | 199 | |||||||
4.63%, 4/3/2049 | EUR | 100 | 64 | |||||||
|
| |||||||||
| 384 | ||||||||||
|
| |||||||||
| Serbia - 3.9% | ||||||||||
Republic of Serbia |
| |||||||||
3.13%, 5/15/2027 | EUR | 200 | 160 | |||||||
1.50%, 6/26/2029 | EUR | 200 | 129 | |||||||
1.65%, 3/3/2033 | EUR | 550 | 297 | |||||||
|
| |||||||||
| 586 | ||||||||||
|
| |||||||||
| Tunisia - 0.5% | ||||||||||
Tunisian Republic 6.75%, 10/31/2023 | EUR | 100 | 74 | |||||||
| Uzbekistan - 3.0% | ||||||||||
Republic of Uzbekistan | ||||||||||
14.50%, 11/25/2023 | UZS | 2,800,000 | 244 | |||||||
5.38%, 2/20/2029 | 250 | 209 | ||||||||
|
| |||||||||
| 453 | ||||||||||
|
| |||||||||
| Zambia - 2.2% | ||||||||||
Republic of Zambia 11.00%, 6/17/2024 | ZMW | 2,796 | 153 | |||||||
10.00%, 6/28/2024 | ZMW | 2,033 | 111 | |||||||
10.00%, 9/20/2024 | ZMW | 1,378 | 73 | |||||||
|
| |||||||||
| 337 | ||||||||||
|
| |||||||||
Total sovereign government bonds |
| 9,060 | ||||||||
| CORPORATE BONDS - 10.8% | ||||||||||
| BRAZIL - 2.5% | ||||||||||
Cosan Overseas Ltd. 8.25%, 11/5/2022(2) | $ | 100 | 99 | |||||||
MC Brazil Downstream Trading SARL 7.25%, 6/30/2031 | 200 | 151 | ||||||||
Unigel Luxembourg SA 8.75%, 10/1/2026 | 140 | 133 | ||||||||
|
| |||||||||
| 383 | ||||||||||
| CHILE - 1.1% | ||||||||||
ATP Tower Holdings LLC 4.05%, 4/27/2026(3) | 200 | 159 | ||||||||
| CHINA - 0.4% | ||||||||||
CAR, Inc. 9.75%, 3/31/2024 | 72 | 60 | ||||||||
| 46 | Artisan Partners Funds |
| Principal Amount | Market Value | |||||||||
| COLOMBIA - 2.5% | ||||||||||
Aris Mining Corp. 6.88%, 8/9/2026 | $ | 200 | $ | 145 | ||||||
EnfraGen Energia Sur SA 5.38%, 12/30/2030 | 130 | 77 | ||||||||
Gran Tierra Energy International Holdings Ltd. 6.25%, 2/15/2025 | 179 | 148 | ||||||||
|
| |||||||||
| 370 | ||||||||||
| CZECH REPUBLIC - 0.6% | ||||||||||
Energo-Pro A/S 4.50%, 5/4/2024 | EUR | 100 | 90 | |||||||
| MEXICO - 1.0% | ||||||||||
Electricidad Firme de Mexico Holdings SA de CV 4.90%, 11/20/2026 | $ | 186 | 152 | |||||||
| PERU - 1.6% | ||||||||||
Inkia Energy Ltd. 5.88%, 11/9/2027 | 151 | 139 | ||||||||
PetroTal Corp. 12.00%, 2/16/2024(3) | 100 | 102 | ||||||||
|
| |||||||||
| 241 | ||||||||||
| TANZANIA - 1.1% | ||||||||||
HTA Group Ltd. 7.00%, 12/18/2025(3) | 200 | 173 | ||||||||
|
| |||||||||
Total corporate bonds |
| 1,628 | ||||||||
| Shares Held | Value | |||||||||
| EXCHANGE TRADED FUNDS - 0.2% | ||||||||||
| EQUITY FUNDS | ||||||||||
SPDR S&P 500 ETF Trust | – | ^ | $ | 32 | ||||||
|
| |||||||||
Total exchange traded funds | 32 | |||||||||
| No. of Contracts‡ | Market Value | |||||||||
| OPTIONS PURCHASED - 0.0%^ | ||||||||||
| PUT INTEREST RATE SWAPTIONS - 0.0%^ | ||||||||||
Option to enter into interest rate swap expiring 4/12/2024 to pay 4% and receive 1D SOFR (Cost $2) | 100 | 4 | ||||||||
|
| |||||||||
Total options purchased |
| 4 | ||||||||
| Principal Amount | Value | |||||||||
| SHORT-TERM INVESTMENTS - 35.2% | ||||||||||
| U.S. TREASURY OBLIGATIONS - 18.7% | ||||||||||
U.S. Treasury Bills | ||||||||||
0.60%, 10/04/2022(4) | $ | 1,500 | 1,500 | |||||||
1.78%, 10/11/2022(4) | 1,300 | 1,299 | ||||||||
|
| |||||||||
Total U.S. treasury obligations |
| 2,799 | ||||||||
| REPURCHASE AGREEMENTS - 14.8% | ||||||||||
JPMorgan Chase Bank, N.A., Dated 9/26/2022 with an interest rate of 2.10% payable by the Portfolio, collateralized by Par 600 Republic of Guatemala, 4.50% due 5/3/2026 and a market value of $566(6) | 639 | 639 | ||||||||
JPMorgan Chase Bank, N.A., Dated 9/26/2022 with an interest rate of 2.70% payable by the Portfolio, collateralized by Par 550 Oriental Republic of Uruguay, 4.38% due 10/27/2027 and a market value of $543(6) | 602 | 602 | ||||||||
JPMorgan Chase Bank, N.A., Dated 9/26/2022 with an interest rate of 2.00% payable by the portfolio, collateralized by Par 500 Republic of Paraguay, 4.70% due 3/27/2027 and a market value of $471(6) | 545 | 545 | ||||||||
JPMorgan Chase Bank, N.A., Dated 9/26/2022 with an interest rate of 1.50% payable by the portfolio, collateralized by Par 550 Arab Republic of Egypt, 3.88% due 2/16/2026 and a market value of $398(6) | 442 | 443 | ||||||||
|
| |||||||||
Total repurchase agreements |
| 2,229 | ||||||||
| Shares Held | Value | |||||||||
| INVESTMENT COMPANIES - 1.7% | ||||||||||
BlackRock Liquidity Funds Treasury Trust Fund - Institutional Class, 2.81% | 88 | 88 | ||||||||
Federated Treasury Obligations Fund - Institutional Class, 2.85% | 85 | 85 | ||||||||
Fidelity Investments Money Market Treasury Portfolio - Institutional Class, 2.89% | 86 | 86 | ||||||||
|
| |||||||||
Total investment companies |
| 259 | ||||||||
Total short-term investments | 5,287 | |||||||||
Total investments - 106.5% |
| 16,011 | ||||||||
| Principal Amount | Market Value | |||||||||
| SECURITIES SOLD SHORT - (13.2)% | ||||||||||
| SOVEREIGN GOVERNMENT BONDS - (13.2)% | ||||||||||
| EGYPT - (2.7)% | ||||||||||
Arab Republic of Egypt 3.88%, 2/16/2026(5) | $ | (550 | ) | $ | (398 | ) | ||||
| GUATEMALA - (3.8)% | ||||||||||
Republic of Guatemala 4.50%, 5/3/2026(5) | (600 | ) | (566 | ) | ||||||
| PARAGUAY - (3.1)% | ||||||||||
Republic of Paraguay 4.70%, 3/27/2027(5) | (500 | ) | (471 | ) | ||||||
| URUGUAY - (3.6)% | ||||||||||
Oriental Republic of Uruguay 4.38%, 10/27/2027(5) | (550 | ) | (543 | ) | ||||||
|
| |||||||||
Total sovereign government bonds |
| (1,978 | ) | |||||||
Total securities sold short |
| (1,978 | ) | |||||||
Other assets less liabilities - 6.7% |
| 1,002 | ||||||||
|
| |||||||||
Total net assets - 100.0%# |
| $ | 15,035 | |||||||
|
| |||||||||
| (1) | Variable or floating rate security, linked to the referenced benchmark. The interest rate shown is the current rate as of September 30, 2022. |
| (2) | Perpetual security. The rate reflected was the rate in effect on September 30, 2022. The maturity date reflects the next call date. |
| (3) | Security exempt from registration pursuant to Rule 144A under the Securities Act of 1933. May be resold in transactions exempt from registration, normally to qualified institutional buyers. |
| (4) | Yield to maturity. |
| (5) | At September 30, 2022, all or a portion of this security was pledged to cover collateral requirements for repurchase agreements. |
| (6) | Open repurchase agreement with no specific maturity date. Either party may terminate the agreement upon demand. |
| Artisan Partners Funds | 47 |
| PORTFOLIO DIVERSIFICATION | ||||||||||
| Dollar values in thousands | ||||||||||
| Value | Percentage of Total Investments | |||||||||
Energy | $ | 590 | 3.7 | % | ||||||
Foreign Government Securities | 9,060 | 56.6 | ||||||||
Industrials | 392 | 2.5 | ||||||||
Investment Funds | 32 | 0.2 | ||||||||
Materials | 278 | 1.7 | ||||||||
Options Purchased | 4 | 0.0 | ||||||||
Utilities | 368 | 2.3 | ||||||||
Short-Term Investment | 5,287 | 33.0 | ||||||||
|
|
|
| |||||||
Total investments | $ | 16,011 | 100.0 | % | ||||||
|
|
|
| |||||||
| TRADING CURRENCIES | ||||||||||
| Dollar values in thousands | ||||||||||
| Value | Percentage of Total Investments | |||||||||
BRL | $ | 90 | 0.6 | % | ||||||
DOP | 604 | 3.7 | ||||||||
EUR | 2,879 | 18.0 | ||||||||
ISK | 697 | 4.4 | ||||||||
PEN | 104 | 0.6 | ||||||||
USD | 11,056 | 69.1 | ||||||||
UZS | 244 | 1.5 | ||||||||
ZMW | 337 | 2.1 | ||||||||
|
|
|
| |||||||
Total investments | $ | 16,011 | 100.0 | % | ||||||
|
|
|
| |||||||
| FOREIGN CURRENCY FORWARD CONTRACTS | ||||||||||||||||||||||||||||
| Values in thousands | ||||||||||||||||||||||||||||
Currency Purchased | Currency Sold | Counterparty | Settlement Date | Unrealized Appreciation (Depreciation) | ||||||||||||||||||||||||
| USD | 97 | BRL | ** | 492 | JPM | 10/4/2022 | $ | 6 | ||||||||||||||||||||
| USD | 326 | UGX | ** | 1,251,330 | SCB | 10/4/2022 | 1 | |||||||||||||||||||||
| USD | 113 | PEN | ** | 438 | JPM | 10/11/2022 | 4 | |||||||||||||||||||||
| RSD | 17,750 | EUR | 150 | JPM | 10/24/2022 | 1 | ||||||||||||||||||||||
| RSD | 16,000 | EUR | 135 | SCB | 10/24/2022 | 1 | ||||||||||||||||||||||
| UZS** | 2,971,581 | USD | 263 | JPM | 11/4/2022 | 7 | (1) | |||||||||||||||||||||
| KZT** | 194,510 | USD | 395 | SCB | 12/9/2022 | 5 | ||||||||||||||||||||||
| USD | 4,292 | EUR | 4,266 | SCB | 12/21/2022 | 85 | ||||||||||||||||||||||
| UZS** | 300,000 | USD | 26 | JPM | 12/27/2022 | 1 | (1) | |||||||||||||||||||||
| GBP | 285 | EUR | 314 | SCB | 12/30/2022 | 8 | ||||||||||||||||||||||
| USD | 627 | ZAR | 11,338 | SCB | 1/6/2023 | 6 | ||||||||||||||||||||||
| USD | 128 | UGX | ** | 560,000 | SCB | 6/18/2024 | 2 | |||||||||||||||||||||
|
| |||||||||||||||||||||||||||
| Total unrealized appreciation | 127 | |||||||||||||||||||||||||||
|
| |||||||||||||||||||||||||||
| BRL** | 853 | USD | 159 | SCB | 10/4/2022 | (1 | ) | |||||||||||||||||||||
| UGX** | 124,330 | USD | 34 | JPM | 10/4/2022 | (2 | ) | |||||||||||||||||||||
| UGX** | 1,127,000 | USD | 303 | SCB | 10/4/2022 | (11 | ) | |||||||||||||||||||||
| RON | 1,978 | EUR | 405 | JPM | 10/6/2022 | (6 | ) | |||||||||||||||||||||
| BRL** | 361 | USD | 67 | JPM | 11/3/2022 | – | ^ | |||||||||||||||||||||
| HUF | 232,231 | EUR | 560 | SCB | 12/2/2022 | (22 | ) | |||||||||||||||||||||
| PLN | 962 | EUR | 200 | SCB | 12/6/2022 | (5 | ) | |||||||||||||||||||||
| EUR | 62 | USD | 62 | SCB | 12/21/2022 | (1 | ) | |||||||||||||||||||||
| USD | 113 | EUR | 117 | SCB | 12/21/2022 | (3 | ) | |||||||||||||||||||||
| USD | 154 | UGX | ** | 700,000 | SCB | 6/18/2024 | (3 | ) | ||||||||||||||||||||
|
| |||||||||||||||||||||||||||
| Total unrealized depreciation | (54 | ) | ||||||||||||||||||||||||||
|
| |||||||||||||||||||||||||||
| Net unrealized appreciation | $ | 73 | ||||||||||||||||||||||||||
|
| |||||||||||||||||||||||||||
| ** | Non-deliverable. |
| (1) | Valued using significant unobservable inputs and is classified as Level 3 in the fair value hierarchy. |
| FUTURES CONTRACTS | ||||||||||||||||||||||||||||||
| Dollar values in thousands | ||||||||||||||||||||||||||||||
| Description | No. of Contracts | Expiration Date | Trading Currency | Notional Amount | Notional Value | Unrealized Appreciation | ||||||||||||||||||||||||
Short Positions Contracts |
| |||||||||||||||||||||||||||||
Euro-Bobl | (14 | ) | 12/8/2022 | EUR | $ | (1,400 | ) | $ | (1,643 | ) | $ | 36 | ||||||||||||||||||
Euro-Bund | (4 | ) | 12/8/2022 | EUR | (400 | ) | (543 | ) | 16 | |||||||||||||||||||||
Euro-Schatz | (7 | ) | 12/8/2022 | EUR | (700 | ) | (735 | ) | 6 | |||||||||||||||||||||
S&P 500 E-Mini Index | (1 | ) | 12/16/2022 | USD | (50 | ) | (180 | ) | 21 | |||||||||||||||||||||
U.S. Treasury 2 Year Note | (13 | ) | 12/30/2022 | USD | (2,600 | ) | (2,670 | ) | 40 | |||||||||||||||||||||
U.S. Treasury 10 Year Note | (10 | ) | 12/20/2022 | USD | (1,000 | ) | (1,121 | ) | 54 | |||||||||||||||||||||
U.S. Treasury 10 Year Ultra Note | (1 | ) | 12/20/2022 | USD | (100 | ) | (118 | ) | 7 | |||||||||||||||||||||
U.S. Treasury Long Bond | (1 | ) | 12/20/2022 | USD | (100 | ) | (126 | ) | 10 | |||||||||||||||||||||
|
| |||||||||||||||||||||||||||||
| $ | 190 | |||||||||||||||||||||||||||||
|
| |||||||||||||||||||||||||||||
The Fund has recorded an asset of $78 as of September 30, 2022, related to the current day’s variation margin related to these contracts.
| 48 | Artisan Partners Funds |
| Centrally Cleared Credit Default Swap-Buy Protection | ||||||||||||||
| (Dollar values in thousands) | ||||||||||||||
| Reference Entity | Financing | Frequency of | Termination Date | Notional Amount | Upfront | Unrealized | Value | |||||||
| Hungary | 1.00 | Quarterly | 6/20/2027 | USD 965 | 40 | 12 | 52 | |||||||
| Kingdom of Saudi Arabia | 1.00 | Quarterly | 6/20/2032 | USD1,070 | (12) | 3 | (9) | |||||||
| Kingdom of Spain | 1.00 | Quarterly | 6/20/2032 | USD 570 | (12) | 8 | (4) | |||||||
| Petrobras Global Finance BV | 1.00 | Quarterly | 12/20/2027 | USD 210 | 20 | –^ | 20 | |||||||
| Republic of Chile | 1.00 | Quarterly | 6/20/2032 | USD 650 | 37 | 23 | 60 | |||||||
| Republic of Indonesia | 1.00 | Quarterly | 12/20/2027 | USD 790 | 5 | 15 | 20 | |||||||
| Republic of Peru | 1.00 | Quarterly | 6/20/2032 | USD 300 | 15 | 13 | 28 | |||||||
| Republic of Poland | 1.00 | Quarterly | 6/20/2027 | USD 325 | 3 | 2 | 5 | |||||||
| Republic of South Africa | 1.00 | Quarterly | 6/20/2032 | USD 765 | 110 | 49 | 159 | |||||||
|
|
| ||||||||||||
| 206 | 125 | 331 | ||||||||||||
|
|
| ||||||||||||
| Centrally Cleared Credit Default Swap-Sell Protection | ||||||||||||||
| (Dollar values in thousands) | ||||||||||||||
| Reference Entity | Financing | Frequency of | Termination Date | Notional Amount | Upfront | Unrealized | Value | |||||||
| Emirate of Abu Dhabi | 1.00 | Quarterly | 6/20/2027 | USD 290 | 6 | –^ | 6 | |||||||
| Republic of South Africa | 1.00 | Quarterly | 6/20/2023 | USD 135 | (1) | –^ | (1) | |||||||
|
|
| ||||||||||||
| 5 | –^ | 5 | ||||||||||||
|
|
| ||||||||||||
| Total | 211 | 125 | 336 | |||||||||||
|
|
| ||||||||||||
The Fund has recorded a liability of $12 as of September 30, 2022, related to the current day’s variation margin related to these contracts.
| Centrally Cleared Interest Rate Swaps | ||||||||||||||
| (Values in thousands) | ||||||||||||||
| Floating Rate Index (Frequency) | Fixed Rate (%) | Fund Pays/ | Termination | Notional | Upfront | Unrealized | Value | |||||||
| 6 month WIBOR semi-annually | 5.30 annually | Receive | 4/15/2032 | PLN 536 | – | 11 | 11 | |||||||
| 6 month PRIBOR semi-annually | 3.86 annually | Receive | 4/4/2032 | CZK 2,710 | – | 11 | 11 | |||||||
| 3 month JIBAR quarterly | 7.26 quarterly | Receive | 4/28/2027 | ZAR 4,485 | – | 13 | 13 | |||||||
| 6 month WIBOR semi-annually | 6.45 annually | Receive | 5/13/2032 | PLN 225 | – | 1 | 1 | |||||||
| 6 month BUBOR semi-annually | 7.25 annually | Receive | 5/13/2032 | HUF 8,300 | – | 3 | 3 | |||||||
| 6 month PRIBOR semi-annually | 4.99 annually | Receive | 5/13/2032 | CZK 2,800 | – | 1 | 1 | |||||||
| 6 month BUBOR semi-annually | 8.16 annually | Receive | 6/17/2032 | HUF 103,300 | 12 | 10 | 22 | |||||||
| 3 month JIBAR quarterly | 7.98 quarterly | Receive | 6/15/2027 | ZAR 1,100 | – | 2 | 2 | |||||||
| 1 day THOR quarterly | 2.89 quarterly | Receive | 6/17/2032 | THB 2,750 | – | 1 | 1 | |||||||
| 1 day THOR quarterly | 2.59 quarterly | Receive | 9/1/2032 | THB 2,150 | – | 3 | 3 | |||||||
| 1 day CDI at termination | 11.39 at termination | Pay | 1/2/2032 | BRL 325 | – | 1 | 1 | |||||||
| 1 day THOR quarterly | 2.99 quarterly | Receive | 9/26/2032 | THB 5,300 | – | 1 | 1 | |||||||
|
|
| ||||||||||||
| Total unrealized appreciation | 12 | 58 | 70 | |||||||||||
|
|
| ||||||||||||
| 4 week TIIE monthly | 8.75 monthly | Pay | 5/18/2032 | MXN 2,235 | –^ | (3) | (3) | |||||||
| 6 month PRIBOR semi-annually | 5.75 annually | Receive | 6/17/2032 | CZK 2,360 | (2) | (3) | (5) | |||||||
| 6 month WIBOR semi-annually | 7.45 annually | Receive | 6/20/2032 | PLN 350 | (1) | (2) | (3) | |||||||
| 4 week TIIE monthly | 8.73 monthly | Pay | 6/21/2032 | MXN 1,300 | – | (1) | (1) | |||||||
| 4 week TIIE monthly | 8.72 monthly | Pay | 9/1/2032 | MXN 3,400 | – | (5) | (5) | |||||||
| 3 month JIBAR quarterly | 9.63 quarterly | Receive | 9/28/2032 | ZAR 1,350 | – | –^ | –^ | |||||||
|
|
| ||||||||||||
| Total unrealized depreciation | (3) | (14) | (17) | |||||||||||
|
|
| ||||||||||||
| Total | 9 | 44 | 53 | |||||||||||
|
|
| ||||||||||||
The Fund has recorded a liability of $2 as of September 30, 2022, related to the current day’s variation margin related to these contracts.
| Artisan Partners Funds | 49 |
| TOP TEN HOLDINGS | |||||||
Company Name | Country | Percentage of Total Net Assets | |||||
Dominican Republic Government Bond | Dominican Republic | 6.2 | % | ||||
Republic of Iceland | Iceland | 4.6 | |||||
Republic of Iraq | Iraq | 4.5 | |||||
Republic of North Macedonia | Macedonia, the Former Yugoslav Republic of | 4.3 | |||||
Arab Republic of Egypt | Egypt | 4.2 | |||||
Republic of Serbia | Serbia | 3.9 | |||||
Republic of Uzbekistan | Uzbekistan | 3.0 | |||||
Republic of Angola | Angola | 2.6 | |||||
Republic of Cameroon | Cameroon | 2.6 | |||||
Romania Government Bond | Romania | 2.6 | |||||
|
| ||||||
Total | 38.5 | % | |||||
|
| ||||||
Definitions of abbreviations and footnotes are detailed on page 28.
The accompanying notes are an integral part of the financial statements.
| 50 | Artisan Partners Funds |
Schedule of Investments – September 30, 2022
Shares and dollar values in thousands
| Shares Held | Value | |||||||||
| COMMON STOCKS - 96.1% | ||||||||||
| BELGIUM - 1.5% | ||||||||||
Groupe Bruxelles Lambert NV(1) | 386 | $ | 26,798 | |||||||
| BRAZIL - 1.1% | ||||||||||
Telefonica Brasil SA, ADR | 2,753 | 20,704 | ||||||||
| CANADA - 1.4% | ||||||||||
Imperial Oil Ltd. | 598 | 25,887 | ||||||||
| CHINA - 3.0% | ||||||||||
Alibaba Group Holding Ltd.*(1) | 3,526 | 35,366 | ||||||||
Alibaba Group Holding Ltd., ADR* | 211 | 16,841 | ||||||||
NXP Semiconductors NV | 12 | 1,816 | ||||||||
|
| |||||||||
| 54,023 | ||||||||||
| FRANCE - 6.7% | ||||||||||
Danone SA(1) | 1,741 | 82,020 | ||||||||
Sodexo SA(1) | 336 | 25,273 | ||||||||
TotalEnergies SE(1) | 294 | 13,830 | ||||||||
TotalEnergies SE, ADR | 28 | 1,285 | ||||||||
|
| |||||||||
| 122,408 | ||||||||||
| GERMANY - 3.9% | ||||||||||
Daimler Truck Holding AG*(1) | 810 | 18,540 | ||||||||
HeidelbergCement AG(1) | 1,286 | 51,522 | ||||||||
|
| |||||||||
| 70,062 | ||||||||||
| JAPAN - 3.0% | ||||||||||
Nintendo Co. Ltd.(1) | 1,339 | 54,220 | ||||||||
| NETHERLANDS - 6.0% | ||||||||||
ING Groep NV(1) | 2,688 | 23,046 | ||||||||
Koninklijke Philips NV(1) | 2,801 | 43,259 | ||||||||
Shell plc(1) | 1,736 | 43,199 | ||||||||
|
| |||||||||
| 109,504 | ||||||||||
| SOUTH KOREA - 3.9% | ||||||||||
Samsung Electronics Co. Ltd.(1) | 1,945 | 71,470 | ||||||||
| SWITZERLAND - 11.8% | ||||||||||
Cie Financiere Richemont SA(1) | 497 | 46,631 | ||||||||
Novartis AG(1) | 1,192 | 90,852 | ||||||||
Swatch Group AG (The)(1) | 13 | 2,978 | ||||||||
UBS Group AG(1) | 5,135 | 74,175 | ||||||||
|
| |||||||||
| 214,636 | ||||||||||
| UNITED KINGDOM - 8.7% | ||||||||||
BAE Systems plc(1) | 5,909 | 51,920 | ||||||||
Compass Group plc(1) | 3,858 | 77,125 | ||||||||
Lloyds Banking Group plc(1) | 65,248 | 29,809 | ||||||||
|
| |||||||||
| 158,854 | ||||||||||
| UNITED STATES - 45.1% | ||||||||||
Advance Auto Parts, Inc. | 134 | 20,913 | ||||||||
Alphabet, Inc., Class A* | 691 | 66,137 | ||||||||
American Express Co. | 425 | 57,310 | ||||||||
Bank of New York Mellon Corp. (The) | 1,971 | 75,919 | ||||||||
Berkshire Hathaway, Inc., Class B* | 268 | 71,669 | ||||||||
Citigroup, Inc. | 1,399 | 58,283 | ||||||||
Dentsply Sirona, Inc. | 1,063 | 30,148 | ||||||||
Elevance Health, Inc. | 229 | 103,931 | ||||||||
Expedia Group, Inc.* | 401 | 37,538 | ||||||||
Lam Research Corp. | 80 | 29,440 | ||||||||
Marsh & McLennan Cos., Inc. | 351 | 52,375 | ||||||||
| UNITED STATES (CONTINUED) | ||||||||||
Meta Platforms, Inc., Class A* | 406 | 55,029 | ||||||||
Progressive Corp. (The) | 528 | 61,363 | ||||||||
Sensata Technologies Holding plc | 518 | 19,296 | ||||||||
Southwest Airlines Co.* | 1,049 | 32,354 | ||||||||
Willis Towers Watson plc | 239 | 48,056 | ||||||||
|
| |||||||||
| 819,761 | ||||||||||
|
| |||||||||
Total common stocks |
| 1,748,327 | ||||||||
| SHORT-TERM INVESTMENT - 2.9% | ||||||||||
| INVESTMENT COMPANY - 2.9% | ||||||||||
BlackRock Liquidity Funds Treasury Trust Fund - Institutional Class, 2.81% | 52,414 | 52,414 | ||||||||
|
| |||||||||
Total investments - 99.0% |
| 1,800,741 | ||||||||
Other assets less liabilities - 1.0% |
| 17,384 | ||||||||
|
| |||||||||
Total net assets - 100.0%# |
| $ | 1,818,125 | |||||||
|
| |||||||||
| (1) | Valued at a fair value in accordance with procedures established by the board of directors of Artisan Partners Funds. In total, securities valued at a fair value were $862,033, or 47.4% of total net assets. See notes 2(a) and 4 in Notes to Financial Statements for additional information. |
| PORTFOLIO DIVERSIFICATION | ||||||||||
| Dollar values in thousands | ||||||||||
| Value | Percentage of Total Investments | |||||||||
Communication Services | $ | 196,090 | 10.9 | % | ||||||
Consumer Discretionary | 262,665 | 14.6 | ||||||||
Consumer Staples | 82,020 | 4.5 | ||||||||
Energy | 84,201 | 4.7 | ||||||||
Financials | 578,803 | 32.1 | ||||||||
Health Care | 268,190 | 14.9 | ||||||||
Industrials | 122,110 | 6.8 | ||||||||
Information Technology | 102,726 | 5.7 | ||||||||
Materials | 51,522 | 2.9 | ||||||||
Short-Term Investment | 52,414 | 2.9 | ||||||||
|
|
|
| |||||||
Total investments | $ | 1,800,741 | 100.0 | % | ||||||
|
|
|
| |||||||
| TRADING CURRENCIES | ||||||||||
| Dollar values in thousands | ||||||||||
| Value | Percentage of Total Investments | |||||||||
CAD | $ | 25,887 | 1.4 | % | ||||||
CHF | 214,636 | 11.9 | ||||||||
EUR | 284,288 | 15.8 | ||||||||
GBP | 202,053 | 11.2 | ||||||||
HKD | 35,366 | 2.0 | ||||||||
JPY | 54,220 | 3.0 | ||||||||
KRW | 71,470 | 4.0 | ||||||||
USD | 912,821 | 50.7 | ||||||||
|
|
|
| |||||||
Total investments | $ | 1,800,741 | 100.0 | % | ||||||
|
|
|
| |||||||
| Artisan Partners Funds | 51 |
| TOP TEN HOLDINGS | |||||||
Company Name | Country | Percentage of Total Net Assets | |||||
Elevance Health, Inc. | United States | 5.7 | % | ||||
Novartis AG | Switzerland | 5.0 | |||||
Danone SA | France | 4.5 | |||||
Compass Group plc | United Kingdom | 4.2 | |||||
Bank of New York Mellon Corp. (The) | United States | 4.2 | |||||
UBS Group AG | Switzerland | 4.1 | |||||
Berkshire Hathaway, Inc. | United States | 3.9 | |||||
Samsung Electronics Co. Ltd. | South Korea | 3.9 | |||||
Alphabet, Inc. | United States | 3.6 | |||||
Progressive Corp. (The) | United States | 3.4 | |||||
|
| ||||||
Total | 42.5 | % | |||||
|
| ||||||
Definitions of abbreviations and footnotes are detailed on page 28.
The accompanying notes are an integral part of the financial statements.
| 52 | Artisan Partners Funds |
Schedule of Investments – September 30, 2022
Principal amount, shares and values in thousands and reported in USD unless otherwise stated
| Principal Amount | Value | |||||||||
| CORPORATE BONDS - 72.4% | ||||||||||
| ADVERTISING - 0.2% | ||||||||||
CMG Media Corp. 8.88%, 12/15/2027(1) | $ | 15,947 | $ | 12,183 | ||||||
| AEROSPACE/DEFENSE - 0.9% | ||||||||||
Bombardier, Inc. | ||||||||||
6.00%, 2/15/2028(1)(2) | 51,291 | 42,914 | ||||||||
7.13%, 6/15/2026(1)(2) | 8,689 | 7,969 | ||||||||
TransDigm, Inc. | ||||||||||
4.63%, 1/15/2029 | 470 | 378 | ||||||||
|
| |||||||||
| 51,261 | ||||||||||
| AIRLINES - 1.6% | ||||||||||
Delta Air Lines, Inc. | ||||||||||
3.75%, 10/28/2029 | 47,512 | 36,917 | ||||||||
4.38%, 4/19/2028 | 9,849 | 8,301 | ||||||||
7.38%, 1/15/2026 | 47,394 | 47,909 | ||||||||
|
| |||||||||
| 93,127 | ||||||||||
| BUILDING MATERIALS - 0.6% | ||||||||||
Eco Material Technologies, Inc. | ||||||||||
7.88%, 1/31/2027(1) | 21,037 | 18,631 | ||||||||
New Enterprise Stone & Lime Co., Inc. | ||||||||||
5.25%, 7/15/2028(1) | 4,361 | 3,605 | ||||||||
9.75%, 7/15/2028(1) | 14,000 | 11,809 | ||||||||
|
| |||||||||
| 34,045 | ||||||||||
| CHEMICALS - 3.2% | ||||||||||
Consolidated Energy Finance SA | ||||||||||
5.63%, 10/15/2028(1)(2) | 17,085 | 13,706 | ||||||||
Diamond BC BV | ||||||||||
4.63%, 10/1/2029(1) | 31,093 | 21,635 | ||||||||
EverArc Escrow SARL | ||||||||||
5.00%, 10/30/2029(1) | 31,571 | 25,486 | ||||||||
Iris Holding, Inc. | ||||||||||
10.00%, 12/15/2028(1) | 37,718 | 30,895 | ||||||||
LSF11 A5 HoldCo LLC | ||||||||||
6.63%, 10/15/2029(1) | 8,542 | 6,407 | ||||||||
Methanex Corp. | ||||||||||
5.13%, 10/15/2027(2) | 28,114 | 23,616 | ||||||||
5.25%, 12/15/2029(2) | 81,326 | 64,646 | ||||||||
5.65%, 12/1/2044(2) | 4,854 | 3,252 | ||||||||
|
| |||||||||
| 189,643 | ||||||||||
| COMMERCIAL SERVICES - 0.2% | ||||||||||
PECF USS Intermediate Holding III Corp. | ||||||||||
8.00%, 11/15/2029(1) | 16,154 | 11,780 | ||||||||
| DISTRIBUTION/WHOLESALE - 0.1% | ||||||||||
American Builders & Contractors Supply Co., Inc. | ||||||||||
3.88%, 11/15/2029(1) | 3,705 | 2,902 | ||||||||
| DIVERSIFIED FINANCIAL SERVICES - 6.3% | ||||||||||
AG Issuer LLC | ||||||||||
6.25%, 3/1/2028(1) | 44,996 | 38,926 | ||||||||
AG TTMT Escrow Issuer LLC | ||||||||||
8.63%, 9/30/2027(1) | 14,564 | 13,690 | ||||||||
NFP Corp. | ||||||||||
4.88%, 8/15/2028(1) | 26,065 | 22,242 | ||||||||
6.88%, 8/15/2028(1) | 210,016 | 163,812 | ||||||||
VistaJet Malta Finance plc | ||||||||||
6.38%, 2/1/2030(1)(2) | 110,149 | 90,047 | ||||||||
7.88%, 5/1/2027(1)(2) | 38,637 | 34,734 | ||||||||
|
| |||||||||
| 363,451 | ||||||||||
| ELECTRONICS - 0.1% | ||||||||||
Sensata Technologies BV | ||||||||||
5.88%, 9/1/2030(1) | 8,422 | 7,880 | ||||||||
| ENERGY-ALTERNATE SOURCES - 0.4% | ||||||||||
Sunnova Energy Corp. | ||||||||||
5.88%, 9/1/2026(1) | 28,481 | 25,449 | ||||||||
| ENGINEERING & CONSTRUCTION - 0.5% | ||||||||||
Signature Aviation US Holdings, Inc. | ||||||||||
4.00%, 3/1/2028(1) | 32,372 | 30,124 | ||||||||
| ENTERTAINMENT - 1.1% | ||||||||||
Jacobs Entertainment, Inc. | ||||||||||
6.75%, 2/15/2029(1) | 26,793 | 22,924 | ||||||||
Motion Bondco DAC | ||||||||||
6.63%, 11/15/2027(1)(2) | 4,227 | 3,577 | ||||||||
Penn Entertainment, Inc. | ||||||||||
4.13%, 7/1/2029(1) | 28,417 | 21,752 | ||||||||
SeaWorld Parks & Entertainment, Inc. | ||||||||||
5.25%, 8/15/2029(1) | 16,424 | 13,639 | ||||||||
Warnermedia Holdings, Inc. | ||||||||||
4.28%, 3/15/2032(1) | 420 | 345 | ||||||||
5.14%, 3/15/2052(1) | 1,678 | 1,220 | ||||||||
|
| |||||||||
| 63,457 | ||||||||||
| FOOD - 1.0% | ||||||||||
B&G Foods, Inc. | ||||||||||
5.25%, 9/15/2027 | 10,154 | 8,227 | ||||||||
H-Food Holdings LLC | ||||||||||
8.50%, 6/1/2026(1) | 79,712 | 50,602 | ||||||||
|
| |||||||||
| 58,829 | ||||||||||
| FOOD SERVICE - 1.1% | ||||||||||
TKC Holdings, Inc. | ||||||||||
6.88%, 5/15/2028(1) | 16,184 | 13,072 | ||||||||
10.50%, 5/15/2029(1) | 65,171 | 49,845 | ||||||||
|
| |||||||||
| 62,917 | ||||||||||
| FOREST PRODUCTS & PAPER - 0.3% | ||||||||||
Ahlstrom-Munksjo Holding 3 Oy | ||||||||||
4.88%, 2/4/2028(1)(2) | 21,125 | 16,781 | ||||||||
| HAND/MACHINE TOOLS - 0.7% | ||||||||||
Werner FinCo LP | ||||||||||
8.75%, 7/15/2025(1) | 46,856 | 39,828 | ||||||||
| HEALTHCARE-PRODUCTS - 2.1% | ||||||||||
Medline Borrower LP | ||||||||||
3.88%, 4/1/2029(1) | 138,407 | 110,959 | ||||||||
5.25%, 10/1/2029(1) | 12,842 | 9,696 | ||||||||
|
| |||||||||
| 120,655 | ||||||||||
| HEALTHCARE-SERVICES - 0.4% | ||||||||||
HCA, Inc. |
| |||||||||
3.50%, 9/1/2030 | 12,810 | 10,578 | ||||||||
Surgery Center Holdings, Inc. |
| |||||||||
6.75%, 7/1/2025(1) | 8,955 | 8,276 | ||||||||
|
| |||||||||
| 18,854 | ||||||||||
| HOME FURNISHINGS - 0.2% | ||||||||||
Tempur Sealy International, Inc. |
| |||||||||
3.88%, 10/15/2031(1) | 17,543 | 12,850 | ||||||||
| Artisan Partners Funds | 53 |
| Principal Amount | Value | |||||||||
| INSURANCE - 9.0% | ||||||||||
Acrisure LLC |
| |||||||||
4.25%, 2/15/2029(1) | $ | 23,420 | $ | 18,354 | ||||||
6.00%, 8/1/2029(1) | 94,545 | 72,799 | ||||||||
7.00%, 11/15/2025(1) | 92,952 | 84,902 | ||||||||
10.13%, 8/1/2026(1) | 48,540 | 46,720 | ||||||||
Alliant Holdings Intermediate LLC |
| |||||||||
4.25%, 10/15/2027(1) | 2,569 | 2,194 | ||||||||
5.88%, 11/1/2029(1) | 15,595 | 12,667 | ||||||||
6.75%, 10/15/2027(1) | 10,008 | 8,625 | ||||||||
Ardonagh Midco 2 plc |
| |||||||||
11.50% Cash, 12.75% PIK, 1/15/2027(1)(2) | 134,315 | 136,330 | ||||||||
AssuredPartners, Inc. |
| |||||||||
7.00%, 8/15/2025(1) | 25,180 | 23,251 | ||||||||
BroadStreet Partners, Inc. |
| |||||||||
5.88%, 4/15/2029(1) | 67,061 | 52,811 | ||||||||
GTCR AP Finance, Inc. |
| |||||||||
8.00%, 5/15/2027(1) | 58,606 | 53,914 | ||||||||
Highlands Holdings Bond Issuer Ltd. |
| |||||||||
7.63% Cash, 8.38% PIK, 10/15/2025(1)(2) | 10,082 | 9,502 | ||||||||
Ryan Specialty Group LLC |
| |||||||||
4.38%, 2/1/2030(1) | 6,905 | 5,856 | ||||||||
|
| |||||||||
| 527,925 | ||||||||||
| INTERNET - 2.1% | ||||||||||
Arches Buyer, Inc. |
| |||||||||
4.25%, 6/1/2028(1) | 123,040 | 95,971 | ||||||||
Cars.com, Inc. |
| |||||||||
6.38%, 11/1/2028(1) | 17,239 | 14,696 | ||||||||
Millennium Escrow Corp. |
| |||||||||
6.63%, 8/1/2026(1) | 9,223 | 7,291 | ||||||||
|
| |||||||||
| 117,958 | ||||||||||
| IRON/STEEL - 0.9% | ||||||||||
Big River Steel LLC |
| |||||||||
6.63%, 1/31/2029(1) | 36,266 | 33,379 | ||||||||
Commercial Metals Co. |
| |||||||||
3.88%, 2/15/2031 | 3,461 | 2,714 | ||||||||
4.13%, 1/15/2030 | 11,253 | 9,239 | ||||||||
4.38%, 3/15/2032 | 9,352 | 7,388 | ||||||||
|
| |||||||||
| 52,720 | ||||||||||
| LEISURE TIME - 6.9% | ||||||||||
Carnival Corp. |
| |||||||||
4.00%, 8/1/2028(1) | 13,445 | 10,847 | ||||||||
5.75%, 3/1/2027(1) | 110,287 | 77,261 | ||||||||
6.00%, 5/1/2029(1) | 83,290 | 54,686 | ||||||||
7.63%, 3/1/2026(1) | 7,882 | 5,990 | ||||||||
10.50%, 6/1/2030(1) | 18,945 | 15,156 | ||||||||
Lindblad Expeditions LLC |
| |||||||||
6.75%, 2/15/2027(1) | 30,844 | 27,143 | ||||||||
MajorDrive Holdings IV LLC |
| |||||||||
6.38%, 6/1/2029(1) | 13,223 | 9,117 | ||||||||
NCL Corp. Ltd. |
| |||||||||
3.63%, 12/15/2024(1) | 17,414 | 14,644 | ||||||||
5.88%, 3/15/2026(1) | 47,354 | 36,024 | ||||||||
5.88%, 2/15/2027(1) | 6,824 | 5,681 | ||||||||
7.75%, 2/15/2029(1) | 35,092 | 26,484 | ||||||||
NCL Finance Ltd. |
| |||||||||
6.13%, 3/15/2028(1) | 73,123 | 53,926 | ||||||||
Royal Caribbean Cruises Ltd. |
| |||||||||
4.25%, 7/1/2026(1) | 19,431 | 14,283 | ||||||||
5.38%, 7/15/2027(1) | 8,553 | 6,291 | ||||||||
5.50%, 8/31/2026(1) | 26,365 | 20,169 | ||||||||
5.50%, 4/1/2028(1) | 35,497 | 24,871 | ||||||||
|
| |||||||||
| 402,573 | ||||||||||
| LODGING - 0.9% | ||||||||||
Boyd Gaming Corp. |
| |||||||||
4.75%, 6/15/2031(1) | 9,302 | 7,532 | ||||||||
| LODGING (CONTINUED) | ||||||||||
MGM Resorts International |
| |||||||||
4.63%, 9/1/2026 | 4,248 | 3,757 | ||||||||
4.75%, 10/15/2028 | 35,704 | 29,879 | ||||||||
5.50%, 4/15/2027 | 2,223 | 1,997 | ||||||||
Station Casinos LLC |
| |||||||||
4.63%, 12/1/2031(1) | 16,806 | 12,693 | ||||||||
|
| |||||||||
| 55,858 | ||||||||||
| MEDIA - 10.3% | ||||||||||
CCO Holdings LLC |
| |||||||||
4.25%, 2/1/2031(1) | 51,560 | 39,549 | ||||||||
4.25%, 1/15/2034(1) | 24,208 | 17,328 | ||||||||
4.50%, 8/15/2030(1) | 68,770 | 54,386 | ||||||||
4.50%, 5/1/2032 | 87,786 | 66,952 | ||||||||
4.75%, 3/1/2030(1) | 31,605 | 25,639 | ||||||||
CSC Holdings LLC |
| |||||||||
4.50%, 11/15/2031(1) | 8,967 | 6,736 | ||||||||
4.63%, 12/1/2030(1) | 78,174 | 53,158 | ||||||||
5.25%, 6/1/2024 | 15,676 | 14,500 | ||||||||
5.38%, 2/1/2028(1) | 6,632 | 5,787 | ||||||||
6.50%, 2/1/2029(1) | 12,161 | 10,732 | ||||||||
7.50%, 4/1/2028(1) | 57,856 | 47,209 | ||||||||
Sinclair Television Group, Inc. |
| |||||||||
5.13%, 2/15/2027(1) | 47,938 | 39,650 | ||||||||
5.50%, 3/1/2030(1) | 83,118 | 59,736 | ||||||||
UPC Holding BV |
| |||||||||
5.50%, 1/15/2028(1)(2) | 2,774 | 2,330 | ||||||||
Virgin Media Finance plc |
| |||||||||
5.00%, 7/15/2030(1)(2) | 81,273 | 59,768 | ||||||||
Virgin Media Secured Finance plc |
| |||||||||
4.50%, 8/15/2030(1)(2) | 22,046 | 17,206 | ||||||||
5.50%, 5/15/2029(1)(2) | 27,393 | 23,452 | ||||||||
Virgin Media Vendor Financing Notes IV DAC | ||||||||||
5.00%, 7/15/2028(1)(2) | 17,967 | 14,531 | ||||||||
Ziggo Bond Co. BV |
| |||||||||
5.13%, 2/28/2030(1)(2) | 7,967 | 5,696 | ||||||||
6.00%, 1/15/2027(1)(2) | 27,070 | 22,604 | ||||||||
Ziggo BV |
| |||||||||
4.88%, 1/15/2030(1)(2) | 24,246 | 19,154 | ||||||||
|
| |||||||||
| 606,103 | ||||||||||
| MINING - 1.0% | ||||||||||
Compass Minerals International, Inc. |
| |||||||||
4.88%, 7/15/2024(1) | 10,392 | 9,769 | ||||||||
6.75%, 12/1/2027(1) | 52,402 | 49,246 | ||||||||
|
| |||||||||
| 59,015 | ||||||||||
| OIL & GAS - 5.2% | ||||||||||
Callon Petroleum Co. |
| |||||||||
8.00%, 8/1/2028(1) | 101,921 | 94,022 | ||||||||
8.25%, 7/15/2025 | 3,046 | 2,961 | ||||||||
CrownRock LP |
| |||||||||
5.00%, 5/1/2029(1) | 25,862 | 22,818 | ||||||||
Laredo Petroleum, Inc. |
| |||||||||
7.75%, 7/31/2029(1) | 89,440 | 82,409 | ||||||||
10.13%, 1/15/2028 | 8,612 | 8,268 | ||||||||
MEG Energy Corp. |
| |||||||||
5.88%, 2/1/2029(1)(2) | 33,922 | 30,445 | ||||||||
SM Energy Co. |
| |||||||||
5.63%, 6/1/2025 | 8,964 | 8,605 | ||||||||
6.50%, 7/15/2028 | 19,447 | 18,481 | ||||||||
6.63%, 1/15/2027 | 4,218 | 4,049 | ||||||||
Strathcona Resources Ltd. |
| |||||||||
6.88%, 8/1/2026(1)(2) | 33,591 | 28,469 | ||||||||
|
| |||||||||
| 300,527 | ||||||||||
| PACKAGING & CONTAINERS - 0.4% | ||||||||||
Clydesdale Acquisition Holdings, Inc. |
| |||||||||
8.75%, 4/15/2030(1) | 20,692 | 17,113 | ||||||||
| 54 | Artisan Partners Funds |
| Principal Amount | Value | |||||||||
| PACKAGING & CONTAINERS (CONTINUED) | ||||||||||
Sealed Air Corp. |
| |||||||||
5.00%, 4/15/2029(1) | $ | 4,531 | $ | 4,044 | ||||||
|
| |||||||||
| 21,157 | ||||||||||
| PHARMACEUTICALS - 1.4% | ||||||||||
BellRing Brands, Inc. |
| |||||||||
7.00%, 3/15/2030(1) | 69,183 | 63,282 | ||||||||
Prestige Brands, Inc. |
| |||||||||
3.75%, 4/1/2031(1) | 21,328 | 16,570 | ||||||||
|
| |||||||||
| 79,852 | ||||||||||
| REAL ESTATE - 0.4% | ||||||||||
Realogy Group LLC |
| |||||||||
5.75%, 1/15/2029(1) | 29,421 | 21,220 | ||||||||
| REAL ESTATE INVESTMENT TRUSTS (REITS) - 2.0% | ||||||||||
Global Net Lease, Inc. |
| |||||||||
3.75%, 12/15/2027(1) | 50,616 | 39,481 | ||||||||
Iron Mountain, Inc. |
| |||||||||
5.00%, 7/15/2028(1) | 1,919 | 1,650 | ||||||||
5.25%, 7/15/2030(1) | 14,936 | 12,359 | ||||||||
Necessity Retail REIT, Inc. |
| |||||||||
4.50%, 9/30/2028(1) | 31,343 | 23,359 | ||||||||
Uniti Group LP |
| |||||||||
4.75%, 4/15/2028(1) | 17,806 | 14,066 | ||||||||
XHR LP |
| |||||||||
4.88%, 6/1/2029(1) | 29,209 | 24,083 | ||||||||
|
| |||||||||
| 114,998 | ||||||||||
| RETAIL - 5.5% | ||||||||||
Asbury Automotive Group, Inc. |
| |||||||||
4.63%, 11/15/2029(1) | 17,053 | 13,632 | ||||||||
Bath & Body Works, Inc. |
| |||||||||
6.63%, 10/1/2030(1) | 8,389 | 7,298 | ||||||||
6.75%, 7/1/2036 | 9,581 | 7,895 | ||||||||
6.88%, 11/1/2035 | 23,874 | 19,944 | ||||||||
Brinker International, Inc. |
| |||||||||
5.00%, 10/1/2024(1) | 25,349 | 24,355 | ||||||||
Gap, Inc. (The) |
| |||||||||
3.63%, 10/1/2029(1) | 34,357 | 22,332 | ||||||||
3.88%, 10/1/2031(1) | 23,637 | 15,027 | ||||||||
Group 1 Automotive, Inc. |
| |||||||||
4.00%, 8/15/2028(1) | 7,540 | 6,071 | ||||||||
LCM Investments Holdings II LLC |
| |||||||||
4.88%, 5/1/2029(1) | 26,332 | 20,391 | ||||||||
Nordstrom, Inc. |
| |||||||||
4.00%, 3/15/2027 | 16,561 | 13,663 | ||||||||
4.25%, 8/1/2031 | 7,410 | 5,076 | ||||||||
4.38%, 4/1/2030 | 48,672 | 35,610 | ||||||||
5.00%, 1/15/2044 | 98,226 | 60,777 | ||||||||
Patrick Industries, Inc. |
| |||||||||
4.75%, 5/1/2029(1) | 6,869 | 5,120 | ||||||||
Specialty Building Products Holdings LLC |
| |||||||||
6.38%, 9/30/2026(1) | 15,437 | 12,774 | ||||||||
SRS Distribution, Inc. |
| |||||||||
6.00%, 12/1/2029(1) | 48,122 | 38,378 | ||||||||
6.13%, 7/1/2029(1) | 2,803 | 2,251 | ||||||||
Superior Plus LP |
| |||||||||
4.25%, 5/18/2028(1)(2) | CAD 6,705 | 4,223 | ||||||||
4.50%, 3/15/2029(1)(2) | 1,684 | 1,391 | ||||||||
|
| |||||||||
| 316,208 | ||||||||||
| SOFTWARE - 0.3% | ||||||||||
Castle US Holding Corp. |
| |||||||||
9.50%, 2/15/2028(1) | 25,953 | 19,075 | ||||||||
| TELECOMMUNICATIONS - 5.1% | ||||||||||
Altice France Holding SA |
| |||||||||
6.00%, 2/15/2028(1)(2) | 87,835 | 55,716 | ||||||||
10.50%, 5/15/2027(1)(2) | 25,971 | 20,342 | ||||||||
| TELECOMMUNICATIONS (CONTINUED) | ||||||||||
Altice France SA |
| |||||||||
5.13%, 1/15/2029(1)(2) | 8,119 | 5,990 | ||||||||
5.13%, 7/15/2029(1)(2) | 8,550 | 6,388 | ||||||||
5.50%, 1/15/2028(1)(2) | 7,974 | 6,315 | ||||||||
5.50%, 10/15/2029(1)(2) | 98,372 | 74,013 | ||||||||
Level 3 Financing, Inc. |
| |||||||||
3.75%, 7/15/2029(1) | 1,710 | 1,253 | ||||||||
Maxar Technologies, Inc. |
| |||||||||
7.75%, 6/15/2027(1) | 37,548 | 35,290 | ||||||||
Sprint Capital Corp. |
| |||||||||
8.75%, 3/15/2032 | 8,536 | 9,891 | ||||||||
Vmed O2 UK Financing I plc |
| |||||||||
4.25%, 1/31/2031(1)(2) | 42,712 | 32,362 | ||||||||
Zayo Group Holdings, Inc. 4.00%, 3/1/2027(1) | 25,706 | 20,628 | ||||||||
6.13%, 3/1/2028(1) | 35,262 | 24,739 | ||||||||
|
| |||||||||
| 292,927 | ||||||||||
|
| |||||||||
Total corporate bonds |
| 4,204,132 | ||||||||
| BANK LOANS - 14.9% | ||||||||||
| AUTO PARTS & EQUIPMENT - 0.8% | ||||||||||
Wheel Pros, Inc. First Lien Term Loan (ICE LIBOR USD 1 Month + 4.50%), 7.55%, 5/11/2028(3) | 63,685 | 46,534 | ||||||||
| CHEMICALS - 0.5% | ||||||||||
CPC Acquisition Corp. First Lien Term Loan B (ICE LIBOR USD 3 Month + 3.75%), 7.42%, 12/29/2027(3) | 38,103 | 29,561 | ||||||||
| COMMERCIAL SERVICES - 2.7% | ||||||||||
Ankura Consulting Group LLC Second Lien Term Loan (ICE LIBOR USD 3 Month + 8.00%), 10.78%, 3/19/2029(3) | 17,830 | 14,977 | ||||||||
Digital Room Holdings, Inc. First Lien Term Loan B (ICE LIBOR USD 1 Month + 5.25%), 8.37%, 12/21/2028(3) | 29,054 | 26,052 | ||||||||
Employbridge Holding Co. First Lien Term Loan B (ICE LIBOR USD 3 Month + 4.75%), 8.42%, 7/19/2028(3) | 52,351 | 46,494 | ||||||||
National Intergovernmental Purchasing Alliance Co. Second Lien Term Loan (ICE LIBOR USD 3 Month + 7.50%), 9.75%, 5/26/2026(3) | 7,320 | 7,174 | ||||||||
New SK Holdco Sub LLC First Lien Term Loan (SOFR + 6.75%), 9.70%, 6/30/2027(3) | 66,746 | 60,071 | ||||||||
|
| |||||||||
| 154,768 | ||||||||||
| ENTERTAINMENT - 0.3% | ||||||||||
J&J Ventures Gaming LLC First Lien Term Loan (ICE LIBOR USD 3 Month + 4.00%), 7.67%, 4/26/2028(3) | 13,444 | 12,713 | ||||||||
Lucky Bucks LLC First Lien Term Loan B | ||||||||||
(ICE LIBOR USD 3 Month + 5.50%), 8.31%, 7/30/2027(3) | 4,145 | 3,046 | ||||||||
(ICE LIBOR USD 3 Month + 5.50%), 8.62%, 7/30/2027(3) | 1 | 1 | ||||||||
|
| |||||||||
| 15,760 | ||||||||||
| FOOD SERVICE - 1.3% | ||||||||||
TKC Holdings, Inc. First Lien Term Loan (ICE LIBOR USD 3 Month + 5.50%), 9.18%, 5/15/2028(3) | 68,762 | 58,414 | ||||||||
TKC Midco 1 LLC First Lien Term Loan 12.00% PIK, 2/15/2027 | 18,035 | 15,465 | ||||||||
|
| |||||||||
| 73,879 | ||||||||||
| HEALTHCARE-SERVICES - 0.5% | ||||||||||
Surgery Center Holdings, Inc. First Lien Term Loan (ICE LIBOR USD 1 Month + 3.75%), 6.51%, 8/31/2026(3) | 33,360 | 31,609 | ||||||||
| HOME FURNISHINGS - 0.2% | ||||||||||
Weber-Stephen Products LLC First Lien Term Loan B (ICE LIBOR USD 1 Month + 3.25%), 6.37%, 10/30/2027(3) | 16,689 | 13,482 | ||||||||
| HOUSEHOLD PRODUCTS/WARES - 0.0%^ | ||||||||||
VC GB Holdings I Corp. First Lien Term Loan (ICE LIBOR USD 3 Month + 3.50%), 6.38%, 7/21/2028(3) | 2,966 | 2,583 | ||||||||
| Artisan Partners Funds | 55 |
| Principal Amount | Value | |||||||||
| INTERNET - 0.2% | ||||||||||
Arches Buyer, Inc. First Lien Term Loan (ICE LIBOR USD 1 Month + 3.25%), 6.37%, 12/6/2027(3) | $ | 11,350 | $ | 10,179 | ||||||
| INVESTMENT COMPANIES - 1.0% | ||||||||||
Nexus Buyer LLC Second Lien Term Loan (ICE LIBOR USD 1 Month + 6.25%), 9.37%, 11/5/2029(3) | 59,570 | 56,095 | ||||||||
| LEISURE TIME - 0.2% | ||||||||||
NCL Corp., Ltd. First Lien Term Loan A (ICE LIBOR USD 3 Month + 1.75%), 5.42%, 1/2/2024(3) | 12,637 | 11,808 | ||||||||
| RETAIL - 0.5% | ||||||||||
Fogo De Chao, Inc. First Lien Term Loan (ICE LIBOR USD 1 Month + 4.25%), 7.37%, 4/7/2025(3) | 13,005 | 12,138 | ||||||||
Portillo’s Holdings LLC First Lien Term Loan (ICE LIBOR USD 1 Month + 5.50%), 8.62%, 9/6/2024(3) | 18,997 | 18,807 | ||||||||
|
| |||||||||
| 30,945 | ||||||||||
| SOFTWARE - 5.2% | ||||||||||
Applied Systems, Inc. Second Lien Term Loan (ICE LIBOR USD 3 Month + 5.50%), 9.17%, 9/19/2025(3) | 28,103 | 27,583 | ||||||||
Castle US Holding Corp. First Lien Term Loan B (ICE LIBOR USD 1 Month + 3.75%), 6.87%, 1/29/2027(3) | 4,896 | 3,917 | ||||||||
CommerceHub, Inc. Second Lien Term Loan B (ICE LIBOR USD 1 Month + 7.00%), 10.12%, 12/29/2028(3) | 10,610 | 8,409 | ||||||||
Constant Contact, Inc. Second Lien Term Loan (ICE LIBOR USD 3 Month + 7.50%), 9.92%, 2/12/2029(3) | 28,018 | 21,574 | ||||||||
Ivanti Software, Inc. Second Lien Term Loan (ICE LIBOR USD 3 Month + 7.25%), 10.33%, 12/1/2028(3) | 6,435 | 4,783 | ||||||||
Matrix Parent, Inc. First Lien Term Loan (SOFR + 5.00%), 8.10%, 3/1/2029(3) | 21,107 | 19,419 | ||||||||
Orchid Finco LLC First Lien Term Loan B (SOFR + 4.75%), 7.58%, 7/27/2027(3) | 25,221 | 23,834 | ||||||||
Renaissance Holdings Corp. First Lien Term Loan (ICE LIBOR USD 1 Month + 3.25%), 5.77%, 5/30/2025(3) | 61,929 | 58,755 | ||||||||
Renaissance Holdings Corp. Second Lien Term Loan (ICE LIBOR USD 1 Month + 7.00%), 10.12%, 5/29/2026(3) | 36,536 | 34,709 | ||||||||
UKG, Inc. Second Lien Term Loan (ICE LIBOR USD 3 Month + 5.25%), 7.54%, 5/3/2027(3) | 74,902 | 70,408 | ||||||||
Virgin Pulse, Inc. First Lien Term Loan B (ICE LIBOR USD 1 Month + 4.00%), 7.12%, 4/6/2028(3) | 34,885 | 30,292 | ||||||||
|
| |||||||||
| 303,683 | ||||||||||
| TELECOMMUNICATIONS - 0.9% | ||||||||||
Delta Topco, Inc. Second Lien Term Loan (ICE LIBOR USD 3 Month + 7.25%), 9.34%, 12/1/2028(3) | 35,575 | 31,128 | ||||||||
Gridiron Fiber Corp. First Lien Term Loan B (ICE LIBOR USD 3 Month + 4.50%), 8.17%, 10/4/2028(3) | 23,726 | 21,457 | ||||||||
|
| |||||||||
| 52,585 | ||||||||||
| TRANSPORTATION - 0.6% | ||||||||||
SIRVA Worldwide, Inc. First Lien Term Loan | ||||||||||
(ICE LIBOR USD 3 Month + 5.50%), 8.31%, 8/4/2025(3) | 6,013 | 5,411 | ||||||||
(ICE LIBOR USD 3 Month + 5.50%), 8.57%, 8/4/2025(3) | 4,749 | 4,274 | ||||||||
(ICE LIBOR USD 3 Month + 5.50%), 8.62%, 8/4/2025(3) | 26,669 | 24,003 | ||||||||
(ICE LIBOR USD 3 Month + 5.50%), 9.17%, 8/4/2025(3) | 800 | 720 | ||||||||
|
| |||||||||
| 34,408 | ||||||||||
|
| |||||||||
Total bank loans | 867,879 | |||||||||
| Shares Held | ||||||||||
| COMMON STOCK - 0.4% | ||||||||||
| MISCELLANEOUS MANUFACTURING - 0.4% | ||||||||||
Utex Equity | 364 | 24,386 | ||||||||
| No. of Warrants | Value | |||||||||
| WARRANTS - 0.0% | ||||||||||
| DIVERSIFIED FINANCIAL SERVICES - 0.0% | ||||||||||
Carnelian Point Holdings LP, expiring 6/30/2027, strike price 10 | 71 | – | ||||||||
| Shares Held | ||||||||||
| SHORT-TERM INVESTMENT - 10.5% | ||||||||||
| INVESTMENT COMPANY - 10.5% | ||||||||||
BlackRock Liquidity Funds Treasury Trust Fund - Institutional Class, 2.81% (Cost $607,917) | 607,917 | 607,917 | ||||||||
|
| |||||||||
Total investments - 98.2% | 5,704,314 | |||||||||
Other assets less liabilities - 1.8% | 104,758 | |||||||||
|
| |||||||||
Total net assets - 100.0%# | $ | 5,809,072 | ||||||||
|
| |||||||||
| (1) | Security exempt from registration pursuant to Rule 144A under the Securities Act of 1933. May be resold in transactions exempt from registration, normally to qualified institutional buyers. |
| (2) | The Fund considers the company to be from outside the United States. See the Fund’s Statement of Additional Information for a description of the methodology used for country classifications. |
| Security | Country | Trading Currency | ||||||||
Ahlstrom-Munksjo Holding 3 Oy, 4.88%, 2/4/2028 | Finland | USD | ||||||||
Altice France Holding SA, 6.00%, 2/15/2028 | Luxembourg | USD | ||||||||
Altice France Holding SA, 10.50%, 5/15/2027 | Luxembourg | USD | ||||||||
Altice France SA, 5.13%, 1/15/2029 | France | USD | ||||||||
Altice France SA, 5.13%, 7/15/2029 | France | USD | ||||||||
Altice France SA, 5.50%, 1/15/2028 | France | USD | ||||||||
Altice France SA, 5.50%, 10/15/2029 | France | USD | ||||||||
Ardonagh Midco 2 plc, 11.50% Cash, 12.75% PIK, 1/15/2027 | United Kingdom | USD | ||||||||
Bombardier, Inc., 6.00%, 2/15/2028 | Canada | USD | ||||||||
Bombardier, Inc., 7.13%, 6/15/2026 | Canada | USD | ||||||||
Consolidated Energy Finance SA, 5.63%, 10/15/2028 | Switzerland | USD | ||||||||
Highlands Holdings Bond Issuer Ltd., 7.63% Cash, 8.38% PIK, 10/15/2025 | Bermuda | USD | ||||||||
MEG Energy Corp., 5.88%, 2/1/2029 | Canada | USD | ||||||||
Methanex Corp., 5.65%, 12/1/2044 | Canada | USD | ||||||||
Methanex Corp., 5.25%, 12/15/2029 | Canada | USD | ||||||||
Methanex Corp., 5.13%, 10/15/2027 | Canada | USD | ||||||||
Motion Bondco DAC, 6.63%, 11/15/2027 | United Kingdom | USD | ||||||||
Strathcona Resources Ltd., 6.88%, 8/1/2026 | Canada | USD | ||||||||
Superior Plus LP, 4.25%, 5/18/2028 | Canada | CAD | ||||||||
Superior Plus LP, 4.50%, 3/15/2029 | Canada | USD | ||||||||
UPC Holding BV, 5.50%, 1/15/2028 | Netherlands | USD | ||||||||
Virgin Media Finance plc, 5.00%, 7/15/2030 | United Kingdom | USD | ||||||||
Virgin Media Secured Finance plc, 4.50%, 8/15/2030 | United Kingdom | USD | ||||||||
Virgin Media Secured Finance plc, 5.50%, 5/15/2029 | United Kingdom | USD | ||||||||
Virgin Media Vendor Financing Notes IV DAC, 5.00%, 7/15/2028 | United Kingdom | USD | ||||||||
VistaJet Malta Finance plc, 6.38%, 2/1/2030 | Switzerland | USD | ||||||||
VistaJet Malta Finance plc, 7.88%, 5/1/2027 | Switzerland | USD | ||||||||
Vmed O2 UK Financing I plc, 4.25%, 1/31/2031 | United Kingdom | USD | ||||||||
Ziggo Bond Co. BV, 5.13%, 2/28/2030 | Netherlands | USD | ||||||||
Ziggo Bond Co. BV, 6.00%, 1/15/2027 | Netherlands | USD | ||||||||
Ziggo BV, 4.88%, 1/15/2030 | Netherlands | USD | ||||||||
| (3) | Variable or floating rate security, linked to the referenced benchmark. The interest rate shown is the current rate as of September 30, 2022. |
| (4) | Defaulted securities. |
| (5) | Valued at a fair value in accordance with procedures established by the board of directors of Artisan Partners Funds. In total, securities valued at a fair value were $24,386, or 0.4% of total net assets. See notes 2(a) and 4 in Notes to Financial Statements for additional information. |
| 56 | Artisan Partners Funds |
| PORTFOLIO DIVERSIFICATION | ||||||||||
| Dollar values in thousands | ||||||||||
| Value | Percentage of Total Investments | |||||||||
Communication Services | $ | 960,529 | 16.8 | % | ||||||
Consumer Discretionary | 1,019,646 | 17.9 | ||||||||
Consumer Staples | 215,143 | 3.8 | ||||||||
Energy | 325,976 | 5.7 | ||||||||
Financials | 1,007,542 | 17.7 | ||||||||
Health Care | 171,118 | 3.0 | ||||||||
Industrials | 462,440 | 8.1 | ||||||||
Information Technology | 428,908 | 7.5 | ||||||||
Materials | 368,877 | 6.4 | ||||||||
Real Estate | 136,218 | 2.4 | ||||||||
Short-Term Investment | 607,917 | 10.7 | ||||||||
|
|
|
| |||||||
Total investments | $ | 5,704,314 | 100.0 | % | ||||||
|
|
|
| |||||||
| TRADING CURRENCIES | ||||||||||
| Dollar values in thousands | ||||||||||
| Value | Percentage of Total Investments | |||||||||
CAD | $ | 4,223 | 0.1 | % | ||||||
USD | 5,700,091 | 99.9 | ||||||||
|
|
|
| |||||||
Total investments | $ | 5,704,314 | 100.0 | % | ||||||
|
|
|
| |||||||
| FOREIGN CURRENCY FORWARD CONTRACTS | ||||||||||||||||||||||||||||
| Values in thousands | ||||||||||||||||||||||||||||
Currency Purchased | Currency Sold | Counterparty | Settlement Date | Unrealized Appreciation | ||||||||||||||||||||||||
| USD | 4,284 | CAD | 5,852 | BOA | 11/28/2022 | $ | 48 | |||||||||||||||||||||
|
| |||||||||||||||||||||||||||
| Total unrealized appreciation | $ | 48 | ||||||||||||||||||||||||||
|
| |||||||||||||||||||||||||||
| FUTURES CONTRACTS | ||||||||||||||||||||||||||||||||||
| Dollar values in thousands | ||||||||||||||||||||||||||||||||||
| Description | No. of Contracts | Expiration Date | Trading Currency | Notional Amount | Notional Value | Unrealized Appreciation | ||||||||||||||||||||||||||||
Short Positions Contracts |
| |||||||||||||||||||||||||||||||||
U.S. Treasury 10 Year Note | (55 | ) | 12/20/2022 | USD | $ | (5,500 | ) | $ | (6,163 | ) | $ | 305 | ||||||||||||||||||||||
U.S. Treasury Long Bond | (371 | ) | 12/20/2022 | USD | (37,100 | ) | (46,897 | ) | 3,984 | |||||||||||||||||||||||||
|
| |||||||||||||||||||||||||||||||||
Total unrealized depreciation | $ | 4,289 | ||||||||||||||||||||||||||||||||
|
| |||||||||||||||||||||||||||||||||
The Fund has recorded an asset of $253 as of September 30, 2022, related to the current day’s variation margin related to these contracts.
| TOP TEN HOLDINGS | ||||||||||
Company Name | Country | Percentage of Total Net Assets | ||||||||
Acrisure LLC | United States | 3.8 | % | |||||||
CCO Holdings LLC | United States | 3.5 | ||||||||
NFP Corp. | United States | 3.2 | ||||||||
Carnival Corp. | United States | 2.8 | ||||||||
CSC Holdings LLC | United States | 2.4 | ||||||||
Ardonagh Midco 2 plc | United Kingdom | 2.3 | ||||||||
VistaJet Malta Finance plc | Switzerland | 2.1 | ||||||||
Medline Borrower LP | United States | 2.1 | ||||||||
Nordstrom, Inc. | United States | 2.0 | ||||||||
Sinclair Television Group, Inc. | United States | 1.7 | ||||||||
|
| |||||||||
Total | 25.9 | % | ||||||||
|
| |||||||||
Definitions of abbreviations and footnotes are detailed on page 28.
The accompanying notes are an integral part of the financial statements.
| Artisan Partners Funds | 57 |
Schedule of Investments – September 30, 2022
Shares and dollar values in thousands
| Shares Held | Value | |||||||||
| COMMON STOCKS AND EQUITY-LINKED SECURITY - 96.0% | ||||||||||
| BELGIUM - 1.8% | ||||||||||
UCB SA(1) | 1,304 | $ | 90,157 | |||||||
| CANADA - 6.5% | ||||||||||
Canadian National Railway Co. | 904 | 97,658 | ||||||||
Canadian Pacific Railway Ltd. | 2,999 | 200,189 | ||||||||
Kinaxis, Inc.* | 264 | 26,183 | ||||||||
|
| |||||||||
| 324,030 | ||||||||||
| DENMARK - 3.0% | ||||||||||
Ascendis Pharma A/S, ADR* | 841 | 86,891 | ||||||||
Novo Nordisk A/S, ADR | 82 | 8,179 | ||||||||
Novo Nordisk A/S, Class B(1) | 571 | 56,940 | ||||||||
|
| |||||||||
| 152,010 | ||||||||||
| FRANCE - 13.6% | ||||||||||
Air Liquide SA(1) | 1,387 | 157,987 | ||||||||
Airbus SE(1) | 533 | 46,006 | ||||||||
BNP Paribas SA(1) | 4,866 | 205,433 | ||||||||
Capgemini SE(1) | 824 | 131,639 | ||||||||
LVMH Moet Hennessy Louis Vuitton SE(1) | 126 | 73,976 | ||||||||
Pernod Ricard SA(1) | 173 | 31,569 | ||||||||
Safran SA(1) | 357 | 32,485 | ||||||||
|
| |||||||||
| 679,095 | ||||||||||
| GERMANY - 14.9% | ||||||||||
Allianz SE(1) | 271 | 42,962 | ||||||||
Brenntag SE(1) | 663 | 40,468 | ||||||||
Deutsche Boerse AG(1) | 1,407 | 231,598 | ||||||||
Deutsche Post AG(1) | 2,701 | 82,198 | ||||||||
Deutsche Telekom AG(1) | 11,188 | 191,789 | ||||||||
Dr Ing hc F Porsche AG (Preference)*(1) | 550 | 44,472 | ||||||||
Porsche Automobil Holding SE (Preference)(1) | 197 | 11,224 | ||||||||
Volkswagen AG (Preference)(1) | 800 | 98,778 | ||||||||
|
| |||||||||
| 743,489 | ||||||||||
| INDIA - 1.6% | ||||||||||
Reliance Industries Ltd.(1) | 2,704 | 78,214 | ||||||||
| IRELAND - 2.1% | ||||||||||
Ryanair Holdings plc, Equity-Linked Security*(1)(2)(3) | 10,244 | 103,985 | ||||||||
| ITALY - 1.3% | ||||||||||
Intesa Sanpaolo SpA(1) | 41,156 | 67,739 | ||||||||
| JAPAN - 0.6% | ||||||||||
Toyota Industries Corp.(1) | 631 | 30,074 | ||||||||
| NETHERLANDS - 12.3% | ||||||||||
Argenx SE, ADR* | 510 | 179,951 | ||||||||
Argenx SE*(1) | 16 | 5,831 | ||||||||
ING Groep NV(1) | 14,459 | 123,980 | ||||||||
Koninklijke DSM NV(1) | 354 | 40,128 | ||||||||
Shell plc(1) | 10,361 | 257,774 | ||||||||
Shell plc, ADR | 99 | 4,905 | ||||||||
|
| |||||||||
| 612,569 | ||||||||||
| RUSSIA - 0.0% | ||||||||||
MMC Norilsk Nickel PJSC, ADR(1)(4)(7) | 4,881 | – | ||||||||
Sberbank of Russia PJSC*(1)(4)(7) | 38,445 | – | ||||||||
|
| |||||||||
| – | ||||||||||
| SINGAPORE - 0.6% | ||||||||||
DBS Group Holdings Ltd.(1) | 1,239 | 28,654 | ||||||||
| SPAIN - 1.1% | ||||||||||
Ferrovial SA(1) | 2,520 | 57,185 | ||||||||
| SWITZERLAND - 6.4% | ||||||||||
Alcon, Inc.(1) | 1,500 | 86,886 | ||||||||
Barry Callebaut AG(1) | 27 | 49,840 | ||||||||
Cie Financiere Richemont SA(1) | 1,109 | 104,079 | ||||||||
Medacta Group SA(1) | 356 | 29,969 | ||||||||
UBS Group AG(1) | 3,384 | 48,890 | ||||||||
|
| |||||||||
| 319,664 | ||||||||||
| UNITED KINGDOM - 12.6% | ||||||||||
BAE Systems plc(1) | 3,119 | 27,401 | ||||||||
Barclays plc(1) | 93,023 | 148,308 | ||||||||
Diageo plc(1) | 2,066 | 86,594 | ||||||||
International Consolidated Airlines Group SA*(1)(5) | 24,139 | 25,157 | ||||||||
Linde plc(1) | 844 | 230,709 | ||||||||
Tesco plc(1) | 24,104 | 55,191 | ||||||||
Unilever plc(1) | 1,291 | 56,821 | ||||||||
|
| |||||||||
| 630,181 | ||||||||||
| UNITED STATES - 17.6% | ||||||||||
Alphabet, Inc., Class A* | 1,154 | 110,406 | ||||||||
Alphabet, Inc., Class C* | 573 | 55,128 | ||||||||
Amazon.com, Inc.* | 1,297 | 146,553 | ||||||||
Aon plc, Class A | 598 | 160,314 | ||||||||
ICON plc* | 132 | 24,277 | ||||||||
Nestle SA(1) | 988 | 106,943 | ||||||||
Roche Holding AG(1) | 231 | 75,227 | ||||||||
Schlumberger NV | 5,529 | 198,507 | ||||||||
|
| |||||||||
| 877,355 | ||||||||||
|
| |||||||||
Total common stocks and equity-linked security |
| 4,794,401 | ||||||||
| SHORT-TERM INVESTMENTS - 4.5% | ||||||||||
| INVESTMENT COMPANIES - 4.5% | ||||||||||
BlackRock Liquidity FedFund - Institutional Shares, 2.00%(6) | 29,932 | 29,932 | ||||||||
BlackRock Liquidity Funds Treasury Trust Fund - Institutional Class, 2.81% | 194,114 | 194,114 | ||||||||
|
| |||||||||
Total investment companies |
| 224,046 | ||||||||
Total investments - 100.5% | 5,018,447 | |||||||||
Other assets less liabilities - (0.5)% | (24,909 | ) | ||||||||
|
| |||||||||
Total net assets - 100.0%# | $ | 4,993,538 | ||||||||
|
| |||||||||
| (1) | Valued at a fair value in accordance with procedures established by the board of directors of Artisan Partners Funds. In total, securities valued at a fair value were $3,495,260, or 70.0% of total net assets. See notes 2(a) and 4 in Notes to Financial Statements for additional information. |
| (2) | Security is restricted. Security was acquired in a transaction pursuant to Rule 144A under the Securities Act of 1933, as amended, on the date or during the period noted below. |
| Security | Acquisition Dates | Cost | Value | Percentage of Total Net Assets | ||||||||||||||||
Ryanair Holdings plc | 11/14/2013 - 02/24/2022 | $ | 190,215 | $ | 103,985 | 2.1 | % | |||||||||||||
| 58 | Artisan Partners Funds |
| (3) | Security is an equity-linked security issued by HSBC Bank plc. As described in 2(g) in Notes to Financial Statements, equity-linked securities are subject to counterparty risk with respect to the bank or broker-dealer that issues them. |
| (4) | Security is valued using significant unobservable inputs and is classified as Level 3 in the fair value hierarchy. |
| (5) | All or a portion of security is on loan at September 30, 2022. |
| (6) | At September 30, 2022, the Portfolio had loaned securities with a total value of $25,157. This was collateralized by cash of $29,932 which was subsequently invested in an investment company. |
| (7) | Security is restricted. |
| Security | Acquisition Dates | Cost | Value | Percentage of Total Net Assets | ||||||||||||||||
MMC Norilsk Nickel PJSC | 01/12/2022 - 10/14/2022 | $ | 151,723 | $ | – | 0.0 | % | |||||||||||||
Sberbank of Russia PJSC | 09/16/2021 - 02/11/2022 | 159,810 | – | 0.0 | % | |||||||||||||||
| PORTFOLIO DIVERSIFICATION | ||||||||||
| Dollar values in thousands | ||||||||||
| Value | Percentage of Total Investments | |||||||||
Communication Services | $ | 357,323 | 7.1 | % | ||||||
Consumer Discretionary | 479,082 | 9.5 | ||||||||
Consumer Staples | 386,958 | 7.7 | ||||||||
Energy | 539,400 | 10.8 | ||||||||
Financials | 1,057,878 | 21.1 | ||||||||
Health Care | 644,308 | 12.8 | ||||||||
Industrials | 742,806 | 14.8 | ||||||||
Information Technology | 157,822 | 3.1 | ||||||||
Materials | 428,824 | 8.6 | ||||||||
Short-Term Investment | 224,046 | 4.5 | ||||||||
|
|
|
| |||||||
Total investments | $ | 5,018,447 | 100.0 | % | ||||||
|
|
|
| |||||||
| TRADING CURRENCIES | ||||||||||
| Dollar values in thousands | ||||||||||
| Value | Percentage of Total Investments | |||||||||
CAD | $ | 324,030 | 6.5 | |||||||
CHF | 501,834 | 10.0 | ||||||||
DKK | 56,940 | 1.1 | ||||||||
EUR | 2,038,313 | 40.6 | ||||||||
GBP | 657,246 | 13.0 | % | |||||||
INR | 78,214 | 1.6 | ||||||||
JPY | 30,074 | 0.6 | ||||||||
RUB | 0 | 0.0 | ||||||||
SGD | 28,654 | 0.6 | ||||||||
USD | 1,303,142 | 26.0 | ||||||||
|
|
|
| |||||||
Total investments | $ | 5,018,447 | 100.0 | % | ||||||
|
|
|
| |||||||
| TOP TEN HOLDINGS | |||||||
Company Name | Country | Percentage of Total Net Assets | |||||
Shell plc | Netherlands | 5.3 | % | ||||
Deutsche Boerse AG | Germany | 4.6 | |||||
Linde plc | United Kingdom | 4.6 | |||||
BNP Paribas SA | France | 4.1 | |||||
Canadian Pacific Railway Ltd. | Canada | 4.0 | |||||
Schlumberger NV | United States | 4.0 | |||||
Deutsche Telekom AG | Germany | 3.8 | |||||
Argenx SE | Netherlands | 3.7 | |||||
Alphabet, Inc. | United States | 3.3 | |||||
Aon plc | United States | 3.2 | |||||
|
| ||||||
Total | 40.6 | % | |||||
|
| ||||||
Definitions of abbreviations and footnotes are detailed on page 28.
The accompanying notes are an integral part of the financial statements.
| Artisan Partners Funds | 59 |
ARTISAN International Explorer FUND
Schedule of Investments – September 30, 2022
Shares and dollar values in thousands
| Shares Held | Value | |||||||||
| COMMON STOCKS - 86.7% | ||||||||||
| ARGENTINA - 4.0% | ||||||||||
Despegar.com Corp.* | 144 | $ | 822 | |||||||
| AUSTRALIA - 4.2% | ||||||||||
Steadfast Group Ltd.(1) | 293 | 863 | ||||||||
| CANADA - 8.2% | ||||||||||
ATS Automation Tooling Systems, Inc.* | 33 | 879 | ||||||||
Boyd Group Services, Inc. | 1 | 138 | ||||||||
Knight Therapeutics, Inc.* | 138 | 530 | ||||||||
Real Matters, Inc.* | 42 | 145 | ||||||||
|
| |||||||||
| 1,692 | ||||||||||
| CHINA - 2.2% | ||||||||||
China Isotope & Radiation Corp.(1) | 210 | 442 | ||||||||
| DENMARK - 1.0% | ||||||||||
ALK-Abello A/S*(1) | 13 | 204 | ||||||||
| FRANCE - 2.0% | ||||||||||
Alten SA(1) | 4 | 421 | ||||||||
| GERMANY - 6.3% | ||||||||||
AlzChem Group AG(1) | 25 | 398 | ||||||||
Hensoldt AG(1) | 45 | 904 | ||||||||
|
| |||||||||
| 1,302 | ||||||||||
| INDIA - 2.4% | ||||||||||
Care Ratings Ltd.(1) | 80 | 494 | ||||||||
| INDONESIA - 4.7% | ||||||||||
Mitra Adiperkasa Tbk. PT*(1) | 13,844 | 962 | ||||||||
| IRELAND - 5.2% | ||||||||||
Glenveagh Properties plc*(1) | 1,216 | 1,059 | ||||||||
| ITALY - 1.3% | ||||||||||
Enav SpA*(1) | 71 | 257 | ||||||||
| JAPAN - 6.9% | ||||||||||
Horiba Ltd.(1) | 10 | 396 | ||||||||
NexTone, Inc.*(1) | 11 | 278 | ||||||||
Zuken, Inc.(1) | 31 | 743 | ||||||||
|
| |||||||||
| 1,417 | ||||||||||
| MEXICO - 2.8% | ||||||||||
Qualitas Controladora SAB de CV | 138 | 568 | ||||||||
| NORWAY - 1.0% | ||||||||||
Sikri Holding ASA*(1) | 345 | 212 | ||||||||
| SOUTH AFRICA - 4.5% | ||||||||||
Bid Corp. Ltd.(1) | 14 | 208 | ||||||||
Cashbuild Ltd.(1) | 37 | 407 | ||||||||
Famous Brands Ltd.(1) | 102 | 307 | ||||||||
|
| |||||||||
| 922 | ||||||||||
| SOUTH KOREA - 2.1% | ||||||||||
Vitzrocell Co. Ltd.(1) | 58 | 441 | ||||||||
| SWITZERLAND - 1.1% | ||||||||||
Medmix AG(1) | 13 | 229 | ||||||||
| UNITED KINGDOM - 21.0% | ||||||||||
Essentra plc(1) | 81 | 162 | ||||||||
Euromoney Institutional Investor plc(1) | 43 | 694 | ||||||||
IDOX plc(1) | 1,100 | 792 | ||||||||
IQE plc*(1) | 722 | 271 | ||||||||
Johnson Service Group plc*(1) | 126 | 111 | ||||||||
LSL Property Services plc(1) | 119 | 348 | ||||||||
Luxfer Holdings plc | 34 | 493 | ||||||||
M&C Saatchi plc*(1) | 879 | 1,317 | ||||||||
Oxford Biomedica plc*(1) | 33 | 125 | ||||||||
|
| |||||||||
| 4,313 | ||||||||||
| UNITED STATES - 5.8% | ||||||||||
Impro Precision Industries Ltd.(1) | 2,436 | 611 | ||||||||
Signify NV(1) | 22 | 571 | ||||||||
|
| |||||||||
| 1,182 | ||||||||||
|
| |||||||||
Total common stocks |
| 17,802 | ||||||||
| SHORT-TERM INVESTMENTS - 14.3% | ||||||||||
| INVESTMENT COMPANIES - 14.3% | ||||||||||
BlackRock Liquidity Funds Treasury Trust Fund - Institutional Class, 2.81% | 1,001 | 1,001 | ||||||||
Federated Treasury Obligations Fund - Institutional Class, 2.85% | 971 | 971 | ||||||||
Fidelity Investments Money Market Treasury Portfolio - Institutional Class, 2.89% | 971 | 971 | ||||||||
|
| |||||||||
Total investment companies |
| 2,943 | ||||||||
Total investments - 101.0% |
| 20,745 | ||||||||
Other assets less liabilities - (1.0)% |
| (209 | ) | |||||||
|
| |||||||||
Total net assets - 100.0%# |
| $ | 20,536 | |||||||
|
| |||||||||
| (1) | Valued at a fair value in accordance with procedures established by the board of directors of Artisan Partners Funds. In total, securities valued at a fair value were $14,227, or 69.3% of total net assets. See notes 2(a) and 4 in Notes to Financial Statements for additional information. |
| PORTFOLIO DIVERSIFICATION | ||||||||||
| Dollar values in thousands | ||||||||||
| Value | Percentage of Total Investments | |||||||||
Communication Services | $ | 2,289 | 11.0 | % | ||||||
Consumer Discretionary | 3,557 | 17.1 | ||||||||
Consumer Staples | 208 | 1.0 | ||||||||
Financials | 1,925 | 9.3 | ||||||||
Health Care | 1,530 | 7.4 | ||||||||
Industrials | 4,405 | 21.2 | ||||||||
Information Technology | 2,835 | 13.7 | ||||||||
Materials | 560 | 2.7 | ||||||||
Real Estate | 493 | 2.4 | ||||||||
Short-Term Investment | 2,943 | 14.2 | ||||||||
|
|
|
| |||||||
Total investments | $ | 20,745 | 100.0 | % | ||||||
|
|
|
| |||||||
| 60 | Artisan Partners Funds |
| TRADING CURRENCIES | ||||||||||
| Dollar values in thousands | ||||||||||
| Value | Percentage of Total Investments | |||||||||
AUD | $ | 863 | 4.2 | % | ||||||
CAD | 1,692 | 8.2 | ||||||||
CHF | 229 | 1.1 | ||||||||
DKK | 204 | 1.0 | ||||||||
EUR | 3,610 | 17.4 | ||||||||
GBP | 3,820 | 18.5 | ||||||||
HKD | 1,053 | 5.1 | ||||||||
IDR | 962 | 4.6 | ||||||||
INR | 494 | 2.4 | ||||||||
JPY | 1,417 | 6.8 | ||||||||
KRW | 441 | 2.1 | ||||||||
MXN | 568 | 2.7 | ||||||||
NOK | 212 | 1.0 | ||||||||
USD | 4,258 | 20.5 | ||||||||
ZAR | 922 | 4.4 | ||||||||
|
|
|
| |||||||
Total investments | $ | 20,745 | 100.0 | % | ||||||
|
|
|
| |||||||
| TOP TEN HOLDINGS | ||||||||
Company Name | Country | Percentage of Total Net Assets | ||||||
M&C Saatchi plc | United Kingdom | 6.4 | % | |||||
Glenveagh Properties plc | Ireland | 5.2 | ||||||
Mitra Adiperkasa Tbk. PT | Indonesia | 4.7 | ||||||
Hensoldt AG | Germany | 4.4 | ||||||
ATS Automation Tooling Systems, Inc. | Canada | 4.3 | ||||||
Steadfast Group Ltd. | Australia | 4.2 | ||||||
Despegar.com Corp. | Argentina | 4.0 | ||||||
IDOX plc | United Kingdom | 3.9 | ||||||
Zuken, Inc. | Japan | 3.6 | ||||||
Euromoney Institutional Investor plc | United Kingdom | 3.4 | ||||||
|
| |||||||
Total | 44.1 | % | ||||||
|
| |||||||
Definitions of abbreviations and footnotes are detailed on page 28.
The accompanying notes are an integral part of the financial statements.
| Artisan Partners Funds | 61 |
Artisan International Small-Mid Fund
Schedule of Investments – September 30, 2022
Shares and dollar values in thousands
| Shares Held | Value | |||||||||
| COMMON STOCKS - 91.8% | ||||||||||
| AUSTRALIA - 0.1% | ||||||||||
Telix Pharmaceuticals Ltd.*(1) | 1,566 | $ | 4,680 | |||||||
| BELGIUM - 0.4% | ||||||||||
Azelis Group NV(1) | 807 | 17,950 | ||||||||
| BRAZIL - 1.9% | ||||||||||
Hapvida Participacoes e Investimentos SA* | 16,123 | 22,716 | ||||||||
Rumo SA | 7,208 | 24,785 | ||||||||
Vibra Energia SA | 9,079 | 29,084 | ||||||||
|
| |||||||||
| 76,585 | ||||||||||
| CANADA - 5.4% | ||||||||||
Altus Group Ltd. | 1,632 | 52,893 | ||||||||
CAE, Inc.* | 3,448 | 52,889 | ||||||||
Descartes Systems Group, Inc. (The)* | 599 | 38,039 | ||||||||
Kinaxis, Inc.* | 364 | 36,139 | ||||||||
Lightspeed Commerce, Inc.* | 1,874 | 32,987 | ||||||||
|
| |||||||||
| 212,947 | ||||||||||
| CHINA - 0.1% | ||||||||||
Jacobio Pharmaceuticals Group Co. Ltd.*(1) | 5,766 | 3,068 | ||||||||
| COSTA RICA - 0.3% | ||||||||||
Establishment Labs Holdings, Inc.* | 184 | 10,064 | ||||||||
| DENMARK - 5.1% | ||||||||||
ALK-Abello A/S*(1) | 1,334 | 20,980 | ||||||||
Ambu A/S, Class B(1) | 4,389 | 37,925 | ||||||||
Carlsberg A/S, Class B(1) | 192 | 22,392 | ||||||||
DSV A/S(1) | 210 | 24,335 | ||||||||
FLSmidth & Co. A/S(1) | 824 | 17,761 | ||||||||
Genmab A/S*(1) | 166 | 53,523 | ||||||||
Vestas Wind Systems A/S(1) | 1,329 | 24,362 | ||||||||
|
| |||||||||
| 201,278 | ||||||||||
| FINLAND - 1.8% | ||||||||||
Metso Outotec OYJ(1) | 9,801 | 64,946 | ||||||||
Revenio Group OYJ(1) | 217 | 8,046 | ||||||||
|
| |||||||||
| 72,992 | ||||||||||
| FRANCE - 3.0% | ||||||||||
Gaztransport Et Technigaz SA(1) | 467 | 51,659 | ||||||||
Lectra(1) | 1,560 | 43,344 | ||||||||
Ubisoft Entertainment SA*(1) | 875 | 24,026 | ||||||||
|
| |||||||||
| 119,029 | ||||||||||
| GERMANY - 4.1% | ||||||||||
AIXTRON SE(1) | 2,613 | 63,179 | ||||||||
Carl Zeiss Meditec AG(1) | 69 | 7,312 | ||||||||
Gerresheimer AG(1) | 684 | 33,601 | ||||||||
Hamburger Hafen und Logistik AG(1) | 1,241 | 13,546 | ||||||||
MorphoSys AG*(1) | 186 | 3,747 | ||||||||
Symrise AG(1) | 438 | 43,123 | ||||||||
|
| |||||||||
| 164,508 | ||||||||||
| ICELAND - 0.4% | ||||||||||
Ossur HF*(1) | 4,382 | 17,097 | ||||||||
| INDIA - 2.4% | ||||||||||
IndiaMart InterMesh Ltd.(1) | 473 | 25,682 | ||||||||
WNS Holdings Ltd., ADR* | 835 | 68,361 | ||||||||
|
| |||||||||
| 94,043 | ||||||||||
| ISRAEL - 8.0% | ||||||||||
Kornit Digital Ltd.* | 2,391 | 63,617 | ||||||||
Max Stock Ltd.(1) | 3,860 | 5,601 | ||||||||
Nice Ltd., ADR* | 907 | 170,738 | ||||||||
Radware Ltd.* | 1,931 | 42,076 | ||||||||
Rami Levy Chain Stores Hashikma Marketing 2006 Ltd.(1) | 205 | 14,682 | ||||||||
Tel Aviv Stock Exchange Ltd.(1) | 3,931 | 20,345 | ||||||||
|
| |||||||||
| 317,059 | ||||||||||
| ITALY - 1.3% | ||||||||||
Davide Campari-Milano NV(1) | 3,178 | 28,188 | ||||||||
Moncler SpA(1) | 569 | 23,383 | ||||||||
|
| |||||||||
| 51,571 | ||||||||||
| JAPAN - 13.2% | ||||||||||
Azbil Corp.(1) | 2,511 | 65,526 | ||||||||
Carenet, Inc.(1)(2) | 3,363 | 27,595 | ||||||||
CKD Corp.(1)(2) | 4,057 | 48,288 | ||||||||
Daikokutenbussan Co. Ltd.(1)(2) | 838 | 30,492 | ||||||||
en Japan, Inc.(1) | 624 | 9,525 | ||||||||
Fujitec Co. Ltd.(1) | 2,143 | 43,322 | ||||||||
GMO Financial Gate, Inc.(1) | 147 | 12,804 | ||||||||
Jeol Ltd.(1) | 624 | 20,577 | ||||||||
Kobe Bussan Co. Ltd.(1) | 662 | 15,851 | ||||||||
Money Forward, Inc.*(1) | 991 | 20,531 | ||||||||
Morinaga Milk Industry Co. Ltd.(1) | 847 | 24,824 | ||||||||
Raccoon Holdings, Inc.(1) | 165 | 1,167 | ||||||||
Rohm Co. Ltd.(1) | 586 | 38,435 | ||||||||
SCSK Corp.(1) | 613 | 9,196 | ||||||||
SG Holdings Co. Ltd.(1) | 4,359 | 59,239 | ||||||||
Temairazu, Inc.(1) | 321 | 11,662 | ||||||||
Toshiba Corp.(1) | 2,019 | 71,910 | ||||||||
Ubicom Holdings, Inc.(1)(2) | 847 | 12,677 | ||||||||
|
| |||||||||
| 523,621 | ||||||||||
| NETHERLANDS - 2.1% | ||||||||||
IMCD NV(1) | 407 | 48,261 | ||||||||
Koninklijke DSM NV(1) | 293 | 33,262 | ||||||||
|
| |||||||||
| 81,523 | ||||||||||
| SPAIN - 0.5% | ||||||||||
Almirall SA(1) | 1,987 | 19,146 | ||||||||
| SWEDEN - 3.3% | ||||||||||
AAK AB(1) | 1,207 | 15,909 | ||||||||
Fortnox AB(1) | 11,588 | 44,957 | ||||||||
Swedish Orphan Biovitrum AB*(1) | 3,551 | 68,741 | ||||||||
|
| |||||||||
| 129,607 | ||||||||||
| SWITZERLAND - 5.8% | ||||||||||
Alcon, Inc.(1) | 1,263 | 73,123 | ||||||||
Baloise Holding AG(1) | 284 | 36,267 | ||||||||
Barry Callebaut AG(1) | 24 | 45,916 | ||||||||
Belimo Holding AG(1) | 88 | 32,178 | ||||||||
Burckhardt Compression Holding AG(1) | 72 | 26,734 | ||||||||
Tecan Group AG(1) | 48 | 16,545 | ||||||||
|
| |||||||||
| 230,763 | ||||||||||
| THAILAND - 1.5% | ||||||||||
Fabrinet* | 628 | 59,988 | ||||||||
| UNITED KINGDOM - 12.4% | ||||||||||
Alphawave IP Group plc*(1) | 11,706 | 17,766 | ||||||||
Balfour Beatty plc(1) | 6,282 | 21,310 | ||||||||
boohoo Group plc*(1) | 10,907 | 4,339 | ||||||||
Britvic plc(1) | 3,218 | 25,585 | ||||||||
| 62 | Artisan Partners Funds |
| Shares Held | Value | |||||||||
| UNITED KINGDOM (CONTINUED) | ||||||||||
ConvaTec Group plc(1) | 36,110 | $ | 81,842 | |||||||
Howden Joinery Group plc(1) | 7,094 | 39,473 | ||||||||
JD Sports Fashion plc(1) | 15,878 | 17,342 | ||||||||
JET2 plc*(1) | 5,958 | 45,618 | ||||||||
Oxford Biomedica plc*(1) | 1,627 | 6,223 | ||||||||
Rotork plc(1) | 16,631 | 43,349 | ||||||||
RS Group plc(1) | 7,362 | 78,561 | ||||||||
Smiths Group plc(1) | 1,261 | 21,126 | ||||||||
St. James’s Place plc(1) | 2,934 | 33,463 | ||||||||
Subsea 7 SA(1) | 1,289 | 10,181 | ||||||||
Trainline plc*(1) | 8,785 | 30,605 | ||||||||
YouGov plc(1) | 1,645 | 16,031 | ||||||||
|
| |||||||||
| 492,814 | ||||||||||
| UNITED STATES - 18.7% | ||||||||||
Agilysys, Inc.* | 917 | 50,734 | ||||||||
Alkermes plc* | 1,283 | 28,647 | ||||||||
Avidity Biosciences, Inc.* | 251 | 4,092 | ||||||||
BioCryst Pharmaceuticals, Inc.* | 1,708 | 21,521 | ||||||||
CyberArk Software Ltd.* | 577 | 86,584 | ||||||||
Envista Holdings Corp.* | 1,188 | 38,978 | ||||||||
Glaukos Corp.* | 1,269 | 67,567 | ||||||||
Ingersoll Rand, Inc. | 1,144 | 49,503 | ||||||||
Inspire Medical Systems, Inc.* | 86 | 15,285 | ||||||||
Lantheus Holdings, Inc.* | 454 | 31,951 | ||||||||
Legend Biotech Corp., ADR* | 907 | 36,992 | ||||||||
Madrigal Pharmaceuticals, Inc.* | 134 | 8,705 | ||||||||
MaxCyte, Inc.* | 835 | 5,425 | ||||||||
Model N, Inc.*(2) | 2,003 | 68,548 | ||||||||
Monday.com Ltd.* | 100 | 11,299 | ||||||||
Myriad Genetics, Inc.* | 1,726 | 32,940 | ||||||||
Relay Therapeutics, Inc.* | 201 | 4,488 | ||||||||
Seagen, Inc.* | 78 | 10,721 | ||||||||
STAAR Surgical Co.* | 339 | 23,924 | ||||||||
Varex Imaging Corp.* | 1,111 | 23,494 | ||||||||
Verastem, Inc.* | 1,246 | 1,059 | ||||||||
ViewRay, Inc.*(2) | 11,030 | 40,149 | ||||||||
Wolfspeed, Inc.* | 767 | 79,288 | ||||||||
|
| |||||||||
| 741,894 | ||||||||||
|
| |||||||||
Total common stocks |
| 3,642,227 | ||||||||
| SHORT-TERM INVESTMENT - 7.0% | ||||||||||
| INVESTMENT COMPANY - 7.0% | ||||||||||
BlackRock Liquidity Funds Treasury Trust Fund - Institutional Class, 2.81% (Cost $279,761) | 279,761 | 279,761 | ||||||||
|
| |||||||||
Total investments - 98.8% |
| 3,921,988 | ||||||||
Other assets less liabilities - 1.2% |
| 46,575 | ||||||||
|
| |||||||||
Total net assets - 100.0%# |
| $ | 3,968,563 | |||||||
|
| |||||||||
| (1) | Valued at a fair value in accordance with procedures established by the board of directors of Artisan Partners Funds. In total, securities valued at a fair value were $2,195,957, or 55.3% of total net assets. See notes 2(a) and 4 in Notes to Financial Statements for additional information. |
| (2) | Affiliated company as defined under the Investment Company Act of 1940. See note 10 in Notes to Financial Statements for additional information. |
PORTFOLIO DIVERSIFICATION
Dollar values in thousands
| Value | Percentage of Total Investments | |||||||||
Communication Services | $ | 40,057 | 1.0 | % | ||||||
Consumer Discretionary | 123,183 | 3.2 | ||||||||
Consumer Staples | 223,839 | 5.7 | ||||||||
Energy | 61,840 | 1.6 | ||||||||
Financials | 90,075 | 2.3 | ||||||||
Health Care | 932,489 | 23.8 | ||||||||
Industrials | 968,270 | 24.7 | ||||||||
Information Technology | 1,073,196 | 27.4 | ||||||||
Materials | 76,385 | 1.9 | ||||||||
Real Estate | 52,893 | 1.3 | ||||||||
Short-Term Investment | 279,761 | 7.1 | ||||||||
|
|
|
| |||||||
Total investments | $ | 3,921,988 | 100.0 | % | ||||||
|
|
|
| |||||||
TRADING CURRENCIES
Dollar values in thousands
| Value | Percentage of Total Investments | |||||||||
AUD | $ | 4,680 | 0.1 | % | ||||||
BRL | 76,585 | 2.0 | ||||||||
CAD | 212,947 | 5.4 | ||||||||
CHF | 230,763 | 5.9 | ||||||||
DKK | 218,375 | 5.6 | ||||||||
EUR | 526,719 | 13.4 | ||||||||
GBP | 482,633 | 12.3 | ||||||||
HKD | 3,068 | 0.1 | ||||||||
INR | 25,682 | 0.7 | ||||||||
ILS | 40,628 | 1.0 | ||||||||
JPY | 523,621 | 13.3 | ||||||||
NOK | 10,181 | 0.3 | ||||||||
SEK | 129,607 | 3.3 | ||||||||
USD | 1,436,499 | 36.6 | ||||||||
|
|
|
| |||||||
Total investments | $ | 3,921,988 | 100.0 | % | ||||||
|
|
|
| |||||||
| TOP TEN HOLDINGS | |||||||
Company Name | Country | Percentage of Total Net Assets | |||||
Nice Ltd. | Israel | 4.3 | % | ||||
CyberArk Software Ltd. | United States | 2.2 | |||||
ConvaTec Group plc | United Kingdom | 2.1 | |||||
Wolfspeed, Inc. | United States | 2.0 | |||||
RS Group plc | United Kingdom | 2.0 | |||||
Alcon, Inc. | Switzerland | 1.8 | |||||
Toshiba Corp. | Japan | 1.8 | |||||
Swedish Orphan Biovitrum AB | Sweden | 1.7 | |||||
Model N, Inc. | United States | 1.7 | |||||
WNS Holdings Ltd. | India | 1.7 | |||||
|
| ||||||
Total | 21.3 | % | |||||
|
| ||||||
Definitions of abbreviations and footnotes are detailed on page 28.
The accompanying notes are an integral part of the financial statements.
| Artisan Partners Funds | 63 |
ARTISAN INTERNATIONAL VALUE FUND
Schedule of Investments – September 30, 2022
Shares and dollar values in thousands
| Shares Held | Value | |||||||||
| COMMON STOCKS AND EQUITY-LINKED SECURITY - 93.3% | ||||||||||
| BELGIUM - 1.9% | ||||||||||
Groupe Bruxelles Lambert NV(1) | 5,565 | $ | 386,750 | |||||||
| BRAZIL - 0.8% | ||||||||||
Telefonica Brasil SA, ADR | 20,904 | 157,199 | ||||||||
| CANADA - 6.1% | ||||||||||
Alimentation Couche-Tard, Inc. | 22,399 | 901,731 | ||||||||
Suncor Energy, Inc. | 11,638 | 327,733 | ||||||||
|
| |||||||||
| 1,229,464 | ||||||||||
| CHINA - 7.5% | ||||||||||
Alibaba Group Holding Ltd.*(1) | 49,825 | 499,787 | ||||||||
Anhui Conch Cement Co. Ltd., Class H(1) | 50,307 | 158,557 | ||||||||
Hengan International Group Co. Ltd.(1) | 55,979 | 249,183 | ||||||||
Trip.com Group Ltd.*(1) | 22,127 | 604,441 | ||||||||
|
| |||||||||
| 1,511,968 | ||||||||||
| FINLAND - 1.6% | ||||||||||
Nokia OYJ, ADR | 63,393 | 270,686 | ||||||||
Nokia OYJ(1) | 14,260 | 60,894 | ||||||||
|
| |||||||||
| 331,580 | ||||||||||
| FRANCE - 9.7% | ||||||||||
Danone SA(1) | 19,943 | 939,670 | ||||||||
Safran SA(1) | 5,962 | 542,118 | ||||||||
Sodexo SA(1) | 5,590 | 420,441 | ||||||||
Sodexo SA (Registered Shares)*(1)(2) | 737 | 55,450 | ||||||||
|
| |||||||||
| 1,957,679 | ||||||||||
| GERMANY - 1.8% | ||||||||||
adidas AG(1) | 1,606 | 186,391 | ||||||||
Fresenius Medical Care AG & Co. KGaA(1) | 6,466 | 183,782 | ||||||||
|
| |||||||||
| 370,173 | ||||||||||
| INDIA - 4.0% | ||||||||||
HCL Technologies Ltd.(1) | 56,082 | 634,192 | ||||||||
Indus Towers Ltd.(1) | 68,515 | 166,016 | ||||||||
|
| |||||||||
| 800,208 | ||||||||||
| IRELAND - 2.6% | ||||||||||
CRH plc(1) | 6,659 | 213,234 | ||||||||
Ryanair Holdings plc*(1) | 1,846 | 18,734 | ||||||||
Ryanair Holdings plc, Equity-Linked Security*(1)(3)(4) | 28,873 | 293,089 | ||||||||
|
| |||||||||
| 525,057 | ||||||||||
| ITALY - 0.1% | ||||||||||
Iveco Group NV*(1) | 4,417 | 20,815 | ||||||||
| JAPAN - 2.4% | ||||||||||
Nintendo Co. Ltd.(1) | 5,150 | 208,529 | ||||||||
Seven & i Holdings Co. Ltd.(1) | 6,652 | 267,198 | ||||||||
|
| |||||||||
| 475,727 | ||||||||||
| MEXICO - 0.7% | ||||||||||
Gruma SAB de CV, Class B | 15,639 | 148,923 | ||||||||
| NETHERLANDS - 5.0% | ||||||||||
ING Groep NV(1) | 50,045 | 429,097 | ||||||||
Koninklijke Philips NV(1) | 24,198 | 373,777 | ||||||||
Universal Music Group NV(1) | 10,304 | 194,233 | ||||||||
|
| |||||||||
| 997,107 | ||||||||||
| SOUTH KOREA - 6.7% | ||||||||||
NAVER Corp.(1) | 2,212 | 294,776 | ||||||||
Samsung Electronics Co. Ltd.(1) | 19,633 | 721,399 | ||||||||
Samsung Electronics Co. Ltd. (Preference)(1) | 9,926 | 322,964 | ||||||||
|
| |||||||||
| 1,339,139 | ||||||||||
| SPAIN - 1.1% | ||||||||||
CaixaBank SA(1) | 70,447 | 227,009 | ||||||||
| SWITZERLAND - 15.1% | ||||||||||
ABB Ltd.(1) | 26,902 | 692,746 | ||||||||
Cie Financiere Richemont SA(1) | 4,362 | 409,269 | ||||||||
Holcim AG*(1) | 12,463 | 508,477 | ||||||||
Novartis AG(1) | 13,251 | 1,010,148 | ||||||||
UBS Group AG(1) | 28,532 | 412,178 | ||||||||
|
| |||||||||
| 3,032,818 | ||||||||||
| UNITED KINGDOM - 14.2% | ||||||||||
Associated British Foods plc(1) | 15,246 | 212,557 | ||||||||
Berkeley Group Holdings plc(1)(5) | 5,543 | 203,196 | ||||||||
CNH Industrial NV(1) | 22,974 | 256,485 | ||||||||
Compass Group plc(1) | 44,514 | 889,806 | ||||||||
Inchcape plc(1) | 6,489 | 48,833 | ||||||||
Liberty Global plc, Class A* | 9,433 | 147,061 | ||||||||
Liberty Global plc, Class C* | 6,771 | 111,724 | ||||||||
Lloyds Banking Group plc(1) | 811,826 | 370,895 | ||||||||
RELX plc(1) | 23,288 | 568,530 | ||||||||
RELX plc(1) | 1,784 | 43,269 | ||||||||
|
| |||||||||
| 2,852,356 | ||||||||||
| UNITED STATES - 12.0% | ||||||||||
Arch Capital Group Ltd.*(5) | 23,073 | 1,050,732 | ||||||||
Garmin Ltd. | 5,192 | 416,967 | ||||||||
Sensata Technologies Holding plc(5) | 8,750 | 326,188 | ||||||||
Willis Towers Watson plc | 3,071 | 617,141 | ||||||||
|
| |||||||||
| 2,411,028 | ||||||||||
|
| |||||||||
Total common stocks and equity-linked security |
| 18,775,000 | ||||||||
| SHORT-TERM INVESTMENT - 6.4% | ||||||||||
| INVESTMENT COMPANY - 6.4% | ||||||||||
BlackRock Liquidity Funds Treasury Trust Fund - Institutional Class, 2.81% (Cost $1,283,119) | 1,283,119 | 1,283,119 | ||||||||
|
| |||||||||
Total investments - 99.7% | 20,058,119 | |||||||||
Other assets less liabilities - 0.3% | 72,911 | |||||||||
|
| |||||||||
Total net assets - 100.0%# | $ | 20,131,030 | ||||||||
|
| |||||||||
| (1) | Valued at a fair value in accordance with procedures established by the board of directors of Artisan Partners Funds. In total, securities valued at a fair value were $14,298,915, or 71.0% of total net assets. See notes 2(a) and 4 in Notes to Financial Statements for additional information. |
| (2) | Security is restricted. |
| Security | Acquisition Date | Cost | Value | Percentage of Total Net Assets | ||||||||||||||||
Sodexo SA (Registered Shares) | 09/01/2020 | $ | 63,852 | $ | 55,450 | 0.3 | % | |||||||||||||
| (3) | Security was acquired in a transaction pursuant to Rule 144A under the Securities Act of 1933, as amended, on the date or during the period noted below. Security is restricted. |
| Security | Acquisition Dates | Cost | Value | Percentage of Total Net Assets | ||||||||||||||||
Ryanair Holdings plc | | 11/14/2013 - 09/29/2022 | $ | 456,186 | $ | 293,089 | 1.5 | % | ||||||||||||
| (4) | Security is an equity-linked security issued by HSBC Bank plc. As described in 2(g) in Notes to Financial Statements, equity-linked securities are subject to counterparty risk with respect to the bank or broker-dealer that issues them. |
| (5) | Affiliated company as defined under the Investment Company Act of 1940. See note 10 in Notes to Financial Statements for additional information. |
| 64 | Artisan Partners Funds |
| OTC TOTAL RETURN SWAP | ||||||||||||||||||||||||||||||
| (Values in thousands) | ||||||||||||||||||||||||||||||
| Counterparty | Reference Entity | Payments | Payments | Frequency of | Counterparty | Maturity | Notional Amount | Upfront | Unrealized | Value | ||||||||||||||||||||
| UBS | Gruma SAB de CV | Fed funds rate + 0.70% and decrease in total return of reference entity | Increase in total return of reference entity | Monthly | UBS AG | 9/21/2023 | USD 975 | – | (498) | (498) | ||||||||||||||||||||
|
|
| ||||||||||||||||||||||||||||
| Total | – | (498) | (498) | |||||||||||||||||||||||||||
|
|
| ||||||||||||||||||||||||||||
| PORTFOLIO DIVERSIFICATION | ||||||||||
| Dollar values in thousands | ||||||||||
| Value | Percentage of Total Investments | |||||||||
Communication Services | $ | 1,279,538 | 6.4 | % | ||||||
Consumer Discretionary | 3,734,581 | 18.6 | ||||||||
Consumer Staples | 2,719,262 | 13.6 | ||||||||
Energy | 327,733 | 1.6 | ||||||||
Financials | 3,493,802 | 17.4 | ||||||||
Health Care | 1,567,707 | 7.8 | ||||||||
Industrials | 2,761,974 | 13.8 | ||||||||
Information Technology | 2,010,135 | 10.0 | ||||||||
Materials | 880,268 | 4.4 | ||||||||
Short-Term Investment | 1,283,119 | 6.4 | ||||||||
|
|
|
| |||||||
Total investments | $ | 20,058,119 | 100.0 | % | ||||||
|
|
|
| |||||||
| TRADING CURRENCIES | ||||||||||
| Dollar values in thousands | ||||||||||
| Value | Percentage of Total Investments | |||||||||
CAD | $ | 1,229,464 | 6.1 | % | ||||||
CHF | 3,032,818 | 15.1 | ||||||||
EUR | 4,552,149 | 22.7 | ||||||||
GBP | 2,293,817 | 11.4 | ||||||||
HKD | 1,511,968 | 7.5 | ||||||||
INR | 800,208 | 4.0 | ||||||||
JPY | 475,727 | 2.4 | ||||||||
KRW | 1,339,139 | 6.7 | ||||||||
MXN | 148,923 | 0.7 | ||||||||
USD | 4,673,906 | 23.4 | ||||||||
|
|
|
| |||||||
Total investments | $ | 20,058,119 | 100.0 | % | ||||||
|
|
|
| |||||||
| TOP TEN HOLDINGS | ||||||||||
Company Name | Country | Percentage of Total Net Assets | ||||||||
Arch Capital Group Ltd. | United States | 5.2 | % | |||||||
Samsung Electronics Co. Ltd. | South Korea | 5.2 | ||||||||
Novartis AG | Switzerland | 5.0 | ||||||||
Danone SA | France | 4.7 | ||||||||
Alimentation Couche-Tard, Inc. | Canada | 4.5 | ||||||||
Compass Group plc | United Kingdom | 4.4 | ||||||||
ABB Ltd. | Switzerland | 3.4 | ||||||||
HCL Technologies Ltd. | India | 3.2 | ||||||||
Willis Towers Watson plc | United States | 3.1 | ||||||||
RELX plc | United Kingdom | 3.0 | ||||||||
|
| |||||||||
Total | 41.7 | % | ||||||||
|
| |||||||||
Definitions of abbreviations and footnotes are detailed on page 28.
The accompanying notes are an integral part of the financial statements.
| Artisan Partners Funds | 65 |
Schedule of Investments – September 30, 2022
Shares and dollar values in thousands
| Shares Held | Value | |||||||||
| COMMON STOCKS - 96.1% | ||||||||||
| AUTO COMPONENTS - 1.1% | ||||||||||
Aptiv plc* | 618 | $ | 48,363 | |||||||
| BANKS - 3.9% | ||||||||||
First Republic Bank | 515 | 67,195 | ||||||||
SVB Financial Group* | 294 | 98,731 | ||||||||
|
| |||||||||
| 165,926 | ||||||||||
| BIOTECHNOLOGY - 8.9% | ||||||||||
Argenx SE, ADR*(1) | 393 | 138,676 | ||||||||
Ascendis Pharma A/S, ADR*(1) | 1,328 | 137,128 | ||||||||
BioNTech SE, ADR(1) | 363 | 49,019 | ||||||||
Exact Sciences Corp.* | 421 | 13,692 | ||||||||
Genmab A/S*(1)(2) | 122 | 39,259 | ||||||||
|
| |||||||||
| 377,774 | ||||||||||
| BUILDING PRODUCTS - 2.5% | ||||||||||
Advanced Drainage Systems, Inc. | 632 | 78,568 | ||||||||
Trex Co., Inc.* | 597 | 26,218 | ||||||||
|
| |||||||||
| 104,786 | ||||||||||
| CAPITAL MARKETS - 8.0% | ||||||||||
LPL Financial Holdings, Inc. | 371 | 81,129 | ||||||||
MSCI, Inc. | 216 | 90,989 | ||||||||
Nasdaq, Inc. | 2,090 | 118,472 | ||||||||
Tradeweb Markets, Inc., Class A | 898 | 50,678 | ||||||||
|
| |||||||||
| 341,268 | ||||||||||
| COMMUNICATIONS EQUIPMENT - 2.3% | ||||||||||
Arista Networks, Inc.* | 867 | 97,858 | ||||||||
| ELECTRICAL EQUIPMENT - 0.5% | ||||||||||
Generac Holdings, Inc.* | 122 | 21,671 | ||||||||
| ELECTRONIC EQUIPMENT, INSTRUMENTS & COMPONENTS - 2.8% | ||||||||||
Teledyne Technologies, Inc.* | 204 | 68,982 | ||||||||
Trimble, Inc.* | 932 | 50,572 | ||||||||
|
| |||||||||
| 119,554 | ||||||||||
| ENTERTAINMENT - 0.9% | ||||||||||
Take-Two Interactive Software, Inc.* | 349 | 38,081 | ||||||||
| HEALTH CARE EQUIPMENT & SUPPLIES - 2.9% | ||||||||||
Cooper Cos., Inc. (The) | 113 | 29,764 | ||||||||
Dexcom, Inc.* | 612 | 49,262 | ||||||||
Envista Holdings Corp.* | 1,314 | 43,109 | ||||||||
|
| |||||||||
| 122,135 | ||||||||||
| HEALTH CARE TECHNOLOGY - 4.2% | ||||||||||
Veeva Systems, Inc., Class A* | 1,069 | 176,231 | ||||||||
| HOTELS, RESTAURANTS & LEISURE - 3.0% | ||||||||||
Chipotle Mexican Grill, Inc.* | 84 | 125,824 | ||||||||
| INSURANCE - 1.1% | ||||||||||
Ryan Specialty Holdings, Inc., Class A* | 1,138 | 46,223 | ||||||||
| INTERACTIVE MEDIA & SERVICES - 3.2% | ||||||||||
Match Group, Inc.* | 1,113 | 53,155 | ||||||||
ZoomInfo Technologies, Inc., Class A* | 1,957 | 81,549 | ||||||||
|
| |||||||||
| 134,704 | ||||||||||
| INTERNET & DIRECT MARKETING RETAIL - 1.8% | ||||||||||
Etsy, Inc.* | 359 | 35,910 | ||||||||
Global-e Online Ltd.*(1) | 1,565 | 41,868 | ||||||||
|
| |||||||||
| 77,778 | ||||||||||
| IT SERVICES - 4.2% | ||||||||||
Global Payments, Inc. | 1,468 | 158,666 | ||||||||
Shopify, Inc., Class A*(1) | 755 | 20,342 | ||||||||
|
| |||||||||
| 179,008 | ||||||||||
| LIFE SCIENCES TOOLS & SERVICES - 5.9% | ||||||||||
Agilent Technologies, Inc. | 601 | 73,012 | ||||||||
Azenta, Inc. | 95 | 4,081 | ||||||||
Evotec SE*(1)(2) | 1,118 | 19,671 | ||||||||
Repligen Corp.* | 342 | 64,031 | ||||||||
West Pharmaceutical Services, Inc. | 360 | 88,617 | ||||||||
|
| |||||||||
| 249,412 | ||||||||||
| MACHINERY - 5.1% | ||||||||||
CNH Industrial NV(1) | 3,927 | 43,859 | ||||||||
Fortive Corp. | 1,041 | 60,716 | ||||||||
Ingersoll Rand, Inc. | 2,585 | 111,829 | ||||||||
|
| |||||||||
| 216,404 | ||||||||||
| MULTILINE RETAIL - 0.5% | ||||||||||
Dollar Tree, Inc.* | 157 | 21,435 | ||||||||
| PHARMACEUTICALS - 3.5% | ||||||||||
Catalent, Inc.* | 2,047 | 148,136 | ||||||||
| PROFESSIONAL SERVICES - 1.0% | ||||||||||
CoStar Group, Inc.* | 302 | 21,059 | ||||||||
Verisk Analytics, Inc. | 132 | 22,451 | ||||||||
|
| |||||||||
| 43,510 | ||||||||||
| ROAD & RAIL - 1.3% | ||||||||||
Uber Technologies, Inc.* | 2,156 | 57,132 | ||||||||
| SEMICONDUCTORS & SEMICONDUCTOR EQUIPMENT - 8.5% | ||||||||||
Entegris, Inc. | 697 | 57,827 | ||||||||
Lattice Semiconductor Corp.* | 2,330 | 114,664 | ||||||||
Monolithic Power Systems, Inc. | 170 | 61,764 | ||||||||
ON Semiconductor Corp.* | 2,020 | 125,885 | ||||||||
|
| |||||||||
| 360,140 | ||||||||||
| SOFTWARE - 16.7% | ||||||||||
Atlassian Corp. plc, Class A* | 813 | 171,143 | ||||||||
Bill.com Holdings, Inc.* | 437 | 57,801 | ||||||||
Datadog, Inc., Class A* | 730 | 64,802 | ||||||||
HubSpot, Inc.* | 553 | 149,452 | ||||||||
Synopsys, Inc.* | 329 | 100,478 | ||||||||
Tyler Technologies, Inc.* | 152 | 52,726 | ||||||||
Zscaler, Inc.* | 674 | 110,787 | ||||||||
|
| |||||||||
| 707,189 | ||||||||||
| SPECIALTY RETAIL - 0.9% | ||||||||||
Burlington Stores, Inc.* | 49 | 5,507 | ||||||||
Five Below, Inc.* | 235 | 32,321 | ||||||||
|
| |||||||||
| 37,828 | ||||||||||
| TEXTILES, APPAREL & LUXURY GOODS - 1.4% | ||||||||||
Lululemon Athletica, Inc.* | 213 | 59,523 | ||||||||
|
| |||||||||
Total common stocks |
| 4,077,893 | ||||||||
| SHORT-TERM INVESTMENT - 3.0% | ||||||||||
| INVESTMENT COMPANY - 3.0% | ||||||||||
BlackRock Liquidity Funds Treasury Trust Fund - Institutional Class, 2.81% | 127,061 | 127,061 | ||||||||
|
| |||||||||
Total investments - 99.1% |
| 4,204,954 | ||||||||
Other assets less liabilities - 0.9% |
| 40,269 | ||||||||
|
| |||||||||
Total net assets - 100.0%# |
| $ | 4,245,223 | |||||||
|
| |||||||||
| 66 | Artisan Partners Funds |
| (1) | The Fund considers the company to be from outside the United States. See the Fund’s Statement of Additional Information for a description of the methodology used for country classifications. |
| Security | Country | Trading Currency | ||||||||
Argenx SE | Netherlands | USD | ||||||||
Ascendis Pharma A/S | Denmark | USD | ||||||||
BioNTech SE | Germany | USD | ||||||||
CNH Industrial NV | United Kingdom | USD | ||||||||
Evotec SE | Germany | EUR | ||||||||
Genmab A/S | Denmark | DKK | ||||||||
Global-e Online Ltd. | Israel | USD | ||||||||
Shopify, Inc. | Canada | USD | ||||||||
| (2) | Valued at a fair value in accordance with procedures established by the board of directors of Artisan Partners Funds. In total, securities valued at a fair value were $58,930, or 1.4% of total net assets. See notes 2(a) and 4 in Notes to Financial Statements for additional information. |
| PORTFOLIO DIVERSIFICATION | ||||||||||
| Dollar values in thousands | ||||||||||
| Value | Percentage of Total Investments | |||||||||
Communication Services | $ | 172,786 | 4.1 | % | ||||||
Consumer Discretionary | 370,751 | 8.8 | ||||||||
Financials | 553,417 | 13.2 | ||||||||
Health Care | 1,073,688 | 25.5 | ||||||||
Industrials | 443,504 | 10.6 | ||||||||
Information Technology | 1,463,747 | 34.8 | ||||||||
Short-Term Investment | 127,061 | 3.0 | ||||||||
|
|
|
| |||||||
Total investments | $ | 4,204,954 | 100.0 | % | ||||||
|
|
|
| |||||||
| TRADING CURRENCIES | ||||||||||
| Dollar values in thousands | ||||||||||
| Value | Percentage of Total Investments | |||||||||
DKK | $ | 39,259 | 0.9 | % | ||||||
EUR | 19,671 | 0.5 | ||||||||
USD | 4,146,024 | 98.6 | ||||||||
|
|
|
| |||||||
Total investments | $ | 4,204,954 | 100.0 | % | ||||||
|
|
|
| |||||||
| TOP TEN HOLDINGS | ||||||||||
Company Name | Country | Percentage of Total Net Assets | ||||||||
Veeva Systems, Inc. | United States | 4.2 | % | |||||||
Atlassian Corp. plc | United States | 4.0 | ||||||||
Global Payments, Inc. | United States | 3.7 | ||||||||
HubSpot, Inc. | United States | 3.5 | ||||||||
Catalent, Inc. | United States | 3.5 | ||||||||
Argenx SE | Netherlands | 3.3 | ||||||||
Ascendis Pharma A/S | Denmark | 3.2 | ||||||||
ON Semiconductor Corp. | United States | 3.0 | ||||||||
Chipotle Mexican Grill, Inc. | United States | 3.0 | ||||||||
Nasdaq, Inc. | United States | 2.8 | ||||||||
|
| |||||||||
Total | 34.2 | % | ||||||||
|
| |||||||||
Definitions of abbreviations and footnotes are detailed on page 28.
The accompanying notes are an integral part of the financial statements.
| Artisan Partners Funds | 67 |
Schedule of Investments – September 30, 2022
Shares and dollar values in thousands
| Shares Held | Value | |||||||||
| COMMON STOCKS - 97.4% | ||||||||||
| AEROSPACE & DEFENSE - 0.9% | ||||||||||
CAE, Inc.*(1) | 749 | $ | 11,478 | |||||||
| AIR FREIGHT & LOGISTICS - 0.8% | ||||||||||
Expeditors International of Washington, Inc. | 123 | 10,904 | ||||||||
| AUTO COMPONENTS - 4.0% | ||||||||||
BorgWarner, Inc. | 825 | 25,908 | ||||||||
Gentex Corp. | 1,086 | 25,900 | ||||||||
|
| |||||||||
| 51,808 | ||||||||||
| BANKS - 5.1% | ||||||||||
First Citizens BancShares, Inc., Class A | 46 | 36,651 | ||||||||
M&T Bank Corp. | 168 | 29,606 | ||||||||
|
| |||||||||
| 66,257 | ||||||||||
| CAPITAL MARKETS - 5.2% | ||||||||||
Carlyle Group, Inc. (The) | 741 | 19,141 | ||||||||
Moelis & Co., Class A | 664 | 22,450 | ||||||||
Northern Trust Corp. | 304 | 26,029 | ||||||||
|
| |||||||||
| 67,620 | ||||||||||
| CHEMICALS - 3.5% | ||||||||||
Celanese Corp. | 185 | 16,754 | ||||||||
Corteva, Inc. | 510 | 29,125 | ||||||||
|
| |||||||||
| 45,879 | ||||||||||
| CONSUMER FINANCE - 2.2% | ||||||||||
Synchrony Financial | 1,009 | 28,434 | ||||||||
| DIVERSIFIED CONSUMER SERVICES - 1.9% | ||||||||||
H&R Block, Inc. | 591 | 25,135 | ||||||||
| ELECTRIC UTILITIES - 2.9% | ||||||||||
OGE Energy Corp. | 1,051 | 38,317 | ||||||||
| ELECTRICAL EQUIPMENT - 3.0% | ||||||||||
nVent Electric plc | 1,251 | 39,530 | ||||||||
| ELECTRONIC EQUIPMENT, INSTRUMENTS & COMPONENTS - 1.1% | ||||||||||
Vontier Corp. | 852 | 14,235 | ||||||||
| ENERGY EQUIPMENT & SERVICES - 2.8% | ||||||||||
NOV, Inc. | 2,261 | 36,588 | ||||||||
| ENTERTAINMENT - 4.0% | ||||||||||
Electronic Arts, Inc. | 224 | 25,899 | ||||||||
Warner Bros Discovery, Inc.* | 2,342 | 26,933 | ||||||||
|
| |||||||||
| 52,832 | ||||||||||
| EQUITY REAL ESTATE INVESTMENT TRUSTS (REITS) - 5.9% | ||||||||||
Lamar Advertising Co., Class A | 424 | 34,950 | ||||||||
Public Storage | 60 | 17,712 | ||||||||
STORE Capital Corp. | 776 | 24,320 | ||||||||
|
| |||||||||
| 76,982 | ||||||||||
| FOOD & STAPLES RETAILING - 4.0% | ||||||||||
Kroger Co. (The) | 681 | 29,792 | ||||||||
Sysco Corp. | 317 | 22,418 | ||||||||
|
| |||||||||
| 52,210 | ||||||||||
| FOOD PRODUCTS - 2.4% | ||||||||||
Tyson Foods, Inc., Class A | 470 | 30,969 | ||||||||
| HEALTH CARE EQUIPMENT & SUPPLIES - 1.1% | ||||||||||
Dentsply Sirona, Inc. | 526 | 14,920 | ||||||||
| Shares Held | Value | |||||||||
| HEALTH CARE PROVIDERS & SERVICES - 4.1% | ||||||||||
AmerisourceBergen Corp. | 159 | $ | 21,488 | |||||||
Centene Corp.* | 421 | 32,726 | ||||||||
|
| |||||||||
| 54,214 | ||||||||||
| HOTELS, RESTAURANTS & LEISURE - 7.1% | ||||||||||
Expedia Group, Inc.* | 340 | 31,882 | ||||||||
Marriott International, Inc., Class A | 238 | 33,394 | ||||||||
Vail Resorts, Inc. | 130 | 28,022 | ||||||||
|
| |||||||||
| 93,298 | ||||||||||
| INSURANCE - 7.9% | ||||||||||
Arch Capital Group Ltd.* | 956 | 43,533 | ||||||||
Globe Life, Inc. | 428 | 42,706 | ||||||||
Progressive Corp. (The) | 144 | 16,731 | ||||||||
|
| |||||||||
| 102,970 | ||||||||||
| INTERACTIVE MEDIA & SERVICES - 1.4% | ||||||||||
IAC, Inc.* | 330 | 18,274 | ||||||||
| MACHINERY - 1.7% | ||||||||||
Otis Worldwide Corp. | 340 | 21,706 | ||||||||
| MEDIA - 8.1% | ||||||||||
Cable One, Inc. | 24 | 20,637 | ||||||||
Liberty Broadband Corp., Class C* | 95 | 7,032 | ||||||||
Liberty Media Corp.-Liberty SiriusXM, Class A* | 353 | 13,452 | ||||||||
Liberty Media Corp.-Liberty SiriusXM, Class C* | 351 | 13,246 | ||||||||
News Corp., Class A | 1,757 | 26,547 | ||||||||
Omnicom Group, Inc. | 406 | 25,591 | ||||||||
|
| |||||||||
| 106,505 | ||||||||||
| REAL ESTATE MANAGEMENT & DEVELOPMENT - 1.4% | ||||||||||
Jones Lang LaSalle, Inc.* | 123 | 18,618 | ||||||||
| ROAD & RAIL - 3.6% | ||||||||||
AMERCO | 93 | 47,202 | ||||||||
| SEMICONDUCTORS & SEMICONDUCTOR EQUIPMENT - 4.0% | ||||||||||
Analog Devices, Inc. | 371 | 51,648 | ||||||||
| SOFTWARE - 1.8% | ||||||||||
Check Point Software Technologies Ltd.*(1) | 213 | 23,830 | ||||||||
| SPECIALTY RETAIL - 2.4% | ||||||||||
AutoNation, Inc.* | 309 | 31,501 | ||||||||
| TECHNOLOGY HARDWARE, STORAGE & PERIPHERALS - 1.6% | ||||||||||
NetApp, Inc. | 340 | 21,004 | ||||||||
| TRADING COMPANIES & DISTRIBUTORS - 1.5% | ||||||||||
Air Lease Corp. | 650 | 20,168 | ||||||||
|
| |||||||||
Total common stocks |
| 1,275,036 | ||||||||
| SHORT-TERM INVESTMENT - 1.6% | ||||||||||
| INVESTMENT COMPANY - 1.6% | ||||||||||
BlackRock Liquidity Funds Treasury Trust Fund - Institutional Class, 2.81% | 20,320 | 20,320 | ||||||||
|
| |||||||||
Total investments - 99.0% | 1,295,356 | |||||||||
Other assets less liabilities - 1.0% | 12,611 | |||||||||
|
| |||||||||
Total net assets - 100.0%# | $ | 1,307,967 | ||||||||
|
| |||||||||
| 68 | Artisan Partners Funds |
| (1) | The Fund considers the company to be from outside the United States. See the Fund’s Statement of Additional Information for a description of the methodology used for country classifications. |
| Security | Country | Trading Currency | ||||||||
CAE, Inc. | Canada | USD | ||||||||
Check Point Software Technologies Ltd. | Israel | USD | ||||||||
| PORTFOLIO DIVERSIFICATION | ||||||||||
| Dollar values in thousands | ||||||||||
| Value | Percentage of Total Investments | |||||||||
Communication Services | $ | 177,612 | 13.7 | % | ||||||
Consumer Discretionary | 201,741 | 15.6 | ||||||||
Consumer Staples | 83,179 | 6.4 | ||||||||
Energy | 36,588 | 2.8 | ||||||||
Financials | 265,281 | 20.5 | ||||||||
Health Care | 69,134 | 5.3 | ||||||||
Industrials | 150,988 | 11.7 | ||||||||
Information Technology | 110,717 | 8.5 | ||||||||
Materials | 45,879 | 3.5 | ||||||||
Real Estate | 95,600 | 7.4 | ||||||||
Utilities | 38,317 | 3.0 | ||||||||
Short-Term Investment | 20,320 | 1.6 | ||||||||
|
|
|
| |||||||
Total investments | $ | 1,295,356 | 100.0 | % | ||||||
|
|
|
| |||||||
TOP TEN HOLDINGS | ||||||||||
Company Name | Country | Percentage of Total Net Assets | ||||||||
Analog Devices, Inc. | United States | 4.0 | % | |||||||
AMERCO | United States | 3.6 | ||||||||
Arch Capital Group Ltd. | United States | 3.3 | ||||||||
Globe Life, Inc. | United States | 3.3 | ||||||||
nVent Electric plc | United States | 3.0 | ||||||||
OGE Energy Corp. | United States | 2.9 | ||||||||
First Citizens BancShares, Inc. | United States | 2.8 | ||||||||
NOV, Inc. | United States | 2.8 | ||||||||
Lamar Advertising Co. | United States | 2.7 | ||||||||
Marriott International, Inc. | United States | 2.6 | ||||||||
|
| |||||||||
Total | 31.0 | % | ||||||||
|
| |||||||||
Definitions of abbreviations and footnotes are detailed on page 28.
The accompanying notes are an integral part of the financial statements.
| Artisan Partners Funds | 69 |
Schedule of Investments – September 30, 2022
Shares and dollar values in thousands
| Shares Held | Value | |||||||||
| COMMON STOCKS - 95.3% | ||||||||||
| AIR FREIGHT & LOGISTICS - 1.4% | ||||||||||
FedEx Corp. | 3 | $ | 411 | |||||||
| AIRLINES - 1.8% | ||||||||||
Southwest Airlines Co.* | 17 | 526 | ||||||||
| AUTOMOBILES - 5.3% | ||||||||||
Harley-Davidson, Inc. | 45 | 1,579 | ||||||||
| BANKS - 4.7% | ||||||||||
Citigroup, Inc. | 33 | 1,375 | ||||||||
| CAPITAL MARKETS - 5.1% | ||||||||||
Bank of New York Mellon Corp. (The) | 39 | 1,513 | ||||||||
| CHEMICALS - 5.7% | ||||||||||
Axalta Coating Systems Ltd.* | 79 | 1,669 | ||||||||
| CONSTRUCTION MATERIALS - 4.2% | ||||||||||
HeidelbergCement AG(1)(2) | 31 | 1,247 | ||||||||
| CONSUMER FINANCE - 5.0% | ||||||||||
American Express Co. | 11 | 1,489 | ||||||||
| DIVERSIFIED FINANCIAL SERVICES - 6.3% | ||||||||||
Berkshire Hathaway, Inc., Class B* | 7 | 1,857 | ||||||||
| FOOD PRODUCTS - 4.7% | ||||||||||
Danone SA(1)(2) | 30 | 1,399 | ||||||||
| HEALTH CARE EQUIPMENT & SUPPLIES - 4.3% | ||||||||||
Dentsply Sirona, Inc. | 45 | 1,284 | ||||||||
| HEALTH CARE PROVIDERS & SERVICES - 5.6% | ||||||||||
Elevance Health, Inc. | 4 | 1,658 | ||||||||
| HOTELS, RESTAURANTS & LEISURE - 5.4% | ||||||||||
Aramark | 21 | 646 | ||||||||
Expedia Group, Inc.* | 10 | 955 | ||||||||
|
| |||||||||
| 1,601 | ||||||||||
| INSURANCE - 12.9% | ||||||||||
Alleghany Corp.* | 1 | 1,097 | ||||||||
Marsh & McLennan Cos., Inc. | 6 | 879 | ||||||||
Progressive Corp. (The) | 16 | 1,839 | ||||||||
|
| |||||||||
| 3,815 | ||||||||||
| INTERACTIVE MEDIA & SERVICES - 9.5% | ||||||||||
Alphabet, Inc., Class A* | 16 | 1,492 | ||||||||
Meta Platforms, Inc., Class A* | 10 | 1,313 | ||||||||
|
| |||||||||
| 2,805 | ||||||||||
| INTERNET & DIRECT MARKETING RETAIL - 4.2% | ||||||||||
Alibaba Group Holding Ltd., ADR*(1) | 15 | 1,231 | ||||||||
| SEMICONDUCTORS & SEMICONDUCTOR EQUIPMENT - 2.0% | ||||||||||
Lam Research Corp. | 2 | 587 | ||||||||
| SPECIALTY RETAIL - 2.9% | ||||||||||
Advance Auto Parts, Inc. | 5 | 848 | ||||||||
| TECHNOLOGY HARDWARE, STORAGE & PERIPHERALS - 4.3% | ||||||||||
Samsung Electronics Co. Ltd.(1)(2) | 34 | 1,264 | ||||||||
|
| |||||||||
Total common stocks |
| 28,158 | ||||||||
| SHORT-TERM INVESTMENT - 4.5% | ||||||||||
| INVESTMENT COMPANY - 4.5% | ||||||||||
BlackRock Liquidity Funds Treasury Trust Fund - Institutional Class, 2.81% (Cost $1,327) | 1,327 | $ | 1,327 | |||||||
|
| |||||||||
Total investments - 99.8% |
| 29,485 | ||||||||
Other assets less liabilities - 0.2% |
| 71 | ||||||||
|
| |||||||||
Total net assets - 100.0%# |
| $ | 29,556 | |||||||
|
| |||||||||
| (1) | The Fund considers the company to be from outside the United States. See the Fund’s Statement of Additional Information for a description of the methodology used for country classifications. |
| Security | Country | Trading Currency | ||||||||
Alibaba Group Holding Ltd. | China | USD | ||||||||
Danone SA | France | EUR | ||||||||
HeidelbergCement AG | Germany | EUR | ||||||||
Samsung Electronics Co. Ltd. | South Korea | KRW | ||||||||
| (2) | Valued at a fair value in accordance with procedures established by the board of directors of Artisan Partners Funds. In total, securities valued at a fair value were $3,910, or 13.2% of total net assets. See notes 2(a) and 4 in Notes to Financial Statements for additional information. |
| PORTFOLIO DIVERSIFICATION | ||||||||||
| Dollar values in thousands | ||||||||||
| Value | Percentage of Total Investments | |||||||||
Communication Services | $ | 2,805 | 9.5 | % | ||||||
Consumer Discretionary | 5,259 | 17.8 | ||||||||
Consumer Staples | 1,399 | 4.7 | ||||||||
Financials | 10,049 | 34.1 | ||||||||
Health Care | 2,942 | 10.0 | ||||||||
Industrials | 937 | 3.2 | ||||||||
Information Technology | 1,851 | 6.3 | ||||||||
Materials | 2,916 | 9.9 | ||||||||
Short-Term Investment | 1,327 | 4.5 | ||||||||
|
|
|
| |||||||
Total investments | $ | 29,485 | 100.0 | % | ||||||
|
|
|
| |||||||
| TRADING CURRENCIES | ||||||||||
| Dollar values in thousands | ||||||||||
| Value | Percentage of Total Investments | |||||||||
EUR | $ | 2,646 | 9.0 | % | ||||||
KRW | 1,264 | 4.3 | ||||||||
USD | 25,575 | 86.7 | ||||||||
|
|
|
| |||||||
Total investments | $ | 29,485 | 100.0 | % | ||||||
|
|
|
| |||||||
| 70 | Artisan Partners Funds |
| TOP TEN HOLDINGS | |||||||
Company Name | Country | Percentage of Total Net Assets | |||||
Berkshire Hathaway, Inc. | United States | 6.3 | % | ||||
Progressive Corp. (The) | United States | 6.2 | |||||
Axalta Coating Systems Ltd. | United States | 5.7 | |||||
Elevance Health, Inc. | United States | 5.6 | |||||
Harley-Davidson, Inc. | United States | 5.3 | |||||
Bank of New York Mellon Corp. (The) | United States | 5.1 | |||||
Alphabet, Inc. | United States | 5.0 | |||||
American Express Co. | United States | 5.0 | |||||
Danone SA | France | 4.7 | |||||
Citigroup, Inc. | United States | 4.7 | |||||
|
| ||||||
Total | 53.6 | % | |||||
|
| ||||||
Definitions of abbreviations and footnotes are detailed on page 28.
The accompanying notes are an integral part of the financial statements.
| Artisan Partners Funds | 71 |
Schedule of Investments – September 30, 2022
Shares and dollar values in thousands
| Shares Held | Value | |||||||||
| COMMON STOCKS - 99.6% | ||||||||||
| BANKS - 1.7% | ||||||||||
Live Oak Bancshares, Inc. | 446 | $ | 13,647 | |||||||
Silvergate Capital Corp., Class A* | 223 | 16,779 | ||||||||
|
| |||||||||
| 30,426 | ||||||||||
| BIOTECHNOLOGY - 20.7% | ||||||||||
Argenx SE, ADR*(1) | 264 | 93,172 | ||||||||
Ascendis Pharma A/S, ADR*(1) | 718 | 74,123 | ||||||||
Avid Bioservices, Inc.* | 657 | 12,568 | ||||||||
Denali Therapeutics, Inc.* | 255 | 7,837 | ||||||||
Halozyme Therapeutics, Inc.* | 3,466 | 137,065 | ||||||||
Iovance Biotherapeutics, Inc.* | 1,585 | 15,187 | ||||||||
Veracyte, Inc.* | 2,183 | 36,246 | ||||||||
|
| |||||||||
| 376,198 | ||||||||||
| BUILDING PRODUCTS - 3.2% | ||||||||||
Advanced Drainage Systems, Inc. | 386 | 47,953 | ||||||||
Trex Co., Inc.* | 239 | 10,502 | ||||||||
|
| |||||||||
| 58,455 | ||||||||||
| CAPITAL MARKETS - 1.6% | ||||||||||
Morningstar, Inc. | 136 | 28,823 | ||||||||
| CONSTRUCTION & ENGINEERING - 4.6% | ||||||||||
Valmont Industries, Inc. | 308 | 82,818 | ||||||||
| DIVERSIFIED CONSUMER SERVICES - 1.7% | ||||||||||
Chegg, Inc.* | 1,473 | 31,026 | ||||||||
| ELECTRICAL EQUIPMENT - 1.0% | ||||||||||
Shoals Technologies Group, Inc., Class A* | 814 | 17,540 | ||||||||
| ELECTRONIC EQUIPMENT, INSTRUMENTS & COMPONENTS - 2.7% | ||||||||||
Novanta, Inc.* | 432 | 49,969 | ||||||||
| FOOD PRODUCTS - 0.6% | ||||||||||
Freshpet, Inc.* | 201 | 10,076 | ||||||||
| HEALTH CARE EQUIPMENT & SUPPLIES - 8.7% | ||||||||||
Envista Holdings Corp.* | 398 | 13,069 | ||||||||
iRhythm Technologies, Inc.* | 178 | 22,274 | ||||||||
Penumbra, Inc.* | 62 | 11,790 | ||||||||
Shockwave Medical, Inc.* | 397 | 110,479 | ||||||||
|
| |||||||||
| 157,612 | ||||||||||
| HEALTH CARE PROVIDERS & SERVICES - 1.1% | ||||||||||
Option Care Health, Inc.* | 652 | 20,532 | ||||||||
| HOTELS, RESTAURANTS & LEISURE - 4.6% | ||||||||||
Papa John’s International, Inc. | 457 | 32,013 | ||||||||
Wingstop, Inc. | 405 | 50,776 | ||||||||
|
| |||||||||
| 82,789 | ||||||||||
| INTERACTIVE MEDIA & SERVICES - 0.6% | ||||||||||
Eventbrite, Inc., Class A* | 1,809 | 11,000 | ||||||||
| INTERNET & DIRECT MARKETING RETAIL - 1.6% | ||||||||||
Etsy, Inc.* | 149 | 14,900 | ||||||||
Global-e Online Ltd.*(1) | 511 | 13,663 | ||||||||
ThredUp, Inc., Class A* | 695 | 1,279 | ||||||||
|
| |||||||||
| 29,842 | ||||||||||
| IT SERVICES - 0.8% | ||||||||||
BigCommerce Holdings, Inc., Series 1* | 963 | 14,255 | ||||||||
| LIFE SCIENCES TOOLS & SERVICES - 2.8% | ||||||||||
Azenta, Inc. | 400 | $ | 17,144 | |||||||
Repligen Corp.* | 176 | 32,995 | ||||||||
|
| |||||||||
| 50,139 | ||||||||||
| MACHINERY - 3.8% | ||||||||||
Ingersoll Rand, Inc. | 1,326 | 57,351 | ||||||||
John Bean Technologies Corp. | 52 | 4,506 | ||||||||
Kornit Digital Ltd.*(1) | 279 | 7,418 | ||||||||
|
| |||||||||
| 69,275 | ||||||||||
| SEMICONDUCTORS & SEMICONDUCTOR EQUIPMENT - 12.9% | ||||||||||
Allegro MicroSystems, Inc.*(1) | 1,040 | 22,723 | ||||||||
Ambarella, Inc.* | 153 | 8,581 | ||||||||
Lattice Semiconductor Corp.* | 1,920 | 94,503 | ||||||||
MACOM Technology Solutions Holdings, Inc.* | 172 | 8,919 | ||||||||
Monolithic Power Systems, Inc. | 184 | 66,833 | ||||||||
Wolfspeed, Inc.* | 321 | 33,224 | ||||||||
|
| |||||||||
| 234,783 | ||||||||||
| SOFTWARE - 21.8% | ||||||||||
Bentley Systems, Inc., Class B | 743 | 22,742 | ||||||||
Blackline, Inc.* | 1,014 | 60,713 | ||||||||
BTRS Holdings, Inc., Class 1* | 1,288 | 11,923 | ||||||||
Ceridian HCM Holding, Inc.* | 309 | 17,257 | ||||||||
Clearwater Analytics Holdings, Inc., Class A* | 517 | 8,681 | ||||||||
DoubleVerify Holdings, Inc.* | 1,177 | 32,192 | ||||||||
Freshworks, Inc., Class A* | 810 | 10,505 | ||||||||
Guidewire Software, Inc.* | 582 | 35,862 | ||||||||
HubSpot, Inc.* | 85 | 22,837 | ||||||||
Olo, Inc., Class A* | 1,283 | 10,136 | ||||||||
Paycor HCM, Inc.* | 803 | 23,743 | ||||||||
Procore Technologies, Inc.* | 127 | 6,261 | ||||||||
Q2 Holdings, Inc.* | 1,003 | 32,309 | ||||||||
Sprout Social, Inc., Class A* | 249 | 15,101 | ||||||||
Tyler Technologies, Inc.* | 118 | 41,084 | ||||||||
Workiva, Inc.* | 563 | 43,801 | ||||||||
|
| |||||||||
| 395,147 | ||||||||||
| SPECIALTY RETAIL - 3.1% | ||||||||||
Five Below, Inc.* | 69 | 9,484 | ||||||||
Floor & Decor Holdings, Inc., Class A* | 419 | 29,434 | ||||||||
Leslie’s, Inc.* | 1,236 | 18,183 | ||||||||
|
| |||||||||
| 57,101 | ||||||||||
|
| |||||||||
Total common stocks |
| 1,807,806 | ||||||||
Total investments - 99.6% |
| 1,807,806 | ||||||||
Other assets less liabilities - 0.4% |
| 7,721 | ||||||||
|
| |||||||||
Total net assets - 100.0%# |
| $ | 1,815,527 | |||||||
|
| |||||||||
| (1) | The Fund considers the company to be from outside the United States. See the Fund’s Statement of Additional Information for a description of the methodology used for country classifications. |
| Security | Country | Trading Currency | ||||||||
Allegro MicroSystems, Inc. | Japan | USD | ||||||||
Argenx SE | Netherlands | USD | ||||||||
Ascendis Pharma A/S | Denmark | USD | ||||||||
Global-e Online Ltd. | Israel | USD | ||||||||
Kornit Digital Ltd. | Israel | USD | ||||||||
| 72 | Artisan Partners Funds |
| PORTFOLIO DIVERSIFICATION | ||||||||||
| Dollar values in thousands | ||||||||||
| Value | Percentage of Total Investments | |||||||||
Communication Services | $ | 10,999 | 0.6 | % | ||||||
Consumer Discretionary | 200,758 | 11.1 | ||||||||
Consumer Staples | 10,076 | 0.6 | ||||||||
Financials | 59,249 | 3.3 | ||||||||
Health Care | 604,481 | 33.4 | ||||||||
Industrials | 228,087 | 12.6 | ||||||||
Information Technology | 694,156 | 38.4 | ||||||||
|
|
|
| |||||||
Total investments | $ | 1,807,806 | 100.0 | % | ||||||
|
|
|
| |||||||
| TOP TEN HOLDINGS | |||||||
Company Name | Country | Percentage of Total Net Assets | |||||
Halozyme Therapeutics, Inc. | United States | 7.5 | % | ||||
Shockwave Medical, Inc. | United States | 6.1 | |||||
Lattice Semiconductor Corp. | United States | 5.2 | |||||
Argenx SE | Netherlands | 5.1 | |||||
Valmont Industries, Inc. | United States | 4.6 | |||||
Ascendis Pharma A/S | Denmark | 4.1 | |||||
Monolithic Power Systems, Inc. | United States | 3.7 | |||||
Blackline, Inc. | United States | 3.3 | |||||
Ingersoll Rand, Inc. | United States | 3.2 | |||||
Wingstop, Inc. | United States | 2.8 | |||||
|
| ||||||
Total | 45.6 | % | |||||
|
| ||||||
Definitions of abbreviations and footnotes are detailed on page 28.
The accompanying notes are an integral part of the financial statements.
| Artisan Partners Funds | 73 |
Artisan Sustainable Emerging Markets Fund
Schedule of Investments – September 30, 2022
Shares and dollar values in thousands
| Shares Held | Value | |||||||||
| COMMON STOCKS - 96.4% | ||||||||||
| ARGENTINA - 1.5% | ||||||||||
Despegar.com Corp.* | 95 | $ | 540 | |||||||
Loma Negra Cia Industrial Argentina SA, ADR | 61 | 381 | ||||||||
|
| |||||||||
| 921 | ||||||||||
| BRAZIL - 10.0% | ||||||||||
Aeris Industria E Comercio De Equipamentos Para Geracao De Energia SA | 687 | 256 | ||||||||
GPS Participacoes e Empreendimentos SA(1) | 387 | 960 | ||||||||
Itau Unibanco Holding SA (Preference)* | 250 | 1,296 | ||||||||
Lojas Renner SA* | 146 | 755 | ||||||||
MercadoLibre, Inc.* | 2 | 1,716 | ||||||||
Vale SA | 96 | 1,287 | ||||||||
|
| |||||||||
| 6,270 | ||||||||||
| CHILE - 1.7% | ||||||||||
Empresa Nacional de Telecomunicaciones SA | 183 | 519 | ||||||||
Vina Concha y Toro SA | 475 | 538 | ||||||||
|
| |||||||||
| 1,057 | ||||||||||
| CHINA - 21.9% | ||||||||||
Alibaba Group Holding Ltd.*(2) | 255 | 2,555 | ||||||||
Baidu, Inc., Class A*(2) | 70 | 1,030 | ||||||||
Baozun, Inc., ADR* | 19 | 117 | ||||||||
China Traditional Chinese Medicine Holdings Co. Ltd.(2) | 3,158 | 1,091 | ||||||||
Estun Automation Co. Ltd., Class A(2) | 645 | 1,711 | ||||||||
Kingsoft Cloud Holdings Ltd., ADR* | 61 | 122 | ||||||||
NIO, Inc., ADR* | 36 | 567 | ||||||||
Noah Holdings Ltd., ADR* | 28 | 366 | ||||||||
Prosus NV*(2) | 28 | 1,471 | ||||||||
Tongwei Co. Ltd., Class A(2) | 103 | 682 | ||||||||
Trip.com Group Ltd.*(2) | 31 | 848 | ||||||||
Wuhan Raycus Fiber Laser Technologies Co. Ltd., Class A*(2) | 211 | 661 | ||||||||
Xiabuxiabu Catering Management China Holdings Co. Ltd.(2) | 253 | 166 | ||||||||
Zhuzhou CRRC Times Electric Co. Ltd., Class H(2) | 565 | 2,371 | ||||||||
|
| |||||||||
| 13,758 | ||||||||||
| GREECE - 2.8% | ||||||||||
Alpha Services & Holdings SA*(2) | 1,068 | 832 | ||||||||
Mytilineos SA(2) | 70 | 954 | ||||||||
|
| |||||||||
| 1,786 | ||||||||||
| HONG KONG - 4.2% | ||||||||||
AIA Group Ltd.(2) | 136 | 1,127 | ||||||||
China High Precision Automation Group Ltd.*(2)(3) | 9,066 | – | ||||||||
Sino Biopharmaceutical Ltd.(2) | 3,247 | 1,510 | ||||||||
|
| |||||||||
| 2,637 | ||||||||||
| INDIA - 11.1% | ||||||||||
Havells India Ltd.(2) | 90 | 1,487 | ||||||||
ICICI Bank Ltd.(2) | 240 | 2,509 | ||||||||
Infosys Ltd.(2) | 58 | 986 | ||||||||
Reliance Industries Ltd.(2) | 68 | 1,960 | ||||||||
|
| |||||||||
| 6,942 | ||||||||||
| INDONESIA - 2.5% | ||||||||||
Bank Rakyat Indonesia Persero Tbk. PT(2) | 3,493 | 1,028 | ||||||||
Indofood CBP Sukses Makmur Tbk. PT(2) | 907 | 513 | ||||||||
|
| |||||||||
| 1,541 | ||||||||||
| KAZAKHSTAN - 1.9% | ||||||||||
Kaspi.KZ JSC, GDR(2) | 21 | 1,206 | ||||||||
| MALAYSIA - 1.5% | ||||||||||
Public Bank Bhd.(2) | 1,017 | 924 | ||||||||
| MEXICO - 2.2% | ||||||||||
Cemex SAB de CV* | 1,101 | 380 | ||||||||
Corp. Inmobiliaria Vesta SAB de CV | 534 | 996 | ||||||||
|
| |||||||||
| 1,376 | ||||||||||
| PERU - 1.4% | ||||||||||
Credicorp Ltd. | 7 | 859 | ||||||||
| PORTUGAL - 0.7% | ||||||||||
Jeronimo Martins SGPS SA(2) | 25 | 467 | ||||||||
| RUSSIA - 0.0% | ||||||||||
LUKOIL PJSC, ADR(2)(3)(4) | 19 | — | ||||||||
MMC Norilsk Nickel PJSC, ADR(2)(3)(4) | 39 | — | ||||||||
Ozon Holdings plc, ADR*(2)(3)(4) | 25 | — | ||||||||
Polyus PJSC, GDR(2)(3)(4) | 24 | — | ||||||||
Sberbank of Russia PJSC*(2)(3)(4) | 265 | — | ||||||||
Yandex NV, Class A*(2)(3)(4) | 14 | — | ||||||||
|
| |||||||||
| — | ||||||||||
| SINGAPORE - 0.4% | ||||||||||
Sea Ltd., ADR* | 5 | 259 | ||||||||
| SOUTH AFRICA - 2.8% | ||||||||||
FirstRand Ltd.(2) | 298 | 992 | ||||||||
MTN Group Ltd.(2) | 118 | 773 | ||||||||
|
| |||||||||
| 1,765 | ||||||||||
| SOUTH KOREA - 10.3% | ||||||||||
HYBE Co. Ltd.*(2) | 5 | 490 | ||||||||
Samsung Biologics Co. Ltd.*(2) | 2 | 1,280 | ||||||||
Samsung Electronics Co. Ltd.(2) | 109 | 4,022 | ||||||||
Shinhan Financial Group Co. Ltd.(2) | 28 | 652 | ||||||||
|
| |||||||||
| 6,444 | ||||||||||
| TAIWAN - 16.9% | ||||||||||
E Ink Holdings, Inc.(2) | 393 | 2,597 | ||||||||
MediaTek, Inc.(2) | 94 | 1,632 | ||||||||
Sunny Friend Environmental Technology Co. Ltd.(2) | 167 | 795 | ||||||||
Taiwan Semiconductor Manufacturing Co. Ltd.(2) | 426 | 5,595 | ||||||||
|
| |||||||||
| 10,619 | ||||||||||
| THAILAND - 0.8% | ||||||||||
Bangkok Bank PCL(2) | 133 | 480 | ||||||||
| UNITED STATES - 1.3% | ||||||||||
Globant SA* | 4 | 817 | ||||||||
| VIETNAM - 0.5% | ||||||||||
Vietnam Technological & Commercial Joint Stock Bank*(2) | 255 | 344 | ||||||||
|
| |||||||||
Total common stocks |
| 60,472 | ||||||||
| SHORT-TERM INVESTMENT - 2.3% | ||||||||||
| INVESTMENT COMPANY - 2.3% | ||||||||||
BlackRock Liquidity Funds Treasury Trust Fund - Institutional Class, 2.81% | 1,473 | 1,473 | ||||||||
Total investments - 98.7% |
| 61,945 | ||||||||
Other assets less liabilities - 1.3% |
| 786 | ||||||||
|
| |||||||||
Total net assets - 100.0%# |
| $ | 62,731 | |||||||
|
| |||||||||
| 74 | Artisan Partners Funds |
| (1) | Security exempt from registration pursuant to Rule 144A under the Securities Act of 1933. May be resold in transactions exempt from registration, normally to qualified institutional buyers. |
| (2) | Valued at a fair value in accordance with procedures established by the board of directors of Artisan Partners Funds. In total, securities valued at a fair value were $47,741, or 76.1% of total net assets. See notes 2(a) and 4 in Notes to Financial Statements for additional information. |
| (3) | Security is valued using significant unobservable inputs and is classified as Level 3 in the fair value hierarchy. |
| (4) | Security is restricted. |
| Security | Acquisition Dates | Cost | Value | Percentage of Total Net Assets | ||||||||||||||||
LUKOIL PJSC | 10/07/2021 - 12/23/2021 | $ | 1,026 | $ | – | 0.0 | % | |||||||||||||
MMC Norilsk Nickel PJSC | 10/07/2021 - 12/23/2021 | 736 | – | 0.0 | % | |||||||||||||||
Ozon Holdings plc | 10/07/2021 - 12/23/2021 | 900 | – | 0.0 | % | |||||||||||||||
Polyus PJSC | 10/07/2021 - 12/23/2021 | 1,320 | – | 0.0 | % | |||||||||||||||
Sberbank of Russia | 10/07/2021 - 12/23/2021 | 772 | – | 0.0 | % | |||||||||||||||
Yandex NV | 10/07/2021 - 12/31/2021 | 613 | – | 0.0 | % | |||||||||||||||
| PORTFOLIO DIVERSIFICATION | ||||||||||
| Dollar values in thousands | ||||||||||
| Value | Percentage of Total Investments | |||||||||
Communication Services | $ | 3,071 | 4.9 | % | ||||||
Consumer Discretionary | 8,735 | 14.1 | ||||||||
Consumer Staples | 2,200 | 3.5 | ||||||||
Energy | 1,960 | 3.2 | ||||||||
Financials | 12,615 | 20.4 | ||||||||
Health Care | 3,881 | 6.3 | ||||||||
Industrials | 8,534 | 13.8 | ||||||||
Information Technology | 16,432 | 26.5 | ||||||||
Materials | 2,048 | 3.3 | ||||||||
Real Estate | 996 | 1.6 | ||||||||
Short-Term Investment | 1,473 | 2.4 | ||||||||
|
|
|
| |||||||
Total investments | $ | 61,945 | 100.0 | % | ||||||
|
|
|
| |||||||
| TRADING CURRENCIES | ||||||||||
| Dollar values in thousands | ||||||||||
| Value | Percentage of Total Investments | |||||||||
BRL | $ | 4,554 | 7.4 | % | ||||||
CLP | 1,057 | 1.7 | ||||||||
CNY | 3,054 | 4.9 | ||||||||
EUR | 3,724 | 6.0 | ||||||||
HKD | 10,698 | 17.3 | ||||||||
IDR | 1,541 | 2.5 | ||||||||
INR | 6,942 | 11.2 | ||||||||
KRW | 6,444 | 10.4 | ||||||||
MXN | 1,376 | 2.2 | ||||||||
MYR | 924 | 1.5 | ||||||||
THB | 480 | 0.8 | ||||||||
TWD | 10,619 | 17.1 | ||||||||
USD | 8,423 | 13.6 | ||||||||
VND | 344 | 0.6 | ||||||||
ZAR | 1,765 | 2.8 | ||||||||
|
|
|
| |||||||
Total investments | $ | 61,945 | 100.0 | % | ||||||
|
|
|
| |||||||
| TOP TEN HOLDINGS | ||||||||||
Company Name | Country | Percentage of Total Net Assets | ||||||||
Taiwan Semiconductor Manufacturing Co. Ltd. | Taiwan | 8.9 | % | |||||||
Samsung Electronics Co. Ltd. | South Korea | 6.4 | ||||||||
E Ink Holdings, Inc. | Taiwan | 4.1 | ||||||||
Alibaba Group Holding Ltd. | China | 4.1 | ||||||||
ICICI Bank Ltd. | India | 4.0 | ||||||||
Zhuzhou CRRC Times Electric Co. Ltd. | China | 3.8 | ||||||||
Reliance Industries Ltd. | India | 3.1 | ||||||||
MercadoLibre, Inc. | Brazil | 2.7 | ||||||||
Estun Automation Co. Ltd. | China | 2.7 | ||||||||
MediaTek, Inc. | Taiwan | 2.6 | ||||||||
|
| |||||||||
Total | 42.4 | % | ||||||||
|
| |||||||||
Definitions of abbreviations and footnotes are detailed on page 28.
The accompanying notes are an integral part of the financial statements.
| Artisan Partners Funds | 75 |
Schedule of Investments – September 30, 2022
Shares and dollar values in thousands
| Shares Held | Value | |||||||||
| COMMON STOCKS - 97.9% | ||||||||||
| AEROSPACE & DEFENSE - 9.6% | ||||||||||
Airbus SE(1)(2) | 62 | $ | 5,349 | |||||||
Northrop Grumman Corp. | 16 | 7,641 | ||||||||
Raytheon Technologies Corp. | 56 | 4,599 | ||||||||
Safran SA(1)(2) | 47 | 4,235 | ||||||||
|
| |||||||||
| 21,824 | ||||||||||
| AIR FREIGHT & LOGISTICS - 2.9% | ||||||||||
FedEx Corp. | 44 | 6,472 | ||||||||
| BANKS - 2.0% | ||||||||||
Bank of America Corp. | 148 | 4,483 | ||||||||
| BEVERAGES - 0.8% | ||||||||||
Heineken Holding NV(1)(2) | 28 | 1,900 | ||||||||
| BIOTECHNOLOGY - 2.0% | ||||||||||
Vertex Pharmaceuticals, Inc.* | 16 | 4,614 | ||||||||
| CAPITAL MARKETS - 9.1% | ||||||||||
Blackstone, Inc., Class A | 53 | 4,405 | ||||||||
CME Group, Inc. | 20 | 3,605 | ||||||||
Goldman Sachs Group, Inc. (The) | 21 | 6,110 | ||||||||
Morgan Stanley | 83 | 6,563 | ||||||||
|
| |||||||||
| 20,683 | ||||||||||
| COMMUNICATIONS EQUIPMENT - 1.7% | ||||||||||
Cisco Systems, Inc. | 95 | 3,797 | ||||||||
| CONSUMER FINANCE - 2.2% | ||||||||||
Synchrony Financial | 176 | 4,975 | ||||||||
| DIVERSIFIED FINANCIAL SERVICES - 2.0% | ||||||||||
Berkshire Hathaway, Inc., Class B* | 17 | 4,562 | ||||||||
| ENERGY EQUIPMENT & SERVICES - 2.8% | ||||||||||
Schlumberger NV | 179 | 6,433 | ||||||||
| ENTERTAINMENT - 7.4% | ||||||||||
Electronic Arts, Inc. | 43 | 5,001 | ||||||||
Netflix, Inc.* | 20 | 4,635 | ||||||||
Walt Disney Co. (The)* | 31 | 2,940 | ||||||||
Warner Bros Discovery, Inc.* | 358 | 4,122 | ||||||||
|
| |||||||||
| 16,698 | ||||||||||
| HEALTH CARE EQUIPMENT & SUPPLIES - 3.5% | ||||||||||
Koninklijke Philips NV(1)(2) | 202 | 3,124 | ||||||||
Medtronic plc | 58 | 4,708 | ||||||||
|
| |||||||||
| 7,832 | ||||||||||
| HEALTH CARE PROVIDERS & SERVICES - 3.3% | ||||||||||
Cigna Corp. | 27 | 7,436 | ||||||||
| HOTELS, RESTAURANTS & LEISURE - 9.3% | ||||||||||
Booking Holdings, Inc.* | 4 | 7,363 | ||||||||
Compass Group plc(1)(2) | 385 | 7,695 | ||||||||
Marriott International, Inc., Class A | 43 | 6,054 | ||||||||
|
| |||||||||
| 21,112 | ||||||||||
| INSURANCE - 3.5% | ||||||||||
Arch Capital Group Ltd.* | 174 | 7,911 | ||||||||
| INTERACTIVE MEDIA & SERVICES - 7.7% | ||||||||||
Alphabet, Inc., Class C* | 118 | 11,342 | ||||||||
Meta Platforms, Inc., Class A* | 46 | 6,187 | ||||||||
|
| |||||||||
| 17,529 | ||||||||||
| IT SERVICES - 4.8% | ||||||||||
Fiserv, Inc.* | 49 | 4,541 | ||||||||
Visa, Inc., Class A | 36 | 6,459 | ||||||||
|
| |||||||||
| 11,000 | ||||||||||
| MEDIA - 2.6% | ||||||||||
Comcast Corp., Class A | 202 | 5,917 | ||||||||
| OIL, GAS & CONSUMABLE FUELS - 4.0% | ||||||||||
EOG Resources, Inc. | 81 | 9,037 | ||||||||
| PHARMACEUTICALS - 3.0% | ||||||||||
Merck & Co., Inc. | 80 | 6,853 | ||||||||
| SEMICONDUCTORS & SEMICONDUCTOR EQUIPMENT - 1.9% | ||||||||||
NXP Semiconductors NV(1) | 30 | 4,400 | ||||||||
| SPECIALTY RETAIL - 2.0% | ||||||||||
AutoNation, Inc.* | 44 | 4,520 | ||||||||
| TECHNOLOGY HARDWARE, STORAGE & PERIPHERALS - 2.3% | ||||||||||
Samsung Electronics Co. Ltd. (Preference)(1)(2) | 160 | 5,191 | ||||||||
| TOBACCO - 5.8% | ||||||||||
Altria Group, Inc. | 151 | 6,102 | ||||||||
Philip Morris International, Inc. | 84 | 6,977 | ||||||||
|
| |||||||||
| 13,079 | ||||||||||
| TRADING COMPANIES & DISTRIBUTORS - 1.7% | ||||||||||
Air Lease Corp. | 126 | 3,901 | ||||||||
|
| |||||||||
Total common stocks |
| 222,159 | ||||||||
| SHORT-TERM INVESTMENT - 0.8% | ||||||||||
| INVESTMENT COMPANY - 0.8% | ||||||||||
BlackRock Liquidity Funds Treasury Trust Fund - Institutional Class, 2.81% | 1,916 | 1,916 | ||||||||
|
| |||||||||
Total investments - 98.7% |
| 224,075 | ||||||||
Other assets less liabilities - 1.3% | 3,020 | |||||||||
|
| |||||||||
Total net assets - 100.0%# | $ | 227,095 | ||||||||
|
| |||||||||
| (1) | The Fund considers the company to be from outside the United States. See the Fund’s Statement of Additional Information for a description of the methodology used for country classifications. |
| Security | Country | Trading Currency | ||||||||
Airbus SE | France | EUR | ||||||||
Compass Group plc | United Kingdom | GBP | ||||||||
Heineken Holding NV | Netherlands | EUR | ||||||||
Koninklijke Philips NV | Netherlands | EUR | ||||||||
NXP Semiconductors NV | China | USD | ||||||||
Safran SA | France | EUR | ||||||||
Samsung Electronics Co. Ltd. | South Korea | KRW | ||||||||
| 76 | Artisan Partners Funds |
| (2) | Valued at a fair value in accordance with procedures established by the board of directors of Artisan Partners Funds. In total, securities valued at a fair value were $27,494, or 12.1% of total net assets. See notes 2(a) and 4 in Notes to Financial Statements for additional information. |
| PORTFOLIO DIVERSIFICATION | ||||||||||
| Dollar values in thousands | ||||||||||
| Value | Percentage of Total Investments | |||||||||
Communication Services | $ | 40,144 | 17.9 | % | ||||||
Consumer Discretionary | 25,632 | 11.4 | ||||||||
Consumer Staples | 14,980 | 6.7 | ||||||||
Energy | 15,470 | 6.9 | ||||||||
Financials | 42,614 | 19.0 | ||||||||
Health Care | 26,735 | 11.9 | ||||||||
Industrials | 32,196 | 14.4 | ||||||||
Information Technology | 24,388 | 10.9 | ||||||||
Short-Term Investment | 1,916 | 0.9 | ||||||||
|
|
|
| |||||||
Total investments | $ | 224,075 | 100.0 | % | ||||||
|
|
|
| |||||||
| TRADING CURRENCIES | ||||||||||
| Dollar values in thousands | ||||||||||
| Value | Percentage of Total Investments | |||||||||
EUR | $ | 14,608 | 6.5 | % | ||||||
GBP | 7,695 | 3.5 | ||||||||
KRW | 5,191 | 2.3 | ||||||||
USD | 196,581 | 87.7 | ||||||||
|
|
|
| |||||||
Total investments | $ | 224,075 | 100.0 | % | ||||||
|
|
|
| |||||||
| TOP TEN HOLDINGS | |||||||
Company Name | Country | Percentage of Total Net Assets | |||||
Alphabet, Inc. | United States | 5.0 | % | ||||
EOG Resources, Inc. | United States | 4.0 | |||||
Arch Capital Group Ltd. | United States | 3.5 | |||||
Compass Group plc | United Kingdom | 3.4 | |||||
Northrop Grumman Corp. | United States | 3.4 | |||||
Cigna Corp. | United States | 3.3 | |||||
Booking Holdings, Inc. | United States | 3.2 | |||||
Philip Morris International, Inc. | United States | 3.1 | |||||
Merck & Co., Inc. | United States | 3.0 | |||||
Morgan Stanley | United States | 2.9 | |||||
|
| ||||||
Total | 34.8 | % | |||||
|
| ||||||
Definitions of abbreviations and footnotes are detailed on page 28.
The accompanying notes are an integral part of the financial statements.
| Artisan Partners Funds | 77 |
Schedule of Investments – September 30, 2022
Principal amount, shares and dollar values in thousands
| Shares Held | Value | |||||||||
| COMMON STOCKS - 89.0% | ||||||||||
| AEROSPACE & DEFENSE - 4.7% | ||||||||||
Airbus SE(1)(2) | 1 | $ | 110 | |||||||
Raytheon Technologies Corp. | 2 | 195 | ||||||||
Safran SA(1)(2) | 1 | 121 | ||||||||
|
| |||||||||
| 426 | ||||||||||
| BANKS - 4.1% | ||||||||||
Bank of America Corp. | 6 | 170 | ||||||||
Bank of Hawaii Corp. | 3 | 207 | ||||||||
|
| |||||||||
| 377 | ||||||||||
| BEVERAGES - 4.5% | ||||||||||
Coca-Cola Co. (The) | 3 | 183 | ||||||||
Heineken Holding NV(1)(2) | 3 | 227 | ||||||||
|
| |||||||||
| 410 | ||||||||||
| CAPITAL MARKETS - 14.8% | ||||||||||
Blackstone, Inc., Class A | 2 | 147 | ||||||||
Carlyle Group, Inc. (The) | 4 | 113 | ||||||||
CME Group, Inc. | 1 | 146 | ||||||||
Cohen & Steers, Inc. | 3 | 168 | ||||||||
GCM Grosvenor, Inc., Class A | 18 | 140 | ||||||||
Goldman Sachs Group, Inc. (The) | –^ | 119 | ||||||||
Moelis & Co., Class A | 5 | 164 | ||||||||
Morgan Stanley | 2 | 149 | ||||||||
Northern Trust Corp. | 2 | 200 | ||||||||
|
| |||||||||
| 1,346 | ||||||||||
| COMMUNICATIONS EQUIPMENT - 1.3% | ||||||||||
Cisco Systems, Inc. | 3 | 122 | ||||||||
| CONSUMER FINANCE - 1.3% | ||||||||||
Synchrony Financial | 4 | 119 | ||||||||
| DIVERSIFIED CONSUMER SERVICES - 2.4% | ||||||||||
H&R Block, Inc.(3) | 5 | 216 | ||||||||
| ELECTRIC UTILITIES - 6.3% | ||||||||||
IDACORP, Inc. | 1 | 105 | ||||||||
OGE Energy Corp. | 6 | 206 | ||||||||
Portland General Electric Co. | 3 | 118 | ||||||||
PPL Corp. | 6 | 146 | ||||||||
|
| |||||||||
| 575 | ||||||||||
| ELECTRICAL EQUIPMENT - 2.9% | ||||||||||
nVent Electric plc | 8 | 263 | ||||||||
| EQUITY REAL ESTATE INVESTMENT TRUSTS (REITS) - 9.3% | ||||||||||
Camden Property Trust | 1 | 121 | ||||||||
Lamar Advertising Co., Class A | 3 | 287 | ||||||||
Public Storage | 1 | 201 | ||||||||
STORE Capital Corp. | 8 | 239 | ||||||||
|
| |||||||||
| 848 | ||||||||||
| FOOD & STAPLES RETAILING - 1.4% | ||||||||||
Sysco Corp. | 2 | 127 | ||||||||
| FOOD PRODUCTS - 2.1% | ||||||||||
Tyson Foods, Inc., Class A | 3 | 188 | ||||||||
| GAS UTILITIES - 1.6% | ||||||||||
Atmos Energy Corp. | 1 | 143 | ||||||||
| HEALTH CARE EQUIPMENT & SUPPLIES - 3.2% | ||||||||||
Koninklijke Philips NV(1)(2) | 7 | 101 | ||||||||
Medtronic plc | 2 | 187 | ||||||||
|
| |||||||||
| 288 | ||||||||||
| HOTELS, RESTAURANTS & LEISURE - 3.8% | ||||||||||
Compass Group plc(1)(2) | 10 | 196 | ||||||||
Vail Resorts, Inc. | 1 | 149 | ||||||||
|
| |||||||||
| 345 | ||||||||||
| IT SERVICES - 1.7% | ||||||||||
Visa, Inc., Class A | 1 | 156 | ||||||||
| MACHINERY - 2.0% | ||||||||||
Otis Worldwide Corp. | 3 | 182 | ||||||||
| MEDIA - 4.6% | ||||||||||
Cable One, Inc. | –^ | 93 | ||||||||
Comcast Corp., Class A | 6 | 186 | ||||||||
Omnicom Group, Inc. | 2 | 141 | ||||||||
|
| |||||||||
| 420 | ||||||||||
| OIL, GAS & CONSUMABLE FUELS - 3.2% | ||||||||||
EOG Resources, Inc. | 3 | 293 | ||||||||
| PHARMACEUTICALS - 2.2% | ||||||||||
Merck & Co., Inc.(3) | 2 | 197 | ||||||||
| PROFESSIONAL SERVICES - 1.3% | ||||||||||
Applus Services SA(1)(2) | 21 | 119 | ||||||||
| TECHNOLOGY HARDWARE, STORAGE & PERIPHERALS - 4.0% | ||||||||||
NetApp, Inc. | 3 | 187 | ||||||||
Samsung Electronics Co. Ltd. (Preference)(1)(2) | 5 | 176 | ||||||||
|
| |||||||||
| 363 | ||||||||||
| TOBACCO - 6.3% | ||||||||||
Altria Group, Inc. | 7 | 292 | ||||||||
Philip Morris International, Inc. | 3 | 286 | ||||||||
|
| |||||||||
| 578 | ||||||||||
Total common stocks |
| 8,101 | ||||||||
| Principal Amount | Value | |||||||||
| CORPORATE BONDS - 4.8% | ||||||||||
| AEROSPACE & DEFENSE - 2.2% | ||||||||||
Boeing Co. (The) 1.43%, 2/4/2024 | $ | 215 | 204 | |||||||
| ENERGY EQUIPMENT & SERVICES - 1.3% | ||||||||||
Weatherford International Ltd. 11.00%, 12/1/2024(4) | 117 | 119 | ||||||||
| TRADING COMPANIES & DISTRIBUTORS - 1.3% | ||||||||||
Air Lease Corp. | ||||||||||
Series C, (US Treasury Yield Curve Rate T Note Constant Maturity 5 Year + 3.15%), 4.12%, 12/15/2026(5)(6) | 173 | 119 | ||||||||
|
| |||||||||
Total corporate bonds |
| 442 | ||||||||
| 78 | Artisan Partners Funds |
| Principal Amount | Value | |||||||||
| CONVERTIBLE BONDS - 2.7% | ||||||||||
| MEDIA - 1.2% | ||||||||||
Cable One, Inc. | ||||||||||
Zero Coupon, 3/15/2026 | $ | 78 | $ | 59 | ||||||
1.13%, 3/15/2028 | 75 | 54 | ||||||||
|
| |||||||||
| 113 | ||||||||||
| MORTGAGE REAL ESTATE INVESTMENT TRUSTS (REITS) - 1.5% | ||||||||||
Redwood Trust, Inc. 7.75%, 6/15/2027(4) | 165 | 132 | ||||||||
|
| |||||||||
Total convertible bonds |
| 245 | ||||||||
| Shares Held | Value | |||||||||
| CONVERTIBLE PREFERRED STOCK - 1.5% | ||||||||||
HEALTH CARE EQUIPMENT & SUPPLIES - 1.5% | ||||||||||
Boston Scientific Corp. | ||||||||||
Series A, 5.50%, 6/1/2023 (Cost $162) | 1 | 142 | ||||||||
| SHORT-TERM INVESTMENTS - 2.8% | ||||||||||
| INVESTMENT COMPANIES - 2.8% | ||||||||||
BlackRock Liquidity Funds Treasury Trust Fund - Institutional Class, 2.81% | 86 | 86 | ||||||||
Federated Treasury Obligations Fund - Institutional Class, 2.85% | 83 | 83 | ||||||||
Fidelity Investments Money Market Treasury Portfolio - Institutional Class, 2.89% | 83 | 83 | ||||||||
|
| |||||||||
Total short-term investments | 252 | |||||||||
Total investments - 100.8% | 9,182 | |||||||||
Written Option Contracts - (0.1)% | (8 | ) | ||||||||
Other assets less liabilities - (0.7%) | (68 | ) | ||||||||
|
| |||||||||
Total net assets - 100.0%# | $ | 9,106 | ||||||||
|
| |||||||||
| (1) | The Fund considers the company to be from outside the United States. See the Fund’s Statement of Additional Information for a description of the methodology used for country classifications. |
| Security | Country | Trading Currency | |||||
Airbus SE | France | EUR | |||||
Applus Services SA | Spain | EUR | |||||
Compass Group plc | United Kingdom | GBP | |||||
Heineken Holding NV | Netherlands | EUR | |||||
Koninklijke Philips NV | Netherlands | EUR | |||||
Safran SA | France | EUR | |||||
Samsung Electronics Co. Ltd. | South Korea | KRW | |||||
| (2) | Valued at a fair value in accordance with procedures established by the board of directors of Artisan Partners Funds. In total, securities valued at a fair value were $1,050, or 11.5% of total net assets. See notes 2(a) and 4 in Notes to Financial Statements for additional information. |
| (3) | At September 30, 2022, all or a portion of this security was pledged to cover collateral requirements for written options. |
| (4) | Security exempt from registration pursuant to Rule 144A under the Securities Act of 1933. May be resold in transactions exempt from registration, normally to qualified institutional buyers. |
| (5) | Perpetual security. The rate reflected was the rate in effect on September 30, 2022. The maturity date reflects the next call date. |
| (6) | Variable or floating rate security, linked to the referenced benchmark. The interest rate shown is the current rate as of September 30, 2022. |
| Artisan Partners Funds | 79 |
| WRITTEN OPTION CONTRACTS | ||||||||||||||||||||||||||
| Call Options | ||||||||||||||||||||||||||
| Dollar values in thousands except exercise price | ||||||||||||||||||||||||||
| No. of Contracts‡ | Description | Exercise Price | Notional Amount | Expiration Date | Premiums (Received) by Fund | Market Value | Unrealized (Depreciation) | |||||||||||||||||||
| 8 | H&R Block, Inc. | $ | 37.00 | $ | 34 | 10/21/22 | $ | (2 | ) | $ | (5 | ) | $ | (3 | ) | |||||||||||
| 8 | H&R Block, Inc. | 42.00 | 34 | 1/20/23 | (3 | ) | (3 | ) | –^ | |||||||||||||||||
| 2 | IDACORP, Inc. | 115.00 | 20 | 11/18/22 | –^ | –^ | –^ | |||||||||||||||||||
| 4 | Portland General Electric Co. | 55.00 | 17 | 12/16/22 | –^ | –^ | –^ | |||||||||||||||||||
|
|
|
|
|
| |||||||||||||||||||||
Total written option contracts | $ | (5 | ) | $ | (8 | ) | $ | (3 | ) | |||||||||||||||||
|
|
|
|
|
| |||||||||||||||||||||
| PORTFOLIO DIVERSIFICATION | ||||||||||
| Dollar values in thousands | ||||||||||
| Value | Percentage of Total Investments | |||||||||
Communication Services | $ | 533 | 5.8 | % | ||||||
Consumer Discretionary | 561 | 6.1 | ||||||||
Consumer Staples | 1,303 | 14.2 | ||||||||
Energy | 412 | 4.5 | ||||||||
Financials | 1,974 | 21.5 | ||||||||
Health Care | 626 | 6.8 | ||||||||
Industrials | 1,314 | 14.3 | ||||||||
Information Technology | 641 | 7.0 | ||||||||
Real Estate | 848 | 9.2 | ||||||||
Utilities | 718 | 7.8 | ||||||||
Short-Term Investment | 252 | 2.8 | ||||||||
|
|
|
| |||||||
Total investments | $ | 9,182 | 100.0 | % | ||||||
|
|
|
| |||||||
| TRADING CURRENCIES | ||||||||||
| Dollar values in thousands | ||||||||||
| Value | Percentage of Total Investments | |||||||||
EUR | $ | 679 | 7.4 | % | ||||||
GBP | 196 | 2.1 | ||||||||
KRW | 176 | 1.9 | ||||||||
USD | 8,131 | 88.6 | ||||||||
|
|
|
| |||||||
Total investments | $ | 9,182 | 100.0 | % | ||||||
|
|
|
| |||||||
| TOP TEN HOLDINGS | ||||||||
Company Name | Country | Percentage of Total Net Assets | ||||||
EOG Resources, Inc. | United States | 3.2 | % | |||||
Altria Group, Inc. | United States | 3.2 | ||||||
Lamar Advertising Co. | United States | 3.1 | ||||||
Philip Morris International, Inc. | United States | 3.1 | ||||||
nVent Electric plc | United States | 2.9 | ||||||
STORE Capital Corp. | United States | 2.6 | ||||||
Heineken Holding NV | Netherlands | 2.5 | ||||||
H&R Block, Inc. | United States | 2.4 | ||||||
Bank of Hawaii Corp. | United States | 2.3 | ||||||
Cable One, Inc. | United States | 2.3 | ||||||
|
| |||||||
Total | 27.6 | % | ||||||
|
| |||||||
Definitions of abbreviations and footnotes are detailed on page 28.
The accompanying notes are an integral part of the financial statements.
| 80 | Artisan Partners Funds |
Statements of Assets and Liabilities – September 30, 2022
Dollar values in thousands
| DEVELOPING WORLD | EMERGING MARKETS DEBT OPPORTUNITIES | FLOATING RATE | FOCUS | |||||||||||||||||
| ASSETS: |
| |||||||||||||||||||
Investments in securities, unaffiliated, at value | $ | 3,203,734 | $ | 17,311 | $ | 42,755 | $ | 1,541,240 | ||||||||||||
Short-term investments, at value | – | 3,149 | 5,124 | 30,961 | ||||||||||||||||
Total investments | 3,203,734 | 20,460 | 47,879 | 1,572,201 | ||||||||||||||||
Cash | 26,852 | – | 380 | 13,723 | ||||||||||||||||
Cash pledged for centrally cleared credit default swap contracts | – | 336 | – | – | ||||||||||||||||
Deposits with broker for forward contracts | – | 128 | – | – | ||||||||||||||||
Deposits with broker for futures contracts | – | 182 | – | – | ||||||||||||||||
Due from broker | – | 4 | – | – | ||||||||||||||||
Foreign currency | 15,590 | 1 | – | – | ||||||||||||||||
Unrealized appreciation on foreign currency forward contracts | – | 176 | – | 9,533 | ||||||||||||||||
Receivable from investments sold | 23,617 | 3,504 | 1,447 | 45,498 | ||||||||||||||||
Receivable from fund shares sold | 3,412 | – | 1 | 1,012 | ||||||||||||||||
Dividends and interest receivable | 124 | 373 | 155 | 776 | ||||||||||||||||
Other assets | 300 | 2 | 2 | 77 | ||||||||||||||||
Total assets | 3,273,629 | 25,166 | 49,864 | 1,642,820 | ||||||||||||||||
| LIABILITIES: |
| |||||||||||||||||||
Unrealized depreciation on foreign currency forward contracts | – | 141 | – | 553 | ||||||||||||||||
Dividends payable | – | – | 1 | – | ||||||||||||||||
Due to custodian | – | 11 | – | – | ||||||||||||||||
Payable for investments purchased | 12,332 | 3,717 | 2,337 | 32,744 | ||||||||||||||||
Payable for fund shares redeemed | 8,132 | – | 101 | 482 | ||||||||||||||||
Payable for variation margin on futures contracts | – | 5 | – | – | ||||||||||||||||
Payable for variation margin on centrally cleared credit default swap contracts | – | 3 | – | – | ||||||||||||||||
Payable for variation margin on centrally cleared interest rate swap contracts | – | 9 | – | – | ||||||||||||||||
Payable to the Adviser | – | – | 71 | – | ||||||||||||||||
Payable for operating expenses | 1,016 | 73 | 119 | 401 | ||||||||||||||||
Payable for management fees | 278 | 7 | – | 133 | ||||||||||||||||
Payable for deferred director’s compensation | 265 | 1 | 2 | 65 | ||||||||||||||||
Total liabilities | 22,023 | 3,967 | 2,631 | 34,378 | ||||||||||||||||
Total net assets | $ | 3,251,606 | $ | 21,199 | $ | 47,233 | $ | 1,608,442 | ||||||||||||
| NET ASSETS CONSIST OF: |
| |||||||||||||||||||
Fund shares issued and outstanding | $ | 4,166,605 | $ | 22,066 | $ | 50,678 | $ | 1,762,847 | ||||||||||||
Total distributable loss | (914,999 | ) | (867 | ) | (3,445 | ) | (154,405 | ) | ||||||||||||
Total net assets | $ | 3,251,606 | $ | 21,199 | $ | 47,233 | $ | 1,608,442 | ||||||||||||
| SUPPLEMENTARY INFORMATION: | ||||||||||||||||||||
Net assets |
| |||||||||||||||||||
Investor Shares | $ | 349,016 | $ | 88 | $ | 2,451 | $ | 237,102 | ||||||||||||
Advisor Shares | $ | 1,620,067 | $ | 433 | $ | 16,705 | $ | 817,890 | ||||||||||||
Institutional Shares | $ | 1,282,523 | $ | 20,678 | $ | 28,077 | $ | 553,450 | ||||||||||||
Shares outstanding (Indefinite number of shares authorized, $0.01 par value) | ||||||||||||||||||||
Investor Shares | 28,794,928 | 9,134 | 263,469 | 15,613,057 | ||||||||||||||||
Advisor Shares | 132,216,436 | 45,171 | 1,796,097 | 53,627,071 | ||||||||||||||||
Institutional Shares | 104,002,149 | 2,154,833 | 3,019,054 | 36,177,875 | ||||||||||||||||
Net asset value per share | ||||||||||||||||||||
Investor Shares | $ | 12.12 | $ | 9.60 | $ | 9.30 | $ | 15.19 | ||||||||||||
Advisor Shares | $ | 12.25 | $ | 9.60 | $ | 9.30 | $ | 15.25 | ||||||||||||
Institutional Shares | $ | 12.33 | $ | 9.60 | $ | 9.30 | $ | 15.30 | ||||||||||||
Cost of total investments | $ | 3,205,184 | $ | 21,985 | $ | 50,729 | $ | 1,581,003 | ||||||||||||
Cost of foreign currency held | $ | 15,645 | $ | 1 | $ | – | $ | – | ||||||||||||
The accompanying notes are an integral part of the financial statements.
| Artisan Partners Funds | 81 |
ARTISAN PARTNERS FUNDS
Statements of Assets and Liabilities – September 30, 2022 (Continued)
Dollar values in thousands
| GLOBAL DISCOVERY | GLOBAL EQUITY | GLOBAL OPPORTUNITIES | GLOBAL UNCONSTRAINED | |||||||||||||||||
| ASSETS: | ||||||||||||||||||||
Investments in securities, unaffiliated, at value | $ | 222,183 | $ | 167,508 | $ | 3,039,858 | $ | 10,724 | ||||||||||||
Short-term investments, at value | 9,356 | 2,519 | 107,854 | 5,287 | ||||||||||||||||
Total investments | 231,539 | 170,027 | 3,147,712 | 16,011 | ||||||||||||||||
Cash | 1,928 | 1,902 | 33,479 | 14 | ||||||||||||||||
Cash pledged for centrally cleared credit default swap contracts | – | – | – | 594 | ||||||||||||||||
Deposits with broker for foreign currency forward contracts | – | – | – | 338 | ||||||||||||||||
Deposits with broker for futures contracts | – | – | – | 29 | ||||||||||||||||
Due from broker | – | – | – | 3 | ||||||||||||||||
Foreign currency | 13 | 181 | 353 | 1 | ||||||||||||||||
Unrealized appreciation on foreign currency forward contracts | – | – | – | 127 | ||||||||||||||||
Receivable from investments sold | 559 | 13,053 | 11,717 | 1,152 | ||||||||||||||||
Receivable from fund shares sold | 23 | 2 | 1,741 | 5 | ||||||||||||||||
Receivable for variation margin on futures contracts | – | – | – | 78 | ||||||||||||||||
Dividends and interest receivable | 142 | 367 | 3,429 | 207 | ||||||||||||||||
Other assets | 14 | 19 | 277 | 1 | ||||||||||||||||
Total assets | 234,218 | 185,551 | 3,198,708 | 18,560 | ||||||||||||||||
| LIABILITIES: |
| |||||||||||||||||||
Short positions in securities, at value | – | – | – | 1,978 | ||||||||||||||||
Unrealized depreciation on foreign currency forward contracts | – | – | – | 54 | ||||||||||||||||
Payable for investments purchased | 1,506 | 8,143 | 20,799 | 1,398 | ||||||||||||||||
Payable for fund shares redeemed | 126 | 907 | 2,490 | – | ||||||||||||||||
Payable for variation margin on centrally cleared credit default swap contracts | – | – | – | 12 | ||||||||||||||||
Payable for variation margin on centrally cleared interest rate swap contracts | – | – | – | 2 | ||||||||||||||||
Payable for operating expenses | 153 | 217 | 870 | 73 | ||||||||||||||||
Payable for management fees | 20 | 15 | 235 | 7 | ||||||||||||||||
Payable for deferred director’s compensation | 12 | 18 | 249 | 1 | ||||||||||||||||
Total liabilities | 1,817 | 9,300 | 24,643 | 3,525 | ||||||||||||||||
Total net assets | $ | 232,401 | $ | 176,251 | $ | 3,174,065 | $ | 15,035 | ||||||||||||
| NET ASSETS CONSIST OF: |
| |||||||||||||||||||
Fund shares issued and outstanding | $ | 261,960 | $ | 206,935 | $ | 2,803,333 | $ | 14,886 | ||||||||||||
Total distributable earnings (loss) | (29,559 | ) | (30,684 | ) | 370,732 | 149 | ||||||||||||||
Total net assets | $ | 232,401 | $ | 176,251 | $ | 3,174,065 | $ | 15,035 | ||||||||||||
| SUPPLEMENTARY INFORMATION: | ||||||||||||||||||||
Net assets |
| |||||||||||||||||||
Investor Shares | $ | 36,925 | $ | 66,270 | $ | 782,904 | $ | 466 | ||||||||||||
Advisor Shares | $ | 13,438 | $ | 4,027 | $ | 625,332 | $ | 2,011 | ||||||||||||
Institutional Shares | $ | 182,038 | $ | 105,954 | $ | 1,765,829 | $ | 12,558 | ||||||||||||
Shares outstanding (Indefinite number of shares authorized, $0.01 par value) | ||||||||||||||||||||
Investor Shares | 2,610,154 | 4,671,281 | 32,192,107 | 46,160 | ||||||||||||||||
Advisor Shares | 947,997 | 283,775 | 25,452,631 | 198,939 | ||||||||||||||||
Institutional Shares | 12,777,713 | 7,356,112 | 70,828,370 | 1,242,210 | ||||||||||||||||
Net asset value per share | ||||||||||||||||||||
Investor Shares | $ | 14.15 | $ | 14.19 | $ | 24.32 | $ | 10.10 | ||||||||||||
Advisor Shares | $ | 14.18 | $ | 14.19 | $ | 24.57 | $ | 10.11 | ||||||||||||
Institutional Shares | $ | 14.25 | $ | 14.40 | $ | 24.93 | $ | 10.11 | ||||||||||||
Cost of total investments | $ | 240,463 | $ | 187,495 | $ | 2,714,844 | $ | 16,887 | ||||||||||||
Cost of foreign currency held | $ | 13 | $ | 184 | $ | 353 | $ | 1 | ||||||||||||
Proceeds from short positions in securities | $ | – | $ | – | $ | – | $ | 2,102 | ||||||||||||
The accompanying notes are an integral part of the financial statements.
| 82 | Artisan Partners Funds |
ARTISAN PARTNERS FUNDS
Statements of Assets and Liabilities – September 30, 2022 (Continued)
Dollar values in thousands
| GLOBAL VALUE | HIGH INCOME | INTERNATIONAL | INTERNATIONAL EXPLORER | |||||||||||||||||
| ASSETS: |
| |||||||||||||||||||
Investments in securities, unaffiliated, at value(2) | $ | 1,748,327 | $ | 5,096,397 | $ | 4,794,401 | $ | 17,802 | ||||||||||||
Short-term investments, at value | 52,414 | 607,917 | 224,046 | 2,943 | ||||||||||||||||
Total investments | 1,800,741 | 5,704,314 | 5,018,447 | 20,745 | ||||||||||||||||
Cash | 14,747 | 47,807 | 56,137 | – | ||||||||||||||||
Due from broker | – | 1,672 | – | – | ||||||||||||||||
Foreign currency | – | – | 1,440 | 13 | ||||||||||||||||
Unrealized appreciation on foreign currency forward contracts | – | 48 | – | – | ||||||||||||||||
Receivable from investments sold | 5,726 | 12,920 | 103,072 | 159 | ||||||||||||||||
Receivable from fund shares sold | 3,983 | 11,744 | 2,026 | 6 | ||||||||||||||||
Receivable for variation margin on futures contracts | – | 253 | – | – | ||||||||||||||||
Receivable from the Adviser | – | – | – | 1 | ||||||||||||||||
Dividends and interest receivable | 7,323 | 85,680 | 22,317 | 14 | ||||||||||||||||
Securities lending income receivable | – | – | 166 | – | ||||||||||||||||
Other assets | 199 | 312 | 821 | — | (1) | |||||||||||||||
Total assets | 1,832,719 | 5,864,750 | 5,204,426 | 20,938 | ||||||||||||||||
| LIABILITIES: |
| |||||||||||||||||||
Dividends payable | – | 6,824 | – | – | ||||||||||||||||
Payable for investments purchased | 11,045 | 31,195 | 160,194 | 352 | ||||||||||||||||
Payable for fund shares redeemed | 2,282 | 15,901 | 17,667 | – | ||||||||||||||||
Payable upon return of securities loaned | – | – | 29,932 | – | ||||||||||||||||
Foreign currency overdraft payable | 19 | – | – | – | ||||||||||||||||
Payable for operating expenses | 915 | 1,159 | 1,933 | 50 | ||||||||||||||||
Payable for management fees | 149 | 324 | 387 | – | ||||||||||||||||
Payable for deferred director’s compensation | 184 | 275 | 775 | – | ||||||||||||||||
Total liabilities | 14,594 | 55,678 | 210,888 | 402 | ||||||||||||||||
Total net assets | $ | 1,818,125 | $ | 5,809,072 | $ | 4,993,538 | $ | 20,536 | ||||||||||||
| NET ASSETS CONSIST OF: |
| |||||||||||||||||||
Fund shares issued and outstanding | $ | 1,783,601 | $ | 6,696,106 | $ | 5,292,326 | $ | 23,903 | ||||||||||||
Total distributable earnings (loss) | 34,524 | (887,034 | ) | (298,788 | ) | (3,367 | ) | |||||||||||||
Total net assets | $ | 1,818,125 | $ | 5,809,072 | $ | 4,993,538 | $ | 20,536 | ||||||||||||
| SUPPLEMENTARY INFORMATION: | ||||||||||||||||||||
Net assets |
| |||||||||||||||||||
Investor Shares | $ | 199,274 | $ | 756,049 | $ | 1,575,634 | ||||||||||||||
Advisor Shares | $ | 254,970 | $ | 2,570,217 | $ | 829,517 | $ | 5,811 | ||||||||||||
Institutional Shares | $ | 1,363,881 | $ | 2,482,806 | $ | 2,588,387 | $ | 14,725 | ||||||||||||
Shares outstanding (Indefinite number of shares authorized, $0.01 par value) | ||||||||||||||||||||
Investor Shares | 12,802,830 | 89,395,958 | 75,267,504 | |||||||||||||||||
Advisor Shares | 16,391,983 | 304,129,422 | 39,754,388 | 668,800 | ||||||||||||||||
Institutional Shares | 87,404,544 | 293,820,128 | 122,749,471 | 1,694,494 | ||||||||||||||||
Net asset value per share | ||||||||||||||||||||
Investor Shares | $ | 15.56 | $ | 8.46 | $ | 20.93 | ||||||||||||||
Advisor Shares | $ | 15.55 | $ | 8.45 | $ | 20.87 | $ | 8.69 | ||||||||||||
Institutional Shares | $ | 15.60 | $ | 8.45 | $ | 21.09 | $ | 8.69 | ||||||||||||
Cost of total investments | $ | 1,775,664 | $ | 6,608,815 | $ | 5,390,826 | $ | 23,940 | ||||||||||||
Cost of foreign currency held | $ | (19 | ) | $ | – | $ | 1,444 | $ | 13 | |||||||||||
| (1) | Amount rounds to less than $1 |
| (2) | Includes value of securities on loan of $25,157 for International |
The accompanying notes are an integral part of the financial statements.
| Artisan Partners Funds | 83 |
ARTISAN PARTNERS FUNDS
Statements of Assets and Liabilities – September 30, 2022 (Continued)
Dollar values in thousands
| INTERNATIONAL SMALL-MID | INTERNATIONAL VALUE | MID CAP | MID CAP VALUE | |||||||||||||||||
| ASSETS: |
| |||||||||||||||||||
Investments in securities, unaffiliated, at value | $ | 3,414,478 | $ | 17,194,884 | $ | 4,077,893 | $ | 1,275,036 | ||||||||||||
Investments in securities, affiliated, at value | 227,749 | 1,580,116 | – | – | ||||||||||||||||
Short-term investments, at value | 279,761 | 1,283,119 | 127,061 | 20,320 | ||||||||||||||||
Total investments | 3,921,988 | 20,058,119 | 4,204,954 | 1,295,356 | ||||||||||||||||
Cash | 37,128 | 127,350 | 44,359 | 12,018 | ||||||||||||||||
Foreign currency | – | 11,989 | — | (1) | – | |||||||||||||||
Receivable from investments sold | 2,261 | 132,213 | 10,523 | – | ||||||||||||||||
Receivable from fund shares sold | 5,766 | 43,836 | 4,093 | 420 | ||||||||||||||||
Dividends and interest receivable | 11,364 | 83,073 | 391 | 1,464 | ||||||||||||||||
Other assets | 190 | 1,222 | 467 | 209 | ||||||||||||||||
Total assets | 3,978,697 | 20,457,802 | 4,264,787 | 1,309,467 | ||||||||||||||||
| LIABILITIES: |
| |||||||||||||||||||
Swaps contracts, at value | – | 498 | – | – | ||||||||||||||||
Payable for investments purchased | 4,783 | 288,252 | 13,661 | – | ||||||||||||||||
Payable for fund shares redeemed | 3,899 | 21,406 | 4,038 | 629 | ||||||||||||||||
Foreign currency overdraft payable | 45 | – | – | – | ||||||||||||||||
Payable for operating expenses | 909 | 10,943 | 1,101 | 568 | ||||||||||||||||
Payable for management fees | 337 | 1,540 | 332 | 105 | ||||||||||||||||
Payable for deferred director’s compensation | 161 | 1,086 | 432 | 198 | ||||||||||||||||
Payable for foreign taxes on unrealized gains | – | 3,047 | – | – | ||||||||||||||||
Total liabilities | 10,134 | 326,772 | 19,564 | 1,500 | ||||||||||||||||
Total net assets | $ | 3,968,563 | $ | 20,131,030 | $ | 4,245,223 | $ | 1,307,967 | ||||||||||||
| NET ASSETS CONSIST OF: |
| |||||||||||||||||||
Fund shares issued and outstanding | $ | 4,498,002 | $ | 21,098,423 | $ | 3,530,125 | $ | 700,088 | ||||||||||||
Total distributable earnings (loss) | (529,439 | ) | (967,393 | ) | 715,098 | 607,879 | ||||||||||||||
Total net assets | $ | 3,968,563 | $ | 20,131,030 | $ | 4,245,223 | $ | 1,307,967 | ||||||||||||
| SUPPLEMENTARY INFORMATION: | ||||||||||||||||||||
Net assets |
| |||||||||||||||||||
Investor Shares | $ | 301,480 | $ | 2,059,112 | $ | 1,387,480 | $ | 391,804 | ||||||||||||
Advisor Shares | $ | 1,161,239 | $ | 4,705,187 | $ | 572,155 | $ | 397,898 | ||||||||||||
Institutional Shares | $ | 2,505,844 | $ | 13,366,731 | $ | 2,285,588 | $ | 518,265 | ||||||||||||
Shares outstanding (Indefinite number of shares authorized, $0.01 par value) | ||||||||||||||||||||
Investor Shares | 21,696,089 | 62,470,179 | 48,770,608 | 22,900,711 | ||||||||||||||||
Advisor Shares | 83,279,661 | 143,059,641 | 19,718,893 | 23,317,875 | ||||||||||||||||
Institutional Shares | 177,522,654 | 404,568,249 | 67,269,133 | 30,337,726 | ||||||||||||||||
Net asset value per share | ||||||||||||||||||||
Investor Shares | $ | 13.90 | $ | 32.96 | $ | 28.45 | $ | 17.11 | ||||||||||||
Advisor Shares | $ | 13.94 | $ | 32.89 | $ | 29.02 | $ | 17.06 | ||||||||||||
Institutional Shares | $ | 14.12 | $ | 33.04 | $ | 33.98 | $ | 17.08 | ||||||||||||
Cost of total investments excluding affiliated issuers | $ | 3,964,425 | $ | 20,031,403 | $ | 3,413,074 | $ | 923,733 | ||||||||||||
Cost of securities of affiliated issuers held | $ | 295,057 | $ | 1,160,677 | $ | – | $ | – | ||||||||||||
Cost of foreign currency held | $ | (50 | ) | $ | 12,009 | $ | — | (1) | $ | – | ||||||||||
| (1) | Amount rounds to less than $1 |
The accompanying notes are an integral part of the financial statements.
| 84 | Artisan Partners Funds |
ARTISAN PARTNERS FUNDS
Statements of Assets and Liabilities – September 30, 2022 (Continued)
Dollar values in thousands
| SELECT EQUITY | SMALL CAP | SUSTAINABLE EMERGING MARKETS | VALUE | |||||||||||||||||
| ASSETS: |
| |||||||||||||||||||
Investments in securities, unaffiliated, at value | $ | 28,158 | $ | 1,807,806 | $ | 60,472 | $ | 222,159 | ||||||||||||
Short-term investments, at value | 1,327 | – | 1,473 | 1,916 | ||||||||||||||||
Total investments | 29,485 | 1,807,806 | 61,945 | 224,075 | ||||||||||||||||
Cash | 147 | 14,956 | 431 | 2,195 | ||||||||||||||||
Foreign currency | – | – | 765 | — | (1) | |||||||||||||||
Receivable from investments sold | – | – | – | 1,885 | ||||||||||||||||
Receivable from fund shares sold | 1 | 1,506 | 167 | 196 | ||||||||||||||||
Dividends and interest receivable | 29 | 317 | 80 | 567 | ||||||||||||||||
Other assets | 6 | 167 | 13 | 34 | ||||||||||||||||
Total assets | 29,668 | 1,824,752 | 63,401 | 228,952 | ||||||||||||||||
| LIABILITIES: |
| |||||||||||||||||||
Payable for investments purchased | – | – | 37 | 1,455 | ||||||||||||||||
Payable for fund shares redeemed | – | 8,325 | – | 127 | ||||||||||||||||
Payable to the Adviser | – | – | 16 | – | ||||||||||||||||
Payable for operating expenses | 94 | 604 | 277 | 224 | ||||||||||||||||
Payable for management fees | 12 | 144 | 28 | 18 | ||||||||||||||||
Payable for deferred director’s compensation | 6 | 152 | 12 | 33 | ||||||||||||||||
Payable for foreign taxes on unrealized gains | – | – | 300 | – | ||||||||||||||||
Total liabilities | 112 | 9,225 | 670 | 1,857 | ||||||||||||||||
Total net assets | $ | 29,556 | $ | 1,815,527 | $ | 62,731 | $ | 227,095 | ||||||||||||
| NET ASSETS CONSIST OF: |
| |||||||||||||||||||
Fund shares issued and outstanding | $ | 33,841 | $ | 1,876,966 | $ | 211,380 | $ | 151,231 | ||||||||||||
Total distributable earnings (loss) | (4,285 | ) | (61,439 | ) | (148,649 | ) | 75,864 | |||||||||||||
Total net assets | $ | 29,556 | $ | 1,815,527 | $ | 62,731 | $ | 227,095 | ||||||||||||
| SUPPLEMENTARY INFORMATION: | ||||||||||||||||||||
Net assets |
| |||||||||||||||||||
Investor Shares | $ | 2,345 | $ | 571,380 | $ | 12,297 | $ | 82,183 | ||||||||||||
Advisor Shares | $ | 1,561 | $ | 361,941 | $ | 26,872 | $ | 54,633 | ||||||||||||
Institutional Shares | $ | 25,650 | $ | 882,206 | $ | 23,562 | $ | 90,279 | ||||||||||||
Shares outstanding (Indefinite number of shares authorized, $0.01 par value) | ||||||||||||||||||||
Investor Shares | 238,276 | 20,542,128 | 985,525 | 6,835,821 | ||||||||||||||||
Advisor Shares | 158,239 | 12,891,216 | 2,154,303 | 4,562,313 | ||||||||||||||||
Institutional Shares | 2,613,591 | 30,695,543 | 1,854,197 | 7,532,985 | ||||||||||||||||
Net asset value per share | ||||||||||||||||||||
Investor Shares | $ | 9.84 | $ | 27.82 | $ | 12.48 | $ | 12.02 | ||||||||||||
Advisor Shares | $ | 9.87 | $ | 28.08 | $ | 12.47 | $ | 11.97 | ||||||||||||
Institutional Shares | $ | 9.81 | $ | 28.74 | $ | 12.71 | $ | 11.98 | ||||||||||||
Cost of total investments | $ | 34,145 | $ | 1,485,756 | $ | 75,951 | $ | 182,461 | ||||||||||||
Cost of foreign currency held | $ | – | $ | – | $ | 776 | $ | — | (1) | |||||||||||
| (1) | Amount rounds to less than $1 |
The accompanying notes are an integral part of the financial statements.
| Artisan Partners Funds | 85 |
ARTISAN PARTNERS FUNDS
Statements of Assets and Liabilities – September 30, 2022 (Continued)
Dollar values in thousands
| VALUE INCOME | |||||
| ASSETS: |
| ||||
Investments in securities, unaffiliated, at value | $ | 8,930 | |||
Short-term investments, at value | 252 | ||||
Total investments | 9,182 | ||||
Foreign currency | 2 | ||||
Receivable from fund shares sold | 25 | ||||
Dividends and interest receivable | 39 | ||||
Other assets | 1 | ||||
Total assets | 9,249 | ||||
| LIABILITIES: |
| ||||
Written options, at value | 8 | (1) | |||
Payable to the Adviser | 42 | ||||
Payable for operating expenses | 76 | ||||
Payable for management fees | 16 | ||||
Payable for deferred director’s compensation | 1 | ||||
Total liabilities | 143 | ||||
Total net assets | $ | 9,106 | |||
| NET ASSETS CONSIST OF: |
| ||||
Fund shares issued and outstanding | $ | 11,088 | |||
Total distributable loss | (1,982 | ) | |||
Total net assets | $ | 9,106 | |||
| SUPPLEMENTARY INFORMATION: | |||||
Net assets |
| ||||
Investor Shares | $ | 733 | |||
Advisor Shares | $ | 1,178 | |||
Institutional Shares | $ | 7,195 | |||
Shares outstanding (Indefinite number of shares authorized, $0.01 par value) | |||||
Investor Shares | 89,885 | ||||
Advisor Shares | 144,520 | ||||
Institutional Shares | 882,462 | ||||
Net asset value per share | |||||
Investor Shares | $ | 8.15 | |||
Advisor Shares | $ | 8.15 | |||
Institutional Shares | $ | 8.15 | |||
Cost of total investments | $ | 11,079 | |||
Cost of foreign currency held | $ | 2 | |||
| (1) | Written options, premiums received $5 |
The accompanying notes are an integral part of the financial statements.
| 86 | Artisan Partners Funds |
Statements of Operations – For the Year Ended September 30, 2022
Dollar values in thousands
| DEVELOPING WORLD | EMERGING MARKETS DEBT OPPORTUNITIES(1) | FLOATING RATE(2) | FOCUS | |||||||||||||||||
| INVESTMENT INCOME: | ||||||||||||||||||||
Dividends, from unaffiliated issuers(3) | $ | 12,794 | $ | 3 | $ | 26 | $ | 19,104 | ||||||||||||
Income from non-cash dividends | 7,970 | – | – | – | ||||||||||||||||
Interest | 220 | 599 | 1,812 | 66 | ||||||||||||||||
Total investment income | 20,984 | 602 | 1,838 | 19,170 | ||||||||||||||||
| EXPENSES: | ||||||||||||||||||||
Management fees | 57,642 | 76 | 241 | 20,362 | ||||||||||||||||
Transfer agent fees | ||||||||||||||||||||
Investor Shares | 1,502 | 16 | 29 | 664 | ||||||||||||||||
Advisor Shares | 2,455 | 15 | 36 | 1,012 | ||||||||||||||||
Institutional Shares | 43 | 15 | 23 | 29 | ||||||||||||||||
Shareholder Communications | 239 | 27 | 27 | 46 | ||||||||||||||||
Custodian fees | 421 | 17 | 3 | 51 | ||||||||||||||||
Accounting fees | 79 | 1 | 67 | 72 | ||||||||||||||||
Professional fees | 284 | 15 | 31 | 97 | ||||||||||||||||
Registration fees | ||||||||||||||||||||
Investor Shares | 40 | 21 | 26 | 27 | ||||||||||||||||
Advisor Shares | 60 | 21 | 37 | 36 | ||||||||||||||||
Institutional Shares | 37 | 21 | 24 | 21 | ||||||||||||||||
Director’s fees | 197 | 3 | 4 | 61 | ||||||||||||||||
Other operating expenses | 223 | 4 | 7 | 74 | ||||||||||||||||
Total operating expenses | 63,222 | 252 | 555 | 22,552 | ||||||||||||||||
Less amounts waived or paid by the Adviser | – | (141 | ) | (175 | ) | – | ||||||||||||||
Total operating expenses | 63,222 | 111 | 380 | 22,552 | ||||||||||||||||
Net investment income (loss) | (42,238 | ) | 491 | 1,458 | (3,382 | ) | ||||||||||||||
| NET REALIZED AND UNREALIZED GAINS (LOSSES) ON INVESTMENTS: | ||||||||||||||||||||
Net realized gain (loss) on: | ||||||||||||||||||||
Investments, from unaffiliated issuers | (616,472 | ) | (96 | ) | (600 | ) | (134,890 | ) | ||||||||||||
Foreign currency forward contracts | – | 365 | – | 3,082 | ||||||||||||||||
Foreign currency related transactions | (3,285 | ) | (11 | ) | – | (153 | ) | |||||||||||||
Futures contracts | – | 167 | – | – | ||||||||||||||||
Written options | – | – | – | 17,350 | ||||||||||||||||
Swap contracts | – | (43 | ) | – | – | |||||||||||||||
Total realized gain (loss) | (619,757 | ) | 382 | (600 | ) | (114,611 | ) | |||||||||||||
Net increase (decrease) in unrealized appreciation or depreciation on: | ||||||||||||||||||||
Investments, from unaffiliated issuers | (3,057,117 | ) | (1,525 | ) | (2,850 | ) | (299,398 | ) | ||||||||||||
Foreign currency forward contracts | – | 35 | – | 8,501 | ||||||||||||||||
Foreign currency related transactions | (66 | ) | (7 | ) | – | – | (4) | |||||||||||||
Futures contracts | – | 311 | – | – | ||||||||||||||||
Written options | – | – | – | (227 | ) | |||||||||||||||
Swap contracts | – | (46 | ) | – | – | |||||||||||||||
Total decrease in unrealized appreciation or depreciation | (3,057,183 | ) | (1,232 | ) | (2,850 | ) | (291,124 | ) | ||||||||||||
Net loss on investments and foreign currency related transactions | (3,676,940 | ) | (850 | ) | (3,450 | ) | (405,735 | ) | ||||||||||||
Net decrease in net assets resulting from operations | $ | (3,719,178 | ) | $ | (359 | ) | $ | (1,992 | ) | $ | (409,117 | ) | ||||||||
(1) For the period from commencement of operations (April 7, 2022) through September 30, 2022. (2) For the period from commencement of operations (December 1, 2021) through September 30, 2022. | ||||||||||||||||||||
(3) Net of foreign taxes withheld on dividends, unaffiliated issuers | $ | 1,225 | $ | 8 | $ | – | $ | 83 | ||||||||||||
(4) Amount rounds to less than $1 | ||||||||||||||||||||
The accompanying notes are an integral part of the financial statements.
| Artisan Partners Funds | 87 |
ARTISAN PARTNERS FUNDS
Statements of Operations – For the Year Ended September 30, 2022 (Continued)
Dollar values in thousands
| GLOBAL DISCOVERY | GLOBAL EQUITY | GLOBAL OPPORTUNITIES | GLOBAL UNCONSTRAINED(1) | |||||||||||||||||
| INVESTMENT INCOME: |
| |||||||||||||||||||
Dividends, from unaffiliated issuers(2) | $ | 1,525 | $ | 4,141 | $ | 40,166 | $ | 7 | ||||||||||||
Interest | 9 | 81 | 356 | 277 | ||||||||||||||||
Total investment income | 1,534 | 4,222 | 40,522 | 284 | ||||||||||||||||
| EXPENSES: |
| |||||||||||||||||||
Management fees | 3,139 | 2,256 | 40,794 | 61 | ||||||||||||||||
Transfer agent fees | ||||||||||||||||||||
Investor Shares | 152 | 264 | 2,873 | 15 | ||||||||||||||||
Advisor Shares | 49 | 34 | 935 | 16 | ||||||||||||||||
Institutional Shares | 27 | 28 | 36 | 15 | ||||||||||||||||
Shareholder Communications | 21 | 22 | 110 | 27 | ||||||||||||||||
Custodian fees | 35 | 77 | 244 | 17 | ||||||||||||||||
Accounting fees | 79 | 79 | 79 | 5 | ||||||||||||||||
Professional fees | 53 | 60 | 202 | 16 | ||||||||||||||||
Registration fees | ||||||||||||||||||||
Investor Shares | 17 | 19 | 31 | 22 | ||||||||||||||||
Advisor Shares | 25 | 15 | 51 | 22 | ||||||||||||||||
Institutional Shares | 22 | 19 | 26 | 22 | ||||||||||||||||
Director’s fees | 10 | 8 | 132 | 3 | ||||||||||||||||
Interest on securities sold short | – | – | – | 12 | ||||||||||||||||
Other operating expenses | 19 | 17 | 156 | 4 | ||||||||||||||||
Total operating expenses | 3,648 | 2,898 | 45,669 | 257 | ||||||||||||||||
Less amounts waived or paid by the Adviser | (23 | ) | (31 | ) | – | (159 | ) | |||||||||||||
Net expenses | 3,625 | 2,867 | 45,669 | 98 | ||||||||||||||||
Net investment income (loss) | (2,091 | ) | 1,355 | (5,147 | ) | 186 | ||||||||||||||
| NET REALIZED AND UNREALIZED GAINS (LOSSES) ON INVESTMENTS: | ||||||||||||||||||||
Net realized gain (loss) on: | ||||||||||||||||||||
Investments, from unaffiliated issuers | (18,524 | ) | (9,000 | ) | (49,639 | ) | (43 | ) | ||||||||||||
Foreign currency forward contracts | – | – | – | 430 | ||||||||||||||||
Foreign currency related transactions | 26 | (82 | ) | (502 | ) | (14 | ) | |||||||||||||
Futures contracts | – | – | – | 81 | ||||||||||||||||
Securities sold short | – | – | – | 7 | ||||||||||||||||
Swap contracts | – | – | – | (15 | ) | |||||||||||||||
Total realized gain (loss) | (18,498 | ) | (9,082 | ) | (50,141 | ) | 446 | |||||||||||||
Net increase (decrease) in unrealized appreciation or depreciation on: | ||||||||||||||||||||
Investments, from unaffiliated issuers(3) | (107,589 | ) | (81,813 | ) | (1,521,743 | ) | (876 | ) | ||||||||||||
Foreign currency forward contracts | – | – | – | 73 | ||||||||||||||||
Foreign currency related transactions | (10 | ) | (41 | ) | (120 | ) | (3 | ) | ||||||||||||
Futures contracts | – | – | – | 190 | ||||||||||||||||
Swap contracts | – | – | – | 169 | ||||||||||||||||
Securities sold short | – | – | – | 124 | ||||||||||||||||
Total decrease in unrealized appreciation or depreciation | (107,599 | ) | (81,854 | ) | (1,521,863 | ) | (323 | ) | ||||||||||||
Net gain (loss) on investments and foreign currency related transactions | (126,097 | ) | (90,936 | ) | (1,572,004 | ) | 123 | |||||||||||||
Net increase (decrease) in net assets resulting from operations | $ | (128,188 | ) | $ | (89,581 | ) | $ | (1,577,151 | ) | $ | 309 | |||||||||
(1) For the period from commencement of operations (March 31, 2022) through September 30, 2022. | ||||||||||||||||||||
(2) Net of foreign taxes withheld on dividends, unaffiliated issuers | $ | 350 | $ | 541 | $ | 2,636 | $ | 3 | ||||||||||||
(3) Net of increase in foreign taxes on unrealized gains | – | 140 | – | – | ||||||||||||||||
The accompanying notes are an integral part of the financial statements.
| 88 | Artisan Partners Funds |
ARTISAN PARTNERS FUNDS
Statements of Operations – For the Year Ended September 30, 2022 (Continued)
Dollar values in thousands
| GLOBAL VALUE | HIGH INCOME | INTERNATIONAL | INTERNATIONAL EXPLORER(1) | |||||||||||||||||
| INVESTMENT INCOME: |
| |||||||||||||||||||
Dividends, from unaffiliated issuers(2) | $ | 47,170 | $ | 2,754 | $ | 154,200 | $ | 92 | ||||||||||||
Interest | 137 | 410,040 | 13,099 | – | (3) | |||||||||||||||
Income from securities lending | – | – | 166 | – | ||||||||||||||||
Total investment income | 47,307 | 412,794 | 167,465 | 92 | ||||||||||||||||
| EXPENSES: |
| |||||||||||||||||||
Management fees | 22,449 | 43,926 | 69,927 | 57 | ||||||||||||||||
Transfer agent fees | ||||||||||||||||||||
Investor Shares | 619 | 2,730 | 5,408 | |||||||||||||||||
Advisor Shares | 287 | 2,697 | 1,092 | 11 | ||||||||||||||||
Institutional Shares | 32 | 49 | 43 | 9 | ||||||||||||||||
Shareholder Communications | 35 | 211 | 86 | 15 | ||||||||||||||||
Custodian fees | 140 | 53 | 682 | 7 | ||||||||||||||||
Accounting fees | 79 | 227 | 79 | 5 | ||||||||||||||||
Professional fees | 129 | 229 | 398 | 23 | ||||||||||||||||
Registration fees | ||||||||||||||||||||
Investor Shares | 20 | 41 | 31 | |||||||||||||||||
Advisor Shares | 30 | 85 | 27 | 26 | ||||||||||||||||
Institutional Shares | 25 | 81 | 248 | 33 | ||||||||||||||||
Director’s fees | 52 | 182 | 175 | 2 | ||||||||||||||||
Other operating expenses | 76 | 218 | 484 | 1 | ||||||||||||||||
Total operating expenses | 23,973 | 50,729 | 78,680 | 189 | ||||||||||||||||
Less amounts waived or paid by the Adviser | – | – | – | (116 | ) | |||||||||||||||
Total operating expenses | 23,973 | 50,729 | 78,680 | 73 | ||||||||||||||||
Net investment income | 23,334 | 362,065 | 88,785 | 19 | ||||||||||||||||
| NET REALIZED AND UNREALIZED GAINS (LOSSES) ON INVESTMENTS: | ||||||||||||||||||||
Net realized gain (loss) on: | ||||||||||||||||||||
Investments, from unaffiliated issuers | 95,660 | 75,704 | 182,162 | (199 | ) | |||||||||||||||
Foreign currency forward contracts | – | 1,011 | – | – | ||||||||||||||||
Foreign currency related transactions | (857 | ) | (251 | ) | (3,853 | ) | 8 | |||||||||||||
Futures contracts | – | 14,566 | – | – | ||||||||||||||||
Total realized gain (loss) | 94,803 | 91,030 | 178,309 | (191 | ) | |||||||||||||||
Net increase (decrease) in unrealized appreciation or depreciation on: | ||||||||||||||||||||
Investments, from unaffiliated issuers | (600,098 | ) | (1,184,698 | ) | (2,603,625 | ) | (3,195 | ) | ||||||||||||
Foreign currency forward contracts | – | 37 | – | – | ||||||||||||||||
Foreign currency related transactions | (255 | ) | (4 | ) | (2,787 | ) | – | (3) | ||||||||||||
Futures contracts | – | 441 | – | – | ||||||||||||||||
Unfunded loan commitments | – | 7 | – | – | ||||||||||||||||
Total decrease in unrealized appreciation or depreciation | (600,353 | ) | (1,184,217 | ) | (2,606,412 | ) | (3,195 | ) | ||||||||||||
Net loss on investments and foreign currency related transactions | (505,550 | ) | (1,093,187 | ) | (2,428,103 | ) | (3,386 | ) | ||||||||||||
Net decrease in net assets resulting from operations | $ | (482,216 | ) | $ | (731,122 | ) | $ | (2,339,318 | ) | $ | (3,367 | ) | ||||||||
(1) For the period from commencement of operations (May 16, 2022) through September 30, 2022. | ||||||||||||||||||||
(2) Net of foreign taxes withheld on dividends, unaffiliated issuers | $ | 3,778 | $ | – | $ | 21,986 | $ | 7 | ||||||||||||
(3) Amount rounds to less than $1 | ||||||||||||||||||||
The accompanying notes are an integral part of the financial statements.
| Artisan Partners Funds | 89 |
ARTISAN PARTNERS FUNDS
Statements of Operations – For the Year Ended September 30, 2022 (Continued)
Dollar values in thousands
| INTERNATIONAL SMALL-MID | INTERNATIONAL VALUE | MID CAP | MID CAP VALUE | |||||||||||||||||
| INVESTMENT INCOME: |
| |||||||||||||||||||
Dividends, from unaffiliated issuers (1) | $ | 46,738 | $ | 524,816 | $ | 12,203 | $ | 32,439 | ||||||||||||
Dividends, from affiliated issuers | 3,385 | 3,157 | – | – | ||||||||||||||||
Interest | 908 | 9,414 | 237 | 62 | ||||||||||||||||
Total investment income | 51,031 | 537,387 | 12,440 | 32,501 | ||||||||||||||||
| EXPENSES: |
| |||||||||||||||||||
Management fees | 53,239 | 214,960 | 54,498 | 17,597 | ||||||||||||||||
Transfer agent fees | ||||||||||||||||||||
Investor Shares | 977 | 6,071 | 4,392 | 1,457 | ||||||||||||||||
Advisor Shares | 1,379 | 4,997 | 677 | 293 | ||||||||||||||||
Institutional Shares | 41 | 59 | 51 | 31 | ||||||||||||||||
Shareholder Communications | 438 | 681 | 139 | 97 | ||||||||||||||||
Custodian fees | 593 | 2,346 | 94 | 26 | ||||||||||||||||
Accounting fees | 79 | 79 | 57 | 57 | ||||||||||||||||
Professional fees | 236 | 712 | 219 | 88 | ||||||||||||||||
Registration fees | ||||||||||||||||||||
Investor Shares | 32 | 35 | 45 | 20 | ||||||||||||||||
Advisor Shares | 37 | 142 | 36 | 23 | ||||||||||||||||
Institutional Shares | 133 | 213 | 46 | 22 | ||||||||||||||||
Director’s fees | 160 | 635 | 162 | 44 | ||||||||||||||||
Other operating expenses | 182 | 669 | 193 | 71 | ||||||||||||||||
Total operating expenses | 57,526 | 231,599 | 60,609 | 19,826 | ||||||||||||||||
Net investment income (loss) | (6,495 | ) | 305,788 | (48,169 | ) | 12,675 | ||||||||||||||
| NET REALIZED AND UNREALIZED GAINS (LOSSES) ON INVESTMENTS: |
| |||||||||||||||||||
Net realized gain (loss) on: | ||||||||||||||||||||
Investments, from unaffiliated issuers | (129,249 | ) | 421,460 | (12,910 | ) | 277,492 | ||||||||||||||
Investments, from affiliated issuers | (30,526 | ) | 1,258 | – | – | |||||||||||||||
Foreign currency forward contracts | – | 56,644 | – | – | ||||||||||||||||
Foreign currency related transactions | (1,472 | ) | (5,636 | ) | (21 | ) | – | |||||||||||||
Total realized gain (loss) | (161,247 | ) | 473,726 | (12,931 | ) | 277,492 | ||||||||||||||
Net increase (decrease) in unrealized appreciation or depreciation on: | ||||||||||||||||||||
Investments, from unaffiliated issuers (2) | (1,703,098 | ) | (5,225,802 | ) | (2,500,946 | ) | (529,378 | ) | ||||||||||||
Investments, from affiliated issuers | (144,548 | ) | (83,625 | ) | – | – | ||||||||||||||
Foreign currency forward contracts | – | (5,810 | ) | – | – | |||||||||||||||
Foreign currency related transactions | (759 | ) | (4,309 | ) | (3 | ) | – | |||||||||||||
Swap contracts | – | (498 | ) | – | – | |||||||||||||||
Total decrease in unrealized appreciation or depreciation | (1,848,405 | ) | (5,320,044 | ) | (2,500,949 | ) | (529,378 | ) | ||||||||||||
Net loss on investments and foreign currency related transactions | (2,009,652 | ) | (4,846,318 | ) | (2,513,880 | ) | (251,886 | ) | ||||||||||||
Net decrease in net assets resulting from operations | $ | (2,016,147 | ) | $ | (4,540,530 | ) | $ | (2,562,049 | ) | $ | (239,211 | ) | ||||||||
(1) Net of foreign taxes withheld on dividends, unaffiliated issuers | $ | 4,831 | $ | 61,219 | $ | 114 | $ | – | ||||||||||||
(2) Net of decrease in foreign taxes on unrealized gains | 2,211 | 49,707 | – | – | ||||||||||||||||
The accompanying notes are an integral part of the financial statements.
| 90 | Artisan Partners Funds |
ARTISAN PARTNERS FUNDS
Statements of Operations – For the Year Ended September 30, 2022 (Continued)
Dollar values in thousands
| SELECT EQUITY | SMALL CAP | SUSTAINABLE EMERGING MARKETS | VALUE | |||||||||||||||||
| INVESTMENT INCOME: | ||||||||||||||||||||
Dividends, from unaffiliated issuers(1) | $ | 378 | $ | 5,332 | $ | 1,544 | $ | 5,744 | ||||||||||||
Income from non-cash dividends | – | – | 156 | – | ||||||||||||||||
Interest | 1 | 82 | – | 11 | ||||||||||||||||
Total investment income | 379 | 5,414 | 1,700 | 5,755 | ||||||||||||||||
| EXPENSES: | ||||||||||||||||||||
Management fees | 216 | 26,145 | 691 | 2,255 | ||||||||||||||||
Transfer agent fees | ||||||||||||||||||||
Investor Shares | 45 | 1,746 | 147 | 245 | ||||||||||||||||
Advisor Shares | 28 | 718 | 15 | 110 | ||||||||||||||||
Institutional Shares | 27 | 39 | 27 | 29 | ||||||||||||||||
Shareholder Communications | 2 | 165 | 27 | 33 | ||||||||||||||||
Custodian fees | 10 | 48 | 49 | 17 | ||||||||||||||||
Accounting fees | 57 | 57 | 79 | 57 | ||||||||||||||||
Professional fees | 39 | 147 | 64 | 47 | ||||||||||||||||
Registration fees | ||||||||||||||||||||
Investor Shares | 17 | 31 | 20 | 19 | ||||||||||||||||
Advisor Shares | 17 | 41 | 29 | 22 | ||||||||||||||||
Institutional Shares | 17 | 74 | 20 | 31 | ||||||||||||||||
Director’s fees | 6 | 93 | 6 | 7 | ||||||||||||||||
Other operating expenses | 10 | 102 | 11 | 19 | ||||||||||||||||
Total operating expenses | 491 | 29,406 | 1,185 | 2,891 | ||||||||||||||||
Less amounts waived or paid by the Adviser | (169 | ) | – | (290 | ) | (71 | ) | |||||||||||||
Total operating expenses | 322 | 29,406 | 895 | 2,820 | ||||||||||||||||
Net investment income (loss) | 57 | (23,992 | ) | 805 | 2,935 | |||||||||||||||
| NET REALIZED AND UNREALIZED GAINS (LOSSES) ON INVESTMENTS: | ||||||||||||||||||||
Net realized gain (loss) on: | ||||||||||||||||||||
Investments, from unaffiliated issuers(2) | 605 | (277,985 | ) | (240 | ) | 45,254 | ||||||||||||||
Investments, from affiliated issuers | – | (30,484 | ) | – | – | |||||||||||||||
Foreign currency related transactions | – | (4) | – | (4) | (28 | ) | (35 | ) | ||||||||||||
Total realized gain (loss) | 605 | (308,469 | ) | (268 | ) | 45,219 | ||||||||||||||
Net increase (decrease) in unrealized appreciation or depreciation on: | ||||||||||||||||||||
Investments, from unaffiliated issuers(3) | (8,795 | ) | (1,132,581 | ) | (32,151 | ) | (92,642 | ) | ||||||||||||
Investments, from affiliated issuers | – | 8,852 | – | – | ||||||||||||||||
Foreign currency related transactions | – | (4) | – | (56 | ) | (8 | ) | |||||||||||||
Total decrease in unrealized appreciation or depreciation | (8,795 | ) | (1,123,729 | ) | (32,207 | ) | (92,650 | ) | ||||||||||||
Net loss on investments and foreign currency related transactions | (8,190 | ) | (1,432,198 | ) | (32,475 | ) | (47,431 | ) | ||||||||||||
Net decrease in net assets resulting from operations | $ | (8,133 | ) | $ | (1,456,190 | ) | $ | (31,670 | ) | $ | (44,496 | ) | ||||||||
(1)Net of foreign taxes withheld on dividends, unaffiliated issuers | $ | 21 | $ | – | $ | 274 | $ | 100 | ||||||||||||
(2)Net of foreign taxes on realized gains | – | – | 116 | – | ||||||||||||||||
(3)Net of decrease in foreign taxes on unrealized gains | – | – | 197 | – | ||||||||||||||||
(4)Amount rounds to less than $1 | ||||||||||||||||||||
The accompanying notes are an integral part of the financial statements.
| Artisan Partners Funds | 91 |
ARTISAN PARTNERS FUNDS
Statements of Operations – For the Year Ended September 30, 2022 (Continued)
Dollar values in thousands
| VALUE INCOME(1) | |||||
| INVESTMENT INCOME: |
| ||||
Dividends, from unaffiliated issuers(2) | $ | 214 | |||
Interest | 13 | ||||
Total investment income | 227 | ||||
| EXPENSES: |
| ||||
Management fees | 40 | ||||
Transfer agent fees | |||||
Investor Shares | 17 | ||||
Advisor Shares | 16 | ||||
Institutional Shares | 16 | ||||
Shareholder Communications | 27 | ||||
Custodian fees | 3 | ||||
Accounting fees | 9 | ||||
Professional fees | 33 | ||||
Registration fees | |||||
Investor Shares | 23 | ||||
Advisor Shares | 23 | ||||
Institutional Shares | 23 | ||||
Director’s fees | 4 | ||||
Other operating expenses | 2 | ||||
Total operating expenses | 236 | ||||
Less amounts waived or paid by the Adviser | (176 | ) | |||
Net expenses | 60 | ||||
Net investment income | 167 | ||||
| NET REALIZED AND UNREALIZED GAINS (LOSSES) ON INVESTMENTS: | |||||
Net realized gain (loss) on: | |||||
Investments, from unaffiliated issuers | (89 | ) | |||
Foreign currency related transactions | (1 | ) | |||
Written options | 3 | ||||
Total realized loss | (87 | ) | |||
Net increase (decrease) in unrealized appreciation or depreciation on: | |||||
Investments, from unaffiliated issuers | (1,897 | ) | |||
Foreign currency related transactions | – | (3) | |||
Written options | (3 | ) | |||
Total decrease in unrealized appreciation or depreciation | (1,900 | ) | |||
Net loss on investments and foreign currency related transactions | (1,987 | ) | |||
Net decrease in net assets resulting from operations | $ | (1,820 | ) | ||
(1)For the period from commencement of operations (February 28, 2022) through September 30, 2022. | |||||
(2)Net of foreign taxes withheld on dividends, unaffiliated issuers | $ | 3 | |||
(3)Amount rounds to less than $1 | |||||
The accompanying notes are an integral part of the financial statements.
| 92 | Artisan Partners Funds |
Statements of Changes in Net Assets
Dollar values in thousands
| DEVELOPING WORLD | EMERGING MARKETS DEBT OPPORTUNITIES | ||||||||||||||
| Year Ended 9/30/2022 | Year Ended 9/30/2021 | Period Ended 9/30/2022(1) | |||||||||||||
| OPERATIONS: | |||||||||||||||
Net investment income (loss) | $ | (42,238 | ) | $ | (77,931 | ) | $ | 491 | |||||||
Net realized gain (loss) on: | |||||||||||||||
Investments, from unaffiliated issuers | (616,472 | ) | 757,078 | (97 | ) | ||||||||||
Foreign currency forward contracts | – | – | 365 | ||||||||||||
Foreign currency related transactions | (3,285 | ) | 3,120 | (11 | ) | ||||||||||
Futures contracts | – | – | 167 | ||||||||||||
Swap contracts | – | – | (43 | ) | |||||||||||
Net increase (decrease) in unrealized appreciation or depreciation on: | |||||||||||||||
Investments, from unaffiliated issuers | (3,057,117 | ) | 341,566 | (1,525 | ) | ||||||||||
Foreign currency forward contracts | – | – | 35 | ||||||||||||
Foreign currency related transactions | (66 | ) | (3,194 | ) | (6 | ) | |||||||||
Futures contracts | – | – | 311 | ||||||||||||
Swap contracts | – | – | (46 | ) | |||||||||||
Net increase (decrease) in net assets resulting from operations | (3,719,178 | ) | 1,020,639 | (359 | ) | ||||||||||
| DISTRIBUTIONS TO SHAREHOLDERS: | |||||||||||||||
Investor Shares | (71,898 | ) | (29,722 | ) | (2 | ) | |||||||||
Advisor Shares | (366,044 | ) | (174,796 | ) | (9 | ) | |||||||||
Institutional Shares | (246,476 | ) | (119,146 | ) | (497 | ) | |||||||||
Total distributions to shareholders | (684,418 | ) | (323,664 | ) | (508 | ) | |||||||||
| FUND SHARE ACTIVITIES: | |||||||||||||||
Net increase (decrease) in net assets resulting from fund share activities | (1,070,988 | ) | 1,396,872 | 22,066 | |||||||||||
Total increase (decrease) in net assets | (5,474,584 | ) | 2,093,847 | 21,199 | |||||||||||
Net assets, beginning of year | 8,726,190 | 6,632,343 | – | ||||||||||||
Net assets, end of year | $ | 3,251,606 | $ | 8,726,190 | $ | 21,199 | |||||||||
| (1) | For the period from commencement of operations (April 7, 2022) through September 30, 2022. |
The accompanying notes are an integral part of the financial statements.
| Artisan Partners Funds | 93 |
ARTISAN PARTNERS FUNDS
Statements of Changes in Net Assets (Continued)
Dollar values in thousands
| FLOATING RATE | FOCUS | ||||||||||||||
| Period Ended 9/30/2022(1) | Year Ended 9/30/2022 | Year Ended 9/30/2021 | |||||||||||||
| OPERATIONS: | |||||||||||||||
Net investment income (loss) | $ | 1,458 | $ | (3,382 | ) | $ | (7,216 | ) | |||||||
Net realized gain (loss) on: | |||||||||||||||
Investments, from unaffiliated issuers | (600 | ) | (134,890 | ) | 432,160 | ||||||||||
Foreign currency forward contracts | – | 3,082 | 2,000 | ||||||||||||
Foreign currency related transactions | – | (153 | ) | (300 | ) | ||||||||||
Written options | – | 17,350 | (32,598 | ) | |||||||||||
Net increase (decrease) in unrealized appreciation or depreciation on: | |||||||||||||||
Investments, from unaffiliated issuers | (2,850 | ) | (299,398 | ) | 8,541 | ||||||||||
Foreign currency forward contracts | – | 8,501 | (515 | ) | |||||||||||
Foreign currency related transactions | – | – | (2) | – | (2) | ||||||||||
Written options | – | (227 | ) | 4,698 | |||||||||||
Net increase (decrease) in net assets resulting from operations | (1,992 | ) | (409,117 | ) | 406,770 | ||||||||||
| DISTRIBUTIONS TO SHAREHOLDERS: | |||||||||||||||
Investor Shares | (41 | ) | (52,159 | ) | (9,433 | ) | |||||||||
Advisor Shares | (511 | ) | (188,039 | ) | (28,018 | ) | |||||||||
Institutional Shares | (904 | ) | (114,170 | ) | (15,917 | ) | |||||||||
Total distributions to shareholders | (1,456 | ) | (354,368 | ) | (53,368 | ) | |||||||||
| FUND SHARE ACTIVITIES: | |||||||||||||||
Net increase in net assets resulting from fund share activities | 50,681 | 73,552 | 508,908 | ||||||||||||
Total increase (decrease) in net assets | 47,233 | (689,933 | ) | 862,310 | |||||||||||
Net assets, beginning of period | – | 2,298,375 | 1,436,065 | ||||||||||||
Net assets, end of period | $ | 47,233 | $ | 1,608,442 | $ | 2,298,375 | |||||||||
| (1) | For the period from commencement of operations (December 1, 2021) through September 30, 2022. |
| (2) | Amount rounds to less than $1 |
The accompanying notes are an integral part of the financial statements.
| 94 | Artisan Partners Funds |
ARTISAN PARTNERS FUNDS
Statements of Changes in Net Assets (Continued)
Dollar values in thousands
| GLOBAL DISCOVERY | GLOBAL EQUITY | |||||||||||||||||||
| Year Ended 9/30/2022 | Year Ended 9/30/2021 | Year Ended 9/30/2022 | Year Ended 9/30/2021 | |||||||||||||||||
| OPERATIONS: | ||||||||||||||||||||
Net investment income (loss) | $ | (2,091 | ) | $ | (2,078 | ) | $ | 1,355 | $ | (1,147 | ) | |||||||||
Net realized gain (loss) on: | ||||||||||||||||||||
Investments, from unaffiliated issuers | (18,524 | ) | 31,521 | (9,000 | ) | 54,538 | ||||||||||||||
Foreign currency related transactions | 26 | (8 | ) | (82 | ) | (17 | ) | |||||||||||||
Net increase (decrease) in unrealized appreciation or depreciation on: | ||||||||||||||||||||
Investments, from unaffiliated issuers | (107,589 | ) | 34,557 | (81,813 | ) | (1,162 | ) | |||||||||||||
Foreign currency related transactions | (10 | ) | (3 | ) | (41 | ) | (89 | ) | ||||||||||||
Net increase (decrease) in net assets resulting from operations | (128,188 | ) | 63,989 | (89,581 | ) | 52,123 | ||||||||||||||
| DISTRIBUTIONS TO SHAREHOLDERS: | ||||||||||||||||||||
Investor Shares | (4,800 | ) | (1,150 | ) | (22,537 | ) | (16,265 | ) | ||||||||||||
Advisor Shares | (1,618 | ) | (419 | ) | (2,161 | ) | (1,575 | ) | ||||||||||||
Institutional Shares | (20,198 | ) | (3,295 | ) | (23,620 | ) | (13,513 | ) | ||||||||||||
Total distributions to shareholders | (26,616 | ) | (4,864 | ) | (48,318 | ) | (31,353 | ) | ||||||||||||
| FUND SHARE ACTIVITIES: | ||||||||||||||||||||
Net increase (decrease) in net assets resulting from fund share activities | 33,064 | 84,571 | (19,588 | ) | 56,071 | |||||||||||||||
Total increase (decrease) in net assets | (121,740 | ) | 143,696 | (157,487 | ) | 76,841 | ||||||||||||||
Net assets, beginning of year | 354,141 | 210,445 | 333,738 | 256,897 | ||||||||||||||||
Net assets, end of year | $ | 232,401 | $ | 354,141 | $ | 176,251 | $ | 333,738 | ||||||||||||
The accompanying notes are an integral part of the financial statements.
| Artisan Partners Funds | 95 |
ARTISAN PARTNERS FUNDS
Statements of Changes in Net Assets (Continued)
Dollar values in thousands
| GLOBAL OPPORTUNITIES | GLOBAL UNCONSTRAINED | ||||||||||||||
| Year Ended 9/30/2022 | Year Ended 9/30/2021 | Period Ended 9/30/2022(1) | |||||||||||||
| OPERATIONS: |
| ||||||||||||||
Net investment income (loss) | $ | (5,147 | ) | $ | (6,112 | ) | $ | 186 | |||||||
Net realized gain (loss) on: | |||||||||||||||
Investments, from unaffiliated issuers | (49,639 | ) | 641,893 | (43 | ) | ||||||||||
Foreign currency forward contracts | – | – | 430 | ||||||||||||
Foreign currency related transactions | (502 | ) | (798 | ) | (14 | ) | |||||||||
Securities sold short | – | – | 7 | ||||||||||||
Futures contracts | – | – | 81 | ||||||||||||
Swap contracts | – | – | (15 | ) | |||||||||||
Net increase (decrease) in unrealized appreciation or depreciation on: | |||||||||||||||
Investments, from unaffiliated issuers | (1,521,743 | ) | 311,786 | (876 | ) | ||||||||||
Foreign currency forward contracts | – | – | 73 | ||||||||||||
Foreign currency related transactions | (120 | ) | (63 | ) | (3 | ) | |||||||||
Securities sold short | – | – | 124 | ||||||||||||
Futures contracts | – | – | 190 | ||||||||||||
Swap contracts | – | – | 169 | ||||||||||||
Net increase (decrease) in net assets resulting from operations | (1,577,151 | ) | 946,706 | 309 | |||||||||||
| DISTRIBUTIONS TO SHAREHOLDERS: | |||||||||||||||
Investor Shares | (152,763 | ) | (93,589 | ) | (3 | ) | |||||||||
Advisor Shares | (124,592 | ) | (67,331 | ) | (20 | ) | |||||||||
Institutional Shares | (303,744 | ) | (162,441 | ) | (137 | ) | |||||||||
Total distributions to shareholders | (581,099 | ) | (323,361 | ) | (160 | ) | |||||||||
| FUND SHARE ACTIVITIES: | |||||||||||||||
Net increase (decrease) in net assets resulting from fund share activities | (407,198 | ) | 333,575 | 14,886 | |||||||||||
Total increase (decrease) in net assets | (2,565,448 | ) | 956,920 | 15,035 | |||||||||||
Net assets, beginning of year | 5,739,513 | 4,782,593 | – | ||||||||||||
Net assets, end of year | $ | 3,174,065 | $ | 5,739,513 | $ | 15,035 | |||||||||
| (1) | For the period from commencement of operations (March 31, 2022) through September 30, 2022. |
The accompanying notes are an integral part of the financial statements.
| 96 | Artisan Partners Funds |
ARTISAN PARTNERS FUNDS
Statements of Changes in Net Assets (Continued)
Dollar values in thousands
| GLOBAL VALUE | HIGH INCOME | |||||||||||||||||||
| Year Ended 9/30/2022 | Year Ended 9/30/2021 | Year Ended 9/30/2022 | Year Ended 9/30/2021 | |||||||||||||||||
| OPERATIONS: |
| |||||||||||||||||||
Net investment income | $ | 23,334 | $ | 22,922 | $ | 362,065 | $ | 339,717 | ||||||||||||
Net realized gain (loss) on: | ||||||||||||||||||||
Investments, from unaffiliated issuers | 95,660 | 222,175 | 75,704 | 204,321 | ||||||||||||||||
Foreign currency forward contracts | – | (3,193 | ) | 1,011 | 3 | |||||||||||||||
Foreign currency related transactions | (857 | ) | 122 | (251 | ) | 110 | ||||||||||||||
Futures contracts | – | – | 14,566 | 5,070 | ||||||||||||||||
Net increase (decrease) in unrealized appreciation or depreciation on: | ||||||||||||||||||||
Investments, from unaffiliated issuers | (600,098 | ) | 390,320 | (1,184,698 | ) | 184,555 | ||||||||||||||
Foreign currency forward contracts | – | 2,416 | 37 | (131 | ) | |||||||||||||||
Foreign currency related transactions | (255 | ) | (189 | ) | (4 | ) | (5 | ) | ||||||||||||
Futures contracts | – | – | 441 | 4,510 | ||||||||||||||||
Unfunded loan commitments | – | – | 7 | (7 | ) | |||||||||||||||
Net increase (decrease) in net assets resulting from operations | (482,216 | ) | 634,573 | (731,122 | ) | 738,143 | ||||||||||||||
| DISTRIBUTIONS TO SHAREHOLDERS: | ||||||||||||||||||||
Investor Shares | (24,940 | ) | (147 | ) | (90,749 | ) | (75,911 | ) | ||||||||||||
Advisor Shares | (29,976 | ) | (256 | ) | (238,921 | ) | (158,181 | ) | ||||||||||||
Institutional Shares | (171,531 | ) | (3,054 | ) | (193,092 | ) | (100,079 | ) | ||||||||||||
Total distributions to shareholders | (226,447 | ) | (3,457 | ) | (522,762 | ) | (334,171 | ) | ||||||||||||
| FUND SHARE ACTIVITIES: | ||||||||||||||||||||
Net increase (decrease) in net assets resulting from fund share activities | 51,359 | 20,553 | (9,127 | ) | 1,851,345 | |||||||||||||||
Total increase (decrease) in net assets | (657,304 | ) | 651,669 | (1,263,011 | ) | 2,255,317 | ||||||||||||||
Net assets, beginning of year | 2,475,429 | 1,823,760 | 7,072,083 | 4,816,766 | ||||||||||||||||
Net assets, end of year | $ | 1,818,125 | $ | 2,475,429 | $ | 5,809,072 | $ | 7,072,083 | ||||||||||||
The accompanying notes are an integral part of the financial statements.
| Artisan Partners Funds | 97 |
ARTISAN PARTNERS FUNDS
Statements of Changes in Net Assets (Continued)
Dollar values in thousands
| INTERNATIONAL | INTERNATIONAL EXPLORER | ||||||||||||||
| Year Ended 9/30/2022 | Year Ended 9/30/2021 | Period Ended 9/30/2022(1) | |||||||||||||
| OPERATIONS: |
| ||||||||||||||
Net investment income | $ | 88,785 | $ | 83,649 | $ | 19 | |||||||||
Net realized gain (loss) on: | |||||||||||||||
Investments, from unaffiliated issuers | 182,162 | 1,941,342 | (199 | ) | |||||||||||
Foreign currency related transactions | (3,853 | ) | (1,274 | ) | 8 | ||||||||||
Net increase (decrease) in unrealized appreciation or depreciation on: | |||||||||||||||
Investments, from unaffiliated issuers | (2,603,625 | ) | (579,432 | ) | (3,195 | ) | |||||||||
Foreign currency related transactions | (2,787 | ) | (3,031 | ) | – | (2) | |||||||||
Net increase (decrease) in net assets resulting from operations | (2,339,318 | ) | 1,441,254 | (3,367 | ) | ||||||||||
| DISTRIBUTIONS TO SHAREHOLDERS: | |||||||||||||||
Investor Shares | (570,026 | ) | (104,497 | ) | |||||||||||
Advisor Shares | (322,303 | ) | (63,660 | ) | – | ||||||||||
Institutional Shares | (947,348 | ) | (168,146 | ) | – | ||||||||||
Total distributions to shareholders | (1,839,677 | ) | (336,303 | ) | – | ||||||||||
| FUND SHARE ACTIVITIES: | |||||||||||||||
Net increase (decrease) in net assets resulting from fund share activities | (485,489 | ) | (1,107,669 | ) | 23,903 | ||||||||||
Total increase (decrease) in net assets | (4,664,484 | ) | (2,718 | ) | 20,536 | ||||||||||
Net assets, beginning of year | 9,658,022 | 9,660,740 | – | ||||||||||||
Net assets, end of year | $ | 4,993,538 | $ | 9,658,022 | $ | 20,536 | |||||||||
| (1) | For the period from commencement of operations (May 16, 2022) through September 30, 2022. |
| (2) | Amount rounds to less than $1 |
The accompanying notes are an integral part of the financial statements.
| 98 | Artisan Partners Funds |
ARTISAN PARTNERS FUNDS
Statements of Changes in Net Assets (Continued)
Dollar values in thousands
| INTERNATIONAL SMALL-MID | INTERNATIONAL VALUE | |||||||||||||||||||
| Year Ended 9/30/2022 | Year Ended 9/30/2021 | Year Ended 9/30/2022 | Year Ended 9/30/2021 | |||||||||||||||||
| OPERATIONS: | ||||||||||||||||||||
Net investment income (loss) | $ | (6,495 | ) | $ | (12,316 | ) | $ | 305,788 | $ | 505,655 | ||||||||||
Net realized gain (loss) on: | ||||||||||||||||||||
Investments, from unaffiliated issuers | (129,249 | ) | 141,847 | 421,460 | 1,828,500 | |||||||||||||||
Investments, from affiliated issuers | (30,526 | ) | 83,170 | 1,258 | 7,423 | |||||||||||||||
Foreign currency forward contracts | – | – | 56,644 | (63,027 | ) | |||||||||||||||
Foreign currency related transactions | (1,472 | ) | 249 | (5,636 | ) | (2,501 | ) | |||||||||||||
Net increase (decrease) in unrealized appreciation or depreciation on: | ||||||||||||||||||||
Investments, from unaffiliated issuers | (1,703,098 | ) | 687,694 | (5,225,802 | ) | 2,526,055 | ||||||||||||||
Investments, from affiliated issuers | (144,548 | ) | 91,612 | (83,625 | ) | 159,408 | ||||||||||||||
Foreign currency forward contracts | – | – | (5,810 | ) | 39,364 | |||||||||||||||
Foreign currency related transactions | (759 | ) | (82 | ) | (4,309 | ) | (843 | ) | ||||||||||||
Swap contracts | – | – | (498 | ) | – | |||||||||||||||
Net increase (decrease) in net assets resulting from operations | (2,016,147 | ) | 992,174 | (4,540,530 | ) | 5,000,034 | ||||||||||||||
| DISTRIBUTIONS TO SHAREHOLDERS: | ||||||||||||||||||||
Investor Shares | (14,628 | ) | (2,495 | ) | (255,824 | ) | (20,240 | ) | ||||||||||||
Advisor Shares | (51,584 | ) | (9,783 | ) | (494,136 | ) | (36,329 | ) | ||||||||||||
Institutional Shares | (107,479 | ) | (19,767 | ) | (1,481,257 | ) | (96,592 | ) | ||||||||||||
Total distributions to shareholders | (173,691 | ) | (32,045 | ) | (2,231,217 | ) | (153,161 | ) | ||||||||||||
| FUND SHARE ACTIVITIES: | ||||||||||||||||||||
Net increase (decrease) in net assets resulting from fund share activities | (127,455 | ) | 1,865,301 | 4,796,949 | 3,685,045 | |||||||||||||||
Total increase (decrease) in net assets | (2,317,293 | ) | 2,825,430 | (1,974,798 | ) | 8,531,918 | ||||||||||||||
Net assets, beginning of year | 6,285,856 | 3,460,426 | 22,105,828 | 13,573,910 | ||||||||||||||||
Net assets, end of year | $ | 3,968,563 | $ | 6,285,856 | $ | 20,131,030 | $ | 22,105,828 | ||||||||||||
The accompanying notes are an integral part of the financial statements.
| Artisan Partners Funds | 99 |
ARTISAN PARTNERS FUNDS
Statements of Changes in Net Assets (Continued)
Dollar values in thousands
| MID CAP | MID CAP VALUE | |||||||||||||||||||
| Year Ended 9/30/2022 | Year Ended 9/30/2021 | Year Ended 9/30/2022 | Year Ended 9/30/2021 | |||||||||||||||||
| OPERATIONS: | ||||||||||||||||||||
Net investment income (loss) | $ | (48,169 | ) | $ | (63,185 | ) | $ | 12,675 | $ | 14,076 | ||||||||||
Net realized gain (loss) on: | ||||||||||||||||||||
Investments, from unaffiliated issuers | (12,910 | ) | 1,502,334 | 277,492 | 280,087 | |||||||||||||||
Foreign currency related transactions | (21 | ) | 35 | – | – | |||||||||||||||
Net increase (decrease) in unrealized appreciation or depreciation on: | ||||||||||||||||||||
Investments, from unaffiliated issuers | (2,500,946 | ) | 502,468 | (529,378 | ) | 418,731 | ||||||||||||||
Foreign currency related transactions | (3 | ) | (1 | ) | – | – | ||||||||||||||
Net increase (decrease) in net assets resulting from operations | (2,562,049 | ) | 1,941,651 | (239,211 | ) | 712,894 | ||||||||||||||
| DISTRIBUTIONS TO SHAREHOLDERS: | ||||||||||||||||||||
Investor Shares | (396,844 | ) | (315,691 | ) | (90,957 | ) | (11,628 | ) | ||||||||||||
Advisor Shares | (143,826 | ) | (102,605 | ) | (71,587 | ) | (11,843 | ) | ||||||||||||
Institutional Shares | (550,241 | ) | (523,547 | ) | (101,879 | ) | (14,906 | ) | ||||||||||||
Total distributions to shareholders | (1,090,911 | ) | (941,843 | ) | (264,423 | ) | (38,377 | ) | ||||||||||||
| FUND SHARE ACTIVITIES: | ||||||||||||||||||||
Net increase (decrease) in net assets resulting from fund share activities | 479,163 | (370,460 | ) | (216,745 | ) | (324,932 | ) | |||||||||||||
Total increase (decrease) in net assets | (3,173,797 | ) | 629,348 | (720,379 | ) | 349,585 | ||||||||||||||
Net assets, beginning of year | 7,419,020 | 6,789,672 | 2,028,346 | 1,678,761 | ||||||||||||||||
Net assets, end of year | $ | 4,245,223 | $ | 7,419,020 | $ | 1,307,967 | $ | 2,028,346 | ||||||||||||
The accompanying notes are an integral part of the financial statements.
| 100 | Artisan Partners Funds |
ARTISAN PARTNERS FUNDS
Statements of Changes in Net Assets (Continued)
Dollar values in thousands
| SELECT EQUITY | SMALL CAP | |||||||||||||||||||
| Year Ended 9/30/2022 | Year Ended 9/30/2021 | Year Ended 9/30/2022 | Year Ended 9/30/2021 | |||||||||||||||||
| OPERATIONS: | ||||||||||||||||||||
Net investment income (loss) | $ | 57 | $ | 26 | $ | (23,992 | ) | $ | (37,217 | ) | ||||||||||
Net realized gain (loss) on: | ||||||||||||||||||||
Investments, from unaffiliated issuers | 605 | 1,323 | (277,985 | ) | 450,902 | |||||||||||||||
Investments, from affiliated issuers | – | – | (30,484 | ) | (718 | ) | ||||||||||||||
Foreign currency related transactions | – | (1) | (1 | ) | – | (1) | – | |||||||||||||
Net increase (decrease) in unrealized appreciation or depreciation on: | ||||||||||||||||||||
Investments, from unaffiliated issuers | (8,795 | ) | 3,092 | (1,132,581 | ) | 328,802 | ||||||||||||||
Investments, from affiliated issuers | – | – | 8,852 | (8,310 | ) | |||||||||||||||
Foreign currency related transactions | – | (1) | – | (1) | – | – | ||||||||||||||
Net increase (decrease) in net assets resulting from operations | (8,133 | ) | 4,440 | (1,456,190 | ) | 733,459 | ||||||||||||||
| DISTRIBUTIONS TO SHAREHOLDERS: | ||||||||||||||||||||
Investor Shares | (142 | ) | – | (106,455 | ) | (58,000 | ) | |||||||||||||
Advisor Shares | (86 | ) | – | (131,363 | ) | (63,020 | ) | |||||||||||||
Institutional Shares | (987 | ) | (67 | ) | (157,713 | ) | (72,018 | ) | ||||||||||||
Total distributions to shareholders | (1,215 | ) | (67 | ) | (395,531 | ) | (193,038 | ) | ||||||||||||
| FUND SHARE ACTIVITIES: | ||||||||||||||||||||
Net increase (decrease) in net assets resulting from fund share activities | 14,298 | 7,206 | (380,807 | ) | 505,642 | |||||||||||||||
Total increase (decrease) in net assets | 4,950 | 11,579 | (2,232,528 | ) | 1,046,063 | |||||||||||||||
Net assets, beginning of year | 24,606 | 13,027 | 4,048,055 | 3,001,992 | ||||||||||||||||
Net assets, end of year | $ | 29,556 | $ | 24,606 | $ | 1,815,527 | $ | 4,048,055 | ||||||||||||
| (1) | Amount rounds to less than $1 |
The accompanying notes are an integral part of the financial statements.
| Artisan Partners Funds | 101 |
ARTISAN PARTNERS FUNDS
Statements of Changes in Net Assets (Continued)
Dollar values in thousands
| SUSTAINABLE EMERGING MARKETS | VALUE | |||||||||||||||||||
| Year Ended 9/30/2022 | Year Ended 9/30/2021 | Year Ended 9/30/2022 | Year Ended 9/30/2021 | |||||||||||||||||
| OPERATIONS: | ||||||||||||||||||||
Net investment income | $ | 805 | $ | 265 | $ | 2,935 | $ | 2,788 | ||||||||||||
Net realized gain (loss) on: | ||||||||||||||||||||
Investments, from unaffiliated issuers | (240 | ) | 2,303 | 45,254 | 42,350 | |||||||||||||||
Foreign currency related transactions | (28 | ) | (5 | ) | (35 | ) | (16 | ) | ||||||||||||
Net increase (decrease) in unrealized appreciation or depreciation on: | ||||||||||||||||||||
Investments, from unaffiliated issuers | (32,151 | ) | 7,333 | (92,642 | ) | 66,645 | ||||||||||||||
Foreign currency related transactions | (56 | ) | (7 | ) | (8 | ) | (2 | ) | ||||||||||||
Net increase (decrease) in net assets resulting from operations | (31,670 | ) | 9,889 | (44,496 | ) | 111,765 | ||||||||||||||
| DISTRIBUTIONS TO SHAREHOLDERS: | ||||||||||||||||||||
Investor Shares | (659 | ) | (900 | ) | (12,565 | ) | (6,500 | ) | ||||||||||||
Advisor Shares | – | (11,837 | ) | (7,059 | ) | |||||||||||||||
Institutional Shares | (89 | ) | (92 | ) | (19,119 | ) | (10,777 | ) | ||||||||||||
Total distributions to shareholders | (748 | ) | (992 | ) | (43,521 | ) | (24,336 | ) | ||||||||||||
| FUND SHARE ACTIVITIES: | ||||||||||||||||||||
Net increase (decrease) in net assets resulting from fund share activities | 23,380 | 9,636 | (56,154 | ) | (2,355 | ) | ||||||||||||||
Total increase (decrease) in net assets | (9,038 | ) | 18,533 | (144,171 | ) | 85,074 | ||||||||||||||
Net assets, beginning of year | 71,769 | 53,236 | 371,266 | 286,192 | ||||||||||||||||
Net assets, end of year | $ | 62,731 | $ | 71,769 | $ | 227,095 | $ | 371,266 | ||||||||||||
The accompanying notes are an integral part of the financial statements.
| 102 | Artisan Partners Funds |
ARTISAN PARTNERS FUNDS
Statements of Changes in Net Assets (Continued)
Dollar values in thousands
| VALUE INCOME | |||||
| Period Ended 9/30/2022(1) | |||||
| OPERATIONS: | |||||
Net investment income | $ | 167 | |||
Net realized gain (loss) on: | |||||
Investments, from unaffiliated issuers | (89 | ) | |||
Foreign currency related transactions | (1 | ) | |||
Written options | 3 | ||||
Net increase (decrease) in unrealized appreciation or depreciation on: | |||||
Investments, from unaffiliated issuers | (1,897 | ) | |||
Foreign currency related transactions | – | (2) | |||
Written options | (3 | ) | |||
Net decrease in net assets resulting from operations | (1,820 | ) | |||
| DISTRIBUTIONS TO SHAREHOLDERS: | |||||
Investor Shares | (12 | ) | |||
Advisor Shares | (18 | ) | |||
Institutional Shares | (131 | ) | |||
Total distributions to shareholders | (161 | ) | |||
| FUND SHARE ACTIVITIES: | |||||
Net increase in net assets resulting from fund share activities | 11,087 | ||||
Total increase in net assets | 9,106 | ||||
Net assets, beginning of period | – | ||||
Net assets, end of period | $ | 9,106 | |||
| (1) | For the period from commencement of operations (February 28, 2022) through September 30, 2022. |
| (2) | Amount rounds to less than $1 |
The accompanying notes are an integral part of the financial statements.
| Artisan Partners Funds | 103 |
Financial Highlights – For a share outstanding throughout each period
| Less Distributions From | ||||||||||||||||||||||||||||||||
Net Asset | Net Investment | Net Realized and Unrealized Gain (Loss) on Investments | Total from | Net Investment Income | Net Realized Gains | Total Distributions | Net Asset Value, End of Period | |||||||||||||||||||||||||
| DEVELOPING WORLD FUND | ||||||||||||||||||||||||||||||||
Investor Shares | ||||||||||||||||||||||||||||||||
9/30/2022 | $ | 25.55 | (0.17 | ) | (11.19 | ) | (11.36 | ) | — | (2.07 | ) | (2.07 | ) | $ | 12.12 | |||||||||||||||||
9/30/2021 | $ | 22.98 | (0.29 | ) | 3.97 | 3.68 | — | (1.11 | ) | (1.11 | ) | $ | 25.55 | |||||||||||||||||||
9/30/2020 | $ | 13.44 | (0.17 | ) | 9.71 | 9.54 | — | — | — | $ | 22.98 | |||||||||||||||||||||
9/30/2019 | $ | 11.17 | (0.07 | ) | 2.34 | 2.27 | — | (5) | — | — | (5) | $ | 13.44 | |||||||||||||||||||
9/30/2018 | $ | 12.83 | — | (5) | (1.23 | ) | (1.23 | ) | (0.02 | ) | (0.41 | ) | (0.43 | ) | $ | 11.17 | ||||||||||||||||
Advisor Shares | ||||||||||||||||||||||||||||||||
9/30/2022 | $ | 25.77 | (0.14 | ) | (11.31 | ) | (11.45 | ) | — | (2.07 | ) | (2.07 | ) | $ | 12.25 | |||||||||||||||||
9/30/2021 | $ | 23.13 | (0.24 | ) | 3.99 | 3.75 | — | (1.11 | ) | (1.11 | ) | $ | 25.77 | |||||||||||||||||||
9/30/2020 | $ | 13.51 | (0.14 | ) | 9.76 | 9.62 | — | — | — | $ | 23.13 | |||||||||||||||||||||
9/30/2019 | $ | 11.21 | (0.03 | ) | 2.34 | 2.31 | (0.01 | ) | — | (0.01 | ) | $ | 13.51 | |||||||||||||||||||
9/30/2018 | $ | 12.87 | 0.03 | (1.25 | ) | (1.22 | ) | (0.03 | ) | (0.41 | ) | (0.44 | ) | $ | 11.21 | |||||||||||||||||
Institutional Shares | ||||||||||||||||||||||||||||||||
9/30/2022 | $ | 25.90 | (0.12 | ) | (11.38 | ) | (11.50 | ) | — | (2.07 | ) | (2.07 | ) | $ | 12.33 | |||||||||||||||||
9/30/2021 | $ | 23.22 | (0.22 | ) | 4.01 | 3.79 | — | (1.11 | ) | (1.11 | ) | $ | 25.90 | |||||||||||||||||||
9/30/2020 | $ | 13.55 | (0.13 | ) | 9.80 | 9.67 | — | (5) | — | — | (5) | $ | 23.22 | |||||||||||||||||||
9/30/2019 | $ | 11.23 | (0.02 | ) | 2.34 | 2.32 | — | (5) | — | — | (5) | $ | 13.55 | |||||||||||||||||||
9/30/2018 | $ | 12.89 | 0.04 | (1.25 | ) | (1.21 | ) | (0.04 | ) | (0.41 | ) | (0.45 | ) | $ | 11.23 | |||||||||||||||||
| EMERGING MARKETS DEBT OPPORTUNITIES FUND | ||||||||||||||||||||||||||||||||
Investor Shares | ||||||||||||||||||||||||||||||||
9/30/2022(6) | $ | 10.00 | 0.24 | (0.41 | ) | (0.17 | ) | (0.23 | ) | — | (0.23 | ) | $ | 9.60 | ||||||||||||||||||
Advisor Shares | ||||||||||||||||||||||||||||||||
9/30/2022(6) | $ | 10.00 | 0.24 | (0.41 | ) | (0.17 | ) | (0.23 | ) | — | (0.23 | ) | $ | 9.60 | ||||||||||||||||||
Institutional Shares | ||||||||||||||||||||||||||||||||
9/30/2022(6) | $ | 10.00 | 0.23 | (0.39 | ) | (0.16 | ) | (0.24 | ) | — | (0.24 | ) | $ | 9.60 | ||||||||||||||||||
| FLOATING RATE FUND | ||||||||||||||||||||||||||||||||
Investor Shares | ||||||||||||||||||||||||||||||||
9/30/2022(7) | $ | 10.00 | 0.32 | (0.72 | ) | (0.40 | ) | (0.30 | ) | — | (0.30 | ) | $ | 9.30 | ||||||||||||||||||
Advisor Shares | ||||||||||||||||||||||||||||||||
9/30/2022(7) | $ | 10.00 | 0.33 | (0.72 | ) | (0.39 | ) | (0.31 | ) | — | (0.31 | ) | $ | 9.30 | ||||||||||||||||||
Institutional Shares | ||||||||||||||||||||||||||||||||
9/30/2022(7) | $ | 10.00 | 0.33 | (0.72 | ) | (0.39 | ) | (0.31 | ) | — | (0.31 | ) | $ | 9.30 | ||||||||||||||||||
| FOCUS FUND | ||||||||||||||||||||||||||||||||
Investor Shares | ||||||||||||||||||||||||||||||||
9/30/2022 | $ | 22.30 | (0.06 | ) | (3.61 | ) | (3.67 | ) | — | (3.44 | ) | (3.44 | ) | $ | 15.19 | |||||||||||||||||
9/30/2021 | $ | 18.34 | (0.11 | ) | 4.73 | 4.62 | — | (0.66 | ) | (0.66 | ) | $ | 22.30 | |||||||||||||||||||
9/30/2020 | $ | 15.63 | (0.06 | ) | 3.35 | 3.29 | (0.04 | ) | (0.54 | ) | (0.58 | ) | $ | 18.34 | ||||||||||||||||||
9/30/2019 | $ | 14.39 | (0.01 | ) | 1.70 | 1.69 | — | (5) | (0.45 | ) | (0.45 | ) | $ | 15.63 | ||||||||||||||||||
9/30/2018 | $ | 11.79 | (0.04 | ) | 3.82 | 3.78 | — | (1.18 | ) | (1.18 | ) | $ | 14.39 | |||||||||||||||||||
Advisor Shares | ||||||||||||||||||||||||||||||||
9/30/2022 | $ | 22.36 | (0.03 | ) | (3.64 | ) | (3.67 | ) | — | (3.44 | ) | (3.44 | ) | $ | 15.25 | |||||||||||||||||
9/30/2021 | $ | 18.36 | (0.08 | ) | 4.74 | 4.66 | — | (0.66 | ) | (0.66 | ) | $ | 22.36 | |||||||||||||||||||
9/30/2020 | $ | 15.66 | (0.04 | ) | 3.35 | 3.31 | (0.07 | ) | (0.54 | ) | (0.61 | ) | $ | 18.36 | ||||||||||||||||||
9/30/2019 | $ | 14.39 | 0.01 | 1.71 | 1.72 | — | (0.45 | ) | (0.45 | ) | $ | 15.66 | ||||||||||||||||||||
9/30/2018(9) | $ | 13.82 | — | (5) | 0.57 | 0.57 | — | — | — | $ | 14.39 | |||||||||||||||||||||
Institutional Shares | ||||||||||||||||||||||||||||||||
9/30/2022 | $ | 22.40 | (0.02 | ) | (3.64 | ) | (3.66 | ) | — | (3.44 | ) | (3.44 | ) | $ | 15.30 | |||||||||||||||||
9/30/2021 | $ | 18.37 | (0.06 | ) | 4.75 | 4.69 | — | (0.66 | ) | (0.66 | ) | $ | 22.40 | |||||||||||||||||||
9/30/2020(10) | $ | 16.37 | (0.01 | ) | 2.01 | 2.00 | — | — | — | $ | 18.37 | |||||||||||||||||||||
| 104 | Artisan Partners Funds |
ARTISAN PARTNERS FUNDS
Financial Highlights – continued
| Total Return(2)(18) | Net Assets, End of Period (000) | Ratio of Expenses to Average Net Assets(3)(4) | Ratio of Expenses to Average Net Assets Excluding Waivers(3) | Ratio of Net | Portfolio Turnover Rate(2) | |||||||||||||||||||
| DEVELOPING WORLD FUND | ||||||||||||||||||||||||
Investor Shares | ||||||||||||||||||||||||
9/30/2022 | (48.39 | )% | $ | 349,016 | 1.28 | % | n/a | (0.92 | )% | 87.26 | % | |||||||||||||
9/30/2021 | 16.15 | % | $ | 899,701 | 1.26 | % | n/a | (1.09 | )% | 126.20 | % | |||||||||||||
9/30/2020 | 71.06 | % | $ | 643,044 | 1.28 | % | n/a | (0.96 | )% | 138.63 | % | |||||||||||||
9/30/2019 | 20.33 | % | $ | 255,336 | 1.35 | % | n/a | (0.56 | )% | 159.86 | % | |||||||||||||
9/30/2018 | (9.99 | )% | $ | 477,908 | 1.36 | % | n/a | (0.02 | )% | 121.12 | % | |||||||||||||
Advisor Shares | ||||||||||||||||||||||||
9/30/2022 | (48.32 | )% | $ | 1,620,067 | 1.11 | % | n/a | (0.75 | )% | 87.26 | % | |||||||||||||
9/30/2021 | 16.35 | % | $ | 4,648,125 | 1.09 | % | n/a | (0.92 | )% | 126.20 | % | |||||||||||||
9/30/2020 | 71.28 | % | $ | 3,513,504 | 1.13 | % | n/a | (0.81 | )% | 138.63 | % | |||||||||||||
9/30/2019 | 20.59 | % | $ | 1,585,519 | 1.18 | % | n/a | (0.23 | )% | 159.86 | % | |||||||||||||
9/30/2018 | (9.87 | )% | $ | 1,031,825 | 1.18 | % | n/a | 0.22 | % | 121.12 | % | |||||||||||||
Institutional Shares | ||||||||||||||||||||||||
9/30/2022 | (48.27 | )% | $ | 1,282,523 | 1.03 | % | n/a | (0.66 | )% | 87.26 | % | |||||||||||||
9/30/2021 | 16.46 | % | $ | 3,178,364 | 1.00 | % | n/a | (0.83 | )% | 126.20 | % | |||||||||||||
9/30/2020 | 71.45 | % | $ | 2,475,795 | 1.04 | % | n/a | (0.72 | )% | 138.63 | % | |||||||||||||
9/30/2019 | 20.71 | % | $ | 820,920 | 1.08 | % | n/a | (0.15 | )% | 159.86 | % | |||||||||||||
9/30/2018 | (9.80 | )% | $ | 681,242 | 1.08 | % | n/a | 0.29 | % | 121.12 | % | |||||||||||||
| EMERGING MARKETS DEBT OPPORTUNITIES FUND | ||||||||||||||||||||||||
Investor Shares | ||||||||||||||||||||||||
9/30/2022(6) | (1.72 | )% | $ | 88 | 1.25 | % | 170.55 | % | 5.07 | % | 38.16 | % | ||||||||||||
Advisor Shares | ||||||||||||||||||||||||
9/30/2022(6) | (1.78 | )% | $ | 433 | 1.15 | % | 28.37 | % | 5.02 | % | 38.16 | % | ||||||||||||
Institutional Shares | ||||||||||||||||||||||||
9/30/2022(6) | (1.65 | )% | $ | 20,678 | 1.10 | % | 1.57 | % | 4.84 | % | 38.16 | % | ||||||||||||
| FLOATING RATE FUND | ||||||||||||||||||||||||
Investor Shares | ||||||||||||||||||||||||
9/30/2022(7) | (4.17 | )% | $ | 2,451 | 1.20 | % | 7.19 | % | 4.02 | % | 48.90 | % | ||||||||||||
Advisor Shares | ||||||||||||||||||||||||
9/30/2022(7) | (4.09 | )% | $ | 16,705 | 1.10 | % | 1.61 | % | 4.16 | % | 48.90 | % | ||||||||||||
Institutional Shares | ||||||||||||||||||||||||
9/30/2022(7) | (4.07 | )% | $ | 28,077 | 1.05 | % | 1.27 | % | 4.10 | % | 48.90 | % | ||||||||||||
| FOCUS FUND | ||||||||||||||||||||||||
Investor Shares | ||||||||||||||||||||||||
9/30/2022 | (20.76 | )% | $ | 237,102 | 1.24 | % | n/a | (0.31 | )% | 240.40 | % | |||||||||||||
9/30/2021 | 25.70 | % | $ | 340,450 | 1.25 | % | n/a | (0.52 | )% | 316.74 | % | |||||||||||||
9/30/2020 | 21.76 | % | $ | 262,246 | 1.30 | % | n/a | (0.39 | )% | 285.25 | % | |||||||||||||
9/30/2019 | 12.35 | % | $ | 170,186 | 1.37 | % | n/a | (0.07 | )% | 368.38 | % | |||||||||||||
9/30/2018 | 34.31 | % | $ | 79,673 | 1.51 | %(8) | 1.70 | %(8) | (0.27 | )% | 355.37 | % | ||||||||||||
Advisor Shares | ||||||||||||||||||||||||
9/30/2022 | (20.60 | )% | $ | 817,890 | 1.10 | % | n/a | (0.17 | )% | 240.40 | % | |||||||||||||
9/30/2021 | 25.84 | % | $ | 1,219,909 | 1.10 | % | n/a | (0.36 | )% | 316.74 | % | |||||||||||||
9/30/2020 | 21.98 | % | $ | 735,871 | 1.13 | % | n/a | (0.26 | )% | 285.25 | % | |||||||||||||
9/30/2019 | 12.49 | % | $ | 521,293 | 1.17 | % | n/a | 0.04 | % | 368.38 | % | |||||||||||||
9/30/2018(9) | 4.12 | % | $ | 38,135 | 1.40 | %(8) | 2.74 | %(8) | 0.16 | % | 355.37 | % | ||||||||||||
Institutional Shares | ||||||||||||||||||||||||
9/30/2022 | (20.56 | )% | $ | 553,450 | 1.01 | % | n/a | (0.08 | )% | 240.40 | % | |||||||||||||
9/30/2021 | 25.93 | % | $ | 738,016 | 1.01 | % | n/a | (0.27 | )% | 316.74 | % | |||||||||||||
9/30/2020(10) | 12.28 | % | $ | 437,948 | 1.04 | % | n/a | (0.14 | )% | 285.25 | % | |||||||||||||
| Artisan Partners Funds | 105 |
ARTISAN PARTNERS FUNDS
Financial Highlights – For a share outstanding throughout each period
| Less Distributions From | ||||||||||||||||||||||||||||||||
Net Asset | Net Investment | Net Realized and Unrealized Gain (Loss) on Investments | Total from | Net Investment Income | Net Realized Gains | Total Distributions | Net Asset Value, End of Period | |||||||||||||||||||||||||
| GLOBAL DISCOVERY FUND | ||||||||||||||||||||||||||||||||
Investor Shares | ||||||||||||||||||||||||||||||||
9/30/2022 | $ | 23.07 | (0.17 | ) | (7.02 | ) | (7.19 | ) | — | (1.73 | ) | (1.73 | ) | $ | 14.15 | |||||||||||||||||
9/30/2021 | $ | 18.40 | (0.20 | ) | 5.27 | 5.07 | — | (0.40 | ) | (0.40 | ) | $ | 23.07 | |||||||||||||||||||
9/30/2020 | $ | 13.39 | (0.13 | ) | 5.14 | 5.01 | — | — | — | $ | 18.40 | |||||||||||||||||||||
9/30/2019 | $ | 12.40 | (0.08 | ) | 1.07 | 0.99 | — | — | — | $ | 13.39 | |||||||||||||||||||||
9/30/2018 | $ | 10.32 | (0.09 | ) | 2.23 | 2.14 | — | (5) | (0.06 | ) | (0.06 | ) | $ | 12.40 | ||||||||||||||||||
Advisor Shares | ||||||||||||||||||||||||||||||||
9/30/2022 | $ | 23.09 | (0.16 | ) | (7.02 | ) | (7.18 | ) | — | (1.73 | ) | (1.73 | ) | $ | 14.18 | |||||||||||||||||
9/30/2021 | $ | 18.41 | (0.19 | ) | 5.27 | 5.08 | — | (0.40 | ) | (0.40 | ) | $ | 23.09 | |||||||||||||||||||
9/30/2020(10) | $ | 14.96 | (0.08 | ) | 3.53 | 3.45 | — | — | — | $ | 18.41 | |||||||||||||||||||||
Institutional Shares | ||||||||||||||||||||||||||||||||
9/30/2022 | $ | 23.15 | (0.11 | ) | (7.06 | ) | (7.17 | ) | — | (1.73 | ) | (1.73 | ) | $ | 14.25 | |||||||||||||||||
9/30/2021 | $ | 18.41 | (0.14 | ) | 5.28 | 5.14 | — | (0.40 | ) | (0.40 | ) | $ | 23.15 | |||||||||||||||||||
9/30/2020(10) | $ | 14.96 | (0.07 | ) | 3.52 | 3.45 | — | — | — | $ | 18.41 | |||||||||||||||||||||
| GLOBAL EQUITY FUND | ||||||||||||||||||||||||||||||||
Investor Shares | ||||||||||||||||||||||||||||||||
9/30/2022 | $ | 24.46 | 0.06 | (6.59 | ) | (6.53 | ) | — | (3.74 | ) | (3.74 | ) | $ | 14.19 | ||||||||||||||||||
9/30/2021 | $ | 23.03 | (0.11 | ) | 4.33 | 4.22 | — | (2.79 | ) | (2.79 | ) | $ | 24.46 | |||||||||||||||||||
9/30/2020 | $ | 20.60 | (0.05 | ) | 4.26 | 4.21 | — | (1.78 | ) | (1.78 | ) | $ | 23.03 | |||||||||||||||||||
9/30/2019 | $ | 22.66 | (0.02 | ) | 1.02 | 1.00 | (0.03 | ) | (3.03 | ) | (3.06 | ) | $ | 20.60 | ||||||||||||||||||
9/30/2018 | $ | 19.60 | 0.03 | 3.17 | 3.20 | — | (0.14 | ) | (0.14 | ) | $ | 22.66 | ||||||||||||||||||||
Advisor Shares | ||||||||||||||||||||||||||||||||
9/30/2022 | $ | 24.46 | 0.03 | (6.56 | ) | (6.53 | ) | — | (3.74 | ) | (3.74 | ) | $ | 14.19 | ||||||||||||||||||
9/30/2021 | $ | 23.04 | (0.11 | ) | 4.32 | 4.21 | — | (2.79 | ) | (2.79 | ) | $ | 24.46 | |||||||||||||||||||
9/30/2020(11) | $ | 22.81 | (0.02 | ) | 0.25 | 0.23 | — | — | — | $ | 23.04 | |||||||||||||||||||||
Institutional Shares | ||||||||||||||||||||||||||||||||
9/30/2022 | $ | 24.72 | 0.13 | (6.71 | ) | (6.58 | ) | — | (3.74 | ) | (3.74 | ) | $ | 14.40 | ||||||||||||||||||
9/30/2021 | $ | 23.21 | (0.06 | ) | 4.36 | 4.30 | — | (2.79 | ) | (2.79 | ) | $ | 24.72 | |||||||||||||||||||
9/30/2020 | $ | 20.71 | (0.03 | ) | 4.32 | 4.29 | (0.01 | ) | (1.78 | ) | (1.79 | ) | $ | 23.21 | ||||||||||||||||||
9/30/2019 | $ | 22.80 | 0.02 | 1.01 | 1.03 | (0.09 | ) | (3.03 | ) | (3.12 | ) | $ | 20.71 | |||||||||||||||||||
9/30/2018 | $ | 19.66 | 0.10 | 3.18 | 3.28 | — | (0.14 | ) | (0.14 | ) | $ | 22.80 | ||||||||||||||||||||
| GLOBAL OPPORTUNITIES FUND | ||||||||||||||||||||||||||||||||
Investor Shares | ||||||||||||||||||||||||||||||||
9/30/2022 | $ | 39.09 | (0.08 | ) | (10.71 | ) | (10.79 | ) | — | (3.98 | ) | (3.98 | ) | $ | 24.32 | |||||||||||||||||
9/30/2021 | $ | 34.89 | (0.10 | ) | 6.70 | 6.60 | — | (2.40 | ) | (2.40 | ) | $ | 39.09 | |||||||||||||||||||
9/30/2020 | $ | 27.06 | (0.06 | ) | 9.80 | 9.74 | — | (1.91 | ) | (1.91 | ) | $ | 34.89 | |||||||||||||||||||
9/30/2019 | $ | 27.66 | (0.01 | ) | 1.01 | 1.00 | — | (1.60 | ) | (1.60 | ) | $ | 27.06 | |||||||||||||||||||
9/30/2018 | $ | 25.69 | (0.03 | ) | 3.07 | 3.04 | — | (1.07 | ) | (1.07 | ) | $ | 27.66 | |||||||||||||||||||
Advisor Shares | ||||||||||||||||||||||||||||||||
9/30/2022 | $ | 39.40 | (0.04 | ) | (10.81 | ) | (10.85 | ) | — | (3.98 | ) | (3.98 | ) | $ | 24.57 | |||||||||||||||||
9/30/2021 | $ | 35.10 | (0.05 | ) | 6.75 | 6.70 | — | (2.40 | ) | (2.40 | ) | $ | 39.40 | |||||||||||||||||||
9/30/2020 | $ | 27.21 | (0.03 | ) | 9.86 | 9.83 | (0.03 | ) | (1.91 | ) | (1.94 | ) | $ | 35.10 | ||||||||||||||||||
9/30/2019 | $ | 27.76 | 0.03 | 1.02 | 1.05 | — | (1.60 | ) | (1.60 | ) | $ | 27.21 | ||||||||||||||||||||
9/30/2018 | $ | 25.75 | 0.01 | 3.07 | 3.08 | — | (1.07 | ) | (1.07 | ) | $ | 27.76 | ||||||||||||||||||||
Institutional Shares | ||||||||||||||||||||||||||||||||
9/30/2022 | $ | 39.89 | (0.01 | ) | (10.97 | ) | (10.98 | ) | — | (3.98 | ) | (3.98 | ) | $ | 24.93 | |||||||||||||||||
9/30/2021 | $ | 35.47 | (0.01 | ) | 6.83 | 6.82 | — | (2.40 | ) | (2.40 | ) | $ | 39.89 | |||||||||||||||||||
9/30/2020 | $ | 27.47 | — | (5) | 9.96 | 9.96 | (0.05 | ) | (1.91 | ) | (1.96 | ) | $ | 35.47 | ||||||||||||||||||
9/30/2019 | $ | 27.99 | 0.06 | 1.02 | 1.08 | — | (5) | (1.60 | ) | (1.60 | ) | $ | 27.47 | |||||||||||||||||||
9/30/2018 | $ | 25.92 | 0.03 | 3.11 | 3.14 | — | (1.07 | ) | (1.07 | ) | $ | 27.99 | ||||||||||||||||||||
| 106 | Artisan Partners Funds |
ARTISAN PARTNERS FUNDS
Financial Highlights – continued
| Total Return(2)(18) | Net Assets, End of Period (000) | Ratio of Expenses to Average Net Assets(3)(4) | Ratio of Expenses to Average Net Assets Excluding Waivers(3) | Ratio of Net | Portfolio Turnover Rate(2) | |||||||||||||||||||
| GLOBAL DISCOVERY FUND | ||||||||||||||||||||||||
Investor Shares | ||||||||||||||||||||||||
9/30/2022 | (33.87 | )% | $ | 36,925 | 1.38 | % | n/a | (0.91 | )% | 59.23 | % | |||||||||||||
9/30/2021 | 27.93 | % | $ | 63,547 | 1.38 | % | n/a | (0.96 | )% | 47.02 | % | |||||||||||||
9/30/2020 | 37.42 | % | $ | 106,480 | 1.35 | % | n/a | (0.89 | )% | 40.44 | % | |||||||||||||
9/30/2019 | 7.98 | % | $ | 107,323 | 1.40 | % | n/a | (0.62 | )% | 52.30 | % | |||||||||||||
9/30/2018 | 20.90 | % | $ | 75,321 | 1.50 | % | 1.71 | % | (0.75 | )% | 38.71 | % | ||||||||||||
Advisor Shares | ||||||||||||||||||||||||
9/30/2022 | (33.79 | )% | $ | 13,438 | 1.30 | % | 1.41 | % | (0.84 | )% | 59.23 | % | ||||||||||||
9/30/2021 | 27.97 | % | $ | 19,954 | 1.30 | % | 1.40 | % | (0.88 | )% | 47.02 | % | ||||||||||||
9/30/2020(10) | 23.06 | % | $ | 19,698 | 1.30 | % | 1.74 | % | (0.73 | )% | 40.44 | % | ||||||||||||
Institutional Shares | ||||||||||||||||||||||||
9/30/2022 | (33.65 | )% | $ | 182,038 | 1.06 | % | n/a | (0.58 | )% | 59.23 | % | |||||||||||||
9/30/2021 | 28.30 | % | $ | 270,640 | 1.08 | % | n/a | (0.63 | )% | 47.02 | % | |||||||||||||
9/30/2020(10) | 23.06 | % | $ | 84,267 | 1.20 | % | n/a | (0.62 | )% | 40.44 | % | |||||||||||||
| GLOBAL EQUITY FUND | ||||||||||||||||||||||||
Investor Shares | ||||||||||||||||||||||||
9/30/2022 | (31.48 | )% | $ | 66,270 | 1.28 | % | n/a | 0.33 | % | 92.81 | % | |||||||||||||
9/30/2021 | 19.70 | % | $ | 151,122 | 1.26 | % | n/a | (0.47 | )% | 119.10 | % | |||||||||||||
9/30/2020 | 21.90 | % | $ | 134,498 | 1.26 | % | n/a | (0.27 | )% | 137.93 | % | |||||||||||||
9/30/2019 | 6.90 | % | $ | 118,936 | 1.38 | % | n/a | (0.09 | )% | 91.33 | % | |||||||||||||
9/30/2018 | 16.38 | % | $ | 123,225 | 1.36 | % | n/a | 0.13 | % | 120.14 | % | |||||||||||||
Advisor Shares | ||||||||||||||||||||||||
9/30/2022 | (31.48 | )% | $ | 4,027 | 1.25 | % | 1.61 | % | 0.14 | % | 92.81 | % | ||||||||||||
9/30/2021 | 19.64 | % | $ | 14,273 | 1.25 | % | 1.62 | % | (0.46 | )% | 119.10 | % | ||||||||||||
9/30/2020(11) | 1.01 | % | $ | 13,092 | 1.25 | % | 2.51 | % | (0.53 | )% | 137.93 | % | ||||||||||||
Institutional Shares | ||||||||||||||||||||||||
9/30/2022 | (31.34 | )% | $ | 105,954 | 1.04 | % | n/a | 0.72 | % | 92.81 | % | |||||||||||||
9/30/2021 | 19.91 | % | $ | 168,343 | 1.05 | % | n/a | (0.24 | )% | 119.10 | % | |||||||||||||
9/30/2020 | 22.17 | % | $ | 109,307 | 1.05 | % | n/a | (0.12 | )% | 137.93 | % | |||||||||||||
9/30/2019 | 7.10 | % | $ | 136,019 | 1.16 | % | n/a | 0.09 | % | 91.33 | % | |||||||||||||
9/30/2018 | 16.73 | % | $ | 196,802 | 1.10 | % | n/a | 0.45 | % | 120.14 | % | |||||||||||||
| GLOBAL OPPORTUNITIES FUND | ||||||||||||||||||||||||
Investor Shares | ||||||||||||||||||||||||
9/30/2022 | (31.13 | )% | $ | 782,904 | 1.14 | % | n/a | (0.26 | )% | 37.32 | % | |||||||||||||
9/30/2021 | 19.89 | % | $ | 1,514,576 | 1.13 | % | n/a | (0.27 | )% | 44.44 | % | |||||||||||||
9/30/2020 | 38.37 | % | $ | 1,358,867 | 1.14 | % | n/a | (0.23 | )% | 44.27 | % | |||||||||||||
9/30/2019 | 4.85 | % | $ | 1,052,916 | 1.15 | % | n/a | (0.02 | )% | 48.64 | % | |||||||||||||
9/30/2018 | 12.19 | % | $ | 1,176,471 | 1.15 | % | n/a | (0.13 | )% | 44.27 | % | |||||||||||||
Advisor Shares | ||||||||||||||||||||||||
9/30/2022 | (31.03 | )% | $ | 625,332 | 1.00 | % | n/a | (0.13 | )% | 37.32 | % | |||||||||||||
9/30/2021 | 20.07 | % | $ | 1,253,950 | 0.99 | % | n/a | (0.12 | )% | 44.44 | % | |||||||||||||
9/30/2020 | 38.52 | % | $ | 957,127 | 1.01 | % | n/a | (0.09 | )% | 44.27 | % | |||||||||||||
9/30/2019 | 5.03 | % | $ | 615,920 | 1.01 | % | n/a | 0.11 | % | 48.64 | % | |||||||||||||
9/30/2018 | 12.32 | % | $ | 583,463 | 1.00 | % | n/a | 0.03 | % | 44.27 | % | |||||||||||||
Institutional Shares | ||||||||||||||||||||||||
9/30/2022 | (30.97 | )% | $ | 1,765,829 | 0.90 | % | n/a | (0.03 | )% | 37.32 | % | |||||||||||||
9/30/2021 | 20.20 | % | $ | 2,970,987 | 0.89 | % | n/a | (0.03 | )% | 44.44 | % | |||||||||||||
9/30/2020 | 38.67 | % | $ | 2,466,599 | 0.90 | % | n/a | 0.01 | % | 44.27 | % | |||||||||||||
9/30/2019 | 5.11 | % | $ | 1,726,115 | 0.91 | % | n/a | 0.23 | % | 48.64 | % | |||||||||||||
9/30/2018 | 12.48 | % | $ | 1,645,152 | 0.91 | % | n/a | 0.11 | % | 44.27 | % | |||||||||||||
| Artisan Partners Funds | 107 |
ARTISAN PARTNERS FUNDS
Financial Highlights – For a share outstanding throughout each period
| Less Distributions From | ||||||||||||||||||||||||||||||||
Net Asset | Net Investment | Net Realized and Unrealized Gain (Loss) on Investments | Total from | Net Investment Income | Net Realized Gains | Total Distributions | Net Asset Value, End of Period | |||||||||||||||||||||||||
| GLOBAL UNCONSTRAINED FUND | ||||||||||||||||||||||||||||||||
Investor Shares | ||||||||||||||||||||||||||||||||
9/30/2022(12) | $ | 10.00 | 0.17 | 0.04 | 0.21 | (0.11 | ) | — | (0.11 | ) | $ | 10.10 | ||||||||||||||||||||
Advisor Shares | ||||||||||||||||||||||||||||||||
9/30/2022(12) | $ | 10.00 | 0.18 | 0.04 | 0.22 | (0.11 | ) | — | (0.11 | ) | $ | 10.11 | ||||||||||||||||||||
Institutional Shares | ||||||||||||||||||||||||||||||||
9/30/2022(12) | $ | 10.00 | 0.14 | 0.09 | 0.23 | (0.12 | ) | — | (0.12 | ) | $ | 10.11 | ||||||||||||||||||||
| GLOBAL VALUE FUND | ||||||||||||||||||||||||||||||||
Investor Shares | ||||||||||||||||||||||||||||||||
9/30/2022 | $ | 21.58 | 0.16 | (4.26 | ) | (4.10 | ) | (0.19 | ) | (1.73 | ) | (1.92 | ) | $ | 15.56 | |||||||||||||||||
9/30/2021 | $ | 15.94 | 0.17 | 5.48 | 5.65 | (0.01 | ) | — | (0.01 | ) | $ | 21.58 | ||||||||||||||||||||
9/30/2020 | $ | 17.12 | 0.07 | (1.01 | ) | (0.94 | ) | (0.24 | ) | — | (0.24 | ) | $ | 15.94 | ||||||||||||||||||
9/30/2019 | $ | 18.24 | 0.21 | (0.38 | ) | (0.17 | ) | (0.15 | ) | (0.80 | ) | (0.95 | ) | $ | 17.12 | |||||||||||||||||
9/30/2018 | $ | 17.87 | 0.18 | 0.55 | 0.73 | (0.12 | ) | (0.24 | ) | (0.36 | ) | $ | 18.24 | |||||||||||||||||||
Advisor Shares | ||||||||||||||||||||||||||||||||
9/30/2022 | $ | 21.57 | 0.19 | (4.26 | ) | (4.07 | ) | (0.22 | ) | (1.73 | ) | (1.95 | ) | $ | 15.55 | |||||||||||||||||
9/30/2021 | $ | 15.91 | 0.19 | 5.49 | 5.68 | (0.02 | ) | — | (0.02 | ) | $ | 21.57 | ||||||||||||||||||||
9/30/2020 | $ | 17.09 | 0.09 | (1.01 | ) | (0.92 | ) | (0.26 | ) | — | (0.26 | ) | $ | 15.91 | ||||||||||||||||||
9/30/2019 | $ | 18.22 | 0.23 | (0.39 | ) | (0.16 | ) | (0.17 | ) | (0.80 | ) | (0.97 | ) | $ | 17.09 | |||||||||||||||||
9/30/2018 | $ | 17.86 | 0.21 | 0.54 | 0.75 | (0.15 | ) | (0.24 | ) | (0.39 | ) | $ | 18.22 | |||||||||||||||||||
Institutional Shares | ||||||||||||||||||||||||||||||||
9/30/2022 | $ | 21.63 | 0.21 | (4.27 | ) | (4.06 | ) | (0.24 | ) | (1.73 | ) | (1.97 | ) | $ | 15.60 | |||||||||||||||||
9/30/2021 | $ | 15.96 | 0.21 | 5.50 | 5.71 | (0.04 | ) | — | (0.04 | ) | $ | 21.63 | ||||||||||||||||||||
9/30/2020 | $ | 17.14 | 0.11 | (1.01 | ) | (0.90 | ) | (0.28 | ) | — | (0.28 | ) | $ | 15.96 | ||||||||||||||||||
9/30/2019 | $ | 18.27 | 0.26 | (0.40 | ) | (0.14 | ) | (0.19 | ) | (0.80 | ) | (0.99 | ) | $ | 17.14 | |||||||||||||||||
9/30/2018 | $ | 17.90 | 0.24 | 0.54 | 0.78 | (0.17 | ) | (0.24 | ) | (0.41 | ) | $ | 18.27 | |||||||||||||||||||
| HIGH INCOME FUND | ||||||||||||||||||||||||||||||||
Investor Shares | ||||||||||||||||||||||||||||||||
9/30/2022 | $ | 10.28 | 0.51 | (1.58 | ) | (1.07 | ) | (0.53 | ) | (0.22 | ) | (0.75 | ) | $ | 8.46 | |||||||||||||||||
9/30/2021 | $ | 9.53 | 0.55 | 0.74 | 1.29 | (0.54 | ) | — | (0.54 | ) | $ | 10.28 | ||||||||||||||||||||
9/30/2020 | $ | 9.66 | 0.60 | (0.13 | ) | 0.47 | (0.60 | ) | — | (0.60 | ) | $ | 9.53 | |||||||||||||||||||
9/30/2019 | $ | 9.87 | 0.61 | (0.17 | ) | 0.44 | (0.60 | ) | (0.05 | ) | (0.65 | ) | $ | 9.66 | ||||||||||||||||||
9/30/2018 | $ | 10.20 | 0.58 | (0.13 | ) | 0.45 | (0.58 | ) | (0.20 | ) | (0.78 | ) | $ | 9.87 | ||||||||||||||||||
Advisor Shares | ||||||||||||||||||||||||||||||||
9/30/2022 | $ | 10.27 | 0.53 | (1.59 | ) | (1.06 | ) | (0.54 | ) | (0.22 | ) | (0.76 | ) | $ | 8.45 | |||||||||||||||||
9/30/2021 | $ | 9.53 | 0.56 | 0.74 | 1.30 | (0.56 | ) | — | (0.56 | ) | $ | 10.27 | ||||||||||||||||||||
9/30/2020 | $ | 9.66 | 0.61 | (0.13 | ) | 0.48 | (0.61 | ) | — | (0.61 | ) | $ | 9.53 | |||||||||||||||||||
9/30/2019 | $ | 9.87 | 0.63 | (0.17 | ) | 0.46 | (0.62 | ) | (0.05 | ) | (0.67 | ) | $ | 9.66 | ||||||||||||||||||
9/30/2018 | $ | 10.20 | 0.60 | (0.13 | ) | 0.47 | (0.60 | ) | (0.20 | ) | (0.80 | ) | $ | 9.87 | ||||||||||||||||||
Institutional Shares | ||||||||||||||||||||||||||||||||
9/30/2022 | $ | 10.27 | 0.54 | (1.59 | ) | (1.05 | ) | (0.55 | ) | (0.22 | ) | (0.77 | ) | $ | 8.45 | |||||||||||||||||
9/30/2021 | $ | 9.53 | 0.57 | 0.74 | 1.31 | (0.57 | ) | — | (0.57 | ) | $ | 10.27 | ||||||||||||||||||||
9/30/2020 | $ | 9.66 | 0.62 | (0.13 | ) | 0.49 | (0.62 | ) | — | (0.62 | ) | $ | 9.53 | |||||||||||||||||||
9/30/2019 | $ | 9.87 | 0.64 | (0.17 | ) | 0.47 | (0.63 | ) | (0.05 | ) | (0.68 | ) | $ | 9.66 | ||||||||||||||||||
9/30/2018 | $ | 10.19 | 0.61 | (0.12 | ) | 0.49 | (0.61 | ) | (0.20 | ) | (0.81 | ) | $ | 9.87 | ||||||||||||||||||
| 108 | Artisan Partners Funds |
ARTISAN PARTNERS FUNDS
Financial Highlights – continued
| Total Return(2)(18) | Net Assets, End of Period (000) | Ratio of Expenses to Average Net Assets(3)(4) | Ratio of Expenses to Average Net Assets Excluding Waivers(3) | Ratio of Net | Portfolio Turnover Rate(2) | |||||||||||||||||||
| GLOBAL UNCONSTRAINED FUND | ||||||||||||||||||||||||
Investor Shares | ||||||||||||||||||||||||
9/30/2022(12) | 2.10 | % | $ | 466 | 1.75 | %(8) | 54.50 | %(8) | 3.28 | % | 40.30 | % | ||||||||||||
Advisor Shares | ||||||||||||||||||||||||
9/30/2022(12) | 2.24 | % | $ | 2,011 | 1.62 | %(8) | 9.54 | %(8) | 3.66 | % | 40.30 | % | ||||||||||||
Institutional Shares | ||||||||||||||||||||||||
9/30/2022(12) | 2.27 | % | $ | 12,558 | 1.48 | %(8) | 2.57 | %(8) | 2.82 | % | 40.30 | % | ||||||||||||
| GLOBAL VALUE FUND | ||||||||||||||||||||||||
Investor Shares | ||||||||||||||||||||||||
9/30/2022 | (21.10 | )% | $ | 199,274 | 1.25 | % | n/a | 0.83 | % | 24.37 | % | |||||||||||||
9/30/2021 | 35.46 | % | $ | 287,469 | 1.24 | % | n/a | 0.80 | % | 39.62 | % | |||||||||||||
9/30/2020 | (5.63 | )% | $ | 242,744 | 1.26 | % | n/a | 0.42 | % | 37.09 | % | |||||||||||||
9/30/2019 | (0.50 | )% | $ | 506,067 | 1.25 | % | n/a | 1.25 | % | 31.18 | % | |||||||||||||
9/30/2018 | 4.16 | % | $ | 724,848 | 1.25 | % | n/a | 1.00 | % | 27.98 | % | |||||||||||||
Advisor Shares | ||||||||||||||||||||||||
9/30/2022 | (21.01 | )% | $ | 254,970 | 1.11 | % | n/a | 0.97 | % | 24.37 | % | |||||||||||||
9/30/2021 | 35.70 | % | $ | 324,013 | 1.10 | % | n/a | 0.95 | % | 39.62 | % | |||||||||||||
9/30/2020 | (5.48 | )% | $ | 259,859 | 1.12 | % | n/a | 0.54 | % | 37.09 | % | |||||||||||||
9/30/2019 | (0.40 | )% | $ | 599,418 | 1.10 | % | n/a | 1.38 | % | 31.18 | % | |||||||||||||
9/30/2018 | 4.27 | % | $ | 851,738 | 1.10 | % | n/a | 1.14 | % | 27.98 | % | |||||||||||||
Institutional Shares | ||||||||||||||||||||||||
9/30/2022 | (20.92 | )% | $ | 1,363,881 | 1.01 | % | n/a | 1.07 | % | 24.37 | % | |||||||||||||
9/30/2021 | 35.80 | % | $ | 1,863,947 | 1.01 | % | n/a | 1.01 | % | 39.62 | % | |||||||||||||
9/30/2020 | (5.37 | )% | $ | 1,321,157 | 1.02 | % | n/a | 0.67 | % | 37.09 | % | |||||||||||||
9/30/2019 | (0.30 | )% | $ | 1,970,393 | 1.01 | % | n/a | 1.54 | % | 31.18 | % | |||||||||||||
9/30/2018 | 4.40 | % | $ | 2,143,564 | 1.01 | % | n/a | 1.31 | % | 27.98 | % | |||||||||||||
| HIGH INCOME FUND | ||||||||||||||||||||||||
Investor Shares | ||||||||||||||||||||||||
9/30/2022 | (11.00 | )% | $ | 756,049 | 0.94 | % | n/a | 5.34 | % | 55.84 | % | |||||||||||||
9/30/2021 | 13.79 | % | $ | 1,436,340 | 0.95 | % | n/a | 5.42 | % | 58.10 | % | |||||||||||||
9/30/2020 | 5.14 | % | $ | 1,149,422 | 0.96 | % | n/a | 6.43 | % | 71.78 | % | |||||||||||||
9/30/2019 | 4.81 | % | $ | 873,574 | 0.98 | % | n/a | 6.41 | % | 74.82 | % | |||||||||||||
9/30/2018 | 4.66 | % | $ | 986,645 | 0.99 | % | n/a | 5.88 | % | 79.10 | % | |||||||||||||
Advisor Shares | ||||||||||||||||||||||||
9/30/2022 | (10.88 | )% | $ | 2,570,217 | 0.79 | % | n/a | 5.56 | % | 55.84 | % | |||||||||||||
9/30/2021 | 13.86 | % | $ | 3,263,582 | 0.79 | % | n/a | 5.56 | % | 58.10 | % | |||||||||||||
9/30/2020 | 5.29 | % | $ | 2,281,480 | 0.82 | % | n/a | 6.57 | % | 71.78 | % | |||||||||||||
9/30/2019 | 4.98 | % | $ | 2,194,146 | 0.82 | % | n/a | 6.56 | % | 74.82 | % | |||||||||||||
9/30/2018 | 4.83 | % | $ | 1,970,272 | 0.82 | % | n/a | 6.03 | % | 79.10 | % | |||||||||||||
Institutional Shares | ||||||||||||||||||||||||
9/30/2022 | (10.81 | )% | $ | 2,482,806 | 0.70 | % | n/a | 5.68 | % | 55.84 | % | |||||||||||||
9/30/2021 | 13.97 | % | $ | 2,372,161 | 0.70 | % | n/a | 5.63 | % | 58.10 | % | |||||||||||||
9/30/2020 | 5.40 | % | $ | 1,385,864 | 0.72 | % | n/a | 6.67 | % | 71.78 | % | |||||||||||||
9/30/2019 | 5.08 | % | $ | 720,592 | 0.73 | % | n/a | 6.64 | % | 74.82 | % | |||||||||||||
9/30/2018 | 5.02 | % | $ | 289,036 | 0.74 | % | n/a | 6.13 | % | 79.10 | % | |||||||||||||
| Artisan Partners Funds | 109 |
ARTISAN PARTNERS FUNDS
Financial Highlights – For a share outstanding throughout each period
| Less Distributions From | ||||||||||||||||||||||||||||||||
Net Asset | Net Investment | Net Realized and Unrealized Gain (Loss) on Investments | Total from | Net Investment Income | Net Realized Gains | Total Distributions | Net Asset Value, End of Period | |||||||||||||||||||||||||
| INTERNATIONAL FUND | ||||||||||||||||||||||||||||||||
Investor Shares | ||||||||||||||||||||||||||||||||
9/30/2022 | $ | 36.66 | 0.28 | (8.90 | ) | (8.62 | ) | (0.24 | ) | (6.87 | ) | (7.11 | ) | $ | 20.93 | |||||||||||||||||
9/30/2021 | $ | 32.86 | 0.24 | 4.68 | 4.92 | (0.08 | ) | (1.04 | ) | (1.12 | ) | $ | 36.66 | |||||||||||||||||||
9/30/2020 | $ | 32.52 | 0.08 | 2.00 | 2.08 | (0.30 | ) | (1.44 | ) | (1.74 | ) | $ | 32.86 | |||||||||||||||||||
9/30/2019 | $ | 33.49 | 0.29 | 1.38 | 1.67 | (0.37 | ) | (2.27 | ) | (2.64 | ) | $ | 32.52 | |||||||||||||||||||
9/30/2018 | $ | 32.28 | 0.35 | 1.08 | 1.43 | (0.22 | ) | — | (0.22 | ) | $ | 33.49 | ||||||||||||||||||||
Advisor Shares | �� | |||||||||||||||||||||||||||||||
9/30/2022 | $ | 36.58 | 0.32 | (8.86 | ) | (8.54 | ) | (0.30 | ) | (6.87 | ) | (7.17 | ) | $ | 20.87 | |||||||||||||||||
9/30/2021 | $ | 32.80 | 0.30 | 4.65 | 4.95 | (0.13 | ) | (1.04 | ) | (1.17 | ) | $ | 36.58 | |||||||||||||||||||
9/30/2020 | $ | 32.46 | 0.15 | 1.98 | 2.13 | (0.35 | ) | (1.44 | ) | (1.79 | ) | $ | 32.80 | |||||||||||||||||||
9/30/2019 | $ | 33.45 | 0.34 | 1.37 | 1.71 | (0.43 | ) | (2.27 | ) | (2.70 | ) | $ | 32.46 | |||||||||||||||||||
9/30/2018 | $ | 32.25 | 0.43 | 1.05 | 1.48 | (0.28 | ) | — | (0.28 | ) | $ | 33.45 | ||||||||||||||||||||
Institutional Shares | ||||||||||||||||||||||||||||||||
9/30/2022 | $ | 36.90 | 0.35 | (8.95 | ) | (8.60 | ) | (0.34 | ) | (6.87 | ) | (7.21 | ) | $ | 21.09 | |||||||||||||||||
9/30/2021 | $ | 33.08 | 0.33 | 4.69 | 5.02 | (0.16 | ) | (1.04 | ) | (1.20 | ) | $ | 36.90 | |||||||||||||||||||
9/30/2020 | $ | 32.72 | 0.17 | 2.01 | 2.18 | (0.38 | ) | (1.44 | ) | (1.82 | ) | $ | 33.08 | |||||||||||||||||||
9/30/2019 | $ | 33.71 | 0.35 | 1.39 | 1.74 | (0.46 | ) | (2.27 | ) | (2.73 | ) | $ | 32.72 | |||||||||||||||||||
9/30/2018 | $ | 32.50 | 0.46 | 1.05 | 1.51 | (0.30 | ) | — | (0.30 | ) | $ | 33.71 | ||||||||||||||||||||
| INTERNATIONAL EXPLORER FUND | ||||||||||||||||||||||||||||||||
Advisor Shares | ||||||||||||||||||||||||||||||||
9/30/2022(13) | $ | 10.00 | 0.02 | (1.33 | ) | (1.31 | ) | — | — | — | $ | 8.69 | ||||||||||||||||||||
Institutional Shares | ||||||||||||||||||||||||||||||||
9/30/2022(13) | $ | 10.00 | 0.01 | (1.32 | ) | (1.31 | ) | — | — | — | $ | 8.69 | ||||||||||||||||||||
| INTERNATIONAL SMALL-MID FUND | ||||||||||||||||||||||||||||||||
Investor Shares | ||||||||||||||||||||||||||||||||
9/30/2022 | $ | 21.19 | (0.06 | ) | (6.65 | ) | (6.71 | ) | — | (0.58 | ) | (0.58 | ) | $ | 13.90 | |||||||||||||||||
9/30/2021 | $ | 17.33 | (0.09 | ) | 4.06 | 3.97 | (0.11 | ) | — | (0.11 | ) | $ | 21.19 | |||||||||||||||||||
9/30/2020 | $ | 13.61 | 0.16 | 3.58 | 3.74 | (0.02 | ) | — | (0.02 | ) | $ | 17.33 | ||||||||||||||||||||
9/30/2019 | $ | 23.47 | (0.03 | ) | (1.56 | ) | (1.59 | ) | — | (8.27 | ) | (8.27 | ) | $ | 13.61 | |||||||||||||||||
9/30/2018 | $ | 24.69 | (0.10 | ) | 2.05 | 1.95 | — | (3.17 | ) | (3.17 | ) | $ | 23.47 | |||||||||||||||||||
Advisor Shares | ||||||||||||||||||||||||||||||||
9/30/2022 | $ | 21.23 | (0.03 | ) | (6.68 | ) | (6.71 | ) | — | (0.58 | ) | (0.58 | ) | $ | 13.94 | |||||||||||||||||
9/30/2021 | $ | 17.35 | (0.05 | ) | 4.06 | 4.01 | (0.13 | ) | — | (0.13 | ) | $ | 21.23 | |||||||||||||||||||
9/30/2020 | $ | 13.62 | 0.20 | 3.57 | 3.77 | (0.04 | ) | — | (0.04 | ) | $ | 17.35 | ||||||||||||||||||||
9/30/2019(14) | $ | 11.91 | 0.01 | 1.70 | 1.71 | — | — | — | $ | 13.62 | ||||||||||||||||||||||
Institutional Shares | ||||||||||||||||||||||||||||||||
9/30/2022 | $ | 21.47 | (0.01 | ) | (6.76 | ) | (6.77 | ) | — | (0.58 | ) | (0.58 | ) | $ | 14.12 | |||||||||||||||||
9/30/2021 | $ | 17.54 | (0.04 | ) | 4.11 | 4.07 | (0.14 | ) | — | (0.14 | ) | $ | 21.47 | |||||||||||||||||||
9/30/2020 | $ | 13.76 | 0.23 | 3.59 | 3.82 | (0.04 | ) | — | (0.04 | ) | $ | 17.54 | ||||||||||||||||||||
9/30/2019 | $ | 23.59 | 0.03 | (1.59 | ) | (1.56 | ) | — | (8.27 | ) | (8.27 | ) | $ | 13.76 | ||||||||||||||||||
9/30/2018 | $ | 24.75 | (0.04 | ) | 2.05 | 2.01 | — | (3.17 | ) | (3.17 | ) | $ | 23.59 | |||||||||||||||||||
| 110 | Artisan Partners Funds |
ARTISAN PARTNERS FUNDS
Financial Highlights – continued
| Total Return(2)(18) | Net Assets, End of Period (000) | Ratio of Expenses to Average Net Assets(3)(4) | Ratio of Expenses to Average Net Assets Excluding Waivers(3) | Ratio of Net | Portfolio Turnover Rate(2) | |||||||||||||||||||
| INTERNATIONAL FUND | ||||||||||||||||||||||||
Investor Shares | ||||||||||||||||||||||||
9/30/2022 | (29.32 | )% | $ | 1,575,634 | 1.19 | % | n/a | 1.03 | % | 50.49 | % | |||||||||||||
9/30/2021 | 15.32 | % | $ | 3,019,360 | 1.18 | % | n/a | 0.69 | % | 67.41 | % | |||||||||||||
9/30/2020 | 6.52 | % | $ | 3,142,072 | 1.19 | % | n/a | 0.27 | % | 53.82 | % | |||||||||||||
9/30/2019 | 6.29 | % | $ | 3,903,758 | 1.19 | % | n/a | 0.95 | % | 41.01 | % | |||||||||||||
9/30/2018 | 4.45 | % | $ | 4,733,866 | 1.18 | % | n/a | 1.06 | % | 55.16 | % | |||||||||||||
Advisor Shares | ||||||||||||||||||||||||
9/30/2022 | (29.24 | )% | $ | 829,517 | 1.05 | % | n/a | 1.18 | % | 50.49 | % | |||||||||||||
9/30/2021 | 15.47 | % | $ | 1,718,258 | 1.04 | % | n/a | 0.84 | % | 67.41 | % | |||||||||||||
9/30/2020 | 6.71 | % | $ | 1,799,962 | 1.04 | % | n/a | 0.48 | % | 53.82 | % | |||||||||||||
9/30/2019 | 6.46 | % | $ | 2,141,985 | 1.04 | % | n/a | 1.11 | % | 41.01 | % | |||||||||||||
9/30/2018 | 4.58 | % | $ | 2,367,026 | 1.04 | % | n/a | 1.29 | % | 55.16 | % | |||||||||||||
Institutional Shares | ||||||||||||||||||||||||
9/30/2022 | (29.14 | )% | $ | 2,588,387 | 0.97 | % | n/a | 1.28 | % | 50.49 | % | |||||||||||||
9/30/2021 | 15.56 | % | $ | 4,920,404 | 0.95 | % | n/a | 0.93 | % | 67.41 | % | |||||||||||||
9/30/2020 | 6.80 | % | $ | 4,718,706 | 0.96 | % | n/a | 0.55 | % | 53.82 | % | |||||||||||||
9/30/2019 | 6.52 | % | $ | 4,513,365 | 0.96 | % | n/a | 1.15 | % | 41.01 | % | |||||||||||||
9/30/2018 | 4.67 | % | $ | 5,815,955 | 0.95 | % | n/a | 1.36 | % | 55.16 | % | |||||||||||||
| INTERNATIONAL EXPLORER FUND | ||||||||||||||||||||||||
Advisor Shares | ||||||||||||||||||||||||
9/30/2022(13) | (13.10 | )% | $ | 5,811 | 1.40 | % | 6.08 | % | 0.64 | % | 11.60 | % | ||||||||||||
Institutional Shares | ||||||||||||||||||||||||
9/30/2022(13) | (13.10 | )% | $ | 14,725 | 1.35 | % | 2.91 | % | 0.25 | % | 11.60 | % | ||||||||||||
| INTERNATIONAL SMALL-MID FUND | ||||||||||||||||||||||||
Investor Shares | ||||||||||||||||||||||||
9/30/2022 | (32.53 | )% | $ | 301,480 | 1.28 | % | n/a | (0.32 | )% | 22.12 | % | |||||||||||||
9/30/2021 | 22.99 | % | $ | 531,882 | 1.30 | % | n/a | (0.42 | )% | 28.29 | % | |||||||||||||
9/30/2020 | 27.52 | % | $ | 400,490 | 1.33 | % | n/a | 1.06 | % | 27.84 | % | |||||||||||||
9/30/2019 | (1.38 | )% | $ | 177,807 | 1.43 | % | n/a | (0.24 | )% | 55.98 | % | |||||||||||||
9/30/2018 | 8.70 | % | $ | 228,317 | 1.55 | % | n/a | (0.44 | )% | 59.53 | % | |||||||||||||
Advisor Shares | ||||||||||||||||||||||||
9/30/2022 | (32.47 | )% | $ | 1,161,239 | 1.14 | % | n/a | (0.16 | )% | 22.12 | % | |||||||||||||
9/30/2021 | 23.20 | % | $ | 1,856,538 | 1.14 | % | n/a | (0.26 | )% | 28.29 | % | |||||||||||||
9/30/2020 | 27.70 | % | $ | 1,223,773 | 1.18 | % | n/a | 1.32 | % | 27.84 | % | |||||||||||||
9/30/2019(14) | 14.36 | % | $ | 434,784 | 1.25 | % | n/a | 0.13 | % | 55.98 | % | |||||||||||||
Institutional Shares | ||||||||||||||||||||||||
9/30/2022 | (32.38 | )% | $ | 2,505,844 | 1.06 | % | n/a | (0.08 | )% | 22.12 | % | |||||||||||||
9/30/2021 | 23.30 | % | $ | 3,897,436 | 1.06 | % | n/a | (0.17 | )% | 28.29 | % | |||||||||||||
9/30/2020 | 27.85 | % | $ | 1,836,163 | 1.09 | % | n/a | 1.49 | % | 27.84 | % | |||||||||||||
9/30/2019 | (1.18 | )% | $ | 608,417 | 1.16 | % | n/a | 0.20 | % | 55.98 | % | |||||||||||||
9/30/2018 | 8.94 | % | $ | 175,808 | 1.35 | % | n/a | (0.17 | )% | 59.53 | % | |||||||||||||
| Artisan Partners Funds | 111 |
ARTISAN PARTNERS FUNDS
Financial Highlights – For a share outstanding throughout each period
| Less Distributions From | ||||||||||||||||||||||||||||||||
Net Asset | Net Investment | Net Realized and Unrealized Gain (Loss) on Investments | Total from | Net Investment Income | Net Realized Gains | Total Distributions | Net Asset Value, End of Period | |||||||||||||||||||||||||
| INTERNATIONAL VALUE FUND | ||||||||||||||||||||||||||||||||
Investor Shares | ||||||||||||||||||||||||||||||||
9/30/2022 | $ | 44.49 | 0.45 | (7.77 | ) | (7.32 | ) | (1.17 | ) | (3.04 | ) | (4.21 | ) | $ | 32.96 | |||||||||||||||||
9/30/2021 | $ | 32.94 | 1.01 | 10.88 | 11.89 | (0.09 | ) | (0.25 | ) | (0.34 | ) | $ | 44.49 | |||||||||||||||||||
9/30/2020 | $ | 34.87 | 0.19 | (1.06 | ) | (0.87 | ) | (0.23 | ) | (0.83 | ) | (1.06 | ) | $ | 32.94 | |||||||||||||||||
9/30/2019 | $ | 36.85 | 0.61 | (0.64 | ) | (0.03 | ) | (0.65 | ) | (1.30 | ) | (1.95 | ) | $ | 34.87 | |||||||||||||||||
9/30/2018 | $ | 39.08 | 0.42 | (1.14 | ) | (0.72 | ) | (0.41 | ) | (1.10 | ) | (1.51 | ) | $ | 36.85 | |||||||||||||||||
Advisor Shares | ||||||||||||||||||||||||||||||||
9/30/2022 | $ | 44.46 | 0.52 | (7.76 | ) | (7.24 | ) | (1.29 | ) | (3.04 | ) | (4.33 | ) | $ | 32.89 | |||||||||||||||||
9/30/2021 | $ | 32.90 | 1.14 | 10.78 | 11.92 | (0.11 | ) | (0.25 | ) | (0.36 | ) | $ | 44.46 | |||||||||||||||||||
9/30/2020 | $ | 34.81 | 0.27 | (1.09 | ) | (0.82 | ) | (0.26 | ) | (0.83 | ) | (1.09 | ) | $ | 32.90 | |||||||||||||||||
9/30/2019 | $ | 36.85 | 0.65 | (0.63 | ) | 0.02 | (0.76 | ) | (1.30 | ) | (2.06 | ) | $ | 34.81 | ||||||||||||||||||
9/30/2018 | $ | 39.11 | 0.48 | (1.16 | ) | (0.68 | ) | (0.48 | ) | (1.10 | ) | (1.58 | ) | $ | 36.85 | |||||||||||||||||
Institutional Shares | ||||||||||||||||||||||||||||||||
9/30/2022 | $ | 44.69 | 0.55 | (7.80 | ) | (7.25 | ) | (1.36 | ) | (3.04 | ) | (4.40 | ) | $ | 33.04 | |||||||||||||||||
9/30/2021 | $ | 33.06 | 1.16 | 10.86 | 12.02 | (0.14 | ) | (0.25 | ) | (0.39 | ) | $ | 44.69 | |||||||||||||||||||
9/30/2020 | $ | 34.96 | 0.28 | (1.08 | ) | (0.80 | ) | (0.27 | ) | (0.83 | ) | (1.10 | ) | $ | 33.06 | |||||||||||||||||
9/30/2019 | $ | 37.02 | 0.69 | (0.64 | ) | 0.05 | (0.81 | ) | (1.30 | ) | (2.11 | ) | $ | 34.96 | ||||||||||||||||||
9/30/2018 | $ | 39.28 | 0.53 | (1.18 | ) | (0.65 | ) | (0.51 | ) | (1.10 | ) | (1.61 | ) | $ | 37.02 | |||||||||||||||||
| MID CAP FUND | ||||||||||||||||||||||||||||||||
Investor Shares | ||||||||||||||||||||||||||||||||
9/30/2022 | $ | 53.28 | (0.37 | ) | (15.87 | ) | (16.24 | ) | — | (8.59 | ) | (8.59 | ) | $ | 28.45 | |||||||||||||||||
9/30/2021 | $ | 47.75 | (0.49 | ) | 13.20 | 12.71 | — | (7.18 | ) | (7.18 | ) | $ | 53.28 | |||||||||||||||||||
9/30/2020 | $ | 37.16 | (0.31 | ) | 15.43 | 15.12 | — | (4.53 | ) | (4.53 | ) | $ | 47.75 | |||||||||||||||||||
9/30/2019 | $ | 44.83 | (0.23 | ) | 0.53 | 0.30 | — | (7.97 | ) | (7.97 | ) | $ | 37.16 | |||||||||||||||||||
9/30/2018 | $ | 42.58 | (0.26 | ) | 8.21 | 7.95 | — | (5.70 | ) | (5.70 | ) | $ | 44.83 | |||||||||||||||||||
Advisor Shares | ||||||||||||||||||||||||||||||||
9/30/2022 | $ | 54.11 | (0.32 | ) | (16.18 | ) | (16.50 | ) | — | (8.59 | ) | (8.59 | ) | $ | 29.02 | |||||||||||||||||
9/30/2021 | $ | 48.33 | (0.43 | ) | 13.39 | 12.96 | — | (7.18 | ) | (7.18 | ) | $ | 54.11 | |||||||||||||||||||
9/30/2020 | $ | 37.52 | (0.27 | ) | 15.61 | 15.34 | — | (4.53 | ) | (4.53 | ) | $ | 48.33 | |||||||||||||||||||
9/30/2019 | $ | 45.10 | (0.17 | ) | 0.56 | 0.39 | — | (7.97 | ) | (7.97 | ) | $ | 37.52 | |||||||||||||||||||
9/30/2018 | $ | 42.75 | (0.20 | ) | 8.25 | 8.05 | — | (5.70 | ) | (5.70 | ) | $ | 45.10 | |||||||||||||||||||
Institutional Shares | ||||||||||||||||||||||||||||||||
9/30/2022 | $ | 61.87 | (0.33 | ) | (18.97 | ) | (19.30 | ) | — | (8.59 | ) | (8.59 | ) | $ | 33.98 | |||||||||||||||||
9/30/2021 | $ | 54.25 | (0.43 | ) | 15.23 | 14.80 | — | (7.18 | ) | (7.18 | ) | $ | 61.87 | |||||||||||||||||||
9/30/2020 | $ | 41.54 | (0.26 | ) | 17.50 | 17.24 | — | (4.53 | ) | (4.53 | ) | $ | 54.25 | |||||||||||||||||||
9/30/2019 | $ | 48.89 | (0.16 | ) | 0.78 | 0.62 | — | (7.97 | ) | (7.97 | ) | $ | 41.54 | |||||||||||||||||||
9/30/2018 | $ | 45.84 | (0.18 | ) | 8.93 | 8.75 | — | (5.70 | ) | (5.70 | ) | $ | 48.89 | |||||||||||||||||||
| 112 | Artisan Partners Funds |
ARTISAN PARTNERS FUNDS
Financial Highlights – continued
| Total Return(2)(18) | Net Assets, End of Period (000) | Ratio of Expenses to Average Net Assets(3)(4) | Ratio of Expenses to Average Net Assets Excluding Waivers(3) | Ratio of Net | Portfolio Turnover Rate(2) | |||||||||||||||||||
| INTERNATIONAL VALUE FUND | ||||||||||||||||||||||||
Investor Shares | ||||||||||||||||||||||||
9/30/2022 | (18.40 | )% | $ | 2,059,112 | 1.19 | % | n/a | 1.13 | % | 22.69 | % | |||||||||||||
9/30/2021 | 36.13 | % | $ | 2,728,996 | 1.18 | % | n/a | 2.39 | % | 32.90 | % | |||||||||||||
9/30/2020 | (2.71 | )% | $ | 1,983,618 | 1.19 | % | n/a | 0.57 | % | 28.06 | % | |||||||||||||
9/30/2019 | 0.38 | % | $ | 2,761,826 | 1.19 | % | n/a | 1.80 | % | 23.69 | % | |||||||||||||
9/30/2018 | (1.99 | )% | $ | 3,371,735 | 1.18 | % | n/a | 1.11 | % | 21.55 | % | |||||||||||||
Advisor Shares | ||||||||||||||||||||||||
9/30/2022 | (18.27 | )% | $ | 4,705,187 | 1.05 | % | n/a | 1.29 | % | 22.69 | % | |||||||||||||
9/30/2021 | 36.31 | % | $ | 6,072,617 | 1.04 | % | n/a | 2.70 | % | 32.90 | % | |||||||||||||
9/30/2020 | (2.56 | )% | $ | 3,645,568 | 1.05 | % | n/a | 0.81 | % | 28.06 | % | |||||||||||||
9/30/2019 | 0.52 | % | $ | 4,336,510 | 1.05 | % | n/a | 1.93 | % | 23.69 | % | |||||||||||||
9/30/2018 | (1.87 | )% | $ | 4,683,702 | 1.04 | % | n/a | 1.27 | % | 21.55 | % | |||||||||||||
Institutional Shares | ||||||||||||||||||||||||
9/30/2022 | (18.20 | )% | $ | 13,366,731 | 0.95 | % | n/a | 1.36 | % | 22.69 | % | |||||||||||||
9/30/2021 | 36.45 | % | $ | 13,304,215 | 0.95 | % | n/a | 2.72 | % | 32.90 | % | |||||||||||||
9/30/2020 | (2.48 | )% | $ | 7,944,724 | 0.96 | % | n/a | 0.85 | % | 28.06 | % | |||||||||||||
9/30/2019 | 0.63 | % | $ | 7,169,774 | 0.95 | % | n/a | 2.03 | % | 23.69 | % | |||||||||||||
9/30/2018 | (1.79 | )% | $ | 7,295,259 | 0.95 | % | n/a | 1.41 | % | 21.55 | % | |||||||||||||
| MID CAP FUND | ||||||||||||||||||||||||
Investor Shares | ||||||||||||||||||||||||
9/30/2022 | (36.55 | )% | $ | 1,387,480 | 1.18 | % | n/a | (0.97 | )% | 34.12 | % | |||||||||||||
9/30/2021 | 29.84 | % | $ | 2,495,355 | 1.18 | % | n/a | (0.98 | )% | 40.72 | % | |||||||||||||
9/30/2020 | 45.66 | % | $ | 2,106,948 | 1.18 | % | n/a | (0.81 | )% | 44.52 | % | |||||||||||||
9/30/2019 | 5.11 | % | $ | 1,599,647 | 1.19 | % | n/a | (0.63 | )% | 47.96 | % | |||||||||||||
9/30/2018 | 21.12 | % | $ | 2,003,621 | 1.18 | % | n/a | (0.62 | )% | 49.83 | % | |||||||||||||
Advisor Shares | ||||||||||||||||||||||||
9/30/2022 | (36.46 | )% | $ | 572,155 | 1.05 | % | n/a | (0.83 | )% | 34.12 | % | |||||||||||||
9/30/2021 | 30.02 | % | $ | 923,543 | 1.04 | % | n/a | (0.85 | )% | 40.72 | % | |||||||||||||
9/30/2020 | 45.83 | % | $ | 667,057 | 1.05 | % | n/a | (0.68 | )% | 44.52 | % | |||||||||||||
9/30/2019 | 5.36 | % | $ | 429,052 | 1.04 | % | n/a | (0.48 | )% | 47.96 | % | |||||||||||||
9/30/2018 | 21.26 | % | $ | 644,777 | 1.04 | % | n/a | (0.48 | )% | 49.83 | % | |||||||||||||
Institutional Shares | ||||||||||||||||||||||||
9/30/2022 | (36.41 | )% | $ | 2,285,588 | 0.95 | % | n/a | (0.74 | )% | 34.12 | % | |||||||||||||
9/30/2021 | 30.15 | % | $ | 4,000,122 | 0.95 | % | n/a | (0.75 | )% | 40.72 | % | |||||||||||||
9/30/2020 | 45.98 | % | $ | 4,015,667 | 0.95 | % | n/a | (0.59 | )% | 44.52 | % | |||||||||||||
9/30/2019 | 5.41 | % | $ | 3,029,773 | 0.96 | % | n/a | (0.41 | )% | 47.96 | % | |||||||||||||
9/30/2018 | 21.37 | % | $ | 3,516,293 | 0.95 | % | n/a | (0.39 | )% | 49.83 | % | |||||||||||||
| Artisan Partners Funds | 113 |
ARTISAN PARTNERS FUNDS
Financial Highlights – For a share outstanding throughout each period
| Less Distributions From | ||||||||||||||||||||||||||||||||
Net Asset | Net Investment | Net Realized and Unrealized Gain (Loss) on Investments | Total from | Net Investment Income | Net Realized Gains | Total Distributions | Net Asset Value, End of Period | |||||||||||||||||||||||||
| MID CAP VALUE FUND | ||||||||||||||||||||||||||||||||
Investor Shares | ||||||||||||||||||||||||||||||||
9/30/2022 | $ | 23.12 | 0.12 | (3.07 | ) | (2.95 | ) | (0.04 | ) | (3.02 | ) | (3.06 | ) | $ | 17.11 | |||||||||||||||||
9/30/2021 | $ | 16.26 | 0.12 | 7.10 | 7.22 | (0.09 | ) | (0.27 | ) | (0.36 | ) | $ | 23.12 | |||||||||||||||||||
9/30/2020 | $ | 19.81 | 0.15 | (1.71 | ) | (1.56 | ) | (0.12 | ) | (1.87 | ) | (1.99 | ) | $ | 16.26 | |||||||||||||||||
9/30/2019 | $ | 23.56 | 0.10 | (0.90 | ) | (0.80 | ) | (0.05 | ) | (2.90 | ) | (2.95 | ) | $ | 19.81 | |||||||||||||||||
9/30/2018 | $ | 23.98 | 0.02 | 1.86 | 1.88 | (0.02 | ) | (2.28 | ) | (2.30 | ) | $ | 23.56 | |||||||||||||||||||
Advisor Shares | ||||||||||||||||||||||||||||||||
9/30/2022 | $ | 23.07 | 0.15 | (3.07 | ) | (2.92 | ) | (0.07 | ) | (3.02 | ) | (3.09 | ) | $ | 17.06 | |||||||||||||||||
9/30/2021 | $ | 16.23 | 0.16 | 7.07 | 7.23 | (0.12 | ) | (0.27 | ) | (0.39 | ) | $ | 23.07 | |||||||||||||||||||
9/30/2020 | $ | 19.77 | 0.17 | (1.70 | ) | (1.53 | ) | (0.14 | ) | (1.87 | ) | (2.01 | ) | $ | 16.23 | |||||||||||||||||
9/30/2019 | $ | 23.53 | 0.13 | (0.90 | ) | (0.77 | ) | (0.09 | ) | (2.90 | ) | (2.99 | ) | $ | 19.77 | |||||||||||||||||
9/30/2018 | $ | 23.94 | 0.05 | 1.85 | 1.90 | (0.03 | ) | (2.28 | ) | (2.31 | ) | $ | 23.53 | |||||||||||||||||||
Institutional Shares | ||||||||||||||||||||||||||||||||
9/30/2022 | $ | 23.09 | 0.16 | (3.06 | ) | (2.90 | ) | (0.09 | ) | (3.02 | ) | (3.11 | ) | $ | 17.08 | |||||||||||||||||
9/30/2021 | $ | 16.24 | 0.17 | 7.08 | 7.25 | (0.13 | ) | (0.27 | ) | (0.40 | ) | $ | 23.09 | |||||||||||||||||||
9/30/2020 | $ | 19.80 | 0.18 | (1.71 | ) | (1.53 | ) | (0.16 | ) | (1.87 | ) | (2.03 | ) | $ | 16.24 | |||||||||||||||||
9/30/2019 | $ | 23.56 | 0.14 | (0.89 | ) | (0.75 | ) | (0.11 | ) | (2.90 | ) | (3.01 | ) | $ | 19.80 | |||||||||||||||||
9/30/2018 | $ | 23.98 | 0.07 | 1.85 | 1.92 | (0.06 | ) | (2.28 | ) | (2.34 | ) | $ | 23.56 | |||||||||||||||||||
| SELECT EQUITY FUND | ||||||||||||||||||||||||||||||||
Investor Shares | ||||||||||||||||||||||||||||||||
9/30/2022 | $ | 13.48 | 0.01 | (3.00 | ) | (2.99 | ) | — | (0.65 | ) | (0.65 | ) | $ | 9.84 | ||||||||||||||||||
9/30/2021 | $ | 10.17 | (0.01 | ) | 3.32 | 3.31 | — | — | — | $ | 13.48 | |||||||||||||||||||||
9/30/2020(15) | $ | 10.00 | — | (5) | 0.17 | 0.17 | — | — | — | $ | 10.17 | |||||||||||||||||||||
Advisor Shares | ||||||||||||||||||||||||||||||||
9/30/2022 | $ | 13.49 | 0.02 | (2.99 | ) | (2.97 | ) | — | (0.65 | ) | (0.65 | ) | $ | 9.87 | ||||||||||||||||||
9/30/2021 | $ | 10.18 | 0.01 | 3.30 | 3.31 | — | — | — | $ | 13.49 | ||||||||||||||||||||||
9/30/2020(15) | $ | 10.00 | 0.01 | 0.17 | 0.18 | — | — | — | $ | 10.18 | ||||||||||||||||||||||
Institutional Shares | ||||||||||||||||||||||||||||||||
9/30/2022 | $ | 13.44 | 0.03 | (2.99 | ) | (2.96 | ) | (0.02 | ) | (0.65 | ) | (0.67 | ) | $ | 9.81 | |||||||||||||||||
9/30/2021 | $ | 10.18 | 0.02 | 3.30 | 3.32 | (0.06 | ) | — | (0.06 | ) | $ | 13.44 | ||||||||||||||||||||
9/30/2020(15) | $ | 10.00 | 0.01 | 0.17 | 0.18 | — | — | — | $ | 10.18 | ||||||||||||||||||||||
| SMALL CAP FUND | ||||||||||||||||||||||||||||||||
Investor Shares | ||||||||||||||||||||||||||||||||
9/30/2022 | $ | 50.34 | (0.36 | ) | (17.09 | ) | (17.45 | ) | — | (5.07 | ) | (5.07 | ) | $ | 27.82 | |||||||||||||||||
9/30/2021 | $ | 42.80 | (0.53 | ) | 10.77 | 10.24 | — | (2.70 | ) | (2.70 | ) | $ | 50.34 | |||||||||||||||||||
9/30/2020 | $ | 33.17 | (0.38 | ) | 12.66 | 12.28 | — | (2.65 | ) | (2.65 | ) | $ | 42.80 | |||||||||||||||||||
9/30/2019 | $ | 38.97 | (0.29 | ) | (0.08 | ) | (0.37 | ) | — | (5.43 | ) | (5.43 | ) | $ | 33.17 | |||||||||||||||||
9/30/2018 | $ | 33.61 | (0.31 | ) | 10.64 | 10.33 | — | (4.97 | ) | (4.97 | ) | $ | 38.97 | |||||||||||||||||||
Advisor Shares | ||||||||||||||||||||||||||||||||
9/30/2022 | $ | 50.70 | (0.32 | ) | (17.23 | ) | (17.55 | ) | — | (5.07 | ) | (5.07 | ) | $ | 28.08 | |||||||||||||||||
9/30/2021 | $ | 43.03 | (0.47 | ) | 10.84 | 10.37 | — | (2.70 | ) | (2.70 | ) | $ | 50.70 | |||||||||||||||||||
9/30/2020 | $ | 33.30 | (0.34 | ) | 12.72 | 12.38 | — | (2.65 | ) | (2.65 | ) | $ | 43.03 | |||||||||||||||||||
9/30/2019 | $ | 39.05 | (0.25 | ) | (0.07 | ) | (0.32 | ) | — | (5.43 | ) | (5.43 | ) | $ | 33.30 | |||||||||||||||||
9/30/2018 | $ | 33.63 | (0.26 | ) | 10.65 | 10.39 | — | (4.97 | ) | (4.97 | ) | $ | 39.05 | |||||||||||||||||||
Institutional Shares | ||||||||||||||||||||||||||||||||
9/30/2022 | $ | 51.74 | (0.28 | ) | (17.65 | ) | (17.93 | ) | — | (5.07 | ) | (5.07 | ) | $ | 28.74 | |||||||||||||||||
9/30/2021 | $ | 43.82 | (0.43 | ) | 11.05 | 10.62 | — | (2.70 | ) | (2.70 | ) | $ | 51.74 | |||||||||||||||||||
9/30/2020 | $ | 33.83 | (0.31 | ) | 12.95 | 12.64 | — | (2.65 | ) | (2.65 | ) | $ | 43.82 | |||||||||||||||||||
9/30/2019 | $ | 39.54 | (0.23 | ) | (0.05 | ) | (0.28 | ) | — | (5.43 | ) | (5.43 | ) | $ | 33.83 | |||||||||||||||||
9/30/2018 | $ | 33.98 | (0.24 | ) | 10.77 | 10.53 | — | (4.97 | ) | (4.97 | ) | $ | 39.54 | |||||||||||||||||||
| 114 | Artisan Partners Funds |
ARTISAN PARTNERS FUNDS
Financial Highlights – continued
| Total Return(2)(18) | Net Assets, End of Period (000) | Ratio of Expenses to Average Net Assets(3)(4) | Ratio of Expenses to Average Net Assets Excluding Waivers(3) | Ratio of Net | Portfolio Turnover Rate(2) | |||||||||||||||||||
| MID CAP VALUE FUND | ||||||||||||||||||||||||
Investor Shares | ||||||||||||||||||||||||
9/30/2022 | (15.39 | )% | $ | 391,804 | 1.20 | % | n/a | 0.57 | % | 15.17 | % | |||||||||||||
9/30/2021 | 44.94 | % | $ | 693,149 | 1.20 | % | n/a | 0.56 | % | 16.04 | % | |||||||||||||
9/30/2020 | (8.93 | )% | $ | 541,320 | 1.21 | % | n/a | 0.90 | % | 43.12 | % | |||||||||||||
9/30/2019 | (2.49 | )% | $ | 842,896 | 1.20 | % | n/a | 0.52 | % | 19.18 | % | |||||||||||||
9/30/2018 | 8.55 | % | $ | 1,294,179 | 1.19 | % | n/a | 0.07 | % | 19.15 | % | |||||||||||||
Advisor Shares | ||||||||||||||||||||||||
9/30/2022 | (15.29 | )% | $ | 397,898 | 1.04 | % | n/a | 0.72 | % | 15.17 | % | |||||||||||||
9/30/2021 | 45.12 | % | $ | 551,822 | 1.05 | % | n/a | 0.73 | % | 16.04 | % | |||||||||||||
9/30/2020 | (8.76 | )% | $ | 518,198 | 1.06 | % | n/a | 1.02 | % | 43.12 | % | |||||||||||||
9/30/2019 | (2.32 | )% | $ | 630,296 | 1.06 | % | n/a | 0.66 | % | 19.18 | % | |||||||||||||
9/30/2018 | 8.68 | % | $ | 951,667 | 1.05 | % | n/a | 0.24 | % | 19.15 | % | |||||||||||||
Institutional Shares | ||||||||||||||||||||||||
9/30/2022 | (15.21 | )% | $ | 518,265 | 0.98 | % | n/a | 0.78 | % | 15.17 | % | |||||||||||||
9/30/2021 | 45.22 | % | $ | 783,375 | 0.98 | % | n/a | 0.79 | % | 16.04 | % | |||||||||||||
9/30/2020 | (8.76 | )% | $ | 619,243 | 1.00 | % | n/a | 1.08 | % | 43.12 | % | |||||||||||||
9/30/2019 | (2.22 | )% | $ | 796,385 | 0.98 | % | n/a | 0.72 | % | 19.18 | % | |||||||||||||
9/30/2018 | 8.75 | % | $ | 1,058,092 | 0.98 | % | n/a | 0.30 | % | 19.15 | % | |||||||||||||
| SELECT EQUITY FUND | ||||||||||||||||||||||||
Investor Shares | ||||||||||||||||||||||||
9/30/2022 | (23.43 | )% | $ | 2,345 | 1.25 | % | 3.16 | % | 0.05 | % | 20.96 | % | ||||||||||||
9/30/2021 | 32.55 | % | $ | 2,919 | 1.25 | % | 4.35 | % | (0.05 | )% | 34.69 | % | ||||||||||||
9/30/2020(15) | 1.70 | % | $ | 983 | 1.25 | % | 17.96 | % | 0.03 | % | 26.96 | % | ||||||||||||
Advisor Shares | ||||||||||||||||||||||||
9/30/2022 | (23.26 | )% | $ | 1,561 | 1.15 | % | 3.68 | % | 0.14 | % | 20.96 | % | ||||||||||||
9/30/2021 | 32.51 | % | $ | 1,784 | 1.15 | % | 4.83 | % | 0.05 | % | 34.69 | % | ||||||||||||
9/30/2020(15) | 1.80 | % | $ | 778 | 1.15 | % | 9.66 | % | 0.15 | % | 26.96 | % | ||||||||||||
Institutional Shares | ||||||||||||||||||||||||
9/30/2022 | (23.33 | )% | $ | 25,650 | 1.10 | % | 1.39 | % | 0.22 | % | 20.96 | % | ||||||||||||
9/30/2021 | 32.71 | % | $ | 19,903 | 1.10 | % | 1.56 | % | 0.16 | % | 34.69 | % | ||||||||||||
9/30/2020(15) | 1.80 | % | $ | 11,266 | 1.10 | % | 2.36 | % | 0.20 | % | 26.96 | % | ||||||||||||
| SMALL CAP FUND | ||||||||||||||||||||||||
Investor Shares | ||||||||||||||||||||||||
9/30/2022 | (38.24 | )% | $ | 571,380 | 1.20 | % | n/a | (1.00 | )% | 33.64 | % | |||||||||||||
9/30/2021 | 24.45 | % | $ | 1,089,099 | 1.19 | % | n/a | (1.06 | )% | 39.79 | % | |||||||||||||
9/30/2020 | 39.51 | % | $ | 896,297 | 1.20 | % | n/a | (1.05 | )% | 40.59 | % | |||||||||||||
9/30/2019 | 2.02 | % | $ | 611,745 | 1.20 | % | n/a | (0.88 | )% | 47.32 | % | |||||||||||||
9/30/2018 | 34.71 | % | $ | 495,803 | 1.20 | % | n/a | (0.90 | )% | 43.85 | % | |||||||||||||
Advisor Shares | ||||||||||||||||||||||||
9/30/2022 | (38.16 | )% | $ | 361,941 | 1.06 | % | n/a | (0.87 | )% | 33.64 | % | |||||||||||||
9/30/2021 | 24.63 | % | $ | 1,325,015 | 1.06 | % | n/a | (0.93 | )% | 39.79 | % | |||||||||||||
9/30/2020 | 39.66 | % | $ | 999,213 | 1.08 | % | n/a | (0.94 | )% | 40.59 | % | |||||||||||||
9/30/2019 | 2.16 | % | $ | 589,147 | 1.08 | % | n/a | (0.77 | )% | 47.32 | % | |||||||||||||
9/30/2018 | 34.89 | % | $ | 495,650 | 1.06 | % | n/a | (0.75 | )% | 43.85 | % | |||||||||||||
Institutional Shares | ||||||||||||||||||||||||
9/30/2022 | (38.12 | )% | $ | 882,206 | 0.98 | % | n/a | (0.78 | )% | 33.64 | % | |||||||||||||
9/30/2021 | 24.76 | % | $ | 1,633,941 | 0.96 | % | n/a | (0.83 | )% | 39.79 | % | |||||||||||||
9/30/2020 | 39.82 | % | $ | 1,106,482 | 0.99 | % | n/a | (0.84 | )% | 40.59 | % | |||||||||||||
9/30/2019 | 2.25 | % | $ | 636,076 | 0.99 | % | n/a | (0.69 | )% | 47.32 | % | |||||||||||||
9/30/2018 | 34.94 | % | $ | 814,426 | 1.01 | % | n/a | (0.70 | )% | 43.85 | % | |||||||||||||
| Artisan Partners Funds | 115 |
ARTISAN PARTNERS FUNDS
Financial Highlights – For a share outstanding throughout each period
| Less Distributions From | ||||||||||||||||||||||||||||||||
Net Asset | Net Investment | Net Realized and Unrealized Gain (Loss) on Investments | Total from | Net Investment Income | Net Realized Gains | Total Distributions | Net Asset Value, End of Period | |||||||||||||||||||||||||
| SUSTAINABLE EMERGING MARKETS FUND | ||||||||||||||||||||||||||||||||
Investor Shares | ||||||||||||||||||||||||||||||||
9/30/2022 | $ | 19.25 | 0.18 | (6.75 | ) | (6.57 | ) | (0.20 | ) | — | (0.20 | ) | $ | 12.48 | ||||||||||||||||||
9/30/2021 | $ | 16.39 | 0.07 | 3.11 | 3.18 | (0.32 | ) | — | (0.32 | ) | $ | 19.25 | ||||||||||||||||||||
9/30/2020 | $ | 15.22 | 0.24 | 1.20 | 1.44 | (0.27 | ) | — | (0.27 | ) | $ | 16.39 | ||||||||||||||||||||
9/30/2019 | $ | 15.08 | 0.18 | 0.10 | 0.28 | (0.14 | ) | — | (0.14 | ) | $ | 15.22 | ||||||||||||||||||||
9/30/2018 | $ | 15.58 | 0.15 | (0.56 | ) | (0.41 | ) | (0.09 | ) | — | (0.09 | ) | $ | 15.08 | ||||||||||||||||||
Advisor Shares | ||||||||||||||||||||||||||||||||
9/30/2022(16) | $ | 14.61 | 0.06 | (2.20 | ) | (2.14 | ) | — | — | — | $ | 12.47 | ||||||||||||||||||||
Institutional Shares | ||||||||||||||||||||||||||||||||
9/30/2022 | $ | 19.55 | 0.18 | (6.85 | ) | (6.67 | ) | (0.17 | ) | — | (0.17 | ) | $ | 12.71 | ||||||||||||||||||
9/30/2021 | $ | 16.56 | 0.10 | 3.14 | 3.24 | (0.25 | ) | — | (0.25 | ) | $ | 19.55 | ||||||||||||||||||||
9/30/2020 | $ | 15.25 | 0.27 | 1.21 | 1.48 | (0.17 | ) | — | (0.17 | ) | $ | 16.56 | ||||||||||||||||||||
9/30/2019 | $ | 15.03 | 0.20 | 0.10 | 0.30 | (0.08 | ) | — | (0.08 | ) | $ | 15.25 | ||||||||||||||||||||
9/30/2018 | $ | 15.50 | 0.14 | (0.53 | ) | (0.39 | ) | (0.08 | ) | — | (0.08 | ) | $ | 15.03 | ||||||||||||||||||
| VALUE FUND | ||||||||||||||||||||||||||||||||
Investor Shares | ||||||||||||||||||||||||||||||||
9/30/2022 | $ | 16.28 | 0.13 | (2.44 | ) | (2.31 | ) | (0.16 | ) | (1.79 | ) | (1.95 | ) | $ | 12.02 | |||||||||||||||||
9/30/2021 | $ | 12.41 | 0.10 | 4.82 | 4.92 | (0.06 | ) | (0.99 | ) | (1.05 | ) | $ | 16.28 | |||||||||||||||||||
9/30/2020 | $ | 12.88 | 0.09 | (0.02 | ) | 0.07 | (0.11 | ) | (0.43 | ) | (0.54 | ) | $ | 12.41 | ||||||||||||||||||
9/30/2019 | $ | 15.10 | 0.11 | (0.56 | ) | (0.45 | ) | (0.10 | ) | (1.67 | ) | (1.77 | ) | $ | 12.88 | |||||||||||||||||
9/30/2018 | $ | 15.25 | 0.11 | 1.19 | 1.30 | (0.05 | ) | (1.40 | ) | (1.45 | ) | $ | 15.10 | |||||||||||||||||||
Advisor Shares | ||||||||||||||||||||||||||||||||
9/30/2022 | $ | 16.21 | 0.15 | (2.42 | ) | (2.27 | ) | (0.18 | ) | (1.79 | ) | (1.97 | ) | $ | 11.97 | |||||||||||||||||
9/30/2021 | $ | 12.37 | 0.13 | 4.79 | 4.92 | (0.09 | ) | (0.99 | ) | (1.08 | ) | $ | 16.21 | |||||||||||||||||||
9/30/2020 | $ | 12.83 | 0.11 | (0.02 | ) | 0.09 | (0.12 | ) | (0.43 | ) | (0.55 | ) | $ | 12.37 | ||||||||||||||||||
9/30/2019 | $ | 15.04 | 0.13 | (0.55 | ) | (0.42 | ) | (0.12 | ) | (1.67 | ) | (1.79 | ) | $ | 12.83 | |||||||||||||||||
9/30/2018 | $ | 15.22 | 0.12 | 1.19 | 1.31 | (0.09 | ) | (1.40 | ) | (1.49 | ) | $ | 15.04 | |||||||||||||||||||
Institutional Shares | ||||||||||||||||||||||||||||||||
9/30/2022 | $ | 16.24 | 0.15 | (2.43 | ) | (2.28 | ) | (0.19 | ) | (1.79 | ) | (1.98 | ) | $ | 11.98 | |||||||||||||||||
9/30/2021 | $ | 12.40 | 0.13 | 4.80 | 4.93 | (0.10 | ) | (0.99 | ) | (1.09 | ) | $ | 16.24 | |||||||||||||||||||
9/30/2020 | $ | 12.86 | 0.12 | (0.02 | ) | 0.10 | (0.13 | ) | (0.43 | ) | (0.56 | ) | $ | 12.40 | ||||||||||||||||||
9/30/2019 | $ | 15.08 | 0.14 | (0.56 | ) | (0.42 | ) | (0.13 | ) | (1.67 | ) | (1.80 | ) | $ | 12.86 | |||||||||||||||||
9/30/2018 | $ | 15.26 | 0.14 | 1.19 | 1.33 | (0.11 | ) | (1.40 | ) | (1.51 | ) | $ | 15.08 | |||||||||||||||||||
| VALUE INCOME FUND | ||||||||||||||||||||||||||||||||
Investor Shares | ||||||||||||||||||||||||||||||||
9/30/2022(17) | $ | 10.00 | 0.15 | (1.86 | ) | (1.71 | ) | (0.14 | ) | — | (0.14 | ) | $ | 8.15 | ||||||||||||||||||
Advisor Shares | ||||||||||||||||||||||||||||||||
9/30/2022(17) | $ | 10.00 | 0.16 | (1.86 | ) | (1.70 | ) | (0.15 | ) | — | (0.15 | ) | $ | 8.15 | ||||||||||||||||||
Institutional Shares | ||||||||||||||||||||||||||||||||
9/30/2022(17) | $ | 10.00 | 0.16 | (1.86 | ) | (1.70 | ) | (0.15 | ) | — | (0.15 | ) | $ | 8.15 | ||||||||||||||||||
| 116 | Artisan Partners Funds |
ARTISAN PARTNERS FUNDS
Financial Highlights – continued
| Total Return(2)(18) | Net Assets, End of Period (000) | Ratio of Expenses to Average Net Assets(3)(4) | Ratio of Expenses to Average Net Assets Excluding Waivers(3) | Ratio of Net | Portfolio Turnover Rate(2) | |||||||||||||||||||
| SUSTAINABLE EMERGING MARKETS FUND | ||||||||||||||||||||||||
Investor Shares | ||||||||||||||||||||||||
9/30/2022 | (34.51 | )% | $ | 12,297 | 1.26 | %** | 1.58 | % | 1.06 | % | 21.48 | % | ||||||||||||
9/30/2021 | 19.50 | % | $ | 61,975 | 1.35 | % | 1.75 | % | 0.36 | % | 23.22 | % | ||||||||||||
9/30/2020 | 9.58 | % | $ | 46,541 | 1.35 | % | 1.73 | % | 1.59 | % | 21.57 | % | ||||||||||||
9/30/2019 | 1.91 | % | $ | 45,717 | 1.35 | % | 1.93 | % | 1.19 | % | 30.58 | % | ||||||||||||
9/30/2018 | (2.70 | )% | $ | 49,562 | 1.41 | %* | 1.78 | % | 0.89 | % | 35.24 | % | ||||||||||||
Advisor Shares | ||||||||||||||||||||||||
9/30/2022(16) | (14.65 | )% | $ | 26,872 | 1.05 | % | 1.97 | % | 0.96 | % | 21.48 | % | ||||||||||||
Institutional Shares | ||||||||||||||||||||||||
9/30/2022 | (34.46 | )% | $ | 23,562 | 1.07 | %** | 1.45 | % | 1.13 | % | 21.48 | % | ||||||||||||
9/30/2021 | 19.74 | % | $ | 9,794 | 1.20 | % | 1.89 | % | 0.51 | % | 23.22 | % | ||||||||||||
9/30/2020 | 9.73 | % | $ | 6,695 | 1.20 | % | 2.29 | % | 1.72 | % | 21.57 | % | ||||||||||||
9/30/2019 | 2.04 | % | $ | 6,315 | 1.20 | % | 2.47 | % | 1.34 | % | 30.58 | % | ||||||||||||
9/30/2018 | (2.57 | )% | $ | 5,842 | 1.33 | %* | 2.00 | % | 0.87 | % | 35.24 | % | ||||||||||||
| VALUE FUND | ||||||||||||||||||||||||
Investor Shares | ||||||||||||||||||||||||
9/30/2022 | (16.50 | )% | $ | 82,183 | 1.06 | % | n/a | 0.86 | % | 27.96 | % | |||||||||||||
9/30/2021 | 41.36 | % | $ | 108,551 | 1.05 | % | n/a | 0.67 | % | 25.99 | % | |||||||||||||
9/30/2020 | 0.35 | % | $ | 78,717 | 1.08 | % | n/a | 0.73 | % | 39.07 | % | |||||||||||||
9/30/2019 | (1.80 | )% | $ | 131,134 | 1.06 | % | n/a | 0.87 | % | 28.36 | % | |||||||||||||
9/30/2018 | 9.32 | % | $ | 184,869 | 1.01 | % | n/a | 0.72 | % | 24.53 | % | |||||||||||||
Advisor Shares | ||||||||||||||||||||||||
9/30/2022 | (16.35 | )% | $ | 54,633 | 0.88 | % | 0.96 | % | 1.02 | % | 27.96 | % | ||||||||||||
9/30/2021 | 41.53 | % | $ | 99,646 | 0.88 | % | 0.95 | % | 0.84 | % | 25.99 | % | ||||||||||||
9/30/2020 | 0.54 | % | $ | 84,035 | 0.88 | % | 0.92 | % | 0.94 | % | 39.07 | % | ||||||||||||
9/30/2019 | (1.59 | )% | $ | 108,557 | 0.88 | % | 0.93 | % | 1.06 | % | 28.36 | % | ||||||||||||
9/30/2018 | 9.43 | % | $ | 130,949 | 0.88 | % | 0.89 | % | 0.83 | % | 24.53 | % | ||||||||||||
Institutional Shares | ||||||||||||||||||||||||
9/30/2022 | (16.34 | )% | $ | 90,279 | 0.85 | % | n/a | 1.01 | % | 27.96 | % | |||||||||||||
9/30/2021 | 41.61 | % | $ | 163,069 | 0.83 | % | n/a | 0.88 | % | 25.99 | % | |||||||||||||
9/30/2020 | 0.64 | % | $ | 123,440 | 0.82 | % | n/a | 1.02 | % | 39.07 | % | |||||||||||||
9/30/2019 | (1.57 | )% | $ | 168,607 | 0.84 | % | n/a | 1.09 | % | 28.36 | % | |||||||||||||
9/30/2018 | 9.56 | % | $ | 184,908 | 0.80 | % | n/a | 0.94 | % | 24.53 | % | |||||||||||||
| VALUE INCOME FUND | ||||||||||||||||||||||||
Investor Shares | ||||||||||||||||||||||||
9/30/2022(17) | (17.16 | )% | $ | 733 | 1.20 | % | 13.46 | % | 2.73 | % | 15.65 | % | ||||||||||||
Advisor Shares | ||||||||||||||||||||||||
9/30/2022(17) | (17.11 | )% | $ | 1,178 | 1.10 | % | 9.98 | % | 2.86 | % | 15.65 | % | ||||||||||||
Institutional Shares | ||||||||||||||||||||||||
9/30/2022(17) | (17.10 | )% | $ | 7,195 | 1.05 | % | 2.55 | % | 2.86 | % | 15.65 | % | ||||||||||||
| Artisan Partners Funds | 117 |
ARTISAN PARTNERS FUNDS
Financial Highlights – continued
| ** | Expense limit from October 1, 2021 to February 28, 2022 was 1.35% for Investor Shares and 1.20% for Institutional Shares. Expense limit was lowered effective March 1, 2022 to 1.15% for Investor Shares and 1.00% for Institutional Shares. |
| * | Expense limit from October 1, 2017 to February 20, 2018 was 1.50%. Expense limit was lowered effective February 21, 2018 to 1.35% for Investor Shares and 1.20% for Institutional Shares. |
| (1) | Computed based on average shares outstanding. |
| (2) | Periods less than twelve months (where applicable) are not annualized. |
| (3) | Periods less than twelve months (where applicable) are annualized. |
| (4) | Includes the effect of expenses waived or paid by the Adviser, if applicable. |
| (5) | Amount is between $0.005 and $(0.005) per share. |
| (6) | For the period from commencement of operations (April 7, 2022) through September 30, 2022. |
| (7) | For the period from commencement of operations (December 1, 2021) through September 30, 2022. |
| (8) | Includes interest expense and dividend payments for securities sold short. The ratios excluding such expenses are listed below. Refer to 2(l) in Notes to Financial Statements for additional information. |
Ratio of Expenses to Average Net Assets@ (annualized) | Ratio of Expenses to Average Net Assets Excluding Waivers (annualized) | |||||||||
| FOCUS FUND | ||||||||||
Investor Shares | ||||||||||
9/30/2018 | 1.50% | 1.69% | ||||||||
Advisor Shares | ||||||||||
9/30/2018& | 1.40% | 2.74% | ||||||||
| GLOBAL UNCONSTRAINED FUND | ||||||||||
Investor Shares | ||||||||||
9/30/2022# | 1.45% | 53.92% | ||||||||
Advisor Shares | ||||||||||
9/30/2022# | 1.35% | 9.22% | ||||||||
Institutional Shares | ||||||||||
9/30/2022# | 1.30% | 2.38% | ||||||||
@ Includes the effect of expenses waived or paid by the Adviser, if applicable. (&) For the period from commencement of operations (July 31, 2018) through September 30, 2018. # For the period from commencement of operations (March 31, 2022) through September 30, 2022. |
| |||||||||
| (9) | For the period from commencement of operations (July 31, 2018) through September 30, 2018. |
| (10) | For the period from commencement of operations (February 3, 2020) through September 30, 2020. |
| (11) | For the period from commencement of operations (August 5, 2020) through September 30, 2020. |
| (12) | For the period from commencement of operations (March 31, 2022) through September 30, 2022. |
| (13) | For the period from commencement of operations (May 16, 2022) through September 30, 2022. |
| (14) | For the period from commencement of operations (December 5, 2018) through September 30, 2019. |
| (15) | For the period from commencement of operations (February 28, 2020) through September 30, 2020. |
| (16) | For the period from commencement of operations (April 25, 2022) through September 30, 2022. |
| (17) | For the period from commencement of operations (February 28, 2022) through September 30, 2022. |
| (18) | The net asset value for financial statement purposes includes the impact of investment transactions and other items reflected on trade date, while the daily dealing net asset value may include the impact of investment transactions and other items on the following day. Total return is based on daily dealing net asset value. |
| 118 | Artisan Partners Funds |
Notes to Financial Statements – September 30, 2022
| (1) | Organization: |
Artisan Partners Funds, Inc. (“Artisan Partners Funds”) was incorporated on January 5, 1995 as a Wisconsin corporation and is registered under the Investment Company Act of 1940, as amended (the “1940 Act”). As of September 30, 2022, Artisan Partners Funds is a series company comprised of twenty-one series and follows specialized accounting and reporting under FASB Accounting Standards Codification Topic 946, Financial Services – Investment Companies. The following funds (each a “Fund” and collectively the “Funds”) are included in this report:
| Fund | Investor Shares Inception Date | Advisor Shares Inception Date | Institutional Shares Inception Date | ||||||||||||
Artisan Developing World Fund (“Developing World Fund”) | June 29, 2015 | June 29, 2015 | June 29, 2015 | ||||||||||||
Artisan Emerging Markets Debt Opportunities Fund (“Emerging Markets Debt Opportunities Fund”) | April 7, 2022 | April 7, 2022 | April 7, 2022 | ||||||||||||
Artisan Floating Rate Fund (“Floating Rate Fund”) | December 1, 2021 | December 1, 2021 | December 1, 2021 | ||||||||||||
Artisan Focus Fund (“Focus Fund”) | April 24, 2017 | July 31, 2018 | February 3, 2020 | ||||||||||||
Artisan Global Discovery Fund (“Global Discovery Fund”) | August 21, 2017 | February 3, 2020 | February 3, 2020 | ||||||||||||
Artisan Global Equity Fund (“Global Equity Fund”) | March 29, 2010 | August 5, 2020 | October 15, 2015 | ||||||||||||
Artisan Global Opportunities Fund (“Global Opportunities Fund”) | September 22, 2008 | April 1, 2015 | July 26, 2011 | ||||||||||||
Artisan Global Unconstrained Fund (“Global Unconstrained Fund”) | March 31, 2022 | March 31, 2022 | March 31, 2022 | ||||||||||||
Artisan Global Value Fund (“Global Value Fund”) | December 10, 2007 | April 1, 2015 | July 17, 2012 | ||||||||||||
Artisan High Income Fund (“High Income Fund”) | March 19, 2014 | March 19, 2014 | October 3, 2016 | ||||||||||||
Artisan International Fund (“International Fund”) | December 28, 1995 | April 1, 2015 | July 1, 1997 | ||||||||||||
Artisan International Explorer Fund (“International Explorer Fund”) | N/A | May 16, 2022 | May 16, 2022 | ||||||||||||
Artisan International Small-Mid Fund (“International Small-Mid Fund”) | December 21, 2001 | December 4, 2018 | April 12, 2016 | ||||||||||||
Artisan International Value Fund (“International Value Fund”) | September 23, 2002 | April 1, 2015 | October 1, 2006 | ||||||||||||
Artisan Mid Cap Fund (“Mid Cap Fund”) | June 27, 1997 | April 1, 2015 | July 1, 2000 | ||||||||||||
Artisan Mid Cap Value Fund (“Mid Cap Value Fund”) | March 28, 2001 | April 1, 2015 | February 1, 2012 | ||||||||||||
Artisan Select Equity Fund (“Select Equity Fund”) | February 28, 2020 | February 28, 2020 | February 28, 2020 | ||||||||||||
Artisan Small Cap Fund (“Small Cap Fund”) | March 28, 1995 | February 1, 2017 | May 7, 2012 | ||||||||||||
Artisan Sustainable Emerging Markets Fund (“Sustainable Emerging Markets Fund”) | June 2, 2008 | April 25, 2022 | June 26, 2006 | ||||||||||||
Artisan Value Fund (“Value Fund”) | March 27, 2006 | April 1, 2015 | July 26, 2011 | ||||||||||||
Artisan Value Income (“Value Income Fund”) | February 28, 2022 | February 28, 2022 | February 28, 2022 | ||||||||||||
During the reporting period, Developing World Fund, Floating Rate Fund, Global Discovery Fund, Global Equity Fund, Global Opportunities Fund, Global Value Fund, High Income Fund, International Fund, International Explorer Fund, International Small-Mid Fund, International Value Fund, Mid Cap Fund, Mid Cap Value Fund, Small Cap Fund, Value Fund, and Value Income Fund operated as open-end, diversified mutual funds. During the reporting period Emerging Markets Debt Opportunities Fund, Focus Fund, Global Unconstrained Fund, Select Equity Fund, and Sustainable Emerging Markets Fund operated as open-end, non-diversified mutual funds. The investment objective of each Fund (except Developing World Fund, Emerging Markets Debt Opportunities Fund, Floating Rate Fund, Focus Fund, Global Unconstrained Fund, High Income Fund and Value Income Fund) is to seek maximum long-term capital growth. Developing World Fund’s investment objective is to seek long-term capital appreciation. Emerging Markets Debt Opportunities Fund’s, Floating Rate Fund’s, Global Unconstrained Fund’s, and High Income Fund’s investment objective is to provide total return through a combination of current income and capital appreciation. Focus Fund’s investment objective is to seek maximum long-term capital appreciation. Value Income Fund’s investment objective is to provide total return through a combination of income and capital appreciation. Each Fund has offered shares of capital stock of the classes designated Investor Shares, Advisor Shares and Institutional Shares, as applicable, since the inception dates listed above, except for International Explorer Fund which only offers Advisor Shares and Institutional Shares. Investor Shares of the Funds are generally available to members of the general public. Advisor Shares of the Funds are generally available for investment only by employee benefit plans, clients of certain financial intermediaries that trade through omnibus accounts and other investors that meet the minimum investment requirements. Institutional Shares are designed for certain employee benefit plans, clients of certain financial intermediaries that trade through omnibus accounts and institutional and other investors who are able to meet the minimum investment requirements.
Each class of shares has equal rights with respect to portfolio assets and voting privileges with respect to the Fund in general. Each class of shares has exclusive voting rights with respect to any matters involving only that class. The classes of a Fund pay pro rata the costs of management of that Fund’s portfolio, including the management fee. Each class of a Fund bears the cost of its own transfer agency and shareholder servicing arrangements, and any other class-specific expenses, which will result in differing expenses by class. Because of the different expenses, the Advisor Shares or Institutional Shares of a Fund typically will have a lower expense ratio and correspondingly higher total return than the Investor Shares of the same Fund.
| Artisan Partners Funds | 119 |
NOTES TO FINANCIAL STATEMENTS
The investment adviser for each Fund is Artisan Partners Limited Partnership (the “Adviser” or “Artisan Partners”). The Adviser is managed by its general partner, Artisan Investments GP LLC, a Delaware limited liability company wholly owned by Artisan Partners Holdings LP (“Artisan Holdings”). Artisan Holdings is a limited partnership organized under the laws of Delaware whose sole general partner is Artisan Partners Asset Management Inc., a publicly traded Delaware corporation.
Each of Artisan Emerging Markets Debt Opportunities Fund and Artisan Global Unconstrained Fund may make investments in securities, derivatives and other instruments, directly or through one or more wholly-owned subsidiaries. References herein to each such Fund include references to a subsidiary in respect of the Fund’s investment exposure. The allocation of the Fund’s portfolio in a subsidiary will vary over time. Each such Fund will treat a subsidiary’s assets as assets of the Fund for purposes of determining compliance with various provisions of the 1940 Act applicable to the Fund.
| (2) | Summary of significant accounting policies: |
The following is a summary of significant accounting policies of the Funds in effect during the period covered by the financial statements, which were in accordance with United States generally accepted accounting principles (“US GAAP”).
| (a) | Valuation – The net asset value (“NAV”) of the shares of each class of each Fund was determined as of the close of regular session trading on the New York Stock Exchange (“NYSE”) (usually 4:00 p.m., Eastern Time) each day the NYSE was open for regular session trading. For financial reporting purposes, information available subsequent to the close of NYSE trading and up to the date of the financial statements was considered in determining a fair value for investments held in each Fund and the resulting NAV presented. The NAV of each class of shares was determined by dividing the value of each Fund’s securities and other assets attributed to that class, less its liabilities attributed to that class, by the number of outstanding shares of that class of that Fund. |
In determining each Fund’s NAV for financial reporting purposes, each equity security and exchange traded fund (“ETF”) traded on a securities exchange, including the Nasdaq Stock Market, or over-the-counter was valued at the closing price on the exchange or market designated by the Funds’ accounting agent or pricing vendor as the principal exchange (each, a “principal exchange”). The closing price provided by the pricing vendor for an exchange may differ from the price quoted elsewhere and may represent information such as last sales price, an official closing price, a closing auction price or other information, depending on exchange or market convention. Absent closing price information for an equity security from the principal exchange, the security was valued using (i) the closing price on another exchange on which the security traded (if such price was made available by a pricing vendor) or (ii) the most recent bid quotation on the principal exchange or, if such bid was not available, from a secondary exchange or in the over-the-counter market. Equity-linked securities, such as participation certificates, participation notes or access notes, are valued by referencing the underlying security if market quotations are not readily available. Repurchase agreements and reverse repurchase agreements are valued at cost plus accrued interest. Exchange traded option contracts were valued at the mid price (average of the bid price and ask price) as provided by the pricing vendor at the close of trading on the contract’s principal exchange. Exchange traded futures contracts were valued at the settlement price as provided by the pricing vendor at the close of trading on the principal exchange. Over-the-counter derivatives (including total return swaps, over-the-counter options on total return swaps, and certain other derivatives) are valued using prices provided by the Funds’ pricing vendors. Prices obtained from independent pricing services may use various observable and unobservable inputs, including, but not limited to, information provided by broker-dealers, pricing formulas, estimates of market values obtained from data relating to investments or securities with similar characteristics and/or discounted cash flow or spread curve models that might be applicable. Shares of open-end investment companies (excluding exchange traded funds) were valued at the latest net asset value reported by the investment company.
Fixed income securities, including loan participation notes, were valued at market value. Market values were generally evaluations based on the judgment of the Funds’ pricing vendors, which may consider, among other factors, the prices at which securities actually trade, broker-dealer quotations, pricing formulas, estimates of market values obtained from yield data relating to investments or securities with similar characteristics and/or discounted cash flow models that might be applicable.
A new rule adopted by the Securities and Exchange Commission (the “SEC”) governing fund valuation practices, Rule 2a-5 under the 1940 Act, has established requirements for determining fair value in good faith for purposes of the 1940 Act. Rule 2a-5 permits fund boards to designate certain parties to perform fair value determinations, subject to board oversight and certain other conditions. Rule 2a-5 also defines when market quotations are “readily available” for purposes of Section 29(a)(41) of the 1940 Act, which requires a fund to fair value a security when market quotations are not readily available. Separately, new SEC Rule 31a-4 under the 1940 Act sets forth the recordkeeping requirements associated with fair value determinations. The Funds adopted a valuation policy conforming to the new rules, effective September 1, 2022, and there was no material impact to the Funds. Under the Rule, Artisan Partners has been designated by Artisan Partners Funds’ board of directors as the valuation designee for the Funds. In its capacity as valuation designee, Artisan Partners, among other things, is responsible for establishing fair valuation methodologies and determining, in good faith, the fair value of all of the assets of the Funds for which there are no readily available market quotations. Securities or other assets for which market quotations are not readily available are valued by Artisan Partners, as valuation designee, in accordance with Artisan Partners’ Procedures for Valuation of Portfolio Securities Held by Artisan Partners Funds, Inc. and under the general oversight of Artisan Partners Funds’ board of directors. A market quotation will be considered not readily available, and a Fund may therefore use fair value pricing, if there are not quoted prices (unadjusted) in active markets for identical investments that a Fund can access at the measurement date, and/or any such quotation is not reliable.
| 120 | Artisan Partners Funds |
NOTES TO FINANCIAL STATEMENTS
When fair value pricing is employed, the value of a security or asset used by a Fund to calculate its NAV may differ from quoted or published prices for the same security or asset. Estimates of fair value utilized by the Funds as described above could differ from the value realized on the sale of those securities or assets in the future and the differences may be material to the NAV of the applicable Fund.
| (b) | Taxes – No provision was made for federal income taxes or excise taxes since each Fund intends to (i) comply with the provisions of Subchapter M of the Internal Revenue Code applicable to regulated investment companies and (ii) distribute to its shareholders substantially all of its taxable income as well as net realized gains from the sale of investment securities. The Funds utilize earnings and profits distributed to shareholders on redemptions of Fund shares as part of the dividends paid deduction. |
The Funds have analyzed the tax positions taken on federal income tax returns for all remaining open tax years (fiscal years 2019 through 2022) and have concluded that, as of September 30, 2022, no provision for income tax would be required in the Funds’ financial statements. The Funds’ federal and state income and federal excise tax returns for tax years for which the applicable statutes of limitations have not expired are subject to examination by the Internal Revenue Service and Wisconsin Department of Revenue.
As of and during the year ended September 30, 2022, the Funds did not have any liabilities for unrecognized tax benefits. The Funds recognize interest and penalties, if any, related to unrecognized tax benefits as income tax expense in the Statements of Operations. During the year ended September 30, 2022, the Funds did not incur any material interest or penalties.
The Funds are subject to taxes imposed on foreign dividend income and realized and unrealized gains on securities traded in certain foreign countries in which the Funds invest. Withholding taxes on foreign dividends have been accrued based on the Funds’ understanding of the applicable country’s tax rules and rates. Foreign taxes imposed on realized and unrealized gains was based on the Funds’ understanding of the applicable country’s tax rules and rates and, if applicable, was recorded on an accrual basis and is included in “Net realized gain (loss) on investments” and “Net increase (decrease) in unrealized appreciation or depreciation on investments”, as applicable, on the accompanying Statements of Operations. The amount of foreign tax owed, if any, is included in “Payable for foreign taxes” on the accompanying Statements of Assets and Liabilities and is comprised of withholding taxes on foreign dividends and taxes on unrealized gains.
| (c) | Portfolio transactions – For financial reporting purposes, security transactions and shareholder transactions were recorded on trade date in accordance with US GAAP. Net realized gains and losses on securities were computed on specific security lot identification. |
| (d) | Restricted securities – The Funds may invest in securities that are subject to restrictions on resale and there may be no liquid secondary market or ready purchaser for such securities. These securities generally may be resold in transactions exempt from registration or to the public if the securities are registered. Disposal of these securities may involve time consuming negotiations and expenses, and prompt sale at an acceptable price may be difficult. Information regarding restricted securities, if any, is included in the footnotes to each Fund’s Schedule of Investments. |
| (e) | Foreign currency translation – Values of foreign investments, open foreign currency forward contracts, payables for foreign taxes, payables and receivables for securities transactions, dividend and reclaim receivables, other receivables and payables, and cash denominated in a foreign currency were translated into US dollars using a spot market rate of exchange as of the time of determination of each Fund’s NAV on the day of valuation. Purchases and sales of investments and dividend and interest income were translated into US dollars using the current spot market rate of exchange on the date of such transactions. The portion of security gains or losses resulting from changes in foreign exchange rates was included with net realized and unrealized gain or loss from investments, as appropriate, for both financial reporting and tax purposes. |
The Funds may enter into foreign currency spot contracts and foreign currency forward contracts. Foreign currency spot contracts are typically used to facilitate the purchase and sale of non-US securities and generally settle within three business days. Foreign currency forward contracts are typically used to hedge against foreign currency exchange rate risks, which the Funds may face as a result of direct or indirect exposure to particular currencies (including through US dollar denominated depositary receipts and equity-linked securities). The Funds could be exposed to loss if the counterparties fail to perform under these contracts. Open foreign currency spot contracts and foreign currency forward contracts, if any, were recorded at market value and unrealized gains and losses on foreign currency forward contracts are presented separately on the Statements of Assets and Liabilities and included in other assets less liabilities in the Schedule of Investments. Realized and unrealized gains and losses were reported as foreign currency related transactions and are recorded in the Statements of Operations. For tax purposes, these foreign exchange gains and losses were treated as ordinary income or loss.
Other foreign currency related transaction gains and losses may result from currency gains and losses realized on the difference between the amounts of dividends and foreign taxes accrued on the Funds’ books and the US dollar equivalent of the amounts actually received or paid. The net increase (decrease) in unrealized appreciation or depreciation on foreign currency related transactions arose from changes in the values of assets and liabilities, other than investments in securities, resulting from changes in foreign exchange rates.
| (f) | Depositary receipts – Each Fund may invest in depositary receipts. Depositary receipts are typically issued by a financial institution (a “depositary”), evidencing ownership interests in a security issued by an issuer and deposited with the depositary. |
| Artisan Partners Funds | 121 |
NOTES TO FINANCIAL STATEMENTS
| (g) | Equity-linked securities – Each Fund, except Mid Cap Value Fund and Small Cap Fund, may invest in equity-linked securities. Equity-linked securities are designed to provide synthetic exposure to one or more underlying securities. An investment in an equity-linked security typically entitles the holder to a return equal to the market return of the underlying security or securities. There is no off-balance sheet risk associated with the equity-linked securities that the Funds typically purchase and, in those cases, the Funds’ potential loss is limited to the purchase price of the securities. The Funds are exposed to credit risk associated with the counterparty to the transaction. |
| (h) | Use of estimates – The preparation of financial statements in conformity with US GAAP requires management to make estimates and assumptions that affect the reported amounts and disclosures in the financial statements. Actual results could differ from those estimates. |
| (i) | Indemnifications – Artisan Partners Funds indemnifies its officers and directors for certain liabilities that may arise from the performance of their duties to Artisan Partners Funds. In the normal course of business, the Funds also enter into contracts in which the Funds agree to indemnify the other party or parties against various potential costs or liabilities. A Fund’s maximum exposure under such arrangements is unknown. As of September 30, 2022, no claim has been made for indemnification pursuant to any such agreement of the Funds. |
| (j) | When-Issued/Delayed Delivery Securities – Each Fund may purchase or sell when-issued and delayed delivery securities. Securities purchased on a when-issued or delayed delivery basis are purchased for delivery beyond the normal settlement date at a stated price, and no income accrues to the Fund on such securities prior to delivery date. Payment and delivery for when-issued and delayed delivery securities can take place a month or more after the date of the transaction. Purchasing securities on a when issued or delayed delivery basis may involve a risk that the market price at the time of delivery may be lower than the agreed upon purchase price. |
| (k) | Unfunded Commitments – Pursuant to the terms of certain term loan agreements, Emerging Markets Debt Opportunities Fund, Floating Rate Fund, Global Unconstrained Fund, and High Income Fund are obligated to fund term loan commitments at the borrower’s discretion. During the year, Floating Rate Fund and High Income Fund had unfunded loan commitments, which were recorded at market value. Unrealized gains and losses are presented separately on the Statements of Operations. As of September 30, 2022, the Funds had no unfunded loan commitments. |
Redemption Fees – Emerging Markets Debt Opportunities Fund, Floating Rate Fund, Global Unconstrained Fund and High Income Fund generally impose a 2% redemption fee on the redemption or exchange of shares owned for 90 days or less. Redemption fees were recorded as a reduction in the cost of shares redeemed and had the primary effect of increasing paid-in capital. Each Fund reserves the right to waive or reduce the 2% redemption fee on shares held 90 days or less at its discretion when the Fund believes such waiver is in the best interest of the Fund, including, but not limited to, when it determines that imposition of the redemption fee is not necessary to protect the Fund from the effects of short- term trading. During the year ended September 30, 2022, High Income Fund waived the redemption fee for shares held by certain authorized agents or other Fund intermediaries and otherwise in accordance with the Funds’ prospectus.
| (l) | Securities Sold Short – The Funds may sell securities short or maintain a short position in anticipation of the decline in the market value of a particular security (a short sale), including securities that the Funds do not own. To complete a short sale, the Funds must borrow the security to make delivery to the buyer. The Funds are required to pay the lender any dividends or interest on the security, which accrues during the period of the loan. |
In order to terminate the short sale, the Fund that borrowed the security is obligated to return the security borrowed by purchasing it at market price at the time of termination. The price of the security at termination may differ from the price at which the security was sold. The Fund will incur a loss, as a result of the short sale, if the price of the security increases between the date of the short sale and when the Fund terminates the short sale. This loss may be unlimited. The Fund will realize a gain if the security declines in price between those dates. The gain is limited to the price at which the Fund sold the security short. The amount of any economic gain will be decreased, and the amount of any economic loss increased, by the amount of any premium, dividends or interest the Fund may be required to pay in connection with a short sale.
The Funds may reinvest short sale proceeds. Because the Funds may invest the proceeds of a short sale, the effect of short selling is similar to the effect of leverage. The Funds incur expenses as a result of executing short sales.
During the year ended September 30, 2022, Global Unconstrained Fund engaged in short sales and paid interest on securities sold short, which is included in Interest in the Statement of Operations. For the year ended September 30, 2022, Global Unconstrained Fund incurred fees and expenses on short sales, which is included in other operating expenses in the Statement of Operations. As of September 30, 2022, Global Unconstrained Fund had open short sale positions.
| (m) | Securities Lending – In order to generate incremental revenue, the Funds may participate in a securities lending program, in which securities from its portfolio may be loaned to third parties. Securities loans by the Funds are made to broker-dealers or other financial institutions pursuant to agreements requiring that the loans be continuously |
| 122 | Artisan Partners Funds |
NOTES TO FINANCIAL STATEMENTS
| secured by collateral consisting of cash or short-term debt obligations at least equal at all times to the value of the securities on loan, “marked-to-market” daily. The risks in lending portfolio securities, as with other extensions of credit, consist of possible delay in recovery of the securities or possible loss of rights in the collateral should the borrower fail financially. If a borrower defaults, the value of the collateral may decline before a Fund can dispose of it. The borrower pays to a participating Fund an amount equal to any dividends or interest received on securities lent (known as “manufactured payments” or “substitute payments”). Manufactured payments for dividends or interest received by a participating Fund while its securities are loaned out will not be considered qualified dividend income and will have other tax implications. To the extent that a Fund makes a distribution of income received by the Fund pursuant to loans of its portfolio securities, such income will not constitute qualified dividend income to noncorporate shareholders and will not be eligible for the dividends-received deduction for corporate shareholders. A participating Fund retains all or a portion of the interest received on investment of the cash collateral and/or receives a fee from the borrower. The Funds will typically invest cash collateral in government money market funds. A participating Fund bears the risk of any loss on the investment of the collateral; any such loss may exceed, potentially by a substantial amount, any profit to the Fund from its securities lending activities. A participating Fund may recall loaned securities on demand. |
Goldman Sachs Bank USA, doing business as Goldman Sachs Agency Lending (“GSAL”), currently serves as the securities lending agent for the Funds. GSAL receives as compensation for its services a portion of the amount earned by each Fund for lending securities.
Income from the securities lending program is recorded when earned or as soon as reliable information became available from the lending agent. Net income for each Fund is reflected in the Statements of Operations under “Income from securities lending.” During the year ended September 30, 2022, International Fund and Sustainable Emerging Markets Fund participated in the securities lending program. As of September 30, 2022, International Fund had securities on loan.
| (n) | Other – Dividend income less foreign taxes accrued or withheld, if any, was generally recorded on the ex-dividend date. In some cases, the information was not available to the Funds on the ex-dividend date. In such cases, which may have included private placements and foreign securities, dividends were recorded, revised or canceled as soon after the ex-dividend date as reliable information became available to the Funds. Non-cash dividends related to corporate actions are included in dividend income, if any, were generally recorded at the fair market value of securities received. Interest income was recorded on the accrual basis and includes accretion of discounts and amortization of premiums. Distributions to shareholders were recorded on the ex-dividend date. Expenses attributable to the Funds were generally allocated to each Fund based on net assets. However, other expense allocation methodologies were also used, depending on the nature of the expense item. Income and expenses not specific to a particular class and realized and unrealized gains and losses were allocated daily to each class of shares based upon the relative net asset value of outstanding shares. Expenses attributable to a particular Fund or class were allocated directly to that Fund or class, respectively. |
The character of income and net realized gains and losses may differ in some instances for financial statement and tax purposes and may result in reclassification of permanent differences among certain capital accounts to more appropriately conform financial accounting to tax characterizations of dividend and capital gain distributions.
| (3) | Risks: |
Like all mutual funds, the Funds take investment risks and it is possible for you to lose money by investing in a Fund. Investors in each Fund should have a long-term perspective and be able to tolerate potentially sharp declines in value. This section describes certain of the principal risks associated with investing in each Fund, but is not a complete list of every risk involved in investing in each Fund and the Fund may be exposed to additional risks not listed below. See the Funds’ prospectus and statement of additional information regarding the risks of investing in shares of the Funds. An investment in a Fund is not a bank deposit, and is not insured or guaranteed by the Federal Deposit Insurance Corporation (FDIC) or any other government agency.
The success of a Fund is dependent on such Fund’s investment team’s investment decisions, which are based, in part, on the research process employed by the Fund’s investment team. The portfolio securities selected by the investment team may decline in value or not increase in value when the market indices, including relevant benchmark indices, are rising, in which case the Fund could experience losses regardless of the performance of the market indices. To the extent an investment team considers environmental, social and governance factors in its research process, such Fund may forgo certain investment opportunities and underperform funds that do not consider environmental, social and governance factors.
Markets may perform poorly and the returns from the securities in which a Fund invests may underperform returns from the general securities markets. Securities markets may experience periods of high volatility and reduced liquidity in response to governmental actions, intervention and/or policies, economic or market developments, or other external factors. The value of a company’s securities may rise or fall in response to company, market, economic or other news.
A widespread health crisis such as a global pandemic could cause substantial market volatility, exchange-trading suspensions and closures, impact the ability to complete redemptions, impact Artisan Partners Funds and its service providers’ business functions and affect fund performance. For example, the global outbreak of the 2019 novel coronavirus (“COVID-19”), together with resulting
| Artisan Partners Funds | 123 |
NOTES TO FINANCIAL STATEMENTS
voluntary and governmental actions, including, without limitation, mandatory business closures, public gathering limitations, restrictions on travel and quarantines, has meaningfully disrupted the global economy and markets. Although the long-term economic fallout of COVID-19 is difficult to predict, it has had and is expected to continue to have, notwithstanding widespread COVID-19 vaccination efforts, ongoing material adverse effects across many, if not all, aspects of regional, national and global economies.
Foreign securities may underperform US securities and may be more volatile than US securities. Risks relating to investments in foreign securities (including, but not limited to, depositary receipts and equity-linked securities) and to securities of issuers with significant exposure to foreign markets include: currency exchange rate fluctuation; less available public information about the issuers of securities; less stringent regulatory standards; lack of uniform accounting, auditing and financial reporting standards; and country risks including less liquidity, high inflation rates, unfavorable economic practices, political instability and expropriation and nationalization risks.
In addition, Russia’s military invasion of Ukraine in February 2022, the resulting responses by the US and other countries, and the potential for wider conflict could increase volatility and uncertainty in global financial markets and adversely affect regional and global economies. These and any related events could significantly impact a Fund’s performance and the value of an investment in a Fund, even if a Fund does not have direct exposure to Russian issuers or issuers in other countries directly affected by the invasion.
Investment risks typically are greater in emerging and developing markets. For example, in addition to the risks associated with investments in any foreign country, political, legal and economic structures in these less developed countries may be new and changing rapidly, which may cause instability and greater risk of loss. The securities markets may be less developed, and securities in those markets are generally more volatile and less liquid than those in developed markets. Investing in emerging market countries may involve substantial risk due to, among other reasons, limited information; higher brokerage costs; different accounting, auditing and financial reporting standards; less developed legal systems and thinner trading markets as compared to those in developed countries; different clearing and settlement procedures and custodial services; and currency blockages or transfer restrictions. Emerging market countries also are more likely to experience higher levels of inflation, deflation or currency devaluations, which could hurt their economies and securities markets. Certain emerging markets also may face other significant internal or external risks, including a heightened risk of war and ethnic, religious and racial conflicts. In addition, governments in many emerging market countries participate to a significant degree in their economies and securities markets, which may impair investment and economic growth of companies in those markets. Such markets may also be heavily reliant on foreign capital and, therefore, vulnerable to capital flight.
The values of debt securities change in response to various factors, including, for example, market related factors, such as changes in interest rates or changes in the actual or perceived ability of an issuer to meet its obligations. In general, the value of a debt security may fall in response to increases in interest rates. Each Fund that may invest in fixed income securities may invest in debt securities without considering the maturity of the investment. The value of a security with a longer duration will generally be more sensitive to changes in interest rates than a similar security with a shorter duration. As a result, changes in interest rates in the US and outside the US may affect each Fund’s debt investments unfavorably.
An issuer or counterparty may fail to pay its obligations to a Fund when they are due. Financial strength and solvency (or the perceived financial strength or solvency) of an issuer are the primary factors influencing credit risk. Changes in the financial condition of an issuer or counterparty, changes in specific economic, social or political conditions that affect a particular type of security or other instrument of an issuer, and changes in economic, social or political conditions generally can increase the risk of default by an issuer or counterparty, which can affect a security’s or other instrument’s credit quality or value and an issuer’s or counterparty’s ability to pay interest and principal when due. The values of lower quality debt, including loans, tend to be particularly sensitive to these changes.
Debt securities in which a Fund invests may be rated below investment grade or be unrated securities that are determined by the Adviser to be of comparable quality. Debt securities of below investment grade quality are high yield, high risk bonds, commonly known as “junk bonds.” These bonds are predominantly speculative. They are usually issued by companies without long track records of sales and earnings, or by companies with questionable credit strength. These bonds have a higher degree of default risk and may be less liquid than higher-rated bonds.
Investments in loans, including floating or adjustable rate loans, are generally subject to the same risks as investments in other types of debt obligations, including, among others, the credit risk of nonpayment of principal and interest. In addition, in many cases loans are subject to the risks associated with below investment grade securities. Floating Rate Fund and High Income Fund may invest in loans made in connection with highly leveraged transactions, which are subject to greater credit and liquidity risks than other types of loans. Although the loans in which a Fund invests may be secured by specific collateral, there can be no assurance that liquidation of such collateral would satisfy the borrower’s obligation in the event of nonpayment of scheduled interest or principal, or that such collateral could be readily liquidated. In the event of the bankruptcy of a borrower, a Fund could experience delays or limitations with respect to its ability to realize the benefits of the collateral securing a loan or could recover nothing of what it is owed on the loan. Uncollateralized (i.e., non-secured) loans are subject to greater risk of loss (i.e., nonpayment) in the event of default than secured loans since they do not afford a Fund recourse to collateral. Investments in loans may be difficult to value and may be illiquid, including due to legal or contractual restrictions on resale. Transactions in many loans settle on a delayed basis, and a Fund may not receive the proceeds from the sale of a loan for a substantial period after the sale. As a result, sale proceeds related to the sale of loans may not be available to make additional investments or meet redemption obligations until a substantial period after the sale of the loans.
The London Interbank Offered Rate (“LIBOR”) is expected to cease to be available, or appropriate for use, by June 30, 2023. The unavailability or replacement of LIBOR may affect the value, liquidity or return on certain Fund investments (including, for example, loans that reference LIBOR) and may result in costs incurred in connection with closing out positions and entering into new trades.
| 124 | Artisan Partners Funds |
NOTES TO FINANCIAL STATEMENTS
Regulators and market participants are working together to identify or develop a replacement rate. For instance, the US Federal Reserve based on the recommendations of the New York Federal Reserve’s Alternative Reference Rate Committee (comprised of major derivative market participants and their regulators), has begun publishing a Secured Overnight Funding Rate (“SOFR”) that is intended to replace US dollar LIBOR. Any pricing adjustments to the Fund’s investments resulting from a substitute reference rate including but not limited to SOFR, may also adversely affect the Fund’s performance and/or NAV. There remains uncertainty regarding the future utilization of LIBOR and the nature of any replacement rate. As such, the potential effect of a transition away from LIBOR on a Fund or the financial instruments in which a Fund invests cannot yet be determined and may vary depending on factors that include but are not limited to existing fallback or termination provisions in individual contracts.
As non-diversified funds, Emerging Markets Debt Opportunities Fund, Focus Fund, Global Unconstrained Fund, Select Equity Fund, and Sustainable Emerging Markets Fund may invest a larger portion of their assets in securities of a smaller number of issuers than a diversified fund, which means a single issuer’s performance may affect Fund performance more than if the Fund were invested in a larger number of issuers.
Operational failures, cyber-attacks or other disruptions that affect the Funds’ service providers, the Funds’ counterparties, other market participants or the issuers of securities held by the Funds may adversely affect the Funds and their shareholders, including by causing losses for the Funds or impairing Fund operations.
A Fund’s use of derivatives may involve risks different from, or greater than, the risks associated with investing in more traditional investments, such as stocks and bonds. Derivatives can be highly complex and may perform in ways unanticipated by Artisan Partners. For example, changes in the value of a derivative may not correlate perfectly with, and may be more sensitive to market events than, the underlying asset, rate or index. The skills needed to successfully execute derivative strategies may be different from those needed for other types of transactions. If a Fund incorrectly forecasts the value and/or creditworthiness of securities, currencies, interest rates, counterparties or other economic factors involved in a derivative transaction, the Fund might have been in a better position if the Fund had not entered into such derivative transaction.
In addition to the risks of an adverse change in the value of the underlying reference asset, a Fund’s use of derivatives, including, but not limited to, over-the-counter (“OTC”) derivatives, involves the risk that the other party to the derivative contract will fail to make required payments or otherwise to comply with the terms of the contract. Derivatives transactions can create investment leverage and may be highly volatile, and a Fund could lose more than the amount it invests, especially in unusual or extreme market conditions. Derivatives may be difficult to value and highly illiquid, and a Fund may not be able to close out or sell a derivative position at a particular time or at an anticipated price.
Recent US and non-US legislative and regulatory reforms, including those related to the Dodd-Frank Wall Street Reform and Consumer Protection Act have resulted in, and may in the future result in, new regulation of derivative instruments and a Fund’s use of such instruments. New regulations could, among other things, restrict a Fund’s ability to engage in derivative transactions (for example, by making certain types of derivative instruments or transactions no longer available to the Fund) and/or increase the costs of such transactions, and a Fund may as a result be unable to execute its investment strategies in a manner Artisan Partners might otherwise choose. In connection with Rule 18f-4 under the 1940 Act, the Funds have adopted a derivatives risk management program that takes into account how a Fund’s derivatives use affects its investment portfolio strategy, including whether derivatives are used to increase or decrease portfolio risks or facilitate efficient portfolio management.
Emerging Markets Debt Opportunities Fund’s and Global Unconstrained Fund’s investments in debt obligations of sovereign governments may lose value due to the government entity’s unwillingness or inability to repay principal and interest when due in accordance with the terms of the debt or otherwise in a timely manner. Sovereign governments may default on their debt obligations for a number of reasons, including social, political, economic and diplomatic changes in countries issuing sovereign debt.
| (4) | Fair value measurements: |
Under US GAAP for fair value measurement, accounting standards clarify the definition of fair value for financial reporting, establish a framework for measuring fair value and require additional disclosures about the use of fair value measurements. In accordance with this standard, fair value is defined as the price that each Fund would receive upon selling an investment in an orderly transaction to an independent buyer in the principal or most advantageous market of the investment. The standard establishes a three-tier hierarchy to distinguish between (1) inputs that reflect the assumptions market participants would use in pricing an asset or liability developed based on the market data obtained from sources independent of the reporting entity (observable inputs) and (2) inputs that reflect the reporting entity’s own assumptions about the assumptions market participants would use in pricing an asset or liability developed based on the best information available in the circumstances (unobservable inputs) and to establish classification of fair value measurements for disclosure purposes. Various inputs are used in determining the value of the Funds’ investments. The three-tier hierarchy of inputs is summarized in three broad levels:
| • | Level 1 – unadjusted quoted prices in active markets for identical investments |
| • | Level 2 – other significant observable inputs (including but not limited to quoted prices for similar securities, interest rates, credit risks and securities trading primarily outside the US where the applicable trading market was closed or factors were applied to prices as a result of significant market movements following the close of local trading) |
| Artisan Partners Funds | 125 |
NOTES TO FINANCIAL STATEMENTS
| • | Level 3 – significant unobservable inputs (including the Funds’ own assumptions in determining a fair value of investments and discounts for lack of marketability) |
The inputs or methodology used for valuing securities are not necessarily an indication of the risk or liquidity associated with investing in those securities. A description of the valuation techniques for the Funds’ major classes of assets are found in Note 2(a). A description of the fair value leveling techniques are described below:
Equity securities, ETFs, investment companies, exchange traded options contracts and exchange traded futures contracts are generally categorized as Level 1. Bank loans, corporate bonds, equity-linked securities, foreign currency forward contracts, treasury bills, other derivatives, foreign equity securities in which the closing price or bid quotation are adjusted for significant events, or local market holidays or other unscheduled market closures, are generally categorized as Level 2. Securities fair valued in good faith by the valuation committee are generally categorized as Level 2 or 3, depending on the observability of the inputs utilized.
The following table summarizes each Fund’s investments by major security type, based on the inputs used to determine their fair values as of September 30, 2022 (in thousands):
| Fund | Level 1 - Unadjusted Quoted Prices | Level 2 - Other Significant Observable Inputs | Level 3 - Significant Unobservable Inputs | Total | ||||||||||||||||
Developing World | ||||||||||||||||||||
Common Stocks(1) | ||||||||||||||||||||
Americas | $ | 1,400,869 | $ | - | $ | - | $ | 1,400,869 | ||||||||||||
Emerging Markets | 547,860 | 633,605 | - | (3) | 1,181,465 | |||||||||||||||
Europe | 104,333 | 321,564 | - | 425,897 | ||||||||||||||||
Pacific Basin | 195,503 | - | - | 195,503 | ||||||||||||||||
Total Investments | $ | 2,248,565 | $ | 955,169 | $ | - | (3) | $ | 3,203,734 | |||||||||||
Emerging Markets Debt Opportunities | ||||||||||||||||||||
Sovereign Government Bonds(1) | $ | - | $ | 15,102 | $ | - | $ | 15,102 | ||||||||||||
Corporate Bonds(1) | - | 2,202 | - | 2,202 | ||||||||||||||||
Options Purchased | - | 7 | - | 7 | ||||||||||||||||
U.S. Treasury Obligations | - | 3,149 | - | 3,149 | ||||||||||||||||
Total Investments | - | 20,460 | - | 20,460 | ||||||||||||||||
Foreign Currency Forward Contracts(2) | - | 34 | 1 | 35 | ||||||||||||||||
Futures(2) | 311 | - | - | 311 | ||||||||||||||||
Centrally Cleared Credit Default Swaps(2) | - | 1 | - | 1 | ||||||||||||||||
Centrally Cleared Interest Rate Swaps(2) | - | (47 | ) | - | (47 | ) | ||||||||||||||
Total | $ | 311 | $ | 20,448 | $ | 1 | $ | 20,760 | ||||||||||||
Floating Rate | ||||||||||||||||||||
Bank Loans(1) | $ | - | $ | 40,873 | $ | - | $ | 40,873 | ||||||||||||
Corporate Bonds(1) | - | 1,882 | - | 1,882 | ||||||||||||||||
Warrants | - | - | - | (3) | - | |||||||||||||||
Investment Companies | 5,124 | - | - | 5,124 | ||||||||||||||||
Total Investments | $ | 5,124 | $ | 42,755 | $ | - | $ | 47,879 | ||||||||||||
Focus | ||||||||||||||||||||
Common Stocks(1) | $ | 1,485,899 | $ | - | $ | - | $ | 1,485,899 | ||||||||||||
Options Purchased | 55,341 | - | - | 55,341 | ||||||||||||||||
Investment Company | 30,961 | - | - | 30,961 | ||||||||||||||||
Total Investments | 1,572,201 | - | - | 1,572,201 | ||||||||||||||||
Foreign Currency Forward Contracts(2) | - | 8,980 | - | 8,980 | ||||||||||||||||
Total | $ | 1,572,201 | $ | 8,980 | $ | - | $ | 1,581,181 | ||||||||||||
Global Discovery | ||||||||||||||||||||
Common Stocks(1) | ||||||||||||||||||||
Americas | $ | 150,699 | $ | - | $ | - | $ | 150,699 | ||||||||||||
Emerging Markets | 5,212 | 3,607 | - | 8,819 | ||||||||||||||||
Europe | 13,395 | 36,073 | - | 49,468 | ||||||||||||||||
Pacific Basin | - | 13,197 | - | 13,197 | ||||||||||||||||
Investment Company | 9,356 | - | - | 9,356 | ||||||||||||||||
Total Investments | $ | 178,662 | $ | 52,877 | $ | - | $ | 231,539 | ||||||||||||
| 126 | Artisan Partners Funds |
NOTES TO FINANCIAL STATEMENTS
| Fund | Level 1 - Unadjusted Quoted Prices | Level 2 - Other Significant Observable Inputs | Level 3 - Significant Unobservable Inputs | Total | ||||||||||||||||
Global Equity | ||||||||||||||||||||
Common Stocks(1) | ||||||||||||||||||||
Americas | $ | 88,818 | $ | - | $ | - | $ | 88,818 | ||||||||||||
Emerging Markets | - | 7,364 | - | (3) | 7,364 | |||||||||||||||
Europe | 9,541 | 56,034 | - | 65,575 | ||||||||||||||||
Pacific Basin | - | 5,751 | - | 5,751 | ||||||||||||||||
Investment Company | 2,519 | - | - | 2,519 | ||||||||||||||||
Total Investments | $ | 100,878 | $ | 69,149 | $ | - | (3) | $ | 170,027 | |||||||||||
Global Opportunities | ||||||||||||||||||||
Common Stocks(1) | ||||||||||||||||||||
Americas | $ | 1,853,436 | $ | - | $ | - | $ | 1,853,436 | ||||||||||||
Emerging Markets | 33,106 | - | - | 33,106 | ||||||||||||||||
Europe | 31,404 | 806,893 | - | 838,297 | ||||||||||||||||
Pacific Basin | - | 315,019 | - | 315,019 | ||||||||||||||||
Investment Company | 107,854 | - | - | 107,854 | ||||||||||||||||
Total Investments | $ | 2,025,800 | $ | 1,121,912 | $ | - | $ | 3,147,712 | ||||||||||||
Global Unconstrained | ||||||||||||||||||||
Sovereign Government Bonds(1) | $ | - | $ | 9,060 | $ | - | $ | 9,060 | ||||||||||||
Corporate Bonds(1) | - | 1,628 | - | 1,628 | ||||||||||||||||
Exchange Traded Fund(1) | 32 | - | - | 32 | ||||||||||||||||
Options Purchased | - | 4 | - | 4 | ||||||||||||||||
U.S. Treasury Obligations | - | 2,799 | - | 2,799 | ||||||||||||||||
Repurchase Agreements | - | 2,229 | - | 2,229 | ||||||||||||||||
Investment Companies | 259 | - | - | 259 | ||||||||||||||||
Total Investments before securities sold short | 291 | 15,720 | - | 16,011 | ||||||||||||||||
Sovereign Government Bonds | - | (1,978 | ) | - | (1,978 | ) | ||||||||||||||
Total Investments after securities sold short | 291 | 13,742 | - | 14,033 | ||||||||||||||||
Foreign Currency Forward Contracts(2) | - | 65 | 8 | 73 | ||||||||||||||||
Futures(2) | 190 | - | - | 190 | ||||||||||||||||
Centrally Cleared Credit Default Swaps(2) | - | 125 | - | 125 | ||||||||||||||||
Centrally Cleared Interest Rate Swaps(2) | - | 44 | - | 44 | ||||||||||||||||
Total | $ | 481 | $ | 13,976 | $ | 8 | $ | 14,465 | ||||||||||||
Global Value | ||||||||||||||||||||
Common Stocks(1) | ||||||||||||||||||||
Americas | $ | 845,648 | $ | - | $ | - | $ | 845,648 | ||||||||||||
Emerging Markets | 39,361 | 106,836 | - | 146,197 | ||||||||||||||||
Europe | 1,285 | 700,977 | - | 702,262 | ||||||||||||||||
Pacific Basin | - | 54,220 | - | 54,220 | ||||||||||||||||
Investment Company | 52,414 | - | - | 52,414 | ||||||||||||||||
Total Investments | $ | 938,708 | $ | 862,033 | $ | - | $ | 1,800,741 | ||||||||||||
High Income | ||||||||||||||||||||
Corporate Bonds(1) | $ | - | $ | 4,204,132 | $ | - | $ | 4,204,132 | ||||||||||||
Bank Loans(1) | - | 867,879 | - | 867,879 | ||||||||||||||||
Common Stock(1) | - | 24,386 | - | 24,386 | ||||||||||||||||
Warrants | - | - | - | (3) | - | |||||||||||||||
Investment Company | 607,917 | - | - | 607,917 | ||||||||||||||||
Total Investments | 607,917 | 5,096,397 | - | 5,704,314 | ||||||||||||||||
Foreign Currency Forward Contracts(2) | - | 48 | - | 48 | ||||||||||||||||
Futures(2) | 4,289 | - | - | 4,289 | ||||||||||||||||
Total | $ | 612,206 | $ | 5,096,445 | $ | - | $ | 5,708,651 | ||||||||||||
| Artisan Partners Funds | 127 |
NOTES TO FINANCIAL STATEMENTS
| Fund | Level 1 - Unadjusted Quoted Prices | Level 2 - Other Significant Observable Inputs | Level 3 - Significant Unobservable Inputs | Total | ||||||||||||||||
International | ||||||||||||||||||||
Common Stocks and Equity-Linked Security(1) | ||||||||||||||||||||
Americas | $ | 1,019,215 | $ | 182,170 | $ | - | $ | 1,201,385 | ||||||||||||
Emerging Markets | - | 78,214 | - | (3) | 78,214 | |||||||||||||||
Europe | 279,926 | 3,176,148 | - | 3,456,074 | ||||||||||||||||
Pacific Basin | - | 58,728 | - | 58,728 | ||||||||||||||||
Investment Company | 224,046 | - | - | 224,046 | ||||||||||||||||
Total Investments | $ | 1,523,187 | $ | 3,495,260 | $ | - | (3) | $ | 5,018,447 | |||||||||||
International Explorer | ||||||||||||||||||||
Common Stocks(1) | ||||||||||||||||||||
Americas | $ | 1,692 | $ | 1,182 | $ | - | $ | 2,874 | ||||||||||||
Emerging Markets | 1,390 | 3,261 | - | 4,651 | ||||||||||||||||
Europe | 493 | 7,504 | - | 7,997 | ||||||||||||||||
Pacific Basin | - | 2,280 | - | 2,280 | ||||||||||||||||
Investment Companies | 2,943 | - | - | 2,943 | ||||||||||||||||
Total Investments | $ | 6,518 | $ | 14,227 | $ | - | $ | 20,745 | ||||||||||||
International Small-Mid | ||||||||||||||||||||
Common Stocks(1) | ||||||||||||||||||||
Americas | $ | 954,841 | $ | - | $ | - | $ | 954,841 | ||||||||||||
Emerging Markets | 214,998 | 45,847 | - | 260,845 | ||||||||||||||||
Europe | - | 1,581,181 | - | 1,581,181 | ||||||||||||||||
Middle East | 276,431 | 40,628 | - | 317,059 | ||||||||||||||||
Pacific Basin | - | 528,301 | - | 528,301 | ||||||||||||||||
Investment Company | 279,761 | - | - | 279,761 | ||||||||||||||||
Total Investments | $ | 1,726,031 | $ | 2,195,957 | $ | - | $ | 3,921,988 | ||||||||||||
International Value | ||||||||||||||||||||
Common Stocks and Equity-Linked Security(1) |
| |||||||||||||||||||
Americas | $ | 3,640,492 | $ | - | $ | - | $ | 3,640,492 | ||||||||||||
Emerging Markets | 306,122 | 3,651,315 | - | 3,957,437 | ||||||||||||||||
Europe | 529,471 | 10,171,873 | - | 10,701,344 | ||||||||||||||||
Pacific Basin | - | 475,727 | - | 475,727 | ||||||||||||||||
Investment Company | 1,283,119 | - | - | 1,283,119 | ||||||||||||||||
Total Investments | 5,759,204 | 14,298,915 | - | 20,058,119 | ||||||||||||||||
OTC Total Return Swap(2) | - | (498 | ) | - | (498 | ) | ||||||||||||||
Total | 5,759,204 | 14,298,417 | - | 20,057,621 | ||||||||||||||||
Mid Cap | ||||||||||||||||||||
Common Stocks(1) | $ | 4,018,963 | $ | 58,930 | $ | - | $ | 4,077,893 | ||||||||||||
Investment Company | 127,061 | - | - | 127,061 | ||||||||||||||||
Total Investments | $ | 4,146,024 | $ | 58,930 | $ | - | $ | 4,204,954 | ||||||||||||
Mid Cap Value | ||||||||||||||||||||
Common Stocks(1) | $ | 1,275,036 | $ | - | $ | - | $ | 1,275,036 | ||||||||||||
Investment Company | 20,320 | - | - | 20,320 | ||||||||||||||||
Total Investments | $ | 1,295,356 | $ | - | $ | - | $ | 1,295,356 | ||||||||||||
Select Equity | ||||||||||||||||||||
Common Stocks(1) | $ | 24,248 | $ | 3,910 | $ | - | $ | 28,158 | ||||||||||||
Investment Company | 1,327 | - | - | 1,327 | ||||||||||||||||
Total Investments | $ | 25,575 | $ | 3,910 | $ | - | $ | 29,485 | ||||||||||||
Small Cap | ||||||||||||||||||||
Common Stocks(1) | $ | 1,807,806 | $ | - | $ | - | $ | 1,807,806 | ||||||||||||
Total Investments | $ | 1,807,806 | $ | - | $ | - | $ | 1,807,806 | ||||||||||||
| 128 | Artisan Partners Funds |
NOTES TO FINANCIAL STATEMENTS
| Fund | Level 1 - Unadjusted Quoted Prices | Level 2 - Other Significant Observable Inputs | Level 3 - Significant Unobservable Inputs | Total | ||||||||||||||||
Sustainable Emerging Markets | ||||||||||||||||||||
Common Stocks(1) | ||||||||||||||||||||
Americas | $ | 817 | $ | - | $ | - | $ | 817 | ||||||||||||
Emerging Markets | 11,655 | 44,637 | - | (3) | 56,292 | |||||||||||||||
Europe | - | 467 | - | 467 | ||||||||||||||||
Pacific Basin | 259 | 2,637 | - | (3) | 2,896 | |||||||||||||||
Investment Company | 1,473 | - | - | 1,473 | ||||||||||||||||
Total Investments | $ | 14,204 | $ | 47,741 | $ | - | (3) | $ | 61,945 | |||||||||||
Value | ||||||||||||||||||||
Common Stocks(1) | $ | 194,665 | $ | 27,494 | $ | - | $ | 222,159 | ||||||||||||
Investment Company | 1,916 | - | - | 1,916 | ||||||||||||||||
Total Investments | $ | 196,581 | $ | 27,494 | $ | - | $ | 224,075 | ||||||||||||
Value Income | ||||||||||||||||||||
Common Stocks(1) | $ | 7,051 | $ | 1,050 | $ | - | $ | 8,101 | ||||||||||||
Corporate Bonds(1) | - | 442 | - | 442 | ||||||||||||||||
Convertible Bonds(1) | - | 245 | - | 245 | ||||||||||||||||
Convertible Preferred Stock(1) | 142 | - | - | 142 | ||||||||||||||||
Investment Companies | 252 | - | - | 252 | ||||||||||||||||
Total Investments | 7,445 | 1,737 | - | 9,182 | ||||||||||||||||
Written Option Contracts | (8 | ) | - | - | (8 | ) | ||||||||||||||
Total | $ | 7,437 | $ | 1,737 | $ | - | $ | 9,174 | ||||||||||||
(1)See the Fund’s Schedule of Investments for industry or country classifications. (2)Foreign currency forward contracts, futures contracts, OTC total return swaps and centrally cleared swap contracts are valued at unrealized appreciation (depreciation). Amounts shown above are shown as net unrealized appreciation (depreciation). See the Fund’s Schedule of Investments for additional detail. (3)Valued at $0. |
| |||||||||||||||||||
Information about Level 3 fair value measurements (dollar values in thousands):
| Assets | Fair Value at September 30, 2022 | Unobservable Input(s) | Impact to Fair Value from an Increase in Input | ||||||||
Developing World Fund | |||||||||||
Common Stock | $ | - | (1) | Last quote in inactive market less 100% discount | N/A | ||||||
Emerging Markets Debt Opportunities Fund | |||||||||||
Foreign Currency Forward Contract | $ | 1 | Forward points | Decrease | |||||||
Global Equity Fund | |||||||||||
Common Stock | $ | - | (1) | Last quote in inactive market less 100% discount | N/A | ||||||
Global Unconstrained Fund | |||||||||||
Foreign Currency Forward Contract | $ | 8 | Forward points | Decrease | |||||||
International Fund | |||||||||||
Common Stock | $ | - | (1) | Last quote in inactive market less 100% discount | N/A | ||||||
Sustainable Emerging Markets Fund | |||||||||||
Common Stock | $ | - | (1) | Last quote in inactive market less 100% discount | N/A | ||||||
(1)Includes one or more securities valued at $0. | |||||||||||
| Artisan Partners Funds | 129 |
NOTES TO FINANCIAL STATEMENTS
As of September 30, 2022, the reconciliation of assets in which significant unobservable inputs (Level 3) were used in determining fair value is as follows (in thousands):
| Developing World Fund | Emerging Markets Debt Opportunities Fund* | Global Equity Fund | Global Unconstrained Fund** | International Fund | Sustainable Emerging Markets Fund | |||||||||||||||||||||||||
Balance as of September 30, 2021 | $ | - | $ | - | $ | - | $ | - | $ | - | $ | - | (1) | |||||||||||||||||
Transfers into Level 3 | 97,770 | 1 | 7,177 | 8 | 242,177 | 6,589 | ||||||||||||||||||||||||
Net change in unrealized appreciation (depreciation) | (121,031 | ) | - | (8,762 | ) | - | (303,947 | ) | (8,186 | ) | ||||||||||||||||||||
Purchases | 48,497 | - | 2,861 | - | 95,640 | 2,075 | ||||||||||||||||||||||||
Sales | (25,474 | ) | - | (1,083 | ) | - | (28,299 | ) | (413 | ) | ||||||||||||||||||||
Realized Gain/(Loss) | 238 | - | (193 | ) | - | (5,571 | ) | (65 | ) | |||||||||||||||||||||
Balance as of September 30, 2022 | $ | - | (1) | $ | 1 | $ | - | (1) | $ | 8 | $ | - | (1) | $ | - | (1) | ||||||||||||||
Net change in unrealized appreciation (depreciation) for investments held as of September 30, 2022 | $ | (121,031 | ) | $ | 1 | $ | (8,762 | ) | $ | 8 | $ | (303,947 | ) | $ | (8,186 | ) | ||||||||||||||
* Fund commenced operations on April 7, 2022. |
| |||||||||||||||||||||||||||||
** Fund commenced operations on March 31, 2022. |
| |||||||||||||||||||||||||||||
(1) Includes one or more securities valued at $0. |
| |||||||||||||||||||||||||||||
| (5) | Transfer agent and authorized agent fees and Shareholder communications expenses: |
Each Fund paid fees to, and reimbursed certain expenses of, the Funds’ transfer agent during the year. In addition, the Funds have authorized certain financial services companies, broker-dealers, banks or other authorized agents, and in some cases, other organizations designated by an authorized agent (with their designees, collectively “authorized agents”) to accept purchase, exchange and redemption orders on the Funds’ behalf. Some authorized agents charge a fee for accounting and shareholder services that the agent provided to Fund shareholders on the Fund’s behalf. Those services typically included recordkeeping, transaction processing for shareholders’ accounts and other services. Generally, the fee was either a per account charge based on the number of accounts to which the authorized agent provided such services, or was a percentage of the average value of Fund shares held in such accounts. For Investor Shares and Advisor Shares of the Funds, each Fund paid all or a portion of such fees, which are intended to compensate the authorized agent for its provision of services of the type that would be provided by the Funds’ transfer agent or other service providers if the shares were registered on the books of the Funds’ transfer agent. For Institutional Shares, the Funds do not pay fees to intermediaries in connection with recordkeeping, transaction processing for shareholders’ accounts or any other services that an intermediary may provide to its clients. Artisan Partners, at its own expense, pays certain authorized agents for accounting and shareholder services (to the extent those fees are not paid by a Fund), and for distribution and marketing services performed with respect to the Funds. See the Funds’ prospectus and statement of additional information about authorized agents. The Funds’ expenses incurred for services provided by authorized agents are included in “Transfer agent fees” in the Statements of Operations. The table below shows the fees and expenses to the Funds’ transfer agent and the fees to authorized agents incurred by each class of each Fund during the year ended September 30, 2022 (in thousands):
| Year Ended 9/30/2022 | |||||||||||||||
| Fund | Fees and Expenses to Transfer Agent | Fees to Authorized Agents | Total | ||||||||||||
Artisan Developing World Fund - Investor Shares | $ | 55 | $ | 1,447 | $ | 1,502 | |||||||||
Artisan Developing World Fund - Advisor Shares | 44 | 2,411 | 2,455 | ||||||||||||
Artisan Developing World Fund - Institutional Shares | 43 | - | 43 | ||||||||||||
Artisan Emerging Markets Debt Opportunities Fund - Investor Shares(2) | 16 | - | (1) | 16 | |||||||||||
Artisan Emerging Markets Debt Opportunities Fund - Advisor Shares(2) | 15 | - | (1) | 15 | |||||||||||
Artisan Emerging Markets Debt Opportunities Fund - Institutional Shares(2) | 15 | - | 15 | ||||||||||||
Artisan Floating Rate Fund - Investor Shares(3) | 24 | 5 | 29 | ||||||||||||
Artisan Floating Rate Fund - Advisor Shares(3) | 23 | 13 | 36 | ||||||||||||
Artisan Floating Rate Fund - Institutional Shares(3) | 23 | - | 23 | ||||||||||||
Artisan Focus Fund - Investor Shares | 56 | 608 | 664 | ||||||||||||
Artisan Focus Fund - Advisor Shares | 31 | 981 | 1,012 | ||||||||||||
Artisan Focus Fund - Institutional Shares | 29 | - | 29 | ||||||||||||
Artisan Global Discovery Fund - Investor Shares | 34 | 118 | 152 | ||||||||||||
| 130 | Artisan Partners Funds |
NOTES TO FINANCIAL STATEMENTS
| Year Ended 9/30/2022 | |||||||||||||||
| Fund | Fees and Expenses to Transfer Agent | Fees to Authorized Agents | Total | ||||||||||||
Artisan Global Discovery Fund - Advisor Shares | $ | 27 | $ | 22 | $ | 49 | |||||||||
Artisan Global Discovery Fund - Institutional Shares | 27 | - | 27 | ||||||||||||
Artisan Global Equity Fund - Investor Shares | 37 | 227 | 264 | ||||||||||||
Artisan Global Equity Fund - Advisor Shares | 27 | 7 | 34 | ||||||||||||
Artisan Global Equity Fund - Institutional Shares | 28 | - | 28 | ||||||||||||
Artisan Global Opportunities Fund - Investor Shares | 66 | 2,807 | 2,873 | ||||||||||||
Artisan Global Opportunities Fund - Advisor Shares | 33 | 902 | 935 | ||||||||||||
Artisan Global Opportunities Fund - Institutional Shares | 36 | - | 36 | ||||||||||||
Artisan Global Unconstrained Fund - Investor Shares(4) | 15 | - | (1) | 15 | |||||||||||
Artisan Global Unconstrained Fund - Advisor Shares(4) | 15 | 1 | 16 | ||||||||||||
Artisan Global Unconstrained Fund - Institutional Shares(4) | 15 | - | 15 | ||||||||||||
Artisan Global Value Fund - Investor Shares | 45 | 574 | 619 | ||||||||||||
Artisan Global Value Fund - Advisor Shares | 29 | 258 | 287 | ||||||||||||
Artisan Global Value Fund - Institutional Shares | 32 | - | 32 | ||||||||||||
Artisan High Income Fund - Investor Shares | 39 | 2,691 | 2,730 | ||||||||||||
Artisan High Income Fund - Advisor Shares | 54 | 2,643 | 2,697 | ||||||||||||
Artisan High Income Fund - Institutional Shares | 49 | - | 49 | ||||||||||||
Artisan International Fund - Investor Shares | 202 | 5,206 | 5,408 | ||||||||||||
Artisan International Fund - Advisor Shares | 34 | 1,058 | 1,092 | ||||||||||||
Artisan International Fund - Institutional Shares | 43 | - | 43 | ||||||||||||
Artisan International Explorer Fund - Advisor Shares(5) | 10 | 1 | 11 | ||||||||||||
Artisan International Explorer Fund - Institutional Shares(5) | 9 | - | 9 | ||||||||||||
Artisan International Small-Mid Fund - Investor Shares | 50 | 927 | 977 | ||||||||||||
Artisan International Small-Mid Fund - Advisor Shares | 38 | 1,341 | 1,379 | ||||||||||||
Artisan International Small-Mid Fund - Institutional Shares | 41 | - | 41 | ||||||||||||
Artisan International Value Fund - Investor Shares | 85 | 5,986 | 6,071 | ||||||||||||
Artisan International Value Fund - Advisor Shares | 43 | 4,954 | 4,997 | ||||||||||||
Artisan International Value Fund - Institutional Shares | 59 | - | 59 | ||||||||||||
Artisan Mid Cap Fund - Investor Shares | 117 | 4,275 | 4,392 | ||||||||||||
Artisan Mid Cap Fund - Advisor Shares | 32 | 645 | 677 | ||||||||||||
Artisan Mid Cap Fund - Institutional Shares | 51 | - | 51 | ||||||||||||
Artisan Mid Cap Value Fund - Investor Shares | 93 | 1,364 | 1,457 | ||||||||||||
Artisan Mid Cap Value Fund - Advisor Shares | 33 | 260 | 293 | ||||||||||||
Artisan Mid Cap Value Fund - Institutional Shares | 31 | - | 31 | ||||||||||||
Artisan Select Equity Fund - Investor Shares | 27 | 18 | 45 | ||||||||||||
Artisan Select Equity Fund - Advisor Shares | 27 | 1 | 28 | ||||||||||||
Artisan Select Equity Fund - Institutional Shares | 27 | - | 27 | ||||||||||||
Artisan Small Cap Fund - Investor Shares | 104 | 1,642 | 1,746 | ||||||||||||
Artisan Small Cap Fund - Advisor Shares | 33 | 685 | 718 | ||||||||||||
Artisan Small Cap Fund - Institutional Shares | 39 | - | 39 | ||||||||||||
Artisan Sustainable Emerging Markets Fund - Investor Shares | 31 | 116 | 147 | ||||||||||||
Artisan Sustainable Emerging Markets Fund - Advisor Shares(6) | 11 | 4 | 15 | ||||||||||||
Artisan Sustainable Emerging Markets Fund - Institutional Shares | 27 | - | 27 | ||||||||||||
Artisan Value Fund - Investor Shares | 42 | 203 | 245 | ||||||||||||
Artisan Value Fund - Advisor Shares | 29 | 81 | 110 | ||||||||||||
Artisan Value Fund - Institutional Shares | 29 | - | 29 | ||||||||||||
Artisan Value Income Fund - Investor Shares(7) | 16 | 1 | 17 | ||||||||||||
| Artisan Partners Funds | 131 |
NOTES TO FINANCIAL STATEMENTS
| Year Ended 9/30/2022 | |||||||||||||||
| Fund | Fees and Expenses to Transfer Agent | Fees to Authorized Agents | Total | ||||||||||||
Artisan Value Income Fund - Advisor Shares(7) | $ | 16 | $ | - | (1) | $ | 16 | ||||||||
Artisan Value Income Fund - Institutional Shares(7) | 16 | - | 16 | ||||||||||||
(1)Amount rounds to less than $1. (2)For the period from commencement of operations (April 7, 2022) through September 30, 2022. (3)For the period from commencement of operations (December 1, 2021) through September 30, 2022. (4)For the period from commencement of operations (March 31, 2022) through September 30, 2022. (5)For the period from commencement of operations (May 16, 2022) through September 30, 2022. (6)For the period from commencement of operations (April 25, 2022) through September 30, 2022. (7)For the period from commencement of operations (February 28, 2022) through September 30, 2022. | |||||||||||||||
The following funds had Shareholder communication expenses greater than 5% of total expenses reported in the Statements of Operations for the year ended September 30, 2022. As such, the class level detail is provided below (in thousands):
| Fund | Shareholder Communications Expense | ||||
Emerging Markets Debt Opportunities Fund - Investor Shares(1) | $ | 11 | |||
Emerging Markets Debt Opportunities Fund - Advisor Shares(1) | 9 | ||||
Emerging Markets Debt Opportunities Fund - Institutional Shares(1) | 7 | ||||
Global Unconstrained Fund - Investor Shares(2) | 11 | ||||
Global Unconstrained Fund - Advisor Shares(2) | 9 | ||||
Global Unconstrained Fund - Institutional Shares(2) | 7 | ||||
International Explorer Fund - Advisor Shares(3) | 8 | ||||
International Explorer Fund - Institutional Shares(3) | 7 | ||||
Value Income Fund - Investor Shares(4) | 11 | ||||
Value Income Fund - Advisor Shares(4) | 9 | ||||
Value Income Fund - Institutional Shares(4) | 7 | ||||
(1)For the period from commencement of operations (April 7, 2022) through September 30, 2022. (2)For the period from commencement of operations (March 31, 2022) through September 30, 2022. (3)For the period from commencement of operations (May 16, 2022) through September 30, 2022 (4)For the period from commencement of operations (February 28, 2022) through September 30, 2022. |
| ||||
| (6) | Derivative Transations: |
Each Fund may invest in derivatives for any purpose consistent with its investment objective and guidelines, as set forth in its then-current prospectus and statement of additional information including, without limitation, to improve expected risk-adjusted returns, to reduce exposure to certain risks, for hedging purposes and to obtain economic exposure to certain issuers.
In connection with Rule 18f-4 under the 1940 Act, the Funds have adopted a derivative risk management program that takes into account how its derivatives use affects its investment in portfolio strategy, including whether derivatives are used to increase or decrease portfolio risks or facilitate efficient portfolio management. To the extent a Fund is not a limited derivatives user (as defined in Rule 18f-4), Rule 18f-4, among other things, limits a Fund’s derivatives exposure through a value-at-risk test and requires such Funds to adopt and implement a derivatives risk management program that is reasonably designed to manage the Funds’ derivatives risks. Subject to certain conditions, Funds that are limited derivatives users are not subject to the full requirements of Rule 18f-4. In order to qualify as a limited derivatives user, a Fund’s derivatives “exposure” (as defined in Rule 18f-4) cannot exceed 10% of its net assets, excluding certain currency or interest rate derivatives used for hedging purposes in accordance with specific requirements set out in Rule 18f-4. Emerging Markets Debt Opportunities Fund, Floating Rate Fund, Focus Fund, Global Unconstrained Fund and High Income Fund are full derivatives users while the remaining Funds are limited derivatives users.
Foreign Currency Forward Contracts
Foreign currency forward contracts are contractual agreements to purchase or sell a specified currency at a specified future date (or within a specified time period) and at a price set at the time of the contract. Forward contracts usually are entered into with banks and broker-dealers and are not exchange traded.
Forward currency transactions may involve currencies of the different countries to which a Fund may have exposure and serve as hedges against possible variations in the exchange rate between these currencies. Forward currency transactions may be used for transaction hedging and portfolio hedging involving either specific transactions or portfolio positions (including positions obtained through, among other instruments, participation certificates and depositary receipts that may be denominated in US dollars or foreign currencies). A Fund may not engage in speculative currency exchange transactions. Emerging Markets Debt Opportunities Fund, Focus Fund, Global Unconstrained Fund, High Income Fund and International Value Fund each used foreign currency contracts for hedging currency exposure during the period ended September 30, 2022.
| 132 | Artisan Partners Funds |
NOTES TO FINANCIAL STATEMENTS
At the maturity of a forward contract to deliver a particular currency, a Fund may either sell the portfolio security related to such contract and make delivery of the currency, or it may retain the security and either acquire the currency on the spot market or terminate its contractual obligation to deliver the currency by purchasing an offsetting contract with the same currency trader obligating it to purchase on the same maturity date the same amount of the currency.
Futures Transactions
Each Fund may invest in futures contracts for hedging, risk management or portfolio management purposes, including to offset changes in the value of securities held or expected to be acquired or be disposed of, to minimize fluctuations in foreign currencies, or to gain exposure to a particular market or instrument. Emerging Markets Debt Opportunities Fund and Global Unconstrained Fund used futures contracts for hedging, risk management or portfolio management purposes, including to offset changes in the value of securities held or expected to be acquired or be disposed of, to minimize fluctuations in foreign currencies, or to gain exposure to a particular market or instrument during the period ended September 30, 2022. High Income Fund used futures contracts to manage duration exposure during the year ended September 30, 2022.
A futures contract provides for the future sale by one party and purchase by another party of a specified amount of a financial instrument or money at a specified time and price. To the extent it uses futures contracts, a Fund will be required to deposit margin and other assets with its futures clearing brokers, shown as due from broker in the Statements of Assets and Liabilities.
There are risks associated with a Fund’s transactions in futures contracts, including that the success of an investment strategy may depend on the ability of the Fund’s portfolio managers to predict movements in the prices of individual securities, fluctuations in markets and movement in interest rates.
Options Transactions
Each Fund may purchase and write (sell) put options and call options on securities or indexes.
An option on a security (or index) is a contract that gives the purchaser (holder) of the option, in return for a premium, the right to buy from or sell to the seller of the option the security underlying the option at a specified exercise price at any time during the term of the option. Premiums paid on options purchased and premiums received on options written, as well as the daily fluctuation in market value, are included in investments in securities, at value and written options, at value, respectively, in the Statements of Assets and Liabilities. Focus Fund and Value Income Fund held option contracts during the period ended September 30, 2022.
Each Fund may also enter into options on swap agreements (“swaptions”). A swaption is a contract that gives a counterparty the right (but not the obligation) to enter into a new swap agreement or to shorten, extend, cancel or otherwise modify an existing swap agreement, at some designated future time on specified terms. A Fund may write (sell) and purchase put and call swaptions to the same extent it may make use of standard options on securities or other instruments. Swaptions are generally subject to the same risks involved in a Fund’s use of options. Emerging Markets Debt Opportunities Fund and Global Unconstrained Fund held swaption contracts during the period ended September 30, 2022.
If a written option expires, a Fund realizes a gain equal to the premium received at the time the option was written. If a purchased option expires, the Fund realizes a loss equal to the premium paid. A Fund will realize a gain from a closing purchase transaction if the cost of the closing option is less than the premium received from writing the option, or if it is more, the Fund will realize a loss. If the premium received from writing a closing sale transaction is more than the premium paid to purchase the option, the Fund will realize a gain, or if it is less, the Fund will realize a loss. Realized gain or loss on options purchased and options written are included in net realized gain (loss) on investments and net realized gain (loss) on written options, respectively, in the Statements of Operations. The Fund as writer of an option bears the market risk of an unfavorable change in the price of the security underlying the written option.
There are risks associated with a Fund investing in options contracts including significant differences between the securities markets, the currency markets, and the options markets that could result in an imperfect correlation between these markets, causing a given transaction not to achieve its objective. During the period ended September 30, 2022, Focus Fund and Value Income Fund used options transactions to enhance alpha and minimize downside market risk.
Repurchase Agreements
Repurchase agreements are transactions in which a Fund purchases a security from a bank or recognized securities dealer and simultaneously commits to resell that security to the bank or dealer at an agreed-upon price, date and market rate of interest unrelated to the coupon rate or maturity of the purchased security. Although repurchase agreements carry certain risks not associated with direct investments in securities, a Fund will enter into repurchase agreements only with banks and dealers believed by Artisan Partners to present minimal credit risks. Artisan Partners will review and monitor the creditworthiness of such institutions and will consider the capitalization of the institution, Artisan Partners’ prior dealings with the institution, any rating of the institution’s senior long-term debt by independent rating agencies and other relevant factors.
To the extent that the proceeds from any sale of collateral upon a default in the obligation to repurchase were less than the repurchase price, the Fund would suffer a loss. If the financial institution that is party to the repurchase agreement petitions for bankruptcy or otherwise becomes subject to bankruptcy or other liquidation proceedings, there may be restrictions on the Fund’s ability to sell the
| Artisan Partners Funds | 133 |
NOTES TO FINANCIAL STATEMENTS
collateral and the Fund could suffer a loss. However, with respect to financial institutions whose bankruptcy or liquidation proceedings are subject to the US Bankruptcy Code, each Fund intends to comply with provisions under the Bankruptcy Code that would allow it immediately to resell such collateral. Global Unconstrained Fund held repurchase agreements during the period ended September 30, 2022.
Swap Transactions
Each Fund may enter into swap agreements and other types of over-the-counter transactions such as caps, floors and collars with broker-dealers or other financial institutions for hedging or investment purposes. An example of one type of swap involves the exchange by the Fund with another party of their respective commitments to pay or receive cash flows, for example, an exchange of floating rate payments for fixed-rate payments. The purchase of a cap entitles the purchaser, to the extent that a specified index or other underlying financial measure exceeds a predetermined value on a predetermined date or dates, to receive payments on a notional principal amount from the party selling the cap. The purchase of a floor entitles the purchaser, to the extent that a specified index or other underlying financial measure falls or other underlying measure below a predetermined value on a predetermined date or dates, to receive payments on a notional principal amount from the party selling the floor. A collar combines elements of a cap and a floor.
Swaps are fair valued daily and changes in value are recorded as unrealized appreciation or depreciation on the Statement of Operations. Upon entering a swap agreement, any payments received or made at the beginning of the measurement period are reflected in the Statements of Assets and Liabilities and represent a reconciling value to compensate for differences between the stated terms of the swap agreement and prevailing market factors. These upfront payments are recorded as realized gains or losses on the Statements of Operations upon termination or maturity of the swap. If a liquidation payment is received or made at the termination of the swap, it is recorded as realized gain or loss on the Statements of Operations. Net periodic payments received or paid by a Fund are included as part of realized gains or losses on the Statements of Operations. Daily changes to the fair value of centrally cleared swaps are recorded as Variation margin receivable or payable on centrally cleared swap agreements in the Statements of Assets and Liabilities and are settled daily. An initial margin, typically in form of cash or qualifying highly liquid, high-quality short-term investments, is paid to the central clearing party or derivatives clearing organization when the swap contract is executed and is recorded as Due from brokers on the Statement of Assets and Liabilities.
Swap agreements and similar transactions can be individually negotiated and structured to include exposure to a variety of different types of investments or market factors. Depending on their structures, swap agreements may increase or decrease a Fund’s exposure to long-or short-term interest rates (in the United States or abroad), foreign currency values, mortgage securities, mortgage rates, corporate borrowing rates, or other factors such as security prices, inflation rates or the volatility of an index or one or more securities. For example, if a Fund agrees to exchange payments in US dollars for payments in a non-US currency, the swap agreement would tend to decrease a Fund’s exposure to US interest rates and increase its exposure to that non-US currency and interest rates.
A Fund’s ability to realize a profit from such transactions will depend on the ability of the financial institutions with which it enters into the transactions to meet their obligations to a Fund. If a counterparty’s creditworthiness declines, the value of the agreement would be likely to decline, potentially resulting in losses. If a default occurs by the other party to such transaction, a Fund will have contractual remedies pursuant to the agreements related to the transaction, which may be limited by applicable law in the case of a counterparty’s insolvency.
Under certain circumstances, suitable transactions may not be available to a Fund, or a Fund may be unable to close out its position under such transactions at the same time, or at the same price, as if it had purchased comparable publicly traded securities. Swaps carry counterparty risks that cannot be fully anticipated. Also, because swap transactions typically involve a contract between the two parties, such swap investments can be extremely illiquid, as it is uncertain as to whether another counterparty would wish to take assignment of the rights under the swap contract at a price acceptable to a Fund.
A credit default swap on a bond is an agreement between a Fund and a counterparty that enables a Fund to buy or sell protection against a credit event related to a particular issuer. One party, acting as a protection buyer, makes periodic payments, which may be based on, among other things, a fixed or floating rate of interest, to the other party, a protection seller, in exchange for a promise by the protection seller to make a payment to the protection buyer if a negative credit event (such as a delinquent payment or default) occurs with respect to a referenced bond or group of bonds. Credit default swaps may also be structured based on the debt of a basket of issuers, rather than a single issuer, and may be customized with respect to the default event that triggers purchase or other factors (for example, a specific default within a basket, or defaults by a particular combination of issuers within the basket, may trigger a payment obligation). As a credit protection seller in a credit default swap contract, a Fund would be required to pay the par (or other agreed-upon) value of a referenced debt obligation to the counterparty following certain negative credit events as to a specified third-party debtor, such as default by a US or non-US corporate issuer on its debt obligations. In return for its obligation, a Fund would receive from the counterparty a periodic stream of payments, which may be based on, among other things, a fixed or floating rate of interest, over the term of the contract provided that no event of default has occurred. If no default occurs, a Fund would keep the stream of payments, and would have no payment obligations to the counterparty. A Fund may sell credit protection in order to earn additional income and/or to take a synthetic long position in the underlying security or basket of securities.
Each Fund may enter into credit default swap contracts as protection buyer in order to hedge against the risk of default on the debt of a particular issuer or basket of issuers or attempt to profit from a deterioration or perceived deterioration in the creditworthiness of the particular issuer(s) (also known as buying credit protection).
| 134 | Artisan Partners Funds |
NOTES TO FINANCIAL STATEMENTS
Each Fund may also engage in total return swaps, in which payments made by a Fund or the counterparty are based on the total return of a particular reference asset or assets (such as an equity or fixed-income security, a combination of such securities, or an index). Total return swap agreements may be used to obtain exposure to a security, commodity, or market without owning or taking physical custody of such security or investing directly in such market. Each Fund may also enter into swap agreements on futures contracts including, but not limited to, index futures contracts. Swap agreements on futures contracts are generally subject to the same risks involved in the fund’s use of futures contracts, in addition to the risks involved in the fund’s use of swap agreements. A total return swap, or a swap on a futures contract, may add leverage to a portfolio by providing investment exposure to an underlying asset or market where the Fund does not own or take physical custody of such asset or invest directly in such market.
Many swaps are complex and often valued subjectively. Many over-the-counter derivatives are complex and their valuation often requires modeling and judgment, which increases the risk of mispricing or incorrect valuation. The pricing models used may not produce valuations that are consistent with the values a Fund realizes when it closes or sells an over-the-counter derivative. Valuation risk is more pronounced when a Fund enters into over-the-counter derivatives with specialized terms because the market value of those derivatives in some cases is determined in part by reference to similar derivatives with more standardized terms. Incorrect valuations may result in increased cash payment requirements to counterparties, undercollateralization and/or errors in calculation of the Fund’s NAV. During the period ended September 30, 2022, Emerging Markets Debt Opportunities Fund and Global Unconstrained Fund used swap transactions to create investment leverage. During the period ended September 30, 2022, International Value Fund used swap transactions to gain exposure in the issuer.
The fair value of derivative instruments as reported in the Statements of Assets and Liabilities as of September 30, 2022 was as follows (in thousands):
| Fund | Risk Exposure Category | Derivative Instrument | Statements of Assets and Liabilities Location | Value | |||||||
Emerging Markets Debt Opportunities | Foreign currency | Foreign currency forward contracts | Unrealized appreciation on foreign currency forward contracts | $ | 176 | ||||||
| Foreign currency | Foreign currency forward contracts | Unrealized depreciation on foreign currency forward contracts | $ | (141) | |||||||
| Interest rate | Futures contracts | Payable for variation margin on futures contracts(1) | $ | (5) | |||||||
| Credit | Centrally cleared credit default swaps | Payable for variation margin on centrally cleared credit default swap contracts | $ | (3) | |||||||
| Interest | Centrally cleared interest rate swaps | Payable for variation margin on centrally cleared interest rate swap contracts | $ | (9) | |||||||
| Equity | Purchased options contracts | Investments in securities, unaffiliated, at value | $ | 7 | |||||||
Focus | Foreign currency | Foreign currency forward contracts | Unrealized appreciation on foreign currency forward contracts | $ | 9,533 | ||||||
| Foreign currency | Foreign currency forward contracts | Unrealized depreciation on foreign currency forward contracts | $ | (553) | |||||||
| Equity | Purchased options contracts | Investments in securities, unaffiliated, at value | $ | 55,341 | |||||||
Global Unconstrained | Foreign currency | Foreign currency forward contracts | Unrealized appreciation on foreign currency forward contracts | $ | 127 | ||||||
| Foreign currency | Foreign currency forward contracts | Unrealized depreciation on foreign currency forward contracts | $ | (54) | |||||||
| Interest rate | Futures contracts | Receivable for variation margin on futures contracts(2) | $ | 78 | |||||||
| Credit | Centrally cleared credit default swaps | Payable for variation margin on centrally cleared credit default swap contracts | $ | (12) | |||||||
| Interest | Centrally cleared interest rate swaps | Payable for variation margin on centrally cleared interest rate swap contracts | $ | (2) | |||||||
| Equity | Purchased options contracts | Investments in securities, unaffiliated, at value | $ | 4 | |||||||
High Income | Foreign currency | Foreign currency forward contracts | Unrealized appreciation on foreign currency forward contracts | $ | 48 | ||||||
| Interest rate | Futures contracts | Receivable for variation margin on futures contracts(3) | $ | 253 | |||||||
International Value | Credit | OTC total return swap contracts | Swap contracts, at value | $ | (498) | ||||||
Value Income | Equity | Written options contracts | Written options, at value | $ | (8) | ||||||
(1)Payable is the daily change in the margin requirement. As of September 30, 2022, total net unrealized appreciation was $311. (2)Receivable is the daily change in the margin requirement. As of September 30, 2022, total net unrealized appreciation was $190. (3)Receivable is the daily change in the margin requirement. As of September 30, 2022, total net unrealized appreciation was $4,289. |
| ||||||||||
The effect of derivative instruments in the amount of realized gain (loss) and change in net unrealized appreciation (depreciation) recognized on the Statements of Operations for the year ended September 30, 2022 was as follows (in thousands):
| Fund | Risk Exposure Category | Derivative Instrument | Statements of Operations Location | Net Realized Gain (Loss) | Statements of Operations Location | Unrealized Appreciation (Depreciation) | ||||||||||||
Emerging Markets Debt Opportunities(1) | Foreign currency | Foreign currency forward contracts | Net realized gain on foreign currency forward contracts | $ | 365 | Net increase in unrealized appreciation or depreciation on foreign currency forward contracts | $ | 35 | ||||||||||
| Interest rate | Futures contracts | Net realized gain on futures contracts | $ | 167 | Net increase in unrealized appreciation or depreciation on futures contracts | $ | 311 | |||||||||||
| Equity | Purchased options contracts | Net realized gain on investments, from unaffiliated issuers | $ | - | Net increase in unrealized appreciation or depreciation on investments, from unaffiliated issuers | $ | 3 | |||||||||||
| Credit | Centrally cleared credit default swaps | Net realized gain on swap contracts | $ | 1 | Net increase in unrealized appreciation or depreciation on swap contracts | $ | 1 | |||||||||||
| Interest rate | Centrally cleared interest rate swaps | Net realized loss on swap contracts | $ | (40 | ) | Net decrease in unrealized appreciation or depreciation on swap contracts | $ | (47 | ) | |||||||||
| Artisan Partners Funds | 135 |
NOTES TO FINANCIAL STATEMENTS
| Fund | Risk Exposure Category | Derivative Instrument | Statements of Operations Location | Net Realized Gain (Loss) | Statements of Operations Location | Unrealized Appreciation (Depreciation) | ||||||||||||
| Variable | Variable Rate Swaps | Net realized loss on swap contracts | $ | (4 | ) | Net increase in unrealized appreciation or depreciation on swap contracts | $ | - | ||||||||||
Focus | Foreign currency | Foreign currency forward contracts | Net realized gain on foreign currency forward contracts | $ | 3,082 | Net increase in unrealized appreciation or depreciation on foreign currency forward contracts | $ | 8,501 | ||||||||||
| Equity | Purchased options contracts | Net realized loss on investments, from unaffiliated issuers | $ | (90,560 | ) | Net decrease in unrealized appreciation or depreciation on investments, from unaffiliated issuers | $ | (25,631 | ) | |||||||||
| Equity | Written options contracts | Net realized gain on written options | $ | 17,350 | Net decrease in unrealized appreciation or depreciation on written options | $ | (227 | ) | ||||||||||
Global Unconstrained(2) | Foreign currency | Foreign currency forward contracts | Net realized gain on foreign currency forward contracts | $ | 430 | Net increase in unrealized appreciation or depreciation on foreign currency forward contracts | $ | 73 | ||||||||||
| Interest rate | Futures contracts | Net realized gain on futures contracts | $ | 81 | Net increase in unrealized appreciation or depreciation on futures contracts | $ | 169 | |||||||||||
| Equity | Futures contracts | Net realized gain on futures contracts | $ | - | Net increase in unrealized appreciation or depreciation on futures contracts | $ | 21 | |||||||||||
| Equity | Purchased options contracts | Net realized gain on investments, from unaffiliated issuers | $ | - | Net increase in unrealized appreciation or depreciation on investments, from unaffiliated issuers | $ | 2 | |||||||||||
| Credit | Centrally cleared credit default swaps | Net realized loss on swap contracts | $ | (32 | ) | Net increase in unrealized appreciation or depreciation on swap contracts | $ | 125 | ||||||||||
| Interest rate | Centrally cleared interest rate swaps | Net realized gain on swap contracts | $ | 17 | Net increase in unrealized appreciation or depreciation on swap contracts | $ | 44 | |||||||||||
High Income | Interest rate | Futures contracts | Net realized gain on futures contracts | $ | 14,566 | Net increase in unrealized appreciation or depreciation on futures contracts | $ | 441 | ||||||||||
| Foreign currency | Foreign currency forward contracts | Net realized gain on foreign currency forward contracts | $ | 1,011 | Net increase in unrealized appreciation or depreciation on foreign currency forward contracts | $ | 37 | |||||||||||
International Value | Foreign currency | Foreign currency forward contracts | Net realized gain on foreign currency forward contracts | $ | 56,644 | Net decrease in unrealized appreciation or depreciation on foreign currency forward contracts | $ | (5,810 | ) | |||||||||
| Interest rate | Centrally cleared interest rate swaps | Net realized gain on swap contracts | $ | - | Net decrease in unrealized appreciation or depreciation on swap contracts | $ | (498 | ) | ||||||||||
Value Income | Equity | Written options contracts | Net realized gain on written options | $ | 3 | Net decrease in unrealized appreciation or depreciation on written options | $ | (3 | ) | |||||||||
(1)For the period from commencement of operations (April 7, 2022) through September 30, 2022. (2)For the period from commencement of operations (March 31, 2022) through September 30, 2022. |
| |||||||||||||||||
The average monthly amount outstanding for each derivative type for the year ended September 30, 2022 was as follows (dollar value in thousands):
| Fund | Derivative Type | Average Monthly Notional Amount | |||||
Emerging Markets Debt Opportunities | Centrally cleared credit default swaps | $ | 103 | ||||
| Centrally cleared interest rate swaps | $ | 1,664 | |||||
| Foreign currency forward contracts | $ | 13,189 | |||||
| Futures contracts | $ | 9,156 | |||||
| Swaptions | $ | 4 | |||||
| Variable rate swap | $ | 772 | |||||
Focus | Foreign currency forward contracts | $ | 107,274 | ||||
| Purchased options contracts | $ | 89,208 | |||||
Global Unconstrained | Centrally cleared credit default swaps | $ | 3,017 | ||||
| Centrally cleared interest rate swaps | $ | 1,068 | |||||
| Foreign currency forward contracts | $ | 6,372 | |||||
| Futures contracts | $ | 4,474 | |||||
| Swaptions | $ | 2 | |||||
High Income | Foreign currency forward contracts | $ | 17,567 | ||||
| Futures contracts | $ | 83,252 | |||||
International Value | Foreign currency forward contracts | $ | 182,793 | ||||
| Total return swaps | $ | 46 | |||||
Value Income | Written options contracts | $ | 4 | ||||
| 136 | Artisan Partners Funds |
NOTES TO FINANCIAL STATEMENTS
Master Netting Agreements
Each Fund is a party to various master netting agreements. While the terms and conditions of these agreements may vary, all transactions under any such agreement constitute a single contractual relationship. Each party’s obligation to make any payments, deliveries or other transfers in respect of any transaction under such an agreement may be netted against the other party’s obligations under such agreement. A default by a party in performance with respect to one transaction under such an agreement would give the other party the right to terminate all transactions under such agreement and calculate one net amount owed from one party to the other.
The following tables present information about the offsetting of derivative instruments and collateral amounts (in thousands) for foreign currency forward contracts as of September 30, 2022:
Gross Amounts Not Offset in the Statements of Assets and Liabilities | |||||||||||||||||||||||
| Fund | Counterparty | Gross Asset Amounts Presented in Statements of Assets and Liabilities | Financial Instrument | Collateral Received* | Net Amount (Not Less Than $0) | ||||||||||||||||||
Emerging Markets Debt Opportunities | Citigroup Global Markets | $ | 57 | $ | - | $ | - | $ | 57 | ||||||||||||||
Emerging Markets Debt Opportunities | Standard Chartered Bank | 117 | (83 | ) | - | 34 | |||||||||||||||||
Emerging Markets Debt Opportunities | JPMorgan Chase Bank, N.A. | 2 | (2 | ) | - | - | |||||||||||||||||
Focus | JPMorgan Chase Bank, N.A. | 9,533 | (553 | ) | - | 8,980 | |||||||||||||||||
Global Unconstrained | JPMorgan Chase Bank, N.A. | 19 | (8 | ) | - | 11 | |||||||||||||||||
Global Unconstrained | Standard Chartered Bank | 107 | (46 | ) | - | 61 | |||||||||||||||||
High Income | Bank Of America, N.A. | 48 | - | - | 48 | ||||||||||||||||||
*Excludes cash segregated on statement of assets and liabilities. |
| ||||||||||||||||||||||
Gross Amounts Not Offset in the Statements of Assets and Liabilities | |||||||||||||||||||||||
| Fund | Counterparty | Gross Liability Amounts Presented in Statements of Assets and Liabilities | Financial Instrument | Collateral Pledged* | Net Amount (Not Less Than $0) | ||||||||||||||||||
Emerging Markets Debt Opportunities | Standard Chartered Bank | $ | 83 | $ | (83 | ) | $ | - | $ | - | |||||||||||||
Emerging Markets Debt Opportunities | JPMorgan Chase Bank, N.A. | 58 | (2 | ) | - | 56 | |||||||||||||||||
Focus | JPMorgan Chase Bank, N.A. | 553 | (553 | ) | - | - | |||||||||||||||||
Global Unconstrained | JPMorgan Chase Bank, N.A. | 8 | (8 | ) | - | - | |||||||||||||||||
Global Unconstrained | Standard Chartered Bank | 46 | (46 | ) | - | - | |||||||||||||||||
International Value | UBS AG | 498 | - | - | 498 | ||||||||||||||||||
*Excludes cash segregated on statement of assets and liabilities. |
| ||||||||||||||||||||||
(7) Related Party Transactions:
| (a) | Investment Advisory Agreement – The Adviser, with which the officers and two directors of the Funds are affiliated, provided investment advisory and administrative services to the Funds during the year ended September 30, 2022. In exchange for those services, each Fund paid a monthly management fee to the Adviser as follows: |
Developing World Fund
| Average Daily Net Assets | Annual Rate | ||||
Less than $1 billion | 1.050 | % | |||
$1 billion to $2 billion | 1.025 | ||||
$2 billion to $3.5 billion | 1.000 | ||||
$3.5 billion to $5 billion | 0.975 | ||||
Greater than $5 billion | 0.950 | ||||
Emerging Markets Debt Opportunities
| Average Daily Net Assets | Annual Rate | ||||
Less than $1 billion | 0.750 | % | |||
$1 billion to $2 billion | 0.725 | ||||
$2 billion to $3.5 billion | 0.700 | ||||
$3.5 billion to $5 billion | 0.675 | ||||
Greater than $5 billion | 0.650 | ||||
| Artisan Partners Funds | 137 |
NOTES TO FINANCIAL STATEMENTS
Floating Rate Fund
| Average Daily Net Assets | Annual Rate | ||||
Less than $1 billion | 0.680 | % | |||
$1 billion to $2 billion | 0.660 | ||||
$2 billion to $3.5 billion | 0.640 | ||||
$3.5 billion to $10 billion | 0.620 | ||||
Greater than $10 billion | 0.600 | ||||
Focus Fund
| Average Daily Net Assets | Annual Rate | ||||
Less than $1 billion | 1.000 | % | |||
$1 billion to $2 billion | 0.975 | ||||
$2 billion to $3.5 billion | 0.950 | ||||
$3.5 billion to $5 billion | 0.925 | ||||
Greater than $5 billion | 0.900 | ||||
Global Discovery Fund
| Average Daily Net Assets | Annual Rate | ||||
Less than $1 billion | 0.975 | % | |||
$1 billion to $2 billion | 0.950 | ||||
$2 billion to $3.5 billion | 0.925 | ||||
$3.5 billion to $5 billion | 0.900 | ||||
Greater than $5 billion | 0.875 | ||||
Global Equity Fund:
| Average Daily Net Assets | Annual Rate | ||||
Less than $1 billion | 0.900 | % | |||
$1 billion to $2 billion | 0.875 | ||||
$2 billion to $3.5 billion | 0.850 | ||||
$3.5 billion to $5 billion | 0.825 | ||||
Greater than $5 billion | 0.800 | ||||
Global Opportunities Fund
| Average Daily Net Assets | Annual Rate | ||||
Less than $1 billion | 0.900 | % | |||
$1 billion to $4 billion | 0.875 | ||||
$4 billion to $8 billion | 0.850 | ||||
$8 billion to $12 billion | 0.825 | ||||
Greater than $12 billion | 0.800 | ||||
Global Unconstrained Fund
| Average Daily Net Assets | Annual Rate | ||||
Less than $1 billion | 0.950 | % | |||
$1 billion to $2 billion | 0.925 | ||||
$2 billion to $3.5 billion | 0.900 | ||||
$3.5 billion to $5 billion | 0.875 | ||||
Greater than $5 billion | 0.850 | ||||
Global Value Fund
| Average Daily Net Assets | Annual Rate | ||||
Less than $1 billion | 1.000 | % | |||
$1 billion to $4 billion | 0.975 | ||||
$4 billion to $8 billion | 0.950 | ||||
$8 billion to $12 billion | 0.925 | ||||
Greater than $12 billion | 0.900 | ||||
High Income Fund
| Average Daily Net Assets | Annual Rate | ||||
Less than $1 billion | 0.725 | % | |||
$1 billion to $2 billion | 0.700 | ||||
$2 billion to $3.5 billion | 0.675 | ||||
$3.5 billion to $10 billion | 0.650 | ||||
Greater than $10 billion | 0.625 | ||||
| 138 | Artisan Partners Funds |
NOTES TO FINANCIAL STATEMENTS
International Fund
| Average Daily Net Assets | Annual Rate | ||||
Less than $500 million | 1.000 | % | |||
$500 million to $750 million | 0.975 | ||||
$750 million to $1 billion | 0.950 | ||||
$1 billion to $12 billion | 0.925 | ||||
Greater than $12 billion | 0.900 | ||||
International Explorer Fund
| Average Daily Net Assets | Annual Rate | ||||
Less than $500 million | 1.050 | % | |||
Greater than $500 million | 1.000 | ||||
International Small-Mid Fund
| Average Daily Net Assets | Annual Rate | ||||
Less than $2 billion | 1.050 | % | |||
$2 billion to $3 billion | 1.025 | ||||
$3 billion to $4 billion | 1.000 | ||||
$4 billion to $5 billion | 0.975 | ||||
Greater than $5 billion | 0.950 | ||||
International Value Fund, Mid Cap Fund, Mid Cap Value Fund and Small Cap Fund
| Average Daily Net Assets | Annual Rate | ||||
Less than $500 million | 1.000 | % | |||
$500 million to $750 million | 0.975 | ||||
$750 million to $1 billion | 0.950 | ||||
Greater than $1 billion | 0.925 | ||||
Select Equity Fund
| Average Daily Net Assets | Annual Rate | ||||
Less than $1 billion | 0.750 | % | |||
$1 billion to $2 billion | 0.725 | ||||
$2 billion to $3.5 billion | 0.700 | ||||
$3.5 billion to $5 billion | 0.675 | ||||
Greater than $5 billion | 0.650 | ||||
Sustainable Emerging Markets Fund (Prior to March 1, 2022)
| Average Daily Net Assets | Annual Rate | ||||
Less than $1 billion | 1.000 | % | |||
$1 billion to $2 billion | 0.975 | ||||
$2 billion to $3.5 billion | 0.950 | ||||
$3.5 billion to $5 billion | 0.925 | ||||
Greater than $5 billion | 0.900 | ||||
Sustainable Emerging Markets Fund (Effective March 1, 2022)
| Average Daily Net Assets | Annual Rate | ||||
Less than $1 billion | 0.850 | % | |||
$1 billion to $2 billion | 0.825 | ||||
$2 billion to $3.5 billion | 0.800 | ||||
$3.5 billion to $5 billion | 0.775 | ||||
Greater than $5 billion | 0.750 | ||||
Value Fund
| Average Daily Net Assets | Annual Rate | ||||
Less than $50 million | 0.800 | % | |||
$50 million to $100 million | 0.760 | ||||
$100 million to $500 million | 0.720 | ||||
$500 million to $7.5 billion | 0.680 | ||||
Greater than $7.5 billion | 0.640 | ||||
Value Income Fund
| Average Daily Net Assets | Annual Rate | ||||
Less than $1 billion | 0.700 | % | |||
$1 billion to $2 billion | 0.675 | ||||
$2 billion to $3.5 billion | 0.650 | ||||
$3.5 billion to $5 billion | 0.625 | ||||
Greater than $5 billion | 0.600 | ||||
| Artisan Partners Funds | 139 |
NOTES TO FINANCIAL STATEMENTS
| (b) | Expense Waivers and Reimbursements – The Adviser has contractually agreed to bear certain expenses and waive its management fees, and to the extent that the fee waiver is insufficient to reimburse any ordinary operating expenses, to the extent necessary to cause total annual fund operating expenses (excluding taxes, interest, all commissions and other normal charges incident to the purchase and sale of portfolio securities, acquired fund fees and expenses, borrowing costs such as dividends on securities sold short, and extraordinary charges such as litigation costs, but including management fees paid to the Adviser) not to exceed the percentages of average daily net assets indicated below. These contractual limits continue through January 31, 2024 at which time Artisan Partners will determine whether to renew, revise or discontinue it. The table below shows the current expense limit as a percent of average daily net assets and amounts waived by the Adviser during the period ended September 30, 2022 (dollar values in thousands). |
For the period ended September 30, 2022, Emerging Markets Debt Opportunities Fund, Global Unconstrained Fund, International Explorer Fund, and Value Income Fund incurred operating expenses of approximately $65,000, $98,000, $59,000, and $135,000, respectively, that were reimbursed by the Adviser. The Funds had no material receivables from or payables to the Adviser at September 30, 2022.
| Fund | Expense Limit as a % of Average Daily Net Assets | Expenses Waived | ||||||||
Emerging Markets Debt Opportunities Fund - Investor Shares | 1.25 | % | 48 | (1) | ||||||
Emerging Markets Debt Opportunities Fund - Advisor Shares | 1.15 | % | 46 | (1) | ||||||
Emerging Markets Debt Opportunities Fund - Institutional Shares | 1.10 | % | 47 | (1) | ||||||
Floating Rate Fund - Investor Shares | 1.20 | % | 61 | (2) | ||||||
Floating Rate Fund - Advisor Shares | 1.10 | % | 63 | (2) | ||||||
Floating Rate Fund - Institutional Shares | 1.05 | % | 51 | (2) | ||||||
Global Discovery Fund - Investor Shares | 1.40 | % | - | |||||||
Global Discovery Fund - Advisor Shares | 1.30 | % | 23 | |||||||
Global Discovery Fund - Institutional Shares | 1.25 | % | - | |||||||
Global Equity Fund - Investor Shares | 1.35 | % | - | |||||||
Global Equity Fund - Advisor Shares | 1.25 | % | 31 | |||||||
Global Unconstrained Fund - Investor Shares | 1.45 | % | 49 | (3) | ||||||
Global Unconstrained Fund - Advisor Shares | 1.35 | % | 48 | (3) | ||||||
Global Unconstrained Fund - Institutional Shares | 1.30 | % | 62 | (3) | ||||||
International Explorer Fund - Advisor Shares | 1.40 | % | 47 | (4) | ||||||
International Explorer Fund - Institutional Shares | 1.35 | % | 69 | (4) | ||||||
Select Equity Fund - Investor Shares | 1.25 | % | 56 | |||||||
Select Equity Fund - Advisor Shares | 1.15 | % | 43 | |||||||
Select Equity Fund - Institutional Shares | 1.10 | % | 70 | |||||||
Sustainable Emerging Markets Fund - Investor Shares* | 1.15 | % | 157 | |||||||
Sustainable Emerging Markets Fund - Advisor Shares | 1.05 | % | 57 | (5) | ||||||
Sustainable Emerging Markets Fund - Institutional Shares* | 1.00 | % | 76 | |||||||
Value Fund - Advisor Shares | 0.88 | % | 71 | |||||||
Value Income Fund - Investor Shares | 1.20 | % | 54 | (6) | ||||||
Value Income Fund - Advisor Shares | 1.10 | % | 50 | (6) | ||||||
Value Income Fund - Institutional Shares | 1.05 | % | 72 | (6) | ||||||
* Prior to March 1, 2022, expense limit, as a percentage of average daily net assets, was 1.35% and 1.20% for Investor Shares and Institutional Shares, respectively. (1)For the period from commencement of operations (April 7, 2022) through September 30, 2022. (2)For the period from commencement of operations (December 1, 2021) through September 30, 2022. (3)For the period from commencement of operations (March 31, 2022) through September 30, 2022. (4)For the period from commencement of operations (May 16, 2022) through September 30, 2022. (5)For the period from commencement of operations (April 25, 2022) through September 30, 2022. (6)For the period from commencement of operations (February 28, 2022) through September 30, 2022. |
| |||||||||
| (c) | Officers and Directors – The officers and directors of the Funds who are affiliated with the Adviser receive no compensation from the Funds. For the year ended September 30, 2022, directors of the Funds who are not affiliated persons of the Adviser (“independent directors”) received compensation for their services based on an annual fee of $290,000 prior to January 1, 2022 and $300,000 thereafter. |
| 140 | Artisan Partners Funds |
NOTES TO FINANCIAL STATEMENTS
In addition, the independent chair and each committee chair receives an annual supplemental retainer as follows:
| Amount | |||||
Independent board chair | $ | 100,000 | |||
Audit committee chair | $ | 45,000 | |||
Governance and nominating committee chair | $ | 30,000 | |||
Education committee chair | $ | 30,000 | |||
These fees were generally allocated to each of the Funds based on net assets, subject to a minimum allocation of $1,500 to each Fund per quarter. Additionally, each director is entitled to reimbursement of expenses related to his or her duties as a director of the Funds.
Artisan Partners Funds has adopted a deferred compensation plan for directors who are not affiliated persons of the Adviser that enables directors to elect to defer receipt of all or a portion of the annual compensation they are entitled to receive from the Funds. For purposes of determining the amount owed to the directors under the plan, deferred amounts were invested in shares of the Funds as selected by the individual directors. Each Fund purchased shares of the Funds selected for deferral by the directors in amounts equal to their investment, resulting in a Fund asset equal to the deferred compensation liability. Such assets were included as a component of “Other assets” on the Statements of Assets and Liabilities. Deferral of directors’ fees under the plan did not affect the net assets of the Funds, and did not materially affect the Funds’ assets, liabilities or net investment income per share. Amounts will be deferred until distributed in accordance with the plan.
| (d) | Distribution – Shares of the Funds are offered for sale by Artisan Partners Distributors LLC (“Distributors”). Distributors is wholly owned by Artisan Holdings. All distribution expenses relating to the Funds are paid by the Adviser. |
| (8) | Line of credit arrangement: |
Artisan Partners Funds is party to a line of credit agreement with a syndicate of lenders, led by JPMorgan Chase Bank N.A., as lender and administrative agent that expires on June 7, 2023. Under the line of credit, each Fund can borrow an amount that would not exceed the lesser of (a) 33 1/3% of its adjusted net assets (20% for Floating Rate Fund from commencement of operations (December 1, 2021) through June 8, 2022), with adjusted net assets being total assets less total liabilities (excluding indebtedness for borrowed money) after giving effect to the borrowing, and (b) the maximum amount the Fund is permitted to borrow pursuant to applicable law, pursuant to the Fund’s prospectus limitations on indebtedness, pursuant to any vote of the shareholders of the Fund, or pursuant to any limitation on borrowings in any applicable agreement with any governmental authority or regulator or any other applicable agreement or document to which such Fund was a party; provided that the aggregate borrowings by all the Funds may not exceed $400 million ($300 million prior to June 8, 2022). The Funds paid a commitment fee at the annual rate of 0.15% on the unused portion of the line of credit and interest was charged on any borrowings at the highest of (i) the Eurodollar Rate for a one-month interest period commencing two business days after such day (but, in any event, not less than 0.00%) plus 1.00%, (ii) the federal funds effective rate in effect on such day (but, in any event, not less than 0.00%) plus 1.00% or (iii) the overnight bank funding rate in effect on such day (but, in any event, not less than 0.00%) plus 1.00% . The Funds also paid an agent’s fee and arrangement fee to JPMorgan Chase Bank N.A. and the Funds’ and administrative agent legal expenses in connection with the line of credit, each as incurred. The fees are allocated to each Fund based on average net assets. The use of the line of credit was generally restricted to temporary borrowing for extraordinary or emergency purposes. During the year ended September 30, 2022, there were borrowings under the line of credit as follows:
| Fund | Average Borrowings | Average Borrowing Rates | ||||||||
Developing World | $ | 13,083,333 | 2.22 | % | ||||||
Global Equity | 2,091,667 | 1.21 | % | |||||||
International | 9,650,000 | 1.32 | % | |||||||
Small Cap | 150,000 | 1.09 | % | |||||||
Value | 275,000 | 1.81 | % | |||||||
All fees and interest expense related to the line of credit are included in other operating expenses in the Statements of Operations. There were no borrowings outstanding at September 30, 2022.
| Artisan Partners Funds | 141 |
NOTES TO FINANCIAL STATEMENTS
| (9) | Investment transactions: |
The cost of securities purchased and the proceeds from the sale of securities (excluding securities sold short, derivatives and short-term securities) for the year ended September 30, 2022 were as follows (in thousands):
| Fund | Security Purchases | Security Sales | ||||||||
Developing World | $ | 4,990,562 | $ | 6,755,039 | ||||||
Emerging Market Debt Opportunities(1) | 22,196 | 5,198 | ||||||||
Floating Rate(2) | 64,976 | 18,843 | ||||||||
Focus | 4,580,615 | 4,981,489 | ||||||||
Global Discovery | 189,885 | 180,438 | ||||||||
Global Equity | 228,615 | 292,449 | ||||||||
Global Opportunities | 1,645,084 | 2,450,800 | ||||||||
Global Unconstrained(3) | 11,829 | 2,549 | ||||||||
Global Value | 520,886 | 589,013 | ||||||||
High Income | 3,354,133 | 3,837,128 | ||||||||
International | 3,659,462 | 5,733,479 | ||||||||
International Explorer(4) | 22,437 | 1,241 | ||||||||
International Small-Mid | 1,102,226 | 1,497,549 | ||||||||
International Value | 9,034,064 | 4,736,724 | ||||||||
Mid Cap | 1,933,967 | 2,557,793 | ||||||||
Mid Cap Value | 269,162 | 749,621 | ||||||||
Select Equity | 19,076 | 5,531 | ||||||||
Small Cap | 929,997 | 1,675,427 | ||||||||
Sustainable Emerging Markets | 38,885 | 15,445 | ||||||||
Value | 82,687 | 175,481 | ||||||||
Value Income(5) | 12,269 | 1,361 | ||||||||
(1)For the period from commencement of operations (April 7, 2022) through September 30, 2022. (2)For the period from commencement of operations (December 1, 2021) through September 30, 2022. (3)For the period from commencement of operations (March 31, 2022) through September 30, 2022. (4)For the period from commencement of operations (May 16, 2022) through September 30, 2022. (5)For the period from commencement of operations (February 28, 2022) through September 30, 2022. | ||||||||||
| (10) | Transactions in securities of affiliates: |
The table below shows information about securities of Fund “affiliates” (as defined below) that were held by a Fund, purchased or sold by a Fund, or from which dividends were received by a Fund during the year ended September 30, 2022 (shares and dollar values in thousands). Each Fund identifies a company as an affiliate for the purpose of this report if the Fund owned voting securities that it believed represented 5% or more of that company’s outstanding voting securities (as defined by the 1940 Act) during the year ended September 30, 2022.
Transactions in securities of affiliates:
| As of 09/30/2021 | Proceeds from Sales | Net Realized Gain (Loss) | Net Increase (Decrease) in Unrealized Appreciation or Depreciation | As of 09/30/2022 | |||||||||||||||||||||||||||||||||||||||||
| Funds | Shares Balance | Value | Purchases at Cost | Share Balance | Value | Dividend Income@ | |||||||||||||||||||||||||||||||||||||||
| International Small-Mid Fund | |||||||||||||||||||||||||||||||||||||||||||||
| Carenet, Inc.(1) | 3,666 | $ | 45,772 | $ | 327 | $ | (2,181 | ) | $ | (2,535 | ) | $ | (13,788 | ) | 3,363 | $ | 27,595 | $ | 172 | ||||||||||||||||||||||||||
| CKD Corp.(1) | 4,443 | 94,824 | 704 | (6,630 | ) | (3,810 | ) | (36,800 | ) | 4,057 | 48,288 | 2,574 | |||||||||||||||||||||||||||||||||
| Daikokutenbussan Co. Ltd.(1) | 965 | 56,662 | 450 | (5,135 | ) | (5,575 | ) | (15,910 | ) | 838 | 30,492 | 185 | |||||||||||||||||||||||||||||||||
| Model N, Inc.* | 2,194 | 73,484 | 552 | (5,092 | ) | (3,894 | ) | 3,498 | 2,003 | 68,548 | - | ||||||||||||||||||||||||||||||||||
| Raccoon Holdings, Inc.†(1) | 2,214 | 31,135 | - | (20,772 | ) | (10,691 | ) | 1,495 | 165 | 1,167 | 330 | ||||||||||||||||||||||||||||||||||
| Radware Ltd.*† | 2,736 | 92,248 | 1,941 | (25,636 | ) | 1,588 | (28,065 | ) | 1,931 | 42,076 | - | ||||||||||||||||||||||||||||||||||
| Temairazu, Inc.†(1) | 363 | 20,866 | - | (1,813 | ) | (674 | ) | (6,717 | ) | 321 | 11,662 | 65 | |||||||||||||||||||||||||||||||||
| Ubicom Holdings, Inc.(1) | 928 | 24,206 | 212 | (1,728 | ) | (1,754 | ) | (8,259 | ) | 847 | 12,677 | 59 | |||||||||||||||||||||||||||||||||
| ViewRay, Inc.* | 12,082 | 87,112 | 418 | (4,198 | ) | (3,181 | ) | (40,002 | ) | 11,030 | 40,149 | - | |||||||||||||||||||||||||||||||||
| Total# | $ | 526,309 | $ | 4,604 | $ | (73,185 | ) | $ | (30,526 | ) | $ | (144,548 | ) | $ | 227,749 | $ | 3,385 | ||||||||||||||||||||||||||||
| 142 | Artisan Partners Funds |
NOTES TO FINANCIAL STATEMENTS
| As of 09/30/2021 | Proceeds from Sales | Net Realized Gain (Loss) | Net Increase (Decrease) in Unrealized Appreciation or Depreciation | As of 09/30/2022 | |||||||||||||||||||||||||||||||||||||||||
| Funds | Shares Balance | Value | Purchases at Cost | Share Balance | Value | Dividend Income@ | |||||||||||||||||||||||||||||||||||||||
| International Value Fund | |||||||||||||||||||||||||||||||||||||||||||||
| Arch Capital Group Ltd.* | 22,709 | $ | 867,017 | $ | 75,119 | $ | (60,077 | ) | $ | 4,309 | $ | 164,364 | 23,073 | $ | 1,050,732 | $ | - | ||||||||||||||||||||||||||||
| Berkeley Group Holdings plc‡(1) | 2,675 | 156,702 | 141,931 | - | - | (95,437 | ) | 5,543 | 203,196 | 1,222 | |||||||||||||||||||||||||||||||||||
| Sensata Technologies Holding plc‡ | - | - | 493,765 | (11,974 | ) | (3,051 | ) | (152,552 | ) | 8,750 | 326,188 | 1,935 | |||||||||||||||||||||||||||||||||
| Total | $ | 1,023,719 | $ | 710,815 | $ | (72,051 | ) | $ | 1,258 | $ | (83,625 | ) | $ | 1,580,116 | $ | 3,157 | |||||||||||||||||||||||||||||
| Small Cap Fund | |||||||||||||||||||||||||||||||||||||||||||||
| Vapotherm, Inc.*† | 1,323 | $ | 29,455 | $ | 666 | $ | (8,489 | ) | $ | (30,484 | ) | $ | 8,852 | - | $ | - | $ | - | |||||||||||||||||||||||||||
| Total# | $ | 29,455 | $ | 666 | $ | (8,489 | ) | $ | (30,484 | ) | $ | 8,852 | $ | - | $ | - | |||||||||||||||||||||||||||||
@ Net of foreign taxes withheld, if any. † Issuer was not an affiliate as of September 30, 2022. ‡ Issuer was not an affiliate as of September 30, 2021. * Non-income producing security. # Total value as of September 30, 2022 is presented only for those issuers that were affiliates as of September 30, 2022. (1)Valued at a fair value in accordance with procedures established by the board of directors of Artisan Partners Funds. See notes 2(a) and 4 in Notes to Financial Statements for additional information. |
| ||||||||||||||||||||||||||||||||||||||||||||
| (11) | Information for Federal income tax purposes: |
For Federal income tax purposes, the cost of investments, gross unrealized appreciation, gross unrealized depreciation and net unrealized appreciation (depreciation) on investments as of September 30, 2022 was as follows (in thousands):
| Fund | Cost of Investments | Gross Unrealized Appreciation | Gross Unrealized Depreciation | Net Unrealized Appreciation/(Depreciation) on Investments | ||||||||||||||||
Developing World | $ | 3,679,711 | $ | 516,537 | $ | (992,515 | ) | $ | (475,978 | ) | ||||||||||
Emerging Markets Debt Opportunities | 22,359 | 477 | (2,079 | ) | (1,602 | ) | ||||||||||||||
Floating Rate | 50,732 | 45 | (2,897 | ) | (2,852 | ) | ||||||||||||||
Focus | 1,619,012 | 90,709 | (128,539 | ) | (37,830 | ) | ||||||||||||||
Global Discovery | 245,943 | 21,272 | (35,675 | ) | (14,403 | ) | ||||||||||||||
Global Equity | 192,768 | 18,867 | (41,607 | ) | (22,740 | ) | ||||||||||||||
Global Opportunities | 2,753,173 | 614,319 | (219,779 | ) | 394,540 | |||||||||||||||
Global Unconstrained | 15,443 | 485 | (1,244 | ) | (759 | ) | ||||||||||||||
Global Value | 1,844,076 | 310,168 | (353,503 | ) | (43,335 | ) | ||||||||||||||
High Income | 6,621,277 | 23,134 | (935,760 | ) | (912,626 | ) | ||||||||||||||
International | 5,461,654 | 733,321 | (1,176,528 | ) | (443,207 | ) | ||||||||||||||
International Explorer | 23,978 | 208 | (3,441 | ) | (3,233 | ) | ||||||||||||||
International Small-Mid | 4,281,979 | 380,158 | (740,149 | ) | (359,991 | ) | ||||||||||||||
International Value | 21,443,300 | 2,285,062 | (3,670,741 | ) | (1,385,680 | ) | ||||||||||||||
Mid Cap | 3,446,356 | 1,107,666 | (349,068 | ) | 758,598 | |||||||||||||||
Mid Cap Value | 925,348 | 416,106 | (46,098 | ) | 370,008 | |||||||||||||||
Select Equity | 34,527 | 1,613 | (6,654 | ) | (5,041 | ) | ||||||||||||||
Small Cap | 1,553,510 | 547,268 | (292,972 | ) | 254,296 | |||||||||||||||
Sustainable Emerging Markets | 77,832 | 10,447 | (26,334 | ) | (15,887 | ) | ||||||||||||||
Value | 184,522 | 54,990 | (15,437 | ) | 39,553 | |||||||||||||||
Value Income | 11,083 | 125 | (2,035 | ) | (1,910 | ) | ||||||||||||||
The difference between cost of investments for financial reporting and cost of investments for Federal income tax purposes was due primarily to timing differences in recognizing certain gains and losses on security transactions (e.g., wash sale loss deferrals and passive foreign investment company transactions).
| Artisan Partners Funds | 143 |
NOTES TO FINANCIAL STATEMENTS
The tax characterization of ordinary income dividends and long-term capital gain distributions paid during the year ended September 30, 2022 and the year ended September 30, 2021 were as follows (in thousands):
| Year Ended 9/30/2022 | Year Ended 9/30/2021 | |||||||||||||||||||
| Fund | Ordinary Income Dividends | Long-Term Capital Gain Distributions | Ordinary Income Dividends | Long-Term Capital Gain Distributions | ||||||||||||||||
Developing World | $ | 295,702 | $ | 388,716 | $ | 152,905 | $ | 170,759 | ||||||||||||
Emerging Markets Debt Opportunities(1) | 508 | - | ||||||||||||||||||
Floating Rate(2) | 1,456 | - | ||||||||||||||||||
Focus | 337,147 | 17,221 | 53,368 | - | ||||||||||||||||
Global Discovery | 7,395 | 19,221 | 3,590 | 1,274 | ||||||||||||||||
Global Equity | 19,459 | 28,859 | 14,871 | 16,482 | ||||||||||||||||
Global Opportunities | 27,681 | 553,418 | 124,967 | 198,394 | ||||||||||||||||
Global Unconstrained(3) | 160 | - | ||||||||||||||||||
Global Value | 28,483 | 197,964 | 3,457 | - | ||||||||||||||||
High Income | 478,573 | 44,189 | 334,171 | - | ||||||||||||||||
International | 429,877 | 1,409,800 | 84,981 | 251,322 | ||||||||||||||||
International Explorer(4) | - | - | ||||||||||||||||||
International Small-Mid | 45,109 | 128,582 | 32,045 | - | ||||||||||||||||
International Value | 1,229,228 | 1,001,989 | 150,230 | 2,931 | ||||||||||||||||
Mid Cap | 91,524 | 999,387 | 169,210 | 772,633 | ||||||||||||||||
Mid Cap Value | 34,762 | 229,661 | 11,961 | 26,416 | ||||||||||||||||
Select Equity | 545 | 670 | 67 | - | ||||||||||||||||
Small Cap | 29,251 | 366,277 | - | 193,038 | ||||||||||||||||
Sustainable Emerging Markets | 748 | - | 992 | - | ||||||||||||||||
Value | 6,388 | 37,133 | 1,976 | 22,360 | ||||||||||||||||
Value Income(5) | 161 | - | ||||||||||||||||||
(1)For the period from commencement of operations (April 7, 2022) through September 30, 2022. (2)For the period from commencement of operations (December 1, 2021) through September 30, 2022. (3)For the period from commencement of operations (March 31, 2022) through September 30, 2022. (4)For the period from commencement of operations (May 16, 2022) through September 30, 2022. (5)For the period from commencement of operations (February 28, 2022) through September 30, 2022. |
| |||||||||||||||||||
Ordinary income dividends and long-term capital gain distributions were determined in accordance with income tax regulations that impose treatment that is different from the treatment that would result from the application of US GAAP for such items as net short-term gains, wash sale loss deferrals, passive foreign investment company transactions, foreign currency transactions, net investment losses and qualified late year ordinary losses.
In addition, the Funds may periodically record reclassifications among certain capital accounts to reflect differences between financial reporting and income tax basis distributions. The reclassifications were recorded in order to reflect the tax treatment for certain permanent differences that exist between income tax regulations and US GAAP. The reclassifications generally relate to net operating losses, dividends in excess and utilization of earnings and profits distributed to shareholders on redemption of Fund shares. These reclassifications have no impact on the net asset values of the Funds.
Permanent book and tax differences resulted in reclassifications to undistributed net investment income (loss), accumulated net realized gain (loss) and paid-in-capital at September 30, 2022 as follows:
| Fund | Undistributed Net Investment Income (Loss) | Accumulated Net Realized Gain (Loss) | Fund Shares Issued and outstanding | ||||||||||||
Developing World | $ | 17,198 | $ | 4,448 | $ | (21,646 | ) | ||||||||
Emerging Markets Debt Opportunities | 238 | (238 | ) | - | (a) | ||||||||||
Floating Rate | (9 | ) | 12 | (3 | ) | ||||||||||
Focus | 2,894 | (2,894 | ) | - | |||||||||||
Global Discovery | 825 | (26 | ) | (799 | ) | ||||||||||
Global Equity | (182 | ) | 94 | 88 | |||||||||||
| 144 | Artisan Partners Funds |
NOTES TO FINANCIAL STATEMENTS
| Fund | Undistributed Net Investment Income (Loss) | Accumulated Net Realized Gain (Loss) | Fund Shares Issued and outstanding | ||||||||||||
Global Opportunities | $ | 4,565 | $ | 502 | $ | (5,067 | ) | ||||||||
Global Unconstrained | 360 | (360 | ) | - | (a) | ||||||||||
Global Value | (3,147 | ) | (6,920 | ) | 10,067 | ||||||||||
High Income | 440 | (8,169 | ) | 7,729 | |||||||||||
International | (9,806 | ) | (57,306 | ) | 67,112 | ||||||||||
International Explorer | 8 | (8 | ) | - | |||||||||||
International Small-Mid | 6,350 | (6,350 | ) | - | |||||||||||
International Value | 35,643 | (84,300 | ) | 48,657 | |||||||||||
Mid Cap | 16,655 | 62,561 | (79,216 | ) | |||||||||||
Mid Cap Value | (5,931 | ) | (29,620 | ) | 35,551 | ||||||||||
Select Equity | (4 | ) | (4 | ) | 8 | ||||||||||
Small Cap | 9,329 | (2,864 | ) | (6,465 | ) | ||||||||||
Sustainable Emerging Markets | (141 | ) | 141 | - | |||||||||||
Value | (483 | ) | (8,189 | ) | 8,672 | ||||||||||
Value Income | (5 | ) | 4 | 1 | |||||||||||
(a) Amount rounds to less than $1 | |||||||||||||||
In order to meet certain excise tax distribution requirements, the Funds are required to measure and distribute annually, net capital gains realized during a twelve-month period ending October 31 and net investment income earned during a twelve-month period ending December 31. In connection with these requirements, the Funds are permitted for tax purposes to defer into their next fiscal year qualified late year losses. Qualified late year capital losses are any net capital losses incurred between November 1 and the end of the Funds’ fiscal year, September 30, 2022. Qualified late year ordinary losses are specified losses generally incurred between January 1 and the end of the Funds’ fiscal year, September 30, 2022.
Additional tax information as of and for the year ended September 30, 2022 follows (in thousands):
Additional tax information
| Fund | Undistributed Ordinary Income | Undistributed Long-Term Gain | Qualified Late Year Capital Losses | Qualified Late Year Ordinary Losses | Other Deferred Gains (Losses)* | Tax Components of Net Assets Appreciation/ (Depreciation) | Total Distributable Earnings | ||||||||||||||||||||||||||||
Developing World | $ | - | $ | - | $ | (413,684 | ) | $ | (24,934 | ) | $ | (334 | ) | $ | (476,047 | ) | $ | (914,999 | ) | ||||||||||||||||
Emerging Markets Debt Opportunities(1) | 455 | 287 | - | - | (1 | ) | (1,608 | ) | (867 | ) | |||||||||||||||||||||||||
Floating Rate(2) | - | - | - | - | (590 | ) | (2,855 | ) | (3,445 | ) | |||||||||||||||||||||||||
Focus | 8,043 | - | - | - | (101,399 | ) | (61,049 | ) | (154,405 | ) | |||||||||||||||||||||||||
Global Discovery | - | - | (13,872 | ) | (1,261 | ) | (15 | ) | (14,411 | ) | (29,559 | ) | |||||||||||||||||||||||
Global Equity | 1,176 | - | (9,054 | ) | - | (23 | ) | (22,783 | ) | (30,684 | ) | ||||||||||||||||||||||||
Global Opportunities | - | - | (22,825 | ) | (516 | ) | (311 | ) | 394,384 | 370,732 | |||||||||||||||||||||||||
Global Unconstrained(3) | 749 | 163 | - | - | (2 | ) | (761 | ) | 149 | ||||||||||||||||||||||||||
Global Value | 8,278 | 70,073 | - | - | (231 | ) | (43,596 | ) | 34,524 | ||||||||||||||||||||||||||
High Income | - | 37,826 | - | - | (7,167 | ) | (917,693 | ) | (887,034 | ) | |||||||||||||||||||||||||
International | 78,878 | 69,382 | - | - | (1,013 | ) | (446,035 | ) | (298,788 | ) | |||||||||||||||||||||||||
International Explorer(4) | 28 | - | - | - | (162 | ) | (3,233 | ) | (3,367 | ) | |||||||||||||||||||||||||
International Small-Mid | - | - | (167,001 | ) | (1,505 | ) | (206 | ) | (360,727 | ) | (529,439 | ) | |||||||||||||||||||||||
International Value | 48,410 | 378,198 | - | - | (1,379 | ) | (1,392,622 | ) | (967,393 | ) | |||||||||||||||||||||||||
Mid Cap | - | - | (11,503 | ) | (31,428 | ) | (567 | ) | 758,596 | 715,098 | |||||||||||||||||||||||||
Mid Cap Value | 5,839 | 232,293 | - | - | (263 | ) | 370,010 | 607,879 | |||||||||||||||||||||||||||
Select Equity | 324 | 441 | - | - | (7 | ) | (5,043 | ) | (4,285 | ) | |||||||||||||||||||||||||
Small Cap | - | - | (300,919 | ) | (14,621 | ) | (194 | ) | 254,295 | (61,439 | ) | ||||||||||||||||||||||||
Sustainable Emerging Markets | 667 | - | - | - | (133,101 | ) | (16,215 | ) | (148,649 | ) | |||||||||||||||||||||||||
Value | 538 | 35,825 | - | - | (44 | ) | 39,545 | 75,864 | |||||||||||||||||||||||||||
Value Income(5) | 3 | - | - | - | (76 | ) | (1,909 | ) | (1,982 | ) | |||||||||||||||||||||||||
| * | Other deferred gains and losses relate to (a) distribution payable at year end (b) other items including straddle loss deferral, deferred compensation and capital loss carryforward. |
| Artisan Partners Funds | 145 |
NOTES TO FINANCIAL STATEMENTS
| (1) | For the period from commencement of operations (April 7, 2022) through September 30, 2022. |
| (2) | For the period from commencement of operations (December 1, 2021) through September 30, 2022. |
| (3) | For the period from commencement of operations (March 31, 2022) through September 30, 2022. |
| (4) | For the period from commencement of operations (May 16, 2022) through September 30, 2022. |
| (5) | For the period from commencement of operations (February 28, 2022) through September 30, 2022. |
As of September 30, 2022, the Funds had capital loss carryovers shown in the table below (in thousands). To the extent the Funds realize future net capital gains, those gains will be offset by any unused capital loss carryover.
| Fund | Unexpiring – ST | Unexpiring – LT | Utilized in CY | ||||||||||||
Floating Rate | $ | 588 | $ | - | $ | - | |||||||||
Focus | 101,319 | - | - | ||||||||||||
International Explorer | 162 | - | - | ||||||||||||
Sustainable Emerging Markets | 6,328 | 126,757 | (1) | 135 | |||||||||||
Value Income | 75 | - | - | ||||||||||||
(1)Due to an equity shift in the ordinary course of business, the utilization of certain capital loss carryovers is subject to annual limitations of $1,323, pursuant to IRC Section 382-383. |
| ||||||||||||||
| (12) | Fund share activities: |
Capital share transactions for the Funds were as follows (dollar values in thousands):
| DEVELOPING WORLD | ||||||||||||||||||||
| Year Ended 9/30/2022 | Year Ended 9/30/2021 | |||||||||||||||||||
| Shares | Amount | Shares | Amount | |||||||||||||||||
| Proceeds from shares issued | ||||||||||||||||||||
Investor Shares | 7,470,810 | $ | 141,791 | 24,456,112 | $ | 652,612 | ||||||||||||||
Advisor Shares | 71,081,577 | 1,307,328 | 78,124,393 | 2,091,300 | ||||||||||||||||
Institutional Shares | 29,932,152 | 533,624 | 35,190,326 | 944,978 | ||||||||||||||||
| Net asset value of shares issued in reinvestment of dividends and distributions | ||||||||||||||||||||
Investor Shares | 2,902,230 | 68,136 | 1,144,414 | 28,164 | ||||||||||||||||
Advisor Shares | 14,263,543 | 338,006 | 6,563,174 | 162,701 | ||||||||||||||||
Institutional Shares | 7,092,177 | 169,058 | 3,125,063 | 77,783 | ||||||||||||||||
| Cost of shares redeemed | ||||||||||||||||||||
Investor Shares | (16,787,479 | ) | (297,852 | ) | (18,370,697 | ) | (478,325 | ) | ||||||||||||
Advisor Shares | (133,496,326 | ) | (2,343,680 | ) | (56,204,034 | ) | (1,491,291 | ) | ||||||||||||
Institutional Shares | (55,734,088 | ) | (987,399 | ) | (22,206,741 | ) | (591,050 | ) | ||||||||||||
| Net increase (decrease) from fund share transactions | ||||||||||||||||||||
Investor Shares | (6,414,439 | ) | (87,925 | ) | 7,229,829 | 202,451 | ||||||||||||||
Advisor Shares | (48,151,206 | ) | (698,346 | ) | 28,483,533 | 762,710 | ||||||||||||||
Institutional Shares | (18,709,759 | ) | (284,717 | ) | 16,108,648 | 431,711 | ||||||||||||||
| EMERGING MARKETS DEBT OPPORTUNITIES | ||||||||||||||||||||
| Period Ended 9/30/2022(1) | ||||||||||||||||||||
| Shares | Amount | |||||||||||||||||||
| Proceeds from shares issued | ||||||||||||||||||||
Investor Shares | 8,969 | $ | 88 | |||||||||||||||||
Advisor Shares | 44,242 | 438 | ||||||||||||||||||
Institutional Shares | 2,106,225 | 21,058 | ||||||||||||||||||
| Net asset value of shares issued in reinvestment of dividends and distributions | ||||||||||||||||||||
Investor Shares | 165 | 2 | ||||||||||||||||||
Advisor Shares | 929 | 9 | ||||||||||||||||||
Institutional Shares | 51,335 | 497 | ||||||||||||||||||
| Cost of shares redeemed | ||||||||||||||||||||
Institutional Shares | (2,727 | ) | (26 | ) | ||||||||||||||||
| Net increase from fund share transactions | ||||||||||||||||||||
Investor Shares | 9,134 | 90 | ||||||||||||||||||
Advisor Shares | 45,171 | 447 | ||||||||||||||||||
Institutional Shares | 2,154,833 | 21,529 | ||||||||||||||||||
| 146 | Artisan Partners Funds |
NOTES TO FINANCIAL STATEMENTS
| FLOATING RATE | ||||||||||||||||||||
| Period Ended 9/30/2022(2) | ||||||||||||||||||||
| Shares | Amount | |||||||||||||||||||
| Proceeds from shares issued | ||||||||||||||||||||
Investor Shares | 280,147 | $ | 2,719 | |||||||||||||||||
Advisor Shares | 2,737,014 | 26,946 | ||||||||||||||||||
Institutional Shares | 3,318,819 | 33,023 | ||||||||||||||||||
| Net asset value of shares issued in reinvestment of dividends and distributions | ||||||||||||||||||||
Investor Shares | 4,253 | 41 | ||||||||||||||||||
Advisor Shares | 53,482 | 511 | ||||||||||||||||||
Institutional Shares | 94,596 | 902 | ||||||||||||||||||
| Cost of shares redeemed | ||||||||||||||||||||
Investor Shares | (20,931 | ) | (203 | ) | ||||||||||||||||
Advisor Shares | (994,399 | ) | (9,499 | ) | ||||||||||||||||
Institutional Shares | (394,361 | ) | (3,759 | ) | ||||||||||||||||
| Net increase from fund share transactions | ||||||||||||||||||||
Investor Shares | 263,469 | 2,557 | ||||||||||||||||||
Advisor Shares | 1,796,097 | 17,958 | ||||||||||||||||||
Institutional Shares | 3,019,054 | 30,166 | ||||||||||||||||||
| FOCUS | ||||||||||||||||||||
| Year Ended 9/30/2022 | Year Ended 9/30/2021 | |||||||||||||||||||
| Shares | Amount | Shares | Amount | |||||||||||||||||
| Proceeds from shares issued | ||||||||||||||||||||
Investor Shares | 4,690,488 | $ | 84,203 | 6,066,488 | $ | 124,647 | ||||||||||||||
Advisor Shares | 15,192,061 | 287,151 | 23,956,675 | 501,871 | ||||||||||||||||
Institutional Shares | 10,512,079 | 182,072 | 9,893,353 | 218,902 | ||||||||||||||||
| Net asset value of shares issued in reinvestment of dividends and distributions | ||||||||||||||||||||
Investor Shares | 2,442,848 | 51,056 | 469,765 | 9,245 | ||||||||||||||||
Advisor Shares | 8,143,796 | 170,694 | 1,300,655 | 25,636 | ||||||||||||||||
Institutional Shares | 1,731,756 | 36,384 | 176,767 | 3,488 | ||||||||||||||||
| Cost of shares redeemed | ||||||||||||||||||||
Investor Shares | (6,784,230 | ) | (127,828 | ) | (5,571,574 | ) | (117,026 | ) | ||||||||||||
Advisor Shares | (24,269,096 | ) | (446,780 | ) | (10,783,293 | ) | (237,296 | ) | ||||||||||||
Institutional Shares | (9,012,101 | ) | (163,400 | ) | (958,295 | ) | (20,559 | ) | ||||||||||||
| Net increase from fund share transactions | ||||||||||||||||||||
Investor Shares | 349,106 | 7,431 | 964,679 | 16,866 | ||||||||||||||||
Advisor Shares | (933,239 | ) | 11,065 | 14,474,037 | 290,211 | |||||||||||||||
Institutional Shares | 3,231,734 | 55,056 | 9,111,825 | 201,831 | ||||||||||||||||
| GLOBAL DISCOVERY | ||||||||||||||||||||
| Year Ended 9/30/2022 | Year Ended 9/30/2021 | |||||||||||||||||||
| Shares | Amount | Shares | Amount | |||||||||||||||||
| Proceeds from shares issued | ||||||||||||||||||||
Investor Shares | 441,723 | $ | 8,708 | 835,410 | $ | 17,733 | ||||||||||||||
Advisor Shares | 751,523 | 15,486 | 260,651 | 5,428 | ||||||||||||||||
Institutional Shares | 2,214,973 | 45,023 | 7,220,727 | 149,718 | ||||||||||||||||
| Net asset value of shares issued in reinvestment of dividends and distributions | ||||||||||||||||||||
Investor Shares | 213,639 | 4,734 | 58,724 | 1,141 | ||||||||||||||||
Advisor Shares | 71,423 | 1,585 | 21,563 | 419 | ||||||||||||||||
Institutional Shares | 907,373 | 20,198 | 169,415 | 3,295 | ||||||||||||||||
| Cost of shares redeemed | ||||||||||||||||||||
Investor Shares | (800,050 | ) | (14,980 | ) | (3,926,010 | ) | (77,149 | ) | ||||||||||||
Advisor Shares | (739,039 | ) | (12,743 | ) | (488,202 | ) | (10,055 | ) | ||||||||||||
Institutional Shares | (2,035,430 | ) | (34,947 | ) | (275,487 | ) | (5,959 | ) | ||||||||||||
| Net increase from fund share transactions | ||||||||||||||||||||
Investor Shares | (144,688 | ) | (1,538 | ) | (3,031,876 | ) | (58,275 | ) | ||||||||||||
Advisor Shares | 83,907 | 4,328 | (205,988 | ) | (4,208 | ) | ||||||||||||||
Institutional Shares | 1,086,916 | 30,274 | 7,114,655 | 147,054 | ||||||||||||||||
| Artisan Partners Funds | 147 |
NOTES TO FINANCIAL STATEMENTS
| GLOBAL EQUITY | ||||||||||||||||||||
| Year Ended 9/30/2022 | Year Ended 9/30/2021 | |||||||||||||||||||
| Shares | Amount | Shares | Amount | |||||||||||||||||
| Proceeds from shares issued | ||||||||||||||||||||
Investor Shares | 363,512 | $ | 6,926 | 904,092 | $ | 21,779 | ||||||||||||||
Advisor Shares | 284,081 | 4,849 | 83,022 | 1,987 | ||||||||||||||||
Institutional Shares | 1,987,292 | 33,399 | 2,694,888 | 63,930 | ||||||||||||||||
| Net asset value of shares issued in reinvestment of dividends and distributions | ||||||||||||||||||||
Investor Shares | 1,087,193 | 22,418 | 732,806 | 16,107 | ||||||||||||||||
Advisor Shares | 104,739 | 2,161 | 71,608 | 1,575 | ||||||||||||||||
Institutional Shares | 1,026,998 | 21,464 | 564,180 | 12,514 | ||||||||||||||||
| Cost of shares redeemed | ||||||||||||||||||||
Investor Shares | (2,958,596 | ) | (54,061 | ) | (1,297,221 | ) | (31,024 | ) | ||||||||||||
Advisor Shares | (688,532 | ) | (11,692 | ) | (139,489 | ) | (3,403 | ) | ||||||||||||
Institutional Shares | (2,467,539 | ) | (45,052 | ) | (1,159,022 | ) | (27,394 | ) | ||||||||||||
| Net increase (decrease) from fund share transactions | ||||||||||||||||||||
Investor Shares | (1,507,891 | ) | (24,717 | ) | 339,677 | 6,862 | ||||||||||||||
Advisor Shares | (299,712 | ) | (4,682 | ) | 15,141 | 159 | ||||||||||||||
Institutional Shares | 546,751 | 9,811 | 2,100,046 | 49,050 | ||||||||||||||||
| GLOBAL OPPORTUNITIES | ||||||||||||||||||||
| Year Ended 9/30/2022 | Year Ended 9/30/2021 | |||||||||||||||||||
| Shares | Amount | Shares | Amount | |||||||||||||||||
| Proceeds from shares issued | ||||||||||||||||||||
Investor Shares | 4,275,468 | $ | 137,036 | 7,534,061 | $ | 276,699 | ||||||||||||||
Advisor Shares | 6,618,480 | 211,795 | 10,297,748 | 382,378 | ||||||||||||||||
Institutional Shares | 10,812,675 | 360,106 | 13,722,463 | 522,472 | ||||||||||||||||
| Net asset value of shares issued in reinvestment of dividends and distributions | ||||||||||||||||||||
Investor Shares | 3,998,126 | 148,890 | 2,661,867 | 91,169 | ||||||||||||||||
Advisor Shares | 3,000,905 | 112,774 | 1,779,172 | 61,346 | ||||||||||||||||
Institutional Shares | 7,348,834 | 279,991 | 4,344,622 | 151,540 | ||||||||||||||||
| Cost of shares redeemed | ||||||||||||||||||||
Investor Shares | (14,827,587 | ) | (451,998 | ) | (10,400,955 | ) | (382,405 | ) | ||||||||||||
Advisor Shares | (15,991,074 | ) | (491,833 | ) | (7,521,324 | ) | (279,779 | ) | ||||||||||||
Institutional Shares | (21,811,032 | ) | (713,959 | ) | (13,122,821 | ) | (489,845 | ) | ||||||||||||
| Net increase (decrease) from fund share transactions | ||||||||||||||||||||
Investor Shares | (6,553,993 | ) | (166,072 | ) | (205,027 | ) | (14,537 | ) | ||||||||||||
Advisor Shares | (6,371,689 | ) | (167,264 | ) | 4,555,596 | 163,945 | ||||||||||||||
Institutional Shares | (3,649,523 | ) | (73,862 | ) | 4,944,264 | 184,167 | ||||||||||||||
| GLOBAL UNCONSTRAINED | ||||||||||||||||||||
| Period Ended 9/30/2022(3) | ||||||||||||||||||||
| Shares | Amount | |||||||||||||||||||
| Proceeds from shares issued | ||||||||||||||||||||
Investor Shares | 45,885 | $ | 463 | |||||||||||||||||
Advisor Shares | 196,899 | 1,967 | ||||||||||||||||||
Institutional Shares | 1,230,442 | 12,315 | ||||||||||||||||||
| Net asset value of shares issued in reinvestment of dividends and distributions | ||||||||||||||||||||
Investor Shares | 294 | 3 | ||||||||||||||||||
Advisor Shares | 2,040 | 20 | ||||||||||||||||||
Institutional Shares | 13,686 | 137 | �� | |||||||||||||||||
| Cost of shares redeemed | ||||||||||||||||||||
Investor Shares | (19 | ) | — | |||||||||||||||||
Institutional Shares | (1,917 | ) | (19 | ) | ||||||||||||||||
| Net increase from fund share transactions | ||||||||||||||||||||
Investor Shares | 46,160 | 466 | ||||||||||||||||||
Advisor Shares | 198,939 | 1,987 | ||||||||||||||||||
Institutional Shares | 1,242,211 | 12,433 | ||||||||||||||||||
| 148 | Artisan Partners Funds |
NOTES TO FINANCIAL STATEMENTS
| GLOBAL VALUE | ||||||||||||||||||||
| Year Ended 9/30/2022 | Year Ended 9/30/2021 | |||||||||||||||||||
| Shares | Amount | Shares | Amount | |||||||||||||||||
| Proceeds from shares issued | ||||||||||||||||||||
Investor Shares | 1,486,945 | $ | 29,522 | 1,479,158 | $ | 31,253 | ||||||||||||||
Advisor Shares | 3,990,120 | 77,572 | 2,543,546 | 53,069 | ||||||||||||||||
Institutional Shares | 21,133,681 | 396,244 | 23,752,376 | 495,788 | ||||||||||||||||
| Net asset value of shares issued in reinvestment of dividends and distributions | ||||||||||||||||||||
Investor Shares | 1,169,733 | 23,816 | 7,554 | 141 | ||||||||||||||||
Advisor Shares | 1,363,221 | 27,701 | 12,545 | 233 | ||||||||||||||||
Institutional Shares | 7,107,819 | 144,786 | 157,821 | 2,943 | ||||||||||||||||
| Cost of shares redeemed | ||||||||||||||||||||
Investor Shares | (3,171,851 | ) | (61,381 | ) | (3,400,424 | ) | (66,559 | ) | ||||||||||||
Advisor Shares | (3,983,122 | ) | (74,999 | ) | (3,869,572 | ) | (74,325 | ) | ||||||||||||
Institutional Shares | (27,007,128 | ) | (511,902 | ) | (20,531,693 | ) | (421,990 | ) | ||||||||||||
| Net increase from fund share transactions | ||||||||||||||||||||
Investor Shares | (515,173 | ) | (8,043 | ) | (1,913,712 | ) | (35,165 | ) | ||||||||||||
Advisor Shares | 1,370,219 | 30,274 | (1,313,481 | ) | (21,023 | ) | ||||||||||||||
Institutional Shares | 1,234,372 | 29,128 | 3,378,504 | 76,741 | ||||||||||||||||
| HIGH INCOME | ||||||||||||||||||||
| Year Ended 9/30/2022 | Year Ended 9/30/2021 | |||||||||||||||||||
| Shares | Amount | Shares | Amount | |||||||||||||||||
| Proceeds from shares issued | ||||||||||||||||||||
Investor Shares | 21,972,142 | $ | 210,935 | 55,384,551 | $ | 557,458 | ||||||||||||||
Advisor Shares | 112,796,323 | 1,065,335 | 127,925,837 | 1,292,736 | ||||||||||||||||
Institutional Shares | 127,041,635 | 1,186,468 | 120,431,802 | 1,227,065 | ||||||||||||||||
| Net asset value of shares issued in reinvestment of dividends and distributions | ||||||||||||||||||||
Investor Shares | 9,043,579 | 86,993 | 7,267,322 | 73,712 | ||||||||||||||||
Advisor Shares | 22,457,803 | 214,298 | 14,085,012 | 142,815 | ||||||||||||||||
Institutional Shares | 13,101,185 | 124,855 | 6,575,203 | 66,709 | ||||||||||||||||
| Cost of shares redeemed(4) | ||||||||||||||||||||
Investor Shares | (81,347,747 | ) | (772,200 | ) | (43,489,922 | ) | (440,258 | ) | ||||||||||||
Advisor Shares | (148,814,020 | ) | (1,401,726 | ) | (63,765,017 | ) | (647,748 | ) | ||||||||||||
Institutional Shares | (77,269,224 | ) | (724,085 | ) | (41,517,109 | ) | (421,144 | ) | ||||||||||||
| Net increase (decrease) from fund share transactions | ||||||||||||||||||||
Investor Shares | (50,332,026 | ) | (474,272 | ) | 19,161,951 | 190,912 | ||||||||||||||
Advisor Shares | (13,559,894 | ) | (122,093 | ) | 78,245,832 | 787,803 | ||||||||||||||
Institutional Shares | 62,873,596 | 587,238 | 85,489,896 | 872,630 | ||||||||||||||||
| Redemption Fees | ||||||||||||||||||||
Investor Shares | 116 | 141 | ||||||||||||||||||
Advisor Shares | 275 | 100 | ||||||||||||||||||
Institutional Shares | 80 | 57 | ||||||||||||||||||
| INTERNATIONAL | ||||||||||||||||||||
| Year Ended 9/30/2022 | Year Ended 9/30/2021 | |||||||||||||||||||
| Shares | Amount | Shares | Amount | |||||||||||||||||
| Proceeds from shares issued | ||||||||||||||||||||
Investor Shares | 4,878,673 | $ | 134,566 | 5,462,779 | $ | 194,169 | ||||||||||||||
Advisor Shares | 9,078,191 | 245,647 | 7,454,600 | 265,316 | ||||||||||||||||
Institutional Shares | 25,657,363 | 704,771 | 17,719,715 | 642,154 | ||||||||||||||||
| Net asset value of shares issued in reinvestment of dividends and distributions | ||||||||||||||||||||
Investor Shares | 18,624,907 | 557,071 | 3,066,146 | 101,796 | ||||||||||||||||
Advisor Shares | 9,803,061 | 291,935 | 1,673,800 | 55,369 | ||||||||||||||||
Institutional Shares | 25,644,328 | 771,381 | 4,262,711 | 142,161 | ||||||||||||||||
| Cost of shares redeemed | ||||||||||||||||||||
Investor Shares | (30,595,419 | ) | (830,194 | ) | (21,775,860 | ) | (777,322 | ) | ||||||||||||
Advisor Shares | (26,103,285 | ) | (712,537 | ) | (17,032,578 | ) | (613,734 | ) | ||||||||||||
Institutional Shares | (61,890,825 | ) | (1,648,129 | ) | (31,289,891 | ) | (1,117,578 | ) | ||||||||||||
| Net increase (decrease) from fund share transactions | ||||||||||||||||||||
Investor Shares | (7,091,839 | ) | (138,557 | ) | (13,246,935 | ) | (481,357 | ) | ||||||||||||
Advisor Shares | (7,222,033 | ) | (174,955 | ) | (7,904,178 | ) | (293,049 | ) | ||||||||||||
Institutional Shares | (10,589,134 | ) | (171,977 | ) | (9,307,465 | ) | (333,263 | ) | ||||||||||||
| Artisan Partners Funds | 149 |
NOTES TO FINANCIAL STATEMENTS
| INTERNATIONAL EXPLORER | ||||||||||||||||||||
| Period Ended 9/30/2022(5) | ||||||||||||||||||||
| Shares | Amount | |||||||||||||||||||
| Proceeds from shares issued | ||||||||||||||||||||
Advisor Shares | 674,918 | $ | 6,881 | |||||||||||||||||
Institutional Shares | 1,730,893 | 17,443 | ||||||||||||||||||
| Cost of shares redeemed | ||||||||||||||||||||
Advisor Shares | (6,118 | ) | (59 | ) | ||||||||||||||||
Institutional Shares | (36,399 | ) | (362 | ) | ||||||||||||||||
| Net increase from fund share transactions | ||||||||||||||||||||
Advisor Shares | 668,800 | 6,822 | ||||||||||||||||||
Institutional Shares | 1,694,494 | 17,081 | ||||||||||||||||||
| INTERNATIONAL SMALL-MID | ||||||||||||||||||||
| Year Ended 9/30/2022 | Year Ended 9/30/2021 | |||||||||||||||||||
| Shares | Amount | Shares | Amount | |||||||||||||||||
| Proceeds from shares issued | ||||||||||||||||||||
Investor Shares | 4,161,258 | $ | 72,617 | 7,655,492 | $ | 155,986 | ||||||||||||||
Advisor Shares | 27,893,529 | 477,225 | 35,223,112 | 704,592 | ||||||||||||||||
Institutional Shares | 49,845,304 | 876,465 | 108,981,913 | 2,173,232 | ||||||||||||||||
| Net asset value of shares issued in reinvestment of dividends and distributions | ||||||||||||||||||||
Investor Shares | 688,580 | 14,109 | 131,370 | 2,441 | ||||||||||||||||
Advisor Shares | 2,266,734 | 46,559 | 462,919 | 8,606 | ||||||||||||||||
Institutional Shares | 4,721,866 | 98,120 | 913,605 | 17,158 | ||||||||||||||||
| Cost of shares redeemed | ||||||||||||||||||||
Investor Shares | (8,256,751 | ) | (141,622 | ) | (5,792,240 | ) | (117,810 | ) | ||||||||||||
Advisor Shares | (34,331,388 | ) | (574,051 | ) | (18,750,530 | ) | (387,229 | ) | ||||||||||||
Institutional Shares | (58,593,168 | ) | (996,877 | ) | (33,013,409 | ) | (691,675 | ) | ||||||||||||
| Net increase (decrease) from fund share transactions | ||||||||||||||||||||
Investor Shares | (3,406,913 | ) | (54,896 | ) | 1,994,622 | 40,617 | ||||||||||||||
Advisor Shares | (4,171,125 | ) | (50,267 | ) | 16,935,501 | 325,969 | ||||||||||||||
Institutional Shares | (4,025,998 | ) | (22,292 | ) | 76,882,109 | 1,498,715 | ||||||||||||||
| INTERNATIONAL VALUE | ||||||||||||||||||||
| Year Ended 9/30/2022 | Year Ended 9/30/2021 | |||||||||||||||||||
| Shares | Amount | Shares | Amount | |||||||||||||||||
| Proceeds from shares issued | ||||||||||||||||||||
Investor Shares | 8,291,428 | $ | 328,863 | 10,029,416 | $ | 425,123 | ||||||||||||||
Advisor Shares | 60,092,836 | 2,405,960 | 60,101,745 | 2,587,653 | ||||||||||||||||
Institutional Shares | 146,452,838 | 6,097,063 | 101,375,505 | 4,247,502 | ||||||||||||||||
| Net asset value of shares issued in reinvestment of dividends and distributions | ||||||||||||||||||||
Investor Shares | 5,974,617 | 251,146 | 531,957 | 19,709 | ||||||||||||||||
Advisor Shares | 11,140,147 | 465,887 | 930,063 | 34,394 | ||||||||||||||||
Institutional Shares | 30,721,316 | 1,289,424 | 2,304,030 | 85,572 | ||||||||||||||||
| Cost of shares redeemed | ||||||||||||||||||||
Investor Shares | (13,135,629 | ) | (518,863 | ) | (9,439,061 | ) | (393,232 | ) | ||||||||||||
Advisor Shares | (64,767,550 | ) | (2,725,845 | ) | (35,243,375 | ) | (1,383,978 | ) | ||||||||||||
Institutional Shares | (70,332,385 | ) | (2,796,686 | ) | (46,260,265 | ) | (1,937,698 | ) | ||||||||||||
| Net increase from fund share transactions | ||||||||||||||||||||
Investor Shares | 1,130,416 | 61,146 | 1,122,312 | 51,600 | ||||||||||||||||
Advisor Shares | 6,465,433 | 146,002 | 25,788,433 | 1,238,069 | ||||||||||||||||
Institutional Shares | 106,841,769 | 4,589,801 | 57,419,270 | 2,395,376 | ||||||||||||||||
| 150 | Artisan Partners Funds |
NOTES TO FINANCIAL STATEMENTS
| MID CAP | ||||||||||||||||||||
| Year Ended 9/30/2022 | Year Ended 9/30/2021 | |||||||||||||||||||
| Shares | Amount | Shares | Amount | |||||||||||||||||
| Proceeds from shares issued | ||||||||||||||||||||
Investor Shares | 7,385,851 | $ | 288,438 | 9,025,373 | $ | 438,653 | ||||||||||||||
Advisor Shares | 7,488,704 | 286,518 | 6,642,387 | 333,096 | ||||||||||||||||
Institutional Shares | 14,203,132 | 642,122 | 13,788,210 | 786,484 | ||||||||||||||||
| Net asset value of shares issued in reinvestment of dividends and distributions | ||||||||||||||||||||
Investor Shares | 7,472,214 | 341,032 | 6,218,417 | 272,802 | ||||||||||||||||
Advisor Shares | 3,050,814 | 141,832 | 2,257,342 | 100,452 | ||||||||||||||||
Institutional Shares | 8,489,882 | 461,850 | 8,473,419 | 430,789 | ||||||||||||||||
| Cost of shares redeemed | ||||||||||||||||||||
Investor Shares | (12,920,194 | ) | (504,849 | ) | (12,533,182 | ) | (619,596 | ) | ||||||||||||
Advisor Shares | (7,888,493 | ) | (299,371 | ) | (5,633,184 | ) | (284,582 | ) | ||||||||||||
Institutional Shares | (20,078,294 | ) | (878,409 | ) | (31,623,027 | ) | (1,828,558 | ) | ||||||||||||
| Net increase (decrease) from fund share transactions | ||||||||||||||||||||
Investor Shares | 1,937,871 | 124,621 | 2,710,608 | 91,859 | ||||||||||||||||
Advisor Shares | 2,651,025 | 128,979 | 3,266,545 | 148,966 | ||||||||||||||||
Institutional Shares | 2,614,720 | 225,563 | (9,361,398 | ) | (611,285 | ) | ||||||||||||||
| MID CAP VALUE | ||||||||||||||||||||
| Year Ended 9/30/2022 | Year Ended 9/30/2021 | |||||||||||||||||||
| Shares | Amount | Shares | Amount | |||||||||||||||||
| Proceeds from shares issued | ||||||||||||||||||||
Investor Shares | 3,346,819 | $ | 71,410 | 3,967,470 | $ | 86,121 | ||||||||||||||
Advisor Shares | 2,617,668 | 52,809 | 2,469,192 | 52,725 | ||||||||||||||||
Institutional Shares | 2,436,382 | 50,058 | 2,813,174 | 59,986 | ||||||||||||||||
| Net asset value of shares issued in reinvestment of dividends and distributions | ||||||||||||||||||||
Investor Shares | 3,275,188 | 69,860 | 488,090 | 9,191 | ||||||||||||||||
Advisor Shares | 3,337,333 | 70,918 | 627,069 | 11,764 | ||||||||||||||||
Institutional Shares | 4,507,359 | 95,826 | 746,328 | 14,009 | ||||||||||||||||
| Cost of shares redeemed | ||||||||||||||||||||
Investor Shares | (13,701,582 | ) | (267,761 | ) | (7,757,410 | ) | (161,521 | ) | ||||||||||||
Advisor Shares | (6,559,601 | ) | (136,708 | ) | (11,106,520 | ) | (234,773 | ) | ||||||||||||
Institutional Shares | (10,527,284 | ) | (223,157 | ) | (7,759,522 | ) | (162,434 | ) | ||||||||||||
| Net increase (decrease) from fund share transactions | ||||||||||||||||||||
Investor Shares | (7,079,575 | ) | (126,491 | ) | (3,301,850 | ) | (66,209 | ) | ||||||||||||
Advisor Shares | (604,600 | ) | (12,981 | ) | (8,010,259 | ) | (170,284 | ) | ||||||||||||
Institutional Shares | (3,583,543 | ) | (77,273 | ) | (4,200,020 | ) | (88,439 | ) | ||||||||||||
| SELECT EQUITY | ||||||||||||||||||||
| Year Ended 9/30/2022 | Year Ended 9/30/2021 | |||||||||||||||||||
| Shares | Amount | Shares | Amount | |||||||||||||||||
| Proceeds from shares issued | ||||||||||||||||||||
Investor Shares | 35,252 | $ | 452 | 164,281 | $ | 2,119 | ||||||||||||||
Advisor Shares | 20,516 | 206 | 62,236 | 862 | ||||||||||||||||
Institutional Shares | 1,091,230 | 13,142 | 370,623 | 4,840 | ||||||||||||||||
| Net asset value of shares issued in reinvestment of dividends and distributions | ||||||||||||||||||||
Investor Shares | 10,699 | 142 | - | - | ||||||||||||||||
Advisor Shares | 6,464 | 86 | - | - | ||||||||||||||||
Institutional Shares | 74,662 | 987 | 5,760 | 67 | ||||||||||||||||
| Cost of shares redeemed | ||||||||||||||||||||
Investor Shares | (24,326 | ) | (298 | ) | (44,311 | ) | (578 | ) | ||||||||||||
Advisor Shares | (917 | ) | (11 | ) | (6,471 | ) | (83 | ) | ||||||||||||
Institutional Shares | (33,527 | ) | (408 | ) | (1,685 | ) | (21 | ) | ||||||||||||
| Net increase from fund share transactions | ||||||||||||||||||||
Investor Shares | 21,625 | 296 | 119,970 | 1,541 | ||||||||||||||||
Advisor Shares | 26,063 | 281 | 55,765 | 779 | ||||||||||||||||
Institutional Shares | 1,132,365 | 13,721 | 374,698 | 4,886 | ||||||||||||||||
| Artisan Partners Funds | 151 |
NOTES TO FINANCIAL STATEMENTS
| SMALL CAP | ||||||||||||||||||||
| Year Ended 9/30/2022 | Year Ended 9/30/2021 | |||||||||||||||||||
| Shares | Amount | Shares | Amount | |||||||||||||||||
| Proceeds from shares issued | ||||||||||||||||||||
Investor Shares | 3,256,368 | $ | 118,733 | 6,975,309 | $ | 353,733 | ||||||||||||||
Advisor Shares | 10,094,246 | 357,099 | 12,032,064 | 616,553 | ||||||||||||||||
Institutional Shares | 11,286,868 | 402,996 | 11,886,909 | 607,621 | ||||||||||||||||
| Net asset value of shares issued in reinvestment of dividends and distributions | ||||||||||||||||||||
Investor Shares | 2,406,177 | 104,067 | 1,229,720 | 57,034 | ||||||||||||||||
Advisor Shares | 2,969,408 | 129,469 | 1,341,078 | 62,575 | ||||||||||||||||
Institutional Shares | 2,704,864 | 120,637 | 1,135,482 | 54,015 | ||||||||||||||||
| Cost of shares redeemed | ||||||||||||||||||||
Investor Shares | (6,753,630 | ) | (245,803 | ) | (7,514,944 | ) | (375,163 | ) | ||||||||||||
Advisor Shares | (26,304,832 | ) | (847,310 | ) | (10,460,652 | ) | (528,644 | ) | ||||||||||||
Institutional Shares | (14,875,744 | ) | (520,695 | ) | (6,692,828 | ) | (342,082 | ) | ||||||||||||
| Net increase (decrease) from fund share transactions | ||||||||||||||||||||
Investor Shares | (1,091,085 | ) | (23,003 | ) | 690,085 | 35,604 | ||||||||||||||
Advisor Shares | (13,241,178 | ) | (360,742 | ) | 2,912,490 | 150,484 | ||||||||||||||
Institutional Shares | (884,012 | ) | 2,938 | 6,329,563 | 319,554 | |||||||||||||||
| SUSTAINABLE EMERGING MARKETS | ||||||||||||||||||||
| Year Ended 9/30/2022 | Year Ended 9/30/2021 | |||||||||||||||||||
| Shares | Amount | Shares | Amount | |||||||||||||||||
| Proceeds from shares issued | ||||||||||||||||||||
Investor Shares | 662,977 | $ | 11,430 | 657,786 | $ | 13,258 | ||||||||||||||
Advisor Shares(6) | 2,174,780 | 30,102 | - | - | ||||||||||||||||
Institutional Shares | 1,405,810 | 24,249 | 267,808 | 5,414 | ||||||||||||||||
| Net asset value of shares issued in reinvestment of dividends and distributions | ||||||||||||||||||||
Investor Shares | 33,599 | 659 | 48,964 | 898 | ||||||||||||||||
Institutional Shares | 4,462 | 89 | 4,929 | 92 | ||||||||||||||||
| Cost of shares redeemed | ||||||||||||||||||||
Investor Shares | (2,930,208 | ) | (41,929 | ) | (326,496 | ) | (6,341 | ) | ||||||||||||
Advisor Shares(6) | (20,477 | ) | (280 | ) | - | - | ||||||||||||||
Institutional Shares | (56,922 | ) | (940 | ) | (176,300 | ) | (3,685 | ) | ||||||||||||
| Net increase from fund share transactions | ||||||||||||||||||||
Investor Shares | (2,233,632 | ) | (29,840 | ) | 380,254 | 7,815 | ||||||||||||||
Advisor Shares(6) | 2,154,303 | 29,822 | - | - | ||||||||||||||||
Institutional Shares | 1,353,350 | 23,398 | 96,437 | 1,821 | ||||||||||||||||
| VALUE | ||||||||||||||||||||
| Year Ended 9/30/2022 | Year Ended 9/30/2021 | |||||||||||||||||||
| Shares | Amount | Shares | Amount | |||||||||||||||||
| Proceeds from shares issued | ||||||||||||||||||||
Investor Shares | 856,850 | $ | 12,330 | 1,006,655 | $ | 15,999 | ||||||||||||||
Advisor Shares | 799,189 | 11,773 | 1,277,534 | 19,493 | ||||||||||||||||
Institutional Shares | 2,078,297 | 30,020 | 2,938,692 | 44,584 | ||||||||||||||||
| Net asset value of shares issued in reinvestment of dividends and distributions | ||||||||||||||||||||
Investor Shares | 825,284 | 12,297 | 471,369 | 6,359 | ||||||||||||||||
Advisor Shares | 783,355 | 11,601 | 523,044 | 7,019 | ||||||||||||||||
Institutional Shares | 1,198,806 | 17,766 | 661,645 | 8,886 | ||||||||||||||||
| Cost of shares redeemed | ||||||||||||||||||||
Investor Shares | (1,514,916 | ) | (22,102 | ) | (1,151,218 | ) | (17,262 | ) | ||||||||||||
Advisor Shares | (3,166,768 | ) | (44,521 | ) | (2,447,377 | ) | (36,532 | ) | ||||||||||||
Institutional Shares | (5,786,232 | ) | (85,318 | ) | (3,514,364 | ) | (50,901 | ) | ||||||||||||
| Net increase (decrease) from fund share transactions | ||||||||||||||||||||
Investor Shares | 167,218 | 2,525 | 326,806 | 5,096 | ||||||||||||||||
Advisor Shares | (1,584,224 | ) | (21,147 | ) | (646,799 | ) | (10,020 | ) | ||||||||||||
Institutional Shares | (2,509,129 | ) | (37,532 | ) | 85,973 | 2,569 | ||||||||||||||
| 152 | Artisan Partners Funds |
NOTES TO FINANCIAL STATEMENTS
| VALUE INCOME | ||||||||||||||||||||
| Period Ended 9/30/2022(7) | ||||||||||||||||||||
| Shares | Amount | |||||||||||||||||||
| Proceeds from shares issued | ||||||||||||||||||||
Investor Shares | 110,107 | $ | 1,067 | |||||||||||||||||
Advisor Shares | 142,757 | 1,376 | ||||||||||||||||||
Institutional Shares | 876,184 | 8,756 | ||||||||||||||||||
| Net asset value of shares issued in reinvestment of dividends and distributions | ||||||||||||||||||||
Investor Shares | 1,389 | 12 | ||||||||||||||||||
Advisor Shares | 2,039 | 18 | ||||||||||||||||||
Institutional Shares | 15,001 | 131 | ||||||||||||||||||
| Cost of shares redeemed | ||||||||||||||||||||
Investor Shares | (21,611 | ) | (195 | ) | ||||||||||||||||
Advisor Shares | (276 | ) | (2 | ) | ||||||||||||||||
Institutional Shares | (8,723 | ) | (76 | ) | ||||||||||||||||
| Net increase from fund share transactions | ||||||||||||||||||||
Investor Shares | 89,885 | 884 | ||||||||||||||||||
Advisor Shares | 144,520 | 1,392 | ||||||||||||||||||
Institutional Shares | 882,462 | 8,811 | ||||||||||||||||||
1. For the period from commencement of operations (April 7, 2022) through September 30, 2022. 2. For the period from commencement of operations (December 1, 2021) through September 30, 2022. 3. For the period from commencement of operations (March 31, 2022) through September 30, 2022. 4. Net of redemption fees. 5. For the period from commencement of operations (May 16, 2022) through September 30, 2022. 6. For the period from commencement of operations (April 25, 2022) through September 30, 2022. 7. For the period from commencement of operations (February 28, 2022) through September 30, 2022. | ||||||||||||||||||||
| (13) | Accounting Pronouncements: |
In March 2020, the FASB issued Accounting Standards Update 2020-04, Reference Rate Reform (Topic 848) – Facilitation of the Effects of Reference Rate Reform on Financial Reporting (“ASU 2020-04”), which provides optional, temporary relief with respect to the financial reporting of contracts subject to certain types of modifications due to the planned discontinuation of certain tenors of the London Interbank Offered Rate (LIBOR) and other LIBOR-based reference rates as of the end of 2021. The temporary relief provided by ASU 2020-04 is effective for certain reference rate-related contract modifications that occur during the period from March 12, 2020 through December 31, 2022. Management is evaluating the impact of ASU 2020-04 on the fund’s investments, derivatives, debt and other contracts that will undergo reference rate-related modifications as a result of the reference rate reform.
| (14) | Subsequent Events: |
The Funds have evaluated subsequent events through the date of issuance of the Funds’ financial statements and have determined there is no impact to the Funds’ financial statements.
| Artisan Partners Funds | 153 |
REPORT OF INDEPENDENT REGISTERED PUBLIC ACCOUNTING FIRM
To the Shareholders and the Board of Directors of Artisan Partners Funds, Inc.
Opinion on the Financial Statements
We have audited the accompanying statements of assets and liabilities of Artisan Partners Funds, Inc. (comprising Artisan Developing World Fund, Artisan Emerging Markets Debt Opportunities Fund, Artisan Floating Rate Fund, Artisan Focus Fund, Artisan Global Discovery Fund, Artisan Global Equity Fund, Artisan Global Opportunities Fund, Artisan Global Unconstrained Fund, Artisan Global Value Fund, Artisan High Income Fund, Artisan International Fund, Artisan International Explorer Fund, Artisan International Small-Mid Fund, Artisan International Value Fund, Artisan Mid Cap Fund, Artisan Mid Cap Value Fund, Artisan Select Equity, Artisan Small Cap Fund, Artisan Sustainable Emerging Markets Fund, Artisan Value Fund and Artisan Value Income Fund (collectively referred to as the “Funds”)), including the schedules of investments, as of September 30, 2022, and the related statements of operations, changes in net assets, and the financial highlights for each of the periods indicated in the table below and the related notes (collectively referred to as the “financial statements”). In our opinion, the financial statements present fairly, in all material respects, the financial position of each of the Funds comprising Artisan Partners Funds, Inc. at September 30, 2022, the results of their operations, changes in net assets and financial highlights for each of the periods indicated in the table below, in conformity with U.S. generally accepted accounting principles.
| Funds comprising Artisan Partners Funds, Inc. | Statements of operations | Statements of changes in net assets | Financial highlights | ||||
Artisan Developing World Fund Artisan Focus Fund Artisan Global Discovery Fund Artisan Global Equity Fund Artisan Global Opportunities Fund Artisan Global Value Fund Artisan High Income Fund Artisan International Fund Artisan International Small-Mid Fund Artisan International Value Fund Artisan Mid Cap Fund Artisan Mid Cap Value Fund Artisan Small Cap Fund Artisan Sustainable Emerging Markets Fund Artisan Value Fund | For the year ended September 30, 2022 | For each of the two years in the period ended September 30, 2022 | For each of the five years in the period ended September 30, 2022 | ||||
| Artisan Select Equity Fund | For the year ended September 30, 2022 | For each of the two years in the period ended September 30, 2022 | For each of the two years in the period ended September 30, 2022 and the period from February 28, 2020 (commencement of operations) through September 30, 2020 | ||||
| Artisan Floating Rate Fund | For the period from December 1, 2021 (commencement of operations) through September 30, 2022 | ||||||
| Artisan Value Income Fund | For the period from February 28, 2022 (commencement of operations) through September 30, 2022 | ||||||
| Artisan Global Unconstrained Fund | For the period from March 31, 2022 (commencement of operations) through September 30, 2022 | ||||||
| Artisan Emerging Markets Debt Opportunities Fund | For the period from April 7, 2022 (commencement of operations) through September 30, 2022 | ||||||
| Artisan International Explorer Fund | For the period from May 16, 2022 (commencement of operations) through September 30, 2022 | ||||||
Basis for Opinion
These financial statements are the responsibility of the Funds’ management. Our responsibility is to express an opinion on each of the Fund’s financial statements based on our audits. We are a public accounting firm registered with the Public Company Accounting Oversight Board (United States) (“PCAOB”) and are required to be independent with respect to the Funds in accordance with the U.S. federal securities laws and the applicable rules and regulations of the Securities and Exchange Commission and the PCAOB.
We conducted our audits in accordance with the standards of the PCAOB. Those standards require that we plan and perform the audit to obtain reasonable assurance about whether the financial statements are free of material misstatement, whether due to error or fraud. The Funds are not required to have, nor were we engaged to perform, an audit of the Funds’ internal control over financial reporting. As part of our audits, we are required to obtain an understanding of internal control over financial reporting but not for the purpose of expressing an opinion on the effectiveness of the Funds’ internal control over financial reporting. Accordingly, we express no such opinion.
| 154 | Artisan Partners Funds |
Our audits included performing procedures to assess the risks of material misstatement of the financial statements, whether due to error or fraud, and performing procedures that respond to those risks. Such procedures included examining, on a test basis, evidence regarding the amounts and disclosures in the financial statements. Our procedures included confirmation of securities owned as of September 30, 2022 by correspondence with the custodian, brokers, counterparties and agent banks; when replies were not received from brokers or others, we performed other auditing procedures. Our audits also included evaluating the accounting principles used and significant estimates made by management, as well as evaluating the overall presentation of the financial statements. We believe that our audits provide a reasonable basis for our opinion.

We have served as the auditor of one or more Artisan Partners Funds investment companies since 2003.
Minneapolis, Minnesota
November 28, 2022
| Artisan Partners Funds | 155 |
NOTES TO FINANCIAL STATEMENTS
Other Federal tax information (unaudited):
The Internal Revenue Code requires that shareholders be notified of certain information regarding long-term capital gains, qualified dividend income and the dividends received deduction for corporate shareholders. This data is informational only. Every year in January, shareholders are sent a Form 1099-DIV which provides the federal tax status of dividends and distributions received during the calendar year. Shareholders are advised to consult their own tax advisor with respect to the specific tax consequences of investing in the Funds.
Each Fund hereby designates the following amounts as (i) long-term capital gain distributions for purposes of the dividends paid deduction (including earnings and profits distributed to shareholders on redemption of Fund shares, in thousands), (ii) the amount of ordinary dividends paid during the year ended September 30, 2022 that are considered qualified dividend income as defined in the Jobs and Growth Tax Relief Reconciliation Act of 2003, and (iii) the amount of ordinary dividends paid during the year ended September 30, 2022 that are eligible for the dividends received deduction available to certain corporate shareholders.
| Fund | Long-Term Capital Gains | Qualified Dividend Income | Dividends Received Deduction | ||||||||||||
Developing World | $ | 388,716 | 4.35 | % | 1.24 | % | |||||||||
Emerging Markets Debt Opportunities | N/A | �� | N/A | N/A | |||||||||||
Floating Rate | N/A | N/A | N/A | ||||||||||||
Focus | 17,221 | 4.90 | 3.49 | ||||||||||||
Global Discovery | 19,221 | 19.22 | 5.75 | ||||||||||||
Global Equity | 28,859 | 22.76 | 2.88 | ||||||||||||
Global Opportunities | 553,418 | 100.00 | 37.59 | ||||||||||||
Global Unconstrained | N/A | N/A | N/A | ||||||||||||
Global Value | 207,234 | 100.00 | 37.72 | ||||||||||||
High Income | 44,189 | N/A | N/A | ||||||||||||
International | 1,470,958 | 39.78 | N/A | ||||||||||||
International Explorer | N/A | N/A | N/A | ||||||||||||
International Small-Mid | 128,582 | 100.00 | 0.21 | ||||||||||||
International Value | 1,035,109 | 44.60 | N/A | ||||||||||||
Mid Cap | 999,387 | 10.65 | 12.36 | ||||||||||||
Mid Cap Value | 264,814 | 68.19 | 71.17 | ||||||||||||
Select Equity | 670 | 70.27 | 42.43 | ||||||||||||
Small Cap | 366,277 | 18.07 | 18.12 | ||||||||||||
Sustainable Emerging Markets | N/A | 100.00 | N/A | ||||||||||||
Value | 45,636 | 90.43 | 70.52 | ||||||||||||
Value Income | N/A | 100.00 | 86.23 | ||||||||||||
| 156 | Artisan Partners Funds |
SHAREHOLDER EXPENSE EXAMPLE (UNAUDITED)
As a shareholder of Artisan Partners Funds, you may incur transaction costs, including redemption fees, and you will incur ongoing costs, including management fees and other Fund expenses. This example is intended to help you understand your ongoing costs (in dollars) of investing in a Fund and to compare these costs with the ongoing costs of investing in other mutual funds.
The example is based on an investment of $1,000 invested at the beginning of the period and held for the entire period from April 1, 2022 to September 30, 2022.
Actual Expenses
The first line under the name of each Fund in the table below provides information about actual account values and actual expenses. You may use the information in this line, together with the amount you invested, to estimate the expenses that you paid over the period. Simply divide your account value by $1,000 (for example, an $8,600 account value divided by $1,000 = 8.6), then multiply the result by the number in the first line under the name of your Fund under the heading entitled “Expenses Paid During Period” to estimate the expenses you paid on your account during this period.
Hypothetical Example for Comparison Purposes
The second line under each Fund’s name in the table below provides information about hypothetical account values and hypothetical expenses based on each Fund’s actual expense ratio for the six months ended September 30, 2022 and an assumed rate of return of 5% per year before expenses, which is not the Fund’s actual return. The hypothetical account values and expenses may not be used to estimate the actual ending account balances or expenses you paid for the period. You may use this information to compare the ongoing costs of investing in each Fund and other funds. To do so, compare the 5% hypothetical example with the 5% hypothetical examples that appear in the shareholder reports of the other funds.
Please note that the expenses shown in the table are meant to highlight your ongoing costs only and do not reflect any transactional costs, such as redemption fees. Therefore, the second line of the table is useful in comparing ongoing costs only, and will not help you determine the relative costs of owning different funds. If these transactional costs were included, your costs would have been higher.
| Beginning Account Value 4/1/2022 | Ending Account Value 9/30/2022 | Expenses Paid During Period 4/1/2022-9/30/2022(1) | Expense Ratio(2)(3) | |||||||||||||||||
Artisan Developing World Fund | ||||||||||||||||||||
Investor Shares | ||||||||||||||||||||
Actual | $ | 1,000.00 | $ | 687.50 | $ | 5.46 | 1.29 | % | ||||||||||||
Hypothetical (5% return before expenses) | $ | 1,000.00 | $ | 1,018.60 | $ | 6.53 | 1.29 | % | ||||||||||||
Advisor Shares | ||||||||||||||||||||
Actual | $ | 1,000.00 | $ | 687.80 | $ | 4.78 | 1.13 | % | ||||||||||||
Hypothetical (5% return before expenses) | $ | 1,000.00 | $ | 1,019.40 | $ | 5.72 | 1.13 | % | ||||||||||||
Institutional Shares | ||||||||||||||||||||
Actual | $ | 1,000.00 | $ | 688.10 | $ | 4.44 | 1.05 | % | ||||||||||||
Hypothetical (5% return before expenses) | $ | 1,000.00 | $ | 1,019.80 | $ | 5.32 | 1.05 | % | ||||||||||||
Artisan Emerging Markets Debt Opportunities Fund | ||||||||||||||||||||
Investor Shares | ||||||||||||||||||||
Actual(4) | $ | 1,000.00 | $ | 982.80 | $ | 5.98 | 1.25 | % | ||||||||||||
Hypothetical (5% return before expenses) | $ | 1,000.00 | $ | 1,018.80 | $ | 6.33 | 1.25 | % | ||||||||||||
Advisor Shares | ||||||||||||||||||||
Actual(4) | $ | 1,000.00 | $ | 982.20 | $ | 5.50 | 1.15 | % | ||||||||||||
Hypothetical (5% return before expenses) | $ | 1,000.00 | $ | 1,019.30 | $ | 5.82 | 1.15 | % | ||||||||||||
Institutional Shares | ||||||||||||||||||||
Actual(4) | $ | 1,000.00 | $ | 983.50 | $ | 5.26 | 1.10 | % | ||||||||||||
Hypothetical (5% return before expenses) | $ | 1,000.00 | $ | 1,019.55 | $ | 5.57 | 1.10 | % | ||||||||||||
Artisan Floating Rate Fund | ||||||||||||||||||||
Investor Shares | ||||||||||||||||||||
Actual | $ | 1,000.00 | $ | 969.70 | $ | 5.93 | 1.20 | % | ||||||||||||
Hypothetical (5% return before expenses) | $ | 1,000.00 | $ | 1,019.05 | $ | 6.07 | 1.20 | % | ||||||||||||
Advisor Shares | ||||||||||||||||||||
Actual | $ | 1,000.00 | $ | 970.30 | $ | 5.43 | 1.10 | % | ||||||||||||
Hypothetical (5% return before expenses) | $ | 1,000.00 | $ | 1,019.55 | $ | 5.57 | 1.10 | % | ||||||||||||
Institutional Shares | ||||||||||||||||||||
Actual | $ | 1,000.00 | $ | 970.60 | $ | 5.19 | 1.05 | % | ||||||||||||
Hypothetical (5% return before expenses) | $ | 1,000.00 | $ | 1,019.80 | $ | 5.32 | 1.05 | % | ||||||||||||
| Artisan Partners Funds | 157 |
SHAREHOLDER EXPENSE EXAMPLE (UNAUDITED)
| Beginning Account Value 4/1/2022 | Ending Account Value 9/30/2022 | Expenses Paid During Period 4/1/2022-9/30/2022(1) | Expense Ratio(2)(3) | |||||||||||||||||
Artisan Focus Fund | ||||||||||||||||||||
Investor Shares | ||||||||||||||||||||
Actual | $ | 1,000.00 | $ | 789.80 | $ | 5.61 | 1.25 | % | ||||||||||||
Hypothetical (5% return before expenses) | $ | 1,000.00 | $ | 1,018.80 | $ | 6.33 | 1.25 | % | ||||||||||||
Advisor Shares | ||||||||||||||||||||
Actual | $ | 1,000.00 | $ | 790.60 | $ | 4.98 | 1.11 | % | ||||||||||||
Hypothetical (5% return before expenses) | $ | 1,000.00 | $ | 1,019.50 | $ | 5.62 | 1.11 | % | ||||||||||||
Institutional Shares | ||||||||||||||||||||
Actual | $ | 1,000.00 | $ | 790.60 | $ | 4.58 | 1.02 | % | ||||||||||||
Hypothetical (5% return before expenses) | $ | 1,000.00 | $ | 1,019.95 | $ | 5.17 | 1.02 | % | ||||||||||||
Artisan Global Discovery Fund | ||||||||||||||||||||
Investor Shares | ||||||||||||||||||||
Actual | $ | 1,000.00 | $ | 749.90 | $ | 6.14 | 1.40 | % | ||||||||||||
Hypothetical (5% return before expenses) | $ | 1,000.00 | $ | 1,018.05 | $ | 7.08 | 1.40 | % | ||||||||||||
Advisor Shares | ||||||||||||||||||||
Actual | $ | 1,000.00 | $ | 750.30 | $ | 5.70 | 1.30 | % | ||||||||||||
Hypothetical (5% return before expenses) | $ | 1,000.00 | $ | 1,018.55 | $ | 6.58 | 1.30 | % | ||||||||||||
Institutional Shares | ||||||||||||||||||||
Actual | $ | 1,000.00 | $ | 751.20 | $ | 4.70 | 1.07 | % | ||||||||||||
Hypothetical (5% return before expenses) | $ | 1,000.00 | $ | 1,019.70 | $ | 5.42 | 1.07 | % | ||||||||||||
Artisan Global Equity Fund | ||||||||||||||||||||
Investor Shares | ||||||||||||||||||||
Actual | $ | 1,000.00 | $ | 802.60 | $ | 5.78 | 1.28 | % | ||||||||||||
Hypothetical (5% return before expenses) | $ | 1,000.00 | $ | 1,018.65 | $ | 6.48 | 1.28 | % | ||||||||||||
Advisor Shares | ||||||||||||||||||||
Actual | $ | 1,000.00 | $ | 802.10 | $ | 5.65 | 1.25 | % | ||||||||||||
Hypothetical (5% return before expenses) | $ | 1,000.00 | $ | 1,018.80 | $ | 6.33 | 1.25 | % | ||||||||||||
Institutional Shares | ||||||||||||||||||||
Actual | $ | 1,000.00 | $ | 803.10 | $ | 4.70 | 1.04 | % | ||||||||||||
Hypothetical (5% return before expenses) | $ | 1,000.00 | $ | 1,019.85 | $ | 5.27 | 1.04 | % | ||||||||||||
Artisan Global Opportunities Fund | ||||||||||||||||||||
Investor Shares | ||||||||||||||||||||
Actual | $ | 1,000.00 | $ | 761.20 | $ | 5.03 | 1.14 | % | ||||||||||||
Hypothetical (5% return before expenses) | $ | 1,000.00 | $ | 1,019.35 | $ | 5.77 | 1.14 | % | ||||||||||||
Advisor Shares | ||||||||||||||||||||
Actual | $ | 1,000.00 | $ | 761.90 | $ | 4.46 | 1.01 | % | ||||||||||||
Hypothetical (5% return before expenses) | $ | 1,000.00 | $ | 1,020.00 | $ | 5.11 | 1.01 | % | ||||||||||||
Institutional Shares | ||||||||||||||||||||
Actual | $ | 1,000.00 | $ | 762.20 | $ | 4.02 | 0.91 | % | ||||||||||||
Hypothetical (5% return before expenses) | $ | 1,000.00 | $ | 1,020.51 | $ | 4.61 | 0.91 | % | ||||||||||||
Artisan Global Unconstrained Fund | ||||||||||||||||||||
Investor Shares | ||||||||||||||||||||
Actual | $ | 1,000.00 | $ | 1,021.00 | $ | 7.35 | 1.45 | % | ||||||||||||
Hypothetical (5% return before expenses) | $ | 1,000.00 | $ | 1,017.80 | $ | 7.33 | 1.45 | % | ||||||||||||
Advisor Shares | ||||||||||||||||||||
Actual | $ | 1,000.00 | $ | 1,022.40 | $ | 6.84 | 1.35 | % | ||||||||||||
Hypothetical (5% return before expenses) | $ | 1,000.00 | $ | 1,018.30 | $ | 6.83 | 1.35 | % | ||||||||||||
Institutional Shares | ||||||||||||||||||||
Actual | $ | 1,000.00 | $ | 1,022.70 | $ | 6.59 | 1.30 | % | ||||||||||||
Hypothetical (5% return before expenses) | $ | 1,000.00 | $ | 1,018.55 | $ | 6.58 | 1.30 | % | ||||||||||||
| 158 | Artisan Partners Funds |
SHAREHOLDER EXPENSE EXAMPLE (UNAUDITED)
| Beginning Account Value 4/1/2022 | Ending Account Value 9/30/2022 | Expenses Paid During Period 4/1/2022-9/30/2022(1) | Expense Ratio(2)(3) | |||||||||||||||||
Artisan Global Value Fund | ||||||||||||||||||||
Investor Shares | ||||||||||||||||||||
Actual | $ | 1,000.00 | $ | 778.00 | $ | 5.57 | 1.25 | % | ||||||||||||
Hypothetical (5% return before expenses) | $ | 1,000.00 | $ | 1,018.80 | $ | 6.33 | 1.25 | % | ||||||||||||
Advisor Shares | ||||||||||||||||||||
Actual | $ | 1,000.00 | $ | 778.70 | $ | 4.99 | 1.12 | % | ||||||||||||
Hypothetical (5% return before expenses) | $ | 1,000.00 | $ | 1,019.45 | $ | 5.67 | 1.12 | % | ||||||||||||
Institutional Shares | ||||||||||||||||||||
Actual | $ | 1,000.00 | $ | 778.80 | $ | 4.55 | 1.02 | % | ||||||||||||
Hypothetical (5% return before expenses) | $ | 1,000.00 | $ | 1,019.95 | $ | 5.17 | 1.02 | % | ||||||||||||
Artisan High Income Fund | ||||||||||||||||||||
Investor Shares | ||||||||||||||||||||
Actual | $ | 1,000.00 | $ | 899.10 | $ | 4.48 | 0.94 | % | ||||||||||||
Hypothetical (5% return before expenses) | $ | 1,000.00 | $ | 1,020.36 | $ | 4.76 | 0.94 | % | ||||||||||||
Advisor Shares | ||||||||||||||||||||
Actual | $ | 1,000.00 | $ | 899.60 | $ | 3.76 | 0.79 | % | ||||||||||||
Hypothetical (5% return before expenses) | $ | 1,000.00 | $ | 1,021.11 | $ | 4.00 | 0.79 | % | ||||||||||||
Institutional Shares | ||||||||||||||||||||
Actual | $ | 1,000.00 | $ | 900.00 | $ | 3.33 | 0.70 | % | ||||||||||||
Hypothetical (5% return before expenses) | $ | 1,000.00 | $ | 1,021.56 | $ | 3.55 | 0.70 | % | ||||||||||||
Artisan International Fund | ||||||||||||||||||||
Investor Shares | ||||||||||||||||||||
Actual | $ | 1,000.00 | $ | 788.00 | $ | 5.33 | 1.19 | % | ||||||||||||
Hypothetical (5% return before expenses) | $ | 1,000.00 | $ | 1,019.10 | $ | 6.02 | 1.19 | % | ||||||||||||
Advisor Shares | ||||||||||||||||||||
Actual | $ | 1,000.00 | $ | 788.70 | $ | 4.71 | 1.05 | % | ||||||||||||
Hypothetical (5% return before expenses) | $ | 1,000.00 | $ | 1,019.80 | $ | 5.32 | 1.05 | % | ||||||||||||
Institutional Shares | ||||||||||||||||||||
Actual | $ | 1,000.00 | $ | 789.00 | $ | 4.40 | 0.98 | % | ||||||||||||
Hypothetical (5% return before expenses) | $ | 1,000.00 | $ | 1,020.16 | $ | 4.96 | 0.98 | % | ||||||||||||
Artisan International Explorer Fund | ||||||||||||||||||||
Advisor Shares | ||||||||||||||||||||
Actual(5) | $ | 1,000.00 | $ | 869.00 | $ | 4.95 | 1.40 | % | ||||||||||||
Hypothetical (5% return before expenses) | $ | 1,000.00 | $ | 1,018.05 | $ | 7.08 | 1.40 | % | ||||||||||||
Institutional Shares | ||||||||||||||||||||
Actual(5) | $ | 1,000.00 | $ | 869.00 | $ | 4.77 | 1.35 | % | ||||||||||||
Hypothetical (5% return before expenses) | $ | 1,000.00 | $ | 1,018.30 | $ | 6.83 | 1.35 | % | ||||||||||||
Artisan International Small-Mid Fund | ||||||||||||||||||||
Investor Shares | ||||||||||||||||||||
Actual | $ | 1,000.00 | $ | 778.30 | $ | 5.71 | 1.28 | % | ||||||||||||
Hypothetical (5% return before expenses) | $ | 1,000.00 | $ | 1,018.65 | $ | 6.48 | 1.28 | % | ||||||||||||
Advisor Shares | ||||||||||||||||||||
Actual | $ | 1,000.00 | $ | 778.30 | $ | 5.13 | 1.15 | % | ||||||||||||
Hypothetical (5% return before expenses) | $ | 1,000.00 | $ | 1,019.30 | $ | 5.82 | 1.15 | % | ||||||||||||
Institutional Shares | ||||||||||||||||||||
Actual | $ | 1,000.00 | $ | 778.80 | $ | 4.82 | 1.08 | % | ||||||||||||
Hypothetical (5% return before expenses) | $ | 1,000.00 | $ | 1,019.65 | $ | 5.47 | 1.08 | % | ||||||||||||
| Artisan Partners Funds | 159 |
SHAREHOLDER EXPENSE EXAMPLE (UNAUDITED)
| Beginning Account Value 4/1/2022 | Ending Account Value 9/30/2022 | Expenses Paid During Period 4/1/2022-9/30/2022(1) | Expense Ratio(2)(3) | |||||||||||||||||
Artisan International Value Fund | ||||||||||||||||||||
Investor Shares | ||||||||||||||||||||
Actual | $ | 1,000.00 | $ | 806.60 | $ | 5.39 | 1.19 | % | ||||||||||||
Hypothetical (5% return before expenses) | $ | 1,000.00 | $ | 1,019.10 | $ | 6.02 | 1.19 | % | ||||||||||||
Advisor Shares | ||||||||||||||||||||
Actual | $ | 1,000.00 | $ | 807.30 | $ | 4.76 | 1.05 | % | ||||||||||||
Hypothetical (5% return before expenses) | $ | 1,000.00 | $ | 1,019.80 | $ | 5.32 | 1.05 | % | ||||||||||||
Institutional Shares | ||||||||||||||||||||
Actual | $ | 1,000.00 | $ | 807.60 | $ | 4.35 | 0.96 | % | ||||||||||||
Hypothetical (5% return before expenses) | $ | 1,000.00 | $ | 1,020.26 | $ | 4.86 | 0.96 | % | ||||||||||||
Artisan Mid Cap Fund | ||||||||||||||||||||
Investor Shares | ||||||||||||||||||||
Actual | $ | 1,000.00 | $ | 756.40 | $ | 5.15 | 1.17 | % | ||||||||||||
Hypothetical (5% return before expenses) | $ | 1,000.00 | $ | 1,019.20 | $ | 5.92 | �� | 1.17 | % | |||||||||||
Advisor Shares | ||||||||||||||||||||
Actual | $ | 1,000.00 | $ | 756.90 | $ | 4.62 | 1.05 | % | ||||||||||||
Hypothetical (5% return before expenses) | $ | 1,000.00 | $ | 1,019.80 | $ | 5.32 | 1.05 | % | ||||||||||||
Institutional Shares | ||||||||||||||||||||
Actual | $ | 1,000.00 | $ | 757.30 | $ | 4.23 | 0.96 | % | ||||||||||||
Hypothetical (5% return before expenses) | $ | 1,000.00 | $ | 1,020.26 | $ | 4.86 | 0.96 | % | ||||||||||||
Artisan Mid Cap Value Fund | ||||||||||||||||||||
Investor Shares | ||||||||||||||||||||
Actual | $ | 1,000.00 | $ | 810.90 | $ | 5.45 | 1.20 | % | ||||||||||||
Hypothetical (5% return before expenses) | $ | 1,000.00 | $ | 1,019.05 | $ | 6.07 | 1.20 | % | ||||||||||||
Advisor Shares | ||||||||||||||||||||
Actual | $ | 1,000.00 | $ | 811.20 | $ | 4.72 | 1.04 | % | ||||||||||||
Hypothetical (5% return before expenses) | $ | 1,000.00 | $ | 1,019.85 | $ | 5.27 | 1.04 | % | ||||||||||||
Institutional Shares | ||||||||||||||||||||
Actual | $ | 1,000.00 | $ | 811.40 | $ | 4.45 | 0.98 | % | ||||||||||||
Hypothetical (5% return before expenses) | $ | 1,000.00 | $ | 1,020.16 | $ | 4.96 | 0.98 | % | ||||||||||||
Artisan Select Equity Fund | ||||||||||||||||||||
Investor Shares | ||||||||||||||||||||
Actual | $ | 1,000.00 | $ | 774.20 | $ | 5.60 | 1.26 | % | ||||||||||||
Hypothetical (5% return before expenses) | $ | 1,000.00 | $ | 1,018.75 | $ | 6.38 | 1.26 | % | ||||||||||||
Advisor Shares | ||||||||||||||||||||
Actual | $ | 1,000.00 | $ | 774.70 | $ | 5.12 | 1.15 | % | ||||||||||||
Hypothetical (5% return before expenses) | $ | 1,000.00 | $ | 1,019.30 | $ | 5.82 | 1.15 | % | ||||||||||||
Institutional Shares | ||||||||||||||||||||
Actual | $ | 1,000.00 | $ | 774.90 | $ | 4.89 | 1.10 | % | ||||||||||||
Hypothetical (5% return before expenses) | $ | 1,000.00 | $ | 1,019.55 | $ | 5.57 | 1.10 | % | ||||||||||||
Artisan Small Cap Fund | ||||||||||||||||||||
Investor Shares | ||||||||||||||||||||
Actual | $ | 1,000.00 | $ | 810.10 | $ | 5.45 | 1.20 | % | ||||||||||||
Hypothetical (5% return before expenses) | $ | 1,000.00 | $ | 1,019.05 | $ | 6.07 | 1.20 | % | ||||||||||||
Advisor Shares | ||||||||||||||||||||
Actual | $ | 1,000.00 | $ | 810.90 | $ | 4.81 | 1.06 | % | ||||||||||||
Hypothetical (5% return before expenses) | $ | 1,000.00 | $ | 1,019.75 | $ | 5.37 | 1.06 | % | ||||||||||||
Institutional Shares | ||||||||||||||||||||
Actual | $ | 1,000.00 | $ | 810.90 | $ | 4.49 | 0.99 | % | ||||||||||||
Hypothetical (5% return before expenses) | $ | 1,000.00 | $ | 1,020.10 | $ | 5.01 | 0.99 | % | ||||||||||||
| 160 | Artisan Partners Funds |
SHAREHOLDER EXPENSE EXAMPLE (UNAUDITED)
| Beginning Account Value 4/1/2022 | Ending Account Value 9/30/2022 | Expenses Paid During Period 4/1/2022-9/30/2022(1) | Expense Ratio(2)(3) | |||||||||||||||||
Artisan Sustainable Emerging Markets Fund | ||||||||||||||||||||
Investor Shares | ||||||||||||||||||||
Actual | $ | 1,000.00 | $ | 768.50 | $ | 5.10 | 1.15 | % | ||||||||||||
Hypothetical (5% return before expenses) | $ | 1,000.00 | $ | 1,019.30 | $ | 5.82 | 1.15 | % | ||||||||||||
Advisor Shares | ||||||||||||||||||||
Actual(6) | $ | 1,000.00 | $ | 853.50 | $ | 4.16 | 1.05 | % | ||||||||||||
Hypothetical (5% return before expenses) | $ | 1,000.00 | $ | 1,019.80 | $ | 5.32 | 1.05 | % | ||||||||||||
Institutional Shares | ||||||||||||||||||||
Actual | $ | 1,000.00 | $ | 768.90 | $ | 4.43 | 1.00 | % | ||||||||||||
Hypothetical (5% return before expenses) | $ | 1,000.00 | $ | 1,020.05 | $ | 5.06 | 1.00 | % | ||||||||||||
Artisan Value Fund | ||||||||||||||||||||
Investor Shares | ||||||||||||||||||||
Actual | $ | 1,000.00 | $ | 805.10 | $ | 4.75 | 1.05 | % | ||||||||||||
Hypothetical (5% return before expenses) | $ | 1,000.00 | $ | 1,019.80 | $ | 5.32 | 1.05 | % | ||||||||||||
Advisor Shares | ||||||||||||||||||||
Actual | $ | 1,000.00 | $ | 805.50 | $ | 3.98 | 0.88 | % | ||||||||||||
Hypothetical (5% return before expenses) | $ | 1,000.00 | $ | 1,020.66 | $ | 4.46 | 0.88 | % | ||||||||||||
Institutional Shares | ||||||||||||||||||||
Actual | $ | 1,000.00 | $ | 805.60 | $ | 3.89 | 0.86 | % | ||||||||||||
Hypothetical (5% return before expenses) | $ | 1,000.00 | $ | 1,020.76 | $ | 4.36 | 0.86 | % | ||||||||||||
Artisan Value Income Fund | ||||||||||||||||||||
Investor Shares | ||||||||||||||||||||
Actual | $ | 1,000.00 | $ | 826.70 | $ | 5.50 | 1.20 | % | ||||||||||||
Hypothetical (5% return before expenses) | $ | 1,000.00 | $ | 1,019.05 | $ | 6.07 | 1.20 | % | ||||||||||||
Advisor Shares | ||||||||||||||||||||
Actual | $ | 1,000.00 | $ | 827.00 | $ | 5.04 | 1.10 | % | ||||||||||||
Hypothetical (5% return before expenses) | $ | 1,000.00 | $ | 1,019.55 | $ | 5.57 | 1.10 | % | ||||||||||||
Institutional Shares | ||||||||||||||||||||
Actual | $ | 1,000.00 | $ | 827.10 | $ | 4.81 | 1.05 | % | ||||||||||||
Hypothetical (5% return before expenses) | $ | 1,000.00 | $ | 1,019.80 | $ | 5.32 | 1.05 | % | ||||||||||||
| (1) | Expenses are equal to the Fund’s ratio of expenses to average net assets for the six month period ended September 30, 2022, multiplied by the average account value over the period, multiplied by 183/365 (to reflect the one-half year period). |
| (2) | Annualized ratio of expenses to average net assets for the six-month period ended September 30, 2022. |
| (3) | Expense ratio includes the effect of expenses waived or paid by the Adviser, if applicable. |
| (4) | The actual account value and expenses paid for Artisan Emerging Markets Debt Opportunities Fund – Investor Shares, Advisor Shares and Institutional Shares have been presented for the period from commencement of operations (April 7, 2022) through September 30, 2022. |
| (5) | The actual account value and expenses paid for Artisan International Explorer Fund – Advisor Shares and Institutional Shares have been presented for the period from commencement of operations (May 16, 2022) through September 30, 2022. |
| (6) | The actual account value and expenses paid for Artisan Sustainable Emerging Markets Fund – Advisor Shares has been presented for the period from commencement of operations (April 25, 2022) through September 30, 2022. |
| Artisan Partners Funds | 161 |
FACTORS CONSIDERED IN RENEWING CERTAIN FUNDS’ ADVISORY AGREEMENTS
Artisan Partners is responsible for management of the Funds’ (as defined below) investment portfolios and for overall management of the Funds’ business and affairs pursuant to an investment advisory agreement (the “Advisory Agreement”) between Artisan Partners Funds and Artisan Partners. With respect to each Fund, the Advisory Agreement, after an initial two-year term, may be continued from year to year only so long as the continuation is approved at least annually (a) by the vote of a majority of the directors of Artisan Partners Funds who are not “interested persons” of Artisan Partners Funds or Artisan Partners (the “independent directors”), and (b) by the board of directors or by the vote of a majority (as defined in the Investment Company Act of 1940, as amended) of the outstanding shares of the Fund.
The directors of Artisan Partners Funds held a meeting on May 5-6, 2022 (the “May 5-6 Meeting”), at which they gave preliminary consideration to information bearing on the continuation of the Advisory Agreement with respect to each of Artisan Developing World Fund, Artisan Focus Fund, Artisan Global Discovery Fund, Artisan Global Equity Fund, Artisan Global Opportunities Fund, Artisan Global Value Fund, Artisan High Income Fund, Artisan International Fund, Artisan International Small-Mid Fund, Artisan International Value Fund, Artisan Mid Cap Fund, Artisan Mid Cap Value Fund, Artisan Select Equity Fund, Artisan Small Cap Fund, Artisan Sustainable Emerging Markets Fund and Artisan Value Fund (each, a “Fund,” and, together, the “Funds”) for the period from July 1, 2022 through June 30, 2023. The investment advisory agreements for Artisan Floating Rate Fund and Artisan International Explorer Fund do not expire until November 10, 2023 and May 6, 2024, respectively, and the investment advisory agreements for Artisan Emerging Markets Debt Opportunities Fund, Artisan Global Unconstrained Fund and Artisan Value Income Fund do not expire until February 17, 2024. Accordingly, the directors did not take action with respect to these funds at the May 5-6 Meeting and the May 25-26 Meeting (as defined below). The primary purpose of the May 5-6 Meeting was to allow the directors ample opportunity to consider matters they deemed relevant in connection with the continuation of the Advisory Agreement (including the information provided relating to their review of the Advisory Agreement, in addition to materials they reviewed at meetings over the course of the preceding year, including a number of special meetings at which the directors discussed with Artisan Partners such matters as the methodology for constructing peer groups for purposes of evaluating the Funds’ investment performance, Artisan Partners’ business model and competitive position and overall asset management industry trends and developments), and to request any additional information they considered reasonably necessary to their deliberations.
At their regular quarterly meeting held on May 25-26, 2022 (the “May 25-26 Meeting”), the directors, including the independent directors, considered and unanimously approved the continuation through June 30, 2023 of the Advisory Agreement with respect to each of the Funds. The independent directors were assisted in their evaluation of the Advisory Agreement and the factors that they deemed to be material, including those factors described below, by independent legal counsel, from whom they received separate legal advice and with whom they met separately from Artisan Partners in connection with the contract review meetings.
Prior to the May 5-6 Meeting, independent counsel to the independent directors sent to Artisan Partners requests for information to be provided to the directors in connection with their consideration of the Advisory Agreement. Artisan Partners provided materials to the directors in response to those requests as well as other information Artisan Partners believed was useful in evaluating the approval of the Advisory Agreement. Artisan Partners provided a report (the “Broadridge Report”) prepared by Broadridge Financial Solutions, Inc. (“Broadridge”), an independent source of investment company data, that included information relating to each Fund’s fees and expenses compared to the fees and expenses of a relatively small peer group (the “Broadridge Peer Group”) and a larger peer universe of mutual funds (the “Broadridge Universe”) selected by Broadridge. The Broadridge Report also contained information comparing each Fund’s investment performance to the performance of a relatively small performance peer group selected by Artisan Partners using a methodology developed by Artisan Partners in consultation with the independent directors, and to the Fund’s Broadridge Universe (or, in the case of Artisan Global Discovery Fund and Artisan International Value Fund, to peer universes with a different style classification that Artisan Partners believed was more appropriate for comparative purposes than the style classification used by Broadridge to compile the Broadridge Universes (the “Supplemental Universes”)).
The directors also received and reviewed a memorandum from independent counsel regarding the directors’ responsibilities in evaluating the Advisory Agreement. The directors recognized that the management and fee arrangements for the Funds are the result of years of review and discussion between the independent directors and Artisan Partners, that certain aspects of such arrangements may receive greater scrutiny from the directors in some years than in others and that the directors’ conclusions may be based, in part, on their consideration of these same arrangements and information received during the course of the year and in prior years.
In evaluating the Advisory Agreement, the directors reviewed the available information and discussed with representatives of Artisan Partners each Fund’s operations; the nature, extent and quality of the advisory and other services provided by Artisan Partners to the Funds; the management fee rates payable by each Fund; the total expense ratios of each class of shares of the Funds; possible economies of scale; and other benefits (in addition to advisory fee revenues) derived or potentially derived by Artisan Partners from its relationship with the Funds. In addition to the third-party reports by Broadridge and the memorandum from independent counsel, the directors reviewed information provided and presented at or prior to May 5-6 Meeting and the May 25-26 Meeting, concerning, among other things, the following:
| • | Artisan Partners’ organization and operations, financial condition and stability and ownership structure; |
| • | Artisan Partners’ personnel and business and financial model and methods, including Artisan Partners’ assessment of its ability to attract and retain capable personnel, including with respect to incentive compensation offered to such personnel, Artisan Partners’ workforce diversity and inclusion practices and Artisan Partners’ succession planning processes with respect to, among other areas, |
| 162 | Artisan Partners Funds |
FACTORS CONSIDERED IN RENEWING CERTAIN FUNDS’ ADVISORY AGREEMENTS
| the leadership of the Funds’ portfolio management teams and senior management of Artisan Partners; Artisan Partners’ research, including with respect to its acquisition and use of traditional and alternative data, and decision-making processes; the adequacy and sophistication of technology and systems with respect to investment and administrative matters, including the use of and reliance on vendors in connection with the management or operations of the Funds; and Artisan Partners’ views on the effects of the evolving competitive landscape of the mutual fund industry and certain industry and regulatory developments, on the Funds’ and/or Artisan Partners’ business; |
| • | The terms of the Advisory Agreement, including the scope of services performed by Artisan Partners; and how the services performed by Artisan Partners under the Advisory Agreement differ from those performed for other investment companies and accounts; |
| • | Each Fund’s short- and long-term investment performance (including past 1-, 3-, 5- and 10-year and since-inception periods, as applicable), including performance attribution and rolling 5-year excess return information for certain Funds and performance comparisons for various time periods with (a) other Artisan Partners client accounts managed with similar investment objectives, (b) other mutual funds having similar investment objectives and (c) appropriate market indices; |
| • | Information on each Fund’s redemption rates relative to other accounts managed by Artisan Partners, including separate account strategies, and appropriate industry peer groups; |
| • | Any litigation pending, threatened or settled involving Artisan Partners, and the results of any inspections, investigations or examinations thereof by the SEC or other governmental or regulatory authorities since January 1, 2021; |
| • | Information regarding fee arrangements, including a comparison of the total expense ratio of each share class of each Fund with other mutual funds; the structure of the management fees, including the method of computing fees and the frequency of payment of fees and Artisan Partners’ process for determining proposed management fee rates for new funds; a comparison of the management fees with fees charged by other investment advisers for managing mutual funds with similar investment objectives; information regarding expense limitation arrangements and effective annual management fee rates for each of the Funds for the calendar year ended December 31, 2021; the expenses other than management fees that the Funds bear, either at the level of the Fund as a whole or on a class-specific basis; and Artisan Partners’ assessment of the reasonableness and current competitiveness of the Funds’ management fee rates and total expense ratios; |
| • | Artisan Partners’ assessment of whether it is realizing economies of scale in providing services to the Funds and, if so, whether, how and, if quantifiable, to what extent the economies of scale are shared with the Funds, and the adequacy of existing breakpoints (reduced fee levels on assets in excess of stated thresholds) in advisory fees and whether further breakpoints are appropriate; |
| • | A comparison of the fee arrangements for the Funds with fees charged by Artisan Partners for subadvising other U.S. mutual funds and for managing other accounts, Artisan Partners’ philosophy regarding management fees charged to such sub-advised clients as compared to Funds with substantially similar investment strategies, including regarding initial fee rates and fee waivers and/or reductions, and trends in fees charged by Artisan Partners for such services; |
| • | Information regarding third-party intermediary and service arrangements and related payments by the Funds and Artisan Partners; |
| • | Potential “fall-out” benefits to Artisan Partners or its affiliates from their relationships with the Funds, in addition to advisory fees, including any benefits to Artisan Partners or its affiliates in selling other products, and the method of estimating the value of any such benefits; |
| • | Matters relating to brokerage and portfolio transactions, including Artisan Partners’ practices regarding selection of brokers and dealers to execute portfolio transactions and regarding negotiation of commission rates and allocation of brokerage for research and other services; |
| • | The estimated profitability to Artisan Partners of its relationship with each Fund on both a pre-tax and post-tax basis for calendar years 2019, 2020 and 2021; and the assumptions and allocation methodologies utilized for such profitability analysis; |
| • | Potential for conflicts of interest between the Funds and Artisan Partners or its other clients and circumstances and actions addressing or bearing on potential conflicts of interest; |
| • | Legal, compliance and related matters, including Artisan Partners’ programs for monitoring compliance with federal and state securities and other applicable laws and regulations, the investment policies and restrictions of the Funds and Subchapter M of the Internal Revenue Code; and information regarding personnel who perform significant legal and compliance services for the Funds; |
| • | Artisan Partners’ risk assessment and risk management processes; |
| • | Artisan Partners’ cybersecurity framework and Artisan Partners’ approach to monitoring the cybersecurity systems of the Funds’ key service providers with respect to the services provided to the Funds; |
| • | Artisan Partners’ views on environmental, social and governance (“ESG”) investing, including the extent to which and how Artisan Partners’ investment teams incorporate ESG factors into the investment process with the goal of helping enhance risk-adjusted |
| Artisan Partners Funds | 163 |
FACTORS CONSIDERED IN RENEWING CERTAIN FUNDS’ ADVISORY AGREEMENTS
| portfolio returns, anticipated incremental resource needs or costs associated with the incorporation of ESG factors into the investment process used to manage the Funds and Artisan Partners’ assessment of actual and perceived benefits to shareholders and/or Fund performance of the incorporation of such factors into the investment process; |
| • | Artisan Partners’ business continuity and disaster recovery procedures, including Artisan Partners’ response to the global outbreak of COVID-19 and any issues that have arisen as a result of COVID-19 in any areas of Artisan Partners’ business or the operations of the Funds, including portfolio management, valuation, liquidity management, trading, distribution, compliance, data security and investor servicing; Artisan Partners’ current short- and longer-term plans for personnel returning to the office in light of improving circumstances related to COVID-19; and Artisan Partners’ views regarding short- and longer-term effects of COVID-19 on Artisan Partners’ and/or the Funds’ service providers’ costs structures, business models and profitability as they relate to the Funds. |
Following the May 5-6 Meeting and executive sessions with their independent counsel, the independent directors requested certain follow-up information from Artisan Partners. Artisan Partners provided this follow-up information prior to the May 25-26 Meeting. At the May 25-26 Meeting, Artisan Partners presented certain additional information to the directors regarding the Funds, and the independent directors and their independent counsel reviewed with the full board the information discussed at the May 5-6 Meeting and during their executive sessions. The directors then considered whether any further discussion or review was necessary, concluding that the information reviewed by the independent directors prior to and at the May 25-26 Meeting provided a sufficient basis for taking action on the continuation of the Advisory Agreement with respect to each Fund for an additional year. The directors then reviewed and affirmed each of the following conclusions:
The nature, extent and quality of Artisan Partners’ services. The directors concluded that the nature and extent of Artisan Partners’ services to the Funds were appropriate and consistent with, and in some cases more advantageous to the Funds than, the terms of the Advisory Agreement. The directors concluded that the quality of Artisan Partners’ services has been consistently high, with no material deficiencies.
The investment performance of each Fund. With respect to each Fund, the directors concluded that the Fund’s performance (including absolute performance and, where applicable, outperformance of peers and relevant benchmarks over long-term periods) or other relevant factors supported continuation of the Fund’s advisory arrangements under the Advisory Agreement. In the case of each Fund that had performance that lagged that of a relevant peer group or benchmark for certain (although not necessarily all) periods, the directors concluded that other factors relevant to performance supported continuation of the advisory arrangements. These factors included either or both of the following: (1) that underperformance was attributable, to a significant extent, to investment decisions (such as security selection, sector allocation or risk mitigation) by Artisan Partners that were reasonable and consistent with the Fund’s investment objective and policies; and (2) that the Fund’s more recent or long-term performance, as applicable, was competitive when compared to relevant performance benchmarks or peer groups. The directors also considered Artisan Partners’ explanations of the Funds’ investment styles and their comparability to those of other funds in the Funds’ peer groups, including the Supplemental Peer Universes.
The costs of the services and profitability of Artisan Partners. The directors concluded that the costs of the services provided by Artisan Partners, and the estimated profitability it realizes, are reasonable in relation to the nature and quality of services provided with respect to each Fund, based on the assumptions and methodology for calculating such costs and profitability presented to the directors by Artisan Partners.
Comparisons of the services rendered and the amounts payable under the Advisory Agreement with those under other investment advisory agreements. The directors concluded that the fees payable by the Funds to Artisan Partners are reasonable in relation to the nature and quality of the services provided. In reaching this conclusion, the directors compared the fees payable by the Funds to the fees paid by other mutual funds that are in the same Broadridge Peer Groups and Broadridge Universes (or Supplemental Universes, as applicable). The directors also considered the fees Artisan Partners receives from, and the scope of services it provides to, other Artisan Partners clients, including its private funds, separate account clients and UCITS funds, and the U.S. mutual funds and collective investment trust portfolios for which it serves as sub-adviser, noting the significantly broader scope of services that Artisan Partners provides to the Funds as compared to the other types of clients. In reaching their conclusion, among the various factors considered, the directors also took into account the costs and risks assumed by Artisan Partners in connection with launching and maintaining publicly-offered mutual funds, and how those costs and risks differ from those associated with other components of Artisan Partners’ business.
In addition, the directors noted that Artisan Partners has contractually agreed to maintain certain expense limitations through January 31, 2024 for Artisan Global Equity Fund (Investor and Advisor Shares), Artisan Global Discovery Fund (Investor, Advisor and Institutional Shares), Artisan Select Equity Fund (Investor, Advisor and Institutional Shares), Artisan Sustainable Emerging Markets Fund (Investor, Advisor and Institutional Shares) and Artisan Value Fund (Advisor Shares).
The extent to which economies of scale would be realized as each Fund grows and whether fee levels reflect these economies of scale for the benefit of Fund investors. The directors concluded that the shareholders of Artisan Developing World Fund, Artisan Focus Fund, Artisan Global Opportunities Fund, Artisan Global Value Fund, Artisan High Income Fund, Artisan International Fund, Artisan International Small-Mid, Artisan International Value Fund, Artisan Mid Cap Fund, Artisan Mid Cap Value Fund, Artisan Small Cap Fund and Artisan Value Fund have appropriately benefited from economies of scale under the management fee structures of their advisory arrangements. The directors concluded that the shareholders of each of Artisan Global Discovery Fund, Artisan Global Equity
| 164 | Artisan Partners Funds |
FACTORS CONSIDERED IN RENEWING CERTAIN FUNDS’ ADVISORY AGREEMENTS
Fund, Artisan Select Equity Fund and Artisan Sustainable Emerging Markets Fund would likely benefit from economies of scale if the Fund’s assets reach the level at which it will be able to take advantage of the investment advisory fee breakpoints in the Advisory Agreement.
Other benefits derived by the Funds or Artisan Partners. The directors concluded that, in addition to the services provided by Artisan Partners pursuant to the Advisory Agreement and the management fees to be paid in return, the Funds and Artisan Partners may potentially benefit from their relationship with each other in several ways. For Artisan Partners, the directors concluded the primary fall-out benefits include (1) the potential conversion of Fund shareholders to separate account clients of Artisan Partners, and the ability otherwise to attract new clients and investment talent to Artisan Partners, (2) the acquisition of research products and services by Artisan Partners, for the benefit of its clients including the Funds, in return for brokerage commissions paid by the Funds (“soft dollars”), (3) reputational benefits as a result of its association with the Funds and (4) the ability of Artisan Partners to leverage its relationships with service providers to obtain favorable terms for its clients. The directors concluded that the Funds could benefit from potential institutional shareholders who might choose to invest in the Funds because they want Artisan Partners’ services, but do not meet Artisan Partners’ minimum separate account size requirements. The directors also concluded that the Funds benefit from Artisan Partners’ use of research obtained through soft dollars generated with respect to its other clients, and from reputational benefits as a result of their association with Artisan Partners.
At the conclusion of the foregoing discussions, the board approved the Advisory Agreement for the period from July 1, 2022 through June 30, 2023 for each Fund by the unanimous vote of all directors and also by the unanimous vote of all the independent directors.
| Artisan Partners Funds | 165 |
FACTORS CONSIDERED IN APPROVING ARTISAN INTERNATIONAL EXPLORER FUND’S ADVISORY AGREEMENT
At the May 5-6 Meeting, the directors of Artisan Partners Funds, including the independent directors, considered and unanimously approved the Advisory Agreement with respect to Artisan International Explorer Fund (the “New Fund”) for an initial two-year term from May 16, 2022 through May 15, 2024. The independent directors were assisted in their evaluation of the Advisory Agreement and the factors that they deemed to be material, including those factors described below, by independent legal counsel, from whom they received separate legal advice and with whom they met separately from Artisan Partners in connection with the May 5-6 meeting.
Prior to the May 5-6 Meeting, independent counsel to the independent directors sent Artisan Partners a request for information to be provided to the directors in connection with their consideration of the approval of the Advisory Agreement with respect to the New Fund. Artisan Partners provided materials to the directors in response to that request as well as other information Artisan Partners believed was useful in evaluating the approval of the Advisory Agreement with respect to the New Fund, and a report prepared by Broadridge, which included information relating to the New Fund’s proposed management fees and projected expenses compared to the management fees and expenses of a peer group of other mutual funds determined by Broadridge to be comparable to the New Fund. The directors also received and reviewed a memorandum from independent counsel regarding the directors’ responsibilities in evaluating the Advisory Agreement.
In evaluating the Advisory Agreement with respect to the New Fund, the directors took into account information regarding the New Fund, its proposed investment strategy and its proposed portfolio management team that had been presented to them by Artisan Partners at a meeting of the directors on February 17, 2022. The directors also reviewed the information (discussed above under “Factors Considered in Renewing Certain Funds’ Advisory Agreement”) provided in connection with the Board’s consideration of the continuation of the Advisory Agreement with respect to various other series of Artisan Partners Funds (the “Existing Funds”). The directors discussed with representatives of Artisan Partners the nature, extent and quality of the advisory and other services proposed to be provided by Artisan Partners to the New Fund, the anticipated overall expense ratio of the New Fund, the prospect for achievement of economies of scale if the New Fund grows to substantial size and other benefits (in addition to advisory fee revenues) that Artisan Partners might potentially derive from its relationship with the New Fund. In addition to the third-party report by Broadridge and the memorandum from independent counsel, the directors reviewed information provided prior to the Meeting concerning, among other things, the following:
| • | The terms of the Advisory Agreement; |
| • | Information on Artisan Partners’ advisory personnel and methods, including differences between the New Fund and the Existing Funds; |
| • | Information regarding the performance of any other accounts of Artisan Partners and/or other mutual funds having similar investment objectives to the New Fund; |
| • | Information on potential limits on the growth of the New Fund; |
| • | A comparison of the total projected expenses and total projected expense ratio of each share class of the New Fund with other mutual funds; a comparison of the New Fund’s proposed management fees with fees charged by other advisory organizations for managing mutual funds with investment goals similar to the New Fund’s; information regarding the adequacy of the proposed management fee breakpoint and whether further breakpoints are appropriate; and Artisan Partners’ agreement to waive a portion of its advisory fee and/or bear certain other expenses of the New Fund for the initial period of the New Fund’s operations in order to limit the New Fund’s operating expenses during that period, and the relationship of expected fees/expenses to the limitation; and |
| • | Information relating to (1) material resource needs, (2) any trading, operational, valuation, compliance or liquidity challenges, (3) conflicts of interest (including but not limited to any considerations relating to allocations of investment opportunities between the New Fund and other accounts managed by the same investment team) associated with the anticipated operations of the New Fund and (4) Artisan Partners’ analysis supporting the conclusion that the New Fund’s investment strategy is appropriate for an open-end fund. |
The board noted that, because the New Fund had not yet commenced operations, Artisan Partners had not yet derived any profits from its relationship to the New Fund and was not expected to do so until the New Fund has achieved a meaningful level of assets.
At the May 5-6 Meeting, the directors discussed and considered the information presented. The directors then considered whether any further discussion or review was necessary. The directors then reviewed and affirmed each of the following conclusions:
The nature, extent and quality of Artisan Partners’ proposed services. The directors concluded that the nature and extent of Artisan Partners’ services proposed to be provided to the New Fund would be appropriate and consistent with, and in some cases more advantageous to the New Fund than, the terms of the Advisory Agreement. The directors noted that one of the New Fund’s proposed portfolio managers serves as portfolio manager of Artisan International Value Fund. The directors considered that Artisan Partners contemplates providing the same service level for the New Fund as it provides for the Existing Funds. The directors concluded that Artisan Partners has sufficient and well-qualified personnel, with appropriate education and experience, to serve the New Fund effectively and that key personnel would not be undesirably overextended in assuming management responsibilities for the New Fund.
Investment performance. The directors noted that, because the New Fund was not yet in operation, it had no performance history. However, the directors reviewed the investment performance of another account that is managed by the proposed portfolio managers of the New Fund using an investment strategy similar to the New Fund’s.
| 166 | Artisan Partners Funds |
FACTORS CONSIDERED IN APPROVING ARTISAN INTERNATIONAL EXPLORER FUND’S ADVISORY AGREEMENT
Cost of services, economies of scale and benefits derived by Artisan Partners. The directors concluded that the nature, extent and quality of services proposed to be provided to the New Fund by Artisan Partners were appropriate and that the fees proposed to be paid to Artisan Partners were reasonable. In this connection, the directors took into account the fees paid by mutual funds considered by Broadridge to be within the same peer group or universe as the New Fund. In addition, the directors considered that Artisan Partners has contractually agreed to limit certain expenses of the New Fund through January 31, 2024. The directors also noted that the proposed management fee schedule includes a breakpoint (a reduced fee level on assets above a stated threshold) at $500 million of New Fund net assets. The directors concluded that this breakpoint will result in a sharing, as between the New Fund and Artisan Partners, of possible future economies of scale as and if the New Fund’s assets grow to substantial levels.
Other benefits derived by the New Fund or Artisan Partners. The directors concluded that, other than the services provided by Artisan Partners pursuant to the proposed Advisory Agreement and the proposed management fees to be paid in return, the New Fund and Artisan Partners may potentially benefit from their relationship with each other in the same ways described above with respect to the Existing Funds (under “Factors Considered in Renewing Certain Funds’ Advisor Agreements’).
Following the discussions described above, the board approved the Advisory Agreement with respect to the New Fund by the unanimous vote of all directors and also by the unanimous vote of all the independent directors.
| Artisan Partners Funds | 167 |
NOTES ON MANAGEMENT’S DISCUSSION OF FUND PERFORMANCE AND PORTFOLIO HOLDINGS’ CLASSIFICATION
The discussions of each Fund included in this report include statistical information about the portfolios of each of the Funds. Except as otherwise noted, that information is as of September 30, 2022. That information will vary with changes in a Fund’s portfolio investments. The performance information for each Fund relative to its benchmark index discussed in this report was prepared by the Adviser using information reported by FactSet Research Systems, Inc. (“FactSet”).
For the purposes of assigning portfolio securities to a particular country in this report, the Adviser considers an issuer to be from a particular country as designated by its securities information vendors. However, the Adviser in its own judgment may consider an issuer to be from a country other than the country designated by the securities information vendors. A vendor’s criteria may include the identity of the jurisdiction of the issuer’s incorporation, the main equity trading market for the issuer’s securities, the geographical distribution of the issuer’s operations and the location of the issuer’s headquarters. The Adviser may also consider other criteria such as the source of a company’s revenues. Over time, country designations may change.
For the purposes of assigning portfolio securities to a particular sector and industry in this report, the Adviser assigns equity securities in accordance with the sector and industry classifications of the Global Industry Classification Standard (GICS®) developed by MSCI Inc. and Standard & Poor’s (to the extent available) as primary sources for most Funds and FactSet (to the extent available) as a secondary source for this information. The Adviser uses the Sustainable Industry Classification System (“SICS®”), developed by the Sustainability Accounting Standards Board (“SASB”), as the primary source with respect to Sustainable Emerging Markets Fund. The Adviser assigns debt securities in accordance with the classifications developed by Bloomberg Finance L.P. In the event the Adviser’s securities information vendors do not classify a security to a particular sector or industry, or if the Adviser determines that a different classification is more appropriate, the Adviser classifies the security according to its own judgment, using other securities information vendors, the company description and/or other publicly available information. Sector and industry classifications may change over time.
The names of portfolio securities reflected in this report are as reported by the Funds’ data providers, may not represent the legal name of the entity and, in some cases, are translations of non-English names.
Definition of Portfolio Statistic
Market Capitalization is the aggregate value of all of a company’s outstanding equity securities.
Descriptions of Indices
Each Fund’s performance is compared in this report to changes in one or more indices, including in all cases a broad-based index of changes in prices of securities in the markets in which the Fund invests. All of the indices are unmanaged and their returns include reinvested dividends. Unlike the Funds’ returns, the returns of each index do not include the payment of sales commissions or other expenses that would be incurred in the purchase or sale of the securities included in that index. An investment cannot be made directly in an index. Fair value pricing is not employed by market indices.
The indices to which the Funds are compared are:
Artisan Developing World and Artisan Sustainable Emerging Markets Funds – Morgan Stanley Capital International Emerging Markets Index (MSCI Emerging Markets Index) is a market-weighted index of companies in emerging markets.
Artisan Emerging Markets Debt Opportunities Fund – JP Morgan (JPM) EMB Hard Currency/Local Currency 50-50 is an unmanaged, blended index consisting of: 50% JPM Government Bond Index-Emerging Market Global Diversified (GBIEMGD), an index of local-currency bonds with maturities of more than one year issued by Emerging Markets governments; 25% JPM Emerging Markets Bond Index-Global Diversified (EMBIGD), an index of USD-denominated bonds with maturities of more than one year issued by Emerging Markets governments; and 25% JPM Corporate Emerging Market Bond Index-Broad Diversified (CEMBIBD), an index of USD-denominated Emerging Markets corporate bonds.
Artisan Floating Rate Fund – Credit (CS) Suisse Leveraged Loan Index is an unmanaged market-weighted index designed to mirror the investable universe of the US dollar-denominated leveraged loan market.
Artisan Focus, Artisan Select Equity and Artisan Value Income Funds – S&P 500® is a market-cap-weighted index that measures the performance of 500 US companies focused on the Large-cap sector of the market.
Artisan Global Discovery, Artisan Global Equity, Artisan Global Opportunities and Artisan Global Value Funds – Morgan Stanley Capital International All Country World Index (MSCI ACWI Index) is a market-weighted index of global developed and emerging markets.
Artisan Global Unconstrained Fund – ICE BofA 3 Month US Treasury Index is an unmanaged index that comprises a single US Treasury issue with approximately three months to final maturity, purchased at the beginning of each month and held for one full month.
Artisan High Income Fund – ICE BofAML US High Yield Master II Index tracks the performance of below investment grade US dollar-denominated corporate bonds publicly issued in the US domestic market.
Artisan International and Artisan International Value Funds – Morgan Stanley Capital International EAFE Index (MSCI EAFE Index) is a market-weighted index of companies in developed markets, excluding the US and Canada. MSCI EAFE’s average annual return since inception of the International Fund is based upon a starting date of December 31, 1995.
Artisan International and Artisan International Value Funds – Morgan Stanley Capital All Country World Index ex USA (MSCI ACWI ex USA Index) is a market-weighted index of global developed and emerging markets, excluding the US.
| 168 | Artisan Partners Funds |
NOTES ON MANAGEMENT’S DISCUSSION OF FUND PERFORMANCE AND PORTFOLIO HOLDINGS’ CLASSIFICATION
Artisan International Explorer and Artisan International Small-Mid Funds – Morgan Stanley Capital International All Country World Index ex USA Small Cap Net Index (MSCI ACWI ex USA Small Cap Net Index) is a market-weighted index of small cap companies in developed and emerging markets, excluding the US.
Artisan International Small-Mid Fund – Morgan Stanley Capital International All Country World ex USA SMID Net Index (MSCI ACWI ex USA SMID Net Index) is a market-weighted index of mid and small cap companies in developed and emerging markets, excluding the US.
Artisan Mid Cap and Artisan Mid Cap Value Funds – Russell Midcap® Index is a market-weighted index of about 800 medium-sized US companies.
Artisan Mid Cap Fund – Russell Midcap® Growth Index is a market-weighted index of those medium-sized companies included in the Russell Midcap® Index with higher price-to-book and higher forecasted growth values.
Artisan Mid Cap Value Fund – Russell Midcap® Value Index is a market-weighted index of those medium-sized companies included in the Russell Midcap® Index with lower price-to-book ratios and lower forecasted growth values.
Artisan Small Cap Fund – Russell 2000® Index is a market-weighted index of about 2,000 small US companies.
Artisan Small Cap Fund – Russell 2000® Growth Index is a market-weighted index of those small companies included in the Russell 2000® Index with higher price-to-book ratios and higher forecasted growth values.
Artisan Value Fund – Russell 1000® Index is a market-weighted index of about 1,000 large US companies.
Artisan Value Fund – Russell 1000® Value Index is a market-weighted index of those large companies included in the Russell 1000® Index with lower price-to-book ratios and lower forecasted growth values.
Artisan Value Income Fund – Dow Jones US Select Dividend Index is a yield-weighted index that aims to represents the US’s leading stocks by dividend yield.
Trademarks
Trademarks and copyrights relating to the indices and products of portfolio companies mentioned in this report, if any, are owned by their respective owners. Except as otherwise indicated, the trademarks, including names, logos, slogans and service marks appearing in this report are the property of the Adviser and may not be copied, reproduced, published or in any way used without written permission.
The Global Industry Classification Standard (GICS®) is the exclusive intellectual property of MSCI Inc. (MSCI) and Standard & Poor’s Financial Services, LLC (S&P). Neither MSCI, S&P, their affiliates, nor any of their third party providers (“GICS Parties”) makes any representations or warranties, express or implied, with respect to GICS or the results to be obtained by the use thereof, and expressly disclaim all warranties, including warranties of accuracy, completeness, merchantability and fitness for a particular purpose. The GICS Parties shall not have any liability for any direct, indirect, special, punitive, consequential or any other damages (including lost profits) even if notified of such damages.
The Sustainable Industry Classification System (SICS®) is the exclusive intellectual property of Sustainability Accounting Standards Board (SASB).
MSCI makes no express or implied warranties or representations and shall have no liability whatsoever with respect to any MSCI data contained herein. The MSCI data may not be further redistributed or used to create indices or financial products. This report is not approved or produced by MSCI.
Source ICE data and indices (“ICE data”), is used with permission. ICE® is a registered trademark of ICE data or its affiliates, and BofA® is a registered trademark of Bank of America corporation licensed by Bank of America corporation and its affiliates (“BOFA”) and may not be used without BofA’s prior written approval. ICE data, its affiliates and their respective third-party suppliers disclaim any and all warranties and representations, express and/or implied, including any warranties of merchantability or fitness for a particular purpose or use, including the indices, index data and any data included in, related to, or derived therefrom. Neither ICE data, its affiliates nor their respective third-party suppliers shall be subject to any damages or liability with respect to the adequacy, accuracy, timeliness or completeness of the indices or the index data or any component thereof, and the indices and index data and all components thereof are provided on an “as is” basis and your use is at your own risk. ICE data, its affiliates and their respective third-party suppliers do not sponsor, endorse, or recommend artisan partners limited partnership, or any of its products or services.
Frank Russell Company (“Russell”) is the source and owner of the trademarks, service marks and copyrights related to the Russell Indexes. Russell® is a trademark of Frank Russell Company. Neither Russell nor its licensors accept any liability for any errors or omissions in the Russell Indexes and/or Russell ratings or underlying data and no party may rely on any Russell Indexes and/or Russell ratings and/or underlying data contained in this communication. No further distribution of Russell Data is permitted without Russell’s express written consent. Russell does not promote, sponsor or endorse the content of this communication.
| Artisan Partners Funds | 169 |
NOTES ON MANAGEMENT’S DISCUSSION OF FUND PERFORMANCE AND PORTFOLIO HOLDINGS’ CLASSIFICATION
The S&P 500® Index is a product of S&P Dow Jones Indices LLC (“S&P DJI”) and/or its affiliates and has been licensed for use. Copyright© 2021 S&P Dow Jones Indices LLC, a division of S&P Global, Inc. All rights reserved. Redistribution or reproduction in whole or in part are prohibited without written permission of S&P Dow Jones Indices LLC. S&P® is a registered trademark of S&P Global and Dow Jones® is a registered trademark of Dow Jones Trademark Holdings LLC (“Dow Jones”). None of S&P DJI, Dow Jones, their affiliates or third party licensors makes any representation or warranty, express or implied, as to the ability of any index to accurately represent the asset class or market sector that it purports to represent and none shall have any liability for any errors, omissions, or interruptions of any index or the data included therein.
The JP Morgan Index is used with permission. Information has been obtained from sources believed to be reliable but JP Morgan does not warrant its completeness or accuracy. The Index may not be copied, used, or distributed without JP Morgan’s prior written approval. Copyright 2022, JP Morgan Chase & Co. All rights reserved.
The Dow Jones US Select Dividend Index (“Index”) is a product of S&P Dow Jones Indices LLC (“S&P DJI”) and/or its affiliates and has been licensed for use. Copyright © 2022 S&P Dow Jones Indices LLC, a division of S&P Global, Inc.. All rights reserved. Redistribution or reproduction in whole or in part are prohibited without written permission of S&P Dow Jones Indices LLC. S&P® is a registered trademark of S&P Global and Dow Jones® is a registered trademark of Dow Jones Trademark Holdings LLC (“Dow Jones”). None of S&P DJI, Dow Jones, their affiliates or third party licensors makes any representation or warranty, express or implied, as to the ability of any index to accurately represent the asset class or market sector that it purports to represent and none shall have any liability for any errors, omissions, or interruptions of any index or the data included therein.
| 170 | Artisan Partners Funds |
PROXY VOTING POLICIES AND PROCEDURES
You may obtain a description of Artisan Partners Funds’ proxy voting policies and procedures, without charge, upon request by calling 800.344.1770. That information also is included in Artisan Partners Funds’ statement of additional information, which is available without charge, on Artisan Partners Funds’ website at www.artisanpartners.com and on the Securities and Exchange Commission’s website at www.sec.gov.
Information relating to how each Fund voted proxies relating to portfolio securities held during the twelve-month period ended June 30 is available without charge, on Artisan Partners Funds’ website at www.artisanpartners.com and on the Securities and Exchange Commission’s website at www.sec.gov.
INFORMATION ABOUT PORTFOLIO SECURITIES
Disclosure of the Funds’ complete schedule of portfolio holdings is required to be made monthly on Form N-PORT, with every third month made available to the public by the Securities and Exchange Commission 60 days after the end of the Funds’ fiscal quarter. You can find Securities and Exchange Commission filings on the Securities and Exchange Commission’s website at www.sec.gov. Each Fund’s complete schedule of portfolio holdings is also made available at https://connect.rightprospectus.com/Artisan, and will be made available, upon request, by calling (toll-free) 800-344-1770. The schedule of portfolio holdings for the second and fourth quarter of each Fund’s fiscal year are included in the semi-annual report and annual report, respectively.
| Artisan Partners Funds | 171 |
The board of directors has overall responsibility for the conduct of the affairs of Artisan Partners Funds. Each director serves an indefinite term until the next annual meeting of shareholders at which the directors are elected and until the election and qualification of his or her successor or until he or she retires, resigns or is removed from office. As of the date of this report, Artisan Partners Funds’ bylaws provide that each director must retire by the end of the calendar year in which he or she attains the age of 72. The board of directors may fill any vacancy on the board provided that after such appointment at least two-thirds of the directors have been elected by the shareholders. The shareholders may remove a director by a vote of a majority of the outstanding shares of the Funds at any meeting of shareholders called for the purpose of removing such director.
The board of directors elects the officers of Artisan Partners Funds. Each officer holds office for one year and until the election and qualification of his or her successor, or until he or she sooner dies, resigns, or is removed or disqualified. The board of directors may remove any officer, with or without cause, at any time.
The names and ages of the directors and officers as of November 15, 2022, the position each holds with the Funds, the date each was first elected to office, their principal business occupations and other directorships they have held during at least the last five years are shown below. As of September 30, 2022, each director oversees all twenty-one series of Artisan Partners Funds.
Name and Age at 11/15/22 | Position(s) Funds | Date First Elected to Office | Principal Occupation(s) during at least the Past 5 Years | Other Public Company or Registered Investment Company Directorships Held | ||||
| Directors who are not “interested persons” of Artisan Partners Funds: | ||||||||
| Coleen Downs Dinneen – 61 | Director and Chair of the Education Committee | 1/1/18 | Retired; until 2016, Executive Vice President and General Counsel, Natixis Global Asset Management – U.S. Distribution and Chief Legal Officer and Secretary, Natixis/Loomis Funds. | None. | ||||
| Gail L. Hanson – 66 | Director and Independent Chair of the Board of Directors | Director since 1/1/12; Independent Chair since 1/1/19 | Retired; from February 2011 to April 2018, Chief Financial Officer, Aurora Health Care (not for profit health care provider); from September 2004 to February 2011, Deputy Executive Director, State of Wisconsin Investment Board. | Director, Northwestern Mutual Series Fund, Inc. (investment company) (27 portfolios). | ||||
| Bonnie L. Howard – 69 | Director and Chair of the Audit Committee | 3/9/18 | Director, Chair of the Audit Committee, and member of the Compensation Committee and Nominating and Governance Committee (May 2020 to present), and Chair of the Risk Oversight Committee and member of the Audit Committee (August 2012 to May 2020), Assured Guaranty Ltd.; Director, BMO Financial Corp and BMO Harris Bank, N.A. (September 2013 to April 2018); until December 2011, Chief Auditor and Global Head of Emerging Risk, Citigroup, Inc. | Director, Assured Guaranty Ltd (insurance company). | ||||
| William J. Kelly – 62 | Director | 1/1/20 | Chief Executive Officer, Chartered Alternative Investment Analyst (CAIA) Association (2014-present). | None. | ||||
| Peter M. Lebovitz – 67 | Director and Chair of the Governance and Nominating Committee | 7/1/14 | Managing Partner, Harkness Partners, LLC (provider of strategic consulting to investment management firms). | None. | ||||
| Peter E. Sundman – 63 | Director | 1/1/2020 | Trustee, IES Abroad (since 2012); Trustee, The College of Wooster (since 2003); Trustee, Frost Valley YMCA (since 1998). Formerly, Chief Executive Officer, ClearBridge Advisors (2009-2011); Chairman and Chief Executive Officer, Neuberger Funds (1999-2008); President, Neuberger Berman Management (1999-2008). | None. | ||||
| Directors who are “interested persons” of Artisan Partners Funds: | ||||||||
| Eric R. Colson – 53* | Director | 11/12/13 | Director, Chief Executive Officer and Chair of Artisan Partners Asset Management Inc.; until January 2021 President of Artisan Partners Asset Management Inc.; Managing Director and Chief Executive Officer of Artisan Partners; until January 2021 President of Artisan Partners; until February 2020, President and Chief Executive Officer of Artisan Partners Funds. | None. | ||||
| Gregory K. Ramirez –52** | Director, President and Chief Executive Officer | Director since 1/1/20; President and Chief Executive Officer since 2/12/20 | Managing Director and Vice President of Artisan Partners; Executive Vice President of Artisan Partners Asset Management Inc.; until February 2020, Chief Financial Officer, Vice President and Treasurer of Artisan Partners Funds; Chair and President of Artisan Partners Distributors LLC (“Distributors”); prior thereto, Vice President, Treasurer and Chief Financial Officer of Distributors; Director of Artisan Partners Global Funds plc; Director (since October 2016) of certain private funds sponsored by Artisan Partners. | None. | ||||
| * | Mr. Colson is an “interested person” of Artisan Partners Funds, as defined in the 1940 Act, because he is a Director of Artisan Partners Funds and holds various positions with Artisan Partners and its affiliates and beneficially owns interests in Artisan Partners and/or its parent company. |
| ** | Mr. Ramirez is an “interested person” of Artisan Partners Funds, as defined in the 1940 Act, because he is a Director, President and Chief Executive Officer of Artisan Partners Funds and holds various positions with Artisan Partners and its affiliates and beneficially owns interests in Artisan Partners and/or its parent company. |
| 172 | Artisan Partners Funds |
DIRECTORS AND OFFICERS
Name and Age at 11/15/22 | Position(s) Held with Artisan Partners Funds | Date First Elected to Office | Principal Occupation(s) during at least the Past 5 Years | Other Public Company or Company Directorships Held | ||||
| Officers: | ||||||||
| Jill M. Demski – 48 | Chief Compliance Officer and Anti-Money Laundering Compliance Officer | 2/12/20 | Chief Compliance Officer of Artisan Partners Funds (since February 2020); Associate Counsel (since January 2019) and Director of Compliance of Artisan Partners; Chief Compliance Officer (since October 2019) of Artisan Partners Distributors LLC. | None. | ||||
| Shannon K. Jagodinski – 45 | Chief Financial Officer, Vice President and Treasurer | Chief Financial Officer and Treasurer since 2/12/20; Vice President since 2/10/15 | Director of Vehicle Administration of Artisan Partners; prior thereto Senior Manager; until February 2020, Assistant Treasurer of Artisan Partners Funds. | None. | ||||
| Laura E. Simpson – 46 | General Counsel, Vice President and Secretary | General Counsel and Secretary since 11/10/22; Vice President since 2/10/15 | General Counsel of Artisan Partners (since October 2022); prior thereto Deputy General Counsel of Artisan Partners; Director (since January 2018) of Artisan Partners Global Funds plc; Director (since July 2020) of certain private funds sponsored by Artisan Partners; until November 2022, Assistant Secretary of Artisan Partners Funds. | None. | ||||
| Sarah A. Johnson – 50 | Vice President and Assistant Secretary | Vice President since 2/8/11; Assistant Secretary since 11/10/22 | Managing Director, Vice President, Secretary and since June 2022, Global Chief Compliance Officer of Artisan Partners; prior thereto General Counsel of Artisan Partners; Executive Vice President, Chief Legal Officer and Secretary of Artisan Partners Asset Management Inc.; Vice President and Secretary of Artisan Partners Distributors, LLC.; until November 2022, General Counsel and Secretary of Artisan Partners Funds. | None. | ||||
| Timothy A. Kahn – 39 | Vice President | 2/12/20 | Associate General Counsel (since January 2021) of Artisan Partners; prior thereto, Associate Counsel of Artisan Partners. | None. | ||||
| Blake A. Rigel – 52 | Assistant Treasurer | 2/9/16 | Global Tax Director and Tax Counsel of Artisan Partners. | None. | ||||
| Kori T. Fojtik – 37 | Assistant Treasurer | 11/10/22 | Manager of Vehicle Administration of Artisan Partners. | None. | ||||
The business address of the officers and the directors affiliated with Artisan Partners is 875 East Wisconsin Avenue, Suite 800, Milwaukee, Wisconsin 53202. The address of the other directors is c/o Artisan Partners Funds, 875 East Wisconsin Avenue, Suite 800, Milwaukee, Wisconsin 53202.
Artisan Partners Funds’ statement of additional information (SAI) contains further information about the directors. Please call 800.344.1770 or visit our website at www.artisanpartners.com for a free copy of the SAI.
| Artisan Partners Funds | 173 |

ARTISAN PARTNERS FUNDS
P.O. BOX 219322
KANSAS CITY, MO 64121-9322

Item 2. Code of Ethics.
(a) Registrant has adopted a code of ethics (the “Code”) that applies to its principal executive officer, principal financial officer and principal accounting officer (the “Covered Officers”).
(b) No disclosures are required pursuant to this Item 2(b).
(c) During the period covered by the report, registrant did not make any amendments to the Code.
(d) During the period covered by the report, registrant did not grant any waivers, including implicit waivers, from the provisions of the Code.
(e) Not applicable.
(f) A copy of the Code is filed as Exhibit (a)(1) to this Form N-CSR.
Item 3. Audit Committee Financial Expert.
Registrant’s board of directors has determined that Gail L. Hanson, member of the registrant’s audit committee, William J. Kelly, member of the registrant’s audit committee, Peter M. Lebovitz, member of the registrant’s audit committee, and Bonnie L. Howard, member and chair of the registrant’s audit committee, each qualify as an audit committee financial expert, as such term is defined in Instruction 2(b) to Item 3 of Form N-CSR. Ms. Hanson, Mr. Kelly, Mr. Lebovitz and Ms. Howard are “independent” as such term is defined in paragraph (a)(2) of Item 3 of Form N-CSR.
Under applicable securities laws, a person who is determined to be an audit committee financial expert will not be deemed an “expert” for any purpose, including, without limitation, for the purposes of Section 11 of the Securities Act of 1933, as a result of being designated or identified as an audit committee financial expert. The designation or identification of a person as an audit committee financial expert does not impose on such person any duties, obligations, or liabilities that are greater than the duties, obligations, and liabilities imposed on such person as a member of the audit committee and board of directors in the absence of such designation or identification.
Item 4. Principal Accountant Fees and Services.
Aggregate fees billed to the Corporation for professional services rendered by Ernst & Young for the 2022 and 2021 fiscal years of the Corporation are summarized in the table below. The table summarizes fees billed (or to be billed) by Ernst & Young for work performed relating to each applicable period identified below.
Fees:
| Fiscal Year Ended September 30, 2022 | Fiscal Year Ended September 30, 2021 | |||||||
Audit Fees (a) | $ | 599,068 | $ | 488,200 | ||||
Audit-Related Fees (b) | $ | — | $ | — | ||||
Tax Fees (c) | $ | 489,887 | $ | 683,325 | ||||
All Other Fees (d) | — | — | ||||||
(a) “Audit Fees” include amounts for professional services rendered by Ernst & Young for the audit of the Corporation’s annual financial statements and services that are normally provided by Ernst & Young in connection with statutory and regulatory filings or engagements, including for 2022, portions of which had not been billed as of September 30, 2022, and fees billed for consents issued in conjunction with the Corporation’s post-effective amendments to the Funds’ registration statements filed for each of the last two fiscal years. The fees billed during the fiscal year ended September 30, 2021 also include a consent issued in conjunction with the Corporation’s post-effective amendments to the Funds’ registration statements filed in connection with the initial offering of Advisor Shares of Artisan Global Equity Fund.
(b) “Audit-Related Fees” include amounts for assurance and related services by Ernst & Young that are reasonably related to the performance of the audit of the Corporation’s financial statements. Audit-related fees have not been reported under the item “audit fees” in the chart above.
(c) “Tax Fees” include amounts for professional services rendered by Ernst & Young for tax compliance, tax advice and tax planning.
The fees shown in the table above for the fiscal year ended September 30, 2022 include fees for (1) the review and preparation of the Funds’ income tax returns for the fiscal year ended September 30, 2022, which had not been billed as of September 30, 2022; (2) the review of excise tax calculations and preparation of excise tax returns for the calendar year ended December 31, 2022, which also had not been billed as of September 30, 2022; (3) the use of a PFIC database supplied by Ernst & Young for the fiscal year ended September 30, 2021, the excise year ended December 31, 2021 and the semiannual period ended March 31, 2022; the use of a Global Withholding Tax Reporter Database supplied by Ernst & Young for the fiscal year ended September 30, 2022; and EU reclaim filing fees.
The fees shown in the table above for the fiscal year ended September 30, 2021 include fees for (1) the review and preparation of the Funds’ income tax returns for the fiscal year ended September 30, 2021, which had not been billed as of September 30, 2021; (2) the review of excise tax calculations and preparation of excise tax returns for the calendar year ended December 31, 2021, which also had not been billed as of September 30, 2021; (3) the use of a PFIC database supplied by Ernst & Young for the fiscal year ended September 30, 2020, the excise year ended December 31, 2020 and the semiannual period ended March 31, 2021; the use of a Global Withholding Tax Reporter Database supplied by Ernst & Young for the fiscal year ended September 30, 2021; and EU reclaim filing fees.
(d) None.
(e)(1) During its regularly scheduled periodic meetings, the registrant’s audit committee considers any requests to pre-approve any audit, audit-related, tax and other services to be provided by the principal accountants of the registrant. The audit committee has authorized its chair to exercise that authority in the intervals between meetings; and the chair presents any such pre-approvals to the audit committee at its next regularly scheduled meeting. Under paragraph (c)(7)(i)(C) of Rule 2-01 of SEC Regulation S-X, pre-approval of non-audit services may be waived provided that: 1) the aggregate fees for all such services provided constitutes no more than five percent of the total amount of fees paid by the registrant to its principal accountant during the fiscal year in which services are provided, 2) such services were not recognized by the registrant at the time of engagement as non-audit services and 3) such services are promptly brought to the attention of the audit committee of the registrant and approved prior to the completion of the audit.
(e)(2) No services included in Items 4(b) – (d) above were approved pursuant to paragraph (c)(7)(i)(C) of Rule 2-01 of Regulation S-X.
(f) Not applicable.
(g) The aggregate fees for the fiscal years ended September 30, 2022 and September 30, 2021 by the registrant’s principal accountant for non-audit services rendered to the registrant are shown in the tables above and described under Items 4(b) – (d) above. For the registrant’s fiscal years ended September 30, 2022 and September 30, 2021, Ernst & Young LLP served as the registrant’s principal accountant and provided no services and billed no fees for non-audit services rendered to the registrant’s adviser or entities controlling, controlled by or under common control with the adviser that provides ongoing services to the registrant.
(h) The audit committee of the registrant’s board of directors has considered whether the provision of non-audit services that were rendered to the registrant’s investment adviser, and any entity controlling, controlled by or under common control with the investment adviser that provides ongoing services to the registrant that were not pre-approved pursuant to paragraph (c)(7)(ii) of Rule 2-01 of Regulation S-X is compatible with maintaining the principal accountant’s independence. The provisions of Rule 2-01(c)(7) were effective on May 6, 2003. No such services were rendered on or after May 6, 2003.
Item 5. Audit Committee of Listed Registrants.
Not applicable.
Item 6. Schedule of Investments.
The Schedules of Investments in securities of unaffiliated issuers as of September 30, 2022 are included as part of the annual reports to shareholders filed under Item 1 of this Form N-CSR.
Item 7. Disclosure of Proxy Voting Policies and Procedures for Closed-End Management Investment Companies.
Not applicable.
Item 8. Portfolio Managers of Closed-End Management Investment Companies.
Not applicable.
Item 9. Purchases of Equity Securities by Closed-End Management Investment Company and Affiliated Purchasers.
Not applicable.
Item 10. Submission of Matters to a Vote of Security Holders.
No material changes to report.
Item 11. Controls and Procedures.
(a) The registrant’s principal executive and principal financial officers have concluded, based on an evaluation of the registrant’s disclosure controls and procedures (as defined in Rule 30a-3(c) under the Investment Company Act of 1940, the “Disclosure Controls”) as of a date within 90 days prior to the filing date (the “Filing Date”) of this Form N-CSR (the “Report”), that the Disclosure Controls are effectively designed to provide reasonable assurance that the information required to be disclosed by the registrant in the Report is recorded, processed, summarized and reported by the Filing Date, including ensuring that information required to be disclosed in the Report is accumulated and communicated to the registrant’s management, including the registrant’s principal executive officer and principal financial officer, as appropriate to allow timely decisions regarding required disclosure.
(b) There were no changes in the registrant’s internal controls over financial reporting (as defined in Rule 30a-3(d) under the Investment Company Act of 1940) that occurred during the second fiscal quarter of the period covered by this report that have materially affected, or are reasonably likely to materially affect, the registrant’s internal control over financial reporting.
Item 12. Disclosure of Securities Lending Activities for Closed-End Management Investment Companies.
Not applicable.
Item 13. Exhibits.
SIGNATURES
Pursuant to the requirements of the Securities Exchange Act of 1934 and the Investment Company Act of 1940, the registrant has duly caused this report to be signed on its behalf by the undersigned, thereunto duly authorized.
| Artisan Partners Funds, Inc. | ||
| By: | /s/ Gregory K. Ramirez | |
| Gregory K. Ramirez | ||
| Principal Executive Officer | ||
| Date: | December 8, 2022 | |
Pursuant to the requirements of the Securities Exchange Act of 1934 and the Investment Company Act of 1940, this report has been signed below by the following persons on behalf of the registrant and in the capacities and on the dates indicated.
| By: | /s/ Gregory K. Ramirez | |
| Gregory K. Ramirez | ||
| Principal Executive Officer | ||
| Date: | December 8, 2022 | |
| By: | /s/ Shannon K. Jagodinski | |
| Shannon K. Jagodinski | ||
| Principal Financial Officer | ||
| Date: | December 8, 2022 | |