| | |
OMB APPROVAL |
OMB Number: | | 3235-0570 |
Expires: | | August 31, 2011 |
Estimated average burden |
hours per response: | | 18.9 |
UNITED STATES
SECURITIES AND EXCHANGE COMMISSION
Washington, D.C. 20549
FORM N-CSR
CERTIFIED SHAREHOLDER REPORT OF
REGISTERED MANAGEMENT INVESTMENT COMPANIES
Investment Company Act file number: 811-8934
ING Strategic Allocation Portfolios, Inc.
(Exact name of registrant as specified in charter)
| | |
| 7337 E. Doubletree Ranch Rd., Scottsdale, AZ | | 85258 |
| (Address of principal executive offices) | | (Zip code) |
The Corporation Trust Incorporated, 300 E. Lombard Street, Baltimore, MD 21201
(Name and address of agent for service)
Registrant’s telephone number, including area code: 1-800-992-0180
Date of fiscal year end: December 31
Date of reporting period: January 1, 2008 to December 31, 2008
| Item 1. | Reports to Stockholders. |
The following is a copy of the report transmitted to stockholders pursuant to Rule 30e-1 under the Act (17 CFR 270.30e-1):

Annual Report
December 31, 2008
Classes ADV, I and S
VP Strategic Allocation Funds-of-Funds
| n | ING VP Strategic Allocation Conservative Portfolio |
| n | ING VP Strategic Allocation Growth Portfolio |
| n | ING VP Strategic Allocation Moderate Portfolio |
| | |
 | | E-Delivery Sign-up – details inside |
This report is submitted for general information to shareholders of the ING Funds. It is not authorized for distribution to prospective shareholders unless accompanied or preceded by a prospectus which includes details regarding the funds’ investment objectives, risks, charges, expenses and other information. This information should be read carefully.
MUTUAL FUNDS 
| |
TABLE OF CONTENTS
| | | | |
| | | |
| | Go Paperless with E-Delivery! | | |
Sign up now for on-line prospectuses, fund reports, and proxy statements. In less than five minutes, you can help reduce paper mail and lower fund costs. Just go to www.ingfunds.com, click on the E-Delivery icon from the home page, follow the directions and complete the quick 5 Steps to Enroll. You will be notified by e-mail when these communications become available on the internet. Documents that are not available on the internet will continue to be sent by mail. |
PROXY VOTING INFORMATION
A description of the policies and procedures that the Portfolios use to determine how to vote proxies related to portfolio securities is available: (1) without charge, upon request, by calling Shareholder Services toll-free at (800) 992-0180; (2) on the ING Funds’ website at www.ingfunds.com; and (3) on the U.S. Securities and Exchange Commission’s (“SEC”) website at www.sec.gov. Information regarding how the Portfolios voted proxies related to portfolio securities during the most recent 12-month period ended June 30 is available without charge on the ING Funds’ website at www.ingfunds.com and on the SEC’s website at www.sec.gov.
QUARTERLY PORTFOLIO HOLDINGS
The Portfolios file their complete schedule of portfolio holdings with the SEC for the first and third quarters of each fiscal year on Form N-Q. The Portfolios’ Forms N-Q are available on the SEC’s website at www.sec.gov. The Portfolios’ Forms N-Q may be reviewed and copied at the SEC’s Public Reference Room in Washington, DC, and information on the operation of the Public Reference Room may be obtained by calling (800) SEC-0330; and is available upon request from the Portfolios by calling Shareholder Services toll-free at (800) 992-0180.
PRESIDENT’S LETTER

Dear Shareholders,
We are in the midst of one of the most challenging periods ever faced by investors, and we at ING Funds are aware of the anxiety that you may be feeling at this time.
I want to assure you that we are actively engaged in monitoring the situation and are committed to keeping you fully informed of how the rapidly unfolding events around us may impact your investments with our company.
We recognize that the confidence of many investors is being tested, perhaps as never before. It is understandable that some of you may be second guessing your investment strategy due to these recent events. We encourage you to work with your investment professional and seek out their advice about your portfolio in light of the current conditions. But we also urge investors not to make rash decisions. ING Funds still believes that a well-diversified, globally allocated portfolio remains the most effective investment strategy of all. We ask that investors not lose sight of their commitment to the long-term.
We thank you for your support and confidence and we look forward to continuing to do business with you in the future.
Sincerely,

Shaun Mathews
President & Chief Executive Officer
ING Funds
January 23, 2009
The views expressed in the President’s Letter reflect those of the President as of the date of the letter. Any such views are subject to change at any time based upon market or other conditions and ING Funds disclaims any responsibility to update such views. These views may not be relied on as investment advice and because investment decisions for an ING Fund are based on numerous factors, may not be relied on as an indication of investment intent on behalf of any ING Fund. Reference to specific company securities should not be construed as recommendations or investment advice. Consider the fund’s investment objectives, risks, and charges and expenses carefully before investing. The prospectus contains this information and other information about the fund.
International investing poses special risks including currency fluctuation, economic and political risks not found in investments that are solely domestic.
1
MARKET PERSPECTIVE: YEAR ENDED DECEMBER 31, 2008
In our semi-annual report, we described a failed second quarter rally that fizzled when investors realized that borderline recessionary conditions and a credit crunch had not gone away. By year-end, governments were committing previously unimaginable sums of taxpayer money to prevent systemic collapse. Global equities in the form of the MSCI World® Index(1) measured in local currencies, including net reinvested dividends (“MSCI” for regions discussed below) plunged 29.70% in the six months ended December 31, 2008 (down 38.70% for the entire fiscal year). (The MSCI World® Index plunged 40.71% for the entire fiscal year, measured in U.S. dollars.) In currencies, the dollar at first drifted near record lows against the euro. But the tide turned in mid-July and for the six months ended December 31, 2008, the dollar strengthened by 12.10% (4.50% for the entire fiscal year). The dollar also soared 37.80% against the pound for the six months ended December 31, 2008 (37.90% for the entire fiscal year). But the yen advanced as carry trades (essentially short yen positions) were unwound and the dollar fell 14.90% for the six months ended December 31, 2008 (down 19.60% for the entire fiscal year).
Even more dramatic was the price of oil which marched to an all-time high of around $147 per barrel in mid-July, only to lose more than two thirds of that price by December 31, 2008.
The economic statistics remained bleak. By the end of October, the Standard & Poor’s (“S&P”)/Case-Shiller National U.S. Home Price Index(2) of house prices had fallen a record 18% over the year. New home sales were at 1991 levels. Some 45% of existing home sales were distressed.
Payrolls declined in every month of 2008, as the number of people claiming unemployment reached 4.1 million, a 26-year high. Gross domestic product (“GDP”) fell at an annualized rate of 0.50% in the third quarter, and the National Bureau of Economic Research announced that the recession had actually started in December 2007.
Yet these were side-shows to the fireworks display in the financial sector, where major institutions — hanging by a thread through problems rooted in unwise mortgage borrowing, lending and investment — met different fates in September 2008 at the hands of the U.S. government.
The Federal National Mortgage Association (“Fannie Mae”) and the Federal Home Loan Mortgage Corporation (“Freddie Mac”) were taken into “conservatorship.” Merrill Lynch was acquired by the
Bank of America with a wink from the authorities. AIG received an $85 billion loan from a reluctant government, which also took a 79.90% equity stake in AIG. But Lehman Brothers having sought capital, then a buyer, found neither and was left to file for Chapter 11 bankruptcy protection.
The U.S. government was now in the position of choosing winners and losers among financial institutions: none too successfully, for it quickly became obvious that by pointedly leaving Lehman Brothers to go under, a credit crisis had become a credit market collapse. Lending all but seized up.
Policy response was huge but at least initially muddled. A Troubled Asset Relief Plan (“TARP”) would set up a $700 billion fund to buy illiquid mortgage securities from financial institutions. But on November 12, 2008 with half of the money already used to recapitalize banks, Treasury Secretary Paulson announced that the rest of the funds would not be used to buy illiquid mortgage securities after all. This merely renewed the pressure on the holders of such securities like Citigroup, which within two weeks received guarantees from the government against losses and another $20 billion in capital.
Other programs were of more practical use, like support for the commercial paper market and a guarantee facility for money market funds. Arguably the most effective measure was the announced intention to buy vast quantities of agency mortgage-backed securities and debentures. This had the effect of driving down rates on the 30-year mortgage towards 5.00%, a record low. In the meantime, the newly-elected president promised a stimulus package worth approximately $1 trillion. And by year end, the Federal Open Market Committee (“FOMC”) reduced interest rates to a range of between 0% and 0.25%.
2008 ended with much gloom and bad news still to come, but the platform for recovery was perhaps taking shape.
In U.S. fixed-income markets, yields on the 90-day Treasury Bills briefly turned negative in December 2008, while the yield on the ten-year Treasury Note fell below 2.50%, something we had not seen in 50 years. The Barclays Capital U.S. Aggregate Bond Index(3), formerly known as the Lehman Brothers U.S. Aggregate Bond Index, of investment grade bonds returned 4.10% for the six months ended December 31, 2008, (5.20% for the entire fiscal year). By contrast, high yield bonds, represented by the Barclays Capital High Yield Bond — 2% Issuer Constrained
2
MARKET PERSPECTIVE: YEAR ENDED DECEMBER 31, 2008
Composite Index(4), formerly known as the Lehman Brothers High Yield Bond — 2% Issuer Constrained Composite Index, behaved more like a stock index and returned (25.10)% for the six months ended December 31, 2008 (down 25.90% for the entire fiscal year).
U.S. equities, represented by the S&P 500® Composite Stock Price (“S&P 500®”) Index(5), including dividends, returned (28.50)% for the six months ended December 31, 2008, (down 37.00% for the entire fiscal year), increasingly unimpressed by sharply falling oil prices. Profits for S&P 500® Index companies suffered their fifth straight quarter of decline, led again by the financials sector, although taxpayer money was also potentially committed to save the big three auto makers from bankruptcy. On November 20, 2008, the S&P 500® Index plumbed a level not seen since April 1997, before a December recovery.
In international markets, plainly entering recession, the MSCI Japan® Index(6) slumped 35.90% for the six months ended December 31, 2008, (down 42.60% for the entire fiscal year). The strengthening yen hit exports in an export-dependent economy even as global demand slowed for other reasons. The MSCI Europe ex UK® Index(7) sagged 29.40% for the six months ended December 31, 2008 (down 43.20% for the entire fiscal year), beset by sharply falling economic activity and a European Central Bank in denial that inflation was falling fast. Finally, rates were reduced by an unprecedented 175 basis points (or 1.75%) in two months near the end of the year while governments, one after the other, proposed large stimulus packages. In the UK, the MSCI UK® Index(8) fell 19.40% for the six months ended December 31, 2008 (down 28.50% for the entire fiscal year). The UK had allowed a bigger housing bubble than the United States and deeper personal indebtedness in an economy more dependent on the financial sector. Rates were reduced to 1951 levels as venerable banks ceased to exist as independent entities.
(1) The MSCI World® Index is an unmanaged index that measures the performance of over 1,400 securities listed on exchanges in the U.S., Europe, Canada, Australia, New Zealand and the Far East.
(2) The S&P/Case-Shiller National U.S. Home Price Index tracks the value of single-family housing within the United States. The index is a composite of single-family home price indices for the nine U.S. Census divisions and is calculated quarterly.
(3) The Barclays Capital U.S. Aggregate Bond Index is an unmanaged index of publicly issued investment grade U.S. Government, mortgage-backed, asset-backed and corporate debt securities.
(4) The Barclays Capital High Yield Bond — 2% Issuer Constrained Composite Index is an unmanaged index that measures the performance of non-investment grade fixed-income securities.
(5) The S&P 500® Index is an unmanaged index that measures the performance of securities of
approximately 500 of the largest companies in the United States.
(6) The MSCI Japan® Index is a free float-adjusted market capitalization index that is designed to measure developed market equity performance in Japan.
(7) The MSCI Europe ex UK® Index is a free float-adjusted market capitalization index that is designed to measure developed market equity performance in Europe, excluding the UK.
(8) The MSCI UK® Index is a free float-adjusted market capitalization index that is designed to measure developed market equity performance in the UK.
All indices are unmanaged and investors cannot invest directly in an index.
Past performance does not guarantee future results. The performance quoted represents past performance. Investment return and principal value of an investment will fluctuate, and shares, when redeemed, may be worth more or less than their original cost. The Portfolios’ performance is subject to change since the period’s end and may be lower or higher than the performance data shown. Please call (800) 992-0180 or log on to www.ingfunds.com to obtain performance data current to the most recent month end.
Market Perspective reflects the views of ING’s Chief Investment Risk Officer only through the end of the period, and is subject to change based on market and other conditions.
3
| | |
| ING VP STRATEGIC ALLOCATION CONSERVATIVE PORTFOLIO | | PORTFOLIO MANAGERS’ REPORT |
ING VP Strategic Allocation Conservative Portfolio (the “Portfolio”) seeks to provide total return (i.e., income and capital growth, both realized and unrealized) consistent with preservation of capital. The Portfolio is managed by Paul Zemsky and Brian Gendreau, Portfolio Managers* of ING Investment Management Co. – the Sub-Adviser.
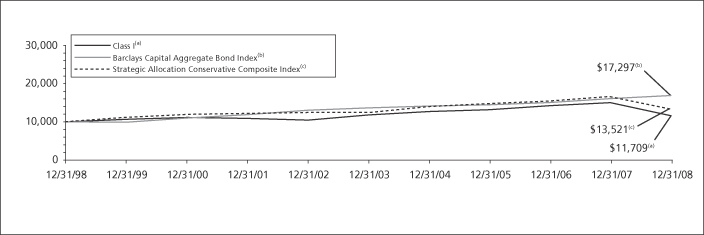
Performance: For the year ended December 31, 2008 the Portfolio’s Class I shares provided a total return of (23.65)% compared to the Barclays Capital U.S. Aggregate Bond Index**(1) and the Strategic Allocation Conservative Composite Index(2) (“Composite Index”), which returned 5.24% and (16.47)%, respectively, for the same period.
Portfolio Specifics: The structure of the Portfolio was converted in April 2008, into a fund-of-funds structure. Rather than holding individual securities, the Portfolio now holds shares of various underlying funds, which represent a portion of the performance of the year.
Prior to the conversion, the domestic equity portion of the Portfolio underperformed its sub-benchmark, the Russell 3000® Index. On a relative basis, the larger-cap stocks were the weakest performers. In particular, stock selection was negative, particularly in the healthcare and industrials sectors. Allocation effect within the equity portion was minimal, as there were only modest deviations from the benchmark. During this period, we experienced a brief change in market leadership from growth to value, which was accompanied by a spike in volatility, but the valuation factors’ outperformance was short-lived and price momentum drove returns through the Portfolio’s conversion.
Prior to the conversion, the international portion of the Portfolio underperformed its sub-benchmark, the MSCI Europe, Australasia Far East® (“MSCI EAFE®”) Index.
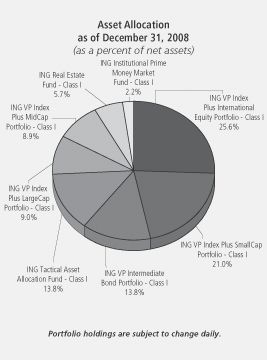
Asset Allocation
as of December 31, 2008
(as a percent of net assets)
| | |
ING VP Intermediate Bond Portfolio — Class I | | 52.0% |
ING VP Index Plus International Equity Portfolio — Class I | | 11.0% |
ING Real Estate Fund — Class I | | 9.2% |
ING Tactical Asset Allocation Fund — Class I | | 9.0% |
ING VP Index Plus SmallCap Portfolio — Class I | | 7.8% |
ING Institutional Prime Money Market
Fund — Class I | | 5.3% |
ING VP Index Plus LargeCap Portfolio — Class I | | 2.9% |
ING VP Index Plus MidCap Portfolio — Class I | | 2.9% |
Other Assets and Liabilities — Net | | (0.1)% |
| | |
Net Assets | | 100.0% |
| | |
Portfolio holdings are subject to change daily.
Negative selection effect in the industrials, utilities and materials sectors more than offset the favorable security selection within the financials and technology sectors.
Prior to the conversion, the fixed-income portion of the Portfolio also underperformed the Barclays Capital U.S. Aggregate Bond Index. During the period, both asset allocation and security selection were detractors. Security selection was a significant drag, but particularly for the month of March due to continued disruption in the mortgage market. Our interest rate strategy was beneficial for performance and, despite the fact we maintained a neutral duration posture for most of this partial reporting period, we maintained a steepened curve positioning, which benefited the Portfolio when heightened risk aversion led to increased demand for Treasuries.
Significant negative pricing action in March, driven by a dearth of liquidity, weighed heavily on returns for the mortgage portion of the Portfolio. An allocation to off-index collateralized mortgage obligations backed by non-agency collateral hurt performance.
Post conversion, performance was mixed for the underlying funds, with all posting negative absolute returns, but positive relative performance for many. Within domestic equity, relative performance was negative for the most part, with ING Tactical Asset Allocation Fund, ING VP Index Plus Mid Cap Portfolio and ING VP Index Plus Small Cap Portfolio underperforming their respective benchmarks. ING Tactical Asset Allocation Fund, which provides exposure to large-cap stocks and seeks to add value by engaging in a global tactical asset allocation overlay strategy, underperformed the Standard & Poor’s (“S&P”) 500® Index due mainly to the average long exposure to equity and short exposure to fixed income.
ING VP Index Plus Mid Cap Portfolio underperformed the S&P Mid Cap 400 Index due mainly to negative allocation effect, particularly by an underweight in utilities, which was the best relative performing sector during the period. ING VP Index Plus Small Cap Portfolio underperformed the S&P Small Cap 600 Index due to negative selection effect, predominantly in the financials, energy and industrials sectors. On the other hand, ING VP Index Plus Large Cap Portfolio outperformed the S&P 500® Index during the period, due mainly to positive stock selection. Of particular success was the selection in energy and financials sectors, both of which saw strong performance during the period.
Post conversion, the ING VP Index Plus International Equity Portfolio outperformed its benchmark, the MSCI EAFE® Index, before the deduction of Portfolio fees and expenses. This was due to a recovery of the predictive power of the sector models in the second half of the year. Overall, the mix of factors added modest value in the financials, materials and energy sectors. A new asset class was added to the Portfolio upon conversion, real estate, via the use of the ING Real Estate Fund. Since its addition, it has outperformed its benchmark, despite the negative returns in the real estate investment trust (“REIT”) asset class. For most of the period, the majority of the outperformance came from stock selection, led by portfolio holdings in the office, shopping center, mall, apartment and hotel sectors. Overweighting the strong healthcare sector also proved beneficial.
Post conversion, the ING VP Intermediate Bond Portfolio has underperformed its benchmark, the Barclays Capital U.S. Aggregate Bond Index. The bond market experienced an unprecedented year in volatility and dislocation. A large source of underperformance was the Portfolio’s underweight in Treasuries, which hurt when investors fled to their relative safety. The ING VP Intermediate Bond Portfolio was also overweight many of the sectors hit hardest by this risk aversion, including financials, corporate bonds and our off-benchmark holdings in non-agency residential mortgage-backed securities. The yield curve, duration and currency exposures in the ING VP Intermediate Bond Portfolio were largely beneficial throughout the year, but not by a margin large enough to nullify the negative selection effect.
Current Strategy and Outlook: Looking forward, we expect the recession to continue for the next two quarters, with growth resuming in the second half of 2009. We expect inflation to decline, and perhaps turn negative, but we don’t believe we are in the midst of a deflationary spiral. Finally, we expect a large fiscal stimulus to be enacted by Congress early in 2009. We ended the year overweight in equity versus fixed income, but would be looking to pare back our equity position once the effects of the fiscal stimulus are more evident. In our opinion, the market is near a bottom, although we expect the coming months to continue to be volatile.
The equity market is factoring in a growth slowdown well beyond what we feel will occur, and with a great number of policy responses from global governments already underway, we intend to stay the course. History has shown that chasing the market, either up or down, has not been a winning strategy.
| * | | Effective January 13, 2009, Brian Gendreau was replaced by Heather Hackett as co-portfolio manager to the Portfolio. |
| ** | | Formerly known as the Lehman Brothers U.S. Aggregate Bond Index. As of October 31, 2008, all Lehman Brothers indices were renamed: the words “Lehman Brothers” changed to “Barclays Capital.” |
Portfolio holdings and characteristics are subject to change and may not be representative of current holdings and characteristics. The outlook for this Portfolio may differ from that presented for other ING Funds. Performance for the different classes of shares will vary based on differences in fees associated with each class.
4
| | |
| PORTFOLIO MANAGERS’ REPORT | | ING VP STRATEGIC ALLOCATION CONSERVATIVE PORTFOLIO |
| | | | | | | | | | | | | | | | | | | |
| | | |
| | | Average Annual Total Returns for the Periods Ended December 31, 2008 | | | |
| | | | | 1 Year | | | 5 Year | | | 10 Year | | | Since Inception of Class ADV December 29, 2006 | | | Since Inception of Class S August 5, 2005 | | | |
| | | Class ADV | | (24.07 | )% | | — | | | — | | | (10.49 | )% | | — | | | |
| | | Class I | | (23.65 | )% | | (0.37 | )% | | 1.57 | % | | — | | | — | | | |
| | | Class S | | (23.92 | )% | | — | | | — | | | — | | | (3.66 | )% | | |
| | | Barclays Capital U.S. Aggregate Bond Index(1) | | 5.24 | % | | 4.65 | % | | 5.63 | % | | 6.10 | %(3) | | 5.08 | %(4) | | |
| | | Strategic Allocation Conservative Composite Index(2) | | (16.47 | )% | | 1.26 | % | | 3.06 | % | | (5.80 | )%(3) | | (0.78 | )%(4) | | |
Based on a $10,000 initial investment, the graph and table above illustrate the total return of ING VP Strategic Allocation Conservative Portfolio against the indices indicated. An index is unmanaged and has no cash in its portfolio, imposes no sales charges and incurs no operating expenses. An investor cannot invest directly in an index. The Portfolio’s performance is shown without the imposition of any expenses or charges which are, or may be, imposed under your annuity contract. Total returns would have been lower if such expenses or charges were included.
The performance graph and table do not reflect the deduction of taxes that a shareholder will pay on Portfolio distributions or the redemption of Portfolio shares.
The performance shown may include the effect of fee waivers and/or expense reimbursements by the Investment Adviser and/or other service providers, which have the effect of increasing total return. Had all fees and expenses been considered, the total returns would have been lower.
The performance update illustrates performance for a variable investment option available through a variable annuity contract. The performance shown indicates past performance and is not a projection or prediction of future results. Actual investment returns and principal value will fluctuate so that shares and/or units, at redemption, may be worth more or less than their original cost. Please call (800) 992-0180 to get performance through the most recent month end.
This report contains statements that may be “forward-looking” statements. Actual results may differ materially from those projected in the “forward-looking” statements.
The views expressed in this report reflect those of the portfolio managers, only through the end of the period as stated on the cover. The portfolio managers’ views are subject to change at any time based on market and other conditions.
Portfolio holdings are subject to change daily.
(1) | | The Barclays Capital U.S. Aggregate Bond Index is a widely recognized, unmanaged index of publicly issued fixed rate U.S. government, investment grade, mortgaged-backed and corporate debt securities. |
(2) | | The Strategic Allocation Conservative Composite Index is comprised of the asset class indices that correspond to the particular asset classes in which the Portfolio invests and their benchmark weightings. From time to time, adjustments have been made in the asset classes and/or weightings applicable to the Portfolio, and corresponding adjustments have been made to the composite. See page 10 for additional information. |
(3) | | Since inception performance for the indices is shown from January 1, 2007. |
(4) | | Since inception performance for the indices is shown from August 1, 2005. |
Effective March 1, 2002, ING Investments, LLC began serving as investment adviser and ING Investment Management Co., the former investment adviser, began serving as sub-adviser to the Portfolio. Effective April 7, 2008, the Portfolio was converted from a mutual fund, which invested directly in securities, to a fund-of-funds, which invests in other mutual funds.
5
| | |
| ING VP STRATEGIC ALLOCATION GROWTH PORTFOLIO | | PORTFOLIO MANAGERS’ REPORT |
ING VP Strategic Allocation Growth Portfolio (the “Portfolio”) seeks to provide capital appreciation. The Portfolio is managed by Paul Zemsky and Brian Gendreau, Portfolio Managers* of ING Investment Management Co. — the Sub-Adviser.
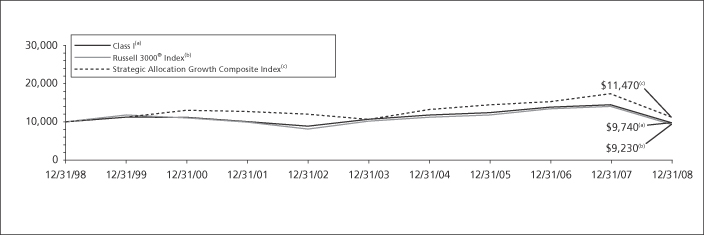
Performance: For the year ended December 31, 2008, the Portfolio’s Class I shares provided a total return of (36.13)% compared to the Russell 3000® Index(1) and the Strategic Allocation Growth Composite Index(2) (“Composite Index”), which returned (37.31)% and (32.93)%, respectively, for the same period.
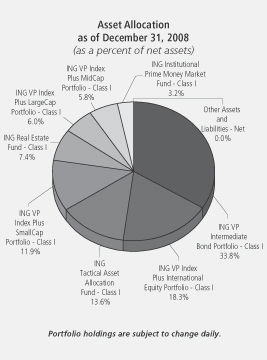
Portfolio Specifics: The structure of the Portfolio was converted in April 2008, into a fund-of-funds structure. Rather than holding individual securities, the Portfolio now holds shares of various underlying funds, which represent a portion of the performance of the year.
Prior to the conversion, the domestic equity portion of the Portfolio underperformed the Russell 3000® Index. On a relative basis, the larger-cap stocks were the weakest performers. In particular, stock selection was negative, particularly in the healthcare and industrials sectors. Allocation effect within the equity portion was minimal, as there were only modest deviations from the benchmark. During this period, we experienced a brief change in market leadership from growth to value, which was accompanied by a spike in volatility, but the valuation factors’ outperformance was short-lived and price momentum drove returns through the Portfolio’s conversion.
Prior to the conversion, the international portion of the Portfolio underperformed its sub-benchmark, the MSCI Europe, Australasia and Far East® (“MSCI EAFE®”) Index. Negative selection effect in the industrials, utilities and materials sectors more than offset the favorable security selection within the financials and technology sectors.
Prior to the conversion, the fixed-income portion of the Portfolio also underperformed its sub-benchmark, the Barclays Capital U.S. Aggregate Bond Index.** During the period, both asset allocation and security selection were detractors. Security selection was a significant drag, but particularly for the month of March due to continued disruption in the mortgage market. Our interest rate strategy was beneficial for performance and, despite the fact we maintained a neutral duration posture for most of this partial reporting period, we maintained a steepened curve positioning, which benefited the Portfolio when heightened risk aversion led to increased demand for Treasuries.
Significant negative pricing action in March, driven by a dearth of liquidity, weighed heavily on returns for the mortgage portion of the Portfolio. An allocation to off-index collateralized mortgage obligations backed by non-agency collateral hurt performance.
Post conversion, performance was mixed for the underlying funds, with all posting negative absolute returns, but positive relative performance for many. Within domestic equity, relative performance was negative for the most part, with ING Tactical Asset Allocation Fund, ING VP Index Plus Mid Cap Portfolio and ING VP Index Plus Small Cap Portfolio underperforming their respective benchmarks. ING Tactical Asset Allocation Fund, which provides exposure to large-cap stocks and seeks to add value by engaging in a global tactical asset allocation overlay strategy, underperformed the Standard & Poor’s (“S&P”) 500® Index due mainly to the average long exposure to equity and short exposure to fixed income.
ING VP Index Plus Mid Cap Portfolio underperformed the S&P Mid Cap 400 Index due mainly to negative allocation effect, particularly by an underweight in utilities, which was the best relative performing sector during the period. ING VP Index Plus Small Cap Portfolio underperformed the S&P Small Cap 600 Index due to negative selection effect, predominantly in the financials, energy and industrials sectors. On the other hand, ING VP Index Plus Large Cap Portfolio outperformed the S&P 500® Index during the period, due mainly to positive stock selection. Of particular success was the selection in energy and financials sectors, both of which saw strong performance during the period.
Post conversion, the ING VP Index Plus International Equity Portfolio outperformed its benchmark, the MSCI EAFE® Index, before the deduction of Portfolio fees and expenses. This was due to a recovery of the predictive power of the sector models in the second half of the year. Overall, the mix of factors added modest value in the financials, materials and energy sectors. A new asset class was added to the Portfolio upon conversion, real estate, via the use of the ING Real Estate Fund. Since its addition, it has outperformed its benchmark, despite the negative returns in the real estate investment trust (“REIT”) asset class. For most of the period, the majority of the outperformance came from stock selection, led by portfolio holdings in the office, shopping center, mall, apartment and hotel sectors. Overweighting the strong healthcare sector also proved beneficial.
Post conversion, the ING VP Intermediate Bond Portfolio has underperformed its benchmark, the Barclays Capital U.S. Aggregate Bond Index. The bond market experienced an unprecedented year in volatility and dislocation. A large source of underperformance was the Portfolio’s underweight in Treasuries, which hurt when investors fled to their relative safety. The ING VP Intermediate Bond Portfolio was also overweight many of the sectors hit hardest by this risk aversion, including financials, corporate bonds and our off-benchmark holdings in non-agency residential mortgage-backed securities. The yield curve, duration and currency exposures in the ING VP Intermediate Bond Portfolio were largely beneficial throughout the year, but not by a margin large enough to nullify the negative selection effect.
Current Strategy and Outlook: Looking forward, we expect the recession to continue for the next two quarters, with growth resuming in the second half of 2009. We expect inflation to decline, and perhaps turn negative, but we don’t believe we are in the midst of a deflationary spiral. Finally, we expect a large fiscal stimulus to be enacted by Congress early in 2009. We ended the year overweight in equity versus fixed income, but would be looking to pare back our equity position once the effects of the fiscal stimulus are more evident. In our opinion, the market is near a bottom, although we expect the coming months to continue to be volatile.
The equity market is factoring in a growth slowdown well beyond what we feel will occur, and with a great number of policy responses from global governments already underway, we intend to stay the course. History has shown that chasing the market, either up or down, has not been a winning strategy.
| * | | Effective January 13, 2009, Brian Gendreau was replaced by Heather Hackett as co-portfolio manager to the Portfolio. |
| ** | | Formerly known as the Lehman Brothers U.S. Aggregate Bond Index. As of October 31, 2008, all Lehman Brothers indices were renamed: the words “Lehman Brothers” changed to “Barclays Capital.” |
Portfolio holdings and characteristics are subject to change and may not be representative of current holdings and characteristics. The outlook for this Portfolio may differ from that presented for other ING Funds. Performance for the different classes of shares will vary based on differences in fees associated with each class.
6
| | |
| PORTFOLIO MANAGERS’ REPORT | | ING VP STRATEGIC ALLOCATION GROWTH PORTFOLIO |
| | | | | | | | | | | | | | | | | | | |
| | | |
| | | Average Annual Total Returns for the Periods Ended December 31, 2008 | | | |
| | | | | 1 Year | | | 5 Year | | | 10 Year | | | Since Inception of Class ADV December 29, 2006 | | | Since Inception of Class S August 5, 2005 | | | |
| | | Class ADV | | (36.27 | )% | | — | | | — | | | (18.28 | )% | | — | | | |
| | | Class I | | (36.13 | )% | | (2.01 | )% | | (0.27 | )% | | — | | | — | | | |
| | | Class S | | (36.19 | )% | | — | | | — | | | — | | | (7.07 | )% | | |
| | | Russell 3000® Index(1) | | (37.31 | )% | | (1.95 | )% | | (0.80 | )% | | (18.81 | )%(3) | | (7.10 | )%(4) | | |
| | | Strategic Allocation Growth Composite Index(2) | | (32.93 | )% | | (0.73 | )% | | 1.38 | % | | (15.58 | )%(3) | | (5.05 | )%(4) | | |
Based on a $10,000 initial investment, the graph and table above illustrate the total return of ING VP Strategic Allocation Growth Portfolio against the indices indicated. An index is unmanaged and has no cash in its portfolio, imposes no sales charges and incurs no operating expenses. An investor cannot invest directly in an index. The Portfolio’s performance is shown without the imposition of any expenses or charges which are, or may be, imposed under your annuity contract. Total returns would have been lower if such expenses or charges were included.
The performance graph and table do not reflect the deduction of taxes that a shareholder will pay on Portfolio distributions or the redemption of Portfolio shares.
The performance shown may include the effect of fee waivers and/or expense reimbursements by the Investment Adviser and/or other service providers, which have the effect of increasing total return. Had all fees and expenses been considered, the total returns would have been lower.
The performance update illustrates performance for a variable investment option available through a variable annuity contract. The performance shown indicates past performance and is not a projection or prediction of future results. Actual investment returns and principal value will fluctuate so that shares and/or units, at redemption, may be worth more or less than their original cost. Please call (800) 992-0180 to get performance through the most recent month end.
This report contains statements that may be “forward-looking” statements. Actual results may differ materially from those projected in the “forward-looking” statements.
The views expressed in this report reflect those of the portfolio managers, only through the end of the period as stated on the cover. The portfolio managers’ views are subject to change at any time based on market and other conditions.
Portfolio holdings are subject to change daily.
(1) | | The Russell 3000® Index is an unmanaged index that measures the performance of 3000 U.S. companies based on total market capitalization. |
(2) | | The Strategic Allocation Growth Composite Index is comprised of the asset class indices that correspond to the particular asset classes in which the Portfolio invests and their benchmark weightings. From time to time, adjustments have been made in the asset classes and/or weightings applicable to the Portfolio, and corresponding adjustments have been made to the composite. See page 10 for additional information. |
(3) | | Since inception performance for the indices is shown from January 1, 2007. |
(4) | | Since inception performance for the indices is shown from August 1, 2005. |
Effective March 1, 2002, ING Investments, LLC began serving as investment adviser and ING Investment Management Co., the former investment adviser, began serving as sub-adviser to the Portfolio. Effective April 7, 2008, the Portfolio was converted from a mutual fund, which invested directly in securities, to a fund-of-funds, which invests in other mutual funds.
7
| | |
| ING VP STRATEGIC ALLOCATION MODERATE PORTFOLIO | | PORTFOLIO MANAGERS’ REPORT |
ING VP Strategic Allocation Moderate Portfolio (the “Portfolio”) seeks to provide total return (i.e., income and capital appreciation, both realized and unrealized). The Portfolio is managed by Paul Zemksy and Brian Gendreau, Portfolio Managers* of ING Investment Management Co. — the Sub-Adviser.
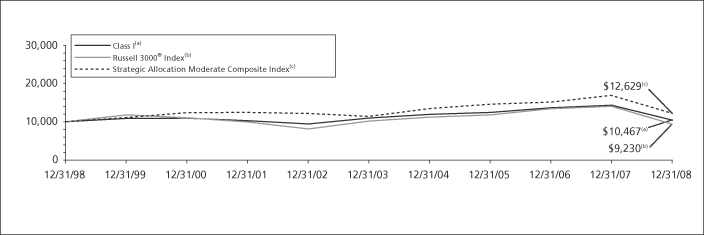
Performance: For the year ended December 31, 2008, the Portfolio’s Class I shares provided a total return of (30.48)% compared to the Russell 3000® Index(1) and the ING Strategic Allocation Moderate Composite Index(2) (“Composite Index”), which returned (37.31)% and (25.26)%, respectively, for the same period.
Portfolio Specifics: The structure of the Portfolio was converted in April 2008, into a fund-of-funds structure. Rather than holding individual securities, the Portfolio now holds shares of various underlying funds, which represent a portion of the performance of the year.
Prior to the conversion, the domestic equity portion of the Portfolio underperformed the Russell 3000® Index. On a relative basis, the larger-cap stocks were the weakest performers. In particular, stock selection was negative, particularly in the healthcare and industrials sectors. Allocation effect within the equity portion was minimal, as there were only modest deviations from the benchmark. During this period, we experienced a brief change in market leadership from growth to value, which was accompanied by a spike in volatility, but the valuation factors’ outperformance was short-lived and price momentum drove returns through the Portfolio’s conversion.
Prior to the conversion, the international portion of the Portfolio underperformed its sub-benchmark, the MSCI Europe, Australasia and Far East® (“MSCI EAFE®”) Index. Negative selection effect in the industrials, utilities and materials sectors more than offset the favorable security selection within the financials and technology sectors.
Prior to the conversion, the fixed-income portion of the Portfolio also underperformed its sub-benchmark, the Barclays Capital U.S. Aggregate Bond Index.** During the period, both asset allocation and security selection were detractors. Security selection was a significant drag, but particularly for the month of March due to continued disruption in the mortgage market. Our interest rate strategy was beneficial for performance and, despite the fact we maintained a neutral duration posture for most of this partial reporting period, we maintained a steepened curve positioning, which benefited the Portfolio when heightened risk aversion led to increased demand for Treasuries.
Significant negative pricing action in March, driven by a dearth of liquidity, weighed heavily on returns for the mortgage portion of the Portfolio. An allocation to off-index collateralized mortgage obligations backed by non-agency collateral hurt performance.
Post conversion, performance was mixed for the underlying funds, with all posting negative absolute returns, but positive relative performance for many. Within domestic equity, relative performance was negative for the most part, with ING Tactical Asset Allocation Fund, ING VP Index Plus Mid Cap Portfolio and ING VP Index Plus Small Cap Portfolio underperforming their respective benchmarks. ING Tactical Asset Allocation Fund, which provides exposure to large-cap stocks and seeks to add value by engaging in a global tactical asset allocation overlay strategy, underperformed the Standard & Poor’s (“S&P”) 500® Index due mainly to the average long exposure to equity and short exposure to fixed income.
ING VP Index Plus Mid Cap Portfolio underperformed the S&P Mid Cap 400 Index due mainly to negative allocation effect, particularly by an underweight in utilities, which was the best relative performing sector during the period. ING VP Index Plus Small Cap Portfolio underperformed the S&P Small Cap 600 Index due to negative selection effect, predominantly in the financials, energy and industrials sectors. On the other hand, ING VP Index Plus Large Cap Portfolio outperformed the S&P 500® Index during the period, due mainly to positive stock selection. Of particular success was the selection in energy and financials sectors, both of which saw strong performance during the period.
Post conversion, the ING VP Index Plus International Equity Portfolio outperformed its benchmark, the MSCI EAFE® Index, before the deduction of Portfolio fees and expenses. This was due to a recovery of the predictive power of the sector models in the second half of the year. Overall, the mix of factors added modest value in the financials, materials and energy sectors. A new asset class was added to the Portfolio upon conversion, real estate, via the use of the ING Real Estate Fund. Since its addition, it has outperformed its benchmark, despite the negative returns in the real estate investment trust (“REIT”) asset class. For most of the period, the majority of the outperformance came from stock selection, led by portfolio holdings in the office, shopping center, mall, apartment and hotel sectors. Overweighting the strong healthcare sector also proved beneficial.
Post conversion, the ING VP Intermediate Bond Portfolio has underperformed its benchmark, the Barclays Capital U.S. Aggregate Bond Index. The bond market experienced an unprecedented year in volatility and dislocation. A large source of underperformance was the Portfolio’s underweight in Treasuries, which hurt when investors fled to their relative safety. The ING VP Intermediate Bond Portfolio was also overweight many of the sectors hit hardest by this risk aversion, including financials, corporate bonds and our off-benchmark holdings in non-agency residential mortgage-backed securities. The yield curve, duration and currency exposures in the ING VP Intermediate Bond Portfolio were largely beneficial throughout the year, but not by a margin large enough to nullify the negative selection effect.
Current Strategy and Outlook: Looking forward, we expect the recession to continue for the next two quarters, with growth resuming in the second half of 2009. We expect inflation to decline, and perhaps turn negative, but we don’t believe we are in the midst of a deflationary spiral. Finally, we expect a large fiscal stimulus to be enacted by Congress early in 2009. We ended the year overweight in equity versus fixed income, but would be looking to pare back our equity position once the effects of the fiscal stimulus are more evident. In our opinion, the market is near a bottom, although we expect the coming months to continue to be volatile.
The equity market is factoring in a growth slowdown well beyond what we feel will occur, and with a great number of policy responses from global governments already underway, we intend to stay the course. History has shown that chasing the market, either up or down, has not been a winning strategy.
| * | | Effective January 13, 2009, Brian Gendreau was replaced by Heather Hackett as co-portfolio manager to the Portfolio. |
| ** | | Formerly known as the Lehman Brothers U.S. Aggregate Bond Index. As of October 31, 2008, all Lehman Brothers indices were renamed: the words “Lehman Brothers” changed to “Barclays Capital.” |
Portfolio holdings and characteristics are subject to change and may not be representative of current holdings and characteristics. The outlook for this Portfolio may differ from that presented for other ING Funds. Performance for the different classes of shares will vary based on differences in fees associated with each class.
8
| | |
| PORTFOLIO MANAGERS’ REPORT | | ING VP STRATEGIC ALLOCATION MODERATE PORTFOLIO |
| | | | | | | | | | | | | | | | | | | |
| | | |
| | | Average Annual Total Returns for the Periods Ended December 31, 2008 | | | |
| | | | | 1 Year | | | 5 Year | | | 10 Year | | | Since Inception of Class ADV December 29, 2006 | | | Since Inception of Class S June 7, 2005 | | | |
| | | Class ADV | | (30.75 | )% | | — | | | — | | | (14.73 | )% | | — | | | |
| | | Class I | | (30.48 | )% | | (1.21 | )% | | 0.46 | % | | — | | | — | | | |
| | | Class S | | (30.68 | )% | | — | | | — | | | — | | | (4.80 | )% | | |
| | | Russell 3000® Index(1) | | (37.31 | )% | | (1.95 | )% | | (0.80 | )% | | (18.81 | )%(3) | | (5.54 | )%(4) | | |
| | | Strategic Allocation Moderate Composite Index(2) | | (25.26 | )% | | 0.34 | % | | 2.36 | % | | (10.90 | )%(3) | | (2.03 | )%(4) | | |
Based on a $10,000 initial investment, the graph and table above illustrate the total return of ING VP Strategic Allocation Moderate Portfolio against the indices indicated. An index is unmanaged and has no cash in its portfolio, imposes no sales charges and incurs no operating expenses. An investor cannot invest directly in an index. The Portfolio’s performance is shown without the imposition of any expenses or charges which are, or may be, imposed under your annuity contract. Total returns would have been lower if such expenses or charges were included.
The performance graph and table do not reflect the deduction of taxes that a shareholder will pay on Portfolio distributions or the redemption of Portfolio shares.
The performance shown may include the effect of fee waivers and/or expense reimbursements by the Investment Adviser and/or other service providers, which have the effect of increasing total return. Had all fees and expenses been considered, the total returns would have been lower.
The performance update illustrates performance for a variable investment option available through a variable annuity contract. The performance shown indicates past performance and is not a projection or prediction of future results. Actual investment returns and principal value will fluctuate so that shares and/or units, at redemption, may be worth more or less than their original cost. Please call (800) 992-0180 to get performance through the most recent month end.
This report contains statements that may be “forward-looking” statements. Actual results may differ materially from those projected in the “forward-looking” statements.
The views expressed in this report reflect those of the portfolio managers, only through the end of the period as stated on the cover. The portfolio managers’ views are subject to change at any time based on market and other conditions.
Portfolio holdings are subject to change daily.
(1) | | The Russell 3000® Index is an unmanaged index that measures the performance of 3000 U.S. companies based on total market capitalization. |
(2) | | The Strategic Allocation Moderate Composite Index is comprised of the asset class indices that correspond to the particular asset classes in which the Portfolio invests and their benchmark weightings. From time to time, adjustments have been made in the asset classes and/or weightings applicable to the Portfolio, and corresponding adjustments have been made to the composite. See page 10 for additional information. |
(3) | | Since inception performance for the indices is shown from January 1, 2007. |
(4) | | Since inception performance for the indices is shown from June 1, 2005. |
Effective March 1, 2002, ING Investments, LLC began serving as investment adviser and ING Investment Management Co., the former investment adviser, began serving as sub-adviser to the Portfolio. Effective April 7, 2008, the Portfolio was converted from a mutual fund, which invested directly in securities, to a fund-of-funds, which invests in other mutual funds.
9
| | |
| ING VP STRATEGIC ALLOCATION PORTFOLIOS | | PORTFOLIO MANAGERS’ REPORT |
ING VP Strategic Allocation Conservative Portfolio, ING VP Strategic Allocation Growth Portfolio and ING VP Strategic Allocation Moderate Portfolio (collectively, the “Portfolios”) seek to obtain their individual investment objectives by investing in a combination of underlying funds (“Underlying Funds”) according to each Portfolio’s fixed formula. The Portfolios are managed by ING Investment Management Co. (“ING IM”) — the Sub-Adviser.
The Sub-Adviser uses the Strategic Allocation Conservative Composite, Strategic Allocation Growth Composite, and Strategic Allocation Moderate
Composite indices (each a “Composite Index”) as benchmarks to which it compares the performance of ING VP Strategic Allocation Conservative Portfolio, ING VP Strategic Allocation Growth Portfolio and ING VP Strategic Allocation Moderate Portfolio, respectively. Each Composite Index is a blended index that is derived from the asset class comparative indices set out in the chart below. The chart shows the weightings for each asset class comparative index represented in each benchmark Composite Index, as a percentage of the Composite Index.
| | | | | | | | | | | | | | | | | | | | | | | | | |
| | | | | S&P 500®
Index(1) | | | S&P MidCap 400 Index(2) | | | S&P SmallCap 600 Index(3) | | | MSCI EAFE® Index(4) | | | Dow Jones Wilshire Real Estate Securities Index(5) | | | Barclays Capital U.S. Aggregate Bond Index(6) | | | 30-Day U.S. T-Bill(7) | | | |
| | VP Strategic Allocation Conservative Composite | | 18 | % | | 3 | % | | 3 | % | | 11 | % | | 10 | % | | 50 | % | | 5 | % | | |
| | VP Strategic Allocation Growth Composite | | 36 | % | | 9 | % | | 9 | % | | 25 | % | | 6 | % | | 13 | % | | 2 | % | | |
| | VP Strategic Allocation Moderate Composite | | 27 | % | | 6 | % | | 6 | % | | 18 | % | | 8 | % | | 32 | % | | 3 | % | | |
(1) | | The S&P 500® Index is an unmanaged index that measures the performance of securities of approximately 500 of the largest companies in the U.S. |
(2) | | The S&P MidCap 400 Index is a market capitalization-weighted index of 400 mid-capitalization stocks chosen for market size, liquidity, and industry group representation. |
(3) | | The S&P SmallCap 600 Index is an unmanaged index that measures the performance of the small-size company segment of the U.S. market. |
(4) | | The MSCI EAFE® Index is an unmanaged index that measures the performance of securities listed on exchanges in markets in Europe, Australia and the Far East. |
(5) | | The Dow Jones Wilshire Real Estate Securities Index consists of REITs and real estate operating companies. |
(6) | | The Barclays Capital U.S. Aggregate Bond Index, formerly known as the Lehman Brothers U.S. Aggregate Bond Index, is a widely recognized, unmanaged index of publicly issued fixed rate U.S. government, investment grade, mortgage-backed, asset backed and corporate debt securities. |
(7) | | The 30-Day U.S. T-Bill is a U.S government issued short-term debt sold at a discount and then redeemed at maturity at the full face value. |
| | | | | | | | | | | | | |
| | | Target Allocations(1) | | ING VP Strategic Allocation Conservative Portfolio | | | ING VP Strategic Allocation Growth Portfolio | | | ING VP Strategic Allocation Moderate Portfolio | | | |
| | U.S. Large-Capitalization Stocks | | 18 | % | | 36 | % | | 27 | % | | |
| | U.S. Mid-Capitalization Stocks | | 3 | % | | 9 | % | | 6 | % | | |
| | U.S. Small-Capitalization Stocks | | 3 | % | | 9 | % | | 6 | % | | |
| | Non-U.S./International Stocks | | 11 | % | | 25 | % | | 18 | % | | |
| | Real Estate Stocks | | 10 | % | | 6 | % | | 8 | % | | |
| | Fixed-Income Securities | | 50 | % | | 13 | % | | 32 | % | | |
| | Cash | | 5 | % | | 2 | % | | 3 | % | | |
| | | | | | | | | | | | | |
| | | | 100 | % | | 100 | % | | 100 | % | | |
(1) | | Portfolio’s current approximate target investment allocations (expressed as a percentage of its net assets). As these are target allocations, the actual allocations of each Portfolio’s assets may deviate from the percentages shown. Although the Portfolios expect to be fully invested at all times, they may maintain liquidity reserves to meet redemption requests. |
10
All indices are unmanaged.
An investor cannot invest directly in an index.
SHAREHOLDER EXPENSE EXAMPLES (UNAUDITED)
As a shareholder of a Portfolio, you incur two types of costs: (1) transaction costs, including redemption fees; and exchange fees; and (2) ongoing costs, including management fees, distribution and/or service (12b-1) fees, and other Portfolio expenses. These Examples are intended to help you understand your ongoing costs (in dollars) of investing in a Portfolio and to compare these costs with the ongoing costs of investing in other mutual funds.
The Examples are based on an investment of $1,000 invested at the beginning of the period and held for the
entire period from July 1, 2008 to December 31, 2008. The Portfolios’ expenses are shown without the imposition of any charges which are, or may be, imposed under your annuity contract. Expenses would have been higher if such charges were included.
Actual Expenses
The first section of the table shown, “Actual Portfolio Return,” provides information about actual account values and actual expenses. You may use the information in this section, together with the amount you invested, to estimate the expenses that you paid over the period. Simply divide your account value by $1,000 (for example, an $8,600 account value divided by $1,000 = 8.6), then multiply the result by the number in the first section under the heading entitled “Expenses Paid During the Period” to estimate the expenses you paid on your account during this period.
Hypothetical Example for Comparison Purposes
The second section of the table shown, “Hypothetical (5% return before expenses),” provides information about hypothetical account values and hypothetical expenses based on the Portfolio’s actual expense ratio and an assumed rate of return of 5% per year before expenses, which is not the Portfolio’s actual return. The hypothetical account values and expenses may not be used to estimate the actual ending account balance or expenses you paid for the period. You may use this information to compare the ongoing costs of investing in the Portfolio and other mutual funds. To do so, compare this 5% hypothetical example with the 5% hypothetical examples that appear in the shareholder reports of the other mutual funds.
Please note that the expenses shown in the table are meant to highlight your ongoing costs only and do not reflect any transactional costs, such as redemption fees or exchange fees. Therefore, the hypothetical lines of the table are useful in comparing ongoing costs only, and will not help you determine the relative total costs of owning different mutual funds. In addition, if these transactional costs were included, your costs would have been higher.
| | | | | | | | | | | | | | | | | | | | | | | | |
| | | Actual Portfolio Return | | Hypothetical (5% return before expenses) |
| | | Beginning Account Value July 1, 2008 | | Ending Account Value December 31, 2008 | | Annualized Expense Ratio* | | | Expenses Paid During the Period Ended December 31, 2008** | | Beginning Account Value July 1, 2008 | | Ending Account Value December 31, 2008 | | Annualized Expense Ratio* | | | Expenses Paid During the Period Ended December 31, 2008** |
ING VP Strategic Allocation Conservative Portfolio | | | | | | | | | | | | |
Class ADV | | $ | 1,000.00 | | $ | 816.20 | | 0.77 | % | | $ | 3.52 | | $ | 1,000.00 | | $ | 1,021.27 | | 0.77 | % | | $ | 3.91 |
Class I | | $ | 1,000.00 | | $ | 817.40 | | 0.27 | % | | $ | 1.23 | | $ | 1,000.00 | | $ | 1,023.78 | | 0.27 | % | | $ | 1.37 |
Class S | | $ | 1,000.00 | | $ | 815.50 | | 0.52 | % | | $ | 2.37 | | $ | 1,000.00 | | $ | 1,022.52 | | 0.52 | % | | $ | 2.64 |
ING VP Strategic Allocation Growth Portfolio | | | | | | | | | | | | | | | | |
Class ADV | | $ | 1,000.00 | | $ | 719.60 | | 0.83 | % | | $ | 3.59 | | $ | 1,000.00 | | $ | 1,020.96 | | 0.83 | % | | $ | 4.22 |
Class I | | $ | 1,000.00 | | $ | 719.20 | | 0.33 | % | | $ | 1.43 | | $ | 1,000.00 | | $ | 1,023.48 | | 0.33 | % | | $ | 1.68 |
Class S | | $ | 1,000.00 | | $ | 719.20 | | 0.58 | % | | $ | 2.51 | | $ | 1,000.00 | | $ | 1,022.22 | | 0.58 | % | | $ | 2.95 |
ING VP Strategic Allocation Moderate Portfolio | | | | | | | | | |
Class ADV | | $ | 1,000.00 | | $ | 766.50 | | 0.81 | % | | $ | 3.60 | | $ | 1,000.00 | | $ | 1,021.06 | | 0.81 | % | | $ | 4.12 |
Class I | | $ | 1,000.00 | | $ | 766.60 | | 0.31 | % | | $ | 1.38 | | $ | 1,000.00 | | $ | 1,023.58 | | 0.31 | % | | $ | 1.58 |
Class S | | $ | 1,000.00 | | $ | 765.00 | | 0.56 | % | | $ | 2.48 | | $ | 1,000.00 | | $ | 1,022.32 | | 0.56 | % | | $ | 2.85 |
| * | | Expense ratios do not include expenses of the underlying funds. |
| ** | | Expenses are equal to each Portfolio’s respective annualized expense ratios multiplied by the average account value over the period, multiplied by 184/366 to reflect the most recent fiscal half-year. |
11
REPORT OF INDEPENDENT REGISTERED PUBLIC ACCOUNTING FIRM
The Shareholders and Board of Directors
ING Strategic Allocation Portfolios, Inc.
We have audited the accompanying statements of assets and liabilities, including the portfolios of investments, of ING VP Strategic Allocation Conservative Portfolio, ING VP Strategic Allocation Growth Portfolio, and ING VP Strategic Allocation Moderate Portfolio, each a series of ING Strategic Allocation Portfolios, Inc., as of December 31, 2008, and the related statements of operations for the year then ended, the statements of changes in net assets for each of the years in the two-year period then ended, and the financial highlights for each of the years or periods in the five-year period then ended. These financial statements and financial highlights are the responsibility of management. Our responsibility is to express an opinion on these financial statements and financial highlights based on our audits.
We conducted our audits in accordance with the standards of the Public Company Accounting Oversight Board (United States). Those standards require that we plan and perform the audit to obtain reasonable assurance about whether the financial statements and financial highlights are free of material misstatement. An audit includes examining, on a test basis, evidence supporting the amounts and disclosures in the financial statements. Our procedures included confirmation of securities owned as of December 31, 2008, by correspondence with the transfer agent of the underlying funds. An audit also includes assessing the accounting principles used and significant estimates made by management, as well as evaluating the overall financial statement presentation. We believe that our audits provide a reasonable basis for our opinion.
In our opinion, the financial statements and financial highlights referred to above present fairly, in all material respects, the financial position of the aforementioned portfolios as of December 31, 2008, and the results of their operations, the changes in their net assets, and the financial highlights for the periods specified in the first paragraph above, in conformity with U.S. generally accepted accounting principles.

Boston, Massachusetts
February 27, 2009
12
STATEMENTS OF ASSETS AND LIABILITIESASOF DECEMBER 31, 2008
| | | | | | | | | | | | |
| | | ING VP Strategic Allocation Conservative Portfolio | | | ING VP Strategic Allocation Growth Portfolio | | | ING VP Strategic Allocation Moderate Portfolio | |
ASSETS: | | | | | | | | | | | | |
Investments in affiliated underlying funds* | | $ | 83,049,555 | | | $ | 145,012,337 | | | $ | 150,239,604 | |
Short-term investments in affiliated underlying funds** | | | 4,631,390 | | | | 3,204,696 | | | | 4,995,158 | |
Cash | | | 277 | | | | 1,674 | | | | — | |
Receivables: | | | | | | | | | | | | |
Investments in affiliated underlying funds sold | | | 435,664 | | | | 399,302 | | | | 665,985 | |
Fund shares sold | | | 74 | | | | 20,401 | | | | 1,252 | |
Dividends and interest | | | 144,502 | | | | 262,413 | | | | 263,607 | |
Prepaid expenses | | | 8,526 | | | | 8,977 | | | | 9,319 | |
| | | | | | | | | | | | |
Total assets | | | 88,269,988 | | | | 148,909,800 | | | | 156,174,925 | |
| | | | | | | | | | | | |
LIABILITIES: | | | | | | | | | | | | |
Payable for investment in affiliated underlying funds purchased | | | 139,061 | | | | 210,220 | | | | 252,234 | |
Payable for fund shares redeemed | | | 436,015 | | | | 421,378 | | | | 667,237 | |
Payable to affiliates | | | 10,488 | | | | 17,555 | | | | 21,169 | |
Payable for directors fees | | | 2,930 | | | | 2,400 | | | | 7,155 | |
Other accrued expenses and liabilities | | | 55,836 | | | | 73,887 | | | | 69,423 | |
| | | | | | | | | | | | |
Total liabilities | | | 644,330 | | | | 725,440 | | | | 1,017,218 | |
| | | | | | | | | | | | |
NET ASSETS | | $ | 87,625,658 | | | $ | 148,184,360 | | | $ | 155,157,707 | |
| | | | | | | | | | | | |
NET ASSETS WERE COMPRISED OF: | | | | | | | | | | | | |
Paid-in capital | | $ | 112,477,253 | | | $ | 212,951,200 | | | $ | 210,910,831 | |
Undistributed net investment income | | | 7,328,644 | | | | 15,498,327 | | | | 14,470,427 | |
Accumulated net realized gain (loss) on affiliated underlying funds, investments, foreign currency related transactions, futures, and swaps | | | (3,439,348 | ) | | | 2,987,306 | | | | (1,577,256 | ) |
Net unrealized depreciation on affiliated underlying funds and foreign currency related transactions | | | (28,740,891 | ) | | | (83,252,473 | ) | | | (68,646,295 | ) |
| | | | | | | | | | | | |
NET ASSETS | | $ | 87,625,658 | | | $ | 148,184,360 | | | $ | 155,157,707 | |
| | | | | | | | | | | | |
| | | | | | | | | | | | |
* Cost of investments in affiliated underlying funds | | $ | 111,791,029 | | | $ | 228,269,782 | | | $ | 218,887,144 | |
** Cost of short-term investments in affiliated underlying funds | | $ | 4,631,390 | | | $ | 3,204,696 | | | $ | 4,995,158 | |
| | | | | | | | | | | | |
Class ADV: | | | | | | | | | | | | |
Net assets | | $ | 677 | | | $ | 535 | | | $ | 599 | |
Shares authorized | | | 100,000,000 | | | | 100,000,000 | | | | 100,000,000 | |
Par value | | $ | 0.001 | | | $ | 0.001 | | | $ | 0.001 | |
Shares outstanding | | | 75 | | | | 59 | | | | 66 | |
Net asset value and redemption price per share | | $ | 9.06 | | | $ | 9.01 | | | $ | 9.06 | |
Class I: | | | | | | | | | | | | |
Net assets | | $ | 86,257,410 | | | $ | 146,861,673 | | | $ | 152,965,343 | |
Shares authorized | | | 100,000,000 | | | | 100,000,000 | | | | 100,000,000 | |
Par value | | $ | 0.001 | | | $ | 0.001 | | | $ | 0.001 | |
Shares outstanding | | | 9,446,743 | | | | 16,242,571 | | | | 16,818,614 | |
Net asset value and redemption price per share | | $ | 9.13 | | | $ | 9.04 | | | $ | 9.10 | |
Class S: | | | | | | | | | | | | |
Net assets | | $ | 1,367,571 | | | $ | 1,322,152 | | | $ | 2,191,765 | |
Shares authorized | | | 100,000,000 | | | | 100,000,000 | | | | 100,000,000 | |
Par value | | $ | 0.001 | | | $ | 0.001 | | | $ | 0.001 | |
Shares outstanding | | | 151,004 | | | | 147,150 | | | | 242,158 | |
Net asset value and redemption price per share | | $ | 9.06 | | | $ | 8.99 | | | $ | 9.05 | |
See Accompanying Notes to Financial Statements
13
STATEMENTS OF OPERATIONSFORTHE YEAR ENDED DECEMBER 31, 2008
| | | | | | | | | | | | |
| | | ING VP Strategic Allocation Conservative Portfolio | | | ING VP Strategic Allocation Growth Portfolio | | | ING VP Strategic Allocation Moderate Portfolio | |
INVESTMENT INCOME: | | | | | | | | | | | | |
Dividends, net of foreign taxes withheld*(1) | | $ | 3,926,533 | | | $ | 6,097,659 | | | $ | 6,749,996 | |
Interest | | | 863,382 | | | | 421,681 | | | | 903,623 | |
Securities lending income, net | | | 108,549 | | | | 111,234 | | | | 157,759 | |
| | | | | | | | | | | | |
Total investment income | | | 4,898,464 | | | | 6,630,574 | | | | 7,811,378 | |
| | | | | | | | | | | | |
EXPENSES: | | | | | | | | | | | | |
Investment management fees | | | 271,952 | | | | 504,716 | | | | 508,646 | |
Distribution and service fees: | | | | | | | | | | | | |
Class ADV | | | 6 | | | | 6 | | | | 6 | |
Class S | | | 4,069 | | | | 3,640 | | | | 5,726 | |
Transfer agent fees | | | 354 | | | | 665 | | | | 593 | |
Administrative service fees | | | 63,114 | | | | 115,341 | | | | 117,331 | |
Shareholder reporting expense | | | 19,677 | | | | 65,991 | | | | 66,320 | |
Registration fees | | | — | | | | 197 | | | | 299 | |
Professional fees | | | 33,655 | | | | 37,344 | | | | 45,496 | |
Custody and accounting expense | | | 42,573 | | | | 51,247 | | | | 39,031 | |
Directors fees | | | 5,774 | | | | 18,604 | | | | 19,170 | |
Miscellaneous expense | | | 8,087 | | | | 12,727 | | | | 14,482 | |
Interest Expense | | | 911 | | | | 771 | | | | 1,526 | |
| | | | | | | | | | | | |
Total expenses | | | 450,172 | | | | 811,249 | | | | 818,626 | |
Net waived and reimbursed fees | | | (132,810 | ) | | | (110,361 | ) | | | (146,843 | ) |
| | | | | | | | | | | | |
Net expenses | | | 317,362 | | | | 700,888 | | | | 671,783 | |
| | | | | | | | | | | | |
Net investment income | | | 4,581,102 | | | | 5,929,686 | | | | 7,139,595 | |
| | | | | | | | | | | | |
REALIZED AND UNREALIZED GAIN (LOSS) ON AFFILIATED UNDERLYING FUNDS, INVESTMENTS, FOREIGN CURRENCY RELATED TRANSACTIONS, FUTURES, AND SWAPS | | | | | | | | | | | | |
Net realized gain (loss) on: | | | | | | | | | | | | |
Capital gain distributions from affiliated underlying funds | | | 3,947,139 | | | | 14,720,375 | | | | 11,003,906 | |
Net realized loss on sale of affiliated underlying funds | | | (3,661,370 | ) | | | (7,642,517 | ) | | | (8,239,190 | ) |
Investments | | | (1,030,583 | ) | | | 6,864,955 | | | | 4,273,425 | |
Foreign currency related transactions | | | 665 | | | | 3,916 | | | | 3,744 | |
Futures | | | 546,955 | | | | 23,203 | | | | 470,606 | |
Swaps | | | (21,370 | ) | | | (13,243 | ) | | | (23,618 | ) |
| | | | | | | | | | | | |
Net realized gain (loss) on affiliated underlying funds, investments, foreign currency related transactions, futures, and swaps | | | (218,564 | ) | | | 13,956,689 | | | | 7,488,873 | |
| | | | | | | | | | | | |
Net change in unrealized appreciation or depreciation on: | | | | | | | | | | | | |
Affiliated underlying funds | | | (28,741,474 | ) | | | (83,257,445 | ) | | | (68,647,540 | ) |
Investments | | | (5,105,078 | ) | | | (25,330,898 | ) | | | (19,985,719 | ) |
Foreign currency related transactions | | | 55 | | | | (529 | ) | | | 281 | |
Futures | | | (14,927 | ) | | | 50,884 | | | | (48,155 | ) |
Swaps | | | (1,256 | ) | | | (775 | ) | | | (1,384 | ) |
| | | | | | | | | | | | |
Net change in unrealized appreciation or depreciation on affiliated underlying funds, investments, foreign currency related transactions, futures, and swaps | | | (33,862,680 | ) | | | (108,538,763 | ) | | | (88,682,517 | ) |
| | | | | | | | | | | | |
Net realized and unrealized loss on affiliated underlying funds, investments, foreign currency related transactions, futures, and swaps | | | (34,081,244 | ) | | | (94,582,074 | ) | | | (81,193,644 | ) |
| | | | | | | | | | | | |
Decrease in net assets resulting from operations | | $ | (29,500,142 | ) | | $ | (88,652,388 | ) | | $ | (74,054,049 | ) |
| | | | | | | | | | | | |
| | | | | | | | | | | | |
* Foreign taxes withheld | | $ | 2,535 | | | $ | 15,999 | | | $ | 11,608 | |
(1) Dividends from affiliated underlying funds | | $ | 3,671,578 | | | $ | 5,075,802 | | | $ | 5,924,344 | |
See Accompanying Notes to Financial Statements
14
STATEMENTS OF CHANGES IN NET ASSETS
| | | | | | | | | | | | | | | | |
| | | ING VP Strategic Allocation Conservative Portfolio | | | ING VP Strategic Allocation Growth Portfolio | |
| | | Year Ended December 31, 2008 | | | Year Ended December 31, 2007 | | | Year Ended December 31, 2008 | | | Year Ended December 31, 2007 | |
FROM OPERATIONS: | | | | | | | | | | | | | | | | |
Net investment income | | $ | 4,581,102 | | | $ | 4,851,387 | | | $ | 5,929,686 | | | $ | 5,209,628 | |
Net realized gain (loss) on affiliated underlying funds, investments, foreign currency related transactions, futures, and swaps | | | (218,564 | ) | | | 10,002,461 | | | | 13,956,689 | | | | 31,053,080 | |
Net change in unrealized appreciation or depreciation on affiliated underlying funds, investments, foreign currency related transactions, futures, and swaps | | | (33,862,680 | ) | | | (6,765,319 | ) | | | (108,538,763 | ) | | | (21,450,563 | ) |
| | | | | | | | | | | | | | | | |
Increase (decrease) in net assets resulting from operations | | | (29,500,142 | ) | | | 8,088,529 | | | | (88,652,388 | ) | | | 14,812,145 | |
| | | | | | | | | | | | | | | | |
FROM DISTRIBUTIONS TO SHAREHOLDERS: | | | | | | | | | | | | | | | | |
Net investment income: | | | | | | | | | | | | | | | | |
Class ADV | | | (35 | ) | | | (34 | ) | | | (17 | ) | | | (18 | ) |
Class I | | | (4,826,048 | ) | | | (4,671,907 | ) | | | (5,205,257 | ) | | | (5,100,107 | ) |
Class S | | | (60,248 | ) | | | (26,838 | ) | | | (20,702 | ) | | | (4,948 | ) |
Net realized gains: | | | | | | | | | | | | | | | | |
Class ADV | | | (75 | ) | | | (26 | ) | | | (116 | ) | | | (60 | ) |
Class I | | | (9,527,565 | ) | | | (3,523,332 | ) | | | (29,584,058 | ) | | | (17,046,119 | ) |
Class S | | | (124,012 | ) | | | (21,032 | ) | | | (122,997 | ) | | | (18,055 | ) |
| | | | | | | | | | | | | | | | |
Total distributions | | | (14,537,983 | ) | | | (8,243,169 | ) | | | (34,933,147 | ) | | | (22,169,307 | ) |
| | | | | | | | | | | | | | | | |
FROM CAPITAL SHARE TRANSACTIONS: | | | | | | | | | | | | | | | | |
Net proceeds from sale of shares | | | 8,825,341 | | | | 14,766,602 | | | | 10,222,946 | | | | 13,458,976 | |
Reinvestment of distributions | | | 14,537,872 | | | | 8,243,110 | | | | 34,933,017 | | | | 22,169,228 | |
| | | | | | | | | | | | | | | | |
| | | 23,363,213 | | | | 23,009,712 | | | | 45,155,963 | | | | 35,628,204 | |
Cost of shares redeemed | | | (30,167,551 | ) | | | (31,501,546 | ) | | | (43,698,895 | ) | | | (56,718,248 | ) |
| | | | | | | | | | | | | | | | |
Net increase (decrease) in net assets resulting from capital share transactions | | | (6,804,338 | ) | | | (8,491,834 | ) | | | 1,457,068 | | | | (21,090,044 | ) |
| | | | | | | | | | | | | | | | |
Net decrease in net assets | | | (50,842,463 | ) | | | (8,646,474 | ) | | | (122,128,467 | ) | | | (28,447,206 | ) |
| | | | | | | | | | | | | | | | |
NET ASSETS: | | | | | | | | | | | | | | | | |
Beginning of year | | | 138,468,121 | | | | 147,114,595 | | | | 270,312,827 | | | | 298,760,033 | |
| | | | | | | | | | | | | | | | |
End of year | | $ | 87,625,658 | | | $ | 138,468,121 | | | $ | 148,184,360 | | | $ | 270,312,827 | |
| | | | | | | | | | | | | | | | |
Undistributed net investment income at end of year | | $ | 7,328,644 | | | $ | 4,882,696 | | | $ | 15,498,327 | | | $ | 5,228,484 | |
| | | | | | | | | | | | | | | | |
See Accompanying Notes to Financial Statements
15
STATEMENTS OF CHANGES IN NET ASSETS
| | | | | | | | |
| | | ING VP Strategic Allocation Moderate Portfolio | |
| | | Year Ended December 31, 2008 | | | Year Ended December 31, 2007 | |
FROM OPERATIONS: | | | | | | | | |
Net investment income | | $ | 7,139,595 | | | $ | 6,656,728 | |
Net realized gain on affiliated underlying funds, investments, foreign currency related transactions, futures, and swaps | | | 7,488,873 | | | | 27,003,075 | |
Net change in unrealized appreciation or depreciation on affiliated underlying funds, investments, foreign currency related transactions, futures, and swaps | | | (88,682,517 | ) | | | (18,201,693 | ) |
| | | | | | | | |
Increase (decrease) in net assets resulting from operations | | | (74,054,049 | ) | | | 15,458,110 | |
| | | | | | | | |
FROM DISTRIBUTIONS TO SHAREHOLDERS: | | | | | | | | |
Net investment income: | | | | | | | | |
Class ADV | | | (21 | ) | | | (24 | ) |
Class I | | | (6,653,236 | ) | | | (6,567,496 | ) |
Class S | | | (32,570 | ) | | | (15,830 | ) |
Net realized gains: | | | | | | | | |
Class ADV | | | (105 | ) | | | (40 | ) |
Class I | | | (26,032,806 | ) | | | (10,985,363 | ) |
Class S | | | (136,028 | ) | | | (28,566 | ) |
| | | | | | | | |
Total distributions | | | (32,854,766 | ) | | | (17,597,319 | ) |
| | | | | | | | |
FROM CAPITAL SHARE TRANSACTIONS: | | | | | | | | |
Net proceeds from sale of shares | | | 11,572,906 | | | | 16,379,652 | |
Reinvestment of distributions | | | 32,854,640 | | | | 17,597,255 | |
| | | | | | | | |
| | | 44,427,546 | | | | 33,976,907 | |
Cost of shares redeemed | | | (47,312,829 | ) | | | (66,295,052 | ) |
| | | | | | | | |
Net decrease in net assets resulting from capital share transactions | | | (2,885,283 | ) | | | (32,318,145 | ) |
| | | | | | | | |
Net decrease in net assets | | | (109,794,098 | ) | | | (34,457,354 | ) |
| | | | | | | | |
NET ASSETS: | | | | | | | | |
Beginning of year | | | 264,951,805 | | | | 299,409,159 | |
| | | | | | | | |
End of year | | $ | 155,157,707 | | | $ | 264,951,805 | |
| | | | | | | | |
Undistributed net investment income at end of year | | $ | 14,470,427 | | | $ | 6,687,528 | |
| | | | | | | | |
See Accompanying Notes to Financial Statements
16
FINANCIAL HIGHLIGHTS
Selected data for a share of beneficial interest outstanding throughout each year or period.
| | | | | | | | | | | | | | | | | | | | | | | | | | | | | | | | | | | | | | | |
| | | | | Income (loss)
from
investment
operations | | | | | | Less distributions | | | | | | | | | Ratios to average net
assets | | | Supplemental
data |
| | | | | | | | | | | | | | | | | | | | | | | | | | | | | | | | | | | | | | | | |
| | | Net asset value, beginning of year or period | | Net investment income (loss) | | | Net realized and unrealized gain (loss) | | | Total from investment operations | | | From net investment income | | From net realized gains | | From return of capital | | Total distributions | | Net asset value, end of year or period | | Total Return (1) | | | Expenses before reductions/ additions(2)(3)(4) | | Expenses net of fee waivers and/or recoupments, if any(2)(3)(4) | | | Expenses net of all reductions/ additions(2)(3)(4) | | | Net investment income (loss)(2)(3)(4) | | | Net assets, end of year or period | | Portfolio turnover rate |
| | | | | | | | | | | | | | | | | | | | | | | | | | | | | | | | | | | | | | | |
Year or period ended | | ($) | | ($) | | | ($) | | | ($) | | | ($) | | ($) | | ($) | | ($) | | ($) | | (%) | | | (%) | | (%) | | | (%) | | | (%) | | | ($000's) | | (%) |
| ING VP Strategic Allocation Conservative Portfolio | | | | | | | | | | | | | | | | | | | | | | | | | | | | | | | | | | | | | | | |
Class ADV | | | | | | | | | | | | | | | | | | | | | | | | | | | | | | | | | | | | | | | |
12-31-08 | | 13.44 | | 0.40 | | | (3.33 | ) | | (2.93 | ) | | 0.46 | | 0.99 | | — | | 1.45 | | 9.06 | | (24.07 | ) | | 0.89 | | 0.77 | † | | 0.77 | † | | 3.63 | † | | 1 | | 277 |
12-31-07 | | 13.53 | | 0.38 | · | | 0.32 | | | 0.70 | | | 0.45 | | 0.34 | | — | | 0.79 | | 13.44 | | 5.43 | | | 1.23 | | 1.15 | † | | 1.15 | † | | 2.86 | † | | 1 | | 422 |
12-29-06(5) – 12-31-06 | | 13.53 | | (0.00 | )* | | — | | | (0.00 | )* | | — | | — | | — | | — | | 13.53 | | — | | | 1.22 | | 1.15 | | | 1.15 | | | (1.15 | ) | | 1 | | 335 |
Class I | | | | | | | | | | | | | | | | | | | | | | | | | | | | | | | | | | | | | | | |
12-31-08 | | 13.51 | | 0.51 | | | (3.39 | ) | | (2.88 | ) | | 0.51 | | 0.99 | | — | | 1.50 | | 9.13 | | (23.65 | ) | | 0.39 | | 0.27 | † | | 0.27 | † | | 3.99 | † | | 86,257 | | 277 |
12-31-07 | | 13.55 | | 0.46 | · | | 0.29 | | | 0.75 | | | 0.45 | | 0.34 | | — | | 0.79 | | 13.51 | | 5.80 | | | 0.73 | | 0.65 | † | | 0.65 | † | | 3.40 | † | | 136,938 | | 422 |
12-31-06 | | 13.27 | | 0.42 | · | | 0.64 | | | 1.06 | | | 0.35 | | 0.43 | | — | | 0.78 | | 13.55 | | 8.37 | | | 0.72 | | 0.65 | | | 0.65 | | | 3.18 | | | 146,397 | | 335 |
12-31-05 | | 13.04 | | 0.34 | | | 0.15 | | | 0.49 | | | 0.26 | | — | | — | | 0.26 | | 13.27 | | 3.83 | | | 0.75 | | 0.65 | | | 0.65 | | | 2.53 | | | 151,565 | | 364 |
12-31-04 | | 12.31 | | 0.25 | | | 0.72 | | | 0.97 | | | 0.24 | | — | | — | | 0.24 | | 13.04 | | 7.99 | | | 0.70 | | 0.65 | | | 0.65 | | | 2.16 | | | 151,489 | | 317 |
Class S | | | | | | | | | | | | | | | | | | | | | | | | | | | | | | | | | | | | | | | |
12-31-08 | | 13.44 | | 0.39 | | | (3.29 | ) | | (2.90 | ) | | 0.49 | | 0.99 | | — | | 1.48 | | 9.06 | | (23.92 | ) | | 0.64 | | 0.52 | † | | 0.52 | † | | 3.89 | † | | 1,368 | | 277 |
12-31-07 | | 13.50 | | 0.42 | · | | 0.29 | | | 0.71 | | | 0.43 | | 0.34 | | — | | 0.77 | | 13.44 | | 5.53 | | | 0.98 | | 0.90 | † | | 0.90 | † | | 3.18 | † | | 1,529 | | 422 |
12-31-06 | | 13.25 | | 0.39 | · | | 0.64 | | | 1.03 | | | 0.35 | | 0.43 | | — | | 0.78 | | 13.50 | | 8.13 | | | 0.97 | | 0.90 | | | 0.90 | | | 3.00 | | | 717 | | 335 |
08-05-05(5) – 12-31-05 | | 13.06 | | 0.06 | | | 0.13 | | | 0.19 | | | — | | — | | — | | — | | 13.25 | | 1.45 | | | 1.00 | | 0.90 | | | 0.90 | | | 2.68 | | | 118 | | 364 |
| | | | | | | | | | | | | | | | |
| ING VP Strategic Allocation Growth Portfolio | | | | | | | | | | | | | | | | | | | | | | | | | | | | | | | | | | | | | | | |
Class ADV | | | | | | | | | | | | | | | | | | | | | | | | | | | | | | | | | | | | | | | |
12-31-08 | | 16.50 | | 0.30 | | | (5.58 | ) | | (5.28 | ) | | 0.28 | | 1.93 | | — | | 2.21 | | 9.01 | | (36.27 | ) | | 0.89 | | 0.83 | † | | 0.83 | † | | 2.35 | † | | 1 | | 235 |
12-31-07 | | 17.06 | | 0.22 | | | 0.53 | | | 0.75 | | | 0.30 | | 1.01 | | — | | 1.31 | | 16.50 | | 4.62 | | | 1.21 | | 1.21 | † | | 1.21 | † | | 1.34 | † | | 1 | | 240 |
12-29-06(5) – 12-31-06 | | 17.06 | | (0.00 | )* | | — | | | (0.00 | )* | | — | | — | | — | | — | | 17.06 | | — | | | 1.21 | | 1.21 | | | 1.21 | | | (1.21 | ) | | 1 | | 233 |
Class I | | | | | | | | | | | | | | | | | | | | | | | | | | | | | | | | | | | | | | | |
12-31-08 | | 16.57 | | 0.38 | | | (5.65 | ) | | (5.27 | ) | | 0.33 | | 1.93 | | — | | 2.26 | | 9.04 | | (36.13 | ) | | 0.39 | | 0.33 | † | | 0.33 | † | | 2.83 | † | | 146,862 | | 235 |
12-31-07 | | 17.06 | | 0.30 | · | | 0.52 | | | 0.82 | | | 0.30 | | 1.01 | | — | | 1.31 | | 16.57 | | 5.04 | | | 0.71 | | 0.71 | † | | 0.71 | † | | 1.79 | † | | 269,587 | | 240 |
12-31-06 | | 15.48 | | 0.28 | · | | 1.73 | | | 2.01 | | | 0.22 | | 0.21 | | — | | 0.43 | | 17.06 | | 13.19 | | | 0.71 | | 0.71 | | | 0.71 | | | 1.77 | | | 298,451 | | 233 |
12-31-05 | | 14.76 | | 0.22 | | | 0.68 | | | 0.90 | | | 0.18 | | — | | — | | 0.18 | | 15.48 | | 6.20 | | | 0.73 | | 0.73 | | | 0.73 | | | 1.43 | | | 287,566 | | 232 |
12-31-04 | | 13.32 | | 0.18 | | | 1.41 | | | 1.59 | | | 0.15 | | — | | — | | 0.15 | | 14.76 | | 12.01 | | | 0.70 | | 0.70 | | | 0.70 | | | 1.46 | | | 263,494 | | 205 |
Class S | | | | | | | | | | | | | | | | | | | | | | | | | | | | | | | | | | | | | | | |
12-31-08 | | 16.49 | | 0.32 | · | | (5.57 | ) | | (5.25 | ) | | 0.32 | | 1.93 | | — | | 2.25 | | 8.99 | | (36.19 | ) | | 0.64 | | 0.58 | † | | 0.58 | † | | 2.72 | † | | 1,322 | | 235 |
12-31-07 | | 17.00 | | 0.26 | · | | 0.52 | | | 0.78 | | | 0.28 | | 1.01 | | — | | 1.29 | | 16.49 | | 4.77 | | | 0.96 | | 0.96 | † | | 0.96 | † | | 1.55 | † | | 725 | | 240 |
12-31-06 | | 15.46 | | 0.23 | · | | 1.73 | | | 1.96 | | | 0.21 | | 0.21 | | — | | 0.42 | | 17.00 | | 12.91 | | | 0.96 | | 0.96 | | | 0.96 | | | 1.47 | | | 308 | | 233 |
08-05-05(5) – 12-31-05 | | 14.98 | | 0.06 | | | 0.42 | | | 0.48 | | | — | | — | | — | | — | | 15.46 | | 3.20 | | | 0.98 | | 0.98 | | | 0.98 | | | 1.27 | | | 29 | | 232 |
See Accompanying Notes to Financial Statements
17
FINANCIAL HIGHLIGHTS (CONTINUED)
Selected data for a share of beneficial interest outstanding throughout each year or period.
| | | | | | | | | | | | | | | | | | | | | | | | | | | | | | | | | | | | | | | |
| | | | | Income (loss)
from
investment
operations | | | | | | Less distributions | | | | | | | | | Ratios to average net assets | | | Supplemental
data |
| | | | | | | | | | | | | | | | | | | | | | | | | | | | | | | | | | | | | | | | |
| | | Net asset value, beginning of year or period | | Net investment income (loss) | | | Net realized and unrealized gain (loss) | | | Total from investment operations | | | From net investment income | | From net realized gains | | From return of capital | | Total distributions | | Net asset value, end of year or period | | Total Return (1) | | | Expenses before reductions/ additions(2)(3)(4) | | Expenses net of all reductions/ additions(2)(3)(4) | | | Expenses net of fee waivers and/or recoupments, if any(2)(3)(4) | | | Net investment income (loss)(2)(3)(4) | | | Net assets, end of year or period | | Portfolio turnover rate |
| | | | | | | | | | | | | | | | | | | | | | | | | | | | | | | | | | | | | | | |
Year or period ended | | ($) | | ($) | | | ($) | | | ($) | | | ($) | | ($) | | ($) | | ($) | | ($) | | (%) | | | (%) | | (%) | | | (%) | | | (%) | | | ($000's) | | (%) |
| ING VP Strategic Allocation Moderate Portfolio | | | | | | | | | | | | | | | | | | | | | | | | | | | | | | | | | | | | | | | |
Class ADV | | | | | | | | | | | | | | | | | | | | | | | | | | | | | | | | | | | | | | | |
12-31-08 | | 15.07 | | 0.35 | | | (4.48 | ) | | (4.13 | ) | | 0.32 | | 1.56 | | — | | 1.88 | | 9.06 | | (30.75 | ) | | 0.88 | | 0.81 | † | | 0.81 | † | | 2.85 | † | | 1 | | 255 |
12-31-07 | | 15.32 | | 0.27 | | | 0.44 | | | 0.71 | | | 0.36 | | 0.60 | | — | | 0.96 | | 15.07 | | 4.87 | | | 1.22 | | 1.20 | † | | 1.20 | † | | 1.83 | † | | 1 | | 302 |
12-29-06(5) – 12-31-06 | | 15.32 | | (0.00 | )* | | — | | | (0.00 | )* | | — | | — | | — | | — | | 15.32 | | — | | | 1.21 | | 1.20 | | | 1.20 | | | (1.20 | ) | | 1 | | 258 |
Class I | | | | | | | | | | | | | | | | | | | | | | | | | | | | | | | | | | | | | | | |
12-31-08 | | 15.16 | | 0.44 | | | (4.54 | ) | | (4.10 | ) | | 0.40 | | 1.56 | | — | | 1.96 | | 9.10 | | (30.48 | ) | | 0.38 | | 0.31 | † | | 0.31 | † | | 3.35 | † | | 152,965 | | 255 |
12-31-07 | | 15.32 | | 0.36 | · | | 0.44 | | | 0.80 | | | 0.36 | | 0.60 | | — | | 0.96 | | 15.16 | | 5.48 | | | 0.72 | | 0.70 | † | | 0.70 | † | | 2.36 | † | | 263,759 | | 302 |
12-31-06 | | 14.35 | | 0.33 | · | | 1.23 | | | 1.56 | | | 0.27 | | 0.32 | | — | | 0.59 | | 15.32 | | 11.17 | | | 0.71 | | 0.70 | | | 0.70 | | | 2.26 | | | 298,715 | | 258 |
12-31-05 | | 13.91 | | 0.26 | · | | 0.39 | | | 0.65 | | | 0.21 | | — | | — | | 0.21 | | 14.35 | | 4.70 | | | 0.74 | | 0.70 | | | 0.70 | | | 1.89 | | | 289,673 | | 301 |
12-31-04 | | 12.78 | | 0.20 | | | 1.09 | | | 1.29 | | | 0.16 | | — | | — | | 0.16 | | 13.91 | | 10.23 | | | 0.70 | | 0.70 | | | 0.70 | | | 1.77 | | | 268,292 | | 262 |
Class S | | | | | | | | | | | | | | | | | | | | | | | | | | | | | | | | | | | | | | | |
12-31-08 | | 15.10 | | 0.37 | · | | (4.48 | ) | | (4.11 | ) | | 0.38 | | 1.56 | | — | | 1.94 | | 9.05 | | (30.68 | ) | | 0.63 | | 0.56 | † | | 0.56 | † | | 3.30 | † | | 2,192 | | 255 |
12-31-07 | | 15.27 | | 0.32 | · | | 0.44 | | | 0.76 | | | 0.33 | | 0.60 | | — | | 0.93 | | 15.10 | | 5.25 | | | 0.97 | | 0.95 | † | | 0.95 | † | | 2.11 | † | | 1,192 | | 302 |
12-31-06 | | 14.34 | | 0.29 | · | | 1.22 | | | 1.51 | | | 0.26 | | 0.32 | | — | | 0.58 | | 15.27 | | 10.80 | | | 0.96 | | 0.95 | | | 0.95 | | | 2.00 | | | 693 | | 258 |
06-07-05(5) – 12-31-05 | | 14.02 | | 0.17 | · | | 0.36 | | | 0.53 | | | 0.21 | | — | | — | | 0.21 | | 14.34 | | 3.81 | | | 0.99 | | 0.95 | | | 0.95 | | | 1.80 | | | 362 | | 301 |
(1) | | Total return is calculated assuming reinvestment of all dividends and capital gain distributions at net asset value and does not reflect the effect of insurance contract charges. Total return for periods less than one year is not annualized. |
(2) | | Annualized for periods less than one year. |
(3) | | Expense ratios do not include expenses of Underlying Funds and do not include fees and expenses charged under the variable annuity contract or life insurance policy. |
(4) | | Expense ratios reflect operating expenses of a Portfolio. Expenses before reductions do not reflect amounts reimbursed by the Investment Adviser and/or the Distributor or reductions from brokerage commission recapture arrangements or other expense offset arrangements and do not represent the amount paid by a Portfolio during periods when reimbursements or reductions occur. Expenses net of fee waivers reflect expenses after reimbursement by the Investment Adviser and/or Distributor but prior to reductions from brokerage commission recapture arrangements or other expense offset arrangements. Expenses net of all reductions represent the net expenses paid by a Portfolio. Net investment income (loss) is net of all such additions or reductions. |
(5) | | Commencement of operations. |
· | | Calculated using average number of shares outstanding throughout the period. |
| * | | Amount is more than $(0.005). |
| † | | Impact of waiving the advisory fee for the ING Institutional Prime Money Market Fund holding has less than 0.005% impact on the expense ratio and net investment income ratio. |
See Accompanying Notes to Financial Statements
18
NOTES TO FINANCIAL STATEMENTSASOF DECEMBER 31, 2008
NOTE 1 — ORGANIZATION
Organization. ING Strategic Allocation Portfolios, Inc. (the “Company”) is registered under the Investment Company Act of 1940, as amended (“1940 Act”) as an open-end management investment company.
The Company is incorporated under the laws of Maryland on October 14, 1994. There are three separate investment series (each a “Portfolio”, collectively the “Portfolios”) that comprise the Company, ING VP Strategic Allocation Conservative Portfolio (“VP Strategic Allocation Conservative”), ING VP Strategic Allocation Growth Portfolio (“VP Strategic Allocation Growth”) and ING VP Strategic Allocation Moderate Portfolio (“VP Strategic Allocation Moderate”). On April 7, 2008, each of the Portfolios was converted from a mutual fund, which invested directly in securities, to a fund-of-funds, which invests in other mutual funds. Each Portfolio currently seeks to achieve its investment objective by investing in other ING Funds (Underlying Funds) and each uses asset allocation strategies to determine how to invest in the Underlying Funds. The Underlying Funds, in turn, invest in equity and fixed-income securities and money market instruments.
VP Strategic Allocation Conservative seeks to provide total return (i.e., income and capital growth, both realized and unrealized) consistent with preservation of capital.
VP Strategic Allocation Growth seeks to provide capital appreciation.
VP Strategic Allocation Moderate seeks to provide total return (i.e., income and capital appreciation, both realized and unrealized).
Each Portfolio offers Adviser (“ADV”) Class, Class I and Class S shares. The three classes differ principally in the applicable distribution and service fees. Shareholders of each class also bear certain expenses that pertain to that particular class. All shareholders bear the common expenses of the Portfolios and earn income and realized gains/losses from a Portfolio pro rata based on the average daily net assets of each class, without distinction between share classes. Common expenses of the Portfolios (including custodial asset-based fees, legal and audit fees, printing and mailing expenses, transfer agency out-of-pocket expenses, and fees and expenses of the independent trustees) are allocated to each Portfolio in proportion to its average net assets. Expenses directly attributable to a particular Portfolio (including advisory, administration, custodial transaction-based, registration, other professional,
distribution and/or service fees, certain taxes, and offering costs) are charged directly to that Portfolio. Differences in per share dividend rates generally result from differences in separate class expenses, including distribution and shareholder service fees, if applicable.
Shares of the Portfolios may be offered to separate accounts of insurance companies as investment options under variable annuity contracts and variable life insurance policies (“Variable Contracts”). Shares may also be offered to qualified pension and retirement plans outside the Variable Contract and to certain investment advisers and their affiliates.
Participating insurance companies and other designated organizations are authorized to receive purchase orders on each Portfolio’s behalf.
ING Investments, LLC (“ING Investments” or the “Investment Adviser”), an Arizona limited liability company, serves as the investment adviser to the Portfolios. ING Investments has engaged ING IM, a Connecticut corporation, to serve as the sub-adviser to the Portfolios. ING Funds Distributor, LLC (the “Distributor” or ”IFD”) is the principal underwriter of the Portfolios. ING Investments, ING IM and the Distributor are indirect, wholly-owned subsidiaries of ING Groep N.V. (“ING Groep”).
ING Groep is a global financial institution of Dutch origin offering banking, investments, life insurance and retirement services to over 75 million private, corporate and institutional clients in more than 50 countries. With a diverse workforce of about 125,000 people, ING Groep comprises a broad spectrum of prominent companies that increasingly serve their clients under the ING brand.
On October 19, 2008, ING Groep announced that it reached an agreement with the Dutch government to strengthen its capital position, creating a strong buffer to navigate the current market and economic environment. ING Groep will issue non-voting core Tier-1 securities for a total consideration of EUR 10 billion to the Dutch State. The transaction boosts ING Bank’s core Tier-1 ratio, strengthens the insurance balance sheet and reduces ING Groep’s Debt/Equity ratio.
NOTE 2 — SIGNIFICANT ACCOUNTING POLICIES
The following significant accounting policies are consistently followed by the Portfolios in the preparation of their financial statements. Such policies are in conformity with U.S. generally accepted accounting principles for investment companies.
| A. | Security Valuation. Investments in equity securities traded on a national securities exchange are |
19
NOTES TO FINANCIAL STATEMENTSASOF DECEMBER 31, 2008 (CONTINUED)
NOTE 2 — SIGNIFICANT ACCOUNTING POLICIES (continued)
| | valued at the last reported sale price. Securities reported by NASDAQ are valued at the NASDAQ official closing prices. Securities traded on an exchange or NASDAQ for which there has been no sale and securities traded in the over-the-counter-market are valued at the mean between the last reported bid and ask prices. All investments quoted in foreign currencies will be valued daily in U.S. dollars on the basis of the foreign currency exchange rates prevailing at that time. Debt securities are valued at prices obtained from independent services or from one or more dealers making markets in the securities and may be adjusted based on the Portfolios’ valuation procedures. U.S. government obligations are valued by using market quotations or independent pricing services that use prices provided by market-makers or estimates of market values obtained from yield data relating to instruments or securities with similar characteristics. |
Securities and assets for which market quotations are not readily available (which may include certain restricted securities which are subject to limitations as to their sale) are valued at their fair values as defined in the 1940 Act, and as determined in good faith by or under the supervision of the Portfolios’ Board of Directors (“Board”), in accordance with methods that are specifically authorized by the Board. Securities traded on exchanges, including foreign exchanges, which close earlier than the time that a Portfolio calculates its net asset value (“NAV”) may also be valued at their fair values, as defined by the 1940 Act, and as determined in good faith by or under the supervision of a Portfolio’s Board, in accordance with methods that are specifically authorized by the Board. The valuation techniques applied in any specific instance are likely to vary from case to case. With respect to a restricted security, for example, consideration is generally given to the cost of the investment, the market value of any unrestricted securities of the same class at the time of valuation, the potential expiration of restrictions on the security, the existence of any registration rights, the costs to the Portfolios related to registration of the security, as well as factors relevant to the issuer itself. Consideration may also be given to the price and extent of any public trading in similar securities of the issuer or comparable companies’ securities. The
value of a foreign security traded on an exchange outside the United States is generally based on its price on the principal foreign exchange where it trades as of the time a Portfolio determines its NAV or if the foreign exchange closes prior to the time a Portfolio determines its NAV, the most recent closing price of the foreign security on its principal exchange. Trading in certain non-U.S. securities may not take place on all days on which the New York Stock Exchange (“NYSE”) is open. Further, trading takes place in various foreign markets on days on which the NYSE is not open. Consequently, the calculation of a Portfolio’s NAV may not take place contemporaneously with the determination of the prices of securities held by a Portfolio in foreign securities markets. Further, the value of a Portfolio’s assets may be significantly affected by foreign trading on days when a shareholder cannot purchase or redeem shares of a Portfolio. In calculating a Portfolio’s NAV, foreign securities denominated in foreign currency are converted to U.S. dollar equivalents. If an event occurs after the time at which the market for foreign securities held by a Portfolio closes but before the time that a Portfolio’s NAV is calculated, such event may cause the closing price on the foreign exchange to not represent a readily available reliable market value quotation for such securities at the time a Portfolio determines its NAV. In such a case, a Portfolio will use the fair value of such securities as determined under a Portfolio’s valuation procedures. Events after the close of trading on a foreign market that could require a Portfolio to fair value some or all of its foreign securities include, among others, securities trading in the U.S. and other markets, corporate announcements, natural and other disasters, and political and other events. Among other elements of analysis in the determination of a security’s fair value, the Board has authorized the use of one or
more independent research services to assist with such determinations. An independent research service may use statistical analyses and quantitative models to help determine fair value as of the time a Portfolio calculates its NAV. There can be no assurance that such models accurately reflect the behavior of the applicable markets or the effect of the behavior of such markets on the fair value of securities, or that such markets will continue to behave in a fashion that is consistent with such models. Unlike the closing price of a security on an exchange, fair value determinations employ
20
NOTES TO FINANCIAL STATEMENTSASOF DECEMBER 31, 2008 (CONTINUED)
NOTE 2 — SIGNIFICANT ACCOUNTING POLICIES (continued)
elements of judgment. Consequently, the fair value assigned to a security may not represent the actual value that a Portfolio could obtain if it were to sell the security at the time of the close of the NYSE. Pursuant to procedures adopted by the Board, a Portfolio is not obligated to use the fair valuations suggested by any research service, and valuation recommendations provided by such research services may be overridden if other events have occurred or if other fair valuations are determined in good faith to be more accurate. Unless an event is such that it causes a Portfolio to determine that the closing prices for one or more securities do not represent readily available reliable market value quotations at the time a Portfolio determines its NAV, events that occur between the time of the close of the foreign market on which they are traded and the close of regular trading on the NYSE will not be reflected in a Portfolio’s NAV. Investments in securities maturing in 60 days or less from date of acquisition are valued at amortized cost which approximates market value.
For the period beginning April 7, 2008, with the conversion to a fund-of-funds structure, the valuations of the Portfolios’ investments in Underlying Funds are based on the NAVs of the Underlying Funds each business day. In general, assets of the Underlying Funds are valued based on actual or estimated market value, with special provisions for assets not having readily available market quotations and short-term debt securities, and for situations where market quotations are deemed unreliable. Investments in securities maturing in 60 days or less are valued at amortized cost which approximates market value. Securities prices may be obtained from automated pricing services. Shares of investment companies held by the Underlying Funds will generally be valued at the latest NAV reported by that investment company.
Effective for fiscal years beginning after November 15, 2007, Financial Accounting Standards Board (“FASB”) Statement of Financial Accounting Standards No. 157, “Fair Value Measurements”, establishes a hierarchy for measuring fair value of assets and liabilities. As required by the standard, each investment asset or liability of the Portfolios is assigned a level at measurement date based on the significance and
source of the inputs to its valuation. Quoted prices in active markets for identical securities are classified as “Level 1”, inputs other than quoted prices for an asset that are observable are classified as “Level 2” and unobservable inputs, including the sub-adviser’s judgment about the assumptions that a market participant would use in pricing an asset or liability are classified as “Level 3”. The inputs used for valuing securities are not necessarily an indication of the risks associated with investing in those securities. A table summarizing the Portfolios’ investments under these levels of classification is included following the Portfolios of Investments.
Effective for fiscal years and interim periods ending after November 15, 2008, the FASB issued FASB Staff Position (“FSP”) No. FAS 133-1 and FASB Interpretation Number (“FIN”) 45-4, “Disclosures about Credit Derivatives and Certain Guarantees: An Amendment of FASB Statement No. 133 and FASB Interpretation No. 45; and Clarification of the Effective Date of FASB Statement No. 161.” The amendments to FAS 133 require enhanced disclosure regarding credit derivatives sold, including (1) the nature and terms of the credit derivative, reasons for entering into the credit derivative, the events or circumstances that would require the seller to perform under the credit derivative, and the current status of the payment/performance risk of the credit derivative, (2) the maximum potential amount of future payments (undiscounted) the seller could be required to make under the credit derivative, (3) the fair value of the credit derivative, and (4) the nature of any recourse provisions and assets held either as collateral or by third parties. The amendments to FIN 45 require additional disclosures about the current status of the payment/performance risk of a guarantee. All changes to accounting policies have been made in accordance with the FSP and incorporated for the current period as part of the Notes to Financial Statements and Portfolio of Investments.
| B. | Security Transactions and Revenue Recognition. Security transactions are accounted for on trade date. Dividend income received from the affiliated funds is recognized on the ex-dividend date and is recorded as income distributions in the Statement of Operations. Capital gain distributions received from the affiliated funds are recognized on ex-dividend date and are recorded on the Statement of Operations as such. Costs used in determining |
21
NOTES TO FINANCIAL STATEMENTSASOF DECEMBER 31, 2008 (CONTINUED)
NOTE 2 — SIGNIFICANT ACCOUNTING POLICIES (continued)
| | realized gains and losses on the sales of investment securities are on the basis of specific identification. |
Effective April 7, 2008, with the conversion to a fund-of-funds structure, capital gain dividends from Underlying Funds are recorded as distributions of realized gains from affiliated Underlying Funds.
| C. | Foreign Currency Translation. The books and records of the Portfolios are maintained in U.S. dollars. Any foreign currency amounts are translated into U.S. dollars on the following basis: |
| | (1) | Market value of investment securities, other assets and liabilities — at the exchange rates prevailing at the end of the day. |
| | (2) | Purchases and sales of investment securities, income and expenses — at the rates of exchange prevailing on the respective dates of such transactions. |
Although the net assets and the market values are presented at the foreign exchange rates at the end of the day, the Portfolios do not isolate the portion of the results of operations resulting from changes in foreign exchange rates on investments from the fluctuations arising from changes in market prices of securities held. Such fluctuations are included with the net realized and unrealized gains or losses from investments. For securities, which are subject to foreign withholding tax upon disposition, liabilities are recorded on the Statement of Assets and Liabilities for the estimated tax withholding based on the securities’ current market value. Upon disposition, realized gains or losses on such securities are recorded net of foreign withholding tax.
Reported net realized foreign exchange gains or losses arise from sales of foreign currencies, currency gains or losses realized between the trade and settlement dates on securities transactions, the difference between the amounts of dividends, interest, and foreign withholding taxes recorded on a Portfolio’s books, and the U.S. dollar equivalent of the amounts actually received or paid. Net unrealized foreign exchange gains and losses arise from changes in the value of assets and liabilities other than investments in securities at fiscal year end, resulting from changes in the exchange rate. Foreign security and currency transactions may involve certain considerations and
risks not typically associated with investing in U.S. companies and U.S. Government securities. These risks include, but are not limited to, revaluation of currencies and future adverse political and economic developments which could cause securities and their markets to be less liquid and prices more volatile than those of comparable U.S. companies and U.S. Government securities.
| D. | Foreign Currency Transactions and Futures Contracts. The Portfolios and certain Underlying Funds may enter into foreign currency exchange transactions to convert to and from different foreign currencies and to and from the U.S. dollar in connection with the planned purchases or sales of securities. When entering into a currency forward contract, a Portfolio agrees to receive or deliver a fixed quantity of foreign currency for an agreed-upon price on an agreed upon date. The Portfolios and certain Underlying Funds either enter into these transactions on a spot basis at the spot rate prevailing in the foreign currency exchange market or use forward foreign currency contracts to purchase or sell foreign currencies. When the contract is fulfilled or closed, gains or losses are realized. Until then, the gain or loss is included in unrealized appreciation or depreciation. Risks may arise upon entering into forward contracts from the potential inability of counterparties to meet the terms of their forward contracts and from unanticipated movements in the value of foreign currencies relative to the U.S. dollar. |
Each Portfolio and certain Underlying Funds may enter into futures contracts involving foreign currency, interest rates, securities and security indices. A futures contract obligates the seller of the contract to deliver and the purchaser of the contract to take delivery of the type of foreign currency, financial instrument or security called for in the contract at a specified future time for a specified price. Upon entering into such a contract, a Portfolio or an Underlying Fund is required to deposit and maintain as collateral such initial margin as required by the exchange on which the contract is traded. Pursuant to the contract, a Portfolio or an Underlying Fund agrees to receive from or pay to the broker an amount equal to the daily fluctuations in the value of the contract. Such receipts or payments are known as variation margins and are recorded as unrealized gains or losses by a Portfolio or an Underlying Fund. When
22
NOTES TO FINANCIAL STATEMENTSASOF DECEMBER 31, 2008 (CONTINUED)
NOTE 2 — SIGNIFICANT ACCOUNTING POLICIES (continued)
the contract is closed, the Portfolio or an Underlying Fund records a realized gain or loss equal to the difference between the value of the contract at the time it was opened and the value at the time it was closed.
| E. | Distributions to Shareholders. The Portfolios record distributions to their shareholders on the ex-dividend date. Dividends from net investment income and capital gains, if any, are declared and paid annually by the Portfolios. The Portfolios may make distributions on a more frequent basis to comply with the distribution requirements of the Internal Revenue Code. The characteristics of income and gains to be distributed are determined in accordance with income tax regulations, which may differ from U.S. generally accepted accounting principles for investment companies. |
| F. | Federal Income Taxes. It is the policy of each Portfolio to comply with subchapter M of the Internal Revenue Code and related excise tax provisions applicable to regulated investment companies and to distribute substantially all of its net investment income and any net realized capital gains to their shareholders. Management has considered the sustainability of the Portfolios’ tax positions taken on federal income tax returns for all open tax years in making this determination. Therefore, no federal income tax provision is required. No capital gain distributions shall be made until any capital loss carryforwards have been fully utilized or expired. |
| G. | Use of Estimates. The preparation of financial statements in conformity with U.S. generally accepted accounting principles requires management to make estimates and assumptions that affect the reported amounts of assets and liabilities and disclosure of contingent assets and liabilities at the date of the financial statements and the reported amounts of increases and decreases in net assets from operations during the reporting period. Actual results could differ from those estimates. |
| H. | Repurchase Agreements. Each Portfolio and certain Underlying Funds may invest in repurchase agreements only with government securities dealers recognized by the Board of Governors of the Federal Reserve System. Under such agreements, the seller of the security agrees to repurchase it at a |
| | mutually agreed upon time and price. The resale price is in excess of the purchase price and reflects an agreed upon interest rate for the period of time the agreement is outstanding. The period of the repurchase agreements is usually short, from overnight to one week, while the underlying securities generally have longer maturities. Each Portfolio and certain Underlying Funds will receive as collateral securities acceptable to it whose market value is equal to at least 100% of the carrying amount of the repurchase agreements, plus accrued interest, being invested by a Portfolio or an Underlying Fund. The underlying collateral is valued daily on a mark to market basis to assure that the value, including accrued interest is at least equal to the repurchase price. There would be potential loss to a Portfolio or Underlying Fund in the event a Portfolio or Underlying Fund is delayed or prevented from exercising its right to dispose of the collateral, and it might incur disposition costs in liquidating the collateral. |
| I. | Securities Lending. Each Portfolio and certain Underlying Funds has the option to temporarily loan up to 30% of its total assets to brokers, dealers or other financial institutions in exchange for a negotiated lender’s fee. The borrower is required to fully collateralize the loans with cash or U.S. Government securities. Generally, in the event of counterparty default, each Portfolio has the right to use collateral to offset losses incurred. There would be potential loss to a Portfolio in the event the Portfolio is delayed or prevented from exercising its right to dispose of the collateral. Each Portfolio or Underlying Fund bears the risk of loss with respect to the investment of collateral. Engaging in securities lending could have a leveraging effect, which may intensify the credit, market and other risks associated with investing in a Portfolio. |
| J. | Illiquid and Restricted Securities. Each Portfolio and certain Underlying Funds may not invest more than 15% of its net assets in illiquid securities. Illiquid securities are not readily marketable. Disposing of illiquid investments may involve time-consuming negotiation and legal expenses, and it may be difficult or impossible for the Portfolios to sell them promptly at an acceptable price. Each Portfolio and certain Underlying Funds may also invest in restricted securities, which include those sold under Rule 144A of the Securities Act of 1933 (“1933 Act”) or securities offered pursuant to |
23
NOTES TO FINANCIAL STATEMENTSASOF DECEMBER 31, 2008 (CONTINUED)
NOTE 2 — SIGNIFICANT ACCOUNTING POLICIES (continued)
| | Section 4(2) of the 1933 Act, and/or are subject to legal or contractual restrictions on resale and may not be publicly sold without registration under the 1933 Act. Certain restricted securities may be considered liquid pursuant to procedures adopted by the Board or may be deemed to be illiquid because they may not be readily marketable. Illiquid and restricted securities are valued using market quotations when readily available. In the absence of market quotations, the securities are valued based upon their fair value determined under procedures approved by the Board. |
| K. | When-Issued and Delayed-Delivery Transactions. Each Portfolio and certain Underlying Funds may purchase or sell securities on a when-issued or forward commitment basis. The price of the underlying securities and date when the securities will be delivered and paid for are fixed at the time the transaction is negotiated. The market value of such is identified in each Portfolio’s Portfolio of Investments. Losses may arise due to changes in the market value of the securities or from the inability of counterparties to meet the terms of the contract. In connection with such purchases, the Portfolios and certain Underlying Funds are required to segregate liquid assets sufficient to cover the purchase price. |
| L. | Mortgage Dollar Roll Transactions. In connection with a Portfolio’s and certain Underlying Funds ability to purchase or sell securities on a when-issued basis, each Portfolio may engage in dollar roll transactions with respect to mortgage-backed securities issued by Government National Mortgage Association, Federal National Mortgage Association and Federal Home Loan Mortgage Corp. In a dollar roll transaction, a Portfolio or Underlying Fund sells a mortgage-backed security to a financial institution, such as a bank or broker/dealer, and simultaneously agrees to repurchase a substantially similar (i.e., same type, coupon, and maturity) security from the institution on a delayed delivery basis at an agreed upon price. The mortgage-backed securities that are repurchased will bear the same interest rate as those sold, but generally will be collateralized by different pools of mortgages with different prepayment histories. The Portfolios and certain Underlying Funds account for dollar roll transactions as purchases and sales. |
| | M. Swap Contracts. The Portfolios and certain Underlying Funds may enter into interest rate swaps, currency swaps and other types of swap agreements, including swaps on securities and indices. A swap is an agreement between two parties pursuant to which each party agrees to make one or more payments to the other on regularly scheduled dates over a stated term, based on different interest rates, currency exchange rates, security prices, the prices or rates of other types of financial instruments or assets or the levels of specified indices. During the term of the swap, changes in the value of the swap, if any, are recognized by marking-to-market the value of the swap and is recorded as an unrealized gain or loss on the Statements of Operations. Upfront payments made and/or received by the Portfolio or Underlying Fund, are recorded as an asset or liability on the Statements of Assets or Liabilities. Periodic payments made and/or received are recorded as a realized gain or loss on the Statements of Operations. Derivatives are also subject to credit risks related to the counterparty’s ability to perform, and any deterioration in the counterparty’s creditworthiness could adversely affect the instrument. |
| N. | Options Contracts. The Portfolios and certain Underlying Funds may purchase put and call options and may write (sell) put options and covered call options. The Portfolios and certain Underlying Funds may engage in option transactions as a hedge against adverse movements in the value of portfolio holdings or to increase market exposure. Option contracts are valued daily and unrealized gains or losses are recorded based upon the last sales price on the principal exchange on which the options are traded. An amount equal to the premium received by the Portfolios or Underlying Fund upon the writing of a put or call option is included in the Statements of Assets and Liabilities as a liability which is subsequently marked-to-market until it is exercised or closed, or it expires. The Portfolios or Underlying Fund will realize a gain or loss upon the expiration or closing of the option contract. When an option is exercised, the proceeds on sales of the underlying security for a written call option, the purchase cost of the security for a written put option, or the cost of the security for a purchased put or call option is adjusted by the amount of premium received or paid. Realized and unrealized gains or losses on option contracts are reflected in |
24
NOTES TO FINANCIAL STATEMENTSASOF DECEMBER 31, 2008 (CONTINUED)
NOTE 2 — SIGNIFICANT ACCOUNTING POLICIES (continued)
| | the accompanying financial statements. The risk in writing a covered call option is that the Portfolios and certain Underlying Funds give up the opportunity for profit if the market price of the security increases and the option is exercised. The risk in writing a put option is that the Portfolios may incur a loss if the market price of the security decreases and the option is exercised. The risk in buying an option is that the Portfolios or Underlying Fund pay a premium whether or not the option is exercised. Risks may also arise from an illiquid secondary market or from the inability of counterparties to meet the terms of the contract. |
| O. | Indemnifications. In the normal course of business, the Company may enter into contracts that provide certain indemnifications. The Company maximum exposure under these arrangements is dependent on future claims that may be made against the Portfolios and, therefore, cannot be estimated; however, based on experience, the risk of loss from such claims is considered remote. |
NOTE 3 — INVESTMENT TRANSACTIONS
For the year ended December 31, 2008, the cost of purchases and the proceeds from the sale of securities, excluding short-term and U.S. government securities, were as follows:
| | | | | | |
| | | Purchases | | Sales |
VP Strategic Allocation Conservative | | $ | 184,598,914 | | $ | 154,053,180 |
VP Strategic Allocation Growth | | | 409,419,934 | | | 399,145,082 |
VP Strategic Allocation Moderate | | | 398,504,926 | | | 372,303,486 |
U.S. government securities not included above were as follows:
| | | | | | |
| | | Purchases | | Sales |
VP Strategic Allocation Conservative | | $ | 117,939,800 | | $ | 170,212,956 |
VP Strategic Allocation Growth | | | 79,029,378 | | | 124,282,689 |
VP Strategic Allocation Moderate | | | 134,180,932 | | | 195,270,936 |
NOTE 4 — INVESTMENT MANAGEMENT AND ADMINISTRATIVE FEES
The Portfolios entered into an investment management agreement (“Investment Management Agreement”) with the Investment Adviser.
As of April 7, 2008, during periods when each Portfolio invests all, or substantially all of its assets in another investment company, the Investment Management Agreement compensates the Investment Adviser with a fee of 0.08%, computed daily and payable monthly, based on the average daily net assets of each Portfolio.
As of April 7, 2008, during periods when the Portfolios invest directly in investment securities, each Portfolio pays the Investment Adviser a fee of 0.60%, computed daily and payable monthly, based on the amount of average daily net assets of each Portfolio invested in such direct investment.
Prior to April 7, 2008, the Investment Management Agreement compensated the Investment Adviser with a fee of 0.60%, computed daily and payable monthly, based on the average daily net assets of each Portfolio.
The Investment Adviser entered into a sub-advisory agreement with ING IM. Subject to such policies as the Board or the Investment Adviser may determine, ING IM manages the Portfolios’ assets in accordance with the Portfolios’ investment objectives, policies, and limitations.
ING Portfolios are permitted to invest end-of-day cash balances into ING Institutional Prime Money Market Fund. Investment management fees paid by the Portfolios will be reduced by an amount equal to the management fees paid indirectly to ING Institutional Prime Money Market Fund with respect to assets invested by the Portfolios. For the period from January 1, 2008 to April 4, 2008, the Investment Adviser for VP Strategic Allocation Conservative, VP Strategic Allocation Growth and VP Strategic Allocation Moderate waived $3,351, $3,434 and $3,872 of such management fees, respectively. These fees are not subject to recoupment. Effective April 7, 2008, the Portfolios converted to a fund-of-funds structure. ING Institutional Prime Money Market Fund is now part of the underlying fund universe and the management fee waiver is no longer applicable.
Pursuant to the Administration Agreement, ING Funds Services, LLC (“IFS”), an indirect, wholly-owned subsidiary of ING Groep, acts as administrator and provides certain administrative and shareholder services necessary for Portfolio operations and is responsible for the supervision of other service providers. IFS is entitled to receive from each Portfolio a fee at an annual rate of 0.055% on the first $5 billion of daily net assets and 0.03% thereafter.
NOTE 5 — DISTRIBUTION AND SERVICE FEES
ADV Class shares of the respective Portfolios are subject to a Shareholder Service and Distribution Plan (the “Plan”). Under the Plan, the Distributor is paid an annual shareholder service fee at the rate of 0.25% and an annual distribution fee at the rate of 0.25% of the average daily net assets attributable to its ADV Class shares.
25
NOTES TO FINANCIAL STATEMENTSASOF DECEMBER 31, 2008 (CONTINUED)
NOTE 5 — DISTRIBUTION AND SERVICE FEES (continued)
Class S shares of the respective Portfolios have adopted a Distribution Plan pursuant to Rule 12b-1 under the 1940 Act (the “12b-1 Plan”), whereby the Distributor is compensated by each Portfolio for expenses incurred in the distribution of each Portfolio’s Class S shares (“Distribution Fees”). Pursuant to the 12b-1 Plans, the Distributor is entitled to a payment each month to compensate for expenses incurred in the distribution and promotion of each Portfolio’s S shares, including expenses incurred in printing prospectuses and reports used for sales purposes, expenses incurred in preparing and printing sales literature and other such distribution related expenses, including any distribution or shareholder servicing fees (“Service Fees”) paid to securities dealers who have executed a distribution agreement with the Distributor. Under the 12b-1 Plans, Class S of the Portfolios pays the Distributor a fee calculated at an annual rate of 0.25% of average daily net assets.
NOTE 6 — OTHER TRANSACTIONS WITH AFFILIATED AND RELATED PARTIES
At December 31, 2008, the Portfolios had the following amounts recorded in payable to affiliates on the accompanying Statements of Assets and Liabilities (see Notes 4 and 5):
| | | | | | | | | | | | | | | |
Fund | | Accrued Investment Management Fees | | Accrued Administrative Fees | | Accrued Shareholder Service and Distribution Fees | | Accrued Recoupment | | Total |
VP Strategic Allocation Conservative | | $ | 5,814 | | $ | 3,997 | | $ | 286 | | $ | 391 | | $ | 10,488 |
VP Strategic Allocation Growth | | | 9,628 | | | 6,619 | | | 263 | | | 1,045 | | | 17,555 |
VP Strategic Allocation Moderate | | | 10,220 | | | 7,026 | | | 448 | | | 3,475 | | | 21,169 |
At December 31, 2008, the following wholly-owned subsidiaries of ING Groep owned more than 5% of the following Portfolios:
ING Life Insurance and Annuity Company — VP Strategic Allocation Conservative (95.22%); VP Strategic Allocation Growth (95.51%); and VP Strategic Allocation Moderate (95.46%)
Control is defined by the 1940 Act as the beneficial ownership, either directly or through one or more controlled companies, of more than 25% of the voting securities of a company. The 1940 Act defines affiliates as companies that are under common control. Therefore, because the Portfolios have a common owner that owns over 25% of the outstanding securities of the Portfolios,
they may be deemed to be affiliates of each other. Investment activities of these shareholders could have a material impact on the Portfolios.
The Company has adopted a Deferred Compensation Plan (“Policy”), which allows eligible non-affiliated directors as described in the Policy to defer the receipt of all or a portion of the directors’ fees payable. Deferred fees are invested in various funds advised by ING Investments until distribution in accordance with the Policy.
NOTE 7 — EXPENSE LIMITATIONS
ING Investments entered into written expense limitation agreements (“Expense Limitation Agreements”) with each of the Portfolios whereby the Investment Adviser has agreed to limit expenses, excluding interest, taxes, brokerage commissions and extraordinary expenses to the levels listed below:
| | | | | | | | | |
Portfolio(1) | | Class ADV | | | Class I | | | Class S | |
VP Strategic Allocation Conservative | | 1.15 | % | | 0.65 | % | | 0.90 | % |
VP Strategic Allocation Growth(2) | | 1.25 | % | | 0.75 | % | | 1.00 | % |
VP Strategic Allocation Moderate | | 1.20 | % | | 0.70 | % | | 0.95 | % |
(1) | These operating expense limits take into account operating expenses incurred at the underlying fund level. |
(2) | Effective April 4, 2008, pursuant to a side agreement, ING Investments has lowered the expense limits for Class ADV, Class I and Class S of VP Strategic Allocation Growth to 1.21%, 0.71% and 0.96%, respectively, through at least April 4, 2011. There is no guarantee that this side agreement will continue after that date. This side agreement will only renew if ING Investments elects to renew it. |
The Investment Adviser may at a later date recoup from a Portfolio for management fees waived and other expenses assumed by the Investment Adviser during the previous 36 months, but only if, after such recoupment, the Portfolio’s expense ratio does not exceed the percentage described above. Waived and reimbursed fees and any recoupment by the Investment Adviser of such waived and reimbursed fees are reflected on the accompanying Statements of Operations for each Portfolio. Amounts payable by the Investment Adviser are reflected on the accompanying Statements of Assets and Liabilities for each Portfolio.
As of December 31, 2008, the amounts of waived and reimbursed fees that are subject to possible recoupment by the Investment Adviser, and the related expiration dates are as follows:
| | | | | | | | | | | | |
| | | December 31, | | |
| | | 2009 | | 2010 | | 2011 | | Total |
VP Strategic Allocation Conservative | | $ | 101,707 | | $ | 106,690 | | $ | 129,459 | | $ | 337,856 |
VP Strategic Allocation Growth | | | — | | | — | | | 106,927 | | | 106,927 |
VP Strategic Allocation Moderate | | | 15,186 | | | 50,875 | | | 142,971 | | | 209,032 |
26
NOTES TO FINANCIAL STATEMENTSASOF DECEMBER 31, 2008 (CONTINUED)
NOTE 7 — EXPENSE LIMITATIONS (continued)
The Expense Limitation Agreement is contractual and shall renew automatically for one-year terms unless ING Investments provides written notice of the termination of an Expense Limitation Agreement within 90 days of the end of the then current term.
NOTE 8 — BORROWINGS
All of the Portfolios included in this report, in addition to certain other Portfolios managed by the Investment Adviser, have entered into an unsecured committed revolving line of credit agreement with Citibank, N.A. (the “Citi Credit Agreement”) for an aggregate amount of $100,000,000. The proceeds may be used only to: (1) temporarily finance the purchase and sale of securities; (2) finance the redemption of shares of an investor in the Portfolios; and (3) enable the Portfolios to meet other emergency expenses as defined in the Citi Credit Agreement. The Portfolios to which the line of credit is available pay a commitment fee equal to 0.08% per annum on the daily unused portion of the committed line amount. Each of the Portfolios will pay its pro rata share of both the agent and commitment fee.
On November 11, 2008, the Board approved an extension of the unsecured committed revolving line of credit agreement with Citibank, N.A. for an aggregate amount of $100,000,000. The Citi Credit Agreement was extended for an additional thirty-day period, terminating on December 18, 2008. The portfolios to which the line of credit is available pay a commitment fee equal to 0.15% per annum on the daily unused portion of the committed line amount.
On December 11, 2008, the Board approved an unsecured committed revolving line of credit agreement with The Bank of New York Mellon (the “BNY Credit Agreement”) for an aggregate amount of $100,000,000, not to exceed $50,000,000 with respect to any one Portfolio or 10% of the Portfolio’s value of total assets if Net Asset Value is less than $25,000,000, effective December 18, 2008 for a 364-day period, terminating on December 16, 2009. The proceeds may be used to: (1) temporarily finance the purchase and sale of securities; (2) finance the redemption of shares of an investor in the Portfolios; and (3) enable the Portfolios to meet other emergency expenses as defined in the BNY Credit Agreement. The Portfolios to which the line of credit is available pay a commitment fee equal to 0.125% per annum on the daily unused portion of the committed line amount.
Generally, borrowings under the credit agreements accrue interest at the federal funds rate plus a specified margin. Repayments generally must be made within 30 days after the date of a revolving credit advance. The following Portfolios utilized the line of credit during the year ended December 31, 2008.
| | | | | | | | |
| | | Days Utilized | | Approximate Average Daily Balance | | Approximate Weighted Average Interest Rate | |
VP Strategic Allocation Conservative | | 3 | | $ | 4,360,000 | | 2.55 | % |
VP Strategic Allocation Growth | | 3 | | | 3,690,000 | | 2.55 | |
VP Strategic Allocation Moderate | | 3 | | | 7,300,000 | | 2.55 | |
NOTE 9 — CAPITAL SHARES
Transactions in capital shares and dollars were as follows:
| | | | | | | | | | | | | | | | | | | | | | |
| | | Shares
sold | | Reinvestment
of
distributions | | Shares
redeemed | | | Net increase
(decrease) in
shares
outstanding | | | | | Shares
sold | | Reinvestment
of
distributions | | Shares
redeemed | | | Net increase
(decrease) in
shares
outstanding | |
Year or period ended | | # | | # | | # | | | # | | | | | ($) | | ($) | | ($) | | | ($) | |
VP Strategic Allocation Conservative | | | | | | | | | | | | | |
Class ADV | | | | | | | | | | | | | | | | | | | | | | |
12-31-08 | | — | | — | | (1 | ) | | (1 | ) | | | | — | | — | | (13 | ) | | (13 | ) |
12-31-07 | | 2 | | — | | — | | | 2 | | | | | 26 | | — | | — | | | 26 | |
Class I | | | | | | | | | | | | | | | | | | | | | | |
12-31-08 | | 687,409 | | 1,242,737 | | (2,619,026 | ) | | (688,880 | ) | | | | 8,184,230 | | 14,353,612 | | (29,801,190 | ) | | (7,263,348 | ) |
12-31-07 | | 1,021,860 | | 632,837 | | (2,322,499 | ) | | (667,802 | ) | | | | 13,694,216 | | 8,195,239 | | (31,185,628 | ) | | (9,296,173 | ) |
Class S | | | | | | | | | | | | | | | | | | | | | | |
12-31-08 | | 54,595 | | 16,037 | | (33,360 | ) | | 37,272 | | | | | 641,111 | | 184,260 | | (366,348 | ) | | 459,023 | |
12-31-07 | | 80,497 | | 3,708 | | (23,551 | ) | | 60,654 | | | | | 1,072,360 | | 47,871 | | (315,918 | ) | | 804,313 | |
27
NOTES TO FINANCIAL STATEMENTSASOF DECEMBER 31, 2008 (CONTINUED)
NOTE 9 — CAPITAL SHARES (continued)
| | | | | | | | | | | | | | | | | | | | | | |
| | | Shares
sold | | Reinvestment
of
distributions | | Shares
redeemed | | | Net increase
(decrease) in
shares
outstanding | | | | | Shares
sold | | Reinvestment
of
distributions | | Shares
redeemed | | | Net increase
(decrease) in
shares
outstanding | |
Year or period ended | | # | | # | | # | | | # | | | | | ($) | | ($) | | ($) | | | ($) | |
VP Strategic Allocation Growth | | | | | | | | | | | | | |
Class ADV | | | | | | | | | | | | | | | | | | | | | | |
12-31-08 | | — | | — | | (1 | ) | | (1 | ) | | | | — | | — | | (12 | ) | | (12 | ) |
12-31-07 | | 1 | | — | | — | | | 1 | | | | | 16 | | — | | — | | | 16 | |
Class I | | | | | | | | | | | | | | | | | | | | | | |
12-31-08 | | 765,527 | | 2,623,629 | | (3,420,752 | ) | | (31,596 | ) | | | | 8,668,497 | | 34,789,315 | | (43,398,417 | ) | | 59,395 | |
12-31-07 | | 759,726 | | 1,381,549 | | (3,363,321 | ) | | (1,222,046 | ) | | | | 12,807,326 | | 22,146,225 | | (56,476,252 | ) | | (21,522,701 | ) |
Class S | | | | | | | | | | | | | | | | | | | | | | |
12-31-08 | | 116,361 | | 10,886 | | (24,057 | ) | | 103,190 | | | | | 1,554,449 | | 143,702 | | (300,466 | ) | | 1,397,685 | |
12-31-07 | | 39,308 | | 1,439 | | (14,924 | ) | | 25,823 | | | | | 651,634 | | 23,003 | | (241,996 | ) | | 432,641 | |
VP Strategic Allocation Moderate | | | | | | | | | | | | | |
Class ADV | | | | | | | | | | | | | | | | | | | | | | |
12-31-08 | | — | | — | | (1 | ) | | (1 | ) | | | | — | | — | | (14 | ) | | (14 | ) |
12-31-07 | | 2 | | — | | — | | | 2 | | | | | 30 | | — | | — | | | 30 | |
Class I | | | | | | | | | | | | | | | | | | | | | | |
12-31-08 | | 782,124 | | 2,635,971 | | (3,999,526 | ) | | (581,431 | ) | | | | 9,346,098 | | 32,686,040 | | (46,943,250 | ) | | (4,911,112 | ) |
12-31-07 | | 1,037,764 | | 1,203,900 | | (4,343,607 | ) | | (2,101,943 | ) | | | | 15,746,184 | | 17,552,859 | | (66,122,963 | ) | | (32,823,920 | ) |
Class S | | | | | | | | | | | | | | | | | | | | | | |
12-31-08 | | 180,986 | | 13,641 | | (31,387 | ) | | 163,240 | | | | | 2,226,808 | | 168,600 | | (369,565 | ) | | 2,025,843 | |
12-31-07 | | 41,840 | | 3,051 | | (11,363 | ) | | 33,528 | | | | | 633,438 | | 44,396 | | (172,089 | ) | | 505,745 | |
NOTE 10 — SECURITIES LENDING
Under an agreement with The Bank of New York Mellon (“BNY”), the Portfolios can lend their securities to approved brokers, dealers and other financial institutions. Loans are collateralized by cash and U.S. government securities. The collateral is equal to at least 105% of the market value of non-U.S. securities loaned and 102% of the market value of U.S. securities loaned when the transaction is entered into and is adjusted daily for changes in the market values of the securities on loan. The cash collateral received is invested in approved investments as defined in the Securities Lending Agreement with BNY (the “Agreement”). The Portfolios bear the risk of loss with respect to the investment of collateral. Currently, the cash collateral is invested in the Bank of New York Mellon Corp. Institutional Cash Reserves Fund (“BICR Fund”). BNY serves as investment manager, custodian and operational trustee of the BICR Fund. Generally, in the event of counterparty default, the Portfolios have the right to use the collateral to offset losses incurred. The Agreement contains certain guarantees by BNY in the event of counterparty default and/or a borrower’s failure to return a loaned security; however, there would
be a potential loss to the Portfolios in the event the Portfolios are delayed or prevented from exercising their right to dispose of the collateral. Engaging in securities lending could have a leveraging effect, which may intensify the credit, market and other risks associated with investing in the Portfolios. At December 31, 2008, the Portfolios had no securities on loan.
NOTE 11 — CONCENTRATION OF INVESTMENT RISK
For the period beginning April 7, 2008, each Portfolio is also affected by other kinds of risks, depending on the types of securities held or strategies used by an Underlying Fund.
Investment by Funds-of-Funds. Each of the Underlying Funds’ shares may be purchased by other investment companies. In some cases, an Underlying Fund may experience large inflows or redemptions due to allocations or rebalancings. While it is impossible to predict the overall impact of these transactions over time, there could be adverse effects on portfolio management. The Investment Adviser will monitor transactions by each Portfolio and will attempt to minimize any adverse effects on the Underlying Funds and the Portfolio as a result of these transactions. So
28
NOTES TO FINANCIAL STATEMENTSASOF DECEMBER 31, 2008 (CONTINUED)
NOTE 11 — CONCENTRATION OF INVESTMENT RISK (continued)
long as an Underlying Fund accepts investments by other investment companies, it will not purchase securities of other investment companies, except to the extent permitted by the 1940 Act or under the terms of an exemptive order granted by the SEC.
Asset Allocation. Although asset allocation seeks to optimize returns given various levels of risk tolerance, you still may lose money and experience volatility. Market and asset class performance may differ in the future from the historical performance and the assumptions used to form the asset allocations for the Portfolio. Furthermore, the Investment Adviser’s allocation of the Portfolio’s assets may not anticipate market trends successfully. Assets will be allocated among Underlying Funds and markets based on judgments made by the Investment Adviser. There is a risk that the Portfolio may allocate assets to an asset class or market that underperforms other Underlying Funds. For example, the Portfolio may be underweighted in assets or a market that is experiencing significant returns or overweighted in assets or a market with significant declines.
Foreign Securities. There are certain risks in owning foreign securities, including those resulting from: fluctuations in currency exchange rates; devaluation of currencies; political or economic developments and the possible imposition of currency exchange blockages or other foreign governmental laws or restrictions; reduced availability of public information concerning issuers; accounting, auditing and financial reporting standards or other regulatory practices and requirements that are not uniform when compared to those applicable to domestic companies; settlement and clearance procedures in some countries that may not be reliable and can result in delays in settlement; higher transaction and custody expenses than for domestic securities; and limitations on foreign ownership of equity securities. Also, securities of many foreign companies may be less liquid and the prices more volatile than those of domestic companies. With certain foreign countries, there is the possibility of expropriation, nationalization, confiscatory taxation and limitations on the use or removal of funds or other assets of Underlying Funds, including the withholding of dividends. Certain Underlying Funds may enter into foreign currency transactions either on a spot or cash basis at prevailing rates or through forward foreign
currency exchange contracts in order to have the necessary currencies to settle transactions, to help protect Underlying Fund assets against adverse changes in foreign currency exchange rates, or to provide exposure to a foreign currency commensurate with the exposure to securities from that country. Such efforts could limit potential gains that might result from a relative increase in the value of such currencies, and might, in certain cases, result in losses to the Underlying Fund. The risks of investing in foreign securities may be greater for countries with an emerging securities market.
Emerging Markets Investments. Certain Underlying Funds may invest in emerging markets. Because of less developed markets and economies and, in some countries, less mature governments and governmental institutions, the risks of investing in foreign securities can be intensified in the case of investments in issuers domiciled or doing substantial business in countries with an emerging securities market. These risks include: high concentration of market capitalization and trading volume in a small number of issuers representing a limited number of industries, as well as a high concentration of investors and financial intermediaries; political and social uncertainties; over-dependence on exports, especially with respect to primary commodities, making these economies vulnerable to changes in commodity prices; overburdened infrastructure and obsolete or unseasoned financial systems; environmental problems; less developed legal systems; and less reliable custodial services and settlement practices.
NOTE 12 — FEDERAL INCOME TAXES AND OTHER TAX MATTERS
The amount of distributions from net investment income and net realized capital gains are determined in accordance with federal income tax regulations, which may differ from U.S. generally accepted accounting principles for investment companies. These book/tax differences may be either temporary or permanent. Permanent differences are reclassified within the capital accounts based on their federal tax-basis treatment; temporary differences are not reclassified. Key differences include the treatment of short-term capital gains, foreign currency transactions, and wash sale deferrals. Distributions in excess of net investment income and/or net realized capital gains for tax purposes are reported as return of capital.
29
NOTES TO FINANCIAL STATEMENTSASOF DECEMBER 31, 2008 (CONTINUED)
NOTE 12 — FEDERAL INCOME TAXES AND OTHER TAX MATTERS (continued)
The following permanent tax differences have been reclassified as of December 31, 2008:
| | | | | | | |
| | | Undistributed Net Investment Income | | Accumulated Net Realized Gains/(Losses) | |
| | |
VP Strategic Allocation Conservative | | $ | 2,751,177 | | $ | (2,751,177 | ) |
| | |
VP Strategic Allocation Growth | | | 9,566,133 | | | (9,566,133 | ) |
| | |
VP Strategic Allocation Moderate | | | 7,329,131 | | | (7,329,131 | ) |
Dividends paid by the Portfolios from net investment income and distributions of net realized short-term capital gains are, for federal income tax purposes, taxable as ordinary income to shareholders.
The tax composition of dividends and distributions to shareholders was as follows:
| | | | | | | | | | | | |
| | | Year Ended December 31, 2008 | | Year Ended December 31, 2007 |
| | | Ordinary Income | | Long-Term Capital Gains | | Ordinary Income | | Long-Term Capital Gains |
| | | | |
VP Strategic Allocation Conservative | | $ | 8,096,981 | | $ | 6,441,002 | | $ | 5,506,546 | | $ | 2,736,623 |
| | | | |
VP Strategic Allocation Growth | | | 11,659,701 | | | 23,273,446 | | | 9,499,660 | | | 12,669,647 |
| | | | |
VP Strategic Allocation Moderate | | | 13,352,069 | | | 19,502,697 | | | 9,078,874 | | | 8,518,445 |
The tax-basis components of distributable earnings and the expiration dates of the capital loss carryforwards which may be used to offset future realized capital gains for federal income tax purposes as of December 31, 2008 were:
| | | | | | | | | | | | | | | | |
| | | Undistributed Ordinary Income | | Undistributed Long-Term Capital Gains | | Unrealized Appreciation/ (Depreciation) | | | Capital Loss Carryforwards | | | Expiration Dates |
| | | | | |
VP Strategic Allocation Conservative | | $ | 7,328,644 | | $ | — | | $ | (31,469,443 | ) | | $ | (710,796 | ) | | 2016 |
| | | | | |
VP Strategic Allocation Growth | | | 15,498,327 | | | 8,485,130 | | | (88,750,297 | ) | | | — | | | — |
| | | | | |
VP Strategic Allocation Moderate | | | 14,470,427 | | | 4,793,412 | | | (75,016,963 | ) | | | — | | | — |
The Portfolios’ major tax jurisdictions are federal and Arizona. The earliest tax year that remains subject to examination by these jurisdictions is 2004.
Under U.S. federal income tax law, as specified in the Internal Revenue Code (the “Code”) and U.S. Treasury regulations, the Portfolios must meet various technical requirements relating to fund administration, portfolio investments, and “eligible investors” in the Portfolios. Complying with these requirements is a condition for beneficial tax treatment of certain insurance products that offer the Portfolios as investment options. The failure of the Portfolios to meet any of these complex requirements could result in an excise tax, administrative penalties imposed by the Internal Revenue Service, potential liability to insurers whose products include the Portfolios as investment options, and unanticipated costs associated with remedying a failure.
NOTE 13 — OTHER ACCOUNTING PRONOUNCEMENT
On March 19, 2008, the FASB issued Statement of Financial Accounting Standards No. 161 (“SFAS No. 161”), “Disclosure about Derivative Instruments and Hedging Activities.” This new accounting statement requires enhanced disclosures about an
entity’s derivative and hedging activities. Entities are required to provide enhanced disclosures about (a) how and why an entity invests in derivatives, (b) how derivatives are accounted for under SFAS No. 133, and (c) how derivatives affect an entity’s financial position, financial performance, and cash flows. SFAS No. 161 also requires enhanced disclosures regarding credit-risk-related contingent features of derivative instruments. SFAS No. 161 is effective for financial statements issued for fiscal years and interim periods beginning after November 15, 2008. As of December 31, 2008, management of the Portfolios is currently assessing the impact of the expanded financial statement disclosures that will result from adopting SFAS No. 161.
NOTE 14 — SUBSEQUENT EVENTS
Effective May 1, 2009, the name of each Portfolio will be renamed from “ING VP Strategic Allocation Conservative Portfolio,” “ING VP Strategic Allocation Growth Portfolio,” and “ING VP Strategic Allocation Moderate Portfolio” to “ING Strategic Allocation Conservative Portfolio,” “ING Strategic Allocation Growth Portfolio,” and “ING Strategic Allocation Moderate Portfolio,” respectively.
30
| | |
ING VP STRATEGIC ALLOCATION
CONSERVATIVE PORTFOLIO | | PORTFOLIO OF INVESTMENTS ASOF DECEMBER 31, 2008 |
| | | | | | | | | |
| Shares | | | | | | | Value | |
| AFFILIATED INVESTMENT COMPANIES: 94.8% | | | | | |
| 870,263 | | ING Real Estate Fund - Class I | | | | | $ | 8,058,638 | |
| 1,242,760 | | ING Tactical Asset Allocation Fund - Class I | | | | | | 7,804,530 | |
| 1,868,470 | | ING VP Index Plus International Equity Portfolio - Class I | | | | | | 9,641,307 | |
| 656,401 | | ING VP Index Plus LargeCap Portfolio - Class I | | | | | | 6,852,822 | |
| 259,686 | | ING VP Index Plus MidCap Portfolio - Class I | | | | | | 2,581,276 | |
| 268,401 | | ING VP Index Plus SmallCap Portfolio - Class I | | | | | | 2,525,656 | |
| 4,114,199 | | ING VP Intermediate Bond Portfolio - Class I | | | | | | 45,585,326 | |
| | | | | | | | | |
| | Total Affiliated Investment Companies
( Cost $111,791,029) | | | | | | 83,049,555 | |
| | | | | | | | | |
| SHORT-TERM INVESTMENTS: 5.3% | | | | | |
| | Affiliated Mutual Fund: 5.3% | | | | | |
| 4,631,390 | | ING Institutional Prime Money Market Fund - Class I | | | | | | 4,631,390 | |
| | | | | | | | | |
| | Total Short-Term Investments
(Cost $4,631,390) | | | | | | 4,631,390 | |
| | | | | | | | | |
| | Total Investments in Securities
(Cost $116,422,419)* | | 100.1 | % | | $ | 87,680,945 | |
| | Other Assets and Liabilities - Net | | (0.1 | ) | | | (55,287 | ) |
| | | | | | | | | |
| | Net Assets | | 100.0 | % | | $ | 87,625,658 | |
| | | | | | | | | |
| * | Cost for federal income tax purposes is $119,150,971. |
| | | | |
Net unrealized depreciation consists of: | | | | |
Gross Unrealized Appreciation | | $ | — | |
Gross Unrealized Depreciation | | | (31,470,026 | ) |
| | | | |
Net Unrealized Depreciation | | $ | (31,470,026 | ) |
| | | | |
The following table summarizes the inputs used as of December 31, 2008 in determining the Portfolio’s investments at fair value for purposes of SFAS 157:
| | | | | | |
| | | Investments in Securities | | Other Financial Instruments* |
Level 1 — Quoted Prices | | $ | 87,680,945 | | $ | — |
Level 2 — Other Significant Observable Inputs | | | — | | | — |
Level 3 — Significant Unobservable Inputs | | | — | | | — |
| | | | | | |
Total | | $ | 87,680,945 | | $ | — |
| | | | | | |
“Fair value” for purposes of SFAS 157 is different from “fair value” as used in the 1940 Act. The former generally implies market value, and can include market quotations as a source of value, and the latter refers to determinations of actual value in absence of available market quotations.
| * | Other financial instruments may include forward foreign currency contracts, futures, swaps, and written options. Forward foreign currency contracts and futures are reported at their unrealized gain/loss at year end. Swaps and written options are reported at their market value at year end. |
A roll forward of fair value measurements using significant unobservable inputs (Level 3) for the year ended December 31, 2008, was as follows:
| | | | | | | |
| | | Investments in Securities | | | Other Financial Instruments* |
Beginning Balance at 12/31/07 | | $ | 1,915,822 | | | $ | — |
Net Purchases/(Sales) | | | (1,451,073 | ) | | | — |
Accrued Discounts/(Premiums) | | | (26,360 | ) | | | — |
Total Realized Gain/(Loss) | | | (653,892 | ) | | | — |
Total Unrealized Appreciation/(Depreciation) | | | 215,503 | | | | — |
Net Transfers In/(Out) of Level 3 | | | — | | | | — |
| | | | | | | |
Ending Balance at 12/31/08 | | $ | — | | | $ | — |
| | | | | | | |
| * | Other financial instruments may include forward foreign currency contracts, futures, swaps, and written options. Forward foreign currency contracts and futures are reported at their unrealized gain/loss at year end. Swaps and written options are reported at their market value at year end. |
For the year ended December 31, 2008, total change in unrealized gain (loss) on Level 3 securities included in the change in net assets was $—. Total unrealized gain (loss) for all securities (including Level 1 and Level 2) can be found on the accompanying Statement of Operations.
See Accompanying Notes to Financial Statements
31
| | |
ING VP STRATEGIC ALLOCATION
GROWTH PORTFOLIO | | PORTFOLIO OF INVESTMENTS ASOF DECEMBER 31, 2008 |
| | | | | | | | | |
| Shares | | | | | | | Value | |
| AFFILIATED INVESTMENT COMPANIES: 97.8% | | | | | |
| 908,132 | | ING Real Estate Fund - Class I | | | | | $ | 8,409,303 | |
| 3,236,173 | | ING Tactical Asset Allocation Fund - Class I | | | | | | 20,323,497 | |
| 7,362,618 | | ING VP Index Plus International Equity Portfolio - Class I | | | | | | 37,991,108 | |
| 2,988,244 | | ING VP Index Plus LargeCap Portfolio - Class I | | | | | | 31,197,266 | |
| 1,351,494 | | ING VP Index Plus MidCap Portfolio - Class I | | | | | | 13,433,852 | |
| 1,397,518 | | ING VP Index Plus SmallCap Portfolio - Class I | | | | | | 13,150,646 | |
| 1,850,782 | | ING VP Intermediate Bond Portfolio - Class I | | | | | | 20,506,665 | |
| | | | | | | | | |
| | Total Affiliated Investment Companies
( Cost $228,269,782) | | | | | | 145,012,337 | |
| | | | | | | | | |
| SHORT-TERM INVESTMENTS: 2.2% | | | | | |
| | Affiliated Mutual Fund: 2.2% | | | | | |
| 3,204,696 | | ING Institutional Prime Money Market Fund - Class I | | | | | | 3,204,696 | |
| | | | | | | | | |
| | Total Short-Term Investments
(Cost $3,204,696) | | | | | | 3,204,696 | |
| | | | | | | | | |
| | Total Investments in Securities
(Cost $231,474,478)* | | 100.0 | % | | $ | 148,217,033 | |
| | Other Assets and Liabilities - Net | | (0.0 | ) | | | (32,673 | ) |
| | | | | | | | | |
| | Net Assets | | 100.0 | % | | $ | 148,184,360 | |
| | | | | | | | | |
| * | Cost for federal income tax purposes is $236,972,302. |
| | | | |
Net unrealized depreciation consists of: | | | | |
Gross Unrealized Appreciation | | $ | — | |
Gross Unrealized Depreciation | | | (88,755,269 | ) |
| | | | |
Net Unrealized Depreciation | | $ | (88,755,269 | ) |
| | | | |
The following table summarizes the inputs used as of December 31, 2008 in determining the Portfolio’s investments at fair value for purposes of SFAS 157:
| | | | | | |
| | | Investments in Securities | | Other Financial Instruments* |
Level 1 — Quoted Prices | | $ | 148,217,033 | | $ | — |
Level 2 — Other Significant Observable Inputs | | | — | | | — |
Level 3 — Significant Unobservable Inputs | | | — | | | — |
| | | | | | |
Total | | $ | 148,217,033 | | $ | — |
| | | | | | |
“Fair value” for purposes of SFAS 157 is different from “fair value” as used in the 1940 Act. The former generally implies market value, and can include market quotations as a source of value, and the latter refers to determinations of actual value in absence of available market quotations.
| * | Other financial instruments may include forward foreign currency contracts, futures, swaps, and written options. Forward foreign currency contracts and futures are reported at their unrealized gain/loss at year end. Swaps and written options are reported at their market value at year end. |
A roll forward of fair value measurements using significant unobservable inputs (Level 3) for the year ended December 31, 2008, was as follows:
| | | | | | | |
| �� | | Investments in Securities | | | Other Financial Instruments* |
Beginning Balance at 12/31/07 | | $ | 780,143 | | | $ | — |
Net Purchases/(Sales) | | | (592,470 | ) | | | — |
Accrued Discounts/(Premiums) | | | (10,395 | ) | | | — |
Total Realized Gain/(Loss) | | | (266,553 | ) | | | — |
Total Unrealized Appreciation/(Depreciation) | | | 89,275 | | | | — |
Net Transfers In/(Out) of Level 3 | | | — | | | | — |
| | | | | | | |
Ending Balance at 12/31/08 | | $ | — | | | $ | — |
| | | | | | | |
| * | Other financial instruments may include forward foreign currency contracts, futures, swaps, and written options. Forward foreign currency contracts and futures are reported at their unrealized gain/loss at year end. Swaps and written options are reported at their market value at year end. |
For the year ended December 31, 2008, total change in unrealized gain (loss) on Level 3 securities included in the change in net assets was $—. Total unrealized gain (loss) for all securities (including Level 1 and Level 2) can be found on the accompanying Statement of Operations.
See Accompanying Notes to Financial Statements
32
| | |
ING VP STRATEGIC ALLOCATION
MODERATE PORTFOLIO | | PORTFOLIO OF INVESTMENTS ASOF DECEMBER 31, 2008 |
| | | | | | | | | |
| Shares | | | | | | | Value | |
| AFFILIATED INVESTMENT COMPANIES: 96.8% | | | | | |
| 1,250,528 | | ING Real Estate Fund - Class I | | | | | $ | 11,579,885 | |
| 3,350,065 | | ING Tactical Asset Allocation Fund - Class I | | | | | | 21,038,513 | |
| 5,494,937 | | ING VP Index Plus International Equity Portfolio - Class I | | | | | | 28,353,876 | |
| 1,769,611 | | ING VP Index Plus LargeCap Portfolio - Class I | | | | | | 18,474,734 | |
| 933,376 | | ING VP Index Plus MidCap Portfolio - Class I | | | | | | 9,277,762 | |
| 964,599 | | ING VP Index Plus SmallCap Portfolio - Class I | | | | | | 9,076,876 | |
| 4,732,668 | | ING VP Intermediate Bond Portfolio - Class I | | | | | | 52,437,958 | |
| | | | | | | | | |
| | Total Affiliated Investment Companies
(Cost $218,887,144) | | | | | | 150,239,604 | |
| | | | | | | | | |
| SHORT-TERM INVESTMENTS: 3.2% | | | | | |
| | Affiliated Mutual Fund: 3.2% | | | | | |
| 4,995,158 | | ING Institutional Prime Money Market Fund - Class I | | | | | | 4,995,158 | |
| | | | | | | | | |
| | Total Short-Term Investments
(Cost $4,995,158) | | | | | | 4,995,158 | |
| | | | | | | | | |
| | Total Investments in Securities
(Cost $223,882,302)* | | 100.0 | % | | $ | 155,234,762 | |
| | Other Assets and Liabilities - Net | | (0.0 | ) | | | (77,055 | ) |
| | | | | | | | | |
| | Net Assets | | 100.0 | % | | $ | 155,157,707 | |
| | | | | | | | | |
| * | Cost for federal income tax purposes is $230,252,970. |
| | | | |
Net unrealized depreciation consists of: | | | | |
Gross Unrealized Appreciation | | $ | — | |
Gross Unrealized Depreciation | | | (75,018,208 | ) |
| | | | |
Net Unrealized Depreciation | | $ | (75,018,208 | ) |
| | | | |
The following table summarizes the inputs used as of December 31, 2008 in determining the Portfolio’s investments at fair value for purposes of SFAS 157:
| | | | | | |
| | | Investments in Securities | | Other Financial Instruments* |
Level 1 — Quoted Prices | | $ | 155,234,762 | | $ | — |
Level 2 — Other Significant Observable Inputs | | | — | | | — |
Level 3 — Significant Unobservable Inputs | | | — | | | — |
| | | | | | |
Total | | $ | 155,234,762 | | $ | — |
| | | | | | |
“Fair value” for purposes of SFAS 157 is different from “fair value” as used in the 1940 Act. The former generally implies market value, and can include market quotations as a source of value, and the latter refers to determinations of actual value in absence of available market quotations.
| * | Other financial instruments may include forward foreign currency contracts, futures, swaps, and written options. Forward foreign currency contracts and futures are reported at their unrealized gain/loss at year end. Swaps and written options are reported at their market value at year end. |
A roll forward of fair value measurements using significant unobservable inputs (Level 3) for the year ended December 31, 2008, was as follows:
| | | | | | | |
| | | Investments in Securities | | | Other Financial Instruments* |
Beginning Balance at 12/31/07 | | $ | 1,539,434 | | | $ | — |
Net Purchases/(Sales) | | | (1,181,059 | ) | | | — |
Accrued Discounts/(Premiums) | | | (22,872 | ) | | | — |
Total Realized Gain/(Loss) | | | (500,468 | ) | | | — |
Total Unrealized Appreciation/(Depreciation) | | | 164,965 | | | | — |
Net Transfers In/(Out) of Level 3 | | | — | | | | — |
| | | | | | | |
Ending Balance at 12/31/08 | | $ | — | | | $ | — |
| | | | | | | |
| * | Other financial instruments may include forward foreign currency contracts, futures, swaps, and written options. Forward foreign currency contracts and futures are reported at their unrealized gain/loss at year end. Swaps and written options are reported at their market value at year end. |
For the year ended December 31, 2008, total change in unrealized gain (loss) on Level 3 securities included in the change in net assets was $—. Total unrealized gain (loss) for all securities (including Level 1 and Level 2) can be found on the accompanying Statement of Operations.
See Accompanying Notes to Financial Statements
33
TAX INFORMATION (UNAUDITED)
Dividends paid during the year ended December 31, 2008 were as follows:
| | | | | |
Fund Name | | Type | | Per Share Amount |
| | |
ING VP Strategic Allocation Conservative Portfolio | | | | | |
Class ADV | | NII | | $ | 0.4587 |
Class I | | NII | | $ | 0.5044 |
Class S | | NII | | $ | 0.4838 |
All Classes | | STCG | | $ | 0.3303 |
All Classes | | LTCG | | $ | 0.6637 |
| | |
ING VP Strategic Allocation Growth Portfolio | | | | | |
Class ADV | | NII | | $ | 0.2855 |
Class I | | NII | | $ | 0.3387 |
Class S | | NII | | $ | 0.3240 |
All Classes | | STCG | | $ | 0.4169 |
All Classes | | LTCG | | $ | 1.5081 |
| | |
ING VP Strategic Allocation Moderate Portfolio | | | | | |
Class ADV | | NII | | $ | 0.3168 |
Class I | | NII | | $ | 0.3991 |
Class S | | NII | | $ | 0.3739 |
All Classes | | STCG | | $ | 0.3978 |
All Classes | | LTCG | | $ | 1.1638 |
NII - Net investment income
STCG - Short-term capital gain
LTCG - Long-term capital gain
Of the ordinary distributions made during the year ended December 31, 2008, the following percentages qualify for the dividends received deduction (DRD) available to corporate shareholders:
| | | |
| |
ING VP Strategic Allocation Conservative Portfolio | | 10.11 | % |
| |
ING VP Strategic Allocation Growth Portfolio | | 25.95 | % |
| |
ING VP Strategic Allocation Moderate Portfolio | | 19.38 | % |
Above figures may differ from those cited elsewhere in this report due to differences in the calculation of income and gains under U.S. generally accepted accounting principles (book) purposes and Internal Revenue Service (tax) purposes.
Shareholders are strongly advised to consult their own tax advisers with respect to the tax consequences of their investments in the Portfolios. In January, shareholders, excluding corporate shareholders, receive an IRS 1099-DIV regarding the federal tax status of the dividends and distributions they received in the calendar year.
34
DIRECTOR AND OFFICER INFORMATION (UNAUDITED)
The business and affairs of the Company are managed under the direction of the Board. A director who is not an interested person of the Company, as defined in the 1940 Act, is an independent director (“Non-Interested Director”). The Directors of the Portfolios are listed below. The Statement of Additional Information includes additional information about Directors of the Company and is available, without charge, upon request at (800) 992-0180.
| | | | | | | | | | |
Name, Address and Age | | Position(s) held with the Company | | Term of Office and Length of Time Served(1) | | Principal Occupation(s) during the Past Five Years | | Number of Portfolios in Fund Complex Overseen by Director(2) | | Other Directorships held by Director |
| | | | |
| Independent Directors: | | | | | | | | |
| | | | | |
Albert E. DePrince, Jr. 7337 E. Doubletree Ranch Rd. Scottsdale, Arizona 85258 Age: 67 | | Director | | June 1998 - Present | | Professor of Economics and Finance, Middle Tennessee State University (August 1991- Present). | | 39 | | Academy of Economics and Finance (February 2002 - Present). |
| | | | | |
Martin Gavin (*) 7337 E. Doubletree Ranch Rd. Scottsdale, Arizona 85258 Age: 58 | | Director | | January 2009- Present | | President, Connecticut Children’s Medical Center (May 2006 - Present). Formerly, Interim President, Connecticut Children’s Medical Center (January 2006 – May 2006). | | 39 | | None |
| | | | | |
Sidney Koch 7337 E. Doubletree Ranch Rd. Scottsdale, Arizona 85258 Age: 73 | | Director | | April 1994 - Present | | Retired. Self-Employed Consultant (June 2000 - Present). | | 39 | | None |
| | | | | |
Dr. Corine T. Norgaard 7337 E. Doubletree Ranch Rd. Scottsdale, Arizona 85258 Age: 71 | | Director | | June 1991 - Present | | Retired. Formerly, Dean of the Barney School of Business, University of Hartford (August 1996 - June 2004). Formerly, President, Thompson Enterprises (September 2004 - September 2005). | | 39 | | Mass Mutual Corporate and Participation Investors (April 1997 - Present); Mass Mutual Premier Series (December 2004 - Present); and Mass Mutual MML Series Investment Funds II (December 2005 - Present). |
| | | | | |
Joseph E. Obermeyer 7337 E. Doubletree Ranch Rd. Scottsdale, Arizona 85258 Age: 51 | | Director | | January 2003 - Present | | President, Obermeyer & Associates, Inc. (November 1999 - Present). | | 39 | | None |
| | | | | |
Russell Jones 7337 E. Doubletree Ranch Rd. Scottsdale, Arizona 85258 Age: 64 | | Director | | December 2007 - Present | | Retired. Formerly, Senior Vice President, Chief Investment Officer and Treasurer Kaman Corporation (1973 - March 2008) | | 39 | | None |
35
DIRECTOR AND OFFICER INFORMATION (UNAUDITED) (CONTINUED)
| | | | | | | | | | |
Name, Address and Age | | Position(s) held with the Companies | | Term of Office and Length of Time Served(1) | | Principal Occupation(s) during the Past Five Years | | Number of Portfolios in Fund Complex Overseen by Director(2) | | Other Directorships held by Director |
Directors/Trustee who are “Interested Persons:” | | | | |
| | | | | |
Shaun Mathews(3)(4) 7337 E. Doubletree Ranch Rd. Scottsdale, Arizona 85258 Age: 53 | | Director | | December 2007 - Present | | President and Chief Executive Officer, ING Investments, LLC(5) (November 2006 - Present). Formerly, President, ING Mutual Funds and Investment Products (November 2004 - November 2006); Chief Marketing Officer, ING USFS (April 2002 - October 2004); and Head of Rollover/Payout (October 2001 - December 2003). | | 200 | | ING Services Holding Company, Inc. (May 2000 - Present); Southland Life Insurance Company (June 2002 - Present); and ING Capital Corporation, LLC, ING Funds Distributor, LLC(6), ING Funds Services, LLC(7), ING Investments, LLC(5) and ING Pilgrim Funding, Inc. (December 2006 - Present). |
| | | | | |
Fredric (Rick) A. Nelson III(8) ING Investment Management 230 Park Avenue New York, New York 10169 Age: 52 | | Director | | December 2007 - January 2009 | | Chief Investment Officer, ING (April 2003 - January 2009) | | | | None |
(*) | | Mr. Martin Gavin was appointed to the Board effective January 1, 2009. |
(1) | | Directors/Trustees serve until their successors are duly elected and qualified. |
(2) | | For the purposes of this table (except for Mr. Mathews), “Fund Complex” means the following investment companies: ING Series Fund, Inc.; ING Strategic Allocation Portfolios, Inc.; ING Variable Funds; ING Variable Portfolios, Inc.; ING VP Balanced Portfolio, Inc.; ING VP Intermediate Bond Portfolio; and ING VP Money Market Portfolio. |
(3) | | For Mr. Mathews, the Fund Complex also includes the following investment companies: ING Asia Pacific High Dividend Equity Income Fund, ING Equity Trust; ING Funds Trust; ING Global Equity Dividend and Premium Opportunity Fund; ING Global Advantage and Premium Opportunity Fund; ING International High Dividend Equity Income Fund; ING Investors Trust; ING Mayflower Trust; ING Mutual Funds; ING Prime Rate Trust; ING Risk Managed Natural Resources Fund; ING Senior Income Fund; ING Separate Portfolios Trust; ING Variable Insurance Trust; ING Variable Products Trust; and ING Partners, Inc. |
(4) | | “Interested person,” as defined in the 1940 Act, by virtue of this Director’s/Trustee’s affiliation with any of the Funds, ING or any of ING’s affiliates. |
(5) | | ING Investments, LLC was previously named ING Pilgrim Investments, LLC. ING Pilgrim Investments, LLC is the successor in interest to ING Pilgrim Investments, Inc., which was previously known as Pilgrim Investments, Inc. and before that was known as Pilgrim America Investments, Inc. |
(6) | | ING Funds Distributor, LLC is the successor in interest to ING Funds Distributor, Inc., which was previously known as ING Pilgrim Securities, Inc., and before that was known as Pilgrim Securities, Inc., and before that was known as Pilgrim America Securities, Inc. |
(7) | | ING Funds Services, LLC was previously named ING Pilgrim Group, LLC. ING Pilgrim Group, LLC is the successor in interest to ING Pilgrim Group, Inc., which was previously known as Pilgrim Group, Inc. and before that was known as Pilgrim America Group, Inc. |
(8) | | Mr. Nelson resigned from the Board as of January 15, 2009. |
36
DIRECTOR AND OFFICER INFORMATION (UNAUDITED) (CONTINUED)
| | | | | | |
Name, Address and Age | | Position(s) Held
with the Companies | | Term of Office and Length of Time Served(1) | | Principal Occupation(s) during the Past Five Years |
Officers: | | | | | | |
| | | |
Shaun P. Mathews 7337 East Doubletree Ranch Rd. Scottsdale, Arizona 85258 Age: 53 | | President and Chief Executive Officer | | December 2006 - Present | | President and Chief Executive Officer, ING Investments, LLC (November 2006 - Present). Formerly, President, ING Mutual Funds and Investment Products (November 2004 - November 2006); Chief Marketing Officer, ING USFS (April 2002 - October 2004); and Head of Rollover/Payout (October 2001 - December 2003). |
| | | |
Michael J. Roland 7337 East Doubletree Ranch Rd. Scottsdale, Arizona 85258 Age: 50 | | Executive Vice President | | April 2002 - Present | | Head of Mutual Fund Platform (February 2007 - Present) and Executive Vice President, ING Investments, LLC(2) and ING Funds Services, LLC(3) (December 2001 - Present). Formerly, Executive Vice President, Head of Product Management (January 2005 - January 2007); Chief Compliance Officer, ING Investments, LLC(2) and Directed Services LLC(6) (October 2004 - December 2005); and Chief Financial Officer and Treasurer, ING Investments, LLC(2) (December 2001 - March 2005). |
| | | |
Stanley D. Vyner 230 Park Avenue New York, New York 10169 Age: 58 | | Executive Vice President | | March 2002 - Present | | Executive Vice President, ING Investments, LLC(2) (July 2000 - Present) and Chief Investment Risk Officer, ING Investments, LLC(2) (January 2003 - Present). |
| | | |
Joseph M. O’Donnell 7337 East Doubletree Ranch Rd. Scottsdale, Arizona 85258 Age: 54 | | Executive Vice President and Chief Compliance Officer | | March 2006 - Present November 2004 - Present | | Chief Compliance Officer of the ING Funds (November 2004 - Present) and Executive Vice President of the ING Funds (March 2006 - Present). Formerly, Chief Compliance Officer of ING Investments, LLC(2) (March 2006 - July 2008); Investment Advisor Chief Compliance Officer, Directed Services LLC(6) (March 2006 - July 2008) ING Life Insurance and Annuity Company (March 2006 - December 2006); and Vice President, Chief Legal Counsel, Chief Compliance Officer and Secretary of Atlas Securities, Inc., Atlas Advisers, Inc. and Atlas Funds (October 2001 - October 2004). |
| | | |
Todd Modic 7337 East Doubletree Ranch Rd Scottsdale, Arizona 85258 Age: 41 | | Senior Vice President, Chief/Principle Financial Officer and Assistant Secretary | | March 2005 - Present | | Senior Vice President, ING Funds Services, LLC(3) (March 2005 - Present). Formerly, Vice President, ING Funds Services, LLC(3) (September 2002 - March 2005). |
| | | |
Kimberly A. Anderson 7337 East Doubletree Ranch Rd. Scottsdale, Arizona 85258 Age: 44 | | Senior Vice President | | December 2003 - Present | | Senior Vice President, ING Investments, LLC(2) (October 2003 - Present). |
| | | |
Robert Terris 7337 East Doubletree Ranch Rd. Scottsdale, Arizona 85258 Age: 38 | | Senior Vice President | | June 2006 - Present | | Senior Vice President, Head of Division Operations, ING Funds Services, LLC(3) (May 2006 - Present). Formerly, Vice President of Administration, ING Funds Services, LLC(3) (October 2001 - March 2006). |
| | | |
Ernest J. C’DeBaca 7337 East Doubletree Ranch Rd. Scottsdale, Arizona 85258 Age: 39 | | Senior Vice President | | June 2006 - Present | | Chief Compliance Officer, ING Investments, LLC(2) (July 2008 - Present); Investment Advisor Chief Compliance Officer, Directed Services LLC(6) (July 2008 - Present); Head of Retail Compliance, ING Funds Distributor, LLC(4) and ING Funds Services, LLC(3), (July 2008 - Present); and Senior Vice President, ING Investments, LLC(2) (December 2006 - Present), ING Funds Services, LLC(3) (April 2006 - Present), ING Funds Distributor, LLC(4) (July 2008 - Present), and Directed Services LLC(6) (July 2008 - Present). Formerly, Counsel, ING Americas, U.S. Legal Services (January 2004 - March 2006) and Attorney-Adviser, U.S. Securities and Exchange Commission (May 2001 - December 2003). |
| | | |
Robyn L. Ichilov 7337 East Doubletree Ranch Rd. Scottsdale, Arizona 85258 Age: 41 | | Vice President and Treasurer | | March 2002 - Present | | Vice President and Treasurer, ING Funds Services, LLC(3) (November 1995 - Present) and ING Investments, LLC(2) (August 1997 - Present). |
| | | |
Lauren D. Bensinger 7337 East Doubletree Ranch Rd. Scottsdale, Arizona 85258 Age: 54 | | Vice President | | March 2003 - Present | | Vice President and Chief Compliance Officer, ING Funds Distributor, LLC(4) (August 1995 - Present); Vice President, ING Investments, LLC(2) and ING Funds Services, LLC(3) (February 1996 - Present); and Director of Compliance, ING Investments, LLC(2) (October 2004 - Present). Formerly, Chief Compliance Officer, ING Investments, LLC(2) (October 2001 - October 2004). |
37
DIRECTOR AND OFFICER INFORMATION (UNAUDITED) (CONTINUED)
| | | | | | |
Name, Address and Age | | Position(s) Held
with the Companies | | Term of Office
and Length of
Time Served(1) | | Principal Occupation(s)
during the Past Five Years |
| | | |
William Evans 10 State House Square Hartford, Connecticut 06103 Age: 36 | | Vice President | | September 2007 - Present | | Vice President, Head of Mutual Fund Advisory Group (April 2007 - Present). Formerly, Vice President, U.S. Mutual Funds and Investment Products (May 2005 - April 2007) and Senior Fund Analyst, U.S. Mutual Funds and Investment Products (May 2002 - May 2005). |
| | | |
Maria M. Anderson 7337 East Doubletree Ranch Rd. Scottsdale, Arizona 85258 Age: 50 | | Vice President | | September 2004 - Present | | Vice President, ING Funds Services, LLC(3) (September 2004 - Present). Formerly, Assistant Vice President, ING Funds Services, LLC(3) (October 2001 - September 2004). |
| | | |
Denise Lewis 7337 East Doubletree Ranch Rd. Scottsdale, Arizona 85258 Age: 45 | | Vice President | | April 2007 - Present | | Vice President, ING Funds Services, LLC (December 2006 - Present). Formerly, Senior Vice President, UMB Investment Services Group, LLC (November 2003 - December 2006). |
| | | |
Kimberly K. Springer 7337 East Doubletree Ranch Rd. Scottsdale, Arizona 85258 Age: 51 | | Vice President | | March 2006 - Present | | Vice President, ING Funds Services, LLC(3) (March 2006 - Present). Formerly, Assistant Vice President, ING Funds Services, LLC(3) (August 2004 - March 2006) and Manager, Registration Statements, ING Funds Services, LLC(3) (May 2003 - August 2004). |
| | | |
Susan P. Kinens 7337 East Doubletree Ranch Rd. Scottsdale, Arizona 85258 Age: 32 | | Assistant Vice President | | March 2003 - Present | | Assistant Vice President, ING Funds Services, LLC(3) (December 2002 - Present). |
| | | |
Craig Wheeler 7337 East Doubletree Ranch Rd. Scottsdale, Arizona 85258 Age: 39 | | Assistant Vice President | | June 2008 - Present | | Assistant Vice President - Director of Tax, ING Funds Services (March 2008 - Present). Formerly, Tax Manager, ING Funds Services (March 2005 - March 2008); Tax Senior, ING Funds Services (January 2004 - March 2005); and Tax Senior, KPMG LLP (August 2002 - December 2003). |
| | | |
Theresa K. Kelety 7337 East Doubletree Ranch Rd. Scottsdale, Arizona 85258 Age: 45 | | Secretary | | September 2003 - Present | | Senior Counsel, ING Americas, U.S. Legal Services (April 2008 - Present). Formerly, Counsel, ING Americas, U.S. Legal Services (April 2003 - April 2008). |
| | | |
Huey P. Falgout, Jr. 7337 East Doubletree Ranch Rd. Scottsdale, Arizona 85258 Age: 45 | | Assistant Secretary | | September 2003 - Present | | Chief Counsel, ING Americas, U.S. Legal Services (September 2003 - Present). |
| | | |
Kathleen Nichols 7337 East Doubletree Ranch Rd. Scottsdale, Arizona 85258 Age: 33 | | Assistant Secretary | | June 2008 - Present | | Counsel, ING Americas, U.S. Legal Services (February 2008 - Present). Formerly, Associate, Ropes & Gray LLP (September 2005 - February 2008). |
(1) | | The officers hold office until the next annual meeting of the Directors/Trustees and until their successors shall have been elected and qualified. |
(2) | | ING Investments, LLC was previously named ING Pilgrim Investments, LLC. ING Pilgrim Investments, LLC is the successor in interest to ING Pilgrim Investments, Inc., which was previously known as Pilgrim Investments, Inc. and before that was known as Pilgrim America Investments, Inc. |
(3) | | ING Funds Services, LLC was previously named ING Pilgrim Group, LLC. ING Pilgrim Group, LLC is the successor in interest to ING Pilgrim Group, Inc., which was previously known as Pilgrim Group, Inc. and before that was known as Pilgrim America Group, Inc. |
(4) | | ING Funds Distributor, LLC is the successor in interest to ING Funds Distributor, Inc., which was previously known as ING Pilgrim Securities, Inc., and before that was known as Pilgrim Securities, Inc., and before that was known as Pilgrim America Securities, Inc. |
(5) | | Directed Services, LLC is the successor in interest to Directed Services, Inc. |
38
ADVISORY CONTRACT APPROVAL DISCUSSION (UNAUDITED)
BOARD CONSIDERATION AND APPROVAL OF INVESTMENT ADVISORY AND SUB-ADVISORY AGREEMENTS
The Investment Company Act of 1940, as amended (the “1940 Act”), provides, in substance, that each investment advisory agreement and sub-advisory agreement for a mutual fund will terminate automatically after the initial term of the agreement (which term may not exceed two years), unless continuation of the agreement is approved annually by the Board of Trustees or Directors, as the case may be (the “Board”) of the fund, including a majority of the Trustees/Directors who have no direct or indirect interest in the agreement and who are not “interested persons” of the fund (the “Independent Trustees”). Consistent with this requirement of the 1940 Act, the Board of ING VP Balanced Portfolio, Inc., ING Strategic Allocation Portfolios, Inc., ING VP Intermediate Bond Portfolio, ING VP Money Market Portfolio, ING Variable Funds, ING Variable Portfolios, Inc. and ING Series Fund, Inc., with respect to each portfolio series thereof (each, a “Fund” and, collectively, the “Funds”) has established a process for considering on an annual basis approval of the continuation of the Investment Management Agreement for each Fund (the “Advisory Agreement”) with ING Investments, LLC (the “Adviser”) and the sub-advisory agreement for each Fund (collectively, the “Sub-Advisory Agreements”) with each sub-adviser of the Funds (the “Sub-Advisers”). Set forth below is a description of the process followed by the Board in considering approval of the continuation of each Advisory and Sub-Advisory Agreement (collectively, the “Agreements”), together with an explanation of many of the factors considered and related conclusions reached by the Board in voting to approve the continuation of each Agreement for an additional one-year period commencing January 1, 2009, followed by specific considerations with respect to each portfolio series covered by this report (each, a “Portfolio”).
Overview of the Review Process
At a meeting of the Board held on December 11, 2008, the Board, including all of the Independent Trustees, voted to approve continuation of each of the existing Advisory and Sub-Advisory Agreements for the Funds. Prior to voting such approvals, the Board received the affirmative recommendation of the Contracts Committee of the Board, which is a Committee of the Board comprised of all of the Independent Trustees and exclusively of the Independent Trustees. The Contracts Committee recommended approval of the Advisory and Sub-Advisory Agreements after completing an
extensive review of information requested by the Committee from the Adviser and each Sub-Adviser, including the following: (1) comparative performance data for each Fund for various time periods; (2) comparative data regarding management fees, including data regarding the fees charged by the Adviser and Sub-Advisers for managing other mutual funds and institutional accounts using investment strategies and techniques similar to those used in managing the Funds; (3) comparative data regarding the total expenses of each Fund; (4) copies of each form of Advisory Agreement and Sub-Advisory Agreement; (5) copies of the codes of ethics of the Adviser and each Sub-Adviser, together with information relating to the manner in which each code is administered; (6) financial statements of the Adviser and each Sub-Adviser; (7) profitability analyses for the Adviser and each Sub-Adviser with respect to each Fund, and all Funds as a group; (8) descriptions of the qualifications of the investment personnel responsible for managing each Fund, the structure of their compensation and their responsibilities with respect to managing other accounts or mutual funds; (9) descriptions of the services provided to the Funds, including the investment strategies and techniques used by each Sub-Adviser in managing the Funds; (10) data relating to portfolio turnover and brokerage practices, including practices with respect to the acquisition of research through “soft dollar” benefits received in connection with the Funds’ brokerage; (11) data comparing the performance of certain Funds against “static portfolios” of the Funds over various time periods; (12) descriptions of the policies and procedures of the various service providers of the Funds for protecting the privacy of shareholder information; (13) information relating to projected sales and redemptions of Fund shares and business plans relating to the Adviser’s mutual fund platform; (14) descriptions of the business continuity and disaster recovery plans of the Adviser and each Sub-Adviser; (15) descriptions of various compliance programs of the Adviser and Sub-Advisers, including the Adviser’s programs for monitoring and enforcing compliance with the Funds’ policies with respect to market-timing, late trading and selective portfolio disclosure; (16) independent reports analyzing the quality of the trade execution services performed by Sub-Advisers for the Funds; and (17) other information relevant to an evaluation of the nature, extent and quality of the services provided by the Adviser and each Sub-Adviser in response to a series of detailed questions posed by independent legal counsel on behalf of the Independent Trustees.
39
ADVISORY CONTRACT APPROVAL DISCUSSION (UNAUDITED) (CONTINUED)
The Contracts Committee began the formal review process in July 2008 when it met separately with Goodwin Procter LLP, legal counsel for the Independent Trustees (“Independent Counsel”), to review the information to be requested from management and the methodology to be used in determining the selected peer groups for comparing performance and expenses. The Contracts Committee then held meetings on October 15-16, 2008 and December 9-10, 2008, during which the Independent Trustees, meeting separately with Independent Counsel, reviewed and evaluated the information described above. As part of the review process, the Contracts Committee also met with representatives from the Adviser and/or the Sub-Advisers to discuss the information provided to the Committee. The Contracts Committee also considered information that had been provided by the Adviser and Sub-Advisers throughout the year at other meetings of the Contracts Committee, the Audit Committee, the Compliance Committee and the full Board.
The Independent Trustees were assisted by Independent Counsel, throughout the contract review process. The Independent Trustees relied upon the advice of Independent Counsel and their own business judgment in determining the material factors to be considered in evaluating each Advisory and Sub-Advisory Agreement and the weight to be given to each such factor. The conclusions reached by the Independent Trustees were based on a comprehensive evaluation of all of the information provided and were not the result of any one factor. Moreover, each Independent Trustee may have afforded different weight to the various factors in reaching his or her conclusions with respect to each Advisory and Sub-Advisory Agreement.
Nature, Extent and Quality of Services
In considering whether to approve the Advisory and Sub-Advisory Agreements for the Funds for the year commencing January 1, 2009, the Board evaluated the nature, extent and quality of services provided to the Funds by the Adviser and Sub-Advisers. The Board considered the investment management and related services provided by the Adviser and Sub-Advisers, including the quantity and quality of the resources available to provide such services. Among other things, the Board considered the qualifications of the individuals responsible for performing various investment related services.
The Board also considered the quality of the compliance programs of the Adviser and each Sub-Adviser, including the manner in which the Adviser and each Sub-Adviser monitor for compliance with the investment policies and restrictions of a Fund and with the Codes of Ethics of the Funds, the Adviser and the Sub-Advisers with respect to personal trading by employees with access to portfolio information. The Board also considered the actions taken by the Adviser and Sub-Advisers to establish and maintain effective disaster recovery and business continuity plans.
The Board considered the actions taken by the Adviser and its affiliated companies to administer the Funds’ policies and procedures for voting proxies, valuing the Funds’ assets, selective disclosure of portfolio holdings and preventing late-trading and frequent trading of Fund shares. With respect to these and related compliance matters, the Board also considered the responsiveness of the Adviser and its affiliated companies over the course of the past several years to the inquiries of various regulatory authorities.
The Board also took into account the efforts of the Adviser and its affiliated companies to reduce the expenses of the Funds. With respect to those Funds that are sub-advised by an affiliate of the Adviser, the Board specifically noted that, in recent years, the Adviser and its affiliated companies have significantly reduced the Funds’ brokerage costs and portfolio turnover rates, as well as the quantity of research acquired through the use of soft dollars from the Funds’ brokerage. The Board also noted the efforts of the Adviser to optimize the number of Funds in the ING complex of mutual funds and to standardize the asset management characteristics and policies across the ING mutual fund platform. Consideration was also given to the benefits that shareholders of the Funds realize because the Funds are part of a larger ING family of mutual funds, including, in most cases, the ability of shareholders to exchange or transfer investments within the same class of shares among a wide variety of mutual funds without incurring additional sales charges.
The Board concluded that the nature, extent and quality of advisory and related services provided by the Adviser and each of the Sub-Advisers, taken as a whole, are consistent with the terms of the respective Advisory and Sub-Advisory Agreements and justify the fees paid by the Funds for such services.
Fund Performance
The Board reviewed each Fund’s investment performance over various time periods on an absolute
40
ADVISORY CONTRACT APPROVAL DISCUSSION (UNAUDITED) (CONTINUED)
basis and relative to the performance of (i) one or more appropriate benchmark indexes (such as the S&P 500 Composite Stock Price Index), (ii) a group of similarly managed mutual funds identified by Lipper, Inc. and/or Morningstar, Inc., and (iii) similarly managed mutual funds within a specified peer group based upon a methodology approved by the Contracts Committee (each, a “Selected Peer Group”). The Board reviewed comparative performance data for the one-, three-, five- and ten-year periods, where applicable, ending June 30, 2008 and the one-, three-, and five-year periods ending September 30, 2008. Summaries of selected portions of the performance information reviewed by the Board, together with the Board’s conclusions regarding the performance of each Portfolio covered by this report, are set forth below under “Fund-by-Fund Analysis.”
Management Fees, Sub-Advisory Fees and Expenses
Consideration was given to the contractual investment advisory fee rates, inclusive of administrative fee rates, payable by the Funds to the Adviser and its affiliated companies (referred to collectively as “management fees”) and the contractual sub-advisory fee rates payable by the Adviser to each Sub-Adviser for sub-advisory services. As part of its review, the Board considered each Fund’s management fee and total expense ratio, as compared to its Selected Peer Group, both before and after giving effect to any undertaking by the Adviser to waive fees and/or limit the total expenses of a Fund. In addition, the Trustees received information regarding the fees charged by each Sub-Adviser to similarly-managed institutional accounts and other mutual funds, if any, and the comparability (or lack thereof) of the services provided by the Sub-Adviser in managing such accounts and other mutual funds to the services provided in managing the Funds. With respect to the Funds sub-advised by an affiliate of the Adviser, the Board evaluated the reasonableness of the total fees received by the Adviser and its affiliate in the aggregate under the Advisory and Sub-Advisory Agreements. With respect to those Funds sub-advised by a Sub-Adviser that is not affiliated with the Adviser, the Board considered the reasonableness of the fees payable to the Sub-Adviser by the Adviser in light of the ability of the Adviser to negotiate such fees on an arm’s-length basis. Summaries of selected portions of the fee and expense information reviewed with respect to each Portfolio covered by this report are set forth below under “Fund-by-Fund Analysis.” After reviewing the
foregoing information, and in light of the nature, extent and quality of the services provided by the Adviser and each Sub-Adviser, the Board concluded with respect to each Fund that the management fee charged to the Fund for advisory, sub-advisory and related services is fair and reasonable and that the total expense ratio of the Fund is reasonable.
Profitability
The Board considered information relating to revenues, expenses, and profits realized by the Adviser and each Sub-Adviser attributable to performing advisory, sub-advisory and administrative services for the Funds. With respect to Funds sub-advised by an unaffiliated Sub-Adviser, the Board did not consider the profitability of the Sub-Adviser to be a material factor because the Board believes that the Adviser negotiates sub-advisory fees with the unaffiliated Sub-Adviser on an arm’s-length basis. The Board reviewed profitability data for the Adviser and its affiliated companies, including the distributor of the Funds, relating to (i) each Fund separately, (ii) all Funds as a group, (iii) all “retail” Funds as a group, and (iv) all variable insurance product Funds as a group, in each case for the one-year periods ended December 31, 2007 and December 31, 2006 and the nine-month period ended September 30, 2008. With respect to the Adviser and its affiliates, such information was prepared in accordance with a methodology approved by the Contracts Committee. The Board considered the profitability of the Adviser and its affiliated companies attributable to managing and operating each Fund both with and without the profitability of the distributor of the Funds and both before and after giving effect to any expenses incurred by the Adviser or any affiliated company in making revenue sharing or other payments to third parties, including affiliated insurance companies, for distribution and administrative services. With respect to Funds sub-advised by an affiliate of the Adviser, the Board considered the total profits derived by the Adviser and its affiliate in the aggregate attributable to managing and operating each Fund. The Board also considered other direct or indirect benefits that the Adviser and Sub-Advisers, and any affiliated companies thereof, derive from their relationships with the Funds, including the receipt by certain affiliates of the Adviser, of fees relating to the offering of bundled financial products, such as annuity contracts, and the receipt by Sub-Advisers of “soft dollar” benefits from the Funds’ brokerage. The Board concluded that, in light of the nature, extent and quality of the services provided, the profits realized by the Adviser and its affiliated
41
ADVISORY CONTRACT APPROVAL DISCUSSION (UNAUDITED) (CONTINUED)
companies, taken as a whole, with respect to providing advisory, sub-advisory and administrative services for each Fund are reasonable.
Economies of Scale
In considering the reasonableness of the management fee of each Fund, the Board considered the extent to which economies of scale can be expected to be realized by a Fund’s Adviser and its affiliated companies, on the one hand, and by the Fund, on the other hand, as the assets of the Fund increase. The Board noted that the advisory fee schedule for certain Funds includes breakpoints such that, as the assets of the Fund increase, the Fund’s management fee will decrease as a percentage of the Fund’s total assets. The Board recognized the inherent difficulties in measuring precisely the impact of any economies of scale being realized by the Adviser and its affiliated companies with respect to their management of any one or more Funds. In an effort to determine the extent to which economies of scale, if any, will be realized by the Adviser and its affiliated companies as the assets of the Funds grow, the Board considered the profitability data described above relating to the Adviser and its affiliated companies in light of changes in the assets of the Funds over various time periods. The Board noted that the total assets under management of many Funds have decreased during the past several years and concluded that the economies of scale realized by the Adviser and its affiliated companies from managing the Funds have not increased with respect to such Funds. The Board also reviewed information regarding the expense ratio of each Fund in light of changes in the assets of the Funds over various time periods, noting that, as the assets of a Fund increase, the fixed expenses of the Fund, as a percentage of the total assets of the Fund, can be expected to decrease. The Board considered such expense information in light of projections provided by the Adviser with respect to the future growth of assets of the Funds. Based upon the foregoing, the Board concluded that the economies of scale being realized by the Adviser and its affiliated companies do not mandate the implementation of breakpoints or additional breakpoints, as the case may be, with respect to any Fund at this time.
Fund-by-Fund Analysis
In deciding to approve the continuation of each Advisory and Sub-Advisory Agreement for an additional one-year period beginning January 1, 2009, the Board took into account the specific data and
factors identified below relating to the performance, fees and expenses of each Fund and actions being taken by the Adviser or Sub-Adviser, as the case may be, with respect to these matters. Except as otherwise indicated, the performance data described below for each Portfolio is for periods ended September 30, 2008 and the management fees and expense data described below are as of June 30, 2008.
ING VP Strategic Allocation Conservative Portfolio
In evaluating the investment performance of ING VP Strategic Allocation Conservative Portfolio the Board noted that: (1) the Portfolio outperformed its Morningstar category median for the most recent calendar quarter and five-year periods but underperformed for the year-to-date, one-year and three-year periods; (2) the Portfolio underperformed its benchmark index for all periods presented; and (3) the Portfolio is ranked in its Morningstar category in the second quintile for the most recent calendar quarter and five-year periods, in the third quintile for the one-year period and in the fourth quintile for the year-to-date and three-year periods. The Board noted that, effective April 7, 2008, the Portfolio was restructured (the “Conversion”) to operate as a risk-based fund-of-funds and that this new structure has enhanced the operating efficiency of the Portfolio. The Board further noted that, in connection with the Conversion, the Portfolio modified its exposures to certain asset categories, including real estate securities and international equities (through the new fund-of-funds structure). Lastly, the Board noted that in 2008, at the request of the Adviser and Sub-adviser, the Board authorized the Portfolio to invest in ING Tactical Asset Allocation Fund, which will allow the Portfolio to adjust its exposures among various asset categories more efficiently in response to changing market conditions. The Board concluded that appropriate actions are being taken to improve the performance of the Portfolio and that additional time is needed to evaluate the effectiveness of these actions.
In assessing the reasonableness of the management fee and expense ratio for ING VP Strategic Allocation Conservative Portfolio, the Board noted that the management fee for the Portfolio is below the median and average management fees of the funds in its Selected Peer Group, and that the expense ratio for the Portfolio is below the median and average expense ratios of the funds in its Selected Peer Group.
42
ADVISORY CONTRACT APPROVAL DISCUSSION (UNAUDITED) (CONTINUED)
ING VP Strategic Allocation Moderate Portfolio
In evaluating the investment performance of ING VP Strategic Allocation Moderate Portfolio, the Board noted that: (1) the Portfolio outperformed its Morningstar category median for the most recent calendar quarter but underperformed for the year-to-date, one-year, three-year and five-year periods; (2) the Portfolio underperformed its benchmark index for all periods presented; and (3) the Portfolio is ranked in its Morningstar category in the second quintile for the most recent calendar quarter, in the third quintile for the year-to-date, one-year and five-year periods and in the fourth quintile for the three-year period. The Board noted that, effective April 7, 2008, the Portfolio was restructured (the “Conversion”) to operate as a risk-based fund-of-funds and that this new structure has enhanced the operating efficiency of the Portfolio. The Board further noted that, in connection with the Conversion, the Portfolio modified its exposures to certain asset categories, including real estate securities and international equities (through the new fund-of-funds structure). Lastly, the Board noted that in 2008, at the request of the Adviser and Sub-adviser, the Board authorized the Portfolio to invest in ING Tactical Asset Allocation Fund, which will allow the Portfolio to adjust its exposures among various asset categories more efficiently in response to changing market conditions. The Board concluded that appropriate actions are being taken to improve the performance of the Portfolio and that additional time is needed to evaluate the effectiveness of these actions.
In assessing the reasonableness of the management fee and expense ratio for ING VP Strategic Allocation Moderate Portfolio, the Board noted that the management fee for the Portfolio is below the median and average management fees of the funds in its Selected Peer Group, and that the expense ratio for the Portfolio is below the median and average expense ratios of the funds in its Selected Peer Group.
ING VP Strategic Allocation Growth Portfolio
In evaluating the investment performance of ING VP Strategic Allocation Growth Portfolio, the Board noted that: (1) the Portfolio outperformed its Morningstar category median for the most recent calendar quarter, year-to-date and one-year periods but underperformed for the three-year and five-year periods; (2) the Portfolio underperformed its benchmark index for all periods presented; and (3) the Portfolio is ranked in its Morningstar category in the second quintile for the one-year period, in the third quintile for the most recent calendar quarter, year-to-date and five-year periods and in the fourth quintile for the three-year period. The Board noted that, effective April 7, 2008, the Portfolio was restructured (the “Conversion”) to operate as a risk-based fund-of-funds and that this new structure has enhanced the operating efficiency of the Portfolio. The Board further noted that, in connection with the Conversion, the Portfolio modified its exposures to certain asset categories, including real estate securities and international equities (through the new fund-of-funds structure). Lastly, the Board noted that in 2008, at the request of the Adviser and Sub-adviser, the Board authorized the Portfolio to invest in ING Tactical Asset Allocation Fund, which will allow the Portfolio to adjust its exposures among various asset categories more efficiently in response to changing market conditions. The Board concluded that appropriate actions are being taken to improve the performance of the Portfolio and that additional time is needed to evaluate the effectiveness of these actions.
In assessing the reasonableness of the management fee and expense ratio for ING VP Strategic Allocation Growth Portfolio, the Board noted that the management fee for the Portfolio is below the median and average management fees of the funds in its Selected Peer Group, and that the expense ratio for the Portfolio is equal to the median and below the average expense ratios of the funds in its Selected Peer Group.
43
Investment Adviser
ING Investments, LLC
7337 East Doubletree Ranch Road
Scottsdale, Arizona 85258
Administrator
ING Funds Services, LLC
7337 East Doubletree Ranch Road
Scottsdale, Arizona 85258
Distributor
ING Funds Distributor, LLC
7337 East Doubletree Ranch Road
Scottsdale, Arizona 85258
Transfer Agent
DST Systems, Inc.
P.O. Box 419368
Kansas City, Missouri 64141
Independent Registered Public Accounting Firm
KPMG LLP
99 High Street
Boston, Massachusetts 02110
Custodian
The Bank of New York Mellon
One Wall Street
New York, New York 10286
Legal Counsel
Goodwin Procter LLP
Exchange Place
53 State Street
Boston, Massachusetts 02109
Before investing, carefully consider the investment objectives, risks, charges and expenses of the variable universal life insurance policy or variable annuity contract and the underlying variable investment options. This and other information is contained in the prospectus for the variable universal life policy or variable annuity contract and the underlying variable investment options. Obtain these prospectuses from your agent/registered representative and read them carefully before investing.
| | | | |
 | | VPAR-SAIS | | (1208-022709) |
As of the end of the period covered by this report, Registrant had adopted a code of ethics, as defined in Item 2 of Form N-CSR, that applies to the Registrant’s principal executive officer and principal financial officer. There were no amendments to the Code during the period covered by the report. The Registrant did not grant any waivers, including implicit waivers, from any provisions of the Code during the period covered by this report. The code of ethics is filed herewith pursuant to Item 10(a)(1), Exhibit 99.CODE ETH.
| Item 3. | Audit Committee Financial Expert. |
The Board of Trustees has determined that Corine Norgaard and Joseph Obermeyer are each audit committee financial experts, as defined in Item 3 of Form N-CSR. Ms. Norgaard and Mr. Obermeyer are both “independent” for purposes of Item 3 of Form N-CSR.
| Item 4. | Principal Accountant Fees and Services. |
| (a) | Audit Fees: The aggregate fees billed for each of the last two fiscal years for professional services rendered by KPMG LLP (“KPMG”), the principal accountant for the audit of the registrant’s annual financial statements, for services that are normally provided by the accountant in connection with statutory and regulatory filings or engagements for those fiscal years were $54,000 for year ended December 31, 2008 and $13,044 for year ended December 31, 2007. |
| (b) | Audit-Related Fees: The aggregate fees billed in each of the last two fiscal years for assurance and related services by KPMG that are reasonably related to the performance of the audit of the registrant’s financial statements and are not reported under paragraph (a) of this Item were $6,450 for year ended December 31, 2008 and $1,531 for year ended December 31, 2007. |
| (c) | Tax Fees: The aggregate fees billed in each of the last two fiscal years for professional services rendered by KPMG for tax compliance, tax advice, and tax planning were $11,136 in the year ended December 31, 2008 and $9,195 in the year ended December 31, 2007. Such services included review of excise distribution calculations (if applicable), preparation of the Funds’ federal, state and excise tax returns, tax services related to mergers and routine consulting. |
| (d) | All Other Fees: The aggregate fees billed in each of the last two fiscal years for products and services provided by KPMG, other than the services reported in paragraphs (a) through (c) of this Item were $17,500 in the year ended December 31, 2008 and $0 in the year ended December 31, 2007. |
| (e)(1) | Audit Committee Pre-Approval Policies and Procedures |
1
AUDIT AND NON-AUDIT SERVICES
PRE-APPROVAL POLICY
| I. | Statement of Principles |
Under the Sarbanes-Oxley Act of 2002 (the “Act”), the Audit Committee of the Board of Directors or Trustees (the “Committee”) of the ING Funds (each a “Fund,” collectively, the “Funds”) set out under Paragraph I on Exhibit A to this Audit and Non-Audit Services Pre-Approval Policy (“Policy”) is responsible for the oversight of the work of the Funds’ independent auditors. As part of its responsibilities, the Committee must pre-approve the audit and non-audit services performed by the auditors in order to assure that the provision of these services does not impair the auditors’ independence from the Funds. The Committee has adopted, and the Board has ratified, this Policy, which sets out the procedures and conditions under which the services of the independent auditors may be pre-approved.
Under Securities and Exchange Commission (“SEC”) rules promulgated in accordance with the Act, the Funds’ may establish two different approaches to pre-approving audit and non-audit services. The Committee may approve services without consideration of specific case-by-case services (“general pre-approval”) or it may pre-approve specific services (“specific pre-approval”). The Committee believes that the combination of these approaches contemplated in this Policy results in an effective and efficient method for pre-approving audit and non-audit services to be performed by the Funds’ independent auditors. Under this Policy, services that are not of a type that may receive general pre-approval require specific pre-approval by the Committee. Any proposed services that exceed pre-approved cost levels or budgeted amounts will also require the Committee’s specific pre-approval.
For both types of approval, the Committee considers whether the subject services are consistent with the SEC’s rules on auditor independence and that such services are compatible with maintaining the auditors’ independence. The Committee also considers whether a particular audit firm is in the best position to provide effective and efficient services to the Funds. Reasons that the auditors are in the best position include the auditors’ familiarity with the Funds’ business, personnel, culture, accounting systems, risk profile, and other factors, and whether the services will enhance the Funds’ ability to manage and control risk or improve audit quality. Such factors will be considered as a whole, with no one factor being determinative.
The appendices attached to this Policy describe the audit, audit-related, tax-related, and other services that have the Committee’s general pre-approval. For any service that has been approved through general pre-approval, the general pre-approval will remain in place for a period 12 months from the date of pre-approval, unless the Committee determines that a different period is appropriate. The Committee will annually review and pre-approve the services that may be provided by the independent auditors without specific pre-approval. The Committee will revise the list of services subject to general pre-approval as appropriate. This Policy does not serve as a delegation to Fund management of the Committee’s duty to pre-approve services performed by the Funds’ independent auditors.
2
The annual audit services engagement terms and fees are subject to the Committee’s specific pre-approval. Audit services are those services that are normally provided by auditors in connection with statutory and regulatory filings or engagements or those that generally only independent auditors can reasonably provide. They include the Funds’ annual financial statement audit and procedures that the independent auditors must perform in order to form an opinion on the Funds’ financial statements (e.g., information systems and procedural reviews and testing). The Committee will monitor the audit services engagement and approve any changes in terms, conditions or fees deemed by the Committee to be necessary or appropriate.
The Committee may grant general pre-approval to other audit services, such as statutory audits and services associated with SEC registration statements, periodic reports and other documents filed with the SEC or issued in connection with securities offerings.
The Committee has pre-approved the audit services listed on Appendix A. The Committee must specifically approve all audit services not listed on Appendix A.
| III. | Audit-related Services |
Audit-related services are assurance and related services that are reasonably related to the performance of the audit or the review of the Funds’ financial statements or are traditionally performed by the independent auditors. The Committee believes that the provision of audit-related services will not impair the independent auditors’ independence, and therefore may grant pre-approval to audit-related services. Audit-related services include accounting consultations related to accounting, financial reporting or disclosure matters not classified as “audit services;” assistance with understanding and implementing new accounting and financial reporting guidance from rulemaking authorities; agreed-upon or expanded audit procedures relating to accounting and/or billing records required to respond to or comply with financial, accounting or regulatory reporting matters; and assistance with internal control reporting requirements under Form N-SAR or Form N-CSR.
The Committee has pre-approved the audit-related services listed on Appendix B. The Committee must specifically approve all audit-related services not listed on Appendix B.
The Committee believes the independent auditors can provide tax services to the Funds, including tax compliance, tax planning, and tax advice, without compromising the auditors’ independence. Therefore, the Committee may grant general pre-approval with respect to tax services historically provided by the Funds’ independent auditors that do not, in the Committee’s view, impair auditor independence and that are consistent with the SEC’s rules on auditor independence.
The Committee will not grant pre-approval if the independent auditors initially recommends a transaction the sole business purpose of which is tax avoidance and the tax treatment of which may
3
not be supported in the Internal Revenue Code and related regulations. The Committee may consult outside counsel to determine that tax planning and reporting positions are consistent with this Policy.
The Committee has pre-approved the tax-related services listed on Appendix C. The Committee must specifically approve all tax-related services not listed on Appendix C.
The Committee believes it may grant approval of non-audit services that are permissible services for independent auditors to a Fund. The Committee has determined to grant general pre-approval to other services that it believes are routine and recurring, do not impair auditor independence, and are consistent with SEC rules on auditor independence.
The Committee has pre-approved the non-audit services listed on Appendix D. The Committee must specifically approve all non-audit services not listed on Appendix D.
A list of the SEC’s prohibited non-audit services is attached to this Policy as Appendix E. The SEC’s rules and relevant guidance should be consulted to determine the precise definitions of these impermissible services and the applicability of exceptions to certain of the SEC’s prohibitions.
| VI. | Pre-approval of Fee levels and Budgeted Amounts |
The Committee will annually establish pre-approval fee levels or budgeted amounts for audit, audit-related, tax and non-audit services to be provided to the Funds by the independent auditors. Any proposed services exceeding these levels or amounts require the Committee’s specific pre-approval. The Committee considers fees for audit and non-audit services when deciding whether to pre-approve services. The Committee may determine, for a pre-approval period of 12 months, the appropriate ratio between the total amount of fees for the Fund’s audit, audit-related, and tax services (including fees for services provided to Fund affiliates that are subject to pre-approval), and the total amount of fees for certain permissible non-audit services for the Fund classified as other services (including any such services provided to Fund affiliates that are subject to pre-approval).
Requests or applications for services to be provided by the independent auditors will be submitted to management. If management determines that the services do not fall within those services generally pre-approved by the Committee and set out in the appendices to these procedures, management will submit the services to the Committee or its delagee. Any such submission will include a detailed description of the services to be rendered.
Notwithstanding this paragraph, the Committee will, on quarterly basis, receive from the independent auditors a list of services provided to date by the auditors during Pre-Approval Period.
4
The Committee may delegate pre-approval authority to one or more of the Committee’s members. Any member or members to whom such pre-approval authority is delegated must report any pre-approval decisions, including any pre-approved services, to the Committee at its next scheduled meeting. The Committee will identify any member to whom pre-approval authority is delegated in writing. The member will retain such authority for a period of 12 months from the date of pre-approval unless the Committee determines that a different period is appropriate. The period of delegated authority may be terminated by the Committee or at the option of the member.
| IX. | Additional Requirements |
The Committee will take any measures the Committee deems necessary or appropriate to oversee the work of the independent auditors and to assure the auditors’ independence from the Funds. This may include reviewing a formal written statement from the independent auditors delineating all relationships between the auditors and the Funds, consistent with Independence Standards Board No. 1, and discussing with the auditors their methods and procedures for ensuring independence.
Date last approved: December 18, 2007
5
Appendix A
Pre-Approved Audit Services for the Pre-Approval Period January 1, 2008 through December 31, 2008
| | | | |
Service | | | | |
| | |
| | | The
Fund(s) | | Fee Range |
| Statutory audits or financial audits (including tax services associated with audit services) | | ü | | As presented to Audit Committee1 |
| | |
| Services associated with SEC registration statements, periodic reports and other documents filed with the SEC or other documents issued in connection with securities offerings (e.g., consents), and assistance in responding to SEC comment letters. | | ü | | Not to exceed $9,750 per filing |
| | |
| Consultations by Fund management with respect to accounting or disclosure treatment of transactions or events and/or the actual or potential effect of final or proposed rules, standards or interpretations by the SEC, Financial Accounting Standards Board, or other regulatory or standard setting bodies. | | ü | | Not to exceed $8,000 during the Pre-Approval Period |
1 | For new Funds launched during the Pre-Approval Period, the fee ranges pre-approved will be the same as those for existing Funds, pro-rated in accordance with inception dates as provided in KPMG’s Proposal or any Engagement Letter covering the period at issue. Fees in the Engagement Letter will be controlling. |
6
Appendix
B Pre-Approved Audit-Related Services for the Pre-Approval Period January 1, 2008 through December 31, 2008
| | | | | | |
Service | | | | | | |
| | | |
| | | The
Fund(s) | | Fund Affiliates | | Fee Range |
| Services related to Fund mergers (Excluding tax services – See Appendix C for tax services associated with fund mergers) | | ü | | ü | | Not to exceed $10,000 per merger |
| | | |
| Consultations by Fund management with respect to accounting or disclosure treatment of transactions or events and/or the actual or potential effect of final or proposed rules, standards or interpretations by the SEC, Financial Accounting Standards Board, or other regulatory or standard setting bodies. [Note: Under SEC rules some consultations may be “audit” services and others may be “audit-related” services.] | | ü | | | | Not to exceed $5,000 per occurrence during the Pre-Approval Period |
| | | |
| Review of the Funds’ semi-annual financial statements | | ü | | | | Not to exceed $2,200 per set of financial statements per fund |
| | | |
| Reports to regulatory or government agencies related to the annual engagement | | ü | | | | Up to $5,000 per occurrence during the Pre- Approval Period |
| | | |
| Regulatory compliance assistance | | ü | | ü | | Not to exceed $5,000 per quarter |
| | | |
| Training courses | | | | ü | | Not to exceed $2,000 per course |
7
Appendix C
Pre-Approved Tax Services for the Pre-Approval Period January 1, 2008 through December 31, 2008
| | | | | | |
Service | | | | | | |
| | | |
| | | The
Fund(s) | | Fund Affiliates | | Fee Range |
| Preparation of federal and state income tax returns and federal excise tax returns for the Funds including assistance and review with excise tax distributions. | | ü | | | | As presented to Audit Committee2 |
| | | |
| Review of IRC Sections 851(b) and 817(h) diversification testing on a real-time basis | | ü | | | | As presented to Audit Committee2 |
| | | |
| Assistance and advice regarding year-end reporting for 1099’s | | ü | | | | As presented to Audit Committee2 |
| | | |
| Tax assistance and advice regarding statutory, regulatory or administrative developments | | ü | | ü | | Not to exceed $5,000 in aggregate for the Funds or for the Funds’ investment adviser during the Pre-Approval Period |
| | | |
| Tax training courses | | | | ü | | Not to exceed $2,000 per course during the Pre-Approval Period |
2 | For new Funds launched during the Pre-Approval Period, the fee ranges pre-approved will be the same as those for existing Funds, as provided in KPMG’s Proposal or any Engagement Letter covering the period at issue. Fees in the Engagement Letter will be controlling. |
8
Appendix C, continued
| | | | | | |
| Service |
| | | |
| | | The Fund(s) | | Fund Affiliates | | Fee Range |
| Tax services associated with Fund mergers | | ü | | ü | | Not to exceed $4,000 per fund per merger during the Pre-Approval Period |
| | | |
| Other tax-related assistance and consultation, including, without limitation, assistance in evaluating derivative financial instruments and international tax issues, qualification and distribution issues, and similar routine tax consultations | | ü | | | | Not to exceed $50,000 during the Pre-Approval Period |
9
Appendix
D Pre-Approved Other Services for the Pre-Approval Period January 1, 2008 through December 31, 2008
| | | | | | |
| Service |
| | | |
| | | The
Fund(s) | | Fund Affiliates | | Fee Range |
| Agreed-upon procedures for Class B share 12b-1 programs | | | | ü | | Not to exceed $50,000 during the Pre-Approval Period |
| | | |
Security counts performed pursuant to Rule 17f-2 of the 1940 Act (i.e., counts for Funds holding securities with affiliated sub-custodians) (Cost to be split 50% the funds and 50% ING Investments, LLC) | | ü | | ü | | Not to exceed $5,000 per Fund during the Pre-Approval Period |
10
Appendix
E Prohibited Non-Audit Services
Dated: 2008
| | • | | Bookkeeping or other services related to the accounting records or financial statements of the Funds |
| | • | | Financial information systems design and implementation |
| | • | | Appraisal or valuation services, fairness opinions, or contribution-in-kind reports |
| | • | | Internal audit outsourcing services |
| | • | | Broker-dealer, investment adviser, or investment banking services |
| | • | | Expert services unrelated to the audit |
| | • | | Any other service that the Public Company Accounting Oversight Board determines, by regulation, is impermissible |
11
EXHIBIT A
ING VP BALANCED PORTFOLIO, INC.
ING STRATEGIC ALLOCATION PORTFOLIOS, INC.
ING GET FUND
ING VP INTERMEDIATE BOND PORTFOLIO
ING VP MONEY MARKET PORTFOLIO
ING VARIABLE FUNDS
ING VARIABLE PORTFOLIOS, INC.
ING SERIES FUND, INC.
12
| (e)(2) | Percentage of services referred to in 4(b) — (4)(d) that were approved by the audit committee |
100% of the services were approved by the audit committee.
| (f) | Percentage of hours expended attributable to work performed by other than full time employees of KPMG if greater than 50%. |
Not applicable.
| (g) | Non-Audit Fees: The non-audit fees billed by the registrant’s accountant for services rendered to the registrant, and rendered to the registrant’s investment adviser, and any entity controlling, controlled by, or under common control with the adviser that provides ongoing services to the registrant for each of the last two fiscal years of the registrant were $1,826,535 for year ended December 31, 2008 and $224,295 for year ended December 31, 2007. |
| (h) | Principal Accountants Independence: The Registrant’s Audit committee has considered whether the provision of non-audit services that were rendered to the registrant’s investment adviser and any entity controlling, controlled by, or under common control with the investment adviser that provides ongoing services to the registrant that were not pre-approved pursuant to Rule 2-01(c)(7)(ii) of Regulation S-X is compatible with maintaining KPMG’s independence. |
| Item 5. | Audit Committee of Listed Registrants. |
Not applicable.
| Item 6. | Schedule of Investments |
Schedule is included as part of the report to shareholders filed under Item 1 of this Form.
| Item 7. | Disclosure of Proxy Voting Policies and Procedures for Closed-End Management Investment Companies. |
Not applicable.
| Item 8. | Portfolio Managers of Closed-End Management Investment Companies. |
Not applicable.
| Item 9. | Purchases of Equity Securities by Closed-End Management Investment Company and Affiliated Purchasers |
Not applicable.
| Item 10. | Submission of Matters to a Vote of Security Holders. |
The Nominating Committee operates pursuant to a Charter approved by the Board. The primary purpose of the Nominating Committee is to consider, evaluate and make recommendations to the Board with respect to the nomination and selection of Independent Trustees. In evaluating candidates, the Nominating Committee may consider a variety of factors, but specific qualifications of candidates for Board membership will be based on the needs of the Board at the time of nomination.
The Nominating Committee is willing to consider nominations received from shareholders and shall assess shareholder nominees in the same manner as it reviews nominees it identifies. A shareholder nominee for director should be submitted in writing to the Fund’s Secretary. Any such shareholder nomination should include sufficient background information concerning the candidate and should be received in a timely
13
manner. At a minimum, the following information as to each individual proposed for nomination as director should be included: the individual’s written consent to be named in the proxy statement as a nominee (if nominated) and to serve as a director (if elected), and all information relating to such individual that is required to be disclosed in a solicitation of proxies for election of directors, or is otherwise required, in each case under applicable federal securities laws, rules and regulations.
The Secretary shall submit all nominations received in a timely manner to the Nominating Committee. To be timely, any such submission must be delivered to the Fund’s Secretary not earlier than the 90th day prior to such meeting and not later than the close of business on the later of the 60th day prior to such meeting or the 10th day following the day on which public announcement of the date of the meeting is first made, by either disclosure in a press release or in a document publicly filed by the Fund with the SEC.
In evaluating a candidate for the position of Independent Trustee, including any candidate recommended by shareholders of the Fund, the Nominating Committee shall consider the following: (i) the candidate’s knowledge in matters relating to the mutual fund industry; (ii) any experience possessed by the candidate as a director or senior officer of other public companies; (iii) the candidate’s educational background, reputation for high ethical standards and professional integrity; (iv) any specific financial, technical or other expertise possessed by the candidate, and the extent to which such expertise would complement the Board’s existing mix of skills, core competencies and qualifications; (v) the candidate’s perceived ability to contribute to the ongoing functions of the Board, including the candidate’s ability and commitment to attend meetings regularly and work collaboratively with other members of the Board; (vi) the candidate’s ability to qualify as an Independent Trustee for purposes of the 1940 Act; and (vii) such other factors as the Committee determines to be relevant in light of the existing composition of the Board and any anticipated vacancies. Prior to making a final recommendation to the Board, the Committee shall conduct personal interviews with those candidates it concludes are the most qualified candidates.
14
| Item 11. | Controls and Procedures. |
| (a) | Based on our evaluation conducted within 90 days of the filing date, hereof, the design and operation of the registrant’s disclosure controls and procedures are effective to ensure that material information relating to the registrant is made known to the certifying officers by others within the appropriate entities, particularly during the period in which Forms N-CSR are being prepared, and the registrant’s disclosure controls and procedures allow timely preparation and review of the information for the registrant’s Form N-CSR and the officer certifications of such Form N-CSR. |
| (b) | There were no significant changes in the registrant’s internal controls that occurred during the second fiscal quarter of the period covered by this report that has materially affected, or is reasonably likely to materially affect, the registrant’s internal control over financial reporting. |
| | |
| |
| (a)(1) | | Code of Ethics pursuant to Item 2 of Form N-CSR is filed and attached hereto as EX-99.CODE ETH. |
| |
| (a)(2) | | A separate certification for each principal executive officer and principal financial officer of the registrant as required by Rule 30a-2 under the Act (17 CFR 270.30a-2) is attached hereto as EX-99.CERT. |
| |
| (b) | | The officer certifications required by Section 906 of the Sarbanes-Oxley Act of 2002 are attached hereto as EX-99.906CERT |
| |
| (3) | | Not applicable. |
15
SIGNATURES
Pursuant to the requirements of the Securities Exchange Act of 1934 and the Investment Company Act of 1940, the registrant has duly caused this report to be signed on its behalf by the undersigned, thereunto duly authorized.
(Registrant): ING Strategic Allocation Portfolios, Inc.
| | |
| |
| By | | /s/ Shaun P. Mathews |
| | Shaun P. Mathews |
| | President and Chief Executive Officer |
| |
| Date: | | March 6, 2009 |
Pursuant to the requirements of the Securities Exchange Act of 1934 and the Investment Company Act of 1940, this report has been signed below by the following persons on behalf of the registrant and in the capacities and on the dates indicated.
| | |
| |
| By | | /s/ Shaun P. Mathews |
| | Shaun P. Mathews |
| | President and Chief Executive Officer |
| |
| Date: | | March 6, 2009 |
| |
| By | | /s/ Todd Modic |
| | Todd Modic |
| | Senior Vice President and Chief Financial Officer |
| |
| Date: | | March 6, 2009 |
15