| | |
OMB APPROVAL |
OMB Number: | | 3235-0570 |
Expires: | | August 31, 2011 |
Estimated average burden |
hours per response: | | 18.9 |
UNITED STATES
SECURITIES AND EXCHANGE COMMISSION
Washington, D.C. 20549
FORM N-CSR
CERTIFIED SHAREHOLDER REPORT OF
REGISTERED MANAGEMENT INVESTMENT COMPANIES
Investment Company Act file number: 811-8934
ING Strategic Allocation Portfolios, Inc.
(Exact name of registrant as specified in charter)
| | |
| 7337 E. Doubletree Ranch Rd., Scottsdale, AZ | | 85258 |
| (Address of principal executive offices) | | (Zip code) |
The Corporation Trust Incorporated, 300 E. Lombard Street, Baltimore, MD 21201
(Name and address of agent for service)
Registrant’s telephone number, including area code: 1-800-992-0180
Date of fiscal year end: December 31
Date of reporting period: January 1, 2010 to December 31, 2010
| Item 1. | Reports to Stockholders. |
The following is a copy of the report transmitted to stockholders pursuant to Rule 30e-1 under the Act (17 CFR 270.30e-1):

Annual Report
December 31, 2010
Classes I and S
Strategic Allocation Funds-of-Funds
| n | ING Strategic Allocation Conservative Portfolio |
| n | ING Strategic Allocation Growth Portfolio |
| n | ING Strategic Allocation Moderate Portfolio |
This report is submitted for general information to shareholders of the ING Funds. It is not authorized for distribution to prospective shareholders unless accompanied or preceded by a prospectus which includes details regarding the funds’ investment objectives, risks, charges, expenses and other information. This information should be read carefully.
MUTUAL FUNDS 
| |
TABLE OF CONTENTS
PROXY VOTING INFORMATION
A description of the policies and procedures that the Portfolios use to determine how to vote proxies related to portfolio securities is available: (1) without charge, upon request, by calling Shareholder Services toll-free at (800) 992-0180; (2) on the ING Funds’ website at www.ingfunds.com; and (3) on the U.S. Securities and Exchange Commission’s (“SEC”) website at www.sec.gov. Information regarding how the Portfolios voted proxies related to portfolio securities during the most recent 12-month period ended June 30 is available without charge on the ING Funds’ website at www.ingfunds.com and on the SEC’s website at www.sec.gov.
QUARTERLY PORTFOLIO HOLDINGS
The Portfolios file their complete schedule of portfolio holdings with the SEC for the first and third quarters of each fiscal year on Form N-Q. The Portfolios’ Forms N-Q are available on the SEC’s website at www.sec.gov. The Portfolios’ Forms N-Q may be reviewed and copied at the SEC’s Public Reference Room in Washington, DC, and information on the operation of the Public Reference Room may be obtained by calling (800) SEC-0330; and is available upon request from the Portfolios by calling Shareholder Services toll-free at (800) 992-0180.
PRESIDENT’S LETTER

Big Picture vs. Details
Dear Shareholder,
On January 25, 2011, President Obama delivered his second State of the Union address. He called on Americans to put aside partisan differences and harness the nation’s creativity to adapt and thrive in a rapidly changing global economy. The president’s challenge is timely: the United States is approaching a nexus of intermediate- and long-term concerns, and the choices we make over the next two years could determine the nation’s competitiveness in the global economy for decades to come.
There are reasons to be optimistic — the International Monetary Fund (“IMF”) predicts the U.S. economy will grow about 3% in 2011. China and India are expected to grow at about 9% and even the euro zone appears to be recovering from crisis; this growth, however, is being accompanied by mounting inflation pressures in certain regions,
suggesting that many economies are expanding at unsustainable rates.
As I write this, the World Economic Forum is getting underway in Davos, Switzerland, and there are numerous concerns to deal with. Chief among them are the still-present risk of sovereign debt defaults in the euro zone; high unemployment and banking problems in the advanced economies; and inflationary pressures in emerging markets, especially with regard to food, fuel and commodities.
As we’ve noted before, uncertainty is a defining characteristic of our age and, in our opinion, is likely to remain so beyond this year. How should you respond within your investment portfolio? Remember that the most important consideration is your long-term goals, not the outlook for 2011. With investment hazards and opportunities everywhere, we believe it makes sense to cast as broad a net as possible around the globe. In our opinion, you want your portfolio to be well diversified so that it is not harmed too much by the trouble spots, and has some exposure to positive trends.
As always, we believe the best approach is a well-diversified portfolio and a well-defined investment plan. As we’ve noted many times before, it’s important to discuss any proposed changes thoroughly with your advisor before taking any action. Thank you for your continued confidence in ING Funds. We look forward to serving your investment needs in the future.
Sincerely,

Shaun Mathews
President & Chief Executive Officer
ING Funds
January 26, 2011
The views expressed in the President’s Letter reflect those of the President as of the date of the letter. Any such views are subject to change at any time based upon market or other conditions and ING Funds disclaim any responsibility to update such views. These views may not be relied on as investment advice and because investment decisions for an ING Fund are based on numerous factors, may not be relied on as an indication of investment intent on behalf of any ING Fund. Reference to specific company securities should not be construed as recommendations or investment advice. Consider the fund’s investment objectives, risks, and charges and expenses carefully before investing. The prospectus contains this information and other information about the fund.
International investing poses special risks including currency fluctuation, economic and political risks not found in investments that are solely domestic.
1
MARKET PERSPECTIVE: YEAR ENDED DECEMBER 31, 2010
In our semi-annual report we described how, after a 13-month advance through mid-April, a confluence of local and world issues sent global equities, in the form of the MSCI World IndexSM measured in local currencies, including net reinvested dividends (“MSCI” for regions discussed below), reeling to a loss for the first half of the fiscal year. In the second half of the year, the MSCI World IndexSM bounced back and for 2010 returned 10.01%. (The MSCI World IndexSM returned 11.76% for the one year ended December 31, 2010, measured in U.S. dollars.) By year end, investor sentiment had turned distinctly positive, despite the grave concerns that remained.
It was a bumpy ride. Markets from stocks to bonds to currencies were continually buffeted by news and events relating to three main themes: the stuttering U.S. economic recovery, the sovereign debt crisis in the Eurozone and growth dynamics in China.
In the U.S., quarterly gross domestic product (“GDP”) growth decelerated from 2.7% (annualized) in the first quarter of 2010 to 1.7% in the second, before recovering to 2.6% in the third. But attention was focused more on employment and housing. The 18-month recession which ended in June of 2009 had cost some 8.7 million jobs. But since then, the unemployment rate had been stuck between 9.4% and 10.1%, barely dented by private sector new jobs averaging 107,000 per month as 2010 ended.
The other weakening link was housing. Sales of new and existing homes collapsed after the expiry in April of a program of tax credits for home buyers and languished thereafter. House prices (based on the S&P/Case-Shiller 20-City Composite Home Price Index), having shown annual increases from February, resumed a downward trend in October with the index still 30% below the peak recorded in April 2006.
To be sure, there were some grounds for optimism as 2010 drew to a close. Consumer spending had risen for five straight months. Investment in equipment and software was growing at double-digit annual percentage rates. On December 30, new unemployment claims were reported below 400,000 for the first time since July 2008. The Federal Reserve in November announced a second round of quantitative easing and would buy $600 billion in Treasury notes and bonds. The mixed mid-term election results forced a “compromise” stimulus package worth an estimated $858 billion for 2011. In combination, these two measures increased the attractiveness of riskier asset classes like equities at the expense of high grade bonds, which sold off.
In the Eurozone, after default was narrowly averted on Greece’s maturing bonds, the creation in May of a European Financial Stabilization “mechanism”, funded with up to €750 billion seemed to calm nerves for a while. But in October, attention turned to Ireland, where the Irish government had injected huge sums into local banks, rendering its own fiscal position untenable. The November 29, 2010 European Union/International Monetary Fund bail-out worth €67.5 billion left markets unimpressed. Suddenly it was May again with downgrades, soaring yields on peripheral Eurozone bonds, fears of contagion, falling stock markets and doubts about the viability of the euro itself. The European Central Bank aggressively bought sovereign bonds and the mood settled. But with Spain’s banks needing to refinance €85 billion of debt in 2011, the issue remains unresolved.
Investors watched nervously as China, the source of much of the world’s growth, wrestled with inflation, which reached 5.1% in November, and a housing bubble. The authorities tightened
mortgage requirements, raised banks’ reserve ratio requirements six times in 2010 and interest rates twice in the last quarter. More interest rate increases seem inevitable.
In U.S. fixed income markets, the Barclays Capital U.S. Aggregate Bond Index of investment grade bonds returned 6.54% in 2010. A slight balance towards risk aversion in the first half gave way to improved risk appetite in the second. For the whole year, the Barclays Capital U.S. Treasury index returned 5.87%, underperforming the Barclays Capital Corporate Investment Grade Bond Index with a return of 9.00%, but both fell well short of the Barclays Capital High Yield Bond — 2% Issuer Constrained Composite Index which gained 14.94% for the one year period.
U.S. equities, represented by the S&P 500® Index including dividends, rose 15.06% in 2010, including its best September, a return of 8.92%, since 1939 and best December, a return of 6.68%, since 1991. Prices were supported by strong earnings reports, with operating earnings per share for S&P 500® companies recording four straight quarters of annual growth. Equities also benefited from improved risk appetite through the quantitative easing initiative and stimulus package referred to above.
In currencies, the worst of the gloom about the Eurozone in early June was replaced by renewed pessimism about the dollar in a stalling economy, before markets were seized by another bout of Eurozone angst. For the year, the dollar gained 8.15% against the euro and 2.95% against the pound, but lost 11.59% to the yen, which was sold in the market by the Bank of Japan after breaching 15-year high levels.
In international markets, the MSCI Japan® Index returned just 0.57% for the year after a strong last quarter, as quarterly GDP growth bounced back to 1.1% and the yen retreated from multi-year peaks. The tone of the market was generally poor with household spending fragile and consumer prices down for 21 months. The MSCI Europe ex UK® Index returned 4.84%, with Germany up 15.97% and Portugal, Italy, Ireland, Greece and Spain all falling. This broadly reflected the two-tier economy that has developed, with economic statistics favoring more soundly based countries at the expense of the peripherals. The MSCI UK® Index advanced 12.18%, despite the prospect of severe public spending cuts intended to eliminate an 11% budget deficit. Supporting sentiment was resilient, if perhaps temporary, quarterly GDP growth averaging 0.9% in the second half of the year.
Parentheses denote a negative number.
All indices are unmanaged and investors cannot invest directly in an index. Past performance does not guarantee future results. The performance quoted represents past performance. Investment return and principal value of an investment will fluctuate, and shares, when redeemed, may be worth more or less than their original cost. The Portfolios’ performance is subject to change since the period’s end and may be lower or higher than the performance data shown. Please call (800) 992-0180 or log on to www.ingfunds.com to obtain performance data current to the most recent month end.
Market Perspective reflects the views of ING’s Chief Investment Risk Officer only through the end of the period, and is subject to change based on market and other conditions.
2
BENCHMARK DESCRIPTIONS
| | |
| Index | | Description |
| MSCI World IndexSM | | An unmanaged index that measures the performance of over 1,400 securities listed on exchanges in the U.S., Europe, Canada, Australia, New Zealand and the Far East. |
| S&P/Case-Shiller 20-City Composite Home Price Index | | A composite index of the home price index for the top 20 Metropolitan Statistical Areas in the United States. The index is published monthly by Standard & Poor’s. |
| Barclays Capital U.S. Aggregate Bond Index | | An unmanaged index of publicly issued investment grade U.S. Government, mortgage-backed, asset-backed and corporate debt securities. |
| Barclays Capital U.S. Treasury Index | | An unmanaged index that includes public obligations of the U.S. Treasury. Treasury bills, certain special issues, such as state and local government series bonds (SLGs), as well as U.S. Treasury TIPS and STRIPS, are excluded. |
Barclays Capital Corporate Investment Grade Bond Index | | The corporate component of the Barclays Capital U.S. Credit Index. The U.S. Credit Index includes publicly-issued U.S. corporate and specified foreign debentures and secured notes that meet the specified maturity, liquidity, and quality requirements. The index includes both corporate and non-corporate sectors. The corporate sectors are industrial, utility and finance, which includes both U.S. and non-U.S. corporations. |
Barclays Capital High Yield Bond — 2% Constrained Composite Index | | An unmanaged index that includes all fixed income securities having a maximum quality rating of Ba1, a minimum amount outstanding of $150 million, and at least one year to maturity. |
| S&P 500® Index | | An unmanaged index that measures the performance of securities of approximately 500 large-capitalization companies whose securities are traded on major U.S. stock markets. |
| MSCI Japan® Index | | A free float-adjusted market capitalization index that is designed to measure developed market equity performance in Japan. |
| MSCI Europe ex UK® Index | | A free float-adjusted market capitalization index that is designed to measure developed market equity performance in Europe, excluding the UK. |
| MSCI UK® Index | | A free float-adjusted market capitalization index that is designed to measure developed market equity performance in the UK. |
| Russell 3000® Index | | An unmanaged index that measures the performance of 3000 U.S. companies based on total market capitalization. |
3
| | |
| PORTFOLIO MANAGERS’ REPORT | | ING STRATEGIC ALLOCATION PORTFOLIOS |
ING Strategic Allocation Conservative Portfolio seeks to provide total return (i.e., income and capital growth, both realized and unrealized) consistent with preservation of capital. ING Strategic Allocation Growth Portfolio seeks to provide capital appreciation. ING Strategic Allocation Moderate Portfolio seeks to provide total return (i.e., income and capital appreciation, both realized and unrealized). ING Strategic Allocation Conservative Portfolio, ING Strategic Allocation Growth Portfolio and ING Strategic Allocation Moderate Portfolio (each a “Portfolio” and collectively, the “Portfolios”) are managed by Paul Zemsky and Heather Hackett, Portfolio Managers of ING Investment Management Co. — the Sub-Adviser.
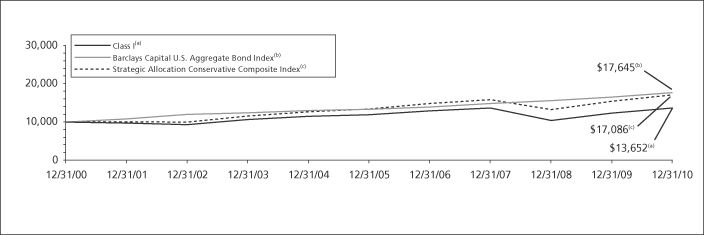
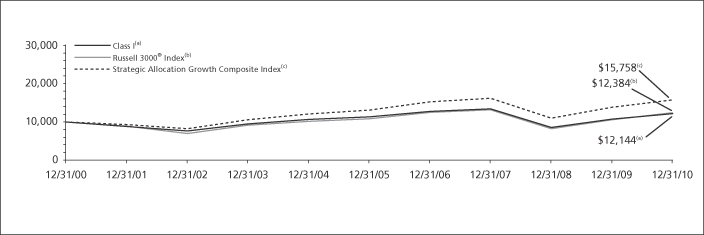
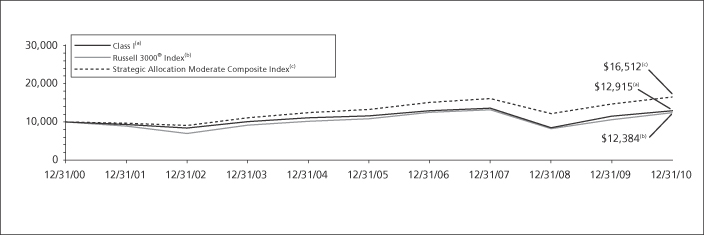
Performance: For the year ended December 31, 2010, ING Strategic Allocation Conservative Portfolio’s Class I shares provided a total return of 11.07% compared to the Barclays Capital U.S. Aggregate Bond Index and the Strategic Allocation Conservative Composite Index, which returned 6.54% and 10.53%, respectively, for the same period. For the year ended December 31, 2010, ING Strategic Allocation Growth Portfolio’s Class I shares provided a total return of 13.06% compared to the Russell 3000® Index and the ING Strategic Allocation Growth Composite Index, which returned 16.93% and 14.02%, respectively, for the same period. For the year ended December 31, 2010, ING Strategic Allocation Moderate Portfolio’s Class I shares provided a total return of 12.03% compared to the Russell 3000® Index and the ING Strategic Allocation Moderate Composite Index, which returned 16.93% and 12.24%, respectively, for the same period.
Portfolio Specifics: As the year drew to a close, investors were in a celebratory mood. A number of equity markets worldwide finished December at or near 2010 highs after a strong fourth quarter. Though most fixed income assets saw limited success in the quarter given rising rates, full-year returns were robust. However, despite the general sense of optimism that currently exists, two of 2010’s most compelling stories — the sluggish economic recovery in the United States and the sovereign debt issues in the euro zone — remain only partially told. How these narratives play out in 2011 will have a significant impact on market performance.
The Portfolios remained at strategic allocation weights and thus allocation results were flat. All asset classes demonstrated positive absolute returns. Equities and real estate outperformed bonds.
ING Intermediate Bond Portfolio significantly outperformed its sub-benchmark, the Barclays Capital U.S. Aggregate Bond Index, in large part due to favorable over weights to corporate bonds, financials and commercial mortgage-backed securities, as well as exposure to non-investment grade corporates. ING MidCap Opportunities Portfolio, significantly outperformed its relative benchmark and exhibited strong stock selection, especially in the energy and consumer staples sectors.
ING Clarion Global Real Estate Portfolio’s performance trailed its relative benchmark and was the largest relative detractor from performance, due to adverse regional allocation decisions during different parts of the year and unfavorable security selection in the Pacific region. Within our large cap equity exposure, ING Tactical Asset Allocation Fund (“TAAF”) underperformed the S&P 500® Index despite its average long exposure to equities as its overlay strategy detracted from returns. More specifically, TAAF’s average long exposure to Italian and Spanish equities in November hurt performance.
ING Alternative Beta Fund was added to the Portfolios’ line-up and seeks to achieve the investment results that approximate the return and risk characteristics of the beta component of the broad universe of hedge fund returns as represented by the HFRI Fund Weighted Composite Index. Although the Fund had success in meeting this objective in 2010, it is not designed to deliver the alpha of the index and underperformed.
The Portfolios are actively managed and may deviate from their strategic weights.
Current Strategy and Outlook: We believe the overall economic environment of the U.S. economy is developing in the direction of a sustainable recovery through an expansion driven more broadly by final demand. In our opinion, U.S. economic data have turned more positive with the PMI numbers, initial jobless claims and retail sales data suggesting that the economy is gaining momentum. In the U.S., policy remains highly stimulative. The extension of the Bush tax cuts along with the large scale Treasury purchases by the Federal Reserve should provide additional stimulus via consumer spending and stable interest rates.
Asset Allocation
as of December 31, 2010
(as a percentage of net assets)
| | | | | | | | | | | | | | | | | | | | | | | | |
| | | | Affiliated Underlying Funds | | | | | ING Strategic Allocation Conservative Portfolio | | | ING Strategic Allocation Growth Portfolio | | | ING Strategic Allocation Moderate Portfolio | | | | |
| | | | ING Alternative Beta Fund - Class I | | | % | | | | 5.0 | | | | 6.9 | | | | 6.0 | | | | | |
| | | | ING Clarion Global Real Estate Portfolio - Class I | | | % | | | | 4.1 | | | | 5.1 | | | | 5.1 | | | | | |
| | | | ING Growth and Income Portfolio - Class I | | | % | | | | 8.1 | | | | 19.1 | | | | 11.1 | | | | | |
| | | | ING Intermediate Bond Portfolio - Class I | | | % | | | | 54.7 | | | | 14.8 | | | | 34.7 | | | | | |
| | | | ING International Index Portfolio - Class I | | | % | | | | 13.1 | | | | 24.1 | | | | 19.1 | | | | | |
| | | | ING MidCap Opportunities Portfolio - Class I | | | % | | | | 4.0 | | | | 9.0 | | | | 6.0 | | | | | |
| | | | ING Small Company Portfolio - Class I | | | % | | | | 3.1 | | | | 8.1 | | | | 5.1 | | | | | |
| | | | ING Tactical Asset Allocation Fund - Class I | | | % | | | | 8.0 | | | | 12.9 | | | | 12.9 | | | | | |
| | | | Other assets and liabilities - Net | | | % | | | | (0.1 | ) | | | (0.0 | )* | | | (0.0 | )* | | | | |
| | | | | | | | | | | | | | | | | | | | | | | | |
| | | | | | | % | | | | 100.0 | | | | 100.0 | | | | 100.0 | | | | | |
| | | | | | | | | | | | | | | | | | | | | | | | |
| * | Amount is more than (0.05)% |
Portfolio holdings and characteristics are subject to change and may not be representative of current holdings and characteristics. The outlook for this Portfolio may differ from that presented for other ING Funds. Performance for the different classes of shares will vary based on differences in fees associated with each class.
4
| | |
| PORTFOLIO MANAGERS’ REPORT | | ING STRATEGIC ALLOCATION CONSERVATIVE PORTFOLIO |
| | | | | | | | | | | | | | | | | | | | | | | | |
| | | |
| | | | | Average Annual Total Returns for the Periods Ended December 31, 2010 | | | | | |
| | | | | | 1 Year | | | 5 Year | | | 10 Year | | | Since
Inception
of Class S
August 5,
2005 | | | | |
| | | | | | | |
| | | | | | | | | | | | | | | | | | | | | | | | | |
| | | | | Class I | | | 11.07 | % | | | 2.78 | % | | | 3.16 | % | | | — | | | | | |
| | | | | Class S | | | 10.91 | % | | | 2.55 | % | | | — | | | | 2.63 | % | | | | |
| | | | | Barclays Capital U.S. Aggregate Bond Index | | | 6.54 | % | | | 5.80 | % | | | 5.84 | % | | | 5.50 | %(1) | | | | |
| | | | | Strategic Allocation Conservative Composite Index | | | 10.53 | % | | | 5.00 | % | | | 5.50 | % | | | 5.13 | %(1) | | | | |
Based on a $10,000 initial investment, the graph and table above illustrate the total return of ING Strategic Allocation Conservative Portfolio against the indices indicated. An index is unmanaged and has no cash in its portfolio, imposes no sales charges and incurs no operating expenses. An investor cannot invest directly in an index. The Portfolio’s performance is shown without the imposition of any expenses or charges which are, or may be, imposed under your annuity contract. Total returns would have been lower if such expenses or charges were included.
The performance graph and table do not reflect the deduction of taxes that a shareholder will pay on Portfolio distributions or the redemption of Portfolio shares.
The performance shown may include the effect of fee waivers and/or expense reimbursements by the Investment Adviser and/or other service providers, which have the effect of increasing total return. Had all fees and expenses been considered, the total returns would have been lower.
The performance update illustrates performance for a variable investment option available through a variable annuity contract. The performance shown indicates past performance and is not a projection or prediction of future results. Actual investment
returns and principal value will fluctuate so that shares and/or units, at redemption, may be worth more or less than their original cost. Please call (800) 992-0180 to get performance through the most recent month end.
This report contains statements that may be “forward-looking” statements. Actual results may differ materially from those projected in the “forward-looking” statements.
The views expressed in this report reflect those of the portfolio managers, only through the end of the period as stated on the cover. The portfolio managers’ views are subject to change at any time based on market and other conditions.
Portfolio holdings are subject to change daily.
| (1) | | Since inception performance for the indices is shown from August 1, 2005. |
Effective March 1, 2002, ING Investments, LLC began serving as investment adviser and ING Investment Management Co., the former investment adviser, began serving as sub-adviser to the Portfolio. Effective April 7, 2008, the Portfolio was converted from a mutual fund, which invested directly in securities, to a fund-of-funds, which invests in other mutual funds.
5
| | |
| PORTFOLIO MANAGERS’ REPORT | | ING STRATEGIC ALLOCATION GROWTH PORTFOLIO |
| | | | | | | | | | | | | | | | | | | | | | | | |
| | |
| | | | | Average Annual Total Returns for the Periods Ended December 31, 2010 | |
| | | | | | 1 Year | | | 5 Year | | | 10 Year | | | Since Inception of Class S August 5, 2005 | | | | |
| | | | | Class I | | | 13.06 | % | | | 1.48 | % | | | 1.96 | % | | | — | | | | | |
| | | | | Class S | | | 12.81 | % | | | 1.24 | % | | | — | | | | 1.74 | % | | | | |
| | | | | Russell 3000® Index | | | 16.93 | % | | | 2.74 | % | | | 2.16 | % | | | 2.89 | %(1) | | | | |
| | | | | Strategic Allocation Growth Composite Index | | | 14.02 | % | | | 3.82 | % | | | 4.65 | % | | | 4.32 | %(1) | | | | |
Based on a $10,000 initial investment, the graph and table above illustrate the total return of ING Strategic Allocation Growth Portfolio against the indices indicated. An index is unmanaged and has no cash in its portfolio, imposes no sales charges and incurs no operating expenses. An investor cannot invest directly in an index. The Portfolio’s performance is shown without the imposition of any expenses or charges which are, or may be, imposed under your annuity contract. Total returns would have been lower if such expenses or charges were included.
The performance graph and table do not reflect the deduction of taxes that a shareholder will pay on Portfolio distributions or the redemption of Portfolio shares.
The performance shown may include the effect of fee waivers and/or expense reimbursements by the Investment Adviser and/or other service providers, which have the effect of increasing total return. Had all fees and expenses been considered, the total returns would have been lower.
The performance update illustrates performance for a variable investment option available through a variable annuity contract. The performance shown indicates past performance and is not a projection or prediction of future results. Actual investment
returns and principal value will fluctuate so that shares and/or units, at redemption, may be worth more or less than their original cost. Please call (800) 992-0180 to get performance through the most recent month end.
This report contains statements that may be “forward-looking” statements. Actual results may differ materially from those projected in the “forward-looking” statements.
The views expressed in this report reflect those of the portfolio managers, only through the end of the period as stated on the cover. The portfolio managers’ views are subject to change at any time based on market and other conditions.
Portfolio holdings are subject to change daily.
| (1) | | Since inception performance for the indices is shown from August 1, 2005. |
Effective March 1, 2002, ING Investments, LLC began serving as investment adviser and ING Investment Management Co., the former investment adviser, began serving as sub-adviser to the Portfolio. Effective April 7, 2008, the Portfolio was converted from a mutual fund, which invested directly in securities, to a fund-of-funds, which invests in other mutual funds.
6
| | |
| PORTFOLIO MANAGERS’ REPORT | | ING STRATEGIC ALLOCATION MODERATE PORTFOLIO |
| | | | | | | | | | | | | | | | | | | | | | | | |
| | |
| | | | | Average Annual Total Returns for the Periods Ended December 31, 2010 | |
| | | | | | 1 Year | | | 5 Year | | | 10 Year | | | Since Inception of Class S June 7, 2005 | | | | |
| | | | | Class I | | | 12.03 | % | | | 2.16 | % | | | 2.59 | % | | | — | | | | | |
| | | | | Class S | | | 11.77 | % | | | 1.90 | % | | | — | | | | 2.39 | % | | | | |
| | | | | Russell 3000® Index | | | 16.93 | % | | | 2.74 | % | | | 2.16 | % | | | 3.68 | %(1) | | | | |
| | | | | Strategic Allocation Moderate Composite Index | | | 12.24 | % | | | 4.46 | % | | | 5.14 | % | | | 6.86 | %(1) | | | | |
Based on a $10,000 initial investment, the graph and table above illustrate the total return of ING Strategic Allocation Moderate Portfolio against the indices indicated. An index is unmanaged and has no cash in its portfolio, imposes no sales charges and incurs no operating expenses. An investor cannot invest directly in an index. The Portfolio’s performance is shown without the imposition of any expenses or charges which are, or may be, imposed under your annuity contract. Total returns would have been lower if such expenses or charges were included.
The performance graph and table do not reflect the deduction of taxes that a shareholder will pay on Portfolio distributions or the redemption of Portfolio shares.
The performance shown may include the effect of fee waivers and/or expense reimbursements by the Investment Adviser and/or other service providers, which have the effect of increasing total return. Had all fees and expenses been considered, the total returns would have been lower.
The performance update illustrates performance for a variable investment option available through a variable annuity contract. The performance shown indicates past performance and is not a projection or prediction of future results. Actual investment
returns and principal value will fluctuate so that shares and/or units, at redemption, may be worth more or less than their original cost. Please call (800) 992-0180 to get performance through the most recent month end.
This report contains statements that may be “forward-looking” statements. Actual results may differ materially from those projected in the “forward-looking” statements.
The views expressed in this report reflect those of the portfolio managers, only through the end of the period as stated on the cover. The portfolio managers’ views are subject to change at any time based on market and other conditions.
Portfolio holdings are subject to change daily.
| (1) | | Since inception performance for the indices is shown from June 1, 2005. |
Effective March 1, 2002, ING Investments, LLC began serving as investment adviser and ING Investment Management Co., the former investment adviser, began serving as sub-adviser to the Portfolio. Effective April 7, 2008, the Portfolio was converted from a mutual fund, which invested directly in securities, to a fund-of-funds, which invests in other mutual funds.
7
| | |
| ING STRATEGIC ALLOCATION PORTFOLIOS | | PORTFOLIO MANAGERS’ REPORT |
ING Strategic Allocation Conservative Portfolio, ING Strategic Allocation Growth Portfolio and ING Strategic Allocation Moderate Portfolio (collectively, the “Portfolios”) seek to obtain their individual investment objectives by investing in a combination of underlying funds (“Underlying Funds”) according to each Portfolio’s fixed formula. The Portfolios are managed by ING Investment Management Co. (“ING IM”) — the Sub-Adviser.
The Sub-Adviser uses the Strategic Allocation Conservative Composite, Strategic Allocation Growth Composite, and Strategic Allocation Moderate
Composite indices (each a “Composite Index”) as benchmarks to which it compares the performance of ING Strategic Allocation Conservative Portfolio, ING Strategic Allocation Growth Portfolio and ING Strategic Allocation Moderate Portfolio, respectively. Each Composite Index is a blended index that is derived from the asset class comparative indices set out in the chart below. The chart shows the weightings for each asset class comparative index represented in each benchmark Composite Index, as a percentage of the Composite Index.
| | | | | | | | | | | | | | | | | | | | | | | | | | | | | | | | | | | | |
| | | | | | S&P 500®
Index | | | S&P MidCap 400 Index | | | S&P SmallCap 600 Index | | | MSCI EAFE® Index | | | S&P
Developed
Property
Index | | | Barclays Capital U.S. Aggregate Bond Index | | | HFRX Index | | | | |
| | | | Strategic Allocation Conservative Composite(1) | | | 16 | % | | | 4 | % | | | 3 | % | | | 13 | % | | | 4 | % | | | 55 | % | | | 5 | % | | | | |
| | | | Strategic Allocation Growth Composite(1) | | | 32 | % | | | 9 | % | | | 8 | % | | | 24 | % | | | 5 | % | | | 15 | % | | | 7 | % | | | | |
| | | | Strategic Allocation Moderate Composite(1) | | | 24 | % | | | 6 | % | | | 5 | % | | | 19 | % | | | 5 | % | | | 35 | % | | | 6 | % | | | | |
| | | | | | | | | | | | | | | | | | | | |
| | | | Target Allocations(*) | | ING Strategic Allocation Conservative Portfolio | | | ING Strategic Allocation Growth Portfolio | | | ING Strategic Allocation Moderate Portfolio | | | | |
| | | | U.S. Large-Capitalization Stocks | | | 16 | % | | | 32 | % | | | 24 | % | | | | |
| | | | U.S. Mid-Capitalization Stocks | | | 4 | % | | | 9 | % | | | 6 | % | | | | |
| | | | U.S. Small-Capitalization Stocks | | | 3 | % | | | 8 | % | | | 5 | % | | | | |
| | | | Non-U.S./International Stocks | | | 13 | % | | | 24 | % | | | 19 | % | | | | |
| | | | Real Estate Stocks | | | 4 | % | | | 5 | % | | | 5 | % | | | | |
| | | | Fixed-Income Securities | | | 55 | % | | | 15 | % | | | 35 | % | | | | |
| | | | Alternatives | | | 5 | % | | | 7 | % | | | 6 | % | | | | |
| | | | | | | | | | | | | | | | | | | | |
| | | | | | | 100 | % | | | 100 | % | | | 100 | % | | | | |
| (1) | | The Composite Indices reflect the allocations in each Composite Index as of December 31, 2010, but do not reflect the historical changes in allocations throughout the history of each Composite Index. The returns on pages 4-7 reflect a calculation inclusive of allocation changes throughout the history of each Composite Index. |
| (*) | | Portfolio’s current approximate target investment allocations (expressed as a percentage of its net assets) as of December 31, 2010. As these are target allocations, the actual allocations of each Portfolio’s assets may deviate from the percentages shown. Although the Portfolios expect to be fully invested at all times, they may maintain liquidity reserves to meet redemption requests. |
8
All indices are unmanaged.
An investor cannot invest directly in an index.
SHAREHOLDER EXPENSE EXAMPLES (UNAUDITED)
As a shareholder of a Portfolio, you incur two types of costs: (1) transaction costs, including redemption fees; and exchange fees; and (2) ongoing costs, including management fees, distribution and/or service (12b-1) fees, and other Portfolio expenses. These Examples are intended to help you understand your ongoing costs (in dollars) of investing in a Portfolio and to compare these costs with the ongoing costs of investing in other mutual funds.
The Examples are based on an investment of $1,000 invested at the beginning of the period and held for the entire period from July 1, 2010 to December 31, 2010. The Portfolios’ expenses are shown without the imposition of any charges which are, or may be, imposed under your variable annuity contract, variable life insurance policy, qualified pension or retirement plan. Expenses would have been higher if such charges were included.
Actual Expenses
The left section of the table shown below, “Actual Portfolio Return,” provides information about actual account values and actual expenses. You may use the information in this section, together with the amount you invested, to estimate the expenses that you paid over the period. Simply divide your account value by $1,000 (for example, an $8,600 account value divided by $1,000 = 8.6), then multiply the result by the number in the first section under the heading entitled “Expenses Paid During the Period” to estimate the expenses you paid on your account during this period.
Hypothetical Example for Comparison Purposes
The right section of the table shown below, “Hypothetical (5% return before expenses),” provides information about hypothetical account values and hypothetical expenses based on a Portfolio’s actual expense ratio and an assumed rate of return of 5% per year before expenses, which is not a Portfolio’s actual return. The hypothetical account values and expenses may not be used to estimate the actual ending account balance or expenses you paid for the period. You may use this information to compare the ongoing costs of investing in a Portfolio and other mutual funds. To do so, compare this 5% hypothetical example with the 5% hypothetical examples that appear in the shareholder reports of the other mutual funds.
Please note that the expenses shown in the table are meant to highlight your ongoing costs only and do not reflect any transactional costs, such as redemption fees or exchange fees. Therefore, the hypothetical lines of the table are useful in comparing ongoing costs only, and will not help you determine the relative total costs of owning different mutual funds. In addition, if these transactional costs were included, your costs would have been higher.
| | | | | | | | | | | | | | | | | | | | | | | | | | | | | | | | |
| | | Actual Portfolio Return | | | Hypothetical (5% return before expenses) | |
| | | Beginning
Account
Value
July 1, 2010 | | | Ending
Account Value
December 31,
2010 | | | Annualized
Expense
Ratio* | | | Expenses Paid
During the
Period Ended
December 31,
2010** | | | Beginning
Account
Value
July 1, 2010 | | | Ending
Account Value
December 31,
2010 | | | Annualized
Expense
Ratio* | | | Expenses Paid
During the
Period Ended
December 31,
2010** | |
ING Strategic Allocation Conservative Portfolio | |
Class I | | $ | 1,000.00 | | | $ | 1,117.00 | | | | 0.09 | % | | $ | 0.48 | | | $ | 1,000.00 | | | $ | 1,024.75 | | | | 0.09 | % | | $ | 0.46 | |
Class S | | | 1,000.00 | | | | 1,116.60 | | | | 0.34 | | | | 1.81 | | | | 1,000.00 | | | | 1,023.49 | | | | 0.34 | | | | 1.73 | |
ING Strategic Allocation Growth Portfolio | |
Class I | | $ | 1,000.00 | | | $ | 1,206.10 | | | | 0.09 | % | | $ | 0.50 | | | $ | 1,000.00 | | | $ | 1,024.75 | | | | 0.09 | % | | $ | 0.46 | |
Class S | | | 1,000.00 | | | | 1,203.80 | | | | 0.34 | | | | 1.89 | | | | 1,000.00 | | | | 1,023.49 | | | | 0.34 | | | | 1.73 | |
ING Strategic Allocation Moderate Portfolio | |
Class I | | $ | 1,000.00 | | | $ | 1,161.00 | | | | 0.10 | % | | $ | 0.54 | | | $ | 1,000.00 | | | $ | 1,024.70 | | | | 0.10 | % | | $ | 0.51 | |
Class S | | | 1,000.00 | | | | 1,160.80 | | | | 0.35 | | | | 1.91 | | | | 1,000.00 | | | | 1,023.44 | | | | 0.35 | | | | 1.79 | |
| * | | Expense ratios do not include expenses of the underlying funds. |
| ** | | Expenses are equal to each Portfolio’s respective annualized expense ratios multiplied by the average account value over the period, multiplied by 184/365 to reflect the most recent fiscal half-year. |
9
i
REPORT OF INDEPENDENT REGISTERED PUBLIC ACCOUNTING FIRM
The Shareholders and Board of Directors
ING Strategic Allocation Portfolios, Inc.
We have audited the accompanying statements of assets and liabilities, including the portfolios of investments, of ING Strategic Allocation Conservative Portfolio, ING Strategic Allocation Growth Portfolio, and ING Strategic Allocation Moderate Portfolio, each a series of ING Strategic Allocation Portfolios, Inc., as of December 31, 2010, and the related statements of operations for the year then ended, the statements of changes in net assets for each of the years in the two-year period then ended, and the financial highlights for each of the years or periods in the five-year period then ended. These financial statements and financial highlights are the responsibility of management. Our responsibility is to express an opinion on these financial statements and financial highlights based on our audits.
We conducted our audits in accordance with the standards of the Public Company Accounting Oversight Board (United States). Those standards require that we plan and perform the audit to obtain reasonable assurance about whether the financial statements and financial highlights are free of material misstatement. An audit includes examining, on a test basis, evidence supporting the amounts and disclosures in the financial statements. Our procedures included confirmation of securities owned as of December 31, 2010, by correspondence with the transfer agent of the underlying funds. An audit also includes assessing the accounting principles used and significant estimates made by management, as well as evaluating the overall financial statement presentation. We believe that our audits provide a reasonable basis for our opinion.
In our opinion, the financial statements and financial highlights referred to above present fairly, in all material respects, the financial position of the aforementioned portfolios as of December 31, 2010, and the results of their operations, the changes in their net assets, and the financial highlights for the periods specified in the first paragraph above, in conformity with U.S. generally accepted accounting principles.

Boston, Massachusetts
February 24, 2011
10
STATEMENTS OF ASSETS AND LIABILITIESASOF DECEMBER 31, 2010
| | | | | | | | | | | | |
| | | ING Strategic
Allocation
Conservative
Portfolio | | | ING Strategic
Allocation
Growth
Portfolio | | | ING Strategic
Allocation
Moderate
Portfolio | |
ASSETS: | | | | | | | | | | | | |
Investments in affiliated underlying funds* | | $ | 91,884,517 | | | $ | 172,909,359 | | | $ | 167,362,612 | |
Receivables: | | | | | | | | | | | | |
Investments in affiliated underlying funds sold | | | 135,611 | | | | 597,205 | | | | 606,835 | |
Fund shares sold | | | 4,300 | | | | 33 | | | | 2,366 | |
Dividends | | | 13 | | | | 744 | | | | 905 | |
Prepaid expenses | | | 1,698 | | | | 2,997 | | | | 3,007 | |
Reimbursement due from manager | | | 6,672 | | | | 14,388 | | | | 4,418 | |
| | | | | | | | | | | | |
Total assets | | | 92,032,811 | | | | 173,524,726 | | | | 167,980,143 | |
| | | | | | | | | | | | |
LIABILITIES: | | | | | | | | | | | | |
Payable for fund shares redeemed | | | 139,911 | | | | 597,238 | | | | 609,201 | |
Payable to affiliates | | | 10,899 | | | | 20,079 | | | | 19,697 | |
Payable for directors fees | | | 468 | | | | 831 | | | | 828 | |
Other accrued expenses and liabilities | | | 43,997 | | | | 58,899 | | | | 64,213 | |
| | | | | | | | | | | | |
Total liabilities | | | 195,275 | | | | 677,047 | | | | 693,939 | |
| | | | | | | | | | | | |
NET ASSETS | | $ | 91,837,536 | | | $ | 172,847,679 | | | $ | 167,286,204 | |
| | | | | | | | | | | | |
NET ASSETS WERE COMPRISED OF: | | | | | | | | | | | | |
Paid-in capital | | $ | 104,185,108 | | | $ | 211,871,396 | | | $ | 200,108,623 | |
Undistributed net investment income | | | 3,453,724 | | | | 4,173,132 | | | | 5,273,567 | |
Accumulated net realized loss | | | (23,450,141 | ) | | | (57,555,528 | ) | | | (52,385,708 | ) |
Net unrealized appreciation | | | 7,648,845 | | | | 14,358,679 | | | | 14,289,722 | |
| | | | | | | | | | | | |
NET ASSETS | | $ | 91,837,536 | | | $ | 172,847,679 | | | $ | 167,286,204 | |
| | | | | | | | | | | | |
| | | | | | | | | | | | |
* Cost of investments in affiliated underlying funds | | $ | 84,235,671 | | | $ | 158,550,754 | | | $ | 153,072,912 | |
| | | | | | | | | | | | |
Class I: | | | | | | | | | | | | |
Net assets | | $ | 90,085,650 | | | $ | 171,094,203 | | | $ | 164,412,264 | |
Shares outstanding(1) | | | 8,651,474 | | | | 16,703,638 | | | | 15,948,760 | |
Net asset value and redemption price per share | | $ | 10.41 | | | $ | 10.24 | | | $ | 10.31 | |
Class S: | | | | | | | | | | | | |
Net assets | | $ | 1,751,886 | | | $ | 1,753,476 | | | $ | 2,873,940 | |
Shares outstanding(1) | | | 169,459 | | | | 172,588 | | | | 280,468 | |
Net asset value and redemption price per share | | $ | 10.34 | | | $ | 10.16 | | | $ | 10.25 | |
| (1) | 100,000,000 shares authorized; $0.001 par value. |
See Accompanying Notes to Financial Statements
11
STATEMENTS OF OPERATIONSFORTHE YEAR ENDED DECEMBER 31, 2010
| | | | | | | | | | | | |
| | | ING Strategic Allocation Conservative Portfolio | | | ING Strategic Allocation Growth Portfolio | | | ING Strategic Allocation Moderate Portfolio | |
INVESTMENT INCOME: | | | | | | | | | | | | |
Dividends from affiliated underlying funds | | $ | 3,510,135 | | | $ | 4,249,290 | | | $ | 5,375,982 | |
| | | | | | | | | | | | |
Total investment income | | | 3,510,135 | | | | 4,249,290 | | | | 5,375,982 | |
| | | | | | | | | | | | |
EXPENSES: | | | | | | | | | | | | |
Investment management fees | | | 74,880 | | | | 133,001 | | | | 132,448 | |
Distribution and service fees | | | 4,291 | | | | 4,098 | | | | 7,024 | |
Transfer agent fees | | | 215 | | | | 303 | | | | 397 | |
Administrative service fees | | | 51,478 | | | | 91,435 | | | | 91,054 | |
Shareholder reporting expense | | | 13,783 | | | | 26,500 | | | | 24,158 | |
Professional fees | | | 26,929 | | | | 36,776 | | | | 37,577 | |
Custody and accounting expense | | | 6,445 | | | | 10,122 | | | | 9,437 | |
Directors fees | | | 5,636 | | | | 8,192 | | | | 8,187 | |
Miscellaneous expense | | | 9,429 | | | | 13,766 | | | | 11,087 | |
| | | | | | | | | | | | |
Total expenses | | | 193,086 | | | | 324,193 | | | | 321,369 | |
Net waived and reimbursed fees | | | (104,529 | ) | | | (170,403 | ) | | | (148,725 | ) |
| | | | | | | | | | | | |
Net expenses | | | 88,557 | | | | 153,790 | | | | 172,644 | |
| | | | | | | | | | | | |
Net investment income | | | 3,421,578 | | | | 4,095,500 | | | | 5,203,338 | |
| | | | | | | | | | | | |
REALIZED AND UNREALIZED GAIN (LOSS): | | | | | | | | | | | | |
Net realized gain (loss) on: | | | | | | | | | | | | |
Capital gain distributions from affiliated underlying funds | | | 145,648 | | | | 378,932 | | | | 315,106 | |
Sale of affiliated underlying funds | | | (5,925,967 | ) | | | (12,111,087 | ) | | | (12,743,822 | ) |
Foreign currency related transactions | | | 54 | | | | (5,833 | ) | | | (264 | ) |
| | | | | | | | | | | | |
Net realized loss | | | (5,780,265 | ) | | | (11,737,988 | ) | | | (12,428,980 | ) |
| | | | | | | | | | | | |
Net change in unrealized appreciation or depreciation on: | | | | | | | | | | | | |
Affiliated underlying funds | | | 12,152,046 | | | | 28,152,514 | | | | 25,778,559 | |
Foreign currency related transactions | | | (373 | ) | | | (5,224 | ) | | | (320 | ) |
| | | | | | | | | | | | |
Net change in unrealized appreciation or depreciation | | | 12,151,673 | | | | 28,147,290 | | | | 25,778,239 | |
| | | | | | | | | | | | |
Net realized and unrealized gain | | | 6,371,408 | | | | 16,409,302 | | | | 13,349,259 | |
| | | | | | | | | | | | |
Increase in net assets resulting from operations | | $ | 9,792,986 | | | $ | 20,504,802 | | | $ | 18,552,597 | |
| | | | | | | | | | | | |
See Accompanying Notes to Financial Statements
12
STATEMENTS OF CHANGES IN NET ASSETS
| | | | | | | | | | | | | | | | |
| | | ING Strategic Allocation Conservative Portfolio | | | ING Strategic Allocation Growth Portfolio | |
| | | Year Ended
December 31, 2010 | | | Year Ended
December 31, 2009 | | | Year Ended December 31, 2010 | | | Year Ended December 31, 2009 | |
FROM OPERATIONS: | | | | | | | | | | | | | | | | |
Net investment income | | $ | 3,421,578 | | | $ | 4,329,682 | | | $ | 4,095,500 | | | $ | 6,185,165 | |
Net realized loss | | | (5,780,265 | ) | | | (14,191,003 | ) | | | (11,737,988 | ) | | | (40,236,147 | ) |
Net change in unrealized appreciation or depreciation | | | 12,151,673 | | | | 24,238,063 | | | | 28,147,290 | | | | 69,463,862 | |
| | | | | | | | | | | | | | | | |
Increase in net assets resulting from operations | | | 9,792,986 | | | | 14,376,742 | | | | 20,504,802 | | | | 35,412,880 | |
| | | | | | | | | | | | | | | | |
FROM DISTRIBUTIONS TO SHAREHOLDERS: | | | | | | | | | | | | | | | | |
Net investment income: | | | | | | | | | | | | | | | | |
Class ADV(1) | | | — | | | | (56 | ) | | | — | | | | (54 | ) |
Class I | | | (4,262,914 | ) | | | (7,207,695 | ) | | | (6,132,027 | ) | | | (15,357,206 | ) |
Class S | | | (73,828 | ) | | | (121,212 | ) | | | (57,848 | ) | | | (142,132 | ) |
Net realized gains: | | | | | | | | | | | | | | | | |
Class ADV(1) | | | — | | | | — | | | | — | | | | (31 | ) |
Class I | | | — | | | | — | | | | — | | | | (8,405,469 | ) |
Class S | | | — | | | | — | | | | — | | | | (79,792 | ) |
| | | | | | | | | | | | | | | | |
Total distributions | | | (4,336,742 | ) | | | (7,328,963 | ) | | | (6,189,875 | ) | | | (23,984,684 | ) |
| | | | | | | | | | | | | | | | |
FROM CAPITAL SHARE TRANSACTIONS: | | | | | | | | | | | | | | | | |
Net proceeds from sale of shares | | | 10,768,391 | | | | 7,978,159 | | | | 5,717,089 | | | | 8,911,923 | |
Reinvestment of distributions | | | 4,336,742 | | | | 7,328,907 | | | | 6,189,875 | | | | 23,984,598 | |
| | | | | | | | | | | | | | | | |
| | | 15,105,133 | | | | 15,307,066 | | | | 11,906,964 | | | | 32,896,521 | |
Cost of shares redeemed | | | (24,147,209 | ) | | | (14,557,135 | ) | | | (23,160,975 | ) | | | (22,722,314 | ) |
| | | | | | | | | | | | | | | | |
Net increase (decrease) in net assets resulting from capital share transactions | | | (9,042,076 | ) | | | 749,931 | | | | (11,254,011 | ) | | | 10,174,207 | |
| | | | | | | | | | | | | | | | |
Net increase (decrease) in net assets | | | (3,585,832 | ) | | | 7,797,710 | | | | 3,060,916 | | | | 21,602,403 | |
| | | | | | | | | | | | | | | | |
NET ASSETS: | | | | | | | | | | | | | | | | |
Beginning of year | | | 95,423,368 | | | | 87,625,658 | | | | 169,786,763 | | | | 148,184,360 | |
| | | | | | | | | | | | | | | | |
End of year | | $ | 91,837,536 | | | $ | 95,423,368 | | | $ | 172,847,679 | | | $ | 169,786,763 | |
| | | | | | | | | | | | | | | | |
Undistributed net investment income at end of year | | $ | 3,453,724 | | | $ | 4,335,805 | | | $ | 4,173,132 | | | $ | 6,188,625 | |
| | | | | | | | | | | | | | | | |
| (1) | Class ADV liquidated on April 6, 2010. |
See Accompanying Notes to Financial Statements
13
STATEMENTS OF CHANGES IN NET ASSETS
| | | | | | | | |
| | | ING Strategic Allocation Moderate Portfolio | |
| | | Year Ended
December 31, 2010 | | | Year Ended
December 31, 2009 | |
| | |
| | | | | | | | |
FROM OPERATIONS: | | | | | | | | |
Net investment income | | $ | 5,203,338 | | | $ | 6,809,799 | |
Net realized loss | | | (12,428,980 | ) | | | (33,508,265 | ) |
Net change in unrealized appreciation or depreciation | | | 25,778,239 | | | | 57,157,778 | |
| | | | | | | | |
Increase in net assets resulting from operations | | | 18,552,597 | | | | 30,459,312 | |
| | | | | | | | |
FROM DISTRIBUTIONS TO SHAREHOLDERS: | | | | | | | | |
Net investment income: | | | | | | | | |
Class ADV(1) | | | — | | | | (55 | ) |
Class I | | | (6,704,131 | ) | | | (14,264,050 | ) |
Class S | | | (112,464 | ) | | | (206,494 | ) |
Net realized gains: | | | | | | | | |
Class ADV(1) | | | — | | | | (20 | ) |
Class I | | | — | | | | (4,723,706 | ) |
Class S | | | — | | | | (70,284 | ) |
| | | | | | | | |
Total distributions | | | (6,816,595 | ) | | | (19,264,609 | ) |
| | | | | | | | |
FROM CAPITAL SHARE TRANSACTIONS: | | | | | | | | |
Net proceeds from sale of shares | | | 7,366,034 | | | | 10,438,408 | |
Reinvestment of distributions | | | 6,816,595 | | | | 19,264,534 | |
| | | | | | | | |
| | | 14,182,629 | | | | 29,702,942 | |
Cost of shares redeemed | | | (27,785,016 | ) | | | (26,902,763 | ) |
| | | | | | | | |
Net increase (decrease) in net assets resulting from capital share transactions | | | (13,602,387 | ) | | | 2,800,179 | |
| | | | | | | | |
Net increase (decrease) in net assets | | | (1,866,385 | ) | | | 13,994,882 | |
| | | | | | | | |
NET ASSETS: | | | | | | | | |
Beginning of year | | | 169,152,589 | | | | 155,157,707 | |
| | | | | | | | |
End of year | | $ | 167,286,204 | | | $ | 169,152,589 | |
| | | | | | | | |
Undistributed net investment income at end of year | | $ | 5,273,567 | | | $ | 6,816,339 | |
| | | | | | | | |
| (1) | Class ADV liquidated on April 6, 2010. |
See Accompanying Notes to Financial Statements
14
FINANCIAL HIGHLIGHTS
Selected data for a share of beneficial interest outstanding throughout each year or period.
| | | | | | | | | | | | | | | | | | | | | | | | | | | | | | | | | | | | | | | | | | | | | | | | | | | | | | | | | | | | | | | | |
| | | | | | Income (loss)
from
investment
operations | | | | | | Less distributions | | | | | | | | | | | | Ratios to average net
assets | | | Supplemental
data | |
| | | | | | | | | | | | | | | | | | | | | | | | | | | | | | | | | | | | | | | | | | | | | | | | | |
| | | Net asset value, beginning of year or period | | | Net investment income (loss) | | | Net realized and unrealized gain (loss) | | | Total from investment operations | | | From net investment income | | | From net realized gains | | | From return of capital | | | Total distributions | | | Net asset value, end of year or period | | | Total Return (1) | | | Expenses before reductions/ additions(2)(3)(4) | | | Expenses net of fee waivers and/or recoupments, if any(2)(3)(4) | | | Expenses net of all reductions/ additions(2)(3)(4) | | | Net investment income (loss)(2)(3)(4) | | | Net assets, end of year or period | | | Portfolio turnover rate | |
| | | | | | | | | | | | | | | | | | | | | | | | | | | | | | | | | | | | | | | | | | | | | | | | | | | | | | | | | | | | | | | | |
Year or period ended | | ($) | | | ($) | | | ($) | | | ($) | | | ($) | | | ($) | | | ($) | | | ($) | | | ($) | | | (%) | | | (%) | | | (%) | | | (%) | | | (%) | | | ($000's) | | | (%) | |
| ING Strategic Allocation Conservative Portfolio | | | | | | | | | | | | | | | | | | | | | | | | | | | | | | | | | | | | | | | | | | | | | | | | | | | | | | | | | | | | | | | | |
Class I | | | | | | | | | | | | | | | | | | | | | | | | | | | | | | | | | | | | | | | | | | | | | | | | | | | | | | | | | | | | | | | | |
12-31-10 | | | 9.80 | | | | 0.36 | · | | | 0.70 | | | | 1.06 | | | | 0.45 | | | | — | | | | — | | | | 0.45 | | | | 10.41 | | | | 11.07 | | | | 0.20 | | | | 0.09 | | | | 0.09 | | | | 3.66 | | | | 90,086 | | | | 88 | |
12-31-09 | | | 9.13 | | | | 0.45 | · | | | 1.03 | | | | 1.48 | | | | 0.81 | | | | — | | | | — | | | | 0.81 | | | | 9.80 | | | | 18.00 | | | | 0.20 | | | | 0.10 | | | | 0.10 | | | | 5.04 | | | | 93,792 | | | | 56 | |
12-31-08 | | | 13.51 | | | | 0.51 | | | | (3.39 | ) | | | (2.88 | ) | | | 0.51 | | | | 0.99 | | | | — | | | | 1.50 | | | | 9.13 | | | | (23.65 | ) | | | 0.39 | | | | 0.27 | † | | | 0.27 | † | | | 3.99 | † | | | 86,257 | | | | 277 | |
12-31-07 | | | 13.55 | | | | 0.46 | · | | | 0.29 | | | | 0.75 | | | | 0.45 | | | | 0.34 | | | | — | | | | 0.79 | | | | 13.51 | | | | 5.80 | | | | 0.73 | | | | 0.65 | † | | | 0.65 | † | | | 3.40 | † | | | 136,938 | | | | 422 | |
12-31-06 | | | 13.27 | | | | 0.42 | · | | | 0.64 | | | | 1.06 | | | | 0.35 | | | | 0.43 | | | | — | | | | 0.78 | | | | 13.55 | | | | 8.37 | | | | 0.72 | | | | 0.65 | | | | 0.65 | | | | 3.18 | | | | 146,397 | | | | 335 | |
Class S | | | | | | | | | | | | | | | | | | | | | | | | | | | | | | | | | | | | | | | | | | | | | | | | | | | | | | | | | | | | | | | | |
12-31-10 | | | 9.73 | | | | 0.34 | | | | 0.70 | | | | 1.04 | | | | 0.43 | | | | — | | | | — | | | | 0.43 | | | | 10.34 | | | | 10.91 | | | | 0.45 | | | | 0.34 | | | | 0.34 | | | | 3.53 | | | | 1,752 | | | | 88 | |
12-31-09 | | | 9.06 | | | | 0.43 | · | | | 1.02 | | | | 1.45 | | | | 0.78 | | | | — | | | | — | | | | 0.78 | | | | 9.73 | | | | 17.79 | | | | 0.45 | | | | 0.35 | | | | 0.35 | | | | 4.89 | | | | 1,631 | | | | 56 | |
12-31-08 | | | 13.44 | | | | 0.39 | | | | (3.29 | ) | | | (2.90 | ) | | | 0.49 | | | | 0.99 | | | | — | | | | 1.48 | | | | 9.06 | | | | (23.92 | ) | | | 0.64 | | | | 0.52 | † | | | 0.52 | † | | | 3.89 | † | | | 1,368 | | | | 277 | |
12-31-07 | | | 13.50 | | | | 0.42 | · | | | 0.29 | | | | 0.71 | | | | 0.43 | | | | 0.34 | | | | — | | | | 0.77 | | | | 13.44 | | | | 5.53 | | | | 0.98 | | | | 0.90 | † | | | 0.90 | † | | | 3.18 | † | | | 1,529 | | | | 422 | |
12-31-06 | | | 13.25 | | | | 0.39 | · | | | 0.64 | | | | 1.03 | | | | 0.35 | | | | 0.43 | | | | — | | | | 0.78 | | | | 13.50 | | | | 8.13 | | | | 0.97 | | | | 0.90 | | | | 0.90 | | | | 3.00 | | | | 717 | | | | 335 | |
| | | | | | | | | | | | | | | | |
| ING Strategic Allocation Growth Portfolio | | | | | | | | | | | | | | | | | | | | | | | | | | | | | | | | | | | | | | | | | | | | | | | | | | | | | | | | | | | | | | | | |
Class I | | | | | | | | | | | | | | | | | | | | | | | | | | | | | | | | | | | | | | | | | | | | | | | | | | | | | | | | | | | | | | | | |
12-31-10 | | | 9.39 | | | | 0.23 | · | | | 0.97 | | | | 1.20 | | | | 0.35 | | | | — | | | | — | | | | 0.35 | | | | 10.24 | | | | 13.06 | | | | 0.19 | | | | 0.09 | | | | 0.09 | | | | 2.47 | | | | 171,094 | | | | 36 | |
12-31-09 | | | 9.04 | | | | 0.37 | | | | 1.48 | | | | 1.85 | | | | 0.97 | | | | 0.53 | | | | — | | | | 1.50 | | | | 9.39 | | | | 25.37 | | | | 0.20 | | | | 0.13 | | | | 0.13 | | | | 4.12 | | | | 168,071 | | | | 75 | |
12-31-08 | | | 16.57 | | | | 0.38 | | | | (5.65 | ) | | | (5.27 | ) | | | 0.33 | | | | 1.93 | | | | — | | | | 2.26 | | | | 9.04 | | | | (36.13 | ) | | | 0.39 | | | | 0.33 | † | | | 0.33 | † | | | 2.83 | † | | | 146,862 | | | | 235 | |
12-31-07 | | | 17.06 | | | | 0.30 | · | | | 0.52 | | | | 0.82 | | | | 0.30 | | | | 1.01 | | | | — | | | | 1.31 | | | | 16.57 | | | | 5.04 | | | | 0.71 | | | | 0.71 | † | | | 0.71 | † | | | 1.79 | † | | | 269,587 | | | | 240 | |
12-31-06 | | | 15.48 | | | | 0.28 | · | | | 1.73 | | | | 2.01 | | | | 0.22 | | | | 0.21 | | | | — | | | | 0.43 | | | | 17.06 | | | | 13.19 | | | | 0.71 | | | | 0.71 | | | | 0.71 | | | | 1.77 | | | | 298,451 | | | | 233 | |
Class S | | | | | | | | | | | | | | | | | | | | | | | | | | | | | | | | | | | | | | | | | | | | | | | | | | | | | | | | | | | | | | | | |
12-31-10 | | | 9.32 | | | | 0.21 | · | | | 0.96 | | | | 1.17 | | | | 0.33 | | | | — | | | | — | | | | 0.33 | | | | 10.16 | | | | 12.81 | | | | 0.44 | | | | 0.34 | | | | 0.34 | | | | 2.22 | | | | 1,753 | | | | 36 | |
12-31-09 | | | 8.99 | | | | 0.32 | · | | | 1.49 | | | | 1.81 | | | | 0.95 | | | | 0.53 | | | | — | | | | 1.48 | | | | 9.32 | | | | 24.90 | | | | 0.45 | | | | 0.38 | | | | 0.38 | | | | 3.88 | | | | 1,715 | | | | 75 | |
12-31-08 | | | 16.49 | | | | 0.32 | · | | | (5.57 | ) | | | (5.25 | ) | | | 0.32 | | | | 1.93 | | | | — | | | | 2.25 | | | | 8.99 | | | | (36.19 | ) | | | 0.64 | | | | 0.58 | † | | | 0.58 | † | | | 2.72 | † | | | 1,322 | | | | 235 | |
12-31-07 | | | 17.00 | | | | 0.26 | · | | | 0.52 | | | | 0.78 | | | | 0.28 | | | | 1.01 | | | | — | | | | 1.29 | | | | 16.49 | | | | 4.77 | | | | 0.96 | | | | 0.96 | † | | | 0.96 | † | | | 1.55 | † | | | 725 | | | | 240 | |
12-31-06 | | | 15.46 | | | | 0.23 | · | | | 1.73 | | | | 1.96 | | | | 0.21 | | | | 0.21 | | | | — | | | | 0.42 | | | | 17.00 | | | | 12.91 | | | | 0.96 | | | | 0.96 | | | | 0.96 | | | | 1.47 | | | | 308 | | | | 233 | |
| ING Strategic Allocation Moderate Portfolio | | | | | | | | | | | | | | | | | | | | | | | | | | | | | | | | | | | | | | | | | | | | | | | | | | | | | | | | | | | | | | | | |
Class I | | | | | | | | | | | | | | | | | | | | | | | | | | | | | | | | | | | | | | | | | | | | | | | | | | | | | | | | | | | | | | | | |
12-31-10 | | | 9.58 | | | | 0.30 | · | | | 0.83 | | | | 1.13 | | | | 0.40 | | | | — | | | | — | | | | 0.40 | | | | 10.31 | | | | 12.03 | | | | 0.19 | | | | 0.10 | | | | 0.10 | | | | 3.15 | | | | 164,412 | | | | 60 | |
12-31-09 | | | 9.10 | | | | 0.39 | · | | | 1.30 | | | | 1.69 | | | | 0.91 | | | | 0.30 | | | | — | | | | 1.21 | | | | 9.58 | | | | 21.84 | | | | 0.21 | | | | 0.13 | | | | 0.13 | | | | 4.47 | | | | 166,449 | | | | 62 | |
12-31-08 | | | 15.16 | | | | 0.44 | | | | (4.54 | ) | | | (4.10 | ) | | | 0.40 | | | | 1.56 | | | | — | | | | 1.96 | | | | 9.10 | | | | (30.48 | ) | | | 0.38 | | | | 0.31 | † | | | 0.31 | † | | | 3.35 | † | | | 152,965 | | | | 255 | |
12-31-07 | | | 15.32 | | | | 0.36 | · | | | 0.44 | | | | 0.80 | | | | 0.36 | | | | 0.60 | | | | — | | | | 0.96 | | | | 15.16 | | | | 5.48 | | | | 0.72 | | | | 0.70 | † | | | 0.70 | † | | | 2.36 | † | | | 263,759 | | | | 302 | |
12-31-06 | | | 14.35 | | | | 0.33 | · | | | 1.23 | | | | 1.56 | | | | 0.27 | | | | 0.32 | | | | — | | | | 0.59 | | | | 15.32 | | | | 11.17 | | | | 0.71 | | | | 0.70 | | | | 0.70 | | | | 2.26 | | | | 298,715 | | | | 258 | |
See Accompanying Notes to Financial Statements
15
FINANCIAL HIGHLIGHTS (CONTINUED)
Selected data for a share of beneficial interest outstanding throughout each year or period.
| | | | | | | | | | | | | | | | | | | | | | | | | | | | | | | | | | | | | | | | | | | | | | | | | | | | | | | | | | | | | | | | |
| | | | | | Income (loss)
from
investment
operations | | | | | | Less distributions | | | | | | | | | | | | Ratios to average net assets | | | Supplemental
data | |
| | | | | | | | | | | | | | | | | | | | | | | | | | | | | | | | | | | | | | | | | | | | | | | | | |
| | | Net asset value, beginning of year or period | | | Net investment income (loss) | | | Net realized and unrealized gain (loss) | | | Total from investment operations | | | From net investment income | | | From net realized gains | | | From return of capital | | | Total distributions | | | Net asset value, end of year or period | | | Total Return (1) | | | Expenses before reductions/ additions(2)(3)(4) | | | Expenses net of fee waivers and/or recoupments, if any(2)(3)(4) | | | Expenses net of all reductions/ additions(2)(3)(4) | | | Net investment income (loss)(2)(3)(4) | | | Net assets, end of year or period | | | Portfolio turnover rate | |
| | | | | | | | | | | | | | | | | | | | | | | | | | | | | | | | | | | | | | | | | | | | | | | | | | | | | | | | | | | | | | | | |
Year or period ended | | ($) | | | ($) | | | ($) | | | ($) | | | ($) | | | ($) | | | ($) | | | ($) | | | ($) | | | (%) | | | (%) | | | (%) | | | (%) | | | (%) | | | ($000's) | | | (%) | |
| ING Strategic Allocation Moderate Portfolio (Continued) | | | | | | | | | | | | | | | | | | | | | | | | | | | | | | | | | | | | | | | | | | | | | | | | | | | | | | | | | | | | | | | | |
Class S | | | | | | | | | | | | | | | | | | | | | | | | | | | | | | | | | | | | | | | | | | | | | | | | | | | | | | | | | | | | | | | | |
12-31-10 | | | 9.53 | | | | 0.27 | | | | 0.83 | | | | 1.10 | | | | 0.38 | | | | — | | | | — | | | | 0.38 | | | | 10.25 | | | | 11.77 | | | | 0.44 | | | | 0.35 | | | | 0.35 | | | | 2.92 | | | | 2,874 | | | | 60 | |
12-31-09 | | | 9.05 | | | | 0.38 | | | | 1.28 | | | | 1.66 | | | | 0.88 | | | | 0.30 | | | | — | | | | 1.18 | | | | 9.53 | | | | 21.60 | | | | 0.46 | | | | 0.38 | | | | 0.38 | | | | 4.34 | | | | 2,703 | | | | 62 | |
12-31-08 | | | 15.10 | | | | 0.37 | · | | | (4.48 | ) | | | (4.11 | ) | | | 0.38 | | | | 1.56 | | | | — | | | | 1.94 | | | | 9.05 | | | | (30.68 | ) | | | 0.63 | | | | 0.56 | † | | | 0.56 | † | | | 3.30 | † | | | 2,192 | | | | 255 | |
12-31-07 | | | 15.27 | | | | 0.32 | · | | | 0.44 | | | | 0.76 | | | | 0.33 | | | | 0.60 | | | | — | | | | 0.93 | | | | 15.10 | | | | 5.25 | | | | 0.97 | | | | 0.95 | † | | | 0.95 | † | | | 2.11 | † | | | 1,192 | | | | 302 | |
12-31-06 | | | 14.34 | | | | 0.29 | · | | | 1.22 | | | | 1.51 | | | | 0.26 | | | | 0.32 | | | | — | | | | 0.58 | | | | 15.27 | | | | 10.80 | | | | 0.96 | | | | 0.95 | | | | 0.95 | | | | 2.00 | | | | 693 | | | | 258 | |
| (1) | | Total return is calculated assuming reinvestment of all dividends, capital gain distributions and return of capital, if any, at net asset value and does not reflect the effect of insurance contract charges. Total return for periods less than one year is not annualized. |
| (2) | | Annualized for periods less than one year. |
| (3) | | Expense ratios do not include expenses of underlying funds and do not include fees and expenses charged under the variable annuity contract or life insurance policy. |
| (4) | | Expense ratios reflect operating expenses of a Portfolio. Expenses before reductions/additions do not reflect amounts reimbursed by the Investment Adviser and/or the Distributor or reductions from brokerage commission recapture arrangements or other expense offset arrangements and do not represent the amount paid by a Portfolio during periods when reimbursements or reductions occur. Expenses net of fee waivers reflect expenses after reimbursement by the Investment Adviser and/or Distributor but prior to reductions from brokerage commission recapture arrangements or other expense offset arrangements. Expenses net of all reductions/additions represent the net expenses paid by a Portfolio. Net investment income (loss) is net of all such additions or reductions. |
| · | | Calculated using average number of shares outstanding throughout the period. |
| † | | Impact of waiving the advisory fee for the ING Institutional Prime Money Market Fund holding has less than 0.005% impact on the expense ratio and net investment income ratio. |
See Accompanying Notes to Financial Statements
16
NOTES TO FINANCIAL STATEMENTSASOF DECEMBER 31, 2010
NOTE 1 — ORGANIZATION
Organization. ING Strategic Allocation Portfolios, Inc. (the “Company”) is registered under the Investment Company Act of 1940, as amended (“1940 Act”), as an open-end management investment company.
The Company was incorporated under the laws of Maryland on October 14, 1994. There are three separate investment series (each a “Portfolio”, collectively the “Portfolios”) that comprise the Company: ING Strategic Allocation Conservative Portfolio (“Strategic Allocation Conservative”), ING Strategic Allocation Growth Portfolio (“Strategic Allocation Growth”), and ING Strategic Allocation Moderate Portfolio (“Strategic Allocation Moderate”). Each Portfolio currently seeks to achieve its investment objective by investing in other ING Funds (“Underlying Funds”) and each uses asset allocation strategies to determine how to invest in the Underlying Funds. The Underlying Funds, in turn, invest in equity and fixed-income securities and money market instruments.
Each Portfolio offers Class I and Class S shares. Each class has equal rights as to class and voting privileges. The two classes differ principally in the applicable distribution and service fees. Shareholders of each class also bear certain expenses that pertain to that particular class. All shareholders bear the common expenses of the Portfolios and earn income and realized gains/losses from a Portfolio pro rata based on the average daily net assets of each class, without distinction between share classes. Expenses that are specific to a Portfolio or a class are charged directly to that Portfolio or class. Other operating expenses shared by several Portfolios are generally allocated among those Portfolios based on average net assets. Dividends are determined separately for each class based on income and expenses allocable to each class. Realized gain distributions are allocated to each class pro rata based on the shares outstanding of each class on the date of distribution. Differences in per share dividend rates generally result from differences in separate class expenses, including distribution and shareholder service fees, if applicable.
Shares of the Portfolios may be offered to separate accounts of insurance companies as investment options under variable annuity contracts and variable life insurance policies (“Variable Contracts”). Shares may also be offered to qualified pension and retirement plans outside the Variable Contract and to certain investment advisers and their affiliates.
Participating insurance companies and other designated organizations are authorized to receive purchase orders on each Portfolio’s behalf.
ING Investments, LLC serves as the investment adviser (“ING Investments” or the “Investment Adviser”) to the Portfolios. ING Investment Management Co. serves as the Sub-Adviser (“ING IIM” or the “Sub-Adviser”) to the Portfolios. ING Funds Services, LLC serves as the administrator (“IFS” or the “Administrator”) for the Portfolios. ING Investments Distributor, LLC (“IID” or the “Distributor”) serves as the principal underwriter to the Portfolios.
The Investment Adviser, the Sub-Adviser, IFS and IID are indirect, wholly-owned subsidiaries of ING Groep N.V. (“ING Groep”). ING Groep is a global financial institution of Dutch origin offering banking, investments, life insurance and retirement services.
ING Groep has adopted a formal restructuring plan that was approved by the European Commission in November 2009 under which the ING life insurance businesses, including the retirement services and investment management businesses, which include the Investment Adviser and its affiliates, would be divested by ING Groep by the end of 2013. While there can be no assurance that it will be carried out, the restructuring plan presents certain risks, including uncertainty about the effect on the businesses of the ING entities that service the Portfolios and potential termination of the Portfolios’ existing advisory agreement, which may trigger the need for shareholder approval of new agreements.
NOTE 2 — SIGNIFICANT ACCOUNTING POLICIES
The following significant accounting policies are consistently followed by the Portfolios in the preparation of their financial statements. Such policies are in conformity with U.S. generally accepted accounting principles for investment companies.
A. Security Valuation. All investments in Underlying Funds are recorded at their estimated fair value, as described below. The valuations of the Portfolios’ investments in Underlying Funds are based on the net asset value of the Underlying Funds each business day.
Fair value is defined as the price that a Portfolio would receive to sell an asset or pay to transfer a liability in an orderly transaction between market participants at the measurement date. Each investment asset or liability of a Portfolio is assigned a level at measurement date based on the
17
NOTES TO FINANCIAL STATEMENTSASOF DECEMBER 31, 2010 (CONTINUED)
NOTE 2 — SIGNIFICANT ACCOUNTING POLICIES (continued)
significance and source of the inputs to its valuation. Quoted prices in active markets for identical securities are classified as “Level 1,” inputs other than quoted prices for an asset or liability that are observable are classified as “Level 2” and unobservable inputs, including the sub-adviser’s judgment about the assumptions that a market participant would use in pricing an asset or liability are classified as “Level 3.” The inputs used for valuing securities are not necessarily an indication of the risks associated with investing in those securities. Short-term securities of sufficient credit quality which are valued at amortized cost, which approximates fair value, are generally considered to be Level 2 securities under applicable accounting rules. A table summarizing each Portfolio’s investments under these levels of classification is included following the Portfolio of Investments.
For the year ended December 31, 2010, there have been no significant changes to the fair valuation methodologies.
The Portfolios classify each of their investments in the Underlying Funds as Level 1, without consideration as to the classification level of the specific investments held by the Underlying Funds.
B. Security Transactions and Revenue Recognition. Security transactions are accounted for on trade date. Dividend income received from the affiliated funds is recognized on the ex-dividend date and is recorded as income distributions in the Statement of Operations. Capital gain distributions received from the affiliated funds are recognized on ex-dividend date and are recorded on the Statement of Operations as such. Costs used in determining realized gains and losses on the sales of investment securities are on the basis of specific identification.
C. Distributions to Shareholders. The Portfolios record distributions to their shareholders on the ex-dividend date. Dividends from net investment income and capital gains, if any, are declared and paid annually by the Portfolios. The Portfolios may make distributions on a more frequent basis to comply with the distribution requirements of the Internal Revenue Code. The characteristics of income and gains to be distributed are determined in accordance with income tax regulations, which may differ from U.S. generally accepted accounting principles for investment companies.
D. Federal Income Taxes. It is the policy of each Portfolio to comply with subchapter M of the Internal Revenue Code and related excise tax provisions applicable to regulated investment companies and to distribute substantially all of its net investment income and any net realized capital gains to their shareholders. Management has considered the sustainability of the Portfolios’ tax positions taken on federal income tax returns for all open tax years in making this determination. Therefore, no federal income tax provision is required. No capital gain distributions shall be made until any capital loss carryforwards have been fully utilized or expired.
E. Use of Estimates. The preparation of financial statements in conformity with U.S. generally accepted accounting principles requires management to make estimates and assumptions that affect the reported amounts of assets and liabilities and disclosure of contingent assets and liabilities at the date of the financial statements and the reported amounts of increases and decreases in net assets from operations during the reporting period. Actual results could differ from those estimates.
F. Indemnifications. In the normal course of business, the Company may enter into contracts that provide certain indemnifications. The Company’s maximum exposure under these arrangements is dependent on future claims that may be made against the Portfolios and, therefore, cannot be estimated; however, based on experience, management considers the risk of loss from such claims remote.
NOTE 3 — INVESTMENT TRANSACTIONS
For the year ended December 31, 2010, the cost of purchases and the proceeds from the sales of the Underlying Funds, were as follows:
| | | | | | | | |
| | | Purchases | | | Sales | |
Strategic Allocation Conservative | | $ | 78,595,385 | | | $ | 83,772,260 | |
Strategic Allocation Growth | | | 57,808,068 | | | | 67,729,502 | |
Strategic Allocation Moderate | | | 95,551,293 | | | | 105,692,620 | |
NOTE 4 — INVESTMENT MANAGEMENT AND ADMINISTRATIVE FEES
The Portfolios entered into an investment management agreement (“Investment Management Agreement”) with the Investment Adviser.
During periods when each Portfolio invests all, or substantially all of its assets in another investment company, the Investment Management Agreement compensates the Investment Adviser with a fee of 0.08%, computed daily and payable monthly, based on the average daily net assets of each Portfolio.
18
NOTES TO FINANCIAL STATEMENTSASOF DECEMBER 31, 2010 (CONTINUED)
NOTE 4 — INVESTMENT MANAGEMENT AND ADMINISTRATIVE FEES (continued)
During periods when the Portfolios invest directly in investment securities, each Portfolio pays the Investment Adviser a fee of 0.60%, computed daily and payable monthly, based on the amount of average daily net assets of each Portfolio invested in such direct investment.
The Investment Adviser entered into a sub-advisory agreement with ING IM. Subject to such policies as the Board or the Investment Adviser may determine, ING IM manages the Portfolios’ assets in accordance with the Portfolios’ investment objectives, policies, and limitations.
Pursuant to the Administration Agreement, IFS acts as administrator and provides certain administrative and shareholder services necessary for Portfolio operations and is responsible for the supervision of other service providers. IFS is entitled to receive from each Portfolio a fee at an annual rate of 0.055% on the first $5 billion of daily net assets and 0.03% thereafter.
NOTE 5 — DISTRIBUTION AND SERVICE FEES
Class S shares of the Portfolios have adopted a Distribution Plan pursuant to Rule 12b-1 under the 1940 Act (the “12b-1 Plans”), whereby the Distributor is compensated by each Portfolio for expenses incurred in the distribution of each Portfolio’s Class S shares. Pursuant to the 12b-1 Plans, the Distributor is entitled to a payment each month to compensate for expenses incurred in the distribution and promotion of each Portfolio’s S shares, including expenses incurred in printing prospectuses and reports used for sales purposes, expenses incurred in preparing and printing sales literature and other such distribution related expenses, including any distribution or shareholder servicing fees paid to securities dealers who have executed a distribution agreement with the Distributor. Under the 12b-1 Plans, Class S shares of the Portfolios pay the Distributor a fee calculated at an annual rate of 0.25% of average daily net assets.
NOTE 6 — OTHER TRANSACTIONS WITH AFFILIATED AND RELATED PARTIES
At December 31, 2010, the Portfolios had the following amounts recorded as payable to affiliates on the
accompanying Statements of Assets and Liabilities (see Notes 4 and 5):
| | | | | | | | | | | | | | | | |
Portfolio | | Accrued Investment Management Fees | | | Accrued Administrative Fees | | | Accrued Shareholder Service and Distribution Fees | | | Total | |
Strategic Allocation Conservative | | $ | 6,240 | | | $ | 4,290 | | | $ | 369 | | | $ | 10,899 | |
Strategic Allocation Growth | | | 11,681 | | | | 8,030 | | | | 368 | | | | 20,079 | |
Strategic Allocation Moderate | | | 11,313 | | | | 7,778 | | | | 606 | | | | 19,697 | |
At December 31, 2010, the following wholly-owned subsidiaries of ING Groep owned more than 5% of the following Portfolios:
| | | | | | |
Subsidiary | | Portfolio | | Percentage | |
ING Life Insurance and Annuity Company | | Strategic Allocation Conservative | | | 92.87 | % |
| | Strategic Allocation Growth | | | 94.26 | % |
| | Strategic Allocation Moderate | | | 92.59 | % |
Reliaster Life Insurance Company | | Strategic Allocation Moderate | | | 5.06 | % |
Control is defined by the 1940 Act as the beneficial ownership, either directly or through one or more controlled companies, of more than 25% of the voting securities of a company. The 1940 Act defines affiliates as companies that are under common control. Therefore, because the Portfolios have a common owner that owns over 25% of the outstanding securities of the Portfolios, they may be deemed to be affiliates of each other. Investment activities of these shareholders could have a material impact on the Portfolios.
The Company has adopted a Deferred Compensation Plan (“Policy”), which allows eligible non-affiliated directors as described in the Policy to defer the receipt of all or a portion of the directors’ fees payable. Amounts deferred are treated as though invested in various “notional” funds advised by ING Investments until distribution in accordance with the Policy.
NOTE 7 — OTHER ACCRUED EXPENSES & LIABILITIES
At December 31, 2010, the following Portfolios had the below payables included in Other Accrued Expenses and Liabilities on the Statement of Assets and Liabilities that exceeded 5% of total liabilities:
| | | | | | |
Portfolio | | Accrued
Expenses | | Amount | |
Strategic Allocation Conservative | | Audit | | $ | 12,371 | |
| | Postage | | | 16,472 | |
19
NOTES TO FINANCIAL STATEMENTSASOF DECEMBER 31, 2010 (CONTINUED)
NOTE 8 — EXPENSE LIMITATION AGREEMENTS
ING Investments entered into written expense limitation agreements (“Expense Limitation Agreements”) with each of the Portfolios whereby the Investment Adviser has agreed to limit expenses, excluding interest, taxes, brokerage commissions and extraordinary expenses to the levels listed below:
| | | | | | | | |
Portfolio(1) | | Class I | | | Class S | |
Strategic Allocation Conservative | | | 0.65 | % | | | 0.90 | % |
Strategic Allocation Growth(2) | | | 0.75 | % | | | 1.00 | % |
Strategic Allocation Moderate | | | 0.70 | % | | | 0.95 | % |
| (1) | These operating expense limits take into account operating expenses incurred at the underlying fund level. The amount of fees and expenses of an Underlying Fund borne by each Portfolio will vary based on each Portfolio’s allocation of assets to, and the net expenses of, a particular Underlying Fund. |
| (2) | The side expense limits for the Portfolio are 0.71% and 0.96% for Classes I and S, respectively through April 4, 2011. |
The Investment Adviser may at a later date recoup from a Portfolio for management fees waived and other expenses assumed by the Investment Adviser during the previous 36 months, but only if, after such recoupment, the Portfolio’s expense ratio does not exceed the percentage described above. Waived and reimbursed
fees and any recoupment by the Investment Adviser of such waived and reimbursed fees are reflected on the accompanying Statements of Operations for each Portfolio. Amounts payable by the Investment Adviser are reflected on the accompanying Statements of Assets and Liabilities for each Portfolio.
As of December 31, 2010, the amounts of waived and reimbursed fees that are subject to possible recoupment by the Investment Adviser, and the related expiration dates are as follows:
| | | | | | | | | | | | | | | | |
| | | December 31, | | | Total | |
Portfolio | | 2011 | | | 2012 | | | 2013 | | |
Strategic Allocation Conservative | | $ | 129,459 | | | $ | 87,726 | | | $ | 104,529 | | | $ | 321,714 | |
Strategic Allocation Growth | | | 106,927 | | | | 104,243 | | | | 170,403 | | | | 381,573 | |
Strategic Allocation Moderate | | | 142,971 | | | | 117,421 | | | | 148,725 | | | | 409,117 | |
The Expense Limitation Agreements are contractual and shall renew automatically for one-year terms unless ING Investments provides written notice of the termination of an Expense Limitation Agreement within 90 days of the end of the then current term.
NOTE 9 — CAPITAL SHARES
Transactions in capital shares and dollars were as follows:
| | | | | | | | | | | | | | | | | | | | | | | | | | | | | | | | | | | | |
| | | Shares
sold | | | Reinvestment
of
distributions | | | Shares
redeemed | | | Net increase
(decrease) in
shares
outstanding | | | | | | Shares sold | | | Reinvestment
of
distributions | | | Shares
redeemed | | | Net increase
(decrease) | |
Year or period ended | | # | | | # | | | # | | | # | | | | | | ($) | | | ($) | | | ($) | | | ($) | |
Strategic Allocation Conservative | | | | | | | | | | | | | | | | | | | | | | | | | | | | | |
Class ADV(1) | | | | | | | | | | | | | | | | | | | | | | | | | | | | | | | | | | | | |
12-31-10 | | | — | | | | — | | | | (74 | ) | | | (74 | ) | | | | | | | — | | | | — | | | | (751 | ) | | | (751 | ) |
12-31-09 | | | — | | | | — | | | | (1 | ) | | | (1 | ) | | | | | | | — | | | | — | | | | (10 | ) | | | (10 | ) |
Class I | | | | | | | | | | | | | | | | | | | | | | | | | | | | | | | | | | | | |
12-31-10 | | | 1,074,341 | | | | 433,223 | | | | (2,426,569 | ) | | | (919,005 | ) | | | | | | | 10,576,222 | | | | 4,262,914 | | | | (23,895,014 | ) | | | (9,055,878 | ) |
12-31-09 | | | 852,622 | | | | 888,742 | | | | (1,617,628 | ) | | | 123,736 | | | | | | | | 7,722,421 | | | | 7,207,695 | | | | (14,316,172 | ) | | | 613,944 | |
Class S | | | | | | | | | | | | | | | | | | | | | | | | | | | | | | | | | | | | |
12-31-10 | | | 19,421 | | | | 7,549 | | | | (25,132 | ) | | | 1,838 | | | | | | | | 192,169 | | | | 73,828 | | | | (251,444 | ) | | | 14,553 | |
12-31-09 | | | 29,074 | | | | 15,057 | | | | (27,514 | ) | | | 16,617 | | | | | | | | 255,738 | | | | 121,212 | | | | (240,953 | ) | | | 135,997 | |
Strategic Allocation Growth | | | | | | | | | | | | | | | | | | | | | | | | | | | | | |
Class ADV(1) | | | | | | | | | | | | | | | | | | | | | | | | | | | | | | | | | | | | |
12-31-10 | | | — | | | | — | | | | (59 | ) | | | (59 | ) | | | | | | | — | | | | — | | | | (581 | ) | | | (581 | ) |
12-31-09 | | | — | | | | — | | | | — | | | | — | | | | | | | | — | | | | — | | | | — | | | | — | |
Class I | | | | | | | | | | | | | | | | | | | | | | | | | | | | | | | | | | | | |
12-31-10 | | | 597,463 | | | | 640,755 | | | | (2,434,925 | ) | | | (1,196,707 | ) | | | | | | | 5,618,197 | | | | 6,132,027 | | | | (22,904,041 | ) | | | (11,153,817 | ) |
12-31-09 | | | 1,042,845 | | | | 3,264,104 | | | | (2,649,175 | ) | | | 1,657,774 | | | | | | | | 8,687,720 | | | | 23,762,674 | | | | (22,554,739 | ) | | | 9,895,655 | |
Class S | | | | | | | | | | | | | | | | | | | | | | | | | | | | | | | | | | | | |
12-31-10 | | | 10,647 | | | | 6,083 | | | | (28,218 | ) | | | (11,488 | ) | | | | | | | 98,892 | | | | 57,848 | | | | (256,353 | ) | | | (99,613 | ) |
12-31-09 | | | 27,442 | | | | 30,652 | | | | (21,168 | ) | | | 36,926 | | | | | | | | 224,203 | | | | 221,924 | | | | (167,575 | ) | | | 278,552 | |
| (1) | | Class ADV liquidated on April 6, 2010. |
20
NOTES TO FINANCIAL STATEMENTSASOF DECEMBER 31, 2010 (CONTINUED)
NOTE 9 — CAPITAL SHARES (continued)
| | | | | | | | | | | | | | | | | | | | | | | | | | | | | | | | | | | | |
| | | Shares
sold | | | Reinvestment
of
distributions | | | Shares
redeemed | | | Net increase
(decrease) in
shares
outstanding | | | | | | Shares sold | | | Reinvestment
of
distributions | | | Shares
redeemed | | | Net increase
(decrease) | |
Year or period ended | | # | | | # | | | # | | | # | | | | | | ($) | | | ($) | | | ($) | | | ($) | |
Strategic Allocation Moderate | | | | | | | | | | | | | | | | | | | | | | | | | | | | | |
Class ADV(1) | | | | | | | | | | | | | | | | | | | | | | | | | | | | | |
12-31-10 | | | — | | | | — | | | | (65 | ) | | | (65 | ) | | | | | | | — | | | | — | | | | (654 | ) | | | (654 | ) |
12-31-09 | | | — | | | | — | | | | (1 | ) | | | (1 | ) | | | | | | | — | | | | — | | | | (11 | ) | | | (11 | ) |
Class I | | | | | | | | | | | | | | | | | | | | | | | | | | | | | | | | | | | | |
12-31-10 | | | 721,651 | | | | 692,576 | | | | (2,833,775 | ) | | | (1,419,548 | ) | | | | | | | 6,991,461 | | | | 6,704,131 | | | | (27,271,366 | ) | | | (13,575,774 | ) |
12-31-09 | | | 1,170,739 | | | | 2,478,819 | | | | (3,099,864 | ) | | | 549,694 | | | | | | | | 10,150,538 | | | | 18,987,756 | | | | (26,669,245 | ) | | | 2,469,049 | |
Class S | | | | | | | | | | | | | | | | | | | | | | | | | | | | | | | | | | | | |
12-31-10 | | | 38,744 | | | | 11,666 | | | | (53,467 | ) | | | (3,057 | ) | | | | | | | 374,573 | | | | 112,464 | | | | (512,996 | ) | | | (25,959 | ) |
12-31-09 | | | 33,696 | | | | 36,275 | | | | (28,604 | ) | | | 41,367 | | | | | | | | 287,870 | | | | 276,778 | | | | (233,507 | ) | | | 331,141 | |
| (1) | | Class ADV liquidated on April 6, 2010. |
NOTE 10 — LINE OF CREDIT
Effective December 15, 2010, the Portfolios, in addition to certain other funds managed by the Investment Adviser, have entered into an unsecured committed revolving line of credit agreement (the “Credit Agreement”) with The Bank of New York Mellon for an aggregate amount of $100,000,000. The proceeds may be used to: (1) temporarily finance the purchase or sale of securities; or (2) finance the redemption of shares of an investor in the funds. The funds to which the line of credit is available pay a commitment fee equal to 0.10% per annum on the daily unused portion of the committed line amount.
Generally, borrowings under the Credit Agreement accrue interest at the federal funds rate plus a specified margin. Repayments generally must be made within 60 days after the date of a revolving credit advance. The Portfolios did not utilize the line of credit during the year ended December 31, 2010.
NOTE 11 — CONCENTRATION OF INVESTMENT RISK
All mutual funds involve risk — some more than others — and there is always the chance that you could lose money or not earn as much as you hope. A Portfolio’s risk profile is largely a factor of the principal securities in which it invests and investment techniques that it uses. For more information regarding the types of securities and investment techniques that may be used by the Portfolios and their corresponding risks, see the Portfolios’ most recent Prospectus and/or the Statement of Additional Information.
The Portfolios are also affected by other kinds of risks, depending on the types of securities held or strategies used by an Underlying Fund.
Asset Allocation. Assets will be allocated among Underlying Funds and markets based on judgements by the Adviser or Sub-Adviser. There is a risk that the Portfolios may allocate assets to an Underlying Fund or market that under performs other funds or asset classes.
Foreign Securities. Investments in foreign securities may entail risks not present in domestic investments. Since securities in which an Underlying Fund may invest are denominated in foreign currencies, changes in the relationship of these foreign currencies to the U.S. dollar can significantly affect the value of the investments and earnings of the Underlying Funds. Foreign investments may also subject the Underlying Funds to foreign government exchange restrictions, expropriation, taxation or other political, social or economic developments, as well as changes vis-à-vis the U.S. dollar from movements in currency, and changes in security value and interest rate, all of which could affect the market and/or credit risk of the Underlying Funds’ investments.
Emerging Markets Investments. Certain Underlying Funds may invest in emerging markets. Because of less developed markets and economies and, in some countries, less mature governments and governmental institutions, the risks of investing in foreign securities can be intensified in the case of investments in issuers domiciled or doing substantial business in countries with an emerging securities market. These risks include: high concentration of market capitalization and trading volume in a small number of issuers representing a limited number of industries, as well as a
21
NOTES TO FINANCIAL STATEMENTSASOF DECEMBER 31, 2010 (CONTINUED)
NOTE 11 — CONCENTRATION OF INVESTMENT RISK (continued)
high concentration of investors and financial intermediaries; political and social uncertainties; over-dependence on exports, especially with respect to primary commodities, making these economies vulnerable to changes in commodity prices; overburdened infrastructure and obsolete or unseasoned financial systems; environmental problems; less developed legal systems; and less reliable custodial services and settlement practices.
NOTE 12 — FEDERAL INCOME TAXES
The amount of distributions from net investment income and net realized capital gains are determined in accordance with federal income tax regulations, which may differ from U.S. generally accepted accounting principles for investment companies. These book/tax differences may be either temporary or permanent. Permanent differences are reclassified within the capital accounts based on their federal tax-basis treatment; temporary differences are not reclassified. Key differences include the treatment of short-term capital gains, foreign currency transactions, and wash sale deferrals. Distributions in excess of net investment income and/or net realized capital gains for tax purposes are reported as return of capital.
The following permanent tax differences have been reclassified as of December 31, 2010:
| | | | | | | | |
| | | Undistributed Net
Investment Income | | | Accumulated Net Realized Gains / (Losses) | |
Strategic Allocation Conservative | | $ | 33,083 | | | $ | (33,083 | ) |
Strategic Allocation Growth | | | 78,882 | | | | (78,882 | ) |
Strategic Allocation Moderate | | | 70,485 | | | | (70,485 | ) |
Dividends paid by the Portfolios from net investment income and distributions of net realized short-term capital gains are, for federal income tax purposes, taxable as ordinary income to shareholders.
The tax composition of dividends and distributions to shareholders was as follows:
| | | | | | | | | | | | |
| | | Year Ended
December 31, 2010
Ordinary Income | | | Year Ended December 31, 2009 | |
| | | | Ordinary
Income | | | Long-Term Capital Gains | |
Strategic Allocation Conservative | | $ | 4,336,742 | | | $ | 7,328,963 | | | $ | — | |
Strategic Allocation Growth | | | 6,189,875 | | | | 15,499,554 | | | | 8,485,130 | |
Strategic Allocation Moderate | | | 6,816,595 | | | | 14,471,197 | | | | 4,793,412 | |
The tax-basis components of distributable earnings and the expiration dates of the capital loss carryforwards which may be used to offset future realized capital
gains for federal income tax purposes as of December 31, 2010 were:
| | | | | | | | | | | | | | | | |
| | | Undistributed Ordinary Income | | | Unrealized Appreciation/ (Depreciation) | | | Capital Loss Carryforwards | | | Expiration Dates | |
Strategic Allocation Conservative | | $ | 3,453,724 | | | $ | (1,606,697 | ) | | $ | (710,796 | ) | | | 2016 | |
| | | | | | | | | | | (12,513,320 | ) | | | 2017 | |
| | | | | | | | | | | (970,483 | ) | | | 2018 | |
| | | | | | | | | | | | | | | | |
| | | | | | | | | | $ | (14,194,599 | ) | | | | |
| | | | | | | | | | | | | | | | |
Strategic Allocation Growth | | | 4,173,132 | | | | 4,642,475 | | | | (34,617,751 | ) | | | 2017 | |
| | | | | | | | | | | (13,221,573 | ) | | | 2018 | |
| | | | | | | | | | | | | | | | |
| | | | | | | | | | $ | (47,839,324 | ) | | | | |
| | | | | | | | | | | | | | | | |
Strategic Allocation Moderate | | | 5,273,567 | | | | (905,644 | ) | | | (30,535,699 | ) | | | 2017 | |
| | | | | | | | | | | (6,654,643 | ) | | | 2018 | |
| | | | | | | | | | | | | | | | |
| | | | | | | | | | $ | (37,190,342 | ) | | | | |
| | | | | | | | | | | | | | | | |
The Portfolios’ major tax jurisdictions are federal and Arizona. The earliest tax year that remains subject to examination by these jurisdictions is 2006.
As of December 31, 2010, no provisions for income tax would be required in the Portfolios’ financial statements as a result of tax positions taken on federal and state income tax returns for open tax years. The Portfolios’ federal and state income and federal excise tax returns for tax years for which the applicable statutes of limitations have not expired are subject to examination by the Internal Revenue Service and state department of revenue.
The Regulated Investment Company Modernization Act of 2010 (the “Act”) was enacted on December 22, 2010. The Act makes changes to several tax rules impacting the Portfolios. In general, the provisions of the Act will be effective for the Portfolios’ fiscal year ending December 31, 2011. Although the Act provides several benefits, including the unlimited carryforward of future capital losses, there may be a greater likelihood that all or a portion of each Portfolio’s pre-enactment capital loss carryforwards may expire without being utilized due to the fact that post-enactment capital losses get utilized before pre-enactment capital loss carryforwards. Relevant information regarding the impact of the Act on the Portfolios, if any, will be contained within the Federal Income Taxes section of the notes to financial statements for the fiscal year ending December 31, 2011.
NOTE 13 — SUBSEQUENT EVENTS
The Portfolios have evaluated events occurring after the Statements of Assets and Liabilities date (subsequent events) to determine whether any subsequent events necessitated adjustment to or disclosure in the financial statements. No such subsequent events were identified.
22
| | |
| ING STRATEGIC ALLOCATION CONSERVATIVE PORTFOLIO | | PORTFOLIO OF INVESTMENTS ASOF DECEMBER 31, 2010 |
| | | | | | | | | | | | |
Shares | | | | | Value | | | Percent of
Net Assets | |
| | |
| | AFFILIATED INVESTMENT COMPANIES: 100.1% | | | | | | | | |
| | 412,830 | | | ING Alternative Beta Fund - Class I | | $ | 4,578,280 | | | | 5.0 | |
| | 386,996 | | | ING Clarion Global Real Estate Portfolio - Class I | | | 3,773,211 | | | | 4.1 | |
| | 337,577 | | | ING Growth and Income Portfolio - Class I | | | 7,406,442 | | | | 8.1 | |
| | 4,164,782 | | | ING Intermediate Bond Portfolio - Class I | | | 50,268,918 | | | | 54.7 | |
| | 1,409,292 | | | ING International Index Portfolio - Class I | | | 12,035,353 | | | | 13.1 | |
| | 315,044 | | | ING MidCap Opportunities Portfolio - Class I | | | 3,682,871 | | | | 4.0 | |
| | 152,612 | | | ING Small Company Portfolio - Class I | | | 2,798,899 | | | | 3.1 | |
| | 814,711 | | | ING Tactical Asset Allocation Fund - Class I | | | 7,340,543 | | | | 8.0 | |
| | | | Total Investments in Affiliated Investment Companies | | | | | | | | |
| | | | (Cost $84,235,671)* | | $ | 91,884,517 | | | | 100.1 | |
| | | | Other Assets and Liabilities - Net | | | (46,981 | ) | | | (0.1 | ) |
| | | | | | | | | | | | |
| | | | Net Assets | | $ | 91,837,536 | | | | 100.0 | |
| | | | | | | | | | | | |
| | | | |
*Costfor federal income tax purposes is $93,491,213. | | | | |
| |
Net unrealized depreciation consists of: | | | | |
Gross Unrealized Appreciation | | $ | — | |
Gross Unrealized Depreciation | | | (1,606,696 | ) |
| | | | |
Net Unrealized Depreciation | | $ | (1,606,696 | ) |
| | | | |
Fair Value Measurements^
The following is a summary of the fair valuations according to the inputs used as of December 31, 2010 in valuing the Portfolio’s assets and liabilities:
| | | | | | | | | | | | | | | | |
| | | Quoted Prices
in Active Markets
for Identical Investments
(Level 1) | | | Other
Observable
Inputs
(Level 2) | | | Significant
Unobservable
Inputs
(Level 3) | | | Fair Value at 12/31/2010 | |
Asset Table | | | | | | | | | | | | | | | | |
Investments, at value | | | | | | | | | | | | | | | | |
Affiliated Investment Companies | | $ | 91,884,517 | | | $ | — | | | $ | — | | | $ | 91,884,517 | |
| | | | | | | | | | | | | | | | |
Total Investments, at value | | $ | 91,884,517 | | | $ | — | | | $ | — | | | $ | 91,884,517 | |
| | | | | | | | | | | | | | | | |
| ^ | See Note 2, “Significant Accounting Policies” in the Notes to Financial Statements for additional information. |
See Accompanying Notes to Financial Statements
23
| | |
| ING STRATEGIC ALLOCATION GROWTH PORTFOLIO | | PORTFOLIO OF INVESTMENTS ASOF DECEMBER 31, 2010 |
| | | | | | | | | | | | |
| Shares | | | | | Value | | | Percent of
Net Assets | |
| | |
| | AFFILIATED INVESTMENT COMPANIES: 100.0% | | | | | | | | |
| | 1,082,447 | | | ING Alternative Beta Fund - Class I | | $ | 12,004,341 | | | | 6.9 | |
| | 906,010 | | | ING Clarion Global Real Estate Portfolio - Class I | | | 8,833,601 | | | | 5.1 | |
| | 1,501,575 | | | ING Growth and Income Portfolio - Class I | | | 32,944,564 | | | | 19.1 | |
| | 2,127,335 | | | ING Intermediate Bond Portfolio - Class I | | | 25,676,937 | | | | 14.8 | |
| | 4,872,674 | | | ING International Index Portfolio - Class I | | | 41,612,632 | | | | 24.1 | |
| | 1,327,545 | | | ING MidCap Opportunities Portfolio - Class I | | | 15,519,000 | | | | 9.0 | |
| | 762,157 | | | ING Small Company Portfolio - Class I | | | 13,977,956 | | | | 8.1 | |
| | 2,479,504 | | | ING Tactical Asset Allocation Fund - Class I | | | 22,340,328 | | | | 12.9 | |
| | | | Total Investments in Affiliated Investment Companies | | | | | |
| | | | (Cost $158,550,754)* | | $ | 172,909,359 | | | | 100.0 | |
| | | | Other Assets and Liabilities - Net | | | (61,680 | ) | | | — | |
| | | | | | | | | | | | |
| | | | Net Assets | | $ | 172,847,679 | | | | 100.0 | |
| | | | | | | | | | | | |
| | | | |
*Costfor federal income tax purposes is $168,266,958. | | | | |
| |
Net unrealized appreciation consists of: | | | | |
Gross Unrealized Appreciation | | $ | 16,454,620 | |
Gross Unrealized Depreciation | | | (11,812,219 | ) |
| | | | |
Net Unrealized Appreciation | | $ | 4,642,401 | |
| | | | |
Fair Value Measurements^
The following is a summary of the fair valuations according to the inputs used as of December 31, 2010 in valuing the Portfolio’s assets and liabilities:
| | | | | | | | | | | | | | | | |
| | | Quoted Prices
in Active Markets
for Identical Investments
(Level 1) | | | Other
Observable
Inputs
(Level 2) | | | Significant
Unobservable
Inputs (Level 3) | | | Fair Value at 12/31/2010 | |
Asset Table | | | | | | | | | | | | | | | | |
Investments, at value | | | | | | | | | | | | | | | | |
Affiliated Investment Companies | | $ | 172,909,359 | | | $ | — | | | $ | — | | | $ | 172,909,359 | |
| | | | | | | | | | | | | | | | |
Total Investments, at value | | $ | 172,909,359 | | | $ | — | | | $ | — | | | $ | 172,909,359 | |
| | | | | | | | | | | | | | | | |
| ^ | See Note 2, “Significant Accounting Policies” in the Notes to Financial Statements for additional information. |
See Accompanying Notes to Financial Statements
24
| | |
| ING STRATEGIC ALLOCATION MODERATE PORTFOLIO | | PORTFOLIO OF INVESTMENTS ASOF DECEMBER 31, 2010 |
| | | | | | | | | | | | |
| Shares | | | | | Value | | | Percent of
Net Assets | |
| | |
| | AFFILIATED INVESTMENT COMPANIES: 100.0% | | | | | | | | |
| | 900,318 | | | ING Alternative Beta Fund - Class I | | $ | 9,984,526 | | | | 6.0 | |
| | 879,148 | | | ING Clarion Global Real Estate Portfolio - Class I | | | 8,571,692 | | | | 5.1 | |
| | 843,553 | | | ING Growth and Income Portfolio - Class I | | | 18,507,543 | | | | 11.1 | |
| | 4,816,735 | | | ING Intermediate Bond Portfolio - Class I | | | 58,137,989 | | | | 34.7 | |
| | 3,743,179 | | | ING International Index Portfolio - Class I | | | 31,966,750 | | | | 19.1 | |
| | 858,788 | | | ING MidCap Opportunities Portfolio - Class I | | | 10,039,237 | | | | 6.0 | |
| | 462,211 | | | ING Small Company Portfolio - Class I | | | 8,476,949 | | | | 5.1 | |
| | 2,405,985 | | | ING Tactical Asset Allocation Fund - Class I | | | 21,677,926 | | | | 12.9 | |
| | | | Total Investments in Affiliated Investment Companies | | | | | |
| | | | (Cost $153,072,912)* | | $ | 167,362,612 | | | | 100.0 | |
| | | | Other Assets and Liabilities - Net | | | (76,408 | ) | | | — | |
| | | | | | | | | | | | |
| | | | Net Assets | | $ | 167,286,204 | | | | 100.0 | |
| | | | | | | | | | | | |
| | | | |
*Costfor federal income tax purposes is $168,268,278. | | | | |
| |
Net unrealized depreciation consists of: | | | | |
Gross Unrealized Appreciation | | $ | — | |
Gross Unrealized Depreciation | | | (905,666 | ) |
| | | | |
Net Unrealized Depreciation | | $ | (905,666 | ) |
| | | | |
Fair Value Measurements^
The following is a summary of the fair valuations according to the inputs used as of December 31, 2010 in valuing the Portfolio’s assets and liabilities:
| | | | | | | | | | | | | | | | |
| | | Quoted Prices
in Active Markets
for Identical Investments
(Level 1) | | | Other
Observable
Inputs
(Level 2) | | | Significant
Unobservable
Inputs
(Level 3) | | | Fair Value at 12/31/2010 | |
Asset Table | | | | | | | | | | | | | | | | |
Investments, at value | | | | | | | | | | | | | | | | |
Affiliated Investment Companies | | $ | 167,362,612 | | | $ | — | | | $ | — | | | $ | 167,362,612 | |
| | | | | | | | | | | | | | | | |
Total Investments, at value | | $ | 167,362,612 | | | $ | — | | | $ | — | | | $ | 167,362,612 | |
| | | | | | | | | | | | | | | | |
| ^ | See Note 2, “Significant Accounting Policies” in the Notes to Financial Statements for additional information. |
See Accompanying Notes to Financial Statements
25
TAX INFORMATION (UNAUDITED)
Dividends paid during the year ended December 31, 2010 were as follows:
| | | | | | | | |
Portfolio Name | | Type | | | Per Share Amount | |
| | |
ING Strategic Allocation Conservative Portfolio | | | | | | | | |
Class I | | | NII | | | $ | 0.4484 | |
Class S | | | NII | | | $ | 0.4274 | |
| | |
ING Strategic Allocation Growth Portfolio | | | | | | | | |
Class I | | | NII | | | $ | 0.3516 | |
Class S | | | NII | | | $ | 0.3311 | |
| | |
ING Strategic Allocation Moderate Portfolio | | | | | | | | |
Class I | | | NII | | | $ | 0.3966 | |
Class S | | | NII | | | $ | 0.3774 | |
NII - Net investment income
Of the ordinary distributions made during the year ended December 31, 2010, the following percentages qualify for the dividends received deduction (DRD) available to corporate shareholders:
| | | | |
| |
ING Strategic Allocation Conservative Portfolio | | | 11.57 | % |
| |
ING Strategic Allocation Growth Portfolio | | | 34.33 | % |
| |
ING Strategic Allocation Moderate Portfolio | | | 19.79 | % |
Above figures may differ from those cited elsewhere in this report due to differences in the calculation of income and gains under U.S. generally accepted accounting principles (book) purposes and Internal Revenue Service (tax) purposes.
Shareholders are strongly advised to consult their own tax advisers with respect to the tax consequences of their investments in the Portfolios. In January, shareholders, excluding corporate shareholders, receive an IRS 1099-DIV regarding the federal tax status of the dividends and distributions they received in the calendar year.
26
DIRECTOR AND OFFICER INFORMATION (UNAUDITED)
The business and affairs of the Company are managed under the direction of the Board. A Director who is not an interested person of the Company, as defined in the 1940 Act, is an independent director (“Non-Interested Director”). The Directors and Officers of the Company are listed below. The Statement of Additional Information includes additional information about directors of the Company and is available, without charge, upon request at (800) 992-0180.
| | | | | | | | | | | | |
Name, Address and Age | | Position(s)
held with the
Company | | Term of Office
and Length of
Time Served(1) | | Principal Occupation(s)
During the Past 5 Years* | | Number of
Funds
in Fund
Complex
Overseen
by Director(2) | | | Other Directorships
Held by Director |
Independent Directors: | | | | | | | | | | | | |
| | | | | |
Albert E. DePrince, Jr. 7337 E. Doubletree Ranch Rd. Suite 100 Scottsdale, Arizona 85258 Age: 69 | | Director | | June 1998 - Present | | Professor of Economics and Finance, Middle Tennessee State University (August 1991 - Present). Formerly, Director of Business and Economics Research Center. Middle Tennessee State University (1999 - 2002); Chief Economist, Marine Midland Bank (1987 - 1990); Various Management Positions, Marine Midland Bank (1978 - 1990). Ph.D. in Economics Published numerous scholarly papers and journal articles in the areas of financial markets, financial institutions, corporate finance and monetary policy. | | | 37 | | | Academy of Economics and Finance (February 2002 - Present). |
| | | | | |
Sidney Koch 7337 E. Doubletree Ranch Rd. Suite 100
Scottsdale, Arizona 85258 Age: 75 | | Director | | April 1994 - Present | | Retired. Self-Employed Consultant (June 2000 - Present). Formerly, Senior Adviser, Hambro America, Inc, (1993 - 2000); Executive Vice President of Investment Banking, Daiwa Securities America, Inc. (1986 - 1993). | | | 37 | | | None. |
| | | | | |
Corine T. Norgaard 7337 E. Doubletree Ranch Rd. Suite 100 Scottsdale, Arizona 85258 Age: 73 | | Director | | June 1991 - Present | | President and Owner, Retirement Options, LLC, a training provider for retirement coaches (August 2009 - Present) Formerly, President, Thompson Enterprises (September 2004 - September 2005); Dean of the Barney School of Business, University of Hartford (August 1996 - June 2004). Various other academic positions (1969 - 1993). Certified Public Accountant Ph. D in Accounting and Business | | | 37 | | | MassMutual Corporate Investors and MassMutual Participation Investors (April 1997 - Present); MassMutual Premier Funds (20 funds), Chair of Audit Committee (December 2004 - Present); and MML Series Investment Funds II (8 funds), Chair of Audit Committee (December 2005 -Present). |
| | | | | |
Joseph E. Obermeyer 7337 E. Doubletree Ranch Rd. Suite 100 Scottsdale, Arizona 85258 Age: 53 | | Director | | January 2003 - Present | | President, Obermeyer & Associates, Inc., a provider of financial and economic consulting services (November 1999 - Present). Formerly, Senior Manager, Arthur Anderson LLP (1995 - 1999); Senior Manager, Coopers & Lybrand, LLP (1993 - 1995); Manager, Price Waterhouse (1988 - 1993); Second Vice President, Smith Barney (1985 - 1988); Consultant, Arthur Anderson & Co. (1984 - 1985) | | | 37 | | | None. |
27
DIRECTOR AND OFFICER INFORMATION (UNAUDITED)(CONTINUED)
| | | | | | | | | | | | |
Name, Address and Age | | Position(s)
held with the
Company | | Term of Office
and Length of
Time Served(1) | | Principal Occupation(s)
During the Past 5 Years* | | Number of
Funds
in Fund
Complex
Overseen
by Director(2) | | | Other Directorships
Held by Director |
| | | | | |
Russell Jones 7337 E. Doubletree Ranch Rd. Suite 100 Scottsdale, Arizona 85258 Age: 66 | | Director | | December 2007 - Present | | Retired. Formerly, Senior Vice President, Chief Investment Officer and Treasurer, and other various positions including Principal Investor Relations Officer, Principal Public Relations Officer, and Corporate Parent Treasurer, Kaman Corporation, an aerospace and industrial distribution manufacturer (April 1973 - March 2008). President, Hartford Area Business Economists (1986 - 1987) and Corporate Loan Officer and Credit Analyst, Hartford National Bank (1966 - 1973), Certified AARP Tax Counselor (2011) | | | 37 | | | Independent Director, CIGNA Mutual Funds (8 funds), Chair of Contracts Commitee (1995 - 2005). |
Directors who are “Interested Persons”(4) | | | | | | | | | | |
| | | | | |
Shaun Mathews(3)(4) 7337 E. Doubletree Ranch Rd. Suite 100 Scottsdale, Arizona 85258 Age: 55 | | Director | | December 2007 - Present | | President and Chief Executive Officer, ING Investments, LLC(5) (November 2006 - Present). Formerly, Head of ING Mutual Funds and Investment Products (November 2004 - November 2006). | | | 175 | | | ING Retirement Holdings, Inc. (September 1998 - Present); ING Services Holding Company, Inc. (May 2000 - Present); ING Financial Advisers, LLC (April 2002 - Present); Southland Life Insurance Company (June 2002 - Present); ING Capital Corporation, LLC and ING Investments Distributor, LLC(6) (December 2005 - Present); ING Funds Services, LLC(7), ING Investments, LLC(5) and ING Pilgrim Funding, Inc. (March 2006 - Present); and Directed Services LLC (December 2006 - Present)(8) . |
| * | The information reported includes the principle occupation during the last five years for each Director and other information relating to the professional experience, attributes and skills relevant to each Director’s qualifications to serve as Director. |
| (1) | Directors serve until their successors are duly elected and qualified. |
| (2) | For the purposes of this table (except for Mr. Mathews), “Fund Complex” means the following investment companies: ING Series Fund, Inc.; ING Strategic Allocation Portfolios, Inc.; ING Variable Funds; ING Variable Portfolios, Inc.; ING Balanced Portfolio, Inc.; ING Intermediate Bond Portfolio; and ING Money Market Portfolio. |
| (3) | For Mr. Mathews, the Fund Complex also includes the following investment companies: ING Asia Pacific High Dividend Equity Income Fund, ING Emerging Markets High Dividend Equity Fund; ING Emerging Markets Local Bond Fund; ING Equity Trust; ING Funds Trust; ING Global Equity Dividend and Premium Opportunity Fund; ING Global Advantage and Premium Opportunity Fund; ING Infrastructure, Industrials, and Materials Fund; ING International High Dividend Equity Income Fund; ING Investors Trust; ING Mayflower Trust; ING Mutual Funds; ING Partners, Inc.; ING Prime Rate Trust; ING Risk Managed Natural Resources Fund; ING Senior Income Fund; ING Separate Portfolios Trust; ING Variable Insurance Trust; and ING Variable Products Trust. |
| (4) | “Interested person,” as defined in the 1940 Act, by virtue of this Director’s/Trustee’s affiliation with any of the Funds, ING or any of ING’s affiliates. |
| (5) | ING Investments, LLC was previously named ING Pilgrim Investments, LLC. ING Pilgrim Investments, LLC is the successor in interest to ING Pilgrim Investments, Inc., which was previously known as Pilgrim Investments, Inc. and before that was known as Pilgrim America Investments, Inc. |
| (6) | ING Investments Distributor, LLC was previously named ING Funds Distributor, LLC. ING Funds Distributor, LLC is the successor in interest to ING Funds Distributor, Inc., which was previously known as ING Pilgrim Securities, Inc., and before that, was known as Pilgrim Securities, Inc., and before that was known as Pilgrim America Securities, Inc. |
| (7) | ING Funds Services, LLC was previously named ING Pilgrim Group, LLC. ING Pilgrim Group, LLC is the successor in interest to ING Pilgrim Group, Inc., which was previously known as Pilgrim Group, Inc. and before that was known as Pilgrim America Group, Inc. |
| (8) | Directed Services LLC is the successor in interest to Directed Services, Inc. |
28
DIRECTOR AND OFFICER INFORMATION (UNAUDITED)(CONTINUED)
| | | | | | |
Name, Address and Age | | Position(s)
Held With
Company | | Term of Office
and Length of Time Served(1) | | Principal Occupation(s) - During the Past 5 Years |
| | | |
Shaun P. Mathews(5) 7337 East Doubletree Ranch Rd. Suite 100 Scottsdale, Arizona 85258 Age: 55 | | President and Chief Executive Officer | | December 2006 - Present | | President and Chief Executive Officer, ING Investments, LLC (November 2006 - Present). Formerly, Head of ING Mutual Funds and Investment Products (November 2004 - November 2006). |
| | | |
Michael J. Roland 7337 East Doubletree Ranch Rd. Suite 100 Scottsdale, Arizona 85258 Age: 52 | | Executive Vice President | | April 2002 - Present | | Executive Vice President and Chief Operating Officer, ING Investments, LLC(2) and ING Funds Services, LLC(3) (January 207 - Present). Formerly, Executive Vice President, Head of Product Management (January 2005 - January 2007). |
| | | |
Stanley D. Vyner 230 Park Avenue New York, New York 10169 Age: 60 | | Executive Vice President | | March 2002 - Present | | Executive Vice President, ING Investments, LLC(2) (July 2000 - Present) and Chief Investment Risk Officer, ING Investments, LLC(2) (January 2003 - Present). |
| | | |
Joseph M. O’Donnell 7337 East Doubletree Ranch Rd. Suite 100 Scottsdale, Arizona 85258 Age: 56 | | Executive Vice President and Chief Compliance Officer | | March 2006 - Present November 2004 - Present | | Chief Compliance Officer of the ING Funds (November 2004 Present); Executive Vice President of the ING Funds (March 2006 - Present); Chief Compliance Officer of ING Investments, LLC(2) (March 2006 - July 2008 and October 2009 - Present); and Investment Advisor Chief Compliance Officer, Directed Services LLC(6) (March 2006 - July 2008 and October 2009 - Present). Formerly, Investment Advisor Chief Compliance Officer, ING Life Insurance and Annuity Company (March 2006 - December 2006). |
| | | |
Todd Modic 7337 East Doubletree Ranch Rd. Suite 100 Scottsdale, Arizona 85258 Age: 43 | | Senior Vice President, Chief/Principal Financial Officer and Assistant Secretary | | March 2005 - Present | | Senior Vice President, ING Funds Services, LLC(3) (March 2005 - Present). |
| | | |
Kimberly A. Anderson 7337 East Doubletree Ranch Rd. Suite 100 Scottsdale, Arizona 85258 Age: 46 | | Senior Vice President | | December 2003 - Present | | Senior Vice President, ING Investments, LLC(2) (October 2003 - Present). |
| | | |
Robert Terris 7337 East Doubletree Ranch Rd. Suite 100 Scottsdale, Arizona 85258 Age: 40 | | Senior Vice President | | June 2006 - Present | | Senior Vice President, Head of Division Operations, ING Funds Services, LLC(3) (May 2006 - Present). Formerly, Vice President of Administration, ING Funds Services, LLC(3) (October 2001 May 2006). |
| | | |
Robyn L. Ichilov 7337 East Doubletree Ranch Rd. Suite 100 Scottsdale, Arizona 85258 Age: 43 | | Vice President and Treasurer | | March 2002 - Present | | Vice President and Treasurer, ING Funds Services, LLC(3) (November 1995 - Present) and ING Investments, LLC(2) (August 1997 - Present). |
| | | |
Lauren D. Bensinger 7337 East Doubletree Ranch Rd. Suite 100 Scottsdale, Arizona 85258 Age: 56 | | Vice President | | March 2003 - Present | | Vice President, ING Investments, LLC(2) and ING Funds Services, LLC(3)(February 1996 - Present); Director of Compliance, ING Investments, LLC(2) (October 2004 - Present); and Vice President and Money Laundering Reporting Officer, ING Investments Distributor, LLC(4) (April 2010 - Present). Formerly, Chief Compliance Officer, ING Investments Distributor, LLC(4) (August 1995 April - 2010). |
| | | |
William Evans 10 State House Square Hartford, Connecticut 06103 Age: 38 | | Vice President | | September 2007 - Present | | Senior Vice President (March 2010 - Present) and Head of Manager Research and Selection Group (April 2007 - Present). Formerly, Vice President, U.S. Mutual Funds and Investment Products (May 2005 - April 2007). |
| | | |
Maria M. Anderson 7337 East Doubletree Ranch Rd. Suite 100 Scottsdale, Arizona 85258 Age: 52 | | Vice President | | September 2004 - Present | | Vice President, ING Funds Services, LLC(3) (September - 2004 Present). |
| | | |
Denise Lewis 7337 East Doubletree Ranch Rd. Suite 100 Scottsdale, Arizona 85258 Age: 47 | | Vice President | | April 2007 - Present | | Vice President, ING Funds Services, LLC (December 2006 - Present). Formerly, Senior Vice President, UMB Investment Services Group, LLC (November 2003 - December 2006). |
29
DIRECTOR AND OFFICER INFORMATION (UNAUDITED)(CONTINUED)
| | | | | | |
Name, Address and Age | | Position(s) Held With Company | | Term of Office and Length of Time Served(1) | | Principal Occupation(s) - During the Past 5 Years |
| | | |
Kimberly K. Springer 7337 East Doubletree Ranch Rd. Suite 100 Scottsdale, Arizona 85258 Age: 53 | | Vice President | | March 2006 - Present | | Vice President, ING Investment Management - ING Funds (March 2010 - Present); Vice President, ING Funds Services, LLC(3) (March 2006 - Present) and Managing Paralegal, Registration Statements (June 2003 - Present). Formerly, Assistant Vice President, ING Funds Services, LLC(3) (August 2004 - March 2006). |
| | | |
Craig Wheeler 7337 East Doubletree Ranch Rd. Suite 100 Scottsdale, Arizona 85258 Age: 41 | | Assistant Vice President | | June 2008 - Present | | Assistant Vice President - Director of Tax, ING Funds Services (March 2008 - Present). Formerly, Tax Manager, ING Funds Services (March 2005 - March 2008). |
| | | |
Huey P. Falgout, Jr. 7337 East Doubletree Ranch Rd. Suite 100 Scottsdale, Arizona 85258 Age: 47 | | Assistant Secretary | | September 2003 - Present | | Senior Vice President and Chief Counsel, ING Investment Management - ING Funds (March 2010 - Present). Formerly, Chief Counsel, ING Americas, U.S. Legal Services (October 2003 - March 2010). |
| | | |
Theresa K. Kelety 7337 East Doubletree Ranch Rd. Suite 100 Scottsdale, Arizona 85258 Age: 47 | | Secretary | | September 2003 - Present | | Vice President and Senior Counsel, ING Investment Management - ING Funds (March 2010 - Present). Formerly, Senior Counsel, ING Americas, U.S. Legal Services (April 2008 - March 2010) and Counsel, ING Americas, U.S. Legal Services (April 2003 - April 2008). |
| | | |
Kathleen Nichols 7337 East Doubletree Ranch Rd. Suite 100 Scottsdale, Arizona 85258 Age: 35 | | Assistant Secretary | | June 2008 - Present | | Vice President and Counsel, ING Investment Management - ING Funds (March 2010 - Present). Formerly, Counsel, ING Americas, U.S. Legal Services (February 2008 - March 2010) and Associate, Ropes & Gray LLP (September 2005 - February 2008) |
| | | |
Paul Caldarelli 7337 East Doubletree Ranch Rd. Suite 100 Scottsdale, Arizona 85258 Age: 59 | | Assistant Secretary | | August 2010 - Present | | Vice President and Senior Counsel, ING Investment Management - ING Funds (March 2010 - Present). Formerly, Senior Counsel, ING Americas, U.S. Legal Services (April 2008 - March 2010) and Counsel, ING Americas, U.S. Legal Services (May 2005 - April 2008). |
| (1) | The officers hold office until the next annual meeting of the Trustees and until their successors shall have been elected and qualified. |
| (2) | ING Investments, LLC was previously named ING Pilgrim Investments, LLC. ING Pilgrim Investments, LLC is the successor in interest to ING Pilgrim Investments, Inc., which was previously known as Pilgrim Investments, Inc. and before that was known as Pilgrim America Investments, Inc. |
| (3) | ING Funds Services, LLC was previously named ING Pilgrim Group, LLC. ING Pilgrim Group, LLC is the successor in interest to ING Pilgrim Group, Inc., which was previously known as Pilgrim Group, Inc. and before that was known as Pilgrim America Group, Inc. |
| (4) | ING Investments Distributor, LLC was previously named ING Funds Distributor, LLC. ING Funds Distributor, LLC is the successor in interest to ING Funds Distributor, Inc., which was previously known as ING Pilgrim Securities, Inc., and before that, was known as Pilgrim Securities, Inc., and before that was known as Pilgrim America Securities, Inc. |
| (5) | Mr. Mathews commenced services as CEO and President of the ING Funds on November 11, 2006. |
| (6) | Directed Services LLC is the successor in interest to Directed Services, Inc. |
30
ADVISORY CONTRACT APPROVAL DISCUSSION (UNAUDITED)
BOARD CONSIDERATION AND APPROVAL OF INVESTMENT ADVISORY AND SUB-ADVISORY AGREEMENTS
The Investment Company Act of 1940, as amended (the “1940 Act”), provides, in substance, that each investment advisory agreement and sub-advisory agreement for a mutual fund will terminate automatically after the initial term of the agreement (which term may not exceed two years), unless continuation of the agreement is approved annually by the Board of Trustees or Directors, as the case may be (the “Board”) of the fund, including a majority of the Trustees/Directors who have no direct or indirect interest in the agreement and who are not “interested persons” of the fund (the “Independent Trustees”). Consistent with this requirement of the 1940 Act, the Board of ING Balanced Portfolio, Inc., ING Strategic Allocation Portfolios, Inc., ING Intermediate Bond Portfolio, ING Money Market Portfolio, ING Variable Funds, ING Variable Portfolios, Inc. and ING Series Fund, Inc., with respect to each portfolio series thereof (each, a “Fund” and, collectively, the “Funds”) has established a process for considering on an annual basis approval of the continuation of the investment management agreement for each Fund (the “Advisory Agreement”) with ING Investments, LLC (the “Adviser”) and the sub-advisory agreement for each Fund (collectively, the “Sub-Advisory Agreements”) with each sub-adviser of the Funds (the “Sub-Advisers”). Set forth below is a description of the process followed by the Board in considering approval of the continuation of each Advisory and Sub-Advisory Agreement (collectively, the “Agreements”), together with an explanation of many of the factors considered and related conclusions reached by the Board in voting to approve the continuation of each Agreement for an additional one-year period commencing January 1, 2011, followed by specific considerations with respect to each Fund covered by this report (each, a “Portfolio”).
Overview of the Review Process
At a meeting of the Board held on December 15, 2010, the Board, including all of the Independent Trustees, voted to approve continuation of each of the existing Agreements for the Funds. Prior to voting such approvals, the Board received the affirmative recommendation of the Contracts Committee of the Board, which is a Committee of the Board comprised of all of the Independent Trustees and exclusively of the Independent Trustees. The Contracts Committee recommended approval of the Agreements after completing an extensive review of information
requested by the Committee from the Adviser and each Sub-Adviser, including the following: (1) comparative performance data for each Fund for various time periods; (2) comparative data regarding management fees, including data regarding the fees charged by the Adviser and Sub-Advisers for managing other mutual funds and institutional accounts using investment strategies and techniques similar to those used in managing the Funds; (3) comparative data regarding the total expenses of each Fund; (4) copies of each form of Advisory Agreement and Sub-Advisory Agreement; (5) copies of the codes of ethics of the Adviser and each Sub-Adviser, together with information relating to the manner in which each code is administered; (6) financial statements of the Adviser and each Sub-Adviser; (7) profitability analyses for the Adviser and each Sub-Adviser with respect to each Fund, and all Funds as a group; (8) descriptions of the qualifications of the investment personnel responsible for managing each Fund, the structure of their compensation and their responsibilities with respect to managing other accounts or mutual funds; (9) descriptions of the services provided to the Funds, including the investment strategies and techniques used by each Sub-Adviser in managing the Funds; (10) data relating to portfolio turnover and brokerage practices, including practices with respect to the acquisition of research through “soft dollar” benefits received in connection with the Funds’ brokerage; (11) descriptions of the policies and procedures of the various service providers of the Funds for protecting the privacy of shareholder information; (12) information relating to projected sales and redemptions of Fund shares and business plans relating to the Adviser’s mutual fund platform; (13) descriptions of the business continuity and disaster recovery plans of the Adviser and each Sub-Adviser; (14) descriptions of various compliance programs of the Adviser and Sub-Advisers, including the Adviser’s programs for monitoring and enforcing compliance with the Funds’ policies with respect to market-timing, late trading and selective portfolio disclosure; (15) independent reports analyzing the quality of the trade execution services performed by Sub-Advisers for the Funds; and (16) other information relevant to an evaluation of the nature, extent and quality of the services provided by the Adviser and each Sub-Adviser in response to a series of detailed questions posed by Goodwin Procter LLP, legal counsel for the Independent Trustees (“Independent Counsel”) on behalf of the Independent Trustees.
The Contracts Committee began the formal review process in August 2010 when it met separately with
31
ADVISORY CONTRACT APPROVAL DISCUSSION (UNAUDITED) (CONTINUED)
Independent Counsel to review the information to be requested from management and the methodology to be used in determining the selected peer groups for comparing performance and expenses (the “Peer Group Methodology”). Prior to the August meeting, the Contracts Committee engaged an independent consultant (the “Independent Consultant”) to evaluate, and make recommendations with respect to, the Peer Group Methodology. The Independent Consultant’s findings were reported to the Contracts Committee at the August meeting and incorporated into the Peer Group Methodology approved by the Board. The Contracts Committee then held meetings on October 19-20, 2010 and December 13-14, 2010, during which the Independent Trustees, meeting separately with Independent Counsel, reviewed and evaluated the information described above. As part of the review process, the Contracts Committee also met with representatives from the Adviser and/or the Sub-Advisers to discuss the information provided to the Committee. The Contracts Committee also considered information that had been provided by the Adviser and Sub-Advisers throughout the year at other meetings of the Contracts Committee, the Audit Committee, the Compliance Committee and the full Board.
The Independent Trustees were assisted by Independent Counsel, throughout the contract review process. The Independent Trustees relied upon the advice of Independent Counsel and their own business judgment in determining the material factors to be considered in evaluating each Advisory and Sub-Advisory Agreement and the weight to be given to each such factor. The conclusions reached by the Independent Trustees were based on a comprehensive evaluation of all of the information provided and were not the result of any one factor. Moreover, each Independent Trustee may have afforded different weight to the various factors in reaching his or her conclusions with respect to each Advisory and Sub-Advisory Agreement.
Nature, Extent and Quality of Services
In considering whether to approve the Advisory and Sub-Advisory Agreements for the Funds for the year commencing January 1, 2011, the Board evaluated the nature, extent and quality of services provided to the Funds by the Adviser and Sub-Advisers. The Board considered the investment management and related services provided by the Adviser and Sub-Advisers, including the quantity and quality of the resources available to provide such services. Among other things, the Board considered the qualifications of the
individuals responsible for performing various investment related services.
The Board also considered the quality of the compliance programs of the Adviser and each Sub-Adviser, including the manner in which the Adviser and each Sub-Adviser monitor for compliance with the investment policies and restrictions of a Fund and with the Codes of Ethics of the Funds, the Adviser and the Sub-Advisers with respect to personal trading by employees with access to portfolio information. The Board also considered the actions taken by the Adviser and Sub-Advisers to establish and maintain effective disaster recovery and business continuity plans.
The Board considered the actions taken by the Adviser and its affiliated companies to administer the Funds’ policies and procedures for voting proxies, valuing the Funds’ assets, selective disclosure of portfolio holdings and preventing late-trading and frequent trading of Fund shares.
The Board also took into account the efforts of the Adviser and its affiliated companies to reduce the expenses of the Funds. With respect to those Funds that are sub-advised by an affiliate of the Adviser, the Board specifically noted that, in recent years, the Adviser and its affiliated companies have significantly reduced the Funds’ brokerage costs and portfolio turnover rates, as well as the quantity of research acquired through the use of soft dollars from the Funds’ brokerage. The Board also noted the efforts of the Adviser to optimize the number of Funds in the ING complex of mutual funds and to standardize the asset management characteristics and policies across the ING mutual fund platform. The Board considered information provided by management with respect to the progress made within ING Groep to establish an integrated global asset management firm (the “Global Transition”), including information with respect to any benefits to the Funds and their shareholders as a result of operational efficiencies achieved through the Global Transition. The Board also considered the benefits that shareholders of the Funds realize because the Funds are part of the larger ING family of mutual funds, including, in most cases, the ability of shareholders to exchange or transfer investments within the same class of shares among a wide variety of mutual funds without incurring additional sales charges. In that regard, the Board considered the potential impacts of any divestiture of its insurance business, which includes the investment management businesses, by ING Groep or significant change in structure of the investment management business, if any, on the services provided
32
ADVISORY CONTRACT APPROVAL DISCUSSION (UNAUDITED) (CONTINUED)
to the Funds by the Adviser and Sub-Advisers. The Board also considered the actions that have been taken by management to retain key investment management personnel in light of such a potential divestiture.
The Board also considered the Adviser’s responsiveness and recommendations for Board action and other steps taken in response to the extraordinary dislocations experienced in the capital markets in recent years, including sustained periods of high volatility, credit disruption and government intervention. In particular, the Board considered the Adviser’s efforts and expertise with respect to each of the following matters as they relate to the Funds: (i) negotiating and maintaining the availability of bank loan facilities and other sources of credit used to satisfy liquidity needs; (ii) establishing the fair value of securities and other instruments held in investment portfolios during periods of market volatility and issuer-specific disruptions; (iii) negotiating and maintaining credit support from the Funds’ securities lending agent with respect to certain defaulted securities held indirectly by the Funds as collateral for securities on loan; and (iv) the ongoing monitoring of investment management processes and risk controls.
The Board’s approval of the Advisory and Sub-Advisory Agreements was informed by certain information provided by the Adviser and the applicable Sub-Advisers with respect to certain actions to be taken to correct underperformance and lack of scale with respect to certain Funds as indicated in the Portfolio-by-Portfolio analysis below.
The Board concluded that the nature, extent and quality of advisory and related services provided by the Adviser and each of the Sub-Advisers, taken as a whole, are consistent with the terms of the respective Advisory and Sub-Advisory Agreements and justify the fees paid by the Funds for such services.
Fund Performance
The Board reviewed each Fund’s investment performance over various time periods on an absolute basis and relative to the performance of (i) one or more appropriate benchmark indexes (such as the S&P 500 Composite Stock Price Index), (ii) a group of similarly managed mutual funds identified by Lipper, Inc. and/or Morningstar, Inc., and (iii) similarly managed mutual funds within a specified peer group based upon the Peer Group Methodology approved by the Contracts Committee (each, a “Selected Peer Group”). The Board reviewed comparative performance data for the most recent calendar quarter, year-to-date, one-, three-, five-
and ten-year periods, where applicable, ending June 30, 2010 and the most recent calendar quarter, year-to-date, one-, three-, and five-year periods ending September 30, 2010. In considering the performance of the Funds, the Board noted the instability of the markets and periods of high volatility during the prior two years and the response of the Adviser and each Sub-Adviser to such volatility. Summaries of selected portions of the performance information reviewed by the Board, together with the Board’s conclusions regarding the performance of each Portfolio, are set forth below under “Portfolio-by-Portfolio Analysis.”
Management Fees, Sub-Advisory Fees and Expenses
Consideration was given to the contractual investment advisory fee rates, inclusive of administrative fee rates, payable by the Funds to the Adviser and its affiliated companies (referred to collectively as “management fees”) and the contractual sub-advisory fee rates payable by the Adviser to each Sub-Adviser for sub-advisory services. As part of its review, the Board considered each Fund’s management fee and total expense ratio, as compared to its Selected Peer Group, both before and after giving effect to any undertaking by the Adviser to waive fees and/or limit the total expenses of a Fund. In addition, the Trustees received information regarding the fees charged by each Sub-Adviser to similarly-managed institutional accounts and other mutual funds, if any, and the comparability (or lack thereof) of the services provided by the Sub-Adviser in managing such accounts and other mutual funds to the services provided in managing the Funds. With respect to the Funds sub-advised by an affiliate of the Adviser, the Board evaluated the reasonableness of the total fees received by the Adviser and its affiliate in the aggregate under the Advisory and Sub-Advisory Agreements. With respect to those Funds sub-advised by a Sub-Adviser that is not affiliated with the Adviser, the Board considered the reasonableness of the fees payable to the Sub-Adviser by the Adviser in light of the ability of the Adviser to negotiate such fees on an arm’s-length basis. Summaries of selected portions of the fee and expense information reviewed with respect to each Portfolio are set forth below under “Portfolio-by-Portfolio Analysis.” After reviewing the foregoing information, and in light of the nature, extent and quality of the services provided by the Adviser and each Sub-Adviser, the Board concluded with respect to each Fund that the management fee charged to the Fund for advisory, sub-advisory and related services is fair and reasonable and that the total expense ratio of the Fund is reasonable.
33
ADVISORY CONTRACT APPROVAL DISCUSSION (UNAUDITED) (CONTINUED)
Profitability
The Board considered information relating to revenues, expenses, and profits realized by the Adviser and each Sub-Adviser attributable to performing advisory, sub-advisory and administrative services for the Funds. With respect to Funds sub-advised by an unaffiliated Sub-Adviser, the Board did not consider the profitability of the Sub-Adviser to be a material factor because the Board believes that the Adviser negotiates sub-advisory fees with the unaffiliated Sub-Adviser on an arm’s-length basis. The Board reviewed profitability data for the Adviser and its affiliated companies, including the distributor of the Funds, relating to (i) each Fund separately, (ii) all Funds as a group, (iii) all “retail” Funds as a group, and (iv) all variable insurance product Funds as a group, in each case for the one-year periods ended December 31, 2009 and December 31, 2008 and the nine-month period ended September 30, 2010. With respect to the Adviser and its affiliates, such information was prepared in accordance with a methodology approved by the Contracts Committee. The Board considered the profitability of the Adviser and its affiliated companies attributable to managing and operating each Fund both with and without the profitability of the distributor of the Funds and both before and after giving effect to any expenses incurred by the Adviser or any affiliated company in making revenue sharing or other payments to third parties, including affiliated insurance companies, for distribution and administrative services. With respect to Funds sub-advised by an affiliate of the Adviser, the Board considered the total profits derived by the Adviser and its affiliate in the aggregate attributable to managing and operating each Fund. The Board also considered other direct or indirect benefits that the Adviser and Sub-Advisers, and any affiliated companies thereof, derive from their relationships with the Funds, including the receipt by certain affiliates of the Adviser, of fees relating to the offering of bundled financial products, such as annuity contracts, and the receipt by Sub-Advisers of “soft dollar” benefits from the Funds’ brokerage. The Board concluded that, in light of the nature, extent and quality of the services provided, the profits realized by the Adviser and its affiliated companies, individually and taken as a whole, with respect to providing advisory, sub-advisory and administrative services for each Fund are reasonable.
Economies of Scale
In considering the reasonableness of the management fee of each Fund, the Board considered the extent to
which economies of scale can be expected to be realized by a Fund’s Adviser and its affiliated companies, on the one hand, and by the Fund, on the other hand, as the assets of the Fund increase. The Board noted that the advisory fee schedule for certain Funds includes breakpoints such that, as the assets of the Fund increase, the Fund’s management fee will decrease as a percentage of the Fund’s total assets. The Board recognized the inherent difficulties in measuring precisely the impact of any economies of scale being realized by the Adviser and its affiliated companies with respect to their management of any one or more Funds. In an effort to determine the extent to which economies of scale, if any, will be realized by the Adviser and its affiliated companies as the assets of the Funds grow, the Board considered the profitability data described above relating to the Adviser and its affiliated companies in light of changes in the assets of the Funds over various time periods. The Board noted that the total assets under management of many of the Funds have decreased during the past several years and concluded that the economies of scale realized by the Adviser and its affiliated companies from managing the Funds have not increased with respect to such Funds. The Board also reviewed information regarding the expense ratio of each Fund in light of changes in the assets of the Funds over various time periods, noting that, as the assets of a Fund increase, the fixed expenses of the Fund, as a percentage of the total assets of the Fund, can be expected to decrease. The Board considered such expense information in light of projections provided by the Adviser with respect to the future growth of assets of the Funds. The Board also considered the extent to which economies of scale have been, or are expected to be, realized as a result of the Global Transition. Based upon the foregoing, the Board concluded that the economies of scale being realized by the Adviser and its affiliated companies do not mandate the implementation of breakpoints or additional breakpoints, as the case may be, with respect to any Fund at this time except as otherwise indicated with respect to any specific Portfolio in the Portfolio-by-Portfolio analysis.
Portfolio-by-Portfolio Analysis
In deciding to approve the continuation of each Advisory and Sub-Advisory Agreement for an additional one-year period beginning January 1, 2011, the Board took into account the specific data and factors identified below relating to the performance, fees and expenses of each Fund and actions being taken by the Adviser or Sub-Adviser, as the case may
34
ADVISORY CONTRACT APPROVAL DISCUSSION (UNAUDITED) (CONTINUED)
be, with respect to these matters. Except as otherwise indicated, the performance data described below for each Portfolio is for periods ended September 30, 2010 and the management fees and expense data described below are as of June 30, 2010.
ING Strategic Allocation Conservative Portfolio
In evaluating the investment performance of ING Strategic Allocation Conservative Portfolio the Board noted that: (1) the Portfolio outperformed its Morningstar category median for the most recent calendar quarter, year-to-date and one-month periods but underperformed for the three-year and five-year periods; (2) the Portfolio outperformed its benchmark index for the most recent calendar quarter one-year, three-year and five-year periods but underperformed for the year-to-date period; and (3) the Portfolio is ranked in its Morningstar category in the first quintile for the most recent calendar quarter, in the second quintile for the year-to-date and one-year periods and in the fifth quintile for the three-year and five-year periods. The Board recognized that certain of the funds that serve as underlying investment options to the Portfolio have experienced turnover of their portfolio management teams during 2010, and have implemented changes to their investment strategies in 2010 to improve performance. In addition, the Board also noted that changes were made during 2010 to the asset categories in which the Portfolio invests and the underlying investment options used to obtain exposure to such categories. The Board concluded that appropriate actions are being taken to improve the performance of the Portfolio and that additional time is needed to evaluate the effectiveness of these actions.
In assessing the reasonableness of the management fee and expense ratio for ING Strategic Allocation Conservative Portfolio, the Board noted that the management fee for the Portfolio is equal to the median and below the average management fees of the funds in its Selected Peer Group, and that the expense ratio for the Portfolio is below the median and average expense ratios of the funds in its Selected Peer Group.
ING Strategic Allocation Moderate Portfolio
In evaluating the investment performance of ING Strategic Allocation Moderate Portfolio, the Board noted that: (1) the Portfolio outperformed its Morningstar category median for the most recent calendar quarter but underperformed for the three-year and five-year periods; (2) the Portfolio outperformed its benchmark index for the year-to-
date, three-year and five-year periods but underperformed for the most recent calendar quarter and one-year periods; and (3) the Portfolio is ranked in its Morningstar category in the first quintile for the most recent calendar quarter, in the second quintile for the year-to-date and one-year periods, in the fourth quintile for the three-year period and in the fifth quintile for the five-year period. The Board recognized that certain of the funds that serve as underlying investment options to the Portfolio have experienced turnover of their portfolio management teams during 2010, and have implemented changes to their investment strategies in 2010 to improve performance. In addition, the Board also noted that changes were made during 2010 to the asset categories in which the Portfolio invests and the underlying investment options used to obtain exposure to such categories. The Board concluded that appropriate actions are being taken to improve the performance of the Portfolio and that additional time is needed to evaluate the effectiveness of these actions.
In assessing the reasonableness of the management fee and expense ratio for ING Strategic Allocation Moderate Portfolio, the Board noted that the management fee for the Portfolio is below the median and the average management fees of the funds in its Selected Peer Group, and that the expense ratio for the Portfolio is below the median and average expense ratios of the funds in its Selected Peer Group.
ING Strategic Allocation Growth Portfolio
In evaluating the investment performance of ING Strategic Allocation Growth Portfolio, the Board noted that: (1) the Portfolio outperformed its Morningstar category median for the most recent calendar quarter but underperformed for the year-to-date, one-year, three-year and five-year periods; (2) the Portfolio outperformed its benchmark index for the most recent calendar quarter, year-to-date and three-year periods, but underperformed for the one-year and five-year periods; and (3) the Portfolio is ranked in its Morningstar category in the first quintile for the most recent calendar quarter, in the third quintile for the year-to-date period, in the fourth quintile for the one-year and three-year periods, and in the fifth quintile for the five-year period. The Board recognized that certain of the funds that serve as underlying investment options to the Portfolio have experienced turnover of their portfolio management teams during 2010, and have implemented changes to their investment strategies in 2010 to improve performance. In addition,
35
ADVISORY CONTRACT APPROVAL DISCUSSION (UNAUDITED) (CONTINUED)
the Board also noted that changes were made during 2010 to the asset categories in which the Portfolio invests and the underlying investment options used to obtain exposure to such categories. The Board concluded that appropriate actions are being taken to improve the performance of the Portfolio and that additional time is needed to evaluate the effectiveness of these actions.
In assessing the reasonableness of the management fee and expense ratio for ING Strategic Allocation Growth Portfolio, the Board noted that the management fee for the Portfolio is below the median and the average management fees of the funds in its Selected Peer Group, and that the expense ratio for the Portfolio is below to the median and the average expense ratios of the funds in its Selected Peer Group.
36
Investment Adviser
ING Investments, LLC
7337 East Doubletree Ranch Road, Suite 100
Scottsdale, Arizona 85258
Distributor
ING Investments Distributor, LLC
7337 East Doubletree Ranch Road, Suite 100
Scottsdale, Arizona 85258
Administrator
ING Funds Services, LLC
7337 East Doubletree Ranch Road, Suite 100
Scottsdale, Arizona 85258
Transfer Agent
BNY Mellon Investment Servicing (U.S.) Inc.
301 Bellevue Parkway
Willmington, Delaware 19809
Independent Registered Public Accounting Firm
KPMG LLP
Two Financial Center
60 South Street
Boston, Massachusetts 02111
Custodian
The Bank of New York Mellon
One Wall Street
New York, New York 10286
Legal Counsel
Goodwin Procter LLP
Exchange Place
53 State Street
Boston, Massachusetts 02109
Before investing, carefully consider the investment objectives, risks, charges and expenses of the variable universal life insurance policy or variable annuity contract and the underlying variable investment options. This and other information is contained in the prospectus for the variable universal life policy or variable annuity contract and the underlying variable investment options. Obtain these prospectuses from your agent/registered representative and read them carefully before investing.
| | | | |
 | | VPAR-SAIS | | (1210-021811) |
As of the end of the period covered by this report, Registrant had adopted a code of ethics, as defined in Item 2 of Form N-CSR, that applies to the Registrant’s principal executive officer and principal financial officer. There were no amendments to the Code during the period covered by the report. The Registrant did not grant any waivers, including implicit waivers, from any provisions of the Code during the period covered by this report. The code of ethics is filed herewith pursuant to Item 10(a)(1), Exhibit 99.CODE ETH.
| Item 3. | Audit Committee Financial Expert. |
The Board of Trustees has determined that Corine Norgaard and Joseph Obermeyer are each audit committee financial experts, as defined in Item 3 of Form N-CSR. Ms. Norgaard and Mr. Obermeyer are both “independent” for purposes of Item 3 of Form N-CSR.
| Item 4. | Principal Accountant Fees and Services. |
| (a) | Audit Fees: The aggregate fees billed for each of the last two fiscal years for professional services rendered by KPMG LLP (“KPMG”), the principal accountant for the audit of the registrant’s annual financial statements, for services that are normally provided by the accountant in connection with statutory and regulatory filings or engagements for those fiscal years were $60,300 for year ended December 31, 2010 and $54,000 for year ended December 31, 2009. |
| (b) | Audit-Related Fees: The aggregate fees billed in each of the last two fiscal years for assurance and related services by KPMG that are reasonably related to the performance of the audit of the registrant’s financial statements and are not reported under paragraph (a) of this Item were $6,450 for year ended December 31, 2010 and $6,450 for year ended December 31, 2009. |
| (c) | Tax Fees: The aggregate fees billed in each of the last two fiscal years for professional services rendered by KPMG for tax compliance, tax advice, and tax planning were $11,391 in the year ended December 31, 2010 and $11,250 in the year ended December 31, 2009. Such services included review of excise distribution calculations (if applicable), preparation of the Funds’ federal, state and excise tax returns, tax services related to mergers and routine consulting. |
| (d) | All Other Fees: The aggregate fees billed in each of the last two fiscal years for products and services provided by KPMG, other than the services reported in paragraphs (a) through (c) of this Item were $0 in the year ended December 31, 2010 and $0 in the year ended December 31, 2009. |
| (e)(1) | Audit Committee Pre-Approval Policies and Procedures |
1
AUDIT AND NON-AUDIT SERVICES
PRE-APPROVAL POLICY
| I. | Statement of Principles |
Under the Sarbanes-Oxley Act of 2002 (the “Act”), the Audit Committee of the Board of Directors or Trustees (the “Committee”) of the ING Funds (each a “Fund,” collectively, the “Funds”) set out under Paragraph I on Exhibit A to this Audit and Non-Audit Services Pre-Approval Policy (“Policy”) is responsible for the oversight of the work of the Funds’ independent auditors. As part of its responsibilities, the Committee must pre-approve the audit and non-audit services performed by the auditors in order to assure that the provision of these services does not impair the auditors’ independence from the Funds. The Committee has adopted, and the Board has ratified, this Policy, which sets out the procedures and conditions under which the services of the independent auditors may be pre-approved.
Under Securities and Exchange Commission (“SEC”) rules promulgated in accordance with the Act, the Funds’ may establish two different approaches to pre-approving audit and non-audit services. The Committee may approve services without consideration of specific case-by-case services (“general pre-approval”) or it may pre-approve specific services (“specific pre-approval”). The Committee believes that the combination of these approaches contemplated in this Policy results in an effective and efficient method for pre-approving audit and non-audit services to be performed by the Funds’ independent auditors. Under this Policy, services that are not of a type that may receive general pre-approval require specific pre-approval by the Committee. Any proposed services that exceed pre-approved cost levels or budgeted amounts will also require the Committee’s specific pre-approval.
For both types of approval, the Committee considers whether the subject services are consistent with the SEC’s rules on auditor independence and that such services are compatible with maintaining the auditors’ independence. The Committee also considers whether a particular audit firm is in the best position to provide effective and efficient services to the Funds. Reasons that the auditors are in the best position include the auditors’ familiarity with the Funds’ business, personnel, culture, accounting systems, risk profile, and other factors, and whether the services will enhance the Funds’ ability to manage and control risk or improve audit quality. Such factors will be considered as a whole, with no one factor being determinative.
The appendices attached to this Policy describe the audit, audit-related, tax-related, and other services that have the Committee’s general pre-approval. For any service that has been approved through general pre-approval, the general pre-approval will remain in place for a period 12 months from the date of pre-approval, unless the Committee determines that a different period is appropriate. The Committee will annually review and pre-approve the services that may be provided by the independent auditors without specific pre-approval. The Committee will revise the list of services subject to general pre-approval as appropriate. This Policy does not serve as a delegation to Fund management of the Committee’s duty to pre-approve services performed by the Funds’ independent auditors.
2
The annual audit services engagement terms and fees are subject to the Committee’s specific pre-approval. Audit services are those services that are normally provided by auditors in connection with statutory and regulatory filings or engagements or those that generally only independent auditors can reasonably provide. They include the Funds’ annual financial statement audit and procedures that the independent auditors must perform in order to form an opinion on the Funds’ financial statements (e.g., information systems and procedural reviews and testing). The Committee will monitor the audit services engagement and approve any changes in terms, conditions or fees deemed by the Committee to be necessary or appropriate.
The Committee may grant general pre-approval to other audit services, such as statutory audits and services associated with SEC registration statements, periodic reports and other documents filed with the SEC or issued in connection with securities offerings.
The Committee has pre-approved the audit services listed on Appendix A. The Committee must specifically approve all audit services not listed on Appendix A.
| III. | Audit-related Services |
Audit-related services are assurance and related services that are reasonably related to the performance of the audit or the review of the Funds’ financial statements or are traditionally performed by the independent auditors. The Committee believes that the provision of audit-related services will not impair the independent auditors’ independence, and therefore may grant pre-approval to audit-related services. Audit-related services include accounting consultations related to accounting, financial reporting or disclosure matters not classified as “audit services;” assistance with understanding and implementing new accounting and financial reporting guidance from rulemaking authorities; agreed-upon or expanded audit procedures relating to accounting and/or billing records required to respond to or comply with financial, accounting or regulatory reporting matters; and assistance with internal control reporting requirements under Form N-SAR or Form N-CSR.
The Committee has pre-approved the audit-related services listed on Appendix B. The Committee must specifically approve all audit-related services not listed on Appendix B.
The Committee believes the independent auditors can provide tax services to the Funds, including tax compliance, tax planning, and tax advice, without compromising the auditors’ independence. Therefore, the Committee may grant general pre-approval with respect to tax services historically provided by the Funds’ independent auditors that do not, in the Committee’s view, impair auditor independence and that are consistent with the SEC’s rules on auditor independence.
The Committee will not grant pre-approval if the independent auditors initially recommends a transaction the sole business purpose of which is tax avoidance and the tax treatment of which may
3
not be supported in the Internal Revenue Code and related regulations. The Committee may consult outside counsel to determine that tax planning and reporting positions are consistent with this Policy.
The Committee has pre-approved the tax-related services listed on Appendix C. The Committee must specifically approve all tax-related services not listed on Appendix C.
The Committee believes it may grant approval of non-audit services that are permissible services for independent auditors to a Fund. The Committee has determined to grant general pre-approval to other services that it believes are routine and recurring, do not impair auditor independence, and are consistent with SEC rules on auditor independence.
The Committee has pre-approved the non-audit services listed on Appendix D. The Committee must specifically approve all non-audit services not listed on Appendix D.
A list of the SEC’s prohibited non-audit services is attached to this Policy as Appendix E. The SEC’s rules and relevant guidance should be consulted to determine the precise definitions of these impermissible services and the applicability of exceptions to certain of the SEC’s prohibitions.
| VI. | Pre-approval of Fee levels and Budgeted Amounts |
The Committee will annually establish pre-approval fee levels or budgeted amounts for audit, audit-related, tax and non-audit services to be provided to the Funds by the independent auditors. Any proposed services exceeding these levels or amounts require the Committee’s specific pre-approval. The Committee considers fees for audit and non-audit services when deciding whether to pre-approve services. The Committee may determine, for a pre-approval period of 12 months, the appropriate ratio between the total amount of fees for the Fund’s audit, audit-related, and tax services (including fees for services provided to Fund affiliates that are subject to pre-approval), and the total amount of fees for certain permissible non-audit services for the Fund classified as other services (including any such services provided to Fund affiliates that are subject to pre-approval).
Requests or applications for services to be provided by the independent auditors will be submitted to management. If management determines that the services do not fall within those services generally pre-approved by the Committee and set out in the appendices to these procedures, management will submit the services to the Committee or its delagee. Any such submission will include a detailed description of the services to be rendered.
Notwithstanding this paragraph, the Committee will, on quarterly basis, receive from the independent auditors a list of services provided to date by the auditors during Pre-Approval Period.
4
The Committee may delegate pre-approval authority to one or more of the Committee’s members. Any member or members to whom such pre-approval authority is delegated must report any pre-approval decisions, including any pre-approved services, to the Committee at its next scheduled meeting. The Committee will identify any member to whom pre-approval authority is delegated in writing. The member will retain such authority for a period of 12 months from the date of pre-approval unless the Committee determines that a different period is appropriate. The period of delegated authority may be terminated by the Committee or at the option of the member.
| IX. | Additional Requirements |
The Committee will take any measures the Committee deems necessary or appropriate to oversee the work of the independent auditors and to assure the auditors’ independence from the Funds. This may include reviewing a formal written statement from the independent auditors delineating all relationships between the auditors and the Funds, consistent with Independence Standards Board No. 1, and discussing with the auditors their methods and procedures for ensuring independence.
Effective April 23, 2008, the KPMG LLP (“KPMG”) audit team for the ING Funds accepted the global responsibility for monitoring the auditor independence for KPMG relative to the ING Funds. Using a proprietary system called Sentinel, the audit team is able to identify and manage potential conflicts of interest across the member firms of the KPMG International Network and prevent the provision of prohibited services to the ING entities that would impair KPMG independence with the respect to the ING Funds. In addition to receiving pre-approval from the ING Funds Audit Committee for services provided to the ING Funds and for services for ING entities in the Investment Company Complex, the audit team has developed a process for periodic notification via email to the ING Funds’ Audit Committee Chairpersons regarding requests to provide services to ING Groep NV and its affiliates from KPMG offices worldwide. Additionally, KPMG provides a quarterly summary of the fees for services that have commenced for ING Groep NV and Affiliates at each Audit Committee Meeting.
Date last approved: September 22, 2010
5
Appendix A
Pre-Approved Audit Services for the Pre-Approval Period September 22, 2010 through December 31, 2011
| | | | |
Service | | The Fund(s) | | Fee Range |
| Statutory audits or financial audits (including tax services associated with audit services) | | ü | | As presented to Audit Committee1 |
| | |
| Services associated with SEC registration statements, periodic reports and other documents filed with the SEC or other documents issued in connection with securities offerings (e.g., consents), and assistance in responding to SEC comment letters. | | ü | | Not to exceed $9,750 per filing |
| | |
| Consultations by Fund management with respect to accounting or disclosure treatment of transactions or events and/or the actual or potential effect of final or proposed rules, standards or interpretations by the SEC, Financial Accounting Standards Board, or other regulatory or standard setting bodies. | | ü | | Not to exceed $8,000 during the Pre-Approval Period |
| 1 | For new Funds launched during the Pre-Approval Period, the fee ranges pre-approved will be the same as those for existing Funds, pro-rated in accordance with inception dates as provided in KPMG’s Proposal or any Engagement Letter covering the period at issue. Fees in the Engagement Letter will be controlling. |
6
Appendix B
Pre-Approved Audit-Related Services for the Pre-Approval Period September 22, 2010 through December 31, 2011
| | | | | | |
Service | | The Fund(s) | | Fund Affiliates | | Fee Range |
| Services related to Fund mergers (Excluding tax services – See Appendix C for tax services associated with fund mergers) | | ü | | ü | | Not to exceed $10,000 per merger |
| | | |
| Consultations by Fund management with respect to accounting or disclosure treatment of transactions or events and/or the actual or potential effect of final or proposed rules, standards or interpretations by the SEC, Financial Accounting Standards Board, or other regulatory or standard setting bodies. [Note: Under SEC rules some consultations may be “audit” services and others may be “audit-related” services.] | | ü | | | | Not to exceed $5,000 per occurrence during the Pre-Approval Period |
| | | |
| Review of the Funds’ semi-annual financial statements | | ü | | | | Not to exceed $2,400 per set of financial statements per fund |
| | | |
| Reports to regulatory or government agencies related to the annual engagement | | ü | | | | Up to $5,000 per occurrence during the Pre-Approval Period |
| | | |
| Regulatory compliance assistance | | ü | | ü | | Not to exceed $5,000 per quarter |
| | | |
| Training courses | | | | ü | | Not to exceed $2,000 per course |
7
Appendix C
Pre-Approved Tax Services for the Pre-Approval Period September 22, 2010 through December 31, 2011
| | | | | | |
Service | | The Fund(s) | | Fund Affiliates | | Fee Range |
| Preparation of federal and state income tax returns and federal excise tax returns for the Funds including assistance and review with excise tax distributions. | | ü | | | | As presented to Audit Committee2 |
| | | |
| Review of IRC Sections 851(b) and 817(h) diversification testing on a real-time basis | | ü | | | | As presented to Audit Committee2 |
| | | |
| Assistance and advice regarding year-end reporting for 1099’s | | ü | | | | As presented to Audit Committee2 |
| | | |
| Tax assistance and advice regarding statutory, regulatory or administrative developments | | ü | | ü | | Not to exceed $5,000 in aggregate for the Funds or for the Funds’ investment adviser during the Pre-Approval Period |
| | | |
| Tax training courses | | | | ü | | Not to exceed $2,000 per course during the Pre-Approval Period |
| 2 | For new Funds launched during the Pre-Approval Period, the fee ranges pre-approved will be the same as those for existing Funds, as provided in KPMG’s Proposal or any Engagement Letter covering the period at issue. Fees in the Engagement Letter will be controlling. |
8
Appendix C, continued
| | | | | | |
Service | | The Fund(s) | | Fund Affiliates | | Fee Range |
| Tax services associated with Fund mergers | | ü | | ü | | Not to exceed $4,000 per fund per merger during the Pre-Approval Period |
| | | |
| Other tax-related assistance and consultation, including, without limitation, assistance in evaluating derivative financial instruments and international tax issues, qualification and distribution issues, and similar routine tax consultations | | ü | | | | Not to exceed $50,000 during the Pre-Approval Period |
9
Appendix D
Pre-Approved Other Services for the Pre-Approval Period September 22, 2010 through December 31, 2011
| | | | | | |
Service | | The Fund(s) | | Fund Affiliates | | Fee Range |
| Agreed-upon procedures for Class B share 12b-1 programs | | | | ü | | Not to exceed $60,000 during the Pre-Approval Period |
| | | |
Security counts performed pursuant to Rule 17f-2 of the 1940 Act (i.e., counts for Funds holding securities with affiliated sub-custodians) (Cost to be split 50% the funds and 50% ING Investments, LLC) | | ü | | ü | | Not to exceed $5,000 per Fund during the Pre-Approval Period |
10
Appendix E
Prohibited Non-Audit Services
Dated: 2010 and 2011
| | • | | Bookkeeping or other services related to the accounting records or financial statements of the Funds |
| | • | | Financial information systems design and implementation |
| | • | | Appraisal or valuation services, fairness opinions, or contribution-in-kind reports |
| | • | | Internal audit outsourcing services |
| | • | | Broker-dealer, investment adviser, or investment banking services |
| | • | | Expert services unrelated to the audit |
| | • | | Any other service that the Public Company Accounting Oversight Board determines, by regulation, is impermissible |
11
EXHIBIT A
ING BALANCED PORTFOLIO, INC.
ING STRATEGIC ALLOCATION PORTFOLIOS, INC.
ING INTERMEDIATE BOND PORTFOLIO
ING MONEY MARKET PORTFOLIO
ING VARIABLE FUNDS
ING VARIABLE PORTFOLIOS, INC.
ING SERIES FUND, INC.
12
| (e)(2) | Percentage of services referred to in 4(b) — (4)(d) that were approved by the audit committee |
100% of the services were approved by the audit committee.
| (f) | Percentage of hours expended attributable to work performed by other than full time employees of KPMG if greater than 50%. |
Not applicable.
| (g) | Non-Audit Fees: The non-audit fees billed by the registrant’s accountant for services rendered to the registrant, and rendered to the registrant’s investment adviser, and any entity controlling, controlled by, or under common control with the adviser that provides ongoing services to the registrant for each of the last two fiscal years of the registrant were $1,220.728 for year ended December 31, 2010 and $2,106,219 for year ended December 31, 2009. |
| (h) | Principal Accountants Independence: The Registrant’s Audit committee has considered whether the provision of non-audit services that were rendered to the registrant’s investment adviser and any entity controlling, controlled by, or under common control with the investment adviser that provides ongoing services to the registrant that were not pre-approved pursuant to Rule 2-01(c)(7)(ii) of Regulation S-X is compatible with maintaining KPMG’s independence. |
| Item 5. | Audit Committee of Listed Registrants. |
Not applicable.
13
| Item 6. | Schedule of Investments |
Summary schedule is included as part of the report to shareholders filed under Item 1 of this Form, if applicable.
14
| | |
| |
| | PORTFOLIO OF INVESTMENTS |
| |
| ING Strategic Allocation Conservative Portfolio | | as of December 31, 2010 |
| | | | | | | | | | | | |
| Shares | | | | | | | | Value | |
| AFFILIATED INVESTMENT COMPANIES: | | | 100.1 | % | | | | |
| | 412,830 | | | ING Alternative Beta Fund - Class I | | | | | | $ | 4,578,280 | |
| | 386,996 | | | ING Clarion Global Real Estate Portfolio - Class I | | | | | | | 3,773,211 | |
| | 337,577 | | | ING Growth and Income Portfolio - Class I | | | | | | | 7,406,442 | |
| | 4,164,782 | | | ING Intermediate Bond Portfolio - Class I | | | | | | | 50,268,918 | |
| | 1,409,292 | | | ING International Index Portfolio - Class I | | | | | | | 12,035,353 | |
| | 315,044 | | | ING MidCap Opportunities Portfolio - Class I | | | | | | | 3,682,871 | |
| | 152,612 | | | ING Small Company Portfolio - Class I | | | | | | | 2,798,899 | |
| | 814,711 | | | ING Tactical Asset Allocation Fund - Class I | | | | | | | 7,340,543 | |
| | | | | | | | | | | | |
| | | | Total Investments in Affiliated Investment Companies
( Cost $ 84,235,671 ) * | | | 100.1 | % | | $ | 91,884,517 | |
| | | | Other Assets and Liabilities - Net | | | (0.1 | ) | | | (46,981 | ) |
| | | | | | | | | | | | |
| | | | Net Assets | | | 100.0 | % | | $ | 91,837,536 | |
| | | | | | | | | | | | |
15
| | |
| |
| | PORTFOLIO OF INVESTMENTS |
| |
| ING Strategic Allocation Growth Portfolio | | as of December 31, 2010 |
| | | | | | | | | | | | |
| Shares | | | | | | | | Value | |
| AFFILIATED INVESTMENT COMPANIES: | | | 100.0 | % | | | | |
| | 1,082,447 | | | ING Alternative Beta Fund - Class I | | | | | | $ | 12,004,341 | |
| | 906,010 | | | ING Clarion Global Real Estate Portfolio - Class I | | | | | | | 8,833,601 | |
| | 1,501,575 | | | ING Growth and Income Portfolio - Class I | | | | | | | 32,944,564 | |
| | 2,127,335 | | | ING Intermediate Bond Portfolio - Class I | | | | | | | 25,676,937 | |
| | 4,872,674 | | | ING International Index Portfolio - Class I | | | | | | | 41,612,632 | |
| | 1,327,545 | | | ING MidCap Opportunities Portfolio - Class I | | | | | | | 15,519,000 | |
| | 762,157 | | | ING Small Company Portfolio - Class I | | | | | | | 13,977,956 | |
| | 2,479,504 | | | ING Tactical Asset Allocation Fund - Class I | | | | | | | 22,340,328 | |
| | | | | | | | | | | | |
| | | | Total Investments in Affiliated Investment Companies
( Cost $ 158,550,754 ) * | | | 100.0 | % | | $ | 172,909,359 | |
| | | | Other Assets and Liabilities - Net | | | (0.0 | ) | | | (61,680 | ) |
| | | | | | | | | | | | |
| | | | Net Assets | | | 100.0 | % | | $ | 172,847,679 | |
| | | | | | | | | | | | |
16
| | |
| |
| | PORTFOLIO OF INVESTMENTS |
| |
| ING Strategic Allocation Moderate Portfolio | | as of December 31, 2010 |
| | | | | | | | | | | | |
| Shares | | | | | | | | Value | |
| AFFILIATED INVESTMENT COMPANIES: | | | 100.0 | % | | | | |
| | 900,318 | | | ING Alternative Beta Fund - Class I | | | | | | $ | 9,984,526 | |
| | 879,148 | | | ING Clarion Global Real Estate Portfolio - Class I | | | | | | | 8,571,692 | |
| | 843,553 | | | ING Growth and Income Portfolio - Class I | | | | | | | 18,507,543 | |
| | 4,816,735 | | | ING Intermediate Bond Portfolio - Class I | | | | | | | 58,137,989 | |
| | 3,743,179 | | | ING International Index Portfolio - Class I | | | | | | | 31,966,750 | |
| | 858,788 | | | ING MidCap Opportunities Portfolio - Class I | | | | | | | 10,039,237 | |
| | 462,211 | | | ING Small Company Portfolio - Class I | | | | | | | 8,476,949 | |
| | 2,405,985 | | | ING Tactical Asset Allocation Fund - Class I | | | | | | | 21,677,926 | |
| | | | | | | | | | | | |
| | | | Total Investments in Affiliated Investment Companies
( Cost $ 153,072,912 ) * | | | 100.0 | % | | $ | 167,362,612 | |
| | | | Other Assets and Liabilities - Net | | | (0.0 | ) | | | (76,408 | ) |
| | | | | | | | | | | | |
| | | | Net Assets | | | 100.0 | % | | $ | 167,286,204 | |
| | | | | | | | | | | | |
17
| Item 7. | Disclosure of Proxy Voting Policies and Procedures for Closed-End Management Investment Companies. |
Not applicable.
| Item 8. | Portfolio Managers of Closed-End Management Investment Companies. |
Not applicable.
| Item 9. | Purchases of Equity Securities by Closed-End Management Investment Company and Affiliated Purchasers |
Not applicable.
| Item 10. | Submission of Matters to a Vote of Security Holders. |
The Nominating Committee operates pursuant to a Charter approved by the Board. The primary purpose of the Nominating Committee is to consider, evaluate and make recommendations to the Board with respect to the nomination and selection of Independent Trustees. In evaluating candidates, the Nominating Committee may consider a variety of factors, but specific qualifications of candidates for Board membership will be based on the needs of the Board at the time of nomination.
The Nominating Committee is willing to consider nominations received from shareholders and shall assess shareholder nominees in the same manner as it reviews nominees it identifies. A shareholder nominee for director should be submitted in writing to the Fund’s Secretary. Any such shareholder nomination should include sufficient background information concerning the candidate and should be received in a timely
18
manner. At a minimum, the following information as to each individual proposed for nomination as director should be included: the individual’s written consent to be named in the proxy statement as a nominee (if nominated) and to serve as a director (if elected), and all information relating to such individual that is required to be disclosed in a solicitation of proxies for election of directors, or is otherwise required, in each case under applicable federal securities laws, rules and regulations.
The Secretary shall submit all nominations received in a timely manner to the Nominating Committee. To be timely, any such submission must be delivered to the Fund’s Secretary not earlier than the 90th day prior to such meeting and not later than the close of business on the later of the 60th day prior to such meeting or the 10th day following the day on which public announcement of the date of the meeting is first made, by either disclosure in a press release or in a document publicly filed by the Fund with the SEC.
In evaluating a candidate for the position of Independent Trustee, including any candidate recommended by shareholders of the Fund, the Nominating Committee shall consider the following: (i) the candidate’s knowledge in matters relating to the mutual fund industry; (ii) any experience possessed by the candidate as a director or senior officer of other public companies; (iii) the candidate’s educational background, reputation for high ethical standards and professional integrity; (iv) any specific financial, technical or other expertise possessed by the candidate, and the extent to which such expertise would complement the Board’s existing mix of skills, core competencies and qualifications; (v) the candidate’s perceived ability to contribute to the ongoing functions of the Board, including the candidate’s ability and commitment to attend meetings regularly and work collaboratively with other members of the Board; (vi) the candidate’s ability to qualify as an Independent Trustee for purposes of the 1940 Act; and (vii) such other factors as the Committee determines to be relevant in light of the existing composition of the Board and any anticipated vacancies. Prior to making a final recommendation to the Board, the Committee shall conduct personal interviews with those candidates it concludes are the most qualified candidates.
19
| Item 11. | Controls and Procedures. |
| (a) | Based on our evaluation conducted within 90 days of the filing date, hereof, the design and operation of the registrant’s disclosure controls and procedures are effective to ensure that material information relating to the registrant is made known to the certifying officers by others within the appropriate entities, particularly during the period in which Forms N-CSR are being prepared, and the registrant’s disclosure controls and procedures allow timely preparation and review of the information for the registrant’s Form N-CSR and the officer certifications of such Form N-CSR. |
| (b) | There were no significant changes in the registrant’s internal controls that occurred during the second fiscal quarter of the period covered by this report that has materially affected, or is reasonably likely to materially affect, the registrant’s internal control over financial reporting. |
| | |
| |
| (a)(1) | | Code of Ethics pursuant to Item 2 of Form N-CSR is filed and attached hereto as EX-99.CODE ETH. |
| |
| (a)(2) | | A separate certification for each principal executive officer and principal financial officer of the registrant as required by Rule 30a-2 under the Act (17 CFR 270.30a-2) is attached hereto as EX-99.CERT. |
| |
| (b) | | The officer certifications required by Section 906 of the Sarbanes-Oxley Act of 2002 are attached hereto as EX-99.906CERT |
| |
| (3) | | Not applicable. |
20
SIGNATURES
Pursuant to the requirements of the Securities Exchange Act of 1934 and the Investment Company Act of 1940, the registrant has duly caused this report to be signed on its behalf by the undersigned, thereunto duly authorized.
(Registrant): ING Strategic Allocation Portfolios, Inc.
| | |
| |
| By | | /s/ Shaun P. Mathews |
| | Shaun P. Mathews |
| | President and Chief Executive Officer |
| |
| Date: | | March 3, 2011 |
Pursuant to the requirements of the Securities Exchange Act of 1934 and the Investment Company Act of 1940, this report has been signed below by the following persons on behalf of the registrant and in the capacities and on the dates indicated.
| | |
| |
| By | | /s/ Shaun P. Mathews |
| | Shaun P. Mathews |
| | President and Chief Executive Officer |
| |
| Date: | | March 3, 2011 |
| |
| By | | /s/ Todd Modic |
| | Todd Modic |
| | Senior Vice President and Chief Financial Officer |
| |
| Date: | | March 3, 2011 |