Table of Contents
OMB APPROVAL | ||
OMB Number: | 3235-0570 | |
Expires: | January 31, 2014 | |
Estimated average burden | ||
hours per response: | 20.6 | |
UNITED STATES
SECURITIES AND EXCHANGE COMMISSION
Washington, D.C. 20549
FORM N-CSR
CERTIFIED SHAREHOLDER REPORT OF
REGISTERED MANAGEMENT INVESTMENT COMPANIES
Investment Company Act file number: 811-8934
ING Strategic Allocation Portfolios, Inc.
(Exact name of registrant as specified in charter)
| 7337 E. Doubletree Ranch Rd., Scottsdale, AZ | 85258 | |
| (Address of principal executive offices) | (Zip code) |
The Corporation Trust Incorporated, 300 E. Lombard Street, Baltimore, MD 21201
(Name and address of agent for service)
Registrant’s telephone number, including area code: 1-800-992-0180
Date of fiscal year end: December 31
Date of reporting period: January 1, 2012 to December 31, 2012
Table of Contents
| Item 1. | Reports to Stockholders. |
The following is a copy of the report transmitted to stockholders pursuant to Rule 30e-1 under the Act (17 CFR 270.30e-1):
Table of Contents

Annual Report
December 31, 2012
Classes I and S
Strategic Allocation Funds-of-Funds
| n | ING Strategic Allocation Conservative Portfolio |
| n | ING Strategic Allocation Growth Portfolio |
| n | ING Strategic Allocation Moderate Portfolio |
This report is submitted for general information to shareholders of the ING Funds. It is not authorized for distribution to prospective shareholders unless accompanied or preceded by a prospectus which includes details regarding the funds’ investment objectives, risks, charges, expenses and other information. This information should be read carefully.
MUTUAL FUNDS |
|

Table of Contents
| 1 | ||||
| 2 | ||||
| 4 | ||||
| 9 | ||||
| 10 | ||||
| 11 | ||||
| 12 | ||||
| 13 | ||||
| 15 | ||||
| 17 | ||||
| 24 | ||||
| 27 | ||||
| 28 | ||||
| 32 | ||||
PROXY VOTING INFORMATION
A description of the policies and procedures that the Portfolios use to determine how to vote proxies related to portfolio securities is available: (1) without charge, upon request, by calling Shareholder Services toll-free at (800) 992-0180; (2) on the ING Funds’ website at www.inginvestment.com; and (3) on the U.S. Securities and Exchange Commission’s (“SEC’s”) website at www.sec.gov. Information regarding how the Portfolios voted proxies related to portfolio securities during the most recent 12-month period ended June 30 is available without charge on the ING Funds’ website at www.inginvestment.com and on the SEC’s website at www.sec.gov.
QUARTERLY PORTFOLIO HOLDINGS
The Portfolios file their complete schedule of portfolio holdings with the SEC for the first and third quarters of each fiscal year on Form N-Q. The Portfolios’ Forms N-Q are available on the SEC’s website at www.sec.gov. The Portfolios’ Forms N-Q may be reviewed and copied at the SEC’s Public Reference Room in Washington, DC, and information on the operation of the Public Reference Room may be obtained by calling (800) SEC-0330. The Portfolios’ Forms N-Q, as well as a complete portfolio of investments, are available without charge upon request from the Portfolios by calling Shareholder Services toll-free at (800) 992-0180.
Table of Contents

Looking Forward
Dear Shareholder,
Normally I end my letters by exhorting clients to keep their portfolios focused on long-term goals and well diversified in terms of assets and geography, and to discuss thoroughly any proposed investment changes with their financial advisors before taking action. This month, the reminders are up front to emphasize their importance as we conclude an eventful year and take a look forward.
A central theme over the past few years has been the impact government and central bank policymaking has had on economic and market outcomes. Private-sector forces, which tend to restore equilibrium in normal times, have not done enough to allow policymakers to scale back their involvement. An important reason for this is that the framework within which private-sector decisions are made requires substantial
overhaul; economic and monetary ties in the euro zone need to be strengthened, the U.S. must make some difficult fiscal decisions and the success of a number of economies depends on the introduction of structural reforms.
Since the world economy is still sluggish, supportive public policies will remain critical in 2013 and beyond. However, what might we anticipate over the long term? For insight into this question, I turned to a recent report published by the National Intelligence Council — a U.S. government agency that serves as a bridge between the U.S. intelligence and policy communities — entitled “Global Trends 2030: Alternative Worlds.” The report identifies four “megatrends” that the Council considers likely to emerge over the next 20 years or so. Among these are two that potentially carry implications for future investment themes. Individual empowerment will accelerate owing to growth of the global middle class, says the Council, potentially leading to a virtuous cycle of global economic expansion and creating dynamic markets for new products and technologies. Meanwhile, emerging nations will wield greater regional influence, and the health of the global economy increasingly will be linked to how well the developing world fares. This suggests that a portfolio of securities that provide exposure to developed and emerging market economies — such as ING Funds seeks to provide — may offer attractive potential for some time to come.
It’s important to remember that these are projections and subject to change, but they point to the value of keeping one’s portfolio well diversified to meet the challenges and take advantage of the opportunities that lie ahead.
All of us at ING Funds extend our best wishes for a happy and prosperous new year. We appreciate your continued confidence in us, and we look forward to serving your investment needs in the future.
Sincerely,

Shaun Mathews
President and Chief Executive Officer
ING Funds
January 4, 2013
The views expressed in the President’s Letter reflect those of the President as of the date of the letter. Any such views are subject to change at any time based upon market or other conditions and ING Funds disclaims any responsibility to update such views. These views may not be relied on as investment advice and because investment decisions for an ING Fund are based on numerous factors, may not be relied on as an indication of investment intent on behalf of any ING Fund. Reference to specific company securities should not be construed as recommendations or investment advice.
International investing poses special risks including currency fluctuation, economic and political risks not found in investments that are solely domestic.
1
Table of Contents
MARKET PERSPECTIVE: YEAR ENDED DECEMBER 31, 2012
In the early part of our fiscal year, global equities in the form of the MSCI World IndexSM measured in local currencies including net reinvested dividends, enjoyed the best first quarter rally since 1998. But in the two months from early April the MSCI World IndexSM slumped 11% as, for the third consecutive year, the basis of earlier optimism was undermined by events. The recovery from there was dramatic and the MSCI World IndexSM ended up 15.71% for the whole year, despite slow, patchy improvement in economic data, and investors’ frustration at the futile efforts of global leaders to resolve key problems. It came because central banks, by their actions, made risky assets much more attractive. (The MSCI World IndexSM returned 15.83% for the one year ended December 31, 2012, measured in U.S. dollars.)
Much of the early upbeat sentiment rested on a sharp improvement in the employment situation, probably the most important driver of economic activity. But the improvement faded fast: the three-month average of 245,000 new jobs reported in March slumped to only 94,000 in September, before rebounding less than one third of the way to 139,000 by December. The unemployment rate was still uncomfortably high at 7.7%.
By December, other economic data, from average hourly earnings growth to consumer confidence to retail sales were mostly inconclusive. Final third quarter gross domestic product (“GDP”) growth was revised up to 3.1%, but it didn’t feel like it and the next few quarters were expected to show growth at about half of this level.
The housing market however, seemed clearly to be on the mend. The final S&P/Case-Shiller 20-City Composite Home Price Index showed a 4.3% year-over-year gain, while new home sales in November were the highest since April 2010.
Also in the relative doldrums was China, responsible for much of global GDP growth in recent years. GDP increased by 7.4% in the third quarter of 2012 over the same quarter in 2011, the lowest rise in three years.
And yet despite the shortage of good news, the MSCI World IndexSM ended December 16% above the low point in early June. How could this be? One reason was a growing sense that the euro zone’s enduring sovereign debt crisis might at last be approaching the end-game. Another was a third round of quantitative easing launched by the Federal Reserve.
In the euro zone, amid ongoing protests against fiscal austerity, a €100 billion recapitalization bailout for Spain’s shaky banks was tortuously agreed upon in June. Attention returned to Greece in July where the continuation of the country’s bailout rested on the outcome of an examination by creditors of its parlous fiscal state. With prospects for the euro looking increasingly tenuous, European Central Bank (“ECB”) President Draghi came out on July 26 with a statement unprecedented in its explicitness, that the ECB was “ready to do whatever it takes to preserve the euro.” Under certain conditions, the ECB would buy without limitation the 1-3 year bonds of a country in difficulties.
In September, Federal Reserve Chairman Bernanke announced a third round of quantitative easing: an additional $40 billion of agency mortgage-backed securities would be purchased monthly. Then in December, “Operation Twist” was replaced by $45 billion in monthly Treasury purchases. Exceptionally low policy interest rates would remain at least until the unemployment rate fell to 6.5%.
So the year ended with central bankers sounding increasingly determined to underpin the euro and the prices of risky
assets. This was enough to drive those prices higher despite dark political clouds. In Europe, inter-governmental squabbling dangerously held back agreement on Greece’s next bailout tranche until November 27. In the U.S., the newly-elected Congress looked rather like the old one, and an ominous year-end cocktail of deflationary tax increases and spending cuts was forestalled by an eleventh-hour agreement on tax increases alone which postponed an even bigger conflict on spending and the debt ceiling until March.
In U.S. fixed income markets the Barclays Capital U.S. Aggregate Bond Index (“BCAB”) of investment grade bonds rose 4.22% in 2012. The Barclays Capital U.S. Treasury Index, a sub-index of the BCAB, returned only 1.99% as risk appetite recovered. By contrast the Barclays Capital U.S. Corporate Investment Grade Bond Index, also a sub-index of the BCAB, rose 9.82%, while the Barclays Capital High-Yield Bond — 2% Issuer Constrained Composite Index (not part of the BCAB index) gained 15.78%.
U.S. equities, represented by the S&P 500® Index including dividends, advanced 16.00% in the fiscal year. By sector, financials led the way with a return of 28.82%, followed by consumer discretionary with a return of 23.92%. No sector incurred a loss, but defensive utilities’ slim 1.29% gain reflected improved risk appetite. Operating earnings per share for S&P 500® companies set a new record in the second quarter of 2012, and barely slipped in the third.
In currency markets, the dollar fell 1.76% against the euro, which rebounded after Draghi’s July pronouncements, and 4.38% against the pound, which moved in sympathy with the euro, reflecting close trade ties. But the dollar gained 12.79% over the yen in 2012, as Japan’s parliamentary opposition won a landslide in December elections and promised unlimited monetary easing.
In international markets, the MSCI Japan® Index soared 21.57%, due mainly to the monetary stimulus referred to above. This was despite the effect on Japan’s export focused economy of the euro zone crisis, the slowdown in China and a return to recession. The MSCI Europe ex UK® Index rose 18.78% due to central bank initiatives, in the face of economic news that was unremittingly bad, also including a return to recession and record unemployment at 11.7%. The MSCI UK® Index added 10.19%, boosted by financials but held back by large, lagging energy and materials. The U.K. GDP grew 1% in the third quarter, but this was largely due to one-time statistical anomalies.
Parentheses denote a negative number.
All indices are unmanaged and investors cannot invest directly in an index. Past performance does not guarantee future results. The performance quoted represents past performance. Investment return and principal value of an investment will fluctuate, and shares, when redeemed, may be worth more or less than their original cost. The Portfolios’ performance is subject to change since the period’s end and may be lower or higher than the performance data shown. Please call (800) 992-0180 or log on to www.inginvestment.com to obtain performance data current to the most recent month end.
Market Perspective reflects the views of ING’s Chief Investment Risk Officer only through the end of the period, and is subject to change based on market and other conditions.
2
Table of Contents
BENCHMARK DESCRIPTIONS
| Index | Description | |
| Barclays Capital High Yield Bond — 2% Issuer Constrained Composite Index | An unmanaged index that includes all fixed-income securities having a maximum quality rating of Ba1, a minimum amount outstanding of $150 million, and at least one year to maturity. | |
| Barclays Capital U.S. Aggregate Bond Index | An unmanaged index of publicly issued investment grade U.S. Government, mortgage-backed, asset-backed and corporate debt securities. | |
| Barclays Capital U.S. Corporate Investment Grade Bond Index | An unmanaged index consisting of publicly issued, fixed rate, nonconvertible, investment grade debt securities. | |
| Barclays Capital U.S. Treasury Index | An unmanaged index that includes public obligations of the U.S. Treasury. Treasury bills, certain special issues, such as state and local government series bonds (SLGs), as well as U.S. Treasury TIPS and STRIPS, are excluded. | |
| MSCI Europe ex UK® Index | A free float-adjusted market capitalization index that is designed to measure developed market equity performance in Europe, excluding the UK. | |
| MSCI Japan® Index | A free float-adjusted market capitalization index that is designed to measure developed market equity performance in Japan. | |
| MSCI UK® Index | A free float-adjusted market capitalization index that is designed to measure developed market equity performance in the UK. | |
| MSCI World IndexSM | An unmanaged index that measures the performance of over 1,400 securities listed on exchanges in the U.S., Europe, Canada, Australia, New Zealand and the Far East. | |
| Russell 3000® Index | An unmanaged index that measures the performance of the largest 3000 U.S. companies representing approximately 98% of the investable U.S. equity market. | |
| S&P 500® Index | An unmanaged index that measures the performance of securities of approximately 500 large-capitalization companies whose securities are traded on major U.S. stock markets. | |
| S&P/Case-Shiller 20-City Composite Home Price Index | A composite index of the home price index for the top 20 Metropolitan Statistical Areas in the United States. The index is published monthly by Standard & Poor’s. |
3
Table of Contents
| ING STRATEGIC ALLOCATION PORTFOLIOS | PORTFOLIO MANAGERS’ REPORT |
ING Strategic Allocation Conservative Portfolio seeks to provide total return (i.e., income and capital growth, both realized and unrealized) consistent with preservation of capital. ING Strategic Allocation Growth Portfolio seeks to provide capital appreciation. ING Strategic Allocation Moderate Portfolio seeks to provide total return (i.e., income and capital appreciation, both realized and unrealized). ING Strategic Allocation Conservative Portfolio, ING Strategic Allocation Growth Portfolio and ING Strategic Allocation Moderate Portfolio (each a “Portfolio” and collectively, the “Portfolios”) are managed by Paul Zemsky, CFA, and Heather Hackett, CFA, Portfolio Managers of ING Investment Management Co. LLC — the Sub-Adviser.
Performance: For the year ended December 31, 2012, ING Strategic Allocation Conservative Portfolio’s Class I shares provided a total return of 12.31% compared to the Barclays Capital U.S. Aggregate Bond which returned 4.21% for the same period. For the year ended December 31, 2012, ING Strategic Allocation Growth Portfolio’s Class I shares provided a total return of 14.99% compared to the Russell 3000® Index, which returned 16.42% for the same period. For the year ended December 31, 2012, ING Strategic Allocation Moderate Portfolio’s Class I shares provided a total return of 13.60% compared to the Russell 3000® Index, which returned 16.42% for the same period.
Portfolio Specifics: Performance of our tactical asset allocation strategies was additive in 2012. At the
beginning of the year, with investors’ search for yield in full force as the European sovereign debt crisis quieted down and spreads narrowed, we held onto our underweight to U.S. bonds, with a corresponding overweight to high yield. This position was additive and we held it through the end of May. At that time, we eliminated the tactical allocation and implemented a high yield overweight on a strategic allocation basis. Within the ING Strategic Allocation Moderate Portfolio and ING Strategic Allocation Growth Portfolio, we held an overweight to large-cap core, with a corresponding underweight to emerging markets initiated in May and removed in September. This also contributed to relative results as domestic equity outperformed international equity.
Finally, toward the end of the year we initiated a large-cap value overweight with a large-cap growth underweight, which was slightly beneficial. Certain valuation metrics supported this position. Growth stocks outperformed for four years in a period of slow growth and deleveraging in the United States. We believe private sector deleveraging to be complete and anticipate a continued U.S. cyclical recovery, which would aid value stocks. We also believe value’s overweight to financials to be supported by continued quantitative easing from the U.S. Federal Reserve, strength in recovering U.S. housing and expectations of gradual improvement in European financial stocks. We believe the continued negative earnings momentum in technology, overweighted in growth, may reward our underweight growth position.
Target Allocations* | Conservative | Moderate | Growth | |||||||||||||||
US Large Cap Stocks | 28 | % | 34 | % | 40 | % | ||||||||||||
US Mid Cap Stocks | 6 | % | 9 | % | 16 | % | ||||||||||||
US Small Cap Stocks | 0 | % | 4 | % | 4 | % | ||||||||||||
Non US Intl Stocks | 8 | % | 11 | % | 17 | % | ||||||||||||
Emerging Markets Equity | 0 | % | 5 | % | 6 | % | ||||||||||||
Global REITs | 3 | % | 2 | % | 2 | % | ||||||||||||
Core Fixed Income | 42 | % | 30 | % | 10 | % | ||||||||||||
High Yield Bonds | 9 | % | 5 | % | 5 | % | ||||||||||||
Short Term Bonds | 4 | % | 0 | % | 0 | % | ||||||||||||
| 100 | % | 100 | % | 100 | % | |||||||||||||
| * | Portfolio’s current approximate target investment allocations (expressed as a percentage of its net assets) as of December 31, 2012. As these are target allocations, the actual allocations of each Portfolio’s assets may deviate from the percentages shown. Although the Portfolios expect to be fully invested at all times, they may maintain liquidity reserves to meet redemption requests. |
Portfolio holdings and characteristics are subject to change and may not be representative of current holdings and characteristics. The outlook for this Portfolio may differ from that presented for other ING Funds. Performance for the different classes of shares will vary based on differences in fees associated with each class.
4
Table of Contents
| PORTFOLIO MANAGERS’ REPORT | ING STRATEGIC ALLOCATION PORTFOLIOS |
At the beginning of December we initiated an overweight to non-U.S. equity, anticipating that fiscal support would be stronger in non-U.S. countries than in the U.S., where fiscal cliff austerity measures were just beginning. The overweight included MSCI EAFE® and emerging market equities, with a corresponding underweight to large-cap core domestic equities. We increased this position slightly toward the end of the year. We also initiated a modest high yield overweight, with a corresponding U.S. core fixed income underweight toward the end of 2012. The search for yield, plus the factors of further quantitative easing, continued low rates and diminished economic fears provided strong support, in our view, for an overweight to high yield bonds relative to core bonds.
The Strategic Allocation Portfolios use a proprietary asset allocation strategy to determine the percentage of each Portfolio’s net assets to invest in each of the Underlying Funds (the “Target Allocations”) which comprises each Portfolio’s respective strategic allocation benchmark (each a “Composite Benchmark” and collectively, the “Composite Benchmarks”) which returned 10.23%, 12.32% and 14.77% for the ING Strategic Allocation Conservative Portfolio Composite Benchmark, ING Strategic Allocation Moderate Portfolio Composite Benchmark and ING Strategic Allocation Growth Portfolio Composite Benchmark, respectively, for the one year ended December 31, 2012.
ING Strategic Allocation Conservative Portfolio’s Composite Benchmark outperformed the Barclays Capital U.S. Aggregate Bond Index because it contained asset classes that outperformed those in the index. ING Strategic Allocation Growth Portfolio’s Composite Benchmark and ING Strategic Allocation Moderate Portfolio’s Composite Benchmark underperformed the Russell 3000® Index because the Composite Benchmarks contained asset classes that underperformed those in the index. The ING Strategic Allocation Growth Portfolio slightly outperformed its Composite Benchmark, both before and after the deduction of
expenses, whereas the ING Strategic Allocation Conservative and ING Strategic Allocation Moderate Portfolios comfortably outperformed their Composite Benchmarks due to the outperformance of the ING Intermediate Bond Fund over the period.
Underlying managers contributed to performance in 2012. The highest relative returns came from ING Intermediate Bond Fund, ING International Index Portfolio and ING High Yield Bond Fund. The lowest relative returns came from ING Large Value Portfolio and ING Mid Cap Opportunities Portfolio.
Current Strategy and Outlook: Despite the thirteenth-hour compromise on the fiscal cliff, risks remain for 2013, but we continue to be optimistic. Global financial markets are currently indicating low levels of stress and turbulence. In addition, we anticipate that monetary and fiscal policies will be more expansionary outside the U.S. than within going forward. With many central banks expected to keep stimulating their economies, we could see further equity gains in 2013. Both European and Japanese valuations are more attractive than those in the U.S., but there are still questions about 2013-14 economic growth in both regions. Chinese economic developments continue to support a recovery in the equity market, and China should be expected to continue to be a catalyst for emerging markets. Looking ahead, we also believe that large-cap value has relatively attractive valuations. It has a concentration in financials, which stand to benefit from improvements in U.S. housing and a continuation of open-ended quantitative easing from the Federal Reserve. The Portfolios’ current positioning reflects these views, with an overweight to value over growth, an overweight to non-U.S. equity, as well as an overweight to high yield bonds. Fundamentals in the high yield asset class are currently attractive, with low defaults rates. We believe returns for high yield bonds may come from the higher coupon rather than broad price movement going forward.
5
Table of Contents
| ING STRATEGIC ALLOCATION CONSERVATIVE PORTFOLIO | PORTFOLIO MANAGERS’ REPORT |
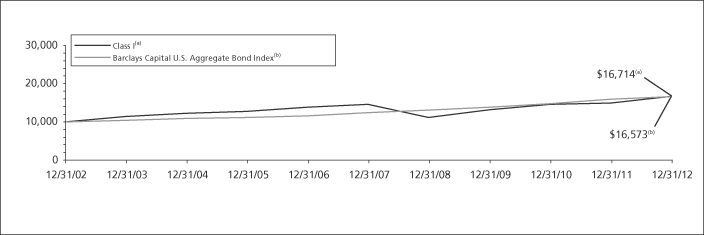
Average Annual Total Returns for the Periods Ended December 31, 2012 |
| |||||||||||||||||||
1 Year | 5 Year | 10 Year | Since | |||||||||||||||||
Class I | 12.31 | % | 2.73 | % | 5.27 | % | — | |||||||||||||
Class S | 12.02 | % | 2.48 | % | — | 3.70 | % | |||||||||||||
Barclays U.S. Aggregate Bond Index | 4.21 | % | 5.95 | % | 5.18 | % | 5.64 | %(1) | ||||||||||||
Based on a $10,000 initial investment, the graph and table above illustrate the total return of ING Strategic Allocation Conservative Portfolio against the index indicated. An index is unmanaged and has no cash in its portfolio, imposes no sales charges and incurs no operating expenses. An investor cannot invest directly in an index. The Portfolio’s performance is shown without the imposition of any expenses or charges which are, or may be, imposed under your annuity contract. Total returns would have been lower if such expenses or charges were included.
The performance graph and table do not reflect the deduction of taxes that a shareholder will pay on Portfolio distributions or the redemption of Portfolio shares.
The performance shown may include the effect of fee waivers and/or expense reimbursements by the Investment Adviser and/or other service providers, which have the effect of increasing total return. Had all fees and expenses been considered, the total returns would have been lower.
The performance update illustrates performance for a variable investment option available through a variable contract. The performance shown indicates past performance and is not a projection or prediction of future results. Actual investment
returns and principal value will fluctuate so that shares and/or units, at redemption, may be worth more or less than their original cost. Please log on to www.inginvestment.com or call (800) 992-0180 to get performance through the most recent month end.
This report contains statements that may be “forward-looking” statements. Actual results may differ materially from those projected in the “forward-looking” statements.
The views expressed in this report reflect those of the portfolio managers, only through the end of the period as stated on the cover. The portfolio managers’ views are subject to change at any time based on market and other conditions.
Portfolio holdings are subject to change daily.
| (1) | Since inception performance for the index is shown from August 1, 2005. |
Effective March 1, 2002, ING Investments, LLC began serving as investment adviser and ING Investment Management Co. LLC, the former investment adviser, began serving as sub-adviser to the Portfolio. Effective April 7, 2008, the Portfolio was converted from a mutual fund, which invested directly in securities, to a fund-of-funds, which invests in other mutual funds.
6
Table of Contents
| PORTFOLIO MANAGERS’ REPORT | ING STRATEGIC ALLOCATION GROWTH PORTFOLIO |
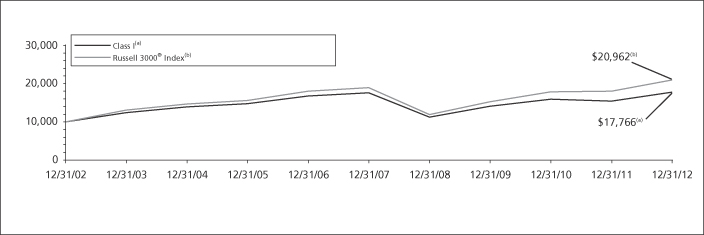
Average Annual Total Returns for the Periods Ended December 31, 2012 |
| |||||||||||||||||||
1 Year | 5 Year | 10 Year | Since | |||||||||||||||||
Class I | 14.99 | % | 0.21 | % | 5.92 | % | — | |||||||||||||
Class S | 14.71 | % | (0.03 | )% | — | 2.71 | % | |||||||||||||
Russell 3000® Index | 16.42 | % | 2.04 | % | 7.68 | % | 4.36 | %(1) | ||||||||||||
Based on a $10,000 initial investment, the graph and table above illustrate the total return of ING Strategic Allocation Growth Portfolio against the index indicated. An index is unmanaged and has no cash in its portfolio, imposes no sales charges and incurs no operating expenses. An investor cannot invest directly in an index. The Portfolio’s performance is shown without the imposition of any expenses or charges which are, or may be, imposed under your annuity contract. Total returns would have been lower if such expenses or charges were included.
The performance graph and table do not reflect the deduction of taxes that a shareholder will pay on Portfolio distributions or the redemption of Portfolio shares.
The performance shown may include the effect of fee waivers and/or expense reimbursements by the Investment Adviser and/or other service providers, which have the effect of increasing total return. Had all fees and expenses been considered, the total returns would have been lower.
The performance update illustrates performance for a variable investment option available through a variable contract. The performance shown indicates past performance and is not a projection or prediction of future results. Actual investment
returns and principal value will fluctuate so that shares and/or units, at redemption, may be worth more or less than their original cost. Please log on to www.inginvestment.com or call (800) 992-0180 to get performance through the most recent month end.
This report contains statements that may be “forward-looking” statements. Actual results may differ materially from those projected in the “forward-looking” statements.
The views expressed in this report reflect those of the portfolio managers, only through the end of the period as stated on the cover. The portfolio managers’ views are subject to change at any time based on market and other conditions.
Portfolio holdings are subject to change daily.
| (1) | Since inception performance for the index is shown from August 1, 2005. |
Effective March 1, 2002, ING Investments, LLC began serving as investment adviser and ING Investment Management Co. LLC, the former investment adviser, began serving as sub-adviser to the Portfolio. Effective April 7, 2008, the Portfolio was converted from a mutual fund, which invested directly in securities, to a fund-of-funds, which invests in other mutual funds.
7
Table of Contents
| ING STRATEGIC ALLOCATION MODERATE PORTFOLIO | PORTFOLIO MANAGERS’ REPORT |
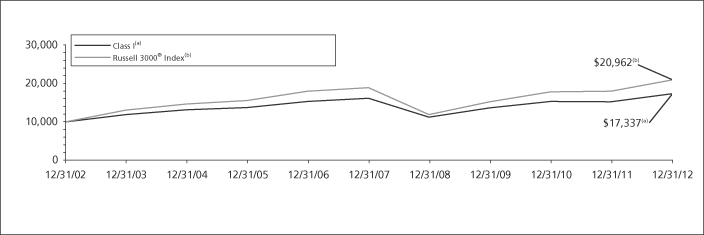
Average Annual Total Returns for the Periods Ended December 31, 2012 |
| |||||||||||||||||||
1 Year | 5 Year | 10 Year | Since | |||||||||||||||||
Class I | 13.60 | % | 1.40 | % | 5.64 | % | — | |||||||||||||
Class S | 13.45 | % | 1.15 | % | — | 3.34 | % | |||||||||||||
Russell 3000® Index | 16.42 | % | 2.04 | % | 7.68 | % | 4.91 | %(1) | ||||||||||||
Based on a $10,000 initial investment, the graph and table above illustrate the total return of ING Strategic Allocation Moderate Portfolio against the index indicated. An index is unmanaged and has no cash in its portfolio, imposes no sales charges and incurs no operating expenses. An investor cannot invest directly in an index. The Portfolio’s performance is shown without the imposition of any expenses or charges which are, or may be, imposed under your annuity contract. Total returns would have been lower if such expenses or charges were included.
The performance graph and table do not reflect the deduction of taxes that a shareholder will pay on Portfolio distributions or the redemption of Portfolio shares.
The performance shown may include the effect of fee waivers and/or expense reimbursements by the Investment Adviser and/or other service providers, which have the effect of increasing total return. Had all fees and expenses been considered, the total returns would have been lower.
The performance update illustrates performance for a variable investment option available through a variable contract. The performance shown indicates past performance and is not a projection or prediction of future results. Actual investment
returns and principal value will fluctuate so that shares and/or units, at redemption, may be worth more or less than their original cost. Please log on to www.inginvestment.com or call (800) 992-0180 to get performance through the most recent month end.
This report contains statements that may be “forward-looking” statements. Actual results may differ materially from those projected in the “forward-looking” statements.
The views expressed in this report reflect those of the portfolio managers, only through the end of the period as stated on the cover. The portfolio managers’ views are subject to change at any time based on market and other conditions.
Portfolio holdings are subject to change daily.
| (1) | Since inception performance for the index is shown from June 1, 2005. |
Effective March 1, 2002, ING Investments, LLC began serving as investment adviser and ING Investment Management Co. LLC, the former investment adviser, began serving as sub-adviser to the Portfolio. Effective April 7, 2008, the Portfolio was converted from a mutual fund, which invested directly in securities, to a fund-of-funds, which invests in other mutual funds.
8
Table of Contents
SHAREHOLDER EXPENSE EXAMPLES (UNAUDITED)
As a shareholder of a Portfolio, you incur two types of costs: (1) transaction costs, including sales charges (loads) on purchase payments, redemption fees, and exchange fees; and (2) ongoing costs, including management fees, distribution and/or service (12b-1) fees, and other Portfolio expenses. These Examples are intended to help you understand your ongoing costs (in dollars) of investing in a Portfolio and to compare these costs with the ongoing costs of investing in other mutual funds.
The Examples are based on an investment of $1,000 invested at the beginning of the period and held for the entire period from July 1, 2012 to December 31, 2012. The Portfolios’ expenses are shown without the imposition of any sales charges or fees. Expenses would have been higher if such charges were included.
Actual Expenses
The left section of the table shown below, “Actual Fund Return,” provides information about actual account values and actual expenses. You may use the information in this section, together with the amount you invested, to estimate the expenses that you paid over the period. Simply divide your account value by $1,000 (for example, an $8,600 account value divided by $1,000 = 8.6), then multiply the result by the number in the first section under the heading entitled “Expenses Paid During the Period” to estimate the expenses you paid on your account during this period.
Hypothetical Example for Comparison Purposes
The right section of the table shown below, “Hypothetical (5% return before expenses),” provides information about hypothetical account values and hypothetical expenses based on a Portfolio’s actual expense ratio and an assumed rate of return of 5% per year before expenses, which is not a Portfolio’s actual return. The hypothetical account values and expenses may not be used to estimate the actual ending account balance or expenses you paid for the period. You may use this information to compare the ongoing costs of investing in each Fund and other funds. To do so, compare this 5% hypothetical example with the 5% hypothetical examples that appear in the shareholder reports of the other funds.
Please note that the expenses shown in the table are meant to highlight your ongoing costs only and do not reflect any transactional costs, such as sales charges (loads), redemption fees, or exchange fees. Therefore, the hypothetical lines of the table are useful in comparing ongoing costs only, and will not help you determine the relative total costs of owning different funds. In addition, if these transactional costs were included, your costs would have been higher.
| Actual Portfolio Return | Hypothetical (5% return before expenses) | |||||||||||||||||||||||||||||||
Beginning | Ending | Annualized | Expenses Paid | Beginning | Ending | Annualized | Expenses Paid | |||||||||||||||||||||||||
ING Strategic Allocation Conservative Portfolio |
| |||||||||||||||||||||||||||||||
Class I | $ | 1,000.00 | $ | 1,065.00 | 0.09 | % | $ | 0.47 | $ | 1,000.00 | $ | 1,024.68 | 0.09 | % | $ | 0.46 | ||||||||||||||||
Class S | 1,000.00 | 1,064.50 | 0.34 | 1.76 | 1,000.00 | 1,023.43 | 0.34 | 1.73 | ||||||||||||||||||||||||
ING Strategic Allocation Growth Portfolio |
| |||||||||||||||||||||||||||||||
Class I | $ | 1,000.00 | $ | 1,082.80 | 0.06 | % | $ | 0.31 | $ | 1,000.00 | $ | 1,024.83 | 0.06 | % | $ | 0.31 | ||||||||||||||||
Class S | 1,000.00 | 1,081.20 | 0.31 | 1.62 | 1,000.00 | 1,023.58 | 0.31 | 1.58 | ||||||||||||||||||||||||
ING Strategic Allocation Moderate Portfolio |
| |||||||||||||||||||||||||||||||
Class I | $ | 1,000.00 | $ | 1,074.90 | 0.09 | % | $ | 0.47 | $ | 1,000.00 | $ | 1,024.68 | 0.09 | % | $ | 0.46 | ||||||||||||||||
Class S | 1,000.00 | 1,073.20 | 0.34 | 1.77 | 1,000.00 | 1,023.43 | 0.34 | 1.73 | ||||||||||||||||||||||||
| * | Expense ratios do not include expenses of the underlying funds. |
| ** | Expenses are equal to each Portfolio’s respective annualized expense ratios multiplied by the average account value over the period, multiplied by 184/366 to reflect the most recent fiscal half-year. |
9
Table of Contents
REPORT OF INDEPENDENT REGISTERED PUBLIC ACCOUNTING FIRM
The Shareholders and Board of Directors
ING Strategic Allocation Portfolios, Inc.
We have audited the accompanying statements of assets and liabilities, including the portfolios of investments, of ING Strategic Allocation Conservative Portfolio, ING Strategic Allocation Growth Portfolio, and ING Strategic Allocation Moderate Portfolio, each a series of ING Strategic Allocation Portfolios, Inc., as of December 31, 2012, and the related statements of operations for the year then ended, the statements of changes in net assets for each of the years in the two-year period then ended, and the financial highlights for each of the years in the five-year period then ended. These financial statements and financial highlights are the responsibility of management. Our responsibility is to express an opinion on these financial statements and financial highlights based on our audits.
We conducted our audits in accordance with the standards of the Public Company Accounting Oversight Board (United States). Those standards require that we plan and perform the audit to obtain reasonable assurance about whether the financial statements and financial highlights are free of material misstatement. An audit includes examining, on a test basis, evidence supporting the amounts and disclosures in the financial statements. Our procedures included confirmation of securities owned as of December 31, 2012, by correspondence with the custodian and transfer agent of the underlying funds. An audit also includes assessing the accounting principles used and significant estimates made by management, as well as evaluating the overall financial statement presentation. We believe that our audits provide a reasonable basis for our opinion.
In our opinion, the financial statements and financial highlights referred to above present fairly, in all material respects, the financial position of ING Strategic Allocation Conservative Portfolio, ING Strategic Allocation Growth Portfolio, and ING Strategic Allocation Moderate Portfolio as of December 31, 2012, and the results of their operations for the year then ended, the changes in their net assets for each of the years in the two-year period then ended, and the financial highlights for each of the years in the five-year period then ended, in conformity with U.S. generally accepted accounting principles.

Boston, Massachusetts
February 25, 2013
10
Table of Contents
STATEMENTS OF ASSETS AND LIABILITIESASOF DECEMBER 31, 2012
ING | ING | ING | ||||||||||
ASSETS: | ||||||||||||
Investments in securities at fair value* | $ | 1,701,266 | $ | 2,940,716 | $ | 2,944,618 | ||||||
Investments in affiliated underlying funds** | 81,304,030 | 139,618,640 | 140,508,590 | |||||||||
|
|
|
|
|
| |||||||
Total Investments at fair value | $ | 83,005,296 | $ | 142,559,356 | $ | 143,453,208 | ||||||
|
|
|
|
|
| |||||||
Cash | 69,269 | 8,741 | 8,769 | |||||||||
Foreign currencies at value*** | — | 2,067 | 985 | |||||||||
Receivables: | ||||||||||||
Investment in affiliated underlying funds sold | — | 1,144,302 | — | |||||||||
Fund shares sold | 94,283 | 2,760 | 32,647 | |||||||||
Dividends | 136,980 | 79,554 | 158,748 | |||||||||
Foreign tax reclaims | — | — | 348 | |||||||||
Prepaid expenses | 1,474 | 2,287 | 2,495 | |||||||||
Reimbursement due from manager | 1,263 | 16,789 | 12,370 | |||||||||
|
|
|
|
|
| |||||||
Total assets | 83,308,565 | 143,815,856 | 143,669,570 | |||||||||
|
|
|
|
|
| |||||||
LIABILITIES: | ||||||||||||
Payable for investments in affiliated underlying funds purchased | 233,015 | 79,656 | 190,335 | |||||||||
Payable for fund shares redeemed | 23 | 1,147,061 | 3,024 | |||||||||
Payable for investment management fees | 5,595 | 9,659 | 9,678 | |||||||||
Payable for administrative fees | 3,846 | 6,640 | 6,654 | |||||||||
Payable for distribution and shareholder service fees | 351 | 136 | 255 | |||||||||
Payable for directors fees | 420 | 720 | 721 | |||||||||
Other accrued expenses and liabilities | 41,499 | 31,636 | 35,852 | |||||||||
|
|
|
|
|
| |||||||
Total liabilities | 284,749 | 1,275,508 | 246,519 | |||||||||
|
|
|
|
|
| |||||||
NET ASSETS | $ | 83,023,816 | $ | 142,540,348 | $ | 143,423,051 | ||||||
|
|
|
|
|
| |||||||
NET ASSETS WERE COMPRISED OF: | ||||||||||||
Paid-in capital | $ | 89,688,025 | $ | 171,630,179 | $ | 166,686,031 | ||||||
Undistributed net investment income | 2,212,734 | 2,543,949 | 3,136,936 | |||||||||
Accumulated net realized loss | (15,285,849 | ) | (51,910,837 | ) | (44,102,854 | ) | ||||||
Net unrealized appreciation | 6,408,906 | 20,277,057 | 17,702,938 | |||||||||
|
|
|
|
|
| |||||||
NET ASSETS | $ | 83,023,816 | $ | 142,540,348 | $ | 143,423,051 | ||||||
|
|
|
|
|
| |||||||
| ||||||||||||
* Cost of investments in securities | $ | 1,658,197 | $ | 2,866,558 | $ | 2,870,261 | ||||||
** Cost of investments in affiliated underlying funds | $ | 74,938,193 | $ | 119,415,794 | $ | 122,880,064 | ||||||
*** Cost of foreign currencies | $ | — | $ | 2,014 | $ | 959 | ||||||
Class I | ||||||||||||
Net assets | $ | 81,359,610 | $ | 141,892,148 | $ | 142,200,187 | ||||||
Shares authorized | 100,000,000 | 100,000,000 | 100,000,000 | |||||||||
Par value | $ | 0.001 | $ | 0.001 | $ | 0.001 | ||||||
Shares outstanding | 7,303,259 | 12,907,247 | 12,869,179 | |||||||||
Net asset value and redemption price per share | $ | 11.14 | $ | 10.99 | $ | 11.05 | ||||||
Class S | ||||||||||||
Net assets | $ | 1,664,206 | $ | 648,200 | $ | 1,222,864 | ||||||
Shares authorized | 100,000,000 | 100,000,000 | 100,000,000 | |||||||||
Par value | $ | 0.001 | $ | 0.001 | $ | 0.001 | ||||||
Shares outstanding | 150,474 | 59,360 | 111,219 | |||||||||
Net asset value and redemption price per share | $ | 11.06 | $ | 10.92 | $ | 11.00 | ||||||
See Accompanying Notes to Financial Statements
11
Table of Contents
STATEMENTS OF OPERATIONSFORTHE YEAR ENDED DECEMBER 31, 2012
ING | ING | ING | ||||||||||
INVESTMENT INCOME: | ||||||||||||
Dividends from affiliated underlying funds | $ | 2,294,150 | $ | 2,627,933 | $ | 3,269,019 | ||||||
Dividends | 5,635 | 8,725 | 8,762 | |||||||||
|
|
|
|
|
| |||||||
Total investment income | 2,299,785 | 2,636,658 | 3,277,781 | |||||||||
|
|
|
|
|
| |||||||
EXPENSES: | ||||||||||||
Investment management fees | 67,274 | 115,236 | 115,460 | |||||||||
Distribution and shareholder service fees: | ||||||||||||
Class S | 3,791 | 1,596 | 2,935 | |||||||||
Transfer agent fees | 203 | 267 | 224 | |||||||||
Administrative service fees | 46,249 | 79,223 | 79,377 | |||||||||
Shareholder reporting expense | 17,778 | 30,644 | 31,049 | |||||||||
Registration fees | 241 | — | 112 | |||||||||
Professional fees | 28,890 | 41,873 | 42,090 | |||||||||
Custody and accounting expense | 6,720 | 12,766 | 11,865 | |||||||||
Directors fees | 2,523 | 4,321 | 4,330 | |||||||||
Miscellaneous expense | 14,973 | 7,259 | 10,460 | |||||||||
Interest expense | 5 | 13 | 11 | |||||||||
|
|
|
|
|
| |||||||
Total expenses | 188,647 | 293,198 | 297,913 | |||||||||
Net waived and reimbursed fees | (108,785 | ) | (204,516 | ) | (164,428 | ) | ||||||
|
|
|
|
|
| |||||||
Net expenses | 79,862 | 88,682 | 133,485 | |||||||||
|
|
|
|
|
| |||||||
Net investment income | 2,219,923 | 2,547,976 | 3,144,296 | |||||||||
|
|
|
|
|
| |||||||
REALIZED AND UNREALIZED GAIN (LOSS): | ||||||||||||
Net realized gain (loss) on: | ||||||||||||
Investments | 6,323,430 | 9,212,379 | 7,462,838 | |||||||||
Capital gain distributions from affiliated underlying funds | 186,926 | 938,908 | 660,661 | |||||||||
Foreign currency related transactions | — | 163 | — | |||||||||
|
|
|
|
|
| |||||||
Net realized gain | 6,510,356 | 10,151,450 | 8,123,499 | |||||||||
|
|
|
|
|
| |||||||
Net change in unrealized appreciation (depreciation) on: | ||||||||||||
Affiliated underlying funds | 997,407 | 7,214,611 | 6,992,083 | |||||||||
Foreign currency related transactions | — | 3 | 32 | |||||||||
|
|
|
|
|
| |||||||
Net change in unrealized appreciation (depreciation) | 997,407 | 7,214,614 | 6,992,115 | |||||||||
|
|
|
|
|
| |||||||
Net realized and unrealized gain | 7,507,763 | 17,366,064 | 15,115,614 | |||||||||
|
|
|
|
|
| |||||||
Increase in net assets resulting from operations | $ | 9,727,686 | $ | 19,914,040 | $ | 18,259,910 | ||||||
|
|
|
|
|
| |||||||
* Foreign taxes withheld | $ | — | $ | 2,297 | $ | 959 | ||||||
See Accompanying Notes to Financial Statements
12
Table of Contents
STATEMENTS OF CHANGES IN NET ASSETS
ING Strategic Allocation | ING Strategic Allocation | |||||||||||||||
Year Ended December 31, 2012 | Year Ended December 31, 2011 | Year Ended December 31, 2012 | Year Ended December 31, 2011 | |||||||||||||
FROM OPERATIONS: | ||||||||||||||||
Net investment income | $ | 2,219,923 | $ | 2,255,975 | $ | 2,547,976 | $ | 2,194,582 | ||||||||
Net realized gain (loss) | 6,510,356 | 1,660,213 | 10,151,450 | (4,489,769 | ) | |||||||||||
Net change in unrealized appreciation (depreciation) | 997,407 | (2,237,346 | ) | 7,214,614 | (1,296,236 | ) | ||||||||||
|
|
|
|
|
|
|
| |||||||||
Increase (decrease) in net assets resulting from operations | 9,727,686 | 1,678,842 | 19,914,040 | (3,591,423 | ) | |||||||||||
|
|
|
|
|
|
|
| |||||||||
FROM DISTRIBUTIONS TO SHAREHOLDERS: | ||||||||||||||||
Net investment income: | ||||||||||||||||
Class I | (2,230,977 | ) | (3,394,780 | ) | (2,207,961 | ) | (4,132,232 | ) | ||||||||
Class S | (37,094 | ) | (60,314 | ) | (6,963 | ) | (41,575 | ) | ||||||||
|
|
|
|
|
|
|
| |||||||||
Total distributions | (2,268,071 | ) | (3,455,094 | ) | (2,214,924 | ) | (4,173,807 | ) | ||||||||
|
|
|
|
|
|
|
| |||||||||
FROM CAPITAL SHARE TRANSACTIONS: | ||||||||||||||||
Net proceeds from sale of shares | 8,291,546 | 9,470,306 | 4,520,129 | 4,766,752 | ||||||||||||
Reinvestment of distributions | 2,268,071 | 3,455,094 | 2,214,924 | 4,173,807 | ||||||||||||
|
|
|
|
|
|
|
| |||||||||
| 10,559,617 | 12,925,400 | 6,735,053 | 8,940,559 | |||||||||||||
Cost of shares redeemed | (17,198,331 | ) | (20,783,769 | ) | (21,156,507 | ) | (34,760,322 | ) | ||||||||
|
|
|
|
|
|
|
| |||||||||
Net decrease in net assets resulting from capital share transactions | (6,638,714 | ) | (7,858,369 | ) | (14,421,454 | ) | (25,819,763 | ) | ||||||||
|
|
|
|
|
|
|
| |||||||||
Net increase (decrease) in net assets | 820,901 | (9,634,621 | ) | 3,277,662 | (33,584,993 | ) | ||||||||||
|
|
|
|
|
|
|
| |||||||||
NET ASSETS: | ||||||||||||||||
Beginning of year or period | 82,202,915 | 91,837,536 | 139,262,686 | 172,847,679 | ||||||||||||
|
|
|
|
|
|
|
| |||||||||
End of year or period | $ | 83,023,816 | $ | 82,202,915 | $ | 142,540,348 | $ | 139,262,686 | ||||||||
|
|
|
|
|
|
|
| |||||||||
Undistributed net investment income at end of year or period | $ | 2,212,734 | $ | 2,254,605 | $ | 2,543,949 | $ | 2,193,907 | ||||||||
|
|
|
|
|
|
|
| |||||||||
See Accompanying Notes to Financial Statements
13
Table of Contents
STATEMENTS OF CHANGES IN NET ASSETS
ING Strategic Allocation | ||||||||
Year Ended December 31, 2012 | Year Ended December 31, 2011 | |||||||
FROM OPERATIONS: | ||||||||
Net investment income | $ | 3,144,296 | $ | 3,021,127 | ||||
Net realized gain | 8,123,499 | 172,986 | ||||||
Net change in unrealized appreciation (depreciation) | 6,992,115 | (3,578,899 | ) | |||||
|
|
|
| |||||
Increase (decrease) in net assets resulting from operations | 18,259,910 | (384,786 | ) | |||||
|
|
|
| |||||
FROM DISTRIBUTIONS TO SHAREHOLDERS: | ||||||||
Net investment income: | ||||||||
Class I | (3,020,695 | ) | (5,188,279 | ) | ||||
Class S | (19,810 | ) | (86,901 | ) | ||||
|
|
|
| |||||
Total distributions | (3,040,505 | ) | (5,275,180 | ) | ||||
|
|
|
| |||||
FROM CAPITAL SHARE TRANSACTIONS: | ||||||||
Net proceeds from sale of shares | 5,332,861 | 6,083,963 | ||||||
Reinvestment of distributions | 3,040,505 | 5,275,180 | ||||||
|
|
|
| |||||
| 8,373,366 | 11,359,143 | |||||||
Cost of shares redeemed | (20,357,242 | ) | (32,797,859 | ) | ||||
|
|
|
| |||||
Net decrease in net assets resulting from capital share transactions | (11,983,876 | ) | (21,438,716 | ) | ||||
|
|
|
| |||||
Net increase (decrease) in net assets | 3,235,529 | (27,098,682 | ) | |||||
|
|
|
| |||||
NET ASSETS: | ||||||||
Beginning of year or period | 140,187,522 | 167,286,204 | ||||||
|
|
|
| |||||
End of year or period | $ | 143,423,051 | $ | 140,187,522 | ||||
|
|
|
| |||||
Undistributed net investment income at end of year or period | $ | 3,136,936 | $ | 3,019,537 | ||||
|
|
|
| |||||
See Accompanying Notes to Financial Statements
14
Table of Contents
Selected data for a share of beneficial interest outstanding throughout each year or period.
| Income (loss) from investment operations | Less distributions | Ratios to average net assets | Supplemental data | |||||||||||||||||||||||||||||||||||||||||||||||||||||||||||||||||
| Net asset value, beginning of year or period | Net investment income (loss) | Net realized and unrealized gain (loss) | Total from investment operations | From net investment income | From net realized gains | From return of capital | Total distributions | Payment by affiliate | Net asset value, end of year or period | Total Return(1) | Expenses before reductions/ additions(2)(3)(4) | Expenses net of fee waivers and/ or recoupments if any(2)(3)(4) | Expense net of all reductions/ additions(2)(3)(4) | Net investment income (loss)(2)(4) | Net assets, end of year or period | Portfolio turnover rate | ||||||||||||||||||||||||||||||||||||||||||||||||||||
Year or period ended | ($) | ($) | ($) | ($) | ($) | ($) | ($) | ($) | ($) | ($) | (%) | (%) | (%) | (%) | (%) | ($000’s) | (%) | |||||||||||||||||||||||||||||||||||||||||||||||||||
ING Strategic Allocation Conservative Portfolio | ||||||||||||||||||||||||||||||||||||||||||||||||||||||||||||||||||||
Class I | ||||||||||||||||||||||||||||||||||||||||||||||||||||||||||||||||||||
12-31-12 | 10.19 | 0.28 | • | 0.96 | 1.24 | 0.29 | — | — | 0.29 | — | 11.14 | 12.31 | 0.22 | 0.09 | 0.09 | 2.64 | 81,360 | 107 | ||||||||||||||||||||||||||||||||||||||||||||||||||
12-31-11 | 10.41 | 0.27 | • | (0.07 | ) | 0.20 | 0.42 | — | — | 0.42 | — | 10.19 | 1.79 | 0.22 | 0.06 | 0.06 | 2.63 | 80,825 | 59 | |||||||||||||||||||||||||||||||||||||||||||||||||
12-31-10 | 9.80 | 0.36 | • | 0.70 | 1.06 | 0.45 | — | — | 0.45 | — | 10.41 | 11.07 | 0.20 | 0.09 | 0.09 | 3.66 | 90,086 | 88 | ||||||||||||||||||||||||||||||||||||||||||||||||||
12-31-09 | 9.13 | 0.45 | • | 1.03 | 1.48 | 0.81 | — | — | 0.81 | — | 9.80 | 18.00 | 0.20 | 0.10 | 0.10 | 5.04 | 93,792 | 56 | ||||||||||||||||||||||||||||||||||||||||||||||||||
12-31-08 | 13.51 | 0.51 | (3.39 | ) | (2.88 | ) | 0.51 | 0.99 | — | 1.50 | — | 9.13 | (23.65 | ) | 0.39 | 0.27 | † | 0.27 | † | 3.99 | † | 86,257 | 277 | |||||||||||||||||||||||||||||||||||||||||||||
Class S | ||||||||||||||||||||||||||||||||||||||||||||||||||||||||||||||||||||
12-31-12 | 10.12 | 0.24 | 0.96 | 1.20 | 0.26 | — | — | 0.26 | — | 11.06 | 12.02 | 0.47 | 0.34 | 0.34 | 2.51 | 1,664 | 107 | |||||||||||||||||||||||||||||||||||||||||||||||||||
12-31-11 | 10.34 | 0.24 | • | (0.07 | ) | 0.17 | 0.39 | — | — | 0.39 | — | 10.12 | 1.53 | 0.47 | 0.31 | 0.31 | 2.29 | 1,378 | 59 | |||||||||||||||||||||||||||||||||||||||||||||||||
12-31-10 | 9.73 | 0.34 | 0.70 | 1.04 | 0.43 | — | — | 0.43 | — | 10.34 | 10.91 | 0.45 | 0.34 | 0.34 | 3.53 | 1,752 | 88 | |||||||||||||||||||||||||||||||||||||||||||||||||||
12-31-09 | 9.06 | 0.43 | • | 1.02 | 1.45 | 0.78 | — | — | 0.78 | — | 9.73 | 17.79 | 0.45 | 0.35 | 0.35 | 4.89 | 1,631 | 56 | ||||||||||||||||||||||||||||||||||||||||||||||||||
12-31-08 | 13.44 | 0.39 | (3.29 | ) | (2.90 | ) | 0.49 | 0.99 | — | 1.48 | — | 9.06 | (23.92 | ) | 0.64 | 0.52 | † | 0.52 | † | 3.89 | † | 1,368 | 277 | |||||||||||||||||||||||||||||||||||||||||||||
ING Strategic Allocation Growth Portfolio | ||||||||||||||||||||||||||||||||||||||||||||||||||||||||||||||||||||
Class I | ||||||||||||||||||||||||||||||||||||||||||||||||||||||||||||||||||||
12-31-12 | 9.70 | 0.18 | • | 1.27 | 1.45 | 0.16 | — | — | 0.16 | — | 10.99 | 14.99 | 0.20 | 0.06 | 0.06 | 1.77 | 141,892 | 74 | ||||||||||||||||||||||||||||||||||||||||||||||||||
12-31-11 | 10.24 | 0.14 | • | (0.41 | ) | (0.27 | ) | 0.27 | — | — | 0.27 | — | 9.70 | (2.92 | ) | 0.20 | 0.05 | 0.05 | 1.42 | 138,642 | 53 | |||||||||||||||||||||||||||||||||||||||||||||||
12-31-10 | 9.39 | 0.23 | • | 0.97 | 1.20 | 0.35 | — | — | 0.35 | — | 10.24 | 13.06 | 0.19 | 0.09 | 0.09 | 2.47 | 171,094 | 36 | ||||||||||||||||||||||||||||||||||||||||||||||||||
12-31-09 | 9.04 | 0.37 | 1.48 | 1.85 | 0.97 | 0.53 | — | 1.50 | — | 9.39 | 25.37 | 0.20 | 0.13 | 0.13 | 4.12 | 168,071 | 75 | |||||||||||||||||||||||||||||||||||||||||||||||||||
12-31-08 | 16.57 | 0.38 | (5.65 | ) | (5.27 | ) | 0.33 | 1.93 | — | 2.26 | — | 9.04 | (36.13 | ) | 0.39 | 0.33 | † | 0.33 | † | 2.83 | † | 146,862 | 235 | |||||||||||||||||||||||||||||||||||||||||||||
Class S | ||||||||||||||||||||||||||||||||||||||||||||||||||||||||||||||||||||
12-31-12 | 9.62 | 0.16 | • | 1.25 | 1.41 | 0.11 | — | — | 0.11 | — | 10.92 | 14.71 | 0.45 | 0.31 | 0.31 | 1.51 | 648 | 74 | ||||||||||||||||||||||||||||||||||||||||||||||||||
12-31-11 | 10.16 | 0.12 | • | (0.42 | ) | (0.30 | ) | 0.24 | — | — | 0.24 | — | 9.62 | (3.16 | ) | 0.45 | 0.30 | 0.30 | 1.14 | 620 | 53 | |||||||||||||||||||||||||||||||||||||||||||||||
12-31-10 | 9.32 | 0.21 | • | 0.96 | 1.17 | 0.33 | — | — | 0.33 | — | 10.16 | 12.81 | 0.44 | 0.34 | 0.34 | 2.22 | 1,753 | 36 | ||||||||||||||||||||||||||||||||||||||||||||||||||
12-31-09 | 8.99 | 0.32 | • | 1.49 | 1.81 | 0.95 | 0.53 | — | 1.48 | — | 9.32 | 24.90 | 0.45 | 0.38 | 0.38 | 3.88 | 1,715 | 75 | ||||||||||||||||||||||||||||||||||||||||||||||||||
12-31-08 | 16.49 | 0.32 | • | (5.57 | ) | (5.25 | ) | 0.32 | 1.93 | — | 2.25 | — | 8.99 | (36.19 | ) | 0.64 | 0.58 | † | 0.58 | † | 2.72 | † | 1,322 | 235 | ||||||||||||||||||||||||||||||||||||||||||||
ING Strategic Allocation Moderate Portfolio | ||||||||||||||||||||||||||||||||||||||||||||||||||||||||||||||||||||
Class I | ||||||||||||||||||||||||||||||||||||||||||||||||||||||||||||||||||||
12-31-12 | 9.93 | 0.23 | • | 1.11 | 1.34 | 0.22 | — | — | 0.22 | — | 11.05 | 13.60 | 0.20 | 0.09 | 0.09 | 2.18 | 142,200 | 84 | ||||||||||||||||||||||||||||||||||||||||||||||||||
12-31-11 | 10.31 | 0.20 | • | (0.24 | ) | (0.04 | ) | 0.34 | — | — | 0.34 | — | 9.93 | (0.57 | ) | 0.21 | 0.07 | 0.07 | 1.97 | 139,057 | 57 | |||||||||||||||||||||||||||||||||||||||||||||||
12-31-10 | 9.58 | 0.30 | • | 0.83 | 1.13 | 0.40 | — | — | 0.40 | — | 10.31 | 12.03 | 0.19 | 0.10 | 0.10 | 3.15 | 164,412 | 60 | ||||||||||||||||||||||||||||||||||||||||||||||||||
12-31-09 | 9.10 | 0.39 | • | 1.30 | 1.69 | 0.91 | 0.30 | — | 1.21 | — | 9.58 | 21.84 | 0.21 | 0.13 | 0.13 | 4.47 | 166,449 | 62 | ||||||||||||||||||||||||||||||||||||||||||||||||||
12-31-08 | 15.16 | 0.44 | (4.54 | ) | (4.10 | ) | 0.40 | 1.56 | — | 1.96 | — | 9.10 | (30.48 | ) | 0.38 | 0.31 | † | 0.31 | † | 3.35 | † | 152,965 | 255 | |||||||||||||||||||||||||||||||||||||||||||||
See Accompanying Notes to Financial Statements
15
Table of Contents
FINANCIAL HIGHLIGHTS (CONTINUED)
| Income (loss) from investment operations | Less distributions | Ratios to average net assets | Supplemental data | |||||||||||||||||||||||||||||||||||||||||||||||||||||||||||||||||
| Net asset value, beginning of year or period | Net investment income (loss) | Net realized and unrealized gain (loss) | Total from investment operations | From net investment income | From net realized gains | From return of capital | Total distributions | Payment by affiliate | Net asset value, end of year or period | Total Return(1) | Expenses before reductions/ additions(2)(3)(4) | Expenses net of fee waivers and/ or recoupments if any(2)(3)(4) | Expense net of all reductions/ additions(2)(3)(4) | Net investment income (loss)(2)(4) | Net assets, end of year or period | Portfolio turnover rate | ||||||||||||||||||||||||||||||||||||||||||||||||||||
Year or period ended | ($) | ($) | ($) | ($) | ($) | ($) | ($) | ($) | ($) | ($) | (%) | (%) | (%) | (%) | (%) | ($000’s) | (%) | |||||||||||||||||||||||||||||||||||||||||||||||||||
ING Strategic Allocation Moderate Portfolio (Continued) | ||||||||||||||||||||||||||||||||||||||||||||||||||||||||||||||||||||
Class S | ||||||||||||||||||||||||||||||||||||||||||||||||||||||||||||||||||||
12-31-12 | 9.86 | 0.21 | • | 1.11 | 1.32 | 0.18 | — | — | 0.18 | — | 11.00 | 13.45 | 0.45 | 0.34 | 0.34 | 1.96 | 1,223 | 84 | ||||||||||||||||||||||||||||||||||||||||||||||||||
12-31-11 | 10.25 | 0.15 | • | (0.22 | ) | (0.07 | ) | 0.32 | — | — | 0.32 | — | 9.86 | (0.91 | ) | 0.46 | 0.32 | 0.32 | 1.44 | 1,131 | 57 | |||||||||||||||||||||||||||||||||||||||||||||||
12-31-10 | 9.53 | 0.27 | 0.83 | 1.10 | 0.38 | — | — | 0.38 | — | 10.25 | 11.77 | 0.44 | 0.35 | 0.35 | 2.92 | 2,874 | 60 | |||||||||||||||||||||||||||||||||||||||||||||||||||
12-31-09 | 9.05 | 0.38 | 1.28 | 1.66 | 0.88 | 0.30 | — | 1.18 | — | 9.53 | 21.60 | 0.46 | 0.38 | 0.38 | 4.34 | 2,703 | 62 | |||||||||||||||||||||||||||||||||||||||||||||||||||
12-31-08 | 15.10 | 0.37 | • | (4.48 | ) | (4.11 | ) | 0.38 | 1.56 | — | 1.94 | — | 9.05 | (30.68 | ) | 0.63 | 0.56 | † | 0.56 | † | 3.30 | † | 2,192 | 255 | ||||||||||||||||||||||||||||||||||||||||||||
| (1) | Total return is calculated assuming reinvestment of all dividends, capital gain distributions and return of capital distributions, if any, at net asset value and does not reflect the effect of insurance contract charges. Total return for periods less than one year is not annualized. |
| (2) | Annualized for periods less than one year. |
| (3) | Expense ratios do not include expenses of underlying funds and do not include fees and expenses charged under the variable annuity contract or variable life insurance policy. |
| (4) | Expense ratios reflect operating expenses of a Portfolio. Expenses before reductions/additions do not reflect amounts reimbursed by an Investment Adviser and/or Distributor or reductions from brokerage service arrangements or other expense offset arrangements and do not represent the amount paid by a Portfolio during periods when reimbursements or reductions occur. Expenses net of fee waivers reflect expenses after reimbursement by an Investment Adviser and/or Distributor but prior to reductions from brokerage service arrangements or other expense offset arrangements. Expenses net of all reductions/additions represent the net expenses paid by a Portfolio. Net investment income (loss) is net of all such additions or reductions. |
| • | Calculated using average number of shares outstanding throughout the period. |
| † | Impact of waiving the advisory fee for the ING Institutional Prime Money Market Fund holding has less than 0.005% impact on the expense ratio and net investment income or loss ratio. |
See Accompanying Notes to Financial Statements
16
Table of Contents
NOTES TO FINANCIAL STATEMENTSASOF DECEMBER 31, 2012
NOTE 1 — ORGANIZATION
ING Strategic Allocation Portfolios, Inc. (the “Company”) is registered under the Investment Company Act of 1940, as amended (“1940 Act”), as an open-end management investment company.
The Company was incorporated under the laws of Maryland on October 14, 1994. There are three separate investment series (each a “Portfolio”, collectively the “Portfolios”) that comprise the Company: ING Strategic Allocation Conservative Portfolio (“Strategic Allocation Conservative”), ING Strategic Allocation Growth Portfolio (“Strategic Allocation Growth”), and ING Strategic Allocation Moderate Portfolio (“Strategic Allocation Moderate”). Each Portfolio currently seeks to achieve its investment objective by investing in other ING Funds (“Underlying Funds”) and each uses asset allocation strategies to determine how to invest in the Underlying Funds. The Underlying Funds, in turn, invest in equity and fixed-income securities and money market instruments.
Each Portfolio offers Class I and Class S shares. Each class has equal rights as to class and voting privileges. The two classes differ principally in the applicable distribution and service fees. Shareholders of each class also bear certain expenses that pertain to that particular class. All shareholders bear the common expenses of the Portfolios and earn income and realized gains/losses from a Portfolio pro rata based on the average daily net assets of each class, without distinction between share classes. Expenses that are specific to a Portfolio or a class are charged directly to that Portfolio or class. Other operating expenses shared by several Portfolios are generally allocated among those Portfolios based on average net assets. Distributions are determined separately for each class based on income and expenses allocable to each class. Realized gain distributions are allocated to each class pro rata based on the shares outstanding of each class on the date of distribution. Differences in per share dividend rates generally result from differences in separate class expenses, including distribution and shareholder service fees, if applicable.
ING Investments, LLC serves as the investment adviser (“ING Investments” or the “Investment Adviser”) to the Portfolios. ING Investment Management Co. LLC serves as the Sub-Adviser (“ING IIM” or the “Sub-Adviser”) to the Portfolios. ING Funds Services, LLC serves as the administrator (“IFS” or the “Administrator”) for the Portfolios. ING Investments Distributor, LLC (“IID” or the “Distributor”) serves as the principal underwriter to the Portfolios.
NOTE 2 — SIGNIFICANT ACCOUNTING POLICIES
The following significant accounting policies are consistently followed by the Portfolios in the preparation of their financial statements. Such policies are in conformity with U.S. generally accepted accounting principles (“GAAP”) for investment companies.
A. Security Valuation. All investments in Underlying Funds are recorded at their estimated fair value, as described below. The valuations of the Portfolios’ investments in Underlying Funds are based on the net asset value of the Underlying Funds each business day.
Fair value is defined as the price that a Portfolio would receive to sell an asset or pay to transfer a liability in an orderly transaction between market participants at the measurement date. Each investment asset or liability of a Portfolio is assigned a level at measurement date based on the significance and source of the inputs to its valuation. Quoted prices in active markets for identical securities are classified as “Level 1,” inputs other than quoted prices for an asset or liability that are observable are classified as “Level 2” and unobservable inputs, including the sub-adviser’s judgment about the assumptions that a market participant would use in pricing an asset or liability are classified as “Level 3.” The inputs used for valuing securities are not necessarily an indication of the risks associated with investing in those securities. Short-term securities of sufficient credit quality which are valued at amortized cost, which approximates fair value, are generally considered to be Level 2 securities under applicable accounting rules. A table summarizing each Portfolio’s investments under these levels of classification is included following the Portfolio of Investments.
The Board has adopted methods for valuing securities and other assets in circumstances where market quotes are not readily available, and has delegated the responsibility for applying the valuation methods to the “Pricing Committee” as established by the fund’s Administrator. The Pricing Committee considers all facts they deem relevant that are reasonably available, through either public information or information available to the Investment Adviser or sub-adviser, when determining the fair value of the security. In the event that a security or asset cannot be valued pursuant to one of the valuation methods established by the Board, the fair value of the security or asset will be determined in good faith by the Pricing Committee. When a Portfolio uses these fair valuation methods that use significant unobservable inputs to determine its NAV, securities will be priced by a method that the
17
Table of Contents
NOTES TO FINANCIAL STATEMENTSASOF DECEMBER 31, 2012 (CONTINUED)
NOTE 2 — SIGNIFICANT ACCOUNTING POLICIES (continued)
Pricing Committee believes accurately reflects fair value and are categorized as Level 3 of the fair value hierarchy. The methodologies used for valuing securities are not necessarily an indication of the risks of investing in those securities valued in good faith at fair value nor can it be assured a Portfolio can obtain the fair value assigned to a security if they were to sell the security.
To assess the continuing appropriateness of security valuations, the Pricing Committee may compare prior day prices, prices on comparable securities, and traded prices to the prior or current day prices and the Pricing Committee challenges those prices exceeding certain tolerance levels with the third party pricing service or broker source. For those securities valued in good faith at fair value, the Pricing Committee reviews and affirms the reasonableness of the valuation on a regular basis after considering all relevant information that is reasonably available.
For fair valuations using significant unobservable inputs, U.S. GAAP requires a reconciliation of the beginning to ending balances for reported fair values that presents changes attributable to total realized and unrealized gains or losses, purchases and sales, and transfers in or out of the Level 3 category during the period. The end of period timing recognition is used for the transfers between Levels of a Portfolio’s assets and liabilities. A reconciliation of Level 3 investments is presented when a Portfolio has a significant amount of Level 3 investments.
For the year ended December 31, 2012, there have been no significant changes to the fair valuation methodologies.
The Portfolios classify each of their investments in the Underlying Funds as Level 1, without consideration as to the classification level of the specific investments held by the Underlying Funds.
B. Security Transactions and Revenue Recognition. Security transactions are accounted for on trade date. Dividend income received from the affiliated funds is recognized on the ex-dividend date and is recorded as income distributions in the Statement of Operations. Capital gain distributions received from the affiliated funds are recognized on ex-dividend date and are
recorded on the Statement of Operations as such. Costs used in determining realized gains and losses on the sales of investment securities are on the basis of specific identification.
C. Distributions to Shareholders. The Portfolios record distributions to their shareholders on the ex-dividend date. Dividends from net investment income and capital gains, if any, are declared and paid annually by the Portfolios. The Portfolios may make distributions on a more frequent basis to comply with the distribution requirements of the Internal Revenue Code. The characteristics of income and gains to be distributed are determined in accordance with income tax regulations, which may differ from U.S. generally accepted accounting principles for investment companies.
D. Federal Income Taxes. It is the policy of each Portfolio to comply with subchapter M of the Internal Revenue Code and related excise tax provisions applicable to regulated investment companies and to distribute substantially all of its net investment income and any net realized capital gains to their shareholders. Management has considered the sustainability of the Portfolios’ tax positions taken on federal income tax returns for all open tax years in making this determination. Therefore, no federal income tax provision is required. No capital gain distributions shall be made until any capital loss carryforwards have been fully utilized or expired.
E. Use of Estimates. The preparation of financial statements in conformity with U.S. generally accepted accounting principles requires management to make estimates and assumptions that affect the reported amounts of assets and liabilities and disclosure of contingent assets and liabilities at the date of the financial statements and the reported amounts of increases and decreases in net assets from operations during the reporting period. Actual results could differ from those estimates.
F. Indemnifications. In the normal course of business, the Company may enter into contracts that provide certain indemnifications. The Company’s maximum exposure under these arrangements is dependent on future claims that may be made against the Portfolios and, therefore, cannot be estimated; however, based on experience, management considers the risk of loss from such claims remote.
18
Table of Contents
NOTES TO FINANCIAL STATEMENTSASOF DECEMBER 31, 2012 (CONTINUED)
NOTE 3 — INVESTMENT TRANSACTIONS
For the year ended December 31, 2012, the cost of purchases and the proceeds from the sales of the Underlying Funds, were as follows:
Purchases | Sales | |||||||
Strategic Allocation Conservative | $ | 89,767,477 | $ | 96,636,651 | ||||
Strategic Allocation Growth | 106,752,431 | 120,932,200 | ||||||
Strategic Allocation Moderate | 121,671,656 | 133,711,145 | ||||||
NOTE 4 — INVESTMENT MANAGEMENT AND ADMINISTRATIVE FEES
The Portfolios entered into an investment management agreement (“Investment Management Agreement”) with the Investment Adviser.
The Investment Management Agreement compensates the Investment Adviser with a fee of 0.08% of each Portfolio’s average daily net assets invested in Underlying Funds and a fee of 0.60% of each Portfolio’s average daily net assets invested in direct investments.
The Investment Adviser entered into a sub-advisory agreement with ING IM with respect to each Portfolio. Subject to such policies as the board of directors (“Board”) or the Investment Adviser may determine, ING IM manages the Portfolios’ assets in accordance with the Portfolios’ investment objectives, policies, and limitations.
Pursuant to the Administration Agreement, IFS acts as administrator and provides certain administrative and shareholder services necessary for Portfolio operations and is responsible for the supervision of other service providers. IFS is entitled to receive from each Portfolio a fee at an annual rate of 0.055% on the first $5 billion of daily net assets and 0.030% thereafter.
NOTE 5 — DISTRIBUTION AND SERVICE FEES
Class S shares of the Portfolios have adopted a Distribution Plan pursuant to Rule 12b-1 under the 1940 Act (the “12b-1 Plan”), whereby the Distributor is compensated by each Portfolio for expenses incurred in the distribution of each Portfolio’s Class S shares. Pursuant to the 12b-1 Plan, the Distributor is entitled to a payment each month to compensate for expenses incurred in the distribution and promotion of each Portfolio’s S shares, including expenses incurred in printing prospectuses and reports used for sales purposes, expenses incurred in preparing and printing sales literature and other such distribution related expenses, including any distribution or shareholder servicing fees paid to securities dealers who have executed a distribution agreement with the Distributor.
Under the 12b-1 Plan, Class S shares of the Portfolios pay the Distributor a fee calculated at an annual rate of 0.25% of average daily net assets.
NOTE 6 — OTHER TRANSACTIONS WITH AFFILIATED AND RELATED PARTIES
At December 31, 2012, the following indirect, wholly-owned subsidiaries of ING U.S., Inc. owned more than 5% of the following Portfolios:
Subsidiary | Portfolios | Percentage | ||||
ING Life Insurance and Annuity Company | Strategic Allocation Conservative | 91.24 | % | |||
| Strategic Allocation Growth | 92.46 | |||||
| Strategic Allocation Moderate | 89.32 | |||||
ReliaStar Life Insurance Company | Strategic Allocation Conservative | 5.63 | ||||
| Strategic Allocation Growth | 5.10 | |||||
| Strategic Allocation Moderate | 8.11 | |||||
Control is defined by the 1940 Act as the beneficial ownership, either directly or through one or more controlled companies, of more than 25% of the voting securities of a company. The 1940 Act defines affiliates as companies that are under common control. Therefore, because the Portfolios have a common owner that owns over 25% of the outstanding securities of the Portfolios, they are deemed to be affiliates of each other. Investment activities of these shareholders could have a material impact on the Portfolios.
The Company has adopted a Deferred Compensation Plan (“Policy”), which allows eligible non-affiliated directors as described in the Policy to defer the receipt of all or a portion of the directors’ fees payable. Amounts deferred are treated as though invested in various “notional” funds advised by ING Investments until distribution in accordance with the Policy.
NOTE 7 — EXPENSE LIMITATION AGREEMENTS
ING Investments entered into written expense limitation agreements (“Expense Limitation Agreements”) with each of the Portfolios whereby the Investment Adviser has agreed to limit expenses, excluding interest, taxes, brokerage commissions and extraordinary expenses to the levels listed below:
Portfolio(1) | Class I | Class S | ||||||
Strategic Allocation Conservative | 0.65 | % | 0.90 | % | ||||
Strategic Allocation Growth(2) | 0.75 | % | 1.00 | % | ||||
Strategic Allocation Moderate | 0.70 | % | 0.95 | % | ||||
| (1) | These operating expense limits take into account operating expenses incurred at the underlying fund level. The amount of fees and expenses of an Underlying Fund borne by each Portfolio will vary based on each Portfolio’s allocation of assets to, and the net expenses of, a particular Underlying Fund. |
| (2) | The Adviser has further agreed to limit expenses for the Portfolio to 0.71% and 0.96% for Classes I and S, respectively. |
19
Table of Contents
NOTES TO FINANCIAL STATEMENTSASOF DECEMBER 31, 2012 (CONTINUED)
NOTE 7 — EXPENSE LIMITATION AGREEMENTS
(continued)
The Investment Adviser may at a later date recoup from a Portfolio for management fees waived and other expenses assumed by the Investment Adviser during the previous 36 months, but only if, after such recoupment, the Portfolio’s expense ratio does not exceed the percentage described above. Waived and reimbursed fees and any recoupment by the Investment Adviser of such waived and reimbursed fees are reflected on the accompanying Statements of Operations for each Portfolio. Amounts payable by the Investment Adviser are reflected on the accompanying Statements of Assets and Liabilities for each Portfolio.
As of December 31, 2012, the amounts of waived and reimbursed fees that are subject to possible recoupment by the Investment Adviser, and the related expiration dates are as follows:
| December 31, | ||||||||||||||||
Portfolio | 2013 | 2014 | 2015 | Total | ||||||||||||
Strategic Allocation Conservative | $ | 104,529 | $ | 134,821 | $ | 108,785 | $ | 348,135 | ||||||||
Strategic Allocation Growth | 170,403 | 232,497 | 204,516 | 607,416 | ||||||||||||
Strategic Allocation Moderate | 148,725 | 209,970 | 164,428 | 523,123 | ||||||||||||
The Expense Limitation Agreements are contractual and shall renew automatically for one-year terms unless ING Investments provides written notice of the termination of an Expense Limitation Agreement within 90 days of the end of the then current term.
NOTE 8 — CAPITAL SHARES
Transactions in capital shares and dollars were as follows:
| Shares sold | Shares issued in merger | Reinvestment of distributions | Shares redeemed | Net increase (decrease) in shares outstanding | Shares sold | Proceeds from shares issued in merger | Reinvestment of distributions | Shares redeemed | Net increase (decrease) | |||||||||||||||||||||||||||||||||
Year or period ended | # | # | # | # | # | ($) | ($) | ($) | ($) | ($) | ||||||||||||||||||||||||||||||||
Strategic Allocation Conservative |
| |||||||||||||||||||||||||||||||||||||||||
Class I |
| |||||||||||||||||||||||||||||||||||||||||
12/31/2012 | 758,752 | — | 210,271 | (1,595,863 | ) | (626,840 | ) | 8,097,511 | — | 2,230,977 | (17,121,325 | ) | (6,792,837 | ) | ||||||||||||||||||||||||||||
12/31/2011 | 912,744 | — | 320,868 | (1,954,986 | ) | (721,374 | ) | 9,423,856 | — | 3,394,780 | (20,329,160 | ) | (7,510,524 | ) | ||||||||||||||||||||||||||||
Class S |
| |||||||||||||||||||||||||||||||||||||||||
12/31/2012 | 18,011 | — | 3,516 | (7,198 | ) | 14,329 | 194,035 | — | 37,094 | (77,006 | ) | 154,123 | ||||||||||||||||||||||||||||||
12/31/2011 | 4,488 | — | 5,728 | (43,530 | ) | (33,314 | ) | 46,450 | — | 60,314 | (454,609 | ) | (347,845 | ) | ||||||||||||||||||||||||||||
Strategic Allocation Growth |
| |||||||||||||||||||||||||||||||||||||||||
Class I |
| |||||||||||||||||||||||||||||||||||||||||
12/31/2012 | 430,704 | — | 209,087 | (2,019,433 | ) | (1,379,642 | ) | 4,499,799 | — | 2,207,961 | (21,077,315 | ) | (14,369,555 | ) | ||||||||||||||||||||||||||||
12/31/2011 | 474,347 | — | 382,968 | (3,274,064 | ) | (2,416,749 | ) | 4,702,229 | — | 4,132,232 | (33,547,374 | ) | (24,712,913 | ) | ||||||||||||||||||||||||||||
Class S |
| |||||||||||||||||||||||||||||||||||||||||
12/31/2012 | 1,946 | — | 663 | (7,715 | ) | (5,106 | ) | 20,330 | — | 6,963 | (79,192 | ) | (51,899 | ) | ||||||||||||||||||||||||||||
12/31/2011 | 6,396 | — | 3,882 | (118,400 | ) | (108,122 | ) | 64,523 | — | 41,575 | (1,212,948 | ) | (1,106,850 | ) | ||||||||||||||||||||||||||||
Strategic Allocation Moderate |
| |||||||||||||||||||||||||||||||||||||||||
Class I |
| |||||||||||||||||||||||||||||||||||||||||
12/31/2012 | 502,801 | — | 286,051 | (1,929,744 | ) | (1,140,892 | ) | 5,281,178 | — | 3,020,695 | (20,250,866 | ) | (11,948,993 | ) | ||||||||||||||||||||||||||||
12/31/2011 | 560,660 | — | 486,249 | (2,985,599 | ) | (1,938,690 | ) | 5,726,581 | — | 5,188,279 | (30,624,648 | ) | (19,709,788 | ) | ||||||||||||||||||||||||||||
Class S |
| |||||||||||||||||||||||||||||||||||||||||
12/31/2012 | 4,857 | — | 1,882 | (10,156 | ) | (3,417 | ) | 51,683 | — | 19,810 | (106,376 | ) | (34,883 | ) | ||||||||||||||||||||||||||||
12/31/2011 | 35,901 | — | 8,183 | (209,915 | ) | (165,831 | ) | 357,382 | — | 86,901 | (2,173,211 | ) | (1,728,928 | ) | ||||||||||||||||||||||||||||
20
Table of Contents
NOTES TO FINANCIAL STATEMENTSASOF DECEMBER 31, 2012 (CONTINUED)
NOTE 9 — LINE OF CREDIT
All of the Portfolios included in this report, in addition to certain other funds managed by the Investment Adviser, are a party to an unsecured committed revolving line of credit agreement (the “Credit Agreement”) with The Bank of New York Mellon for an aggregate amount of $100,000,000. The proceeds may be used to: (1) temporarily finance the purchase or sale of securities; or (2) finance the redemption of shares of an investor in the funds. The funds to which the line of credit is available pay a commitment fee equal to 0.08% per annum on the daily unused portion of the committed line amount.
Generally, borrowings under the Credit Agreement accrue interest at the federal funds rate plus a specified margin. Repayments generally must be made within 60 days after the date of a revolving credit advance. The Portfolios did not utilize the line of credit during the year ended December 31, 2012.
NOTE 10 — CONCENTRATION OF INVESTMENT RISK
All mutual funds involve risk — some more than others — and there is always the chance that you could lose money or not earn as much as you hope. A Portfolio’s risk profile is largely a factor of the principal securities in which it invests and investment techniques that it uses. For more information regarding the types of securities and investment techniques that may be used by the Portfolios and their corresponding risks, see the Portfolios’ most recent Prospectus and/or the Statement of Additional Information.
The Portfolios are also affected by other kinds of risks, depending on the types of securities held or strategies used by an Underlying Fund.
Asset Allocation. Assets will be allocated among Underlying Funds and markets based on judgements by the Adviser or Sub-Adviser. There is a risk that the Portfolios may allocate assets to an Underlying Fund or market that under performs other funds or asset
Foreign Investments and/or Developing and Emerging Markets. There are certain risks in owning foreign securities, including those resulting from: fluctuations in currency exchange rates; devaluation of currencies; political or economic developments and the possible imposition of currency exchange blockages or other foreign governmental laws or restrictions; reduced availability of public information concerning issuers; accounting, auditing and financial reporting standards or other regulatory practices and requirements that are not uniform when compared to those applicable to
domestic companies; settlement and clearance procedures in some countries that may not be reliable and can result in delays in settlement; higher transaction and custody expenses than for domestic securities; and limitations on foreign ownership of equity securities. Also, securities of many foreign companies may be less liquid and the prices more volatile than those of domestic companies. Foreign investment risks may be greater in developing and emerging markets than in developed markets.
NOTE 11 — FEDERAL INCOME TAXES
The amount of distributions from net investment income and net realized capital gains are determined in accordance with federal income tax regulations, which may differ from U.S. generally accepted accounting principles for investment companies. These book/tax differences may be either temporary or permanent. Permanent differences are reclassified within the capital accounts based on their federal tax-basis treatment; temporary differences are not reclassified. Key differences include the treatment of short-term capital gains, foreign currency transactions, and wash sale deferrals. Distributions in excess of net investment income and/or net realized capital gains for tax purposes are reported as return of capital.
The following permanent tax differences have been reclassified as of December 31, 2012:
| Undistributed Net Investment Income | Accumulated Net Realized Gains/(Losses) | |||||||
Strategic Allocation Conservative | $ | 6,277 | $ | (6,277 | ) | |||
Strategic Allocation Growth | 16,990 | (16,990 | ) | |||||
Strategic Allocation Moderate | 13,608 | (13,608 | ) | |||||
Dividends paid by the Portfolios from net investment income and distributions of net realized short-term capital gains are, for federal income tax purposes, taxable as ordinary income to shareholders.
The tax composition of dividends and distributions to shareholders was as follows:
| Year Ended December 31, 2012 | Year Ended December 31, 2011 | |||||||
| Ordinary Income | Ordinary Income | |||||||
Strategic Allocation Conservative | $ | 2,268,071 | $ | 3,455,094 | ||||
Strategic Allocation Growth | 2,214,924 | 4,173,807 | ||||||
Strategic Allocation Moderate | 3,040,505 | 5,275,180 | ||||||
21
Table of Contents
NOTES TO FINANCIAL STATEMENTSASOF DECEMBER 31, 2012 (CONTINUED)
NOTE 11 — FEDERAL INCOME TAXES (continued)
The tax-basis components of distributable earnings and the expiration dates of the capital loss carryforwards which may be used to offset future realized capital gains for federal income tax purposes as of December 31, 2012 are detailed below. The Regulated Investment Company Modernization Act of 2010 (the “Act”) provides an unlimited carryforward period for newly generated capital losses. Under the Act, there may be a greater likelihood that all or a portion of the Portfolios’ pre-enactment capital loss carryforwards may expire without being utilized due to the fact that post-enactment capital losses are required to be utilized before pre-enactment capital loss carryforwards.
Undistributed | Unrealized | Capital Loss Carryforwards | ||||||||||||||||
Amount | Character | Expiration | ||||||||||||||||
Strategic Allocation Conservative | $ | 2,225,451 | $ | 5,353,964 | $ | (710,796 | ) | Short-term | 2016 | |||||||||
| (12,513,320 | ) | Short-term | 2017 | |||||||||||||||
| (970,483 | ) | Short-term | 2018 | |||||||||||||||
| (36,308 | ) | Long-term | None | |||||||||||||||
|
| |||||||||||||||||
| $ | (14,230,907 | ) | ||||||||||||||||
|
| |||||||||||||||||
Strategic Allocation Growth | 2,565,168 | 13,866,162 | (32,278,369 | ) | Short-term | 2017 | ||||||||||||
| (13,221,573 | ) | Short-term | 2018 | |||||||||||||||
|
| |||||||||||||||||
| $ | (45,499,942 | ) | ||||||||||||||||
|
| |||||||||||||||||
Strategic Allocation Moderate | 3,157,806 | 15,617,304 | (30,535,699 | ) | Short-term | 2017 | ||||||||||||
| (6,654,643 | ) | Short-term | 2018 | |||||||||||||||
| (4,826,878 | ) | Long-term | None | |||||||||||||||
|
| |||||||||||||||||
| $ | (42,017,220 | ) | ||||||||||||||||
|
| |||||||||||||||||
The Portfolios’ major tax jurisdictions are U.S. federal and Arizona. The earliest tax year that remains subject to examination by these jurisdictions is 2008.
As of December 31, 2012, no provisions for income tax would be required in the Portfolios’ financial statements as a result of tax positions taken on federal and state income tax returns for open tax years. The Portfolios’ federal and state income and federal excise tax returns for tax years for which the applicable statutes of limitations have not expired are subject to examination by the Internal Revenue Service and state department of revenue.
NOTE 12 — RESTRUCTURING PLAN
The Investment Adviser, the Sub-Adviser, IFS and IID are indirect, wholly-owned subsidiaries of ING U.S., Inc. (“ING U.S.”). ING U.S. is a U.S.-based financial institution whose subsidiaries operate in the retirement, investment, and insurance industries. As of December 31, 2012 ING U.S. is a wholly-owned
subsidiary of ING Groep N.V. (“ING Groep”), which is a global financial institution of Dutch origin, with operations in more than 40 countries.
In October 2009, ING Groep submitted a restructuring plan (the “Restructuring Plan”) to the European Commission to receive approval for state aid granted to ING Groep by the Kingdom of the Netherlands in November 2008 and March 2009. To receive approval for this state aid, ING Groep was required to divest its insurance and investment management businesses, including ING U.S. by the end of 2013. In November 2012, ING Groep announced that the European Commission agreed to an amendment to the Restructuring Plan which will extend the time for the completion of the divestiture. Under the terms of the amendment, at least 25% of ING U.S. has to be divested by the end of 2013, more than 50% has to be divested by the end of 2014, with the remaining interest divested by the end of 2016. It is anticipated that an initial public offering of a portion of the ING U.S. common stock will be conducted in 2013 as part of the Restructuring Plan. ING Groep has announced that the base case for divesting ING U.S. is an initial public offering of ING U.S. common stock, in which ING Groep anticipates selling a portion of its ownership interest in ING U.S. and thereafter divesting its remaining ownership interest over time. While the base case is an initial public offering, all options remain open and it is possible that ING Groep’s divestment of ING U.S. may take place by means of a sale to a single buyer or group of buyers.
The investment advisory agreement for the Portfolios provides that it will terminate automatically in the event of its assignment, which would occur upon a transfer of a controlling block of the shares of the Investment Adviser. The Restructuring Plan may result in a need to obtain further Board and shareholder approval of new advisory agreements.
The Restructuring Plan, whether implemented through public offerings or other means, may be disruptive to the businesses of ING U.S. and its subsidiaries, including the Investment Adviser and affiliated entities that provide services to the Portfolios, and may cause, among other things, interruption of business operations or services, diversion of management’s attention from day-to-day operations, reduced access to capital, and loss of key employees or customers. Completion of the Restructuring Plan is expected to result in the Investment Adviser’s loss of access to the resources of ING Groep, which could adversely affect its business. Currently, the Investment Adviser does not anticipate that the Restructuring Plan will have an adverse impact on its operations or the operations of the Portfolios.
22
Table of Contents
NOTES TO FINANCIAL STATEMENTSASOF DECEMBER 31, 2012 (CONTINUED)
NOTE 12 — RESTRUCTURING PLAN (continued)
During the time that ING Groep retains a controlling interest in ING U.S., circumstances affecting ING Groep, including restrictions or requirements imposed on ING Groep and its subsidiaries, including ING U.S. and the Investment Adviser, by U.S., European and other authorities, may negatively affect ING U.S. and the Investment Adviser. For example, restrictions on activities of entities controlled by ING Groep, including ING U.S. and the Investment Adviser, could be imposed under U.S., European or other laws or regulations, as a result of activities engaged in by ING Groep and its subsidiaries over which ING U.S. and the Investment Adviser have no control.
NOTE 13 — SUBSEQUENT EVENTS
It is anticipated that one or more of the transactions contemplated by the Restructuring Plan may be deemed to be a change of control, resulting in the automatic terminations of the existing investment advisory and sub-advisory agreements for the Portfolios. At a meeting held on January 9, 2013, the Board approved new advisory and sub-advisory agreements for the Portfolios that will take effect upon shareholder approval or the close of the IPO, whichever is later. Information regarding the basis for the Board’s approval of the investment advisory and investment sub-advisory relationships will be disclosed in the Portfolios’ semi-annual shareholder report to be dated June 30, 2013. A proxy statement, including disclosures regarding the Board’s considerations, is expected to be sent to shareholders of the Portfolios included in this report, as well as shareholders of other ING Funds, seeking approval of the new investment advisory and sub-advisory agreements.
At a meeting of the Board on January 9, 2013, the Board nominated 13 individuals (collectively, the “Nominees”) for election as Directors of the Company. The Nominees include Albert E. DePrince Jr., Russell H. Jones, Martin J. Gavin, Joseph E. Obermeyer and Shaun P. Mathews, each of whom is a current member of the Board. In addition, the Board has nominated Colleen D. Baldwin, John V. Boyer, Patricia W. Chadwick, Peter S. Drotch, J. Michael Earley, Patrick W. Kenny, Sheryl K. Pressler and Roger B. Vincent, each of whom is not currently a member of the Board, but who serve as a director or trustee to other investment companies in the ING Fund complex. These nominations are, in part, the result of an effort on the part of the Board and another board in the ING Fund complex to consolidate the membership of the boards so that the same members serve on each board in the ING Fund complex. A proxy statement is expected to be sent to shareholders of the Portfolios included in this report, as well as shareholders of other ING Funds, seeking approval of the same Nominees. If these proposals were all approved by shareholders, the result would be that all ING Funds would be governed by a board made up of the same individuals.
The Portfolios have evaluated events occurring after the Statements of Assets and Liabilities date (subsequent events) to determine whether any subsequent events necessitated adjustment to or disclosure in the financial statements. Other than the above, no such subsequent events were identified.
23
Table of Contents
| ING STRATEGIC ALLOCATION CONSERVATIVE PORTFOLIO | ASOF DECEMBER 31, 2012 |
| Shares | Value | Percentage of Net Assets | ||||||||||||
| EXCHANGE-TRADED FUNDS: 2.1% | ||||||||||||||
| 38,360 | iShares MSCI Emerging Markets Index Fund | $ | 1,701,266 | 2.1 | ||||||||||
| Total Exchange-Traded Funds (Cost $1,658,197) | 1,701,266 | 2.1 | ||||||||||||
| MUTUAL FUNDS: 97.9% | ||||||||||||||
| Affiliated Investment Companies: 97.9% | ||||||||||||||
| 303,004 | ING Growth and Income Portfolio - Class I | 7,435,715 | 8.9 | |||||||||||
| 3,348,324 | ING Intermediate Bond Fund - Class I | 33,851,559 | 40.8 | |||||||||||
| 904,055 | ING International Index Portfolio - Class I | 7,648,303 | 9.2 | |||||||||||
| 333,133 | ING Large Cap Growth Portfolio - Class I | 4,930,362 | 5.9 | |||||||||||
| 195,124 | ING MidCap Opportunities Portfolio - Class I | 2,513,203 | 3.0 | |||||||||||
| 203,340 | ING MidCap Value Fund - Class I | 2,497,012 | 3.0 | |||||||||||
| 320,504 | @ | ING Short Term Bond Fund Class - I | 3,205,038 | 3.9 | ||||||||||
| 230,552 | ING Clarion Global Real Estate Portfolio - Class I | 2,575,264 | 3.1 | |||||||||||
| 1,023,717 | ING High Yield Bond Fund - Class I | 8,363,772 | 10.1 | |||||||||||
| 897,487 | ING Large Cap Value Portfolio - Class I | 8,283,802 | 10.0 | |||||||||||
| Total Mutual Funds (Cost $74,938,193) | 81,304,030 | 97.9 | ||||||||||||
| Total Investments in Securities (Cost $76,596,390) | $ | 83,005,296 | 100.0 | |||||||||||
| Assets in Excess of Other Liabilities | 18,520 | — | ||||||||||||
|
|
|
| |||||||||||
| Net Assets | $ | 83,023,816 | 100.0 | |||||||||||
|
|
|
| |||||||||||
| @ | Non-income producing security |
| Cost for federal income tax purposes is $77,651,332. |
Net unrealized appreciation consists of: | ||||
Gross Unrealized Appreciation | $ | 6,410,449 | ||
Gross Unrealized Depreciation | (1,056,485 | ) | ||
|
| |||
Net Unrealized Appreciation | $ | 5,353,964 | ||
|
|
Fair Value Measurements^
The following is a summary of the fair valuations according to the inputs used as of December 31, 2012 in valuing the assets and liabilities:
| Quoted Prices in Active Markets for Identical Investments (Level 1) | Significant Other Observable Inputs (Level 2) | Significant Unobservable Inputs (Level 3) | Fair Value at December 31, 2012 | |||||||||||||
Asset Table | ||||||||||||||||
Investments, at fair value | ||||||||||||||||
Exchange-Traded Funds | $ | 1,701,266 | $ | — | $ | — | $ | 1,701,266 | ||||||||
Mutual Funds | 81,304,030 | — | — | 81,304,030 | ||||||||||||
|
|
|
|
|
|
|
| |||||||||
Total Investments, at fair value | $ | 83,005,296 | $ | — | $ | — | $ | 83,005,296 | ||||||||
|
|
|
|
|
|
|
| |||||||||
| ^ | See Note 2, “Significant Accounting Policies” in the Notes to Financial Statements for additional information. |
See Accompanying Notes to Financial Statements
24
Table of Contents
| ING STRATEGIC ALLOCATION GROWTH PORTFOLIO | PORTFOLIO OF INVESTMENTS ASOF DECEMBER 31, 2012 |
| Shares | Value | Percentage of Net Assets | ||||||||||||
| EXCHANGE-TRADED FUNDS: 2.1% | ||||||||||||||
| 66,307 | iShares MSCI Emerging Markets Index Fund | $ | 2,940,716 | 2.1 | ||||||||||
| Total Exchange-Traded Funds (Cost $2,866,558) | 2,940,716 | 2.1 | ||||||||||||
| MUTUAL FUNDS: 97.9% | ||||||||||||||
| Affiliated Investment Companies: 97.9% | ||||||||||||||
| 736,990 | ING Emerging Markets Index Portfolio - Class I | 8,843,879 | 6.2 | |||||||||||
| 630,622 | ING Growth and Income Portfolio - Class I | 15,475,475 | 10.9 | |||||||||||
| 1,250,222 | ING Intermediate Bond Fund - Class I | 12,639,741 | 8.9 | |||||||||||
| 1,040,496 | ING Large Cap Growth Portfolio - Class I | 15,399,338 | 10.8 | |||||||||||
| 488,860 | ING MidCap Opportunities Portfolio - Class I | 6,296,523 | 4.4 | |||||||||||
| 525,142 | ING MidCap Value Fund - Class I | 6,448,745 | 4.5 | |||||||||||
| 804,408 | ING RussellTM Mid Cap Index Portfolio - Class I | 10,014,884 | 7.0 | |||||||||||
| 261,926 | ING Clarion Global Real Estate Portfolio - Class I | 2,925,718 | 2.1 | |||||||||||
| 1,047,349 | ING High Yield Bond Fund - Class I | 8,556,842 | 6.0 | |||||||||||
| 3,082,878 | ING International Index Portfolio - Class I | 26,081,145 | 18.3 | |||||||||||
| 2,293,589 | ING Large Cap Value Portfolio - Class I | 21,169,822 | 14.8 | |||||||||||
| 293,761 | ING Small Company Portfolio - Class I | 5,766,528 | 4.0 | |||||||||||
| Total Mutual Funds (Cost $119,415,794) | 139,618,640 | 97.9 | ||||||||||||
| Total Investments in Securities (Cost $122,282,352) | $ | 142,559,356 | 100.0 | |||||||||||
| Liabilities in Excess of Other Assets | (19,008 | ) | — | |||||||||||
|
|
|
| |||||||||||
| Net Assets | $ | 142,540,348 | 100.0 | |||||||||||
|
|
|
| |||||||||||
| Cost for federal income tax purposes is $128,693,247. |
Net unrealized appreciation consists of: | ||||
Gross Unrealized Appreciation | $ | 20,277,224 | ||
Gross Unrealized Depreciation | (6,411,115 | ) | ||
|
| |||
Net Unrealized Appreciation | $ | 13,866,109 | ||
|
|
Fair Value Measurements^
The following is a summary of the fair valuations according to the inputs used as of December 31, 2012 in valuing the assets and liabilities:
| Quoted Prices in Active Markets for Identical Investments (Level 1) | Significant Other Observable Inputs (Level 2) | Significant Unobservable Inputs (Level 3) | Fair Value at December 31, 2012 | |||||||||||||
Asset Table | ||||||||||||||||
Investments, at fair value | ||||||||||||||||
Exchange-Traded Funds | $ | 2,940,716 | $ | — | $ | — | $ | 2,940,716 | ||||||||
Mutual Funds | 139,618,640 | — | — | 139,618,640 | ||||||||||||
|
|
|
|
|
|
|
| |||||||||
Total Investments, at fair value | $ | 142,559,356 | $ | — | $ | — | $ | 142,559,356 | ||||||||
|
|
|
|
|
|
|
| |||||||||
| ^ | See Note 2, “Significant Accounting Policies” in the Notes to Financial Statements for additional information. |
See Accompanying Notes to Financial Statements
25
Table of Contents
| ING STRATEGIC ALLOCATION MODERATE PORTFOLIO | PORTFOLIO OF INVESTMENTS ASOF DECEMBER 31, 2012 |
| Shares | Value | Percentage of Net Assets | ||||||||||||
| EXCHANGE-TRADED FUNDS: 2.0% | ||||||||||||||
| 66,395 | iShares MSCI Emerging Markets Index Fund | $ | 2,944,618 | 2 .0 | ||||||||||
| Total Exchange-Traded Funds (Cost $2,870,261) | 2,944,618 | 2.0 | ||||||||||||
| MUTUAL FUNDS: 98.0% | ||||||||||||||
| Affiliated Investment Companies: 98.0% | ||||||||||||||
| 620,730 | ING Emerging Markets Index Portfolio - Class I | 7,448,757 | 5.2 | |||||||||||
| 578,731 | ING Growth and Income Portfolio - Class I | 14,202,051 | 9.9 | |||||||||||
| 4,072,002 | ING Intermediate Bond Fund - Class I | 41,167,936 | 28.7 | |||||||||||
| 811,556 | ING Large Cap Growth Portfolio - Class I | 12,011,031 | 8.4 | |||||||||||
| 500,661 | ING MidCap Opportunities Portfolio - Class I | 6,448,510 | 4.5 | |||||||||||
| 527,319 | ING MidCap Value Fund - Class I | 6,475,483 | 4.5 | |||||||||||
| 264,324 | ING Clarion Global Real Estate Portfolio - Class I | 2,952,494 | 2.1 | |||||||||||
| 1,056,424 | ING High Yield Bond Fund - Class I | 8,630,982 | 6.0 | |||||||||||
| 2,073,991 | ING International Index Portfolio - Class I | 17,545,961 | 12.2 | |||||||||||
| 1,929,144 | ING Large Cap Value Portfolio - Class I | 17,805,995 | 12.4 | |||||||||||
| 296,454 | ING Small Company Portfolio - Class I | 5,819,390 | 4.1 | |||||||||||
| Total Mutual Funds (Cost $122,880,064) | 140,508,590 | 98.0 | ||||||||||||
| Total Investments in Securities (Cost $125,750,325) | $ | 143,453,208 | 100.0 | |||||||||||
| Liabilities in Excess of Other Assets | (30,157 | ) | — | |||||||||||
|
|
|
| |||||||||||
| Net Assets | $ | 143,423,051 | 100.0 | |||||||||||
|
|
|
| |||||||||||
| Cost for federal income tax purposes is $127,835,959. |
Net unrealized appreciation consists of: | ||||
Gross Unrealized Appreciation | $ | 17,704,229 | ||
Gross Unrealized Depreciation | (2,086,980 | ) | ||
|
| |||
Net Unrealized Appreciation | $ | 15,617,249 | ||
|
|
Fair Value Measurements^
The following is a summary of the fair valuations according to the inputs used as of December 31, 2012 in valuing the assets and liabilities:
| Quoted Prices in Active Markets for Identical Investments (Level 1) | Significant Other Observable Inputs (Level 2) | Significant Unobservable Inputs (Level 3) | Fair Value at December 31, 2012 | |||||||||||||
Asset Table | ||||||||||||||||
Investments, at fair value | ||||||||||||||||
Exchange-Traded Funds | $ | 2,944,618 | $ | — | $ | — | $ | 2,944,618 | ||||||||
Mutual Funds | 140,508,590 | — | — | 140,508,590 | ||||||||||||
|
|
|
|
|
|
|
| |||||||||
Total Investments, at fair value | $ | 143,453,208 | $ | — | $ | — | $ | 143,453,208 | ||||||||
|
|
|
|
|
|
|
| |||||||||
| ^ | See Note 2, “Significant Accounting Policies” in the Notes to Financial Statements for additional information. |
See Accompanying Notes to Financial Statements
26
Table of Contents
Dividends paid during the year ended December 31, 2012 were as follows:
Portfolio Name | Type | Per Share Amount | ||||
ING Strategic Allocation Conservative Portfolio | ||||||
Class I | NII | $ | 0.2903 | |||
Class S | NII | $ | 0.2633 | |||
ING Strategic Allocation Growth Portfolio | ||||||
Class I | NII | $ | 0.1580 | |||
Class S | NII | $ | 0.1108 | |||
ING Strategic Allocation Moderate Portfolio | ||||||
Class I | NII | $ | 0.2198 | |||
Class S | NII | $ | 0.1779 | |||
NII - Net investment income
Of the ordinary distributions made during the year ended December 31, 2012, the following percentages qualify for the dividends received deduction (DRD) available to corporate shareholders:
ING Strategic Allocation Conservative Portfolio | 3.26 | % | ||
ING Strategic Allocation Growth Portfolio | 16.75 | % | ||
ING Strategic Allocation Moderate Portfolio | 7.01 | % |
The Regulated Investment Company Modernization Act of 2010 allows qualified fund-of-funds to elect to pass through the ability to take foreign tax credits (or deductions) to the extent that foreign taxes are passed through from underlying funds.
A qualified fund-of-funds is a regulated investment company that has at least 50% of the value of its total assets invested in other regulated investment companies at the end of each quarter of the taxable year. Pursuant to Section 853 of the Internal Revenue Code, the Portfolios designate the following amounts as foreign taxes paid for the year ended December 31, 2012:
| Creditable Foreign Taxes Paid | Per Share Amount | Portion of Ordinary Income Distribution Derived from Foreign Sourced Income* | ||||||||||
ING Strategic Allocation Conservative Portfolio | $ | 12,748 | $ | 0.0017 | 7.27 | % | ||||||
ING Strategic Allocation Growth Portfolio | $ | 47,293 | $ | 0.0036 | 22.52 | % | ||||||
ING Strategic Allocation Moderate Portfolio | $ | 33,729 | $ | 0.0026 | 11.94 | % | ||||||
| * | None of the Portfolios listed above derived any income from ineligible foreign sources as defined under Section 901(j) of the Internal Revenue Code. |
Above figures may differ from those cited elsewhere in this report due to differences in the calculation of income and gains under U.S. generally accepted accounting principles (book) purposes and Internal Revenue Service (tax) purposes.
Shareholders are strongly advised to consult their own tax advisers with respect to the tax consequences of their investments in the Portfolios. In January, shareholders, excluding corporate shareholders, receive an IRS 1099-DIV regarding the federal tax status of the dividends and distributions they received in the calendar year.
27
Table of Contents
DIRECTOR AND OFFICER INFORMATION (UNAUDITED)
The business and affairs of the Company are managed under the direction of the Board. A Director, who is not an interested person of the Company, as defined in the 1940 Act, is an independent director (“Non-Interested Director”). The Directors and Officers of the Company are listed below. The Statement of Additional Information includes additional information about directors of the Company and is available, without charge, upon request at (800) 992-0180.
Name, Address and Age | Position(s) | Term of Office | Principal Occupation(s) | Number of | Other Board Positions | |||||
Independent Directors: | ||||||||||
Dr. Albert E. DePrince, Jr. 7337 E. Doubletree Ranch Rd. Suite 100 Scottsdale, Arizona 85258 Age:71 | Chairman/Director | June 1998 - Present | Professor of Economics and Finance, Middle Tennessee State University (August 1991 - Present) and various positions with Academy of Economics and Finance (2003 - 2012). Formerly, Director of Business and Economics Research Center, Middle Tennessee State University (1999 - 2002); Chief Economist, Marine Midland Bank (1987 - 1990); various positions, Marine Midland Bank (1978-1990); and Economist, Federal Reserve Bank of New York (1969 - 1978).
Ph.D. in Economics.
Director of Academy of Economics and Finance (February 2001 - February 2003). Published numerous scholarly papers and journal articles in the areas of financial markets, financial institutions and monetary policy. | 35 | None. | |||||
Martin J. Gavin 7337 E. Doubletree Ranch Rd. Suite 100 Scottsdale, Arizona 85258 Age: 62 | Director | January 2009 - June 2010 July 2011 - Present | President and Chief Executive Officer, Connecticut Children’s Medical Center (May 2006 - Present). Formerly, Interim President, Connecticut Children’s Medical Center (January 2006 - May 2006); various positions for the Phoenix Companies, Inc. (1984 - 2000); Assistant Vice President, CNA Insurance Company, Inc. (1980 - 1984); and various positions at CIGNA Corporation (1973 - 1980). | 35 | None. | |||||
Russell H. Jones 7337 E. Doubletree Ranch Rd. Suite 100 Scottsdale, Arizona 85258 Age: 68 | Director | December 2007 - Present | Retired. Director, Hill - Stead Museum (non-profit) (2008 - Present). Formerly, Senior Vice President, Chief Investment Officer and Treasurer, and other various positions including Principal Investor Relations Officer, Principal Public Relations Officer, and Corporate Parent Treasurer, Kaman Corporation, an aerospace and industrial distribution manufacturer (April 1973 - March 2008); President, Hartford Area Business Economists (1986 - 1987); and Corporate Loan Officer and Credit Analyst, Hartford National Bank (July 1966 - April 1973).
Certified AARP Tax Counselor (2011). | 35 | Independent Director, CIGNA Mutual Funds (8 funds), Chair of Contracts Committee (1995 - 2005). | |||||
28
Table of Contents
DIRECTOR AND OFFICER INFORMATION (UNAUDITED) (CONTINUED)
Name, Address and Age | Position(s) | Term of Office | Principal Occupation(s) | Number of | Other Board Positions | |||||
Sidney Koch 7337 E. Doubletree Ranch Rd. Suite 100 Scottsdale, Arizona 85258 Age:77 | Director | April 1994 - Present | Retired. Self-Employed Consultant (June 2000 - Present). Formerly, Senior Adviser, Hambro America, Inc. (1993 - 2000) and Executive Vice President of Investment Banking, Daiwa Securities America, Inc. (1986 -1993). | 35 | None. | |||||
Joseph E. Obermeyer 7337 E. Doubletree Ranch Rd. Suite 100 Scottsdale, Arizona 85258 Age: 55 | Director | January 2003 - Present | President, Obermeyer & Associates, Inc., a provider of financial and economic consulting services (November 1999 - Present). Formerly, Senior Manager, Arthur Andersen LLP (1995 - 1999); Senior Manager, Coopers & Lybrand, LLP (1993 - 1995); Manager, Price Waterhouse (1988 - 1993); Second Vice President, Smith Barney (1985 - 1988); and Consultant, Arthur Andersen & Co. (1984 -1985). | 35 | None. | |||||
Director who is an “Interested Person” | ||||||||||
Shaun P. Mathews(3) 7337 E. Doubletree Ranch Rd. Suite 100 Scottsdale, Arizona 85258 Age: 57 | Director | December 2007 - Present | President and Chief Executive Officer, ING Investments, LLC (November 2006 - Present). | 182 | ING Capital Corporation, LLC and ING Investments Distributor, LLC (December 2005 - Present); ING Funds Services, LLC, ING Investments, LLC and ING Investment Management, LLC (March 2006 - Present); and ING Investment Trust Co. (April 2009 - Present). | |||||
| (1) | The information reported includes the principle occupation during the last five years for each Director and other information relating to the professional experiences, attributes and skills relevant to each Director’s qualifications to serve as a Director. |
| (2) | Except for Mr. Mathews and for the purposes of this table “Fund Complex” means the following investment companies: ING Balanced Portfolio, Inc.; ING Intermediate Bond Portfolio; ING Money Market Portfolio; ING Series Fund, Inc.; ING Strategic Allocation Portfolios, Inc.; ING Variable Funds; and ING Variable Portfolios, Inc. For Mr. Mathews, the ING Fund Complex also includes the following investment companies: ING Asia Pacific High Dividend Equity Income Fund; ING Emerging Markets High Dividend Equity Fund; ING Emerging Markets Local Bond Fund; ING Equity Trust; ING Funds Trust; ING Global Equity Dividend and Premium Opportunity Fund; ING Global Advantage and Premium Opportunity Fund; ING Global Strategic Income Fund; ING Infrastructure, Industrials and Materials Fund; ING International High Dividend Equity Income Fund; ING Investors Trust; ING Mayflower Trust; ING Mutual Funds; ING Partners, Inc.; ING Prime Rate Trust; ING Risk Managed Natural Resources Fund; ING Senior Income Fund; ING Separate Portfolios Trust; ING Short Duration High Income Fund; ING Variable Insurance Trust; and ING Variable Products Trust. Therefore, for the purposes of this table with reference to Mr. Mathews, “Fund Complex” includes these investment companies. The number of funds in the ING Fund Complex is as of January 31, 2013. |
| (3) | “Interested Person,” by virtue of this Director’s current or prior affiliation with any of the Portfolios, ING or any of ING’s affiliates. |
29
Table of Contents
DIRECTOR AND OFFICER INFORMATION (UNAUDITED) (CONTINUED)
Name, Address and Age | Position(s) Held | Term of Office | Principal Occupation(s) – During the Past 5 Years | |||
Shaun P. Mathews 7337 East Doubletree Ranch Rd. Suite 100 Scottsdale, Arizona 85258 Age: 57 | President and Chief Executive Officer | December 2006 - Present | President and Chief Executive Officer, ING Investments, LLC (November 2006 - Present). | |||
Michael J. Roland 7337 East Doubletree Ranch Rd. Suite 100 Scottsdale, Arizona 85258 Age: 54 | Executive Vice President | April 2002 - Present | Managing Director and Chief Operating Officer, ING Investments, LLC and ING Funds Services, LLC (April 2012 - Present) and Chief Compliance Officer, Directed Services LLC and ING Investments, LLC (March 2011 - Present). Formerly, Executive Vice President and Chief Operating Officer, ING Investments, LLC and ING Funds Services, LLC (January 2007 - April 2012) and Chief Compliance Officer, ING Funds (March 2011 - February 2012). | |||
Stanley D. Vyner 230 Park Avenue New York, New York 10169 Age: 62 | Executive Vice President | March 2002 - Present | Executive Vice President, ING Investments, LLC (July 2000 - Present) and Chief Investment Risk Officer, ING Investments, LLC (January 2003 - Present). | |||
Kevin M. Gleason 7337 East Doubletree Ranch Rd. Suite 100 Scottsdale, Arizona 85258 Age: 46 | Chief Compliance Officer | February 2012 - Present | Senior Vice President, ING Investments, LLC (February 2012- Present). Formerly, Assistant General Counsel and Assistant Secretary, The Northwestern Mutual Life Insurance Company (June 2004 - January 2012). | |||
Kimberly A. Anderson 7337 East Doubletree Ranch Rd. Suite 100 Scottsdale, Arizona 85258 Age: 48 | Senior Vice President | December 2003 - Present | Senior Vice President, ING Investments, LLC (October 2003 - Present). | |||
Todd Modic 7337 East Doubletree Ranch Rd. Suite 100 Scottsdale, Arizona 85258 Age: 45 | Senior Vice President, Chief/Principal Financial Officer and Assistant Secretary | March 2005 - Present | Senior Vice President, ING Funds Services, LLC (March 2005 - Present). | |||
Robert Terris 7337 East Doubletree Ranch Rd. Suite 100 Scottsdale, Arizona 85258 Age: 42 | Senior Vice President | June 2006 - Present | Senior Vice President, Head of Division Operations, ING Funds Services, LLC (January 2006 - Present). | |||
Julius A. Drelick, III 7337 East Doubletree Ranch Rd. Suite 100 Scottsdale, Arizona 85258 Age: 46 | Senior Vice President | September 2012 - Present | Senior Vice President - Fund Compliance, ING Funds Services, LLC (June 2012 - Present). Formerly, Vice President - Platform Product Management & Project Management, ING Investments, LLC (April 2007 - June 2012). | |||
Robyn L. Ichilov 7337 East Doubletree Ranch Rd. Suite 100 Scottsdale, Arizona 85258 Age: 45 | Vice President | March 2002 - Present | Vice President and Treasurer, ING Funds Services, LLC (November 1995 - Present) and ING Investments, LLC (August 1997 - Present). Formerly, Treasurer, ING Funds (November 1999 - February 2012). | |||
Maria M. Anderson 7337 East Doubletree Ranch Rd. Suite 100 Scottsdale, Arizona 85258 Age: 54 | Vice President | September 2004 - Present | Vice President, ING Funds Services, LLC (September 2004 - Present). | |||
Lauren D. Bensinger 7337 East Doubletree Ranch Rd. Suite 100 Scottsdale, Arizona 85258 Age: 59 | Vice President | March 2003 - Present | Vice President, ING Investments, LLC and ING Funds Services, LLC (February 1996 - Present); Director of Compliance, ING Investments, LLC (October 2004 - Present); and Vice President and Money Laundering Reporting Officer, ING Investments Distributor, LLC ( April 2010 - Present). Formerly, Chief Compliance Officer, ING Investments Distributor, LLC (August 1995 - April 2010). | |||
Jason Kadavy 7337 East Doubletree Ranch Rd. Suite 100 Scottsdale, Arizona 85258 Age: 36 | Vice President | September 2012 - Present | Vice President, ING Funds Services, LLC (July 2007 - Present). | |||
30
Table of Contents
DIRECTOR AND OFFICER INFORMATION (UNAUDITED) (CONTINUED)
Name, Address and Age | Position(s) Held | Term of Office | Principal Occupation(s) – During the Past 5 Years | |||
Fred Bedoya 7337 East Doubletree Ranch Rd. Suite 100 Scottsdale, Arizona 85258 Age: 40 | Vice President and Treasurer | September 2012 - Present | Vice President, ING Funds Services, LLC (March 2012 - Present). Formerly, Assistant Vice President - Director, ING Funds Services, LLC (March 2003 - March 2012). | |||
Kimberly K. Springer 7337 East Doubletree Ranch Rd. Suite 100 Scottsdale, Arizona 85258 Age: 55 | Vice President | March 2006 - Present | Vice President - Platform Product Management & Project Management, ING Investments, LLC (July 2012 - Present); Vice President, ING Investment Management - ING Funds (March 2010 - Present) and Vice President, ING Funds Services, LLC (March 2006 - Present). Formerly Managing Paralegal, Registration Statements (June 2003 - July 2012). | |||
Craig Wheeler 7337 East Doubletree Ranch Rd. Suite 100 Scottsdale, Arizona 85258 Age: 43 | Assistant Vice President | June 2008 - Present | Assistant Vice President - Director of Tax, ING Funds Services, LLC (March 2008 - Present). Formerly, Tax Manager, ING Funds Services, LLC (March 2005 - March 2008). | |||
Theresa K. Kelety 7337 East Doubletree Ranch Rd. Suite 100 Scottsdale, Arizona 85258 Age: 50 | Secretary | September 2003 - Present | Vice President and Senior Counsel, ING Investment Management - ING Funds (March 2010 - Present). Formerly, Senior Counsel, ING Americas, U.S. Legal Services (April 2008 - March 2010) and Counsel, ING Americas, U.S. Legal Services (April 2003 - April 2008). | |||
Huey P. Falgout, Jr. 7337 East Doubletree Ranch Rd. Suite 100 Scottsdale, Arizona 85258 Age: 49 | Assistant Secretary | September 2003 - Present | Senior Vice President and Chief Counsel, ING Investment Management - ING Funds (March 2010- Present). Formerly, Chief Counsel, ING Americas, U.S. Legal Services (October 2003 - March 2010). | |||
Paul A. Caldarelli 7337 East Doubletree Ranch Rd. Suite 100 Scottsdale, Arizona 85258 Age: 61 | Assistant Secretary | August 2010 - Present | Vice President and Senior Counsel, ING Investment Management - ING Funds (March 2010-Present). Formerly, Senior Counsel, ING Americas, U.S. Legal Services (April 2008 - March 2010) and Counsel, ING Americas, U.S. Legal Services (May 2005 - April 2008). | |||
| (1) | The Officers hold office until the next annual meeting of the Board of Directors and until their successors shall have been elected and qualified. |
31
Table of Contents
ADVISORY CONTRACT APPROVAL DISCUSSION (UNAUDITED)
BOARD CONSIDERATIONS IN APPROVING CONTINUATION OF THE CURRENT INVESTMENT ADVISORY AND SUB-ADVISORY AGREEMENTS
The Investment Company Act of 1940, as amended (the “1940 Act”), provides, in substance, that each investment advisory agreement and sub-advisory agreement for a mutual fund will terminate automatically after the initial term of the agreement (which term may not exceed two years), unless continuation of the agreement is approved annually by the Board of Trustees or Directors, as the case may be (the “Board”) of the fund, including a majority of the Trustees/Directors who have no direct or indirect interest in the agreement and who are not “interested persons” of the fund (the “Independent Trustees”). Consistent with this requirement of the 1940 Act, the Board of ING Balanced Portfolio, Inc., ING Strategic Allocation Portfolios, Inc., ING Intermediate Bond Portfolio, ING Money Market Portfolio, ING Variable Funds, ING Variable Portfolios, Inc. and ING Series Fund, Inc., with respect to each portfolio series thereof (each, a “Fund” or a “Portfolio” and, collectively, the “Funds” or the “Portfolios”) has established a process for considering on an annual basis approval of the continuation of the investment management agreement for each Fund (the “Advisory Agreement”) with ING Investments, LLC (the “Adviser”) and the sub-advisory agreement for each Fund (collectively, the “Sub-Advisory Agreements”) with the sub-adviser of each Fund (the “Sub-Advisers”). Set forth below is a description of the process followed by the Board in considering approval of the continuation of each Advisory and Sub-Advisory Agreement (collectively, the “Agreements”), together with an explanation of many of the factors considered and related conclusions reached by the Board in voting to approve the continuation of each Agreement for an additional one-year period commencing January 1, 2013.
Overview of the Review Process
At a meeting of the Board held on December 12, 2012, the Board, including all of the Independent Trustees, voted to approve continuation of each of the existing Agreements for the Funds. Prior to voting such approvals, the Board received the affirmative recommendation of the Contracts Committee of the Board, which is a Committee of the Board comprised of all of the Independent Trustees and exclusively of the Independent Trustees. The Contracts Committee recommended approval of the Agreements after completing an extensive review of information
requested by the Committee from the Adviser and each Sub-Adviser, including the following: (1) comparative performance data for each Fund for various time periods; (2) comparative data regarding management fees, including data regarding the fees charged by the Adviser and Sub-Advisers for managing other mutual funds and institutional accounts using investment strategies and techniques similar to those used in managing the Funds; (3) comparative data regarding the total expenses of each Fund; (4) copies of each form of Advisory Agreement and Sub-Advisory Agreement; (5) copies of the codes of ethics of the Adviser and each Sub-Adviser, together with information relating to the manner in which each code is administered; (6) financial statements of the Adviser and each Sub-Adviser (or its parent company); (7) profitability analyses for the Adviser and each Sub-Adviser with respect to each Fund, and all Funds as a group; (8) descriptions of the qualifications of the investment personnel responsible for managing each Fund, the structure of their compensation and their responsibilities with respect to managing other accounts or mutual funds; (9) descriptions of the services provided to the Funds, including the investment strategies and techniques used by each Sub-Adviser in managing the Funds; (10) data relating to portfolio turnover and brokerage practices, including practices with respect to the acquisition of research through “soft dollar” benefits received in connection with the Funds’ brokerage; (11) descriptions of the policies and procedures of the various service providers of the Funds for protecting the privacy of shareholder information; (12) information relating to projected sales and redemptions of Fund shares and business plans relating to the Adviser’s mutual fund platform; (13) descriptions of the business continuity and disaster recovery plans of the Adviser and each Sub-Adviser; (14) descriptions of various compliance programs of the Adviser and Sub-Advisers, including the Adviser’s programs for monitoring and enforcing compliance with the Funds’ policies with respect to market-timing, late trading and selective portfolio disclosure; (15) independent reports analyzing the quality of the trade execution services performed by Sub-Advisers for the Funds; and (16) other information relevant to an evaluation of the nature, extent and quality of the services provided by the Adviser and each Sub-Adviser in response to a series of detailed questions posed by Goodwin Procter LLP, legal counsel for the Independent Trustees (“Independent Counsel”) on behalf of the Independent Trustees. With respect to each Sub-Advisory Agreement, the Board also
32
Table of Contents
ADVISORY CONTRACT APPROVAL DISCUSSION (UNAUDITED) (CONTINUED)
considered the Adviser’s recommendation that the Agreement be renewed and the basis provided by the Adviser for such recommendation.
The Contracts Committee began the formal review process in August 2012 when it met separately with Independent Counsel to review the information to be requested from management and the methodology to be used in determining the selected peer groups for comparing performance and expenses (the “Peer Group Methodology”). Prior to the August meeting, the Contracts Committee had engaged an independent consultant (the “Independent Consultant”) to evaluate, and make recommendations with respect to, the Peer Group Methodology. The Independent Consultant’s findings were reported to the Contracts Committee at a meeting of the Committee held on August 1-2, 2012 and incorporated into the Peer Group Methodology approved by the Board on August 2, 2012. The Contracts Committee then held meetings on September 11-13, 2012, October 15-16, 2012, November 29, 2012 and December 10-12, 2012, during which the Independent Trustees, meeting separately with Independent Counsel, reviewed and evaluated information relating to the Agreements, including the information described above. As part of the review process, the Contracts Committee met with representatives from the Adviser and/or the Sub-Advisers to discuss the information provided to the Committee. The Contracts Committee also considered information that had been provided by the Adviser and Sub-Advisers throughout the year at other meetings of the Contracts Committee, the Audit Committee, the Compliance Committee and the full Board.
The Independent Trustees were assisted by Independent Counsel throughout the contract review process. The Independent Trustees relied upon the advice of Independent Counsel and their own business judgment in determining the material factors to be considered in evaluating each Advisory and Sub-Advisory Agreement and the weight to be given to each such factor. The conclusions reached by the Independent Trustees were based on a comprehensive evaluation of all of the information provided and were not the result of any one factor. Moreover, each Independent Trustee may have afforded different weight to the various factors in reaching conclusions with respect to each Advisory and Sub-Advisory Agreement.
Nature, Extent and Quality of Services
In considering whether to approve the Advisory and Sub-Advisory Agreements for the Funds for the year commencing January 1, 2013, the Board evaluated the nature, extent and quality of services provided to the Funds by the Adviser and Sub-Advisers. The Board considered the investment management and related services provided by the Adviser and Sub-Advisers, including the quantity and quality of the resources available to provide such services. Among other things, the Board considered the qualifications of the individuals responsible for performing various investment related services. The Board also noted the Adviser has implemented a “manager-of-managers” structure for the Funds under which the investment portfolio of each Fund is managed by a Sub-Adviser, and considered the responsibilities that the Adviser has under the “manager-of-managers” structure, including with respect to the selection and ongoing monitoring of the Sub-Advisers.
The Board also considered the quality of the compliance programs of the Adviser and each Sub-Adviser, including the manner in which the Adviser and each Sub-Adviser monitor for compliance with the investment policies and restrictions of a Fund and with the Codes of Ethics of the Funds, the Adviser and the Sub-Advisers with respect to personal trading by employees with access to portfolio information. In this regard, the Board noted the Adviser’s assistance to the Funds in identifying and hiring a new Chief Compliance Officer (“CCO”) during 2012, and in approving enhancements to the staff of the office of the CCO. Additionally, the Board considered information related to the quality of the risk management program established by ING’s Chief Risk Officer for the Funds, and received reports from other risk management personnel regarding the risk characteristics of the Funds. The Board also considered the actions taken by the Adviser and Sub-Advisers to establish and maintain effective disaster recovery and business continuity plans.
The Board considered the actions taken by the Adviser and its affiliated companies to administer the Funds’ policies and procedures for voting proxies, valuing the Funds’ assets, selective disclosure of portfolio holdings and preventing late-trading and frequent trading of Fund shares.
The Board also took into account the efforts of the Adviser and its affiliated companies to reduce the expenses of the Funds. With respect to those Funds that
33
Table of Contents
ADVISORY CONTRACT APPROVAL DISCUSSION (UNAUDITED) (CONTINUED)
are sub-advised by an affiliate of the Adviser, the Board specifically noted that, in recent years, the Adviser and its affiliated companies have maintained reasonable brokerage costs on behalf of the Funds and have not materially increased the quantity of research acquired through the use of soft dollars from the Funds’ brokerage. In this regard, the Independent Trustees noted that the Adviser and its affiliated companies have established Commission Sharing Arrangements as an alternative means of maintaining access to desired research consistent with achieving best execution. The Board also noted the efforts of the Adviser to optimize the number of Funds in the ING complex of mutual funds and to standardize the asset management characteristics and policies across the ING mutual fund platform. The Board also considered the benefits that shareholders of the Funds realize because the Funds are part of the larger ING family of mutual funds, including, in most cases, the ability of shareholders to exchange or transfer investments within the same class of shares among a wide variety of mutual funds without incurring additional sales charges.
The Board considered information provided by management with respect to ING Groep’s plans for divestiture of its insurance business, including its investment management business (the “Insurance Divestiture”). The Board considered the potential impact of the Insurance Divestiture on the services provided to the Funds by the Adviser and Sub-Advisers. The Board also considered the actions that have been taken by management to retain key investment management personnel in light of the Insurance Divestiture.
The Board also considered the Adviser’s responsiveness and recommendations for Board action and other steps taken in response to the extraordinary dislocations experienced in the capital markets in recent years and related legislative and regulatory changes. In particular, the Board considered the Adviser’s efforts and expertise with respect to each of the following matters as they relate to the Funds: (i) negotiating and maintaining the availability of bank loan facilities and other sources of credit used to satisfy liquidity needs; (ii) establishing the fair value of securities and other instruments held in investment portfolios during periods of market volatility; (iii) negotiating and maintaining credit support from the Funds’ securities lending agent with respect to certain defaulted securities held indirectly by the Funds as collateral for securities on loan; and (iv) the ongoing monitoring of investment management processes and risk controls.
The Board’s approval of the Advisory and Sub-Advisory Agreements was informed by certain information provided by the Adviser and the applicable Sub-Advisers with respect to actions previously taken and proposed to be taken to improve the performance of certain Funds, including those funds that make use of quantitative investment strategies.
The Board concluded that the nature, extent and quality of advisory and related services provided by the Adviser and each of the Sub-Advisers, taken as a whole, are appropriate and consistent with the terms of the respective Advisory and Sub-Advisory Agreements.
Fund Performance
The Board reviewed each Fund’s investment performance over various time periods on an absolute basis and relative to the performance of (i) one or more appropriate benchmark indexes (such as the S&P 500 Composite Stock Price Index), (ii) a group of similarly managed mutual funds identified by Morningstar, Inc. and/or, Lipper, Inc., and (iii) similarly managed mutual funds within a specified peer group based upon the Peer Group Methodology approved by the Contracts Committee (each, a “Selected Peer Group”). The Board reviewed comparative performance data for the most recent calendar quarter, year-to-date, one-, three-, five- and ten-year periods, where applicable, ending June 30, 2012 and the most recent calendar quarter, year-to-date, one-, three-, and five-year periods ending September 30, 2012.
With respect to each Fund that seeks investment results corresponding to the total return of an index (commonly referred to as an “index fund”), the Board focused on the reasonableness of the differences between the Fund’s performance and the total return of such index during these time periods, rather than the performance of the Fund relative to the applicable Morningstar or Lipper category or Selected Peer Group. With respect to each index fund, the Board concluded that differences between the performance of the index fund and benchmark index during relevant time periods have been reasonable.
Subject to the foregoing, the Board concluded with respect to each Fund that (i) the performance of the Fund is satisfactory and/or (ii) that appropriate actions are being taken to improve the Fund’s performance and that additional time is needed to evaluate the effectiveness of such actions.
Summaries of selected portions of the performance information reviewed by the Board, together with the
34
Table of Contents
ADVISORY CONTRACT APPROVAL DISCUSSION (UNAUDITED) (CONTINUED)
Board’s conclusions regarding the performance of each Fund covered by this report, are set forth below under “Fund-by-Fund Analysis.”
Management Fees, Sub-Advisory Fees and Expenses
Consideration was given to the contractual investment advisory fee rates, inclusive of administrative fee rates, payable by the Funds to the Adviser and its affiliated companies (referred to collectively as “management fees”) and the contractual sub-advisory fee rates payable by the Adviser to each Sub-Adviser for sub-advisory services. As part of its review, the Board considered each Fund’s management fee and total expense ratio, as compared to its Selected Peer Group, both before and after giving effect to any undertaking by the Adviser to waive fees and/or limit the total expenses of a Fund. In this regard, the Board considered the Adviser’s agreement to extend each such fee waiver and expense limitation agreement for an additional period of at least one-year and not to terminate such agreement in future years without prior approval of the Board. In addition, the Trustees received information regarding the fees charged by each Sub-Adviser to similarly-managed institutional accounts and other mutual funds, if any, and the comparability (or lack thereof) of the services provided by the Sub-Adviser in managing such accounts and other mutual funds to the services provided in managing the Funds. With respect to the Funds sub-advised by an affiliate of the Adviser, the Board evaluated the reasonableness of the total fees received by the Adviser and its affiliate in the aggregate under the Advisory and Sub-Advisory Agreements. With respect to any Fund sub-advised by a Sub-Adviser that is not affiliated with the Adviser, the Board considered the reasonableness of the fees payable to the Sub-Adviser by the Adviser in light of the ability of the Adviser to negotiate such fees on an arm’s-length basis. After reviewing the foregoing information, and in light of the nature, extent and quality of the services provided by the Adviser and each Sub-Adviser, the Board concluded with respect to each Fund that the fees charged to the Fund for advisory, sub-advisory and related services is fair and reasonable.
Summaries of selected portions of the fee and expense information reviewed for the Funds covered by this report are set forth below under “Fund-by-Fund Analysis.”
Profitability
The Board considered information relating to revenues, expenses, and profits realized by the Adviser and each Sub-Adviser attributable to performing advisory, sub-advisory and administrative services for the Funds. With respect to Funds sub-advised by an unaffiliated Sub-Adviser, the Board did not consider the profitability of the Sub-Adviser to be a material factor because the Board believes that the Adviser negotiates sub-advisory fees with the unaffiliated Sub-Adviser on an arm’s-length basis. The Board reviewed profitability data for the Adviser and its affiliated companies, including the distributor of the Funds, relating to (i) each Fund separately, (ii) all Funds as a group, (iii) all “retail” Funds as a group, and (iv) all variable insurance product Funds as a group, in each case for the one-year periods ended December 31, 2011 and December 31, 2010 and the six-month period ended June 30, 2012. With respect to the Adviser and its affiliates, such information was prepared in accordance with a methodology approved by the Contracts Committee. The Board considered the profitability of the Adviser and its affiliated companies attributable to managing and operating each Fund both with and without the profitability of the distributor of the Funds and both before and after giving effect to any expenses incurred by the Adviser or any affiliated company in making revenue sharing or other payments to third parties, including affiliated insurance companies, for distribution and administrative services. With respect to Funds sub-advised by an affiliate of the Adviser, the Board considered the total profits derived by the Adviser and its affiliate in the aggregate attributable to managing and operating each Fund. The Board recognized that measuring profitability is not an exact science, that there is no uniform methodology for determining profitability for this purpose and that different methodologies can produce dramatically different profit and loss results. The Board also considered other direct or indirect benefits that the Adviser and Sub-Advisers, and any affiliated companies thereof, derive from their relationships with the Funds, including the receipt by certain affiliates of the Adviser, of fees relating to the offering of bundled financial products, such as annuity contracts, and the receipt by Sub-Advisers of “soft dollar” benefits from the Funds’ brokerage. The Board concluded that, in light of the nature, extent and quality of the services provided, the profits realized by the Adviser and its affiliated companies, individually and taken as a whole, with respect to providing advisory, sub-advisory and administrative services for each Fund are reasonable.
35
Table of Contents
ADVISORY CONTRACT APPROVAL DISCUSSION (UNAUDITED) (CONTINUED)
Economies of Scale
In considering the reasonableness of the management fee of each Fund, the Board considered the extent to which economies of scale can be expected to be realized by a Fund’s Adviser and its affiliated companies, on the one hand, and by the Fund, on the other hand, as the assets of the Fund grow. The Board noted that the advisory fee schedule for certain Funds include breakpoints such that, as the assets of the Fund grow, the Fund’s management fee will decrease as a percentage of the Fund’s total assets. The Board recognized the inherent difficulties in measuring precisely the impact of any economies of scale being realized by the Adviser and its affiliated companies with respect to their management of any one or more Funds. In an effort to determine the extent to which economies of scale, if any, will be realized by the Adviser and its affiliated companies as the assets of the Funds grow, the Board considered the profitability data described above relating to the Adviser and its affiliated companies in light of changes in the assets of the Funds over various time periods. The Board also reviewed information regarding the expense ratio of each Fund in light of changes in the assets of the Funds over various time periods, noting that, as the assets of a Fund increase, the fixed expenses of the Fund, as a percentage of the total assets of the Fund, can be expected to decrease. The Board considered such expense information in light of projections provided by the Adviser with respect to the future growth of assets of the Funds. The Board also considered the actions taken during 2012, consistent with prior undertakings provided by the Adviser to the Board, to implement new or additional breakpoints for the following Funds: ING WisdomTree Global High Yielding Equity Index Portfolio; ING Russell Mid Cap Growth Index Portfolio; ING Blackrock Science and Technology Opportunities Portfolio; ING Hang Seng Index Portfolio; ING Corporate Leaders 100 Fund; ING International Index Portfolio; ING Russell Large Cap Growth Index Portfolio; ING Russell Small Cap Index Portfolio; ING Russell Large Cap Index Portfolio; ING Russell Mid Cap Index Portfolio; and ING U.S. Bond Index Portfolio. Based upon the foregoing (and after giving effect to all new or additional breakpoints), the Board concluded that the economies of scale being realized by the Adviser and its affiliated companies do not require the implementation of new breakpoints or additional breakpoints, as the case may be, with respect to any other Fund at this time.
Fund-by-Fund Analysis
In deciding to approve the continuation of each Advisory and Sub-Advisory Agreement for an additional one-year period beginning January 1, 2013, the Board took into account the specific data and factors identified below relating to the performance, fees and expenses of each Fund and actions being taken by the Adviser or Sub-Adviser, as the case may be, with respect to these matters. Except as otherwise indicated, the performance data described below for each Fund is for periods ended September 30, 2012 and the management fees and expense data described below are as of June 30, 2012.
ING Strategic Allocation Conservative Portfolio
In evaluating the investment performance of ING Strategic Allocation Conservative Portfolio the Board noted that: (1) the Portfolio outperformed its Morningstar category median for the most recent calendar quarter, year-to-date, one-year and three-year periods, and underperformed for the five-year period; (2) the Portfolio outperformed its benchmark index for the most recent calendar quarter, year-to-date, one-year and three-year periods, and underperformed for the five-year period; and (3) the Portfolio is ranked in its Morningstar category in the first quintile for the most recent calendar quarter and year-to-date periods, in the second quintile for the one-year and three-year periods and in the fourth quintile for the five-year period. The Board concluded that the performance of the Fund was satisfactory.
In assessing the reasonableness of the management fee for ING Strategic Allocation Conservative Portfolio, the Board noted that the management fee for the Portfolio is below the median and average management fees of the funds in its Selected Peer Group, and that the expense ratio for the Portfolio is below the median and average expense ratios of the funds in its Selected Peer Group.
ING Strategic Allocation Moderate Portfolio
In evaluating the investment performance of ING Strategic Allocation Moderate Portfolio, the Board noted that: (1) the Portfolio outperformed its Morningstar category median the most recent calendar quarter, year-to-date, one-year and three-year periods, and underperformed for the five-year period; (2) the Portfolio underperformed its benchmark index for each period presented; and (3) the Portfolio is ranked in its Morningstar category in the first quintile for the most
36
Table of Contents
ADVISORY CONTRACT APPROVAL DISCUSSION (UNAUDITED) (CONTINUED)
recent calendar quarter, in the second quintile for the year-to-date period, in the third quintile for the one-year and three-year periods and in the fourth quintile for the five-year period. The Board concluded that the Performance of the Portfolio was satisfactory.
In assessing the reasonableness of the management fee for ING Strategic Allocation Moderate Portfolio, the Board noted that the management fee for the Portfolio is below the median and average management fees of the funds in its Selected Peer Group, and that the expense ratio for the Portfolio is below the median and average expense ratios of the funds in its Selected Peer Group.
ING Strategic Allocation Growth Portfolio
In evaluating the investment performance of ING Strategic Allocation Growth Portfolio, the Board noted that: (1) the Portfolio outperformed its Morningstar category median for the most recent calendar quarter, year-to-date, one-year and three-year periods, and
underperformed for the five-year period; (2) the Portfolio outperformed its benchmark index for the most recent calendar, and underperformed its benchmark index for the year-to-date, one-year, three-year and five-year periods; and (3) the Portfolio is ranked in its Morningstar category in the first quintile for the most recent calendar quarter, in the second quintile for the year-to-date and one-year periods, in the third quintile for the three-year period and in the fourth quintile for the five-year period. The Board concluded that the performance of the Portfolio was satisfactory.
In assessing the reasonableness of the management fee for ING Strategic Allocation Growth Portfolio, the Board noted that the management fee for the Portfolio is below the median and average management fees of the funds in its Selected Peer Group, and that the expense ratio for the Portfolio is below to the median and the average expense ratios of the funds in its Selected Peer Group.
37
Table of Contents
Investment Adviser
ING Investments, LLC
7337 East Doubletree Ranch Road, Suite 100
Scottsdale, Arizona 85258
Administrator
ING Funds Services, LLC
7337 East Doubletree Ranch Road, Suite 100
Scottsdale, Arizona 85258
Distributor
ING Investments Distributor, LLC
7337 East Doubletree Ranch Road, Suite 100
Scottsdale, Arizona 85258
Transfer Agent
BNY Mellon Investment Servicing (U.S.) Inc.
301 Bellevue Parkway
Wilmington, Delaware 19809
Independent Registered Public Accounting Firm
KPMG LLP
Two Financial Center
60 South Street
Boston, Massachusetts 02111
Custodian
The Bank of New York Mellon
One Wall Street
New York, New York 10286
Legal Counsel
Goodwin Procter LLP
Exchange Place
53 State Street
Boston, Massachusetts 02109
Before investing, carefully consider the investment objectives, risks, charges and expenses of the variable universal life insurance policy or variable annuity contract and the underlying variable investment options. This and other information is contained in the prospectus for the variable universal life policy or variable annuity contract and the underlying variable investment options. Obtain these prospectuses from your agent/ registered representative and read them carefully before investing.
 | VPAR-SAIS | (1212-021513) |
Table of Contents
| Item 2. | Code of Ethics. |
As of the end of the period covered by this report, Registrant had adopted a code of ethics, as defined in Item 2 of Form N-CSR, that applies to the Registrant’s principal executive officer and principal financial officer. There were no amendments to the Code during the period covered by the report. The Registrant did not grant any waivers, including implicit waivers, from any provisions of the Code during the period covered by this report. The code of ethics is filed herewith pursuant to Item 10(a)(1), Exhibit 99.CODE ETH.
| Item 3. | Audit Committee Financial Expert. |
The Board of Trustees has determined that Joseph Obermeyer is an audit committee financial expert, as defined in Item 3 of Form N-CSR. Mr. Obermeyer is “independent” for purposes of Item 3 of Form N-CSR.
| Item 4. | Principal Accountant Fees and Services. |
| (a) | Audit Fees: The aggregate fees billed for each of the last two fiscal years for professional services rendered by KPMG LLP (“KPMG”), the principal accountant for the audit of the registrant’s annual financial statements, for services that are normally provided by the accountant in connection with statutory and regulatory filings or engagements for those fiscal years were $60,300 for year ended December 31, 2012 and $60,300 for year ended December 31, 2011. |
| (b) | Audit-Related Fees: The aggregate fees billed in each of the last two fiscal years for assurance and related services by KPMG that are reasonably related to the performance of the audit of the registrant’s financial statements and are not reported under paragraph (a) of this Item were $7,200 for year ended December 31, 2012 and $7,200 for year ended December 31, 2011. |
| (c) | Tax Fees: The aggregate fees billed in each of the last two fiscal years for professional services rendered by KPMG for tax compliance, tax advice, and tax planning were $11,400 in the year ended December 31, 2012 and $11,424 in the year ended December 31, 2011. Such services included review of excise distribution calculations (if applicable), preparation of the Funds’ federal, state and excise tax returns, tax services related to mergers and routine consulting. |
| (d) | All Other Fees: The aggregate fees billed in each of the last two fiscal years for products and services provided by KPMG, other than the services reported in paragraphs (a) through (c) of this Item were $0 in the year ended December 31, 2012 and $0 in the year ended December 31, 2011. |
| (e)(1) | Audit Committee Pre-Approval Policies and Procedures |
Table of Contents
AUDIT AND NON-AUDIT SERVICES
PRE-APPROVAL POLICY
| I. | Statement of Principles |
Under the Sarbanes-Oxley Act of 2002 (the “Act”), the Audit Committee of the Board of Directors or Trustees (the “Committee”) of the ING Funds (each a “Fund,” collectively, the “Funds”) set out under Paragraph I on Exhibit A to this Audit and Non-Audit Services Pre-Approval Policy (“Policy”) is responsible for the oversight of the work of the Funds’ independent auditors. As part of its responsibilities, the Committee must pre-approve the audit and non-audit services performed by the auditors in order to assure that the provision of these services does not impair the auditors’ independence from the Funds. The Committee has adopted, and the Board has ratified, this Policy, which sets out the procedures and conditions under which the services of the independent auditors may be pre-approved.
Under Securities and Exchange Commission (“SEC”) rules promulgated in accordance with the Act, the Funds’ may establish two different approaches to pre-approving audit and non-audit services. The Committee may approve services without consideration of specific case-by-case services (“general pre-approval”) or it may pre-approve specific services (“specific pre-approval”). The Committee believes that the combination of these approaches contemplated in this Policy results in an effective and efficient method for pre-approving audit and non-audit services to be performed by the Funds’ independent auditors. Under this Policy, services that are not of a type that may receive general pre-approval require specific pre-approval by the Committee. Any proposed services that exceed pre-approved cost levels or budgeted amounts will also require the Committee’s specific pre-approval.
For both types of approval, the Committee considers whether the subject services are consistent with the SEC’s rules on auditor independence and that such services are compatible with maintaining the auditors’ independence. The Committee also considers whether a particular audit firm is in the best position to provide effective and efficient services to the Funds. Reasons that the auditors are in the best position include the auditors’ familiarity with the Funds’ business, personnel, culture, accounting systems, risk profile, and other factors, and whether the services will enhance the Funds’ ability to manage and control risk or improve audit quality. Such factors will be considered as a whole, with no one factor being determinative.
The appendices attached to this Policy describe the audit, audit-related, tax-related, and other services that have the Committee’s general pre-approval. For any service that has been approved through general pre-approval, the general pre-approval will remain in place for a period 12 months from the date of pre-approval, unless the Committee determines that a different period is appropriate. The Committee will annually review and pre-approve the services that may be provided by the independent auditors without specific pre-approval. The Committee will revise the list of services subject to general pre-approval as appropriate. This Policy does not serve as a delegation to Fund management of the Committee’s duty to pre-approve services performed by the Funds’ independent auditors.
Table of Contents
| II. | Audit Services |
The annual audit services engagement terms and fees are subject to the Committee’s specific pre-approval. Audit services are those services that are normally provided by auditors in connection with statutory and regulatory filings or engagements or those that generally only independent auditors can reasonably provide. They include the Funds’ annual financial statement audit and procedures that the independent auditors must perform in order to form an opinion on the Funds’ financial statements (e.g., information systems and procedural reviews and testing). The Committee will monitor the audit services engagement and approve any changes in terms, conditions or fees deemed by the Committee to be necessary or appropriate.
The Committee may grant general pre-approval to other audit services, such as statutory audits and services associated with SEC registration statements, periodic reports and other documents filed with the SEC or issued in connection with securities offerings.
The Committee has pre-approved the audit services listed on Appendix A. The Committee must specifically approve all audit services not listed on Appendix A.
| III. | Audit-related Services |
Audit-related services are assurance and related services that are reasonably related to the performance of the audit or the review of the Funds’ financial statements or are traditionally performed by the independent auditors. The Committee believes that the provision of audit-related services will not impair the independent auditors’ independence, and therefore may grant pre-approval to audit-related services. Audit-related services include accounting consultations related to accounting, financial reporting or disclosure matters not classified as “audit services;” assistance with understanding and implementing new accounting and financial reporting guidance from rulemaking authorities; agreed-upon or expanded audit procedures relating to accounting and/or billing records required to respond to or comply with financial, accounting or regulatory reporting matters; and assistance with internal control reporting requirements under Form N-SAR or Form N-CSR.
The Committee has pre-approved the audit-related services listed on Appendix B. The Committee must specifically approve all audit-related services not listed on Appendix B.
| IV. | Tax Services |
The Committee believes the independent auditors can provide tax services to the Funds, including tax compliance, tax planning, and tax advice, without compromising the auditors’ independence. Therefore, the Committee may grant general pre-approval with respect to tax services historically provided by the Funds’ independent auditors that do not, in the Committee’s view, impair auditor independence and that are consistent with the SEC’s rules on auditor independence.
The Committee will not grant pre-approval if the independent auditors initially recommends a transaction the sole business purpose of which is tax avoidance and the tax treatment of which may
Table of Contents
not be supported in the Internal Revenue Code and related regulations. The Committee may consult outside counsel to determine that tax planning and reporting positions are consistent with this Policy.
The Committee has pre-approved the tax-related services listed on Appendix C. The Committee must specifically approve all tax-related services not listed on Appendix C.
| V. | Other Services |
The Committee believes it may grant approval of non-audit services that are permissible services for independent auditors to a Fund. The Committee has determined to grant general pre-approval to other services that it believes are routine and recurring, do not impair auditor independence, and are consistent with SEC rules on auditor independence.
The Committee has pre-approved the non-audit services listed on Appendix D. The Committee must specifically approve all non-audit services not listed on Appendix D.
A list of the SEC’s prohibited non-audit services is attached to this Policy as Appendix E. The SEC’s rules and relevant guidance should be consulted to determine the precise definitions of these impermissible services and the applicability of exceptions to certain of the SEC’s prohibitions.
| VI. | Pre-approval of Fee levels and Budgeted Amounts |
The Committee will annually establish pre-approval fee levels or budgeted amounts for audit, audit-related, tax and non-audit services to be provided to the Funds by the independent auditors. Any proposed services exceeding these levels or amounts require the Committee’s specific pre-approval. The Committee considers fees for audit and non-audit services when deciding whether to pre-approve services. The Committee may determine, for a pre-approval period of 12 months, the appropriate ratio between the total amount of fees for the Fund’s audit, audit-related, and tax services (including fees for services provided to Fund affiliates that are subject to pre-approval), and the total amount of fees for certain permissible non-audit services for the Fund classified as other services (including any such services provided to Fund affiliates that are subject to pre-approval).
| VII. | Procedures |
Requests or applications for services to be provided by the independent auditors will be submitted to management. If management determines that the services do not fall within those services generally pre-approved by the Committee and set out in the appendices to these procedures, management will submit the services to the Committee or its delagee. Any such submission will include a detailed description of the services to be rendered.
Notwithstanding this paragraph, the Committee will, on quarterly basis, receive from the independent auditors a list of services provided to date by the auditors during Pre-Approval Period.
Table of Contents
| VIII. | Delegation |
The Committee may delegate pre-approval authority to one or more of the Committee’s members. Any member or members to whom such pre-approval authority is delegated must report any pre-approval decisions, including any pre-approved services, to the Committee at its next scheduled meeting. The Committee will identify any member to whom pre-approval authority is delegated in writing. The member will retain such authority for a period of 12 months from the date of pre-approval unless the Committee determines that a different period is appropriate. The period of delegated authority may be terminated by the Committee or at the option of the member.
| IX. | Additional Requirements |
The Committee will take any measures the Committee deems necessary or appropriate to oversee the work of the independent auditors and to assure the auditors’ independence from the Funds. This may include reviewing a formal written statement from the independent auditors delineating all relationships between the auditors and the Funds, consistent with Independence Standards Board No. 1, and discussing with the auditors their methods and procedures for ensuring independence.
Effective April 23, 2008, the KPMG LLP (“KPMG”) audit team for the ING Funds accepted the global responsibility for monitoring the auditor independence for KPMG relative to the ING Funds. Using a proprietary system called Sentinel, the audit team is able to identify and manage potential conflicts of interest across the member firms of the KPMG International Network and prevent the provision of prohibited services to the ING entities that would impair KPMG independence with the respect to the ING Funds. In addition to receiving pre-approval from the ING Funds Audit Committee for services provided to the ING Funds and for services for ING entities in the Investment Company Complex, the audit team has developed a process for periodic notification via email to the ING Funds’ Audit Committee Chairpersons regarding requests to provide services to ING Groep NV and its affiliates from KPMG offices worldwide. Additionally, KPMG provides a quarterly summary of the fees for services that have commenced for ING Groep NV and Affiliates at each Audit Committee Meeting.
Date last approved: December 14, 2011
Table of Contents
Appendix A
Pre-Approved Audit Services for the Pre-Approval Period January 1, 2012 through December 31, 2012
Service | The Fund(s) | Fee Range | ||
| Statutory audits or financial audits (including tax services associated with audit services) | ü | As presented to Audit Committee1 | ||
| Services associated with SEC registration statements, periodic reports and other documents filed with the SEC or other documents issued in connection with securities offerings (e.g., consents), and assistance in responding to SEC comment letters. | ü | Not to exceed $9,750 per filing | ||
| Consultations by Fund management with respect to accounting or disclosure treatment of transactions or events and/or the actual or potential effect of final or proposed rules, standards or interpretations by the SEC, Financial Accounting Standards Board, or other regulatory or standard setting bodies. | ü | Not to exceed $8,000 during the Pre-Approval Period | ||
| 1 | For new Funds launched during the Pre-Approval Period, the fee ranges pre-approved will be the same as those for existing Funds, pro-rated in accordance with inception dates as provided in KPMG’s Proposal or any Engagement Letter covering the period at issue. Fees in the Engagement Letter will be controlling. |
Table of Contents
Appendix B
Pre-Approved Audit-Related Services for the Pre-Approval Period January 1, 2012 through December 31, 2012
Service | The Fund(s) | Fund Affiliates | Fee Range | |||
| Services related to Fund mergers (Excluding tax services – See Appendix C for tax services associated with fund mergers) | ü | ü | Not to exceed $10,000 per merger | |||
| Consultations by Fund management with respect to accounting or disclosure treatment of transactions or events and/or the actual or potential effect of final or proposed rules, standards or interpretations by the SEC, Financial Accounting Standards Board, or other regulatory or standard setting bodies. [Note: Under SEC rules some consultations may be “audit” services and others may be “audit-related” services.] | ü | Not to exceed $5,000 per occurrence during the Pre-Approval Period | ||||
| Review of the Funds’ semi-annual financial statements | ü | Not to exceed $2,400 per set of financial statements per fund | ||||
| Reports to regulatory or government agencies related to the annual engagement | ü | Up to $5,000 per occurrence during the Pre-Approval Period | ||||
| Regulatory compliance assistance | ü | ü | Not to exceed $5,000 per quarter | |||
| Training courses | ü | Not to exceed $2,000 per course | ||||
Table of Contents
Appendix C
Pre-Approved Tax Services for the Pre-Approval Period January 1, 2012 through December 31, 2012
Service | The Fund(s) | Fund Affiliates | Fee Range | |||
| Preparation of federal and state income tax returns and federal excise tax returns for the Funds including assistance and review with excise tax distributions. | ü | As presented to Audit Committee2 | ||||
| Review of IRC Sections 851(b) and 817(h) diversification testing on a real-time basis | ü | As presented to Audit Committee2 | ||||
| Assistance and advice regarding year-end reporting for 1099’s | ü | As presented to Audit Committee2 | ||||
| Tax assistance and advice regarding statutory, regulatory or administrative developments | ü | ü | Not to exceed $5,000 in aggregate for the Funds or for the Funds’ investment adviser during the Pre-Approval Period | |||
| Tax training courses | ü | Not to exceed $2,000 per course during the Pre-Approval Period | ||||
| 2 | For new Funds launched during the Pre-Approval Period, the fee ranges pre-approved will be the same as those for existing Funds, as provided in KPMG’s Proposal or any Engagement Letter covering the period at issue. Fees in the Engagement Letter will be controlling. |
Table of Contents
Appendix C, continued
Service | The Fund(s) | Fund Affiliates | Fee Range | |||
| Tax services associated with Fund mergers | ü | ü | Not to exceed $4,000 per fund per merger during the Pre-Approval Period | |||
| Other tax-related assistance and consultation, including, without limitation, assistance in evaluating derivative financial instruments and international tax issues, qualification and distribution issues, and similar routine tax consultations | ü | �� | Not to exceed $50,000 during the Pre-Approval Period | |||
Table of Contents
Appendix D
Pre-Approved Other Services for the Pre-Approval Period January 1, 2012 through December 31, 2012
Service | The Fund(s) | Fund Affiliates | Fee Range | |||
| Agreed-upon procedures for Class B share 12b-1 programs | ü | Not to exceed $60,000 during the Pre-Approval Period | ||||
Security counts performed pursuant to Rule 17f-2 of the 1940 Act (i.e., counts for Funds holding securities with affiliated sub-custodians)
(Cost to be split 50% the funds and 50% ING Investments, LLC) | ü | ü | Not to exceed $5,000 per Fund during the Pre-Approval Period | |||
Table of Contents
Appendix E
Prohibited Non-Audit Services
Dated: 2012
| • | Bookkeeping or other services related to the accounting records or financial statements of the Funds |
| • | Financial information systems design and implementation |
| • | Appraisal or valuation services, fairness opinions, or contribution-in-kind reports |
| • | Actuarial services |
| • | Internal audit outsourcing services |
| • | Management functions |
| • | Human resources |
| • | Broker-dealer, investment adviser, or investment banking services |
| • | Legal services |
| • | Expert services unrelated to the audit |
| • | Any other service that the Public Company Accounting Oversight Board determines, by regulation, is impermissible |
Table of Contents
EXHIBIT A
ING BALANCED PORTFOLIO, INC.
ING STRATEGIC ALLOCATION PORTFOLIOS, INC.
ING INTERMEDIATE BOND PORTFOLIO
ING MONEY MARKET PORTFOLIO
ING VARIABLE FUNDS
ING VARIABLE PORTFOLIOS, INC.
ING SERIES FUND, INC.
Table of Contents
| (e)(2) | Percentage of services referred to in 4(b) — (4)(d) that were approved by the audit committee |
100% of the services were approved by the audit committee.
| (f) | Percentage of hours expended attributable to work performed by other than full time employees of KPMG if greater than 50%. |
Not applicable.
| (g) | Non-Audit Fees: The non-audit fees billed by the registrant’s accountant for services rendered to the registrant, and rendered to the registrant’s investment adviser, and any entity controlling, controlled by, or under common control with the adviser that provides ongoing services to the registrant for each of the last two fiscal years of the registrant were $2,085,015 for year ended December 31, 2012 and $1,122,24 for year ended December 31, 2011. |
| (h) | Principal Accountants Independence: The Registrant’s Audit committee has considered whether the provision of non-audit services that were rendered to the registrant’s investment adviser and any entity controlling, controlled by, or under common control with the investment adviser that provides ongoing services to the registrant that were not pre-approved pursuant to Rule 2-01(c)(7)(ii) of Regulation S-X is compatible with maintaining KPMG’s independence. |
| Item 5. | Audit Committee of Listed Registrants. |
Not applicable.
Table of Contents
| Item 6. | Schedule of Investments |
Schedule is included as part of the report to shareholders filed under Item 1 of this Form, if applicable.
Table of Contents
| Item 7. | Disclosure of Proxy Voting Policies and Procedures for Closed-End Management Investment Companies. |
Not applicable.
| Item 8. | Portfolio Managers of Closed-End Management Investment Companies. |
Not applicable.
| Item 9. | Purchases of Equity Securities by Closed-End Management Investment Company and Affiliated Purchasers |
Not applicable.
| Item 10. | Submission of Matters to a Vote of Security Holders. |
The Nominating Committee operates pursuant to a Charter approved by the Board. The primary purpose of the Nominating Committee is to consider, evaluate and make recommendations to the Board with respect to the nomination and selection of Independent Trustees. In evaluating candidates, the Nominating Committee may consider a variety of factors, but specific qualifications of candidates for Board membership will be based on the needs of the Board at the time of nomination.
The Nominating Committee is willing to consider nominations received from shareholders and shall assess shareholder nominees in the same manner as it reviews nominees it identifies. A shareholder nominee for director should be submitted in writing to the Fund’s Secretary. Any such shareholder nomination should include sufficient background information concerning the candidate and should be received in a timely
Table of Contents
manner. At a minimum, the following information as to each individual proposed for nomination as director should be included: the individual’s written consent to be named in the proxy statement as a nominee (if nominated) and to serve as a director (if elected), and all information relating to such individual that is required to be disclosed in a solicitation of proxies for election of directors, or is otherwise required, in each case under applicable federal securities laws, rules and regulations.
The Secretary shall submit all nominations received in a timely manner to the Nominating Committee. To be timely, any such submission must be delivered to the Fund’s Secretary not earlier than the 90th day prior to such meeting and not later than the close of business on the later of the 60th day prior to such meeting or the 10th day following the day on which public announcement of the date of the meeting is first made, by either disclosure in a press release or in a document publicly filed by the Fund with the SEC.
In evaluating a candidate for the position of Independent Trustee, including any candidate recommended by shareholders of the Fund, the Nominating Committee shall consider the following: (i) the candidate’s knowledge in matters relating to the mutual fund industry; (ii) any experience possessed by the candidate as a director or senior officer of other public companies; (iii) the candidate’s educational background, reputation for high ethical standards and professional integrity; (iv) any specific financial, technical or other expertise possessed by the candidate, and the extent to which such expertise would complement the Board’s existing mix of skills, core competencies and qualifications; (v) the candidate’s perceived ability to contribute to the ongoing functions of the Board, including the candidate’s ability and commitment to attend meetings regularly and work collaboratively with other members of the Board; (vi) the candidate’s ability to qualify as an Independent Trustee for purposes of the 1940 Act; and (vii) such other factors as the Committee determines to be relevant in light of the existing composition of the Board and any anticipated vacancies. Prior to making a final recommendation to the Board, the Committee shall conduct personal interviews with those candidates it concludes are the most qualified candidates.
Table of Contents
| Item 11. | Controls and Procedures. |
| (a) | Based on our evaluation conducted within 90 days of the filing date, hereof, the design and operation of the registrant’s disclosure controls and procedures are effective to ensure that material information relating to the registrant is made known to the certifying officers by others within the appropriate entities, particularly during the period in which Forms N-CSR are being prepared, and the registrant’s disclosure controls and procedures allow timely preparation and review of the information for the registrant’s Form N-CSR and the officer certifications of such Form N-CSR. |
| (b) | There were no significant changes in the registrant’s internal controls that occurred during the second fiscal quarter of the period covered by this report that has materially affected, or is reasonably likely to materially affect, the registrant’s internal control over financial reporting. |
| Item 12. | Exhibits. |
| (a)(1) | Code of Ethics pursuant to Item 2 of Form N-CSR is filed and attached hereto as EX-99.CODE ETH. | |
| (a)(2) | A separate certification for each principal executive officer and principal financial officer of the registrant as required by Rule 30a-2 under the Act (17 CFR 270.30a-2) is attached hereto as EX-99.CERT. | |
| (b) | The officer certifications required by Section 906 of the Sarbanes-Oxley Act of 2002 are attached hereto as EX-99.906CERT | |
| (3) | Not applicable. | |
Table of Contents
SIGNATURES
Pursuant to the requirements of the Securities Exchange Act of 1934 and the Investment Company Act of 1940, the registrant has duly caused this report to be signed on its behalf by the undersigned, thereunto duly authorized.
(Registrant): ING Strategic Allocation Portfolios, Inc.
| By | /s/ Shaun P. Mathews | |
| Shaun P. Mathews | ||
| President and Chief Executive Officer | ||
| Date: | March 6, 2013 | |
Pursuant to the requirements of the Securities Exchange Act of 1934 and the Investment Company Act of 1940, this report has been signed below by the following persons on behalf of the registrant and in the capacities and on the dates indicated.
| By | /s/ Shaun P. Mathews | |
| Shaun P. Mathews | ||
| President and Chief Executive Officer | ||
| Date: | March 6, 2013 | |
| By | /s/ Todd Modic | |
| Todd Modic | ||
| Senior Vice President and Chief Financial Officer | ||
| Date: | March 6, 2013 | |