UNITED STATES
SECURITIES AND EXCHANGE COMMISSION
Washington, D.C. 20549
FORM 10-K
ANNUAL REPORT PURSUANT TO SECTION 13 OR 15(d) OF THE
SECURITIES EXCHANGE ACT OF 1934
For the Fiscal Year Ended February 2, 2008
Commission File No.0-25464
DOLLAR TREE, INC.
(Exact name of registrant as specified in its charter)
| Virginia | 26-2018846 |
| (State or other jurisdiction of | (I.R.S. Employer |
| incorporation or organization) | Identification No.) |
500 Volvo Parkway, Chesapeake, VA 23320
(Address of principal executive offices)
Registrant’s telephone number, including area code: (757) 321-5000
| Securities Registered Pursuant to Section 12(b) of the Act: |
| Title of Each Class | Name of Each Exchange on Which Registered |
| None | None |
Securities Registered Pursuant to Section 12(g) of the Act:
Common Stock (par value $.01 per share)
(Title of Class)
Indicate by check mark if the registrant is a well-known seasoned issuer, as defined in Rule 405 of the Securities Act.
Indicate by check mark if the registrant is not required to file reports pursuant to Section 13 or Section 15(d) of the Exchange Act.
Indicate by check mark whether Registrant (1) has filed all reports required to be filed by Section 13 or 15(d) of the Securities Exchange Act of 1934 during the preceding 12 months (or for such shorter period that the Registrant was required to file such reports), and (2) has been subject to such filing requirements for the past 90 days.
Indicate by check mark if disclosure of delinquent filers pursuant to Item 405 of Regulation S-K is not contained herein, and will not be contained, to the best of Registrant’s knowledge, in definitive proxy or information statements incorporated by reference in Part III of this Form 10-K or any amendment to this Form 10-K. ( )
Indicate by check mark whether the registrant is a large accelerated filer, an accelerated filer, a non-accelerated filer or a smaller reporting company. See definition of “large accelerated filer,” “accelerated filer” and “smaller reporting company” in Rule 12b-2 of the Exchange Act.
| Large accelerated filer (X) | Accelerated filer ( ) |
| Non-accelerated filer ( ) | Smaller reporting company ( ) |
Indicate by check mark whether the registrant is a shell company (as defined in Rule 12b-2 of the Exchange Act).
The aggregate market value of Common Stock held by non-affiliates of the Registrant on August 3, 2007, was $3,664,182,086 based on a $39.28 average of the high and low sales prices for the Common Stock on such date. For purposes of this computation, all executive officers and directors have been deemed to be affiliates. Such determination should not be deemed to be an admission that such executive officers and directors are, in fact, affiliates of the Registrant.
On March 28, 2008, there were 89,808,123 shares of the Registrant’s Common Stock outstanding.
DOCUMENTS INCORPORATED BY REFERENCE
The information regarding securities authorized for issuance under equity compensation plans called for in Item 5 of Part II and the information called for in Items 10, 11, 12, 13 and 14 of Part III are incorporated by reference to the definitive Proxy Statement for the Annual Meeting of Stockholders of the Company to be held June 19, 2008, which will be filed with the Securities and Exchange Commission not later than May 30, 2008.
TABLE OF CONTENTS
| | | Page |
| | PART I | |
| | | |
| Item 1. | BUSINESS | 6 |
| | | |
| Item 1A. | RISK FACTORS | 10 |
| | | |
| Item 1B. | UNRESOLVED STAFF COMMENTS | 12 |
| | | |
| Item 2. | PROPERTIES | 13 |
| | | |
| Item 3. | LEGAL PROCEEDINGS | 14 |
| | | |
| Item 4. | SUBMISSION OF MATTERS TO A VOTE OF SECURITY HOLDERS | 15 |
| | | |
| | PART II | |
| | | |
| Item 5. | MARKET FOR REGISTRANT'S COMMON EQUITY, RELATED | |
| | STOCKHOLDER MATTERS AND ISSUER PURCHASES OF EQUITY SECURITIES | 16 |
| | | |
| Item 6. | SELECTED FINANCIAL DATA | 17 |
| | | |
| Item 7. | MANAGEMENT'S DISCUSSION AND ANALYSIS OF FINANCIAL | |
| | CONDITION AND RESULTS OF OPERATIONS | 19 |
| | | |
| Item 7A. | QUANTITATIVE AND QUALITATIVE DISCLOSURES ABOUT MARKET RISK | 29 |
| | | |
| Item 8. | FINANCIAL STATEMENTS AND SUPPLEMENTARY DATA | 31 |
| | | |
| Item 9. | CHANGES IN AND DISAGREEMENTS WITH ACCOUNTANTS ON | |
| | ACCOUNTING AND FINANCIAL DISCLOSURE | 57 |
| | | |
| Item 9A. | CONTROLS AND PROCEDURES | 57 |
| | | |
| Item 9B. | OTHER INFORMATION | 58 |
| | | |
| | PART III | |
| | | |
| Item 10. | DIRECTORS, EXECUTIVE OFFICERS, AND CORPORATE GOVERNANCE | 58 |
| | | |
| Item 11. | EXECUTIVE COMPENSATION | 58 |
| | | |
| Item 12. | SECURITY OWNERSHIP OF CERTAIN BENEFICIAL OWNERS | |
| | AND MANAGEMENT AND RELATED STOCKHOLDER MATTERS | 58 |
| | | |
| Item 13. | CERTAIN RELATIONSHIPS, RELATED TRANSACTIONS AND DIRECTOR INDEPENDENCE | 59 |
| | | |
| Item 14. | PRINCIPAL ACCOUNTING FEES AND SERVICES | 59 |
| | | |
| | PART IV | |
| | | |
| Item 15. | EXHIBITS, FINANCIAL STATEMENT SCHEDULES, AND REPORTS ON FORM 8-K | 59 |
| | | |
| | SIGNATURES | 60 |
A WARNING ABOUT FORWARD-LOOKING STATEMENTS: This document contains "forward-looking statements" as that term is used in the Private Securities Litigation Reform Act of 1995. Forward-looking statements address future events, developments and results. They include statements preceded by, followed by or including words such as "believe," "anticipate," "expect," "intend," "plan," "view," “target” or "estimate." For example, our forward-looking statements include statements regarding:
· | our anticipated sales, including comparable store net sales, net sales growth and earnings growth; |
· | our growth plans, including our plans to add, expand or relocate stores, our anticipated square footage increase, and our ability to renew leases at existing store locations; |
· | the average size of our stores to be added in 2008 and beyond; |
· | the effect of a slight shift in merchandise mix to consumables and the increase in freezers and coolers on gross profit margin and sales; |
· | the effect that expanding tender types accepted by our stores will have on sales; |
· | the net sales per square foot, net sales and operating income attributable to smaller and larger stores and store-level cash payback metrics; |
· | the possible effect of inflation and other economic changes on our costs and profitability, including the possible effect of future changes in minimum wage rates, shipping rates, domestic and foreign freight costs, fuel costs and wage and benefit costs; |
· | our cash needs, including our ability to fund our future capital expenditures and working capital requirements; |
· | our gross profit margin, earnings, inventory levels and ability to leverage selling, general and administrative and other fixed costs; |
· | our seasonal sales patterns including those relating to the length of the holiday selling seasons and the effect of an earlier Easter in 2008; |
· | the capabilities of our inventory supply chain technology and other new systems; |
· | the future reliability of, and cost associated with, our sources of supply, particularly imported goods such as those sourced from China; |
· | the capacity, performance and cost of our distribution centers, including opening and expansion schedules; |
· | our expectations regarding competition and growth in our retail sector; |
· | costs of pending and possible future legal claims; |
· | management's estimates associated with our critical accounting policies, including inventory valuation, accrued expenses, and income taxes; |
You should assume that the information appearing in this annual report is accurate only as of the date it was issued. Our business, financial condition, results of operations and prospects may have changed since that date.
For a discussion of the risks, uncertainties and assumptions that could affect our future events, developments or results, you should carefully review the risk factors described in Item 1A “Risk Factors” beginning on page 10, as well as Item 7 "Management’s Discussion and Analysis of Financial Condition and Results of Operations" beginning on page 19 of this Form 10-K.
Our forward-looking statements could be wrong in light of these and other risks, uncertainties and assumptions. The future events, developments or results described in this report could turn out to be materially different. We have no obligation to publicly update or revise our forward-looking statements after the date of this annual report and you should not expect us to do so.
Investors should also be aware that while we do, from time to time, communicate with securities analysts and others, we do not, by policy, selectively disclose to them any material, nonpublic information or other confidential commercial information. Accordingly, shareholders should not assume that we agree with any statement or report issued by any securities analyst regardless of the content of the statement or report. We generally do not issue financial forecasts or projections and we do not, by policy, confirm those issued by others. Thus, to the extent that reports issued by securities analysts contain any projections, forecasts or opinions, such reports are not our responsibility.
INTRODUCTORY NOTE: Unless otherwise stated, references to "we," "our" and "Dollar Tree" generally refer to Dollar Tree, Inc. and its direct and indirect subsidiaries on a consolidated basis. Unless specifically indicated otherwise, any references to “2008” or “fiscal 2008”, “2007” or “fiscal 2007”, “2006” or “fiscal 2006,” and “2005” or “fiscal 2005,” relate to as of or for the years ended January 31, 2009, February 2, 2008, February 3, 2007 and January 28, 2006, respectively.
On March 2, 2008, we reorganized by creating a new holding company structure. The new parent company is Dollar Tree, Inc., replacing Dollar Tree Stores, Inc., which is now an operating subsidiary. The primary purpose of the reorganization was to create a more efficient corporate structure. Outstanding shares of the capital stock of Dollar Tree Stores, Inc., were automatically converted, on a share for share basis, into identical shares of common stock of the new holding company. The articles of incorporation, the bylaws, the executive officers and the board of directors of our new holding company are the same as those of the former Dollar Tree Stores, Inc. in effect immediately prior to the reorganization. The common stock of our new holding company will continue to be listed on the NASDAQ Global Select Market under the symbol “DLTR”. The rights, privileges and interests of our stockholders will remain the same with respect to our new holding company.
AVAILABLE INFORMATION
Our annual reports on Form 10-K, quarterly reports on Form 10-Q, current reports on Form 8-K and amendments to those reports filed or furnished pursuant to Section 13(a) or 15(d) of the Securities Exchange Act are available free of charge on our website at www.dollartree.com as soon as reasonably practicable after electronic filing of such reports with the SEC.
PART I
Item 1. BUSINESS
Overview
Since our founding in 1986, we have become the leading operator of discount variety stores offering merchandise at the fixed price of $1.00. We believe the variety and quality of products we sell for $1.00 sets us apart from our competitors. At February 2, 2008, we operated 3,411 discount variety retail stores. Approximately 3,300 of these stores sell substantially all items for $1.00 or less. The remaining stores, operating as Deal$, which were acquired in March 2006, sell most items for $1.00 or less but also sell items at prices greater than $1.00. Our stores operate under the names of Dollar Tree, Deal$ and Dollar Bills. On March 2, 2008, Dollar Tree, Inc. became the new parent holding company for Dollar Tree Stores, Inc., which is now an operating subsidiary.
In the past five years, we have modified our average store size to reflect what we believe is our optimal store size of between 10,000 and 12,500 square feet. At February 2, 2008, approximately 14% of our stores are less than 6,000 square feet, which is down from approximately 40% of our stores at January 31, 2004. These smaller stores are comprised of mall and older strip shopping center locations and are candidates for relocation as their leases expire. Our current store size reflects our expanded merchandise offerings and improved service to our customers. As we have been expanding our merchandise offerings, we have added freezers and coolers to approximately 1,100 stores during the past three years to increase traffic and transaction size. At January 31, 2004, we operated 2,513 stores in 47 states. At February 2, 2008, we operated 3,411 stores in 48 states. Our selling square footage increased from approximately 16.9 million square feet in January 2004 to 28.4 million square feet in February 2008. Our store growth since 2003 has resulted from opening new stores and completing mergers and acquisitions. We centrally manage our store and distribution operations from our corporate headquarters in Chesapeake, Virginia.
Business Strategy
Value Merchandise Offering. We strive to exceed our customers' expectations of the variety and quality of products that they can purchase for $1.00 by offering items that we believe typically sell for higher prices elsewhere. We buy approximately 55% to 60% of our merchandise domestically and import the remaining 40% to 45%. Our domestic purchases include closeouts. We believe our mix of imported and domestic merchandise affords our buyers flexibility that allows them to consistently exceed the customer's expectations. In addition, direct relationships with manufacturers permit us to select from a broad range of products and customize packaging, product sizes and package quantities that meet our customers' needs.
Mix of Basic Variety and Seasonal Merchandise. We maintain a balanced selection of products within traditional variety store categories. We offer a wide selection of everyday basic products and we supplement these basic, everyday items with seasonal and closeout merchandise. We attempt to keep certain basic consumable merchandise in our stores continuously to establish our stores as a destination and we increased slightly the mix of consumable merchandise in order to increase the traffic in our stores. Closeout merchandise is purchased opportunistically and represents less than 10% of our purchases. National, regional and corporate brands have become a bigger part of our merchandise mix.
Our merchandise mix consists of:
| | |
· | consumable merchandise, which includes candy and food, basic health and beauty care, and household consumables such as paper, plastics and household chemicals and in select stores, frozen and refrigerated food; |
| | |
· | variety merchandise, which includes toys, durable housewares, gifts, fashion health and beauty care, party goods, greeting cards, apparel, and other items; and |
| | |
· | seasonal goods, which include Easter, Halloween and Christmas merchandise, along with summer toys and lawn and garden merchandise. |
We have added freezers and coolers to certain stores which has increased the consumable merchandise carried by those stores. We believe this initiative helps us drive additional transactions and allows us to appeal to a broader demographic mix, and these stores will carry more consumable merchandise than stores without freezers. We have added freezers and coolers to approximately 360 more stores in 2007. Therefore, as of February 2, 2008, we have freezers and coolers in approximately 1,100 of our stores. We plan to add them to approximately 150 more stores in 2008. As a result of the installation of freezers and coolers in select stores, consumable merchandise has grown as a percentage of purchases and sales and we expect this trend to continue. The following table shows the percentage of purchases of each major product group for the years ended February 2, 2008 and February 3, 2007:
| | February 2, | February 3, |
| Merchandise Type | 2008 | 2007 |
| | | |
| Variety categories | 48.1% | 48.9% |
| Consumable | 46.0% | 45.3% |
| Seasonal | 5.9% | 5.8% |
Customer Payment Methods. All of our stores accept cash, checks, debit cards and VISA credit cards and approximately 1,000 stores accept MasterCard credit cards. Prior to May 2005, approximately 900 of our stores accepted debit cards. By the end of 2005, approximately 2,300 of our stores accepted debit cards and as of the end of 2006, all of our stores accepted debit cards. We began accepting VISA credit cards at all of our stores in the fourth quarter of 2007. Along with the shift to more consumables, the rollout of freezers and coolers, and the acceptance of pin-based debit and VISA credit transactions, we increased the number of stores accepting Electronic Benefits Transfer cards and food stamps at qualified stores in the current year. We believe that expanding our tender types has helped increase both the traffic and the average size of transactions at our stores in the current year.
Convenient Locations and Store Size. We primarily focus on opening new stores in strip shopping centers anchored by mass merchandisers, whose target customers we believe to be similar to ours. Our stores have proven successful in metropolitan areas, mid-sized cities and small towns. The range of our store sizes allows us to target a particular location with a store that best suits that market and takes advantage of available real estate opportunities. Our stores are attractively designed and create an inviting atmosphere for shoppers by using bright lighting, vibrant colors, decorative signs and background music. We enhance the store design with attractive merchandise displays. We believe this design attracts new and repeat customers and enhances our image as both a destination and impulse purchase store.
For more information on retail locations and retail store leases, see Item 2 "Properties” beginning on page 13 of this Form 10-K.
Profitable Stores with Strong Cash Flow. We maintain a disciplined, cost-sensitive approach to store site selection in order to minimize the initial capital investment required and maximize our potential to generate high operating margins and strong cash flows. We believe that our stores have a relatively small shopping radius, which allows us to profitably concentrate multiple stores within a single market. Our ability to open new stores is dependent upon, among other factors, locating suitable sites and negotiating favorable lease terms.
Our older, smaller stores continue to generate significant store-level operating income and operating cash flows and have some of the highest operating margin rates among our stores; however, the increased size of our newer stores allows us to offer a wider selection of products, including more basic consumable merchandise, thereby making them more attractive as a destination store.
The strong cash flows generated by our stores allow us to self-fund infrastructure investment and new stores. Over the past five years, cash flows from operating activities have exceeded capital expenditures.
For more information on our results of operations and seasonality of sales, see Item 7 "Management's Discussion and Analysis of Financial Condition and Results of Operations" beginning on page 19 of this Form 10-K.
Cost Control. We believe that substantial buying power at the $1.00 price point and our flexibility in making sourcing decisions contributes to our successful purchasing strategy, which includes disciplined, targeted merchandise margin goals by category. We believe our disciplined buying and quality merchandise help to minimize markdowns. We buy products on an order-by-order basis and have no material long-term purchase contracts or other assurances of continued product supply or guaranteed product cost. No vendor accounted for more than 10% of total merchandise purchased in any of the past five years.
Our supply chain systems continue to provide us with valuable sales information to assist our buyers and improve merchandise allocation to our stores. Controlling our inventory levels has resulted in more efficient distribution and store operations.
Information Systems. We believe that investments in technology help us to increase sales and control costs. Our inventory management system has allowed us to improve the efficiency of our supply chain, improve merchandise flow and control distribution and store operating costs. Our automatic replenishment system automatically reorders key items, based on actual store level sales and inventory. At the end of 2007, we had over 1,000 basic, everyday items on automatic replenishment.
Point-of-sale data allows us to track sales by merchandise category at the store level and assists us in planning for future purchases of inventory. We believe that this information allows us to ship the appropriate product to stores at the quantities commensurate with selling patterns. Using this point-of-sale data for planning purchases of inventory has helped us maintain our inventory levels on a per store basis in 2007 compared to 2006 despite lower than planned fourth quarter 2007 sales and increased merchandise flow resulting from the earlier Easter season in 2008. Our inventory turns also increased 25 basis points in 2007.
Corporate Culture and Values. We believe that honesty and integrity, doing the right things for the right reasons, and treating people fairly and with respect are core values within our corporate culture. We believe that running a business, and certainly a public company, carries with it a responsibility to be above reproach when making operational and financial decisions. Our management team visits and shops our stores like every customer; we have an open door policy for all our associates; and ideas and individual creativity are encouraged. We have standards for store displays, merchandise presentation, and store operations. Our distribution centers are operated based on objective measures of performance and virtually everyone in our store support center is available to assist associates in the stores and distribution centers.
Our disclosure committee meets at least quarterly and monitors our internal controls over financial reporting and ensures that our public filings contain discussions about the risks our business faces. We believe that we have the controls in place to be able to certify our financial statements. Additionally, we have complied with the updated listing requirements for the Nasdaq Stock Market.
Growth Strategy
Store Openings and Square Footage Growth. The primary factors contributing to our net sales growth have been new store openings, an active store expansion and remodel program, and selective mergers and acquisitions. From 2003 to 2007, net sales increased at a compound annual growth rate of 10.9%. We expect that the substantial majority of our future sales growth will come primarily from new store openings and from our store expansion and relocation program.
The following table shows the total selling square footage of our stores and the selling square footage per new store opened over the last five years. Our growth and productivity statistics are reported based on selling square footage because our management believes the use of selling square footage yields a more accurate measure of store productivity. The selling square footage statistics for 2003 through 2007 are estimates based on the relationship of selling to gross square footage.
| Year | Number of Stores | Average Selling Square Footage Per Store | Average Selling Square Footage Per New Store Opened |
| 2003 | 2,513 | 6,716 | 9,948 |
| 2004 | 2,735 | 7,475 | 10,947 |
| 2005 | 2,914 | 7,900 | 9,756 |
| 2006 | 3,219 | 8,160 | 8,780 |
| 2007 | 3,411 | 8,300 | 8,480 |
We expect to increase our selling square footage in the future by opening new stores in underserved markets and strategically increasing our presence in our existing markets via new store openings and store expansions (expansions include store relocations). In fiscal 2008 and beyond, we plan to predominantly open stores that are approximately 8,500 - 9,000 selling square feet and we believe this size allows us to achieve our objectives in the markets in which we plan to expand. At February 2, 2008, 1,370 of our stores, totaling 55.6% of our selling square footage, were 8,500 selling square feet or larger.
In addition to new store openings, we plan to continue our store expansion program to increase our net sales per store and take advantage of market opportunities. We target stores for expansion based on the current sales per selling square foot and changes in market opportunities. Stores targeted for expansion are generally less than 6,000 selling square feet in size. Store expansions generally increase the existing store size by approximately 4,000 selling square feet.
Since 1995, we have added a total of 609 stores through four mergers and several small acquisitions. Our acquisition strategy has been to target companies with a similar single-price point concept that have shown success in operations or provide a strategic advantage. We evaluate potential acquisition opportunities in our retail sector as they become available.
On March 25, 2006, we completed our acquisition of 138 Deal$ stores and paid $32.0 million for store-related and other assets and $22.1 million for inventory. These stores are located primarily in the Midwest part of the United States and we have existing logistics capacity to service these stores. This acquisition also included a few “combo” stores that offer an expanded assortment of merchandise including items that sell for more than $1. Substantially all Deal$ stores acquired continue to operate under the Deal$ banner while providing us an opportunity to leverage our Dollar Tree infrastructure in the testing of new merchandise concepts, including higher price points, without disrupting the single-price point model in our Dollar Tree stores.
In 2007, we also acquired the rights to 32 store leases through bankruptcy proceedings of certain discount retailers. We will take advantage of these opportunities as they arise in the future.
Merchandising and Distribution. Expanding our customer base is important to our growth plans. We plan to continue to stock our new stores with the ever-changing merchandise that our current customers have come to appreciate. In addition, we are opening larger stores that contain more basic consumable merchandise to attract new customers. Consumable merchandise typically leads to more frequent return trips to our stores resulting in increased sales. The presentation and display of merchandise in our stores are critical to communicating value to our customers and creating a more exciting shopping experience. We believe our approach to visual merchandising results in higher store traffic, higher sales volume and an environment that encourages impulse purchases.
A strong and efficient distribution network is critical to our ability to grow and to maintain a low-cost operating structure. We expect to continue to add distribution capacity to support our store opening plans, with the aim of remaining approximately one year ahead of our distribution needs. In 2007, we added capacity to our Briar Creek distribution center which services the northeast part of the country. We believe these distribution centers, including the expanded Briar Creek, Pennsylvania distribution center, in total are capable of supporting approximately $6.7 billion in annual sales. New distribution sites are strategically located to reduce stem miles, maintain flexibility and improve efficiency in our store service areas.
Our stores receive approximately 90% of their inventory from our distribution centers via contract carriers. The remaining store inventory, primarily perishable consumable items and other vendor-maintained display items, are delivered directly to our stores from vendors. For more information on our distribution center network, see Item 2 “Properties” beginning on page 13 of this Form 10-K.
Competition
The retail industry is highly competitive and we expect competition to increase in the future. The principal methods of competition include closeout merchandise, convenience and the quality of merchandise offered to the customer. Our competitors include single-price dollar stores, multi-price dollar stores, mass merchandisers, discount retailers and variety retailers. In addition, several mass merchandisers and grocery store chains carry "dollar store" or “dollar zone” concepts in their stores, which increases competition. Our sales and profits could be reduced by increases in competition, especially because there are no significant economic barriers for others to enter our retail sector.
Trademarks
We are the owners of federal service mark registrations for "Dollar Tree," the "Dollar Tree" logo, "1 Dollar Tree" together with the related design, and "One Price...One Dollar." We also own a concurrent use registration for "Dollar Bill$" and the related logo. During 1997, we acquired the rights to use trade names previously owned by Everything's A Dollar, a former competitor in the $1.00 price point industry. Several trade names were included in the purchase, including the marks "Everything's $1.00 We Mean Everything," and "Everything's $1.00," the registration of which is pending. With the acquisition of Dollar Express, we became the owner of the service marks "Dollar Express" and "Dollar Expres$." We became the owners of the "Greenbacks All A Dollar" and "All A Dollar" service marks, with the acquisition of Greenbacks. We also became the owners of “Deal$” and “Deal$ Nothing Over A Dollar” trademarks, with the acquisition of Deal$. We have applied for federal trademark registrations for various private labels that we use to market some of our product lines.
Employees
We employed approximately 13,300 full-time and 29,300 part-time associates on February 2, 2008. Part-time associates work 35 hours per week or less. The number of part-time associates fluctuates depending on seasonal needs. We consider our relationship with our associates to be good, and we have not experienced significant interruptions of operations due to labor disagreements. None of our employees are subject to collective bargaining agreements.
Item 1A. RISK FACTORS
An investment in our common stock involves a high degree of risk. You should carefully consider the specific risk factors listed below together with all other information included or incorporated in this report. Any of the following risks may materialize, and additional risks not known to us, or that we now deem immaterial, may arise. In such event, our business, financial condition, results of operations or prospects could be materially adversely affected. If that occurs, the market price of our common stock could fall, and you could lose all or part of your investment.
Our profitability is especially vulnerable to cost increases.
Future increase in costs such as the cost of merchandise, wage levels, shipping rates, freight costs, fuel costs and store occupancy costs may reduce our profitability. As a fixed price retailer, we cannot raise the sales price of our merchandise to offset cost increases. Unlike multi-price retailers, we are primarily dependent on our ability to operate more efficiently or effectively or increase our comparable store net sales in order to offset inflation. We can give you no assurance that we will be able to operate more efficiently or increase our comparable store net sales in the future. Please see Item 7, "Management's Discussion and Analysis of Financial Condition and Results of Operations," beginning on page 19 of this Form 10-K for further discussion of the effect of Inflation and Other Economic Factors on our operations.
We could encounter disruptions or additional costs in receiving and distributing merchandise.
Our success depends on our ability to transport merchandise from our suppliers to our distribution centers and then ship it to our stores in a timely and cost-effective manner. We may not anticipate, respond to or control all of the challenges of operating our receiving and distribution systems. Some of the factors that could have an adverse effect on our shipping and receiving systems or costs are:
§ Shipping. Our oceanic shipping schedules may be disrupted or delayed from time to time. We also have experienced shipping rate increases over the last several years imposed by the trans-Pacific ocean carriers. |
§ Diesel fuel costs. We have experienced increases in diesel fuel costs over the past few years and expect increases in 2008. |
§ Vulnerability to natural or man-made disasters. A fire, explosion or natural disaster at any of our distribution facilities could result in a loss of merchandise and impair our ability to adequately stock our stores. Some of our facilities are especially vulnerable to earthquakes, hurricanes or tornadoes. |
§ Labor disagreement. Labor disagreements or disruptions may result in delays in the delivery of merchandise to our stores and increase costs. |
§ War, terrorism and other events. War and acts of terrorism in the United States, or in China or other parts of Asia where we buy a significant amount of our imported merchandise, could disrupt our supply chain. |
A downturn in economic conditions could adversely affect our sales.
Economic conditions, such as those caused by recession, inflation, cost increases, adverse weather conditions, or terrorism, could reduce consumer spending or cause customers to shift their spending to products we either do not sell or do not sell as profitably. Adverse economic conditions could disrupt consumer spending and significantly reduce our sales.
Sales below our expectations during peak seasons may cause our operating results to suffer materially.
Our highest sales periods are the Christmas and Easter seasons. We generally realize a disproportionate amount of our net sales and a substantial majority of our operating and net income during the fourth quarter. In anticipation, we stock extra inventory and hire many temporary employees to supplement our stores. An economic downturn during these periods could adversely affect our operating results, particularly operating and net income, to a greater extent than if a downturn occurred at other times of the year. Untimely merchandise delays due to receiving or distribution problems could have a similar effect. Sales during the Easter selling season are materially affected by the timing of the Easter holiday. Easter in fiscal 2007 was on April 8th, while in fiscal 2008, it will be two weeks earlier on March 23rd. We believe that the earlier Easter in 2008 could potentially result in $25.0 million of lost sales when compared to the first quarter of 2007. In fiscal 2008, there is one fewer weekend between Thanksgiving and Christmas compared to fiscal 2007. We believe this could potentially reduce the total foot traffic in our stores for the Christmas holiday in fiscal 2008 compared to fiscal 2007.
Our sales and profits rely on imported merchandise, which may increase in cost or become unavailable.
Merchandise imported directly from overseas accounts for approximately 40% to 45% of our total purchases at retail. In addition, we believe that a small portion of our goods purchased from domestic vendors is imported. China is the source of a substantial majority of our imports. Imported goods are generally less expensive than domestic goods and increase our profit margins. A disruption in the flow of our imported merchandise or an increase in the cost of those goods may significantly decrease our profits. Risks associated with our reliance on imported goods include:
§ disruptions in the flow of imported goods because of factors such as: |
o raw material shortages, work stoppages, strikes and political unrest; |
o problems with oceanic shipping, including shipping container shortages; and |
o economic crises and international disputes. |
| |
§ increases in the cost of purchasing or shipping foreign merchandise, resulting from: |
o increases in shipping rates imposed by the trans-Pacific ocean carriers; |
o changes in currency exchange rates and local economic conditions, including inflation in the country of origin; |
o failure of the United States to maintain normal trade relations with China; and |
o import duties, import quotas and other trade sanctions. |
We may be unable to expand our square footage as profitably as planned.
We plan to expand our selling square footage by approximately 9% in 2008 to increase our sales and profits. Expanding our square footage profitably depends on a number of uncertainties, including our ability to locate, lease, build out and open or expand stores in suitable locations on a timely basis under favorable economic terms. We must also open or expand stores within our established geographic markets, where new or expanded stores may draw sales away from our existing stores. We may not manage our expansion effectively, and our failure to achieve our expansion plans could materially and adversely affect our business, financial condition and results of operations.
Our profitability is affected by the mix of products we sell.
Our gross profit could decrease if we increase the proportion of higher cost goods we sell in the future. In recent years, the percentage of our sales from higher cost consumable products has increased and is likely to increase slightly in 2008. Our gross profit will decrease, unless we are able to maintain our current merchandise cost sufficiently to offset any decrease in our product margin percentage. We can give you no assurance that we will be able to do so.
Pressure from competitors may reduce our sales and profits.
The retail industry is highly competitive. The marketplace is highly fragmented as many different retailers compete for market share by utilizing a variety of store formats and merchandising strategies. We expect competition to increase in the future because there are no significant economic barriers for others to enter our retail sector. Many of our current or potential competitors have greater financial resources than we do. We cannot guarantee that we will continue to be able to compete successfully against existing or future competitors. Please see Item 1, “Business,” beginning on page 6 of this Form 10-K for further discussion of the effect of competition on our operations.
The resolution of certain legal matters could have a material adverse effect on our results of operations, accrued liabilities and cash.
For a discussion of current legal matters, please see Item 3. “Legal Proceedings” beginning on page 14 of this Form 10-K. Resolution of certain matters described in that item, if decided against the Company, could have a material adverse effect on our results of operations, accrued liabilities or cash flows.
Certain provisions in our articles of incorporation and bylaws could delay or discourage a takeover attempt that may be in a shareholder's best interest.
Our articles of incorporation and bylaws contain provisions that may delay or discourage a takeover attempt that a shareholder might consider in his best interest. These provisions, among other things:
· classify our board of directors into three classes, each of which serves for different three-year periods; |
· provide that only the board of directors, chairman or president may call special meetings of the shareholders; |
· establish certain advance notice procedures for nominations of candidates for election as directors and for shareholder proposals to be considered at shareholders' meetings; |
· require a vote of the holders of more than two-thirds of the shares entitled to vote in order to remove a director, change the number of directors, or amend the foregoing and certain other provisions of the articles of incorporation and bylaws; and |
· permit the board of directors, without further action of the shareholders, to issue and fix the terms of preferred stock, which may have rights senior to those of the common stock. |
However, we believe that these provisions allow our Board of Directors to negotiate a higher price in the event of a takeover attempt which would be in the best interest of our shareholders.
Item 1B. UNRESOLVED STAFF COMMENTS
None.
Item 2. PROPERTIES
Stores
As of February 2, 2008, we operated 3,411 stores in 48 states as detailed below:
| Alabama | 82 | | Maine | 17 | | Ohio | 157 |
| Arizona | 58 | | Maryland | 79 | | Oklahoma | 51 |
| Arkansas | 45 | | Massachusetts | 47 | | Oregon | 70 |
| California | 241 | | Michigan | 123 | | Pennsylvania | 186 |
| Colorado | 46 | | Minnesota | 51 | | Rhode Island | 12 |
| Connecticut | 29 | | Mississippi | 47 | | South Carolina | 70 |
| Delaware | 20 | | Missouri | 79 | | South Dakota | 6 |
| Florida | 206 | | Montana | 8 | | Tennessee | 86 |
| Georgia | 135 | | Nebraska | 14 | | Texas | 212 |
| Idaho | 23 | | Nevada | 28 | | Utah | 33 |
| Illinois | 145 | | New Hampshire | 16 | | Vermont | 6 |
| Indiana | 97 | | New Jersey | 79 | | Virginia | 131 |
| Iowa | 26 | | New Mexico | 25 | | Washington | 61 |
| Kansas | 30 | | New York | 154 | | West Virginia | 31 |
| Kentucky | 65 | | North Carolina | 149 | | Wisconsin | 66 |
| Louisiana | 56 | | North Dakota | 5 | | Wyoming | 8 |
We currently lease our stores and expect to continue to lease new stores as we expand. Our leases typically provide for a short initial lease term, generally five years, with options to extend, however in some cases we have initial lease terms of seven to ten years. We believe this leasing strategy enhances our flexibility to pursue various expansion opportunities resulting from changing market conditions. As current leases expire, we believe that we will be able to obtain lease renewals, if desired, for present store locations, or to obtain leases for equivalent or better locations in the same general area.
Distribution Centers
The following table includes information about the distribution centers that we currently operate. We expanded the Briar Creek distribution center in 2007. We believe our distribution center network, including this expansion, is capable of supporting approximately $6.7 billion in annual sales.
Location | Own/Lease | Lease Expires | Size in Square Feet |
| | | | |
| Chesapeake, Virginia | Own | N/A | 400,000 |
| Olive Branch, Mississippi | Own | N/A | 425,000 |
| Joliet, Illinois | Own | N/A | 1,200,000 |
| Stockton, California | Own | N/A | 525,000 |
| Briar Creek, Pennsylvania | Own | N/A | 1,003,000 |
| Savannah, Georgia | Own | N/A | 603,000 |
| Marietta, Oklahoma | Own | N/A | 603,000 |
| Salt Lake City, Utah | Lease | April 2010 | 252,000 |
| Ridgefield, Washington | Own | N/A | 665,000 |
In addition to our distribution centers noted above, during the past several years, we have used off-site facilities to accommodate limited quantities of seasonal merchandise.
Each of our distribution centers contains advanced materials handling technologies, including radio-frequency inventory tracking equipment and specialized information systems. With the exception of our Salt Lake City and Ridgefield facilities each of our distribution centers also contains automated conveyor and sorting systems.
For more information on financing of our distribution centers, see Item 7 "Management's Discussion and Analysis of Financial Condition and Results of Operations- Funding Requirements" Beginning on page 25 of this Form 10-K.
Item 3. LEGAL PROCEEDINGS
From time to time, we are defendants in ordinary, routine litigation or proceedings incidental to our business, including allegations regarding:
| | |
· | employment related matters; |
| | |
· | infringement of intellectual property rights; |
| | |
· | product safety matters, which may include product recalls in cooperation with the Consumer Products Safety Commission or other jurisdictions; |
| | |
· | personal injury/wrongful death claims; and |
| | |
· | real estate matters related to store leases. |
In 2003, we were served with a lawsuit in a California state court by a former employee who alleged that employees did not properly receive sufficient meal breaks and paid rest periods, along with other alleged wage and hour violations. The suit requested that the Court certify the case as a class action. The parties engaged in mediation and reached an agreement which upon presentation to the Court, received preliminary approval and the certification of a settlement class. Notices have been mailed to the class members and the final fairness hearing is expected to occur on May 22, 2008. The settlement amount has been accrued in the accompanying consolidated balance sheet as of February 2, 2008.
In 2005, we were served with a lawsuit by former employees in Oregon who allege that they did not properly receive sufficient meal breaks and paid rest periods, and that terminated employees were not paid in a timely manner. The plaintiffs requested the Court to certify classes for their various claims and the presiding judge did so with respect to two classes, but denied others. After a partly successful appeal by the plaintiffs, one additional class has been certified. The certified classes now include two for alleged violations of that state’s labor laws concerning rest breaks and one related to untimely payments upon termination. Discovery is now on-going and no trial is anticipated before the latter part of 2008.
In 2006, we were served with a lawsuit by a former employee in a California state court alleging that she was paid for wages with a check drawn on a bank which did not have any branches in the state, an alleged violation of the state's labor code; that she was paid less for her work than other similar employees with the same job title based on her gender; and that she was not paid her final wages in a timely manner, also an alleged violation of the labor code. The plaintiff requested the Court to certify the case and those claims as a class action. The parties have reached a settlement and executed an Agreement by which the named plaintiff individually settled her Equal Pay Act and late payment claims. The Court accepted the proposed settlement and certified a class for the check claim. Notices have been mailed to class members and a hearing for final approval of the settlement has been scheduled for April 22, 2008. The estimated settlement amount has been accrued in the accompanying consolidated balance sheet as of February 2, 2008.
In 2006, we were served with a lawsuit filed in federal court in the state of Alabama by a former store manager. She claims that she should have been classified as a non-exempt employee under the Fair Labor Standards Act and, therefore, should have received overtime compensation and other benefits. She filed the case as a collective action on behalf of herself and all other employees (store managers) similarly situated. Plaintiff sought and received from the Court an Order allowing nationwide (except for the state of California) notice to be sent to all store managers employed by the Company now or within the past three years. Such notice has been mailed and each involved person will determine whether he or she wishes to opt-in to the class as a plaintiff. We intend at the appropriate time to challenge the anticipated effort by the opt-in plaintiffs to be certified as a class.
In 2007, we were served with a lawsuit filed in federal court in the state of California by one present and one former store manager. They claim they should have been classified as non-exempt employees under both the California Labor Code and the Fair Labor Standards Act. They filed the case as a class action on behalf of California based store managers. We responded with a motion to dismiss which the Court granted with respect to allegations of fraud. The plaintiff then filed an amended complaint which has been answered by us. We were thereafter served with a second suit in a California state court which alleges essentially the same claims as those contained in the federal action and which likewise seeks class certification of all California store managers. We have removed the case to the same federal court as the first suit, answered it and the two cases have been consolidated. We will defend plaintiffs’ anticipated effort to seek class certification.
In 2007, we were served with a lawsuit filed in federal court in California by two former employees who allege they were not paid all wages due and owing for time worked, that they were not paid in a timely manner upon termination of their employment and that they did not receive accurate itemized wage statements. They filed the suit as a class action and seek to include in the class all of our former employees in the state of California. We responded with a motion to dismiss which the Court denied. We answered and a motion for summary judgment on our part is presently pending before the Court.
We were recently served in federal court in California with a Complaint, on behalf of a former employee, alleging meal and rest break violations among other causes of action, and seeking class action status. The settlement Order entered by the Court in the 2003 case referenced above included an injunction against meal and rest break claims on the part of class members which we believe include this plaintiff. We will seek to stay this litigation in accordance with that injunction.
We will vigorously defend ourselves in these lawsuits. We do not believe that any of these matters will, individually or in the aggregate, have a material adverse effect on our business or financial condition. We cannot give assurance, however, that one or more of these lawsuits will not have a material adverse effect on our results of operations for the period in which they are resolved.
Item 4. SUBMISSION OF MATTERS TO A VOTE OF SECURITY HOLDERS
No matters were submitted to a vote of security holders during the fourth quarter of our 2007 fiscal year.
PART II
Item 5. MARKET FOR REGISTRANT’S COMMON EQUITY, RELATED STOCKHOLDER MATTERS AND ISSUER PURCHASES OF EQUITY SECURITIES
Our common stock has been traded on The Nasdaq Stock Market® under the symbol "DLTR" since our initial public offering on March 6, 1995. The following table gives the high and low sales prices of our common stock as reported by Nasdaq for the periods indicated.
| | | High | | | Low | |
| Fiscal year ended February 3, 2007: | | | | | | |
| | | | | | | |
| First Quarter | | $ | 28.68 | | | $ | 24.34 | |
| Second Quarter | | | 27.89 | | | | 23.90 | |
| Third Quarter | | | 32.00 | | | | 25.62 | |
| Fourth Quarter | | | 32.78 | | | | 29.34 | |
| | | | | | | | | |
| Fiscal year ended February 2, 2008: | | | | | | | | |
| | | | | | | | | |
| First Quarter | | $ | 40.31 | | | $ | 31.24 | |
| Second Quarter | | | 45.98 | | | | 37.93 | |
| Third Quarter | | | 44.13 | | | | 33.69 | |
| Fourth Quarter | | | 36.17 | | | | 20.72 | |
On March 28, 2008, the last reported sale price for our common stock, as quoted by Nasdaq, was $27.00 per share. As of March 28, 2008, we had approximately 519 shareholders of record.
The following table presents our share repurchase activity for the 13 weeks ended February 2, 2008.
| | | | | | | | | | | | Approximate | |
| | | | | | | | | | | | dollar value | |
| | | | | | | | | Total number | | | of shares that | |
| | | | | | | | | of shares | | | may yet be | |
| | | | | | | | | purchased as | | | purchased under | |
| | | Total number | | | Average | | | part of publicly | | | the plans or | |
| | | of shares | | | price paid | | | announced plans | | | programs | |
| Period | | purchased | | | per share | | | or programs | | | (in millions) | |
| November 4, 2007 to December 1, 2007 | | | 358,953 | | | $ | 28.50 | | | | 358,953 | | | $ | 538.2 | |
| December 2, 2007 to January 5, 2008 | | | 3,018,093 | | | | 27.98 | | | | 3,018,093 | | | | 453.7 | |
| January 6, 2008 to February 2, 2008 | | | - | | | | - | | | | - | | | | 453.7 | |
| Total | | | 3,377,046 | | | $ | 28.03 | | | | 3,377,046 | | | $ | 453.7 | |
In October 2007, our Board of Directors authorized the repurchase of an additional $500.0 million of our common stock. This authorization was in addition to the November 2006 authorization which had approximately $98.4 million remaining. As of February 2, 2008 we have approximately $453.7 million remaining under Board authorization.
We anticipate that substantially all of our cash flow from operations in the foreseeable future will be retained for the development and expansion of our business, the repayment of indebtedness and, as authorized by our Board of Directors, the repurchase of stock. Management does not anticipate paying dividends on our common stock in the foreseeable future.
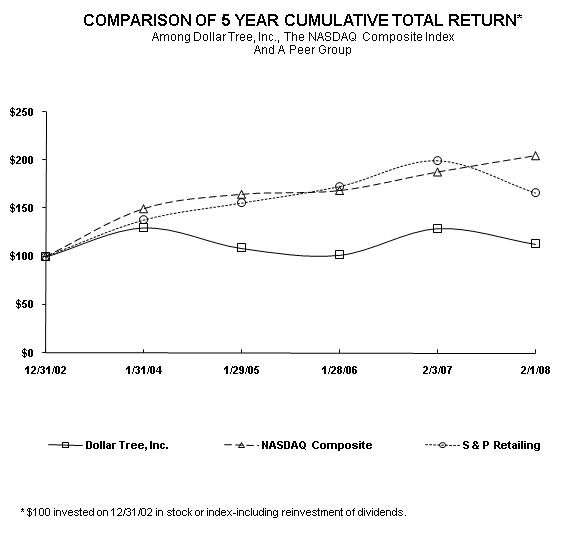
Stock Performance Graph
The following graph sets forth the yearly percentage change in the cumulative total shareholder return on our common stock during the five fiscal years ended February 2, 2008, compared with the cumulative total returns of the NASDAQ Composite Index and the S&P Retailing Index. The comparison assumes that $100 was invested in our common stock on December 31, 2002, and, in each of the foregoing indices on December 31, 2002, and that dividends were reinvested.
Item 6. SELECTED FINANCIAL DATA
The following table presents a summary of our selected financial data for the fiscal years ended February 2, 2008, February 3, 2007, January 28, 2006, January 29, 2005, and January 31, 2004. Fiscal 2006 included 53 weeks, commensurate with the retail calendar, while all other fiscal years reported in the table contain 52 weeks. The selected income statement and balance sheet data have been derived from our consolidated financial statements that have been audited by our independent registered public accounting firm. This information should be read in conjunction with the consolidated financial statements and related notes, "Management’s Discussion and Analysis of Financial Condition and Results of Operations" and our financial information found elsewhere in this report.
Comparable store net sales compare net sales for stores open throughout each of the two periods being compared, including expanded stores. Net sales per store and net sales per selling square foot are calculated for stores open throughout the period presented.
Amounts in the following tables are in millions, except per share data, number of stores data, net sales per selling square foot data and inventory turns.
| | | Years Ended | |
| | | February 2, | | | February 3, | | | January 28, | | | January 29, | | | January 31, | |
| | | 2008 | | | 2007 | | | 2006 | | | 2005 | | | 2004 | |
| Income Statement Data: | | | | | | | | | | | | | | | |
| Net sales | | $ | 4,242.6 | | | $ | 3,969.4 | | | $ | 3,393.9 | | | $ | 3,126.0 | | | $ | 2,799.9 | |
| Gross profit | | | 1,461.1 | | | | 1,357.2 | | | | 1,172.4 | | | | 1,112.5 | | | | 1,018.4 | |
| Selling, general and administrative expenses | | | 1,130.8 | | | | 1,046.4 | | | | 888.5 | | | | 819.0 | | | | 724.8 | |
| Operating income | | | 330.3 | | | | 310.8 | | | | 283.9 | | | | 293.5 | | | | 293.6 | |
| Net income | | | 201.3 | | | | 192.0 | | | | 173.9 | | | | 180.3 | | | | 177.6 | |
| | | | | | | | | | | | | | | | | | | | | |
| Margin Data (as a percentage of net sales): | | | | | | | | | | | | | | | | | | | | |
| Gross profit | | | 34.4 | % | | | 34.2 | % | | | 34.5 | % | | | 35.6 | % | | | 36.4 | % |
| Selling, general and administrative expenses | | | 26.6 | % | | | 26.4 | % | | | 26.2 | % | | | 26.2 | % | | | 25.9 | % |
| Operating income | | | 7.8 | % | | | 7.8 | % | | | 8.3 | % | | | 9.4 | % | | | 10.5 | % |
| Net income | | | 4.7 | % | | | 4.8 | % | | | 5.1 | % | | | 5.8 | % | | | 6.3 | % |
| | | | | | | | | | | | | | | | | | | | | |
| Per Share Data: | | | | | | | | | | | | | | | | | | | | |
| | | | | | | | | | | | | | | | | | | | | |
| Diluted net income per share | | $ | 2.09 | | | $ | 1.85 | | | $ | 1.60 | | | $ | 1.58 | | | $ | 1.54 | |
| Diluted net income per share increase | | | 13.0 | % | | | 15.6 | % | | | 1.3 | % | | | 2.6 | % | | | 14.1 | % |
| | | As of | |
| | | February 2, | | | February 3, | | | January 28, | | | January 29, | | | January 31, | |
| | | 2008 | | | 2007 | | | 2006 | | | 2005 | | | 2004 | |
| Balance Sheet Data: | | | | | | | | | | | | | | | |
| Cash and cash equivalents | | | | | | | | | | | | | | | |
| and short-term investments | | $ | 81.1 | | | $ | 306.8 | | | $ | 339.8 | | | $ | 317.8 | | | $ | 168.7 | |
| Working capital | | | 382.9 | | | | 575.7 | | | | 648.2 | | | | 675.5 | | | | 450.3 | |
| Total assets | | | 1,787.7 | | | | 1,882.2 | | | | 1,798.4 | | | | 1,792.7 | | | | 1,501.5 | |
| Total debt, including capital lease obligations | | | 269.4 | | | | 269.5 | | | | 269.9 | | | | 281.7 | | | | 185.1 | |
| Shareholders' equity | | | 988.4 | | | | 1,167.7 | | | | 1,172.3 | | | | 1,164.2 | | | | 1,014.5 | |
| | | Years Ended | |
| | | February 2, | | | February 3, | | | January 28, | | | January 29, | | | January 31, | |
| | | 2008 | | | 2007 | | | 2006 | | | 2005 | | | 2004 | |
| Selected Operating Data: | | | | | | | | | | | | | | | | | | | | |
| Number of stores open at end of period | | | 3,411 | | | | 3,219 | | | | 2,914 | | | | 2,735 | | | | 2,513 | |
| Gross square footage at end of period | | | 36.1 | | | | 33.3 | | | | 29.2 | | | | 25.9 | | | | 21.4 | |
| Selling square footage at end of period | | | 28.4 | | | | 26.3 | | | | 23.0 | | | | 20.4 | | | | 16.9 | |
| Selling square footage annual growth | | | 8.0 | % | | | 14.3 | % | | | 12.6 | % | | | 21.1 | % | | | 27.5 | % |
| Net sales annual growth | | | 6.9 | % | | | 16.9 | % | | | 8.6 | % | | | 11.6 | % | | | 18.7 | % |
| Comparable store net sales increase (decrease) | | | 2.7 | % | | | 4.6 | % | | | (0.8 | %) | | | 0.5 | % | | | 2.9 | % |
| Net sales per selling square foot | | $ | 155 | | | $ | 161 | | | $ | 156 | | | $ | 168 | | | $ | 187 | |
| Net sales per store | | $ | 1.3 | | | $ | 1.3 | | | $ | 1.2 | | | $ | 1.2 | | | $ | 1.2 | |
| Selected Financial Ratios: | | | | | | | | | | | | | | | | | | | | |
| Return on assets | | | 11.0 | % | | | 10.4 | % | | | 9.7 | % | | | 10.9 | % | | | 13.7 | % |
| Return on equity | | | 18.7 | % | | | 16.4 | % | | | 14.9 | % | | | 16.5 | % | | | 19.0 | % |
| Inventory turns | | | 3.7 | | | | 3.5 | | | | 3.1 | | | | 2.9 | | | | 2.9 | |
Item 7. MANAGEMENT’S DISCUSSION AND ANALYSIS OF FINANCIAL CONDITION AND RESULTS OF OPERATIONS
In Management’s Discussion and Analysis, we explain the general financial condition and the results of operations for our company, including:
| | |
· | what factors affect our business; |
| | |
· | what our net sales, earnings, gross margins and costs were in 2007, 2006 and 2005; |
| | |
· | why those net sales, earnings, gross margins and costs were different from the year before; |
| | |
· | how all of this affects our overall financial condition; |
| | |
· | what our expenditures for capital projects were in 2007 and what we expect them to be in 2008; and |
| | |
· | where funds will come from to pay for future expenditures. |
As you read Management’s Discussion and Analysis, please refer to our consolidated financial statements, included in Item 8 of this Form 10-K, which present the results of operations for the fiscal years ended February 2, 2008, February 3, 2007 and January 28, 2006. In Management’s Discussion and Analysis, we analyze and explain the annual changes in some specific line items in the consolidated financial statements for the fiscal year 2007 compared to the comparable fiscal year 2006 and the fiscal year 2006 compared to the comparable fiscal year 2005.
Key Events and Recent Developments
Several key events have had or are expected to have a significant effect on our operations. You should keep in mind that:
· | On March 2, 2008, we reorganized by creating a new holding company structure. The new parent company is Dollar Tree, Inc., replacing Dollar Tree Stores, Inc., which is now an operating subsidiary. Outstanding shares of the capital stock of Dollar Tree Stores, Inc., were automatically converted, on a share for share basis, into identical shares of common stock of the new holding company. The articles of incorporation, the bylaws, the executive officers and the board of directors of our new holding company are the same as those of the former Dollar Tree Stores, Inc. in effect immediately prior to the reorganization. The common stock of our new holding company will continue to be listed on the NASDAQ Global Select Market under the symbol “DLTR”. The rights, privileges and interests of our stockholders will remain the same with respect to our new holding company. |
· | On February 20, 2008, we entered into a five-year $550.0 million Credit Agreement (the Agreement). The Agreement provides for a $300.0 million revolving line of credit, including up to $150.0 million in available letters of credit, and a $250.0 million term loan. The interest rate on the facility will be based, at our option, on a LIBOR rate, plus a margin, or an alternate base rate, plus a margin. Our March 2004, $450.0 million unsecured revolving credit facility was terminated concurrent with entering into the Agreement. |
· | In November 2007, we completed the 400,000 square foot expansion of our Briar Creek distribution center. Including this expansion, we believe that our nine distribution centers will support approximately $6.7 billion in sales annually. |
· | In October 2007, our Board of Directors authorized the repurchase of an additional $500.0 million of our common stock. This authorization was in addition to the November 2006 authorization which had approximately $98.4 million remaining. At February 2, 2008, we had approximately $453.7 million remaining under Board authorization. |
· | In March 2006, we completed our acquisition of 138 Deal$ stores and related assets. We paid approximately $32.0 million for store related assets and $22.1 million for inventory. |
· | On December 15, 2005, the Compensation Committee of our Board of Directors approved the acceleration of the vesting date of all previously issued, outstanding and unvested options under all current stock option plans, effective as of December 15, 2005. This decision eliminated non-cash compensation expense that would have been recorded in future periods following our adoption of Statement of Financial Accounting Standards No. 123, Share-Based Payment (revised 2004) (FAS 123R), on January 29, 2006. Compensation expense has been reduced by approximately $14.9 million over a period of four years during which the options would have vested, as a result of the option acceleration program. |
Overview
Our net sales are derived from the sale of merchandise. Two major factors tend to affect our net sales trends. First is our success at opening new stores or adding new stores through acquisitions. Second, sales vary at our existing stores from one year to the next. We refer to this change as a change in comparable store net sales, because we compare only those stores that are open throughout both of the periods being compared. We include sales from stores expanded during the year in the calculation of comparable store net sales, which has the effect of increasing our comparable store net sales. The term 'expanded' also includes stores that are relocated.
At February 2, 2008, we operated 3,411 stores in 48 states, with 28.4 million selling square feet compared to 3,219 stores with 26.3 million selling square feet at February 3, 2007. During fiscal 2007, we opened 240 stores, expanded 102 stores and closed 48 stores, compared to 211 new stores opened, 85 stores expanded and 44 stores closed during fiscal 2006. In addition to the new stores opened in 2006, we acquired 138 Deal$ stores on March 25, 2006. In the current year we achieved 8% selling square footage growth. Of the 2.1 million selling square foot increase in 2007, 0.4 million was added by expanding existing stores. The average size of our stores opened in 2007 was approximately 8,500 selling square feet (or about 10,800 gross square feet). The average new store size decreased slightly in 2007 from approximately 9,000 selling square feet (or about 11,000 gross square feet) for new stores in 2006. For 2008, we continue to plan to open stores that are approximately 8,500 - 9,000 selling square feet (or about 10,000 - 12,500 gross square feet). We believe that this store size is our optimal size operationally and that this size also gives our customers an improved shopping environment that invites them to shop longer and buy more. We expect the substantial majority of our future net sales growth to come from the square footage growth resulting from new store openings and expansion of existing stores.
Fiscal 2006 ended on February 3, 2007 and included 53 weeks, commensurate with the retail calendar. The 53rd week in 2006 added approximately $70 million in sales. Fiscal 2007 and 2005 ended on February 2, 2008 and January 28, 2006, respectively, and both years included 52 weeks.
In fiscal 2007, comparable store net sales increased by 2.7%. This increase was based on the comparable 52 weeks for both years. We believe comparable store net sales were positively affected by a number of our initiatives over the past year, including expansion of forms of payment accepted by our stores and the roll-out of freezers and coolers to more of our stores. During 2006, we completed the roll-out of pin-capture debit card acceptance to all of our stores, which has enabled us to accept Electronic Benefit Transfer cards and we now accept food stamps in approximately 1,100 qualified stores. We believe the expansion of forms of payment accepted by our stores has helped increase the average transaction size in our stores. On October 31, 2007, all of our stores began accepting VISA credit as well, which we expect to have a positive impact on future sales.
We continued to experience a slight shift in the mix of merchandise sold to more consumables which we believe increases the traffic in our stores; however, this merchandise has lower margins. The negative impact from the planned shift toward more consumables was smaller in 2007 than in 2006. The planned shift in mix to more consumables is partially the result of the roll-out of frozen and refrigerated merchandise to more stores in 2007 and 2006. At February 2, 2008 we had frozen and refrigerated merchandise in approximately 1,100 stores compared to approximately 700 stores at February 3, 2007. We believe that this will continue to enable us to increase sales and earnings by increasing the number of shopping trips made by our customers and increasing the average transaction size.
Our point-of-sale technology provides us with valuable sales and inventory information to assist our buyers and improve our merchandise allocation to our stores. We believe that this has enabled us to better manage our inventory flow resulting in more efficient distribution and store operations and increased inventory turnover for each of the last two years. Inventory turnover improved by approximately 25 basis points in 2007 compared to 2006 and by approximately 45 basis points in 2006 compared to 2005. Inventory per store has also remained constant at February 2, 2008 compared to February 3, 2007 despite slightly lower than expected fourth-quarter 2007 sales and the increased merchandise flow due to the earlier Easter season in 2008.
We must continue to control our merchandise costs, inventory levels and our general and administrative expenses. Increases in these line items could negatively impact our operating results.
Our plans for fiscal 2008 anticipate net sales in the $4.49 billion to $4.62 billion range and diluted earnings per share of $2.17 to $2.35. This guidance for 2008 is predicated on selling square footage growth of approximately 9%. The earnings per share guidance for 2008 is exclusive of any share repurchase activity in 2008.
On March 25, 2006, we completed our acquisition of 138 Deal$ stores. These stores are located primarily in the Midwest part of the United States and we have existing logistics capacity to service these stores. This acquisition also included a few “combo” stores that offer an expanded assortment of merchandise including items that sell for more than $1. Substantially all Deal$ stores acquired continue to operate under the Deal$ banner while providing us an opportunity to leverage our Dollar Tree infrastructure in the testing of new merchandise concepts, including higher price points, without disrupting the single-price point model in our Dollar Tree stores. At February 2, 2008, 131 of these stores were selling items priced over $1.00, compared to 121 stores at February 3, 2007.
We paid approximately $32.0 million for store-related and other assets and $22.1 million for inventory. The results of Deal$ store operations are included in our financial statements since the acquisition date and did not have a significant impact on our operating results in fiscal 2007 or fiscal 2006.
Results of Operations
The following table expresses items from our consolidated statements of operations, as a percentage of net sales:
| | | Year Ended | | | Year Ended | | | Year Ended | |
| | | February 2, | | | February 3, | | | January 28, | |
| | | 2008 | | | 2007 | | | 2006 | |
| | | | | | | | | | |
| Net sales | | | 100.0 | % | | | 100.0 | % | | | 100.0 | % |
| Cost of sales | | | 65.6 | % | | | 65.8 | % | | | 65.5 | % |
| Gross profit | | | 34.4 | % | | | 34.2 | % | | | 34.5 | % |
| | | | | | | | | | | | | |
| Selling, general and administrative | | | | | | | | | | | | |
| expenses | | | 26.6 | % | | | 26.4 | % | | | 26.2 | % |
| | | | | | | | | | | | | |
| Operating income | | | 7.8 | % | | | 7.8 | % | | | 8.3 | % |
| | | | | | | | | | | | | |
| Interest income | | | 0.1 | % | | | 0.2 | % | | | 0.2 | % |
| Interest expense | | | (0.4 | %) | | | (0.4 | %) | | | (0.4 | %) |
| | | | | | | | | | | | | |
| Income before income taxes | | | 7.5 | % | | | 7.6 | % | | | 8.1 | % |
| | | | | | | | | | | | | |
| Provision for income taxes | | | (2.8 | %) | | | (2.8 | %) | | | (3.0 | %) |
| | | | | | | | | | | | | |
| Net income | | | 4.7 | % | | | 4.8 | % | | | 5.1 | % |
Fiscal year ended February 2, 2008 compared to fiscal year ended February 3, 2007
Net Sales. Net sales increased 6.9%, or $273.2 million, in 2007 compared to 2006, resulting primarily from sales in our new and expanded stores. Our sales increase was also impacted by a 2.7% increase in comparable store net sales for the year. This increase is based on the comparable 52-weeks for both years. These increases were partially offset by an extra week of sales in 2006 due to the 53-week retail calendar for 2006. On a comparative 52-week basis, sales increased approximately 8.8% in 2007 compared to 2006. Comparable store net sales are positively affected by our expanded and relocated stores, which we include in the calculation, and, to a lesser extent, are negatively affected when we open new stores or expand stores near existing ones.
The following table summarizes the components of the changes in our store count for fiscal years ended February 2, 2008 and February 3, 2007.
| | February 2, 2008 | February 3, 2007 |
| | | |
| New stores | 208 | 190 |
| Deal$ acquisition | -- | 138 |
| Acquired leases | 32 | 21 |
| Expanded or relocated stores | 102 | 85 |
| Closed stores | (48) | (44) |
Of the 2.1 million selling square foot increase in 2007 approximately 0.4 million was added by expanding existing stores.
Gross Profit. Gross profit margin increased to 34.4% in 2007 compared to 34.2% in 2006. The increase was primarily due to a 50 basis point decrease in merchandise cost, including inbound freight, due to improved initial mark-up in many categories in the current year. This decrease was partially offset by a 40 basis point increase in occupancy costs due to the loss of leverage from the extra week of sales in the prior year and the lower comparable store net sales in the current year.
Selling, General and Administrative Expenses. Selling, general and administrative expenses, as a percentage of net sales, increased to 26.6% for 2007 compared to 26.4% for 2006. The increase is primarily due to the following:
| · | Operating and corporate expenses increased approximately 25 basis points due to increased debit and credit fees resulting from increased debit transactions in the current year and the rollout of VISA credit at October 31, 2007. Also, in 2006, we had approximately 10 basis points of income related to early lease terminations. |
· | Occupancy costs increased 15 basis points primarily due to increased repairs and maintenance costs in the current year. |
· | Partially offsetting these increases was an approximate 15 basis point decrease in depreciation expense due to the expiration of the depreciable life on much of the supply chain hardware and software placed in service in 2002. |
Operating Income. Due to the reasons discussed above, operating income margin was 7.8% in 2007 and 2006.
Income Taxes. Our effective tax rate was 37.1% in 2007 compared to 36.6% in 2006. The increase in the rate for 2007 reflects a reduction of tax-exempt interest income in the current year due to lower investment levels resulting from increased share repurchase activity and an increase in tax reserves in accordance with the Financial Accounting Standards Board’s Financial Interpretation No. 48, Accounting for Uncertainty in Income Taxes. These increases more than offset a slight decrease in our net state tax rate.
Fiscal year ended February 3, 2007 compared to fiscal year ended January 28, 2006
Net Sales. Net sales increased 16.9%, or $575.5 million, in 2006 compared to 2005, resulting from sales in our new and expanded stores, including 138 Deal$ stores acquired in March 2006 and the 53 weeks of sales in 2006 versus 52 weeks in 2005, which accounted for approximately $70 million of the increase. Our sales increase was also impacted by a 4.6% increase in comparable store net sales for the year. This increase is based on a 53-week comparison for both periods. Comparable store net sales are positively affected by our expanded and relocated stores, which we include in the calculation, and, to a lesser extent, are negatively affected when we open new stores or expand stores near existing ones.
The following table summarizes the components of the changes in our store count for fiscal years ended February 3, 2007 and January 28, 2006.
| | February 3, 2007 | January 28, 2006 |
| | | |
| New stores | 190 | 197 |
| Deal$ acquisition | 138 | -- |
| Acquired leases | 21 | 35 |
| Expanded or relocated stores | 85 | 93 |
| Closed stores | (44) | (53) |
Of the 3.3 million selling square foot increase in 2006, approximately 1.2 million resulted from the acquisition of the Deal$ stores and 0.4 million was added by expanding existing stores.
Gross Profit. Gross profit margin decreased to 34.2% in 2006 compared to 34.5% in 2005. The decrease was primarily due to a 35 basis point increase in merchandise cost, including inbound freight. This increase in merchandise cost was due to a slight shift in mix to more consumables, which have a lower margin, higher cost merchandise at our Deal$ stores and increased inbound domestic freight costs.
Selling, General and Administrative Expenses. Selling, general and administrative expenses, as a percentage of net sales, increased to 26.4% for 2006 as compared to 26.2% for 2005. The increase is primarily due to the following:
· | Payroll and benefit related costs increased 35 basis points due to increased incentive compensation costs resulting from better overall company performance in 2006 as compared to 2005 and increased stock compensation expense, partially offset by lower workers’ compensation costs in 2006. |
· | Operating and corporate expenses decreased 10 basis points primarily as the result of payments received for early lease terminations in 2006. |
Operating Income. Due to the reasons discussed above, operating income margin decreased to 7.8% in 2006 compared to 8.3% in 2005.
Income Taxes. Our effective tax rate was 36.6% in 2006 compared to 36.8% in 2005. The decreased tax rate for 2006 was due primarily to increased tax-exempt interest on certain of our investments in 2006.
Liquidity and Capital Resources
Our business requires capital to build and open new stores, expand our distribution network and operate existing stores. Our working capital requirements for existing stores are seasonal and usually reach their peak in September and October. Historically, we have satisfied our seasonal working capital requirements for existing stores and have funded our store opening and distribution network expansion programs from internally generated funds and borrowings under our credit facilities.
The following table compares cash-related information for the years ended February 2, 2008, February 3, 2007, and January 28, 2006:
| | | Year Ended | | | Year Ended | | | Year Ended | |
| | | February 2, | | | February 3, | | | January 28, | |
| (in millions) | | 2008 | | | 2007 | | | 2006 | |
| Net cash provided by (used in): | | | | | | | | | |
| Operating activities | | $ | 367.3 | | | $ | 412.8 | | | $ | 365.1 | |
| Investing activities | | | (22.7 | ) | | | (190.7 | ) | | | (235.5 | ) |
| Financing activities | | | (389.0 | ) | | | (202.9 | ) | | | (170.3 | ) |
Net cash provided by operating activities decreased $45.5 million compared to last year due to increased working capital requirements in the current year and increases in the provision for deferred taxes, partially offset by improved earnings before depreciation and amortization in the current year.
Net cash used in investing activities decreased $168.0 million compared to last year. This decrease is due to $129.1 million of increased proceeds from short-term investment activity in the current year to fund increased capital stock repurchases and $54.1 million used in the prior year to acquire Deal$ assets. These were partially offset by increased capital expenditures in the current year resulting from the Briar Creek distribution center and the corporate headquarters expansions.
Net cash used in financing activities increased $186.1 million due primarily to increased stock repurchases in the current year partially offset by increased proceeds from stock option exercises in the current year resulting from the Company’s higher stock price earlier in the year.
The $47.7 million increase in cash provided by operating activities in 2006 as compared to 2005 was primarily due to increased earnings before depreciation and better payables management in 2006, partially offset by approximately $28.9 million of rent payments for February 2007 made prior to the end of fiscal 2006.
The $44.8 million decrease in cash used in investing activities in 2006 compared to 2005 was the result of a $114.9 million increase in net proceeds from short-term investments which were used to help fund stock repurchases and the Deal$ acquisition in 2006. In 2006, we purchased an additional $9.3 million, net, of investments in a restricted account to collateralize certain long-term insurance obligations. Additional uses of cash for investing activities consisted of $54.1 million for the Deal$ acquisition in 2006 and an increase of $36.1 million in capital expenditures due primarily to new store growth and the installation of freezers and coolers to certain stores in 2006.
The $32.6 million increase in cash used in financing activities in 2006 compared to 2005 primarily resulted from $248.2 million in stock repurchases in 2006 compared to $180.4 million in 2005. This increase was partially offset by increased proceeds from stock option exercises in 2006 resulting from our higher stock prices in 2006 as compared to 2005.
At February 2, 2008, our long-term borrowings were $268.5 million and our capital lease commitments were $0.9 million. We also have $125.0 million and $50.0 million Letter of Credit Reimbursement and Security Agreements, under which approximately $88.9 million were committed to letters of credit issued for routine purchases of imported merchandise at February 2, 2008.
On February 20, 2008, we entered into a five-year $550.0 million Credit Agreement (the Agreement). The Agreement provides for a $300.0 million revolving line of credit, including up to $150.0 million in available letters of credit, and a $250.0 million term loan. Our March 2004, $450.0 million unsecured revolving credit facility was terminated concurrent with entering into the Agreement.
In March 2005, our Board of Directors authorized the repurchase of up to $300.0 million of our common stock through March 2008. In November 2006, our Board of Directors authorized the repurchase of up to $500.0 million of our common stock. This amount was in addition to the $27.0 million remaining on the March 2005 authorization. Then, in October 2007, our Board of Directors authorized the repurchase of an additional $500.0 million of our common stock. This authorization was in addition to the November 2006 authorization which had approximately $98.4 million remaining at the time.
In December 2006, we entered into two agreements with a third party to repurchase approximately $100.0 million of our common shares under an Accelerated Share Repurchase Agreement.
The first $50.0 million was executed in an “uncollared” agreement. In this transaction we initially received 1.7 million shares based on the market price of our stock of $30.19 as of the trade date (December 8, 2006). A weighted average price of $32.17 was calculated using stock prices from December 16, 2006 – March 8, 2007. This represented the calculation period for the weighted average price. Based on this weighted average price, we paid the third party an additional $3.3 million on March 8, 2007 for the 1.7 million shares delivered under this agreement.
The remaining $50.0 million was executed under a “collared” agreement. Under this agreement, we initially received 1.5 million shares through December 15, 2006, representing the minimum number of shares to be received based on a calculation using the “cap” or high-end of the price range of the collar. The number of shares received under the agreement was determined based on the weighted average market price of our common stock, net of a predetermined discount, during the time after the initial execution date through March 8, 2007. The calculated weighted average market price through March 8, 2007, net of a predetermined discount, as defined in the “collared” agreement, was $31.97. Therefore, on March 8, 2007, we received an additional 0.1 million shares under the “collared” agreement resulting in 1.6 million total shares being repurchased under this agreement.
On March 29, 2007, we entered into an agreement with a third party to repurchase $150.0 million of our common shares under an Accelerated Share Repurchase Agreement. The entire $150.0 million was executed under a “collared” agreement. Under this agreement, we initially received 3.6 million shares through April 12, 2007, representing the minimum number of shares to be received based on a calculation using the “cap” or high-end of the price range of the collar. The number of shares was determined based on the weighted average market price of our common stock during the four months after the initial execution date. The calculated weighted average market price through July 30, 2007, net of a predetermined discount, as defined in the “collared” agreement, was $40.78. Therefore, on July 30, 2007, we received an additional 0.1 million shares under the “collared” agreement resulting in 3.7 million total shares being repurchased under this agreement.
On August 30, 2007, we entered into an agreement with a third party to repurchase $100.0 million of our common shares under an Accelerated Share Repurchase Agreement. The entire $100.0 million was executed under a “collared” agreement. Under this agreement, we initially received 2.1 million shares through September 10, 2007, representing the minimum number of shares to be received based on a calculation using the “cap” or high-end of the price range of the collar. The number of shares received under the agreement was determined based on the weighted average market price of our common stock, net of a predetermined discount, during the time after the initial execution date through a period of up to four and one half months. The contract terminated on October 22, 2007 and the weighted average price through that date was $41.16. Therefore, on October 22, 2007, we received an additional 0.3 million shares resulting in 2.4 million total shares repurchased under this agreement.
We repurchased approximately 12.8 million shares for approximately $473.0 million in fiscal 2007, approximately 8.8 million shares for approximately $248.2 million in fiscal 2006 and approximately 7.0 million shares for approximately 180.4 million in fiscal 2005. At February 2, 2008, the Company had approximately $453.7 remaining under Board authorization.
Funding Requirements
Overview
We expect our cash needs for opening new stores and expanding existing stores in fiscal 2008 to total approximately $176.0 million, which includes capital expenditures, initial inventory and pre-opening costs. Our estimated capital expenditures for fiscal 2008 are between $155.0 and $165.0 million, including planned expenditures for our new and expanded stores, the addition of freezers and coolers to approximately 150 stores and completion of the expansion to our home office and data center in Chesapeake, Va. We believe that we can adequately fund our working capital requirements and planned capital expenditures for the next few years from net cash provided by operations and potential borrowings under our existing credit facility.
The following tables summarize our material contractual obligations at February 2, 2008, including both on- and off-balance sheet arrangements, and our commitments, excluding interest on long-term borrowings (in millions):
| Contractual Obligations | | Total | | 2008 | | 2009 | | 2010 | | 2011 | | 2012 | | Thereafter | |
| Lease Financing | | | | | | | | | | | | | | | |
| Operating lease obligations | | $ | 1,363.2 | | $ | 319.0 | | $ | 284.3 | | $ | 238.4 | | $ | 185.8 | | $ | 129.9 | | $ | 205.8 | |
| Capital lease obligations | | | 0.9 | | | 0.3 | | | 0.3 | | | 0.2 | | | 0.1 | | | -- | | | -- | |
| | | | | | | | | | | | | | | | | | | | | | | |
| Long-term Borrowings | | | | | | | | | | | | | | | | | | | | | | |
| Revolving credit facility | | | 250.0 | | | -- | | | 250.0 | | | -- | | | -- | | | -- | | | -- | |
| Revenue bond financing | | | 18.5 | | | 18.5 | | | -- | | | -- | | | -- | | | -- | | | -- | |
| Interest on long-term borrowings | | | 13.7 | | | 11.8 | | | 1.9 | | | -- | | | -- | | | -- | | | -- | |
| Total obligations | | $ | 1,646.3 | | $ | 349.6 | | $ | 536.5 | | $ | 238.6 | | $ | 185.9 | | $ | 129.9 | | $ | 205.8 | |
| Commitments | | Total | | Expiring in 2008 | | Expiring in 2009 | | Expiring in 2010 | | Expiring in 2011 | | Expiring in 2012 | | Thereafter | |
| | | | | | | | | | | | | | | | |
| Letters of credit and surety bonds | | $ | 108.7 | | $ | 108.1 | | $ | 0.6 | | $ | -- | | $ | -- | | $ | -- | | $ | -- | |
| Freight contracts | | | 191.2 | | | 85.0 | | | 83.7 | | | 14.5 | | | 4.5 | | | 3.5 | | | -- | |
| Technology assets | | | 5.1 | | | 5.1 | | | -- | | | -- | | | -- | | | -- | | | -- | |
| Total commitments | | $ | 305.0 | | $ | 198.2 | | $ | 84.3 | | $ | 14.5 | | $ | 4.5 | | $ | 3.5 | | $ | -- | |
Lease Financing
Operating Lease Obligations. Our operating lease obligations are primarily for payments under noncancelable store leases. The commitment includes amounts for leases that were signed prior to February 2, 2008 for stores that were not yet open on February 2, 2008.
Capital Lease Obligations. Our capital lease obligations are primarily for distribution center equipment and computer equipment at the store support center.
Revolving Credit Facility. In March 2004, we entered into a five-year Revolving Credit Facility (the Facility). The Facility provides for a $450.0 million line of credit, including up to $50.0 million in available letters of credit. Interest is assessed under the line based on matrix pricing which currently approximates LIBOR, plus 0.475%. This rate was 4.47% at February 2, 2008. The Facility also bears a facilities fee, calculated as a percentage, as defined, of the amount available under the facility, payable quarterly. The Facility, among other things, requires the maintenance of certain specified financial ratios, restricts the payment of certain distributions and prohibits the incurrence of certain new indebtedness. The Facility also bears an administrative fee payable annually. We used availability under this Facility to repay the $142.6 million of variable-rate debt and to purchase short-term investments. As of February 2, 2008, we had $250.0 million outstanding on this Facility.
On February 20, 2008, we entered into a five-year $550.0 million Credit Agreement (the Agreement). The Agreement provides for a $300.0 million revolving line of credit, including up to $150.0 million in available letters of credit, and a $250.0 million term loan. The interest rate on the facility will be based, at our option, on a LIBOR rate, plus a margin, or an alternate base rate, plus a margin. The revolving line of credit also bears a facilities fee, calculated as a percentage, as defined, of the amount available under the line of credit, payable quarterly. The term loan is due and payable in full at the five year maturity date of the Agreement. The Agreement also bears an administrative fee payable annually. The Agreement, among other things, requires the maintenance of certain specified financial ratios, restricts the payment of certain distributions and prohibits the incurrence of certain new indebtedness. Our March 2004, $450.0 million unsecured revolving credit facility was terminated concurrent with entering into the Agreement.
Revenue Bond Financing. In May 1998, we entered into an agreement with the Mississippi Business Finance Corporation under which it issued $19.0 million of variable-rate demand revenue bonds. We used the proceeds from the bonds to finance the acquisition, construction and installation of land, buildings, machinery and equipment for our distribution facility in Olive Branch, Mississippi. At February 2, 2008, the balance outstanding on the bonds was $18.5 million. These bonds are due to be fully repaid in June 2018. The bonds do not have a prepayment penalty as long as the interest rate remains variable. The bonds contain a demand provision and, therefore, outstanding amounts are classified as current liabilities. We pay interest monthly based on a variable interest rate, which was 3.38% at February 2, 2008.
Interest on Long-term Borrowings. This amount represents interest payments on the revolving credit facility and the revenue bond financing using the interest rates for each at February 2, 2008.
Commitments
Letters of Credit and Surety Bonds. In March 2001, we entered into a Letter of Credit Reimbursement and Security Agreement, which provides $125.0 million for letters of credit. In December 2004, we entered into an additional Letter of Credit Reimbursement and Security Agreement, which provides $50.0 million for letters of credit. Letters of credit are generally issued for the routine purchase of imported merchandise and we had approximately $88.9 million of purchases committed under these letters of credit at February 2, 2008.
We also have approximately $19.8 million of letters of credit or surety bonds outstanding for our self-insurance programs and certain utility payment obligations at some of our stores.
Freight Contracts. We have contracted outbound freight services from various carriers with contracts expiring through February 2013. The total amount of these commitments is approximately $191.2 million.
Technology Assets. We have commitments totaling approximately $5.1 million to primarily purchase store technology assets for our stores during 2008.
Derivative Financial Instruments
We are party to one interest rate swap, which allows us to manage the risk associated with interest rate fluctuations on the demand revenue bonds. The swap is based on a notional amount of $18.5 million. Under the $18.5 million agreement, as amended, we pay interest to the bank that provided the swap at a fixed rate. In exchange, the financial institution pays us at a variable-interest rate, which is similar to the rate on the demand revenue bonds. The variable-interest rate on the interest rate swap is set monthly. No payments are made by either party under the swap for monthly periods with an established interest rate greater than a predetermined rate (the knock-out rate). The swap may be canceled by the bank or us and settled for the fair value of the swap as determined by market rates and expires in 2009.
Because of the knock-out provision in the $18.5 million swap, changes in the fair value of that swap are recorded in earnings. For more information on the interest rate swaps, see Item 7A "Quantitative and Qualitative Disclosures About Market Risk – Interest Rate Risk” beginning on page 29 of this Form 10-K.
On March 20, 2008, we entered into two $75.0 million interest rate swap agreements. These interest rate swaps are used to manage the risk associated with interest rate fluctuations on a portion of our $250.0 million variable rate term note. Under these agreements, we pay interest to financial institutions at a fixed rate of 2.8%. In exchange, the financial institutions pay us at a variable rate, which approximates the variable rate on the debt, excluding the credit spread. We believe these swaps are highly effective as the interest reset dates and the underlying interest rate indices are identical for the swaps and the debt. These swaps qualify for hedge accounting treatment pursuant to SFAS No. 133, Accounting for Derivative Instruments and Hedging Activities. These swaps expire in March 2011.
Critical Accounting Policies
The preparation of financial statements requires the use of estimates. Certain of our estimates require a high level of judgment and have the potential to have a material effect on the financial statements if actual results vary significantly from those estimates. Following is a discussion of the estimates that we consider critical.
Inventory Valuation
As discussed in Note 1 to the Consolidated Financial Statements, inventories at the distribution centers are stated at the lower of cost or market with cost determined on a weighted-average basis. Cost is assigned to store inventories using the retail inventory method on a weighted-average basis. Under the retail inventory method, the valuation of inventories at cost and the resulting gross margins are computed by applying a calculated cost-to-retail ratio to the retail value of inventories. The retail inventory method is an averaging method that has been widely used in the retail industry and results in valuing inventories at lower of cost or market when markdowns are taken as a reduction of the retail value of inventories on a timely basis.
Inventory valuation methods require certain significant management estimates and judgments, including estimates of future merchandise markdowns and shrink, which significantly affect the ending inventory valuation at cost as well as the resulting gross margins. The averaging required in applying the retail inventory method and the estimates of shrink and markdowns could, under certain circumstances, result in costs not being recorded in the proper period.
We estimate our markdown reserve based on the consideration of a variety of factors, including, but not limited to, quantities of slow moving or seasonal, carryover merchandise on hand, historical markdown statistics and future merchandising plans. The accuracy of our estimates can be affected by many factors, some of which are outside of our control, including changes in economic conditions and consumer buying trends. Historically, we have not experienced significant differences in our estimated reserve for markdowns compared with actual results.
Our accrual for shrink is based on the actual, historical shrink results of our most recent physical inventories adjusted, if necessary, for current economic conditions. These estimates are compared to actual results as physical inventory counts are taken and reconciled to the general ledger. Our physical inventory counts are generally taken between January and September of each year; therefore, the shrink accrual recorded at February 2, 2008 is based on estimated shrink for most of 2007, including the fourth quarter. We have not experienced significant fluctuations in historical shrink rates beyond approximately 10 basis points in our Dollar Tree stores for the last two years. However, we have sometimes experienced higher than typical shrink in acquired stores in the year following an acquisition. We periodically adjust our shrink estimates to address these factors as they become apparent.
Our management believes that our application of the retail inventory method results in an inventory valuation that reasonably approximates cost and results in carrying inventory at the lower of cost or market each year on a consistent basis.
Accrued Expenses
On a monthly basis, we estimate certain expenses in an effort to record those expenses in the period incurred. Our most material estimates include domestic freight expenses, self-insurance programs, store-level operating expenses, such as property taxes and utilities, and certain other expenses. Our freight and store-level operating expenses are estimated based on current activity and historical trends and results. Our workers' compensation and general liability insurance accruals are recorded based on actuarial valuations which are adjusted annually based on a review performed by a third-party actuary. These actuarial valuations are estimates based on historical loss development factors. Certain other expenses are estimated and recorded in the periods that management becomes aware of them. The related accruals are adjusted as management’s estimates change. Differences in management's estimates and assumptions could result in an accrual materially different from the calculated accrual. Our experience has been that some of our estimates are too high and others are too low. Historically, the net total of these differences has not had a material effect on our financial condition or results of operations.
Income Taxes
On a quarterly basis, we estimate our required income tax liability and assess the recoverability of our deferred tax assets. Our income taxes payable are estimated based on enacted tax rates, including estimated tax rates in states where our store base is growing, applied to the income expected to be taxed currently. Management assesses the recoverability of deferred tax assets based on the availability of carrybacks of future deductible amounts and management’s projections for future taxable income. We cannot guarantee that we will generate taxable income in future years. Historically, we have not experienced significant differences in our estimates of our tax accrual.
In addition, we have a recorded liability for our estimate of uncertain tax positions taken or expected to be taken in a tax return. Judgment is required in evaluating the application of federal and state tax laws, including relevant case law, and assessing whether it is more likely than not that a tax position will be sustained on examination and, if so, judgment is also required as to the measurement of the amount of tax benefit that will be realized upon settlement with the taxing authority. Income tax expense is adjusted in the period in which new information about a tax position becomes available or the final outcome differs from the amounts recorded. We believe that our liability for uncertain tax positions is adequate. For further discussion of our changes in reserves during 2007, see Item 8 “Financial Statements and Supplementary Data - Note 3 to the Consolidated Financial Statements” beginning on page 42 of this Form 10-K.
Seasonality and Quarterly Fluctuations
We experience seasonal fluctuations in our net sales, comparable store net sales, operating income and net income and expect this trend to continue. Our results of operations may also fluctuate significantly as a result of a variety of factors, including:
| | |
· | Shifts in the timing of certain holidays, especially Easter; |
| | |
· | The timing of new store openings; |
| | |
· | The net sales contributed by new stores; |
| | |
· | changes in our merchandise mix; and |
| | |
· | competition. |
Our highest sales periods are the Christmas and Easter seasons. Easter was observed on April 16, 2006, April 8, 2007, and will be observed on March 23, 2008. We believe that the earlier Easter in 2008 could potentially result in $25 million of lost sales when compared to the first quarter of 2007. We generally realize a disproportionate amount of our net sales and of our operating and net income during the fourth quarter. In anticipation of increased sales activity during these months, we purchase substantial amounts of inventory and hire a significant number of temporary employees to supplement our continuing store staff. Our operating results, particularly operating and net income, could suffer if our net sales were below seasonal norms during the fourth quarter or during the Easter season for any reason, including merchandise delivery delays due to receiving or distribution problems, consumer sentiment or inclement weather. Fiscal 2006 consisted of 53 weeks, commensurate with the retail calendar. This extra week contributed approximately $70 million of sales in 2006 compared to 2007. Fiscal 2007 consisted of 52 weeks. In fiscal 2008, there is one fewer weekend between Thanksgiving and Christmas compared to fiscal 2007. We believe this could potentially reduce the total foot traffic in our stores for the Christmas holiday in fiscal 2008 compared to fiscal 2007.
Our unaudited results of operations for the eight most recent quarters are shown in a table in Footnote 12 of the Consolidated Financial Statements in Item 8 of this Form 10-K.
Inflation and Other Economic Factors
Our ability to provide quality merchandise at a fixed price and on a profitable basis may be subject to economic factors and influences that we cannot control. Consumer spending could decline because of economic pressures, including rising fuel prices. Reductions in consumer confidence and spending could have an adverse effect on our sales. National or international events, including war or terrorism, could lead to disruptions in economies in the United States or in foreign countries where we purchase some of our merchandise. These and other factors could increase our merchandise costs and other costs that are critical to our operations, such as shipping and wage rates.
Shipping Costs. Currently, trans-Pacific shipping rates are negotiated with individual freight lines and are subject to fluctuation based on supply and demand for containers and current fuel costs. As a result, our trans-Pacific shipping costs in fiscal 2008 may increase compared with fiscal 2007 when we renegotiate our import shipping rates effective May 2008. We can give no assurances as to the amount of the increase, as we are in the early stages of our negotiations.
Minimum Wage. On May 25, 2007, the President signed legislation that increased the Federal Minimum Wage from $5.15 an hour to $7.25 an hour by June 2009. We do not expect this legislation to have a material effect on our operations in fiscal 2008.
New Accounting Pronouncements
In September 2006, the Financial Accounting Standards Board (FASB) issued Statement of Financial Accounting Standards No. 157, Fair Value Measurement (SFAS No. 157). SFAS No. 157, effective for interim or annual reporting periods beginning after November 15, 2007, establishes a framework for measuring fair value in generally accepted accounting principles and expands disclosures about fair value measurements. We will adopt this statement in the first quarter of 2008 and we do not expect it to have a material effect on our consolidated financial statements.
In July 2006, the Financial Accounting Standards Board (FASB) issued FASB Interpretation No. 48 ("FIN 48"), Accounting for Uncertainty in Income Taxes -- an interpretation of FASB Statement No. 109. FIN 48 clarifies the accounting for uncertainty in income taxes recognized in an enterprise's financial statements in accordance with FASB Statement No. 109, Accounting for Income Taxes. FIN 48 prescribes a recognition threshold and measurement attribute for the financial statement recognition and measurement of a tax position taken or expected to be taken in a tax return. FIN 48 also provides guidance on derecognition, classification, interest and penalties, accounting in interim periods, disclosures, and transition. We adopted FIN 48 in the first quarter of 2007. For further discussion of the effect of the adoption of FIN 48, see Item 8 “Financial Statements and Supplementary Data” - - Notes 1 and 3 of the Consolidated Financial Statements beginning on page 37 of this Form 10-K.
Item 7A. QUANTITATIVE AND QUALITATIVE DISCLOSURES ABOUT MARKET RISK
We are exposed to various types of market risk in the normal course of our business, including the impact of interest rate changes and foreign currency rate fluctuations. We may enter into interest rate swaps to manage exposure to interest rate changes, and we may employ other risk management strategies, including the use of foreign currency forward contracts. We do not enter into derivative instruments for any purpose other than cash flow hedging purposes and we do not hold derivative instruments for trading purposes.
Interest Rate Risk
We use variable-rate debt to finance certain of our operations and capital improvements. These obligations expose us to variability in interest payments due to changes in interest rates. If interest rates increase, interest expense increases. Conversely, if interest rates decrease, interest expense also decreases. We believe it is beneficial to limit the variability of our interest payments.
To meet this objective, we entered into a derivative instrument in the form of an interest rate swap to manage fluctuations in cash flows resulting from changes in the variable-interest rates on the Demand Revenue Bonds. The interest rate swap reduces the interest rate exposure on this variable-rate obligation. Under the interest rate swap, we pay the bank at a fixed-rate and receive variable-interest at a rate approximating the variable-rate on the obligation, thereby creating the economic equivalent of a fixed-rate obligation. Under the swap, no payments are made by parties under the swap for monthly periods in which the variable-interest rate is greater than the predetermined knock-out rate.
The following table summarizes the financial terms of our interest rate swap agreement and the fair value of the interest rate swap at February 2, 2008:
Hedging Instrument | Receive Variable | Pay Fixed | Knock-out Rate | Expiration | Fair Value |
$18.5 million interest rate swap | LIBOR | 4.88% | 7.75% | 4/1/09 | $0.5 million |
Hypothetically, a 1% change in interest rates results in approximately a $0.2 million change in the amount paid or received under the terms of the interest rate swap agreement on an annual basis. Due to many factors, management is not able to predict the changes in fair value of our interest rate swap. These fair values are obtained from an outside financial institution.
On March 20, 2008, we entered into two $75.0 million interest rate swap agreements. These interest rate swaps are used to manage the risk associated with interest rate fluctuations on a portion of our $250.0 million variable rate term note. Under these agreements, we pay interest to financial institutions at a fixed rate of 2.8%. In exchange, the financial institutions pay us at a variable rate, which approximates the variable rate on the debt, excluding the credit spread. We believe these swaps are highly effective as the interest reset dates and the underlying interest rate indices are identical for the swaps and the debt. These swaps qualify for hedge accounting treatment pursuant to SFAS No. 133, Accounting for Derivative Instruments and Hedging Activities, and expire in March 2011.
Item 8. FINANCIAL STATEMENTS AND SUPPLEMENTARY DATA
| Index to Consolidated Financial Statements | Page |
| | |
| Report of Independent Registered Public Accounting Firm | 32 |
| | |
| Consolidated Statements of Operations for the years ended | |
| February 2, 2008, February 3, 2007 and January 28, 2006 | 33 |
| | |
| Consolidated Balance Sheets as of February 2, 2008 and | |
| February 3, 2007 | 34 |
| | |
| Consolidated Statements of Shareholders’ Equity and Comprehensive Income | |
| for the years ended February 2, 2008, February 3, 2007 and | |
| January 28, 2006 | 35 |
| | |
| Consolidated Statements of Cash Flows for the years ended | |
| February 2, 2008, February 3, 2007 and January 28, 2006 | 36 |
| | |
| Notes to Consolidated Financial Statements | 37 |
Report of Independent Registered Public Accounting Firm
The Board of Directors and Shareholders
Dollar Tree, Inc. (formerly Dollar Tree Stores, Inc.):
We have audited the accompanying consolidated balance sheets of Dollar Tree, Inc. (formerly Dollar Tree Stores, Inc.) and subsidiaries (the Company) as of February 2, 2008 and February 3, 2007, and the related consolidated statements of operations, shareholders’ equity and comprehensive income, and cash flows for each of the fiscal years in the three-year period ended February 2, 2008. These consolidated financial statements are the responsibility of the Company’s management. Our responsibility is to express an opinion on these consolidated financial statements based on our audits.
We conducted our audits in accordance with the standards of the Public Company Accounting Oversight Board (United States). Those standards require that we plan and perform the audit to obtain reasonable assurance about whether the financial statements are free of material misstatement. An audit includes examining, on a test basis, evidence supporting the amounts and disclosures in the financial statements. An audit also includes assessing the accounting principles used and significant estimates made by management, as well as evaluating the overall financial statement presentation. We believe that our audits provide a reasonable basis for our opinion.
In our opinion, the consolidated financial statements referred to above present fairly, in all material respects, the financial position of the Company as of February 2, 2008 and February 3, 2007, and the results of their operations and their cash flows for each of the fiscal years in the three-year period ended February 2, 2008, in conformity with U.S. generally accepted accounting principles.
As discussed in note 1 to the consolidated financial statements, the Company adopted Financial Accounting Standards Board Interpretation No. 48, Accounting for Uncertainty in Income Taxes, effective February 4, 2007, and Statement of Financial Accounting Standards No. 123 (revised 2004), Share-Based Payment, effective January 29, 2006.
We also have audited, in accordance with the standards of the Public Company Accounting Oversight Board (United States), Dollar Tree, Inc.’s (formerly Dollar Tree Stores, Inc.) internal control over financial reporting as of February 2, 2008, based on criteria established in Internal Control - Integrated Framework, issued by the Committee of Sponsoring Organizations of the Treadway Commission (COSO), and our report dated April 1, 2008 expressed an unqualified opinion on the effectiveness of the Company’s internal control over financial reporting.
/s/ KPMG LLP
Norfolk, Virginia
April 1, 2008
DOLLAR TREE, INC.
AND SUBSIDIARIES
CONSOLIDATED STATEMENTS OF OPERATIONS
| | | Year Ended | | | Year Ended | | | Year Ended | |
| | | February 2, | | | February 3, | | | January 28, | |
| (In millions, except per share data) | | 2008 | | | 2007 | | | 2006 | |
| Net sales | | $ | 4,242.6 | | | $ | 3,969.4 | | | $ | 3,393.9 | |
| Cost of sales (Note 4) | | | 2,781.5 | | | | 2,612.2 | | | | 2,221.5 | |
| Gross profit | | | 1,461.1 | | | | 1,357.2 | | | | 1,172.4 | |
| | | | | | | | | | | | | |
| Selling, general and administrative | | | | | | | | | | | | |
| expenses (Notes 8 and 9) | | | 1,130.8 | | | | 1,046.4 | | | | 888.5 | |
| | | | | | | | | | | | | |
| Operating income | | | 330.3 | | | | 310.8 | | | | 283.9 | |
| | | | | | | | | | | | | |
| Interest income | | | 6.7 | | | | 8.6 | | | | 6.8 | |
| Interest expense (Notes 5 and 6) | | | (17.2 | ) | | | (16.5 | ) | | | (15.5 | ) |
| | | | | | | | | | | | | |
| Income before income taxes | | | 319.8 | | | | 302.9 | | | | 275.2 | |
| | | | | | | | | | | | | |
| Provision for income taxes (Note 3) | | | 118.5 | | | | 110.9 | | | | 101.3 | |
| | | | | | | | | | | | | |
| Net income | | $ | 201.3 | | | $ | 192.0 | | | $ | 173.9 | |
| | | | | | | | | | | | | |
| Basic net income per share (Note 7) | | $ | 2.10 | | | $ | 1.86 | | | $ | 1.61 | |
| | | | | | | | | | | | | |
| Diluted net income per share (Note 7) | | $ | 2.09 | | | $ | 1.85 | | | $ | 1.60 | |
See accompanying Notes to Consolidated Financial Statements.
DOLLAR TREE, INC.
AND SUBSIDIARIES
CONSOLIDATED BALANCE SHEETS
| (In millions, except share data) | | February 2, 2008 | | | February 3, 2007 | |
| ASSETS | | | | | | |
| Current assets: | | | | | | |
| Cash and cash equivalents | | $ | 40.6 | | | $ | 85.0 | |
| Short-term investments | | | 40.5 | | | | 221.8 | |
| Merchandise inventories | | | 641.2 | | | | 605.0 | |
| Deferred tax assets (Note 3) | | | 17.3 | | | | 10.7 | |
| Prepaid expenses and other current assets | | | 49.2 | | | | 45.4 | |
| Total current assets | | | 788.8 | | | | 967.9 | |
| | | | | | | | | |
| Property, plant and equipment, net (Note 2) | | | 743.6 | | | | 715.3 | |
| Goodwill (Note 10) | | | 133.3 | | | | 133.3 | |
| Other intangibles, net (Notes 2 and 10) | | | 14.5 | | | | 13.3 | |
| Deferred tax assets (Note 3) | | | 38.7 | | | | - | |
| Other assets, net (Notes 2, 8 and 11) | | | 68.8 | | | | 52.4 | |
| | | | | | | | | |
| TOTAL ASSETS | | $ | 1,787.7 | | | $ | 1,882.2 | |
| | | | | | | | | |
| LIABILITIES AND SHAREHOLDERS' EQUITY | | | | | | | | |
| Current liabilities: | | | | | | | | |
| Current portion of long-term debt (Note 5) | | $ | 18.5 | | | $ | 18.8 | |
| Accounts payable | | | 200.4 | | | | 198.1 | |
| Other current liabilities (Note 2) | | | 143.6 | | | | 132.0 | |
| Income taxes payable | | | 43.4 | | | | 43.3 | |
| Total current liabilities | | | 405.9 | | | | 392.2 | |
| | | | | | | | | |
| Long-term debt, excluding current portion (Note 5) | | | 250.0 | | | | 250.0 | |
| Income taxes payable, long-term (Note 3) | | | 55.0 | | | | - | |
| Deferred tax liabilities (Note 3) | | | - | | | | 1.5 | |
| Other liabilities (Notes 6 and 8) | | | 88.4 | | | | 70.8 | |
| | | �� | | | | | | |
| Total liabilities | | | 799.3 | | | | 714.5 | |
| | | | | | | | | |
| Commitments, contingencies and | | | | | | | | |
| subsequent events (Notes 1,4,5 and 6) | | | | | | | | |
| | | | | | | | | |
| Shareholders' equity (Notes 6, 7 and 9): | | | | | | | | |
| Common stock, par value $0.01. 300,000,000 shares | | | | | | | | |
| authorized, 89,784,776 and 99,663,580 shares | | | | | | | | |
| issued and outstanding at February 2, 2008 | | | | | | | | |
| and February 3, 2007, respectively | | | 0.9 | | | | 1.0 | |
| Additional paid-in capital | | | - | | | | - | |
| Accumulated other comprehensive income (loss) | | | 0.1 | | | | 0.1 | |
| Retained earnings | | | 987.4 | | | | 1,166.6 | |
| Total shareholders' equity | | | 988.4 | | | | 1,167.7 | |
| | | | | | | | | |
| TOTAL LIABILITIES AND SHAREHOLDERS' EQUITY | | $ | 1,787.7 | | | $ | 1,882.2 | |
See accompanying Notes to Consolidated Financial Statements.
DOLLAR TREE, INC.
AND SUBSIDIARIES
CONSOLIDATED STATEMENTS OF SHAREHOLDERS’ EQUITY AND COMPREHENSIVE INCOME
YEARS ENDED FEBRUARY 2, 2008, FEBRUARY 3, 2007, AND JANUARY 28, 2006
| | | | | | | | | Accumulated | | | | | | | |
| | | Common | | | | Additional | | Other | | | | | | Share- | |
| | | Stock | | Common | | Paid-in | | Comprehensive | | Unearned | | Retained | | holders' | |
| (in millions) | | Shares | | Stock | | Capital | | Income (Loss) | | Compensation | | Earnings | | Equity | |
| | | | | | | | | | | | | | | | |
| Balance at January 29, 2005 | | | 113.0 | | $ | 1.1 | | $ | 177.7 | | $ | (0.3 | ) | $ | (0.1 | ) | $ | 985.8 | | $ | 1,164.2 | |
| | | | | | | | | | | | | | | | | | | | | | | |
| Net income for the year ended | | | | | | | | | | | | | | | | | | | | | | |
| January 28, 2006 | | | - | | | - | | | - | | | - | | | - | | | 173.9 | | | 173.9 | |
| Other comprehensive income (Note 7) | | | - | | | - | | | - | | | 0.4 | | | - | | | - | | | 0.4 | |
| Total comprehensive income | | | | | | | | | | | | | | | | | | | | | 174.3 | |
| Issuance of stock under Employee | | | | | | | | | | | | | | | | | | | | | | |
| Stock Purchase Plan (Note 9) | | | 0.1 | | | - | | | 3.0 | | | - | | | - | | | - | | | 3.0 | |
| Exercise of stock options, including | | | | | | | | | | | | | | | | | | | | | | |
| income tax benefit of $1.2 (Note 9) | | | 0.4 | | | - | | | 8.8 | | | - | | | - | | | - | | | 8.8 | |
| Repurchase and retirement of shares (Note 7) | | | (7.0 | ) | | - | | | (180.3 | ) | | - | | | - | | | - | | | (180.3 | ) |
| Stock-based compensation (Notes 1 and 9) | | | - | | | - | | | 2.2 | | | - | | | 0.1 | | | - | | | 2.3 | |
| Balance at January 28, 2006 | | | 106.5 | | | 1.1 | | | 11.4 | | | 0.1 | | | - | | | 1,159.7 | | | 1,172.3 | |
| | | | | | | | | | | | | | | | | | | | | | | |
| Net income for the year ended | | | | | | | | | | | | | | | | | | | | | | |
| February 3, 2007 | | | - | | | - | | | - | | | - | | | - | | | 192.0 | | | 192.0 | |
| Other comprehensive income (Note 7) | | | - | | | - | | | - | | | - | | | - | | | - | | | - | |
| Total comprehensive income | | | | | | | | | | | | | | | | | | | | | 192.0 | |
| Issuance of stock under Employee Stock | | | | | | | | | | | | | | | | | | | | | | |
| Purchase Plan (Note 9) | | | 0.1 | | | - | | | 2.8 | | | - | | | - | | | - | | | 2.8 | |
| Exercise of stock options, including | | | | | | | | | | | | | | | | | | | | | | |
| income tax benefit of $5.6 (Note 9) | | | 1.7 | | | - | | | 43.1 | | | - | | | - | | | - | | | 43.1 | |
| Repurchase and retirement of shares (Note 7) | | | (8.8 | ) | | (0.1 | ) | | (63.0 | ) | | | | | - | | | (185.1 | ) | | (248.2 | ) |
| Stock-based compensation, net (Notes 1 and 9) | | | 0.1 | | | - | | | 5.7 | | | - | | | - | | | - | | | 5.7 | |
| Balance at February 3, 2007 | | | 99.6 | | | 1.0 | | | - | | | 0.1 | | | - | | | 1,166.6 | | | 1,167.7 | |
| | | | | | | | | | | | | | | | | | | | | | | |
| Net income for the year ended | | | | | | | | | | | | | | | | | | | | | | |
| February 2, 2008 | | | - | | | - | | | - | | | - | | | - | | | 201.3 | | | 201.3 | |
| Other comprehensive income (Note 7) | | | - | | | - | | | - | | | - | | | - | | | - | | | - | |
| Total comprehensive income | | | | | | | | | | | | | | | | | | | | | 201.3 | |
| Adoption of FIN 48 (Note 3) | | | - | | | - | | | - | | | - | | | - | | | (0.6 | ) | | (0.6 | ) |
| Issuance of stock under Employee Stock | | | | | | | | | | | | | | | | | | | | | | |
| Purchase Plan (Note 9) | | | 0.1 | | | - | | | - | | | - | | | - | | | 3.5 | | | 3.5 | |
| Exercise of stock options, including | | | | | | | | | | | | | | | | | | | | | | |
| income tax benefit of $13.0 (Note 9) | | | 2.7 | | | - | | | - | | | - | | | - | | | 81.1 | | | 81.1 | |
| Repurchase and retirement of shares (Note 7) | | | (12.8 | ) | | (0.1 | ) | | - | | | | | | - | | | (472.9 | ) | | (473.0 | ) |
| Stock-based compensation, net (Notes 1 and 9) | | | 0.2 | | | - | | | - | | | - | | | - | | | 8.4 | | | 8.4 | |
| Balance at February 2,2008 | | | 89.8 | | $ | 0.9 | | $ | - | | $ | 0.1 | | $ | - | | $ | 987.4 | | $ | 988.4 | |
See accompanying Notes to Consolidated Financial Statements.
DOLLAR TREE, INC.
AND SUBSIDIARIES
CONSOLIDATED STATEMENTS OF CASH FLOWS
| | | Year Ended | | | Year Ended | | | Year Ended | |
| | | February 2, | | | February 3, | | | January 28, | |
| (In millions) | | 2008 | | | 2007 | | | 2006 | |
| Cash flows from operating activities: | | | | | | | | | |
| Net income | | $ | 201.3 | | | $ | 192.0 | | | $ | 173.9 | |
| Adjustments to reconcile net income to net cash | | | | | | | | | | | | |
| provided by operating activities: | | | | | | | | | | | | |
| Depreciation and amortization | | | 159.3 | | | | 159.0 | | | | 140.7 | |
| Provision for deferred income taxes | | | (46.8 | ) | | | (21.9 | ) | | | (21.5 | ) |
| Tax benefit of stock option exercises | | | - | | | | - | | | | 1.2 | |
| Stock based compensation expense | | | 11.3 | | | | 6.7 | | | | 2.4 | |
| Other non-cash adjustments to net income | | | 8.0 | | | | 5.1 | | | | 5.6 | |
| Changes in assets and liabilities increasing | | | | | | | | | | | | |
| (decreasing) cash and cash equivalents: | | | | | | | | | | | | |
| Merchandise inventories | | | (36.2 | ) | | | (6.2 | ) | | | 38.9 | |
| Other assets | | | (4.4 | ) | | | (19.8 | ) | | | (5.5 | ) |
| Accounts payable | | | 2.3 | | | | 53.7 | | | | 11.4 | |
| Income taxes payable | | | 46.9 | | | | 1.6 | | | | 8.0 | |
| Other current liabilities | | | 8.7 | | | | 31.8 | | | | (6.4 | ) |
| Other liabilities | | | 16.9 | | | | 10.8 | | | | 16.4 | |
| Net cash provided by operating activities | | | 367.3 | | | | 412.8 | | | | 365.1 | |
| | | | | | | | | | | | | |
| Cash flows from investing activities: | | | | | | | | | | | | |
| Capital expenditures | | | (189.0 | ) | | | (175.3 | ) | | | (139.2 | ) |
| Purchase of short-term investments | | | (1,119.2 | ) | | | (1,044.4 | ) | | | (885.5 | ) |
| Proceeds from maturities of short-term investments | | | 1,300.5 | | | | 1,096.6 | | | | 822.8 | |
| Purchase of restricted investments | | | (99.3 | ) | | | (84.5 | ) | | | (69.4 | ) |
| Proceeds from maturities of restricted investments | | | 90.9 | | | | 75.2 | | | | 39.5 | |
| Purchase of Deal$ assets, net of cash acquired of $0.3 | | | - | | | | (54.1 | ) | | | - | |
| Acquisition of favorable lease rights | | | (6.6 | ) | | | (4.2 | ) | | | (3.7 | ) |
| Net cash used in investing activities | | | (22.7 | ) | | | (190.7 | ) | | | (235.5 | ) |
| | | | | | | | | | | | | |
| Cash flows from financing activities: | | | | | | | | | | | | |
| Principal payments under long-term debt and capital lease obligations | | | (0.6 | ) | | | (0.6 | ) | | | (0.6 | ) |
| Borrowings from revolving credit facility | | | 362.4 | | | | - | | | | - | |
| Repayments of revolving credit facility | | | (362.4 | ) | | | - | | | | - | |
| Payments for share repurchases | | | (473.0 | ) | | | (248.2 | ) | | | (180.4 | ) |
| Proceeds from stock issued pursuant to stock-based | | | | | | | | | | | | |
| compensation plans | | | 71.6 | | | | 40.3 | | | | 10.7 | |
| Tax benefit of stock options exercised | | | 13.0 | | | | 5.6 | | | | - | |
| Net cash used in financing activities | | | (389.0 | ) | | | (202.9 | ) | | | (170.3 | ) |
| | | | | | | | | | | | | |
| Net increase (decrease) in cash and cash equivalents | | | (44.4 | ) | | | 19.2 | | | | (40.7 | ) |
| Cash and cash equivalents at beginning of year | | | 85.0 | | | | 65.8 | | | | 106.5 | |
| Cash and cash equivalents at end of year | | $ | 40.6 | | | $ | 85.0 | | | $ | 65.8 | |
| Supplemental disclosure of cash flow information: | | | | | | | | | | | | |
| Cash paid for: | | | | | | | | | | | | |
| Interest | | $ | 18.7 | | | $ | 14.9 | | | $ | 11.8 | |
| Income taxes | | $ | 109.5 | | | $ | 125.5 | | | $ | 113.9 | |
Supplemental disclosure of non-cash investing and financing activities:
The Company purchased equipment under capital lease obligations amounting to $0.5 million, $0.1 million and $0.4 million in the years ended February 2, 2008, February 3, 2007, and January 28, 2006, respectively.
See accompanying Notes to Consolidated Financial Statements
DOLLAR TREE, INC.
AND SUBSIDIARIES
NOTES TO CONSOLIDATED FINANCIAL STATEMENTS
NOTE 1 - SUMMARY OF SIGNIFICANT ACCOUNTING POLICIES
Description of Business
On March 2, 2008, the Company reorganized by creating a new holding company structure. The primary purpose of the reorganization was to create a more efficient corporate structure. The business operations of the Company and its subsidiaries will not change as a result of this reorganization. As a part of the holding company reorganization, a new parent company, Dollar Tree, Inc., was formed. Outstanding shares of the capital stock of Dollar Tree Stores, Inc., were automatically converted, on a share for share basis, into identical shares of common stock of the new holding company. The articles of incorporation, the bylaws, the executive officers and the board of directors of the new holding company are the same as those of the former Dollar Tree Stores, Inc. in effect immediately prior to the reorganization. The common stock of the new holding company will continue to be listed on the NASDAQ Global Select Market under the symbol “DLTR”. The rights, privileges and interests of the Company’s stockholders will remain the same with respect to the new holding company.
At February 2, 2008, Dollar Tree, Inc. (the Company), formerly Dollar Tree Stores, Inc., owned and operated 3,411 discount variety retail stores. Approximately 3,300 of these stores sell substantially all items for $1.00 or less. The remaining stores were acquired as apart of the Deal$ acquisition and these stores sell most items for $1.00 or less but also sell items at prices greater than $1.00. The Company's stores operate under the names of Dollar Tree, Deal$ and Dollar Bills. The Company’s stores average approximately 8,300 selling square feet.
The Company's headquarters and one of its distribution centers are located in Chesapeake, Virginia. The Company also operates distribution centers in Mississippi, Illinois, California, Pennsylvania, Georgia, Oklahoma, Utah and Washington. The Company's stores are located in all 48 contiguous states. The Company's merchandise includes food, health and beauty care, party goods, candy, toys, stationery, seasonal goods, gifts and other consumer items. Approximately 40% to 45% of the Company's merchandise is imported, primarily from China.
Principles of Consolidation
The consolidated financial statements include the financial statements of Dollar Tree, Inc., and its wholly owned subsidiaries. All significant intercompany balances and transactions have been eliminated in consolidation.
Fiscal Year
The Company's fiscal year ends on the Saturday closest to January 31. Any reference herein to “2007” or “Fiscal 2007,” “2006” or “Fiscal 2006,” and “2005” or “Fiscal 2005,” relates to as of or for the years ended February 2, 2008, February 3, 2007, and January 28, 2006, respectively. Fiscal year 2006 consisted of 53 weeks, while 2007 and 2005 both consisted of 52 weeks.
Use of Estimates
The preparation of financial statements in conformity with U.S. generally accepted accounting principles requires management to make estimates and assumptions that affect the reported amounts of assets and liabilities and disclosures of contingent assets and liabilities at the date of the consolidated financial statements and the reported amounts of revenues and expenses during the reporting period. Actual results could differ from those estimates.
Reclassifications
Certain 2006 and 2005 amounts have been reclassified for comparability with the current period presentation. The balance sheet at February 3, 2007 presented herein reflects an immaterial correction which increased other current assets and accounts payable by $8.9 million. The gross amount of purchases of restricted investments and proceeds from the maturities of restricted investments have been included in 2006 and 2005. These amounts were previously reported on a net basis.
Cash and Cash Equivalents
Cash and cash equivalents at February 2, 2008 and February 3, 2007 includes $12.8 million and $40.3 million, respectively, of investments in money market securities and bank participation agreements which are valued at cost, which approximates fair value. The underlying assets of these short-term participation agreements are primarily commercial notes. For purposes of the consolidated statements of cash flows, the Company considers all highly liquid debt instruments with original maturities of three months or less to be cash equivalents. The majority of payments due from financial institutions for the settlement of debit card and credit card transactions process within three business days, and therefore are classified as cash and cash equivalents.
Short-Term Investments
The Company’s short-term investments at February 2, 2008, consist primarily of government-sponsored municipal bonds. These investments are classified as available for sale and are recorded at fair value, which approximates cost. The government-sponsored municipal bonds can be converted into cash depending on terms of the underlying agreement. Short-term investments at February 3, 2007 also included auction rate securities. The auction rate securities have stated interest rates, which typically reset to prevailing market rates every 35 days or less. The securities underlying both the government-sponsored municipal bonds and the auction rate securities have longer legal maturity dates.
Merchandise Inventories
Merchandise inventories at the distribution centers are stated at the lower of cost or market, determined on a weighted average cost basis. Cost is assigned to store inventories using the retail inventory method, determined on a weighted average cost basis.
Costs directly associated with warehousing and distribution are capitalized as merchandise inventories. Total warehousing and distribution costs capitalized into inventory amounted to $26.3 million and $25.6 million at February 2, 2008 and February 3, 2007, respectively.
Property, Plant and Equipment
Property, plant and equipment are stated at cost and depreciated using the straight-line method over the estimated useful lives of the respective assets as follows:
| Buildings | 39 to 40 years |
| Furniture, fixtures and equipment | 3 to 15 years |
| Transportation vehicles | 4 to 6 years |
Leasehold improvements and assets held under capital leases are amortized over the estimated useful lives of the respective assets or the committed terms of the related leases, whichever is shorter. Amortization is included in "selling, general and administrative expenses" on the accompanying consolidated statements of operations.
Costs incurred related to software developed for internal use are capitalized and amortized over three years. Costs capitalized include those incurred in the application development stage as defined in Statement of Position 98-1, Accounting for the Costs of Computer Software Developed or Obtained for Internal Use.
Goodwill and Other Intangible Assets
Goodwill and other intangible assets with indefinite useful lives are not amortized, but rather tested for impairment at least annually. In accordance with SFAS No. 142, goodwill is no longer being amortized, but is tested annually for impairment. In addition, goodwill will be tested on an interim basis if an event or circumstance indicates that it is more likely than not that an impairment loss has been incurred. The Company performed its annual impairment testing in November 2007 and determined that no impairment loss existed. Intangible assets with finite useful lives are amortized over their respective estimated useful lives and reviewed for impairment in accordance with SFAS No. 144. The Company performs its annual assessment of impairment following the finalization of each November’s financial statements.
Impairment of Long-Lived Assets and Long-Lived Assets to Be Disposed Of
The Company reviews its long-lived assets and certain identifiable intangible assets for impairment whenever events or changes in circumstances indicate that the carrying amount of an asset may not be recoverable, in accordance with Statement of Financial Accounting Standards (SFAS) No. 144, Accounting for the Impairment or Disposal of Long-Lived Assets. Recoverability of assets to be held and used is measured by comparing the carrying amount of an asset to future net undiscounted cash flows expected to be generated by the asset. If such assets are considered to be impaired, the impairment to be recognized is measured as the amount by which the carrying amount of the assets exceeds the fair value of the assets based on discounted cash flows or other readily available evidence of fair value, if any. Assets to be disposed of are reported at the lower of the carrying amount or fair value less costs to sell. In fiscal 2007, 2006 and 2005, the Company recorded charges of $0.8 million, $0.5 million and $0.2 million, respectively, to write down certain assets. These charges are recorded as a component of "selling, general and administrative expenses" in the accompanying consolidated statements of operations.
Financial Instruments
The Company utilizes derivative financial instruments to reduce its exposure to market risks from changes in interest rates. By entering into receive-variable, pay-fixed interest rate swaps, the Company limits its exposure to changes in variable interest rates. The Company is exposed to credit-related losses in the event of non-performance by the counterparty to the interest rate swaps; however, the counterparties are major financial institutions, and the risk of loss due to non-performance is considered remote. Interest rate differentials paid or received on the swaps are recognized as adjustments to expense in the period earned or incurred. The Company formally documents all hedging relationships, if applicable, and assesses hedge effectiveness both at inception and on an ongoing basis.
The Company’s remaining interest rate swap does not qualify for hedge accounting treatment pursuant to the provisions of SFAS No. 133, Accounting for Derivative Instruments and Hedging Activities (SFAS133). This interest rate swap is recorded at fair value in the accompanying consolidated balance sheets as a component of “other liabilities” (see Note 6). Changes in the fair value of this interest rate swap are recorded as "interest expense” in the accompanying consolidated statements of operations. The fair value of this interest rate swap at February 2, 2008 was $0.5 million. The fair value at February 3, 2007 was less than $0.1 million.
Lease Accounting
The Company leases all of its retail locations under operating leases. The Company recognizes minimum rent expense starting when possession of the property is taken from the landlord, which normally includes a construction period prior to store opening. When a lease contains a predetermined fixed escalation of the minimum rent, the Company recognizes the related rent expense on a straight-line basis and records the difference between the recognized rental expense and the amounts payable under the lease as deferred rent. The Company also receives tenant allowances, which are recorded in deferred rent and are amortized as a reduction of rent expense over the term of the lease.
Revenue Recognition
The Company recognizes sales revenue at the time a sale is made to its customer.
Taxes Collected
The Company reports taxes assessed by a governmental authority that are directly imposed on revenue-producing transactions (i.e., sales tax) on a net (excluded from revenues) basis.
Cost of Sales
The Company includes the cost of merchandise, warehousing and distribution costs, and certain occupancy costs in cost of sales.
Pre-Opening Costs
The Company expenses pre-opening costs for new, expanded and relocated stores, as incurred.
Advertising Costs
The Company expenses advertising costs as they are incurred. Advertising costs approximated $8.4 million, $10.6 million and $11.8 million for the years ended February 2, 2008, February 3, 2007, and January 28, 2006, respectively.
Income Taxes
Income taxes are accounted for under the asset and liability method. Deferred tax assets and liabilities are recognized for the future tax consequences attributable to differences between financial statement carrying amounts of existing assets and liabilities and their respective tax bases. Deferred tax assets and liabilities are measured using enacted tax rates expected to apply to taxable income in the years in which those temporary differences are expected to be recovered or settled. The effect on deferred tax assets and liabilities of a change in tax rates is recognized in income in the period that includes the enactment date of such change.
On February 4, 2007, the Company adopted Financial Accounting Standards Board Interpretation No. 48, Accounting for Uncertainty in Income Taxes (FIN 48), which clarified the accounting for uncertainty in income taxes recognized in the financial statements in accordance with SFAS No. 109, Accounting for Income Taxes. With the adoption of FIN 48, the Company includes interest and penalties in the provision for income tax expense and income taxes payable. The Company does not provide for any penalties associated with tax contingencies unless they are considered probable of assessment. Refer to Note 3 for further discussion of income taxes and the impact of adopting FIN 48.
Stock-Based Compensation
Effective, January 29, 2006, the Company adopted Statement of Financial Accounting Standards, No. 123 (revised 2004), Share-Based Payment, (SFAS 123R). This statement is a revision of SFAS 123 and supersedes Accounting Principle Board Opinion No. 25, Accounting for Stock Issued to Employees, (APB Opinion 25). SFAS 123R requires all share-based payments to employees, including grants of employee stock options, to be recognized in the financial statements based on their fair values. The Company adopted SFAS 123R using the modified prospective method, which requires application of the standard to all awards granted, modified, repurchased or cancelled on or after January 29, 2006, and to all awards granted to employees that were unvested as of January 29, 2006. In accordance with the modified prospective method of implementation, 2005 financial statements have not been restated to reflect the impact of SFAS 123R. During 2006, the Company recognized $1.8 million of stock-based compensation expense as a result of the adoption of SFAS 123R. Total stock-based compensation expense for 2007, 2006 and 2005 was $11.3 million, $6.7 million and $2.4 million, respectively. Through January 28, 2006, the Company applied the intrinsic value recognition and measurement principles of APB Opinion 25 and related Interpretations in accounting for its stock-based employee compensation plans. Prior to the adoption of SFAS 123R, the Company reported all tax benefits resulting from the exercise of stock options as operating cash flows in the Consolidated Statements of Cash Flows. SFAS 123R requires cash flows resulting from the tax deductions in excess of the tax benefits of the related compensation cost recognized in the financial statements (excess tax benefits) to be classified as financing cash flows. Thus, the Company has classified the $13.0 million and $5.6 million of excess tax benefits recognized in 2007 and 2006, respectively, as financing cash flows. Excess tax benefits of $1.2 million recognized in 2005 prior to the adoption of SFAS 123R, are classified as operating cash flows.
If the accounting provisions of SFAS 123 had been applied to 2005, the Company's net income and net income per share would have been reduced to the pro forma amounts indicated in the following table:
| | | Year Ended | |
| | | January 28, | |
| (in millions, except per share data) | | 2006 | |
| | | | |
| Net income as reported | | $ | 173.9 | |
| Add: Total stock-based employee | | | | |
| compensation expense included in net | | | | |
| income, net of related tax effects | | | 1.5 | |
| Deduct: Total stock-based employee | | | | |
| compensation expense determined under | | | | |
| fair value based method, | | | | |
| net of related tax effects | | | (18.2 | ) |
| | | | | |
| | | $ | 157.2 | |
| | | | | |
| Net income per share: | | | | |
| Basic, as reported | | $ | 1.61 | |
| Basic, pro forma under FAS 123 | | | 1.45 | |
| | | | | |
| Diluted, as reported | | $ | 1.60 | |
| Diluted, pro forma under FAS 123 | | | 1.44 | |
On December 15, 2005, the Compensation Committee of the Board of Directors of the Company approved the acceleration of the vesting date of all previously issued, outstanding and unvested options under all current stock option plans, including the 1995 Stock Incentive Plan, the 2003 Equity Incentive Plan and the 2004 Executive Officer Equity Incentive Plan (EOEP), effective as of December 15, 2005. At the effective date, almost all of these options had exercise prices higher than the actual stock price. The Company made the decision to accelerate vesting of these options to give employees increased performance incentives and to enhance current retention. This decision also eliminated non-cash compensation expense that would have been recorded in future periods following the Company’s adoption of SFAS 123R on January 29, 2006. Compensation expense, as determined at the time of the accelerated vesting, has been reduced by $14.9 million, over a period of four years during which the options would have vested, as a result of the option acceleration program. This amount is net of compensation expense of $0.1 million recognized in fiscal 2005 for estimated forfeiture of certain (in the money) options.
The Company recognizes expense related to the fair value of restricted stock units (RSUs) over the requisite service period. The fair value of the RSUs is determined using the closing price of the Company’s common stock on the date of grant.
On March 14, 2008, the Board of Directors granted approximately 0.3 million restricted stock units and options to purchase 0.4 million shares of the Company’s common stock under the Company’s Equity Incentive Plan and the EOEP.
Net Income Per Share
Basic net income per share has been computed by dividing net income by the weighted average number of shares outstanding. Diluted net income per share reflects the potential dilution that could occur assuming the inclusion of dilutive potential shares and has been computed by dividing net income by the weighted average number of shares and dilutive potential shares outstanding. Dilutive potential shares include all outstanding stock options and unvested restricted stock, excluding certain performance based restricted stock grants, after applying the treasury stock method.
NOTE 2 - BALANCE SHEET COMPONENTS
Other Intangibles, Net
Intangibles, net, as of February 2, 2008 and February 3, 2007 consist of the following:
| | | February 2, | | | February 3, | |
| (in millions) | | 2008 | | | 2007 | |
| | | | | | | |
| Non-competition agreements | | $ | 6.4 | | | $ | 6.4 | |
| Accumulated amortization | | | (5.9 | ) | | | (5.1 | ) |
| Non-competition agreements, net | | | 0.5 | | | | 1.3 | |
| | | | | | | | | |
| Favorable lease rights | | | 25.1 | | | | 19.0 | |
| Accumulated amortization | | | (11.1 | ) | | | (7.0 | ) |
| Favorable lease rights, net | | | 14.0 | | | | 12.0 | |
| | | | | | | | | |
| Total other intangibles, net | | $ | 14.5 | | | $ | 13.3 | |
Non-Competition Agreements
The Company has entered into non-competition agreements with certain former executives of certain acquired entities. These assets are being amortized over the legal term of the individual agreements, ranging from five to ten years.
Favorable Lease Rights
In 2007 and 2006, the Company acquired favorable lease rights for operating leases for retail locations from third parties, including the acquired favorable lease rights in its acquisition of 138 Deal$ stores (see Note 10). The Company’s favorable lease rights are amortized on a straight-line basis to rent expense over the remaining initial lease terms, which expire at various dates through 2016. The weighted average life remaining on the favorable lease rights at February 2, 2008 is 50 months.
Amortization expense related to the non-competition agreements and favorable lease rights was $5.4 million, $4.4 million and $3.3 million for the years ended February 2, 2008, February 3, 2007 and January 28, 2006, respectively. Estimated annual amortization expense for the next five years follows: 2008 - $4.9 million; 2009 - $3.2 million; 2010 - $2.5 million, 2011 - $1.9 million, and 2012 - - $1.1 million.
Property, Plant and Equipment, Net
Property, plant and equipment, net, as of February 2, 2008 and February 3, 2007 consists of the following:
| | | February 2, | | | February 3, | |
| (in millions) | | 2008 | | | 2007 | |
| | | | | | | |
| Land | | $ | 29.4 | | | $ | 29.4 | |
| Buildings | | | 172.7 | | | | 154.7 | |
| Improvements | | | 535.1 | | | | 482.3 | |
| Furniture, fixtures and equipment | | | 785.0 | | | | 708.6 | |
| Construction in progress | | | 52.9 | | | | 38.3 | |
| | | | | | | | | |
| Total property, plant and equipment | | | 1,575.1 | | | | 1,413.3 | |
| | | | | | | | | |
| Less: accumulated depreciation and amortization | | | 831.5 | | | | 698.0 | |
| | | | | | | | | |
| Total property, plant and equipment, net | | $ | 743.6 | | | $ | 715.3 | |
Other Assets, Net
Other assets, net includes $47.6 million and $39.2 million at February 2, 2008 and February 3, 2007, respectively of restricted investments. The Company purchased these restricted investments to collateralize long-term insurance obligations. These investments replaced higher cost stand by letters of credit and surety bonds. These investments consist primarily of government-sponsored municipal bonds, similar to our short-term investments. These investments are classified as available for sale and are recorded at fair value, which approximates cost.
Other Current Liabilities
Other current liabilities as of February 2, 2008 and February 3, 2007 consist of accrued expenses for the following:
| | | February 2, | | | February 3, | |
| (in millions) | | 2008 | | | 2007 | |
| | | | | | | |
| Compensation and benefits | | $ | 45.5 | | | $ | 43.5 | |
| Taxes (other than income taxes) | | | 16.3 | | | | 19.5 | |
| Insurance | | | 27.6 | | | | 26.8 | |
| Other | | | 54.2 | | | | 42.2 | |
| | | | | | | | | |
| Total other current liabilities | | $ | 143.6 | | | $ | 132.0 | |
Fair Value of Financial Instruments
The carrying values of cash and cash equivalents, other current assets, accounts payable and other current liabilities approximate fair value because of the short maturity of these instruments. The carrying values of other long-term financial assets and liabilities, excluding restricted investments, approximate fair value because they are recorded using discounted future cash flows or quoted market rates. Short-term investments and restricted investments are carried at fair value, which approximates cost, in accordance with SFAS No. 115, Accounting for Certain Investments in Debt and Equity Securities.
The carrying value of the Company's long-term debt approximates its fair value because the debt’s interest rates vary with market interest rates.
NOTE 3 - INCOME TAXES
Total income taxes were allocated as follows:
| | | Year Ended | | | Year Ended | | | Year Ended | |
| | | February 2, | | | February 3, | | | January 28, | |
| | | 2008 | | | 2007 | | | 2006 | |
| (in millions) | | | |
| | | | | | | | | | |
| Income from continuing operations | | $ | 118.5 | | | $ | 110.9 | | | $ | 101.3 | |
| Accumulated other comprehensive income, | | | | | | | | | | | | |
| marking derivative financial | | | | | | | | | | | | |
| instruments to fair value | | | - | | | | - | | | | 0.2 | |
| Stockholders' equity, tax benefit on | | | | | | | | | | | | |
| exercise of stock options | | | (13.0 | ) | | | (5.6 | ) | | | (1.2 | ) |
| | | $ | 105.5 | | | $ | 105.3 | | | $ | 100.3 | |
The provision for income taxes consists of the following:
| | | Year Ended | | | Year Ended | | | Year Ended | |
| | | February 2, | | | February 3, | | | January 28, | |
| (in millions) | | 2008 | | | 2007 | | | 2006 | |
| Federal - current | | $ | 147.5 | | | $ | 116.2 | | | $ | 108.1 | |
| State - current | | | 17.8 | | | | 16.6 | | | | 14.7 | |
| Total current | | | 165.3 | | | | 132.8 | | | | 122.8 | |
| | | | | | | | | | | | | |
| Federal - deferred | | | (39.4 | ) | | | (19.1 | ) | | | (20.6 | ) |
| State - deferred | | | (7.4 | ) | | | (2.8 | ) | | | (0.9 | ) |
| Total deferred | | | (46.8 | ) | | | (21.9 | ) | | | (21.5 | ) |
| | | | | | | | | | | | | |
| Provision for income taxes | | $ | 118.5 | | | $ | 110.9 | | | $ | 101.3 | |
Included in current tax expense for the year ended February 2, 2008, are amounts related to uncertain tax positions associated with temporary differences, in accordance with FIN 48.
A reconciliation of the statutory federal income tax rate and the effective rate follows:
| | | Year Ended | | | Year Ended | | | Year Ended | |
| | | February 2, | | | February 3, | | | January 28, | |
| | | 2008 | | | 2007 | | | 2006 | |
| | | | | | | | | | |
| Statutory tax rate | | | 35.0 | % | | | 35.0 | % | | | 35.0 | % |
| Effect of: | | | | | | | | | | | | |
| State and local income taxes, | | | | | | | | | | | | |
| net of federal income tax | | | | | | | | | | | | |
| benefit | | | 2.9 | | | | 3.3 | | | | 3.4 | |
| Other, net | | | (0.8 | ) | | | (1.7 | ) | | | (1.6 | ) |
| Effective tax rate | | | 37.1 | % | | | 36.6 | % | | | 36.8 | % |
The rate reduction in “other, net” consists primarily of benefits from the resolution of tax uncertainties, interest on tax reserves, federal jobs credits and tax exempt interest.
Deferred income taxes reflect the net tax effects of temporary differences between the carrying amounts of assets and liabilities for financial reporting purposes and the amounts used for income tax purposes. Deferred tax assets and liabilities are classified on the accompanying consolidated balance sheets based on the classification of the underlying asset or liability. Significant components of the Company's net deferred tax assets (liabilities) follows:
| | | February 2, | | | February 3, | |
| | | 2008 | | | 2007 | |
| (in millions) | | | | | | |
| Deferred tax assets: | | | | | | |
| Accrued expenses | | $ | 38.2 | | | $ | 33.5 | |
| Property and equipment | | | 22.2 | | | | - | |
| State tax net operating losses and credit | | | | | | | | |
| carryforwards, net of federal benefit | | | 2.1 | | | | 1.3 | |
| Accrued compensation expense | | | 10.7 | | | | 9.3 | |
| Total deferred tax assets | | | 73.2 | | | | 44.1 | |
| Valuation allowance | | | (2.1 | ) | | | (1.3 | ) |
| Deferred tax assets, net | | | 71.1 | | | | 42.8 | |
| | | | | | | | | |
| Deferred tax liabilities: | | | | | | | | |
| Intangible assets | | | (11.0 | ) | | | (9.2 | ) |
| Property and equipment | | | - | | | | (14.3 | ) |
| Prepaids | | | (2.2 | ) | | | (9.0 | ) |
| Other | | | (1.9 | ) | | | (1.1 | ) |
| Total deferred tax liabilities | | | (15.1 | ) | | | (33.6 | ) |
| | | | | | | | | |
| Net deferred tax asset | | $ | 56.0 | | | $ | 9.2 | |
A valuation allowance of $2.1 million, net of Federal tax benefits, has been provided principally for certain state net operating losses and credit carryforwards. In assessing the realizability of deferred tax assets, management considers whether it is more likely than not that some portion or all of the deferred taxes will not be realized. Based upon the availability of carrybacks of future deductible amounts to the past two years’ taxable income and management's projections for future taxable income over the periods in which the deferred tax assets are deductible, management believes it is more likely than not the remaining existing deductible temporary differences will reverse during periods in which carrybacks are available or in which the Company generates net taxable income.
The Internal Revenue Service completed its examination of the 1999 to 2003 consolidated federal income tax returns during 2006. In addition, several states completed their examination of fiscal years prior to 2005. In general, fiscal years 2004 and forward are within the statute of limitations for Federal and state tax purposes. The statute of limitations is still open prior to 2004 for some states.
In June 2006, the Financial Accounting Standards Board issued FIN 48. This Interpretation clarifies accounting for income tax uncertainties recognized in an enterprise’s financial statements in accordance with Statement of Financial Accounting Standards No. 109, Accounting for Income Taxes. FIN 48 prescribes a recognition threshold and measurement attribute for a tax position taken or expected to be taken in a tax return. Under the guidelines of FIN 48, an entity should recognize a financial statement benefit for a tax position if it determines that it is more likely than not that the position will be sustained upon examination.
The Company adopted the provisions of FIN 48 on February 4, 2007. As a result, the Company recognized a $0.6 million decrease to retained earnings. The balance for unrecognized tax benefits at February 4, 2007, was $19.1 million. The total amount of unrecognized tax benefits at February 4, 2007, that, if recognized, would affect the effective tax rate was $12.4 million (net of the federal tax benefit). The following is a reconciliation of Dollar Tree’s total gross unrecognized tax benefits for the year-to-date period ended February 2, 2008:
| | | | (in millions) | |
| Balance at February 4, 2007 | | $ | 19.1 | |
| Additions, based on tax positions related to current year | | | 8.1 | |
| Additions for tax positions of prior years | | | 29.2 | |
| Reductions for tax positions of prior years | | | | |
| settlements | | | (0.1 | ) |
| Lapses in statute of limitations | | | (1.3 | ) |
| Balance at February 2, 2008 | | $ | 55.0 | |
The total amount of unrecognized tax benefits at February 2, 2008, that, if recognized, would affect the effective tax rate was $15.4 million (net of the federal tax benefit).
During fiscal 2007, the Company accrued potential interest of $4.4 million, related to these unrecognized tax benefits. No potential penalties were accrued during 2007 related to the unrecognized tax benefits. As of February 2, 2008, the Company has recorded a liability for potential penalties and interest of $0.1 million and $7.3 million, respectively.
During the next 12 months, it is reasonably possible the Company’s reserve for uncertain tax positions will decrease between $34.0 million and $42.0 million. Most of this reduction relates to temporary differences and the related interest expense for which accounting method changes have been filed at the beginning of fiscal year 2008 with the Internal Revenue Service. Voluntarily filing accounting method changes provides audit protection for the issues involved for the open periods in exchange for agreeing to pay the tax over a prescribed period of time. In addition, it is possible that state tax reserves will be reduced for audit settlements and statute expirations within the next 12 months. At this point it is not possible to estimate a range associated with these audits.
NOTE 4 – COMMITMENTS AND CONTINGENCIES
Operating Lease Commitments
Future minimum lease payments under noncancelable stores and distribution center operating leases are as follows:
| | | | (in millions) | |
| 2008 | | $ | 319.0 | |
| 2009 | | | 284.3 | |
| 2010 | | | 238.4 | |
| 2011 | | | 185.8 | |
| 2012 | | | 129.9 | |
| Thereafter | | | 205.8 | |
| | | | | |
| Total minimum lease payments | | $ | 1,363.2 | |
The above future minimum lease payments include amounts for leases that were signed prior to February 2, 2008 for stores that were not open as of February 2, 2008.
Minimum rental payments for operating leases do not include contingent rentals that may be paid under certain store leases based on a percentage of sales in excess of stipulated amounts. Future minimum lease payments have not been reduced by expected future minimum sublease rentals of $2.6 million under operating leases.
Minimum and Contingent Rentals
Rental expense for store and distribution center operating leases (including payments to related parties) included in the accompanying consolidated statements of operations are as follows:
| | | Year Ended | | | Year Ended | | | Year Ended | |
| | | February 2, | | | February 3, | | | January 28, | |
| | | 2008 | | | 2007 | | | 2006 | |
| (in millions) | | | | | | | | | |
| Minimum rentals | | $ | 295.4 | | | $ | 261.8 | | | $ | 225.8 | |
| Contingent rentals | | | 1.2 | | | | 0.9 | | | | 0.7 | |
Non-Operating Facilities
The Company is responsible for payments under leases for certain closed stores. The Company was also responsible for payments under leases for two former distribution centers whose leases expired in June 2005 and September 2005. The Company accounts for abandoned lease facilities in accordance with SFAS No. 146, Accounting for Costs Associated with Exit or Disposal Activities. A facility is considered abandoned on the date that the Company ceases to use it. On this date, the Company records an expense for the present value of the total remaining costs for the abandoned facility reduced by any actual or probable sublease income. Due to the uncertainty regarding the ultimate recovery of the future lease and related payments, the Company recorded charges of $0.1 million, $0.1 million and $0.3 million in 2007, 2006 and 2005, respectively.
Related Parties
The Company also leases properties for six of its stores from partnerships owned by related parties. The total rental payments related to these leases were $0.5 million for each of the years ended February 2, 2008, February 3, 2007 and January 28, 2006, respectively. Total future commitments under related party leases are $0.9 million.
Freight Services
The Company has contracted outbound freight services from various contract carriers with contracts expiring through February 2013. The total amount of these commitments is approximately $191.2 million, of which approximately $85.0 million is committed in 2008, $83.7 million is committed in 2009, $14.5 million is committed in 2010, $4.5 million is committed in 2011 and $3.5 is committed in 2012.
Technology Assets
The Company has commitments totaling approximately $5.1 million to purchase store technology assets for its stores during 2008.
Letters of Credit
In March 2001, the Company entered into a Letter of Credit Reimbursement and Security Agreement. The agreement provides $125.0 million for letters of credit. In December 2004, the Company entered into an additional Letter of Credit Reimbursement and Security Agreement, which provides $50.0 million for letters of credit. Letters of credit under both of these agreements are generally issued for the routine purchase of imported merchandise and approximately $88.9 million was committed to these letters of credit at February 2, 2008.
The Company also has approximately $17.3 million in stand-by letters of credit that serve as collateral for its self-insurance programs and expire in fiscal 2008.
Surety Bonds
The Company has issued various surety bonds that primarily serve as collateral for utility payments at the Company’s stores. The total amount of the commitment is approximately $2.5 million, which is committed through various dates through fiscal 2009.
Contingencies
In 2003, the Company was served with a lawsuit in a California state court by a former employee who alleged that employees did not properly receive sufficient meal breaks and paid rest periods, along with other alleged wage and hour violations. The suit requested that the Court certify the case as a class action. The parties engaged in mediation and reached an agreement which upon presentation to the Court, received preliminary approval and the certification of a settlement class. Notices have been mailed to the class members and the final fairness hearing is expected to occur on May 22, 2008. The settlement amount has been accrued in the accompanying consolidated balance sheet as of February 2, 2008.
In 2005, the Company was served with a lawsuit by former employees in Oregon who allege that they did not properly receive sufficient meal breaks and paid rest periods, and that terminated employees were not paid in a timely manner. The plaintiffs requested the Court to certify classes for their various claims and the presiding judge did so with respect to two classes, but denied others. After a partly successful appeal by the plaintiffs, one additional class has been certified. The certified classes now include two for alleged violations of that state’s labor laws concerning rest breaks and one related to untimely payments upon termination. Discovery is now on-going and no trial is anticipated before the latter part of 2008.
In 2006, the Company was served with a lawsuit by a former employee in a California state court alleging that she was paid for wages with a check drawn on a bank which did not have any branches in the state, an alleged violation of the state's labor code; that she was paid less for her work than other similar employees with the same job title based on her gender; and that she was not paid her final wages in a timely manner, also an alleged violation of the labor code. The plaintiff requested the Court to certify the case and those claims as a class action. The parties have reached a settlement and executed an Agreement by which the named plaintiff individually settled her Equal Pay Act and late payment claims. The Court accepted the proposed settlement and certified a class for the check claim. Notices have been mailed to class members and a hearing for final approval of the settlement has been scheduled for April 22, 2008. The estimated settlement amount has been accrued in the accompanying consolidated balance sheet as of February 2, 2008.
In 2006, the Company was served with a lawsuit filed in federal court in the state of Alabama by a former store manager. She claims that she should have been classified as a non-exempt employee under the Fair Labor Standards Act and, therefore, should have received overtime compensation and other benefits. She filed the case as a collective action on behalf of herself and all other employees (store managers) similarly situated. Plaintiff sought and received from the Court an Order allowing nationwide (except for the state of California) notice to be sent to all store managers employed by the Company now or within the past three years. Such notice has been mailed and each involved person will determine whether he or she wishes to opt-in to the class as a plaintiff. The Company intends at the appropriate time to challenge the anticipated effort by the opt-in plaintiffs to be certified as a class.
In 2007, the Company was served with a lawsuit filed in federal court in the state of California by one present and one former store manager. They claim they should have been classified as non-exempt employees under both the California Labor Code and the Fair Labor Standards Act. They filed the case as a class action on behalf of California based store managers. The Company responded with a motion to dismiss which the Court granted with respect to allegations of fraud. The plaintiff then filed an amended complaint which has been answered by us. The Company was thereafter served with a second suit in a California state court which alleges essentially the same claims as those contained in the federal action and which likewise seeks class certification of all California store managers. The Company has removed the case to the same federal court as the first suit, answered it and the two cases have been consolidated. The Company will defend the plaintiffs’ anticipated effort to seek class certification.
In 2007, the Company was served with a lawsuit filed in federal court in California by two former employees who allege they were not paid all wages due and owing for time worked, that they were not paid in a timely manner upon termination of their employment and that they did not receive accurate itemized wage statements. They filed the suit as a class action and seek to include in the class all of the Company’s former employees in the state of California. The Company responded with a motion to dismiss which the Court denied. The Company answered and a motion for summary judgment on the part of the Company is presently pending before the Court.
The Company was recently served in federal court in California with a Complaint, on behalf of a former employee, alleging meal and rest break violations among other causes of action, and seeking class action status. The settlement Order entered by the Court in the 2003 case referenced above included an injunction against meal and rest break claims on the part of class members which the Company believe include this plaintiff. The Company will seek to stay this litigation in accordance with that injunction.
The Company will vigorously defend itself in these lawsuits. The Company does not believe that any of these matters will, individually or in the aggregate, have a material adverse effect on its business or financial condition. The Company cannot give assurance, however, that one or more of these lawsuits will not have a material adverse effect on its results of operations for the period in which they are resolved.
NOTE 5 - LONG-TERM DEBT
Long-term debt at February 2, 2008 and February 3, 2007 consists of the following:
| | | February 2, | | | February 3, | |
| (in millions) | | 2008 | | | 2007 | |
| | | | | | | |
| $450.0 million Unsecured Revolving Credit Facility, | | | | | | |
| interest payable monthly at LIBOR, | | | | | | |
| plus 0.475%, which was 4.47% at | | | | | | |
| February 2, 2008, principal payable upon | | | | | | |
| expiration of the facility in March 2009 | | $ | 250.0 | | | $ | 250.0 | |
| | | | | | | | | |
| Demand Revenue Bonds, interest payable monthly | | | | | | | | |
| at a variable rate which was 3.38% at | | | | | | | | |
| February 2, 2008, principal payable on | | | | | | | | |
| demand, maturing June 2018 | | | 18.5 | | | | 18.8 | |
| | | | | | | | | |
| Total long-term debt | | | 268.5 | | | | 268.8 | |
| | | | | | | | | |
| Less current portion | | | 18.5 | | | | 18.8 | |
| | | | | | | | | |
| Long-term debt, excluding current portion | | $ | 250.0 | | | $ | 250.0 | |
Maturities of long-term debt are as follows: 2008 - $18.5 million and 2009 - $250.0 million.
Unsecured Revolving Credit Facility
In March 2004, the Company entered into a five-year Unsecured Revolving Credit Facility (the Facility). The Facility provides for a $450.0 million revolving line of credit, including up to $50.0 million in available letters of credit, bearing interest at LIBOR, plus 0.475%. The Facility also bears an annual facilities fee, calculated as a percentage, as defined, of the amount available under the line of credit and an annual administrative fee payable quarterly. The Facility, among other things, requires the maintenance of certain specified financial ratios, restricts the payment of certain distributions and prohibits the incurrence of certain new indebtedness.
Demand Revenue Bonds
On May 20, 1998, the Company entered into an unsecured Loan Agreement with the Mississippi Business Finance Corporation (MBFC) under which the MBFC issued Taxable Variable Rate Demand Revenue Bonds (the Bonds) in an aggregate principal amount of $19.0 million to finance the acquisition, construction, and installation of land, buildings, machinery and equipment for the Company's distribution facility in Olive Branch, Mississippi. The Bonds do not contain a prepayment penalty as long as the interest rate remains variable. The Bonds contain a demand provision and, therefore, are classified as current liabilities.
Credit Agreement
On February 20, 2008, the Company entered into a five-year $550.0 million Credit Agreement (the Agreement). The Agreement provides for a $300.0 million revolving line of credit, including up to $150.0 million in available letters of credit, and a $250.0 million term loan. The interest rate on the facility will be based, at the Company’s option, on a LIBOR rate, plus a margin, or an alternate base rate, plus a margin. The revolving line of credit also bears a facilities fee, calculated as a percentage, as defined, of the amount available under the line of credit, payable quarterly. The term loan is due and payable in full at the five year maturity date of the Agreement. The Agreement also bears an administrative fee payable annually. The Agreement, among other things, requires the maintenance of certain specified financial ratios, restricts the payment of certain distributions and prohibits the incurrence of certain new indebtedness. The Company’s March 2004, $450.0 million unsecured revolving credit facility was terminated concurrent with entering into the Agreement.
NOTE 6 – DERIVATIVE FINANCIAL INSTRUMENTS
Non-Hedging Derivatives
At February 2, 2008, the Company was party to a derivative instrument in the form of an interest rate swap that does not qualify for hedge accounting treatment pursuant to the provisions of SFAS No. 133 because it contains a knock-out provision. The swap creates the economic equivalent of a fixed rate obligation by converting the variable-interest rate to a fixed rate. Under this interest rate swap, the Company pays interest to a financial institution at a fixed rate, as defined in the agreement. In exchange, the financial institution pays the Company at a variable interest rate, which approximates the floating rate on the variable-rate obligation, excluding the credit spread. The interest rate on the swap is subject to adjustment monthly. No payments are made by either party for months in which the variable-interest rate, as calculated under the swap agreement, is greater than the "knock-out rate." The following table summarizes the terms of the interest rate swap:
| Derivative | Origination | Expiration | Pay Fixed | Knock-out |
| Instrument | Date | Date | Rate | Rate |
| | | | | |
| $18.5 million swap | 4/1/99 | 4/1/09 | 4.88% | 7.75% |
This swap reduces the Company's exposure to the variable interest rate related to the Demand Revenue Bonds (see Note 5).
On March 20, 2008, the Company entered into two $75.0 million interest rate swap agreements. These interest rate swaps are used to manage the risk associated with interest rate fluctuations on a portion of the Company’s $250.0 million variable rate term note. Under these agreements, the Company pays interest to financial institutions at a fixed rate of 2.8%. In exchange, the financial institutions pay the Company at a variable rate, which approximates the variable rate on the debt, excluding the credit spread. The Company believes these swaps are highly effective as the interest reset dates and the underlying interest rate indices are identical for the swaps and the debt. These swaps qualify for hedge accounting treatment pursuant to SFAS No. 133, Accounting for Derivative Instruments and Hedging Activities and expire in March 2011.
NOTE 7 - SHAREHOLDERS' EQUITY
Preferred Stock
The Company is authorized to issue 10,000,000 shares of Preferred Stock, $0.01 par value per share. No preferred shares are issued and outstanding at February 2, 2008 and February 3, 2007.
Net Income Per Share
The following table sets forth the calculation of basic and diluted net income per share:
| | | Year Ended | | | Year Ended | | | Year Ended | |
| | | February 2, | | | February 3, | | | January 28, | |
| (in millions, except per share data) | | 2008 | | | 2007 | | | 2006 | |
| Basic net income per share: | | | | | | | | | |
| Net income | | $ | 201.3 | | | $ | 192.0 | | | $ | 173.9 | |
| Weighted average number of shares | | | | | | | | | | | | |
| outstanding | | | 95.9 | | | | 103.2 | | | | 108.3 | |
| | | | | | | | | | | | | |
| Basic net income per share | | $ | 2.10 | | | $ | 1.86 | | | $ | 1.61 | |
| | | | | | | | | | | | | |
| Diluted net income per share: | | | | | | | | | | | | |
| Net income | | $ | 201.3 | | | $ | 192.0 | | | $ | 173.9 | |
| Weighted average number of shares | | | | | | | | | | | | |
| outstanding | | | 95.9 | | | | 103.2 | | | | 108.3 | |
| Dilutive effect of stock options and | | | | | | | | | | | | |
| restricted stock (as determined by | | | | | | | | | | | | |
| applying the treasury stock method) | | | 0.5 | | | | 0.6 | | | | 0.4 | |
| Weighted average number of shares and | | | | | | | | | | | | |
| dilutive potential shares outstanding | | | 96.4 | | | | 103.8 | | | | 108.7 | |
| | | | | | | | | | | | | |
| Diluted net income per share | | $ | 2.09 | | | $ | 1.85 | | | $ | 1.60 | |
At February 2, 2008, February 3, 2007, and January 28, 2006, respectively, 0.4 million, 1.5 million, and 3.4 million stock options are not included in the calculation of the weighted average number of shares and dilutive potential shares outstanding because their effect would be anti-dilutive.
Share Repurchase Programs
In December 2006, the Company entered into two agreements with a third party to repurchase approximately $100.0 million of the Company’s common shares under an Accelerated Share Repurchase Agreement.
The first $50.0 million was executed in an “uncollared” agreement. In this transaction the Company initially received 1.7 million shares based on the market price of the Company’s stock of $30.19 as of the trade date (December 8, 2006). A weighted average price of $32.17 was calculated using stock prices from December 16, 2006 – March 8, 2007. This represented the calculation period for the weighted average price. Based on this weighted average price, the Company paid the third party an additional $3.3 million on March 8, 2007 for the 1.7 million shares delivered under this agreement.
The remaining $50.0 million was executed under a “collared” agreement. Under this agreement, the Company initially received 1.5 million shares through December 15, 2006, representing the minimum number of shares to be received based on a calculation using the “cap” or high-end of the price range of the collar. The number of shares received under the agreement was determined based on the weighted average market price of the Company’s common stock, net of a predetermined discount, during the time after the initial execution date through March 8, 2007. The calculated weighted average market price through March 8, 2007, net of a predetermined discount, as defined in the “collared” agreement, was $31.97. Therefore, on March 8, 2007, the Company received an additional 0.1 million shares under the “collared” agreement resulting in 1.6 million total shares being repurchased under this agreement.
On March 29, 2007, the Company entered into an agreement with a third party to repurchase $150.0 million of the Company’s common shares under an Accelerated Share Repurchase Agreement. The entire $150.0 million was executed under a “collared” agreement. Under this agreement, the Company initially received 3.6 million shares through April 12, 2007, representing the minimum number of shares to be received based on a calculation using the “cap” or high-end of the price range of the collar. The maximum number of shares that could have been received under the agreement was 4.1 million. The number of shares was determined based on the weighted average market price of the Company’s common stock during the four months after the initial execution date. The calculated weighted average market price through July 30, 2007, net of a predetermined discount, as defined in the “collared” agreement, was $40.78. Therefore, on July 30, 2007, the Company received an additional 0.1 million shares under the “collared” agreement resulting in 3.7 million total shares being repurchased under this agreement.
On August 30, 2007, the Company entered into an agreement with a third party to repurchase $100.0 million of the Company’s common shares under an Accelerated Share Repurchase Agreement. The entire $100.0 million was executed under a “collared” agreement. Under this agreement, the Company initially received 2.1 million shares through September 10, 2007, representing the minimum number of shares to be received based on a calculation using the “cap” or high-end of the price range of the collar. The number of shares received under the agreement was determined based on the weighted average market price of the Company’s common stock, net of a predetermined discount, during the time after the initial execution date through a period of up to four and one half months. The contract terminated on October 22, 2007 and the weighted average price through that date was $41.16. Therefore, on October 22, 2007, the Company received an additional 0.3 million shares resulting in 2.4 million total shares repurchased under this agreement.
In March 2005, the Company’s Board of Directors authorized the repurchase of up to $300.0 million of the Company’s common stock through March 2008. In November 2006, the Company’s Board of Directors authorized the repurchase of up to $500.0 million of the Company’s common stock. This amount was in addition to the $27.0 million remaining on the March 2005 authorization. In October 2007, the Company’s Board of Directors authorized the repurchase of an additional $500.0 million of the Company’s common stock. This authorization was in addition to the November 2006 authorization which had approximately $98.4 million remaining.
The Company repurchased approximately 12.8 million shares for approximately $473.0 million in fiscal 2007, approximately 8.8 million shares for approximately $248.2 million in fiscal 2006 and approximately 7.0 million shares for approximately $180.4 million in fiscal 2005. At February 2, 2008, the Company had approximately $453.7 remaining under Board authorization.
NOTE 8 – EMPLOYEE BENEFIT PLANS
Profit Sharing and 401(k) Retirement Plan
The Company maintains a defined contribution profit sharing and 401(k) plan which is available to all employees over 21 years of age who have completed one year of service in which they have worked at least 1,000 hours. Eligible employees may make elective salary deferrals. The Company may make contributions at its discretion.
Contributions to and reimbursements by the Company of expenses of the plan included in the accompanying consolidated statements of operations were as follows:
| Year Ended February 2, 2008 | $19.0 million |
| Year Ended February 3, 2007 | 16.8 million |
| Year Ended January 28, 2006 | 6.9 million |
Eligible employees hired prior to January 1, 2007 are immediately vested in the Company’s profit sharing contributions. Eligible employees hired subsequent to January 1, 2007 vest in the Company’s profit sharing contributions based on the following schedule:
· 25% after three years of service |
· 50% after four years of service |
· 100% after five years of service |
All eligible employees are immediately vested in any Company match contributions under the 401(k) portion of the plan.
Deferred Compensation Plan
The Company has a deferred compensation plan which provides certain officers and executives the ability to defer a portion of their base compensation and bonuses and invest their deferred amounts. The plan is a nonqualified plan and the Company may make discretionary contributions. The deferred amounts and earnings thereon are payable to participants, or designated beneficiaries, at specified future dates, or upon retirement or death. Total cumulative participant deferrals were approximately $2.5 million and $2.3 million, respectively, at February 2, 2008 and February 3, 2007, and are included in "other liabilities" on the accompanying consolidated balance sheets. The related assets are included in "other assets, net" on the accompanying consolidated balance sheets. The Company did not make any discretionary contributions in the years ended February 2, 2008, February 3, 2007 or January 28, 2006.
All of the employee benefit plans noted above were adopted by Dollar Tree, Inc. on March 2, 2008 as a part of the holding company reorganization. Refer to Note 1 for a discussion of the holding company reorganization.
NOTE 9 - STOCK-BASED COMPENSATION PLANS
At February 2, 2008, the Company has eight stock-based compensation plans. Each plan and the accounting method are described below.
Fixed Stock Option Compensation Plans
Under the Non-Qualified Stock Option Plan (SOP), the Company granted options to its employees for 1,047,264 shares of Common Stock in 1993 and 1,048,289 shares in 1994. Options granted under the SOP have an exercise price of $0.86 and are fully vested at the date of grant.
Under the 1995 Stock Incentive Plan (SIP), the Company granted options to its employees for the purchase of up to 12.6 million shares of Common Stock. The exercise price of each option equaled the market price of the Company's stock at the date of grant, unless a higher price was established by the Board of Directors, and an option's maximum term is 10 years. Options granted under the SIP generally vested over a three-year period. This plan was terminated on July 1, 2003 and replaced with the Company’s 2003 Equity Incentive Plan, discussed below.
The Step Ahead Investments, Inc. Long-Term Incentive Plan (SAI Plan) provided for the issuance of stock options, stock appreciation rights, phantom stock and restricted stock awards to officers and key employees. Effective with the merger with 98 Cent Clearance Center in December 1998 and in accordance with the terms of the SAI Plan, outstanding 98 Cent Clearance Center options were assumed by the Company and converted, based on 1.6818 Company options for each 98 Cent Clearance Center option, to options to purchase the Company's common stock. Options issued as a result of this conversion were fully vested as of the date of the merger.
Under the 1998 Special Stock Option Plan (Special Plan), options to purchase 247,500 shares were granted to five former officers of 98 Cent Clearance Center who were serving as employees or consultants of the Company following the merger. The options were granted as consideration for entering into non-competition agreements and a consulting agreement. The exercise price of each option equals the market price of the Company's stock at the date of grant, and the options' maximum term is 10 years. Options granted under the Special Plan vested over a five-year period. As of February 2, 2008, 135,250 of these options are still outstanding.
The 2003 Equity Incentive Plan (EIP) replaces the Company's SIP discussed above. Under the EIP, the Company may grant up to 6.0 million shares of its Common Stock, plus any shares available for future awards under the SIP, to the Company’s employees, including executive officers and independent contractors. The EIP permits the Company to grant equity awards in the form of stock options, stock appreciation rights and restricted stock. The exercise price of each stock option granted equals the market price of the Company’s stock at the date of grant. The options generally vest over a three-year period and have a maximum term of 10 years.
The 2004 Executive Officer Equity Plan (EOEP) is available only to the Chief Executive Officer and certain other executive officers. These officers no longer receive awards under the EIP. The EOEP allows the Company to grant the same type of equity awards as does the EIP. These awards generally vest over a three-year period, with a maximum term of 10 years.
Stock appreciation rights may be awarded alone or in tandem with stock options. When the stock appreciation rights are exercisable, the holder may surrender all or a portion of the unexercised stock appreciation right and receive in exchange an amount equal to the excess of the fair market value at the date of exercise over the fair market value at the date of the grant. No stock appreciation rights have been granted to date.
Any restricted stock or RSUs awarded are subject to certain general restrictions. The restricted stock shares or units may not be sold, transferred, pledged or disposed of until the restrictions on the shares or units have lapsed or have been removed under the provisions of the plan. In addition, if a holder of restricted shares or units ceases to be employed by the Company, any shares or units in which the restrictions have not lapsed will be forfeited.
The 2003 Non-Employee Director Stock Option Plan (NEDP) provides non-qualified stock options to non-employee members of the Company's Board of Directors. The stock options are functionally equivalent to such options issued under the EIP discussed above. The exercise price of each stock option granted equals the market price of the Company’s stock at the date of grant. The options generally vest immediately.
The 2003 Director Deferred Compensation Plan permits any of the Company's directors who receive a retainer or other fees for Board or Board committee service to defer all or a portion of such fees until a future date, at which time they may be paid in cash or shares of the Company's common stock, or to receive all or a portion of such fees in non-statutory stock options. Deferred fees that are paid out in cash will earn interest at the 30-year Treasury Bond Rate. If a director elects to be paid in common stock, the number of shares will be determined by dividing the deferred fee amount by the current market price of a share of the Company's common stock. The number of options issued to a director will equal the deferred fee amount divided by 33% of the price of a share of the Company's common stock. The exercise price will equal the fair market value of the Company's common stock at the date the option is issued. The options are fully vested when issued and have a term of 10 years.
All of the shareholder approved plans noted above were adopted by Dollar Tree, Inc. on March 2, 2008 as a part of the holding company reorganization. Refer to Note 1 for a discussion of the holding company reorganization.
Stock Options
In 2007 and 2006, the Company granted a total of 386,490 and 342,216 stock options from the EIP, EOEP and the NEDP, respectively. The fair value of all of these options is being expensed ratably over the three-year vesting periods, or a shorter period based on the retirement eligibility of the grantee. For these options, the fair value of each option grant was estimated on the date of grant using the Black-Scholes option-pricing model. All options granted to directors vest immediately and are expensed on the grant date. During 2007 and 2006, the Company recognized $2.7 million and $1.3 million, respectively of expense related to stock option grants. As of February 2, 2008, there was approximately $4.3 million of total unrecognized compensation expense related to these stock options which is expected to be recognized over a weighted average period of 23 months. The expected term of the awards granted was calculated using the “simplified method” in accordance with Staff Accounting Bulletin No. 107. Expected volatility is derived from an analysis of the historical and implied volatility of the Company’s publicly traded stock. The risk free rate is based on the U.S. Treasury rates on the grant date with maturity dates approximating the expected life of the option on the grant date. For pro forma disclosures required under FAS 123, the fair value of option awards in 2005 were also calculated using the Black-Scholes option-pricing model. The weighted average assumptions used in the Black-Scholes option-pricing model for grants in 2007, 2006 and 2005 are as follows:
| | | Fiscal 2007 | | | Fiscal 2006 | | | Fiscal 2005 | |
| Expected term in years | | | 6.0 | | | | 6.0 | | | | 4.7 | |
| Expected volatility | | | 28.4 | % | | | 30.2 | % | | | 48.7 | % |
| Annual dividend yield | | | - | | | | - | | | | - | |
| Risk free interest rate | | | 4.5 | % | | | 4.8 | % | | | 3.7 | % |
| Weighted average fair value of options | | | | | | | | | | | | |
| granted during the period | | $ | 14.33 | | | $ | 10.93 | | | $ | 11.27 | |
| Options granted | | | 386,490 | | | | 342,216 | | | | 320,220 | |
The following tables summarize the Company's various option plans and information about options outstanding at February 2, 2008 and changes during the year then ended.
| Stock Option Activity | |
| | | | | | | | | | | | | |
| | | February 2, 2008 | | | | | | | |
| | | | | | Weighted | | | | | | | |
| | | | | | Average | | | Weighted | | | Aggregate | |
| | | | | | Per Share | | | Average | | | Intrinsic | |
| | | | | | Exercise | | | Remaining | | Value (in | |
| | | Shares | | | Price | | | Term | | | millions) | |
| | | | | | | | | | | | | |
| Outstanding, beginning of period | | | 4,466,041 | | | $ | 25.96 | | | | | | | |
| Granted | | | 386,490 | | | | 38.17 | | | | | | | |
| Exercised | | | (2,674,857 | ) | | | 25.46 | | | | | | | |
| Forfeited | | | (87,760 | ) | | | 31.00 | | | | | | | |
| Outstanding, end of period | | | 2,089,914 | | | $ | 28.63 | | | | 5.5 | | | $ | - | |
| | | | | | | | | | | | | | | | | |
| Options vested and expected to vest | | | | | | | | | | | | | |
| at February 2, 2008 | | | 2,061,008 | | | $ | 28.58 | | | | 5.5 | | | $ | - | |
| | | | | | | | | | | | | | | | | |
| Options exercisable at end of period | | | 1,557,234 | | | $ | 26.71 | | | | 4.4 | | | $ | 1.7 | |
| | | | Options Outstanding | Options Exercisable |
| | | Options | | | | Options | | |
| Range of | | Outstanding | Weighted Avg. | Weighted Avg. | Exercisable | Weighted Avg. |
| Exercise | | at February 2, | Remaining | Exercise | at February 2, | Exercise |
| Prices | | 2008 | Contractual Life | Price | | 2008 | | Price |
| | | | | | | | | |
| $0.86 | | 3,072 | N/A | $ 0.86 | | 3,072 | | $ 0.86 |
| $10.99 to $21.28 | 307,534 | 4.3 | 19.43 | | 307,534 | | 19.43 |
| $21.29 to $29.79 | 935,616 | 5.3 | 25.83 | | 736,436 | | 25.35 |
| $29.80 to $42.56 | 843,692 | 6.1 | 35.20 | | 510,192 | | 33.21 |
| | | | | | | | | |
| $0.86 to $42.56 | 2,089,914 | 5.5 | 28.63 | | 1,557,234 | | 26.71 |
The intrinsic value of options exercised during 2007, 2006 and 2005 was approximately $32.8 million, $13.1 million and $2.8 million, respectively.
Restricted Stock
The Company granted 323,320, 277,347 and 252,936 RSUs, net of forfeitures in 2007, 2006 and 2005, respectively, from the EIP and the EOEP to the Company’s employees and officers. The fair value of all of these RSUs is being expensed ratably over the three-year vesting periods, or a shorter period based on the retirement eligibility of the grantee. The fair value was determined using the Company’s closing stock price on the date of grant. The Company recognized $7.7 million, $4.5 million and $1.7 million of expense related to these RSUs during 2007, 2006 and 2005. As of February 2, 2008, there was approximately $11.8 million of total unrecognized compensation expense related to these RSUs which is expected to be recognized over a weighted average period of 22 months.
In 2005, the Company granted 40,000 RSUs from the EOEP to certain officers of the Company, contingent on the Company meeting certain performance targets in 2005 and future service of these officers through various points through July 2007. The Company met these performance targets in fiscal 2005; therefore, the fair value of these RSUs of $1.0 million was expensed over the service period. The fair value of these RSUs was determined using the Company’s closing stock price January 28, 2006 (the last day of fiscal 2005), when the performance targets were satisfied. The Company recognized $0.3 million and $0.7 million, of expense related to these RSUs in 2006 and 2005, respectively. The amount recognized in 2007 was less than $0.1 million.
In 2006, the Company granted 6,000 RSUs from the EOEP and the EIP to certain officers of the Company, contingent on the Company meeting certain performance targets in 2006 and future service of the these officers through fiscal 2006. The Company met these performance targets in fiscal 2006; therefore, the Company recognized the fair value of these RSUs of $0.2 million during fiscal 2006. The fair value of these RSUs was determined using the Company’s closing stock price on the grant date in accordance with SFAS 123R.
The following table summarizes the status of RSUs as of February 2, 2008, and changes during the year then ended:
| | | | | | Weighted | |
| | | | | | Average | |
| | | | | | Grant | |
| | | | | | Date Fair | |
| | | Shares | | | Value | |
| | | | | | | |
| Nonvested at February 3, 2007 | | | 456,777 | | | $ | 26.57 | |
| Granted | | | 350,470 | | | | 38.12 | |
| Vested | | | (206,076 | ) | | | 26.60 | |
| Forfeited | | | (45,236 | ) | | | 32.96 | |
| Nonvested at February 2, 2008 | | | 555,935 | | | | 26.57 | |
In connection with the vesting of RSUs in 2007 and 2006, certain employees elected to receive shares net of minimum statutory tax withholding amounts which totaled $2.9 million and $1.0 million, respectively. The total fair value of the restricted shares vested during the years ended February 2, 2008 and February 3, 2007 was $8.2 million and $2.8 million, respectively. The total fair value of restricted shares vested during the year ended January 28, 2006 was less than $0.1 million.
Employee Stock Purchase Plan
Under the Dollar Tree, Inc. Employee Stock Purchase Plan (ESPP), the Company is authorized to issue up to 1,759,375 shares of common stock to eligible employees. Under the terms of the ESPP, employees can choose to have up to 10% of their annual base earnings withheld to purchase the Company's common stock. The purchase price of the stock is 85% of the lower of the price at the beginning or the end of the quarterly offering period. Under the ESPP, the Company has sold 1,074,420 shares as of February 2, 2008.
The fair value of the employees' purchase rights is estimated on the date of grant using the Black-Scholes option-pricing model with the following weighted average assumptions:
| | | Fiscal 2007 | | | Fiscal 2006 | | | Fiscal 2005 | |
| | | | | | | | | | |
| Expected term | | 3 months | | | 3 months | | | 3 months | |
| Expected volatility | | | 16.3 | % | | | 13.1 | % | | | 12.0 | % |
| Annual dividend yield | | | - | | | | - | | | | - | |
| Risk free interest rate | | | 4.4 | % | | | 4.8 | % | | | 3.9 | % |
The weighted average per share fair value of those purchase rights granted in 2007, 2006 and 2005 was $5.74, $4.59 and $4.11, respectively. Total expense recognized for these purchase rights was $0.9 million and $0.4 million in 2007 and 2006, respectively.
On March 2, 2008, the ESPP was adopted by Dollar Tree, Inc. as a part of the holding company reorganization. Refer to Note 1 for discussion of the holding company reorganization.
NOTE 10 – ACQUISITION
On March 25, 2006, the Company completed its acquisition of 138 Deal$ stores. These stores are located primarily in the Midwest part of the United States and the Company has existing logistics capacity to service these stores. This acquisition also includes a few “combo” stores that offer an expanded assortment of merchandise including items that sell for more than $1. Substantially all Deal$ stores acquired will continue to operate under the Deal$ banner while providing the Company an opportunity to leverage its Dollar Tree infrastructure in the testing of new merchandise concepts, including higher price points, without disrupting the single-price point model in its Dollar Tree stores.
The Company paid approximately $32.0 million for store-related and other assets and $22.1 million for inventory. This amount includes approximately $0.6 million of direct costs associated with the acquisition. The results of Deal$ store operations are included in the Company’s financial statements since the acquisition date and did not have a significant impact on the Company’s operating results in 2006. This acquisition is immaterial to the Company’s operations as a whole and therefore no proforma disclosure of financial information has been presented. The following table summarizes the allocation of the purchase price to the fair value of the assets acquired.
| (In millions) | | | |
| Inventory | | $ | 22.1 | |
| Other current assets | | | 0.1 | |
| Property and equipment | | | 15.1 | |
| Goodwill | | | 14.6 | |
| Other intangibles | | | 2.2 | |
| | | $ | 54.1 | |
The goodwill resulting from this acquisition will not be amortized but will be tested annually for impairment. Included in other intangibles is approximately $2.1 million related to net favorable lease rights for operating leases for retail locations. This amount is being amortized on a straight-line basis to rent expense over 35 months, the weighted average remaining initial lease term of the locations purchased.
NOTE 11 - INVESTMENT
The Company has a $4.0 million investment which represents a 10.5% fully diluted interest in Ollie's Holdings, Inc. (Ollie's), a multi-price point discount retailer located in the mid-Atlantic region. In addition, the SKM Equity Fund III, L.P. (SKM Equity) and SKM Investment Fund (SKM Investment) acquired a combined fully diluted interest in Ollie's of 53.1%. One of the Company's current directors, Thomas Saunders and one former director, John Megrue, are principal members of SKM Partners, L.L.C., which serves as the general partner of SKM Equity. John Megrue is also a principal member of Apax Partners, L.P., which serves as the general partner for SKM Investment. John Megrue, did not stand for re-election to the Company’s Board of Directors in June 2007. The $4.0 million investment in Ollie's is accounted for under the cost method and is included in "other assets" in the accompanying consolidated balance sheets.
NOTE 12 - QUARTERLY FINANCIAL INFORMATION (Unaudited)
The following table sets forth certain items from the Company's unaudited consolidated statements of operations for each quarter of fiscal year 2007 and 2006. The unaudited information has been prepared on the same basis as the audited consolidated financial statements appearing elsewhere in this report and includes all adjustments, consisting only of normal recurring adjustments, which management considers necessary for a fair presentation of the financial data shown. The operating results for any quarter are not necessarily indicative of results for a full year or for any future period.
| | | First | | | Second | | | Third | | | Fourth | |
| | | Quarter (1) | | | Quarter | | | Quarter | | | Quarter (2) | |
| | | | | | | | | | | | | |
| Fiscal 2007: | | | | | | | | | | | | |
| Net sales | | $ | 975.0 | | | $ | 971.2 | | | $ | 997.8 | | | $ | 1,298.6 | |
| Gross profit | | $ | 325.3 | | | $ | 326.6 | | | $ | 343.9 | | | $ | 465.3 | |
| Operating income | | $ | 62.3 | | | $ | 53.4 | | | $ | 60.2 | | | $ | 154.4 | |
| Net income | | $ | 38.1 | | | $ | 32.6 | | | $ | 35.9 | | | $ | 94.7 | |
| Diluted net income per share | | $ | 0.38 | | | $ | 0.33 | | | $ | 0.38 | | | $ | 1.04 | |
| Stores open at end of quarter | | | 3,280 | | | | 3,334 | | | | 3,401 | | | | 3,411 | |
| Comparable store net sales change | | | 5.8 | % | | | 4.4 | % | | | 1.9 | % | | | (0.8 | %) |
| | | | | | | | | | | | | | | | | |
| Fiscal 2006: | | | | | | | | | | | | | | | | |
| Net sales | | $ | 856.5 | | | $ | 883.6 | | | $ | 910.4 | | | $ | 1,318.9 | |
| Gross profit | | $ | 286.1 | | | $ | 293.3 | | | $ | 307.5 | | | $ | 470.3 | |
| Operating income | | $ | 53.5 | | | $ | 48.2 | | | $ | 53.5 | | | $ | 155.6 | |
| Net income | | $ | 32.9 | | | $ | 29.0 | | | $ | 32.5 | | | $ | 97.6 | |
| Diluted net income per share | | $ | 0.31 | | | $ | 0.28 | | | $ | 0.32 | | | $ | 0.96 | |
| Stores open at end of quarter | | | 3,119 | | | | 3,156 | | | | 3,192 | | | | 3,219 | |
| Comparable store net sales change | | | 4.0 | % | | | 4.2 | % | | | 4.0 | % | | | 5.5 | % |
| | | | | | | | | | | | | | | | | |
| (1) Easter was observed on April 8, 2007 and April 16, 2006 | | | | | | | | | |
| (2) Fiscal 2007 contains 13 weeks ended February 2, 2008 while | | | | | | | | | |
| Fiscal 2006 contains 14 weeks ended February 3, 2007 | | | | | | | | | | | | | |
Item 9. CHANGES IN AND DISAGREEMENTS WITH ACCOUNTANTS ON ACCOUNTING AND FINANCIAL DISCLOSURE
None.
Item 9A. CONTROLS AND PROCEDURES
Evaluation of disclosure controls and procedures
We maintain disclosure controls and procedures that are designed to ensure that information required to be disclosed in our reports under the Securities Exchange Act of 1934 (Exchange Act) is recorded, processed, summarized and reported within the time periods specified in the rules and forms of the Securities and Exchange Commission, and that such information is accumulated and communicated to our management, including our Chief Executive Officer and Principal Financial Officer, as appropriate, to allow timely decisions regarding required disclosure. In designing and evaluating the disclosure controls and procedures, we recognize that any controls and procedures, no matter how well designed and operated, can provide only reasonable assurance of achieving the desired control objectives, and management necessarily is required to apply our judgment in evaluating the cost-benefit relationship of possible controls and procedures.
Our management has carried out, with the participation of the Company’s Chief Executive Officer and Principal Financial Officer, an evaluation of the effectiveness of the Company’s disclosure controls and procedures, as defined in Rule 13a-15(e) under the Exchange Act. Based upon this evaluation, our chief executive officer and our principal financial officer concluded that, as of February 2, 2008, the Company’s disclosure controls and procedures are effective to provide reasonable assurance that material information required to be disclosed by us in reports that we file or submit under the Exchange Act is recorded, processed, summarized and reported within the time periods specified in Securities and Exchange Commission rules and forms.
Management’s Report on Internal Control over Financial Reporting
The Company’s management is responsible for establishing and maintaining adequate internal control over financial reporting, as defined in Exchange Act Rule 13a-15(f). The Company’s management conducted an assessment of the Company’s internal control over financial reporting based on the framework established by the Committee of Sponsoring Organizations of the Treadway Commission in Internal Control-Integrated Framework. Based on this assessment, the Company’s management has concluded that, as of February 2, 2008, the Company’s internal control over financial reporting is effective. The Company’s independent registered public accounting firm, KPMG LLP, has audited the Company’s consolidated financial statements and has issued an attestation report on the effectiveness of the Company’s internal control over financial reporting. Their report appears below.
Changes in internal controls
There were no changes in our internal controls over financial reporting that occurred during our most recently completed fiscal quarter that materially affected, or are reasonably likely to materially affect, our internal control over financial reporting.
Report of Independent Registered Public Accounting Firm
The Board of Directors and Shareholders
Dollar Tree, Inc. (formerly Dollar Tree Stores, Inc.):
We have audited Dollar Tree, Inc.’s (formerly Dollar Tree Stores, Inc.) internal control over financial reporting as of February 2, 2008, based on criteria established in Internal Control - Integrated Framework issued by the Committee of Sponsoring Organizations of the Treadway Commission (COSO). Dollar Tree Inc.’s management is responsible for maintaining effective internal control over financial reporting and for its assessment of the effectiveness of internal control over financial reporting, included in the accompanying Management’s Report on Internal Control over Financial Reporting. Our responsibility is to express an opinion on the Company’s internal control over financial reporting based on our audit.
We conducted our audit in accordance with the standards of the Public Company Accounting Oversight Board (United States). Those standards require that we plan and perform the audit to obtain reasonable assurance about whether effective internal control over financial reporting was maintained in all material respects. Our audit included obtaining an understanding of internal control over financial reporting, assessing the risk that a material weakness exists, and testing and evaluating the design and operating effectiveness of internal control based on the assessed risk. Our audit also included performing such other procedures as we considered necessary in the circumstances. We believe that our audit provides a reasonable basis for our opinion.
A company's internal control over financial reporting is a process designed to provide reasonable assurance regarding the reliability of financial reporting and the preparation of financial statements for external purposes in accordance with generally accepted accounting principles. A company's internal control over financial reporting includes those policies and procedures that (1) pertain to the maintenance of records that, in reasonable detail, accurately and fairly reflect the transactions and dispositions of the assets of the company; (2) provide reasonable assurance that transactions are recorded as necessary to permit preparation of financial statements in accordance with generally accepted accounting principles, and that receipts and expenditures of the company are being made only in accordance with authorizations of management and directors of the company; and (3) provide reasonable assurance regarding prevention or timely detection of unauthorized acquisition, use, or disposition of the company’s assets that could have a material effect on the financial statements.
Because of its inherent limitations, internal control over financial reporting may not prevent or detect misstatements. Also, projections of any evaluation of effectiveness to future periods are subject to the risk that controls may become inadequate because of changes in conditions, or that the degree of compliance with the policies or procedures may deteriorate.
In our opinion, Dollar Tree, Inc. (formerly Dollar Tree Stores, Inc.) maintained, in all material respects, effective internal control over financial reporting as of February 2, 2008, based on criteria established in Internal Control - Integrated Framework issued by the Committee of Sponsoring Organizations of the Treadway Commission.
We also have audited, in accordance with the standards of the Public Company Accounting Oversight Board (United States), the consolidated balance sheets of Dollar Tree, Inc. (formerly Dollar Tree Stores, Inc.) and subsidiaries as of February 2, 2008 and February 3, 2007, and the related consolidated statements of operations, shareholders’ equity and comprehensive income, and cash flows for each of the fiscal years in the three-year period ended February 2, 2008, and our report dated April 1, 2008 expressed an unqualified opinion on those consolidated financial statements.
/s/ KPMG LLP
Norfolk, Virginia
April 1, 2008
Item 9B. OTHER INFORMATION
None.
PART III
Item 10. DIRECTORS, EXECUTIVE OFFICERS AND CORPORATE GOVERNANCE
The information concerning our Directors and Executive Officers required by this Item is incorporated by reference in Dollar Tree, Inc.'s Proxy Statement relating to our Annual Meeting of Shareholders to be held on June 19, 2008, under the caption "Election of Directors."
Information set forth in the Proxy Statement under the caption "Compliance with Section 16(a) of the Securities and Exchange Act of 1934," with respect to director and executive officer compliance with Section 16(a), is incorporated herein by reference.
The information concerning our code of ethics required by this Item is incorporated by reference to Dollar Tree, Inc.'s Proxy Statement relating to our Annual Meeting of Shareholders to be held on June 19, 2008, under the caption "Code of Business Conduct (Code of Ethics)."
Item 11. EXECUTIVE COMPENSATION
Information set forth in the Proxy Statement under the caption "Compensation of Executive Officers," with respect to executive compensation, is incorporated herein by reference.
Item 12. SECURITY OWNERSHIP OF CERTAIN BENEFICIAL OWNERS AND MANAGEMENT AND RELATED STOCKHOLDER MATTERS
Information set forth in the Proxy Statement under the caption "Ownership of Common Stock," with respect to security ownership of certain beneficial owners and management, is incorporated herein by reference.
Item 13. CERTAIN RELATIONSHIPS, RELATED TRANSACTIONS AND DIRECTOR INDEPENDENCE
Information set forth in the Proxy Statement under the caption "Certain Relationships, Related Transactions and Director Independence," is incorporated herein by reference.
Item 14. PRINCIPAL ACCOUNTING FEES AND SERVICES
Information set forth in the Proxy Statement under the caption "Principal Accounting Fees and Services," is incorporated herein by reference.
PART IV
Item 15. EXHIBITS, FINANCIAL STATEMENT SCHEDULES, AND REPORTS ON FORM 8-K
| Documents filed as part of this report: |
| 1. | Financial Statements. Reference is made to the Index to the Consolidated Financial Statements set forth under Part II, Item 8, on Page 31 of this Form 10-K. |
| | |
| 2. | Financial Statement Schedules. All schedules for which provision is made in the applicable accounting regulations of the Securities and Exchange Commission are not required under the related instructions, are not applicable, or the information is included in the Consolidated Financial Statements, and therefore have been omitted. |
| | |
| 3. | Exhibits. The exhibits listed on the accompanying Index to Exhibits, on page 61 of this Form 10-K, are filed as part of, or incorporated by reference into, this report. |
SIGNATURES
Pursuant to the requirements of Section 13 or 15(d) of the Securities Exchange Act of 1934, the Registrant has duly caused this report to be signed on its behalf by the undersigned, thereunto duly authorized.
| | DOLLAR TREE, INC. |
| | |
| | |
| DATE: April 1, 2008 | By: /s/ Bob Sasser |
| | Bob Sasser |
| | President, Chief Executive Officer |
Pursuant to the requirements of the Securities Exchange Act of 1934, this report has been signed below by the following persons on behalf of the Registrant and in the capacities and on the dates indicated.
| Signature | Title | Date |
| | | |
| | | |
| /s/ Macon F. Brock, Jr. | | |
| Macon F. Brock, Jr. | Chairman; Director | April 1, 2008 |
| | | |
/s/ Bob Sasser | | |
| Bob Sasser | Director, President and | April 1, 2008 |
| | Chief Executive Officer | |
| | (principal executive officer) | |
| | | |
| /s/ Thomas A. Saunders, III | | |
| Thomas A. Saunders, III | Lead Director | April 1, 2008 |
| | | |
| /s/ J. Douglas Perry | | |
| J. Douglas Perry | Chairman Emeritus; Director | April 1, 2008 |
| | | |
| /s/ Arnold S. Barron | | |
| Arnold S. Barron | Director | April 1, 2008 |
| | | |
| /s/ Mary Anne Citrino | | |
| Mary Anne Citrino | Director | April 1, 2008 |
| | | |
| /s/ H. Ray Compton | | |
| H. Ray Compton | Director | April 1, 2008 |
| | | |
| /s/ Richard G. Lesser | | |
| Richard G. Lesser | Director | April 1, 2008 |
| | | |
| /s/ Lemuel E. Lewis | | |
| Lemuel E. Lewis | Director | April 1, 2008 |
| | | |
| /s/ Kathleen E. Mallas | | |
| Kathleen E. Mallas | Vice President, Controller | April 1, 2008 |
| | (principal financial and | |
| | accounting officer) | |
| | | |
| /s/ Eileen R. Scott | | |
| Eileen R. Scott | Director | April 1, 2008 |
| | | |
| /s/ Thomas E. Whiddon | | |
| Thomas E. Whiddon | Director | April 1, 2008 |
| | | |
| /s/ Alan L. Wurtzel | | |
| Alan L. Wurtzel | Director | April 1, 2008 |
| | | |
| /s/ Dr. Carl P. Zeithaml | | |
| Dr. Carl P. Zeithaml | Director | April 1, 2008 |
Index to Exhibits
3. Articles and Bylaws
| 3.1 | Articles of Incorporation of Dollar Tree, Inc. (Exhibit 3.1 to the Company’s February 27, 2008 Current Report on Form 8-K, incorporated herein by this reference) |
| | |
| 3.2 | Bylaws of Dollar Tree, Inc. (Exhibit 3.2 to the Company’s February 27, 2008 Current Report on Form 8-K, incorporated herein by this reference) |
| | |
10. Material Contracts
| 10.1 | Third Amendment to the Company's 2003 Non-Employee Director Stock Option Plan and the Sixth Amendment to the Company's Stock Incentive Plan (filed herewith) |
| | |
| 10.2 | New policy for director compensation (as described in Item 1.01 of the Company's January 16, 2008 Current Report on Form 8-K, incorporated herein by this reference) |
| | |
| 10.3 | Salary and bonus arrangements for the Company’s executive officers for fiscal 2007 (as described in Item 1.01 of the Company’s March 14, 2007 Current Report on Form 8-K, incorporated herein by this reference) |
| | |
| 10.4 | Second Amendment to the Company's 2004 Executive Officer Equity Plan (Exhibit 10.1 to the Company’s January 16, 2008 Current Report on Form 8-K, incorporated herein by this reference) |
| | |
| 10.5 | Second Amendment to the Company's 2003 Equity Incentive Plan (Exhibit 10.2 to the Company’s January 16, 2008 Current Report on Form 8-K, incorporated herein by this reference) |
| | |
| 10.6 | Second Amendment to the Company's 2003 Director Deferred Compensation Plan (Exhibit 10.3 to the Company’s January 16, 2008 Current Report on Form 8-K, incorporated herein by this reference) |
| | |
| 10.7 | Fourth Amendment to the Company's Stock Incentive Plan (Exhibit 10.4 to the Company’s January 16, 2008 Current Report on Form 8-K, incorporated herein by this reference) |
| | |
| 10.8 | Amendments to the Company's Stock Plans (Exhibit 10.5 to the Company’s January 16, 2008 Current Report on Form 8-K, incorporated herein by this reference) |
| | |
| 10.9 | Termination of Change in Control Retention Agreement with Kent A. Kleeberger, Chief Financial Officer (as described in Item 1.02 of the Company’s October 16, 2007 Report on Form 8-K, incorporated herein by this reference) |
| | |
| 10.10 | Accelerated Share Repurchase Program Collared Master Confirmation dated August 30, 2007 (Exhibit 10.1 to the Company’s Quarterly Report on Form 10-Q for the fiscal quarter ended August 4, 2007, incorporated herein by this reference) |
| | |
| 10.11 | Accelerated Share Repurchase Program Collared Supplemental Confirmation dated August 30, 2007 (Exhibit 10.2 to the Company’s Quarterly Report on Form 10-Q for the fiscal quarter ended August 4, 2007, incorporated herein by this reference) |
| | |
| 10.12 | Post-Retirement Benefit Agreement Between the Company and H. Ray Compton dated June 21, 2007 (Exhibit 10.3 to the Company’s Quarterly Report on Form 10-Q for the fiscal quarter ended August 4, 2007, incorporated herein by this reference) |
| | |
| 10.13 | March 29, 2007 Accelerated Share Repurchase Program (as described in Item 1.01 of the Company’s March 29, 2007 Report on Form 8-K, incorporated herein by this reference) |
| | |
| 10.14 | Change in Control Retention Agreements (Exhibit 10.1 to the Company’s March 14, 2007 Report on Form 8-K, incorporated herein by this reference) |
21. Subsidiaries of the Registrant
23. Consents of Experts and Counsel
| 23.1 | Consent of Independent Registered Public Accounting Firm |
| 31. | Certifications required under Section 302 of the Sarbanes-Oxley Act |
| 31.1 | Certification required under Section 302 of the Sarbanes-Oxley Act of Chief Executive Officer |
| | |
| 31.2 | Certification required under Section 302 of the Sarbanes-Oxley Act of Principal Financial Officer |
| 32. | Statements under Section 906 of the Sarbanes-Oxley Act |
| 32.1 | Statement under Section 906 of the Sarbanes-Oxley Act of Chief Executive Officer |
| | |
| 32.2 | Statement under Section 906 of the Sarbanes-Oxley Act of Principal Financial Officer |