No matters were submitted to a vote of security holders during the fourth quarter of our 2008 fiscal year.
There was no share repurchase activity for the 13 weeks ended January 31, 2009. At January 31, 2009, we have approximately $453.7 million remaining under Board authorization.
We anticipate that substantially all of our cash flow from operations in the foreseeable future will be retained for the development and expansion of our business, the repayment of indebtedness and, as authorized by our Board of Directors, the repurchase of stock. Management does not anticipate paying dividends on our common stock in the foreseeable future.
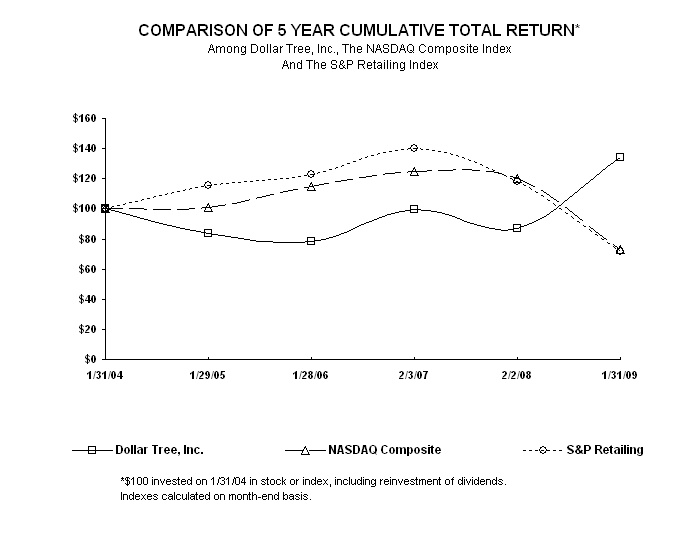
The following graph sets forth the yearly percentage change in the cumulative total shareholder return on our common stock during the five fiscal years ended January 31, 2009, compared with the cumulative total returns of the NASDAQ Composite Index and the S&P Retailing Index. The comparison assumes that $100 was invested in our common stock on January 31, 2004, and, in each of the foregoing indices on January 31, 2004, and that dividends were reinvested.
The following table presents a summary of our selected financial data for the fiscal years ended January 31, 2009, February 2, 2008, February 3, 2007, January 28, 2006, and January 29, 2005. Fiscal 2006 included 53 weeks, commensurate with the retail calendar, while all other fiscal years reported in the table contain 52 weeks. The selected income statement and balance sheet data have been derived from our consolidated financial statements that have been audited by our independent registered public accounting firm. This information should be read in conjunction with the consolidated financial statements and related notes, "Management’s Discussion and Analysis of Financial Condition and Results of Operations" and our financial information found elsewhere in this report.
Comparable store net sales compare net sales for stores open throughout each of the two periods being compared, including expanded stores. Net sales per store and net sales per selling square foot are calculated for stores open throughout the period presented.
Amounts in the following tables are in millions, except per share data, number of stores data, net sales per selling square foot data and inventory turns.
| | | Years Ended | |
| | | January 31, | | | February 2, | | | February 3, | | | January 28, | | | January 29, | |
| | | 2009 | | | 2008 | | | 2007 | | | 2006 | | | 2005 | |
| Income Statement Data: | | | | | | | | | | | | | | | |
| Net sales | | $ | 4,644.9 | | | $ | 4,242.6 | | | $ | 3,969.4 | | | $ | 3,393.9 | | | $ | 3,126.0 | |
| Gross profit | | | 1,592.2 | | | | 1,461.1 | | | | 1,357.2 | | | | 1,172.4 | | | | 1,112.5 | |
| Selling, general and administrative expenses | | | 1,226.4 | | | | 1,130.8 | | | | 1,046.4 | | | | 888.5 | | | | 819.0 | |
| Operating income | | | 365.8 | | | | 330.3 | | | | 310.8 | | | | 283.9 | | | | 293.5 | |
| Net income | | | 229.5 | | | | 201.3 | | | | 192.0 | | | | 173.9 | | | | 180.3 | |
| | | | | | | | | | | | | | | | | | | | | |
| Margin Data (as a percentage of net sales): | | | | | | | | | | | | | | | | | | | | |
| Gross profit | | | 34.3 | % | | | 34.4 | % | | | 34.2 | % | | | 34.5 | % | | | 35.6 | % |
| Selling, general and administrative expenses | | | 26.4 | % | | | 26.6 | % | | | 26.4 | % | | | 26.2 | % | | | 26.2 | % |
| Operating income | | | 7.9 | % | | | 7.8 | % | | | 7.8 | % | | | 8.3 | % | | | 9.4 | % |
| Net income | | | 4.9 | % | | | 4.7 | % | | | 4.8 | % | | | 5.1 | % | | | 5.8 | % |
| | | | | | | | | | | | | | | | | | | | | |
| Per Share Data: | | | | | | | | | | | | | | | | | | | | |
| | | | | | | | | | | | | | | | | | | | | |
| Diluted net income per share | | $ | 2.53 | | | $ | 2.09 | | | $ | 1.85 | | | $ | 1.60 | | | $ | 1.58 | |
| Diluted net income per share increase | | | 21.1 | % | | | 13.0 | % | | | 15.6 | % | | | 1.3 | % | | | 2.6 | % |
| | | As of | |
| | | January 31, | | | February 2, | | | February 3, | | | January 28, | | | January 29, | |
| | | 2009 | | | 2008 | | | 2007 | | | 2006 | | | 2005 | |
| Balance Sheet Data: | | | | | | | | | | | | | | | |
| Cash and cash equivalents | | | | | | | | | | | | | | | |
| and short-term investments | | $ | 364.4 | | | $ | 81.1 | | | $ | 306.8 | | | $ | 339.8 | | | $ | 317.8 | |
| Working capital | | | 663.3 | | | | 382.9 | | | | 575.7 | | | | 648.2 | | | | 675.5 | |
| Total assets | | | 2,035.7 | | | | 1,787.7 | | | | 1,882.2 | | | | 1,798.4 | | | | 1,792.7 | |
| Total debt, including capital lease obligations | | | 268.2 | | | | 269.4 | | | | 269.5 | | | | 269.9 | | | | 281.7 | |
| Shareholders' equity | | | 1,253.2 | | | | 988.4 | | | | 1,167.7 | | | | 1,172.3 | | | | 1,164.2 | |
| | | Years Ended |
| | | January 31, | | | February 2, | | | February 3, | | | January 28, | | | January 29, | |
| | | 2009 | | | 2008 | | | 2007 | | | 2006 | | | 2005 | |
| Selected Operating Data: | | | | | | | | | | | | | | | | | | | | |
| Number of stores open at end of period | | | 3,591 | | | | 3,411 | | | | 3,219 | | | | 2,914 | | | | 2,735 | |
| Gross square footage at end of period | | | 38.5 | | | | 36.1 | | | | 33.3 | | | | 29.2 | | | | 25.9 | |
| Selling square footage at end of period | | | 30.3 | | | | 28.4 | | | | 26.3 | | | | 23.0 | | | | 20.4 | |
| Selling square footage annual growth | | | 6.7 | % | | | 8.0 | % | | | 14.3 | % | | | 12.6 | % | | | 21.1 | % |
| Net sales annual growth | | | 9.5 | % | | | 6.9 | % | | | 16.9 | % | | | 8.6 | % | | | 11.6 | % |
| Comparable store net sales increase (decrease) | | | 4.1 | % | | | 2.7 | % | | | 4.6 | % | | | (0.8 | %) | | | 0.5 | % |
| Net sales per selling square foot | | $ | 158 | | | $ | 155 | | | $ | 161 | | | $ | 156 | | | $ | 168 | |
| Net sales per store | | $ | 1.3 | | | $ | 1.3 | | | $ | 1.3 | | | $ | 1.2 | | | $ | 1.2 | |
| Selected Financial Ratios: | | | | | | | | | | | | | | | | | | | | |
| Return on assets | | | 12.0 | % | | | 11.0 | % | | | 10.4 | % | | | 9.7 | % | | | 10.9 | % |
| Return on equity | | | 20.5 | % | | | 18.7 | % | | | 16.4 | % | | | 14.9 | % | | | 16.5 | % |
| Inventory turns | | | 3.8 | | | | 3.7 | | | | 3.5 | | | | 3.1 | | | | 2.9 | |
Item 7. MANAGEMENT’S DISCUSSION AND ANALYSIS OF FINANCIAL CONDITION AND RESULTS OF OPERATIONS
In Management’s Discussion and Analysis, we explain the general financial condition and the results of operations for our company, including:
| | |
· | what factors affect our business; |
| | |
· | what our net sales, earnings, gross margins and costs were in 2008, 2007 and 2006; |
| | |
· | why those net sales, earnings, gross margins and costs were different from the year before; |
| | |
· | how all of this affects our overall financial condition; |
| | |
· | what our expenditures for capital projects were in 2008 and 2007 and what we expect them to be in 2009; and |
| | |
· | where funds will come from to pay for future expenditures. |
As you read Management’s Discussion and Analysis, please refer to our consolidated financial statements, included in Item 8 of this Form 10-K, which present the results of operations for the fiscal years ended January 31, 2009, February 2, 2008 and February 3, 2007. In Management’s Discussion and Analysis, we analyze and explain the annual changes in some specific line items in the consolidated financial statements for the fiscal year 2008 compared to the comparable fiscal year 2007 and the fiscal year 2007 compared to the comparable fiscal year 2006.
Key Events and Recent Developments
Several key events have had or are expected to have a significant effect on our operations. You should keep in mind that:
· | On February 20, 2008, we entered into a five-year $550.0 million unsecured Credit Agreement (the Agreement). The Agreement provides for a $300.0 million revolving line of credit, including up to $150.0 million in available letters of credit, and a $250.0 million term loan. The interest rate on the facility will be based, at our option, on a LIBOR rate, plus a margin, or an alternate base rate, plus a margin. Our March 2004, $450.0 million unsecured revolving credit facility was terminated concurrent with entering into the Agreement. |
· | On March 2, 2008, we reorganized by creating a new holding company structure. The new parent company is Dollar Tree, Inc., replacing Dollar Tree Stores, Inc., which is now an operating subsidiary. |
· | On March 20, 2008, we entered into two $75.0 million interest rate swap agreements. These interest rate swaps are used to manage the risk associated with interest rate fluctuations on a portion of our $250.0 million variable rate term loan. |
· | In October 2007, our Board of Directors authorized the repurchase of an additional $500.0 million of our common stock. This authorization was in addition to the November 2006 authorization which had approximately $98.4 million remaining. At January 31, 2009, we had approximately $453.7 million remaining under Board authorizations. |
Overview
Our net sales are derived from the sale of merchandise. Two major factors tend to affect our net sales trends. First is our success at opening new stores or adding new stores through acquisitions. Second, sales vary at our existing stores from one year to the next. We refer to this change as a change in comparable store net sales, because we compare only those stores that are open throughout both of the periods being compared. We include sales from stores expanded during the year in the calculation of comparable store net sales, which has the effect of increasing our comparable store net sales. The term 'expanded' also includes stores that are relocated.
At January 31, 2009, we operated 3,591 stores in 48 states, with 30.3 million selling square feet compared to 3,411 stores with 28.4 million selling square feet at February 2, 2008. During fiscal 2008, we opened 231 stores, expanded 86 stores and closed 51 stores, compared to 240 new stores opened, 102 stores expanded and 48 stores closed during fiscal 2007. In the current year we increased our selling square footage by 6.7%. Of the 1.9 million selling square foot increase in 2008, 0.3 million was added by expanding existing stores. The average size of our stores opened in 2008 was approximately 8,100 selling square feet (or about 10,300 gross square feet). The average new store size decreased slightly in 2008 from approximately 8,500 selling square feet (or about 10,800 gross square feet) for new stores in 2007. For 2009, we continue to plan to open stores that are approximately 8,000 - 10,000 selling square feet (or about 10,000 - 12,000 gross square feet). We believe that this store size is our optimal size operationally and that this size also gives our customers an ideal shopping environment that invites them to shop longer and buy more. We expect the majority of our future net sales growth to come from the square footage growth resulting from new store openings and expansion of existing stores.
Fiscal 2006 ended on February 3, 2007 and included 53 weeks, commensurate with the retail calendar. The 53rd week in 2006 added approximately $70 million in sales. Fiscal 2008 and 2007 ended on January 31, 2009 and February 2, 2008, respectively, and both years included 52 weeks.
In fiscal 2008, comparable store net sales increased by 4.1%. The comparable store net sales increase was the result of increases of 3.7% in the number of transactions and a 0.4% increase in average transaction size. We believe comparable store net sales continue to be positively affected by a number of our initiatives, including expansion of forms of payment accepted by our stores and the roll-out of freezers and coolers to more of our stores. At January 31, 2009 we had frozen and refrigerated merchandise in approximately 1,200 stores compared to approximately 1,100 stores at February 2, 2008. We believe that this enables us to increase sales and earnings by increasing the number of shopping trips made by our customers and increasing the average transaction size. In addition, we now accept food stamps in approximately 2,200 qualified stores compared to 1,000 at the end of 2007. Beginning October 31, 2007, all of our stores accept Visa credit which has had a positive impact on our sales for fiscal 2008.
With the pressures of the current economic environment, we have seen an increase in the demand for basic, consumable merchandise in 2008. As a result, we have shifted the mix of inventory carried in our stores to more consumer product merchandise which we believe increases the traffic in our stores and has helped to increase our sales even during the current economic downturn. This shift has negatively impacted our margins in 2008, and we believe that this increase in basic, consumer product merchandise will negatively impact our margins in the first half of 2009.
Our point-of-sale technology provides us with valuable sales and inventory information to assist our buyers and improve our merchandise allocation to our stores. We believe that this has enabled us to better manage our inventory flow resulting in more efficient distribution and store operations and increased inventory turnover for each of the last two years. Inventory turnover improved by approximately 5 basis points in 2008 compared to 2007 and by approximately 25 basis points in 2007 compared to 2006. Fiscal 2008 was the fourth consecutive year of increased inventory turnover. Inventory per selling square foot also decreased 1.2% at January 31, 2009 compared to February 2, 2008.
On May 25, 2007, legislation was enacted that increased the Federal Minimum Wage from $5.15 an hour to $7.25 an hour by July 2009. As a result, our wages will increase in 2009; however, we believe that we can partially offset the increase in payroll costs through increased store productivity and continued efficiencies in product flow to our stores.
We must continue to control our merchandise costs, inventory levels and our general and administrative expenses. Increases in these line items could negatively impact our operating results.
On March 25, 2006, we completed our acquisition of 138 Deal$ stores, which included stores that offered an expanded assortment of merchandise including items that sell for more than $1. Most of these stores continue to operate under the Deal$ banner while providing us an opportunity to leverage our Dollar Tree infrastructure in the testing of new merchandise concepts, including higher price points, without disrupting the single-price point model in our Dollar Tree stores. We have opened new Deal$ stores, including some in new markets, and as of January 31, 2009, we have 143 stores under the Deal$ banner that are selling most items for $1 or less but also sell items for more than $1, compared to 131 stores at February 2, 2008.
Results of Operations
The following table expresses items from our consolidated statements of operations, as a percentage of net sales:
| | | Year Ended | | | Year Ended | | | Year Ended | |
| | | January 31, | | | February 2, | | | February 3, | |
| | | 2009 | | | 2008 | | | 2007 | |
| | | | | | | | | | |
| Net sales | | | 100.0 | % | | | 100.0 | % | | | 100.0 | % |
| Cost of sales | | | 65.7 | % | | | 65.6 | % | | | 65.8 | % |
| Gross profit | | | 34.3 | % | | | 34.4 | % | | | 34.2 | % |
| | | | | | | | | | | | | |
| Selling, general and administrative | | | | | | | | | | | | |
| expenses | | | 26.4 | % | | | 26.6 | % | | | 26.4 | % |
| | | | | | | | | | | | | |
| Operating income | | | 7.9 | % | | | 7.8 | % | | | 7.8 | % |
| | | | | | | | | | | | | |
| Interest income | | | 0.0 | % | | | 0.1 | % | | | 0.2 | % |
| Interest expense | | | (0.2 | %) | | | (0.4 | %) | | | (0.4 | %) |
| | | | | | | | | | | | | |
| Income before income taxes | | | 7.7 | % | | | 7.5 | % | | | 7.6 | % |
| | | | | | | | | | | | | |
| Provision for income taxes | | | (2.8 | %) | | | (2.8 | %) | | | (2.8 | %) |
| | | | | | | | | | | | | |
| Net income | | | 4.9 | % | | | 4.7 | % | | | 4.8 | % |
Fiscal year ended January 31, 2009 compared to fiscal year ended February 2, 2008
Net Sales. Net sales increased 9.5%, or $402.3 million, in 2008 compared to 2007, resulting from sales in our new and expanded stores and a 4.1% increase in comparable store net sales. Comparable store net sales are positively affected by our expanded and relocated stores, which we include in the calculation, and, to a lesser extent, are negatively affected when we open new stores or expand stores near existing ones.
The following table summarizes the components of the changes in our store count for fiscal years ended January 31, 2009 and February 2, 2008.
| | | January 31, 2009 | | | February 2, 2008 | |
| | | | | | | |
| New stores | | | 227 | | | | 208 | |
| Acquired leases | | | 4 | | | | 32 | |
| Expanded or relocated stores | | | 86 | | | | 102 | |
| Closed stores | | | (51 | ) | | | (48 | ) |
Of the 1.9 million selling square foot increase in 2008 approximately 0.3 million was added by expanding existing stores.
Gross Profit. Gross profit margin decreased to 34.3% in 2008 compared to 34.4% in 2007. The decrease was primarily due to a 30 basis point increase in merchandise cost, including inbound freight, resulting from an increase in the sales mix of higher cost consumer product merchandise and higher diesel fuel costs compared with 2007. Partially offsetting this increase was a 20 basis point decrease in shrink expense due to favorable adjustments to shrink estimates based on actual inventory results during the year.
Selling, General and Administrative Expenses. Selling, general and administrative expenses, as a percentage of net sales, decreased to 26.4% for 2008 compared to 26.6% for 2007. The decrease is primarily due to the following:
· | Depreciation expense decreased 25 basis points primarily due to the leveraging associated with the comparable store net sales increase for the year. |
· | Payroll-related expenses decreased 10 basis points primarily as a result of lower field payroll costs as a percentage of sales, due to the leveraging from the comparable store net sales increase in 2008. |
· | Partially offsetting these decreases was an approximate 10 basis point increase in store operating costs due to increases in repairs and maintenance and utility costs in the current year. |
Operating Income. Due to the reasons discussed above, operating income margin was 7.9% in 2008 compared to 7.8% in 2007.
Income Taxes. Our effective tax rate was 36.1% in 2008 compared to 37.1% in 2007. The lower rate in the current year reflects the recognition of certain tax benefits in accordance with Financial Accounting Standards Board’s Financial Interpretation No. 48, Accounting for Uncertainty in Income Taxes (FIN 48), and a lower blended state tax rate resulting from the settlement of state tax audits in the current year which allowed us to release income tax reserves and accrue less interest expense on tax uncertainties in the current year. These benefits to the tax rate were partially offset by a reduction in tax-exempt interest income in the current year.
Fiscal year ended February 2, 2008 compared to fiscal year ended February 2, 2007
Net Sales. Net sales increased 6.9%, or $273.2 million, in 2007 compared to 2006, resulting primarily from sales in our new and expanded stores. Our sales increase was also impacted by a 2.7% increase in comparable store net sales for 2007. This increase is based on the comparable 52-weeks for both years. These increases were partially offset by an extra week of sales in 2006 due to the 53-week retail calendar for 2006. On a comparative 52-week basis, sales increased approximately 8.8% in 2007 compared to 2006. Comparable store net sales are positively affected by our expanded and relocated stores, which we include in the calculation, and, to a lesser extent, are negatively affected when we open new stores or expand stores near existing ones.
The following table summarizes the components of the changes in our store count for fiscal years ended February 2, 2008 and February 3, 2007.
| | | February 2, 2008 | | | February 3, 2007 | |
| | | | | | | |
| New stores | | | 208 | | | | 190 | |
| Deal$ acquisition | | | -- | | | | 138 | |
| Acquired leases | | | 32 | | | | 21 | |
| Expanded or relocated stores | | | 102 | | | | 85 | |
| Closed stores | | | (48 | ) | | | (44 | ) |
Of the 2.1 million selling square foot increase in 2007 approximately 0.4 million was added by expanding existing stores.
Gross Profit. Gross profit margin increased to 34.4% in 2007 compared to 34.2% in 2006. The increase was primarily due to a 50 basis point decrease in merchandise cost, including inbound freight, due to improved initial mark-up in many categories in 2007. This decrease was partially offset by a 40 basis point increase in occupancy costs due to the loss of leverage from the extra week of sales in 2006.
Selling, General and Administrative Expenses. Selling, general and administrative expenses, as a percentage of net sales, increased to 26.6% for 2007 compared to 26.4% for 2006. The increase is primarily due to the following:
· | Operating and corporate expenses increased approximately 25 basis points due to increased debit and credit fees resulting from increased debit transactions in 2007 and the rollout of VISA credit at October 31, 2007. Also, in 2006, we had approximately 10 basis points of income related to early lease terminations. |
· | Occupancy costs increased 15 basis points primarily due to increased repairs and maintenance costs in 2007. |
· | Partially offsetting these increases was an approximate 15 basis point decrease in depreciation expense due to the expiration of the depreciable life on much of the supply chain hardware and software placed in service in 2002. |
Operating Income. Due to the reasons discussed above, operating income margin was 7.8% in 2007 and 2006.
Income Taxes. Our effective tax rate was 37.1% in 2007 compared to 36.6% in 2006. The increase in the rate for 2007 reflects a reduction of tax-exempt interest income in the current year due to lower investment levels resulting from increased share repurchase activity and an increase in tax reserves in accordance with FIN 48. These increases more than offset a slight decrease in our net state tax rate.
Liquidity and Capital Resources
Our business requires capital to build and open new stores, expand our distribution network and operate existing stores. Our working capital requirements for existing stores are seasonal and usually reach their peak in September and October. Historically, we have satisfied our seasonal working capital requirements for existing stores and have funded our store opening and distribution network expansion programs from internally generated funds and borrowings under our credit facilities.
The following table compares cash-related information for the years ended January 31, 2009, February 2, 2008, and February 3, 2007:
| | | Year Ended | | | Year Ended | | | Year Ended | |
| | | January 31, | | | February 2, | | | February 3, | |
| (in millions) | | 2009 | | | 2008 | | | 2007 | |
| Net cash provided by (used in): | | | | | | | | | |
| Operating activities | | $ | 403.1 | | | $ | 367.3 | | | $ | 412.8 | |
| Investing activities | | | (102.0 | ) | | | (22.7 | ) | | | (190.7 | ) |
| Financing activities | | | 22.7 | | | | (389.0 | ) | | | (202.9 | ) |
Net cash provided by operating activities increased $35.8 million compared to last year due to increased earnings before income taxes, depreciation and amortization in the current year and lower prepaid rent amounts at the end of January 2009. February 2008 rent payments were made prior to the end of fiscal 2007 which resulted in a prepaid asset in fiscal 2007 whereas February 2009 rent was paid in fiscal 2009.
Net cash provided by operating activities decreased $45.5 million in 2007 compared to 2006 due to increased working capital requirements in 2007 and increases in the provision for deferred taxes, partially offset by improved earnings before depreciation and amortization in 2007.
Net cash used in investing activities increased $79.3 million in the current year. Net proceeds from the sale of short-term investments were higher in the prior year in order to fund share repurchases. Overall, short-term investment activity has decreased in the current year resulting from the liquidation of our short-term investments early in the current year due to market conditions. These amounts were primarily invested in cash equivalent money market accounts. Partially offsetting the decrease in net proceeds from the sales of short-term investments was higher capital expenditures ($57.7 million higher) in the prior year due to the expansions of the Briar Creek distribution center and corporate headquarters.
Net cash used in investing activities decreased $168.0 million in 2007 compared to 2006. This decrease is due to $129.1 million of increased proceeds from short-term investment activity in 2007 to fund increased share repurchases and $54.1 million used in 2006 to acquire Deal$ assets. These were partially offset by increased capital expenditures in 2007 resulting from the Briar Creek distribution center and the corporate headquarters expansions.
In the current year, financing activities provided cash of $22.7 million as a result of stock option exercises and employee stock plan purchases. In the prior year, net cash used in financing activities was $389.0 million. This was the result of share repurchases of $473.0 million for fiscal 2007, partially offset by stock option exercises resulting from the Company’s stock price last year being higher than it had been in the prior several years.
Net cash used in financing activities increased $186.1 million in 2007 due primarily to increased share repurchases in 2007 partially offset by increased proceeds from stock option exercises in 2007 resulting from the Company’s higher stock price earlier in the year.
At January 31, 2009, our long-term borrowings were $267.6 million and our capital lease commitments were $0.6 million. We also have $121.5 million and $50.0 million Letter of Credit Reimbursement and Security Agreements, under which approximately $97.8 million were committed to letters of credit issued for routine purchases of imported merchandise at January 31, 2009.
On February 20, 2008, we entered into a five-year $550.0 million unsecured Credit Agreement (the Agreement). The Agreement provides for a $300.0 million revolving line of credit, including up to $150.0 million in available letters of credit, and a $250.0 million term loan. The interest rate on the Agreement is based, at our option, on a LIBOR rate, plus a margin, or an alternate base rate, plus a margin. The revolving line of credit also bears a facilities fee, calculated as a percentage, as defined, of the amount available under the line of credit, payable quarterly. The term loan is due and payable in full at the five year maturity date of the Agreement. The Agreement also bears an administrative fee payable annually. The Agreement, among other things, requires the maintenance of certain specified financial ratios, restricts the payment of certain distributions and prohibits the incurrence of certain new indebtedness. Our March 2004, $450.0 million unsecured revolving credit facility was terminated concurrent with entering into the Agreement. As of January 31, 2009, the $250.0 million term loan is outstanding under the Agreement.
In March 2005, our Board of Directors authorized the repurchase of up to $300.0 million of our common stock through March 2008. In November 2006, our Board of Directors authorized the repurchase of up to $500.0 million of our common stock. This amount was in addition to the $27.0 million remaining on the March 2005 authorization. Then, in October 2007, our Board of Directors authorized the repurchase of an additional $500.0 million of our common stock. This authorization was in addition to the November 2006 authorization which had approximately $98.4 million remaining at the time.
We repurchased approximately 12.8 million shares for approximately $473.0 million in fiscal 2007 and approximately 8.8 million shares for approximately $248.2 million in fiscal 2006. We had no share repurchases in fiscal 2008. At January 31, 2009, we have approximately $453.7 million remaining under Board authorization.
Overview
We expect our cash needs for opening new stores and expanding existing stores in fiscal 2009 to total approximately $138.1 million, which includes capital expenditures, initial inventory and pre-opening costs. Our estimated capital expenditures for fiscal 2009 are between $135.0 and $145.0 million, including planned expenditures for our new and expanded stores and the addition of freezers and coolers to approximately 175 stores. We believe that we can adequately fund our working capital requirements and planned capital expenditures for the next few years from net cash provided by operations and potential borrowings under our existing credit facility.
The following tables summarize our material contractual obligations at January 31, 2009, including both on- and off-balance sheet arrangements, and our commitments, including interest on long-term borrowings (in millions):
| Contractual Obligations | | Total | | | 2009 | | | 2010 | | | 2011 | | | 2012 | | | 2013 | | | Thereafter | |
| Lease Financing | | | | | | | | | | | | | | | | | | | | | |
| Operating lease obligations | | $ | 1,439.4 | | | $ | 348.1 | | | $ | 304.6 | | | $ | 251.4 | | | $ | 194.8 | | | $ | 130.1 | | | $ | 210.4 | |
| Capital lease obligations | | | 0.6 | | | | 0.2 | | | | 0.2 | | | | 0.1 | | | | 0.1 | | | | -- | | | | -- | |
| | | | | | | | | | | | | | | | | | | | | | | | | | | | | |
| Long-term Borrowings | | | | | | | | | | | | | | | | | | | | | | | | | | | | |
| Credit Agreement | | | 250.0 | | | | -- | | | | -- | | | | -- | | | | -- | | | | 250.0 | | | | -- | |
| Revenue bond financing | | | 17.6 | | | | 17.6 | | | | -- | | | | -- | | | | -- | | | | -- | | | | -- | |
| Interest on long-term borrowings | | | 12.6 | | | | 3.3 | | | | 3.0 | | | | 3.0 | | | | 3.0 | | | | 0.3 | | | | -- | |
| Total obligations | | $ | 1,720.2 | | | $ | 369.2 | | | $ | 307.8 | | | $ | 254.5 | | | $ | 197.9 | | | $ | 380.4 | | | $ | 210.4 | |
| Commitments | | Total | | | Expiring in 2009 | | | Expiring in 2010 | | | Expiring in 2011 | | | Expiring in 2012 | | | Expiring in 2013 | | | Thereafter | |
| | | | | | | | | | | | | | | | | | | | | | |
| Letters of credit and surety bonds | | $ | 124.3 | | | $ | 124.3 | | | $ | -- | | | $ | -- | | | $ | -- | | | $ | -- | | | $ | -- | |
| Freight contracts | | | 109.6 | | | | 86.6 | | | | 15.6 | | | | 4.4 | | | | 3.0 | | | | -- | | | | -- | |
| Technology assets | | | 3.2 | | | | 3.2 | | | | -- | | | | -- | | | | -- | | | | -- | | | | -- | |
| Total commitments | | $ | 237.1 | | | $ | 214.1 | | | $ | 15.6 | | | $ | 4.4 | | | $ | 3.0 | | | $ | -- | | | $ | -- | |
Lease Financing
Operating Lease Obligations. Our operating lease obligations are primarily for payments under noncancelable store leases. The commitment includes amounts for leases that were signed prior to January 31, 2009 for stores that were not yet open on January 31, 2009.
Capital Lease Obligations. Our capital lease obligations are primarily for distribution center equipment and computer equipment at the store support center.
Credit Agreement. On February 20, 2008, we entered into a five-year $550.0 million unsecured Credit Agreement (the Agreement). The Agreement provides for a $300.0 million revolving line of credit, including up to $150.0 million in available letters of credit, and a $250.0 million term loan. The interest rate on the facility will be based, at our option, on a LIBOR rate, plus a margin, or an alternate base rate, plus a margin. This rate was 1.21% at January 31, 2009. The revolving line of credit also bears a facilities fee, calculated as a percentage, as defined, of the amount available under the line of credit, payable quarterly. The term loan is due and payable in full at the five year maturity date of the Agreement. The Agreement also bears an administrative fee payable annually. The Agreement, among other things, requires the maintenance of certain specified financial ratios, restricts the payment of certain distributions and prohibits the incurrence of certain new indebtedness. As of January 31, 2009, we had $250.0 million outstanding on the Agreement. Our March 2004, $450.0 million unsecured revolving credit facility was terminated concurrent with entering into the Agreement.
Revenue Bond Financing. In May 1998, we entered into an agreement with the Mississippi Business Finance Corporation under which it issued $19.0 million of variable-rate demand revenue bonds. We used the proceeds from the bonds to finance the acquisition, construction and installation of land, buildings, machinery and equipment for our distribution facility in Olive Branch, Mississippi. At January 31, 2009, the balance outstanding on the bonds was $17.6 million. These bonds are due to be fully repaid in June 2018. The bonds do not have a prepayment penalty as long as the interest rate remains variable. The bonds contain a demand provision and, therefore, outstanding amounts are classified as current liabilities. We pay interest monthly based on a variable interest rate, which was 1.50% at January 31, 2009.
Interest on Long-term Borrowings. This amount represents interest payments on the Credit Agreement and the revenue bond financing using the interest rates for each at January 31, 2009.
Commitments
Letters of Credit and Surety Bonds. In March 2001, we entered into a Letter of Credit Reimbursement and Security Agreement, which provides $121.5 million for letters of credit. In December 2004, we entered into an additional Letter of Credit Reimbursement and Security Agreement, which provides $50.0 million for letters of credit. Letters of credit are generally issued for the routine purchase of imported merchandise and we had approximately $97.8 million of purchases committed under these letters of credit at January 31, 2009.
We also have approximately $26.5 million of letters of credit or surety bonds outstanding for our self-insurance programs and certain utility payment obligations at some of our stores.
Freight Contracts. We have contracted outbound freight services from various carriers with contracts expiring through February 2013. The total amount of these commitments is approximately $109.6 million.
Technology Assets. We have commitments totaling approximately $3.2 million to primarily purchase store technology assets for our stores during 2009.
Derivative Financial Instruments
On March 20, 2008, we entered into two $75.0 million interest rate swap agreements. These interest rate swaps are used to manage the risk associated with interest rate fluctuations on a portion of our $250.0 million variable rate term loan. Under these agreements, we pay interest to financial institutions at a fixed rate of 2.8%. In exchange, the financial institutions pay us at a variable rate, which approximates the variable rate on the debt, excluding the credit spread. These swaps qualify for hedge accounting treatment pursuant to SFAS No. 133, Accounting for Derivative Instruments and Hedging Activities. These swaps expire in March 2011.
We are party to one additional interest rate swap, which allows us to manage the risk associated with interest rate fluctuations on the demand revenue bonds. The swap is based on a notional amount of $17.6 million. Under the $17.6 million agreement, as amended, we pay interest to the bank that provided the swap at a fixed rate. In exchange, the financial institution pays us at a variable-interest rate, which is similar to the rate on the demand revenue bonds. The variable-interest rate on the interest rate swap is set monthly. No payments are made by either party under the swap for monthly periods with an established interest rate greater than a predetermined rate (the knock-out rate). The swap may be canceled by the bank or us and settled for the fair value of the swap as determined by market rates and expires in 2009.
Critical Accounting Policies
The preparation of financial statements requires the use of estimates. Certain of our estimates require a high level of judgment and have the potential to have a material effect on the financial statements if actual results vary significantly from those estimates. Following is a discussion of the estimates that we consider critical.
Inventory Valuation
As discussed in Note 1 to the Consolidated Financial Statements, inventories at the distribution centers are stated at the lower of cost or market with cost determined on a weighted-average basis. Cost is assigned to store inventories using the retail inventory method on a weighted-average basis. Under the retail inventory method, the valuation of inventories at cost and the resulting gross margins are computed by applying a calculated cost-to-retail ratio to the retail value of inventories. The retail inventory method is an averaging method that has been widely used in the retail industry and results in valuing inventories at lower of cost or market when markdowns are taken as a reduction of the retail value of inventories on a timely basis.
Inventory valuation methods require certain significant management estimates and judgments, including estimates of future merchandise markdowns and shrink, which significantly affect the ending inventory valuation at cost as well as the resulting gross margins. The averaging required in applying the retail inventory method and the estimates of shrink and markdowns could, under certain circumstances, result in costs not being recorded in the proper period.
We estimate our markdown reserve based on the consideration of a variety of factors, including, but not limited to, quantities of slow moving or seasonal, carryover merchandise on hand, historical markdown statistics and future merchandising plans. The accuracy of our estimates can be affected by many factors, some of which are outside of our control, including changes in economic conditions and consumer buying trends. Historically, we have not experienced significant differences in our estimated reserve for markdowns compared with actual results.
Our accrual for shrink is based on the actual, historical shrink results of our most recent physical inventories adjusted, if necessary, for current economic conditions. These estimates are compared to actual results as physical inventory counts are taken and reconciled to the general ledger. Our physical inventory counts are generally taken between January and September of each year; therefore, the shrink accrual recorded at January 31, 2009 is based on estimated shrink for most of 2008, including the fourth quarter. We have not experienced significant fluctuations in historical shrink rates beyond approximately 10-20 basis points in our Dollar Tree stores for the last few years. However, we have sometimes experienced higher than typical shrink in acquired stores in the year following an acquisition. We periodically adjust our shrink estimates to address these factors as they become apparent.
Our management believes that our application of the retail inventory method results in an inventory valuation that reasonably approximates cost and results in carrying inventory at the lower of cost or market each year on a consistent basis.
Accrued Expenses
On a monthly basis, we estimate certain expenses in an effort to record those expenses in the period incurred. Our most material estimates include domestic freight expenses, self-insurance programs, store-level operating expenses, such as property taxes and utilities, and certain other expenses. Our freight and store-level operating expenses are estimated based on current activity and historical trends and results. Our workers' compensation and general liability insurance accruals are recorded based on actuarial valuations which are adjusted at least annually based on a review performed by a third-party actuary. These actuarial valuations are estimates based on our historical loss development factors. Certain other expenses are estimated and recorded in the periods that management becomes aware of them. The related accruals are adjusted as management’s estimates change. Differences in management's estimates and assumptions could result in an accrual materially different from the calculated accrual. Our experience has been that some of our estimates are too high and others are too low. Historically, the net total of these differences has not had a material effect on our financial condition or results of operations.
Income Taxes
On a quarterly basis, we estimate our required income tax liability and assess the recoverability of our deferred tax assets. Our income taxes payable are estimated based on enacted tax rates, including estimated tax rates in states where our store base is growing, applied to the income expected to be taxed currently. Management assesses the recoverability of deferred tax assets based on the availability of carrybacks of future deductible amounts and management’s projections for future taxable income. We cannot guarantee that we will generate taxable income in future years. Historically, we have not experienced significant differences in our estimates of our tax accrual.
In addition, we have a recorded liability for our estimate of uncertain tax positions taken or expected to be taken in our tax returns. Judgment is required in evaluating the application of federal and state tax laws, including relevant case law, and assessing whether it is more likely than not that a tax position will be sustained on examination and, if so, judgment is also required as to the measurement of the amount of tax benefit that will be realized upon settlement with the taxing authority. Income tax expense is adjusted in the period in which new information about a tax position becomes available or the final outcome differs from the amounts recorded. We believe that our liability for uncertain tax positions is adequate. For further discussion of our changes in reserves during 2008, see Item 8 “Financial Statements and Supplementary Data - Note 3 to the Consolidated Financial Statements” beginning on page 41 of this Form 10-K.
Seasonality and Quarterly Fluctuations
We experience seasonal fluctuations in our net sales, comparable store net sales, operating income and net income and expect this trend to continue. Our results of operations may also fluctuate significantly as a result of a variety of factors, including:
| | |
· | Shifts in the timing of certain holidays, especially Easter; |
| | |
· | The timing of new store openings; |
| | |
· | The net sales contributed by new stores; |
| | |
· | Changes in our merchandise mix; and |
| | |
· | Competition. |
Our highest sales periods are the Christmas and Easter seasons. Easter was observed on April 8, 2007, March 23, 2008, and will be observed on April 12, 2009. We believe that the later Easter in 2009 could result in a $25.0 million increase in sales in the first quarter of 2009 as compared to the first quarter of 2008. We generally realize a disproportionate amount of our net sales and of our operating and net income during the fourth quarter. In anticipation of increased sales activity during these months, we purchase substantial amounts of inventory and hire a significant number of temporary employees to supplement our continuing store staff. Our operating results, particularly operating and net income, could suffer if our net sales were below seasonal norms during the fourth quarter or during the Easter season for any reason, including merchandise delivery delays due to receiving or distribution problems, consumer sentiment or inclement weather.
Our unaudited results of operations for the eight most recent quarters are shown in a table in Footnote 12 of the Consolidated Financial Statements in Item 8 of this Form 10-K.
Inflation and Other Economic Factors
Our ability to provide quality merchandise at a fixed price and on a profitable basis may be subject to economic factors and influences that we cannot control. Consumer spending could decline because of economic pressures, including unemployment and rising fuel prices. Reductions in consumer confidence and spending could have an adverse effect on our sales. National or international events, including war or terrorism, could lead to disruptions in economies in the United States or in foreign countries where we purchase some of our merchandise. These and other factors could increase our merchandise costs and other costs that are critical to our operations, such as shipping and wage rates.
Shipping Costs. Currently, trans-Pacific shipping rates are negotiated with individual freight lines and are subject to fluctuation based on supply and demand for containers and current fuel costs. We can give no assurances as to the final actual rates for 2009, as we are in the early stages of our negotiations.
Minimum Wage. On May 25, 2007, legislation was enacted that increased the Federal Minimum Wage from $5.15 an hour to $7.25 an hour by July 2009. As a result, our wages will increase in 2009; however, we believe that we can partially offset the increase in payroll costs through increased store productivity and continued efficiencies in product flow to our stores.
Item 7A. QUANTITATIVE AND QUALITATIVE DISCLOSURES ABOUT MARKET RISK
We are exposed to various types of market risk in the normal course of our business, including the impact of interest rate changes and foreign currency rate fluctuations. We may enter into interest rate swaps to manage exposure to interest rate changes, and we may employ other risk management strategies, including the use of foreign currency forward contracts. We do not enter into derivative instruments for any purpose other than cash flow hedging and we do not hold derivative instruments for trading purposes.
Interest Rate Risk
We use variable-rate debt to finance certain of our operations and capital improvements. These obligations expose us to variability in interest payments due to changes in interest rates. If interest rates increase, interest expense increases. Conversely, if interest rates decrease, interest expense also decreases. We believe it is beneficial to limit the variability of our interest payments.
To meet this objective, we entered into derivative instruments in the form of interest rate swaps to manage fluctuations in cash flows resulting from changes in the variable-interest rates on a portion of our $250.0 million term loan and on our Demand Revenue Bonds. The interest rate swaps reduce the interest rate exposure on these variable-rate obligations. Under the interest rate swaps, we pay the bank at a fixed-rate and receive variable-interest at a rate approximating the variable-rate on the obligation, thereby creating the economic equivalent of a fixed-rate obligation. We entered into two $75.0 million interest rate swap agreements in March 2008 to manage the risk associated with the interest rate fluctuations on a portion of our $250.0 million variable rate term loan and we have an additional $17.6 million interest rate swap to manage the risk associated with the interest rate fluctuations on our Demand Revenue Bonds. Under this $17.6 million swap, no payments are made by parties under the swap for monthly periods in which the variable-interest rate is greater than the predetermined knock-out rate.
The following table summarizes the financial terms of our interest rate swap agreements and the fair value of the interest rate swaps at January 31, 2009:
| Hedging Instrument | Receive Variable | Pay Fixed | Knock-out Rate | Expiration | Fair Value |
| Two $75.0 million interest rate swaps | LIBOR | 2.80% | N/A | 3/31/11 | ($4.4 million) |
| $17.6 million interest rate swap | LIBOR | 4.88% | 7.75% | 4/1/09 | ($0.1 million) |
Hypothetically, a 1% change in interest rates results in an approximate $1.7 million change in the amount paid or received under the terms of the interest rate swap agreement on an annual basis. Due to many factors, management is not able to predict the changes in the fair values of our interest rate swaps. These fair values are obtained from our outside financial institutions.
Item 8. FINANCIAL STATEMENTS AND SUPPLEMENTARY DATA
| Index to Consolidated Financial Statements | Page |
| | |
| 31 |
| | |
| |
| January 31, 2009, February 2, 2008 and February 3, 2007 | 31 |
| | |
| |
| February 2, 2008 | 33 |
| | |
| |
| for the years ended January 31, 2009, February 2, 2008 and | |
| February 3, 2007 | 34 |
| | |
| |
| January 31, 2009, February 2, 2008 and February 3, 2007 | 35 |
| | |
| 36 |
The Board of Directors and Shareholders
Dollar Tree, Inc.:
We have audited the accompanying consolidated balance sheets of Dollar Tree, Inc. and subsidiaries (the Company) as of January 31, 2009 and February 2, 2008, and the related consolidated statements of operations, shareholders’ equity and comprehensive income, and cash flows for each of the fiscal years in the three-year period ended January 31, 2009. These consolidated financial statements are the responsibility of the Company’s management. Our responsibility is to express an opinion on these consolidated financial statements based on our audits.
We conducted our audits in accordance with the standards of the Public Company Accounting Oversight Board (United States). Those standards require that we plan and perform the audit to obtain reasonable assurance about whether the financial statements are free of material misstatement. An audit includes examining, on a test basis, evidence supporting the amounts and disclosures in the financial statements. An audit also includes assessing the accounting principles used and significant estimates made by management, as well as evaluating the overall financial statement presentation. We believe that our audits provide a reasonable basis for our opinion.
In our opinion, the consolidated financial statements referred to above present fairly, in all material respects, the financial position of the Company as of January 31, 2009 and February 2, 2008, and the results of their operations and their cash flows for each of the years in the three-year period ended January 31, 2009, in conformity with U.S. generally accepted accounting principles.
As discussed in note 1 to the consolidated financial statements, the Company adopted Financial Accounting Standards Board Interpretation No. 48, Accounting for Uncertainty in Income Taxes, effective February 4, 2007.
We also have audited, in accordance with the standards of the Public Company Accounting Oversight Board (United States), Dollar Tree, Inc.’s internal control over financial reporting as of January 31, 2009, based on criteria established in Internal Control – Integrated Framework issued by the Committee of Sponsoring Organizations of the Treadway Commission (COSO), and our report dated March 26, 2009 expressed an unqualified opinion on the effectiveness of the Company’s internal control over financial reporting.
/s/ KPMG LLP
Norfolk, Virginia
March 26, 2009
DOLLAR TREE, INC.
AND SUBSIDIARIES
| | | Year Ended | | | Year Ended | | | Year Ended | |
| | | January 31, | | | February 2, | | | February 3, | |
| (In millions, except per share data) | | 2009 | | | 2008 | | | 2007 | |
| Net sales | | $ | 4,644.9 | | | $ | 4,242.6 | | | $ | 3,969.4 | |
| | | 3,052.7 | | | | 2,781.5 | | | | 2,612.2 | |
| Gross profit | | | 1,592.2 | | | | 1,461.1 | | | | 1,357.2 | |
| | | | | | | | | | | | | |
| Selling, general and administrative | | | | | | | | | | | | |
expenses (Notes 4, 8 and 9) | | | 1,226.4 | | | | 1,130.8 | | | | 1,046.4 | |
| | | | | | | | | | | | | |
| Operating income | | | 365.8 | | | | 330.3 | | | | 310.8 | |
| | | | | | | | | | | | | |
| Interest income | | | 2.6 | | | | 6.7 | | | | 8.6 | |
Interest expense (Notes 5 and 6) | | | (9.3 | ) | | | (17.2 | ) | | | (16.5 | ) |
| | | | | | | | | | | | | |
| Income before income taxes | | | 359.1 | | | | 319.8 | | | | 302.9 | |
| | | | | | | | | | | | | |
Provision for income taxes (Note 3) | | | 129.6 | | | | 118.5 | | | | 110.9 | |
| | | | | | | | | | | | | |
| Net income | | $ | 229.5 | | | $ | 201.3 | | | $ | 192.0 | |
| | | | | | | | | | | | | |
Basic net income per share (Note 7) | | $ | 2.54 | | | $ | 2.10 | | | $ | 1.86 | |
| | | | | | | | | | | | | |
Diluted net income per share (Note 7) | | $ | 2.53 | | | $ | 2.09 | | | $ | 1.85 | |
See accompanying Notes to Consolidated Financial Statements.
DOLLAR TREE, INC.
AND SUBSIDIARIES
CONSOLIDATED BALANCE SHEETS| (In millions, except share and per share data) | | January 31, 2009 | | | February 2, 2008 | |
| ASSETS | | | | | | |
| Current assets: | | | | | | |
| Cash and cash equivalents | | $ | 364.4 | | | $ | 40.6 | |
| Short-term investments | | | - | | | | 40.5 | |
| Merchandise inventories | | | 675.8 | | | | 641.2 | |
| | | 7.7 | | | | 17.3 | |
| Prepaid expenses and other current assets | | | 25.3 | | | | 49.2 | |
| Total current assets | | | 1,073.2 | | | | 788.8 | |
| | | | | | | | | |
Property, plant and equipment, net (Note 2) | | | 710.3 | | | | 743.6 | |
| | | 133.3 | | | | 133.3 | |
| | | 33.0 | | | | 38.7 | |
Other assets, net (Notes 8 and 11) | | | 85.9 | | | | 83.3 | |
| | | | | | | | | |
| TOTAL ASSETS | | $ | 2,035.7 | | | $ | 1,787.7 | |
| | | | | | | | | |
| LIABILITIES AND SHAREHOLDERS' EQUITY | | | | | | | | |
| Current liabilities: | | | | | | | | |
Current portion of long-term debt (Note 5) | | $ | 17.6 | | | $ | 18.5 | |
| Accounts payable | | | 192.9 | | | | 200.4 | |
Other current liabilities (Note 2) | | | 152.5 | | | | 143.6 | |
| | | 46.9 | | | | 43.4 | |
| Total current liabilities | | | 409.9 | | | | 405.9 | |
| | | | | | | | | |
Long-term debt, excluding current portion (Note 5) | | | 250.0 | | | | 250.0 | |
Income taxes payable, long-term (Note 3) | | | 14.7 | | | | 55.0 | |
Other liabilities (Notes 2, 6 and 8) | | | 107.9 | | | | 88.4 | |
| | | | | | | | | |
| Total liabilities | | | 782.5 | | | | 799.3 | |
| | | | | | | | | |
| Commitments, contingencies and | | | | | | | | |
| | | | | | | | |
| | | | | | | | | |
Shareholders' equity (Notes 6, 7 and 9): | | | | | | | | |
| Common stock, par value $0.01. 300,000,000 shares | | | | | | | | |
| authorized, 90,771,397 and 89,784,776 shares | | | | | | | | |
| issued and outstanding at January 31, 2009 | | | | | | | | |
| and February 2, 2008, respectively | | | 0.9 | | | | 0.9 | |
| Additional paid-in capital | | | 38.0 | | | | - | |
| Accumulated other comprehensive income (loss) | | | (2.6 | ) | | | 0.1 | |
| Retained earnings | | | 1,216.9 | | | | 987.4 | |
| Total shareholders' equity | | | 1,253.2 | | | | 988.4 | |
| | | | | | | | | |
| TOTAL LIABILITIES AND SHAREHOLDERS' EQUITY | | $ | 2,035.7 | | | $ | 1,787.7 | |
See accompanying Notes to Consolidated Financial Statements.
DOLLAR TREE, INC.
AND SUBSIDIARIES
YEARS ENDED JANUARY 31, 2009, FEBRUARY 2, 2008, AND FEBRUARY 3, 2007
| | | | | | | | | | | | Accumulated | | | | | | | |
| | | Common | | | | | | Additional | | | Other | | | | | | Share- | |
| | | Stock | | | Common | | | Paid-in | | | Comprehensive | | | Retained | | | holders' | |
| (in millions) | | Shares | | | Stock | | | Capital | | | Income (Loss) | | | Earnings | | | Equity | |
| | | | | | | | | | | | | | | | | | | |
| Balance at January 28, 2006 | | | 106.5 | | | $ | 1.1 | | | $ | 11.4 | | | $ | 0.1 | | | $ | 1,159.7 | | | $ | 1,172.3 | |
| | | | | | | | | | | | | | | | | | | | | | | | | |
| Net income for the year ended | | | | | | | | | | | | | | | | | | | | | | | | |
| February 3, 2007 | | | - | | | | - | | | | - | | | | - | | | | 192.0 | | | | 192.0 | |
| Other comprehensive income | | | - | | | | - | | | | - | | | | - | | | | - | | | | - | |
| Total comprehensive income | | | | | | | | | | | | | | | | | | | | | | | 192.0 | |
| Issuance of stock under Employee Stock | | | | | | | | | | | | | | | | | | | | | | | | |
| | | 0.1 | | | | - | | | | 2.8 | | | | - | | | | - | | | | 2.8 | |
| Exercise of stock options, including | | | | | | | | | | | | | | | | | | | | | | | | |
income tax benefit of $5.6 (Note 9) | | | 1.7 | | | | - | | | | 43.1 | | | | - | | | | - | | | | 43.1 | |
Repurchase and retirement of shares (Note 7) | | | (8.8 | ) | | | (0.1 | ) | | | (63.0 | ) | | | | | | | (185.1 | ) | | | (248.2 | ) |
Stock-based compensation, net (Notes 1 and 9) | | | 0.1 | | | | - | | | | 5.7 | | | | - | | | | - | | | | 5.7 | |
| Balance at February 3, 2007 | | | 99.6 | | | | 1.0 | | | | - | | | | 0.1 | | | | 1,166.6 | | | | 1,167.7 | |
| | | | | | | | | | | | | | | | | | | | | | | | | |
| Net income for the year ended | | | | | | | | | | | | | | | | | | | | | | | | |
| February 2, 2008 | | | - | | | | - | | | | - | | | | - | | | | 201.3 | | | | 201.3 | |
| Other comprehensive income | | | - | | | | - | | | | - | | | | - | | | | - | | | | - | |
| Total comprehensive income | | | | | | | | | | | | | | | | | | | | | | | 201.3 | |
| | | - | | | | - | | | | - | | | | - | | | | (0.6 | ) | | | (0.6 | ) |
| Issuance of stock under Employee Stock | | | | | | | | | | | | | | | | | | | | | | | | |
| | | 0.1 | | | | - | | | | - | | | | - | | | | 3.5 | | | | 3.5 | |
| Exercise of stock options, including | | | | | | | | | | | | | | | | | | | | | | | | |
income tax benefit of $13.0 (Note 9) | | | 2.7 | | | | - | | | | - | | | | - | | | | 81.1 | | | | 81.1 | |
Repurchase and retirement of shares (Note 7) | | | (12.8 | ) | | | (0.1 | ) | | | - | | | | | | | | (472.9 | ) | | | (473.0 | ) |
Stock-based compensation, net (Notes 1 and 9) | | | 0.2 | | | | - | | | | - | | | | - | | | | 8.4 | | | | 8.4 | |
| Balance at February 2,2008 | | | 89.8 | | | | 0.9 | | | | - | | | | 0.1 | | | | 987.4 | | | | 988.4 | |
| | | | | | | | | | | | | | | | | | | | | | | | | |
| Net income for the year ended | | | | | | | | | | | | | | | | | | | | | | | | |
| January 31, 2009 | | | - | | | | - | | | | - | | | | - | | | | 229.5 | | | | 229.5 | |
| Other comprehensive loss, net of income tax | | | | | | | | | | | | | | | | | | | | | | | | |
| benefit of $1.7 | | | - | | | | - | | | | - | | | | (2.7 | ) | | | - | | | | (2.7 | ) |
| Total comprehensive income | | | | | | | | | | | | | | | | | | | | | | | 226.8 | |
| Issuance of stock under Employee Stock | | | | | | | | | | | | | | | | | | | | | | | | |
| | | 0.1 | | | | - | | | | 3.6 | | | | - | | | | - | | | | 3.6 | |
| Exercise of stock options, including | | | | | | | | | | | | | | | | | | | | | | | | |
income tax benefit of $2.3 (Note 9) | | | 0.7 | | | | - | | | | 20.3 | | | | - | | | | - | | | | 20.3 | |
Stock-based compensation, net (Notes 1 and 9) | | | 0.2 | | | | - | | | | 14.1 | | | | - | | | | - | | | | 14.1 | |
| Balance at January 31, 2009 | | | 90.8 | | | $ | 0.9 | | | $ | 38.0 | | | $ | (2.6 | ) | | $ | 1,216.9 | | | $ | 1,253.2 | |
See accompanying Notes to Consolidated Financial Statements.
DOLLAR TREE, INC.
AND SUBSIDIARIES
| | | Year Ended | | | Year Ended | | | Year Ended | |
| | | January 31, | | | February 2, | | | February 3, | |
| (In millions) | | 2009 | | | 2008 | | | 2007 | |
| Cash flows from operating activities: | | | | | | | | | |
| Net income | | $ | 229.5 | | | $ | 201.3 | | | $ | 192.0 | |
| Adjustments to reconcile net income to net cash | | | | | | | | | | | | |
| provided by operating activities: | | | | | | | | | | | | |
| Depreciation and amortization | | | 161.7 | | | | 159.3 | | | | 159.0 | |
| Provision for deferred income taxes | | | 17.0 | | | | (46.8 | ) | | | (21.9 | ) |
| Stock based compensation expense | | | 16.7 | | | | 11.3 | | | | 6.7 | |
| Other non-cash adjustments to net income | | | 7.9 | | | | 8.0 | | | | 5.1 | |
| Changes in assets and liabilities increasing | | | | | | | | | | | | |
| (decreasing) cash and cash equivalents: | | | | | | | | | | | | |
| Merchandise inventories | | | (34.6 | ) | | | (36.2 | ) | | | (6.2 | ) |
| Other assets | | | 27.3 | | | | (4.4 | ) | | | (19.8 | ) |
| Accounts payable | | | (7.5 | ) | | | 2.3 | | | | 53.7 | |
| Income taxes payable | | | (36.8 | ) | | | 46.9 | | | | 1.6 | |
| Other current liabilities | | | 6.1 | | | | 8.7 | | | | 31.8 | |
| Other liabilities | | | 15.8 | | | | 16.9 | | | | 10.8 | |
| Net cash provided by operating activities | | | 403.1 | | | | 367.3 | | | | 412.8 | |
| | | | | | | | | | | | | |
| Cash flows from investing activities: | | | | | | | | | | | | |
| Capital expenditures | | | (131.3 | ) | | | (189.0 | ) | | | (175.3 | ) |
| Purchase of short-term investments | | | (34.7 | ) | | | (1,119.2 | ) | | | (1,044.4 | ) |
| Proceeds from sale of short-term investments | | | 75.2 | | | | 1,300.5 | | | | 1,096.6 | |
| Purchase of restricted investments | | | (29.0 | ) | | | (99.3 | ) | | | (84.5 | ) |
| Proceeds from sale of restricted investments | | | 18.2 | | | | 90.9 | | | | 75.2 | |
| Purchase of Deal$ assets, net of cash acquired of $0.3 | | | - | | | | - | | | | (54.1 | ) |
| Acquisition of favorable lease rights | | | (0.4 | ) | | | (6.6 | ) | | | (4.2 | ) |
| Net cash used in investing activities | | | (102.0 | ) | | | (22.7 | ) | | | (190.7 | ) |
| | | | | | | | | | | | | |
| Cash flows from financing activities: | | | | | | | | | | | | |
| Principal payments under long-term debt and capital lease obligations | | | (1.2 | ) | | | (0.6 | ) | | | (0.6 | ) |
| Borrowings from revolving credit facility | | | - | | | | 362.4 | | | | - | |
| Repayments of revolving credit facility | | | - | | | | (362.4 | ) | | | - | |
| Payments for share repurchases | | | - | | | | (473.0 | ) | | | (248.2 | ) |
| Proceeds from stock issued pursuant to stock-based | | | | | | | | | | | | |
| compensation plans | | | 21.6 | | | | 71.6 | | | | 40.3 | |
| Tax benefit of stock options exercised | | | 2.3 | | | | 13.0 | | | | 5.6 | |
| Net cash provided by (used in) financing activities | | | 22.7 | | | | (389.0 | ) | | | (202.9 | ) |
| | | | | | | | | | | | | |
| Net increase (decrease) in cash and cash equivalents | | | 323.8 | | | | (44.4 | ) | | | 19.2 | |
| Cash and cash equivalents at beginning of year | | | 40.6 | | | | 85.0 | | | | 65.8 | |
| Cash and cash equivalents at end of year | | $ | 364.4 | | | $ | 40.6 | | | $ | 85.0 | |
| Supplemental disclosure of cash flow information: | | | | | | | | | | | | |
| Cash paid for: | | | | | | | | | | | | |
| Interest | | $ | 9.7 | | | $ | 18.7 | | | $ | 14.9 | |
| Income taxes | | $ | 140.4 | | | $ | 109.5 | | | $ | 125.5 | |
Supplemental disclosure of non-cash investing and financing activities:
The Company purchased equipment under capital lease obligations amounting to $0.5 million and $0.1 million in the years ended February 2, 2008 and February 3, 2007, respectively. Equipment purchased under capital lease obligations in the year ended January 31, 2009 was less than $0.1 million.
See accompanying Notes to Consolidated Financial Statements
DOLLAR TREE, INC.
AND SUBSIDIARIES
Description of Business
At January 31, 2009, Dollar Tree, Inc. (the Company) owned and operated 3,591 discount variety retail stores. Approximately 3,450 of these stores sell substantially all items for $1.00 or less. The remaining stores are Deal$ stores, most of which were acquired in the Deal$ acquisition and these stores sell most items for $1.00 or less but also sell items at prices greater than $1.00. The Company's stores operate under the names of Dollar Tree, Deal$ and Dollar Bills. The Company’s stores average approximately 8,400 selling square feet.
The Company's headquarters and one of its distribution centers are located in Chesapeake, Virginia. The Company also operates distribution centers in Mississippi, Illinois, California, Pennsylvania, Georgia, Oklahoma, Utah and Washington. The Company's stores are located in all 48 contiguous states. The Company's merchandise includes food, household consumables and products, party goods, health and beauty care, candy, toys, seasonal goods, stationery and other consumer items. Approximately 40% to 45% of the Company's merchandise is imported, primarily from China.
On March 2, 2008, the Company reorganized by creating a new holding company structure. The primary purpose of the reorganization was to create a more efficient corporate structure. The business operations of the Company and its subsidiaries did not change as a result of this reorganization. As a part of the holding company reorganization, a new parent company, Dollar Tree, Inc., was formed. Outstanding shares of the capital stock of Dollar Tree Stores, Inc., were automatically converted, on a share for share basis, into identical shares of common stock of the new holding company. The articles of incorporation, the bylaws, the executive officers and the board of directors of the new holding company are the same as those of the former Dollar Tree Stores, Inc. in effect immediately prior to the reorganization. The common stock of the new holding company continues to be listed on the NASDAQ Global Select Market under the symbol “DLTR”. The rights, privileges and interests of the Company’s stockholders remain the same with respect to the new holding company.
Principles of Consolidation
The consolidated financial statements include the financial statements of Dollar Tree, Inc., and its wholly owned subsidiaries. All significant intercompany balances and transactions have been eliminated in consolidation.
Fiscal Year
The Company's fiscal year ends on the Saturday closest to January 31. Any reference herein to “2008” or “Fiscal 2008”, “2007” or “Fiscal 2007,” and “2006” or “Fiscal 2006,” relates to as of or for the years ended January 31, 2009, February 2, 2008, and February 3, 2007, respectively. Fiscal year 2006 consisted of 53 weeks, while 2008 and 2007 both consisted of 52 weeks.
Use of Estimates
The preparation of financial statements in conformity with U.S. generally accepted accounting principles requires management to make estimates and assumptions that affect the reported amounts of assets and liabilities and disclosures of contingent assets and liabilities at the date of the consolidated financial statements and the reported amounts of revenues and expenses during the reporting period. Actual results could differ from those estimates.
Cash and Cash Equivalents
Cash and cash equivalents at January 31, 2009 and February 2, 2008 includes $336.1 million and $12.8 million, respectively, of investments primarily in money market securities which are valued at cost, which approximates fair value. For purposes of the consolidated statements of cash flows, the Company considers all highly liquid debt instruments with original maturities of three months or less to be cash equivalents. The majority of payments due from financial institutions for the settlement of debit card and credit card transactions process within three business days, and therefore are classified as cash and cash equivalents.
Short-Term Investments
The Company has no short-term investments at January 31, 2009. The amounts at February 2, 2008, consisted primarily of government-sponsored municipal bonds. These investments were classified as available for sale and were recorded at fair value, which approximates cost. The government-sponsored municipal bonds could be converted into cash depending on terms of the underlying agreement. The securities underlying the government-sponsored municipal bonds had longer legal maturity dates.
Merchandise inventories at the distribution centers are stated at the lower of cost or market, determined on a weighted average cost basis. Cost is assigned to store inventories using the retail inventory method, determined on a weighted average cost basis.
Costs directly associated with warehousing and distribution are capitalized as merchandise inventories. Total warehousing and distribution costs capitalized into inventory amounted to $26.9 million and $26.3 million at January 31, 2009 and February 2, 2008, respectively.
Property, Plant and Equipment
Property, plant and equipment are stated at cost and depreciated using the straight-line method over the estimated useful lives of the respective assets as follows:
| Buildings | 39 to 40 years |
| Furniture, fixtures and equipment | 3 to 15 years |
Leasehold improvements and assets held under capital leases are amortized over the estimated useful lives of the respective assets or the committed terms of the related leases, whichever is shorter. Amortization is included in "selling, general and administrative expenses" on the accompanying consolidated statements of operations.
Costs incurred related to software developed for internal use are capitalized and amortized over three years. Costs capitalized include those incurred in the application development stage as defined in Statement of Position 98-1, Accounting for the Costs of Computer Software Developed or Obtained for Internal Use.
Goodwill
Goodwill is not amortized, but rather tested for impairment at least annually in accordance with SFAS No. 142. In addition, goodwill will be tested on an interim basis if an event or circumstance indicates that it is more likely than not that an impairment loss has been incurred. The Company performed its annual impairment testing in November 2008 and determined that no impairment loss existed.
Other Assets, Net
Other assets, net consists primarily of restricted investments and intangible assets. Restricted investments were $58.5 million and $47.6 million at January 31, 2009 and February 2, 2008, respectively and were purchased to collateralize long-term insurance obligations. These investments consist primarily of government-sponsored municipal bonds, similar to the Company's short-term investments and money market securities. These investments are classified as available for sale and are recorded at fair value, which approximates cost. Intangible assets primarily include favorable lease rights with finite useful lives and are amortized over their respective estimated useful lives and reviewed for impairment in accordance with Statement of Financial Accounting Standards (SFAS) No. 144, Accounting for the Impairment or Disposal of Long-Lived Assets (SFAS 144). The Company performs its annual assessment of impairment following the finalization of each November’s financial statements and as a result determined no impairment loss existed in the current year.
Impairment of Long-Lived Assets and Long-Lived Assets to Be Disposed Of
The Company reviews its long-lived assets and certain identifiable intangible assets for impairment whenever events or changes in circumstances indicate that the carrying amount of an asset may not be recoverable, in accordance with SFAS 144. Recoverability of assets to be held and used is measured by comparing the carrying amount of an asset to future net undiscounted cash flows expected to be generated by the asset. If such assets are considered to be impaired, the impairment to be recognized is measured as the amount by which the carrying amount of the assets exceeds the fair value of the assets based on discounted cash flows or other readily available evidence of fair value, if any. Assets to be disposed of are reported at the lower of the carrying amount or fair value less costs to sell. In fiscal 2008, 2007 and 2006, the Company recorded charges of $1.2 million, $0.8 million and $0.5 million, respectively, to write down certain assets. These charges are recorded as a component of "selling, general and administrative expenses" in the accompanying consolidated statements of operations.
Financial Instruments
The Company utilizes derivative financial instruments to reduce its exposure to market risks from changes in interest rates. By entering into receive-variable, pay-fixed interest rate swaps, the Company limits its exposure to changes in variable interest rates. The Company is exposed to credit-related losses in the event of non-performance by the counterparty to the interest rate swaps. However, these swaps are in a net liability position as of January 31, 2009, therefore no credit risk exists as of that date. Interest rate differentials paid or received on the swaps are recognized as adjustments to interest expense in the period earned or incurred. The Company formally documents all hedging relationships, if applicable, and assesses hedge effectiveness both at inception and on an ongoing basis. These interest rate swaps that qualify for hedge accounting are recorded at fair value in the accompanying consolidated balance sheets as a component of “other liabilities” (note 6). Changes in the fair value of these interest rate swaps are recorded in “accumulated other comprehensive income (loss)”, net of tax, in the accompanying consolidated balance sheets.
One of the Company’s interest rate swaps does not qualify for hedge accounting treatment pursuant to the provisions of SFAS No. 133, Accounting for Derivative Instruments and Hedging Activities (SFAS 133). This interest rate swap is recorded at fair value in the accompanying consolidated balance sheets as a component of “other liabilities” (see Note 6). Changes in the fair value of this interest rate swap are recorded as "interest expense” in the accompanying consolidated statements of operations.
Fair Value Measurements
The Company adopted SFAS No. 157, “Fair Value Measurements” (SFAS 157) on February 3, 2008. This statement defines fair value, establishes a framework for measuring fair value and expands disclosures about fair value measurements. Additionally, on February 3, 2008, the Company elected the partial adoption of SFAS 157 under the provisions of Financial Accounting Standards Board Staff Position FAS 157-2, which amends SFAS 157 to allow an entity to delay the application of this statement until fiscal 2009 for certain non-financial assets and liabilities. The adoption of SFAS 157 did not have a material impact on the condensed consolidated financial statements.
SFAS 157 clarifies that fair value is an exit price, representing the amount that would be received to sell an asset or paid to transfer a liability in an orderly transaction between market participants. As such, fair value is a market-based measurement that should be determined based on assumptions that market participants would use in pricing an asset and liability. As a basis for considering such assumptions, SFAS 157 establishes a fair value hierarchy that prioritizes the inputs used to measure fair value. The hierarchy gives the highest priority to unadjusted quoted prices in active markets for identical assets or liabilities (level 1 measurement) and the lowest priority to unobservable inputs (level 3 measurements). The three levels of the fair value hierarchy defined by SFAS 157 are as follows:
Level 1 - Quoted prices in active markets for identical assets or liabilities;
Level 2 - Quoted prices for similar instruments in active markets; quoted prices for identical or similar instruments in markets that are not active; and
Level 3 - Unobservable inputs in which there is little or no market data which require the reporting entity to develop its own assumptions.
The Company’s cash and cash equivalents, restricted investments and interest rate swaps represent the financial assets and liabilities that were accounted for at fair value on a recurring basis as of January 31, 2009. As required by SFAS 157, financial assets and liabilities are classified in their entirety based on the lowest level of input that is significant to the fair value measurement. The Company's assessment of the significance of a particular input to the fair value measurement requires judgment, and may affect the valuation of fair value assets and liabilities and their placement within the fair value hierarchy levels. The fair value of the Company’s cash and cash equivalents and restricted investments was $364.4 million and $58.5 million, respectively at January 31, 2009. These fair values were determined using Level 1 measurements in the fair value hierarchy. The fair value of the swaps as of January 31, 2009 was a liability of $4.5 million. These fair values were estimated using Level 2 measurements in the fair value hierarchy. These estimates used discounted cash flow calculations based upon forward interest-rate yield curves. The curves were obtained from independent pricing services reflecting broker market quotes.
The carrying value of the Company's long-term debt approximates its fair value because the debt’s interest rates vary with market interest rates and was recently renegotiated.
Lease Accounting
The Company leases all of its retail locations under operating leases. The Company recognizes minimum rent expense starting when possession of the property is taken from the landlord, which normally includes a construction period prior to store opening. When a lease contains a predetermined fixed escalation of the minimum rent, the Company recognizes the related rent expense on a straight-line basis and records the difference between the recognized rental expense and the amounts payable under the lease as deferred rent. The Company also receives tenant allowances, which are recorded in deferred rent and are amortized as a reduction of rent expense over the term of the lease.
Revenue Recognition
The Company recognizes sales revenue at the time a sale is made to its customer.
Taxes Collected
The Company reports taxes assessed by a governmental authority that are directly imposed on revenue-producing transactions (i.e., sales tax) on a net (excluded from revenues) basis.
Cost of Sales
The Company includes the cost of merchandise, warehousing and distribution costs, and certain occupancy costs in cost of sales.
Pre-Opening Costs
The Company expenses pre-opening costs for new, expanded and relocated stores, as incurred.
Advertising Costs
The Company expenses advertising costs as they are incurred and they are included in "selling, general and administrative expenses" on the accompanying consolidated statements of operations. Advertising costs approximated $6.6 million, $8.4 million and $10.6 million for the years ended January 31, 2009, February 2, 2008, and February 3, 2007, respectively.
Income Taxes
Income taxes are accounted for under the asset and liability method. Deferred tax assets and liabilities are recognized for the future tax consequences attributable to differences between financial statement carrying amounts of existing assets and liabilities and their respective tax bases. Deferred tax assets and liabilities are measured using enacted tax rates expected to apply to taxable income in the years in which those temporary differences are expected to be recovered or settled. The effect on deferred tax assets and liabilities of a change in tax rates is recognized in income in the period that includes the enactment date of such change.
On February 4, 2007, the Company adopted Financial Accounting Standards Board Interpretation No. 48, Accounting for Uncertainty in Income Taxes (FIN 48), which clarified the accounting for uncertainty in income taxes recognized in the financial statements in accordance with SFAS No. 109, Accounting for Income Taxes. With the adoption of FIN 48, the Company includes interest and penalties in the provision for income tax expense and income taxes payable. The Company does not provide for any penalties associated with tax contingencies unless they are considered probable of assessment.
Stock-Based Compensation
The Company accounts for stock-based compensation in accordance with Statement of Financial Accounting Standards, No. 123 (revised 2004), Share-Based Payment, (SFAS 123R). SFAS 123R requires all share-based payments to employees, including grants of employee stock options, to be recognized in the financial statements based on their fair values. Total stock-based compensation expense for 2008, 2007 and 2006 was $16.7 million, $11.3 million and $6.7 million, respectively.
The Company recognizes expense related to the fair value of stock options and restricted stock units (RSUs) over the requisite service period on a straight-line basis. The fair value of stock option grants is estimated on the date of grant using the Black Scholes option pricing model. The fair value of the RSUs is determined using the closing price of the Company’s common stock on the date of grant.
Net Income Per Share
Basic net income per share has been computed by dividing net income by the weighted average number of shares outstanding. Diluted net income per share reflects the potential dilution that could occur assuming the inclusion of dilutive potential shares and has been computed by dividing net income by the weighted average number of shares and dilutive potential shares outstanding. Dilutive potential shares include all outstanding stock options and unvested restricted stock, excluding certain performance-based restricted stock grants, after applying the treasury stock method.
Property, Plant and Equipment, Net
Property, plant and equipment, net, as of January 31, 2009 and February 2, 2008 consists of the following:
| | | January 31, | | | February 2, | |
| (in millions) | | 2009 | | | 2008 | |
| | | | | | | |
| Land | | $ | 29.4 | | | $ | 29.4 | |
| Buildings | | | 181.9 | | | | 172.7 | |
| Improvements | | | 590.9 | | | | 535.1 | |
| Furniture, fixtures and equipment | | | 856.0 | | | | 785.0 | |
| Construction in progress | | | 22.4 | | | | 52.9 | |
| | | | | | | | | |
| Total property, plant and equipment | | | 1,680.6 | | | | 1,575.1 | |
| | | | | | | | | |
| Less: accumulated depreciation and amortization | | | 970.3 | | | | 831.5 | |
| | | | | | | | | |
| Total property, plant and equipment, net | | $ | 710.3 | | | $ | 743.6 | |
Depreciation expense was $161.1 million, 158.5 million and $158.2 million for the years ended January 31, 2009, February 2, 2008, and February 3, 2007, respectively.
Other Current Liabilities
Other current liabilities as of January 31, 2009 and February 2, 2008 consist of accrued expenses for the following:
| | | January 31, | | | February 2, | |
| (in millions) | | 2009 | | | 2008 | |
| | | | | | | |
| Compensation and benefits | | $ | 49.9 | | | $ | 45.5 | |
| Taxes (other than income taxes) | | | 22.3 | | | | 16.3 | |
| Insurance | | | 30.3 | | | | 27.6 | |
| Other | | | 50.0 | | | | 54.2 | |
| | | | | | | | | |
| Total other current liabilities | | $ | 152.5 | | | $ | 143.6 | |
Total income taxes were allocated as follows:
| | | Year Ended | | | Year Ended | | | Year Ended | |
| | | January 31, | | | February 2, | | | February 3, | |
| | | 2009 | | | 2008 | | | 2007 | |
| (in millions) | | | | | | | | | |
| | | | | | | | | | |
| Income from continuing operations | | $ | 129.6 | | | $ | 118.5 | | | $ | 110.9 | |
| Accumulated other comprehensive income, | | | | | | | | | | | | |
| marking derivative financial | | | | | | | | | | | | |
| instruments to fair value | | | (1.7 | ) | | | - | | | | - | |
| Stockholders' equity, tax benefit on | | | | | | | | | | | | |
| exercise of stock options | | | (2.3 | ) | | | (13.0 | ) | | | (5.6 | ) |
| | | $ | 125.6 | | | $ | 105.5 | | | $ | 105.3 | |
The provision for income taxes consists of the following:
| | | Year Ended | | | Year Ended | | | Year Ended | |
| | | January 31, | | | February 2, | | | February 3, | |
| (in millions) | | 2009 | | | 2008 | | | 2007 | |
| Federal - current | | $ | 91.9 | | | $ | 147.5 | | | $ | 116.2 | |
| State - current | | | 20.7 | | | | 17.8 | | | | 16.6 | |
| Total current | | | 112.6 | | | | 165.3 | | | | 132.8 | |
| | | | | | | | | | | | | |
| Federal - deferred | | | 15.4 | | | | (39.4 | ) | | | (19.1 | ) |
| State - deferred | | | 1.6 | | | | (7.4 | ) | | | (2.8 | ) |
| Total deferred | | | 17.0 | | | | (46.8 | ) | | | (21.9 | ) |
| | | | | | | | | | | | | |
| Provision for income taxes | | $ | 129.6 | | | $ | 118.5 | | | $ | 110.9 | |
Included in current tax expense for the years ended January 31, 2009 and February 2, 2008, are amounts related to uncertain tax positions associated with temporary differences, in accordance with FIN 48.
A reconciliation of the statutory federal income tax rate and the effective rate follows:
| | | Year Ended | | | Year Ended | | | Year Ended | |
| | | January 31, | | | February 2, | | | February 3, | |
| | | | 2009 | | | 2008 | | | 2007 | |
| | | | | | | | | | | |
| Statutory tax rate | | | 35.0 | % | | | 35.0 | % | | | 35.0 | % |
| Effect of: | | | | | | | | | | | | |
| State and local income taxes, | | | | | | | | | | | | |
| net of federal income tax | | | | | | | | | | | | |
| benefit | | | 3.0 | | | | 2.9 | | | | 3.3 | |
| Other, net | | | (1.9 | ) | | | (0.8 | ) | | | (1.7 | ) |
| Effective tax rate | | | 36.1 | % | | | 37.1 | % | | | 36.6 | % |
The rate reduction in “other, net” consists primarily of benefits from the resolution of tax uncertainties, interest on tax reserves, federal jobs credits and tax exempt interest.
Deferred income taxes reflect the net tax effects of temporary differences between the carrying amounts of assets and liabilities for financial reporting purposes and the amounts used for income tax purposes. Deferred tax assets and liabilities are classified on the accompanying consolidated balance sheets based on the classification of the underlying asset or liability. Significant components of the Company's net deferred tax assets (liabilities) follows:
| | | January 31, | | | February 2, | |
| | | 2009 | | | 2008 | |
| (in millions) | | | | | | |
| Deferred tax assets: | | | | | | |
| Accrued expenses | | $ | 39.2 | | | $ | 38.2 | |
| Property and equipment | | | 12.3 | | | | 22.2 | |
| State tax net operating losses and credit | | | | | | | | |
| carryforwards, net of federal benefit | | | 5.4 | | | | 2.1 | |
| Accrued compensation expense | | | 14.9 | | | | 10.7 | |
| Other | | | 1.7 | | | | - | |
| Total deferred tax assets | | | 73.5 | | | | 73.2 | |
| Valuation allowance | | | (4.9 | ) | | | (2.1 | ) |
| Deferred tax assets, net | | | 68.6 | | | | 71.1 | |
| | | | | | | | | |
| Deferred tax liabilities: | | | | | | | | |
| Intangible assets | | | (13.5 | ) | | | (11.0 | ) |
| Prepaids | | | (10.4 | ) | | | (2.2 | ) |
| Other | | | (4.0 | ) | | | (1.9 | ) |
| Total deferred tax liabilities | | | (27.9 | ) | | | (15.1 | ) |
| | | | | | | | | |
| Net deferred tax asset | | $ | 40.7 | | | $ | 56.0 | |
A valuation allowance of $4.9 million, net of Federal tax benefits, has been provided principally for certain state credit net operating losses and carryforwards. In assessing the realizability of deferred tax assets, the Company considers whether it is more likely than not that some portion or all of the deferred taxes will not be realized. Based upon the availability of carrybacks of future deductible amounts to the past two years’ taxable income and the Company's projections for future taxable income over the periods in which the deferred tax assets are deductible, the Company believes it is more likely than not the remaining existing deductible temporary differences will reverse during periods in which carrybacks are available or in which the Company generates net taxable income.
The Internal Revenue Service completed its examination of the 2004 federal income tax return during 2008 and is currently auditing the 2005-2007 consolidated federal income tax returns. In addition, several states completed their examination of fiscal years prior to 2005. In general, fiscal years 2005 and forward are within the statute of limitations for Federal and state tax purposes. The statute of limitations is still open prior to 2005 for some states.
In June 2006, the Financial Accounting Standards Board issued FIN 48. This Interpretation clarifies accounting for income tax uncertainties recognized in an enterprise’s financial statements in accordance with Statement of Financial Accounting Standards No. 109, Accounting for Income Taxes. FIN 48 prescribes a recognition threshold and measurement attribute for a tax position taken or expected to be taken in a tax return. Under the guidelines of FIN 48, an entity should recognize a financial statement benefit for a tax position if it determines that it is more likely than not that the position will be sustained upon examination. The Company adopted the provisions of FIN 48 on February 4, 2007, the first day of fiscal 2007.
The balance for unrecognized tax benefits at January 31, 2009, was $14.8 million. The total amount of unrecognized tax benefits at January 31, 2009, that, if recognized, would affect the effective tax rate was $9.8 million (net of the federal tax benefit). The following is a reconciliation of the Company's total gross unrecognized tax benefits for the year-to-date period ended January 31, 2009:
| | | (in millions) | |
| Balance at February 2, 2008 | | $ | 55.0 | |
| Additions, based on tax positions related to current year | | | 0.8 | |
| Additions for tax positions of prior years | | | 1.6 | |
| Reductions for tax positions of prior years | | | (36.5 | ) |
| Settlements | | | (3.8 | ) |
| Lapses in statute of limitations | | | (2.3 | ) |
| Balance at January 31, 2009 | | $ | 14.8 | |
During fiscal 2008, the Company accrued potential interest of $0.7 million, related to these unrecognized tax benefits. No potential penalties were accrued during 2008 related to the unrecognized tax benefits. As of January 31, 2009, the Company has recorded a liability for potential penalties and interest of $0.1 million and $3.0 million, respectively.
Most of the change in the Company’s reserve for uncertain tax positions relates to a reduction of temporary differences and related interest expense for which accounting method changes were filed at the beginning of fiscal year 2008 with the Internal Revenue Service. Voluntarily filing accounting method changes provides audit protection for the issues involved for the open periods in exchange for agreeing to pay the tax over a prescribed period of time.
It is possible that state tax reserves will be reduced for audit settlements and statute expirations within the next 12 months. At this point it is not possible to estimate a range associated with these audits.
Operating Lease Commitments
Future minimum lease payments under noncancelable stores and distribution center operating leases are as follows:
| | | (in millions) | |
| 2009 | | $ | 348.1 | |
| 2010 | | | 304.6 | |
| 2011 | | | 251.4 | |
| 2012 | | | 194.8 | |
| 2013 | | | 130.1 | |
| Thereafter | | | 210.4 | |
| | | | | |
| Total minimum lease payments | | $ | 1,439.4 | |
Back to 10-K Table of Contents; Financial Statement Index; Statement of Operations; Balance Sheets; Statement of Shareholders' Equity; Cash Flow
The above future minimum lease payments include amounts for leases that were signed prior to January 31, 2009 for stores that were not open as of January 31, 2009.
Minimum rental payments for operating leases do not include contingent rentals that may be paid under certain store leases based on a percentage of sales in excess of stipulated amounts. Future minimum lease payments have not been reduced by expected future minimum sublease rentals of $1.7 million under operating leases.
Minimum and Contingent Rentals
Rental expense for store and distribution center operating leases (including payments to related parties) included in the accompanying consolidated statements of operations are as follows:
| | | Year Ended | | | Year Ended | | | Year Ended | |
| | | January 31, | | | February 2, | | | February 3, | |
| (in millions) | | 2009 | | | 2008 | | | 2007 | |
| | | | | | | | | | |
| Minimum rentals | | $ | 323.9 | | | $ | 295.4 | | | $ | 261.8 | |
| Contingent rentals | | | (0.3 | ) | | | 1.2 | | | | 0.9 | |
Non-Operating Facilities
The Company is responsible for payments under leases for certain closed stores. The Company accounts for abandoned lease facilities in accordance with SFAS No. 146, Accounting for Costs Associated with Exit or Disposal Activities. A facility is considered abandoned on the date that the Company ceases to use it. On this date, the Company records an expense for the present value of the total remaining costs for the abandoned facility reduced by any actual or probable sublease income. Due to the uncertainty regarding the ultimate recovery of the future lease and related payments, the Company recorded charges of $0.6 million, $0.1 million and $0.1 million in 2008, 2007 and 2006, respectively.
Related Parties
The Company also leases properties for six of its stores from partnerships owned by related parties. The total rental payments related to these leases were $0.5 million for each of the years ended January 31, 2009, February 2, 2008 and February 3, 2007, respectively. Total future commitments under related party leases are $0.5 million.
Freight Services
The Company has contracted outbound freight services from various contract carriers with contracts expiring through February 2013. The total amount of these commitments is approximately $109.6 million, of which approximately $86.6 million is committed in 2009, $15.6 million is committed in 2010, $4.4 million is committed in 2011 and $3.0 million is committed in 2012.
Technology Assets
The Company has commitments totaling approximately $3.2 million to purchase store technology assets for its stores during 2009.
Letters of Credit
In March 2001, the Company entered into a Letter of Credit Reimbursement and Security Agreement. The agreement provides $121.5 million for letters of credit. In December 2004, the Company entered into an additional Letter of Credit Reimbursement and Security Agreement, which provides $50.0 million for letters of credit. Letters of credit under both of these agreements are generally issued for the routine purchase of imported merchandise and approximately $97.8 million was committed to these letters of credit at January 31, 2009. As discussed in Note 5, the Company has $150.0 million of available letters of credit included in the $550.0 million Unsecured Credit Agreement (the Agreement) entered into on February 20, 2008. As of January 31, 2009, there were no letters of credit committed under the Agreement.
The Company also has approximately $22.5 million in stand-by letters of credit that serve as collateral for its self-insurance programs and expire in fiscal 2009.
Surety Bonds
The Company has issued various surety bonds that primarily serve as collateral for utility payments at the Company’s stores. The total amount of the commitment is approximately $4.0 million, which is committed through various dates through fiscal 2009.
Contingencies
In August of 2006, the Company was served with a lawsuit filed in federal court in the state of Alabama by a former store manager. As a collective action, she claims that she and all other store managers similarly situated should have been classified as non-exempt employees under the Fair Labor Standards Act and, therefore, should have received overtime compensation and other benefits. The Court preliminarily allowed nationwide (except for the state of California) notice to be sent to all store managers employed by the Company for the three years immediately preceding the filing of the suit. Approximately 770 individuals opted in. A second suit was filed in the same Court, in which the allegations are essentially the same as those in the first suit. The Court has consolidated the two cases. The Court should decide whether to decertify the collective action and other defensive motions late this summer. If the Court eventually certifies a class, the case has been scheduled for trial in January 2010.
In April 2007, the Company was served with a lawsuit filed in federal court in the state of California by one present and one former store manager. They claim they should have been classified as non-exempt employees under both the California Labor Code and the Fair Labor Standards Act. They filed the case as a class action on behalf of California-based store managers employed by the Company for the four years prior to the filing of the suit. The Company was thereafter served with a second suit in a California state court which alleges essentially the same claims as those contained in the federal action and which likewise seeks class certification of all California store managers. The Company has removed the case to the same federal court as the first suit, answered it and the two cases have been consolidated. The plaintiffs’ motion to seek class certification should be decided this spring or summer. No trial date has been scheduled.
In July 2008, the Company was served with a lawsuit filed in federal court in the state of Alabama by one present and one former store manager, both females, alleging that they and other female store managers similarly situated were deprived of their rights under the Equal Pay Act, 29 U.S.C. 206(d) in that they were paid less than male store managers for performing jobs of equal skill and effort. They seek an unspecified amount of monetary damages, back pay, injunctive and other relief. The Company has answered the Complaint denying the plaintiffs’ allegations. The Court ordered notice to be sent to female individuals employed by the Company as a store manager between February 1, 2006 and January 30, 2009 (3,320 in number) to participate as a member of a potential class. A second notice was sent to 215 female store managers in California employed during the period March 1, 2006 through February 27, 2009. The opt in period ends April 23, 2009, so the Company does not know at this date the number of persons who will elect to opt in. Discovery is now ongoing. The Company expects that the Court will consider a motion to decertify the collective action and other defensive motions at a future date. The case has not been set for trial.
In May and June of 2008, 29 present or former female store managers filed claims with the Norfolk, Virginia office of the EEOC alleging employment discrimination pursuant to Title VII of the Civil Rights Act on the grounds that women store managers throughout the Company are paid less than their male counterparts. Eventually the EEOC issued Right to Sue letters to the complaining parties. All are represented by the attorneys for the plaintiffs in the existing pay discrimination case, who, following the letters, sought to amend the existing Complaint to include the Title VII charges. The Court presently has that matter under consideration.
The Company will vigorously defend itself in these lawsuits. The Company cannot give assurance, however, that one or more of these lawsuits will not have a material adverse effect on its results of operations for the period in which they are resolved.
Long-term debt at January 31, 2009 and February 2, 2008 consists of the following:
| | | January 31, | | | February 2, | |
| (in millions) | | 2009 | | | 2008 | |
| | | | | | | |
| $550.0 million Unsecured Credit Agreement, | | | | | | |
| interest payable monthly at LIBOR, | | | | | | |
| plus 0.50%, which was 1.21% at | | | | | | |
| January 31, 2009, principal payable upon | | | | | | |
| expiration of the facility in February 2013 | | $ | 250.0 | | | $ | - | |
| | | | | | | | | |
| $450.0 million Unsecured Revolving Credit Facility, | | | | | | | | |
| interest payable monthly at LIBOR, plus 0.475%, | | | | | | | | |
| principal payable upon expiration of the facility, | | | | | | | | |
| in March 2009, amount refinanced in 2008 | | | - | | | | 250.0 | |
| | | | | | | | | |
| Demand Revenue Bonds, interest payable monthly | | | | | | | | |
| at a variable rate which was 1.50% at | | | | | | | | |
| January 31, 2009, principal payable on | | | | | | | | |
| demand, maturing June 2018 | | | 17.6 | | | | 18.5 | |
| | | | | | | | | |
| Total long-term debt | | $ | 267.6 | | | $ | 268.5 | |
Maturities of long-term debt are as follows: 2009 - $17.6 million and 2013 - $250.0 million.
Unsecured Credit Agreement
On February 20, 2008, the Company entered into the Agreement which provides for a $300.0 million revolving line of credit, including up to $150.0 million in available letters of credit, and a $250.0 million term loan. The interest rate on the facility is based, at the Company’s option, on a LIBOR rate, plus a margin, or an alternate base rate, plus a margin. The revolving line of credit also bears a facilities fee, calculated as a percentage, as defined, of the amount available under the line of credit, payable quarterly. The term loan is due and payable in full at the five year maturity date of the Agreement. The Agreement also bears an administrative fee payable annually. The Agreement, among other things, requires the maintenance of certain specified financial ratios, restricts the payment of certain distributions and prohibits the incurrence of certain new indebtedness. The Company’s March 2004, $450.0 million unsecured revolving credit facility was terminated concurrent with entering into the Agreement. As of January 31, 2009, only the $250.0 million term loan was outstanding under this Agreement.
Unsecured Revolving Credit Facility
In March 2004, the Company entered into a five-year Unsecured Revolving Credit Facility (the Facility). The Facility provided for a $450.0 million revolving line of credit, including up to $50.0 million in available letters of credit, bearing interest at LIBOR, plus 0.475%. The Facility also contained an annual facilities fee, calculated as a percentage, as defined, of the amount available under the line of credit and an annual administrative fee payable quarterly. This facility was terminated in February 2008 and replaced by the Agreement.
On May 20, 1998, the Company entered into an unsecured Loan Agreement with the Mississippi Business Finance Corporation (MBFC) under which the MBFC issued Taxable Variable Rate Demand Revenue Bonds (the Bonds) in an aggregate principal amount of $19.0 million to finance the acquisition, construction, and installation of land, buildings, machinery and equipment for the Company's distribution facility in Olive Branch, Mississippi. The Bonds do not contain a prepayment penalty as long as the interest rate remains variable. The Bonds contain a demand provision and, therefore, are classified as current liabilities.
Hedging Derivatives
On March 20, 2008, the Company entered into two $75.0 million interest rate swap agreements. These interest rate swaps are used to manage the risk associated with interest rate fluctuations on a portion of the Company’s variable rate debt. Under these agreements, the Company pays interest to financial institutions at a fixed rate of 2.8%. In exchange, the financial institutions pay the Company at a variable rate, which equals the variable rate on the debt, excluding the credit spread. These swaps qualify for hedge accounting treatment pursuant to SFAS 133 and expire in March 2011. The fair value of these swaps as of January 31, 2009 was a liability of $4.4 million.
Non-Hedging Derivative
At January 31, 2009, the Company was party to a derivative instrument in the form of an interest rate swap that does not qualify for hedge accounting treatment pursuant to the provisions of SFAS No. 133 because it contains a knock-out provision. The swap creates the economic equivalent of a fixed rate obligation by converting the variable-interest rate to a fixed rate. Under this interest rate swap, the Company pays interest to a financial institution at a fixed rate, as defined in the agreement. In exchange, the financial institution pays the Company at a variable interest rate, which approximates the floating rate on the variable-rate obligation, excluding the credit spread. The interest rate on the swap is subject to adjustment monthly. No payments are made by either party for months in which the variable-interest rate, as calculated under the swap agreement, is greater than the "knock-out rate." The following table summarizes the terms of the interest rate swap:
| Derivative | Origination | Expiration | Pay Fixed | Knock-out |
| Instrument | Date | Date | Rate | Rate |
| | | | | |
| $17.6 million swap | 4/1/99 | 4/1/09 | 4.88% | 7.75% |
This swap reduces the Company's exposure to the variable interest rate related to the Demand Revenue Bonds (see Note 5). The fair value of this swap as of January 31, 2009 and February 2, 2008 was a liability of $0.1 million and $0.4 million, respectively.
Preferred Stock
The Company is authorized to issue 10,000,000 shares of Preferred Stock, $0.01 par value per share. No preferred shares are issued and outstanding at January 31, 2009 and February 2, 2008.
Net Income Per Share
The following table sets forth the calculation of basic and diluted net income per share:
| | | Year Ended | | | Year Ended | | | Year Ended | |
| | | January 31, | | | February 2, | | | February 3, | |
| (in millions, except per share data) | | 2009 | | | 2008 | | | 2007 | |
| Basic net income per share: | | | | | | | | | |
| Net income | | $ | 229.5 | | | $ | 201.3 | | | $ | 192.0 | |
| Weighted average number of shares | | | | | | | | | | | | |
| outstanding | | | 90.3 | | | | 95.9 | | | | 103.2 | |
| | | | | | | | | | | | | |
| Basic net income per share | | $ | 2.54 | | | $ | 2.10 | | | $ | 1.86 | |
| | | | | | | | | | | | | |
| Diluted net income per share: | | | | | | | | | | | | |
| Net income | | $ | 229.5 | | | $ | 201.3 | | | $ | 192.0 | |
| Weighted average number of shares | | | | | | | | | | | | |
| outstanding | | | 90.3 | | | | 95.9 | | | | 103.2 | |
| Dilutive effect of stock options and | | | | | | | | | | | | |
| restricted stock (as determined by | | | | | | | | | | | | |
| applying the treasury stock method) | | | 0.5 | | | | 0.5 | | | | 0.6 | |
| Weighted average number of shares and | | | | | | | | | | | | |
| dilutive potential shares outstanding | | | 90.8 | | | | 96.4 | | | | 103.8 | |
| | | | | | | | | | | | | |
| Diluted net income per share | | $ | 2.53 | | | $ | 2.09 | | | $ | 1.85 | |
At January 31, 2009, February 2, 2008, and February 3, 2007, 0.5 million, 0.4 million, and 1.5 million stock options, respectively are not included in the calculation of the weighted average number of shares and dilutive potential shares outstanding because their effect would be anti-dilutive.
Share Repurchase Programs
In December 2006, the Company entered into two agreements with a third party to repurchase approximately $100.0 million of the Company’s common shares under an Accelerated Share Repurchase Agreement.
The first $50.0 million was executed in an “uncollared” agreement. In this transaction the Company initially received 1.7 million shares based on the market price of the Company’s stock of $30.19 as of the trade date (December 8, 2006). A weighted average price of $32.17 was calculated using stock prices from December 16, 2006 – March 8, 2007. This represented the calculation period for the weighted average price. Based on this weighted average price, the Company paid the third party an additional $3.3 million on March 8, 2007 for the 1.7 million shares delivered under this agreement.
The remaining $50.0 million was executed under a “collared” agreement. Under this agreement, the Company initially received 1.5 million shares through December 15, 2006, representing the minimum number of shares to be received based on a calculation using the “cap” or high-end of the price range of the collar. The number of shares received under the agreement was determined based on the weighted average market price of the Company’s common stock, net of a predetermined discount, during the time after the initial execution date through March 8, 2007. The calculated weighted average market price through March 8, 2007, net of a predetermined discount, as defined in the “collared” agreement, was $31.97. Therefore, on March 8, 2007, the Company received an additional 0.1 million shares under the “collared” agreement resulting in 1.6 million total shares being repurchased under this agreement.
On March 29, 2007, the Company entered into an agreement with a third party to repurchase $150.0 million of the Company’s common shares under an Accelerated Share Repurchase Agreement. The entire $150.0 million was executed under a “collared” agreement. Under this agreement, the Company initially received 3.6 million shares through April 12, 2007, representing the minimum number of shares to be received based on a calculation using the “cap” or high-end of the price range of the collar. The maximum number of shares that could have been received under the agreement was 4.1 million. The number of shares was determined based on the weighted average market price of the Company’s common stock during the four months after the initial execution date. The calculated weighted average market price through July 30, 2007, net of a predetermined discount, as defined in the “collared” agreement, was $40.78. Therefore, on July 30, 2007, the Company received an additional 0.1 million shares under the “collared” agreement resulting in 3.7 million total shares being repurchased under this agreement.
On August 30, 2007, the Company entered into an agreement with a third party to repurchase $100.0 million of the Company’s common shares under an Accelerated Share Repurchase Agreement. The entire $100.0 million was executed under a “collared” agreement. Under this agreement, the Company initially received 2.1 million shares through September 10, 2007, representing the minimum number of shares to be received based on a calculation using the “cap” or high-end of the price range of the collar. The number of shares received under the agreement was determined based on the weighted average market price of the Company’s common stock, net of a predetermined discount, during the time after the initial execution date through a period of up to four and one half months. The contract terminated on October 22, 2007 and the weighted average price through that date was $41.16. Therefore, on October 22, 2007, the Company received an additional 0.3 million shares resulting in 2.4 million total shares repurchased under this agreement.
In March 2005, the Company’s Board of Directors authorized the repurchase of up to $300.0 million of the Company’s common stock through March 2008. In November 2006, the Company’s Board of Directors authorized the repurchase of up to $500.0 million of the Company’s common stock. This amount was in addition to the $27.0 million remaining on the March 2005 authorization. In October 2007, the Company’s Board of Directors authorized the repurchase of an additional $500.0 million of the Company’s common stock. This authorization was in addition to the November 2006 authorization which had approximately $98.4 million remaining.
The Company repurchased approximately 12.8 million shares for approximately $473.0 million in fiscal 2007 and approximately 8.8 million shares for approximately $248.2 million in fiscal 2006. The Company had no share repurchases in fiscal 2008. At January 31, 2009, the Company had approximately $453.7 remaining under Board authorization.
Profit Sharing and 401(k) Retirement Plan
The Company maintains a defined contribution profit sharing and 401(k) plan which is available to all employees over 21 years of age who have completed one year of service in which they have worked at least 1,000 hours. Eligible employees may make elective salary deferrals. The Company may make contributions at its discretion.
Contributions to and reimbursements by the Company of expenses of the plan included in the accompanying consolidated statements of operations were as follows:
| Year Ended January 31, 2009 | $21.6 million |
| Year Ended February 2, 2008 | 19.0 million |
| Year Ended February 3, 2007 | 16.8 million |
Eligible employees hired prior to January 1, 2007 are immediately vested in the Company’s profit sharing contributions. Eligible employees hired on or subsequent to January 1, 2007 vest in the Company’s profit sharing contributions based on the following schedule:
· 25% after three years of service |
· 50% after four years of service |
· 100% after five years of service |
All eligible employees are immediately vested in any Company match contributions under the 401(k) portion of the plan.
Deferred Compensation Plan
The Company has a deferred compensation plan which provides certain officers and executives the ability to defer a portion of their base compensation and bonuses and invest their deferred amounts. The plan is a nonqualified plan and the Company may make discretionary contributions. The deferred amounts and earnings thereon are payable to participants, or designated beneficiaries, at specified future dates, or upon retirement or death. Total cumulative participant deferrals were approximately $1.5 million and $2.5 million, respectively, at January 31, 2009 and February 2, 2008, and are included in "other liabilities" on the accompanying consolidated balance sheets. The related assets are included in "other assets, net" on the accompanying consolidated balance sheets. The Company did not make any discretionary contributions in the years ended January 31, 2009, February 2, 2008, or February 3, 2007.
All of the employee benefit plans noted above were adopted by Dollar Tree, Inc. on March 2, 2008 as a part of the holding company reorganization. Refer to Note 1 for a discussion of the holding company reorganization.
At January 31, 2009, the Company has eight stock-based compensation plans. Each plan and the accounting method are described below.
Fixed Stock Option Compensation Plans
Under the Non-Qualified Stock Option Plan (SOP), the Company granted options to its employees for 1,047,264 shares of Common Stock in 1993 and 1,048,289 shares in 1994. Options granted under the SOP have an exercise price of $0.86 and are fully vested at the date of grant.
Under the 1995 Stock Incentive Plan (SIP), the Company granted options to its employees for the purchase of up to 12.6 million shares of Common Stock. The exercise price of each option equaled the market price of the Company's stock at the date of grant, unless a higher price was established by the Board of Directors, and an option's maximum term is 10 years. Options granted under the SIP generally vested over a three-year period. This plan was terminated on July 1, 2003 and replaced with the Company’s 2003 Equity Incentive Plan, discussed below.
The Step Ahead Investments, Inc. Long-Term Incentive Plan (SAI Plan) provided for the issuance of stock options, stock appreciation rights, phantom stock and restricted stock awards to officers and key employees. Effective with the merger with 98 Cent Clearance Center in December 1998 and in accordance with the terms of the SAI Plan, outstanding 98 Cent Clearance Center options were assumed by the Company and converted, based on 1.6818 Company options for each 98 Cent Clearance Center option, to options to purchase the Company's common stock. Options issued as a result of this conversion were fully vested as of the date of the merger.
Under the 1998 Special Stock Option Plan (Special Plan), options to purchase 247,500 shares were granted to five former officers of 98 Cent Clearance Center who were serving as employees or consultants of the Company following the merger. The options were granted as consideration for entering into non-competition agreements and a consulting agreement. The exercise price of each option equaled the market price of the Company's stock at the date of grant, and the options' maximum term was 10 years. Options granted under the Special Plan vested over a five-year period. As of January 31, 2009, all of these options have been exercised or have expired.
The EIP replaces the Company's SIP discussed above. Under the EIP, the Company may grant up to 6.0 million shares of its Common Stock, plus any shares available for future awards under the SIP, to the Company’s employees, including executive officers and independent contractors. The EIP permits the Company to grant equity awards in the form of stock options, stock appreciation rights and restricted stock. The exercise price of each stock option granted equals the market price of the Company’s stock at the date of grant. The options generally vest over a three-year period and have a maximum term of 10 years.
The EOEP is available only to the Chief Executive Officer and certain other executive officers. These officers no longer receive awards under the EIP. The EOEP allows the Company to grant the same type of equity awards as does the EIP. These awards generally vest over a three-year period, with a maximum term of 10 years.
Stock appreciation rights may be awarded alone or in tandem with stock options. When the stock appreciation rights are exercisable, the holder may surrender all or a portion of the unexercised stock appreciation right and receive in exchange an amount equal to the excess of the fair market value at the date of exercise over the fair market value at the date of the grant. No stock appreciation rights have been granted to date.
Any restricted stock or RSUs awarded are subject to certain general restrictions. The restricted stock shares or units may not be sold, transferred, pledged or disposed of until the restrictions on the shares or units have lapsed or have been removed under the provisions of the plan. In addition, if a holder of restricted shares or units ceases to be employed by the Company, any shares or units in which the restrictions have not lapsed will be forfeited.
The 2003 Non-Employee Director Stock Option Plan (NEDP) provides non-qualified stock options to non-employee members of the Company's Board of Directors. The stock options are functionally equivalent to such options issued under the EIP discussed above. The exercise price of each stock option granted equals the market price of the Company’s stock at the date of grant. The options generally vest immediately.
The 2003 Director Deferred Compensation Plan permits any of the Company's directors who receive a retainer or other fees for Board or Board committee service to defer all or a portion of such fees until a future date, at which time they may be paid in cash or shares of the Company's common stock, or receive all or a portion of such fees in non-statutory stock options. Deferred fees that are paid out in cash will earn interest at the 30-year Treasury Bond Rate. If a director elects to be paid in common stock, the number of shares will be determined by dividing the deferred fee amount by the current market price of a share of the Company's common stock on the date of deferral. The number of options issued to a director will equal the deferred fee amount divided by 33% of the price of a share of the Company's common stock. The exercise price will equal the fair market value of the Company's common stock at the date the option is issued. The options are fully vested when issued and have a term of 10 years.
All of the shareholder approved plans noted above were adopted by Dollar Tree, Inc. on March 2, 2008 as a part of the holding company reorganization. Refer to Note 1 for a discussion of the holding company reorganization.
Stock Options
In 2008, 2007 and 2006, the Company granted a total of 0.5 million, 0.4 million and 0.3 million stock options from the EIP, EOEP and the NEDP, respectively. The fair value of all of these options is being expensed ratably over the three-year vesting periods, or a shorter period based on the retirement eligibility of the grantee. All options granted to directors vest immediately and are expensed on the grant date. During 2008, 2007 and 2006, the Company recognized $4.7 million, $2.7 million and $1.3 million, respectively of expense related to these stock option grants. As of January 31, 2009, there was approximately $6.0 million of total unrecognized compensation expense related to these stock options which is expected to be recognized over a weighted average period of 23 months.
In 2008, the Company granted 0.1 million stock options from the EIP and the EOEP to certain officers of the Company, contingent on the Company meeting certain performance targets in 2008 and future service of these officers through fiscal 2009. The Company met these performance targets in fiscal 2008; therefore, the fair value of these stock options of $1.0 million is being expensed over the service period. The Company recognized $0.5 million of expense on these stock options in 2008. The fair value of these stock options was determined using the Company’s closing stock price on the grant date in accordance with FAS 123R.
The fair value of each option grant was estimated on the date of grant using the Black-Scholes option-pricing model. The expected term of the awards granted was calculated using the “simplified method” in accordance with Staff Accounting Bulletin No. 107. Expected volatility is derived from an analysis of the historical and implied volatility of the Company’s publicly traded stock. The risk free rate is based on the U.S. Treasury rates on the grant date with maturity dates approximating the expected life of the option on the grant date. The weighted average assumptions used in the Black-Scholes option pricing model for grants in 2008, 2007 and 2006 are as follows:
| | | Fiscal 2008 | | | Fiscal 2007 | | | Fiscal 2006 | |
| Expected term in years | | | 6.0 | | | | 6.0 | | | | 6.0 | |
| Expected volatility | | | 45.7 | % | | | 28.4 | % | | | 30.2 | % |
| Annual dividend yield | | | - | | | | - | | | | - | |
| Risk free interest rate | | | 2.8 | % | | | 4.5 | % | | | 4.8 | % |
| Weighted average fair value of options | | | | | | | | | | | | |
| granted during the period | | $ | 13.45 | | | $ | 14.33 | | | $ | 10.93 | |
| Options granted | | | 558,293 | | | | 386,490 | | | | 342,216 | |
The following tables summarize the Company's various option plans and information about options outstanding at January 31, 2009 and changes during the year then ended.
| Stock Option Activity | |
| | | | | | | | | | | | | |
| | | January 31, 2009 | | | | | | | |
| | | | | | Weighted | | | | | | | |
| | | | | | Average | | | Weighted | | | Aggregate | |
| | | | | | Per Share | | | Average | | | Intrinsic | |
| | | | | | Exercise | | | Remaining | | Value (in | |
| | | Shares | | | Price | | | Term | | | millions) | |
| | | | | | | | | | | | | |
| Outstanding, beginning of period | | | 2,089,914 | | | $ | 28.63 | | | | | | | |
| Granted | | | 558,293 | | | | 28.51 | | | | | | | |
| Exercised | | | (681,609 | ) | | | 26.47 | | | | | | | |
| Forfeited | | | (23,982 | ) | | | 24.41 | | | | | | | |
| Outstanding, end of period | | | 1,942,616 | | | $ | 29.41 | | | | 6.4 | | | $ | 25.8 | |
| | | | | | | | | | | | | | | | | |
| Options vested and expected to vest | | | | | | | | | | | | | |
| at January 31, 2009 | | | 1,909,041 | | | $ | 29.44 | | | | 6.3 | | | $ | 25.3 | |
| | | | | | | | | | | | | | | | | |
| Options exercisable at end of period | | | 1,097,837 | | | $ | 28.46 | | | | 4.6 | | | $ | 15.6 | |
| | | | Options Outstanding | Options Exercisable |
| | | Options | | | | Options | | |
| Range of | | Outstanding | Weighted Avg. | Weighted Avg. | Exercisable | Weighted Avg. |
| Exercise | | at January 31, | Remaining | Exercise | at January 31, | Exercise |
| Prices | | 2009 | Contractual Life | Price | | 2009 | | Price |
| | | | | | | | | |
| $0.86 | | 2,706 | N/A | $ 0.86 | | 2,706 | | $ 0.86 |
| $10.99 to $21.28 | 216,387 | 3.6 | 19.51 | | 216,387 | | 19.51 |
| $21.29 to $29.79 | 930,425 | 7.2 | 26.21 | | 379,491 | | 25.52 |
| $29.80 to $42.56 | 793,098 | 6.0 | 35.97 | | 499,253 | | 34.73 |
| | | | | | | | | |
| $0.86 to $42.56 | 1,942,616 | 6.4 | $ 29.41 | | 1,097,837 | | $ 28.46 |
The intrinsic value of options exercised during 2008, 2007 and 2006 was approximately $7.2 million, $32.8 million and $13.1 million, respectively.
Restricted Stock
The Company granted 0.4 million, 0.3 million and 0.3 million RSUs, net of forfeitures in 2008, 2007 and 2006, respectively, from the EIP and the EOEP to the Company’s employees and officers. The fair value of all of these RSUs is being expensed ratably over the three-year vesting periods, or a shorter period based on the retirement eligibility of the grantee. The fair value was determined using the Company’s closing stock price on the date of grant. The Company recognized $9.5 million, $7.7 million and $4.5 million of expense related to these RSUs during 2008, 2007 and 2006. As of January 31, 2009, there was approximately $11.9 million of total unrecognized compensation expense related to these RSUs which is expected to be recognized over a weighted average period of 21 months.
In 2008, the Company granted 0.1 million RSUs from the EIP and the EOEP to certain officers of the Company, contingent on the Company meeting certain performance targets in 2008 and future service of these officers through fiscal 2009. The Company met these performance targets in fiscal 2008; therefore, the fair value of these RSUs of $2.3 million is being expensed over the service period. The Company recognized $1.2 million of expense on these RSUs in 2008. The fair value of these RSUs was determined using the Company’s closing stock price on the grant date in accordance with FAS 123R.
Back to 10-K Table of Contents; Financial Statement Index; Statement of Operations; Balance Sheets; Statement of Shareholders' Equity; Cash Flow
In 2006, the Company granted less than 0.1 million RSUs from the EOEP and the EIP to certain officers of the Company, contingent on the Company meeting certain performance targets in 2006 and future service of the these officers through fiscal 2006. The Company met these performance targets in fiscal 2006; therefore, the Company recognized the fair value of these RSUs of $0.2 million during fiscal 2006. The fair value of these RSUs was determined using the Company’s closing stock price on the grant date in accordance with SFAS 123R.
In 2005, the Company granted less than 0.1 million RSUs from the EOEP to certain officers of the Company, contingent on the Company meeting certain performance targets in 2005 and future service of these officers through various points through July 2007. The Company met these performance targets in fiscal 2005; therefore, the fair value of these RSUs of $1.0 million was expensed over the service period. The fair value of these RSUs was determined using the Company’s closing stock price January 28, 2006 (the last day of fiscal 2005), when the performance targets were satisfied. The Company recognized $0.3 million and $0.7 million, of expense related to these RSUs in 2006 and 2005, respectively. The amount recognized in 2007 was less than $0.1 million.
The following table summarizes the status of RSUs as of January 31, 2009, and changes during the year then ended:
| | | | | | Weighted | |
| | | | | | Average | |
| | | | | | Grant | |
| | | | | | Date Fair | |
| | | Shares | | | Value | |
| | | | | | | |
| Nonvested at February 2, 2008 | | | 555,935 | | | $ | 26.57 | |
| Granted | | | 469,645 | | | | 27.05 | |
| Vested | | | (256,870 | ) | | | 31.20 | |
| Forfeited | | | (21,217 | ) | | | 31.57 | |
| Nonvested at January 31, 2009 | | | 747,493 | | | $ | 30.13 | |
In connection with the vesting of RSUs in 2008 and 2007, certain employees elected to receive shares net of minimum statutory tax withholding amounts which totaled $2.6 million and $2.9 million, respectively. The total fair value of the restricted shares vested during the years ended January 31, 2009 and February 2, 2008 was $8.0 million and $8.2 million, respectively.
Employee Stock Purchase Plan
Under the Dollar Tree, Inc. Employee Stock Purchase Plan (ESPP), the Company is authorized to issue up to 1,759,375 shares of common stock to eligible employees. Under the terms of the ESPP, employees can choose to have up to 10% of their annual base earnings withheld to purchase the Company's common stock. The purchase price of the stock is 85% of the lower of the price at the beginning or the end of the quarterly offering period. Under the ESPP, the Company has sold 1,213,640 shares as of January 31, 2009.
The fair value of the employees' purchase rights is estimated on the date of grant using the Black-Scholes option-pricing model with the following weighted average assumptions:
| | | Fiscal 2008 | Fiscal 2007 | Fiscal 2006 |
| | | | | |
| Expected term | | 3 months | 3 months | 3 months |
| Expected volatility | | 14.4% | 16.3% | 13.1% |
| Annual dividend yield | | - | - | - |
| Risk free interest rate | | 3.8% | 4.4% | 4.8% |
The weighted average per share fair value of those purchase rights granted in 2008, 2007 and 2006 was $5.64, $5.74 and $4.59, respectively. Total expense recognized for these purchase rights was $0.8 million, $0.9 million and $0.4 million in 2008, 2007 and 2006, respectively.
On March 2, 2008, the ESPP was adopted by Dollar Tree, Inc. as a part of the holding company reorganization. Refer to Note 1 for discussion of the holding company reorganization.
On March 25, 2006, the Company completed its acquisition of 138 Deal$ stores. These stores are located primarily in the Midwest part of the United States and the Company has existing logistics capacity to service these stores. This acquisition included stores that offer an expanded assortment of merchandise including items that sell for more than $1. Substantially all Deal$ stores acquired continue to operate under the Deal$ banner while providing the Company an opportunity to leverage its Dollar Tree infrastructure in the testing of new merchandise concepts, including higher price points, without disrupting the single-price point model in its Dollar Tree stores.
The Company paid approximately $32.0 million for store-related and other assets and $22.1 million for inventory. This amount includes approximately $0.6 million of direct costs associated with the acquisition. The results of Deal$ store operations are included in the Company’s financial statements since the acquisition date and did not have a significant impact on the Company’s operating results in 2006. This acquisition is immaterial to the Company’s operations as a whole and therefore no proforma disclosure of financial information has been presented. The following table summarizes the allocation of the purchase price to the fair value of the assets acquired.
| (In millions) | | | |
| Inventory | | $ | 22.1 | |
| Other current assets | | | 0.1 | |
| Property and equipment | | | 15.1 | |
| Goodwill | | | 14.6 | |
| Other intangibles | | | 2.2 | |
| | | $ | 54.1 | |
The Company has a $4.0 million investment which represents a 10.5% fully diluted interest in Ollie's Holdings, Inc. (Ollie's), a multi-price point discount retailer located in the mid-Atlantic region. In addition, the SKM Equity Fund III, L.P. (SKM Equity) and SKM Investment Fund (SKM Investment) acquired a combined fully diluted interest in Ollie's of 53.1%. One of the Company's current directors, Thomas Saunders, is a principal member of SKM Partners, L.L.C., which serves as the general partner of SKM Equity. The $4.0 million investment in Ollie's is accounted for under the cost method and is included in "other assets" in the accompanying consolidated balance sheets.
The following table sets forth certain items from the Company's unaudited consolidated statements of operations for each quarter of fiscal year 2008 and 2007. The unaudited information has been prepared on the same basis as the audited consolidated financial statements appearing elsewhere in this report and includes all adjustments, consisting only of normal recurring adjustments, which management considers necessary for a fair presentation of the financial data shown. The operating results for any quarter are not necessarily indicative of results for a full year or for any future period.
| | | First | | | Second | | | Third | | | Fourth | |
| | | Quarter (1) | | | Quarter | | | Quarter | | | Quarter | |
| | | | | | | | | | | | | |
| Fiscal 2008: | | | | | | | | | | | | |
| Net sales | | $ | 1,051.3 | | | $ | 1,093.1 | | | $ | 1,114.0 | | | $ | 1,386.5 | |
| Gross profit | | $ | 356.5 | | | $ | 363.1 | | | $ | 379.4 | | | $ | 493.2 | |
| Operating income | | $ | 69.7 | | | $ | 61.6 | | | $ | 69.3 | | | $ | 165.2 | |
| Net income | | $ | 43.6 | | | $ | 37.6 | | | $ | 43.1 | | | $ | 105.2 | |
| Diluted net income per share | | $ | 0.48 | | | $ | 0.42 | | | $ | 0.47 | | | $ | 1.15 | |
| Stores open at end of quarter | | | 3,474 | | | | 3,517 | | | | 3,572 | | | | 3,591 | |
| Comparable store net sales change | | | 2.1 | % | | | 6.5 | % | | | 6.2 | % | | | 2.2 | % |
| | | | | | | | | | | | | | | | | |
| Fiscal 2007: | | | | | | | | | | | | | | | | |
| Net sales | | $ | 975.0 | | | $ | 971.2 | | | $ | 997.8 | | | $ | 1,298.6 | |
| Gross profit | | $ | 325.3 | | | $ | 326.6 | | | $ | 343.9 | | | $ | 465.3 | |
| Operating income | | $ | 62.3 | | | $ | 53.4 | | | $ | 60.2 | | | $ | 154.4 | |
| Net income | | $ | 38.1 | | | $ | 32.6 | | | $ | 35.9 | | | $ | 94.7 | |
| Diluted net income per share | | $ | 0.38 | | | $ | 0.33 | | | $ | 0.38 | | | $ | 1.04 | |
| Stores open at end of quarter | | | 3,280 | | | | 3,334 | | | | 3,401 | | | | 3,411 | |
| Comparable store net sales change | | | 5.8 | % | | | 4.4 | % | | | 1.9 | % | | | (0.8 | %) |
| | | | | | | | | | | | | | | | | |
| (1) Easter was observed on March 23, 2008 and April 8, 2007 | | | | | | | | | |
Item 9. CHANGES IN AND DISAGREEMENTS WITH ACCOUNTANTS ON ACCOUNTING AND FINANCIAL DISCLOSURE