The PMI Group, Inc. Supplemental Portfolio Information As of June 30, 2009 Exhibit 99.3 |
The PMI Group, Inc. 2 Definition of Terms 2/28s – refers to loans with interest rates that are fixed for two years and reset to a new interest rate at the end of year two for the remaining term of the loan. ARMs – refers to loans with adjustable interest rates. We consider a loan an ARM if its interest rate may be adjusted prior to the loan’s fifth anniversary. A Quality Loans – we define A quality to include loans with credit scores of 620 and greater. Alt-A Loans – we consider a loan Alt-A if it has a credit score of 620 or greater and the borrower requests and is given the option of providing reduced documentation verifying income, assets, deposit information and/or employment. Captive Reinsurance – refers to agreements in which a portion of risk insured by PMI is reinsured by a captive reinsurance company affiliated with the mortgage originator or investor. Defaults – our primary mortgage insurance master policy defines “default” as the borrower’s failure to pay when due an amount equal to the scheduled monthly mortgage payment under the terms of the mortgage. Generally, the master policies require an insured to notify PMI of a default no later than the last business day of the month following the month in which the borrower becomes three monthly payments in default. For reporting purposes and internal tracking purposes, we do not consider a loan to be in default until the borrower has missed two consecutive payments. Depending upon its scheduled payment date, a loan delinquent for two consecutive monthly payments could be reported to PMI between the 31 and the 60 day after the first missed payment. Flow – generally refers to mortgage insurance offered on a loan-by-loan basis to lenders. GSE Pool – refers to a traditional pool product for mortgage loans sold by PMI’s customers to the GSEs. This product was available from 1997 to 2001. Interest Only Loans – refers to loans that do not reduce principal during the initial deferral period (usually between two and ten years) and therefore do not accumulate equity through loan amortization during the initial deferral period. Approximately 91% of our interest only loans have an initial deferral period of 5 years or greater. The average initial deferral period for loans insured in 2007 was 9 years. Insurance in Force (IIF) – refers to the current principal balance of all outstanding mortgage loans with insurance coverage as of a given date. Less-than-A Quality Loans – we define less-than-A credit quality loans to include loans with credit scores of 619 or below. The majority of our less-than-A-quality loans have credit scores above 575. st th |
The PMI Group, Inc. 3 Definition of Terms Modified Pool Insurance – modified pool insurance may be used in addition to primary mortgage insurance or may be placed on loans that do not require primary insurance. Coverage of modified pool products varies. Some products provide first loss protection by covering a percentage of the losses on individual loans held within the pool of insured loans up to a stated aggregate loss limit (“stop loss limit”) for the entire pool. Some modified pool products offer mezzanine-level coverage by providing for claims payments only after a predetermined cumulative claims level, or deductible, is reached. New Insurance Written (NIW) – refers to the original principal balance of all loans that receive new primary mortgage insurance coverage during a given period. New Risk Written (NRW) – refers to the aggregate dollar amount of each insured mortgage loan’s current principal balance multiplied by the insurance coverage percentage specified in the policy for all loans that receive new primary mortgage insurance coverage during a given period. Old Pool – refers to a traditional pool product for mortgage loans sold by PMI’s customers to capital market participants. Payment Option ARMs – generally refers to loans that provide the borrower an option every month to make a payment consisting of principal and interest, interest only, or an amount established by the lender that may be less than the interest owed. Primary Insurance – refers to mortgage insurance placed on a loan-by-loan basis through our “flow” channel and mortgage insurance issued for mortgage-backed securities and portfolio investors through our “structured transactions” channel. Primary insurance does not include pool or modified pool information. Primary Risk in Force – refers to the aggregate dollar amount of each insured mortgage loan’s current principal balance multiplied by the insurance coverage percentage specified in the policy for insurance policies issued through our “flow” and “structured transactions” channels only. Risk in Force (RIF) – refers to the aggregate dollar amount of each insured mortgage loan’s current principal balance multiplied by the insurance coverage percentage specified in the policy. Structured – generally refers to mortgage insurance offered by PMI that covers large portfolios of mortgage loans and is provided to issuers of mortgage backed securities (“MBS”) and portfolio investors. Traditional Pool – covers the entire loss on a defaulted mortgage loan that exceeds the claim payment under any primary insurance coverage, up to a stated aggregate loss limit, or stop loss, for all of the loans in a pool. PMI is not currently offering traditional pool insurance to its customers. |
The PMI Group, Inc. 4 Contents of Presentation Primary Portfolio Characteristics by Vintage Part 3 Focus on Particular Portfolio Segments Part 2 Primary Portfolio Characteristics Part 1 Captive Reinsurance Arrangements Part 5 Modified Pool Portfolio Part 4 |
Primary Portfolio Characteristics |
The PMI Group, Inc. 6 2.2% 1.4% 2.8% 7.8% 8.0% 12.2% 15.5% 28.2% 16.3% 5.5% 0% 10% 20% 30% 40% 50% Prior to 2001 2001 2002 2003 2004 2005 2006 2007 2008 2009 $120.2 Billion Primary IIF $29.4 Billion Primary RIF U.S. Portfolio Age Distribution Average Rate (1) (1) Average loan fixed annual mortgage interest rate 2.3% 1.3% 2.9% 7.9% 8.6% 12.6% 16.1% 28.2% 15.2% 4.8% 0% 10% 20% 30% 40% 50% Prior to 2001 2001 2002 2003 2004 2005 2006 2007 2008 2009 6.35% 7.07% 7.02% 6.24% 6.14% 6.04% 6.88% 7.68% 7.76% Note: Due to rounding, the sum of percentages may not total 100% 5.17% |
The PMI Group, Inc. 7 Primary Risk in Force by FICO Score 7.8% 6.8% 5.9% 5.9% 33.8% 34.6% 34.7% 33.1% 23.4% 24.1% 24.6% 30.3% 30.7% 31.5% 32.7% 36.1% 1.8% 3.0% 2.5% 2.1% 1.8% 2.2% 5.1% 5.2% 29.9% 30.8% 24.8% 25.1% 25.1% 37.5% 0% 25% 50% 75% 100% 2004 2005 2006 2007 2008 Jun 30, 2009 Less than 575 720 and above 680 - 719 620 - 679 575 - 619 U.S. Portfolio Credit Score Distribution Excludes unreported FICO scores |
The PMI Group, Inc. 8 LTVs between 85.01% and 90% Primary Risk in Force by Loan to Value 9.2% 9.3% 7.0% 7.1% 37.9% 36.4% 33.7% 31.0% 29.5% 30.3% 6.6% 5.3% 4.6% 3.8% 4.1% 11.9% 14.3% 17.6% 20.6% 8.9% 7.1% 35.0% 37.5% 37.9% 37.4% 35.9% 29.9% 4.1% 21.5% 24.6% 0% 25% 50% 75% 100% 2004 2005 2006 2007 2008 Jun 30, 2009 LTVs above 97% LTVs between 95.01% and 97% LTVs between 90.01% and 95% LTVs of 85% and below U.S. Portfolio Loan to Value Distribution Note: Due to rounding, the sum of percentages may not total 100% |
The PMI Group, Inc. 9 U.S. Portfolio Geographic Distribution 1 Top ten states as determined by primary RIF on June 30, 2009 2 Default rates as of June 30, 2009 and December 31 for 2008 and 2007 10.1% 7.4% 7.7% 5.2% 3.8% 3.4% 3.9% 3.2% 4.7% 3.2% Florida 10.1% 34.14% 27.79% 10.56% California 7.7% 30.84% 24.68% 10.92% Texas 7.4% 9.84% 9.44% 6.03% Illinois 5.2% 18.86% 14.80% 8.19% Georgia 4.7% 17.57% 14.62% 9.50% % of RIF Jun 2009 YE 2008 YE 2007 New York 3.9% 13.70% 11.27% 6.78% Ohio 3.8% 14.84% 13.50% 10.83% Pennsylvania 3.4% 12.27% 10.75% 7.47% New Jersey 3.2% 18.36% 14.17% 7.53% Washington 3.2% 11.88% 8.15% 3.58% % of RIF Jun 2009 YE 2008 YE 2007 Top Ten States – Percent of Primary Risk in Force and Default Rates Primary Default Rates Primary Default Rates 1 2 2 1 |
The PMI Group, Inc. 10 U.S. Portfolio Primary NIW Characteristics Flow and Structured Primary NIW New Insurance Written by LTV New Risk Written by LTV Note: Due to rounding, the sum of percentages may not total 100% Flow Primary NIW Structured Primary NIW 90.01 – 95% 85.01 – 90% 85 and below Above 97% 95.01%- 97% The increased percentage of above 97% LTV loans in 2007 is due to the reduced availability of alternative mortgage products including piggyback loans and increased activity by the GSEs. With the exception of previously issued commitments, effective March 1, 2008, PMI discontinued insuring loans with LTV ratios above 97%. 90.01 – 95% 85.01 – 90% 85 and below Above 97% 95.01%- 97% 28.2 23.3 37.6 22.2 6.9 7.7 8.9 8.6 0.4 $35.9 $32.2 $46.1 $22.6 $6.9 $0 $10 $20 $30 $40 $50 $60 2005 2006 2007 2008 1H 2009 18% 15% 10% 16% 43% 42% 31% 50% 24% 21% 24% 26% 13% 19% 20% 49% 30% 1% 3% 2% 3% 2% 32% 5% 0% 25% 50% 75% 100% 2005 2006 2007 2008 1H 2009 12% 10% 6% 8% 42% 41% 30% 50% 27% 24% 27% 31% 18% 24% 11% 49% 39% 1% 2% 2% 5% 2% 35% 6% 0% 25% 50% 75% 100% 2005 2006 2007 2008 1H 2009 |
The PMI Group, Inc. 11 U.S. Portfolio Primary NIW Characteristics Less-Than-A Quality Loans - NIW Alt-A Loans – NIW Note: Due to rounding, the sum of percentages may not total 100% Refinances Purchases Less-Than-A Quality Loans - Structured Channel Less-Than-A Quality Loans – Flow Channel Less-Than-A Quality Loans as a percentage of Total Primary NIW Alt-A Loans – Flow Channel Alt-A Loans as a % of Total Primary NIW Alt-A Loan – Structured Channel With the exception of previously issued commitments, effective March 10, 2008, PMI discontinued insuring loans with FICO scores below 620. Refinances and Purchases as a % of Primary NIW 296 11 1,153 3,067 1,588 838 1,605 1,084 $2,672 $1,991 $4,672 $11 $322 7% 6% 10% 1% 0% $0 $2,000 $4,000 $6,000 2005 2006 2007 2008 1H 2009 0% 5% 10% 15% 14 7,425 11,242 6,691 1,195 3,002 1,397 4,410 $1,211 $14 $12,639 $11,101 $10,427 0% 5% 27% 34% 29% $0 $4,000 $8,000 $12,000 2005 2006 2007 2008 1H 2009 0% 5% 10% 15% 20% 25% 30% 35% 40% 47% 67% 63% 64% 64% 53% 33% 37% 36% 36% 0% 25% 50% 75% 100% 2005 2006 2007 2008 1H 2009 |
The PMI Group, Inc. 12 Interest Only Loans - NIW Payment Option ARMs - NIW U.S. Portfolio Primary NIW Characteristics Payment Option ARMS – Flow Channel Total Payment Option ARMs as a percentage of Total Primary NIW Interest Only – Structured Channel Interest Only – Flow Channel Total Interest Only Loans as a percentage of Total Primary NIW ARMs - NIW ARM amounts Primary NIW – Flow Channel ARM amounts Primary NIW – Structured Channel ARMs as a percentage of Total Primary NIW Approximately 1.0% of Total Primary RIF is subject to rate adjustment in 2009. Approximately 0.6% and 0.1% are subject to adjustment in 2010 and 2011, respectively. Approximately 98% of interest only loans written in 2007 have an initial deferral period of 5 years or greater and 85% have an initial deferral period of 7 years or greater. For 2006 NIW, initial deferral periods of 5 and 7 years or greater were 89% and 62%, respectively. $6,024 $3,802 $1,907 $261 $5,889 $4,081 $2,238 $11,913 $7,883 $4,145 $20 $295 33% 24% 9% 1% 0% $0 $4,000 $8,000 $12,000 2005 2006 2007 2008 1H 2009 0% 5% 10% 15% 20% 25% 30% 35% 40% 1,173 13 0 3,235 8,296 3,507 2,386 1,025 2,329 $1,184 $13 $9,321 $5,836 $5,621 0% 5% 20% 18% 16% $0 $2,000 $4,000 $6,000 $8,000 $10,000 2005 2006 2007 2008 1H 2009 0% 5% 10% 15% 20% 25% 2,617 1,252 2,799 0% 0% 8% 8% 3% $0 $1,000 $2,000 $3,000 2005 2006 2007 2008 1H 2009 0% 5% 10% |
Focus on Particular Portfolio Segments |
The PMI Group, Inc. 14 U.S. Portfolio Interest Rate Adjustments Rate Adjustments by Credit Quality Rate Adjustments of Hybrid Loans and Other ARMs Rate Adjustments in Distressed Geographic Regions Other ARMs 3/27s Prime Alt-A Less than A Quality Note: 2/28s resets in 2009 and 2010 are 0.01% and 0.00%, respectively California All Other Florida Auto States Note: Auto states include Michigan, Ohio, Illinois and Indiana 0.01% 0.01% Note: Percentages are of total Primary RIF at June 30, 2009 2009 2010 2011 Total interest rate adjustments as a percentage of primary risk in force: 1.0% 0.6% 0.1% 0.01% 0.46% 0.33% 0.06% 0.36% 0.13% 0.14% 0.17% 0.0% 0.3% 0.5% 0.8% 1.0% 2009 2010 2011 0.39% 0.22% 0.06% 0.57% 0.41% 0.0% 0.3% 0.5% 0.8% 1.0% 2009 2010 2011 0.46% 0.36% 0.05% 0.11% 0.08% 0.19% 0.08% 0.07% 0.16% 0.0% 0.3% 0.5% 0.8% 1.0% 2009 2010 2011 ` |
The PMI Group, Inc. 15 California at June 30, 2009 1 Condominium includes Townhouses and Cooperatives 2 Excludes unreported FICO scores % of CA RIF % of Total RIF % of Total RIF Note: Due to rounding, the sum of percentages may not total 100% % of CA RIF $2.3 Billion of Total Risk in Force 7.7% of PMI’s Primary Risk in Force $298,369 Average Loan Size MSA Distribution of Total Primary RIF Oakland-Fremont-Hayward, CA – 0.4% San Diego-Carlsbad-San Marcos – 0.6% Sacramento--Arden-Arcade—Roseville – 0.7% Riverside-San Bernardino-Ontario – 1.5% Los Angeles-Long Beach-Glendale – 1.6% FICO Scores 720 and above 39.8% 3.1% 680-719 28.1% 2.2% 620-679 28.9% 2.2% 575-619 2.4% 0.2% Less than 575 0.6% 0.0% Loan to Value Above 97.00% 12.5% 1.0% 95.01% to 97.00% 1.9% 0.2% 90.01% to 95.00% 20.8% 1.6% 85.01% to 90.00% 51.4% 4.0% 85.00% and below 13.3% 1.0% Loan Type Fixed Rate 75.0% 5.8% ARM 25.0% 1.9% Property Type Single Family 81.0% 6.3% Condominium 15.3% 1.2% Multi-Family and other 3.7% 0.3% Occupancy Primary Residence 92.8% 7.2% Second Home 2.7% 0.2% Non-owner occupied 4.6% 0.4% Alt-A 33.1% 2.5% |
The PMI Group, Inc. 16 Florida at June 30, 2009 1 Condominium includes Townhouses and Cooperatives 2 Excludes unreported FICO scores % of FL RIF % of Total RIF % of FL RIF % of Total RIF $3.0 Billion of Total Risk in Force 10.1% of PMI’s Primary Risk in Force $177,354 Average Loan Size Note: Due to rounding, the sum of percentages may not total 100% FICO Scores 720 and above 35.8% 3.6% 680-719 27.8% 2.8% 620-679 30.8% 3.1% 575-619 4.1% 0.4% Less than 575 1.2% 0.1% Loan to Value Above 97.00% 20.1% 2.0% 95.01% to 97.00% 2.6% 0.3% 90.01% to 95.00% 29.8% 3.0% 85.01% to 90.00% 40.8% 4.1% 85.00% and below 6.7% 0.7% Loan Type Fixed Rate 83.8% 8.5% ARM 16.2% 1.6% Property Type Single Family 71.7% 7.3% Condominium 26.3% 2.7% Multi-Family and other 2.0% 0.2% Occupancy Primary Residence 78.6% 8.0% Second Home 12.4% 1.3% Non-owner occupied 9.0% 0.9% Alt-A 36.8% 3.5% Tampa-St. Petersburg-Clearwater, FL– 1.4% MSA Distribution of Total Primary RIF Jacksonville, FL– 0.7% Fort Lauderdale-Deerfield Beach, FL– 1.1% Miami-Miami Beach-Kendall, FL– 1.5% Orlando-Kissimmee, FL– 1.6% |
The PMI Group, Inc. 17 Auto States (Michigan, Ohio, Illinois, Indiana) at June 30, 2009 1 Condominium includes Townhouses and Cooperatives 2 Excludes unreported FICO scores % of Total RIF $3.9 Billion of Total Risk in Force 13.4% of PMI’s Primary Risk in Force $136,031 Average Loan Size Note: Due to rounding, the sum of percentages may not total 100% Loan Type Fixed Rate 90.7% 12.1% ARM 9.3% 1.2% Property Type Single Family 82.3% 11.0% Condominium 13.9% 1.9% Multi-Family and other 3.8% 0.5% Occupancy Primary Residence 93.0% 12.5% Second Home 1.4% 0.2% Non-owner occupied 5.6% 0.8% Alt-A 13.1% 1.6% % of Auto States RIF % of Auto States RIF % of Total RIF FICO Scores 720 and above 35.2% 4.7% 680-719 23.5% 3.2% 620-679 31.7% 4.2% 575-619 6.2% 0.8% Less than 575 2.9% 0.4% Loan to Value Above 97.00% 19.5% 2.6% 95.01% to 97.00% 5.1% 0.7% 90.01% to 95.00% 32.2% 4.3% 85.01% to 90.00% 35.9% 4.8% 85.00% and below 7.2% 1.0% Cleveland-Elyria-Mentor, OH - 0.9% Chicago – Naperville – Joliet, IL - 4.0% Columbus, OH - 0.8% Cincinnati-Middletown, OH-KY-IN-0.7% Warren-Troy-Farmington Hills, MI - 0.8% MSA Distribution of Total Primary RIF |
The PMI Group, Inc. 18 Loan Type Fixed Rate 88.8% 2.5% ARM 11.2% 0.3% Property Type Single Family 85.0% 2.3% Condominium 11.9% 0.3% Multi-Family and other 3.2% 0.1% Occupancy Primary Residence 84.5% 2.3% Second Home 8.6% 0.2% Non-owner occupied 6.9% 0.2% Alt-A 25.1% 0.7% Arizona at June 30, 2009 1 Condominium includes Townhouses and Cooperatives 2 Excludes unreported FICO scores % of % of AZ RIF Total RIF % of AZ RIF % of Total RIF FICO Scores 720 and above 37.5% 1.0% 680-719 26.6% 0.7% 620-679 29.9% 0.8% 575-619 3.8% 0.1% Less than 575 1.0% 0.0% Loan to Value Above 97.00% 27.5% 0.8% 95.01% to 97.00% 2.5% 0.1% 90.01% to 95.00% 24.5% 0.7% 85.01% to 90.00% 38.5% 1.1% 85.00% and below 7.0% 0.2% $0.8 Billion of Total Risk in Force 2.8% of PMI’s Primary Risk in Force $189,720 Average Loan Size Note: Due to rounding, the sum of percentages may not total 100% Lake Havasu City-Kingman, AZ-0.1% Yuma, AZ – 0.1% Prescott, AZ-0.1% Tucson, AZ-0.4% Phoenix-Mesa, AZ – 2.0% MSA Distribution of Total Primary RIF |
The PMI Group, Inc. 19 Loan Type Fixed Rate 80.9% 1.3% ARM 19.1% 0.3% Property Type Single Family 79.0% 1.3% Condominium 19.2% 0.3% Multi-Family and other 1.8% 0.0% Occupancy Primary Residence 81.6% 1.4% Second Home 12.9% 0.2% Non-owner occupied 5.5% 0.1% Alt-A 32.4% 0.5% Nevada at June 30, 2009 1 Condominium includes Townhouses and Cooperatives 2 Excludes unreported FICO scores % of % of NV RIF Total RIF % of NV RIF % of Total RIF FICO Scores 720 and above 39.7% 0.7% 680-719 27.5% 0.5% 620-679 28.8% 0.5% 575-619 2.9% 0.0% Less than 575 0.5% 0.0% Loan to Value Above 97.00% 19.0% 0.3% 95.01% to 97.00% 1.5% 0.0% 90.01% to 95.00% 27.6% 0.5% 85.01% to 90.00% 44.5% 0.7% 85.00% and below 7.4% 0.1% $0.5 Billion of Total Risk in Force 1.7% of PMI’s Primary Risk in Force $233,469 Average Loan Size Note: Due to rounding, the sum of percentages may not total 100% Las Vegas-Paradise, NV-1.4% Reno-Sparks, NV-0.2% Carson City, NV-0.00% MSA Distribution of Total Primary RIF |
The PMI Group, Inc. 20 Notes 2/28 Hybrid ARMS at June 30, 2009 1Condominium includes Townhouses and Cooperatives 2 Excludes unreported FICO scores FICO Scores 720 and above 12.2% 0.2% 680-719 22.4% 0.4% 620-679 50.9% 1.0% 575-619 8.9% 0.2% Less than 575 5.5% 0.1% Loan to Value Above 97.00% 9.4% 0.2% 95.01% to 97.00% 0.1% 0.0% 90.01% to 95.00% 20.9% 0.4% 85.01% to 90.00% 35.7% 0.7% 85.00% and below 33.9% 0.7% % of 2/28 RIF % of Total RIF % of Total RIF % of 2/28 RIF $0.6 Billion of Total Risk in Force 2.0% of PMI’s Primary Risk in Force $181,307 Average Loan Size All of the 2/28 Hybrid ARMs that PMI has insured are past their rate reset date. 2/28 hybrid ARMs monthly reported notices of default peaked in August 2007. Property Type Single Family 79.8% 1.6% Condominium 7.3% 0.1% Multi-Family and other 12.8% 0.3% Occupancy Primary Residence 78.1% 1.5% Second Home 2.0% 0.0% Non-owner occupied 19.9% 0.4% Alt-A 52.6% 0.9% Note: Due to rounding, the sum of percentages may not total 100% 0% - 1% 1.01% - 2% 2.01% - 5% >10.00% 5.01% - 10% State Distribution of 2/28 RIF |
The PMI Group, Inc. 21 California 28.2% 0.6% Florida 10.6% 0.2% Illinois 5.2% 0.1% Michigan 5.1% 0.1% New York 5.1% 0.1% Texas 3.6% 0.1% Ohio 3.5% 0.1% Arizona 3.0% 0.1% New Jersey 2.7% 0.1% Pennsylvania 2.5% 0.0% 2/28 Hybrid ARMS at June 30, 2009 1 Top ten states as determined by Primary RIF on June 30, 2009 % Total 2/28 RIF % Total RIF Top States¹ MSA Distribution of CA Bulk 2/28 RIF Santa Ana-Anaheim-Irvine –7.8% San Diego – Carlsbad – San Marcos, CA –6.5% Riverside-San Bernardino-Ontario –19.8% Los Angeles-Long Beach-Glendale –24.5% Oakland-Fremont-Hayward, CA– 6.9% |
The PMI Group, Inc. 22 Greater Than 97% LTV at June 30, 2009 1 Condominium includes Townhouses and Cooperatives 2 Excludes unreported FICO scores FICO Scores 720 and above 26.8% 5.5% 680-719 21.8% 4.5% 620-679 38.5% 7.9% 575-619 8.8% 1.8% Less than 575 2.8% 0.6% % of >97 RIF % of Total RIF % of >97 RIF % of Total RIF Loan Type Fixed Rate 94.9% 19.5% ARM 5.1% 1.1% Property Type Single Family 85.6% 17.6% Condominium 12.9% 2.7% Multi-Family and other 1.5% 0.3% Occupancy Primary Residence 95.2% 19.6% Second Home 1.2% 0.2% Non-owner occupied 3.6% 0.8% Alt-A 12.7% 2.3% $6.1 Billion of Total Risk in Force 20.6% of PMI’s Primary Risk in Force $146,809 Average Loan Size With the exception of previously issued commitments, effective March 1, 2008, PMI no longer insures loans with LTV ratios above 97% Guideline Changes Note: Due to rounding, the sum of percentages may not total 100% State Distribution of > 97% LTV RIF 0.00% to 1.00% 1.00% to 2.00% 2.00% to 5.00% 5.00% to 10.00% >10.00% 2 1 |
The PMI Group, Inc. 23 Top States Florida 9.9% 2.0% Texas 9.7% 2.0% Georgia 5.6% 1.1% Illinois 4.8% 1.0% California 4.7% 1.0% Arizona 3.7% 0.8% Virginia 3.6% 0.7% Washington 3.5% 0.7% Maryland 3.5% 0.7% Ohio 3.1% 0.6% Greater Than 97% LTV at June 30, 2009 1 Top ten states as determined by Primary RIF on June 30, 2009 % Total > 97% RIF % Total RIF MSA Distribution of CA > 97% LTV RIF Bakersfield, CA -6.8% San Diego-Carlsbad-San Marcos –8.8% Sacramento--Arden-Arcade—Roseville –11.5% Riverside-San Bernardino-Ontario – 22.3% Los Angeles-Long Beach-Glendale –13.8% MSA Distribution of FL > 97% LTV RIF Fort Lauderdale-Deerfield Beach, FL-9.7% Miami-Miami Beach-Kendall, FL-16.8% Orlando-Kissimmee, FL-16.9% Jacksonville, FL-9.5% Tampa-St. Petersburg-Clearwater, FL-14.8% Houston – Sugar Land - Baytown, TX-31.4% MSA Distribution of TX > 97% LTV RIF Dallas – Plano -Irving, TX-20.0% Austin – Round Rock, TX-6.8% San Antonio, TX-7.1% Fort Worth – Arlington, TX-10.5% 1 |
The PMI Group, Inc. 24 Alt-A at June 30, 2009 1 Condominium includes Townhouses and Cooperatives 2 Excludes unreported FICO scores % of Alt-A RIF % of Total RIF % of Total RIF Loan Type Fixed Rate 75.4% 13.2% ARM 24.6% 4.3% Property Type 1 Single Family 77.7% 13.6% Condominium 15.3% 2.7% Multi-Family and other 7.0% 1.2% Occupancy Primary Residence 80.0% 14.0% Second Home 7.2% 1.3% Non-owner occupied 12.8% 2.3% $5.2 Billion of Total Risk in Force 17.6% of PMI’s Primary Risk in Force $210,548 Average Loan Size Guideline Changes % of Alt-A RIF Note: Due to rounding, the sum of percentages may not total 100% FICO Scores 2 720 and above 37.8% 6.6% 680-719 35.3% 6.2% 620-679 26.9% 4.7% 575-619 0.0% 0.0% Less than 575 0.0% 0.0% Loan to Value Above 97.00% 13.0% 2.3% 95.01% to 97.00% 0.2% 0.0% 90.01% to 95.00% 26.8% 4.7% 85.01% to 90.00% 50.1% 8.8% 85.00% and below 9.9% 1.7% With the exception of previously issued commitments, effective June 1, 2008, PMI no longer insures Alt-A 0.00% to 1.00% 1.00% to 2.00% 2.00% to 5.00% 5.00% to 10.00% >10.00% State Distribution of Alt-A RIF |
The PMI Group, Inc. 25 Top States 1 Florida 20.0% 3.5% California 14.1% 2.5% New York 5.2% 0.9% Illinois 4.9% 0.9% Texas 4.5% 0.8% New Jersey 4.4% 0.8% Arizona 3.7% 0.7% Maryland 3.3% 0.6% Georgia 3.0% 0.5% Virginia 3.0% 0.5% Alt-A at June 30, 2009 % Total Alt-A RIF % Total RIF 1 Top ten states as determined by Primary RIF on June 30, 2009 MSA Distribution of CA Alt-A RIF Santa Ana-Anaheim-Irvine –5.6% San Diego-Carlsbad-San Marcos –8.3% Sacramento--Arden-Arcade—Roseville –8.6% Riverside-San Bernardino-Ontario –21.0% Los Angeles-Long Beach-Glendale –22.6% Tampa-St. Petersburg-Clearwater, FL-12.8% MSA Distribution of FL Alt-A RIF West Palm Beach-Boca Raton, FL-7.7% Fort Lauderdale-Deerfield Beach, FL-11.3% Miami-Miami Beach-Kendall, FL-14.7% Orlando-Kissimmee, FL-19.4% |
Primary Portfolio Characteristics by Vintage |
27 The PMI Group, Inc. $29.4 Billion Primary Risk in Force and $1.6 Billion Pool Risk in Force* Primary Flow 82% Domestic Mortgage Insurance Primary Structured 13% Domestic MI 57% Modified Pool 4% General Portfolio Categories Primary Flow Insurance $25.5 billion of risk in force Primary mortgage insurance offered to lenders on a loan-by-loan basis Primary Structured Insurance $4.0 billion of risk in force Credit enhancement solutions offered across the credit spectrum to agency and non-agency MBS issuers as well as portfolio investors Modified Pool Risk in Force $1.2 billion of risk in force Insurance offered to agency and non-agency MBS issuers and investors Other Pool $0.4 billion of risk in force Prior to 2002, PMI offered certain pool insurance products, referred to principally as GSE or Old Pool, to lenders, the GSEs and non-agency market Other Pool 1% * At June 30, 2009 Note: Due to rounding, the sum of percentages may not total 100% |
The PMI Group, Inc. 28 $26,553 $7,296 $8,803 $11,041 $29,421 $1,486 $6,061 $5,169 $2,279 $2,977 $2,286 $3,273 $520 $582 $3,940 37.3% 22.4% 16.3% 8.7% 17.0% 30.8% 50.4% 36.5% 22.4% 37.5% 30.8% 34.1% 15.1% 17.4% 40.4% Total 720 and above 680 - 719 620 - 679 575 - 619 Less than 575 Fixed Rate ARMs 2/28s Interest Only LTV>97 Alt-A Calif. Florida Auto States Risk Characteristics Risk Characteristics: Total Primary Portfolio Risk in Force (dollars in millions) Default Rate (as measured by policies) Credit Score Total Loan Type Total Primary Portfolio: PMI’s total primary book is primarily driven by the flow channel Loans are primarily fixed rate and owner occupied with FICO scores greater than 620 Certain geographies and select products have exhibited heightened levels of defaults Total Primary Risk in Force as of June 30, 2009 |
The PMI Group, Inc. 29 Primary Portfolio Characteristics Primary RIF as of June 30, 2009 1 Excludes unreported FICO scores 2 At origination Note: Categories are not mutually exclusive except for Credit Score and Loan Type. Vintage refers to the year the insurance was issued. 2/28s All $ in Millions, except for Average Loan Size Specific Portfolio Characteristics Interest Only LTV > 97% Alt-A California Florida Auto States Avg Loan Size Avg LTV Avg FICO Total Credit Score Loan Type Less than 575 575 - 619 720 and above ARM Fixed Rate 620 - 679 680 - 719 Total 2/28s Total Portfolio $29,421.4 $519.6 $1,486.1 $8,802.7 $7,296.5 $11,041.3 $26,553.3 $2,286.2 $581.8 Default Rate 17.0% 40.4% 30.8% 22.4% 16.3% 8.7% 15.1% 37.3% 50.4% 2009 Vintage $1,421.0 $0.2 $0.3 $68.7 $265.1 $1,085.0 $1,416.9 $4.1 $0.0 Default Rate 0.3% 0.0% 0.0% 1.9% 0.4% 0.2% 0.3% 4.2% 0.0% 2008 Vintage $4,461.4 $6.1 $51.7 $810.5 $1,157.6 $2,430.7 $4,406.7 $54.7 $0.0 Default Rate 7.3% 45.6% 28.3% 14.4% 8.0% 3.6% 7.2% 19.7% 0.0% 2007 Vintage $8,296.6 $206.3 $551.0 $2,573.1 $2,126.8 $2,816.7 $7,679.1 $569.0 $48.4 Default Rate 23.9% 44.6% 34.7% 27.3% 23.1% 14.9% 23.0% 34.5% 51.0% 2006 Vintage $4,745.2 $60.6 $203.3 $1,679.0 $1,247.0 $1,531.6 $3,780.8 $675.9 $288.5 Default Rate 26.0% 45.7% 35.4% 30.9% 26.5% 17.1% 21.5% 49.7% 59.6% 2005 Vintage $3,719.8 $48.2 $167.0 $1,357.7 $956.4 $1,162.6 $2,937.0 $575.0 $207.8 Default Rate 19.0% 39.7% 30.9% 23.4% 18.9% 11.0% 15.0% 41.0% 42.2% 2004 Vintage and Prior $6,777.4 $198.2 $512.8 $2,313.6 $1,543.6 $2,014.7 $6,332.9 $407.5 $37.1 Default Rate 12.9% 35.8% 26.2% 16.4% 9.9% 5.4% 12.0% 26.9% 39.6% Total Portfolio $3,273.5 $6,060.9 $5,169.2 $2,279.0 $2,977.3 $3,940.2 $161,248 93% 695 Default Rate 36.5% 22.4% 37.5% 30.8% 34.1% 17.4% 2009 Vintage $3.0 $0.0 $3.0 $40.5 $29.7 $165.0 $217,876 90% 748 Default Rate 5.3% 0.0% 13.3% 0.1% 0.6% 0.4% 2008 Vintage $241.1 $263.4 $227.8 $441.9 $222.5 $548.3 $206,117 91% 722 Default Rate 15.7% 16.5% 28.2% 12.4% 21.0% 7.6% 2007 Vintage $1,562.9 $2,858.1 $2,087.3 $803.4 $924.9 $914.2 $187,554 94% 686 Default Rate 39.2% 26.1% 41.1% 41.9% 44.3% 22.5% 2006 Vintage $878.0 $1,240.8 $1,551.3 $424.7 $735.2 $611.0 $173,799 93% 692 Default Rate 40.4% 22.9% 43.9% 57.2% 51.0% 23.8% 2005 Vintage $504.8 $707.5 $798.8 $318.3 $534.2 $551.5 $157,354 92% 693 Default Rate 33.7% 19.4% 35.7% 39.0% 36.4% 18.2% 2004 Vintage and Prior $83.7 $991.2 $501.1 $250.3 $530.9 $1,150.3 $111,967 92% 686 Default Rate 27.0% 16.7% 20.9% 11.9% 15.9% 16.2% 2 1 |
The PMI Group, Inc. 30 $3,413 $0 $312 $2,509 $1,735 $2,572 $1,811 $4,035 $4,943 $1,134 $25,458 $9,932 $7,450 $6,451 $23,723 43.3% 15.8% 14.7% 33.9% 29.0% 37.5% 22.4% 36.4% 30.2% 15.8% 8.4% 15.6% 21.0% 38.6% Total 720 and above 680 - 719 620 - 679 575 - 619 Less than 575 Fixed Rate ARMs 2/28s Interest Only LTV>97 Alt-A Calif. Florida Auto States Flow Risk in Force as of June 30, 2009 Risk Characteristics: Flow Risk in Force (dollars in millions) Default Rate (as measured by policies) Credit Score Total Loan Type Risk Characteristics Primary Flow Portfolio: PMI’s primary flow book represents 85% of primary insurance and is primarily owner occupied, fixed rate loans with FICO scores greater than 620 Approximately 93% of flow risk in force is within conforming loan limits Approximately 57% of flow risk in force is in captive reinsurance agreements |
The PMI Group, Inc. 31 Flow Portfolio Characteristics Flow RIF as of June 30, 2009 All $ in Millions, except for Average Loan Size Interest Only LTV > 97% Alt-A California Florida Auto States Avg Loan Size Avg LTV Avg FICO Credit Score Loan Type Less than 575 575 - 619 720 and above ARM Fixed Rate 620 - 679 680 - 719 Total 2/28s 1 Excludes unreported FICO scores 2 At origination Note: Categories are not mutually exclusive except for Credit Score and Loan Type. Vintage refers to the year the insurance was issued. Specific Portfolio Characteristics Total Portfolio $25,458.2 $312.3 $1,134.1 $7,449.6 $6,450.9 $9,932.3 $23,723.2 $1,735.1 $0.0 Default Rate 15.8% 43.3% 30.2% 21.0% 15.6% 8.4% 14.7% 38.6% n/a 2009 Vintage $1,420.8 $0.2 $0.3 $68.7 $265.1 $1,085.0 $1,416.7 $4.1 $0.0 Default Rate 0.3% 0.0% 0.0% 1.9% 0.4% 0.2% 0.3% 4.2% n/a 2008 Vintage $4,399.9 $5.2 $48.8 $793.1 $1,141.3 $2,406.9 $4,351.0 $48.9 $0.0 Default Rate 7.2% 46.2% 28.0% 14.3% 8.1% 3.6% 7.1% 20.6% n/a 2007 Vintage $6,882.6 $145.4 $443.0 $2,208.1 $1,806.3 $2,257.1 $6,533.7 $348.9 $0.0 Default Rate 24.8% 53.0% 37.2% 27.8% 24.4% 16.1% 24.2% 45.0% n/a 2006 Vintage $3,531.6 $25.6 $138.6 $1,175.9 $961.9 $1,205.6 $2,991.8 $539.8 $0.0 Default Rate 23.3% 47.2% 32.6% 26.7% 24.4% 16.4% 20.2% 52.2% n/a 2005 Vintage $3,160.0 $22.1 $118.4 $1,096.1 $829.5 $1,065.9 $2,707.8 $452.3 $0.0 Default Rate 17.4% 42.7% 28.9% 21.2% 17.9% 10.8% 14.8% 40.6% n/a 2004 Vintage and Prior $6,063.2 $113.8 $384.9 $2,107.6 $1,446.7 $1,911.9 $5,722.2 $341.1 $0.0 Default Rate 12.2% 33.9% 24.4% 16.0% 9.8% 5.4% 11.6% 23.6% n/a Total Portfolio $2,509.1 $4,942.5 $4,035.1 $1,810.5 $2,572.4 $3,413.3 $161,772 93% 699 Default Rate 36.4% 22.4% 37.5% 29.0% 33.9% 15.8% 2009 Vintage $3.0 $0.0 $3.0 $40.5 $29.7 $165.0 $217,884 90% 748 Default Rate 5.3% 0.0% 13.3% 0.1% 0.6% 0.4% 2008 Vintage $239.7 $241.8 $226.0 $440.6 $220.6 $542.9 $206,278 91% 722 Default Rate 15.8% 16.6% 28.6% 12.4% 20.9% 7.4% 2007 Vintage $1,337.9 $2,398.1 $1,807.5 $687.7 $767.9 $760.9 $189,295 94% 689 Default Rate 40.2% 27.2% 41.7% 44.4% 48.0% 22.3% 2006 Vintage $537.6 $929.2 $988.5 $240.5 $585.0 $436.3 $173,268 93% 696 Default Rate 40.6% 22.3% 45.2% 54.5% 49.7% 19.8% 2005 Vintage $317.3 $629.6 $590.1 $187.1 $493.4 $453.9 $154,982 93% 697 Default Rate 33.1% 18.3% 35.7% 39.8% 35.9% 16.4% 2004 Vintage and Prior $73.6 $743.7 $420.2 $214.2 $475.9 $1,054.3 $112,828 93% 690 Default Rate 25.5% 15.3% 20.5% 11.1% 15.6% 15.3% 2 1 |
The PMI Group, Inc. 32 Risk Characteristics: Structured Transactions $207 $764 $1,119 $582 $527 $2,830 $405 $469 $1,134 $352 $3,963 $1,109 $1,353 $846 $551 50.4% 36.9% 34.8% 27.3% 18.3% 35.8% 39.4% 37.7% 22.2% 36.8% 32.2% 23.8% 12.0% 21.8% 30.3% Total 720 and above 680 - 719 620 - 679 575 - 619 Less than 575 Fixed Rate ARMs 2/28s Interest Only LTV>97 Alt-A Calif. Florida Auto States ` Risk in Force (dollars in millions) Default Rate (as measured by policies) Credit Score Total Loan Type Risk Characteristics Primary Structured Portfolio: PMI’s primary structured book represents approximately 15% of total primary insurance Highest defaults are reported in the 2/28 hybrid ARMs product, in which: All of the 2/28 hybrid ARM risk in force has passed the interest rate reset date Monthly reporting of notices of default began to decline in August 2007 Structured Transactions Risk in Force as of June 30, 2009 |
The PMI Group, Inc. 33 Structured Portfolio Characteristics Structured RIF as of June 30, 2009 All $ in Millions, except for Average Loan Size 1 Excludes unreported FICO scores 2 At origination Note: All of the 2/28 Hybrid ARMs that PMI has insured are past their rate reset date and monthly reported notices of default for this product peaked in late 2007 Categories are not mutually exclusive except for Credit Score and Loan Type. Vintage refers to the year the insurance was issued. Interest Only LTV > 97% Alt-A California Florida Auto States Avg Loan Size Avg LTV Avg FICO Credit Score Loan Type Less than 575 575 - 619 720 and above ARM Fixed Rate 620 - 679 680 - 719 Total 2/28s Specific Portfolio Characteristics Total Portfolio $3,963.2 $207.3 $352.0 $1,353.0 $845.6 $1,108.9 $2,830.2 $551.2 $581.8 Default Rate 23.8% 36.9% 32.2% 30.3% 21.8% 12.0% 18.3% 34.8% 50.4% 2009 Vintage $0.1 $0.0 $0.0 $0.1 $0.0 $0.0 $0.1 $0.0 $0.0 Default Rate 0.0% 0.0% 0.0% 0.0% 0.0% 0.0% 0.0% 0.0% 0.0% 2008 Vintage $61.5 $0.9 $2.9 $17.5 $16.3 $23.8 $55.7 $5.8 $0.0 Default Rate 10.2% 43.6% 31.0% 15.9% 7.0% 2.9% 10.0% 14.3% 0.0% 2007 Vintage $1,414.0 $60.9 $108.0 $365.0 $320.5 $559.6 $1,145.4 $220.1 $48.4 Default Rate 20.1% 32.5% 28.5% 25.3% 17.0% 9.9% 17.0% 28.4% 51.0% 2006 Vintage $1,213.7 $35.0 $64.6 $503.0 $285.0 $326.0 $789.1 $136.1 $288.5 Default Rate 34.8% 44.5% 41.7% 42.3% 34.2% 20.3% 26.9% 42.9% 59.6% 2005 Vintage $559.8 $26.1 $48.6 $261.5 $126.9 $96.7 $229.2 $122.8 $207.8 Default Rate 29.4% 36.8% 36.9% 35.1% 27.0% 13.2% 17.5% 42.4% 42.2% 2004 Vintage and Prior $714.2 $84.4 $127.9 $206.0 $96.9 $102.7 $610.7 $66.4 $37.1 Default Rate 17.8% 38.2% 31.1% 19.6% 11.4% 5.2% 14.8% 40.5% 39.6% Total Portfolio $764.4 $1,118.5 $1,134.1 $468.5 $405.0 $526.9 $158,107 92% 670 Default Rate 36.8% 22.2% 37.7% 39.4% 35.8% 27.3% 2009 Vintage $0.0 $0.0 $0.0 $0.0 $0.0 $0.0 $174,636 88% 718 Default Rate 0.0% 0.0% 0.0% 0.0% 0.0% 0.0% 2008 Vintage $1.3 $21.6 $1.8 $1.3 $1.9 $5.4 $198,865 93% 697 Default Rate 5.6% 15.6% 3.6% 17.2% 27.1% 17.2% 2007 Vintage $225.0 $460.0 $279.9 $115.7 $157.0 $153.3 $180,806 94% 677 Default Rate 33.8% 21.8% 37.9% 29.5% 29.8% 23.3% 2006 Vintage $340.4 $311.5 $562.8 $184.1 $150.2 $174.7 $175,509 92% 680 Default Rate 40.1% 25.4% 41.9% 61.5% 55.9% 34.2% 2005 Vintage $187.5 $77.9 $208.8 $131.2 $40.8 $97.6 $172,984 89% 668 Default Rate 35.2% 30.6% 35.8% 37.3% 42.5% 26.1% 2004 Vintage and Prior $10.1 $247.5 $80.9 $36.0 $55.0 $95.9 $105,921 91% 647 Default Rate 36.6% 19.9% 22.6% 16.8% 18.2% 25.1% 2 1 |
34 The PMI Group, Inc. Modified Pool Portfolio Characteristics All $ in Millions Modified Pool: Data shown in this exhibit is an aggregation of unique pools by book years Modified Pool with Deductibles Modified Pool without Deductibles All $ in Millions Modified Pool as of June 30, 2009 1 Established loss reserves for non-performing (i.e. delinquent) modified pool loans, which represents PMI’s estimate of losses for those loans at June 30, 2009. 2 Remaining risk in force excludes non-performing risk exposures, for which loss reserves have been established. 2004 and Prior 2005 2006 2007 2008 2009 Insurance in Force $2,262 $1,322 $4,334 n/a n/a n/a Stop Loss Amount $483 $54 $317 n/a n/a n/a PMI's Claims Paid to Date $42 $19 $38 n/a n/a n/a Reserves for Losses 1 $40 $22 $32 n/a n/a n/a Remaining Risk In Force 2 $260 $13 $247 n/a n/a n/a 2004 and Prior 2005 2006 2007 2008 2009 Insurance in Force $5,899 $6,396 $12,602 $7,370 n/a n/a Stop Loss Amount $1,315 $367 $635 $273 n/a n/a Losses Applicable to Deductible $114 $65 $69 $7 n/a n/a Deductible Balance $72 $17 $74 $73 n/a n/a PMI's Claims Paid to Date $3 $5 $10 $0 n/a n/a Reserves for Losses 1 $33 $152 $247 $38 n/a n/a Remaining Risk In Force 2 $122 $128 $242 $153 n/a n/a |
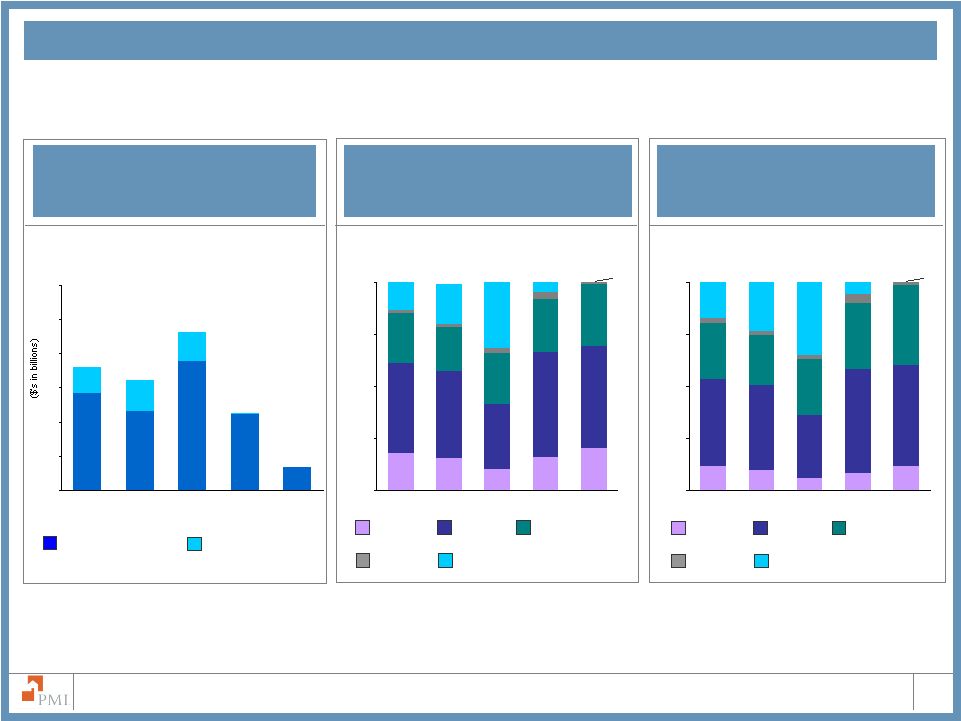
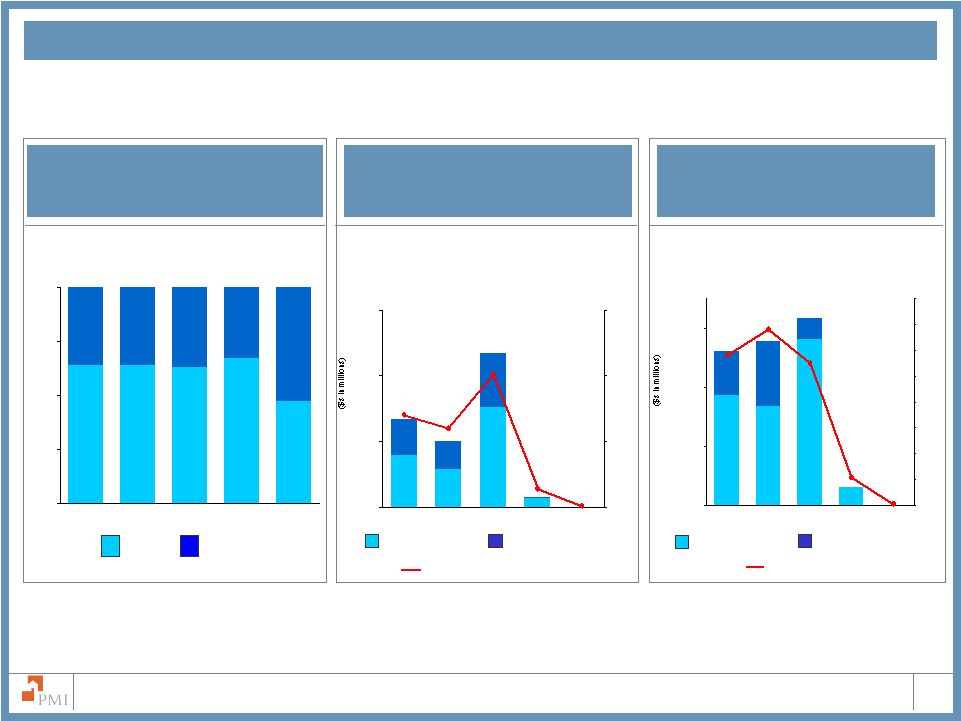
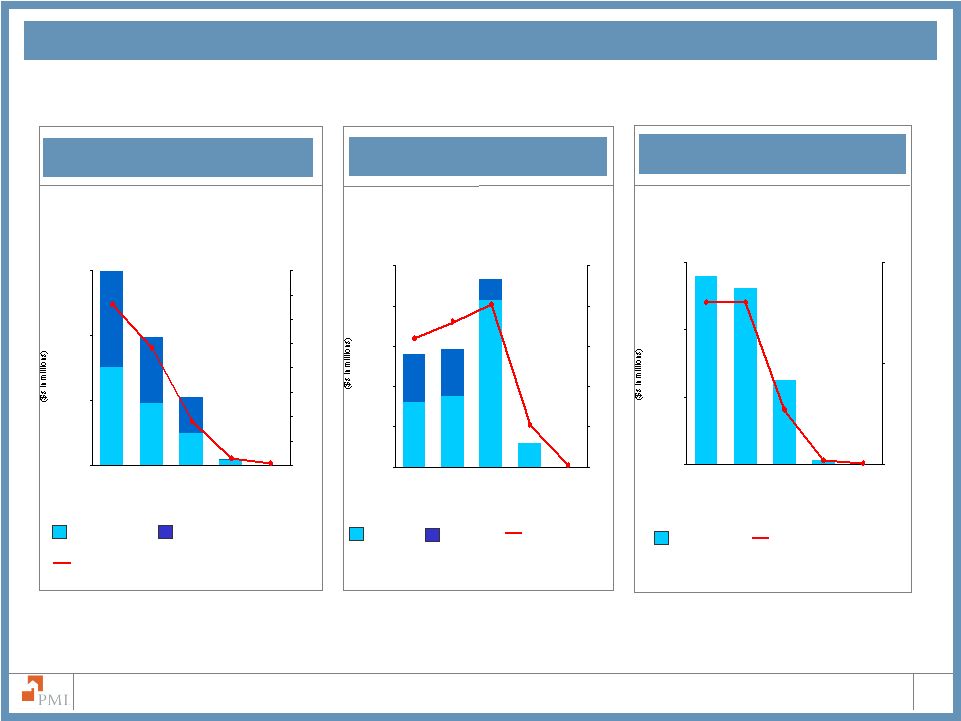
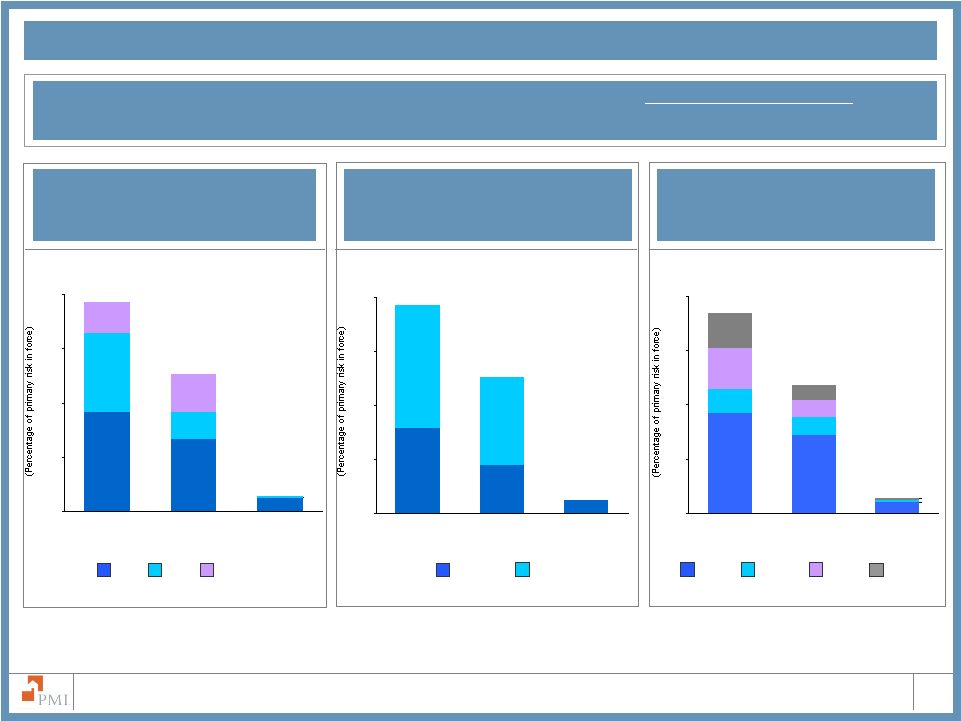
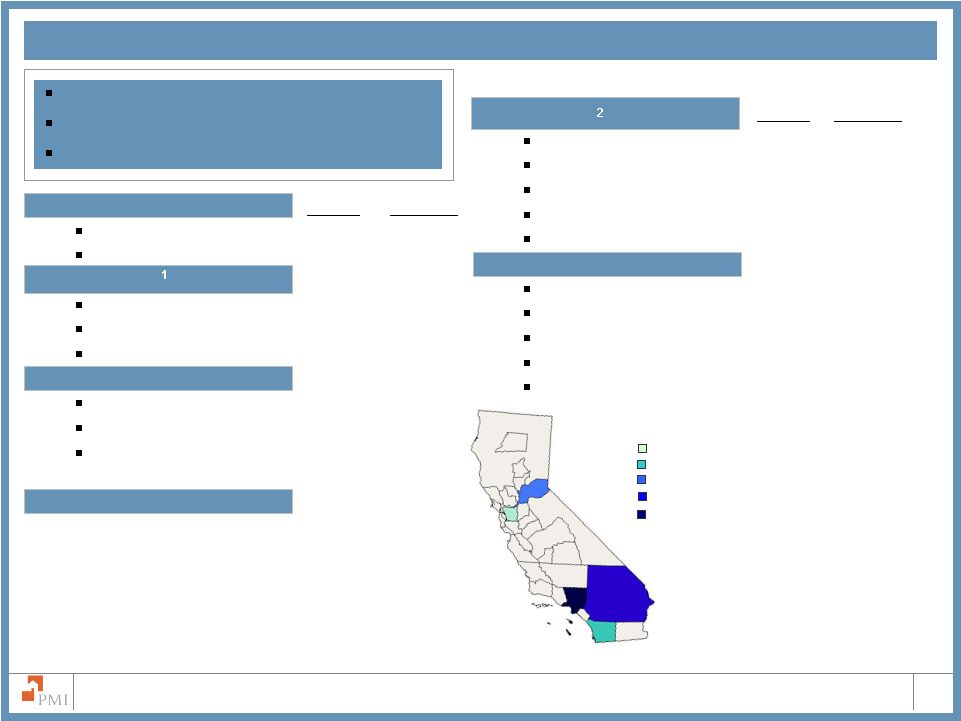
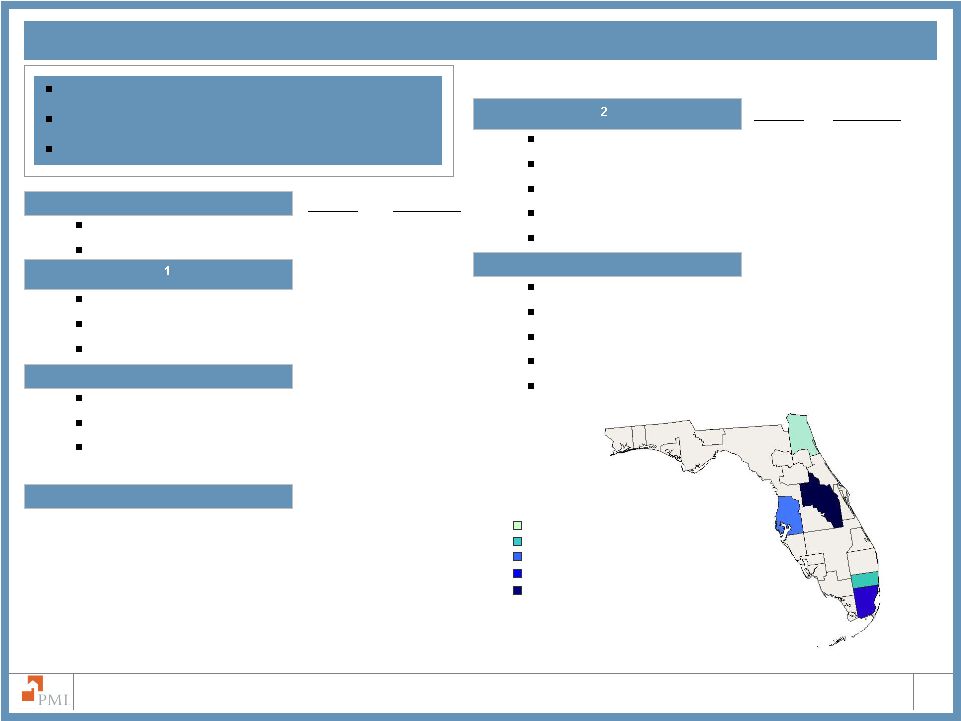
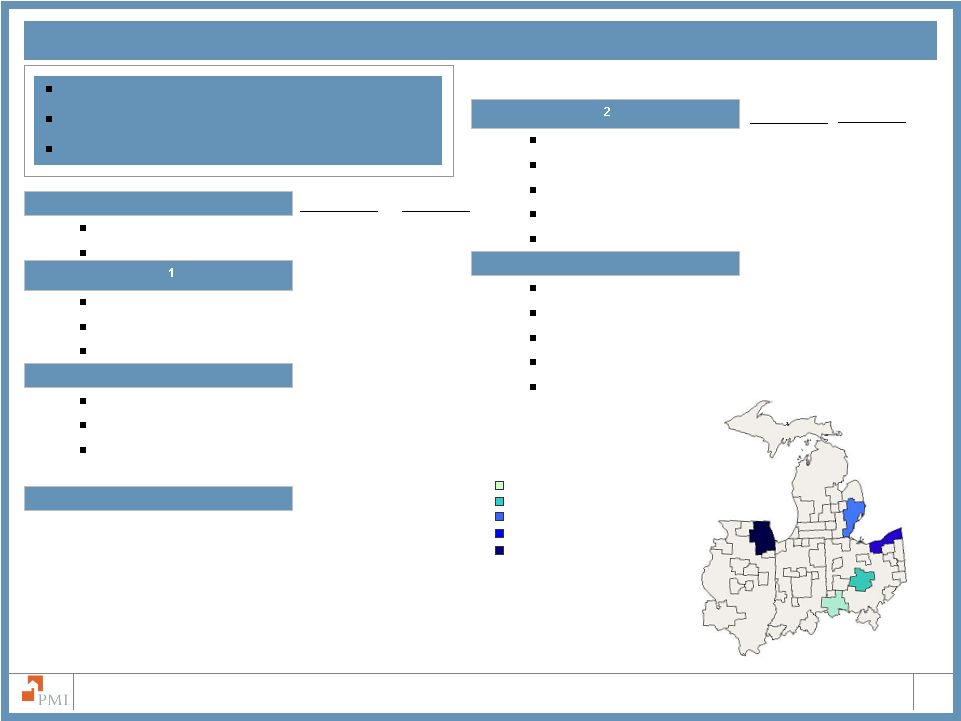
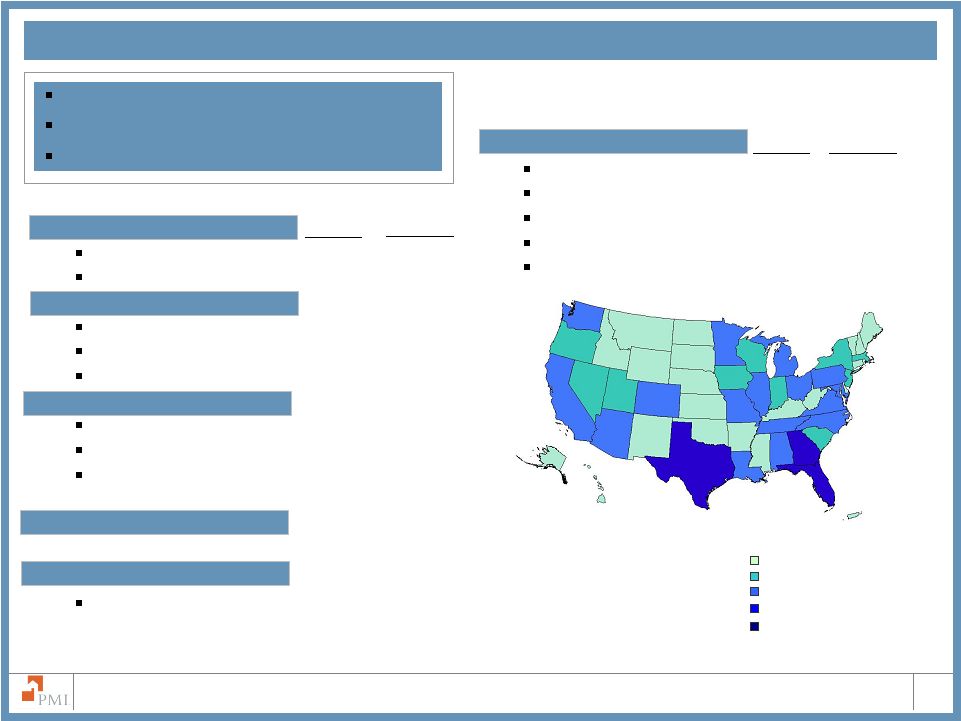
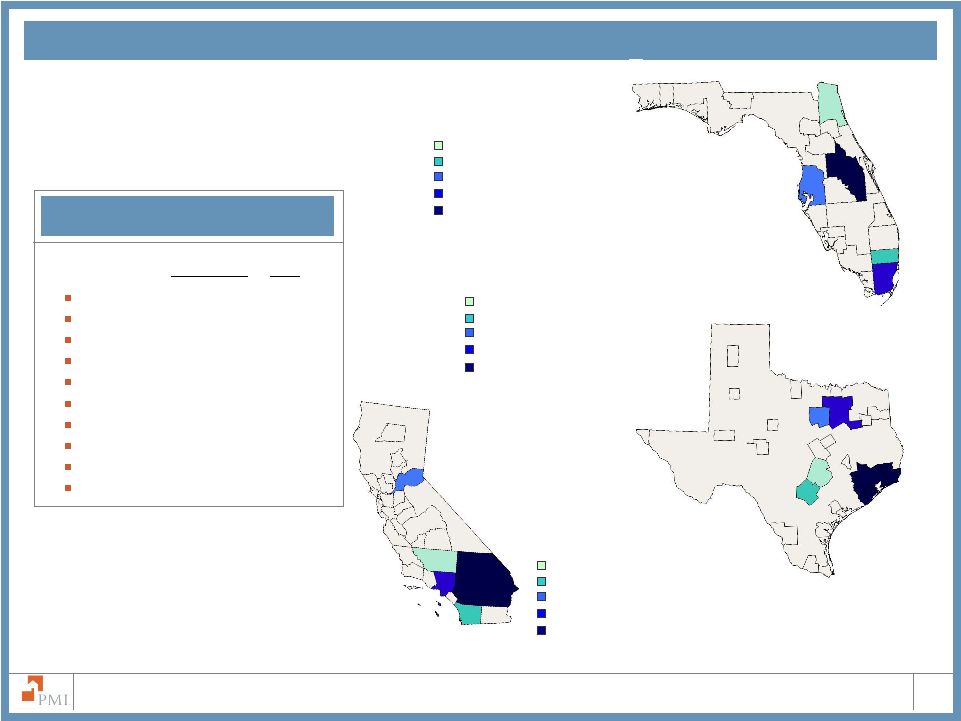
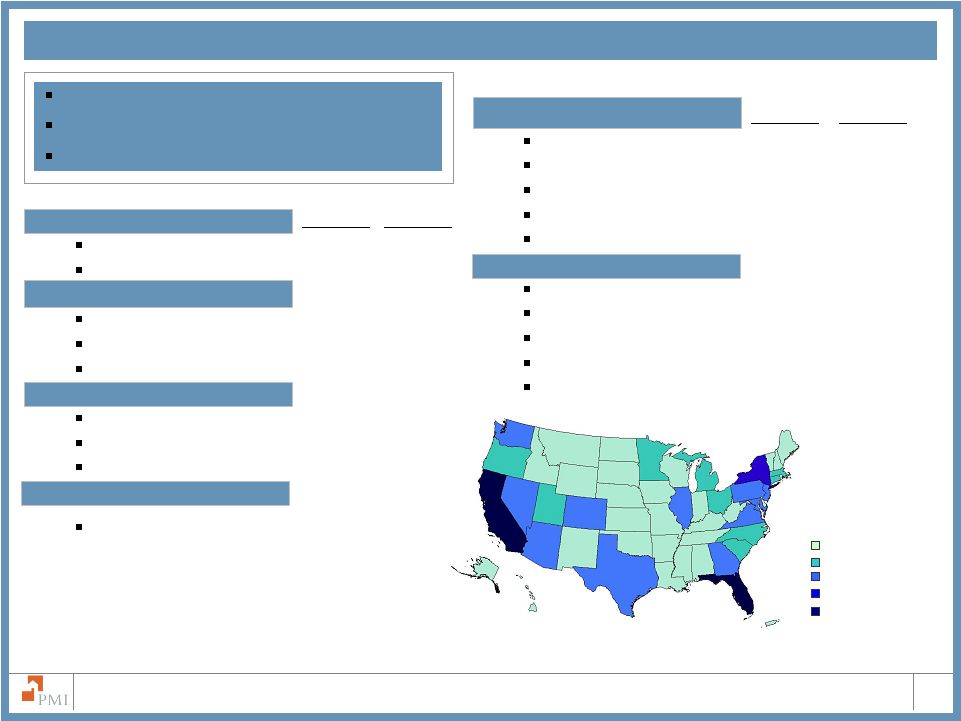
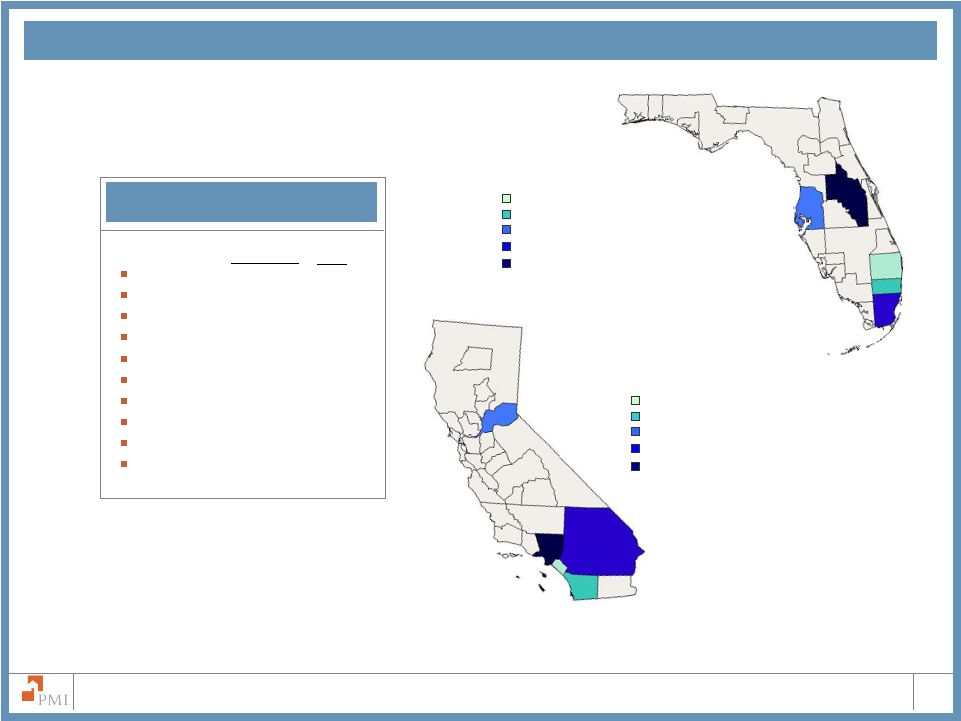
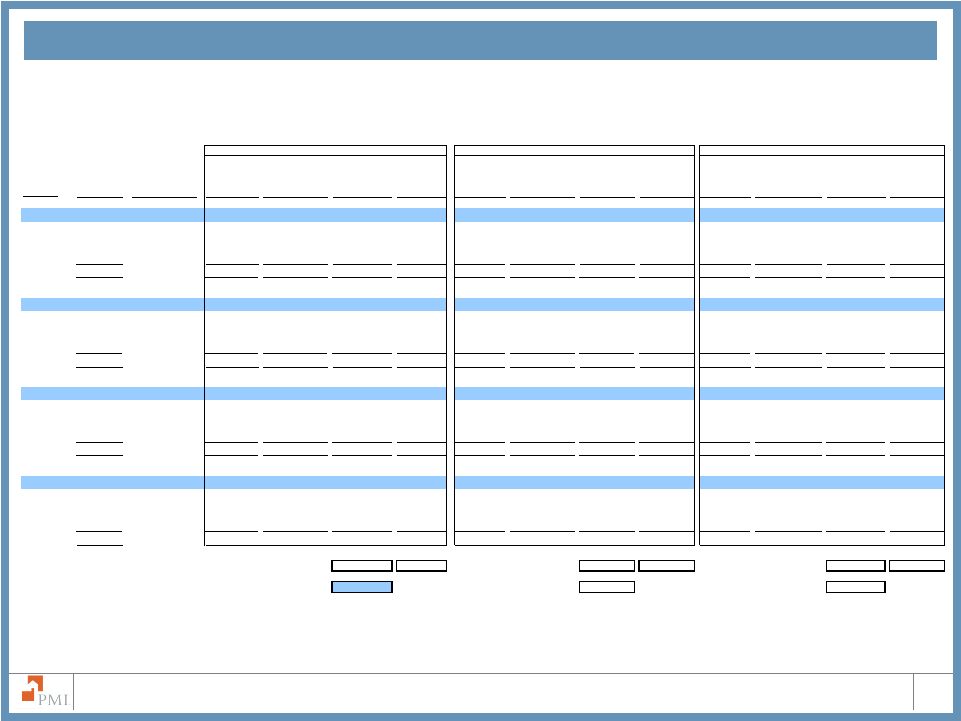
The PMI Group, Inc. Interest Only LTV > 97% Alt-A California Florida Auto States Avg Loan Size Avg LTV Avg FICO 35 Modified Pool Portfolio Characteristics Modified Pool IIF as of June 30, 2009 1 Excludes unreported FICO scores 2 Excludes Balloon, Buy Down, and Other 3 At origination Note: PMI did not insure any modified pool contracts with deductible in 2008 or 2009 and did not insure any modified pool contracts without deductible in 2007, 2008 or 2009 Categories are not mutually exclusive except for Credit Score and Loan Type. Vintage refers to the year the insurance was issued. All $ in Millions, except for Average Loan Size Specific Portfolio Characteristics Specific Portfolio Characteristics Credit Score Loan Type Credit Score Loan Type Total Total Fixed Rate ARM 2/28s Fixed Rate ARM 2/28s Deductible Non Deductible Less than 575 575 - 619 620 - 679 680 - 719 720 and above Less than 575 575 - 619 620 - 679 680 - 719 720 and above Interest Only LTV > 97% Alt-A California Florida Auto States Avg Loan Size Avg LTV Avg FICO Total Portfolio $32,267 $329 $818 $10,200 $9,924 $10,990 $30,386 $1,867 $2 2007 Vintage $7,370 $130 $301 $2,581 $2,484 $1,873 $6,912 $457 $0 2006 Vintage $12,602 $64 $144 $4,811 $4,226 $3,357 $12,432 $168 $2 2005 Vintage $6,396 $5 $54 $1,589 $2,022 $2,724 $5,301 $1,093 $1 2004 Vintage and Prior $5,899 $130 $320 $1,218 $1,192 $3,036 $5,742 $148 $0 Total Portfolio $10,915 $804 $20,916 $5,529 $3,493 $3,234 $173,681 78 699 2007 Vintage $3,140 $697 $4,855 $1,437 $739 $674 $203,973 82 686 2006 Vintage $4,680 $48 $9,097 $2,068 $1,532 $1,191 $187,439 79 693 2005 Vintage $2,399 $36 $4,449 $1,147 $844 $605 $173,310 79 708 2004 Vintage and Prior $697 $24 $2,515 $877 $378 $764 $129,610 72 710 Total Portfolio $7,918 $356 $801 $2,935 $1,874 $1,757 $4,957 $2,892 $16 2006 Vintage $4,334 $345 $759 $1,897 $867 $466 $1,641 $2,677 $16 2005 Vintage $1,322 $0 $5 $273 $391 $637 $1,301 $20 $0 2004 Vintage and Prior $2,262 $11 $37 $765 $617 $654 $2,015 $195 $0 Total Portfolio $1,061 $1,608 $2,946 $1,274 $723 $898 $150,389 86 673 2006 Vintage $306 $1,540 $341 $512 $450 $695 $156,337 93 650 2005 Vintage $604 $1 $939 $290 $100 $57 $195,187 76 718 2004 Vintage and Prior $152 $67 $1,666 $472 $172 $146 $124,599 78 693 |
Captive Reinsurance |
The PMI Group, Inc. 37 $130 $245 $491 $34 2007 2008 2009 2010 Captive reinsurers are wholly-owned, bankruptcy remote subsidiaries of originators that provide mezzanine level reinsurance for loans for which PMI has provided primary mortgage insurance coverage. PMI is the named beneficiary on captive trust balances totaling approximately $898 million as of June 30, 2009. At June 30, 2009, approximately 55.0% of flow risk in force was covered by captive reinsurance agreements, including: Based on current expectations of defaults, PMI forecasts approximately the following reductions to total incurred losses as a result of captive reinsurance agreements in 2009 and 2010: Benefit from Captive Reinsurance Agreements PMI’s Captive Reinsurance Agreements (Dollars in Millions) Flow Risk in Force Covered by Captives ~ 56% of prime ~ 50% of Alt-A ~ 61% of less-than-A quality ~ 56% of LTVs >97%* * Captive coverage for LTVs greater than 97% may overlap with other listed categories Actual Projected |
The PMI Group, Inc. 38 PMI’s Captive Reinsurance Agreements PMI Mortgage Insurance Co. Captive Reinsurance Agreements Analysis (Dollars in Millions) Note: For the combined captive trust arrangements, the weighted average entry point is 4.10% and the weighted average exit point is 12.15%. The cumulative captive benefit on this page is for excess-of-loss (XOL) captive reinsurance agreements only. Note: Due to rounding, the totals may not equal the sum of each category $1,973 $227.6 1,125 158.1 1,065 117.1 187 62.5 $4,350 $565.3 $8.5 $0.6 $75 $1.8 290 11.0 542 34.6 1,761 200.8 $2,668 $248.2 $82.0 $0.0 $53 $0.5 1 0.0 277 12.6 2,434 248.1 $2,765 $261.2 $115.9 $0.0 $99 $1.1 220 5.9 240 8.4 4,605 285.1 $5,163 $300.5 $97.6 $0.0 $304.1 $0.8 $787.8 RIF Current June 30, 2008 Cumulative Cumulative Benefit Benefit Incurred Loss Paid Loss Captive Captive Incurred Losses Ever to Date $1,307 $187.3 1,102 171.1 1,043 141.3 394 79.9 $3,845 $579.7 $10.9 $1.2 $37 $0.7 234 12.6 16 1.3 2,126 295.0 $2,413 $309.7 $128.6 $6.6 $41 $0.9 5 0.2 0 0.0 2,375 326.5 $2,421 $327.5 $158.0 $2.4 $32 $0.3 45 1.5 224 10.1 4,256 397.8 $4,557 $409.7 $187.4 $0.0 $484.9 $10.1 $860.1 Current RIF Ever to Date Incurred Losses Paid Loss Incurred Loss Captive December 31, 2008 Cumulative Cumulative Benefit Captive Benefit Original Progression to Book Year RIF Attachment Point 2004 & Prior Total $13,253 0 - 50% $1,055 $190.1 5,969 50 - 75% 809 154.4 2,907 75-99% 624 88.5 5,039 Attached 959 185.8 $27,169 $3,446 $618.8 $19.8 $1.7 2005 Total $55 0 - 50% $34 $0.8 8 50 - 75% 4 0.3 65 75-99% 34 2.6 4,456 Attached 2,175 371.9 $4,584 $2,248 $375.6 $174.5 $36.6 2006 Total $38 0 - 50% $25 $0.5 26 50 - 75% 16 0.8 1 75-99% 0 0.0 3,296 Attached 2,203 396.1 $3,361 $2,244 $397.4 $198.0 $14.1 2007 Total $36 0 - 50% $28 $0.4 0 50 - 75% 0 0.0 9 75-99% 8 0.4 4,971 Attached 4,188 511.9 $5,017 $4,224 $512.7 $255.6 $0.0 Cumulative Captive Benefit (MM) $647.9 $52.5 Total Captive Trust Balances (MM) $898.0 Cumulative June 30, 2009 Incurred Loss Cumulative Paid Loss Captive RIF Incurred Losses Benefit Captive Benefit Current Ever to Date |
39 The PMI Group, Inc. Forward-Looking Statement Cautionary Statement: Statements in this supplement that are not historical facts, or that relate to future plans, events or performance are "forward-looking" statements within the meaning of the Private Securities Litigation Reform Act of 1995. Such statements include our expectations with respect to reductions to incurred losses provided by captive reinsurance arrangements. Readers are cautioned that forward-looking statements by their nature involve risk and uncertainty because they relate to events and depend on circumstances that will occur in the future. Many factors could cause actual results and developments to differ materially from those expressed or implied by forward-looking statements. Such factors include, among others: • Potential significant future losses as a result of changes in economic and market conditions, such as a deepening of the current economic recession; decreases in housing demand, mortgage originations or housing values; a further reduction in the liquidity in the capital markets or further contraction of credit markets; further increases in unemployment rates; changes in interest rates or consumer confidence; and/or changes in credit spreads; • our expectation that, as a result of continued losses, we will need to raise significant additional capital and/or achieve significant statutory capital relief in 2009; • the risk that we may be unable to maintain minimum regulatory risk-to-capital and policyholders surplus requirements and, in that event, that we must cease writing new business in some or all states; • the limitations we have placed on new business writings and the concentration of our business among a relatively small number of large customers; • the potential future impairment of the value of certain securities held in our investment portfolios as a result of the significant volatility in the capital markets; • the potential that our actual losses may substantially exceed our current loss reserve estimates or that our underwriting policies may not anticipate all risks and/or the magnitude of potential loss; • heightened regulatory and litigation risks faced by the financial services industry, the mortgage insurance industry and PMI; • the potential litigation risk associated with our increased rescission activity and, in the event that we are unsuccessful in defending our rescission decisions, the need to establish loss reserves for, and reassume risk on, delinquent rescinded loans; • the aging of our mortgage insurance portfolio and changes in severity or frequency of losses associated with our mortgage insurance policies; • the performance of our insured portfolio of higher risk loans, such as Alternative-A (“Alt-A”) and less than-A loans, and adjustable rate and interest-only loans, which have resulted in increased losses in 2007 and 2008 and are expected to result in further losses; |
40 The PMI Group, Inc. Forward-Looking Statement • the risk that Fannie Mae and/or Freddie Mac (collectively, the “GSEs”) determine that we are no longer an eligible provider of mortgage insurance; • changes in persistency rates of our mortgage insurance policies caused by, among other things, changes in refinancing activity and home values ; • the risk that we are not able to timely satisfy certain obligations under our credit facility and an event of default occurs; • further downgrades or other ratings actions with respect to our credit ratings or insurer financial strength ratings assigned by the major rating agencies; • heightened competition from the Federal Housing Administration and the Veterans’ Administration or other private mortgage insurers; • potential changes in the charters or business practices of the GSEs, the largest purchasers of mortgages; • volatility in our earnings caused by changes in the fair value of our derivative contracts and our need to reevaluate the premium deficiencies in our mortgage insurance business on a quarterly basis; and • potential additional losses in our European operations as a result of deteriorating economic conditions and the potential that we must make additional capital contributions to those operations pursuant to a capital support agreement. |