Exhibit 99.2
Link to searchable text of slide shown above

Link to searchable text of slide shown above

Link to searchable text of slide shown above
Link to searchable text of slide shown above

Link to searchable text of slide shown above
Link to searchable text of slide shown above
Link to searchable text of slide shown above
Link to searchable text of slide shown above

Link to searchable text of slide shown above
Link to searchable text of slide shown above
Link to searchable text of slide shown above
Link to searchable text of slide shown above

Link to searchable text of slide shown above
Link to searchable text of slide shown above
Link to searchable text of slide shown above
Link to searchable text of slide shown above
Link to searchable text of slide shown above
Searchable text section of graphics shown above
FINANCIAL UPDATE AND OUTLOOK
EDWARD J. RESCH
EXECUTIVE VICE PRESIDENT AND
CHIEF FINANCIAL OFFICER
[LOGO]
TODAY’S DISCUSSION
Year-to-date Financial Review
Achieving Our Goals
Balance Sheet/Capital Management
Summary
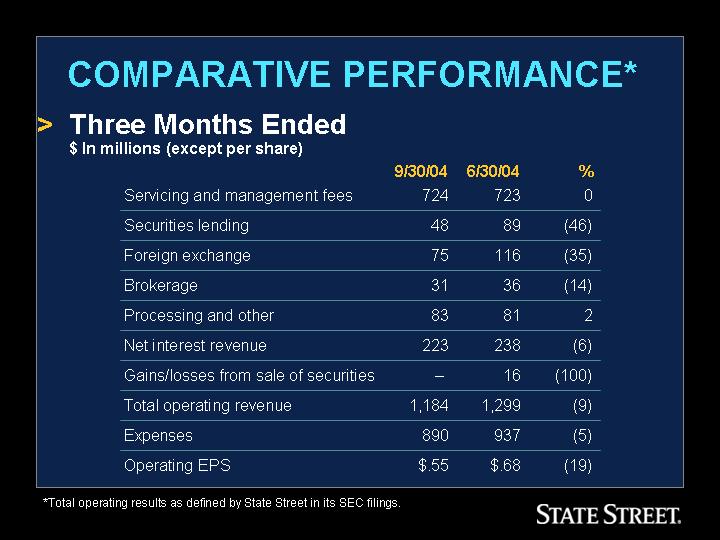
COMPARATIVE PERFORMANCE*
• Three Months Ended
$ In millions (except per share)
|
| 9/30/04 |
| 6/30/04 |
| % |
| ||
Servicing and management fees |
| 724 |
| 723 |
| 0 |
| ||
Securities lending |
| 48 |
| 89 |
| (46 | ) | ||
Foreign exchange |
| 75 |
| 116 |
| (35 | ) | ||
Brokerage |
| 31 |
| 36 |
| (14 | ) | ||
Processing and other |
| 83 |
| 81 |
| 2 |
| ||
Net interest revenue |
| 223 |
| 238 |
| (6 | ) | ||
Gains/losses from sale of securities |
| — |
| 16 |
| (100 | ) | ||
Total operating revenue |
| 1,184 |
| 1,299 |
| (9 | ) | ||
Expenses |
| 890 |
| 937 |
| (5 | ) | ||
Operating EPS |
| $ | .55 |
| $ | .68 |
| (19 | ) |
*Total operating results as defined by State Street in its SEC filings.
OPERATING REVENUE
[CHART]
Operating revenue as defined in State Street Corporation SEC filings.
*Excludes Corporate Trust and Private Asset Management.
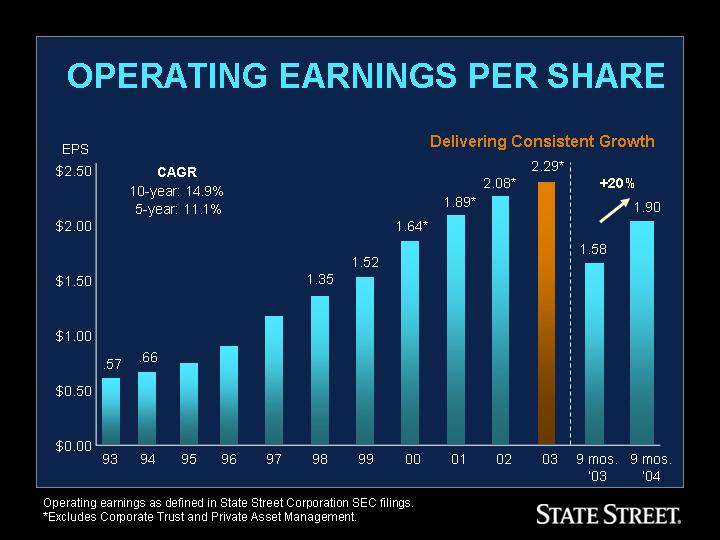
OPERATING EARNINGS PER SHARE
[CHART]
Operating earnings as defined in State Street Corporation SEC filings.
*Excludes Corporate Trust and Private Asset Management.
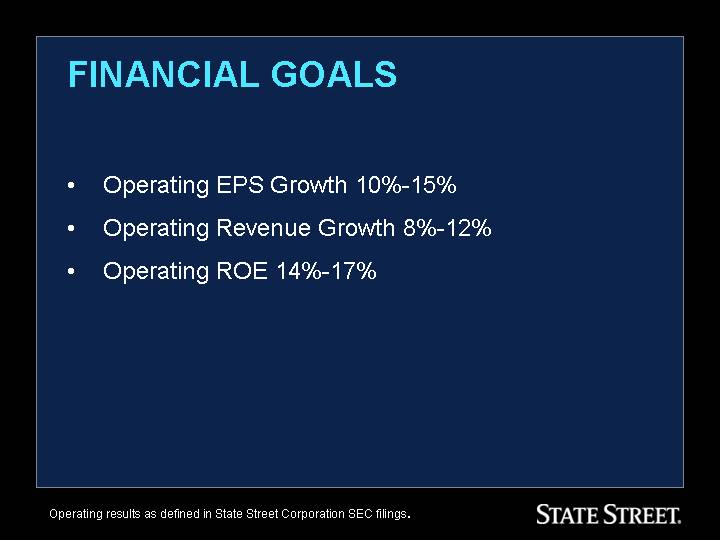
FINANCIAL GOALS
• Operating EPS Growth 10%-15%
• Operating Revenue Growth 8%-12%
• Operating ROE 14%-17%
Operating results as defined in State Street Corporation SEC filings.
ACHIEVING OUR GOALS
• Operating EPS Growth: 10%-15%
• 5-year historic operating EPS Growth (CAGR): 11.1%
• Impact on operating EPS growth
• Revenue growth: 8%-12%
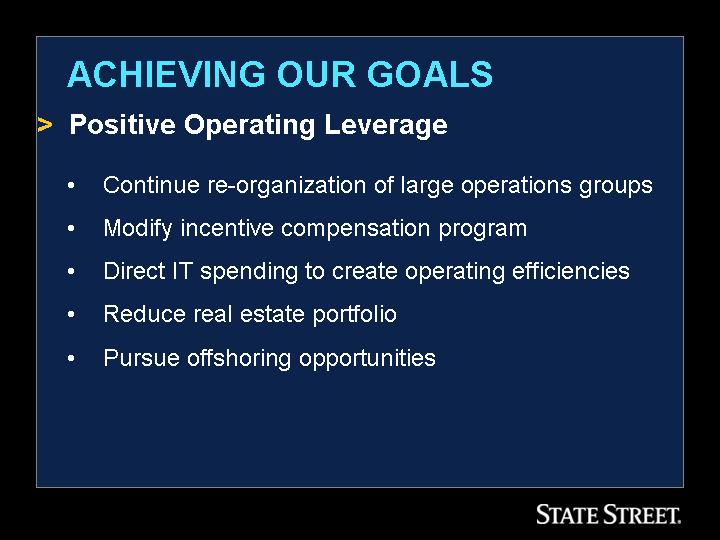
• Positive operating leverage
• Capital management: ~ 1%
Operating earnings as defined in State Street Corporation SEC filings.
• Continue re-organization of large operations groups
• Modify incentive compensation program
• Direct IT spending to create operating efficiencies
• Reduce real estate portfolio
• Pursue offshoring opportunities
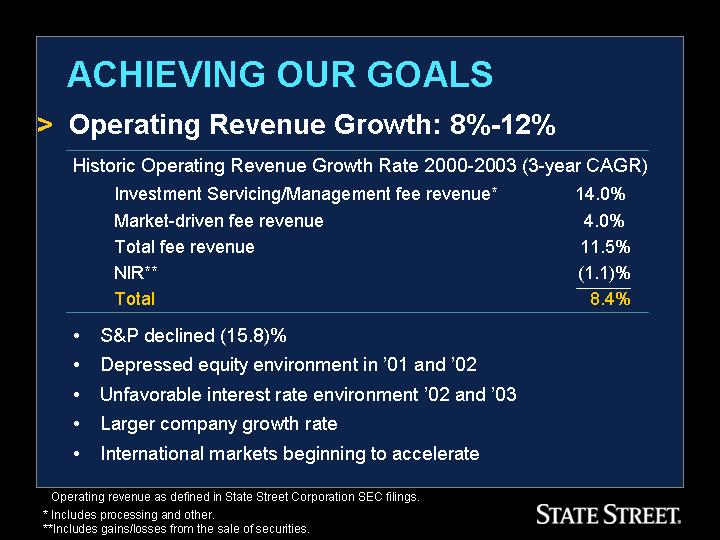
• Operating Revenue Growth: 8%-12%
Historic Operating Revenue Growth Rate 2000-2003 (3-year CAGR)
Investment Servicing/Management fee revenue* |
| 14.0 | % |
Market-driven fee revenue |
| 4.0 | % |
Total fee revenue |
| 11.5 | % |
NIR** |
| (1.1 | )% |
Total |
| 8.4 | % |
• S&P declined (15.8)%
• Depressed equity environment in ‘01 and ‘02
• Unfavorable interest rate environment ‘02 and ‘03
• Larger company growth rate
• International markets beginning to accelerate
Operating revenue as defined in State Street Corporation SEC filings.
* Includes processing and other.
** Includes gains/losses from the sale of securities.
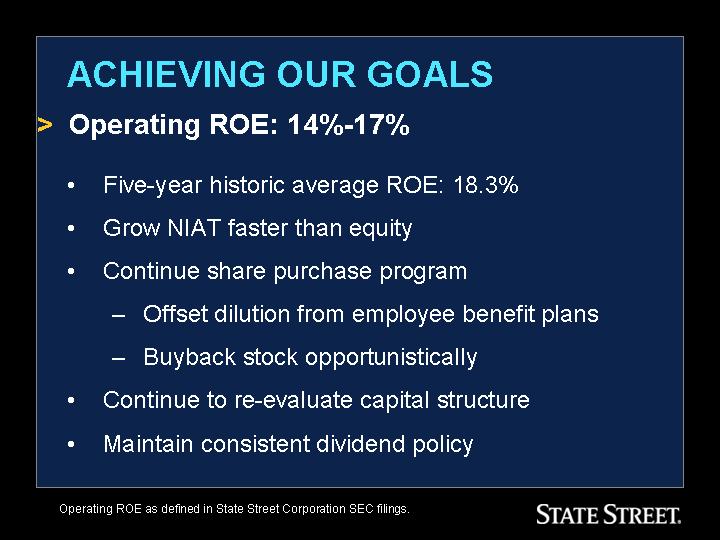
• Five-year historic average ROE: 18.3%
• Grow NIAT faster than equity
• Continue share purchase program
• Offset dilution from employee benefit plans
• Buyback stock opportunistically
• Continue to re-evaluate capital structure
• Maintain consistent dividend policy
Operating ROE as defined in State Street Corporation SEC filings.
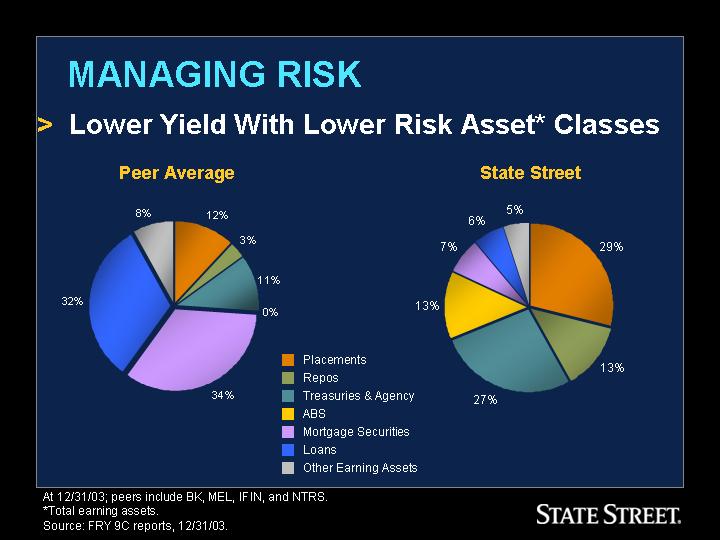
MANAGING RISK
• Lower Yield With Lower Risk Asset* Classes
Peer Average | State Street |
|
|
[CHART] | [CHART] |
At 12/31/03; peers include BK, MEL, IFIN, and NTRS.
*Total earning assets.
Source: FRY 9C reports, 12/31/03.
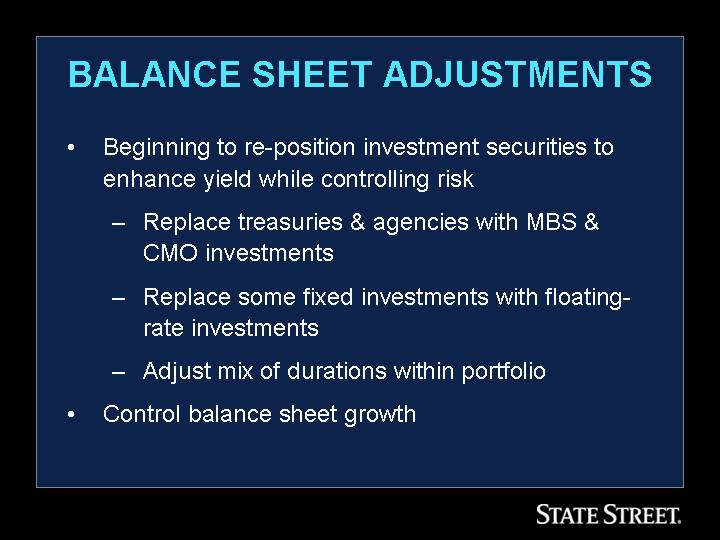
BALANCE SHEET ADJUSTMENTS
• Beginning to re-position investment securities to enhance yield while controlling risk
• Replace treasuries & agencies with MBS & CMO investments
• Replace some fixed investments with floating-rate investments
• Adjust mix of durations within portfolio
• Control balance sheet growth
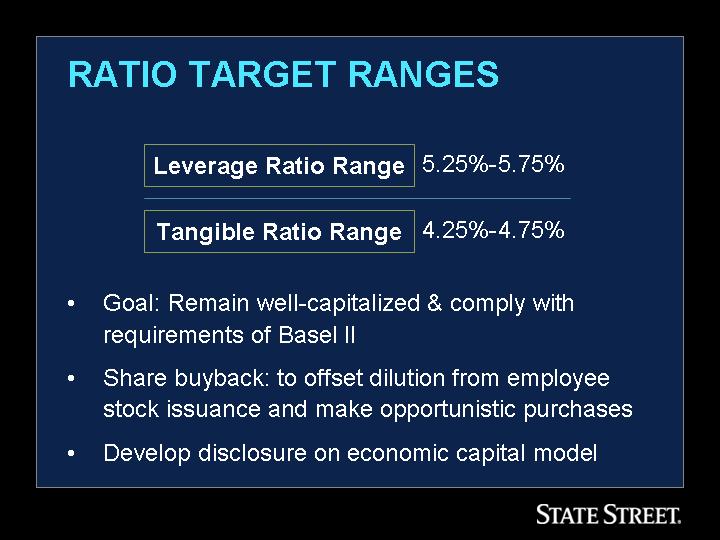
RATIO TARGET RANGES
Leverage Ratio Range | 5.25%-5.75% |
|
|
Tangible Ratio Range | 4.25%-4.75% |
• Goal: Remain well-capitalized & comply with requirements of Basel II
• Share buyback: to offset dilution from employee stock issuance and make opportunistic purchases
• Develop disclosure on economic capital model
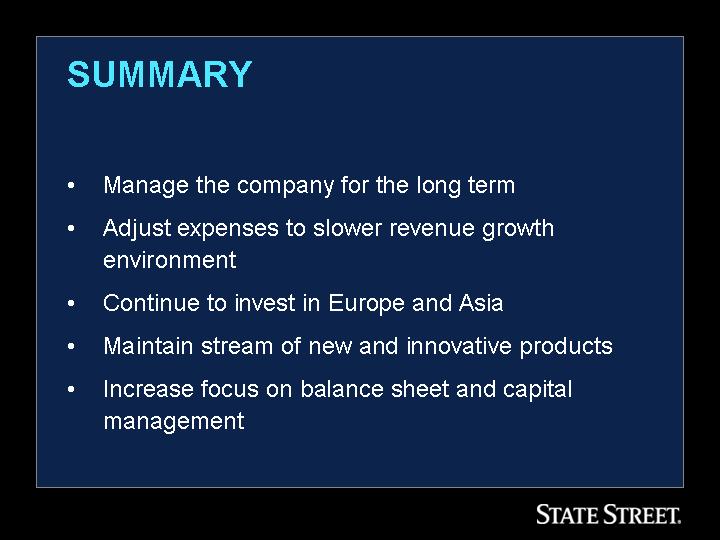
SUMMARY
• Manage the company for the long term
• Adjust expenses to slower revenue growth environment
• Continue to invest in Europe and Asia
• Maintain stream of new and innovative products
• Increase focus on balance sheet and capital management