Exhibit 99.2
1 Title: Asset-Backed Commercial Paper As of 6/30/08
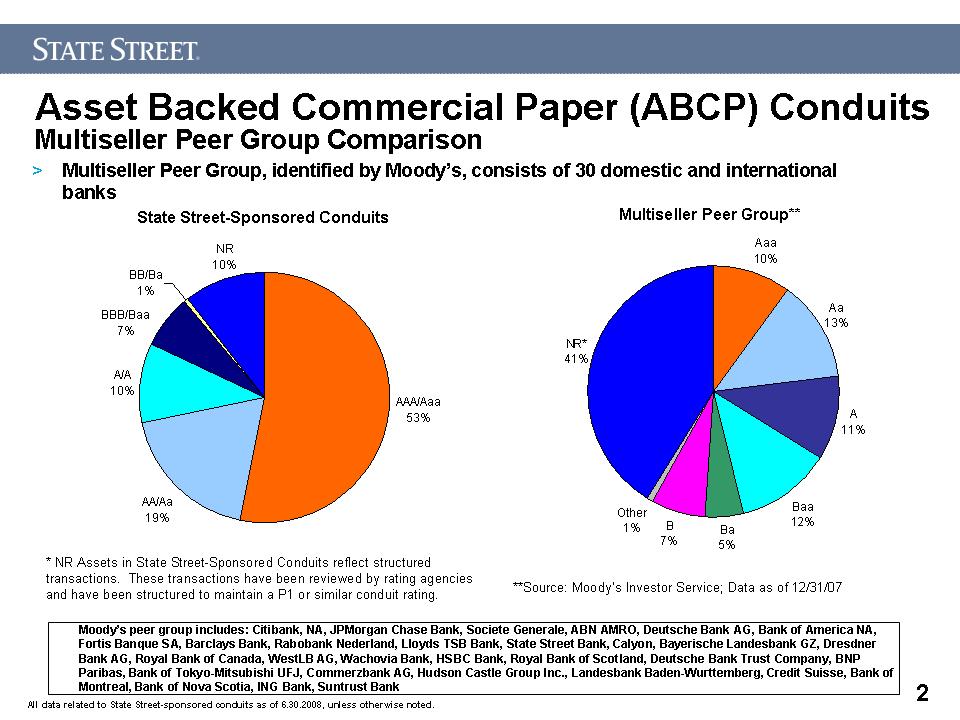
2 Title: Asset Backed Commercial Paper (ABCP) Conduits Multiseller Peer Group Comparison State Street-Sponsored Conduits 2 Multiseller Peer Group** **Source: Moody’s Investor Service; Data as of 12/31/07 Multiseller Peer Group, identified by Moody’s, consists of 30 domestic and international banks * NR Assets in State Street-Sponsored Conduits reflect structured transactions. These transactions have been reviewed by rating agencies and have been structured to maintain a P1 or similar conduit rating. Moody’s peer group includes: Citibank, NA, JPMorgan Chase Bank, Societe Generale, ABN AMRO, Deutsche Bank AG, Bank of America NA, Fortis Banque SA, Barclays Bank, Rabobank Nederland, Lloyds TSB Bank, State Street Bank, Calyon, Bayerische Landesbank GZ, Dresdner Bank AG, Royal Bank of Canada, WestLB AG, Wachovia Bank, HSBC Bank, Royal Bank of Scotland, Deutsche Bank Trust Company, BNP Paribas, Bank of Tokyo-Mitsubishi UFJ, Commerzbank AG, Hudson Castle Group Inc., Landesbank Baden-Wurttemberg, Credit Suisse, Bank of Montreal, Bank of Nova Scotia, ING Bank, Suntrust Bank
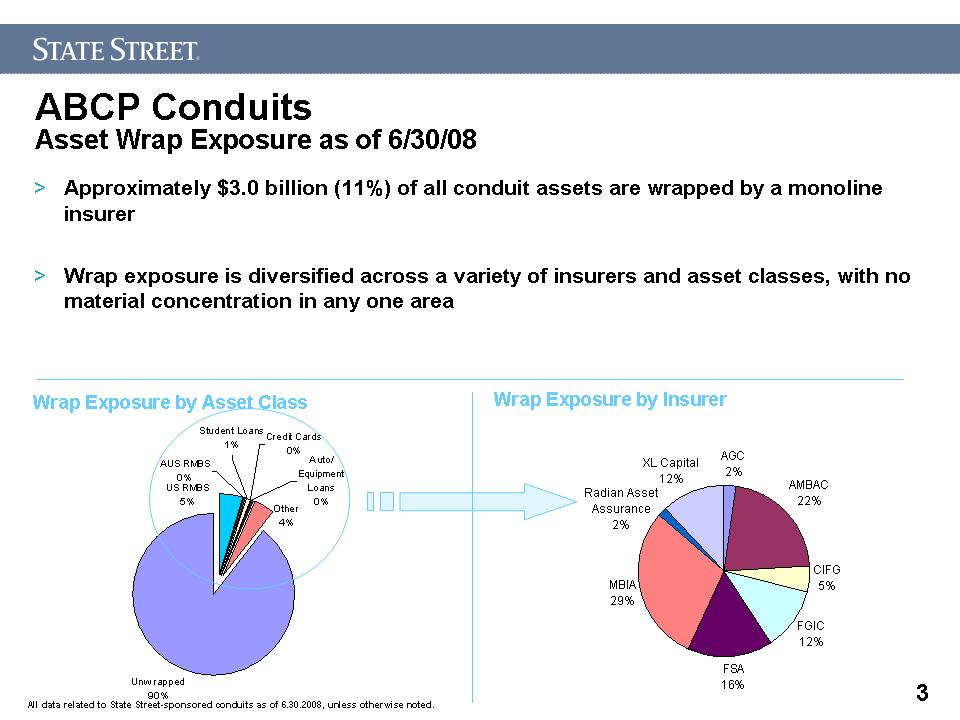
3 ABCP Conduits Asset Wrap Exposure as of 6/30/08 Approximately $3.0 billion (11%) of all conduit assets are wrapped by a monoline insurer Wrap exposure is diversified across a variety of insurers and asset classes, with no material concentration in any one area Wrap Exposure by Asset Class Wrap Exposure by Insurer

4ABCP Conduits KEY METRICS
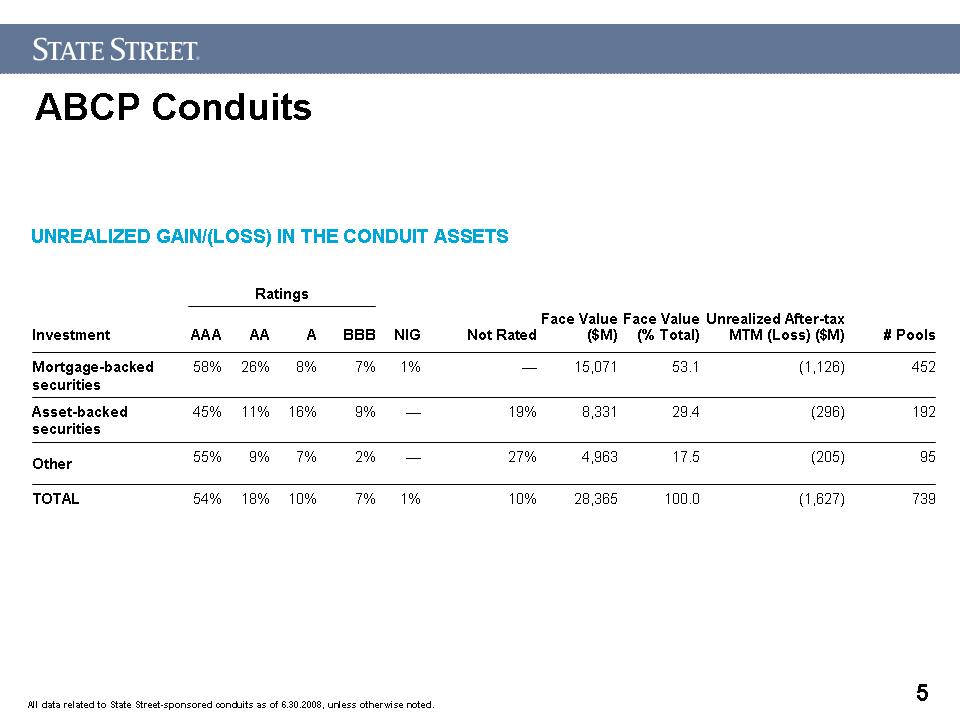
5 ABCP Conduits UNREALIZED GAIN/(LOSS) IN THE CONDUIT ASSETS
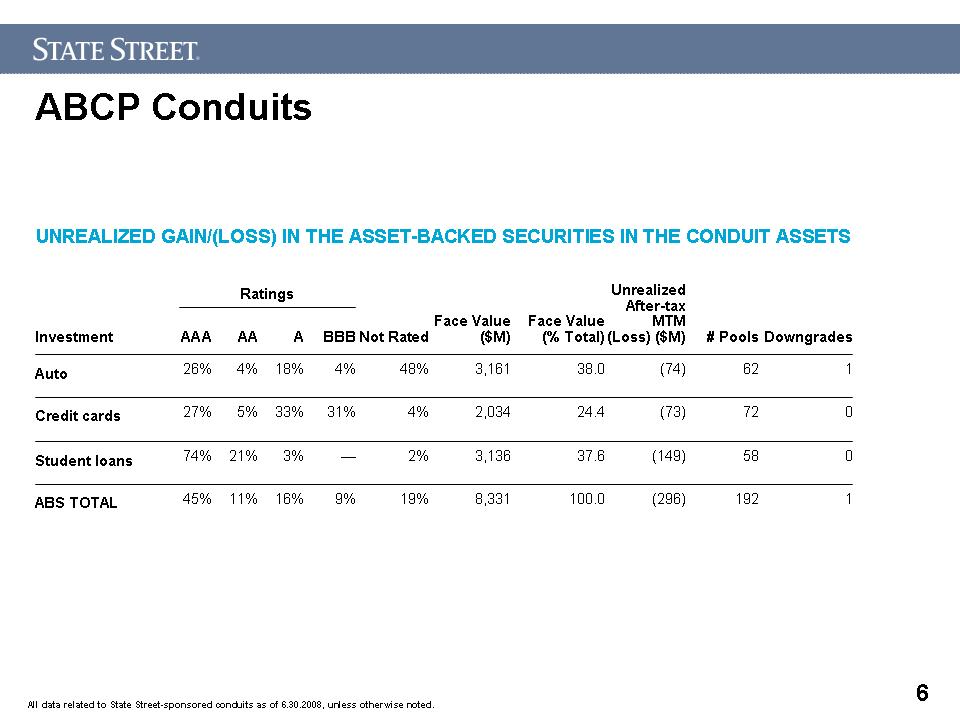
6 ABCP Conduits UNREALIZED GAIN/(LOSS) IN THE ASSET-BACKED SECURITIES IN THE CONDUIT ASSETS
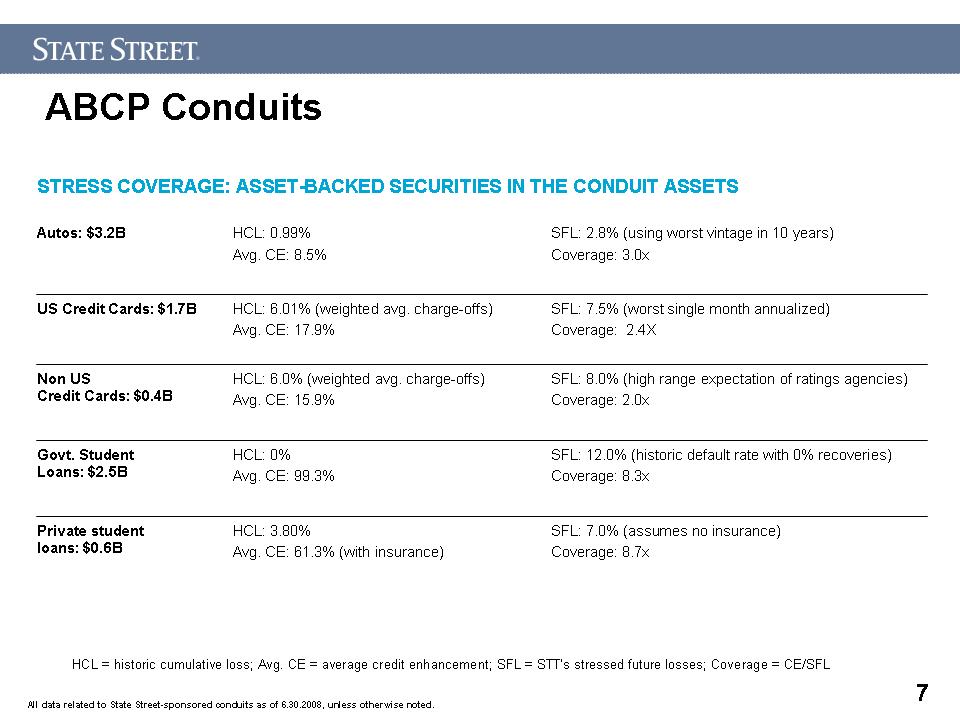
7 ABCP Conduits STRESS COVERAGE: ASSET-BACKED SECURITIES IN THE CONDUIT ASSETS HCL = historic cumulative loss; Avg. CE = average credit enhancement; SFL = STT’s stressed future losses; Coverage = CE/SFL
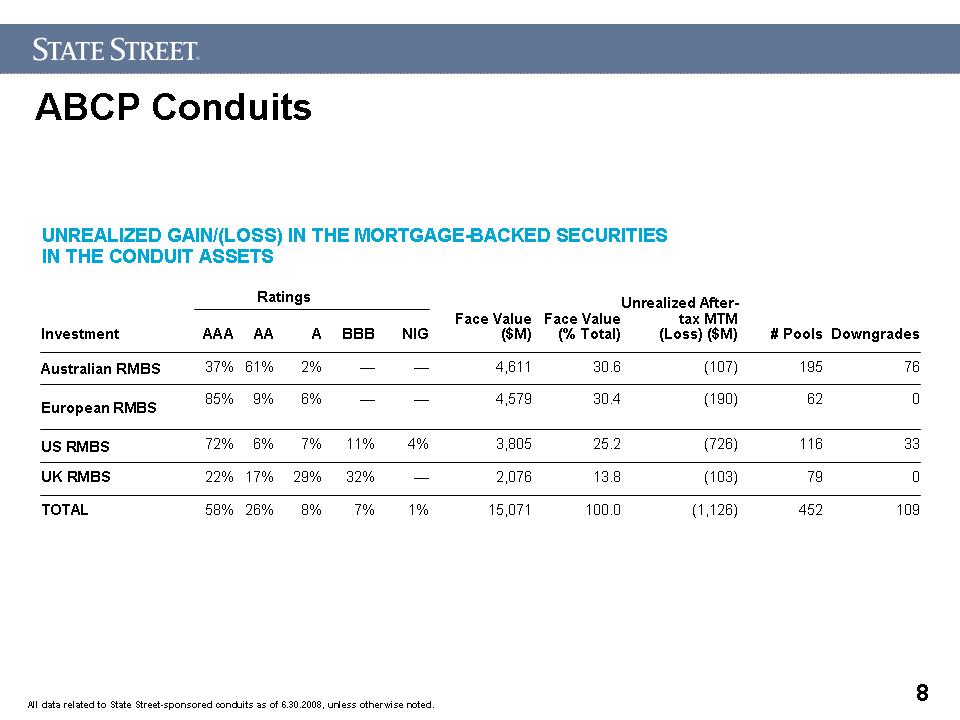
8 Title: ABCP Conduits UNREALIZED GAIN/(LOSS) IN THE MORTGAGE-BACKED SECURITIES IN THE CONDUIT ASSETS
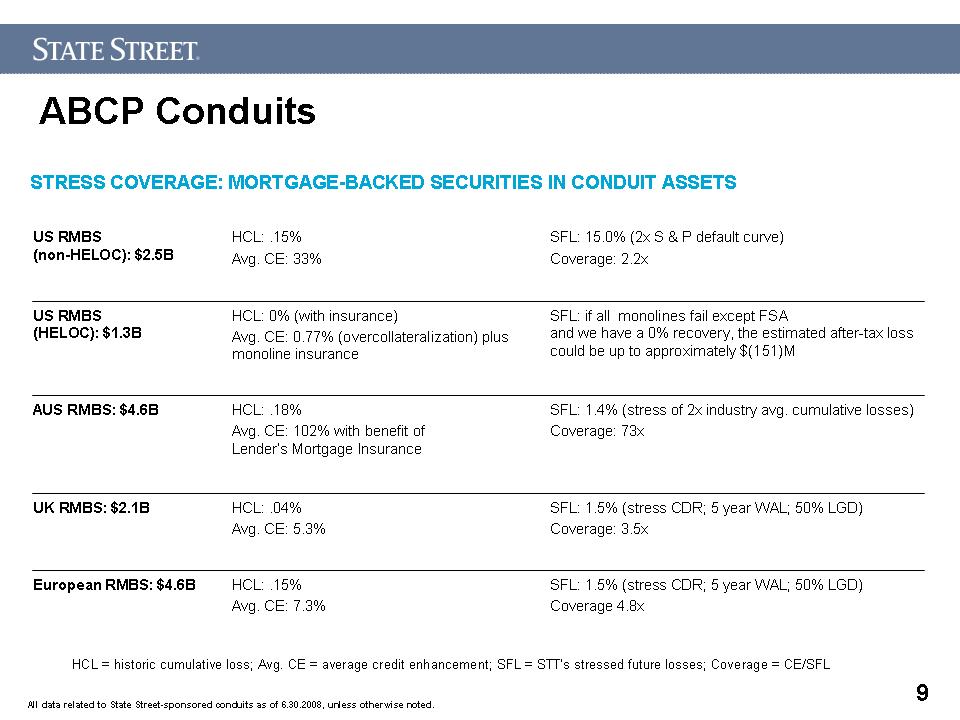
9 ABCP Conduits STRESS COVERAGE: MORTGAGE-BACKED SECURITIES IN CONDUIT ASSETS HCL = historic cumulative loss; Avg. CE = average credit enhancement; SFL = STT’s stressed future losses; Coverage = CE/SFL
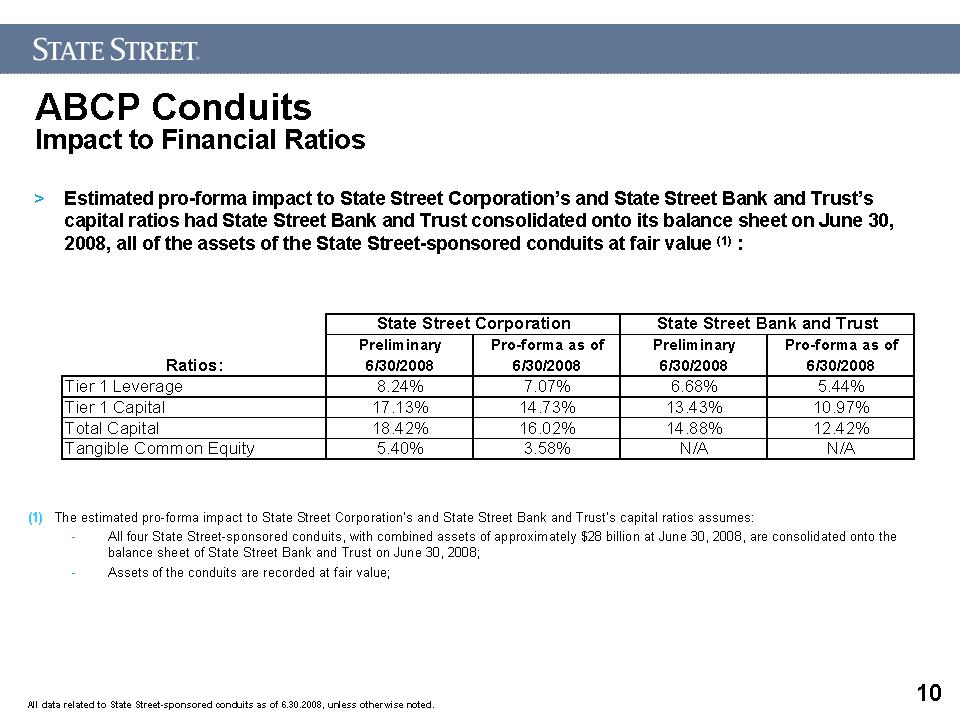
10 ABCP Conduits Impact to Financial Ratios Estimated pro-forma impact to State Street Corporation’s and State Street Bank and Trust’s capital ratios had State Street Bank and Trust consolidated onto its balance sheet on June 30, 2008, all of the assets of the State Street-sponsored conduits at fair value (1) : (1) The estimated pro-forma impact to State Street Corporation’s and State Street Bank and Trust’s capital ratios assumes: All four State Street-sponsored conduits, with combined assets of approximately $28 billion at June 30, 2008, are consolidated onto the balance sheet of State Street Bank and Trust on June 30, 2008; Assets of the conduits are recorded at fair value;
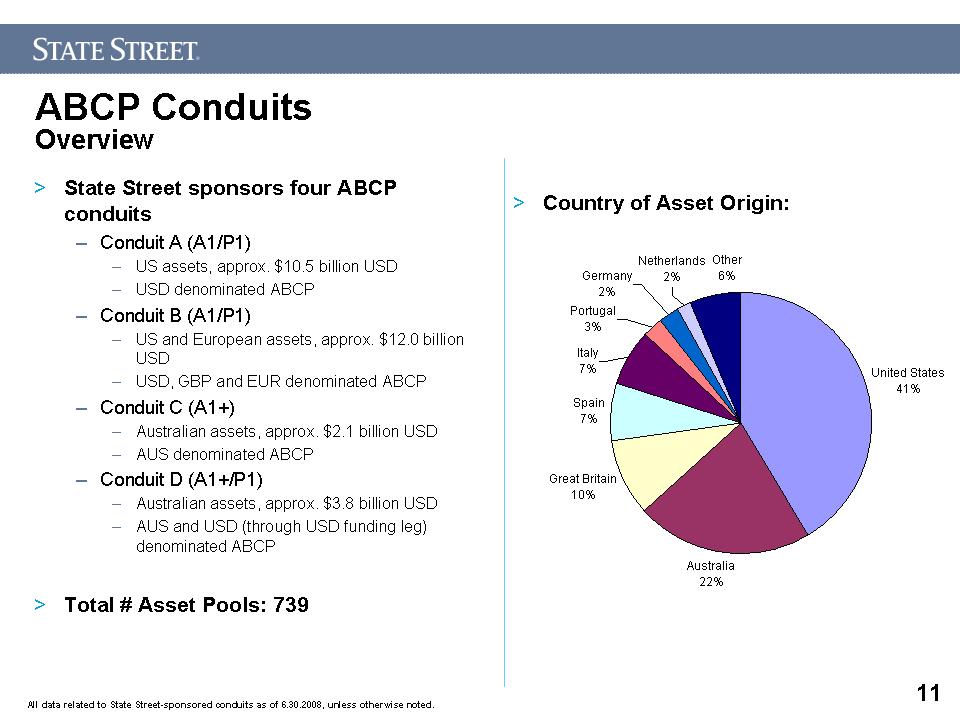
11 Title: ABCP Conduits Overview Body: State Street sponsors four ABCP conduits Conduit A (A1/P1) US assets, approx. $10.5 billion USD USD denominated ABCP Conduit B (A1/P1) US and European assets, approx. $12.0 billion USD USD, GBP and EUR denominated ABCP Conduit C (A1+) Australian assets, approx. $2.1 billion USD AUS denominated ABCP Conduit D (A1+/P1) Australian assets, approx. $3.8 billion USD AUS and USD (through USD funding leg) denominated ABCP Total # Asset Pools: 739 Country of Asset Origin:
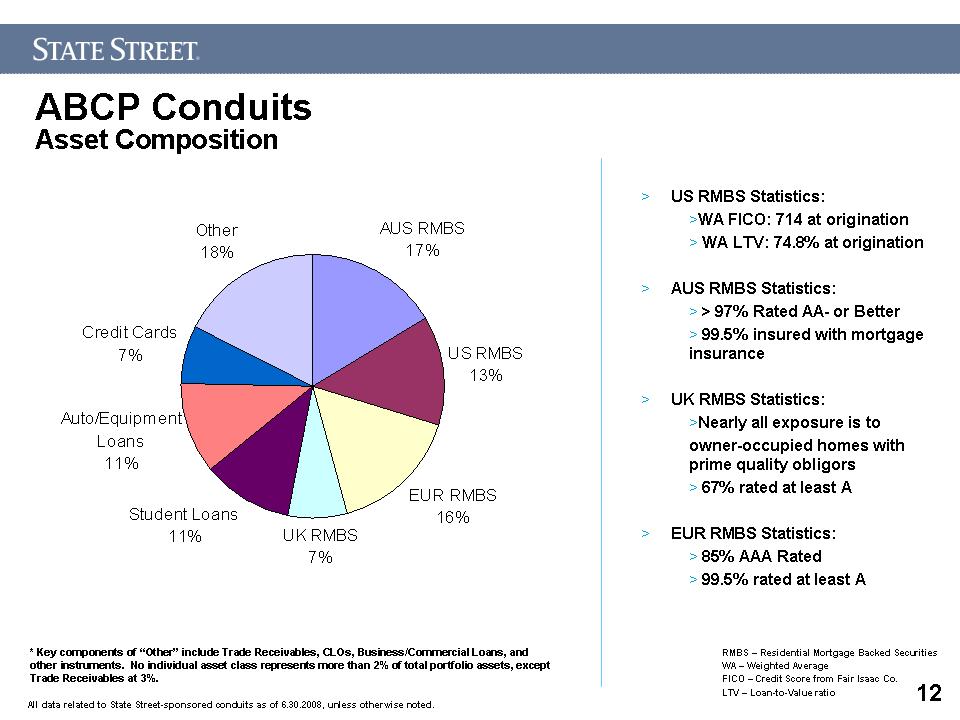
12 ABCP Conduits Asset Composition US RMBS Statistics: WA FICO: 714 at origination WA LTV: 74.8% at origination AUS RMBS Statistics: > 97% Rated AA- or Better 99.5% insured with mortgage insurance UK RMBS Statistics: Nearly all exposure is to owner-occupied homes with prime quality obligors 67% rated at least A EUR RMBS Statistics: 85% AAA Rated 99.5% rated at least A RMBS – Residential Mortgage Backed Securities WA – Weighted Average FICO – Credit Score from Fair Isaac Co. LTV – Loan-to-Value ratio * Key components of “Other” include Trade Receivables, CLOs, Business/Commercial Loans, and other instruments. No individual asset class represents more than 2% of total portfolio assets, except Trade Receivables at 3%.
13 ABCP Conduits Asset Sourcing and Approval Body: Conduit assets are originated through public security purchases and existing client relationships All assets and associated State Street liquidity facilities are approved by State Street’s Enterprise Risk Management (ERM), either through a formal review at the time of purchase or through inclusion on a list of pre-approved transactions/structures A majority of assets are either explicitly rated or reviewed by rating agencies (Moody’s, Standard & Poor’s) Conduits subject to significant internal controls Dedicated surveillance team responsible for monthly monitoring of asset performance Robust liability management oversight, including economic and market updates, and weekly management meetings Dedicated administration team responsible for asset and liability administration, annual audits and accounting policy
14 Conduit Oversight and Approval Body: ERM Oversight ERM establishes prudential limits and diversification requirements ERM monitors asset performance monthly through management’s surveillance reporting Key Credit Characteristics Strong overall asset quality supported by diversified pools of relatively homogenous financial obligations No material concentration risk among issuers or servicers No exposure to subprime mortgages and no exposure to asset-backed collateralized debt obligations (CDOs) Rating Quality Transactions that carry external ratings are mapped to State Street’s internal credit risk rating scale, unless an override is deemed appropriate by Enterprise Risk Management Transactions without external ratings are rated internally using proprietary models that are subject to ERM oversight and compliance with State Street’s Model Risk Policy and Guidelines
15 Key Credit Characteristics – US RMBS Exposure to US RMBS totals $3.8BN, consisting entirely of senior positions in the capital structure Collateral pools are comprised of mostly floating rate, Alt-A loans and Home Equity Lines of Credit (HELOCs). Underlying pool characteristics are strong for RMBS (WA FICO score of 714, and WA LTV of 74.8%, at origination) $2.2BN of this exposure (59%) represents “super-senior” positions in RMBS, with 2-5X the initial enhancement levels required to achieve an external rating of AAA/Aaa $1.3BN in HELOC exposure (35%), all of which is insured by one of six bond insurers The remaining $248.2MM of US RMBS exposure (7%) represents well-seasoned issues externally rated AAA that exhibit strong underlying pool characteristics (WA FICO score of 720, and a WA LTV of 68%, at origination)
16 Exposure to AUS RMBS totals $4.6BN (US Equiv.), greater than 97% of which is externally rated AA- or better, and all of which is externally rated A or better Collateral consists of diversified pools of prime obligors supported by private mortgage insurance policies (99.5%) that cover principal and interest shortfalls on defaulted / foreclosed loans Greater than 95% of mortgage insurance providers have external ratings of AA- or better. The balance are captive insurers, all of which are rated investment grade Average loan-to-value ratio of 68% on security purchase date Average loan size of A$168,000 (US$161,000) on security purchase date Key Credit Characteristics – AUS RMBS* *Includes AUD-denominated assets AUD Rate of Exchange: 0.9586
17 Key Credit Characteristics – UK RMBS* Body: Exposure to UK RMBS totals $2.1BN, with 21% AAA, 18% AA, 29% A, and 32% BBB Majority of exposure is to UK Master Trusts from AA rated top-tier issuers Collateral consists of diversified pools of conforming loans to prime obligors with a range from 62% and not higher than 78% weighted average LTVs at origination Nearly all exposure is to owner occupied homes with prime quality obligors * Includes GBP, EUR and USD-denominated assets GBP Rate of Exchange: 1.9923 EUR Rate of Exchange: 1.57547
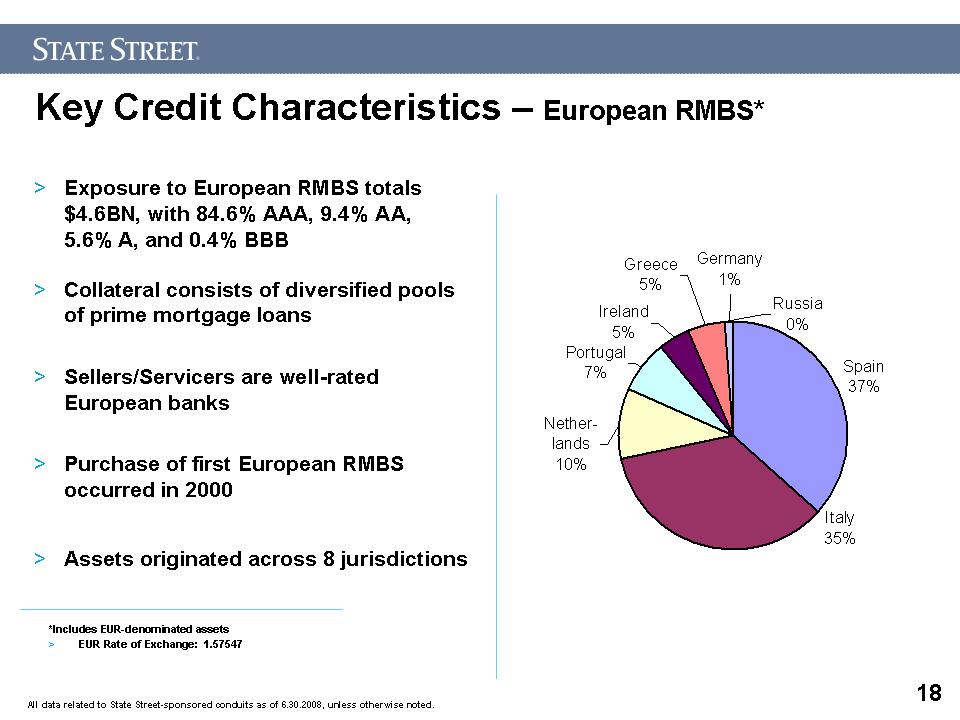
18 Key Credit Characteristics – European RMBS* Body: Exposure to European RMBS totals $4.6BN, with 84.6% AAA, 9.4% AA, 5.6% A, and 0.4% BBB Collateral consists of diversified pools of prime mortgage loans Sellers/Servicers are well-rated European banks Purchase of first European RMBS occurred in 2000 Assets originated across 8 jurisdictions *Includes EUR-denominated assets EUR Rate of Exchange: 1.57547
19 Key Credit Characteristics – US Student Loans Body: Exposure to US Student Loans totals $3.1BN 79.9%, or $2.5BN, are backed by Federal Family Education Loan Program (FFELP) loans carrying at least a 97% guarantee by the US government Of the $2.5BN FFELP loan transactions, $1.9BN are senior classes, with the vast majority rated AAA, while the remaining $558MM represents subordinated classes ($471MM rated at least AA and $77MM rated at least A) 20.1% or $627MM are backed by diversified pools of private student loans (for borrowers primarily attending 4-year schools or graduate schools).
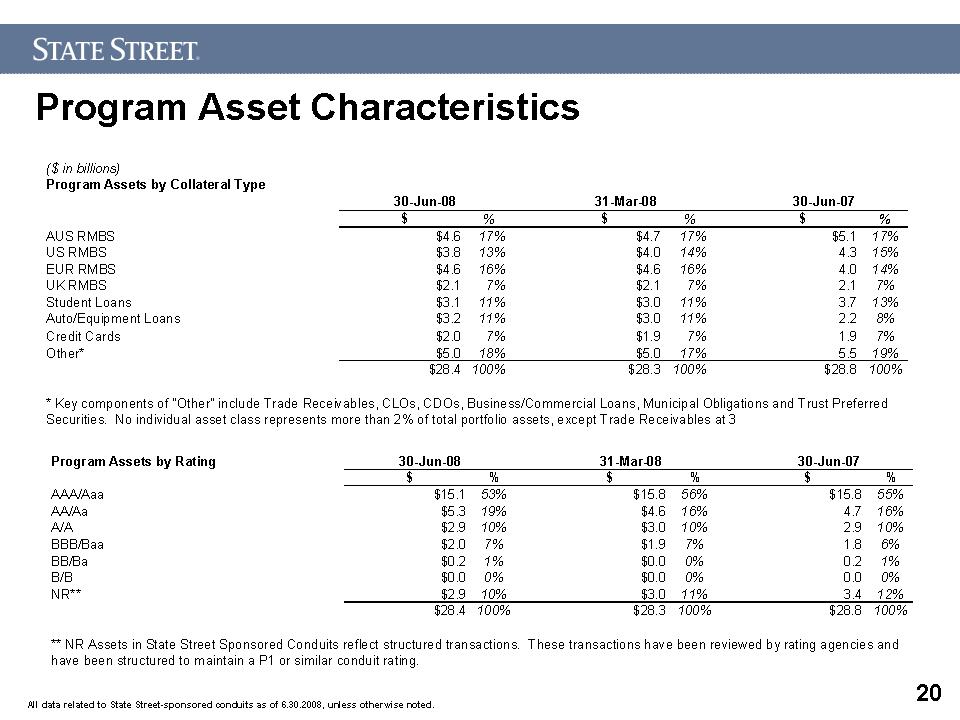
20 Program Asset Characteristics
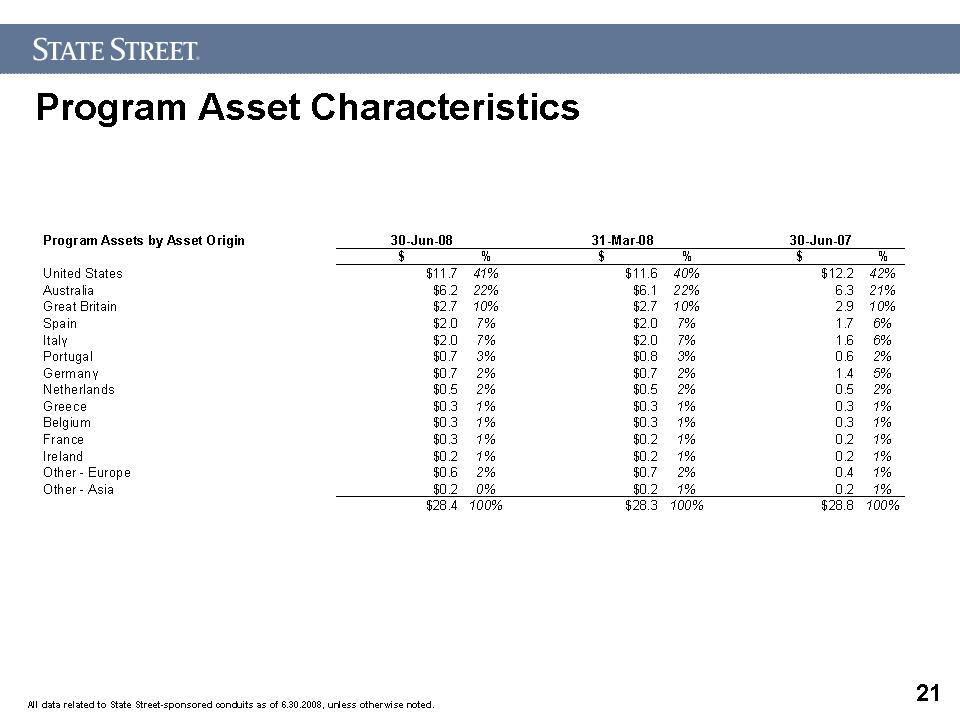
21 Program Asset Characteristics