 Jefferies Global Technology, Internet, Media and Telecom Conference New York, New York Craig De Young – Vice President Investor Relations May 12, 2011 Exhibit 99.1 |
 Safe Harbor "Safe Harbor" Statement under the US Private Securities Litigation Reform Act of 1995: the matters discussed in this document may include forward-looking statements, including statements made about our outlook, realization of backlog, IC unit demand, financial results, average selling price, gross margin and expenses, dividend policy and intention to repurchase shares. These forward looking statements are subject to risks and uncertainties including, but not limited to: economic conditions, product demand and semiconductor equipment industry capacity, worldwide demand and manufacturing capacity utilization for semiconductors (the principal product of our customer base), including the impact of general economic conditions on consumer confidence and demand for our customers’ products, competitive products and pricing, the impact of manufacturing efficiencies and capacity constraints, the pace of new product development and customer acceptance of new products, our ability to enforce patents and protect intellectual property rights, the risk of intellectual property litigation, availability of raw materials and critical manufacturing equipment, trade environment, changes in exchange rates available cash, distributable reserves for dividend payments and share repurchases, uncertainty surrounding the impact of the earthquake and tsunami in Japan and its potential effect on our customers and suppliers and other risks indicated in the risk factors included in ASML’s Annual Report on Form 20-F and other filings with the US Securities and Exchange Commission. / Slide 2 |
 / Slide 3 Agenda Business Overview Market ASML business update Outlook and summary |
 / Slide 4 Business Overview |
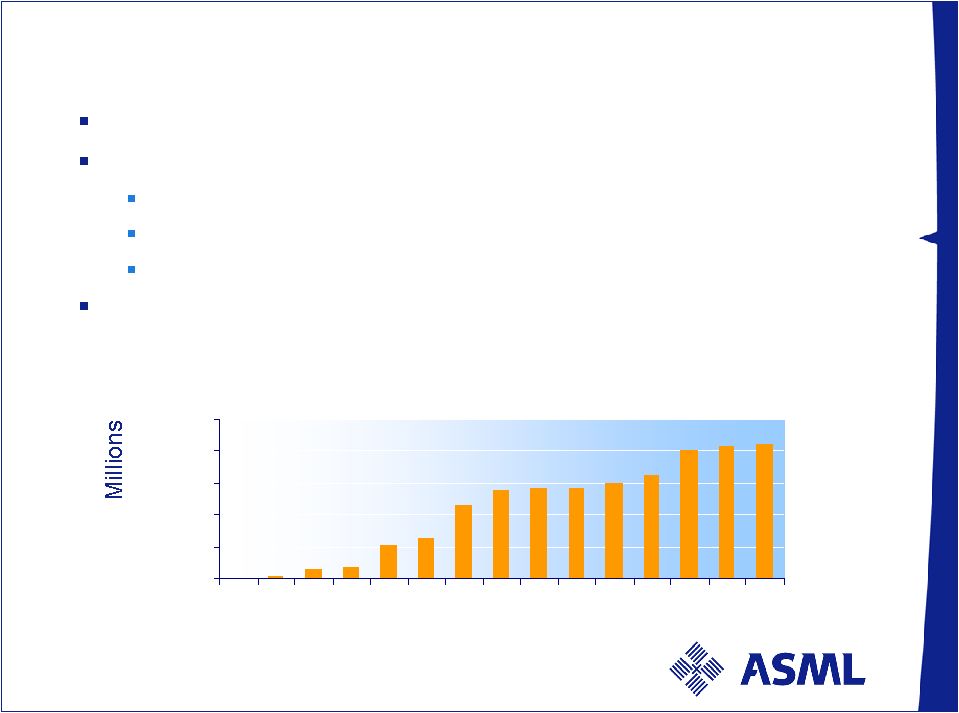
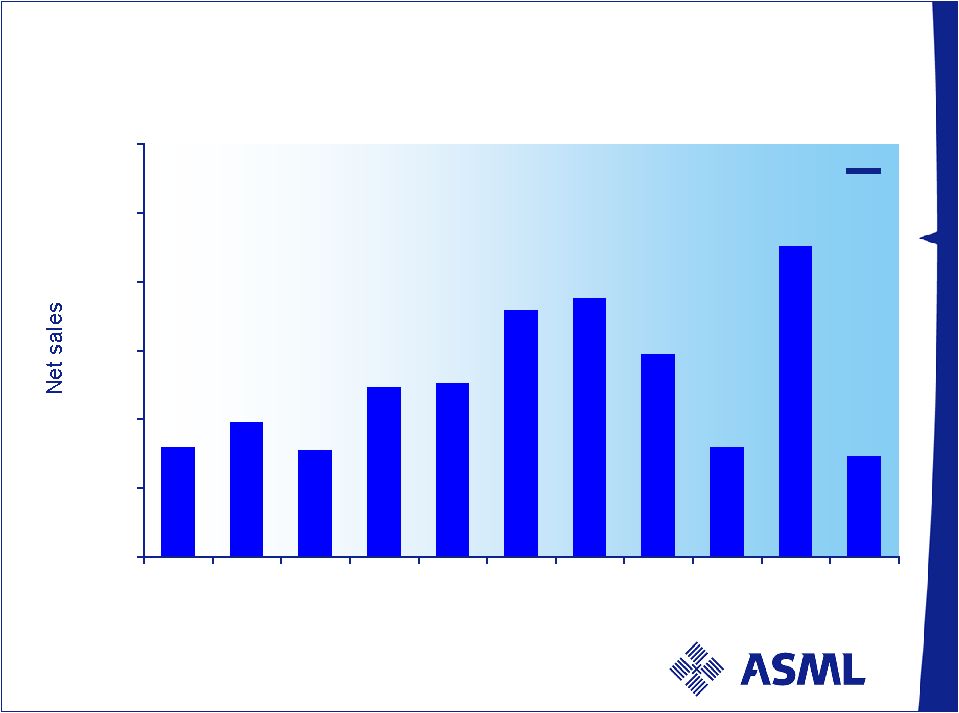 / Slide 5 0 1,000 2,000 3,000 4,000 5,000 6,000 2001 2002 2003 2004 2005 2006 2007 2008 2009 2010 2011 Sales History M€ 3,582 3,768 Numbers have been rounded for readers’ convenience. 2,954 1,596 4,508 1,959 1,589 2,465 2,529 1,543 2011 Average analyst estimates* Q1 only *Bank analysts average includes Barclays, Credit Suisse, Deutsche Bank, Exane BNP, Goldman Sachs, JPMorgan, BofA Merrill Lynch, RBS, UBS |
 / Slide 6 Q1 results - highlights Net sales of € 1,452 million, 63 systems shipped valued at € 1,284 million, service and field option sales at € 168 million Gross margin of 44.7% Operating margin of 31.0% Net system bookings of 40 systems, € 845 million Backlog at € 3,330 million, 134 systems with ASP of € 28.4 million for new tools, includes 60 immersion tools Generated € 1,1 billon cash from operations |
 / Slide 7 Key financial trends 2010 – 2011 Consolidated statements of operations M€ Q1 10 Q2 10 Q3 10 Q4 10 Q1 11 Net Sales 742 1,069 1,176 1,521 1,452 Gross profit Gross margin % 298 40.3% 459 43.0% 513 43.6% 685 45.0% 649 44.7% R&D costs 120 125 137 141 145 SG&A costs 41 42 48 50 54 Income from operations Operating income % 137 18.5% 292 27.4% 328 27.9% 494 32.4% 450 31.0% Net income Net income as a % of net sales 107 14.5% 239 22.4% 269 22.8% 407 26.7% 395 27.2% Units sold 34 43 51 69 63 ASP new systems 25.8 25.6 24.1 22.4 22.5 Net bookings value 1,165 1,342 1,391 2,315 845 Numbers have been rounded for readers’ convenience. |
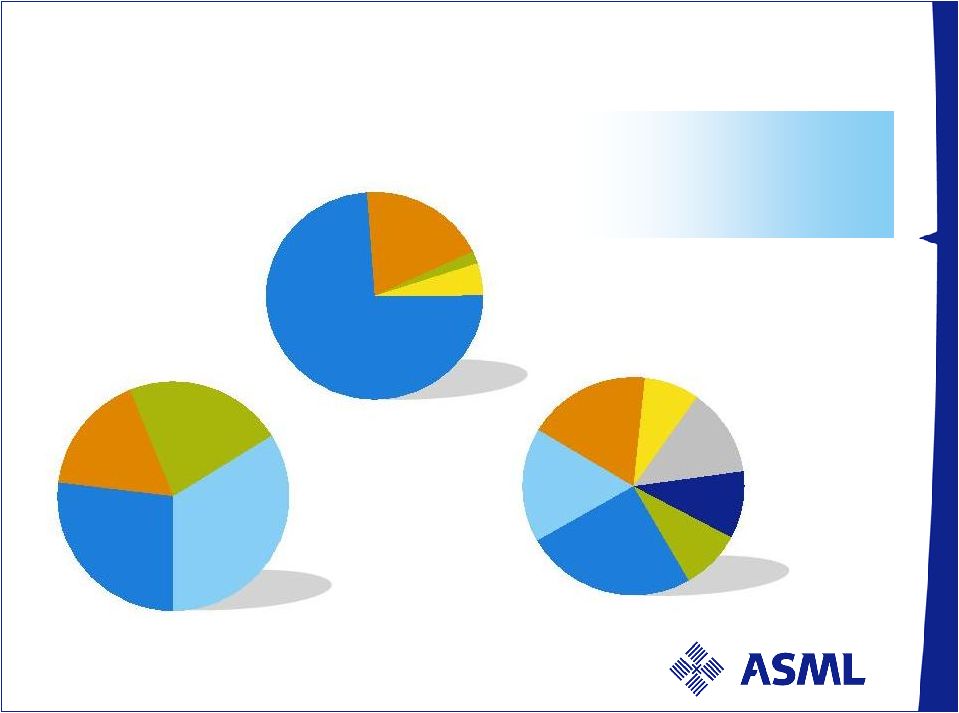 / Slide 8 New systems Used systems Total systems Units 115 19 134 Value M€ 3,262 68 3,330 ASP M€ 28.4 3.6 24.9 Backlog in value per March 27, 2011 Total value M€ 3,330 Technology ArF immersion 74% KrF 19% I-Line 2% Region (ship to location) USA 18% Taiwan 17% Korea 25% Europe 10% Japan 8% End-use DRAM 27% IDM 17% Foundry 22% Numbers have been rounded for readers’ convenience. Singapore 13% China 9% ArF dry 5% NAND 34% |
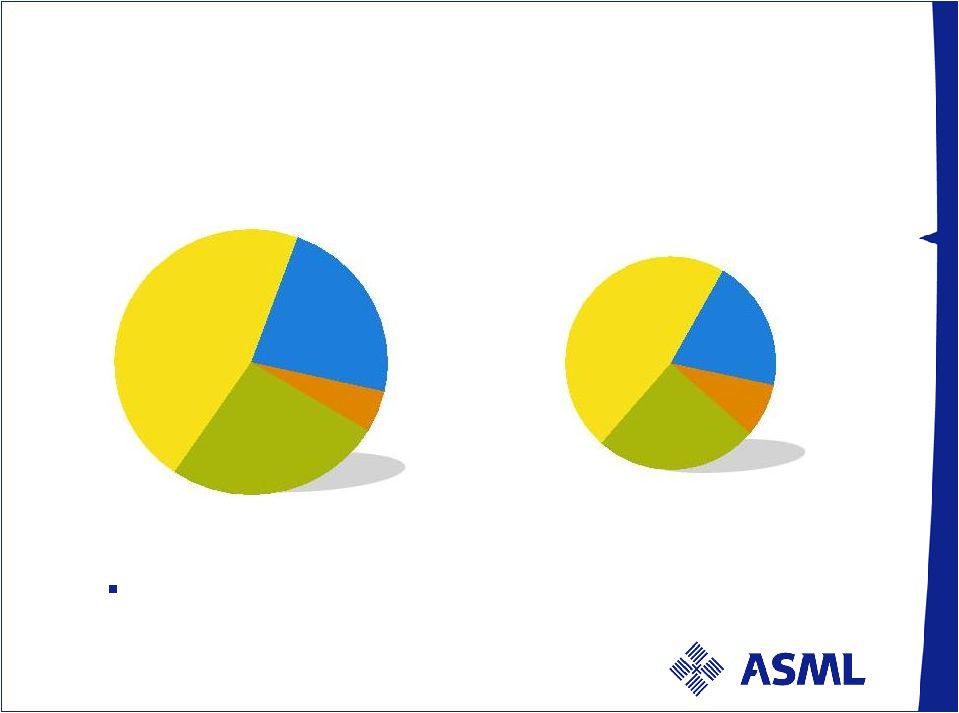 / Slide 9 Foundry 26% DRAM 23% NAND 46% Bookings activity by sector - total value M€ 845 Bookings in value Bookings in units IDM 5% IDM 8% Foundry 25% DRAM 20% NAND 47% Booked 36 new tools at € 832 million, 4 used at € 13 million Numbers have been rounded for readers’ convenience. |
 / Slide 10 Market |
 / Slide 11 Business environment Semiconductor manufacturers have shown caution in assessing economic impact of Japanese earthquake on their supply chain and end-product markets Although direct impact to the electronics industry world- wide seems limited, it has caused some of our customers to review their existing equipment delivery and order plans Resulting adjustments are only affecting potential litho system demand above what is currently the analyst’s consensus We continue to expect a total revenue level for 2011 clearly above € 5 billion |
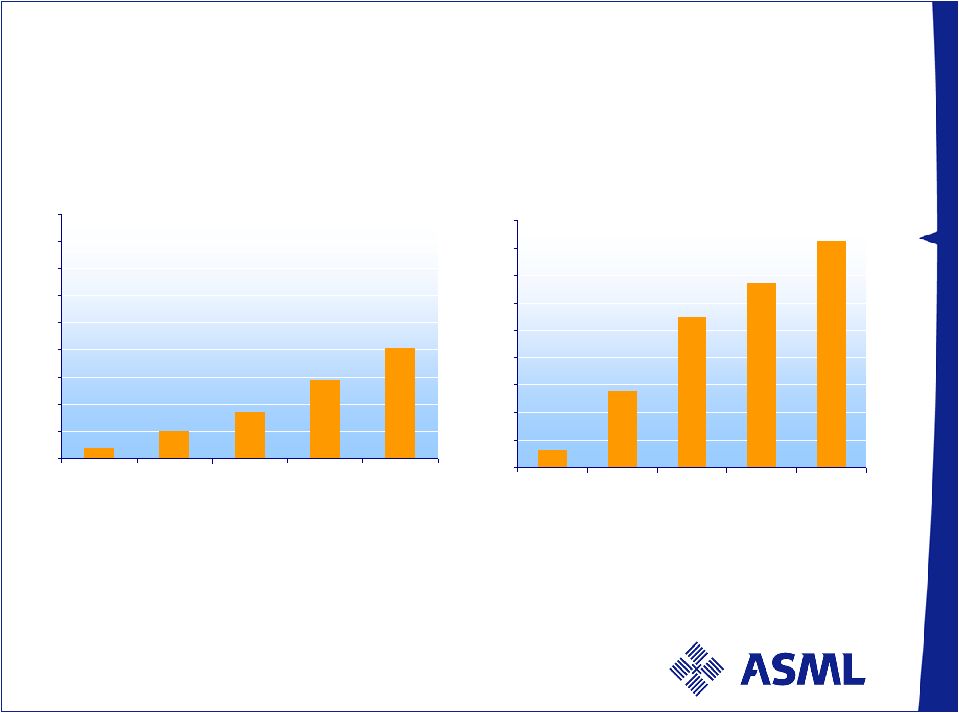 / Slide 12 Device complexity drives litho opportunity due to a growing number of critical litho layers Source: ASML Marketing (03/11), 300mm wafers only Node 9x,6x 9x, 6x 6x ,4x 6x, 4x 4x, 3x Node 6x, 4x 6x, 4x 4x, 3x 3x, 2x 2x, 1x Average MPU immersion layers 0 2 4 6 8 10 12 14 16 18 2008 2009 2010 2011 2012 Average Logic + DSP + MCU immersion layers 0 2 4 6 8 10 12 14 16 18 2008 2009 2010 2011 2012 |
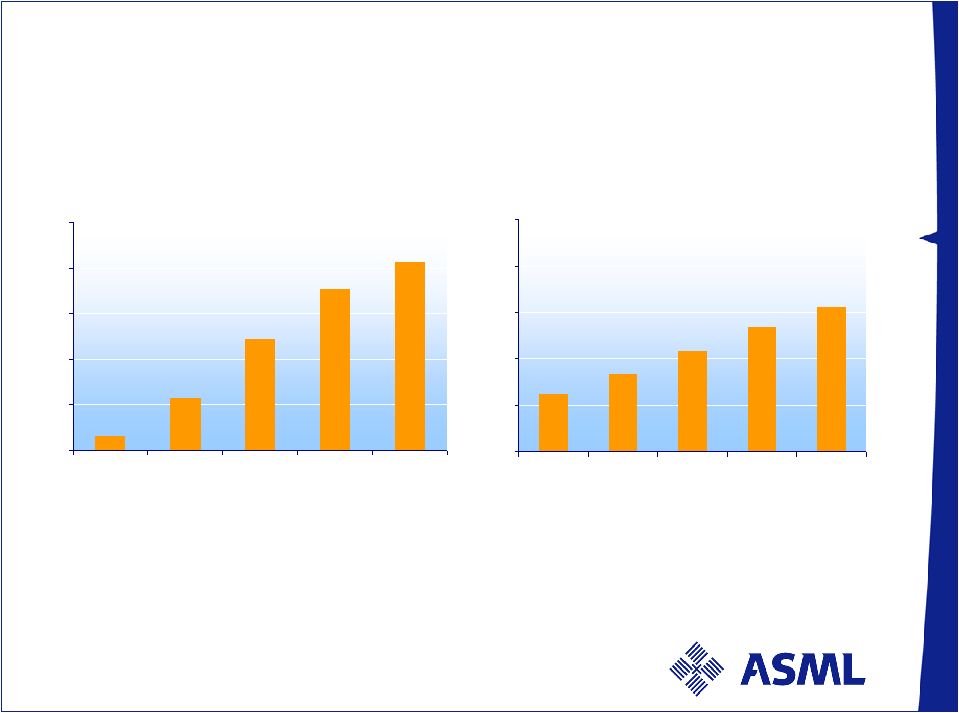 / Slide 13 Required immersion layers keeps increasing per node, per year in memory also Node 8x, 6x 6x, 5x 5x, 4x 4x, 3x 3x, 2x Node 5x, 4x 4x, 3x 4x, 3x 3x, 2x 2x, 1x Source: ASML Marketing (03/11), 300mm wafers only Average DRAM immersion layers 0 2 4 6 8 10 2008 2009 2010 2011 2012 0 2 4 6 8 10 2008 2009 2010 2011 2012 Average NAND immersion layers |
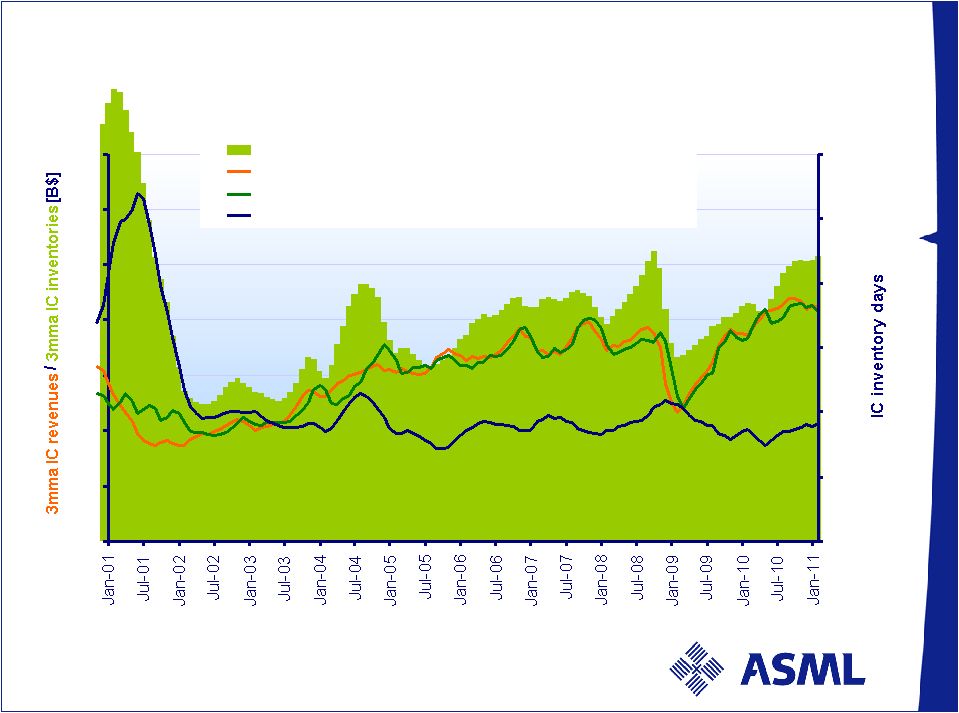 / Slide 14 Slightly decreased consumption & revenues in February 2011, stable days of inventory (36) Source: VLSI Research, WSTS, ASML Last data point: February 2011 3mma IC revenue, inventory and inventory days 0 5 10 15 20 25 30 35 - 20 40 60 80 100 120 3mma IC inventory value (left) 3mma IC revenues (left) 3mma IC consumption: revenues ± inventory value change (left) 3mma Inventory days (right) |
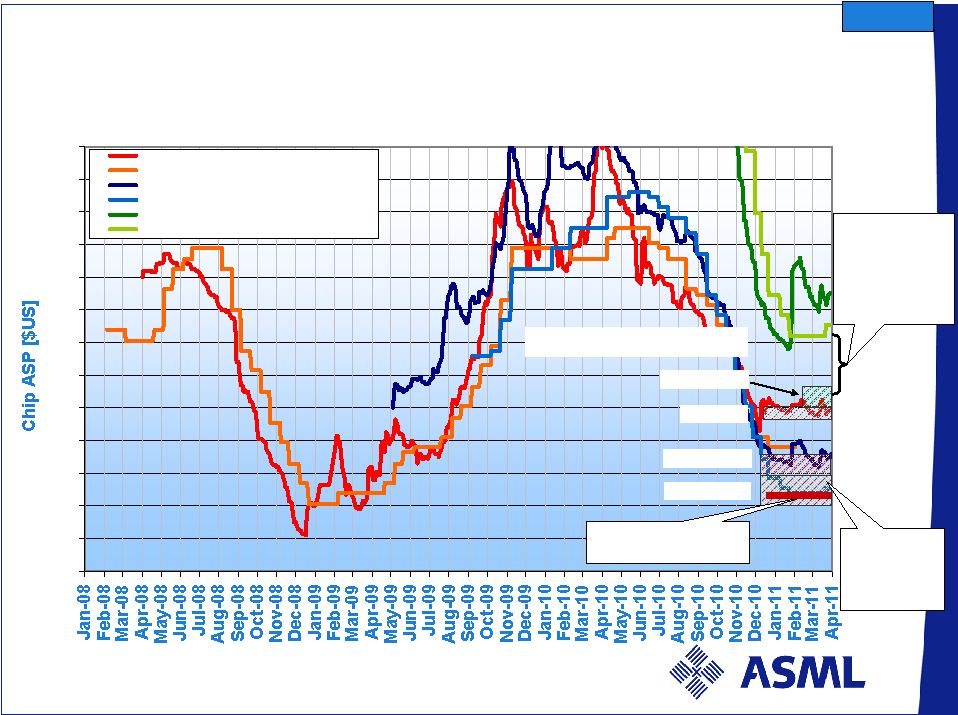 / Slide 15 MAIN DRAM SPOT & CONTRACT PRICES (01/2008 - 2011YTD) 0.4 0.6 0.8 1 1.2 1.4 1.6 1.8 2 2.2 2.4 2.6 2.8 3 1Gb DDR2 800 MHz SPOT PRICE 1Gb DDR2 800 MHz CONTRACT PRICE 1Gb DDR3 1333 MHz SPOT PRICE 1Gb DDR3 1333 MHz CONTRACT PRICE 2Gb DDR3 1333MHz SPOT PRICE 2Gb DDR3 1333MHz CONTRACT PRICE Source: DRAMeXchange (1/4/2011), ASML MCC First improvement in DDR3 contract prices visible, Not enough yet to bring tier 2/3 players back to profitability Customer litho system utilizations high DRAM (64), 1Gb (5x H), 1 Gb (5x L), 1 Gb (4x H), 2 Gb Estimated DRAM cash costs in Q1/11 (avg. production node in nm) Current DDR3 1 Gb contract ASP at 0.88 $ Poor 5x nm yields do increase avg. costs About 25% cash profit on 2Gb DDR3 ICs, if manufactured at 4x nm and sold at current contract prices |
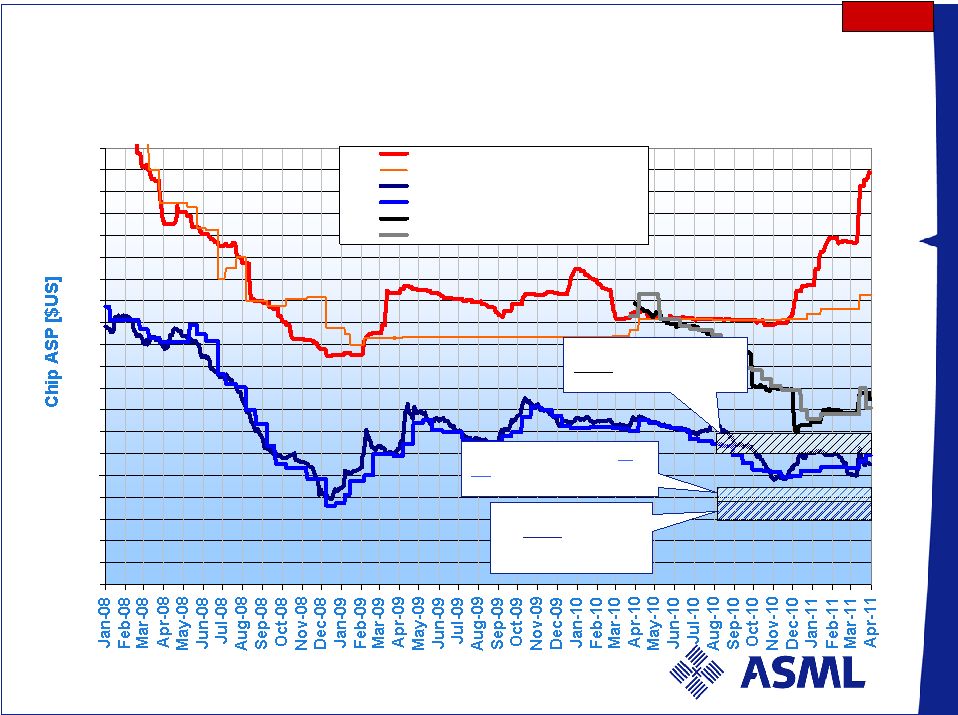 / Slide 16 MAIN NAND SPOT & CONTRACT PRICES (01/2008 - 2011YTD) 0 1 2 3 4 5 6 7 8 9 10 11 12 13 14 15 16 17 18 19 20 16Gb NAND SLC SPOT PRICE 16Gb NAND SLC CONTRACT PRICE 32Gb NAND MLC SPOT PRICE 32Gb NAND MLC CONTRACT PRICE 64Gb NAND TLC SPOT PRICE 64Gb NAND TLC CONTRACT PRICE NAND 300 mm cash-costs for 3x nm 32 Gb 2 b/c MLC NAND between 3,2 and 4,0 USD Spot prices peaked in March due to fear of shortages after Japan earthquake, SLC spot-prices increased due to change in product-mix Customer litho tool utilization remain high Source: DRAMeXchange (1/4/2011), ASML MCC 300 mm cash-costs for 3x nm 32 Gb 3 b/c MLC NAND between 2,6 and 3,2 USD 300 mm costs for mature 2x nm 64 Gb MLC NAND between 5.5 and 6,5 USD |
 / Slide 17 ASML business update |
 / Slide 18 Technology - EUV NXE:3100 second generation EUV Three NXE:3100 shipped to date, 3 more to go Progress ongoing to reach target throughput by year end Customer process development started Infrastructure development transitioning to optimization phase (masks, resist, metrology, etc) Revenue recognition expected in 2012 NXE:3300 third generation EUV Commitments received for 10 NXE:3300 production systems, deliveries to start H2 2012 |
 / Slide 19 € 0 € 50 € 100 € 150 € 200 € 250 4 5 6 7 8 9 10 11 12 13 14 15 16 17 18 Cash return € 2.7B cash & cash equivalents at end Q1 2011 € 1 B / 24 month share buy back program in progress 21% of program executed until wk 19 7 million shares repurchased at an average price of € 29.66 Weekly updates available on ASML’s website Dividend for 2010 of € 0.40 per ordinary share (approx. € 175 million) vs. € 0.20 per share in 2009 Share buy back (cumulative) Week |
 / Slide 20 Outlook and summary |
 / Slide 21 Q2 2011 outlook Order intake between € 900 million – €1 billion Net sales around € 1.5 billion Gross margin about 45% R&D at € 150 million SG&A at € 55 million ASML expects 2011 total revenue clearly above € 5 billion |
 |