 Deutsche Bank Access Asia Conference Singapore Craig DeYoung – Vice President Investor Relations May 25, 2011 Exhibit 99.1 |
 / Slide 2 Safe Harbor "Safe Harbor" Statement under the US Private Securities Litigation Reform Act of 1995: the matters discussed in this document may include forward-looking statements, including statements made about our outlook, realization of backlog, IC unit demand, financial results, average selling price, gross margin and expenses, dividend policy and intention to repurchase shares. These forward looking statements are subject to risks and uncertainties including, but not limited to: economic conditions, product demand and semiconductor equipment industry capacity, worldwide demand and manufacturing capacity utilization for semiconductors (the principal product of our customer base), including the impact of general economic conditions on consumer confidence and demand for our customers’ products, competitive products and pricing, the impact of manufacturing efficiencies and capacity constraints, the pace of new product development and customer acceptance of new products, our ability to enforce patents and protect intellectual property rights, the risk of intellectual property litigation, availability of raw materials and critical manufacturing equipment, trade environment, changes in exchange rates available cash, distributable reserves for dividend payments and share repurchases, uncertainty surrounding the impact of the earthquake and tsunami in Japan and its potential effect on our customers and suppliers and other risks indicated in the risk factors included in ASML’s Annual Report on Form 20-F and other filings with the US Securities and Exchange Commission. |
 / Slide 3 ASML’s strategy “ To be a technology leader in lithographic systems and software for semiconductor manufacturing, thus enabling our customers to increase the functionality of microchips while reducing the cost and power consumption per function on a chip |
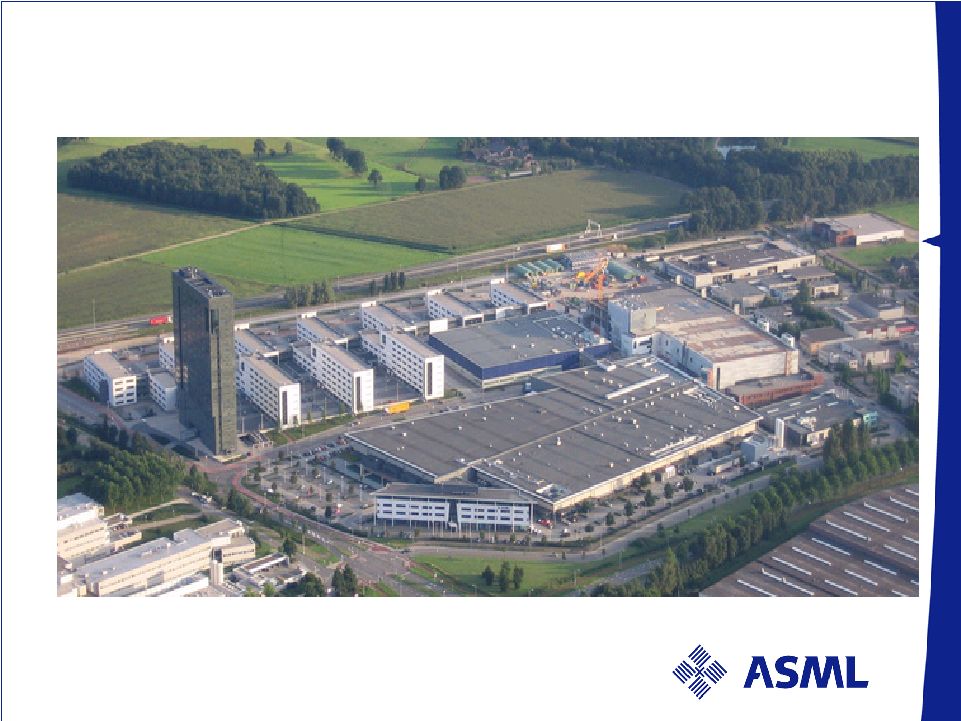 / Slide 4 ASML Headquarters in Veldhoven, the Netherlands ASML: the number 2 semiconductor equipment supplier in the world in 2010 |
 / Slide 5 Agenda Business Overview Market ASML EUV update Outlook and summary |
 / Slide 6 Business Overview |
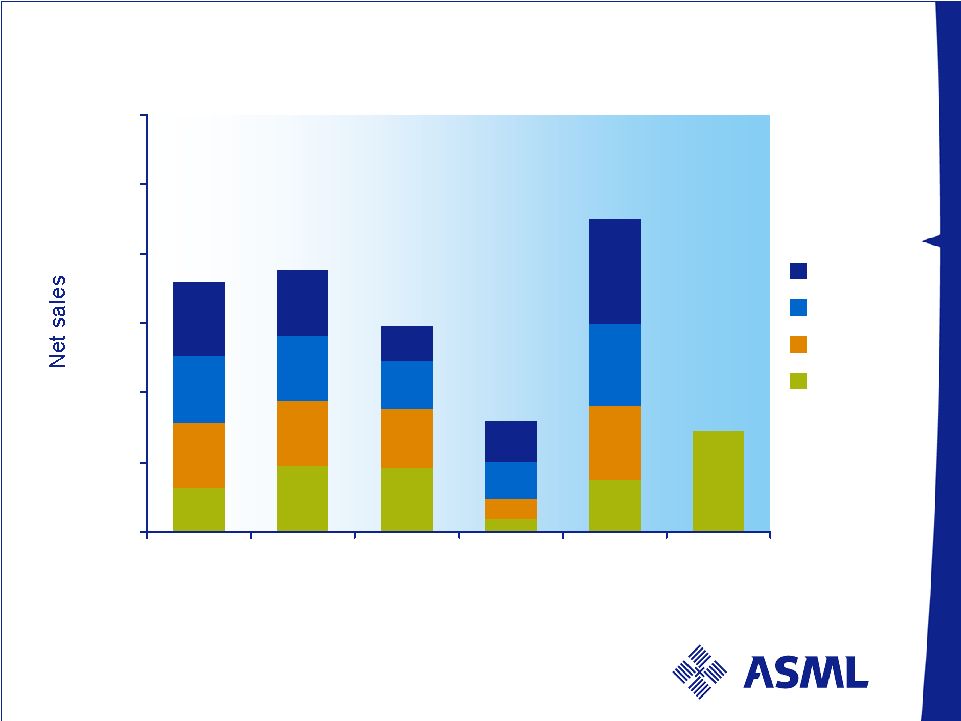 / Slide 7 629 949 919 183 742 1,452 942 930 844 277 1,069 958 934 697 555 1,176 1,053 955 494 581 1,521 0 1,000 2,000 3,000 4,000 5,000 6,000 2006 2007 2008 2009 2010 2011 Q4 Q3 Q2 Q1 Total net sales M€ 3,582 3,768 Numbers have been rounded for readers’ convenience. 2,954 1,596 4,508 |
 / Slide 8 Q1 results - highlights Net sales of € 1,452 million, 63 systems shipped valued at € 1,284 million, service and field option sales at € 168 million Gross margin of 44.7% Operating margin of 31.0% Net system bookings of 40 systems, € 845 million Backlog at € 3,330 million, 134 systems with ASP of € 28.4 million for new tools, includes 60 immersion tools Generated € 1,1 billon cash from operations |
 / Slide 9 Key financial trends 2010 – 2011 Consolidated statements of operations M€ Q1 10 Q2 10 Q3 10 Q4 10 Q1 11 Net Sales 742 1,069 1,176 1,521 1,452 Gross profit Gross margin % 298 40.3% 459 43.0% 513 43.6% 685 45.0% 649 44.7% R&D costs 120 125 137 141 145 SG&A costs 41 42 48 50 54 Income from operations Operating income % 137 18.5% 292 27.4% 328 27.9% 494 32.4% 450 31.0% Net income Net income as a % of net sales 107 14.5% 239 22.4% 269 22.8% 407 26.7% 395 27.2% Units sold 34 43 51 69 63 ASP new systems 25.8 25.6 24.1 22.4 22.5 Net bookings value 1,165 1,342 1,391 2,315 845 Numbers have been rounded for readers’ convenience. |
 / Slide 10 Backlog in value per March 27, 2011 Numbers have been rounded for readers’ convenience. |
 / Slide 11 Market |
 / Slide 12 Business environment Semiconductor manufacturers have shown caution in assessing economic impact of Japanese earthquake on their supply chain and end-product markets Although direct impact to the electronics industry world- wide seems limited, it has caused some of our customers to review their existing equipment delivery and order plans Resulting adjustments are only affecting potential litho system demand above what is currently the analyst’s consensus We continue to expect a total revenue level for 2011 clearly above € 5 billion |
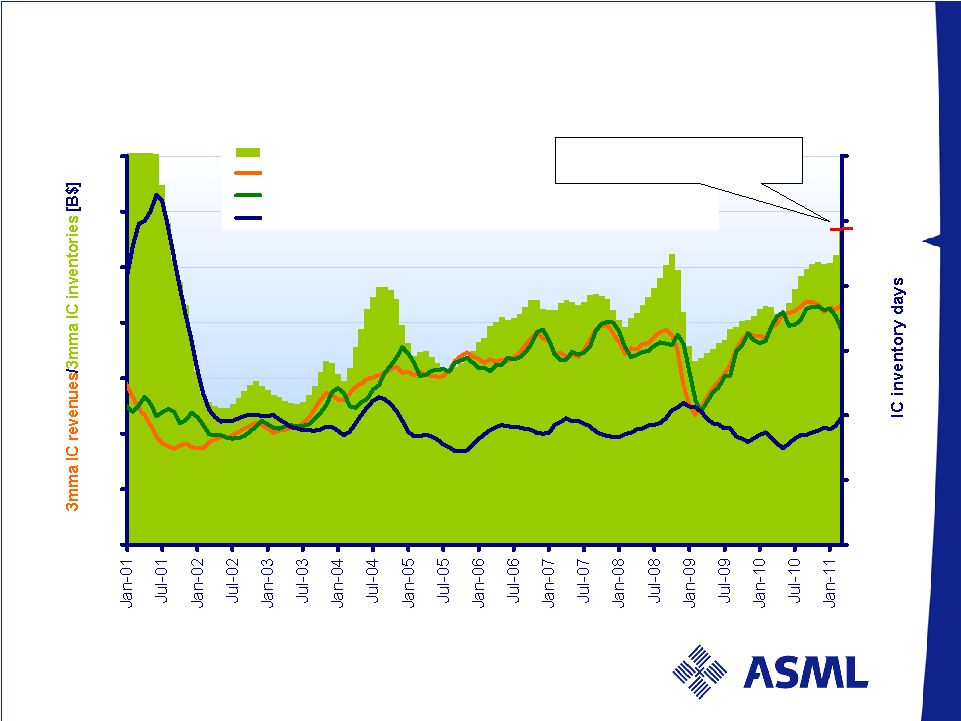 / Slide 13 3mma IC revenue, inventory and inventory days 0 5 10 15 20 25 30 35 - 20 40 60 80 100 120 3mma IC inventory value (left) 3mma IC revenues (left) 3mma IC consumption: revenues ± inventory value change (left) 3mma Inventory days (right) Consumption decreased in March, whereas revenues increased, causing growing IC inventory level Source: VLSI Research, WSTS, ASML Last data point: March 2011 Current 3mma inventory value at around $27 B |
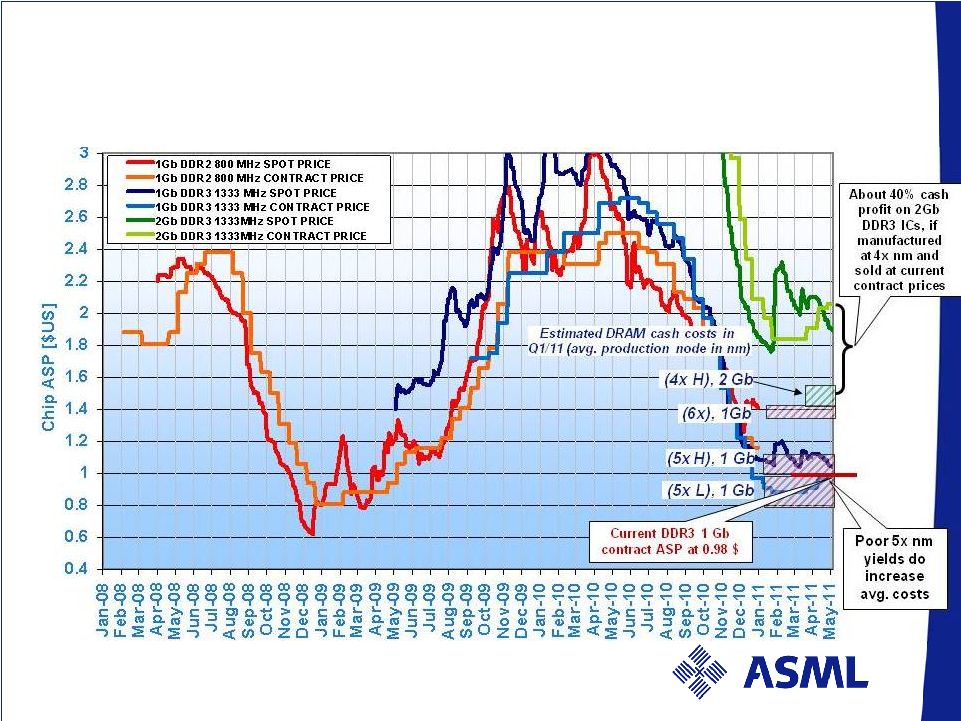 / Slide 14 Source: DRAMeXchange (5/5/2011), ASML MCC Further recovery of contract prices leads tier 2/3 manufacturers at low 5x nm (closer) to profitability <Customer litho system utilizations high> MAIN DRAM SPOT & CONTRACT PRICES (01/2008 - 2011YTD) |
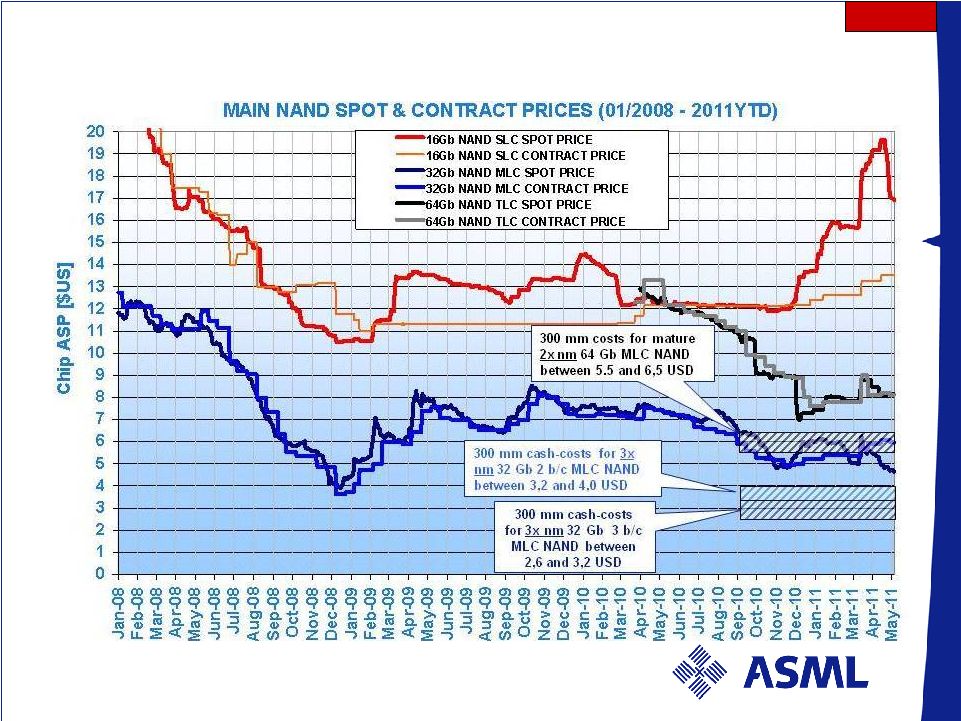 / Slide 15 NAND SLC spot prices slide after change in product mix in March, overall chip prices remain quite stable at healthy levels <Customer litho tool utilization remain high> Source: DRAMeXchange (5/5/2011), ASML MCC |
 / Slide 16 ASML EUV update |
 / Slide 17 Technology - EUV NXE:3100 second generation EUV Three NXE:3100 shipped to date, 3 more to go Progress ongoing to reach target throughput by year end Customer process development started Infrastructure development transitioning to optimization phase (masks, resist, metrology, etc) Revenue recognition expected in 2012 NXE:3300 third generation EUV Commitments received for 10 NXE:3300 production systems, deliveries to start H2 2012 |
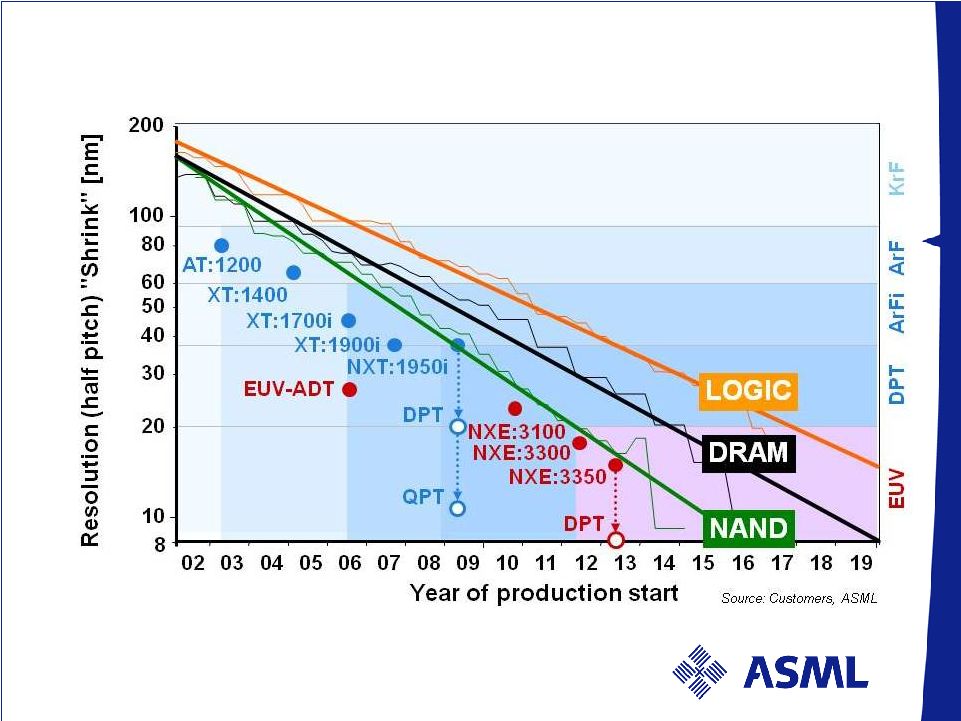 / Slide 18 Why EUV? EUV supports IC & Lithography roadmap towards <10nm Notes: 1. R&D solution required 1.5~ 2 yrs ahead of Production 2. EUV resolution requires 7nm diffusion length resist 3. DPT = Double Patterning 4. QPT = Double Double Patterning |
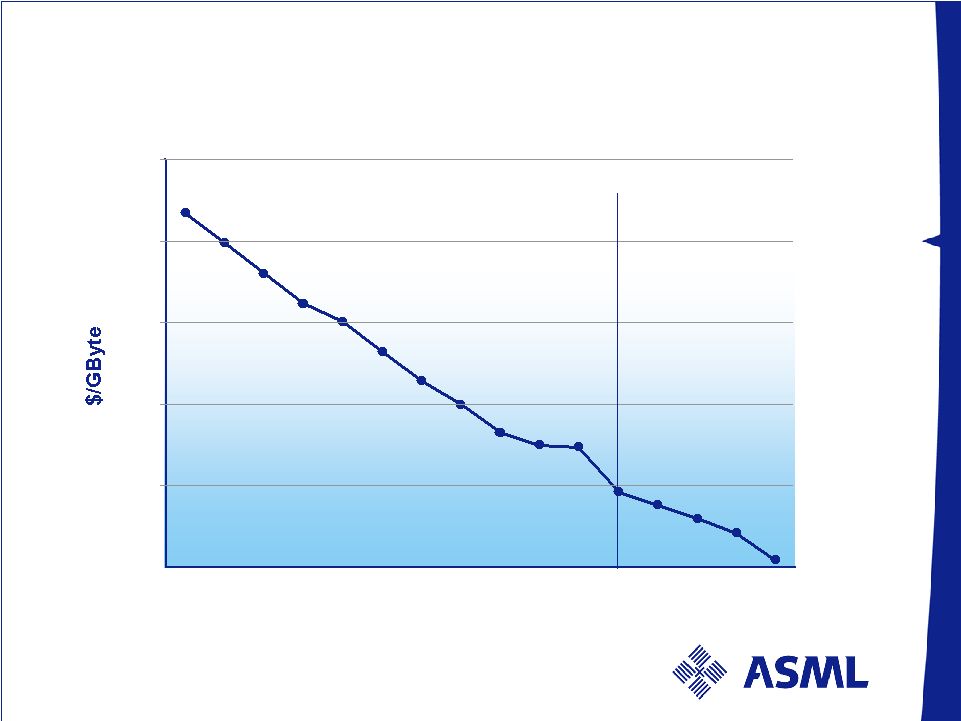 / Slide 19 Consumers are the winners Shrink drives manufacturing cost down Note: data iSupply, March 2009. High quality Flash 0 1 10 100 1000 10000 2000 2001 2002 2003 2004 2005 2006 2007 2008 2009 2010 2011 2012 2013 2014 2015 $2,305 for 1Gigabyte (GB) $0.17 for 1 GB |
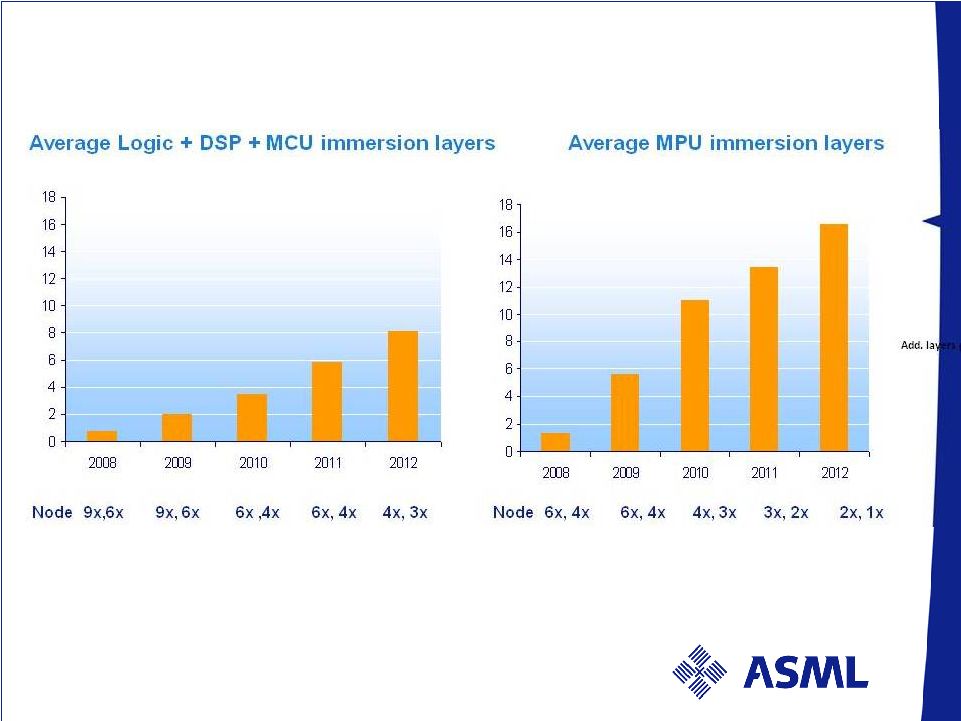 / Slide 20 Shrink drives device complexity which drives litho opportunity due to a growing number of critical litho layers Source: ASML Marketing (03/11), 300mm wafers only |
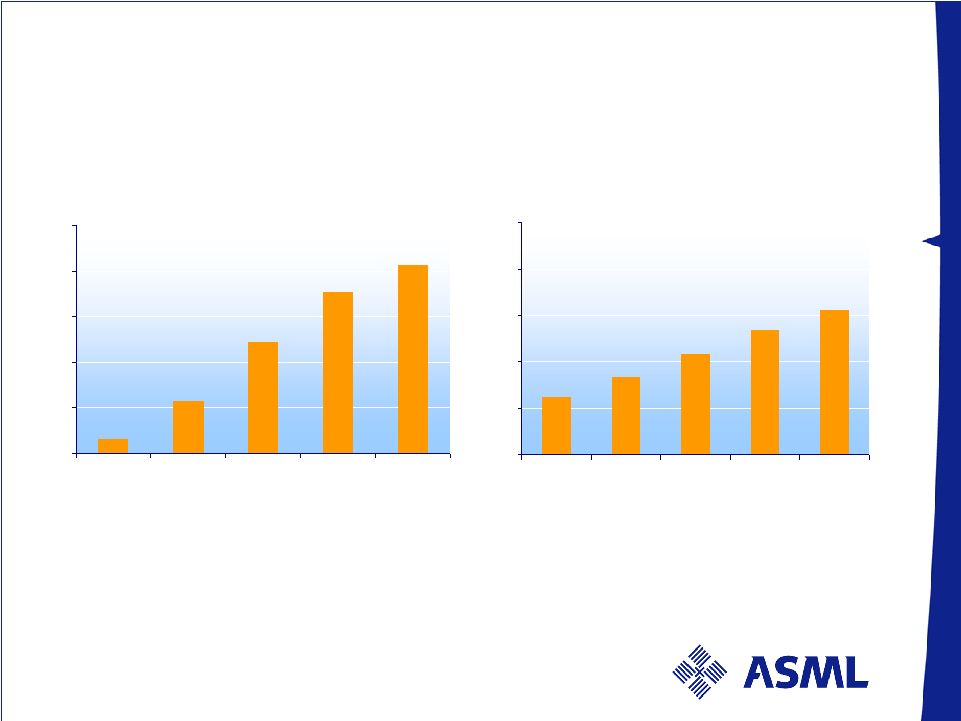 / Slide 21 Increasing immersion layers per node, per year with shrink in memory too Node 8x, 6x 6x, 5x 5x, 4x 4x, 3x 3x, 2x Node 5x, 4x 4x, 3x 4x, 3x 3x, 2x 2x, 1x Source: ASML Marketing (03/11), 300mm wafers only Average DRAM immersion layers 0 2 4 6 8 10 2008 2009 2010 2011 2012 0 2 4 6 8 10 2008 2009 2010 2011 2012 Average NAND immersion layers |
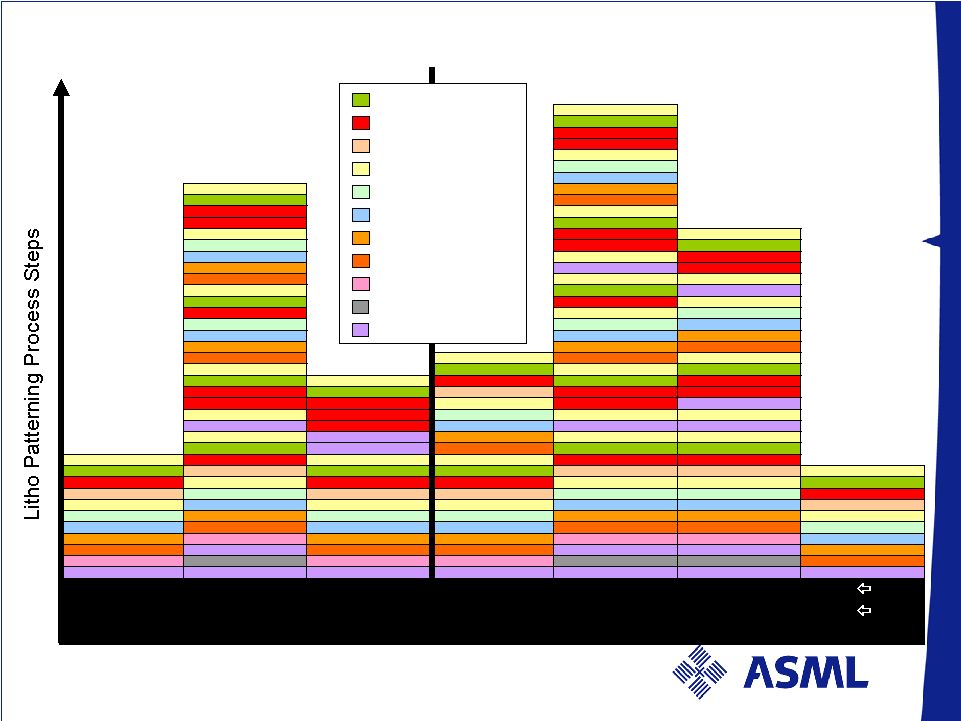 / Slide 22 Logic NAND DRAM Logic NAND DRAM 32nm 2x nm 3x nm 22nm 1x nm 2xnm ArFi Spacer DPT Spacer DPT Litho DPT 2x Spacer Spacer DPT EUV Typical Patterning Schemes for Critical Layers 2011 2013 DPT = Double Patterning Organic BARC Resist Hard Mask Expose Develop Inorganic BARC Metrology Hard Mask Etch Strip & Clean Defect Inspect Cap Layer Source: ASML Strategic Marketing |
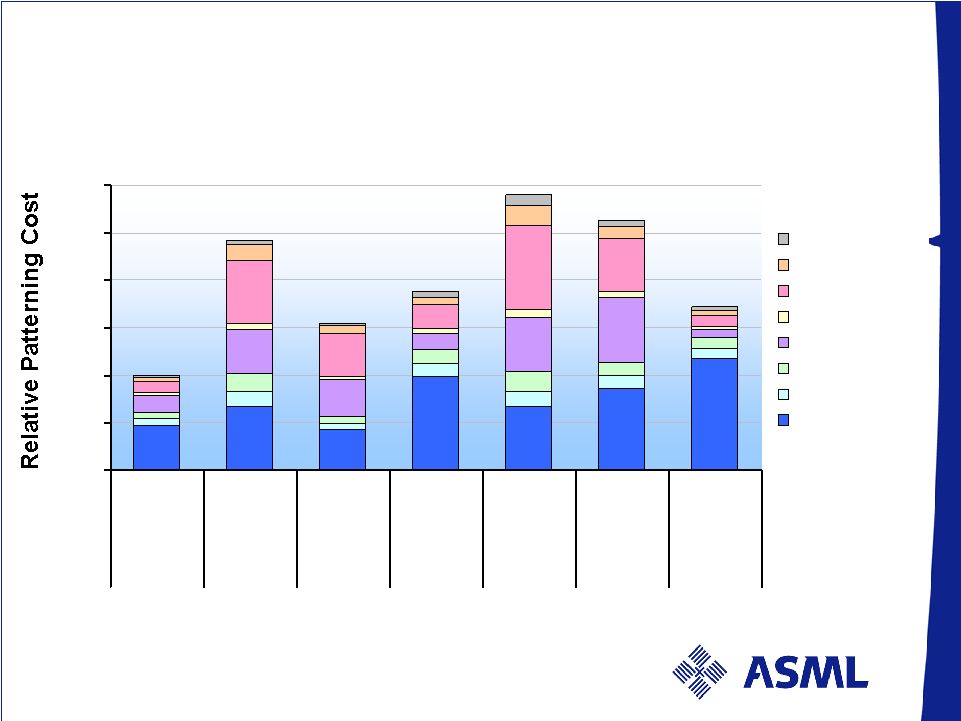 / Slide 23 Cost Impact of Double Patterning - 0.5 1.0 1.5 2.0 2.5 3.0 Logic NAND DRAM Logic NAND DRAM ALL 32nm 2x nm 3x nm 22nm 1x nm 2xnm - ArFi 1D Spacer 1D Spacer 2x Litho- Etch Double Spacer 2D Spacer EUV Reticle Strip/Clean Etch Metrology CVD Litho chemicals Track Litho Source: ASML Strategic Marketing |
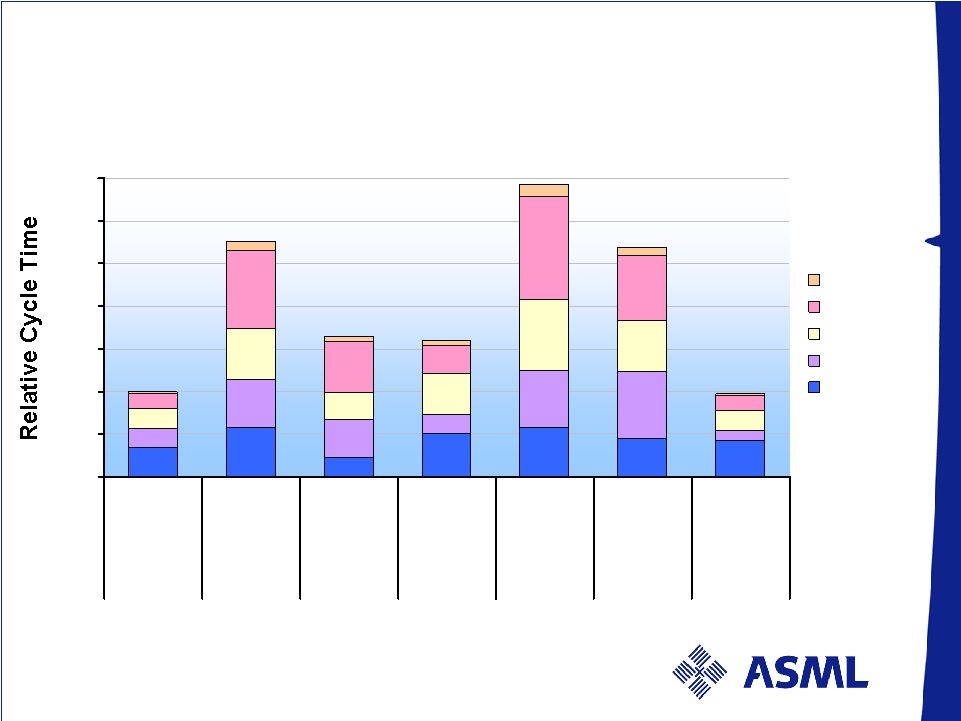 / Slide 24 Cycle Time Impact of Double Patterning - 0.5 1.0 1.5 2.0 2.5 3.0 3.5 Logic NAND DRAM Logic NAND DRAM ALL 32nm 2x nm 3x nm 22nm 1x nm 2xnm - ArFi 1D Spacer 1D Spacer 2x Litho- Etch Double Spacer 2D Spacer EUV Strip/Clean Etch Metrology CVD Litho Source: ASML Strategic Marketing |
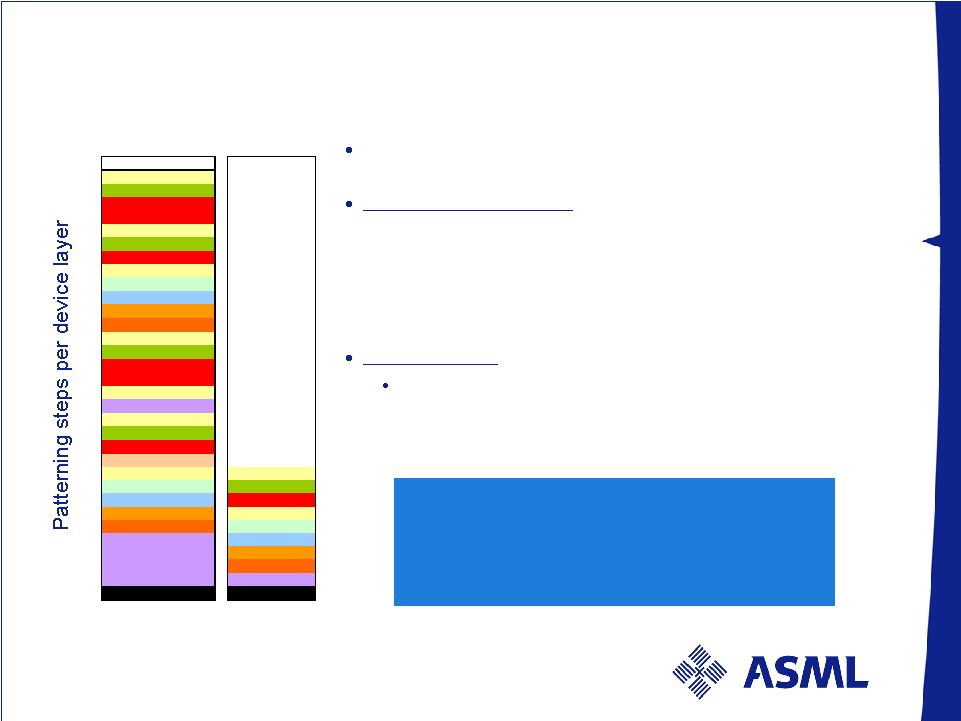 / Slide 25 EUV lowers overall costs for customer, while increasing litho costs € 70.82 * € 46.44 * * Source: ASML Strategic Marketing; Cost of Technology model incl. Capex & Opex – NAND Example Cost per layer [Euro/Wafer] Metrology Strip/Clean Spacer etch BARC/ACL/SiON etch Metrology Strip/Clean Trim Etch Metrology ArFi Develop Expose ArFi Resist ArFi BARC Metrology Strip/Clean Template removal Oxide Etch Back Metrology Spacer Metrology Strip/Clean BARC/ACL/SiON etch Defect Metrology Metrology ArFi Develop Strip/Clean Expose ACL Etch ArFi Resist Metrology ArFi BARC EUV Develop SiON/SiC Expose ACL EUV Resist Cap layer EUV BARC ACL ACL Spacer Li Costs per layer: ArFi Spacer imaging: • Overall patterning costs (including litho, etching, etc.): 70.82 €/wafer • Litho costs (2xArFi exposures per layer): 23.36 €/wafer • Ratio litho costs/overall patterning costs: 33% EUV imaging : Overall patterning costs: 46.44 €/wafer • Litho costs (1x EUV exposure per layer): 31.74 €/wafer • Ratio litho costs/overall patterning costs: 68% Reduced cost/complexity drives EUV adoption and secures it’s role in lithography for the next decade |
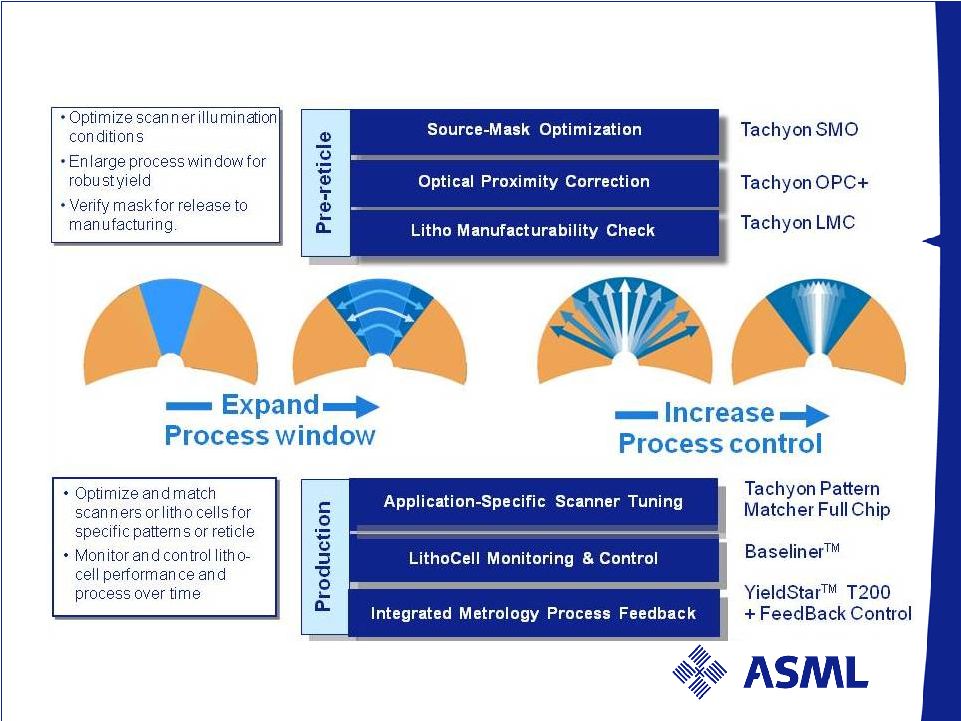 / Slide 26 ASML’s Unique Holistic Litho Optimisation & Control of future low k1, DP and EUV litho processes |
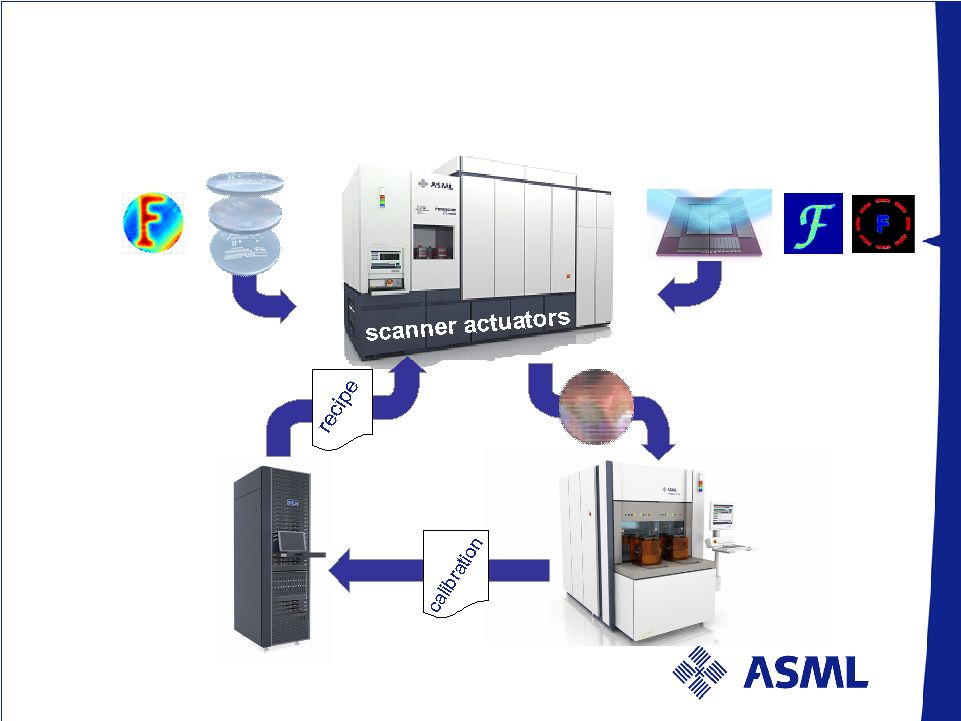 / Slide 27 Stages Illuminator Lens Sensors ASML Scanner Optimisation & Control enabled through Wafer Metrology & Computational Litho Computational Lithography Optimization and Tuning for CD Wafer Metrology Setup and Control of CD and Overlay Programmable Wavefront Programmable pupil and polarization CD and Overlay improvements |
 / Slide 28 Section Summary Low k1 Double Patterning Lithography enables extension of immersion Lithography bridging the gap until single patterning EUV is available However, Double Patterning presents significant Cost, Process Control, and Cycle Time manufacturing challenges Advanced Optical Metrology enables improved Scanner control and utilisation whilst integrated solutions enable improved Overlay & CD Uniformity through feedback loops & increased correction capability |
 / Slide 29 Outlook and summary |
 / Slide 30 Q2 2011 outlook Order intake between € 900 million – €1 billion Net sales around € 1.5 billion Gross margin about 45% R&D at € 150 million SG&A at € 55 million ASML expects 2011 total revenue clearly above € 5 billion |
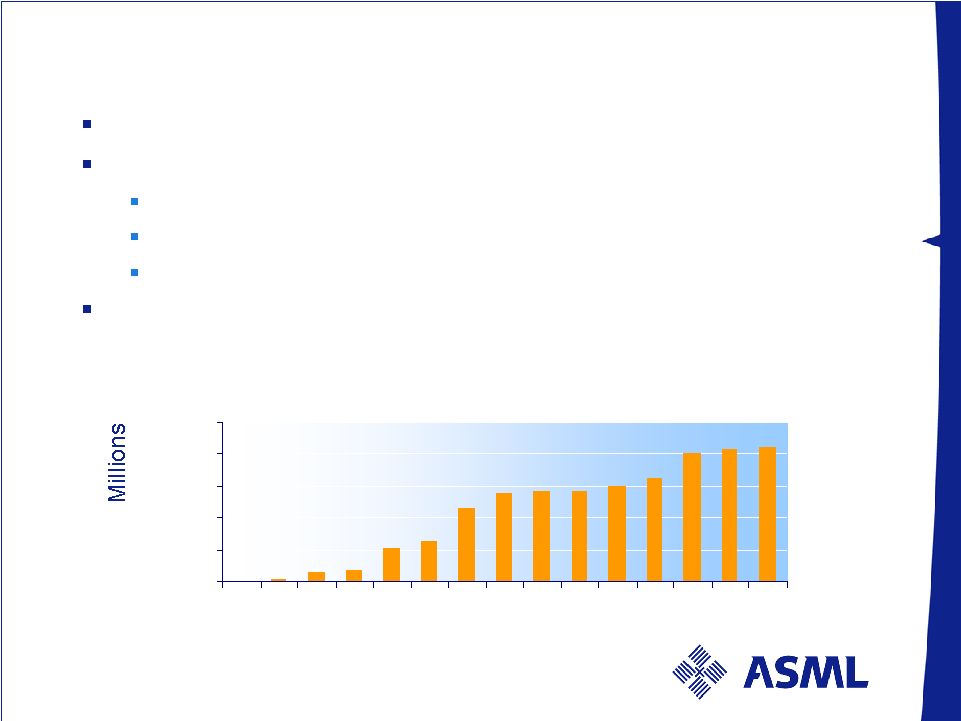 / Slide 31 € 0 € 50 € 100 € 150 € 200 € 250 4 5 6 7 8 9 10 11 12 13 14 15 16 17 18 Cash return € 2.7B cash & cash equivalents at end Q1 2011 € 1 B / 24 month share buy back program in progress 21% of program executed until wk 19 7 million shares repurchased at an average price of € 29.66 Weekly updates available on ASML’s website Dividend for 2010 of € 0.40 per ordinary share (approx. € 175 million) vs. € 0.20 per share in 2009 Share buy back (cumulative) Week |
 |