Exhibit 99.2

ASML
ASML reiterates H1 2012 expectation, sees stable sales in Q3
ASML 2012 First Quarter Results
Veldhoven, the Netherlands, April 18, 2012
Safe Harbor
“Safe Harbor” Statement under the US Private Securities Litigation Reform Act of 1995: the matters discussed in this document may include forward-looking statements, including statements made about our outlook, realization of systems backlog, IC unit demand, financial results, average selling price, gross margin and expenses, dividend policy and intention to repurchase shares.
These forward looking statements are subject to risks and uncertainties including, but not limited to: economic conditions, product demand and semiconductor equipment industry capacity, worldwide demand and manufacturing capacity utilization for semiconductors (the principal product of our customer base), including the impact of general economic conditions on consumer confidence and demand for our customers’ products, competitive products and pricing, the impact of manufacturing efficiencies and capacity constraints, the continuing success of technology advances and the related pace of new product development and customer acceptance of new products, our ability to enforce patents and protect intellectual property rights, the risk of intellectual property litigation, availability of raw materials and critical manufacturing equipment, trade environment, changes in exchange rates, available cash, distributable reserves for dividend payments and share repurchases, and other risks indicated in the risk factors included in ASML’s Annual Report on Form 20-F and other filings with the
US Securities and Exchange Commission.
/ Slide 2
ASML

Agenda
• Business summary
• Market
• ASML technology strategy
• Outlook
/ Slide 3
ASML
Business summary
/ Slide 4
ASML
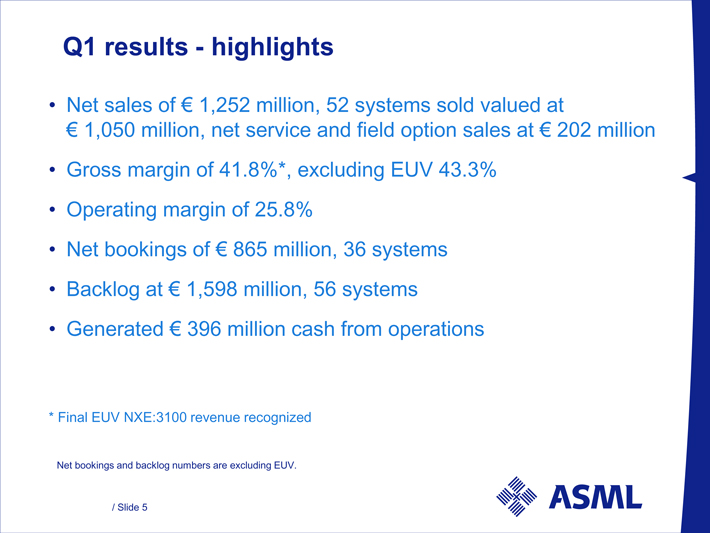
Q1 results - highlights
• Net sales of € 1,252 million, 52 systems sold valued at € 1,050 million, net service and field option sales at € 202 million
• Gross margin of 41.8%*, excluding EUV 43.3%
• Operating margin of 25.8%
• Net bookings of € 865 million, 36 systems
• Backlog at € 1,598 million, 56 systems
• Generated € 396 million cash from operations
* Final EUV NXE:3100 revenue recognized
Net bookings and backlog numbers are excluding EUV.
/ Slide 5
ASML

Total net sales M€
Net sales
6,000
5,000
4,000
3,000
2,000
1,000
0
3,768
955
934
930
949
2,954
494
697
844
919
1,596
581
555
277
183
4,508
1,521
1,176
1,069
742
5,651
1,211
1,459
1,529
1,452
1,252
2007 2008 2009 2010 2011 2012
Q4 Q3 Q2 Q1
Numbers have been rounded for readers’ convenience.
/ Slide 6
ASML
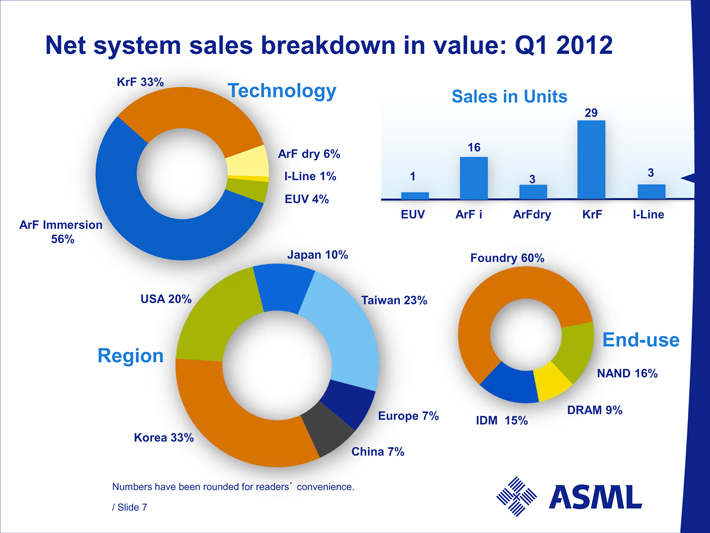
Net system sales breakdown in value: Q1 2012
Technology
KrF 33%
ArF Immersion 56%
ArF dry 6%
I-Line 1%
EUV 4%
Sales in Units
1 EUV
16 ArF i
3 ArFdry
29 KrF
3 I-Line
Region
Korea 33%
China 7%
Europe 7%
Taiwan 23%
Japan 10%
USA 20%
Foundry 60%
End-use
NAND 16%
DRAM 9%
IDM 15%
Numbers have been rounded for readers’ convenience.
/ Slide 7
ASML
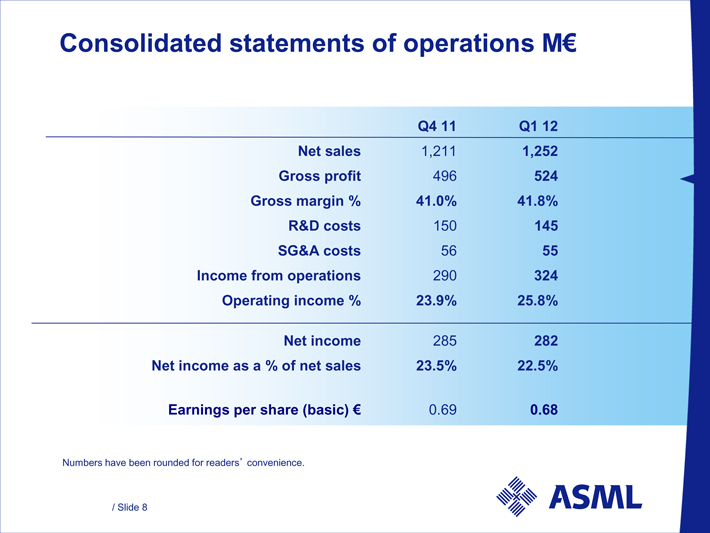
Consolidated statements of operations M€
Q4 11 Q1 12
Net sales 1,211 1,252
Gross profit 496 524
Gross margin % 41.0% 41.8%
R&D costs 150 145
SG&A costs 56 55
Income from operations 290 324
Operating income % 23.9% 25.8%
Net income 285 282
Net income as a % of net sales 23.5% 22.5%
Earnings per share (basic) € 0.69 0.68
Numbers have been rounded for readers’ convenience.
/ Slide 8
ASML

Key financial trends 2011 – 2012
Consolidated statements of operations M€
Q1 11 Q2 11 Q3 11 Q4 11 Q1 12
Net Sales 1,452 1,529 1,459 1,211 1,252
Gross profit 649 690 613 496 524
Gross margin % 44.7% 45.1% 42.1% 41.0% 41.8%
R&D costs 145 145 150 150 145
SG&A costs 54 51 56 56 55
Income from operations 450 494 407 290 324
Operating income % 31.0% 32.3% 27.9% 23.9% 25.8%
Net income 395 432 355 285 282
Net income as a % of net sales 27.2% 28.3% 24.4% 23.5% 22.5%
Units sold 63 63 55 41 52
ASP new systems 22.5 22.7 27.1 27.4 22.1
Net bookings value 845 840 514 710 865
Numbers have been rounded for readers’ convenience.
/ Slide 9
ASML
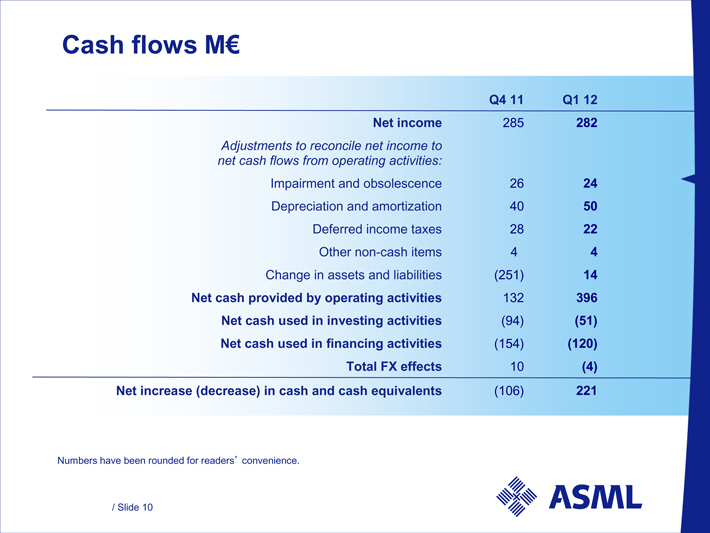
Cash flows M€
Q4 11 Q1 12
Net income 285 282
Adjustments to reconcile net income to net cash flows from operating activities:
Impairment and obsolescence 26 24
Depreciation and amortization 40 50
Deferred income taxes 28 22
Other non-cash items 4 4
Change in assets and liabilities (251) 14
Net cash provided by operating activities 132 396
Net cash used in investing activities (94) (51)
Net cash used in financing activities (154) (120)
Total FX effects 10 (4)
Net increase (decrease) in cash and cash equivalents (106) 221
Numbers have been rounded for readers’ convenience.
/ Slide 10
ASML
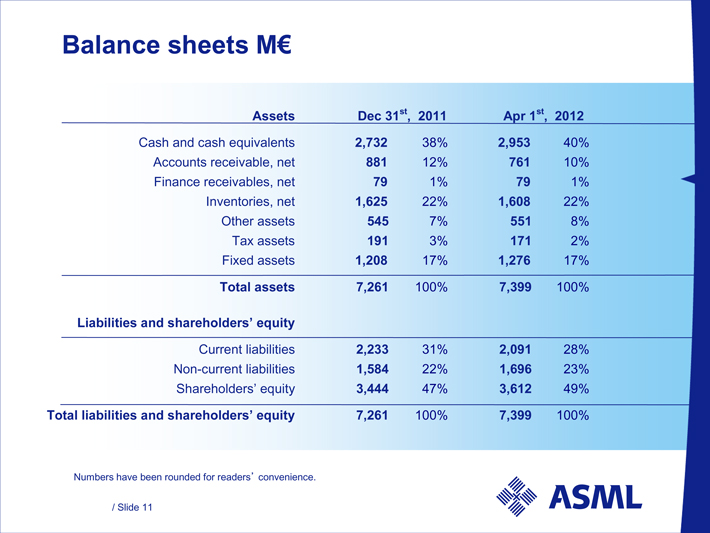
Balance sheets M€
Assets Dec 31st , 2011 Apr 1st , 2012
Cash and cash equivalents 2,732 38% 2,953 40%
Accounts receivable, net 881 12% 761 10%
Finance receivables, net 79 1% 79 1%
Inventories, net 1,625 22% 1,608 22%
Other assets 545 7% 551 8%
Tax assets 191 3% 171 2%
Fixed assets 1,208 17% 1,276 17%
Total assets 7,261 100% 7,399 100%
Liabilities and shareholders’ equity
Current liabilities 2,233 31% 2,091 28%
Non-current liabilities 1,584 22% 1,696 23%
Shareholders’ equity 3,444 47% 3,612 49%
Total liabilities and shareholders’ equity 7,261 100% 7,399 100%
Numbers have been rounded for readers’ convenience.
/ Slide 11
ASML
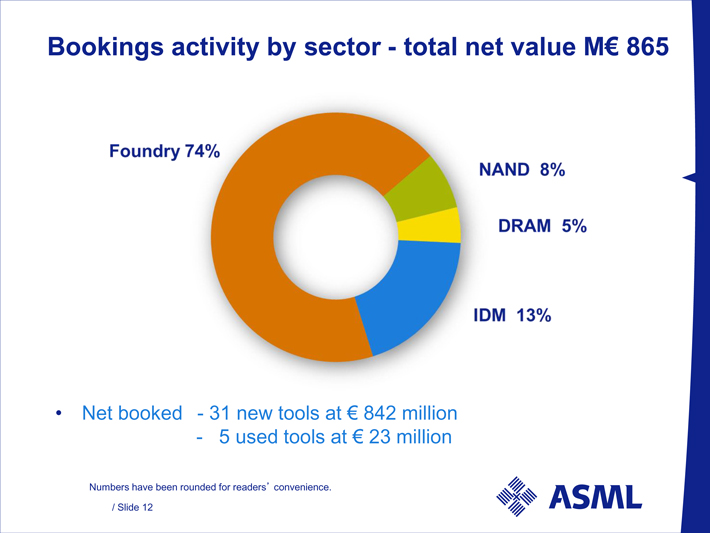
Bookings activity by sector - total net value M€ 865
Foundry 74%
NAND 8%
DRAM 5%
IDM 13%
• Net booked - 31 new tools at € 842 million
- 5 used tools at € 23 million
Numbers have been rounded for readers’ convenience.
/ Slide 12
ASML

Backlog in value per Apr 1st, EUV not included
Total value M€ 1,598
Technology
ArF immersion 75%
KrF 21%
I-Line 3% ArF dry 1%
New Used Total
systems systems systems
Units 46 10 56
Value M€ 1,546 52 1,598
ASP M€ 33.6 5.2 28.5
End-use
Foundry 53%
IDM 24%
DRAM 2%
NAND 21%
USA 29%
Taiwan 29%
Korea 28%
Japan 7%
Singapore 2%
Europe 4%
China 1%
Region
(ship to location)
• 91% of backlog carry shipment dates in the next 6 months
Numbers have been rounded for readers’ convenience.
/ Slide 13
ASML
Cash return to shareholders
• Dividend of € 0.46 per ordinary share will be proposed during the AGM April 25th
• 74% of € 1,130 million share buy back program executed end of Q1
• Bought back 4.1 million shares worth € 139 million in Q1 ‘12
• Purchased shares are/will be cancelled
• Initiate buy back program of up to 2.2 million shares to cover outstanding employee stock and option plans later this year
• These shares will be held as treasury shares
• Reiterate our policy to return excess cash to shareholders through dividend payments and share buy backs
/ Slide 14
ASML
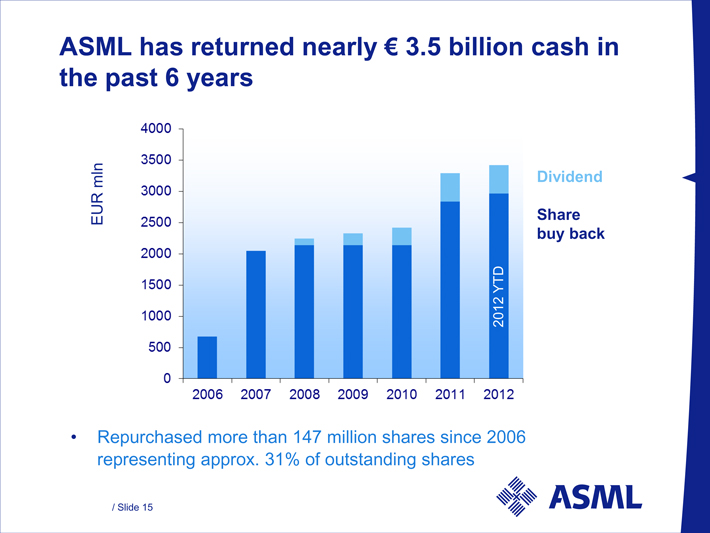
ASML has returned nearly € 3.5 billion cash in the past 6 years
EUR mln
4000
3500
3000
2500
2000
1500
1000
500
0
2006 2007 2008 2009 2010 2011 2012
Dividend
Share buy back
• Repurchased more than 147 million shares since 2006 representing approx. 31% of outstanding shares
/ Slide 15
ASML
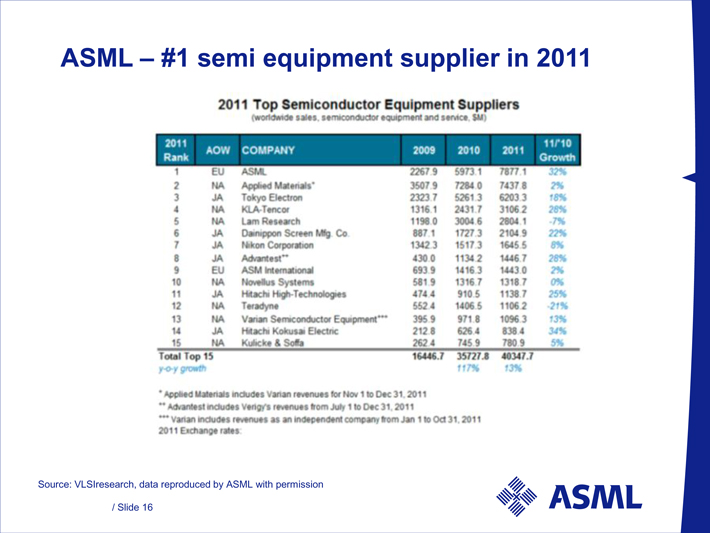
ASML – #1 semi equipment supplier in 2011
2011 Top Semiconductor Equipment Suppliers
(worldwide sales, semiconductor equipment and service, $M)
2011 Rank AOW Company 2009 2010 2011
11/’10 Growth
1 EU ASML 2267.9 5973.1 7877.1 32%
2 NA Applied Materials* 3507.9 7284.0 7437.8 2%
3 JA Tokyo Electron 2323.7 5261.3 6203.3 18%
4 NA KLA-Tencor 1316.1 2431.7 3106.2 28%
5 NA Lam Research 1198.0 3004.6 2804.1 -7%
6 JA Dainippon Screen Mfg. Co. 887.1 1727.3 2104.9 22%
7 JA Nikon Corporation 1342.3 1517.3 1645.5 8%
8 JA Advantest** 430.0 1134.2 1446.7 28%
9 EU ASM International 693.9 1416.3 1443.0 2%
10 NA Novellus Systems 581.9 1316.7 1318.7 0%
11 JA Hitachi High-Technologies 474.4 910.5 1138.7 25%
12 NA Teradyne 552.4 1406.5 1106.2 -21%
13 NA Varian Semiconductor Equipment*** 395.9 971.8 1096.3 13%
14 JA Hitachi Kokusai Electric 212.8 626.4 838.4 34%
15 NA Kulicke & Soffa 262.4 745.9 780.9 5%
Total Top 15 16446.7 35727.8 40347.7
y-o-y growth 117% 13%
* Applied Materials includes Varian revenues for Nov 1 to Dec 31, 2011
** Advantest includes Verigy’s revenues from July 1 to Dec 31, 2011
*** Varian includes revenues as an independent company from Jan 1 to Oct 31, 2011
2011 Exchange rates:
Source: VLSIresearch, data reproduced by ASML with permission
/ Slide 16
ASML
Market
/ Slide 17
ASML

Business environment
• Litho sales is driven mainly by demand from Logic
(Foundries and IDM’s), which will represent the majority of our sales in the next 2 quarters
• Demand for 28 nm in Logic continues to be large and structural and will be accompanied by the start of pre-production for 20 nm late in 2012
• For memory we expect technology demand for sub 20 nm NAND, sub 30 nm DRAM later this year
• Our sales will include both TWINSCAN immersion technology and KrF tools driven by sustained capacity build in Logic
/ Slide 18
ASML

ASML technology strategy
/ Slide 19
ASML
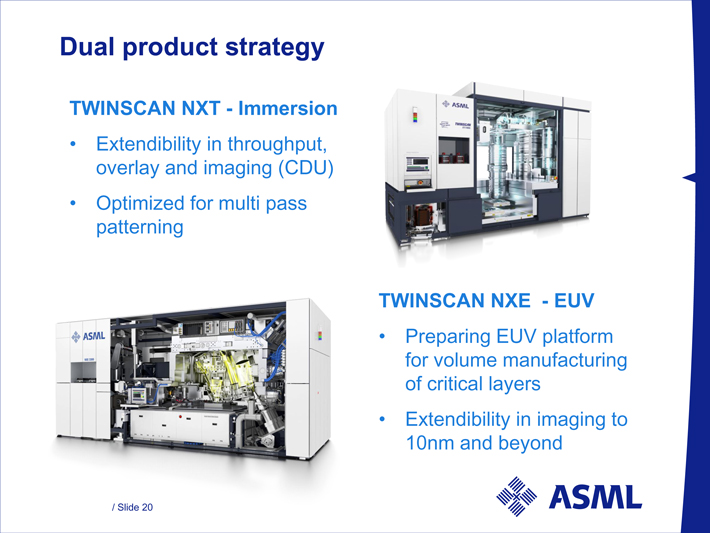
Dual product strategy
ASML
TWINSCAN NXT - Immersion
• Extendibility in throughput, overlay and imaging (CDU)
• Optimized for multi pass patterning
ASML
TWINSCAN NXE - EUV
• Preparing EUV platform for volume manufacturing of critical layers
• Extendibility in imaging to 10nm and beyond
/ Slide 20
ASML
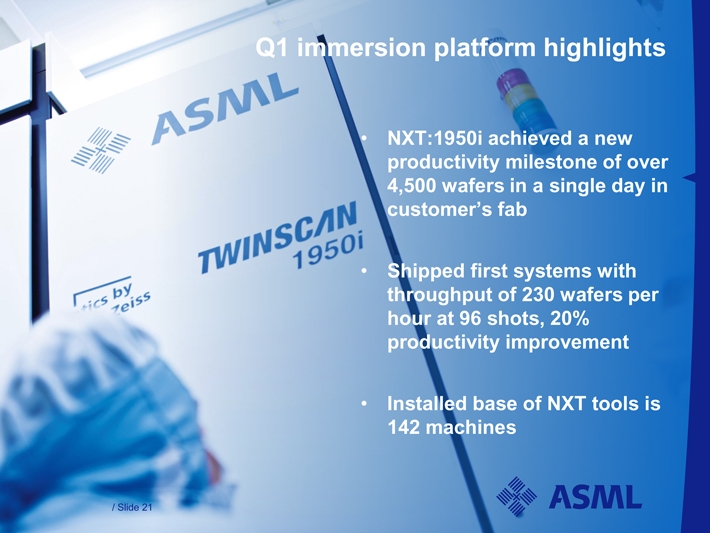
Q1 immersion platform highlights
ASML
• NXT:1950i achieved a new productivity milestone of over 4,500 wafers in a single day in customer’s fab
TWINSCAN
1950i
• Shipped first systems with throughput of 230 wafers per hour at 96 shots, 20% productivity improvement
• Installed base of NXT tools is 142 machines
/ Slide 21
ASML
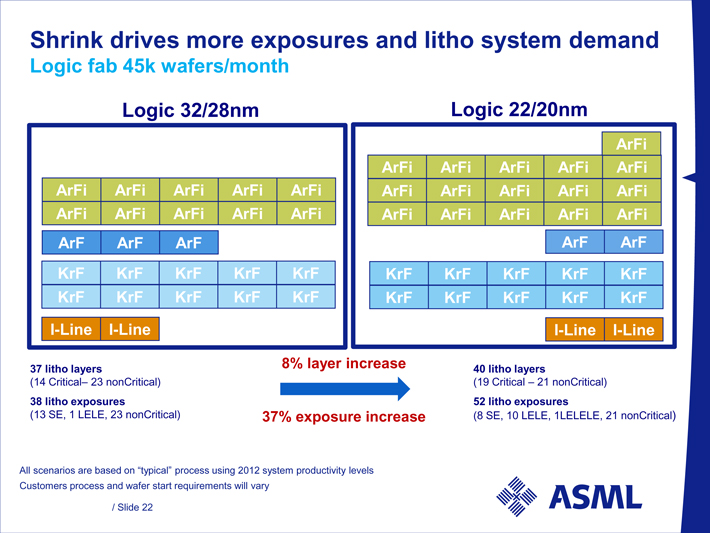
Shrink drives more exposures and litho system demand
Logic fab 45k wafers/month
Logic 32/28nm
ArFi ArFi ArFi ArFi ArFi
ArFi ArFi ArFi ArFi ArFi
ArF ArF ArF
KrF KrF KrF KrF KrF
KrF KrF KrF KrF KrF
I-Line I-Line
Logic 22/20nm
ArFi
ArFi ArFi ArFi ArFi ArFi
ArFi ArFi ArFi ArFi ArFi
ArFi ArFi ArFi ArFi ArFi
ArF ArF
KrF KrF KrF KrF KrF
KrF KrF KrF KrF KrF
I-Line I-Line
37 litho layers
(14 Critical – 23 nonCritical)
38 litho exposures
(13 SE, 1 LELE, 23 nonCritical)
8% layer increase
37% exposure increase
40 litho layers
(19 Critical – 21 nonCritical)
52 litho exposures
(8 SE, 10 LELE, 1LELELE, 21 nonCritical)
All scenarios are based on “typical” process using 2012 system productivity levels Customers process and wafer start requirements will vary
/ Slide 22
ASML

All 2nd generation EUV systems delivered to customers
ASML
System 1
ASML
System 2
ASML
System 3
ASML
System 4
ASML
System 5
ASML
System 6
All systems printing wafers for device development
/ Slide 23
ASML
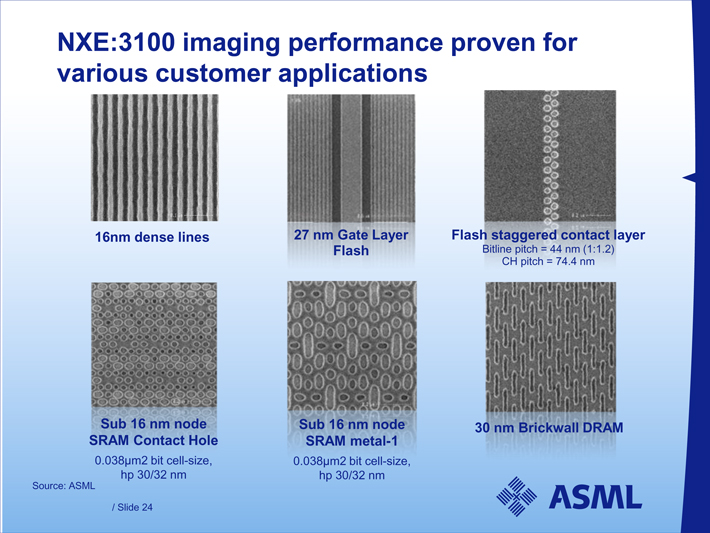
NXE:3100 imaging performance proven for various customer applications
16nm dense lines
27 nm Gate Layer Flash
Flash staggered contact layer
Bitline pitch = 44 nm (1:1.2) CH pitch = 74.4 nm
Sub 16 nm node SRAM metal-1
0.038µm2 bit cell-size, hp 30/32 nm
Sub 16 nm node SRAM Contact Hole
0.038µm2 bit cell-size, hp 30/32 nm
30 nm Brickwall DRAM
Source: ASML
/ Slide 24
ASML
EUV highlights Q1
• Supplier has demonstrated 30 Watts laser power at high duty cycle with acceptable dose control for a sustained period of time
• In addition progress demonstrated on light source with 50 watts raw laser power, successfully applying pre-pulse technology
• Stable overlay performance of < 2 nm achieved
• 9,000 wafers exposed on customer EUV tools to date
/ Slide 25
ASML
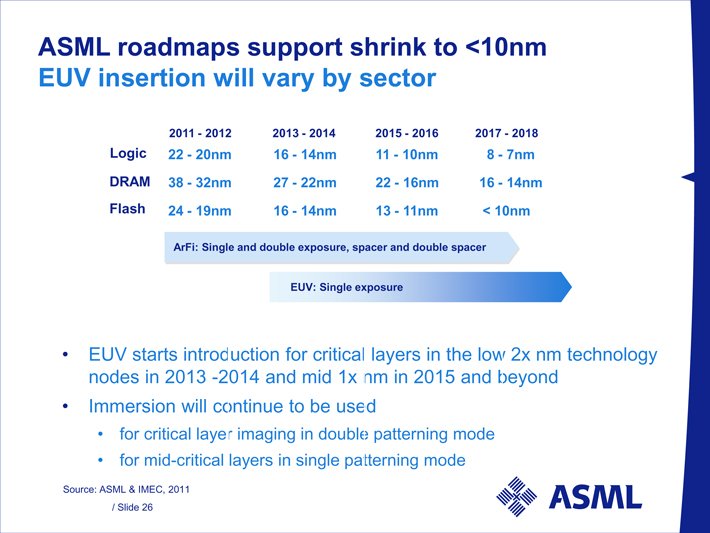
ASML roadmaps support shrink to <10nm EUV insertion will vary by sector
2011 - 2012 2013 - 2014 2015 - 2016 2017 - 2018
Logic 22 - 20nm 16 - 14nm 11 - 10nm 8 - 7nm
DRAM 38 - 32nm 27 - 22nm 22 - 16nm 16 - 14nm
Flash 24 - 19nm 16 - 14nm 13 - 11nm < 10nm
ArFi: Single and double exposure, spacer and double spacer
EUV: Single exposure
• EUV starts introduction for critical layers in the low 2x nm technology nodes in 2013 -2014 and mid 1x nm in 2015 and beyond
• Immersion will continue to be used
• for critical layer imaging in double patterning mode
• for mid-critical layers in single patterning mode
Source: ASML & IMEC, 2011
/ Slide 26
ASML

EUV simplifies process and reduces costs and cycle time
LELE relative to EUV
Process steps x2
Cycle time x2
Additional costs < 10%
Process steps
DPT relative to EUV
Process steps x4
Cycle time x4
Additional costs 30-50%
QPT relative to EUV
Process steps > x5
Cycle time > x5
Additional costs > 50%
Litho Etch Litho Etch
Single Spacer
Double Spacer
EUV
Strip/clean
Etch
Defect inspection
Metrology
Develop
Expose
Coat
CVD
Data is based on Customer interaction
/ Slide 27
ASML
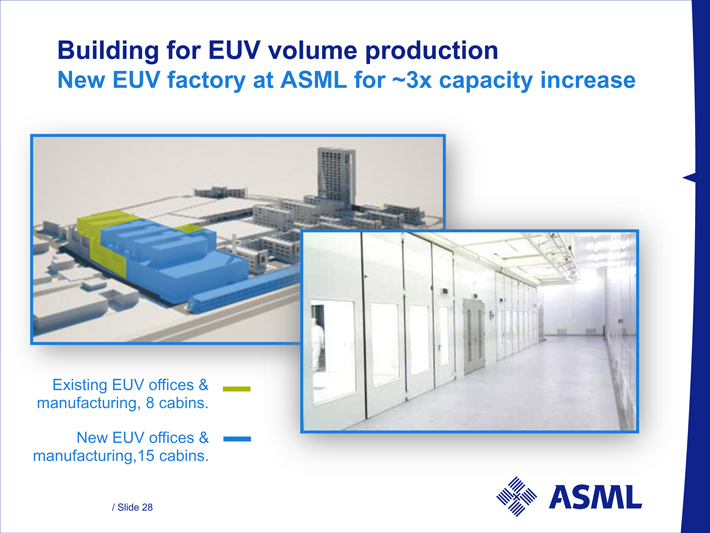
Building for EUV volume production
New EUV factory at ASML for ~3x capacity increase
Existing EUV offices & manufacturing, 8 cabins.
New EUV offices & manufacturing, 15 cabins.
/ Slide 28
ASML
Status EUV
• First shipment of the NXE:3300B production system is planned for Q4 2012 with revenue recognition expected starting early 2013
• Next batch of orders currently being negotiated
• Proven imaging and overlay performance of NXE:3100 platform supports current customer device and process development for 2x nm node
• Programs defined to improve efficiency of the system to reach our target of 60 wafers per hour in H2 2012
• EUV delivers:
• Single exposure shrink, fewer design restrictions, with less fab complexity in less fab space
• Extendable for many nodes to come
/ Slide 29
ASML
Outlook
/ Slide 30
ASML
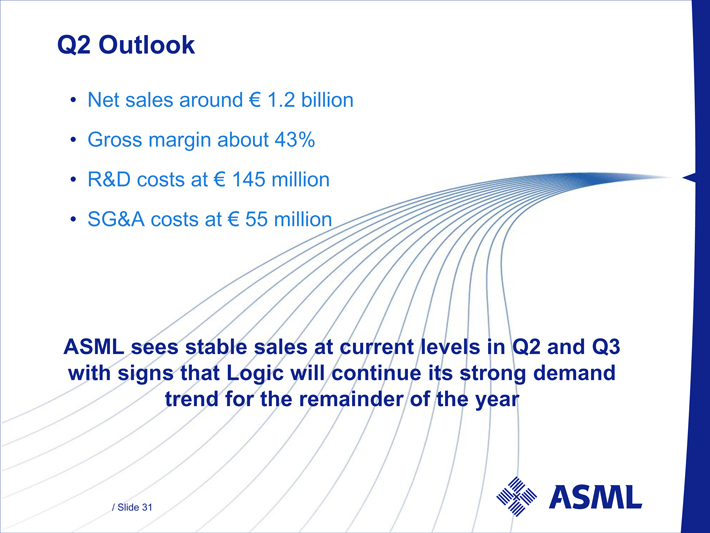
Q2 Outlook
• Net sales around € 1.2 billion
• Gross margin about 43%
• R&D costs at € 145 million
• SG&A costs at € 55 million
ASML sees stable sales at current levels in Q2 and Q3 with signs that Logic will continue its strong demand trend for the remainder of the year
/ Slide 31
ASML
ASML