Exhibit 99.1

Statutory Annual Report 2011
Contents
1 | Board of Management | |
2 | Supervisory Board | |
3 | Supervisory Board Report | |
10 | Corporate Governance Paragraph1 | |
29 | Management Board Report | |
48 | Directors’ Responsibility Statement | |
51 | Statutory Financial Statements | |
119 | Company Financial Statements | |
131 | Other Information | |
135 | Information and Investor Relations | |
137 | ASML Worldwide Contact Information | |
This report comprises regulated information within the meaning of articles 1:1 and 5:25c of the Dutch Financial Markets Supervision Act (Wet op het Financieel Toezicht)
In this report the name “ASML” is sometimes used for convenience in contexts where reference is made to ASML Holding N.V. and/or any of its subsidiaries in general. The name is also used where no useful purpose is served by identifying the particular company or companies.
© 2012, ASML Holding N.V. All Rights Reserved
ASML STATUTORY ANNUAL REPORT 2011
Board of Management
Eric Meurice (1956)
President, Chief Executive Officer and
Chairman of the Board of Management
Appointed in 2004, reappointed in 2008
French nationality
Peter T.F.M. Wennink (1957)
Executive Vice President, Chief Financial Officer and
Member of the Board of Management
Appointed in 1999
Dutch nationality
Martin A. van den Brink (1957)
Executive Vice President, Chief Product and Technology Officer and
Member of the Board of Management
Appointed in 1999
Dutch nationality
Frits J. van Hout (1960)
Executive Vice President, Chief Marketing Officer and
Member of the Board of Management
Appointed in 2009
Dutch nationality
Frédéric J.M.Schneider-Maunoury (1961)
Executive Vice President, Chief Operating Officer and
Member of the Board of Management
Appointed in 2010
French nationality
| ASML STATUTORY ANNUAL REPORT 2011 | 1 |
Supervisory Board
Arthur P.M. van der Poel (1948)
(Chairman)
Former Chief Executive Officer of Philips Semiconductors
First appointed 2004
Current term until 2012
Dutch nationality
Jos W.B. Westerburgen (1942)
Former Company Secretary and
Head of Tax of Unilever N.V. and Plc.
First appointed 2002
Current term until 2013
Dutch nationality
Fritz W. Fröhlich (1942)
(Vice Chairman)
Former Deputy Chairman and
Chief Financial Officer of Akzo Nobel N.V.
First appointed 2004
Current term until 2012
German nationality
Hendrika (leke) C.J. van den Burg (1952)
Member of the Dutch Monitoring Committee Corporate Governance Code
First appointed 2005
Current term until 2013
Dutch nationality
OB Bilous (1938)
Former General Manager and
VP Worldwide Manufacturing of IBM’s Microelectronics Division
First appointed 2005
Current term until 2012
United States nationality
William T. Siegle (1939)
Former Senior Vice President and
Scientist of AMD, Inc.
First appointed 2007
Current term until 2013
United States nationality
Pauline F.M. van der Meer Mohr (1960)
President of the Executive Board of the Erasmus University Rotterdam
First appointed 2009
Current term until 2013
Dutch nationality
Wolfgang H. Ziebart (1950)
Former President and CEO of Infineon Technologies A.G.
First appointed 2009
Current term until 2013
German nationality
| ASML STATUTORY ANNUAL REPORT 2011 | 2 |
Supervisory Board Report
In this section of the 2011 Statutory Annual Report of ASML Holding N.V. (“ASML” or the “Company”), the Supervisory Board reports on its activities in 2011, and on the information required to be provided in this report based on the Dutch Corporate Governance Code (the “Code”).
Overview of 2011
After 2010, 2011 continued to be a very good year for ASML in many aspects. Financially, because ASML’s revenues, margins, net income all showed record numbers, but also technologically, with for example progress in EUV, as ASML delivered five EUV pre-production tools to customers in 2011, in addition to the one shipped in 2010. On the other hand, challenges were again numerous in 2011, relating to among others ASML’s factory capacity / supply to demand; EUV and other leading-edge technologies; as well as the need for employees with the appropriate technical skills.
Furthermore, the increasing uncertainty of the macro-economic outlook in the second half of 2011 also led to some uncertainty for the semiconductor market in 2012, as a result of which the meetings in the later part of the year rather took the current macro-economic situation into consideration, while the meetings in the early part of 2011 focused on the challenges related to an upturn.
In 2011, ASML’s strategic direction for the coming years was discussed extensively with prime focus on: maintaining and further developing ASML’s position as a technology leader in semiconductor lithography. The goal of this strategy is to deliver lithography systems which enable customers to produce highest performance and lowest cost chips. The value of ownership offered to customers as a result of ASML’s strategy also maximizes ASML’s own financial performance, aligning the interests of ASML and our customers.
Another important topic of discussion in 2011 was the development and status of the EUV tool. The technological issues were discussed in-depth, especially in the Technology and Strategy Committee. But also the full Supervisory Board monitored (and will continue to do so) the progress in the development of this - technologically very advanced - tool.
As the current term of Mr. Meurice’s appointment as ASML’s President, Chief Executive Officer (“CEO”) and Chairman of the Board of Management expires per the 2012 Annual General Meeting of Shareholders (“AGM”), the Supervisory Board discussed and decided on the extension Mr. Meurice’s appointment term in 2011. In preparing this decision for the Supervisory Board, the Selection and Nomination Committee took into consideration ASML’s good technical, operational and financial performance during Mr. Meurice’s tenure. Subject to notification to the AGM, the Supervisory Board - in mutual agreement with Mr. Meurice - will extend the appointment term of Mr. Meurice for two more consecutive years until the AGM in 2014. Mr. Meurice will then have served as ASML’s President, CEO and Chairman of the Board of Management for a period of ten years. The appointment term can potentially be further extended by another two years.
Meetings and activities of the Supervisory Board
The Supervisory Board held five - scheduled - physical meetings in 2011. In addition, three scheduled conference calls were held to specifically discuss the quarterly results and the press releases related thereto. In general, the physical meetings of the Supervisory Board and its committees are held during several days, thus creating more time for longer Supervisory Board meetings. The additional time available is spent on specific themes, such as management development, operational performance and strategy.
To continuously stay abreast of the developments in the semiconductor market, the Board of Management provides the Supervisory Board each meeting with an overview of the market situation at that moment, expectations for the near future, the development of ASML’s share price and investor / analyst feedback on ASML. Other topics frequently addressed during the 2011 Supervisory Board meetings were among others ASML’s business risks; investor relations; and the corporate objectives and targets. Twice per year, the Company’s budget is reviewed by the Supervisory Board.
The Supervisory Board also reviewed ASML’s sustainability strategy, including the actions (to be) implemented needed to achieve the targets set with respect to the sustainability strategy. Sustainability was also addressed in the Remuneration Committee as it is a short-term qualitative target for the members of the Board of Management.
No Supervisory Board member was absent more than once in 2011; the attendance rate was 97.0 percent.
| ASML STATUTORY ANNUAL REPORT 2011 | 3 |
In general, after each Supervisory Board meeting, the Supervisory Board members meet inter se to discuss for example the functioning of the Supervisory Board and of the Board of Management and its members; and any other topics deemed important at that time, such as the extension of Mr. Meurice’s appointment term.
During all physical meetings of the Supervisory Board, most Board of Management members were present. Also outside the meetings, members of the Supervisory Board and its committees interacted regularly with the Board of Management and the individual members. Also, several informal meetings and telephone calls took place among Supervisory Board members to consult with each other on various topics.
Each year, the Supervisory Board and each of its committees perform an evaluation related to the functioning of the Supervisory Board; its committees and the individual members, as well as the functioning of the Board of Management and the individual members in the past year. Also the composition of both bodies is addressed. In 2011, the evaluation of the Supervisory Board was done in one-on-one interviews between the Chairman and each individual Supervisory Board member. Besides the topics mentioned above, the discussions also focused on the recommendations and action items resulting from the 2010 evaluation and the follow up thereof, such as composition of the Supervisory Board, and additional topics to be addressed in the Supervisory Board meetings.
The evaluation of each committee was conducted by means of a questionnaire specifically developed for that committee, also including follow-up themes resulting from the evaluations performed the previous year. Each committee discussed the outcome of the evaluation among its own members. The main conclusions of the evaluation of the committees and of the Supervisory Board were discussed in a Supervisory Board-only meeting. The Supervisory Board has embedded the evaluation process in its processes and activities as the Supervisory Board attaches great value to the evaluations. They ensure continuous focus on the quality of the activities, composition and functioning of the Supervisory Board and its committees.
Furthermore, as is done each year, also in 2011 a delegation of the Supervisory Board met twice with the Works Council of ASML Netherlands B.V. The topics of these meetings mostly evolve around important internal and external developments relevant for the Company and its employees, the Company’s financial position and its strategy. The Supervisory Board considers these meetings a valuable contribution to its activities for ASML.
For further details on the structure, organization and responsibilities of the Supervisory Board, reference is made to the Corporate Governance Paragraph of this Statutory Annual Report.
Composition of the Supervisory Board
Currently, the Supervisory Board consists of eight members. Four of the Supervisory Board members have the Dutch nationality, two members have the German nationality and two members have the United States nationality. Two of the eight Supervisory Board members are female. The average age is 65 years, whereby the ages vary from 51 to 73 years.
In 2011, J. (Jos) Westerburgen and W. (William) Siegle retired by rotation on April 20, 2011 and were both reappointed for a period of two years. In line with the Supervisory Board’s rotation schedule, Mr. Westerburgen has started his last term on ASML’s Supervisory Board and will therefore retire from ASML’s Supervisory Board in 2013. In 2012, Messrs. OB (OB) Bilous, F. (Fritz) Fröhlich and A. (Arthur) van der Poel will retire by rotation. These members have indicated to be available for reappointment.
Supervisory Board Committees
The Supervisory Board has installed four committees: an Audit Committee, Remuneration Committee, Selection and Nomination Committee, and Technology and Strategy Committee. Each committee operates pursuant to its charter, which charter is based on the rules and regulations of the Code, but also reflects practices developed over the years. The responsibilities and authorities of the committees are based on a mandate of the Supervisory Board, whereas the Supervisory Board retains full responsibility for the activities of the four committees. The committees prepare the decisions to be made by the full Supervisory Board, each in its own field of expertise.
In the plenary Supervisory Board meetings, the Chairman of each committee provides a report, verbally and/or in writing, on the topics discussed during the committee meetings. In addition, the minutes of the committee meetings are available for all Supervisory Board members, so that they have all information sufficient to understand ASML’s current state of affairs, thus ensuring that the full Supervisory Board is able to make the appropriate decisions.
| ASML STATUTORY ANNUAL REPORT 2011 | 4 |
Audit Committee
The current members of ASML’s Audit Committee are Mr. Fröhlich (Chairman), Mr. Van der Poel and Mr. Ziebart. The members of the Audit Committee are all independent, non-executive members of the Supervisory Board.
In 2011, the Audit Committee met four times and held four conference calls. Three calls were specifically held to discuss the quarterly results and the related press release; the other call was held for the purpose of discussing the results of the year-end audits (US GAAP and International Financial Reporting Standards, “IFRS”, respectively). The Audit Committee also continuously monitors the activities of the internal audit department with respect to ASML’s risk management and ASML’s internal controls, including the internal controls over financial reporting in light of Section 404 of the Sarbanes-Oxley Act of 2002. The Audit Committee reviews and approves the audit plans of the internal and external auditors and monitors their audit activities. Annually, the Audit Committee reviews ASML’s tax strategy, tax systems and tax planning; investor relations; ASML’s management of the IT landscape; and the activities of the Company’s Disclosure Committee. The Audit Committee also regularly discusses ASML’s financial position, and ASML’s financing and return policy. The Audit Committee (and Supervisory Board) endorses ASML’s conservative principles with respect to its financing policy and return policy, which helps ASML to respond properly to the highly cyclical nature of the semiconductor equipment industry.
In 2011, the Audit Committee conducted an extensive assessment with respect to the performance of the external auditor over the past four years. The evaluation was conducted by means of surveys which were completed by the various bodies within the Company who work with the auditor during their audit, and by the Audit Committee. The surveys addressed among others the quality, scope and planning of the audit; the independence of the auditor; the composition of the audit team; the fees and the reporting of the auditor. The result of the surveys was positive, with some minor attention points for the future such as recommendations with respect to maintaining continuity of ASML knowledge within the audit team.
To anticipate on the external developments with respect to the audit profession and to bring the auditor’s (re)appointment in line with current governance requirements, it was decided to change the current indefinite appointment of the auditor to an annual (re)appointment to be approved by the AGM, effective per the 2012 AGM. The proposal for (re)appointment shall include the main conclusions of the auditor’s evaluation for purposes of assessing the reappointment of the auditor. Furthermore, the Audit Committee decided to perform the extensive assessment as described above at least every two years instead of every four years.
Selection and Nomination Committee
The current members of ASML’s Selection and Nomination Committee are Mr. Westerburgen (Chairman), Mr. Bilous and Mr. Van der Poel. The Selection and Nomination Committee held five scheduled meetings and several additional meetings on an ad-hoc basis in 2011. As already previously mentioned, the Selection and Nomination Committee prepared the decision for the Supervisory Board to extend the appointment term of Mr. Meurice. Besides above topic, other discussion items in 2011 were the ’regular’ topics such as management development and talent management; the composition of the Supervisory Board and of the Board of Management; and the functioning of the individual members of the Supervisory Board and the Board of Management.
The Selection and Nomination Committee is also responsible for monitoring Corporate Governance developments. The main topics of discussion this year with respect to that topic were the possible consequences for ASML’s Board of Management and Supervisory Board in view of the expected enactment of the Bill on Management and Supervision on July 1, 2012; the possible consequences of the proposed Bill with respect to the amendment of bonus and profit participation of members of the Board of Management; and the 2011 report of the Monitoring Committee of the Dutch Corporate Governance Code.
Remuneration Committee
The current members of ASML’s Remuneration Committee are Mr. Westerburgen (Chairman), Ms. Van den Burg and Ms. Van der Meer Mohr. In 2011, the Remuneration Committee met four times in physical meetings, two times via conference call and several times on an ad-hoc basis. The topics discussed in 2011 included: the share and option plans for the employees; the targets and remuneration package for the Board of Management; and the 2010 and 2011 Remuneration Reports. Also discussed were proposals for the revision of the 2010 Remuneration Policy, scheduled to be submitted for adoption to the AGM in 2013. Furthermore, in order to comply with the highest standards of corporate governance and to mitigate the potential benefit of a Change of Control under the long term incentive, the Remuneration Committee prepared a proposal with respect thereto for the Supervisory Board. The Supervisory Board agreed with the proposed arrangement, which entails that the share price will be fixed on the average of i) the average closing share price over a period of 15 trading days prior to the first public announcement of Change of Control negotiations, and
| ASML STATUTORY ANNUAL REPORT 2011 | 5 |
ii) the average closing share price over a period of 30 trading days prior to closing of the transaction. This Change of Control arrangement was included in the employment contracts of the Board of Management members.
Another topic this year was the remuneration aspect in relation to the proposed extension of Mr. Meurice’s appointment term. As required by the Code, the main details of Mr. Meurice’s remuneration package will be provided at the time of publication of the relevant documents for the AGM, in March 2012.
In cooperation with the Audit Committee and the Technology and Strategy Committee, the Remuneration Committee reviewed and proposed to the Supervisory Board the 2011 targets for the Board of Management and also provided its recommendations to the Supervisory Board with respect to the achievement of the 2011 targets and related appropriate compensation levels for the Board of Management members over the financial year 2011.
Legal experts as well as experts in the field of remuneration for members of Boards of Management assisted the Remuneration Committee in its activities. These experts do not provide remuneration advice to the Board of Management.
Technology and Strategy Committee
The current members of ASML’s Technology and Strategy Committee are Mr. Siegle (Chairman), Mr. Bilous, Mr. Van der Poel and Mr. Ziebart. In addition, the Technology and Strategy Committee may appoint one or more advisors from within and/or from outside the Company. In 2011 three external advisors participated in committee meetings. The advisors to the Technology and Strategy Committee may be invited as guests to (parts of) the meetings of the Committee, but are not entitled to vote in the meetings. The Technology and Strategy Committee held five physical meetings and one conference call in 2011. In general, the physical meetings last a full day. One meeting and the conference call were held for the purpose of discussing the technology targets for the Board of Management and the achievements related thereto.
The Technology and Strategy Committee reviews the specific ASML technology matters important at that time and discusses the proposals for ASML’s future product- and technology strategies. The Technology and Strategy Committee is instrumental in preparing the decisions and/ or advice for the Supervisory Board related to these topics. Important topics this year were, as mentioned, ASML’s EUV development and production processes. To familiarize themselves with the technical demands and challenges related to the development and production of the EUV tool, the Technology and Strategy Committee members visited suppliers who develop important components of this tool as well as customers, to also understand the customer requirements. Besides EUV, other topics of discussion included matters related to Immersion and holistic lithography solutions (for example Brion products and metrology).
For a further description of the responsibilities of the Supervisory Board committees, reference is made to the Corporate Governance Paragraph of this Statutory Annual Report.
Remuneration of the Supervisory Board
The remuneration of the Supervisory Board members is described in Note 30 to the Consolidated Financial Statements. In 2011, the AGM adopted the Supervisory Board’s proposal to increase the Supervisory Board’s remuneration in view of the continuing increase of responsibilities, workload and liabilities for the Supervisory Board members and its committees, as well as the growth of the Company over the past years. Furthermore the AGM approved to further increase the annual (fixed) fee with a maximum amount of EUR 5,000 depending on circumstances. In addition to their fee as member of the Supervisory Board, Supervisory Board members also receive a fee for each committee membership, as well as a net cost allowance. The Supervisory Board remuneration is not dependent on the financial results of the Company. None of the members of the Supervisory Board owns shares or options on shares of the Company. The Company has not granted any loans to, nor has it granted any guarantees in favor of, any of the members of the Supervisory Board.
Composition of the Board of Management
The Board of Management currently consists of five members. As mentioned earlier in this report, the Supervisory Board will extend the appointment term of Mr. Meurice for two more consecutive years upon notification to the AGM to be held on April 25, 2012. For further details and a biography of the members of the Board of Management, see page 1 of this Statutory Annual Report.
| ASML STATUTORY ANNUAL REPORT 2011 | 6 |
Remuneration of the Board of Management
General
In 2010, the General Meeting of Shareholders adopted an update of the Remuneration Policy for the Board of Management. This policy did not change in 2011. The Remuneration Committee oversees the development and implementation of compensation and benefit programs for the Board of Management, as well as the compensation levels for the individual members of the Board of Management.
The Remuneration Committee reviews the corporate objectives and targets relevant to the compensation of all members of the Board of Management, in cooperation with the Audit Committee and the Technology and Strategy Committee. The Remuneration Committee evaluates the achievements of the Board of Management with respect to those objectives and targets (again, in cooperation with the Audit Committee and the Technology and Strategy Committee), and provides recommendations to the Supervisory Board on the resulting compensation levels for the members of the Board of Management.
The external auditor performs agreed-upon procedures on the targets achieved to assess compliance with the Remuneration Policy.
The Supervisory Board has the discretionary power to adjust variable remuneration components both upwards and downwards if these would, in the opinion of the Supervisory Board, produce an unfair result due to extraordinary circumstances during the period in which the predetermined performance criteria have been or should have been achieved (Ultimum Remedium - provision II.2.10). Besides this, the Supervisory Board may recover from the Board of Management any variable remuneration awarded on the basis of incorrect financial or other data (claw back clause - provision II.2.11).
Outline 2011 remuneration report
In summary, total remuneration for members of the Board of Management is derived from the median level of the appropriate top executive pay market (a reference market consisting of a group of European companies mainly in the ICT and Technology sector) and consists of (i) base salary; (ii) short term performance incentives (in cash); (iii) long term performance incentives (in shares) and (iv) other benefits. The payout of the cash incentive and vesting of performance shares is dependent on the achievement of predetermined financial and non-financial performance criteria.
By applying the following ratio, the structure of Total Direct Compensation is aimed at balancing short and long term performance and to align remuneration with long term value creation: 100-75-80 for the CEO, where base salary is 100; the target short term performance related cash incentive is 75; long term performance shares are 80. For the other members of the Board of Management this ratio is 100-60-80. The maximum payout - in case of overachievement of pre-defined targets - for the performance shares is 146.25 percent for all members of the Board of Management.
Gratitude to ASML employees
The Supervisory Board would like to thank and recognize all ASML employees who have been able to again achieve so much this past year: the progress with EUV: the shipment of the 100th NXT1950i; the efforts made to supply to the demand. All your efforts resulted in a record year for ASML with respect to sales and profit. ASML’s Supervisory Board acknowledges the pressure that the extreme swings in demand put on ASML employees, and appreciates all the efforts and achievements of ASML employees throughout these years. And the Supervisory Board would especially like to thank the employees of ASML Japan, who remained so committed to ASML despite the natural and nuclear disaster which hit Japan in March of this year.
| ASML STATUTORY ANNUAL REPORT 2011 | 7 |
Information on Supervisory Board members
Presented below is the personal data of all Supervisory Board members that is required to be disclosed in this report in order to comply with the Code.
| OB Bilous | ||||
| gender | : | male | ||
| age | : | 73 | ||
| profession | : | former General Manager and Vice President Worldwide Manufacturing of IBM’s Microelectronics Division | ||
| principal position | : | retired | ||
| nationality | : | United States | ||
| other relevant positions | : | Board member Nantero, Inc. | ||
| first appointed | : | 2005 | ||
| current term until | : | 2012 | ||
H.C.J. van den Burg | ||||
gender | : | female | ||
| age | : | 59 | ||
| profession | : | former member of the European Parliament | ||
| principal position | : | member of the Dutch Monitoring Committee Corporate Governance Code | ||
| nationality | : | Dutch | ||
| other relevant positions | : | member of the Supervisory Board of APG Groep N.V., Chairperson of the Monitoring Foundation Dutch Insurance Companies, member of the Advisory Boards of the Dutch Data-Protection Authority and the Dutch National Register Supervisory Directors, member of the Advisory Scientific Committee European Systemic Risk Board (ECB Frankfurt) and member of the Advisory Council International Affairs Commission Human Rights (Dutch Ministry Foreign Affairs) | ||
| first appointed | : | 2005 | ||
| current term until | : | 2013 | ||
F.W. Fröhlich | ||||
gender | : | male | ||
| age | : | 69 | ||
| profession | : | former Deputy Chairman and CFO of Akzo Nobel N.V | ||
| principal position | : | retired | ||
| nationality | : | German | ||
| other relevant positions | : | Chairman of the Supervisory Board of Randstad Holding N.V., member of the Supervisory Boards of Allianz Nederland N.V. and Rexel SA, member of the Board of Directors of Prysmian Group. | ||
| first appointed | : | 2004 | ||
| current term until | : | 2012 | ||
P.F.M. van der Meer Mohr | ||||
gender | : | female | ||
| age | : | 51 | ||
| profession | : | President of the Executive Board of the Erasmus University Rotterdam | ||
| nationality | : | Dutch | ||
| other relevant positions | : | Member of the Supervisory Boards of Royal DSM N.V., Duisenberg School of Finance and Netherlands School for Public Governance | ||
| first appointed | : | 2009 | ||
| current term until | : | 2013 | ||
| A.P.M. van der Poel | ||||
gender | : | male | ||
| age | : | 63 | ||
| profession | : | former member of the Board of Management of Royal Philips Electronics | ||
| principal position | : | retired | ||
| nationality | : | Dutch | ||
| other relevant positions | : | member of the Board of Directors of Gemalto Holding N.V., member of the Supervisory Boards of PSV N.V. and DHV Holding B.V. | ||
| first appointed | : | 2004 | ||
| current term until | : | 2012 | ||
| ASML STATUTORY ANNUAL REPORT 2011 | 8 |
| W.T. Siegle | ||
gender | : male | |
age | : 73 | |
profession | : former Senior Vice President and Chief Scientist of AMD, Inc. | |
principal position | : retired | |
nationality | : United States | |
other relevant positions | : member of the Advisory Board of Acorn Technologies, Inc. | |
first appointed | : 2007 | |
current term until | : 2013 | |
J.W.B. Westerburgen | ||
gender | : male | |
age | : 69 | |
profession | : former Company Secretary and Head of Tax of Unilever N.V. and Plc. | |
principal position | : retired | |
nationality | : Dutch | |
other relevant positions | : Vice Chairman of the Board of the Association Aegon | |
first appointed | : 2002 | |
current term until | : 2013 | |
W.H. Ziebart | ||
gender | : male | |
age | : 62 | |
profession | : former President and CEO of Infineon Technologies A.G. | |
principal position | : retired | |
nationality | : German | |
other relevant positions | : member of the Board of Autoliv, Inc. and member of the Supervisory Board of Nordex SE | |
first appointed | : 2009 | |
current term until | : 2013 | |
Company Secretary | : Mr. R.F. Roelofs | |
Appointed | : 2002 | |
Deputy Company Secretary | : Ms. G.C.M. Keizer | |
Appointed | : 2002 | |
The Supervisory Board,
Veldhoven, February 13, 2012
| ASML STATUTORY ANNUAL REPORT 2011 | 9 |
Corporate Governance Paragraph1
I. General
ASML Holding N.V. (“ASML” or the “Company”) was established in 1994 as a private limited liability company. ASML is the parent company of ASML Netherlands B.V., which was established in 1984, as well as of other, mainly foreign, subsidiaries. ASML is a public limited liability company, with registered seat in Veldhoven, the Netherlands and is governed by Dutch law. ASML’s shares are listed since 1995 on Euronext Amsterdam by NYSE Euronext (“Euronext Amsterdam”) and on the NASDAQ Stock Market LLC (“NASDAQ”), since 1995.
ASML continuously monitors and assesses applicable Dutch, U.S. and other relevant corporate governance codes, rules, and regulations. ASML is subject to the Dutch Corporate Governance Code (the “Code”). Because ASML is also listed on NASDAQ, it is required to comply with the U.S. Sarbanes-Oxley Act of 2002, as well as NASDAQ listing rules, and the rules and regulations promulgated by the U.S. Securities and Exchange Commission (“SEC”).
For the full text of the Code, please refer to the website www.commissiecorporategovernance.nl. For the full text of the U.S. Sarbanes-Oxley Act of 2002, as well as NASDAQ listing rules, and the rules and regulations promulgated by the SEC, see www.sec.gov/about/laws/soa2002.pdf, http://nasdaq.cchwallstreet.com, and www.sec.gov/about.shtml respectively.
ASML’s Supervisory Board and Board of Management, who are responsible for ASML’s corporate governance structure, will continue their efforts to ensure that ASML’s practices and procedures comply with both U.S. and Dutch corporate governance requirements. In this Paragraph, ASML addresses its corporate governance structure, thereby referring to the principles and best practices set forth in the Code, as well as with the applicable laws with respect to corporate governance. ASML’s Supervisory Board and Board of Management are of the opinion that ASML complies with all recommendations in the Code. However, ASML has provided explanations with respect to a few recommendations, as ASML’s practice with respect to these recommendations could be perceived as non-compliant with the Code.
Material changes in the corporate governance structure of ASML and/or in its compliance with the Code will be discussed at ASML’s Annual General Meeting of Shareholders (“AGM”) as a separate agenda item.
| 1 | This Corporate Governance Paragraph also includes the information that is required to be disclosed pursuant to article 2a of the Decree of 23 December 2004 regarding further provisions on the substance of annual reports. |
| ASML STATUTORY ANNUAL REPORT 2011 | 10 |
II. Board of Management
Role and Procedure
ASML’s Board of Management is responsible for managing ASML, under the chairmanship of its President, Chief Executive Officer (“CEO”) and Chairman of the Board of Management. The current Board of Management comprises five members.
Although the various management tasks are divided among the members of the Board of Management, the Board of Management remains collectively responsible for the management of ASML, the deployment of its strategy, its risk profile and policies, the achievement of its objectives, its results and the corporate social responsibility aspects relevant to the Company.
In fulfilling its management tasks and responsibilities, the Board of Management considers the interests of ASML and the business connected with it, as well as the interests of ASML’s stakeholders. The Board of Management is accountable to the Supervisory Board and the General Meeting of Shareholders for the performance of its management tasks.
ASML has a two-tier board structure: the Supervisory Board supervises and advises the Board of Management in the execution of its tasks and responsibilities. The Board of Management provides the Supervisory Board with all information, in writing or otherwise, necessary for the Supervisory Board to fulfill its duties. Besides the information provided in the regular meetings, the Board of Management keeps the Supervisory Board frequently informed on developments relating to ASML’s business, financials, operations, and industry developments in general.
Important decisions of the Board of Management that require the approval of the Supervisory Board are, among others:
| • | the operational and financial objectives of ASML; |
| • | the strategy designed to achieve the objectives; |
| • | the parameters to be applied in relation to the strategy to achieve the objectives; and |
| • | corporate social responsibility issues that are relevant to ASML. |
The main elements of the operational and financial objectives of ASML, the strategy to achieve the objectives, and the parameters to be applied are included in the Report of the Board of Management. In the “risk factors” section of the 2011 Statutory Annual Report, ASML describes the sensitivity of its results to both external as well as internal factors and variables.
The Rules of Procedure for the Board of Management contain - among other topics - the general responsibilities of the Board of Management, the relationship with the Supervisory Board and various stakeholders, the decision making process within the Board of Management, and also the logistics surrounding the meetings. The Rules of Procedure are posted in the Corporate Governance section on ASML’s website.
Appointment, Other Functions
Members of the Board of Management are appointed by the Supervisory Board upon recommendation by ASML’s Selection and Nomination Committee and upon notification to the General Meeting of Shareholders. Members of the Board of Management appointed after the amendment of the Articles of Association in 2004, are appointed for a period of four years, where after reappointment is possible. Because Messrs. P. Wennink and M. van den Brink’s initial appointment as member of the Board of Management occurred before 2004, their appointment to the Board of Management is for an indefinite period of time. Until now, the existing employment contracts, including all rights and obligations under these contracts, have been honored.
The Supervisory Board may suspend and dismiss members of the Board of Management, but only after consulting the General Meeting of Shareholders.
Board of Management members may only accept a Supervisory Board membership of another listed company after having obtained prior approval from the Supervisory Board. Members of the Board of Management are also required to notify the Supervisory Board of other important functions held or to be held by them.
Currently, no Board of Management member has more than two Supervisory Board memberships in other listed companies. No current member of the Board of Management is chairman of a supervisory board of a listed company.
| ASML STATUTORY ANNUAL REPORT 2011 | 11 |
Internal Risk Management and Control Systems, External Factors
The Board of Management is responsible for ensuring that ASML complies with applicable legislation and regulations. It is also responsible for the financing of ASML and for managing the internal and external risks related to its business activities.
The establishment of ASML’s internal risk management and control system is based on the identification of external and internal risk factors that could influence the operational and financial objectives of ASML and contains a system of monitoring, reporting, and operational reviews.
To help identifying risks, ASML uses a formal risk management approach, consisting of a set of risks definitions (Risk Universe) which are discussed amongst ASML senior management during an annually recurring risk review. Based on this risk assessment, actions are initiated to further enhance ASML’s risk mitigation.
The establishment of ASML’s internal control and risk management systems is based on the identification of external and internal risk factors that could influence the operational and financial objectives of the Company and contains a system of monitoring, reporting and operational reviews. All material risk management activities have been discussed with the Audit Committee and the Supervisory Board. For a summary of ASML’s Risk Factors, we refer to our Management Board Report in the Statutory Annual Report.
ASML does not rank the individual risks identified, as ASML is of the opinion that doing so defies the purpose of a comprehensive risk assessment and it would be arbitrary of nature since all risks mentioned have significant relevance for ASML and its business.
ASML publishes two annual reports in respect of the financial year 2011 (“2011 Annual Reports”): this Statutory Annual Report in accordance with the Dutch legal requirements and International Financial Reporting Standards (“IFRS”) as adopted by the European Union and an Annual Report on Form 20-F in accordance with U.S. securities laws, based on the United States of America Generally Accepted Accounting Principles (“U.S. GAAP”). Both Annual Reports describe the same risk factors that are specific to the semiconductor industry, ASML and its shares. ASML also provides sensitivity analyses by providing:
| • | a narrative explanation of its financial statements; |
| • | the context within which financial information should be analyzed; and |
| • | information about the quality, and potential variability, of ASML’s earnings and cash flow. In its “In Control Statement” (as part of the Director’s Responsibility Statement), as included in the Statutory Annual Report 2011, the Board of Management addresses ASML’s internal risk management and control systems. |
With respect to the process of drafting annual reports, ASML has extensive guidelines for the lay-out and the content of its reports. These guidelines are primarily based on applicable laws. For the Statutory Annual Report and the Interim Report, ASML follows the requirements of Dutch law and regulations, including preparation of the consolidated financial statements in accordance with IFRS as adopted by the EU. For the Annual Report on Form 20-F, ASML applies the requirements of the U.S. Securities and Exchange Act of 1934, and prepares the financial statements included therein in accordance with U.S. GAAP. With respect to the preparation process of these and the other financial reports, ASML applies internal procedures to safeguard completeness and correctness of such information as part of its disclosure controls and procedures.
ASML’s Internal Control Committee, comprising among others three members of the Disclosure Committee, advises ASML’s Disclosure Committee about their assessment of ASML’s internal control over financial reporting. The Chairman of the Internal Control Committee reports to the Audit Committee and to the Board of Management on the progress of the assessments.
ASML’s Disclosure Committee, consisting of various members of senior management from different functional areas within ASML, reports to and assists ASML’s CEO and CFO in the maintenance, review and evaluation of disclosure controls and procedures. The Disclosure Committee’s main responsibility is to ensure compliance with applicable disclosure requirements arising under United States and Dutch law and applicable stock exchange rules. The Chairman of the Disclosure Committee reports to the Audit Committee and to the CEO and CFO on the topics discussed in the Disclosure Committee meetings and advises ASML’s CEO and CFO about its assesment of ASML’s disclosure controls and procedures and internal control over financial reporting.
| ASML STATUTORY ANNUAL REPORT 2011 | 12 |
Code of Conduct
Part of ASML’s risk management and control system is ASML’s Code of Conduct. The Code of Conduct contains rules and guidance on compliance with external and internal rules, laws, controls and processes.
In 2011, the Code of Conduct and the existing whistleblower and complaints procedures have been reviewed and revised integrally for simplification, transparency and updating purposes. Concerns and complaints can be submitted through various internal channels as well as an external party, which provides for anonymous reporting upon request.
The Code of Conduct, as well as submitted complaints, if any, are regularly discussed in the Audit Committee.
The Code of Conduct and the new Reporting Procedure (including whistleblower procedures) are available on the Corporate Governance section of ASML’s website.
Remuneration of the Board of Management
With respect to the remuneration of the Board of Management, the Supervisory Board is of the opinion that the 2010 Remuneration Policy was drafted in accordance with the Code, and that the execution of the Policy is also in line with the Code, with (potential) exceptions as mentioned more specifically at the end of this Corporate Governance Paragraph.
Performance criteria
Even though this is not a deviation from the Code, as the Code stipulates that not disclosing the performance criteria (best practice provisions II.2.13 f) and g) because of competition sensitiveness is justified, ASML hereby wants to provide its reasons for not providing all information as included in the best practice provisions mentioned above.
ASML provides the quantitative performance criteria, a summary and account of the methods to determine the achievement of the performance criteria, and also the ultimate achievement level of the quantitative and qualitative performance criteria. However, ASML cannot provide the exact performance criteria data, nor the levels of achievement per performance criterion, as this concerns highly competitive information, such as targets related to ASML’s technology, market position etc. The Supervisory Board deems it its responsibility to set the actual targets and to determine the level of achievement of these targets for the variable part of the remuneration of the Board of Management. The AGM endorsed this position in its meeting on March 23, 2006.
For more details about the Board of Management’s remuneration, its composition, and other relevant elements, reference is made to the 2010 Remuneration Policy and the Remuneration Report for the 2011 financial year (both published on ASML’s website), the Report of the Supervisory Board and Note 30 of the 2011 Annual Statutory Report.
The external auditor performs agreed-upon procedures on the targets achieved to assess compliance with the Remuneration Policy.
Insider Trading
With respect to trading in ASML financial instruments, ASML employees, ASML Board of Management members and ASML Supervisory Board members are bound by ASML’s Insider Trading Rules, which are published on the Company’s website. The ASML Insider Trading Rules stipulate, among other items, that members of the Board of Management may not trade during the two months preceding the publication of the annual results, and during the three weeks before publication of quarterly results. In addition, employees of ASML, including the members of the Board of Management, may not perform transactions in ASML financial instruments during the open periods when they have inside information.
Indemnification
ASML’s Articles of Association provide for the indemnification of the members of the Board of Management against claims that are a direct result of their tasks as members of the Board of Management, provided that such claim is not attributable to willful misconduct or intentional recklessness of such member of the Board of Management. The Supervisory Board has further implemented the indemnification of the Board of Management members by means of separate indemnification agreements for each Board of Management member.
Conflicts of Interest
Except for the below, there have been no transactions during 2011, and there are currently no transactions, between ASML or any of its subsidiaries, and any significant shareholder and any director or officer or any relative or spouse thereof other than ordinary course compensation arrangements.
| ASML STATUTORY ANNUAL REPORT 2011 | 13 |
Conflicts of interest procedures are incorporated in the Board of Management’s Rules of Procedure and reflect the principle and best practice provisions of the Code with respect to conflicts of interest. Consistent with the Company’s corporate responsibilities to its surrounding community and together with several other companies in the region, ASML entered into a loan agreement with local sports club PSV N.V. pursuant to which ASML provided PSV N.V., as of August 1, 2011, with a 14 years, interest free, subordinated loan of EUR 5.0 million. The Chairman of the Supervisory Board of ASML, Mr. Arthur van der Poel is currently (until June 2012) member of the Supervisory Board of PSV N.V. Mr. Peter Wennink (Chief Financial Officer of ASML) was appointed as member of the Supervisory Board of PSV N.V. as of August 2011.
III. Supervisory Board
Role and Procedure
As mentioned before, ASML’s Supervisory Board supervises the policies of the Board of Management and the general course of affairs of ASML and its subsidiaries. ASML’s Supervisory Board also supports the Board of Management with its advice. As ASML has and intends to keep a two-tier structure, the Supervisory Board is a separate and independent body from the Board of Management and from the Company. Under Dutch law and per the Code, Supervisory Board members cannot be members of the Board of Management and cannot be (former) officers or employees of ASML.
In fulfilling its role and responsibilities, the Supervisory Board takes into consideration the interests of ASML and its subsidiaries, as well as the relevant interests of ASML’s stakeholders. The Supervisory Board supervises and advises the Board of Management in performing its tasks, with a particular focus on:
| • | the achievement of ASML’s objectives; |
| • | ASML’s corporate strategy and the management of risks inherent to ASML’s business activities; |
| • | the structure and operation of internal risk management and control systems; |
| • | the financial reporting process; |
| • | compliance with applicable legislation and regulations; |
| • | relationship with shareholders; and |
| • | the corporate social responsibility issues important for ASML. |
Major management decisions, such as ASML’s strategy, major investments and budget, require the approval of the Supervisory Board. The Supervisory Board selects and appoints new Board of Management members, prepares the remuneration policy for the Board of Management, and decides on the remuneration for the individual members of the Board of Management. Also, the Supervisory Board is the body that nominates new Supervisory Board candidates for appointment and submits remuneration proposals for the Supervisory Board members to the AGM.
The Supervisory Board, through its Selection and Nomination Committee, closely follows the developments in the area of corporate governance and the applicability of the relevant corporate governance rules for ASML. For a more detailed description on the Supervisory Board’s activities in the area of corporate governance reference is made to the Supervisory Board Report as included in this Statutory Annual Report.
Meetings and activities of the Supervisory Board
The Supervisory Board held five scheduled physical meetings in 2011. In addition three conference calls were held to specifically discuss the quarterly results. No Supervisory Board member of those who were in office during the full year of 2011, was absent more than once at the meetings held in 2011.
During the various meetings, the Supervisory Board discussed among other topics ASML’s strategy, the financial position, financing policy, business risks, investor relations, sustainability, budget and corporate targets.
As also described in the Supervisory Board Report, members of the Supervisory Board also interact with Board of Management members and with their colleague Supervisory Board members outside the regular meetings or conference calls.
During all physical meetings of the Supervisory Board most Board of Management members were present. In general at the end of each meeting, the Supervisory Board meets inter se to discuss topics related to, amongst others, the composition and functioning of the Board of Management and the Supervisory Board, the functioning of the individual members of both bodies, and the relationship between these bodies and its individual members.
As is common practice each year, the Supervisory Board conducted an evaluation in 2011 with respect to the functioning of the full Supervisory Board. Also each Committee performed a self-evaluation with respect to its functioning. For more detailed information on this topic reference is made to the Supervisory Board Report.
| ASML STATUTORY ANNUAL REPORT 2011 | 14 |
Members of the Supervisory Board have semi-annual meetings with the Works Council in the Netherlands to discuss the Company’s strategy, financial situation and any other topic that is deemed relevant at that time.
For more detailed information on the meetings and activities of the Supervisory Board in 2011, reference is made to the Supervisory Board Report.
The Rules of Procedure
The Rules of Procedure of the Supervisory Board contain requirements based on the Code, on the Sarbanes-Oxley Act and on any other applicable laws, as well as corporate governance practices developed by the Supervisory Board over the past years. The Rules of Procedure are subject to regular review in view of the continuous corporate governance developments. Items include among others responsibilities of the Supervisory Board and its committees, composition of the Supervisory Board and its committees, logistics surrounding the meetings, meeting attendance of Supervisory Board members, rotation schedule for the Supervisory Board members.
The Rules of Procedure also contain the charters of the four committees. The Supervisory Board has assigned certain of its tasks and responsibilities to the four committees; however, the plenary Supervisory Board remains responsible for the fulfillment of these tasks and responsibilities. The Supervisory Board - and its committees - may obtain information from officers and external advisors of ASML, if necessary for the execution of its tasks. Especially the committees frequently call upon external advisors, who assist the committees in preparing the recommendations to be decided upon by the full Supervisory Board.
The Rules of Procedure, as well as the charters of the four committees are regularly reviewed and, if needed, amended. Changes in the Supervisory Board’s Rules of Procedure need to be approved by the full Supervisory Board. Changes in the charters of the committees are approved by the committee concerned. The Audit Committee charter is reviewed annually, to check whether the charter still complies with the applicable rules and regulations, especially those relating to the Sarbanes-Oxley Act.
Independence
The Supervisory Board is of the opinion that its current members are all independent as defined by the Code. Neither the Chairman nor any other member of the Supervisory Board is a former member of ASML’s Board of Management, or has another relationship with ASML which can be judged “not independent” for ASML.
Potentially however, the Supervisory Board could be ‘forced’ to deviate from the Code’s independence definition when looking for the most suitable candidate for a vacancy. For example, in the case where the profile for a vacancy requires particular knowledge of or experience in the semiconductor - and related - industries. The semiconductor industry has relatively few players, and therefore the Supervisory Board may want - or need - to nominate candidates for appointment to the AGM who do not fully comply with the independence criteria as listed in the Code. In those circumstances, ASML and the candidate will ensure that any such business relationship does not compromise the candidate’s independence.
Expertise, Composition, Appointment
The Supervisory Board currently consists of eight members, the minimum being three members. The Supervisory Board determines the number of Supervisory Board members required for the performance of its functions.
At the AGM held on April 20, 2011, Messrs. W.T. (Bill) Siegle and J.W.B. (Jos) Westerburgen retired by rotation and were both reappointed for a period of two years. Conform the Supervisory Board’s rotation schedule, Mr. Westerburgen has started his last term on ASML’s Supervisory Board.
In 2012, Messrs. O. (OB) Bilous, F.W. (Fritz) Fröhlich and A.P.M. (Arthur) van der Poel will retire by rotation. These members have indicated to be available for reappointment.
The current members of ASML’s Supervisory Board show a diverse mix with respect to background, nationality, age, gender and expertise, in line with the current profile drawn up by the Supervisory Board.
The profile of the Supervisory Board aims for an international and adequate composition reflecting the global business activities of ASML, as well as for an adequate level of experience in financial, economic, technological, social, and legal aspects of international business. In case of (re)appointments, the Selection and Nomination Committee checks whether the candidates fit in the Supervisory Board’s profile.
The Company is still subject to the law applicable to large corporations (“structuurregime”). Being such a company, members of the Supervisory Board are appointed by the General Meeting of Shareholders based on nominations proposed by the Supervisory Board. The Supervisory Board informs the AGM and the Works Council about upcoming resignations by rotation at the AGM in the year preceding the actual resignation(s) by rotation to ensure that the
| ASML STATUTORY ANNUAL REPORT 2011 | 15 |
General Meeting of Shareholders and the Works Council have sufficient opportunity to recommend candidates for the upcoming vacancies. The Supervisory Board has the right to reject the proposed recommendations. Furthermore, the Works Council has an enhanced right to make recommendations for one-third of the members of the Supervisory Board. The enhanced recommendation right implies that the Supervisory Board may only reject the Works Council’s recommendations for the following reasons: (i) if the relevant person is unsuitable or (ii) if the Supervisory Board would not be duly composed if the recommended person were appointed as Supervisory Board member. If no agreement on the recommended person(s) can be reached between the Supervisory Board and the Works Council, the Supervisory Board may request the Enterprise Chamber of the Amsterdam Court of Appeal to declare that the Supervisory Board’s objection is legitimate. Any decision of the Enterprise Chamber on this matter is non-appealable.
Mmes. H.C.J. (leke) van den Burg and P.F.M. (Pauline) van der Meer Mohr are nominated and appointed per the Works Council’s enhanced recommendation right. Potential future reappointments of both members will also be subject to this enhanced recommendation right.
Nominations by the Supervisory Board may be overruled by a resolution at the General Meeting of Shareholders with an absolute majority of the votes, representing at least one-third of ASML’s outstanding share capital. If the votes cast in favor of such a resolution do not represent at least one-third of the total outstanding capital, a new shareholders’ meeting can be convened at which the nomination can be overruled by an absolute majority. If the General Meeting of Shareholders does not appoint the person nominated and does not reject the nomination, the Supervisory Board will appoint the nominated person.
For newly appointed Supervisory Board members, the Company prepares an introduction program of which the main topics are: ASML’s organization, operations, strategy, industry, technology, ASML’s financial and legal affairs, and ASML’s human resources. Supervisory Board members are regularly given the opportunity to follow technical tutorials to maintain and increase their knowledge of ASML’s ever progressing technology. In addition, specific training is also provided for new committee members based on individual needs. Annually, the Supervisory Board and/ or committees members determine their need for further training on specific topics.
Supervisory Board members serve for a maximum term of four years from the date of their appointment, or a shorter period as per the Supervisory Board’s rotation schedule. Members can be reappointed, provided that their entire term of office does not exceed 12 years. The rotation schedule is available in the Corporate Governance section on ASML’s website.
The General Meeting of Shareholders may, by an absolute majority of the votes representing at least one-third of the total outstanding capital, dismiss the Supervisory Board in its entirety for lack of confidence. In such case, the Enterprise Chamber of the Amsterdam Court of Appeal shall appoint one or more Supervisory Board members at the request of the Board of Management.
Currently, none of the Supervisory Board members exceeds the maximum number of five memberships of supervisory boards of Large Companies (a chairmanship counting double).
For detailed information on ASML’s Supervisory Board members, reference is made to the Supervisory Board Report.
Role of the Chairman of the Supervisory Board and the Company Secretary
Mr. Van der Poel is the Chairman of ASML’s Supervisory Board; Mr. Fröhlich its Vice-Chairman. The role and responsibilities of the Chairman of the Supervisory Board are described in its Rules of Procedure. The Chairman determines the agenda of the Supervisory Board meetings, he acts as the main contact between the Supervisory Board and the Board of Management and ensures orderly and efficient proceedings at the General Meeting of Shareholders. The Chairman will among others also ensure that:
| • | the members of the Supervisory Board follow an introduction and training program for Supervisory Board members; |
| • | the members of the Supervisory Board receive all information necessary for the proper performance of their duties on a timely basis; |
| • | there is sufficient time for consultation and decision making by the Supervisory Board; |
| • | the committees function properly; |
| • | the performance of the Board of Management members and the Supervisory Board members is assessed at least once a year; and |
| • | the Supervisory Board has proper contact with the Board of Management and the Works Council. |
The Company Secretary assists the Supervisory Board in the performance of its duties; ensures that the correct procedures are followed; and that the Supervisory Board acts in accordance with its legal and statutory obligations. The Company Secretary assists the Chairman of the Supervisory Board in the organization of the affairs of the Supervisory
| ASML STATUTORY ANNUAL REPORT 2011 | 16 |
Board and its committees. The Company Secretary is appointed by and may also be dismissed by the Board of Management after prior approval from the Supervisory Board. The Company Secretary is assisted by a deputy Company Secretary.
Composition and Role of the four Committees of the Supervisory Board
Although the Supervisory Board retains ultimate responsibility, the Supervisory Board has delegated certain of its tasks to the four committees of the Supervisory Board. Their roles and functions are described in separate chapters in the Supervisory Board’s Rules of Procedure.
In the plenary Supervisory Board meetings, the chairmen of the committees report verbally and/ or in writing on the issues and items discussed in the committee meetings, and also the minutes of the committee meetings are available for all Supervisory Board members, enabling the full Supervisory Board to make the appropriate decisions.
Audit Committee
The current members of ASML’s Audit Committee are Mr. Fröhlich (Chairman), Mr. Van der Poel and Mr. Ziebart. The members of the Audit Committee are all independent, non-executive members of the Supervisory Board.
In general, the Audit Committee meets at least four times per year and always before the publication of the quarterly and annual financial results. In the first quarter, the Audit Committee focuses on the annual results, the audits over the previous financial year and the internal and external audit plans for the year ahead. Frequently discussed topics were ASML’s internal controls and risk management systems, the testing of internal controls over financial reporting in light of Section 404 of the Sarbanes-Oxley Act, ASML’s financial- and cash position, the financing and return policy, and the supervision of the enforcement of the relevant legislation and regulations.
ASML provides the Audit Committee with all relevant information to be able to adequately and efficiently supervise the preparation and disclosure of financial information by ASML. This includes, among other things, information on the status and development of the (semiconductor) market to be able to judge the outlook and budget for the next six to twelve months, the application of accounting standards in the Netherlands, IFRS, the choice of accounting policies and the work of internal and external auditors. Annually, the Audit Committee discusses and reviews ASML’s tax planning policy, the investor relations activities and strategy, the Code of Conduct, the fraud policy, and the information and communication technology policy.
The Audit Committee, on behalf of the Supervisory Board, reviews and approves the fees of the external auditor. The Audit Committee is the first contact for the external auditor if the external auditor discovers irregularities in the content of the financial reports. The external auditor provides the Audit Committee regularly with an update on the actual costs for the audit services and the non-audit services, enabling the Audit Committee to monitor the independence of the external auditor. The external auditor only provides the audit and non-audit services in accordance with ASML’s pre- approval policy, as approved by the Audit Committee. As a general rule, the external auditor is present at meetings of the Audit Committee. In general, after each Audit Committee meeting, the Audit Committee (without management present) meets with the external auditor to discuss the relationship between the Audit Committee and the external auditor, the relationship between Board of Management and the external auditor, and any other issues deemed necessary to be discussed.
The Audit Committee generally invites ASML’s CEO, CFO, Corporate Controller and Chief Accountant to its meetings. The Internal Auditor also attends these meetings. From time to time, other ASML employees may be invited to Audit Committee meetings to address subjects that are of importance to the Audit Committee.
Mr. Fröhlich, Chairman of the Audit Committee, is the Supervisory Board’s financial expert, taking into consideration his extensive financial background and experience.
| ASML STATUTORY ANNUAL REPORT 2011 | 17 |
Remuneration Committee
The current members of ASML’s Remuneration Committee are Mr. Westerburgen (Chairman), Ms. Van den Burg and Ms. Van der Meer Mohr.
The Remuneration Committee prepares ASML’s Remuneration Policy for members of the Board of Management, and oversees the development and implementation of the Remuneration Policy. In cooperation with the Audit Committee and the Technology and Strategy Committee, the Remuneration Committee reviews and proposes to the Supervisory Board corporate goals and objectives relevant to the variable part of the Board of Management’s remuneration. Also in cooperation with the Audit Committee and the Technology and Strategy Committee, the Remuneration Committee evaluates the performance of the members of the Board of Management in view of those goals and objectives, and - based on this evaluation - recommends to the Supervisory Board appropriate compensation levels for the Board of Management members.
In 2011, the Remuneration Committee met four times in physical meetings, two times via conference call and several times on an ad-hoc basis. Topics of discussion in 2011 were among others the targets and remuneration package for the Board of Management, the ASML stock option and share plans, the 2010 and 2011 Remuneration Reports and the review of the 2010 Remuneration Policy, which led to the conclusion that in 2012 the 2010 Remuneration Policy will be revised to be submitted for adoption to the 2013 AGM. Another topic of discussion in 2011 was the remuneration aspect in relation to the extension of Mr. Meurice’s appointment term as ASML’s President, CEO and Chairman of the Board of Management for another period of two years until the 2014 AGM (with possibility of extension for two consecutive years), subject to notification to the 2012 AGM. The main details of Mr. Meurice’s remuneration package will be published together with the AGM documents. External experts assist the Remuneration Committee in its activities. Those experts do not provide advice to the Board of Management with respect to matters in this area.
The Remuneration Committee prepared the 2011 Remuneration Report. This report describes among others the manner in which the 2010 Remuneration Policy was implemented and executed in 2011.
Mr. Westerburgen, the Chairman of the Remuneration Committee is neither a former member of ASML’s Board of Management, nor a member of the board of management of another company. No member of the Remuneration Committee is a current member of the Board of Management of another Dutch listed company.
Selection and Nomination Committee
The current members of ASML’s Selection and Nomination Committee are Mr. Westerburgen (Chairman), Mr. Bilous and Mr. Van der Poel.
The Selection and Nomination Committee meets at least twice a year and more frequently when deemed necessary. In 2011, the Selection and Nomination Committee members met five times formally and several additional times on an ad-hoc basis.
An important topic discussed by the Selection and Nomination Committee in 2011 was the extension of the appointment term of Mr. Meurice. As mentioned in the Supervisory Board report, the reasons to decide to extend the appointment term, subject to notification to the 2012 AGM, were the good operational, financial and technical performance in the years since Mr. Meurice was first appointed in 2004. Other topics discussed by the Selection and Nomination Committee were the composition and profile of the Supervisory Board in view of the number of Supervisory Board members who will be retiring by rotation in 2012 and 2013, but also because of the gender diversity requirement expected to be enacted on July 1, 2012. In that same context, the composition of the Board of Management was discussed. The Selection and Nomination Committee also assessed and discussed the selection and appointment procedures for the Supervisory Board and Board of Management, the functioning of the Supervisory Board and Board of Management, and its individual members.
The Selection and Nomination Committee furthermore discussed imminent corporate governance developments, for example those based on law proposals, but also the outcome of the Report of the Monitoring Committee with respect to compliance with the Code.
Technology and Strategy Committee
The current members of the Technology and Strategy Committee are Mr. Siegle (Chairman), Mr. Bilous, Mr. Van der Poel and Mr. Ziebart.
The Technology and Strategy Committee meets at least twice a year and more frequently when deemed necessary. In 2011, the Technology & Strategy Committee met five times and held one conference call. During several of these
| ASML STATUTORY ANNUAL REPORT 2011 | 18 |
meetings the technology targets, which are part of the overall performance targets set, as well as the achievements related to the technology targets were discussed.
The Technology and Strategy Committee provides advice to the Supervisory Board with respect to ASML’s technology strategies and ASML’s technology and product roadmaps. External experts as well as experts from within ASML may act as advisors to the Technology and Strategy Committee with respect to the subjects reviewed and discussed in this Committee. The advisors do not have voting rights. The Technology and Strategy Committee frequently uses the possibility to invite external and/or internal experts to attend Committee meetings. External experts may include representatives of suppliers and R&D partners to increase the Committee’s understanding of the technology and research necessary for the development of ASML’s leading-edge systems. Two meetings in 2011 included visits to customers and suppliers of ASML, where the Technology and Strategy Committee acquainted itself with the technology demands and technology challenges ASML, its customers and suppliers are facing.
The in-depth technology discussions in the Technology and Strategy Committee and the subsequent reporting on headlines in the full Supervisory Board increases the Supervisory Board’s understanding of ASML technology matters and enables the Supervisory Board to adequately supervise the strategic choices facing ASML, including the Company’s investment in research and development.
The main subjects of the meetings of the Technology and Strategy Committee in 2011 were the Company’s technology roadmap, including Extreme Ultra Violet (“EUV”) lithography, immersion technology and Holistic lithography solutions (for example Brion products, metrology).
The Committee also reviews the proposed technology targets, as well as the achievements related thereto and provides the Remuneration Committee with its advice on this topic.
Conflict of Interest
Except for the below, there have been no transactions during 2011, and there are currently no transactions, between ASML or any of its subsidiaries, and any significant shareholder and any director or officer or any relative or spouse thereof other than ordinary course compensation arrangements.
Conflict of interest procedures are incorporated in the Supervisory Board’s Rules of Procedure and address the principle and the best practice provisions of the Code with respect to conflicts of interest. Consistent with the Company’s corporate responsibilities to its surrounding community and together with several other companies in the region, ASML entered into a loan agreement with local sports club PSV N.V. pursuant to which ASML provided PSV N.V., as of August 1, 2011, with a 14 years, interest free, subordinated loan of EUR 5.0 million. The Chairman of the Supervisory Board of ASML, Mr. Arthur van der Poel is currently (until June 2012) member of the Supervisory Board of PSV N.V. Mr. Peter Wennink (Chief Financial Officer of ASML) was appointed as member of the Supervisory Board of PSV N.V. as of August 2011.
Remuneration of the Supervisory Board
The AGM determines the remuneration of the Supervisory Board members; the remuneration is not dependent on the results of the Company. In 2011, the AGM adopted the Supervisory Board’s proposal to increase the Supervisory Board’s remuneration in view of the continuing increase of responsibilities, workload and liabilities for the Supervisory Board members and its committees, as well as the growth of the Company over the past years. Furthermore the AGM approved to further increase the annual (fixed) fee with a maximum amount of EUR 5,000 depending on circumstances.
In addition to their fee as member of the Supervisory Board, Supervisory Board members also receive a fee for each committee membership, as well as a net cost allowance. Also, one Supervisory Board member receives an additional fee to compensate for certain obligations which ASML has towards the US government and which obligations this member is required to fulfill. The Supervisory Board remuneration is not dependent on the financial results of the Company. No member of the Supervisory Board personally maintains a business relationship with the Company other than as a member of the Supervisory Board.
The Supervisory Board members do not receive ASML shares, or rights to acquire ASML shares, as part of their remuneration. Supervisory Board members who acquire or have acquired ASML shares or rights to acquire ASML shares, must have the intention to keep these for long-term investment only. No member of ASML’s Supervisory Board currently owns ASML shares or rights to acquire ASML shares. In concluding transactions in ASML shares, Supervisory Board members must comply with ASML’s Insider Trading Rules.
Detailed information on the Supervisory Board’s remuneration can be found in Note 30 of the 2011 Statutory Financial Statements, included herein.
| ASML STATUTORY ANNUAL REPORT 2011 | 19 |
With respect to trading in ASML financial instruments, the ASML Insider Trading Rules stipulate - among other requirements - that members of the Supervisory Board may not trade during the two months preceding the publication of the annual results, and neither during the three weeks before publication of the quarterly results. In addition, members of the Supervisory Board may not perform transactions in ASML financial instruments during the open periods when they have inside information. This requirement is not applicable for Supervisory Board members who have a management agreement with an independent third party for the management of her or his financial instruments.
ASML has not granted any personal loans, guarantees, or the like to members of the Supervisory Board. ASML’s Articles of Association provide for the indemnification of the members of the Supervisory Board against claims that are a direct result of their tasks as members of the Supervisory Board, provided that such claim is not attributable to willful misconduct or intentional recklessness of such Supervisory Board member. ASML has further implemented the indemnification of the members of the Supervisory Board by means of separate indemnification agreements for each member of the Supervisory Board.
IV. Shareholders and General Meeting of Shareholders
Powers
A General Meeting of Shareholders is held at least once a year and generally takes place in Veldhoven. In this meeting, at least the following items are discussed and/or approved:
| • | the written report of the Board of Management containing the course of affairs in ASML and the conduct of the management during the past financial year; |
| • | the adoption of the annual accounts; |
| • | the discharge of the members of the Board of Management in respect of their management during the previous financial year; |
| • | the discharge of the members of the Supervisory Board in respect of their supervision during the previous financial year; |
| • | ASML’s reserves and dividend policy and justification thereof by the Board of Management; |
| • | each material change in the corporate governance structure of ASML; and |
| • | any other item the Board of Management or the Supervisory Board determine to place on the agenda. |
The General Meeting of Shareholders has furthermore (with due observance of the statutory provisions) the power:
| • | to resolve to amend the articles of association; |
| • | to resolve to dissolve the Company; |
| • | to resolve to issue shares if and insofar as the Board of Management has not been designated by the General Meeting of Shareholders for this purpose; |
| • | to resolve to reduce the issued share capital; |
| • | to appoint members of the Supervisory Board; |
| • | to withdraw its confidence in the Supervisory Board; |
| • | to adopt the Remuneration Policy for members of the Board of Management; and |
| • | to determine the remuneration of the members of the Supervisory Board. |
The Board of Management requires the approval of the General Meeting of Shareholders and the Supervisory Board for resolutions regarding a significant change in the identity or character of ASML or its business, including in any event:
| • | a transfer of the business or virtually all of the business to a third party; |
| • | entry into or termination of long-term cooperation by ASML or a subsidiary with another legal entity or partnership or as a general partner with full liability in a limited or general partnership if such cooperation or the termination thereof is of far-reaching significance for ASML; and |
| • | an acquisition or disposal by ASML or a subsidiary of a participation in the capital of another company, the value of which equals at least one third of the amount of the assets according to the consolidated balance sheet (in the consolidated financial statements referred to as “statement of financial position”) with explanatory notes attached to the Annual Accounts as most recently adopted. |
Proposals placed on the agenda by the Supervisory Board, the Board of Management, or by shareholders, provided that they have submitted the proposals in accordance with the applicable legal provisions, are discussed and resolved upon. Shareholders representing at least 1 percentage of ASML’s outstanding share capital or representing a share value of at least Euro 50,000,000 are entitled to place agenda items on the AGM agenda at the latest sixty days before the AGM. About two weeks before the closing of this sixty days term, ASML notifies its shareholders about the closing of the term on its website.
| ASML STATUTORY ANNUAL REPORT 2011 | 20 |
A recurring agenda item is the limited authorization for the Board of Management to issue (rights to) shares in the Company’s capital, and to exclude pre-emptive shareholders rights for such issuances. This agenda item includes two elements: 1) the authorization to the Board of Management to issue a maximum of 10.0 percent (rights to) shares of ASML’s issued share capital as of the date of authorization; and 2) the authorization to exclude pre-emptive rights in relation to the above share issue, with a maximum of 10.0 percent of ASML’s issued share capital as of the date of authorization.
A simple majority is required for the authorization to issue shares; for the authorization to exclude the pre-emptive rights a simple majority is required in case at least fifty percent of ASML’s issued share capital is present or represented at the AGM; otherwise a majority of two thirds of the votes cast is required. The Board of Management must obtain the approval of the Supervisory Board for the issuance of ASML shares as well as for excluding the pre-emptive rights.
It is important for ASML to be able to issue (rights to) shares and to exclude the pre-emptive shareholders’ rights in situations where it is imperative to be able to act quickly, for example when financial opportunities arise or when stock (option) plans need to be executed to attract and retain top talent. This authorization has been used in the past especially to optimize the financial position of ASML. Given the dynamics of the global capital markets, such financing transactions generally need to be executed in the shortest window of opportunity. The opportunity to issue shares or rights to shares, such as convertible bonds, would be limited if ASML needed a resolution of the General Meeting of Shareholders to issue shares and/ or to exclude the shareholders’ pre-emptive rights and may thus hinder the financial flexibility of ASML.
Another agenda item in 2012 will be the proposal to adopt the dividend proposal, as communicated in ASML’s press release on January 18, 2012.
In addition to dividend payments, ASML also intends to return cash to its shareholders on a regular basis through share buy backs or repayment of capital, subject to its actual and anticipated level of cash generated from operations, the cash requirements for investment in its business, its current share price and other market conditions and relevant factors.
On April 20, 2011, the General Meeting of Shareholders authorized the repurchase of up to a maximum of three times 10.0 percent of our issued share capital as of the date of authorization through October 20, 2012.
As announced on January 19, 2011, ASML intends to repurchase up to EUR 1.0 billion of its own shares within the next two years. During 2011 the Company repurchased 25,674,576 million shares for a total amount of EUR 700.0 million; of the shares repurchased 13,185,305 were cancelled in 2011. The Company intends to cancel the remaining repurchased shares in 2012.
As announced in the press release of January 18, 2012, ASML has the intention to increase the size of the current share buy back program to a maximum amount of EUR 1,130 million. Furthermore, ASML announced its intention to purchase up to 2.2 million of additional shares during 2012 for the purpose of covering outstanding employee stock and stock option plans. These shares will be held as treasury shares.
Also in 2012, the request to grant the Board of Management the authority to repurchase shares in its own capital shall be put on the AGM agenda. A simple majority is required for the authorization. The Board of Management must obtain the approval of the Supervisory Board for each repurchase of ASML shares. The authorization to be requested will be limited in accordance with the current articles of association of the Company and the law. A proposal to cancel the repurchased shares subject to a resolution of the Board of Management will also be put on the AGM agenda.
The Board of Management or Supervisory Board may convene Extraordinary General Meetings (“EGMs”) as often as they deem necessary. Such meetings must be held if one or more shareholders and others entitled to attend the meetings jointly representing at least one-tenth of the issued share capital make a written request to that effect to the Board of Management and the Supervisory Board, specifying in detail the items to be discussed.
Logistics of the General Meeting of Shareholders
The convocation date for the AGM is legally set at forty two days, and the record date at twenty eight days before the AGM. Those who are registered as shareholders at the record date are entitled to attend the meeting and to exercise other shareholder rights.
The Board of Management and Supervisory Board shall provide the shareholders with the facts and circumstances relevant to the proposed resolutions, through an explanation to the agenda, as well as through other documents necessary and/or helpful for this purpose. All documents relevant to the General Meeting of Shareholders, including
| ASML STATUTORY ANNUAL REPORT 2011 | 21 |
the agenda with explanations, shall be posted in the Investor Relations and Corporate Governance sections on ASML’s website. The agenda clearly indicates which agenda items are voting items, and which items are for discussion only.
ASML shareholders may appoint a proxy who can vote on their behalf in the General Meeting of Shareholders. ASML also uses an internet proxy voting system, thus facilitating shareholder participation without having to attend in person. Shareholders who voted through internet proxy voting are required, however, to appoint a proxy to officially represent them at the General Meeting of Shareholders in person. ASML also provides the possibility for shareholders to issue voting proxies or voting instructions to an independent third party (civil law notary) prior to the AGM.
Resolutions passed at the General Meeting of Shareholders shall be recorded by a civil law notary and co-signed by the Chairman of the meeting and will thereafter be made available on ASML’s website within two weeks after the AGM.
The draft minutes of the General Meeting of Shareholders are available via ASML’s website, and also upon request via mail or e-mail, no later than three months after the meeting. Shareholders are given the opportunity to provide their comments in the subsequent three months, and thereafter the minutes are adopted by the Chairman and the Secretary of the meeting. The adopted minutes are also available on ASML’s website and, upon request, via regular mail or e-mail.
There are no depositary receipts for shares in the Company’s capital issued with the cooperation of ASML.
Information to the Shareholders
To ensure fair disclosure, ASML distributes Company information that may influence the share price to shareholders and other parties in the financial markets simultaneously and through means that are public to all interested parties. In case of bilateral contacts with shareholders, ASML follows the procedure related thereto as published on ASML’s website.
When ASML’s annual and quarterly results are published by means of a press release, interested parties, including shareholders, can participate through conference calls, listen to a webcast and view the presentation of the results on ASML’s website. The schedule for communicating the annual financial results is in general published through a press release and is posted on ASML’s website. In addition, ASML provides information to its shareholders at ASML’s AGM. Also ASML publishes a Sustainability Report on its website every year, reporting on Environmental, Health, Social and Safety performance.
It is ASML’s policy to post the presentations given to analysts and investors at investor conferences on its website. Information regarding presentations to investors and analysts and conference calls are announced in advance on ASML’s website; for details see ASML’s financial calendar as published in the Investor Relations section on ASML’s website. Meetings and discussions with investors and analysts shall, in principle, not take place shortly before publication of regular financial information. ASML does not assess, comment upon, or correct analysts’ reports and valuations in advance, other than to comment on factual errors. ASML does not pay any fees to parties carrying out research for analysts’ reports, or for the production or publication of analysts’ reports, and takes no responsibility for the content of such reports.
At the General Meeting of Shareholders, the Board of Management and the Supervisory Board provide shareholders with all requested information, unless this is contrary to an overriding interest of the Company. If this should be the case, the Board of Management and Supervisory Board will provide their reasons for not providing the requested information.
Furthermore, the Corporate Governance section on ASML’s website provides links to websites that contain information about ASML published or filed by ASML in accordance with applicable rules and regulations.
ASML’s only anti-takeover device is the Preference Shares Foundation. The mechanisms of this Foundation are described in more detail in the next chapter on required information Article 10 Takeover Directive and the 2011 Annual Reports.
Relationship with Institutional Investors
ASML finds it important that its institutional investors participate in ASML’s General Meetings of Shareholders. To increase the participation rate, several measures have been taken in the past few years, including providing internet proxy voting. In addition, ASML actively approaches its institutional investors to discuss their participation at the General Meetings of Shareholders.
| ASML STATUTORY ANNUAL REPORT 2011 | 22 |
V. The Audit of Financial Reporting and the Position of the Internal and External Auditor Function
Financial Reporting
ASML has comprehensive internal procedures in place for the preparation and publication of Annual Reports, annual accounts, quarterly figures, and all other financial information. These internal procedures are frequently discussed in the Audit Committee and the Supervisory Board. The Disclosure Committee assists the Board of Management in overseeing ASML’s disclosure activities and ensures compliance with applicable disclosure requirements arising under U.S. and Dutch law and regulatory requirements.
The Audit Committee reviews and approves the external auditor’s Audit Plan for the audits planned during the financial year. The Audit Plan also includes the activities of the external auditor with respect to their reviews of the quarterly results other than the annual accounts. These reviews are based on agreed upon procedures and are approved by the Audit Committee. The external auditor regularly updates the Audit Committee on the progress of the audits and other activities.
The Supervisory Board has reviewed the Statutory Annual Report of ASML for the financial year 2011 as prepared by the Board of Management. Deloitte has duly examined the Company’s financial statements, and the Auditor’s Report is included in the Statutory Financial Statements.
Appointment, Role, Assessment of the Functioning of the External Auditor, and the Auditor’s Fee
In accordance with Dutch law, ASML’s external auditor is appointed by the General Meeting of Shareholders and is nominated for appointment by the Supervisory Board upon advice from the Audit Committee and the Board of Management. ASML’s current external auditor, Deloitte Accountants B.V. (“Deloitte”), was appointed by the General Meeting of Shareholders in 1995 for an indefinite period of time.
In 2011, the Audit Committee and the Board of Management conducted an extensive assessment with respect to the performance of the external auditor over the past four years, since the last evaluation end 2007. The evaluation was conducted by means of surveys which were completed by the various bodies within the Company who work with the auditor during their audit (management, Internal Audit, Internal Control Committee) and by the Audit Committee. The surveys addressed among others the quality, scope and planning of the audit; the independence of the auditor; the composition of the audit team; the fees and the reporting of the auditor. The result of the surveys was positive, with some minor attention items, such as maintaining the continuity of ASML knowledge within the audit team. To bring the (re) appointment of the external auditor in line with current governance practices, it was decided to change the current indefinite appointment term of the auditor to an annual (re)appointment proposal to be submitted for approval to the AGM, effective per the 2012 AGM. The proposal for reappointment shall include notes explaining the reasons for reappointment of the auditor.
The Audit Committee also decided to perform the extensive assessment as described above at least every two years instead of every four years.
Annually, the Board of Management and the Audit Committee provide the Supervisory Board with a report on the relationship with the external auditor, including the required auditor independence. To determine the External Auditor’s independence, the relationship between the audit services and the non-audit services provided by the external auditor is important, as well as the rotation of the responsible lead audit partner every five years. Non-audit services (mainly tax related fees) performed by the external auditor comprised 18.0 percent of the external auditor’s services in 2011. Based on the proportion audit fees versus non-audit related fees, it was concluded - and confirmed by the external auditor - that the external auditor acts independently.
The external auditor is present at ASML’s AGM to respond to questions, if any, from the shareholders about the auditor’s report on the statutory financial statements.
The Audit Committee, on behalf of the Supervisory Board, approves the remuneration of the external auditor as well as the non-audit services to be performed, after consultation with the Board of Management. It has been agreed among the members of the Supervisory Board and the Board of Management that the Audit Committee has the most relevant insight and experience to be able to approve both items, and therefore the Supervisory Board has delegated these responsibilities to the Audit Committee.
In principle the external auditor attends all meetings of the Audit Committee, unless this is deemed not necessary by the Audit Committee. The findings of the external auditor are discussed at these meetings.
| ASML STATUTORY ANNUAL REPORT 2011 | 23 |
The Audit Committee reports on all issues discussed with the external auditor to the Supervisory Board, including the external auditor’s report with regard to the audit of the annual accounts as well as the content of the annual accounts. In the audit report, the external auditor refers to the financial reporting risks and issues that were identified during the audit, internal control matters, and any other matters requiring communication under the auditing standards generally accepted in the Netherlands and in the United States.
Internal Audit Function
The internal audit function of ASML forms one of the key elements to address the topics of risk management and internal control over financial reporting as required under the Code and the Sarbanes-Oxley Act, respectively. To ensure the independence of this function, the Director Internal Audit reports to the Board of Management and the Audit Committee. The external auditor and the Audit Committee are involved in drawing up the work schedule and audit scope of the internal auditor. The internal auditor regularly provides updates on its findings to the Audit Committee.
VI. Required information Article 10 Takeover Directive
General
The EU Takeover Directive requires that listed companies publish additional information providing insight into defensive structures and mechanisms which they apply. The relevant provision has been implemented into Dutch law by means of a decree of April 5, 2006. Pursuant to this decree, Dutch companies whose securities have been admitted to trading on a regulated market have to include information in their annual report which could be of importance for persons who are considering taking an interest in the company.
This information comprises amongst other things:
| • | the capital structure of the company; |
| • | restrictions on the transfer of securities and on voting rights; |
| • | special powers conferred upon the holders of certain shares; |
| • | the rules governing the appointment and dismissal of board members and the amendment of the articles of association; |
| • | the rules on the issuing and the repurchasing of shares by the company; significant agreements to which the company is a party and which contain change of control rights (except where their nature is such that their disclosure would be seriously prejudicial to the company); and |
| • | agreements between the company and its board members or employees providing for a “golden parachute”. |
In this section the Board of Management and the Supervisory Board provide for an explanation to the information - if applicable to ASML - as required under the Resolution Article 10 of the Takeover Directive.
Share capital
ASML’s authorized share capital amounts to EUR 126,000,000 and is divided into:
| • | 700,000,000 cumulative preference shares with a nominal value of EUR 0.09 each; |
| • | 700,000,000 ordinary shares with a nominal value of EUR 0.09 each. |
Per December 31, 2011, 413,669,257 ordinary shares with a nominal value of EUR 0.09 each were outstanding and fully paid in. The number of issued shares was 431,294,790 , including 17,625,533 repurchased (“treasury”) shares, the majority of which will be cancelled in 2012.
Our Board of Management has the power to issue shares if and to the extent the Board of Management has been authorized to do so by the General Meeting of Shareholders (either by means of a resolution or by an amendment to our Articles of Association). However, the Supervisory Board must approve any issuance of shares.
As a consequence of the amendment of the Company’s Articles of Association per May 6, 2011, 10,000 ordinary shares in the Company’s share capital with nominal value of EUR 0,01 were cancelled because no such shares were issued.
Ordinary shares
At ASML’s Annual General Meeting of Shareholders, held on April 20, 2011, the Board of Management was granted the authorization to issue shares and/or rights thereto representing up to a maximum of 5.0 percent of the Company’s issued share capital as of the date of authorization, plus an additional 5.0 percent of the Company’s issued share capital as of the date of authorization that may be issued in connection with mergers and acquisitions. At ASML’s Annual General Meeting of Shareholders to be held on April 25, 2012, its shareholders will be asked to authorize the Board of Management (subject to the approval of the Supervisory Board) to issue shares and/or rights thereto through October 25, 2013.
| ASML STATUTORY ANNUAL REPORT 2011 | 24 |
Holders of ASML’s ordinary shares have a preemptive right of subscription to any issuance of ordinary shares for cash, which right may be limited or excluded. Ordinary shareholders have no pro rata preemptive right of subscription to any ordinary shares issued for consideration other than cash or ordinary shares issued to employees. If authorized for this purpose by the General Meeting of Shareholders (either by means of a resolution or by an amendment to ASML’s Articles of Association), the Board of Management has the power, with the approval of the Supervisory Board, to limit or exclude the preemptive rights of holders of ordinary shares. A designation may be renewed. At ASML’s Annual General Meeting of Shareholders, held on April 20, 2011, the Board of Management was authorized, subject to the aforementioned approval, to restrict or exclude preemptive rights of holders of ordinary shares up to a maximum of 10 percent of the Company’s issued share capital as of the date of authorization. At ASML’s Annual General Meeting of Shareholders to be held on April 25, 2012, its shareholders will be asked to grant this authority through October 25, 2013. At this Annual General Meeting of Shareholders, the shareholders will be asked to grant authority to the Board of Management to issue shares and options separately for a period of 18 months.
The Company may repurchase its issued ordinary shares at any time, subject to compliance with the requirements of Dutch law and the Company’s Articles of Association. Any such repurchases are subject to the approval of the Supervisory Board and the authorization of shareholders at ASML’s Annual General Meeting of Shareholders, which authorization may not be for more than 18 months. The Board of Management is currently authorized, subject to Supervisory Board approval, to repurchase through October 20, 2012 up to a maximum of three times 10.0 percent of the Company’s issued share capital as of the date of authorization (April 20, 2011) at a price between the nominal value of the ordinary shares purchased and 110.0 percent of the market price of these securities on Euronext Amsterdam or NASDAQ. At the Company’s Annual General Meeting of Shareholders to be held on April 25, 2012, ASML shall request the authorization for the Board of Management to repurchase and cancel shares for a period of 18 months as of the 2012 AGM, i.e. until October 25, 2013, all in conformity with the provisions of the law and the Company’s articles of association.
Cumulative preference shares
In 1998, the Company granted to the preference share foundation, “Stichting Preferente Aandelen ASML” (the “Foundation”) an option to acquire cumulative preference shares in the capital of the Company (the “Preference Share Option”). This option was amended and extended in 2003 and 2007. A third amendment to the option agreement between the Foundation and ASML became effective on January 1, 2009, to clarify the procedure for the repurchase and cancellation of the preference shares when issued.
Per the amendment of the Company’s Articles of Association on May 6, 2011, the nominal value of the cumulative preference shares was increased to EUR 0.09, The number of cumulative preference shares included in the authorized share capital was decreased to 700,000,000 million, equal to the number of common shares in the authorized share capital. This was done to simplify the Articles of Association, and to give each share the right to cast one vote in the general meeting of shareholders.
The Foundation may exercise the Preference Share Option in situations where, in the opinion of the Board of Directors of the Foundation, the interests of the Company, its business or the interests of its stakeholders are at stake. This may be the case if a public bid for the ordinary shares of the Company has been announced or has been made, or the justified expectation exists that such a bid will be made without any agreement having been reached in relation to such a bid with the Company. The same may apply if one shareholder, or more shareholders acting in concert, hold a substantial percentage of the issued ordinary shares of the Company without making an offer or if, in the opinion of the Board of Directors of the Foundation, the (attempted) exercise of the voting rights by one shareholder or more shareholders, acting in concert, is materially in conflict with the interests of the Company, its business or its stakeholders.
The objects of the Foundation are to look after the interests of ASML and of the enterprises maintained by ASML and of the companies which are affiliated in a group with ASML, in such way that the interests of ASML, of those enterprises and of all parties concerned are safeguarded in the best possible way, and influences in conflict with these interests which might affect the independence or the identity of ASML and those companies are deterred to the best of the Foundation’s ability, and everything related to the above or possibly conducive thereto. The Foundation seeks to realize its objects by the acquiring and holding of cumulative preference shares in the capital of ASML and by exercising the rights attached to these shares, particularly the voting rights attached to these shares.
The Preference Share Option gives the Foundation the right to acquire a number of cumulative preference shares, provided that the aggregate nominal value of such number of cumulative preference shares shall not exceed the aggregate nominal value of the ordinary shares that have been issued at the time of exercise of the Preference Share Option for a subscription price equal to their EUR 0.09 nominal value. Exercise of the Preference Share Option could
| ASML STATUTORY ANNUAL REPORT 2011 | 25 |
effectively dilute the voting power of the outstanding ordinary shares by one-half. Only one-fourth of the subscription price is payable at the time of initial issuance of the cumulative preference shares.
Cancellation and repayment of the issued cumulative preference shares by the Company requires the authorization by the General Meeting of Shareholders of a proposal to do so by the Board of Management approved by the Supervisory Board. If the Preference Share Option is exercised and as a result cumulative preference shares are issued, the Company, at the request of the Foundation, will initiate the repurchase or cancellation of all cumulative preference shares held by the Foundation as a result of such issuance with repayment of the amount paid and exemption from the obligation to pay up on the cumulative preference shares. In that case the Company is obliged to effect the repurchase and cancellation respectively as soon as possible.
If the Foundation will not request the Company to repurchase or cancel all cumulative preference shares held by the Foundation within 20 months after issuance of these shares, the Company will be obliged to convene a General Meeting of Shareholders in order to decide on a repurchase or cancellation of these shares.
The Foundation is independent of the Company. The Board of Directors of the Foundation comprises four independent voting members from the Dutch business and academic communities: Mr. R.E. Selman (until December 31, 2011), Mr. M.W. den Boogert, Mr. J.M. de Jong, Mr. A. Baan., and Mr. A.M. Lundqvist (as of January 1, 2012).
Limitations to transfers of shares in the share capital of ASML
There are currently no limitations, either under Dutch law or in the Articles of Association of ASML, as to the transfer of shares in the share capital of ASML.
Reporting obligations under the Act on the supervision of financial markets (Wet op het financieel toezicht, the “Wft”)
Holders of our shares may be subject to reporting obligations under the Wft. The disclosure obligations under the Wft apply to any person or entity that acquires, holds or disposes of an interest in the voting rights and/or the capital of a public limited company incorporated under Dutch law whose shares are admitted to trading on a regulated market within the European Union (the “EU”). Disclosure is required when the percentage of voting rights or capital interest of a person or an entity reaches, exceeds or falls below 5, 10, 15, 20, 25, 30, 40, 50, 60, 75 or 95 percent (as a result of an acquisition or disposal by such person, or as a result of a change in our total number of voting rights or capital issued). With respect to ASML, the Wft would require any person or entity whose interest in the voting rights and/or capital of ASML reached, exceeded or fell below those percentage interests to notify the Authority for the Financial Markets in the Netherlands (Autoriteit Financiele Markten, the “AFM”) immediately. A legislative proposal is currently under discussion in Dutch Parliament, pursuant to which the 5.0 percent threshold will be replaced by a 3.0 percent threshold. Under the same proposal each holder of a 3.0 percent interest would need to declare, in a filing to be publicly made with the AFM, whether it has any objections to our strategy as publicly submitted to the AFM. The proposal would also introduce a mechanism pursuant to which ASML would be able to identify, and communicate with, beneficial holders of its shares through the respective custodians.
According to AFM’s public registry (www.afm.nl/registers) on December 31, 2011, the following notifications of voting rights or capital interest above 5 percent have been made pursuant to the Wft:
Capital Research and Management Company 10.03 percentage voting rights, no capital interest Stichting Preferente Aandelen ASML 100 percentage option rights.
Special voting rights on the issued shares
There are no special voting rights on the issued shares in the share capital of ASML.
Limitation voting rights on shares
There are currently no limitations, either under Dutch law or in the Articles of Association of ASML, to hold or vote ordinary shares.
Appointment of Board of Management and Supervisory Board
Board of Management
The rules governing the appointment and dismissal of members of the Board of Management are described in section II. above.
| ASML STATUTORY ANNUAL REPORT 2011 | 26 |
Supervisory Board
The rules governing the appointment and dismissal of members of the Supervisory Board are described in section III. above.
Amendment of the Articles of Association
The General Meeting of Shareholders can resolve to amend the Articles of Association of the Company. The (proposed) amendment requires the approval of the Supervisory Board.
A resolution to amend the Articles of Association is adopted at a General Meeting of Shareholders at which more than one half of the issued share capital is represented and with at least three-fourths of the votes cast; if the required share capital is not represented at a meeting convened for that purpose, a subsequent meeting shall be convened, to be held within four weeks of the first meeting, at which, irrespective of the share capital represented, the resolution can be adopted with at least three-fourths of the votes cast. If a resolution to amend the Articles of Association is proposed by the Board of Management, the resolution will be adopted with an absolute majority of votes cast irrespective of the represented share capital at the General Meeting of Shareholders.
The complete proposals should be made available for inspection by the shareholders and the others entitled to attend meetings at the office of the Company and at a banking institution designated in the convocation to the general meeting of shareholders, as from the date of said convocation until the close of that meeting. Furthermore, the Company must consult Euronext Amsterdam and the AFM, before the amendment is proposed to its shareholders.
Severance payments under agreements with members of Board of Management
Because their appointment to the Board of Management took place before March 31, 2004, the employment agreements with Messrs. Wennink and Van den Brink do not contain specific provisions regarding benefits upon termination of those agreements. Potential severance payments will be according to applicable law.
Employment agreements for members of the Board of Management appointed after March 31, 2004 contain specific provisions regarding severance payments. If ASML gives notice of termination of the employment agreement for reasons which are not exclusively or mainly found in acts or omissions of the board member concerned, a severance payment equal to one year base salary will be paid upon the effective date of termination. This severance payment will also be paid in case a Board of Management member gives notice of termination of the employment agreement in connection with a substantial difference of opinion between the respective executive and the Supervisory Board regarding her / his employment agreement, her / his function or the Company’s strategy.
Board of Management members appointed after March 31, 2004 shall also be entitled to the aforementioned severance payments in the event ASML or its legal successor gives notice of termination in connection with a Change of Control (as defined in the employment agreement) or if such Board of Management member gives notice of termination directly related to such Change of Control, and such notice is given within twelve months from the date on which the Change of Control occurs.
VII. Deviations from the Code
For clarity purposes, ASML lists below its deviations from the Code and reasons for doing so. The deviations follow the order of the recommendations in the Code.
II.2.5
Although ASML does not consider ASML’s execution of this best practice a deviation from the Code, it could be interpreted as such.
The members of the Board of Management are eligible to receive performance shares which will be awarded annually under the condition of fulfillment of predetermined performance targets, which are measured over a period of three calendar years. Once the shares are unconditionally awarded after fulfillment of the performance conditions, the shares will be retained (for a lock-up period) by the Board of Management member for at least two years after the date of unconditional award or until the termination of employment, whichever period is shorter. The date of release lies three years after the original date of target setting, and the members of the Board of Management have to retain the performance shares for at least two subsequent years. Accordingly, the total period before one obtains full rights to the performance shares will be five years. The Remuneration Committee believes that the total resulting period is in
| ASML STATUTORY ANNUAL REPORT 2011 | 27 |
compliance with the Code. The AGM approved the performance share arrangement for the Board of Management on March 24, 2010.
II.2.8
The employment contracts of the members of the Board of Management appointed before March 31, 2004, being Messrs. Wennink and Van den Brink, are being honored, including all rights and obligations under these contracts. This implies that the appointment of Messrs. Wennink and Van den Brink as members of the Board of Management will be for an indefinite period of time, and that their potential severance payments will be according to applicable law. Although ASML does not consider this to be contrary to the recommendations in the Code, it may be considered a deviation from the Code.
The Board of Management and the Supervisory Board,
Veldhoven, February 13, 2012
| ASML STATUTORY ANNUAL REPORT 2011 | 28 |
Management Board Report
About ASML
ASML is one of the world’s leading providers (measured in revenues) of lithography equipment that is critical to the production of ICs or chips. Headquartered in Veldhoven, the Netherlands, ASML operates globally, with activities in Europe, the United States and Asia. As of December 31, 2011 we employed 7,955 payroll employees (2010: 7,184) and 1,935 temporary employees (2010: 2,061), measured in full-time employees (“FTEs”). ASML operates in 16 countries through over 55 sales and service locations.
In 2011, we generated net sales of EUR 5,651.0 million and operating income of EUR 1,643.5 million or 29.1 percent of net sales. Net income in 2011 amounted to EUR 1,494.0 million or 26.4 percent of net sales, representing net income per ordinary share of EUR 3.51.
In the executive summary below we provide an overview of the risk factors, followed by an update of semiconductor equipment industry conditions, a discussion of our business strategy and our key performance indicators.
Risk Factors
In conducting our business, we face many risks that may interfere with our business objectives. Some of these risks relate to our operational processes, while others relate to our business environment. It is important to understand the nature of these risks and the impact they may have on our business, financial condition and results of operations. Some of the more relevant risks are described below. These risks are not the only ones that ASML faces. Some risks may not yet be known to ASML and certain risks that ASML does not currently believe to be material could become material in the future.
Summary
Strategic Risks
| • | We Derive Most of Our Revenues from the Sale of a Relatively Small Number of Products. |
Risks Related to the Semiconductor Industry
| ��� | The Semiconductor Industry is Highly Cyclical and We May Be Adversely Affected by Any Downturn; |
| • | Our Business Will Suffer If We Do Not Respond Rapidly to Commercial and Technological Changes in the Semiconductor Industry; |
| • | We Face Intense Competition. |
Governmental, Legal and Compliance Risks
| • | Failure to Adequately Protect the Intellectual Property Rights Upon Which We Depend Could Harm Our Business; |
| • | Defending Against Intellectual Property Claims Brought by Others Could Harm Our Business; |
| • | We Are Subject to Risks in Our International Operations; |
| • | Because of Labor Laws and Practices, Any Workforce Reductions That We May Seek to Implement in Order to Reduce Costs Company-Wide May Be Delayed or Suspended; |
Operational Risks
| • | The Number of Systems We Can Produce Is Limited by Our Dependence on a Limited Number of Suppliers of Key Components; |
| • | The Pace of Introduction of Our New Products Is Accelerating and Is Accompanied by Potential Design and Production Delays and by Significant Costs; |
| • | We Are Dependent on the Continued Operation of a Limited Number of Manufacturing Facilities; |
| • | We May Be Unable to Make Desirable Acquisitions or to Integrate Successfully Any Businesses We Acquire; |
| • | Our Business and Future Success Depend on Our Ability to Attract and Retain a Sufficient Number of Adequately Educated and Skilled Employees. |
Financial risks
| • | A High Percentage of Net Sales Is Derived from a Few Customers; |
| • | Fluctuations in Foreign Exchange Rates Could Harm Our Results of Operations; |
| ASML STATUTORY ANNUAL REPORT 2011 | 29 |
Risks Related to Our Ordinary Shares
| • | We may not declare cash dividends at all or in any particular amounts in any given year; |
| • | The Price of Our Ordinary Shares is Volatile; |
| • | Restrictions on Shareholder Rights May Dilute Voting Power. |
Strategic Risks
We Derive Most of Our Revenues from the Sale of a Relatively Small Number of Products
We derive most of our revenues from the sale of a relatively small number of lithography equipment systems (222 units in 2011 and 197 units in 2010), with an average selling price (“ASP”) in 2011 of EUR 22.0 million (EUR 24.5 million for new systems and EUR 3.8 million for used systems) and an ASP in 2010 of EUR 19.8 million (EUR 24.1 million for new systems and EUR 4.4 million for used systems). As a result, the timing of recognition of revenue from a small number of product sales may have a significant impact on our net sales and operating results for a particular reporting period. Specifically, the failure to receive anticipated orders, or delays in shipments near the end of a particular reporting period, due, for example, to:
| • | a downturn in the highly cyclical semiconductor industry; |
| • | unanticipated shipment rescheduling; |
| • | cancellation or order push-back by customers; |
| • | unexpected manufacturing difficulties; and |
| • | delays in deliveries by suppliers, |
may cause net sales in a particular reporting period to fall significantly below net sales in previous periods or below our expected net sales, and may have a material adverse effect on our operating results for that period. In particular our published quarterly earnings may vary significantly from quarter to quarter and may vary in the future for the reasons discussed above.
Risks Related to the Semiconductor Industry
The Semiconductor Industry is Highly Cyclical and We May Be Adversely Affected by Any Downturn
As a supplier to the global semiconductor industry, we are subject to the industry’s business cycles, the timing, duration and volatility of which are difficult to predict. The semiconductor industry has historically been cyclical. Sales of our lithography systems depend in large part upon the level of capital expenditures by semiconductor manufacturers. These capital expenditures depend upon a range of competitive and market factors, including:
| • | the current and anticipated market demand for semiconductors and for products utilizing semiconductors; |
| • | semiconductor prices; |
| • | semiconductor production costs; |
| • | changes in semiconductor inventory levels; |
| • | general economic conditions; and |
| • | access to capital. |
Reductions or delays in capital equipment purchases by our customers could have a material adverse effect on our business, financial condition and results of operations.
In an industry downturn, our ability to maintain profitability will depend substantially on whether we are able to lower our costs and break-even level, which is the level of sales that we must reach in a year to achieve net income. If sales decrease significantly as a result of an industry downturn and we are unable to adjust our costs over the same period, our net income may decline significantly or we may suffer losses. As we need to keep certain levels of inventory on hand to meet anticipated product demand, we may also incur increased costs related to inventory obsolescence in an industry downturn. In addition, industry downturns generally result in overcapacity, resulting in downward pressure on prices and impairment of machinery and equipment, which in the past has had, and in the future could have, a material adverse effect on our business, financial condition and results of operations.
The ongoing financial crises that have affected the international banking system and global financial markets since 2008 have been in many respects unprecedented. Concerns persist over the debt burden of certain Eurozone countries and their ability to meet future obligations, the overall stability of the euro, and the suitability of the euro as a single currency given the diverse economic and political circumstances in individual Eurozone countries. These concerns could lead to the re-introduction of the individual currencies in one or more Eurozone countries, or in more extreme circumstances, the possible dissolution of the euro currency entirely. Should the euro dissolve entirely, the legal and contractual consequences for holders of euro-denominated obligations would be determined by the laws in effect at that time. These potential developments, or market perceptions concerning these and related issues, could adversely affect the value of our euro-denominated assets and obligations. In addition, remaining concerns over the effect of this
| ASML STATUTORY ANNUAL REPORT 2011 | 30 |
financial crisis on financial institutions in Europe and globally, and the instability of the financial markets and the global economy in general could result in a number of follow-on effects on our business, including: declining business and consumer confidence resulting in reduced, delayed or shorter-term capital expenditures for our products; insolvency of key suppliers resulting in product delays; the inability of customers to obtain credit to finance purchases of our products, delayed payments from our customers and/or customer insolvencies; and other adverse effects that we cannot currently anticipate. If global economic and market conditions deteriorate, we are likely to experience material adverse impacts on our business, financial condition and results of operations.
Conversely, in anticipation of periods of increasing demand for semiconductor manufacturing equipment, we must maintain sufficient manufacturing capacity and inventory and we must attract, hire, integrate and retain a sufficient number of qualified employees to meet customer demand. Our ability to predict the timing and magnitude of industry fluctuations is limited and our products require significant lead-time to complete. Accordingly, we may not be able to effectively increase our production capacity to respond to an increase in customer demand in an industry upturn resulting in lost revenues, damage to customer relationships and we may lose market share.
Our Business Will Suffer If We Do Not Respond Rapidly to Commercial and Technological Changes in the Semiconductor Industry
The semiconductor manufacturing industry is subject to:
| • | rapid change towards more complex technologies; |
| • | frequent new product introductions and enhancements; |
| • | evolving industry standards; |
| • | changes in customer requirements; and |
| • | continued shortening of product life cycles. |
Our products could become obsolete sooner than anticipated because of a faster than anticipated change in one or more of the technologies related to our products or in market demand for products based on a particular technology. Our success in developing new products and in enhancing our existing products depends on a variety of factors, including the successful management of our research and development (“R&D”) programs and timely completion of product development and design relative to competitors. If we do not develop and introduce new and enhanced systems at competitive prices and on a timely basis, our customers will not integrate our systems into the planning and design of new production facilities and upgrades of existing facilities, which would have a material adverse effect on our business, financial condition and results of operations.
In particular, we are investing considerable financial and other resources to develop and introduce new products and product enhancements, such as Extreme Ultraviolet lithography (“EUV”). If we are unable to complete these developments and introductions or if our customers do not fully adopt the new technologies, products or product enhancements due to a preference for more established or alternative new technologies and products or for any other reasons, we would not recoup all of our investments in these technologies or products, which would result in the recording of impairment charges on these investments, which could have a material adverse effect on our business, financial condition and results of operations.
The success of EUV remains particularly dependent on light source (laser) availability and continuing related technical advances by ASML and its suppliers, as well as infrastructure developments in masks and photoresists, without which the tools cannot achieve the productivity and yield required to economically justify the higher price of these tools. This could discourage or result in much slower adoption of this technology.
We Face Intense Competition
The semiconductor equipment industry is highly competitive. The principal elements of competition in our market are:
| • | the technical performance characteristics of a lithography system; |
| • | the value of ownership of that system based on its purchase price, maintenance costs, productivity, and customer service and support costs; |
| • | the exchange rate of the euro particularly against the Japanese yen which results in varying prices and margins; |
| • | the strength and breadth of our portfolio of patents and other intellectual property rights; and |
| • | our customers’ desire to obtain lithography equipment from more than one supplier. |
Our competitiveness increasingly depends upon our ability to develop new and enhanced semiconductor equipment that is competitively priced and introduced on a timely basis, as well as our ability to protect and defend our intellectual property rights.
ASML competes primarily with Nikon Corporation (“Nikon”) and to a lesser degree with Canon Kabushiki Kaisha (“Canon”). Both Nikon and Canon have substantial financial resources and broad patent portfolios. Each continues to
| ASML STATUTORY ANNUAL REPORT 2011 | 31 |
introduce new products with improved price and performance characteristics that compete directly with our products, which may cause a decline in our sales or a loss of market acceptance for our lithography systems. In addition, adverse market conditions, industry overcapacity or a decrease in the value of the Japanese yen in relation to the euro or the U.S. dollar could further intensify price-based competition in those regions that account for the majority of our sales, resulting in lower prices and margins and a material adverse effect on our business, financial condition and results of operations. In addition, to competitors in lithography, ASML may face competition with respect to alternative technologies for the non-critical layers and from alternative technologies for all layers. In the event the delivery of new technology is delayed, ASML’s customers may turn to alternative technology equipment and/or their own installed base as a substitute for purchasing ASML’s products.
Governmental, Legal and Compliance Risks
Failure to Adequately Protect the Intellectual Property Rights Upon Which We Depend Could Harm Our Business
We rely on intellectual property rights such as patents, copyrights and trade secrets to protect our proprietary technology. However, we face the risk that such measures could prove to be inadequate because:
| • | intellectual property laws may not sufficiently support our proprietary rights or may change in the future in a manner adverse to us; |
| • | patent rights may not be granted or construed as we expect; |
| • | patents will expire which may result in key technology becoming widely available that may hurt our competitive position; |
| • | the steps we take to prevent misappropriation or infringement of our proprietary rights may not be successful; and |
| • | third parties may be able to develop or obtain patents for similar competing technology. |
In addition, litigation may be necessary to enforce our intellectual property rights or to determine the validity and scope of the proprietary rights of others. Any such litigation may result in substantial costs and diversion of resources, and, if decided unfavorably to us, could have a material adverse effect on our business, financial condition and results of operations.
Defending Against Intellectual Property Claims Brought by Others Could Harm Our Business
In the course of our business, we are subject to claims by third parties alleging that our products or processes infringe upon their intellectual property rights. If successful, such claims could limit or prohibit us from developing our technology and manufacturing our products, which could have a material adverse effect on our business, financial condition and results of operations.
In addition, our customers may be subject to claims of infringement from third parties, alleging that our products used by such customers in the manufacture of semiconductor products and/or the processes relating to the use of our products infringe one or more patents issued to such parties. If such claims were successful, we could be required to indemnify customers for some or all of any losses incurred or damages assessed against them as a result of such infringement, which could have a material adverse effect on our business, financial condition and results of operations.
We may also incur substantial licensing or settlement costs where doing so would strengthen or expand our intellectual property rights or limit our exposure to intellectual property claims brought by others, which may have a material adverse effect on our business, financial condition and results of operations.
We Are Subject to Risks in Our International Operations
The majority of our sales are made to customers outside Europe. There are a number of risks inherent in doing business in some of those regions, including the following:
| • | potentially adverse tax consequences; |
| • | unfavorable political or economic environments; |
| • | unexpected legal or regulatory changes; and |
| • | an inability to effectively protect intellectual property. |
If we are unable to manage successfully the risks inherent in our international activities, our business, financial condition and results of operations could be materially and adversely affected.
In particular, 20.3 percent of our 2011 revenues and 30.6 percent of our 2010 revenues were derived from customers in Taiwan. Taiwan has a unique international political status. The People’s Republic of China asserts sovereignty over Taiwan and does not recognize the legitimacy of the Taiwanese government. Changes in relations between Taiwan and the People’s Republic of China, Taiwanese government policies and other factors affecting Taiwan’s political, economic or social environment could have a material adverse effect on our business, financial condition and results of operations.
| ASML STATUTORY ANNUAL REPORT 2011 | 32 |
Because of Labor Laws and Practices, Any Workforce Reductions That We May Seek to Implement in Order to Reduce Costs Company-Wide May Be Delayed or Suspended
The semiconductor market is highly cyclical and as a consequence we may need to implement workforce reductions in case of a downturn, in order to adapt to such market changes. In accordance with labor laws and practices applicable in the jurisdictions in which we operate, a reduction of any significance may be subject to formal procedures that can delay or may result in the modification of our planned workforce reductions. For example, ASML Netherlands B.V., our operating subsidiary in the Netherlands, has a Works Council, as required by Dutch law. If the Works Council renders contrary advice in connection with a proposed workforce reduction in the Netherlands, but we nonetheless determine to proceed, we must temporarily suspend any action while the Works Council determines whether to appeal to the Enterprise Chamber of the Amsterdam Court of Appeal. This appeal process can cause a delay of several months and may require us to address any procedural inadequacies identified by the Court in the way we reached our decision. Such delays could impair our ability to reduce costs company-wide to levels comparable to those of our competitors.
Operational Risks
The Number of Systems We Can Produce Is Limited by Our Dependence on a Limited Number of Suppliers of Key Components
We rely on outside vendors for the components and subassemblies used in our systems, each of which is obtained from a single supplier or a limited number of suppliers. Our reliance on a limited group of suppliers involves several risks, including a potential inability to obtain an adequate supply of required components and the risk of untimely delivery of these components and subassemblies.
The number of lithography systems we are able to produce is limited by the production capacity of Carl Zeiss SMT AG (“Zeiss”). Zeiss is our single supplier of lenses and other critical optical components. If Zeiss were unable to maintain and increase production levels or if we are unable to maintain our business relationship with Zeiss in the future we could be unable to fulfill orders, which could damage relationships with current and prospective customers and have a material adverse effect on our business, financial condition and results of operations. If Zeiss were to terminate its relationship with us or if Zeiss were unable to maintain production of lenses over a prolonged period, we would effectively cease to be able to conduct our business.
In addition to Zeiss’ current position as our single supplier of lenses, the excimer laser illumination systems that provide the ultraviolet light source, referred to as “deep UV”, used in our high resolution steppers and Step & Scan systems, and the extreme ultraviolet light source, used in our second-generation (NXE:3100) EUV systems, are available from only a very limited number of suppliers.
Although the timeliness, yield and quality of deliveries to date from our other subcontractors generally have been satisfactory, manufacturing some of these components and subassemblies that we use in our manufacturing processes is an extremely complex process and delays caused by suppliers may occur in the future. A prolonged inability to obtain adequate deliveries of components or subassemblies, or any other circumstance that requires us to seek alternative sources of supply, could significantly hinder our ability to deliver our products in a timely manner, which could damage relationships with current and prospective customers and have a material adverse effect on our business, financial condition and results of operations.
The Pace of Introduction of Our New Products Is Accelerating and Is Accompanied by Potential Design and Production Delays and by Significant Costs
The development and initial production, installation and enhancement of the systems we produce is often accompanied by design and production delays and related costs of a nature typically associated with the introduction and transition to full-scale manufacturing of complex capital equipment. While we expect and plan for a corresponding learning-curve effect in our product development cycle, we cannot predict with precision the time and expense required to overcome these initial problems and to ensure full performance to specifications. Moreover, we anticipate that this learning-curve effect will continue to present increasingly difficult challenges with every new generation as a result of increasing technological complexity. There is a risk that we may not be able to introduce or bring to full-scale production new products as quickly as we anticipate in our product introduction plans, which could have a material adverse effect on our business, financial condition and results of operations.
For the market to accept technology enhancements, our customers, in many cases, must upgrade their existing technology capabilities. Such upgrades from established technology may not be available to our customers to enable volume production using our new technology enhancements. This could result in our customers not purchasing, or pushing back or canceling orders for our technology enhancements, which could negatively impact our business, financial condition and results of operations.
| ASML STATUTORY ANNUAL REPORT 2011 | 33 |
We Are Dependent on the Continued Operation of a Limited Number of Manufacturing Facilities
All of our manufacturing activities, including subassembly, final assembly and system testing, take place in clean room facilities in Veldhoven, the Netherlands, in Wilton, Connecticut, the United States and in Linkou, Taiwan. These facilities may be subject to disruption for a variety of reasons, including work stoppages, fire, energy shortages, flooding or other natural disasters. We cannot ensure that alternative production capacity would be available if a major disruption were to occur or that, if it were available, it could be obtained on favorable terms. Such a disruption could have a material adverse effect on our business, financial condition and results of operations.
We May Be Unable to Make Desirable Acquisitions or to Integrate Successfully Any Businesses We Acquire
Our future success may depend in part on the acquisition of businesses or technologies intended to complement, enhance or expand our current business or products or that might otherwise offer us growth opportunities. Our ability to complete such transactions may be hindered by a number of factors, including potential difficulties in obtaining government approvals.
Any acquisition that we do make would pose risks related to the integration of the new business or technology with our business. We cannot be certain that we will be able to achieve the benefits we expect from a particular acquisition or investment. Acquisitions may also strain our managerial and operational resources, as the challenge of managing new operations may divert our staff from monitoring and improving operations in our existing business. Our business, financial condition and results of operations may be materially and adversely affected if we fail to coordinate our resources effectively to manage both our existing operations and any businesses we acquire.
Our Business and Future Success Depend on Our Ability to Attract and Retain a Sufficient Number of Adequately Educated and Skilled Employees
Our business and future success significantly depend upon our employees, including a large number of highly qualified professionals, as well as our ability to attract and retain employees. Competition for such personnel is intense, and we may not be able to continue to attract and retain such personnel, which could adversely affect our business, financial condition and results of operations.
In addition, the increasing complexity of our products results in a longer learning-curve for new and existing employees leading to an inability to decrease cycle times and incurring significant additional costs, which could adversely affect our business, financial condition and results of operations.
Financial risks
A High Percentage of Net Sales Is Derived from a Few Customers
Historically, we have sold a substantial number of lithography systems to a limited number of customers. We expect customer concentration to increase because of continuing consolidation in the semiconductor manufacturing industry. Consequently, while the identity of our largest customers may vary from year to year, we expect sales to remain concentrated among relatively few customers in any particular year. In 2011, recognized sales to our largest customer accounted for EUR 1,311.7 million, or 23.2 percent of net sales, compared with EUR 1,270.8 million, or 28.2 percent of net sales, in 2010. The loss of any significant customer or any significant reduction in orders by a significant customer may have a material adverse effect on our business, financial condition and results of operations.
Additionally, as a result of our limited number of customers, credit risk on our receivables is concentrated. Our three largest customers (based on net sales) accounted for 40.7 percent of accounts receivable at December 31, 2011, compared with 42.4 percent at December 31, 2010. As a result, business failure or insolvency of one of our main customers may have a material adverse effect on our business, financial condition and results of operations.
Fluctuations in Foreign Exchange Rates Could Harm Our Results of Operations
We are exposed to currency risks. We are particularly exposed to fluctuations in the exchange rates between the U.S. dollar, Japanese yen and the euro as we incur manufacturing costs for our systems predominantly in euros while portions of our net sales and cost of sales are denominated in U.S. dollars and Japanese yen.
In addition, a portion of our assets and liabilities and operating results are denominated in U.S. dollars, and a small portion of our assets, liabilities and operating results are denominated in currencies other than the euro and the U.S. dollar. Our consolidated financial statements are expressed in euros. Accordingly, our results of operations and assets and liabilities are exposed to fluctuations in exchange rates between the euro and various currencies. In general, our customers run their businesses in U.S. dollars and therefore a weakening of the U.S. dollar against the euro might impact the ability of our customers to purchase our products.
| ASML STATUTORY ANNUAL REPORT 2011 | 34 |
Furthermore, a strengthening of the euro particularly against the Japanese yen could further intensify price-based competition in those regions that account for the majority of our sales, resulting in lower prices and margins and a material adverse effect on our business, financial condition and results of operations.
Risks Related to Our Ordinary Shares
We may not declare cash dividends at all or in any particular amounts in any given year
We aim to pay an annual dividend that will be stable or growing over time. Annually, the Board of Management will, upon prior approval from the Supervisory Board, submit a proposal to the Annual General Meeting of Shareholders with respect to the amount of dividend to be declared with respect to the prior year. The dividend proposal in any given year will be subject to the availability of distributable profits or retained earnings and may be affected by, among other factors, the Board of Management’s views on our potential future liquidity requirements, including for investments in production capacity, the funding of our research and development programs and for acquisition opportunities that may arise from time to time; and by future changes in applicable income tax and corporate laws. Accordingly, it may be decided to propose not to pay a dividend or pay a lower dividend with respect to any particular year in the future, which could have a negative effect on our share price.
The Price of Our Ordinary Shares is Volatile
The current market price of our ordinary shares may not be indicative of prices that will prevail in the future. In particular, the market price of our ordinary shares has in the past experienced significant fluctuation, including fluctuation that is unrelated to our performance. This fluctuation may continue in the future.
Restrictions on Shareholder Rights May Dilute Voting Power
Our Articles of Association provide that we are subject to the provisions of Dutch law applicable to large corporations, called “structuurregime”. These provisions have the effect of concentrating control over certain corporate decisions and transactions in the hands of our Supervisory Board. As a result, holders of ordinary shares may have more difficulty in protecting their interests in the face of actions by members of our Supervisory Board than if we were incorporated in the United States or another jurisdiction.
Our authorized share capital also includes a class of cumulative preference shares and ASML has granted “Stichting Preferente Aandelen ASML”, a Dutch foundation, an option to acquire, at their nominal value of EUR 0.09 per share, such cumulative preference shares. Exercise of the cumulative preference share option would effectively dilute the voting power of our outstanding ordinary shares by one-half, which may discourage or significantly impede a third party from acquiring a majority of our voting shares.
Financial risk management
ASML is exposed to a variety of financial risks such as market risk (including foreign currency exchange risk and interest rate risk), credit risk, liquidity risk and capital risk. The overall risk management program focuses on the unpredictability of financial markets and seeks to minimize potential adverse effects on the Company’s financial performance. See Note 5 to our consolidated financial statements for more information.
Semiconductor Equipment Industry
The chip-making business is focused on “shrink” or reducing the size of chip designs. Historically the semiconductor industry has experienced significant growth largely due to the continual reduction of cost per function performed by ICs. Improvement in the design and manufacture of ICs with higher circuit densities resulted in smaller and cheaper ICs capable of performing a larger number of functions at higher speeds with lower power consumption. We believe that these long-term trends will continue for the foreseeable future and will be accompanied by a continuing demand for production equipment that is capable of accurate production of advanced ICs in high volumes at the lowest possible cost.
Lithography equipment is used to print complex circuit patterns onto silicon wafers, which are the primary raw materials for ICs. The printing process is one of the most critical and expensive steps in wafer fabrication. Lithography equipment is therefore a significant focus of the IC industry’s demand for cost-efficient enhancements to production technology.
The costs to develop new lithography equipment are high. Accordingly, the lithography equipment industry is characterized by the presence of only a few primary suppliers: ASML and Nikon, and (to a lesser degree) Canon. In 2011, ASML was one of the world’s leading providers of lithography equipment (measured in revenues).
| ASML STATUTORY ANNUAL REPORT 2011 | 35 |
Total lithography equipment shipped by the industry as a whole in the six years ended December 31, 2011, is set out in the following table:
Year ended December 31 | 2011 | 2010 | 2009 | 2008 | 2007 | 2006 | ||||||||||||||||||
Total units shipped1 | 356 | 304 | 128 | 344 | 604 | 633 | ||||||||||||||||||
Total value (in millions USD)1 | 7,981 | 6,416 | 2,485 | 5,388 | 7,144 | 6,386 | ||||||||||||||||||
| 1 | Historical data and full-year 2011 estimates as reported by Gartner Dataquest in its fourth quarter 2011 report. |
For the year 2011, the latest indications of independent market analysts show an increase in total lithography equipment shipped to the market by the industry of 17.1 percent in unit volume and 24.4 percent in value. For ASML, the year 2011 was characterized by increased demand for lithography imaging systems across all chip layers: customers continued to invest in new leading-edge immersion technology as well as dry lithography tools in order to execute their strategic investments both in new technology and capacity to meet demand. Sales were derived from all three major markets in which our customers operate, with the Logic segment generating the majority of system sales and DRAM and Nand- Flash memory generating the remainder. Also in 2011, we shipped five second-generation (NXE:3100) EUV systems, in addition to one shipped in 2010.
Business strategy
The long-term growth of the semiconductor industry is the result of the principle that the power, cost and time required for every computation on a digital electronic device can be reduced by shrinking the size of transistors on chips. In 2011, chip makers routinely produce electronic chip features with geometries of 32 nanometers, compared to typical geometries of 10,000 nanometers in the early 1970s, resulting in an increase in the number of transistors on leading chips from several thousand to over two billion. This trend was first observed by Intel co-founder Gordon Moore in 1965, and is referred to as ‘Moore’s Law’. Moore’s Law has resulted in our information society with fast wired and wireless communications - built on affordable chips. Moore’s Law also has an impact on the energy usage of chips. Smaller geometries allow for much lower electrical currents to operate the chip. This has helped to contain the world’s energy consumption despite the proliferation of affordable computing. Using advanced semiconductors in industrial and consumer products often provides economic benefits, user-friendliness and increased safety. The technology revolution powered by semiconductors has brought many advantages: not only can information be more widely disseminated than ever before, affordable chip intelligence has also enabled industry and service sectors to create and distribute products and ideas at lightning speed.
Smarter, smaller and more energy-efficient chips are made with increasingly sophisticated lithography systems produced by ASML. Lithography systems are crucial to the roadmaps of chipmakers to make smaller transistors on chips. ASML’s business strategy is based on maintaining and further developing its position as a technology leader in semiconductor lithography. When executed, this strategy results in the delivery of lithography systems which enable customers to produce highest performance and lowest cost chips. The superior value of ownership offered to customers as a result of ASML’s strategy also maximizes ASML’s own financial performance, aligning the interests of ASML and our customers.
Customer focus
Ensuring customers are served with the right products at the right time, supported by excellent service, is key to ASML’s commitment to a long-term relationship. With high-valued products, customers expect high-quality support customized to their specific requirements. This support includes service engineers, equipped with the latest technical information, to ensure the highest levels of system performance, as well as applications specialists who support optimal system processing and new product implementation.
ASML aims to deliver lithography systems with the lowest cost of ownership and highest earnings.
Customer satisfaction is a critical objective of ASML. We have account teams that are specifically dedicated to customer satisfaction throughout the lifecycle of our products.
Through 2011, all of the top 10 chip makers worldwide, in terms of semiconductor capital expenditure, were our customers. We also have a significant share of customers outside the top 10. We strive for continued business growth with all our customers. We expect customer concentration to increase because of continuing consolidation in the semiconductor manufacturing industry.
| ASML STATUTORY ANNUAL REPORT 2011 | 36 |
In 2011, our satisfaction ratings by customers surpassed every lithography competitor for the ninth successive year, according to VLSI Research, an independent industry research firm that surveyed customers representing 95.0 percent of the world’s total semiconductor market.
Technology Leadership
Our customers need lithography scanners that continuously improve performance in three areas: resolution, speed and precision. The image of the electronic chip circuit must be extremely small (currently the smallest features have a size of less than 30 nm), the system must be able to image billions of these features every second and it must be able to do that with extreme precision of just a few nm (one nm is four silicon atoms). To realize and improve this system performance for our customers, ASML needs to deliver the right technology at the right time to meet long-term roadmaps which often extend many years into the future. Therefore, ASML is committed to significant long-term investments in R&D that are not significantly impacted by short-term cyclical swings. ASML has one of the highest private R&D budgets invested in the Netherlands (source: “Technisch weekblad”). In 2011, our R&D investments (which include R&D costs, net of credits and additions to other intangible assets regarding development expenditures) amounted to EUR 590.3 million, an increase from previous years to accommodate the rapid introduction of evolved platforms which are in demand by customers (2010: EUR 523.4 million). A significant part of this budget was used for R&D jointly with our suppliers and technology partners.
Our lithography scanners are based on our dual-stage wafer imaging platform - the TWINSCAN system - which we introduced in 2000 and which allows exposure of one wafer while simultaneously measuring the wafer which will be exposed next. Our strong leadership in this capability has allowed us to achieve the industry’s highest productivity, enabling reduced cost-per-exposure per wafer. Dual-stage lithography also supports the required accuracy to position electronic features on the wafer, as it allows for more time to measure the wafer prior to exposure. ASML is the only lithography manufacturer that enables volume production based on dual-stage systems.
In order to meet the resolution requirements, we have focused our R&D investments on three core programs: immersion, EUV and holistic lithography solutions.
Our innovative immersion lithography systems place a fluid between the wafer and a system’s projection lens to enhance focus and enable circuit line-width to shrink to smaller dimensions than what is possible with “dry” lithography systems. ASML pioneered this “wet” technology and has experienced strong demand for immersion-based systems, which have been adopted by most of our customers in all semiconductor market segments, including Logic processor chip, NAND-Flash memory chip, as well as the DRAM memory chip segment.
We have developed different immersion systems for different customer needs. We have optimized our TWINSCAN XT immersion systems for cost-effective imaging down to 38 nm and beyond patterning, and have developed a new dual wafer stage system called TWINSCAN NXT with improved positioning (“overlay”) and imaging. The TWINSCAN NXT platform enables next generations of semiconductors through the so-called double patterning technique which requires two exposures per layer on a chip, enabling precise imaging patterns and lines by using our TWINSCAN NXT planar wafer stage and breakthrough grid metrology.
Also in 2011, we shipped five second-generation (NXE:3100) EUV systems, in addition to one shipped in 2010. This NXE:3100 system is being used by customers to develop their EUV manufacturing processes before high-volume EUV systems will become available, which we expect to occur in 2012, subject to successful implementation of a number of new technologies specific to EUV, including the light source. As of December 31, 2011, we had received 11 orders for its successor, the third-generation (NXE:3300), high-volume EUV systems. The EUV system, built on a new platform utilizing the concepts of the TWINSCAN platform, enables our customers to extend their roadmap towards smaller chip features. EUV permits chip makers to expose a critical layer in just one single step - as opposed to double patterning which requires multiple steps. EUV also has a roadmap from the initial 27 nm resolution down to 16 nm and beyond. We have published a roadmap to develop a range of EUV models, offering the greatest extendibility at the lowest cost of ownership for the future of lithography.
We complement our scanner products with a rapidly expanding holistic lithography portfolio of software and metrology products to help our customers optimize semiconductor scanner performance, provide a faster start to chip production and achieve better imaging at higher resolutions. Our customers optimize their scanner performance by taking into account the entire chip creation process, from design to volume manufacturing - we call this approach “holistic lithography”. Starting in 2010, and also during 2011, broad customer adoption of holistic lithography products continued as all of ASML’s leading-edge scanners were sold with one or more holistic lithography components. Semiconductor manufacturers face increasingly smaller margins of error as they shrink chip features. Holistic lithography provides a way to shrink within these margins, offering significant revenue-generating and cost-saving opportunities to our customers.
| ASML STATUTORY ANNUAL REPORT 2011 | 37 |
Operational excellence
We strive to sustain our business success based on our technological leadership by continuing to execute our fundamental operating strategy well, including reducing lead-times while improving our cost competitiveness. Lead-time is the time from a customer’s order to a tool’s delivery.
Our business strategy includes outsourcing the manufacturing of the majority of components and subassemblies that make up our products. We work in partnership with suppliers, collaborating on quality, logistics, technology and total cost. By operating our strategy of value sourcing, we strive to attain flexibility and cost efficiencies from our suppliers through mutual commitment and shared risk and reward. Value sourcing also allows the flexibility to adapt to the cyclicality of the world market for semiconductor lithography systems.
ASML has a flexible labor model with a mix of fixed and flexible contracted labor in its manufacturing and R&D facilities in Veldhoven, the Netherlands, and payroll employees compensated under a partly variable salary structure through ASML’s profit sharing plan. This reinforces our ability to adapt more quickly to semiconductor market cycles, including support for potential 24-hour, seven days-a-week production activities. By maximizing the flexibility of our technically skilled workforce, we can shorten lead-times: a key driver of added value for customers. Flexibility also reduces our working capital requirements.
In view of the economic volatility of the semiconductor industry, we continue to strive for improve efficiencies in our operations: addressing our cost structure and strengthening our capability to generate cash.
Our business model
Our business model is derived from our “Value of Ownership” concept which is based on the following principles:
| • | offering ongoing improvements in productivity, imaging and overlay by introducing advanced technology based on modular platforms and advanced applications outside the traditional lithography business, each resulting in lower costs per product for our customers; |
| • | providing customer services that ensure rapid, efficient installation and superior support and training to optimize manufacturing processes of our customers and improve productivity; |
| • | maintaining appropriate levels of R&D to offer the most advanced technology suitable for high-throughput and low-cost volume production at the earliest possible date; |
| • | enhancing the capabilities of the installed base of our customers through ongoing field upgrades of key value drivers (productivity, imaging and overlay) based on further technology developments; |
| • | reducing the cycle time between a customer’s order of a system and the use of that system in volume production; |
| • | expanding operational flexibility in research and manufacturing by reinforcing strategic alliances with world class partners, including outsourcing companies; |
| • | improving the reliability and uptime of our installed system base; and |
| • | providing refurbishing services that effectively increase residual value by extending the life of equipment. |
Manufacturing, Logistics and Suppliers
Our business model is based on outsourcing production of a significant part of the components and modules that comprise our lithography systems, working in partnership with suppliers from all over the world. Our manufacturing activities comprise the subassembly and testing of certain modules and the final assembly and fine tuning / testing of a finished system from components and modules that are manufactured to our specifications by third parties and by us. All of our manufacturing activities (subassembly, final assembly and system fine tuning / testing) are performed in clean room facilities in Veldhoven, the Netherlands, in Wilton, Connecticut, the United States and in Linkou, Taiwan. We procure stepper and scanner system components and subassemblies from a single supplier or a limited group of suppliers in order to ensure overall quality and timeliness of delivery. We jointly operate a formal strategy with suppliers known as “value sourcing”, which is based on competitive performance in quality, logistics, technology and total cost. The essence of value sourcing is to maintain a supply base that is world class, globally competitive and globally present.
Our value sourcing strategy is based on the following strategic principles:
| • | maintaining long-term relationships with our suppliers; |
| • | sharing risks and rewards with our suppliers; |
| • | dual sourcing of knowledge, globally, together with our suppliers; and |
| • | single, dual or multiple sourcing of products, where possible or required. |
Value sourcing is intended to align the performance of our suppliers with our requirements on quality, logistics, technology and total costs.
| ASML STATUTORY ANNUAL REPORT 2011 | 38 |
Zeiss is our sole external supplier of main optical systems and one of the suppliers of other components. In 2011, 27.9 percent of our aggregate cost of sales was purchased from Zeiss (2010: 29.7 percent).
Zeiss is highly dependent on its manufacturing and testing facilities in Oberkochen and Wetzlar, Germany, and its suppliers. Moreover, Zeiss has a finite capacity for production of lenses and optical components for our systems. The expansion of this production capacity may require significant lead-time. From time to time, the number of systems we have been able to produce has been limited by the capacity of Zeiss to provide us with lenses and optical components. During 2011, our sales were not limited by the deliveries from Zeiss.
If Zeiss is unable to maintain or increase production levels, we might not be able to respond to customer demand. As a result, our relationships with current and prospective customers could be harmed, which would have a material adverse effect on our business, financial condition and results of operations.
Our relationship with Zeiss is structured as a strategic alliance pursuant to several agreements executed in 1997 and subsequent years. These agreements define a framework in all areas of our business relationship. The partnership between ASML and Zeiss is focused on continuous improvement of operational excellence.
Pursuant to these agreements, ASML and Zeiss have agreed to continue their strategic alliance until either party provides at least three years’ notice of its intent to terminate. Although we believe such an outcome is unlikely, if Zeiss were to terminate its relationship with us, or if Zeiss were unable to produce lenses and optical components over a prolonged period, we would effectively cease to be able to conduct our business.
In addition to Zeiss, we also rely on other outside vendors for the components and subassemblies used in our systems, each of which is obtained from a single supplier or a limited number of suppliers. Our reliance on a limited group of suppliers involves several risks, including a potential inability to obtain an adequate supply of required components and the risk of untimely delivery of these components and subassemblies.
Organizational Structure
ASML Holding N.V. is a holding company that operates through its subsidiaries. Our major operating subsidiaries, each of which is a wholly-owned (direct or indirect) subsidiary, are as follows:
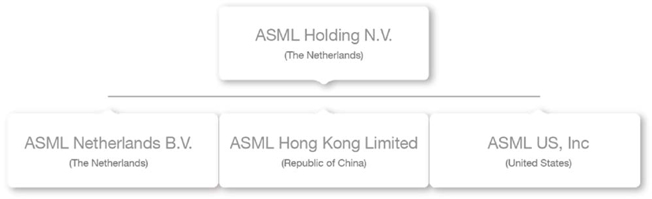
The chart above excludes intermediate subsidiaries; see Note 27 to our consolidated financial statements for a list of our main subsidiaries.
| ASML STATUTORY ANNUAL REPORT 2011 | 39 |
ASML operations update
The following table presents the key performance indicators used by our Board of Management and senior management to measure performance in our monthly operational review meetings. The figures in the table below are based on U.S. GAAP.
Year ended December 31 (in millions) | 2011 EUR | % 1 | 2010 EUR | % 1 | ||||||||||||
Sales | ||||||||||||||||
Net sales | 5,651.0 | 4,507.9 | ||||||||||||||
Increase in net sales (%) | 25.4 | 182.4 | ||||||||||||||
Net system sales | 4,883.9 | 3,894.7 | ||||||||||||||
Sales of systems (in units) | 222 | 197 | ||||||||||||||
Average selling price of total system sales | 22.0 | 19.8 | ||||||||||||||
Average selling price of new system sales | 24.5 | 24.1 | ||||||||||||||
Average selling price of used system sales | 3.8 | 4.4 | ||||||||||||||
Value of systems backlog excluding EUV2,3 | 1,732.5 | 3,855.7 | ||||||||||||||
Systems backlog excluding EUV (in units)2,3 | 71 | 157 | ||||||||||||||
Average selling price of systems backlog excluding EUV2,3 | 24.4 | 24.6 | ||||||||||||||
Average selling price of systems backlog excluding EUV (New)2,3 | 27.9 | 27.7 | ||||||||||||||
Average selling price of systems backlog excluding EUV (Used)2,3 | 3.0 | 5.1 | ||||||||||||||
Immersion systems recognized (in units)4 | 101 | 95 | ||||||||||||||
NXE systems recognized (in units)3 | 3 | — | ||||||||||||||
Profitability | ||||||||||||||||
Gross profit | 2,449.4 | 43.3 | 1,955.2 | 43.4 | ||||||||||||
Income from operations | 1,641.2 | 29.0 | 1,250.7 | 27.7 | ||||||||||||
Net income | 1,467.0 | 26.0 | 1,021.8 | 22.7 | ||||||||||||
Liquidity | ||||||||||||||||
Cash and cash equivalents | 2,731.8 | 1,949.8 | ||||||||||||||
Operating cash flow | 2,070.4 | 940.0 | ||||||||||||||
| 1 | As a percentage of net sales. |
| 2 | As of January 1, 2011, ASML values its net bookings and systems backlog at system sales value including factory options. The comparative figures have not been adjusted because the impact on the comparative figures is insignificant (approximately EUR 20 million negative impact on backlog value per December 31, 2010). Before 2011, ASML valued net bookings and systems backlog at full order value (i.e. including options and services). |
| 3 | Through December 31, 2011 a total of six NXE:3100 systems had been shipped. Three of these systems were recognized in net system sales in 2011, one is expected to be recognized in 2012, one was shipped under the conditions of an operating lease contract and the last one is shipped to a research institute. |
| 4 | Included in the total number of immersion system recognized in 2011 are 78 of our most advanced immersion technology NXT:1950 (2010: 34). |
The consolidated financial statements included in this Statutory Annual Report are based on IFRS, as adopted by the EU, therefore, the results of operations analysis provided below, is based on IFRS. For a detailed explanation of the differences between U.S. GAAP and IFRS, we refer to pages 45 to 47.
Results of Operations
Set forth below are our consolidated income statement data for the two years ended December 31, 2011 and 2010:
Year ended December 31 (in millions) | 2011 EUR | 2010 EUR | ||||||
Total net sales | 5,651.0 | 4,507.9 | ||||||
Cost of sales | 3,299.3 | 2,696.1 | ||||||
Gross profit on sales | 2,351.7 | 1,811.8 | ||||||
Research and development costs | 492.1 | 468.0 | ||||||
Selling, general and administrative costs | 216.1 | 182.5 | ||||||
Operating income | 1,643.5 | 1,161.3 | ||||||
Interest income (charges), net | 17.3 | (7.7 | ) | |||||
Income before income taxes | 1,660.8 | 1,153.6 | ||||||
Provision for income taxes | (166.8 | ) | (168.1 | ) | ||||
Net income | 1,494.0 | 985.5 | ||||||
| ASML STATUTORY ANNUAL REPORT 2011 | 40 |
The following table shows a summary of sales (revenue and units sold), gross profit on sales and ASP data on an annual and semi-annual basis for the years ended December 31, 2011 and 2010:
| First half year | 2011 Second half year | Full year | First half year | 2010 Second half year | Full year | |||||||||||||||||||
Net sales (EUR million) | 2,981.6 | 2,669.4 | 5,651.0 | 1,810.5 | 2,697.4 | 4,507.9 | ||||||||||||||||||
Net system sales (EUR million) | 2,618.0 | 2,265.9 | 4,883.9 | 1,554.6 | 2,340.1 | 3,894.7 | ||||||||||||||||||
Net service and field option sales (EUR million) | 363.6 | 403.5 | 767.1 | 255.9 | 357.3 | 613.2 | ||||||||||||||||||
Total sales of systems (in units) | 126 | 96 | 222 | 77 | 120 | 197 | ||||||||||||||||||
Total sales of new systems (in units) | 114 | 81 | 195 | 58 | 96 | 154 | ||||||||||||||||||
Total sales of used systems (in units) | 12 | 15 | 27 | 19 | 24 | 43 | ||||||||||||||||||
Gross profit as a percentage of net sales | 43.1 | 39.9 | 41.6 | 37.9 | 41.7 | 40.2 | ||||||||||||||||||
ASP of system sales (EUR million) | 20.8 | 23.6 | 22.0 | 20.2 | 19.5 | 19.8 | ||||||||||||||||||
ASP of new system sales (EUR million) | 22.6 | 27.2 | 24.5 | 25.7 | 23.1 | 24.1 | ||||||||||||||||||
ASP of used system sales (EUR million) | 3.5 | 4.0 | 3.8 | 3.4 | 5.2 | 4.4 | ||||||||||||||||||
Sales
For the longer term, and based on industry analysts IC unit growth forecasts, we expect our sales level to grow. Our sales levels depend on multiple growth drivers: market growth, market share growth, average selling price growth and a broadening of our product and services scope.
Net sales increased by EUR 1,143.1 million, or 25.4 percent to EUR 5,651.0 million in 2011 from EUR 4,507.9 million in 2010. The increase in net sales mainly resulted from an increase in net system sales of EUR 989.2 million, or 25.4 percent to EUR 4,883.9 million in 2011 from EUR 3,894.7 million in 2010. Net service and field option sales increased to EUR 767.1 million in 2011 from EUR 613.2 million in 2010. The number of total systems sold increased by 12.7 percent to 222 systems in 2011 from 197 systems in 2010. The increase in total net sales was caused by increased demand for lithography imaging systems required for all of the various chip layers: customers continued to invest in new leading-edge immersion technology as well as dry lithography tools in order to execute their strategic investments in new technology and capacity to meet demand. Sales were derived from all three major markets in which our customers operate, with the Logic segment generating the majority of system sales and DRAM and Nand-Flash memory generating the remainder.
The ASP of our systems increased by 11.1 percent to EUR 22.0 million in 2011 from EUR 19.8 million in 2010 resulting from a decrease in the number of used systems sold with relatively lower ASPs. The ASP of our new systems increased by 1.7 percent to EUR 24.5 million in 2011 from EUR 24.1 million in 2010, which was mainly driven by three NXE:3100 systems recognized with an ASP of EUR 39.8 million, partly offset by a change in product mix.
From time to time, ASML repurchases systems that it has manufactured and sold and, following factory-rebuild or refurbishment, resells those systems to other customers. This repurchase decision is mainly driven by market demand for capacity expressed by other customers and not by explicit or implicit contractual arrangements relating to the initial sale. The number of used systems sold in 2011 decreased to 27 from 43 in 2010. The ASP of our used systems decreased by 13.6 percent to EUR 3.8 million in 2011 from EUR 4.4 million in 2010, which was the result of a shift in the mix of used systems sold toward more low-end system types.
Through 2011, all of the top 10 chipmakers worldwide, in terms of semiconductor capital expenditure, were our customers. In 2011, recognized sales to our largest customer accounted for EUR 1,311.7 million, or 23.2 percent of our net sales. In 2010, recognized sales to our largest customer accounted for EUR 1,270.8 million, or 28.2 percent of our net sales.
Profitability
Our general strategy is to seek to achieve operating income to net sales of 13.0 to 18.0 percent at the trough of the industry’s business cycle and 25.0 to 30.0 percent at the peak. However in exceptional circumstances, as evidenced by the financial and economic crisis, we could see periods with operating results that are substantially below our minimum target level.
Operating income increased to EUR 1,643.5 million, or 29.1 percent of net sales, in 2011 from an operating income of EUR 1,161.3 million, or 25.8 percent of net sales, in 2010. This EUR 482.2 million increase was the result of an increase in sales and the resulting increase in gross profit of EUR 540.0 million which was partly offset by an increase in SG&A and R&D operating expenses of EUR 57.8 million.
| ASML STATUTORY ANNUAL REPORT 2011 | 41 |
Gross profit increased to 2,351.7 million or 41.6 percent of net sales in 2011 from EUR 1,811.8 million or 40.2 percent of net sales in 2010. The higher absolute amount of gross profit reflects increased demand for lithography imaging systems across all chip layers: customers continued to invest in new leading-edge immersion technology as well as dry lithography tools in order to execute their strategic investments both in new technology and in capacity to meet demand. The 2011 gross profit as a percentage of net sales only increased slightly compared to the 2010 percentage, which can be explained by the following: In 2011, net sales and cost of sales included three NXE:3100 systems which represent net sales of around EUR 120.0 million with zero gross profit at the time these were recognized as revenue. Our gross profit is negatively impacted by increased cost of sales incurred on all six NXE:3100 systems shipped to our customers as a result of significant costs due to the introduction of the EUV program. These effects had a negative impact on the 2011 gross profit as a percentage of net sales of 1.5 percent. In addition, manufacturing costs increased in 2011 compared to 2010 (mainly EUV related expenditures).
ASML has a flexible labor model with a mix of fixed and flexible contracted labor in its manufacturing and R&D facilities in Veldhoven, the Netherlands, and payroll employees compensated under a partly variable salary structure through ASML’s profit sharing plan. This reinforces our ability to adapt more quickly to semiconductor market cycles, including support for potential 24-hour, seven days-a-week production activities. By maximizing the flexibility of our technically skilled workforce, we can shorten lead-times: a key driver of added value for customers. Flexibility also reduces our working capital requirements.
Research and development costs
R&D investments (which include R&D costs, net of credits and additions to other intangible assets regarding development expenditures) increased by EUR 66.9 million or 12.8 percent from EUR 523.4 million in 2010 (EUR 468.0 million R&D costs and EUR 55.4 million addition to other intangible assets regarding development expenditures) to EUR 590.3 million (EUR 492.2 million R&D costs and EUR 98.1 million addition to other intangible assets regarding development expenditures) in 2011. This increase reflects our acceleration of strategic investment in the development and enhancement of the next-generation TWINSCAN systems based on immersion, EUV and holistic lithography solutions to extend these systems. The increase in the additions in intangible assets regarding capitalized development expenditures mainly relate to EUV and an enhanced version of the NXT.
Selling, general and administrative costs
SG&A costs increased by EUR 33.6 million, or 18.4 percent, as a result of both a higher sales level and increased costs to implement and support IT solutions and for improvement programs (relating mainly to employee development costs).
Interest income (charges), net
Net interest income in 2011 was EUR 17.3 million compared with a net interest charge in 2010 of EUR 7.7 million. Interest income relates to interest earned on our cash and cash equivalents and was in 2011 only partly offset by net interest charges on our outstanding debt, mainly due to a significantly higher cash balance. Furthermore, net interest income was positively impacted by a release of expected interest charges related to income tax liabilities.
Income taxes
The effective tax rate was 10.0 percent of income before income taxes in 2011, compared with 14.6 percent of income before income taxes in 2010. This decrease is mainly caused by the fact that ASML reached agreement with the Dutch fiscal authorities regarding the application of the “Innovation Box” in December 2010, a facility under Dutch corporate tax law pursuant to which income associated with R&D is partially exempted from taxation. This tax ruling has retroactive effect to January 1, 2007 and is valid through December 31, 2016. Thereafter the validity of this ruling may be extended or this ruling may be adapted depending on a possible change of circumstances. For 2010, the beneficial impact of the Innovation Box was partially offset with the cumulative negative Innovation Box effects (previously called “Royalty Box”) incurred in The Netherlands during the period 2007-2009. In 2011, the Innovation Box effect is no longer offset by these prior year effects.
Net income
Net income in 2011 amounted to EUR 1,494.0 million, or 26.4 percent of net sales, representing EUR 3.51 net income per ordinary share, compared with net income in 2010 of EUR 985.5 million, or 21.9 percent of net sales, representing EUR 2.26 net income per ordinary share.
Liquidity
ASML seeks to ensure that cash generated from operations, together with the liquidity provided by existing cash balances and its borrowing capability, will be sufficient to satisfy its liquidity requirements throughout every face of the industry cycles.
| ASML STATUTORY ANNUAL REPORT 2011 | 42 |
ASML provided net cash by operating activities of EUR 2,168.5 million and EUR 1,002.5 million in 2011 and 2010, respectively. Net cash provided by operating activities in 2011 mainly relates to increased sales levels as a result of increased demand for lithography imaging systems required for all of the various chip layers. The primary drivers of net cash provided by operating activities in 2011 were net income of EUR 1,494.0 million, an increase in accrued and other liabilities (EUR 625.1 million) mainly as a result of EUV down payments, partly offset by a net increase in working capital. This net increase in working capital mainly relates to a decrease in accounts payable (EUR 126.2 million).
ASML used EUR 399.0 million for investing activities in 2011 and EUR 180.3 million in 2010. The 2011 investing activities are mainly related to machinery and equipment, EUV and NXT production facilities in Veldhoven, the Netherlands, information technology and leasehold improvements to our facilities. The majority of the 2010 expenditures were mainly related to machinery and equipment and the start of the second part of the EUV and NXT production facilities in Veldhoven, the Netherlands.
Net cash used in financing activities was EUR 991.6 million in 2011 compared with net cash provided by financing activities of EUR 85.7 million in 2010. In 2011 net cash used in financing activities includes the cash outflow of EUR 700.5 million for our share buy back program, our annual dividend payment of EUR 172.6 million and a repayment of deposits from customers of EUR 150.0 million, partly offset by the net proceeds from issuance of shares in connection with the exercise and purchase of employee stock options of EUR 34.1 million. In 2010 net cash provided by financing activities included EUR 150.0 million cash inflow from deposits from customers and EUR 31.0 million cash inflow from the issuance of shares in connection with the exercise and purchase of employee stock options, partly offset by EUR 87.0 million cash outflow for our dividend payment.
ASML’s principal sources of liquidity consist of cash flows from operations, EUR 2,731.8 million of cash and cash equivalents as of December 31, 2011 and EUR 500.0 million of available credit facilities as of December 31, 2011. In addition, the Company may from time to time raise additional capital in debt and equity markets. ASML’s goal is to remain an investment grade rated company and maintain a capital structure that supports this.
ASML invests its cash and cash equivalents mainly in euro-denominated short-term deposits with high-rated financial institutions and the Dutch government and partly in euro-denominated AAAm-rated money market funds that invest in high-rated short-term debt securities of financial institutions and governments.
The Company’s available credit facility consists of a EUR 500.0 million committed revolving credit facility from a group of banks that will mature in 2015. The credit facility contains a restrictive covenant that requires the Company to maintain a minimum committed capital to net total assets ratio of 40.0 percent calculated in accordance with contractually agreed definitions. In 2011, the Company was in compliance with the covenant and currently does not expect any difficulty in continuing to meet its covenant requirement. Outstanding amounts under this credit facility will bear interest at EURIBOR or LIBOR plus a margin that depends on the Company’s liquidity position. No amounts were outstanding under this credit facility at the end of 2011 and 2010.
The undrawn EUR 200.0 million loan facility (between the Company and the European Investment Bank) matured in 2011, as the availability period to draw the facility ended on March 31, 2011.
We have repayment obligations in 2017, amounting to EUR 600.0 million, on our 5.75 percent senior notes due 2017 (the “Eurobond”). The coupons on the Eurobond have been swapped to a floating rate thereby creating a partial fair value hedge of the floating rate cash flows which we receive from our investments of our cash and cash equivalents.
Subject to market conditions, we expect that our capital expenditures (purchases of property, plant and equipment) in 2012 will be approximately EUR 233.5 million (2011: EUR 300.9 million). Capital expenditures in 2012 will mainly consist of investments in the finalization of capacity expansion of EUV production facilities as a result of customer commitments.
Our liquidity needs are affected by many factors, some of which are based on the normal ongoing operations of the business, and others that relate to the uncertainties of the global economy and the semiconductor industry. Although our cash requirements fluctuate based on the timing and extent of these factors, we believe that cash generated from operations, together with the liquidity provided by existing cash balances and our borrowing capability are sufficient to satisfy our requirements throughout every phase of the industry cycles, including our 2012 capital expenditures. We intend to return cash to our shareholders on a regular basis in the form of dividend payments and, subject to our actual and anticipated liquidity requirements and other relevant factors, share buy backs or repayment of capital.
| ASML STATUTORY ANNUAL REPORT 2011 | 43 |
Trend Information
The year 2011 was characterized by increased demand for lithography imaging systems required for all of the various chip layers: customers continued to invest in new leading-edge immersion technology as well as dry lithography tools in order to execute their strategic investments in new technology and capacity to meet demand. Sales were derived from all three major markets in which our customers operate, with the Logic segment generating the majority of system sales and DRAM and Nand-Flash memory generating the remainder. Also in 2011, we shipped five second-generation (NXE:3100) EUV systems, in addition to one shipped in 2010.
The following table sets forth our systems backlog, excluding EUV, as of December 31, 2011 and 2010.
Year ended December 31 | 20111 | 2010 | ||||||
New systems backlog excluding EUV (in units) | 61 | 135 | ||||||
Used systems backlog excluding EUV (in units) | 10 | 22 | ||||||
Total systems backlog excluding EUV (in units) | 71 | 157 | ||||||
Value of new systems backlog excluding EUV (EUR million) | 1,702.7 | 3,744.3 | ||||||
Value of used systems backlog excluding EUV (EUR million) | 29.8 | 111.4 | ||||||
Total value of systems backlog excluding EUV (EUR million) | 1,732.5 | 3,855.7 | ||||||
ASP of new systems backlog excluding EUV (EUR million) | 27.9 | 27.7 | ||||||
ASP of used systems backlog excluding EUV (EUR million) | 3.0 | 5.1 | ||||||
ASP of total systems backlog excluding EUV (EUR million) | 24.4 | 24.6 | ||||||
| 1 | As of January 1, 2011, ASML values its net bookings and systems backlog at system sales value including factory options. The comparative figures have not been adjusted because the impact on the comparative figures is insignificant (approximately EUR 20 million negative impact on backlog value per December 31, 2010). Before 2011, ASML valued net bookings and systems backlog at full order value (i.e. including options and services). |
Our systems backlog includes only orders for which written authorizations have been accepted and system shipment and revenue recognition dates within 12 months have been assigned. Historically, orders have been subject to cancellation or delay by the customer. Due to possible customer changes in delivery schedules and to cancellation of orders, our systems backlog at any particular date is not necessarily indicative of actual sales for any succeeding period.
We started 2011 with a systems backlog excluding EUV of 157 systems. In 2011, we booked orders for 137 systems, received order cancellations or push-outs beyond 12 months for 4 systems and recognized sales for 219 systems. This resulted in a systems backlog of 71 systems as of December 31, 2011.
As of December 31, 2011, our systems backlog excluding EUV was valued at EUR 1,732.5 million and included 71 systems with an ASP of EUR 24.4 million. As of December 31, 2010, the systems backlog was valued at EUR 3,855.7 million and included 157 systems with an ASP of EUR 24.6 million.
ASML expects first quarter 2012 net sales of approximately EUR 1.2 billion. We now see a growing demand for third generation (NXE:3300) EUV system deliveries and for which we had received 11 orders as of December 31, 2011.
Remuneration of the Supervisory Board
The remuneration of the members of the Supervisory Board is not dependent on the financial results of the Company. No member of the Supervisory Board personally maintains a business relationship with the Company other than as a member of the Supervisory Board. The General Meeting of Shareholders determines the remuneration of the members of the Supervisory Board. For more details regarding the remuneration of the Supervisory Board we refer to Note 30 to our consolidated financial statements.
Remuneration of the Board of Management
The remuneration of the individual members of the Board of Management is determined by the Supervisory Board based on the advice of the Remuneration Committee of the Supervisory Board. For more details regarding the remuneration of the Board of Management we refer to the Corporate Governance chapter and Note 30 to our consolidated financial statements.
| ASML STATUTORY ANNUAL REPORT 2011 | 44 |
Corporate Governance
ASML continuously monitors and assesses applicable Dutch, U.S., and other relevant corporate governance codes, rules, and regulations. ASML is subject to the Dutch Corporate Governance Code (the “Code”), as ASML is registered in the Netherlands and is listed on Euronext Amsterdam. For more details we refer to the Corporate Governance Chapter included in this report on pages 10 to 28.
Directors’ Responsibility Statement
The Directors’ Responsibility Statement is included in this report on pages 48 to 50.
Sustainability Report 2011
Sustainability over the long term is essential in the relationship between ASML and customers, because customers rely on ASML for their long-term roadmaps towards smarter and more energy efficient microchips.
Sustainability Governance
In 2009 ASML decided to significantly strengthen its commitment in the area of Sustainability by setting a number of stringent objectives to be reached by 2015. It is the mission of the Sustainability Board to monitor the realization of the objectives. The mandate given by the Board of Management to the Sustainability Board is to review and make recommendations on the sustainability management system and policies, authorize or recommend plans to the Board of Management, provide guidance to management on objectives and targets; monitor and provide guidance on sustainability performance and targets, monitor and oversee sustainability risk management review and monitor stakeholder relations, and review and make recommendations on sustainability impacts of major business decisions. The Sustainability Board also determines the scope, provides input, and recommends to the Board of Management adoption of the Sustainability Report.
In 2010, the Sustainability Board established the Corporate Sustainability department to coordinate the implementation of the overall sustainability strategy and policies on a day-to-day basis.
In 2011, senior management decided to expand the Sustainability Governance structure by nominating a ‘domain owner’ for each of the four strategic focus areas. Domain owners are responsible for coordinating the implementation of the sustainability goals in their respective domains.
Sustainability Strategy
Our customers want chip-making machines that produce more chips faster, using less energy and fewer natural resources. They also want us, as their supplier, to operate according to the highest environmental, social and governance standards. Our Sustainability strategy thus goes hand in hand with our business strategy, aimed at maintaining and further developing our position as a technology leader in the semiconductor industry.
ASML’s sustainability strategy focuses on four domains: sustainable operations, sustainable products, sustainable value chain and sustainable culture:
| • | Focusing on sustainable operations means we seek to reduce the environmental impact of both our manufacturing process and our research and development activities; |
| • | Providing sustainable products means we continuously strive to make our chip-making machines more efficient, enabling our customers to reduce energy and natural resources consumption per chip produced; |
| • | Focusing on a sustainable value chain signifies our ambition to stimulate our suppliers to meet increasingly high sustainability standards and to enable our customers to positively influence their impact on environment and society; |
| • | Focusing on a sustainable culture means we seek to provide a working environment that inspires our highly skilled workforce and respects their cultural and individual differences. It also means we seek to make a positive contribution to the well-being of the communities in which we operate. |
U.S. GAAP and Dutch Statutory Annual Reports
General
The Company prepares two sets of financial statements, one based on accounting principles generally accepted in the United States of America (“U.S. GAAP”) and one based on Dutch law and International Financial Reporting Standards (“IFRS”) as adopted by the European Union (“EU”). By means of regulation 1606/2002, the European Commission has
| ASML STATUTORY ANNUAL REPORT 2011 | 45 |
stipulated that all listed companies within the European Union member states are required to prepare their consolidated financial statements under IFRS as adopted by the EU as from January 1, 2005.
The consolidated financial statements included in this Statutory Annual Report are based on IFRS as adopted by the EU. For internal and external reporting purposes, ASML follows U.S. GAAP. U.S. GAAP is ASML’s primary accounting standard for the Company’s setting of financial and operational performance targets.
ASML’s annual report on Form 20-F, which is based on U.S. GAAP, may contain additional information next to its Statutory Annual Report. ASML also publishes quarterly IFRS financial figures and a statutory interim report. The U.S. GAAP Annual Report and the U.S. GAAP and IFRS quarterly press releases, statutory interim report and statutory annual report are available on ASML’s website at www.asml.com. For the periods presented in this statutory annual report, the main differences between IFRS and U.S. GAAP for ASML relate to the following:
Year ended December 31 (in thousands) | 2011 EUR | 2010 EUR | ||||||
Net income under U.S. GAAP | 1,466,960 | 1,021,820 | ||||||
Capitalization of development expenditures | (2,219 | ) | (9,859 | ) | ||||
Impairment of capitalized development expenditures | — | (9,657 | ) | |||||
Share-based payments | (315 | ) | 283 | |||||
Reversal of write-downs | 4,620 | (14,559 | ) | |||||
Income taxes | 25,025 | (2,575 | ) | |||||
|
|
|
| |||||
Net income under IFRS | 1,494,071 | 985,453 | ||||||
|
|
|
| |||||
As of December 31 (in thousands) | 2011 EUR | 2010 EUR | ||||||
Equity under U.S. GAAP | 3,444,154 | 2,773,908 | ||||||
Capitalization of development expenditures | 232,995 | 234,331 | ||||||
Share-based payments | 2,711 | 6,542 | ||||||
Reversal of write-downs | 7,166 | 2,546 | ||||||
Income taxes | 32,779 | 5,135 | ||||||
|
|
|
| |||||
Equity under IFRS | 3,719,805 | 3,022,462 | ||||||
|
|
|
| |||||
Capitalization of development expenditures
Under IFRS, ASML applies IAS 38, “Intangible Assets”. In accordance with IAS 38, ASML capitalizes certain development expenditures that are amortized over the expected useful life of the related product generally ranging between one and three years. Amortization starts when the developed product is ready for volume production.
Under U.S. GAAP, ASML applies ASC 730, “Research and Development”. In accordance with ASC 730, ASML charges costs relating to research and development to operating expense as incurred.
Share-based payments
Under IFRS, ASML applies IFRS 2, “Share-based Payments” beginning from January 1, 2004. In accordance with IFRS 2, ASML records as an expense the fair value of its share-based payments with respect to stock options and stock granted to its employees after November 7, 2002. Under IFRS, at period end a deferred tax asset is computed on the basis of the tax deduction for the share-based payments under the applicable tax law and is recognized to the extent it is probable that future taxable profit will be available against which these deductible temporary differences will be utilized. Therefore, changes in the Company’s share price do affect the deferred tax asset at period-end and result in adjustments to the deferred tax asset.
As of January 1, 2006, ASML applies ASC 718 “Compensation-Stock Compensation” which requires companies to recognize the cost of employee services received in exchange for awards of equity instruments based upon the grant-date fair value of those instruments. ASC 718’s general principle is that a deferred tax asset is established as the Company recognizes compensation costs for commercial purposes for awards that are expected to result in a tax deduction under existing tax law. Under U.S. GAAP, the deferred tax recorded on share-based compensation is computed on the basis of the expense recognized in the financial statements. Therefore, changes in the Company’s share price do not affect the deferred tax asset recorded in the Company’s financial statements.
| ASML STATUTORY ANNUAL REPORT 2011 | 46 |
Reversal of write-downs
Under IFRS, ASML applies IAS 2 (revised), “Inventories”. In accordance with IAS 2, reversal of a prior period write-down as a result of a subsequent increase in value of inventory should be recognized in the period in which the value increase occurs.
Under U.S. GAAP, ASML applies ASC 330 “Inventory”. In accordance with ASC 330 reversal of a write-down is prohibited as a write-down creates a new cost basis.
Income taxes
Under IFRS, ASML applies IAS 12, “Income Taxes” beginning from January 1, 2005. In accordance with IAS 12 unrealized net income resulting from intercompany transactions that are eliminated from the carrying amount of assets in consolidation give rise to a temporary difference for which deferred taxes must be recognized in consolidation. The deferred taxes are calculated based on the tax rate applicable in the purchaser’s tax jurisdiction.
Under U.S. GAAP, the elimination of unrealized net income from intercompany transactions that are eliminated from the carrying amount of assets in consolidation give rise to a temporary difference for which prepaid taxes must be recognized in consolidation. Contrary to IFRS, the prepaid taxes under U.S. GAAP are calculated based on the tax rate applicable in the seller’s rather than the purchaser’s tax jurisdiction.
Statutory Interim Report 2011
On July 13, 2011 we published our Statutory Interim Report for the six-month period ended June 26, 2011. This report includes Consolidated Condensed Interim Financial Statements prepared in accordance with IAS 34, an Interim Management Board Report, and a Managing Directors’ Statement. The Statutory Interim Report is available on our website www.asml.com. The Statutory Interim Report comprises regulated information within the meaning of the Dutch Financial Markets Supervision Act (Wet op het financieel toezicht).
The Board of Management,
Veldhoven, February 13, 2012
| ASML STATUTORY ANNUAL REPORT 2011 | 47 |
Directors’ Responsibility Statement
Managing Directors’ Statement (EU Transparency Directive)
The Board of Management hereby declares that, to the best of its knowledge, the statutory financial statements prepared in accordance with IFRS and Title 9 of Part 2 of the Netherlands Civil Code provide a true and fair view of the assets, liabilities, financial position and profit or loss of ASML Holding N.V. and the undertakings included in the consolidation taken as a whole and that the management report includes a fair review concerning the position as per the balance sheet date, the development and performance of ASML Holding N.V. and the undertakings included in the consolidation taken as a whole, together with the principal risk and uncertainties that they face.
| ASML STATUTORY ANNUAL REPORT 2011 | 48 |
In Control Statement (Dutch Corporate Governance Code)
As the Board of Management of ASML Holding N.V. (“ASML” or the “Company”), we hereby state that we are responsible for the design, implementation and operation of the Company’s internal risk management and control systems. The purpose of these systems is to adequately and effectively manage the significant risks to which the Company is exposed. Such systems can never provide absolute assurance regarding achievement of corporate objectives, nor can they provide an absolute assurance that material errors, losses, fraud and the violation of laws or regulations will not occur.
Financial reporting risks
To comply with our duties in the area of internal risk management and control systems with respect to financial reporting risks, we use various measures including but not limited to:
| • | monthly operational review meetings of the Board of Management with ASML’s senior management on financial performance and realization of operational objectives and responses to emerging issues; |
| • | semi-annual financial planning meetings of the Board of Management with ASML’s senior management; |
| • | monthly meetings with ASML’s Chief Executive Officer, Chief Financial Officer and senior finance management focusing on monthly financial figures; |
| • | monthly and quarterly financial reporting, mainly to ASML’s senior management; |
| • | letters of representation that are signed by ASML’s key senior management members on a semi-annual basis in which they confirm that for their responsible area based upon their knowledge (i) an effective system of internal controls and procedures is maintained and (ii) the financial reports fairly present the financial position, results of operations and cash flows; |
| • | assessments by ASML’s Disclosure Committee with respect to the timely review, disclosure, and evaluation of periodic (financial) reports; |
| • | assessments by ASML’s Disclosure Committee with respect to internal controls in light of among others the requirements under the Sarbanes-Oxley Act of 2002 and the Dutch Corporate Governance Code; |
| • | discussions on management letters and audit reports provided by the Company’s internal and external auditors within our Board of Management and Supervisory Board; |
| • | ASML’s Business Principles; |
| • | ASML’s Internal Guidelines on Ethical Business Conduct, including the Complaints Procedure and related whistleblower mechanism; and |
| • | ASML’s Anti-Fraud Policy, which facilitates the development of controls which will aid in prevention, deterrence and detection of fraud against ASML. |
We acknowledge the importance of internal control and risk management systems. Therefore, in 2004, ASML executed the SOX Project to establish a framework to properly manage internal controls over financial reporting, which is required per section 404 of the Sarbanes-Oxley Act of 2002 (“SOX 404”). The results of ASML’s assessment of the effectiveness of this framework, which is based on the Committee of Sponsoring Organizations of the Treadway Commission (“COSO”) model, as well as significant changes and improvements, are regularly reported to and discussed with ASML’s Audit Committee and external auditors. The Audit Committee reports about these subjects to the Supervisory Board on a regular basis. In addition, once a year, the Board of Management discusses the implementation of this internal control framework, as well as significant changes and major improvements in internal controls, with the Audit Committee and the full Supervisory Board.
Summary
Based on the outcome of the above-mentioned measures and to the best of its knowledge and belief, the Board of Management states that:
| 1. | the above-mentioned measures provide a reasonable level of assurance that ASML’s financial statements as of and for the year ended December 31, 2011 fairly present in all material respects the financial condition, results of operations and cash flows of the Company and that ASML’s financial statements as of and for the year ended December 31, 2011 do not contain any material inaccuracy; |
| 2. | the internal risk management and control systems provide a reasonable assurance that the financial reporting does not contain any errors of material importance and have worked adequately in 2011; and |
| 3. | there are no indications that the Company’s internal controls over financial reporting will not operate effectively in 2012. |
ASML’s Board of Management is currently not aware of any significant change in the Company’s internal control over financial reporting that occurred during 2011 that has materially affected, or is reasonably likely to materially affect, the Company’s effectiveness of internal control over financial reporting.
| ASML STATUTORY ANNUAL REPORT 2011 | 49 |
Operational/strategic risks and legal and regulatory risks
To comply with our duties in the area of internal risk management and control systems with respect to operational/ strategic risks and legal and regulatory risks, we use various measures among which:
| • | strategic evaluations of ASML’s business by the Board of Management in consultation with the Supervisory Board; |
| • | semi-annual senior management meetings, which are conducted to assess ASML’s corporate initiatives which are launched in order to execute ASML’s strategy; |
| • | monthly operational review meetings of the Board of Management with ASML’s senior management on financial performance and realization of operational objectives and responses to emerging issues; |
| • | bi-annual financial planning meetings of the Board of Management with ASML’s senior management; |
| • | monthly (internal) and quarterly (public) financial reporting; |
| • | letters of representation that are signed by ASML’s key senior management members on a semi-annual basis in which they confirm their responsibility for assessing business risks and ensuring appropriate risk mitigation for their responsible area based upon their knowledge; |
| • | annual risk review, including a specific risk discussion, by the Board of Management with ASML’s senior management to review key strategic risks and define appropriate mitigating actions. Outcomes of the review and progress updates are reported to the Audit Committee annually; |
| • | ASML’s Business Principles; |
| • | ASML’s Internal Guidelines on Ethical Business Conduct, including the Complaints Procedure and related whistleblower mechanism; and |
| • | ASML’s Anti-Fraud Policy, which facilitates the development of controls which will aid in prevention, deterrence and detection of fraud against ASML. |
The establishment of ASML’s internal control and risk management systems is based on the identification of external and internal risk factors that could influence the operational and financial objectives of the Company and contains a system of monitoring, reporting and operational reviews. All material risk management activities have been discussed with the Audit Committee and the Supervisory Board. For more information on our risk management activities and our internal control and risk management systems, we refer to Internal Risk Management and Control Systems, External Factors included in ASML’s chapter on Corporate Governance. For a summary of ASML’s Risk Factors, we refer to our Management Board Report in the Statutory Annual Report.
The Board of Management,
Eric Meurice, President, Chief Executive Officer
Peter T.F.M. Wennink, Executive Vice President, Chief Financial Officer
Martin A. van den Brink, Executive Vice President, Chief Product and Technology Officer
Frits J. van Hout, Executive Vice President, Chief Marketing Officer
Frédéric J.M. Schneider-Maunoury, Executive Vice President, Chief Operating Officer
Veldhoven, February 13, 2012
| ASML STATUTORY ANNUAL REPORT 2011 | 50 |

Statutory Financial Statements
Consolidated Financial Statements
53 | Consolidated Income Statement | |
53 | Consolidated Statement of Comprehensive Income | |
54 | Consolidated Statement of Financial Position | |
55 | Consolidated Statement of Changes in Equity | |
56 | Consolidated Statement of Cash Flows | |
57 | Notes to the Consolidated Financial Statements | |
| ASML STATUTORY ANNUAL REPORT 2011 | 52 |
Consolidated Income Statement
Notes | Year ended December 31 (in thousands, except per share data) | 2011 EUR | 2010 EUR | |||||||
28 | Net system sales | 4,883,913 | 3,894,742 | |||||||
Net service and field option sales | 767,122 | 613,196 | ||||||||
|
|
|
| |||||||
28 | Total net sales | 5,651,035 | 4,507,938 | |||||||
Cost of system sales | 2,891,579 | 2,366,363 | ||||||||
Cost of service and field option sales | 407,714 | 329,804 | ||||||||
|
|
|
| |||||||
29 | Total cost of sales | 3,299,293 | 2,696,167 | |||||||
|
|
|
| |||||||
Gross profit on sales | 2,351,742 | 1,811,771 | ||||||||
29, 31 | Research and development costs | 492,184 | 468,038 | |||||||
29 | Selling, general and administrative costs | 216,055 | 182,407 | |||||||
|
|
|
| |||||||
Operating income | 1,643,503 | 1,161,326 | ||||||||
32 | Interest income | 43,668 | 19,300 | |||||||
32 | Interest charges | (26,361 | ) | (27,012 | ) | |||||
|
|
|
| |||||||
Income before income taxes | 1,660,810 | 1,153,614 | ||||||||
26 | Provision for income taxes | (166,739 | ) | (168,161 | ) | |||||
|
|
|
| |||||||
Net income | 1,494,071 | 985,453 | ||||||||
7 | Basic net income per ordinary share | 3.51 | 2.26 | |||||||
Diluted net income per ordinary share1 | 3.48 | 2.24 | ||||||||
Number of ordinary shares used in computing per share amounts (in thousands): | ||||||||||
Basic | 425,618 | 435,146 | ||||||||
Diluted1 | 429,053 | 438,978 | ||||||||
| 1 | The calculation of diluted net income per ordinary share assumes the exercise of options issued under ASML stock option plans and the issuance of shares under ASML share plans for periods in which exercises or issuances would have a dilutive effect. The calculation of diluted net income per ordinary share does not assume exercise of such options or issuance of shares when such exercises or issuance would be anti-dilutive. |
Consolidated Statement of Comprehensive Income
Notes | Year ended December 31 (in thousands) | 2011 EUR | 2010 EUR | |||||||
Net income | 1,494,071 | 985,453 | ||||||||
Other comprehensive income: | ||||||||||
Foreign currency translation, net of taxes: | ||||||||||
5,18 | Losses on the hedge of a net investment | (1,829 | ) | ��� | ||||||
5,18 | Gain (losses) on translation of foreign operations | (12,142 | ) | 27,306 | ||||||
Derivative financial instruments, net of taxes: | ||||||||||
5,18 | Fair value losses in the year | (4,610 | ) | (49,175 | ) | |||||
5,18 | Transfers to net income | 51,963 | 47,954 | |||||||
|
|
|
| |||||||
Other comprehensive income for the period, net of taxes | 33,382 | 26,085 | ||||||||
|
|
|
| |||||||
Total comprehensive income for the period, net of taxes | 1,527,453 | 1,011,538 | ||||||||
Attributable to Equity holders | 1,527,453 | 1,011,538 | ||||||||
| ASML STATUTORY ANNUAL REPORT 2011 | 53 |
Consolidated Statement of Financial Position
(Before appropriation of net income)
Notes | As of December 31 (in thousands) | 2011 EUR | 2010 EUR | |||||||
Assets | ||||||||||
8 | Property, plant and equipment | 1,053,610 | 745,331 | |||||||
9 | Goodwill | 155,124 | 150,071 | |||||||
10 | Other intangible assets | 267,988 | 277,038 | |||||||
26 | Deferred tax assets | 212,255 | 234,194 | |||||||
11 | Finance receivables | — | 28,905 | |||||||
13 | Derivative financial instruments | 92,534 | 71,779 | |||||||
14 | Other assets | 211,058 | 159,603 | |||||||
|
|
|
| |||||||
Total non-current assets | 1,992,569 | 1,666,921 | ||||||||
15 | Inventories | 1,632,678 | 1,500,072 | |||||||
26 | Current tax assets | 32,105 | 12,678 | |||||||
13 | Derivative financial instruments | 33,817 | 24,401 | |||||||
11 | Finance receivables | 78,853 | 12,648 | |||||||
16 | Accounts receivable | 880,627 | 1,123,534 | |||||||
14 | Other assets | 176,732 | 163,745 | |||||||
17 | Cash and cash equivalents | 2,731,782 | 1,949,834 | |||||||
|
|
|
| |||||||
Total current assets | 5,566,594 | 4,786,912 | ||||||||
|
|
|
| |||||||
Total assets | 7,559,163 | 6,453,833 | ||||||||
Equity and liabilities | ||||||||||
18 | Equity | 3,719,805 | 3,022,462 | |||||||
19 | Long-term debt1 | 730,122 | 704,302 | |||||||
13 | Derivative financial instruments | 3,210 | 1,981 | |||||||
26 | Deferred and other tax liabilities | 203,298 | 185,009 | |||||||
21 | Provisions | 10,012 | 11,811 | |||||||
22 | Accrued and other liabilities | 659,889 | 371,089 | |||||||
|
|
|
| |||||||
Total non-current liabilities | 1,606,531 | 1,274,192 | ||||||||
21 | Provisions | 2,326 | 2,250 | |||||||
13 | Derivative financial instruments | 37,149 | 32,917 | |||||||
Current portion of long-term debt1 | 2,587 | 1,429 | ||||||||
26 | Current and other tax liabilities | 14,999 | 79,354 | |||||||
22 | Accrued and other liabilities | 1,731,497 | 1,485,832 | |||||||
Accounts payable | 444,269 | 555,397 | ||||||||
|
|
|
| |||||||
Total current liabilities | 2,232,827 | 2,157,179 | ||||||||
|
|
|
| |||||||
Total equity and liabilities | 7,559,163 | 6,453,833 | ||||||||
|
|
|
| |||||||
| 1 | As of January 1, 2011 the current portion of long-term debt is presented as part of the current liabilities. The comparative figures have been adjusted to reflect this change (EUR 1.4 million). |
| ASML STATUTORY ANNUAL REPORT 2011 | 54 |
Consolidated Statement of Changes in Equity
Issued and outstanding shares | ||||||||||||||||||||||||||||||||||
Notes | (in thousands) | Number1
| Amount EUR | Share Premium EUR | Retained Earnings EUR | Treasury Shares at cost EUR | Other Reserves2 EUR | Net Income (loss) EUR | Total EUR | |||||||||||||||||||||||||
Balance at January 1, 2010 | 433,639 | 40,448 | 923,487 | 1,215,492 | (219,623 | ) | 172,446 | (81,443 | ) | 2,050,807 | ||||||||||||||||||||||||
Appropriation of net loss | — | — | — | (81,443 | ) | — | — | 81,443 | — | |||||||||||||||||||||||||
Components of statement of comprehensive income | ||||||||||||||||||||||||||||||||||
Net income | — | — | — | — | — | — | 985,453 | 985,453 | ||||||||||||||||||||||||||
| 5,18 | Foreign currency translation, net of taxes | — | — | — | — | — | 27,306 | — | 27,306 | |||||||||||||||||||||||||
| 5,18 | Derivative financial instruments, net of taxes | — | — | — | — | — | (1,221 | ) | — | (1,221 | ) | |||||||||||||||||||||||
Total comprehensive income | — | — | — | — | — | 26,085 | 985,453 | 1,011,538 | ||||||||||||||||||||||||||
| 23,29,30 | Share-based payments | — | — | 16,254 | — | — | — | — | 16,254 | |||||||||||||||||||||||||
| 18 | Dividend paid | — | — | — | (86,960 | ) | — | — | — | (86,960 | ) | |||||||||||||||||||||||
| 23,30 | Issuance of shares and stock options | 2,954 | 265 | (17,400 | ) | (18,573 | ) | 66,531 | — | — | 30,823 | |||||||||||||||||||||||
| 18 | Development expenditures | — | — | — | 68,153 | — | (68,153 | ) | — | — | ||||||||||||||||||||||||
|
|
|
|
|
|
|
|
|
|
|
|
|
|
|
| |||||||||||||||||||
Balance at December 31, 2010 | 436,593 | 40,713 | 922,341 | 1,096,669 | (153,092 | ) | 130,378 | 985,453 | 3,022,462 | |||||||||||||||||||||||||
Appropriation of net income | — | — | — | 985,453 | — | — | (985,453 | ) | — | |||||||||||||||||||||||||
Components of statement of comprehensive income | ||||||||||||||||||||||||||||||||||
Net income | — | — | — | — | — | — | 1,494,071 | 1,494,071 | ||||||||||||||||||||||||||
| 5,18 | Foreign currency translation, net of taxes | — | — | — | — | — | (13,971 | ) | — | (13,971 | ) | |||||||||||||||||||||||
| 5,18 | Derivative financial instruments, net of taxes | — | — | — | — | — | 47,353 | — | 47,353 | |||||||||||||||||||||||||
Total comprehensive income | — | — | — | — | — | 33,382 | 1,494,071 | 1,527,453 | ||||||||||||||||||||||||||
| 18 | Purchases of treasury shares | (25,675 | ) | — | (700,452 | ) | — | — | (700,452 | ) | ||||||||||||||||||||||||
| 18 | Cancellation of treasury shares | — | (1,897 | ) | 710 | (372,614 | ) | 373,801 | — | — | — | |||||||||||||||||||||||
| 23,29,30 | Share-based payments | — | — | 7,819 | — | — | — | — | 7,819 | |||||||||||||||||||||||||
| 18 | Dividend paid | — | — | — | (172,645 | ) | — | — | — | (172,645 | ) | |||||||||||||||||||||||
| 23,30 | Issuance of shares and stock options | 2,751 | — | (10,392 | ) | (16,346 | ) | 61,906 | — | — | 35,168 | |||||||||||||||||||||||
| 18 | Development expenditures | — | — | — | 4,721 | — | (4,721 | ) | — | — | ||||||||||||||||||||||||
|
|
|
|
|
|
|
|
|
|
|
|
|
|
|
| |||||||||||||||||||
Balance at December 31, 2011 | 413,669 | 38,816 | 920,478 | 1,525,238 | (417,837 | ) | 159,039 | 1,494,071 | 3,719,805 | |||||||||||||||||||||||||
|
|
|
|
|
|
|
|
|
|
|
|
|
|
|
| |||||||||||||||||||
| 1 | As of December 31, 2011, the number of issued shares was 431,294,790. This includes the number of issued and outstanding shares of 413,669,257 and the number of treasury shares of 17,625,533. As of December 31, 2010, the number of issued shares was 444,480,095. This includes the number of issued and outstanding shares of 436,592,972 and the number of treasury shares of 7,887,123. |
| 2 | Other reserves consist of the hedging reserve, the currency translation reserve and the reserve for capitalized development expenditures. See Note 18. |
| ASML STATUTORY ANNUAL REPORT 2011 | 55 |
Consolidated Statement of Cash Flows
Notes | Year ended December 31 (in thousands) | 2011 EUR | 2010 EUR | |||||||
Cash Flows from Operating Activities | ||||||||||
Net income | 1,494,071 | 985,453 | ||||||||
Adjustments to reconcile net income to net cash flows from operating activities: | ||||||||||
8,10 | Depreciation and amortization | 266,124 | 267,066 | |||||||
8,10 | Impairment | 12,272 | 19,538 | |||||||
8 | Loss on disposals of property, plant and equipment1 | 3,368 | 2,913 | |||||||
23,30 | Share-based payments | 12,430 | 12,109 | |||||||
16 | Allowance for doubtful debts | 849 | (1,256 | ) | ||||||
15 | Allowance for obsolete inventory | 46,055 | 28,502 | |||||||
26 | Deferred income taxes | 50,574 | (45,230 | ) | ||||||
Changes in assets and liabilities: | ||||||||||
16 | Accounts receivable | 267,209 | (748,898 | ) | ||||||
11 | Finance receivables | (37,301 | ) | (20,000 | ) | |||||
15 | Inventories1 | (264,537 | ) | (657,306 | ) | |||||
14 | Other assets | (99,710 | ) | (111,925 | ) | |||||
21,22 | Accrued and other liabilities | 625,136 | 872,840 | |||||||
Accounts payable | (126,234 | ) | 350,231 | |||||||
26 | Income taxes payable | 109,114 | 203,768 | |||||||
|
|
|
| |||||||
Cash generated from operations | 2,359,420 | 1,157,805 | ||||||||
Interest received | 47,326 | 29,152 | ||||||||
Interest paid | (35,919 | ) | (35,559 | ) | ||||||
Income taxes paid | (202,312 | ) | (148,915 | ) | ||||||
|
|
|
| |||||||
Net cash provided by operating activities | 2,168,515 | 1,002,483 | ||||||||
Cash Flows from Investing Activities | ||||||||||
8 | Purchases of property, plant and equipment1 | (300,898 | ) | (128,728 | ) | |||||
8 | Proceeds from sale of property, plant and equipment1 | — | 3,825 | |||||||
10 | Purchase of intangible assets | (98,086 | ) | (55,388 | ) | |||||
|
|
|
| |||||||
Net cash used in investing activities | (398,984 | ) | (180,291 | ) | ||||||
Cash Flows from Financing Activities | ||||||||||
18 | Dividend paid | (172,645 | ) | (86,960 | ) | |||||
Purchase of shares | (700,452 | ) | — | |||||||
23,30 | Net proceeds from issuance of shares and stock options | 34,084 | 31,000 | |||||||
22 | Deposits from customers | (150,000 | ) | 150,000 | ||||||
19 | Repayment of debt | (2,537 | ) | (8,385 | ) | |||||
|
|
|
| |||||||
Net cash provided by (used in) financing activities | (991,550 | ) | 85,655 | |||||||
Net cash flows | 777,981 | 907,847 | ||||||||
Effect of changes in exchange rates on cash | 3,967 | 4,913 | ||||||||
|
|
|
| |||||||
Net increase in cash and cash equivalents | 781,948 | 912,760 | ||||||||
17 | Cash and cash equivalents at beginning of the year | 1,949,834 | 1,037,074 | |||||||
|
|
|
| |||||||
17 | Cash and cash equivalents at end of the year | 2,731,782 | 1,949,834 | |||||||
|
|
|
| |||||||
| 1 | An amount of EUR 300.5 million (2010: EUR 214.1 million) of the additions in property, plant and equipment relates to non-cash transfers mainly from inventory and an amount of EUR 145.3 million (2010: EUR 110.4 million) of the disposals of property, plant and equipment relates to non-cash transfers to inventory. Since the transfers between inventory and property, plant and equipment are non-cash events, these are not reflected in this consolidated statement of cash flows. |
| ASML STATUTORY ANNUAL REPORT 2011 | 56 |
Notes to the Consolidated Financial Statements
1. General information
ASML Holding N.V. (“ASML”), with its corporate seat in Veldhoven, the Netherlands, is engaged in the development, production, marketing, sale and servicing of advanced semiconductor equipment systems exclusively consisting of lithography systems. ASML’s principal operations are in the Netherlands, the United States of America and Asia.
ASML’s shares are listed for trading in the form of registered shares on the NASDAQ Stock Market LLC (“NASDAQ”) and in the form of registered shares on Euronext Amsterdam by NYSE Euronext (“Euronext Amsterdam”). The principal trading market of ASML’s ordinary shares is Euronext Amsterdam.
The accompanying consolidated financial statements include the financial statements of ASML Holding N.V. headquartered in Veldhoven, the Netherlands, and its consolidated subsidiaries (together referred to as “ASML” or “the Company”).
The financial statements of the Company were authorized for issue by the Board of Management on February 13, 2012 and will be filed at the Trade Register of the Chamber of Commerce in Eindhoven, the Netherlands within eight days after adoption by the General Meeting of Shareholders, scheduled on April 25, 2012.
2. Adoption of new and revised International Financial Reporting Standards
The financial statements have been prepared on the basis of International Financial Reporting Standards (“IFRS”) as adopted by the European Union (“EU”). New Standards and Interpretations, which became effective in 2011, did not have a material impact on ASML’s consolidated financial statements.
Standards and Interpretations effective in 2011
IAS 24 (Revised), “Related Party Disclosures” (effective for annual periods beginning on or after January 1, 2011). The revised standard simplifies the disclosure requirements for government-related entities by providing a partial exemption for government-related entities and clarifies the definition of a related party. The adoption of the Revised Standard did not have any impact on the Company’s consolidated financial statements.
IAS 32 (Amendment) “Classification of Rights Issues” (effective for annual periods beginning on or after February 1, 2010). The amendment to IAS 32 addresses the accounting for rights issues (rights, options or warrants) that are denominated in a currency other than the functional currency of the issuer. The amendment requires that, provided certain conditions are met, such rights issues are classified as equity regardless of the currency in which the exercise price is denominated. The adoption of the Revised Standard did not have any impact on the Company’s consolidated financial statements.
IFRIC 19, ‘Extinguishing financial liabilities with equity instruments’ (effective for annual periods beginning on or after July 1, 2010). The interpretation clarifies the accounting by an entity when the terms of a financial liability are renegotiated and result in the entity issuing equity instruments to a creditor of the entity to extinguish all or part of the financial liability (debt for equity swap). It requires a gain or loss to be recognised in profit or loss, which is measured as the difference between the carrying amount of the financial liability and the fair value of the equity instruments issued. If the fair value of the equity instruments issued cannot be reliably measured, the equity instruments should be measured to reflect the fair value of the financial liability extinguished. The adoption of the Revised Standard did not have any impact on the Company’s consolidated financial statements.
At the date of authorization of these financial statements, the following Standards and Interpretations have been issued however are not yet effective and have not yet been adopted
IFRS 7 Amendments “Financial Instruments” (effective for annual periods beginning on or after July 1, 2011). The Amendments are subject to endorsement by the European Union. The Amendments increase the disclosure requirements for transactions involving transfers of financial assets. These Amendments are intended to provide greater transparency around risk exposures when a financial asset is transferred but the transferor retains some level of continuing exposure in the asset. ASML is currently in the process of determining the impact of adopting this Standard on the Company’s consolidated financial statements.
IFRS 9 “Financial Instruments” (effective for annual periods beginning on or after January 1, 2013). The Standard is subject to endorsement by the European Union. IFRS 9 is subject to endorsement by the European Union. IFRS 9 addresses the classification and measurement of financial assets and financial liabilities. IFRS 9 enhances the ability of investors and other users of financial information to understand the accounting of financial assets and reduces complexity. Furthermore, IFRS 9 addresses the accounting for changes in the fair value of financial liabilities (designated
| ASML STATUTORY ANNUAL REPORT 2011 | 57 |
at fair value through profit or loss) attributable to changes in the credit risk of that liability. ASML is currently in the process of determining the impact of adopting this Standard on the Company’s consolidated financial statements.
IFRS 10 “Consolidated Financial Statements” (effective for annual periods beginning on or after January 1, 2013). The Standard is subject to endorsement by the European Union. IFRS 10 replaces the parts of IAS 27 “Consolidated and Separate Financial Statements” that deal with consolidated financial statements. Under IFRS 10 there is only one basis of consolidation, being control. In addition, IFRS 10 includes a new definition of control that contains three elements: a) power over an investee, b) exposure, or rights to variable returns from its involvement with the investee, and c) the ability to use power over the investee to affect the amount of the investor’s returns. ASML is currently in the process of determining the impact of adopting this Standard on the Company’s consolidated financial statements.
IFRS 11 “Joint Arrangements” (effective for annual periods beginning on or after January 1, 2013). The Standard is subject to endorsement by the European Union. IFRS 11 replaces IAS 31 “Interests in Joint Ventures” and deals with how a joint arrangement of which two or more parties have joint control should be classified. Under IFRS 11, joint ventures are required to be accounted for using the equity method of accounting, whereas under IAS 31, jointly controlled entities can be accounted for using the equity method of accounting or proportionate accounting. ASML is currently in the process of determining the impact of adopting this Standard on the Company’s consolidated financial statements.
IFRS 12 “Disclosure of Interest in Other Entities” (effective for annual periods beginning on or after January 1, 2013). The Standard is subject to endorsement by the European Union. IFRS 12 is a disclosure standard and is applicable to entities that have interests in subsidiaries, joint arrangements, associates and/or unconsolidated structured entities. ASML is currently in the process of determining the impact of adopting this Standard on the Company’s consolidated financial statements.
IFRS 13 “Fair Value Measurement” (effective for annual periods beginning on or after January 1, 2013). The Standard is subject to endorsement by the European Union. IFRS 13 defines fair value, establishes a framework for measuring fair value and requires disclosures about fair value measurements. The Standard applies to both financial instrument items and non-financial instrument items. ASML is currently in the process of determining the impact of adopting this Standard on the Company’s consolidated financial statements.
IAS 1 Amendments “Presentation of Items of Other Comprehensive Income” (effective for annual periods beginning on or after July 1, 2012). The Amendments are subject to endorsement by the European Union. The Amendments to IAS 1 require additional disclosures to be made in the other comprehensive income section such that items are grouped into two categories: (a) items that will not be reclassified subsequently to profit or loss; and (b) items that will be reclassified subsequently to profit or loss when specific conditions are met. ASML is currently in the process of determining the impact of adopting these Amendments on the Company’s consolidated financial statements.
IAS 19 Revised “Employee Benefits” (effective for annual periods beginning on or after January 1, 2013). This Revised standard is subject to endorsement by the European Union. The amendments to IAS 19 change the accounting for defined benefit plans and termination benefits. Further, the amendments enhance the disclosure requirements for an employer’s participation in a multiemployer plan. ASML is currently in the process of determining the impact of adopting this Revised Standard on the Company’s consolidated financial statements.
3. Summary of Significant Accounting Policies
Basis of preparation
The accompanying consolidated financial statements are stated in thousands of euros (“EUR”) unless otherwise indicated. These financial statements, prepared for statutory purposes, have been prepared in accordance with IFRS as adopted by the EU - accounting principles generally accepted in the Netherlands for companies quoted on Euronext Amsterdam. For internal and external reporting purposes, ASML follows accounting principles generally accepted in the United States of America (“U.S. GAAP”). U.S. GAAP is ASML’s primary accounting standard for the Company’s setting of financial and operational performance targets.
The financial statements have been prepared on historical cost convention unless stated otherwise. The principal accounting policies adopted are set out below.
In accordance with article 402 Part 9 Book 2 of the Dutch Civil Code the Company income statement is presented in abbreviated form.
| ASML STATUTORY ANNUAL REPORT 2011 | 58 |
The accounting policies adopted in the preparation of the consolidated financial statements are consistent with those applied in the preparation of the Company’s statutory financial statements 2010.
Use of estimates
The preparation of ASML’s consolidated financial statements in conformity with IFRS as adopted by the EU requires management to make estimates and assumptions that affect the reported amounts of assets and liabilities and the disclosure of contingent assets and liabilities on the dates of the statement of financial position and the reported amounts of revenue and expense during the reported periods. Actual results could differ from those estimates.
Basis of consolidation
The consolidated financial statements include the accounts of ASML Holding N.V. and all of its majority owned subsidiaries. All intercompany profits, balances and transactions have been eliminated in the consolidation.
Subsidiaries
Subsidiaries are all entities over which ASML has the power to govern financial and operating policies generally accompanying a shareholding of more than one-half of the voting rights. As from the date that these criteria are met, the financial data of the relevant company are included in the consolidation.
Acquisitions of subsidiaries are included on the basis of the ‘purchase accounting’ method. The cost of acquisition is measured as the cash payment made, the fair value of other assets distributed and the fair value of liabilities incurred or assumed at the date of exchange, plus the costs that can be allocated directly to the acquisition. Identifiable assets acquired as well as liabilities and contingent liabilities assumed in a business combination are measured initially at their fair values at acquisition date. The excess of the costs of an acquired subsidiary over the net of the amounts assigned to assets acquired and liabilities incurred or assumed is capitalized as goodwill.
Special purpose entities
When the Company has an interest in a Special Purpose Entity (“SPE”), it shall assess whether ASML has control over the SPE and, thus, should consolidate the SPE.
Foreign currency translation
The individual financial statements of each group entity are presented in the currency of the primary economic environment in which the entity operates (its functional currency). For the purpose of the consolidated financial statements, the results and financial position of each entity are expressed in euros, which is the functional currency of the Company, and the presentation currency for the consolidated financial statements.
In preparing the financial statements of the individual entities, transactions in currencies other than the entity’s functional currency (foreign currencies) are recorded at the rates of exchange prevailing on the dates of the transactions. At each statement of financial position date, monetary items denominated in foreign currencies are retranslated at the rates prevailing on the statement of financial position date. Non-monetary items carried at fair value that are denominated in foreign currencies are retranslated at the rates prevailing on the date when the fair value was determined. Non-monetary items that are measured in terms of historical cost in a foreign currency are not retranslated.
Exchange rate differences arising on the settlement of monetary items, and on the retranslation of monetary items, are recognized in the income statement for the period. Exchange rate differences arising on the retranslation of non-monetary items carried at fair value are recognized in the income statement for the period except for differences arising on the retranslation of non-monetary items in respect of which gains and losses are recognized directly in equity. For such non-monetary items, any exchange rate component of that gain or loss is also recognized directly in equity.
In order to hedge its exposure to certain foreign exchange rate risks, the Company enters into forward contracts and currency options; see below for details of the Company’s accounting policies in respect of such derivative financial instruments.
For the purpose of presenting consolidated financial statements, the assets and liabilities of the Company’s foreign subsidiaries (including comparatives) are expressed in euros using exchange rates prevailing on the statement of financial position date. Income and expense items (including comparatives) are translated at the average exchange rates for the period, unless exchange rates fluctuated significantly during that period, in which case the exchange rates at the dates of the transactions are used. Exchange rate differences arising, if any, are classified as equity and transferred to the Company’s currency translation reserve. Such translation differences are recognized in the income statement in the period in which the foreign operation is disposed of. Goodwill and fair value adjustments arising on the acquisition of a foreign subsidiary are treated as assets and liabilities of foreign subsidiaries and translated at closing rate.
| ASML STATUTORY ANNUAL REPORT 2011 | 59 |
Property, plant and equipment
Property, plant and equipment are stated at cost, less accumulated depreciation and any accumulated impairment losses. Costs of assets manufactured by ASML include direct manufacturing costs, production overhead and interest costs incurred for qualifying assets during the construction period. Depreciation is calculated using the straight-line method based on the estimated useful lives of the related assets. In the case of leasehold improvements, the estimated useful lives of the related assets do not exceed the remaining term of the corresponding lease. The following table presents the estimated useful lives of ASML’s property, plant and equipment:
Category | Estimated useful life | |||
Buildings and constructions | 5 - 40 years | |||
Machinery and equipment | 2 - 5 years | |||
Leasehold improvements | 5 - 10 years | |||
Furniture, fixtures and other equipment | 3 - 5 years | |||
Land is not depreciated.
Certain internal and external costs associated with the purchase and/or development of internally used software are capitalized when both the preliminary project stage is completed and management has authorized further funding for the project, which it has deemed probable to be completed and to be usable for the intended function. These costs are amortized on a straight-line basis over the period of related benefit, which ranges primarily from three to five years.
The estimated useful lives and depreciation method are reviewed at each year-end, with the effect of any changes in estimate accounted for on a prospective basis.
The gain or loss arising on the disposal or retirement of an item of property, plant and equipment is determined as the difference between the sales proceeds and the carrying amount of the asset and is recognized in the income statement.
Intangible assets
Goodwill
Goodwill represents the excess of the costs of an acquisition over the fair value of Company’s share of the net identifiable assets, liabilities and contingent liabilities of the acquired subsidiary at the date of acquisition. Goodwill is initially recognized as an asset at cost and is subsequently measured at cost less any accumulated impairment losses.
For the purpose of impairment testing, goodwill is allocated to each of the Company’s cash-generating units expected to benefit from the synergies of the combination. Cash-generating units to which goodwill has been allocated are tested for impairment annually on September 30, or more frequently when there is an indication that the unit may be impaired. If the recoverable amount of the cash-generating unit is less than the carrying amount of the unit, the impairment loss is allocated first to reduce the carrying amount of any goodwill allocated to the unit and then to the other assets of the unit pro-rata on the basis of the carrying amount of each asset in the unit. An impairment loss recognized for goodwill is not reversed in a subsequent period.
On disposal of a subsidiary, the attributable amount of goodwill is included in the determination of the profit or loss on disposal.
Other intangible assets
Other intangible assets include internally-generated intangible assets, acquired intellectual property rights, developed technology, customer relationships, in-process Research and Development (“R&D”) and other intangible assets.
Internally-generated intangible assets - research and development expenditures
Expenditure on research activities is recognized as an expense in the period in which it is incurred. IFRS requires capitalization of development expenditures provided if, and only if, certain criteria can be demonstrated.
An internally-generated intangible asset arising from the Company’s development is recognized only if the Company can demonstrate all of the following conditions:
| • | the technical feasibility of completing the intangible asset so that it will be available for use or sale; |
| • | the intention to complete the intangible asset and use or sell it; |
| • | the ability to use or sell the intangible asset; |
| • | the probability that the asset created will generate future economic benefits; |
| ASML STATUTORY ANNUAL REPORT 2011 | 60 |
| • | the availability of adequate technical, financial and other resources to complete the development and to use or sell the intangible asset; and |
| • | the ability to measure reliably the expenditure attributable to the intangible asset during its development. |
For certain development programs, it was not possible to separate development activities from research activities (approximately EUR 15.9 million and EUR 16.2 million for 2011 and 2010, respectively). Consequently, ASML was not able to reliably determine the amount of development expenditures incurred for these programs.
Internally-generated intangible assets are amortized on a straight-line basis over their estimated useful lives, ranging from one to three years. Where no internally-generated intangible asset can be recognized, development expenditure is charged to the income statement in the period in which it is incurred.
The estimated useful lives and depreciation method are reviewed at each year-end, with the effect of any changes in estimate accounted for on a prospective basis.
Intellectual property rights, developed technology, customer relationships and other intangible assets
Acquired intellectual property rights, developed technology, customer relations and other intangible assets are stated at cost less accumulated amortization and any accumulated impairment losses. Amortization is charged on a straight-line basis over their estimated useful lives. The estimated useful life and amortization method are reviewed at the end of each annual reporting period, with the effect of any changes in estimate being accounted for on a prospective basis.
In-process research and development
In-process R&D relates to the fair value of the technology regarding products that were in development at the time of acquisition. In-process R&D is subsequently stated at cost less accumulated amortization and any accumulated impairment losses. Amortization is charged on a straight-line basis over the estimated useful life. The estimated useful lives and depreciation method are reviewed at each year-end, with the effect of any changes in estimate accounted for on a prospective basis.
The following table presents the estimated useful lives of ASML’s other intangible assets:
Category | Estimated useful life | |||
Development expenditures | 1 - 5 years | |||
Intellectual property | 3 - 10 years | |||
Developed technology | 6 years | |||
Customer relationships | 8 years | |||
In-process research and development | 4 years | |||
Other | 2 - 6 years | |||
Impairment of tangible and intangible assets excluding goodwill
At each reporting date, the Company reviews the carrying amounts of its tangible and intangible assets (other than goodwill) to determine whether there is any indication that those assets have suffered an impairment loss. If any such indication exists, the recoverable amount of the asset is estimated in order to determine the extent of the impairment loss (if any). Where it is not possible to estimate the recoverable amount of an individual asset, the Company estimates the recoverable amount of the cash-generating unit to which the asset belongs. Where a reasonable and consistent basis of allocation can be identified, corporate assets are also allocated to individual cash-generating units, or otherwise they are allocated to the smallest group of cash-generating units for which a reasonable and consistent allocation basis can be identified.
Intangible assets with indefinite useful lives and intangible assets not yet available for use are tested for impairment annually, and whenever there is an indication that the asset may be impaired.
Recoverable amount is the higher of fair value less costs to sell and value in use.
If the recoverable amount of an asset (or cash-generating unit) is estimated to be less than its carrying amount, the carrying amount of the asset (or cash-generating unit) is reduced to its recoverable amount. An impairment loss is recognized immediately in the income statement, unless the relevant asset is carried at a revalued amount, in which case the impairment loss is treated as a revaluation decrease.
Where an impairment loss subsequently reverses, the carrying amount of the asset (or cash-generating unit) is increased to the revised estimate of its recoverable amount, but so that the increased carrying amount does not exceed the
| ASML STATUTORY ANNUAL REPORT 2011 | 61 |
carrying amount that would have been determined had no impairment loss been recognized for the asset (or cash-generating unit) in prior years. A reversal of an impairment loss is recognized immediately in the income statement, unless the relevant asset is carried at a revalued amount, in which case the reversal of the impairment loss is treated as a revaluation increase.
Financial assets
Financial assets are classified as at fair value through profit or loss and loans and receivables.
Financial assets at fair value through profit or loss
Financial assets are classified as at fair value through profit or loss where the financial asset is designated as at fair value through profit or loss. Assets in this category are categorized as current assets.
Loans and receivables
Loans and receivables are non-derivative financial assets with fixed or determinable payments that are not quoted in an active market. They are included in current receivables, except for maturities greater than 12 months after the date of statement of financial position. These are classified as non-current assets. The Company’s loans and receivables comprise accounts receivable, finance receivables and other non-current and current assets and cash and cash equivalents in the statement of financial position.
Loans and receivables are initially measured at fair value and subsequently at amortized cost using the effective interest rate method.
ASML assesses at each date of statement of financial position whether there is objective evidence that a financial asset or a group of financial assets is impaired.
Impairment of financial assets
Financial assets, other than those at fair value through profit or loss, are assessed for indicators of impairment at each date of statement of financial position. Financial assets are impaired where there is objective evidence that, as a result of one or more events that occurred after the initial recognition of the financial asset, the estimated future cash flows of the investment have been impacted.
Financial liabilities and equity instruments issued by the Company
Financial liabilities and equity instruments issued by the Company are classified according to the substance of the contractual arrangements entered into and the definitions of a financial liability and an equity instrument.
Financial liabilities that are classified as fair value through profit or loss are categorized as current liabilities. An equity instrument is any contract that evidences a residual interest in the assets of the Company after deducting all of its liabilities. Equity instruments issued by the Company are recorded at the proceeds received, net of direct issue costs.
Financial liabilities at fair value through profit or loss are stated at fair value with any resultant gain or loss recognized in the income statement.
Derivative financial instruments and hedging activities
Derivatives are initially recognized at fair value on the date a derivative contract is entered into and are subsequently remeasured at their fair value. The method of recognizing the resulting gain or loss depends on whether the derivative is designated as a hedging instrument, and if so, the nature of the item being hedged. The Company designates certain derivatives as either:
| • | A hedge of the exposure to changes in the fair value of a recognized asset or liability, or of an unrecognized firm commitment, that are attributable to a particular risk (fair value hedge); or |
| • | A hedge of the exposure of variability in the cash flows of a recognized asset or liability, of a forecasted transaction, that is attributable to a particular risk (cash flow hedge). |
| • | A hedge of the foreign currency exposure of a net investment in a foreign operation (net investment hedge). |
The Company documents at the inception of the transaction the relationship between hedging instruments and hedged items, as well as its risk management objectives and strategy for undertaking various hedging transactions. The Company also documents its assessment, both at hedge inception and on an ongoing basis, of whether derivatives that are used in hedging transactions are highly effective in offsetting changes in fair values or cash flows of hedged items.
The fair values of various derivative instruments used for hedging purposes are disclosed in Note 4, Note 5, Note 12 and Note 13. Movements in the hedging reserve within equity are shown in Note 18. The fair value part of a derivative that
| ASML STATUTORY ANNUAL REPORT 2011 | 62 |
has a remaining term of less or equal to 12 months is classified as current asset or liability. When the fair value part of a derivative has a term of more than 12 months it is classified as non-current.
| ASML STATUTORY ANNUAL REPORT 2011 | 63 |
Fair value hedge
Changes in the fair value of a derivative that is designated and qualifies as a fair value hedge, along with the gain or loss on the hedged asset or liability, that is attributable to the hedged risk, are recorded in the income statement. The Company designates foreign currency hedging instruments as a hedge of the fair value of a recognized asset or liability in non-functional currencies. The gain or loss relating to the ineffective portion of foreign currency hedging instruments is recognized in the Consolidated Income Statement as “net sales” or “cost of sales”.
Hedge accounting is discontinued when the Company revokes the hedging relationship, the hedging instrument expires or is sold, terminated or exercised, or no longer qualifies for hedge accounting. The adjustment to the carrying amount of the hedged item arising from the hedged risk is amortized to the income statement from that date.
The gain or loss relating to the ineffective portion of foreign currency hedging instruments is recognized in the income statement as “net sales” or “cost of sales”.
Interest rate swaps that are being used to hedge the fair value of fixed loan coupons payable are designated as fair value hedges. The change in fair value is intended to offset the change in the fair value of the underlying fixed loan coupons, which is recorded accordingly. The gain or loss relating to the ineffective portion of interest rate swaps hedging fixed loan coupons payable is recognized in the income statement as “interest income” or “interest charges”.
Cash flow hedge
The effective portion of changes in the fair value of a derivative that is designated and qualifies as a cash flow hedge is recorded in the hedging reserve, within equity, until underlying hedged transaction is recognized in the income statement. However, when the forecasted transaction that is hedged results in the recognition of a non-financial asset or a non-financial liability, the gains and losses previously deferred in equity are transferred from equity and included in the initial measurement of the cost of the asset or liability. Hedge accounting is discontinued when the Company revokes the hedging relationship, the hedging instrument expires or is sold, terminated or exercised, or no longer qualifies for hedge accounting. Any cumulative gain or loss deferred in equity at that time remains in equity and is recognized when the forecasted transaction is ultimately recognized in the income statement. When a forecasted transaction is no longer expected to occur, the cumulative gain or loss that was deferred in equity is recognized immediately in the income statement.
Foreign currency hedging instruments that are being used to hedge cash flows relating to future sales or purchase transactions in non-functional currencies are designated as cash flow hedges. The gain or loss relating to the ineffective portion of the foreign currency hedging instruments is recognized in the income statement in “net sales” or “cost of sales”.
Interest rate swaps that are being used to hedge changes in the variability of future interest receipts are designated as cash flow hedges. The change in fair value is intended to offset the change in the fair value of the underlying assets, which is recorded accordingly in equity as hedging reserve. The maximum length of time of cash flow hedges is the time elapsed from the moment the exposure is generated until the actual settlement. The gain or loss relating to the ineffective portion of interest rate swaps hedging the variability of future interest receipts is recognized in the income statement “interest income” or “interest charges”.
Net investment hedge
Foreign currency hedging instruments that are being used to hedge changes in the value of a net investment are designated as net investment hedges. Changes in the fair value of a derivative that is designated and qualifies as a net investment hedge are recorded in the currency translation reserve within equity. The gain or loss relating to the ineffective portion is recognized in the consolidated income statement as “interest income” or “interest charges”. Gains and losses accumulated in equity are recognized in the consolidated income statement when the foreign operation is (partially) disposed or sold.
Inventories
Inventories are stated at the lower of cost (first-in-first-out method) or net realizable value. The costs of inventories comprise of net prices paid for materials purchased, charges for freight and customs duties, production labor cost and factory overhead. Net realizable value represents the estimated selling price less all estimated costs of completion and costs to be incurred in marketing, selling and distribution.
| ASML STATUTORY ANNUAL REPORT 2011 | 64 |
Inventory provisions are recognized for slow-moving, obsolete or unsellable inventory. Impairment losses for inventory are determined based on the expected demand which is derived from the sales forecasts as well as the expected market value of the inventory. A new assessment of net realizable value is made in each subsequent period. When the circumstances that previously caused inventories to be written down below cost no longer exist or when there is clear evidence of an increase in net realizable value because of changed economic circumstances, the amount of the write-down is reversed.
Accounts receivable
Accounts receivable are measured at initial recognition at fair value and are subsequently measured at amortized cost using the effective interest rate method, less allowance for doubtful debts. An allowance for doubtful debts of accounts receivable is established when there is objective evidence that the Company will not be able to collect all amounts due according to original terms of the receivables. Significant financial difficulties of the debtor, probability that the debtor will enter bankruptcy or financial restructuring and default or delinquency in payments are considered indicators that the accounts receivable are impaired. The allowance recognized is measured as the difference between the asset’s carrying amount and the present value of estimated future cash flows discounted at the effective interest rate computed at initial recognition.
Cash and cash equivalents
Cash and cash equivalents consist primarily of highly liquid investments, such as bank deposits, money market funds and interest-bearing bank accounts with insignificant interest rate risk and remaining maturities of three months or less at the date of acquisition.
Equity
Ordinary shares are classified as equity. Incremental costs directly attributable to the issue of new shares or options are shown in equity as a deduction, net of income taxes, from the proceeds.
Treasury shares are deducted from equity for the consideration paid, including any directly attributable incremental costs (net of income taxes), until the shares are cancelled or reissued. Where such shares are subsequently reissued, any consideration received, net of any directly attributable incremental transaction costs and related income tax effects is included in equity.
Provisions
Provisions are recognized when the Company has a present obligation (legal or constructive) as a result of a past event, it is probable that the Company will be required to settle the probable outflow of resources, and a reliable estimate can be made of the amount of the obligation.
The amount recognized as a provision is the best estimate of the consideration required to settle the present obligation at the statement of financial position date, taking into account the risks and uncertainties surrounding the obligation. Where a provision is measured using the cash flows estimated to settle the present obligation, its carrying amount is the present value of those cash flows.
When some or all of the economic benefits required to settle a provision are expected to be recovered from a third party, the receivable is recognized as an asset if it is virtually certain that reimbursements will be received and the amount of the receivable can be measured reliably.
Onerous contracts
Present obligations arising under onerous contracts are recognized and measured as provisions. Onerous contracts are considered to exist where the Company has a contract under which the unavoidable costs of meeting the obligations under the contract exceed the economic benefit expected to be received under the contract.
Accounts payable
Accounts payable are initially measured at fair value, and are subsequently measured at amortized cost, using the effective interest rate method.
Revenue recognition
In general, ASML recognizes the revenue from the sale of a system upon shipment and the revenue from the installation of a system upon completion of that installation at the customer site. Each system undergoes, prior to shipment, a “Factory Acceptance Test” in ASML’s cleanroom facilities, effectively replicating the operating conditions that will be present on the customer’s site, in order to verify whether the system will meet its standard specifications and any additional technical and performance criteria agreed with the customer. A system is shipped, and revenue is recognized, only after all specifications are met and customer sign-off is received or waived. In case not all specifications are met
| ASML STATUTORY ANNUAL REPORT 2011 | 65 |
and the remaining performance obligation is not essential to the functionality of the system but substantive rather than inconsequential or perfunctory a portion of the sales price is deferred. Although each system’s performance is re-tested upon installation at the customer’s site, the Company has never failed to successfully complete installation of a system at a customer’s premises.
In 2011, we recognized system sales revenue for three NXE:3100 systems that were installed at the customer location and were accepted by our customers, for an amount of EUR 119.3 million (2010: no revenue from new technology was recognized). This includes one NXE:3100 system for an amount of EUR 38.5 million that had been deferred in 2010 because the system had not yet been accepted by the customer. For the year 2010 we did not recognize any revenue from new technology that had previously been deferred. As of December 31, 2011, we deferred revenue from new technology systems for an amount of EUR 48.6 million, relating to one NXE:3100 system that has not been installed at the customer’s location.
In connection with the introduction of new technology, such as our second-generation EUV systems (NXE:3100), we initially defer revenue recognition until completion of installation and acceptance of the new technology based system at customer premises. As our systems are based largely on two product platforms that permit incremental, modular upgrades, the introduction of genuinely “new” technology occurs infrequently, and in the past 12 years, has occurred on only two occasions: 2010 (EUV) and 1999 (TWINSCAN).
With respect to the third-generation EUV systems (NXE:3300) that are expected to be available for shipment to customers from 2012 onwards, the Company is currently assessing the conditions upon which revenue would be recognized and whether or not amounts should be deferred. Any such deferral of revenues could have a material effect on ASML’s results of operations for the period in which the deferral occurred and on the succeeding periods.
ASML has no significant repurchase commitments in its general sales terms and conditions. From time to time the Company repurchases systems that it has manufactured and sold and, following refurbishment, resells those systems to other customers. This repurchase decision is driven by market demand expressed by other customers and not by explicit or implicit contractual arrangements relating to the initial sale. The Company considers reasonable offers from any vendor, including customers, to repurchase used systems so that it can refurbish, resell, and install these systems as part of its normal business operations. Once repurchased, the repurchase price of the used system is recorded in work-in-process inventory during the period it is being refurbished, following which the refurbished system is reflected in finished products inventory until it is sold to the customer. As of December 31, 2011 and 2010 ASML had no repurchase commitments.
A portion of the Company’s revenue is derived from contractual arrangements with its customers that have multiple deliverables, such as installation and training services, prepaid service contracts and prepaid extended optic warranty contracts. The revenue relating to the undelivered elements of the arrangements is deferred until delivery of these elements. Revenue from installation and training services is recognized when the services are completed. Revenue from prepaid extended and enhanced (optic) warranty contracts is recognized over the term of the contract.
The deferred revenue balance from installation and training services as of December 31, 2011 amounted to EUR 1.8 million (2010: EUR 10.1 million) and EUR 11.9 million (2010: EUR 12.7 million), respectively.
The deferred revenue balance from extended and enhanced (optic) warranty contracts as of December 31, 2011, amounted to EUR 280.1 million (2010: EUR 243.4 million).
We offer customers discounts in the normal course of sales negotiations. These discounts are directly deducted from the gross sales price at the moment of revenue recognition. From time to time, we offer volume discounts to certain customers. In some instances these volume discounts can be used to purchase field options (system enhancements). The related amount is recorded as a reduction in revenue at time of shipment. From time to time, we offer free or discounted products or services (award credits) to our customers as part of a volume purchase agreement. The sales transaction that gives rise to these award credits is accounted for as a multiple element revenue transaction as the agreements involve the delivery of multiple products. The consideration received from the sales transaction is allocated between the award credits and the other elements of the sales transaction. The consideration allocated to the award credits is recognized as deferred revenue until award credits are delivered to the customer. The amount allocable to a delivered item is limited to the amount that is not contingent upon the delivery of additional items or meeting other specified performance conditions (the non-contingent amount).
Revenues are recognized excluding the taxes levied on revenues (net basis).
| ASML STATUTORY ANNUAL REPORT 2011 | 66 |
In the event that an arrangement with a customer becomes onerous, the Company recognizes a liability for the amount that the cost of settling the arrangement exceeds the amount of the contract price. When the Company satisfies the onerous arrangement, it derecognizes the related liability.
Lease arrangements
If ASML has offered the customer a finance lease arrangement, revenue is recognized at commencement of the lease term. The present value of the lease payments is recognized as a finance receivable. The difference between the gross receivable and the present value of the receivable is recognized as unearned interest in the consolidated income statement. If ASML has offered its customers an operating lease arrangement, the contract consideration is recognized in the consolidated income statement on a straight-line basis over the period of the lease.
Warranty
The Company provides standard warranty coverage on our systems for 12 months and on certain optic parts for 60 months, providing labor and parts necessary to repair systems and optic parts during the warranty period. The estimated warranty costs are accounted for by accruing these costs for each system upon recognition of the system sale. The estimated warranty costs are based on historical product performance and field expenses. Based upon historical service records, the Company calculates the charge of average service hours and parts per system to determine the estimated warranty charge. On a semi-annual basis, the Company assesses, and updates if necessary, its accounting estimates used to calculate the standard warranty provision based on the latest actual historical warranty costs and expected future warranty costs. The extended and enhanced (optic) warranty on our systems and certain optical parts is accounted for as a separate element of multiple element revenue recognition transactions.
Accounting for shipping and handling fees and costs
ASML bills the customer for, and recognizes as revenue, any charges for shipping and handling costs. The related costs are recognized as cost of sales.
Cost of sales
Cost of system sales comprise direct product costs such as materials, labor, cost of warranty, depreciation, amortization, shipping and handling costs and related overhead costs. ASML accrues for the estimated cost of the warranty on its systems, which includes the cost of labor and parts necessary to repair systems during the warranty period. The amounts recorded in the warranty accrual are estimated based on actual historical expenses incurred and on estimated probable future expenses related to current sales. Actual warranty costs are charged against the accrued warranty reserve.
Costs of service sales comprise direct service costs such as materials, labor, depreciation and overhead costs.
Cost of field option sales comprise direct product costs such as materials, labor, cost of warranty, shipping and handling costs and related overhead costs.
Borrowing costs
Borrowing costs directly attributable to the acquisition, construction or production of qualifying assets, which are assets that necessarily take a substantial period of time to get ready for their intended use or sale, are added to the cost of those assets, until such time that the assets are substantially ready for their intended use or sale.
Government grants
Government grants are not recognized until there is reasonable assurance that ASML will comply with the conditions attaching to them and that the grants will be received.
Government grants whose primary condition is that ASML should purchase, construct or otherwise acquire non-current assets are recognized as deferred income in the statement of financial position and transferred to the income statement on a systematic and rational basis over the useful lives of the related assets.
Other government grants are recognized as income over the periods necessary to match them with the costs for which they are intended to compensate, on a systematic basis. Government grants that are receivable as compensation for expenses or losses already incurred, or for the purpose of giving immediate financial support to ASML with no future related costs are recognized in the income statement in the period in which they become receivable.
Income taxes
Income taxes represent the sum of the current tax position and deferred tax.
The current tax position is based on taxable base for the year. Taxable base differs from results as reported in the consolidated income statement because it excludes items of income or charges that are taxable or deductible in prior
| ASML STATUTORY ANNUAL REPORT 2011 | 67 |
or later years, for example timing differences between taxable base and financial results, and it further excludes items that are never taxable or deductible, for example permanent differences between taxable base and financial results. The Company’s tax position is calculated using tax rates that have been enacted or substantively enacted by the date of statement of financial position.
Deferred tax is recognized on differences between the carrying amounts of assets and liabilities in the financial statements and the corresponding tax base used in the computation of taxable profit, and is accounted for using the balance sheet liability method. Deferred tax liabilities are recognized for all taxable temporary differences and deferred tax assets are recognized to the extent that it is probable that taxable profits will be available against which deductible temporary differences can be utilized. Such assets and liabilities are not recognized if the temporary difference arises from goodwill or from the initial recognition (other than in a business combination) of other assets and liabilities in a transaction that affects neither the taxable profit nor the accounting profit.
The carrying amount of deferred tax assets is reviewed at each statement of financial position date and reduced to the extent that it is no longer probable that sufficient taxable profits will be available to allow all or part of the asset to be recovered.
Deferred tax assets and liabilities are measured at the tax rates that are expected to apply in the period in which the liability is settled or the asset realized, based on tax rates (and tax laws) that have been enacted or substantively enacted by the statement of financial position date. The measurement of deferred tax liabilities and assets reflects the tax consequences that would follow from the manner in which the Company expects, at the reporting date, to recover or settle the carrying amount of its assets and liabilities.
Deferred tax assets and liabilities are offset on the statement of financial position when there is a legally enforceable right to set off current tax assets against current tax liabilities and when they relate to income taxes levied by the same taxation authority and the Company intends to settle its current tax assets and liabilities on a net basis.
The Company recognizes a liability for uncertain tax positions when it is probable that an outflow of economic resources will occur. Measurement of the liability for uncertain tax positions is based on management’s best estimate of the amount of tax benefit that will be realized upon settlement.
The income statement effect of interest and penalties relating to liabilities for uncertain tax positions are presented based on their nature, as part of interest charges and as part of selling, general and administrative costs, respectively.
Current and deferred tax are recognized as an expense or income in the income statement, except when they relate to items credited or debited directly to equity, in which case the tax is also recognized directly in equity, or where they arise from the initial accounting for a business combination. In the case of a business combination, the tax effect is taken into account in calculating goodwill or in determining the excess of the Company’s interest in the net fair value of the acquired entity’s identifiable assets, liabilities and contingent liabilities over the cost of the business combination.
Contingencies and litigation
We are party to various legal proceedings generally incidental to our business, as disclosed in Note 25. In connection with these proceedings and claims, management evaluated, based on the relevant facts and legal principles, the likelihood of an unfavorable outcome and whether the amount of the loss could be reasonably estimated. In most cases, management determined that either a loss was not probable or was not reasonably estimable. In 2011, no estimated losses were recorded as a charge to the Company’s consolidated income statement (2010: EUR 1.5 million loss). Significant subjective judgments were required in these evaluations, including judgments regarding the validity of asserted claims and the likely outcome of legal and administrative proceedings. The outcome of these proceedings, however, is subject to a number of factors beyond our control, most notably the uncertainty associated with predicting decisions by courts and administrative agencies. In addition, estimates of the potential costs associated with legal and administrative proceedings frequently cannot be subjected to any sensitivity analysis, as damage estimates or settlement offers by claimants may bear little or no relation to the eventual outcome. Finally, in any particular proceeding, even where we believe that we would ultimately prevail, we may agree to settle or to terminate a claim or proceeding where we believe that doing so, when taken together with other relevant commercial considerations, is more cost-effective than engaging in expensive and protracted litigation, the outcome of which is uncertain.
We accrue legal costs related to litigation in our consolidated income statement at the time when the related legal services are actually provided to us.
| ASML STATUTORY ANNUAL REPORT 2011 | 68 |
Share-based payments
The cost of employee services received (compensation expenses) in exchange for awards of equity instruments are recognized based upon the grant-date fair value of stock options and shares. The grant-date fair value of stock options is estimated using a Black-Scholes option valuation model. This Black-Scholes model requires the use of assumptions, including expected share price volatility, the estimated life of each award and the estimated dividend yield. The risk-free interest rate used in the model is determined, based on an index populated with euro-denominated European government agency bond with AAA ratings, and with a life equal to the expected life of the equity-settled share-based payments. The grant-date fair value of shares is determined based on the closing price of the Company’s ordinary shares on NYSE Euronext in Amsterdam (“Euronext Amsterdam”) on the grant-date.
The grant-date fair value of the equity-settled share-based payments is expensed on a straight-line basis over the vesting period, based on the Company’s estimate of equity instruments that will eventually vest. At each statement of financial position date, the Company revises its estimate of the number of equity instruments expected to vest. The impact of the revision of the original estimates, if any, is recognized in the consolidated income statement in the period in which the revision is determined, with a corresponding adjustment to equity. The policy described above is applied to all equity-settled share-based payments that were granted after November 7, 2002 that vested after January 1, 2005. No amount has been recognized in the consolidated financial statements in respect of other equity-settled share based payments.
Our current share-based payment plans do not provide for cash settlement of options and stock.
Retirement benefit costs
Contributions to defined contribution retirement benefit plans are recognized as an expense when employees have rendered service entitling them to the contributions. Payments made to state-managed retirement benefit schemes are dealt with as payments to defined contribution plans where the Company’s obligations under the plans are equivalent to those arising in a defined contribution retirement benefit plan. ASML accounts for its multi-employer defined benefit plan as if it were a defined contribution plan as the pension union managing the plan is not able to provide ASML with the required Company-specific information to enable ASML to account for the plan as a defined benefit plan.
Consolidated statement of cash flows
The consolidated statement of cash flows has been prepared based on the indirect method. Cash flows in foreign currencies have been translated at average exchange rates. Exchange rate difference on cash and cash equivalents are shown separately in the consolidated statement of cash flows. Acquisitions of subsidiaries are presented net of cash balances acquired.
4. Fair Value Measurements
Fair value is the price that would be received to sell an asset or paid to transfer a liability in an orderly transaction between market participants at the measurement date. The fair value measurement hierarchy prioritizes the inputs to valuation techniques used to measure fair value as follows:
| • | Level 1: Valuations based on inputs such as quoted prices for identical assets or liabilities in active markets that the entity has the ability to access. |
| • | Level 2: Valuations based on inputs other than level 1 inputs such as quoted prices for similar assets or liabilities, quoted prices in markets that are not active, or other inputs that are observable or can be corroborated by observable data for substantially the full term of the assets or liabilities. |
| • | Level 3: Valuations based on inputs that are supported by little or no market activity and that are significant to the fair value of the assets or liabilities. |
The fair value hierarchy gives the highest priority to quoted prices (unadjusted) in active markets for identical assets or liabilities (Level 1) and the lowest priority to unobservable inputs (Level 3). A financial instrument’s fair value classification is based on the lowest level of any input that is significant in the fair value measurement hierarchy.
Financial assets and financial liabilities measured at fair value on a recurring basis
Investments in money market funds (as part of the Company’s cash and cash equivalents) have fair value measurements which are all based on quoted prices for similar assets or liabilities.
The principal market in which ASML executes its derivative contracts is the institutional market in an over-the-counter environment with a high level of price transparency. The market participants usually are large commercial banks. The valuation inputs for ASML’s derivative contracts are based on quoted prices and quoting pricing intervals from public data sources; they do not involve management judgment.
| ASML STATUTORY ANNUAL REPORT 2011 | 69 |
The valuation technique used to determine the fair value of forward contracts (used for hedging purposes) approximates the Net Present Value technique which is the estimated amount that a bank would receive or pay to terminate the forward contracts at the reporting date, taking into account current interest rates and current exchange rates.
The valuation technique used to determine the fair value of interest rate swaps (used for hedging purposes) is the Net Present Value technique which is the estimated amount that a bank would receive or pay to terminate the swap agreements at the reporting date, taking into account current interest rates.
The Eurobond serves as a hedged item in a fair value hedge relationship in which ASML hedges the variability of changes in the fair value of the Company’s Eurobond due to changes in market interest rates. The fair value changes of the interest rate swaps are recorded on the statement of financial position under derivative financial instruments (within other current and non-current assets). Therefore, the carrying amount is only adjusted for fair value changes in interest rate swaps. For the actual fair value, including credit risk considerations, see Note 19.
The following table presents the Company’s financial assets and financial liabilities that are measured at fair value on a recurring basis:
As of December 31, 2011 (in thousands) | Level 1 EUR | Level 2 EUR | Level 3 EUR | Total EUR | ||||||||||||
Assets | ||||||||||||||||
Derivative financial instruments 1 | — | 126,351 | — | 126,351 | ||||||||||||
Money market funds2 | 369,238 | — | — | 369,238 | ||||||||||||
|
|
|
|
|
|
|
| |||||||||
Total | 369,238 | 126,351 | — | 495,589 | ||||||||||||
Liabilities | ||||||||||||||||
Long term debt3 | — | 732,709 | — | 732,709 | ||||||||||||
Derivative financial instruments1 | — | 40,359 | — | 40,359 | ||||||||||||
|
|
|
|
|
|
|
| |||||||||
Total | — | 773,068 | — | 773,068 | ||||||||||||
|
|
|
|
|
|
|
| |||||||||
| 1 | Derivative financial instruments consist of forward contracts and interest rate swaps. See note 5. |
| 2 | Money market funds are part of the Company’s cash and cash equivalents. |
| 3 | Long-term debt mainly relates to the Company’s EUR 600.0 million Eurobond and excludes accrued interest. For further details see Note 19. |
As of December 31, 2010 (in thousands) | Level 1 EUR | Level 2 EUR | Level 3 EUR | Total EUR | ||||||||||||
Assets | ||||||||||||||||
Derivative financial instruments1 | — | 96,180 | — | 96,180 | ||||||||||||
Money market funds2 | 203,922 | — | — | 203,922 | ||||||||||||
|
|
|
|
|
|
|
| |||||||||
Total | 203,922 | 96,180 | — | 300,102 | ||||||||||||
Liabilities | ||||||||||||||||
Long term debt3 | — | 705,731 | — | 705,731 | ||||||||||||
Derivative financial instruments1 | — | 34,898 | — | 34,898 | ||||||||||||
|
|
|
|
|
|
|
| |||||||||
Total | — | 740,629 | — | 740,629 | ||||||||||||
|
|
|
|
|
|
|
| |||||||||
| 1 | Derivative financial instruments consist of forward contracts and interest rate swaps. See Note 5. |
| 2 | Money market funds are part of the Company’s cash and cash equivalents. |
| 3 | Long-term debt mainly relates to the Company’s EUR 600.0 million Eurobond and excludes accrued interest. For further details see Note 19. |
As of December 31, 2011, the Company did not have any assets or liabilities measured at fair value on a recurring basis using significant unobservable inputs (Level 3) in its statement of financial position.
5. Financial Risk Management
The Company is exposed to certain financial risks such as market risk (including foreign currency exchange risk and interest rate risk), credit risk, liquidity risk and capital risk. The overall risk management program focuses on the unpredictability of financial markets and seeks to minimize potentially adverse effects on the Company’s financial performance. The Company uses derivative instruments to hedge certain risk exposures. None of the transactions are entered into for trading or speculative purposes. We believe that market information is the most reliable and transparent measure for our derivative instruments that are measured at fair value.
| ASML STATUTORY ANNUAL REPORT 2011 | 70 |
Foreign currency risk management
The Company’s sales are predominately denominated in euros. Exceptions may occur on a customer by customer basis. Our cost of sales and other expenses are mainly denominated in euros, to a certain extent in U.S. dollar and Japanese yen and to a limited extent in other currencies. Therefore, the Company is exposed to foreign currency risk. It is the Company’s policy to hedge material transaction exposures, such as forecasted sales and purchase transactions, and material net remeasurement exposures, such as accounts receivable and payable. The Company hedges these exposures through the use of foreign exchange contracts.
As of December 31, 2011 shareholders’ equity includes EUR 4.9 million loss (net of taxes: EUR 4.4 million loss; 2010: EUR 35.9 million loss) representing the total anticipated loss to be charged to sales, and EUR 11.6 million gain (net of taxes: EUR 10.3 million gain; 2010: EUR 6.1 million loss) to be released to cost of sales, which will offset the EUR equivalent of foreign currency denominated forecasted sales and purchase transactions. All amounts are expected to be released over the next 12 months. The effectiveness of all contracts for which ASML applies hedge accounting is monitored on a quarterly basis throughout the life of the hedges. In 2011, a loss of EUR 0.2 million was recognized as a result of ineffective cash flow hedges related to forecasted sales transactions, no ineffectiveness was recognized relating to purchase transactions (2010: loss of EUR 0.4 million related to sales transactions).
It is the Company’s policy not to hedge currency translation exposures resulting from net equity investments in foreign subsidiaries. As an exception to the Company’s policy, during 2011, the Company entered into a net investment hedge in order to hedge a temporary U.S. dollar exposure by means of a forward foreign exchange contract. The net investment hedge, resulting in a negative effect in other comprehensive income in 2011 of EUR 1.9 million, was effective throughout its entire term. The temporary increase in the foreign exchange exposure and the related hedge ended in 2011.
Interest rate risk management
The Company has interest-bearing assets and liabilities that expose the Company to fluctuations in market interest rates. The Company uses interest rate swaps to align the interest-typical terms of interest-bearing assets with the interest-typical terms of interest-bearing liabilities. There may be residual interest rate risk to the extent the asset and liability positions do not fully offset.
As part of its hedging policy, the Company uses interest rate swaps to hedge changes in fair value of its Eurobond due to changes in market interest rates, thereby offsetting the variability of future interest receipts on part of its cash and cash equivalents. During 2011, the hedge was 100 percent effective in hedging the fair value exposure to interest rate movements. The changes in fair value of the Eurobond were included at the same time in the consolidated income statement as the changes in the fair value of the interest rate swaps.
Furthermore, as part of its hedging policy, the Company uses interest rate swaps to hedge the variability of future interest cash flows relating to certain of its operating lease obligations. During 2011, these hedges were 100 percent effective in hedging the cash flow exposure to interest rate movements.
Financial instruments
The Company uses forward foreign exchange contracts to manage its currency risk and interest rate swaps to manage its interest rate risk. The following table summarizes the notional amounts and estimated fair values of the Company’s financial instruments:
As of December 31 (in thousands) | 2011 Notional Amount EUR | Fair Value EUR | 2010 Notional Amount EUR | Fair Value EUR | ||||||||||||
Forward foreign exchange contracts1 | 389,579 | (23,999 | ) | (1,933 | ) | (28,974 | ) | |||||||||
Interest rate swaps2 | 641,500 | 109,991 | 641,500 | 90,256 | ||||||||||||
| 1 | Relates to forward contracts assigned as a hedge to forecasted sales and purchase transactions and to monetary assets and liabilities, mainly in U.S. dollar and Japanese Yen. |
| 2 | Relates to interest rate swaps assigned as a hedge to interest bearing assets and liabilities, mainly related to the Eurobond; the fair value of the interest rate swaps includes accrued interest. |
| ASML STATUTORY ANNUAL REPORT 2011 | 71 |
Sensitivity analysis financial instruments
Foreign currency sensitivity
ASML is mainly exposed to the fluctuations in exchange rates between the euro and each of U.S. dollar and Japanese yen. The following table details the Company’s sensitivity to a 10.0 percent strengthening of foreign currencies against the euro. The sensitivity analysis includes foreign currency denominated monetary items outstanding and adjusts their translation at the period end for a 10.0 percent strengthening in foreign currency rates. A positive amount indicates an increase in income before income taxes or equity, as shown.
| 2011 | 2010 | |||||||||||||||
(in thousands) | Impact on income before income taxes EUR | Impact on equity EUR | Impact on income before income taxes EUR | Impact on equity EUR | ||||||||||||
U.S. dollar | (2,134 | ) | 17,293 | (5,861 | ) | 25,858 | ||||||||||
Japanese yen | (902 | ) | (6,255 | ) | (4,207 | ) | (5,500 | ) | ||||||||
Other currencies | (3,628 | ) | — | (700 | ) | — | ||||||||||
|
|
|
|
|
|
|
| |||||||||
Total | (6,664 | ) | 11,038 | (10,768 | ) | 20,358 | ||||||||||
|
|
|
|
|
|
|
| |||||||||
It is the Company’s policy to limit the effects of currency exchange rate fluctuations on its consolidated income statement. The negative effect on income before income taxes as presented in the table above for 2011 and 2010 is mainly attributable to timing differences between the arising and hedging of exposures.
The decrease in the U.S. dollar and Japanese yen effect on income before income taxes in 2011 compared with 2010 reflects the Company’s lower net U.S. dollar and Japanese yen exposures at year end.
The revaluation effects of the fair value movements of cash flow hedges, entered into for U.S. dollar and Japanese yen transactions are recognized in other comprehensive income within equity. The decreased U.S. dollar effect on other comprehensive income in 2011 compared with 2010 is the result of lower U.S. dollar exposures.
For a 10.0 percent weakening of the foreign currencies against the euro, there would be approximately an equal but opposite effect on the income before income taxes.
Interest rate sensitivity
The sensitivity analysis below has been determined based on the exposure to interest rates for both derivatives and non-derivative instruments at the statement of financial position date with the stipulated change taking place at the beginning of the financial year and held constant throughout the reporting period. The table below shows the effect of a 1.0 percent point increase in interest rates on the Company’s income before income taxes and other comprehensive income, within equity. For a 1.0 percntn point decrease in interest rates there would be an approximately equal but opposite effect on income before income taxes and other comprehensive income, within equity. A positive amount indicates an increase in income before income taxes and other comprehensive income, within equity.
| 2011 | 2010 | |||||||||||||||
(in thousands) | Impact on income before income taxes EUR | Impact on equity EUR | Impact on income before income taxes EUR | Impact on equity EUR | ||||||||||||
| 21,020 | 1,691 | 13,274 | 1,986 | |||||||||||||
The positive effect on other comprehensive income, within equity, is mainly attributable to the fair value movements of the interest rate swaps designated as cash flow hedges. The effect on income before income taxes has increased, reflecting an increase in cash and cash equivalents in 2011 compared with 2010.
Credit risk management
Financial instruments that potentially subject ASML to significant concentrations of credit risk consist principally of cash and cash equivalents, derivative instruments used in hedging activities and accounts receivable.
Cash and cash equivalents and derivative instruments contain an element of risk of the counterparties being unable to meet their obligations. Our risk management program focuses appropriately on the current environment of uncertainty in the financial markets, especially in the euro-zone. ASML invests its cash and cash equivalents mainly in euro-denominated short-term deposits with high-rated financial institutions and the Dutch government, and partly in
| ASML STATUTORY ANNUAL REPORT 2011 | 72 |
euro-denominated AAAm-rated money market funds that invest in high-rated short-term debt securities of financial institutions and governments. To mitigate the risk that any of our counterparties in hedging transactions is unable to meet its obligations, ASML only enters into transactions with a limited number of major financial institutions that have high credit ratings and closely monitors the creditworthiness of its counterparties. Concentration risk is mitigated by limiting the exposure on a single counterparty.
ASML’s customers consist of Integrated Circuit (“IC”) manufacturers located throughout the world. ASML performs ongoing credit evaluations of its customers’ financial condition. ASML takes additional measures to mitigate credit risk when considered appropriate by means of e.g. down payments, letters of credit, and retention of ownership provisions in contracts. Retention of ownership enables ASML to recover the systems in the event a customer defaults on payment.
Liquidity risk management
ASML’s liquidity needs are affected by many factors, some of which are based on the normal ongoing operations of the business, and others that relate to the uncertainties of the global economy and the semiconductor industry. Since our cash requirements fluctuate based on the timing and extent of these factors, ASML seeks to ensure that its sources of liquidity will be sufficient to satisfy its liquidity requirements throughout every phase of the industry cycles.
ASML’s principal sources of liquidity consist of cash flows from operations, cash and cash equivalents and available credit facilities. In addition, ASML may from time to time raise additional capital in debt and equity markets. ASML’s goal is to remain an investment grade rated company and maintain a capital structure that supports this. ASML intends to return cash to its shareholders on a regular basis in the form of dividend payments and, subject to our actual and anticipated liquidity requirements and other relevant factors, share buy backs or repayment of capital.
Liquidity and Capital risk management
Our liquidity needs are affected by many factors, some of which are based on the normal ongoing operations of the business, and others that relate to the uncertainties of the global economy and the semiconductor industry. Although our cash requirements fluctuate based on the timing and extent of these factors, we believe that cash generated from operations, together with the liquidity provided by existing cash balances and our borrowing capability are sufficient to satisfy our requirements, including our 2012 capital expenditures. We intend to return cash to our shareholders on a regular basis in the form of dividend payments and, subject to our actual and anticipated liquidity requirements and other relevant factors, share buy backs or repayment of capital.
The Company’s liquidity analysis consists of the following derivative financial instruments::
(in thousands) | Total EUR | Less than 1 year EUR | 1-3 years EUR | 3-5 years EUR | After 5 years EUR | |||||||||||||||
Cash outflows | ||||||||||||||||||||
Currency contracts | 799,579 | 799,579 | — | — | — | |||||||||||||||
Interest rate swaps | 737,381 | 30,700 | 28,699 | 40,118 | 637,864 | |||||||||||||||
Cash inflows | ||||||||||||||||||||
Currency contracts | 775,956 | 775,956 | — | — | — | |||||||||||||||
Interest rate swaps | 851,623 | 51,469 | 69,602 | 70,090 | 660,462 | |||||||||||||||
For more information on the Company’s contractual obligations see Note 24.
6. Critical Accounting Judgments and Key Sources of Estimation Uncertainty
In the process of applying the Company’s accounting policies, which are described in Note 3, management has made some judgments that have significant effect on the amounts recognized in the financial statements. These also include key assumptions concerning the future, and other key sources of estimation uncertainty at the statement of financial position date, that have a significant risk of causing a material adjustment to the carrying amounts of assets and liabilities within the next financial year.
Revenue Recognition
We refer to Note 3.
| ASML STATUTORY ANNUAL REPORT 2011 | 73 |
Warranty
We provide standard warranty coverage on our systems for 12 months and on certain optic parts for 60 months, providing labor and parts necessary to repair systems and optic parts during the warranty period. The estimated warranty costs are accounted for by accruing these costs for each system upon recognition of the system sale. The estimated warranty costs are based on historical product performance and field expenses. Based upon historical service records, we calculate the charge of average service hours and parts per system to determine the estimated warranty charge. On a semi-annual basis, the Company assesses, and updates if necessary, its accounting estimates used to calculate the standard warranty reserve based on the latest actual historical warranty costs and expected future warranty costs. The actual product performance and/or field expense profiles may differ, and in those cases we adjust our warranty reserves accordingly. Future warranty costs may exceed our estimates, which could lead to an increase in our cost of sales. In 2011 and 2010, the reassessments of the warranty reserve, and resulting change in accounting estimate, did not have a material effect on the Company’s consolidated income statement and per-share amounts.
Impairment of non-financial assets
Non-financial assets include goodwill, other intangible assets and property, plant and equipment.
At each reporting date, the Company reviews the carrying amounts of its tangible and intangible assets (other than goodwill) to determine whether there is any indication that those assets have suffered an impairment loss. If any such indication exists, the recoverable amount of the asset is estimated in order to determine the extent of the impairment loss (if any). Where it is not possible to estimate the recoverable amount of an individual asset, the Company estimates the recoverable amount of the cash-generating unit to which the asset belongs. Where a reasonable and consistent basis of allocation can be identified, corporate assets are also allocated to individual cash-generating units, or otherwise they are allocated to the smallest group of cash-generating units for which a reasonable and consistent allocation basis can be identified.
Intangible assets with indefinite useful lives and intangible assets not yet available for use are tested for impairment annually, and whenever there is an indication that the asset may be impaired.
Recoverable amount is the higher of fair value less costs to sell and value in use. If the recoverable amount of an asset (or cash-generating unit) is estimated to be less than its carrying amount, the carrying amount of the asset (or cash-generating unit) is reduced to its recoverable amount. An impairment loss is recognized immediately in profit or loss, unless the relevant asset is carried at a revalued amount, in which case the impairment loss is treated as a revaluation decrease.
During 2011, we recorded impairment charges of EUR 12.3 million in property, plant and equipment of which we recorded EUR 6.2 million in cost of sales, EUR 3.5 million in R&D costs and EUR 2.6 million in SG&A costs. The impairment charges recorded in 2011 mainly related to machinery and equipment and furniture, fixture and other equipment (EUR 9.5 million) with respect to technical equipment and software which are ceased to be used. The impairment charges were determined based on the difference between the assets’ recoverable amount (being EUR 1.9 million) and their carrying amount. We did not record any impairment charges in other intangible assets.
Capitalization of development expenditures
In determining the development expenditures to be capitalized, ASML makes estimates and assumptions based on expected future economic benefits generated by products that are the result of these development expenditures. Other important estimates and assumptions in this assessment process are the required internal rate of return, the distinction between R&D and the estimated useful life.
Accounts receivable
A majority of our accounts receivable are derived from sales to a limited number of large multinational semiconductor manufacturers throughout the world. In order to monitor potential credit losses, we perform ongoing credit evaluations of our customers’ financial condition. An allowance for doubtful accounts is maintained for potential credit losses based upon management’s assessment of the expected collectability of all accounts receivable. The allowance for doubtful accounts is reviewed periodically to assess the adequacy of the allowance. In making this assessment, management takes into consideration (i) any circumstances of which we are aware regarding a customer’s inability to meet its financial obligations; and (ii) our judgments as to potential prevailing economic conditions in the industry and their potential impact on the Company’s customers. Where we deem it prudent to do so, we may require some form of credit enhancement, such as letters of credit, down payments and retention of ownership provisions in contracts, before shipping systems to certain customers, which are intended to recover the systems in the event a customer defaults on payment. We have not incurred any material accounts receivable credit losses during the past three years. Our three largest customers (based on net sales) accounted for 40.7 percent of accounts receivable at December 31, 2011, compared with 42.4 percent at December 31, 2010. A business failure of one of our main customers could result in a
| ASML STATUTORY ANNUAL REPORT 2011 | 74 |
substantial credit loss in respect to amounts owed to the Company by that customer, which could adversely affect our business, financial condition and results of operations.
Provisions
Provisions are recognized when the Company has a present obligation (legal or constructive) as a result of a past event, it is probable that the Company will be required to settle the probable outflow of resources, and a reliable estimate can be made of the amount of the obligation.
Present obligations arising under onerous contracts are recognized and measured as provisions. Onerous contracts are considered to exist where the Company has a contract under which the unavoidable costs of meeting the obligations under the contract exceed the economic benefit expected to be received under the contract. As of December 31, 2011, the provision for onerous contracts amounts to EUR 12.3 million (2010: EUR 14.1 million) and relates to an operating lease contract for a building for which no economic benefits are expected.
Inventories
Inventories are stated at the lower of cost (first-in-first-out method) or net realizable value. The cost of inventories comprise net prices paid for materials purchased, charges for freight and customs duties, production labor cost and factory overhead. Net realizable value represents the estimated selling price less all estimated costs of completion and costs to be incurred in marketing, selling and distribution.
Inventory provisions are recognized for slow-moving, obsolete or unsellable inventory and are reviewed on a quarterly basis. Our methodology involves matching our on hand and on-order inventory with our manufacturing forecast. In determining inventory provisions, we evaluate inventory in excess of our forecasted needs on both technological and economic criteria and make appropriate provisions to reflect the risk of obsolescence. This methodology is significantly affected by our forecasted needs for inventory. If actual demand or usage were to be lower than estimated, additional inventory provisions for excess or obsolete inventory may be required, which could have a material adverse effect on our business, financial condition and results of operations.
As of December 31, 2011, the provision for inventory obsolescence amounted to EUR 185.5 million (2010: EUR 186.3 million). The 2011 addition for the year mainly relates to certain obsolete parts due to technological developments and design changes. In 2010, the addition was mainly due to a reassessment by the Company of expected future demand based on the unexpected customers’ response to the financial and economic crisis.
In 2011 ASML released EUR 7.9 million from the provision for obsolete inventory as a result of a subsequent increase in net realizable value (2010: EUR 32.8 million).
Contingencies and Litigation
See Note 3.
Share-based payments
The cost of employee services received (compensation expenses) in exchange for awards of equity instruments are recognized based upon the grant date fair value of stock options and shares. The grant date fair value of stock options is estimated using a Black-Scholes option valuation model. This Black-Scholes option valuation model requires the use of assumptions, including expected stock price volatility, the estimated life of each award and the estimated dividend yield. The risk-free interest rate used in the model is determined, based on a euro government bond with a life equal to the expected life of the equity-settled share-based payments. See Note 23 for further details re the assumptions used in the pricing model.
The total gross amount of recognized expenses associated with share-based payments was EUR 12.4 million in 2011 (2010: EUR 12.1 million).
Our current share-based payment plans do not provide for cash settlement of options and shares.
Income taxes
We operate in various tax jurisdictions in Asia, the United States and Europe and must comply with the tax laws of each of these jurisdictions.
Deferred tax assets and liabilities are measured at the tax rates that are expected to apply in the period in which the liability is settled or the asset realized, based on tax rates (and tax laws) that have been enacted or substantively enacted by the statement of financial position date. The measurement of deferred tax liabilities and assets reflects the
| ASML STATUTORY ANNUAL REPORT 2011 | 75 |
tax consequences that would follow from the manner in which the Company expects, at the reporting date, to recover or settle the carrying amount of its assets and liabilities.
We continuously assess our ability to realize our deferred tax assets resulting, among others, from net operating loss carry-forwards. The total amount of tax effect of the loss carry-forwards as of December 31, 2011 was EUR 7.7 million, which resides with ASML US, Inc. and US based subsidiaries of ASML US Inc. We believe that all losses will be offset by future taxable income before our ability to utilize those losses expires. This analysis takes into account our projected future taxable operating income and possible tax planning alternatives available to us.
The calculation of our tax liabilities involves uncertainties in the application of complex tax laws. Our estimate for the potential outcome of any uncertain tax position is highly judgmental. However, we believe that we have adequately provided for uncertain tax positions. Settlement of these uncertainties in a manner inconsistent with our expectations could have a material impact on our results of operations, financial condition and cash flows. The Company recognizes a liability for uncertain tax positions when it is probable that an outflow of economic resources will occur. Measurement of the liability for uncertain tax positions is based on management’s best estimate of the amount of tax benefit that will be realized upon settlement.
The Company provides for the uncertain tax positions for the duration of the statute of limitations which differs per tax jurisdiction and generally ranges up to seven years, or in case of an earlier settlement, when the uncertain tax position is settled with the tax authorities before the statute of limitations period lapses. As of December 31, 2011 the liability for uncertain tax positions amounts to EUR 155.4 million (December 31, 2010: EUR 162.1 million). In 2011, the total liability for uncertain tax positions is classified as non-current deferred and other tax liabilities because payment of cash is not expected within one year. The total liability for uncertain tax positions, if reversed, would have a favorable effect on the Company’s effective tax rate.
The Company estimates that the total liability for uncertain tax positions will decrease by EUR 10.1 million within the next 12 months. The estimated changes to the liability for uncertain tax positions within the next 12 months are mainly due to expected settlements and expiration of statute of limitations.
The Company is subject to tax audits in its major tax jurisdictions for years from and including 2007 onwards in the Netherlands, for years from and including 2004 onwards in Hong Kong, and for years from and including 2001 onwards for the United States. In the course of such audits, local tax authorities may challenge the positions taken by the Company. For the years 2004 through 2010, the exemption of taxable profits is subject to tax audits in certain tax jurisdictions.
In December 2010, ASML reached agreement with the Dutch fiscal authorities regarding the application of the “Innovation Box”, a facility under Dutch corporate tax law pursuant to which income associated with R&D is partially exempted from taxation. This tax ruling has retroactive effect to January 1, 2007 and is valid through December 31, 2016. Thereafter the validity of this ruling may be extended or this ruling may be adapted depending on a possible change of circumstances.
| ASML STATUTORY ANNUAL REPORT 2011 | 76 |
7. Earnings per share
The earnings per share (“EPS”) data have been calculated in accordance with the following schedule:
As of December 31 (in thousands, except per share data) | 2011 EUR | 2010 EUR | ||||||
Net income | 1,494,071 | 985,453 | ||||||
Weighted average number of shares outstanding (after deduction of treasury stock) during the year | 425,618 | 435,146 | ||||||
Basic net income per ordinary share | 3.51 | 2.26 | ||||||
Weighted average number of shares: | 425,618 | 435,146 | ||||||
Plus shares applicable to: | ||||||||
Stock options / Restricted shares1 | 3,435 | 3,832 | ||||||
|
|
|
| |||||
Dilutive potential common shares | 3,435 | 3,832 | ||||||
|
|
|
| |||||
Adjusted weighted average number of shares | 429,053 | 438,978 | ||||||
Diluted earnings per share1 | 3.48 | 2.24 | ||||||
| 1 | The calculation of diluted net income per ordinary share assumes the exercise of options issued under ASML stock option plans and the issuance of shares under ASML share plans for periods in which exercises or issuances would have a dilutive effect. The calculation of diluted net income per ordinary share does not assume exercise of such options or issuance of shares when such exercises or issuance would be anti-dilutive. |
| ASML STATUTORY ANNUAL REPORT 2011 | 77 |
8. Property, Plant and Equipment
Property, plant and equipment consist of the following:
(in thousands) | Land, buildings and constructions EUR | Machinery and equipment EUR | Leasehold improvements EUR | Furniture, fixtures and other equipment EUR | Total EUR | |||||||||||||||
Cost | ||||||||||||||||||||
Balance, January 1, 2010 | 482,233 | 543,415 | 154,966 | 286,484 | 1,467,098 | |||||||||||||||
Additions | 38,528 | 244,123 | 31,015 | 29,129 | 342,795 | |||||||||||||||
Disposals | (2,876 | ) | (197,462 | ) | (1,103 | ) | (1,844 | ) | (203,285 | ) | ||||||||||
Effect of exchange rates | 8,970 | 19,177 | 757 | 2,475 | 31,379 | |||||||||||||||
|
|
|
|
|
|
|
|
|
| |||||||||||
Balance, December 31, 2010 | 526,855 | 609,253 | 185,635 | 316,244 | 1,637,987 | |||||||||||||||
Additions | 213,513 | 355,358 | 20,918 | 29,314 | 619,103 | |||||||||||||||
Disposals | — | (212,286 | ) | (216 | ) | (1,619 | ) | (214,121 | ) | |||||||||||
Effect of exchange rates | 1,773 | 11,698 | 323 | 1,040 | 14,834 | |||||||||||||||
|
|
|
|
|
|
|
|
|
| |||||||||||
Balance, December 31, 2011 | 742,141 | 764,023 | 206,660 | 344,979 | 2,057,803 | |||||||||||||||
Accumulated depreciation | ||||||||||||||||||||
Balance, January 1, 2010 | 92,043 | 342,920 | 114,929 | 254,992 | 804,884 | |||||||||||||||
Depreciation | 28,125 | 83,397 | 14,919 | 21,548 | 147,989 | |||||||||||||||
Impairment charges | 6,673 | 1,178 | 500 | 212 | 8,563 | |||||||||||||||
Disposals | (1,328 | ) | (78,663 | ) | (1,045 | ) | (1,696 | ) | (82,732 | ) | ||||||||||
Effect of exchange rates | 1,996 | 9,194 | 438 | 2,324 | 13,952 | |||||||||||||||
|
|
|
|
|
|
|
|
|
| |||||||||||
Balance, December 31, 2010 | 127,509 | 358,026 | 129,741 | 277,380 | 892,656 | |||||||||||||||
Depreciation | 27,362 | 99,968 | 13,128 | 17,575 | 158,033 | |||||||||||||||
Impairment charges | — | 3,508 | 2,789 | 5,975 | 12,272 | |||||||||||||||
Disposals | — | (64,417 | ) | (41 | ) | (988 | ) | (65,446 | ) | |||||||||||
Effect of exchange rates | 1,006 | 4,715 | 158 | 799 | 6,678 | |||||||||||||||
|
|
|
|
|
|
|
|
|
| |||||||||||
Balance, December 31, 2011 | 155,877 | 401,800 | 145,775 | 300,741 | 1,004,193 | |||||||||||||||
Carrying amount | ||||||||||||||||||||
December 31, 2010 | 399,346 | 251,227 | 55,894 | 38,864 | 745,331 | |||||||||||||||
December 31, 2011 | 586,264 | 362,223 | 60,885 | 44,238 | 1,053,610 | |||||||||||||||
As of December 31, 2011, the carrying amount includes assets under construction for land, buildings and constructions of EUR 165.0 million (2010: EUR 31.8 million), machinery and equipment of EUR 16.6 million (2010: EUR 16.3 million), leasehold improvements of EUR 1.3 million (2010: EUR 29.1 million) and furniture, fixtures and other equipment of EUR8.0 million (2010: EUR 6.9 million). As of December 31, 2011, the carrying amount of land amounts to EUR 51.1 million (2010: EUR 36.1 million).
The majority of the additions and disposals in 2011 and 2010 relate to machinery and equipment (including operating leases, prototypes, evaluation and training systems). These systems are similar to those that ASML sells in its ordinary course of business. The systems are capitalized under property, plant and equipment because they are held for own use, for rental and for evaluation purposes. These systems are recorded at cost and depreciated over their expected useful life. From the time that these assets are no longer held for use but intended for sale in the ordinary course of business, they are reclassified from property, plant and equipment to inventory at the lower of their carrying value or fair market value. Since the transfers between inventory and property, plant and equipment are non-cash events, these are not reflected in the consolidated statement of cash flows. An amount of EUR 300.5 million (2010: EUR 214.1 million) of the additions relates to non-cash transfers from inventory and an amount of EUR 17.7 million relates to other non-cash movements (mainly investments not yet paid). An amount of EUR 145.3 million (2010: EUR 110.4 million) of the disposals relates to non-cash transfers to inventory. When sold, the proceeds and cost of these systems are recorded as net sales and cost of sales, respectively, identical to the treatment of other sales transactions. The cost of sales for these systems includes the inventory value and the additional costs of refurbishing (materials and labor).
The impairment charges recorded in 2011 mainly related to machinery and equipment and furniture, fixtures and other equipment (EUR 9.5 million). The Company recorded impairment charges with respect to technical equipment and software which are ceased to be used. The impairment charges were determined based on the difference between the assets’ value in use (being EUR 1.9 million) and their carrying amount.
The impairment charges recorded in 2010 mainly related to buildings and constructions (EUR 6.7 million). The Company recorded impairment charges with respect to several technical infrastructure items which are ceased to be used due to technical changes relating to NXE (EUV) development. The impairment charges were determined based on the difference between the assets’ value in use (being EUR 0.4 million) and their carrying amount.
| ASML STATUTORY ANNUAL REPORT 2011 | 78 |
In determining the fair value of an asset, the Company makes estimates about future cash flows. These estimates are based on the Company’s financial plan updated with the latest available projection of semiconductor market conditions and the Company’s sales and cost expectations which are consistent with the plans and estimates that it uses to manage its business.
As of December 31, 2011, the carrying amount of machinery and equipment includes an amount of EUR 201.4 million with respect to evaluation and operating lease systems (2010: EUR 63.0 million).
During 2011, the Company recorded impairment charges of EUR 12.3 million (2010: EUR 8.6 million) of which it recorded EUR 6.2 million (2010: EUR 7.3 million) in cost of sales, EUR 3.5 million (2010: EUR 0.7 million) in R&D costs and EUR 2.6 million (2010: EUR 0.6 million) in SG&A costs.
During 2011, the Company recorded depreciation charges of EUR 158.0 million (2010: EUR 148.0 million) of which it recorded EUR 117.7 million (2010: EUR 108.7 million) in cost of sales, EUR 24.9 million (2010 EUR 20.1 million) in R&D costs and EUR 15.4 million (2010: EUR 19.2 million) in SG&A costs.
Special Purpose Entity
The carrying amount of land, buildings and constructions includes an amount of EUR 33.8 million (2010: EUR 35.2 million) relating to the Company’s headquarters in Veldhoven, the Netherlands, which is owned by Koppelenweg II B.V., a Special Purpose Entity (‘SPE’).
In 2003, the Company moved to its current Veldhoven headquarters. The Company is leasing these headquarters for a period of 15 years (from 2003) from an entity (“lessor”) that was incorporated by a syndicate of three banks (“shareholders”) solely for the purpose of leasing this building. The lessor’s shareholders equity amounts to EUR 1.9 million and did not change since 2003.
The shareholders each granted a loan of EUR 11.6 million and a fourth bank granted a loan of EUR 12.3 million (EUR 47.1 million in total) to the parent of the lessor. ASML provided the parent of the lessor with a subordinated loan of EUR 5.4 million and has a purchase option that is exercisable either at the end of the lease in 2018, at a pre-determined price of EUR 24.5 million, or during the lease at a price equal to the book value of the assets. The total assets of the lessor entity amounted to EUR 54.5 million at inception of the lease. The entity is determined to be a SPE because the equity investors do not have sufficient equity at risk for the legal entity to finance its activities without sufficient additional subordinated support.
The primary purpose for which the SPE was created was to provide ASML with use of the building for 15 years, where ASML does not retain substantially all the risks and rewards from changes in value of the building. The main activities of the entity are to rent, re-market and ultimately sell the building that is owned by the SPE. The economic performance of the SPE is most significantly impacted by the ability of the lessee (ASML) to exercise the call option at any time during the lease term, and thus the Company could potentially benefit from increases in the fair value of the building.
While the debt holders have an interest, and may absorb losses, and the equity holders have an interest and may receive benefits, they do not have the power to direct activities that most significantly impact the entity’s economic performance and therefore, cannot be the primary beneficiary. Through the pre-determined price of the call option ASML has the power over the SPE, therefore only ASML meets both the power and losses/benefit criterion and consolidates the SPE.
| ASML STATUTORY ANNUAL REPORT 2011 | 79 |
9. Goodwill
Changes in goodwill are summarized as follows:
(in thousands) | 2011 EUR | 2010 EUR | ||||||
Cost | ||||||||
Balance, January 1 | 150,071 | 139,636 | ||||||
Effect of exchange rates | 5,053 | 10,435 | ||||||
|
|
|
| |||||
Balance, December 31 | 155,124 | 150,071 | ||||||
Carrying amount, December 31 | 155,124 | 150,071 | ||||||
The goodwill relates to the acquisition of Brion in March 2007. Goodwill is tested annually for impairment on September 30. For the purpose of impairment testing, goodwill is allocated to the cash-generating unit Brion. The recoverable amount of the cash-generating unit Brion is calculated based on the value in use. These calculations use pre-tax discounted cash flow projections based on a strategic plan approved by management.
The material assumptions used by management for the value in use calculation of the cash-generating unit (based on past experience) are:
| • | The pre-tax cash flow projections for the coming five years are based on a significant growth scenario, reflecting the start-up nature of Brion. Projections are built bottom-up, using estimates for revenue, gross profit, R&D costs and SG&A costs. |
| • | Brion would reach maturity in the final year of this five year period and grow at a weighted average growth rate of three percent from then onwards, which Management believes is a reasonable estimate that does not exceed the long-term historical average growth rate for the lithography business in which Brion operates. |
| • | A pre-tax discount rate of 21.0 percent representing Brion’s weighted average cost of capital (“WACC”) based on markets participants’ view, was determined using an adjusted version of the Capital Asset Pricing Model. The discount rate increased reflecting management’s assessment of increased market uncertainty. |
ASML performed sensitivity analyses on each of these assumptions and concluded that any reasonably likely change in these assumptions would not have caused the carrying amount of Brion to exceed its value in use. A discussion of the sensitivity analysis is set out below:
| • | Estimated cash flows associated with Brion’s operations after the coming five year period accounted for approximately 46.6 percent of the cash-generating unit’s value in use, based on the assumed three percent growth rate. Assuming Management’s estimate of cash flows for the five year period is unchanged; growth in subsequent years could reduce to zero percent without Brion’s value in use falling below its carrying amount of EUR 154.6 million. Management does not believe, however, that such a long-term no growth scenario is reasonably likely, given that the long-term historical growth rate of the lithography industry exceeds three percent. |
| • | The estimated cash flows associated with Brion’s initial five year period including the estimated cash flows after the initial five year period, could be reduced to 41.0 percent without causing the fair value of Brion to decrease below its carrying amount of EUR 154.6 million. Management does not believe that such a decline is reasonably likely based on Management’s future expectations on the development of these cash flows. |
| • | The pre-tax discount rate used in the value in use calculation could increase from 21.0 percent to 32.3 percent without causing the value in use of Brion to decrease below its carrying amount. |
| ASML STATUTORY ANNUAL REPORT 2011 | 80 |
10. Other intangible assets
Development expenditures | Intellectual property | Developed technology | Customer relationships | In-process R&D | Other | Total | ||||||||||||||||||||||
(in thousands) | EUR | EUR | EUR | EUR | EUR | EUR | EUR | |||||||||||||||||||||
Cost | ||||||||||||||||||||||||||||
Balance, January 1, 2010 | 667,065 | 47,250 | 24,495 | 8,263 | 21,230 | 2,196 | 770,499 | |||||||||||||||||||||
Additions | 55,388 | — | — | — | — | — | 55,388 | |||||||||||||||||||||
Effect of exchange rates | 1,903 | — | 1,388 | 470 | 1,587 | 35 | 5,383 | |||||||||||||||||||||
|
|
|
|
|
|
|
|
|
|
|
|
|
| |||||||||||||||
Balance, December 31, 2010 | 724,356 | 47,250 | 25,883 | 8,733 | 22,817 | 2,231 | 831,270 | |||||||||||||||||||||
Additions | 98,086 | — | — | — | — | — | 98,086 | |||||||||||||||||||||
Effect of exchange rates | 2,179 | — | — | — | 769 | — | 2,948 | |||||||||||||||||||||
|
|
|
|
|
|
|
|
|
|
|
|
|
| |||||||||||||||
Balance, December 31, 2011 | 824,621 | 47,250 | 25,883 | 8,733 | 23,586 | 2,231 | 932,304 | |||||||||||||||||||||
Accumulated depreciation | ||||||||||||||||||||||||||||
Balance, January 1, 2010 | 350,406 | 47,013 | 12,268 | 2,927 | 9,081 | 1,868 | 423,563 | |||||||||||||||||||||
Amortization | 106,690 | 211 | 4,052 | 1,084 | 5,876 | 108 | 118,021 | |||||||||||||||||||||
Impairment charges | 10,975 | — | — | — | — | — | 10,975 | |||||||||||||||||||||
Effect of exchange rates | 249 | — | 723 | 174 | 509 | 18 | 1,673 | |||||||||||||||||||||
|
|
|
|
|
|
|
|
|
|
|
|
|
| |||||||||||||||
Balance, December 31, 2010 | 468,320 | 47,224 | 17,043 | 4,185 | 15,466 | 1,994 | 554,232 | |||||||||||||||||||||
Amortization | 97,337 | 4 | 4,080 | 1,092 | 5,470 | 109 | 108,092 | |||||||||||||||||||||
Effect of exchange rates | 1,047 | — | — | — | 945 | — | 1,992 | |||||||||||||||||||||
|
|
|
|
|
|
|
|
|
|
|
|
|
| |||||||||||||||
Balance, December 31, 2011 | 566,704 | 47,228 | 21,123 | 5,277 | 21,881 | 2,103 | 664,316 | |||||||||||||||||||||
Carrying amount | ||||||||||||||||||||||||||||
December 31, 2010 | 256,036 | 26 | 8,840 | 4,548 | 7,351 | 237 | 277,038 | |||||||||||||||||||||
December 31, 2011 | 257,917 | 22 | 4,760 | 3,456 | 1,705 | 128 | 267,988 | |||||||||||||||||||||
Development expenditures mainly relate to the capitalized expenditures regarding the Company’s core programs: immersion, EUV and holistic lithography solutions.
Intellectual property relates to licenses and patents purchased from third parties. Developed technology, customer relationships, in-process R&D and other were obtained in the acquisition of Brion.
During 2011, we recorded amortization charges of EUR 108.1 million (2010: EUR 118.0 million) which were fully recorded in cost of sales in 2011 and 2010.
During 2011 and 2010, we did not capitalize borrowing costs.
Estimated amortization expenses relating to intangible assets for the next five years and thereafter are as follows:
| (in thousands) | EUR | |||
2012 | 106,659 | |||
2013 | 112,096 | |||
2014 | 33,669 | |||
2015 | 15,558 | |||
2016 | 4 | |||
Thereafter | 2 | |||
|
| |||
Total | 267,988 | |||
|
| |||
| ASML STATUTORY ANNUAL REPORT 2011 | 81 |
11. Finance receivables
Finance receivables consist of the net investment in finance leases. The following table lists the components of the finance receivables as of December 31, 2011 and 2010:
As of December 31 (in thousands) | 2011 EUR | 2010 EUR | ||||||
Finance receivables, gross | 78,853 | 48,398 | ||||||
Unearned interest | — | (6,845 | ) | |||||
|
|
|
| |||||
Finance receivables, net | 78,853 | 41,553 | ||||||
Current portion of finance receivables, gross | 78,853 | 16,594 | ||||||
Current portion of unearned interest | — | (3,946 | ) | |||||
|
|
|
| |||||
Non-current portion of finance receivables, net | — | 28,905 | ||||||
|
|
|
| |||||
At December 31, 2011, the finance receivables due for payment in each of the next five years and thereafter are as follows:
| (in thousands) | EUR | |||
2012 | 78,853 | |||
2013 | — | |||
2014 | — | |||
2015 | — | |||
2016 | — | |||
Thereafter | — | |||
|
| |||
Finance receivables, gross | 78,853 | |||
|
| |||
| ASML STATUTORY ANNUAL REPORT 2011 | 82 |
12. Financial instruments by category
The accounting policies for financial instruments have been applied to the line items below and represent the fair value of these financial instruments:
As of December 31, 2011 (in thousands) | Derivatives at fair value through profit or loss EUR | Derivatives for which hedge accounting is applied EUR | Financial assets at fair value through profit or loss EUR | Loans and receivables EUR | Total EUR | |||||||||||||||
Assets as per statement of financial position date | ||||||||||||||||||||
Derivative financial instruments | 1,095 | 125,256 | — | — | 126,351 | |||||||||||||||
Accounts receivable | — | — | — | 880,627 | 880,627 | |||||||||||||||
Finance receivables | — | — | — | 78,853 | 78,853 | |||||||||||||||
Other non-current and current assets | — | — | — | 89,470 | 89,470 | |||||||||||||||
Cash and cash equivalents | — | — | 369,238 | 2,362,544 | 2,731,782 | |||||||||||||||
|
|
|
|
|
|
|
|
|
| |||||||||||
Total | 1,095 | 125,256 | 369,238 | 3,411,494 | 3,907,083 | |||||||||||||||
|
|
|
|
|
|
|
|
|
| |||||||||||
As of December 31, 2011 (in thousands) | Derivatives at fair value through profit or loss EUR | Derivatives for which hedge accounting is applied EUR | Other financial liabilities EUR | Total EUR | ||||||||||||
Liabilities as per statement of financial position date | ||||||||||||||||
Long-term debt1 | — | — | 732,709 | 732,709 | ||||||||||||
Derivative financial instruments | 33,407 | 6,952 | — | 40,359 | ||||||||||||
Accrued and other liabilities | — | — | 472,710 | 472,710 | ||||||||||||
Accounts payable | — | — | 444,269 | 444,269 | ||||||||||||
|
|
|
|
|
|
|
| |||||||||
Total | 33,407 | 6,952 | 1,649,688 | 1,690,047 | ||||||||||||
|
|
|
|
|
|
|
| |||||||||
| 1 | Long-term debt includes the Company’s Eurobond. Because the Eurobond serves as hedged item in a fair value hedge relationship, the carrying amount is only adjusted for fair value changes in interest rate swaps. See note 19. |
| ASML STATUTORY ANNUAL REPORT 2011 | 83 |
As of December 31, 2010 (in thousands) | Derivatives at fair value through profit or loss EUR | Derivatives for which hedge accounting is applied EUR | Financial assets at fair value through profit or loss EUR | Loans and receivables EUR | Total EUR | |||||||||||||||
Assets as per statement of financial position date | ||||||||||||||||||||
Derivative financial instruments | 1,300 | 94,880 | — | — | 96,180 | |||||||||||||||
Accounts receivable | — | — | — | 1,123,534 | 1,123,534 | |||||||||||||||
Finance receivables | — | — | — | 41,553 | 41,553 | |||||||||||||||
Other non-current and current assets | — | — | — | 83,060 | 83,060 | |||||||||||||||
Cash and cash equivalents | — | — | 203,922 | 1,745,912 | 1,949,834 | |||||||||||||||
|
|
|
|
|
|
|
|
|
| |||||||||||
Total | 1,300 | 94,880 | 203,922 | 2,994,059 | 3,294,161 | |||||||||||||||
|
|
|
|
|
|
|
|
|
| |||||||||||
As of December 31, 2010 (in thousands) | Derivatives at fair value through profit or loss EUR | Derivatives for which hedge accounting is applied EUR | Other financial liabilities EUR | Total EUR | ||||||||||||
Liabilities as per statement of financial position date | ||||||||||||||||
Long-term debt1 | — | — | 705,731 | 705,731 | ||||||||||||
Derivative financial instruments | 20,272 | 14,626 | — | 34,898 | ||||||||||||
Accrued and other liabilities | — | — | 597,861 | 597,861 | ||||||||||||
Accounts payable | — | — | 555,397 | 555,397 | ||||||||||||
|
|
|
|
|
|
|
| |||||||||
Total | 20,272 | 14,626 | 1,858,989 | 1,893,887 | ||||||||||||
|
|
|
|
|
|
|
| |||||||||
| 1 | Long-term debt includes the Company’s Eurobond. Because the Eurobond serves as hedged item in a fair value hedge relationship, the carrying amount is only adjusted for fair value changes in interest rate swaps. See note 19. |
See Note 4 for the fair value measurement hierarchy.
The carrying amounts of the accounts receivable and other assets approximate their fair value.
There are no significant concentrations of credit risk for loans and receivables designated at fair value through profit or loss as of December 31, 2011. The amounts reflected above represent the Company’s maximum exposure to credit risk for such loans and receivables.
Credit quality of financial assets
The credit quality of financial assets that are neither past due nor impaired can be assessed by reference to the following:
Financial instruments that potentially subject ASML to significant concentrations of credit risk consist principally of cash and cash equivalents, derivative instruments used in hedging activities and accounts receivable.
Cash and cash equivalents and derivative instruments contain an element of risk of the counterparties being unable to meet their obligations. Our risk management program focuses appropriately on the current environment of uncertainty in the financial markets, especially in the euro-zone. ASML invests its cash and cash equivalents mainly in euro-denominated short-term deposits with high-rated financial institutions and the Dutch government, and partly in euro-denominated AAAm-rated money market funds that invest in high-rated short-term debt securities of financial institutions and governments. To mitigate the risk that any of our counterparties in hedging transactions is unable to meet its obligations, ASML only enters into transactions with a limited number of major financial institutions that have high credit ratings and closely monitors the creditworthiness of its counterparties. Concentration risk is mitigated by limiting the exposure on a single counterparty.
ASML’s customers consist of Integrated Circuit (“IC”) manufacturers located throughout the world. ASML performs ongoing credit evaluations of its customers’ financial condition. ASML takes additional measures to mitigate credit risk when considered appropriate by means of e.g. down payments, letters of credit, and retention of ownership provisions in contracts. Retention of ownership enables ASML to recover the systems in the event a customer defaults on payment.
| ASML STATUTORY ANNUAL REPORT 2011 | 84 |
13. Derivative financial instruments
| 2011 | 2010 | |||||||||||||||
As of December 31 (in thousands) | Assets EUR | Liabilities EUR | Assets EUR | Liabilities EUR | ||||||||||||
Interest rate swaps - cash flow hedges | — | 3,933 | — | 3,091 | ||||||||||||
Interest rate swaps - fair value hedges | 113,924 | — | 93,347 | — | ||||||||||||
Forward foreign exchange contracts - cash flow hedges | 11,332 | 3,019 | 1,533 | 11,535 | ||||||||||||
Forward foreign exchange contracts - other hedges (no hedge accounting) | 1,095 | 33,407 | 1,300 | 20,272 | ||||||||||||
|
|
|
|
|
|
|
| |||||||||
Total | 126,351 | 40,359 | 96,180 | 34,898 | ||||||||||||
Less non-current portion: | ||||||||||||||||
Interest rate swaps - cash flow hedges | — | 3,210 | — | 1,887 | ||||||||||||
Interest rate swaps - fair value hedges | 92,534 | — | 71,779 | — | ||||||||||||
Forward foreign exchange contracts - cash flow hedges | — | — | — | 94 | ||||||||||||
|
|
|
|
|
|
|
| |||||||||
Total non-current portion | 92,534 | 3,210 | 71,779 | 1,981 | ||||||||||||
|
|
|
|
|
|
|
| |||||||||
Total current portion | 33,817 | 37,149 | 24,401 | 32,917 | ||||||||||||
|
|
|
|
|
|
|
| |||||||||
The fair value part of a hedging derivative that has a remaining term of 12 months or less is classified as current asset or liability. When the fair value part of a hedging derivative has a term of more than 12 months after statement of financial position date it is classified as non-current.
Forward foreign exchange contracts
The notional principal amounts of the outstanding forward foreign exchange contracts in the main currencies U.S. dollar and Japanese yen at December 31, 2011 are U.S. dollar 48.9 million and Japanese yen 37.2 billion (2010: U.S. dollar 222.6 million and Japanese yen 27.7 billion).
The hedged highly probable forecasted transactions denominated in foreign currency are expected to occur at various dates during the coming 12 months. Gains and losses recognized in other comprehensive income (in equity) on forward contracts as of December 31, 2011 will be recognized in the consolidated income statement in the period or periods during which the hedged forecasted transaction affects the consolidated income statement.
In 2011, we recognized a net amount of EUR 58.1 million loss (2010: EUR 43.5 million loss) in the consolidated income statement resulting from effective cash flow hedges for forecasted sales and purchase transactions that occurred in the year. Furthermore, we recognized an amount of EUR 38.3 million loss in the consolidated income statement resulting from derivative financial instruments measured at fair value through profit or loss (2010: EUR 32.9 million loss).
Interest rate swaps
The notional principal amounts of the outstanding interest rate swap contracts as of December 31, 2011 were EUR 641.5 million (2010: EUR 641.5 million).
14. Other assets
The other non-current assets consist of the following:
As of December 31 (in thousands) | 2011 EUR | 2010 EUR | ||||||
Advance payments to Zeiss | 187,950 | 140,016 | ||||||
Compensation plan assets1 | 10,577 | 9,626 | ||||||
Subordinated loan granted to lessor in respect of Veldhoven headquarters2 | 5,445 | 5,445 | ||||||
Other | 7,086 | 4,516 | ||||||
|
|
|
| |||||
Total other non-current assets | 211,058 | 159,603 | ||||||
|
|
|
| |||||
| 1 | For further details on compensation plan refer to Note 23. |
| 2 | For further details on loan granted to lessor in respect of Veldhoven headquarters refer to Note 24. |
Zeiss is the Company’s sole supplier of lenses. The non-current part of advance payments to Zeiss mainly relates to payments made to support the Zeiss investments for ASML’s EUV program, which are expected to be repaid through EUV lens deliveries.
| ASML STATUTORY ANNUAL REPORT 2011 | 85 |
The other current assets consist of the following:
As of December 31 (in thousands) | 2011 EUR | 2010 EUR | ||||||
Advance payments to Zeiss | 66,203 | 65,821 | ||||||
VAT | 47,543 | 35,065 | ||||||
Prepaid expenses | 28,754 | 20,309 | ||||||
Other receivables | 27,504 | 41,298 | ||||||
Other | 6,728 | 1,252 | ||||||
|
|
|
| |||||
Total other current assets | 176,732 | 163,745 | ||||||
|
|
|
| |||||
From time to time, Zeiss receives non-interest bearing advance payments from the Company that assist in financing Zeiss’ work-in-process and thereby secure lens deliveries to the Company. Amounts owed under these advance payments are repaid through lens deliveries over the next 12 months.
The carrying amount of the other non-current and current assets approximates the fair value. The other non-current and current assets do not contain impaired assets.
15. Inventories
Inventories consist of the following:
As of December 31 (in thousands) | 2011 EUR | 2010 EUR | ||||||
Raw materials | 258,712 | 248,969 | ||||||
Work-in-process | 1,026,872 | 1,083,932 | ||||||
Finished products | 532,556 | 353,514 | ||||||
|
|
|
| |||||
Total inventories, gross | 1,818,140 | 1,686,415 | ||||||
Provision for obsolescence and/or lower market value | (185,462 | ) | (186,343 | ) | ||||
|
|
|
| |||||
Total inventories, net | 1,632,678 | 1,500,072 | ||||||
|
|
|
| |||||
A summary of activity in the provision for obsolescence is as follows:
As of December 31 (in thousands) | 2011 EUR | 2010 EUR | ||||||
Balance at beginning of year | (186,343 | ) | (190,638 | ) | ||||
Addition of the year | (60,300 | ) | (61,316 | ) | ||||
Effect of exchange rates | (883 | ) | (4,148 | ) | ||||
Release of the provision | 7,915 | 32,814 | ||||||
Utilization of the provision | 54,149 | 28,554 | ||||||
Transfers from property, plant and equipment | — | 8,391 | ||||||
|
|
|
| |||||
Balance at end of year | (185,462 | ) | (186,343 | ) | ||||
|
|
|
| |||||
In 2011, the addition for the year is recorded in cost of sales for an amount of EUR 60.0 million and R&D costs for an amount of EUR 0.3 million (2010: cost of sales EUR 54.6 million and R&D costs EUR 6.7 million). The 2011 addition for the year mainly relates to certain obsolete parts due to technological developments and design changes.
In 2011 ASML released EUR 7.9 million from the provision for obsolete inventory as a result of a subsequent increase in net realizable value (2010: EUR 32.8 million).
The cost of inventories recognized as expense and included in cost of sales amounted to EUR 2,361.6 million (2010: EUR 1,916.1 million).
| ASML STATUTORY ANNUAL REPORT 2011 | 86 |
16. Accounts receivable
The accounts receivable consist of the following:
As of December 31 (in thousands) | 2011 EUR | 2010 EUR | ||||||
Accounts receivable, gross | 883,209 | 1,125,479 | ||||||
Allowance for doubtful receivables | (2,582 | ) | (1,945 | ) | ||||
|
|
|
| |||||
Accounts receivable, net | 880,627 | 1,123,534 | ||||||
|
|
|
| |||||
The carrying amount of the accounts receivable approximates the fair value. ASML performs ongoing credit evaluations of its customers’ financial condition. ASML regularly reviews whether an allowance for credit losses is needed by considering factors such as historical payment experience, credit quality, and age of the accounts receivables balances, and current economic conditions that may affect a customer’s ability to pay.
The main part of the carrying value of accounts receivable consists of euro balances.
Accounts receivable are impaired and provided for, on an individual basis. As of December 31, 2011, accounts receivable of EUR 66.8 million (2010: EUR 334.3 million) were past due but not impaired. These balances are still considered to be recoverable because they relate to customers for whom there is no recent history of default and there has not been a significant change in credit quality. The table below shows the ageing analysis of the accounts receivable that are up to three months past due and over three months past due. Accounts receivable are past due when the payment term has expired.
As of December 31 (in thousands) | 2011 EUR | 2010 EUR | ||||||
Up to three months past due | 41,118 | 316,727 | ||||||
Over three months past due | 25,729 | 17,538 | ||||||
|
|
|
| |||||
Total past due | 66,847 | 334,265 | ||||||
|
|
|
| |||||
ASML provided extended payment terms to some of its customers. The average days outstanding decreased from 91 days in 2010 to 57 days in 2011.
Movements in the allowance for doubtful debts are as follows:
As of December 31 (in thousands) | 2011 EUR | 2010 EUR | ||||||
Balance at beginning of year | (1,945 | ) | (3,239 | ) | ||||
Utilization of the provision | 212 | 38 | ||||||
(Addition) / release for the year1 | (849 | ) | 1,256 | |||||
|
|
|
| |||||
Allowance for doubtful receivables | (2,582 | ) | (1,945 | ) | ||||
|
|
|
| |||||
| 1 | (Addition) / release for the year is recorded in cost of sales. |
17. Cash and cash equivalents
Cash and cash equivalents at December 31, 2011 include euro-denominated short-term deposits with high-rated financial institutions and the Dutch government of EUR 1,818.6 million (2010: EUR 1,138.8 million), investments in euro-denominated AAAm-rated money market funds that invest in high-rated short-term debt securities of financial institutions and governments of EUR 369.2 million (2010: EUR 203.9 million) and interest-bearing bank accounts of EUR 544.0 million (2010: EUR 607.1 million).
Cash and cash equivalents have insignificant interest rate risk and remaining maturities of three months or less at the date of acquisition. No further restrictions on usage of cash and cash equivalents exist. The carrying amount of these assets approximates their fair value.
| ASML STATUTORY ANNUAL REPORT 2011 | 87 |
18. Equity
Share Capital
ASML’s authorized share capital amounts to EUR 126,000,000 and is divided into:
| • | 700,000,000 cumulative preference shares with a nominal value of EUR 0.09 each; |
| • | 700,000,000 ordinary shares with a nominal value of EUR 0.09 each. |
Per December 31, 2011, 413,669,257 ordinary shares with a nominal value of EUR 0.09 each were outstanding and fully paid in. The number of issued shares was 431,294,790, including 17,625,533 repurchased (“treasury”) shares, the majority of which will be cancelled in 2012.
Our Board of Management has the power to issue shares if and to the extent the Board of Management has been authorized to do so by the General Meeting of Shareholders (either by means of a resolution or by an amendment to our Articles of Association). However, the Supervisory Board must approve any issuance of shares.
As a consequence of the amendment of the Company’s Articles of Association per May 6, 2011, 10,000 ordinary shares in the Company’s share capital with nominal value of EUR 0,01 were canceled because no such shares were issued.
Ordinary shares
At ASML’s Annual General Meeting of Shareholders, held on April 20, 2011, the Board of Management was granted the authorization to issue shares and/or rights thereto representing up to a maximum of 5.0 percent of the Company’s issued share capital as of the date of authorization, plus an additional 5.0 percent of the Company’s issued share capital as of the date of authorization that may be issued in connection with mergers and acquisitions. At ASML’s Annual General Meeting of Shareholders to be held on April 25, 2012, its shareholders will be asked to authorize the Board of Management (subject to the approval of the Supervisory Board) to issue shares and/or rights thereto through October 25, 2013.
Holders of ASML’s ordinary shares have a preemptive right of subscription to any issuance of ordinary shares for cash, which right may be limited or excluded. Ordinary shareholders have no pro rata preemptive right of subscription to any ordinary shares issued for consideration other than cash or ordinary shares issued to employees. If authorized for this purpose by the General Meeting of Shareholders (either by means of a resolution or by an amendment to ASML’s Articles of Association), the Board of Management has the power, with the approval of the Supervisory Board, to limit or exclude the preemptive rights of holders of ordinary shares. A designation may be renewed. At ASML’s Annual General Meeting of Shareholders, held on April 20, 2011, the Board of Management was authorized, subject to the aforementioned approval, to restrict or exclude preemptive rights of holders of ordinary shares up to a maximum of 10 percent of the Company’s issued share capital as of the date of authorization. At ASML’s Annual General Meeting of Shareholders to be held on April 25, 2012, its shareholders will be asked to grant this authority through October 25, 2013. At this Annual General Meeting of Shareholders, the shareholders will be asked to grant authority to the Board of Management to issue shares and options separately for a period of 18 months.
The Company may repurchase its issued ordinary shares at any time, subject to compliance with the requirements of Dutch law and the Company’s Articles of Association. Any such repurchases are subject to the approval of the Supervisory Board and the authorization of shareholders at ASML’s Annual General Meeting of Shareholders, which authorization may not be for more than 18 months. The Board of Management is currently authorized, subject to Supervisory Board approval, to repurchase through October 20, 2012 up to a maximum of three times 10.0 percent of the Company’s issued share capital as of the date of authorization (April 20, 2011) at a price between the nominal value of the ordinary shares purchased and 110.0 percent of the market price of these securities on Euronext Amsterdam or NASDAQ. At the Company’s Annual General Meeting of Shareholders to be held on April 25, 2012, ASML shall request the authorization for the Board of Management to repurchase and cancel shares for a period of 18 months as of the 2012 AGM, i.e. until October 25, 2013, all in conformity with the provisions of the law and the Company’s articles of association.
Cumulative preference shares
In 1998, the Company granted to the preference share foundation, “Stichting Preferente Aandelen ASML” (the “Foundation”) an option to acquire cumulative preference shares in the capital of the Company (the “Preference Share Option”). This option was amended and extended in 2003 and 2007. A third amendment to the option agreement between the Foundation and ASML became effective on January 1, 2009, to clarify the procedure for the repurchase and cancellation of the preference shares when issued.
Per the amendment of the Company’s Articles of Association on May 6, 2011, the nominal value of the cumulative preference shares was increased to EUR 0.09. The number of cumulative preference shares included in the authorized share capital was decreased to 700,000,000 million, equal to the number of common shares in the authorized share
| ASML STATUTORY ANNUAL REPORT 2011 | 88 |
capital. This was done to simplify the Articles of Association, and to give each share the right to cast one vote in the general meeting of shareholders.
The Foundation may exercise the Preference Share Option in situations where, in the opinion of the Board of Directors of the Foundation, the interests of the Company, its business or the interests of its stakeholders are at stake. This may be the case if a public bid for the ordinary shares of the Company has been announced or has been made, or the justified expectation exists that such a bid will be made without any agreement having been reached in relation to such a bid with the Company. The same may apply if one shareholder, or more shareholders acting in concert, hold a substantial percentage of the issued ordinary shares of the Company without making an offer or if, in the opinion of the Board of Directors of the Foundation, the (attempted) exercise of the voting rights by one shareholder or more shareholders, acting in concert, is materially in conflict with the interests of the Company, its business or its stakeholders.
The objects of the Foundation are to look after the interests of ASML and of the enterprises maintained by ASML and of the companies which are affiliated in a group with ASML, in such way that the interests of ASML, of those enterprises and of all parties concerned are safeguarded in the best possible way, and influences in conflict with these interests which might affect the independence or the identity of ASML and those companies are deterred to the best of the Foundation’s ability, and everything related to the above or possibly conducive thereto. The Foundation seeks to realize its objects by the acquiring and holding of cumulative preference shares in the capital of ASML and by exercising the rights attached to these shares, particularly the voting rights attached to these shares.
The Preference Share Option gives the Foundation the right to acquire a number of cumulative preference shares, provided that the aggregate nominal value of such number of cumulative preference shares shall not exceed the aggregate nominal value of the ordinary shares that have been issued at the time of exercise of the Preference Share Option for a subscription price equal to their EUR 0.09 nominal value. Exercise of the Preference Share Option could effectively dilute the voting power of the outstanding ordinary shares by one-half. Only one-fourth of the subscription price is payable at the time of initial issuance of the cumulative preference shares.
Cancellation and repayment of the issued cumulative preference shares by the Company requires the authorization by the General Meeting of Shareholders of a proposal to do so by the Board of Management approved by the Supervisory Board. If the Preference Share Option is exercised and as a result cumulative preference shares are issued, the Company, at the request of the Foundation, will initiate the repurchase or cancellation of all cumulative preference shares held by the Foundation as a result of such issuance with repayment of the amount paid and exemption from the obligation to pay up on the cumulative preference shares. In that case the Company is obliged to effect the repurchase and cancellation respectively as soon as possible.
If the Foundation will not request the Company to repurchase or cancel all cumulative preference shares held by the Foundation within 20 months after issuance of these shares, the Company will be obliged to convene a General Meeting of Shareholders in order to decide on a repurchase or cancellation of these shares.
The Foundation is independent of the Company. The Board of Directors of the Foundation comprises four independent voting members from the Dutch business and academic communities: Mr. R.E. Selman (until December 31, 2011), Mr. M.W. den Boogert, Mr. J.M. de Jong, Mr. A. Baan., and Mr. A.M. Lundqvist (as of January 1, 2012).
| ASML STATUTORY ANNUAL REPORT 2011 | 89 |
Other reserves
Changes in other reserves during 2011 and 2010 were as follows:
Other reserves | ||||||||||||||||
(in thousands) | Hedging reserve EUR | Currency translation reserve EUR | Capitalized development expenditures EUR | Total EUR | ||||||||||||
Balance at January 1, 2010 | (43,148 | ) | (113,214 | ) | 328,808 | 172,446 | ||||||||||
Components of statement of comprehensive income: | ||||||||||||||||
Foreign currency translation, net of taxes: | ||||||||||||||||
Gain on translation of foreign operations | — | 27,306 | — | 27,306 | ||||||||||||
Derivative financial instruments, net of taxes: | ||||||||||||||||
Fair value losses in the year | (49,175 | ) | — | — | (49,175 | ) | ||||||||||
Transfers to net income | 47,954 | — | — | 47,954 | ||||||||||||
Development expenditures | — | — | (68,153 | ) | (68,153 | ) | ||||||||||
Currency translation on development expenditures | — | (2,732 | ) | 2,732 | — | |||||||||||
|
|
|
|
|
|
|
| |||||||||
Balance at December 31, 2010 | (44,369 | ) | (88,640 | ) | 263,387 | 130,378 | ||||||||||
Components of statement of comprehensive income: | ||||||||||||||||
Foreign currency translation, net of taxes: | ||||||||||||||||
Losses on the hedge of a net investment | — | (1,829 | ) | — | (1,829 | ) | ||||||||||
Losses on translation of foreign operations | — | (12,142 | ) | — | (12,142 | ) | ||||||||||
Derivative financial instruments, net of taxes: | ||||||||||||||||
Fair value losses in the year | (4,610 | ) | — | — | (4,610 | ) | ||||||||||
Transfers to net income | 51,963 | — | — | 51,963 | ||||||||||||
Development expenditures | — | — | (4,721 | ) | (4,721 | ) | ||||||||||
Currency translation on development expenditures | — | (956 | ) | 956 | — | |||||||||||
|
|
|
|
|
|
|
| |||||||||
Balance at December 31, 2011 | 2,984 | (103,567 | ) | 259,622 | 159,039 | |||||||||||
|
|
|
|
|
|
|
| |||||||||
Exchange rate differences relating to the translation from the Company’s foreign subsidiaries into euro are recognized in the currency translation reserve. Gains and losses on hedging instruments that are designated as hedges of net investments in foreign operations are included in the currency translation reserve.
Hedging reserve represents hedging gains and losses on the effective portion of cash flow hedges. The cumulative gain or loss on the hedge is recognized in net income (loss) when the hedge transaction impacts net income (loss).
ASML is a company incorporated under Dutch Law. In accordance with the Dutch Civil Code, other reserves consist of legal reserves that have to be established in certain circumstances. The legal reserves consist of the hedging reserve, the currency translation reserve and the reserve for capitalized development expenditures. Legal reserves are not for distribution to ASML’s shareholders. If the currency translation reserve or the hedging reserve has a negative balance, distributions to ASML’s shareholders are restricted to the extent of the negative balance.
Appropriation of net income
As part of our financing policy, we aim to pay an annual dividend that will be stable or growing over time. Annually, the Board of Management will, upon prior approval from the Supervisory Board, submit a proposal to the Annual General Meeting of Shareholders with respect to the amount of dividend to be declared with respect to the prior year. The dividend proposal in any given year will be subject to the availability of distributable profits or retained earnings and may be affected by, among other factors, the Board of Management’s views on our potential future liquidity requirements, including for investments in production capacity, the funding of our research and development programs and for acquisition opportunities that may arise from time to time; and by future changes in applicable income tax and corporate laws. Accordingly, it may be decided to propose not to pay a dividend or to pay a lower dividend with respect any particular year in the future.
For 2011, a proposal to declare a dividend of EUR 0.46 per ordinary share of EUR 0.09 nominal value will be submitted to the Annual General Meeting of Shareholders to be held on April 25, 2012.
| ASML STATUTORY ANNUAL REPORT 2011 | 90 |
Dividends on ordinary shares are payable out of net income or retained earnings as shown in the financial statements of the Company as adopted by the General Meeting of Shareholders of the Company, after payment first of (accumulated) dividends out of net income on any issued cumulative preference shares.
Share buyback programs
In addition to dividend payments, we intend to return cash to our shareholders on a regular basis through share buy backs or repayment of capital, subject to our actual and anticipated level of cash generated from operations, the cash requirements for investment in our business, our current share price and other market conditions and relevant factors.
On April 20, 2011, the General Meeting of Shareholders authorized the repurchase of up to a maximum of three times
10.0 percent of our issued share capital as of the date of authorization through October 20, 2012.
On January 19, 2011, ASML announced its intention to repurchase up to EUR 1.0 billion of its own shares within the next two years. During 2011 the Company repurchased 25,674,576 shares for a total amount of EUR 700.0 million; of the shares repurchased 13,185,305 were cancelled in 2011. The company intends to cancel the remaining repurchased shares in 2012.
The following table provides a summary of shares repurchased by the Company in 2011:
Period | Total Number of Shares purchased | Average Price Paid per Share (EUR) | Total Number of Shares Purchased as Part of Publicly Announced Plans or Programs | Maximum Value of Shares That May Yet be Purchased Under The Plans or Programs 1 | ||||||||||||
January 20 - 31, 2011 | 78,975 | 29.13 | 78,975 | 997,699,182 | ||||||||||||
February 1 - 28, 2011 | 1,599,019 | 31.42 | 1,677,994 | 947,457,186 | ||||||||||||
March 1 - 31, 2011 | 2,988,801 | 30.33 | 4,666,795 | 856,819,199 | ||||||||||||
April 1 - 30, 2011 | 2,413,449 | 27.68 | 7,080,244 | 790,017,324 | ||||||||||||
May 2 - 31, 2011 | 4,814,924 | 27.26 | 11,895,168 | 658,770,101 | ||||||||||||
June 1 - 30, 2011 | 1,677,557 | 25.20 | 13,572,725 | 616,498,695 | ||||||||||||
July 1 - 29, 2011 | 2,245,788 | 25.50 | 15,818,513 | 559,238,654 | ||||||||||||
August 1 - 31, 2011 | 2,907,848 | 23.59 | 18,726,361 | 490,649,449 | ||||||||||||
September 1 - 30, 2011 | 2,887,514 | 25.46 | 21,613,875 | 417,147,453 | ||||||||||||
October 3 - 31, 2011 | 1,440,646 | 27.53 | 23,054,521 | 377,488,352 | ||||||||||||
November 1 - 30, 2011 | 1,649,792 | 29.01 | 24,704,313 | 329,630,685 | ||||||||||||
December 1 - 31, 2011 | 970,263 | 30.54 | 25,674,576 | 300,000,025 | ||||||||||||
Total | 25,674,576 | 27.26 | ||||||||||||||
| 1 | This table reflects the situation as at December 31, 2011. Subsequently, on January 18, 2012, the Company announced to increase the size of the program to a maximum amount of EUR 1,130 million. |
| ASML STATUTORY ANNUAL REPORT 2011 | 91 |
19. Long-term debt
The long-term debt consists of the following:
As of December 31 (in thousands) | 2011 EUR | 2010 EUR | ||||||
Eurobond, carrying amount | 691,959 | 670,506 | ||||||
Loan headquarter building1 | 33,795 | 35,225 | ||||||
Other | 6,955 | — | ||||||
|
|
|
| |||||
Long-term debt | 732,709 | 705,731 | ||||||
Less: current portion of long term debt | 2,587 | 1,429 | ||||||
|
|
|
| |||||
Non-current portion of long term debt | 730,122 | 704,302 | ||||||
|
|
|
| |||||
| 1 | This loan relates to the Company’s Special Purpose Entity. |
The Company’s obligations to make principal repayments under the Eurobond and other borrowing arrangements as of December 31, 2011, for the next five years and thereafter and excluding interest charges are as follows:
| (in thousands) | EUR | |||
2012 | 2,587 | |||
2013 | 2,481 | |||
2014 | 2,379 | |||
2015 | 2,379 | |||
2016 | 2,379 | |||
Thereafter | 628,545 | |||
|
| |||
Total | 640,750 | |||
Less: current portion of long-term debt | 2,587 | |||
|
| |||
Non-current portion of long-term debt | 638,163 | |||
|
| |||
Eurobond
The following table summarizes the carrying amount of the Company’s outstanding Eurobond, including transaction costs and the fair value of interest rate swaps used to hedge the change in the value of the Eurobond:
As of December 31 (in thousands) | 2011 EUR | 2010 EUR | ||||||
Eurobond | ||||||||
Principal amount1 | 596,341 | 595,670 | ||||||
Fair value hedge adjustment2 | 95,618 | 74,836 | ||||||
|
|
|
| |||||
Total | 691,959 | 670,506 | ||||||
|
|
|
| |||||
| 1 | The principal amount is adjusted for transaction costs. |
| 2 | The fair value of the interest rate swaps excludes accrued interest. |
In June 2007, ASML completed an offering of EUR 600.0 million principal amount of its Eurobond, with 5.75 percent interest payable annually on June 13 of each year. The notes are redeemable at the option of ASML, in whole or in part, at any time by paying a make whole premium, and unless previously redeemed, will be redeemed at 100 percent of their principal amount on June 13, 2017.
The Eurobond serves as a hedged item in a fair value hedge relationship in which ASML hedges the variability of changes in the fair value of the Company’s Eurobond due to changes in market interest rates. The fair value changes of the interest rate swaps are recorded on the statement of financial position under derivative financial instruments (within other current and non-current assets). Therefore, the carrying amount is only adjusted for fair value changes in interest rate swaps.
| ASML STATUTORY ANNUAL REPORT 2011 | 92 |
The following table summarizes the estimated fair value of the Company’s Eurobond:
As of December 31 (in thousands) | Principal Amount EUR | 2011 Carrying Amount EUR | Fair Value1 EUR | Principal Amount EUR | 2010 Carrying Amount EUR | Fair Value1 EUR | ||||||||||||||||||
Eurobond | 600,000 | 691,959 | 640,500 | 600,000 | 670,506 | 631,452 | ||||||||||||||||||
| 1 | Source: Bloomberg Finance LP |
The fair value of the Company’s Eurobond is estimated based on the quoted market prices as of December 31, 2011. The fair value of the Eurobond is higher than the principal amount as a result of lower interest rates.
20. Lines of credit
The Company’s available credit facilities amount to EUR 500.0 million as of December 31, 2011 and EUR 700.0 million as of December 31, 2010. The amount at December 31, 2011 consists of one EUR 500.0 million committed revolving credit facility from a group of banks that will mature in 2015. The credit facility contains a restrictive covenant that requires the Company to maintain a minimum committed capital to net total assets ratio of 40.0 percent calculated in accordance with contractually agreed definitions. As of December 31, 2011 and December 31, 2010, this ratio was 87.7 percent and 78.0 percent, respectively. Therefore, the Company was in compliance with the covenant at the end of 2011 and 2010. Outstanding amounts under this credit facility will bear interest at EURIBOR or LIBOR plus a margin that depends on the Company’s liquidity position. No amounts were outstanding under this credit facility at the end of 2011 and 2010.
The undrawn EUR 200.0 million loan facility (between the Company and the European Investment Bank) matured in 2011, as the availability period to draw the facility ended on March 31, 2011.
21. Provisions
Provisions consist of the following:
(in thousands) | Onerous contracts EUR | |||
Balance, January 1, 2010 | 15,198 | |||
Utilization of the provision | (2,576 | ) | ||
Unwinding of discount | 305 | |||
Effect of exchange rates | 1,134 | |||
|
| |||
Balance, December 31, 2010 | 14,061 | |||
Utilization of the provision | (2,452 | ) | ||
Unwinding of discount | 421 | |||
Effect of exchange rates | 308 | |||
|
| |||
Balance, December 31, 2011 | 12,338 | |||
Non-current portion of provisions | ||||
December 31, 2010 | 11,811 | |||
December 31, 2011 | 10,012 | |||
The provision for onerous contracts relates to an operating lease contract for a building for which no economic benefits are expected. The provision for lease contract termination costs is expected to be utilized by 2017.
| ASML STATUTORY ANNUAL REPORT 2011 | 93 |
22. Accrued and other liabilities
Accrued and other liabilities consist of the following:
As of December 31 (in thousands) | 2011 EUR | 2010 EUR | ||||||
Deferred revenue | 816,045 | 543,145 | ||||||
Costs to be paid | 260,651 | 270,836 | ||||||
Deposits from customers | — | 150,000 | ||||||
Down payments from customers | 1,057,046 | 675,636 | ||||||
Personnel related items | 212,059 | 177,025 | ||||||
Warranty | 43,273 | 37,965 | ||||||
Other | 2,312 | 2,314 | ||||||
|
|
|
| |||||
Total accrued and other liabilities | 2,391,386 | 1,856,921 | ||||||
Less: non-current portion of accrued and other liabilities1 | 659,889 | 371,089 | ||||||
|
|
|
| |||||
Current portion of accrued and other liabilities | 1,731,497 | 1,485,832 | ||||||
|
|
|
| |||||
| 1 | The main part of the non-current portion of accrued and other liabilities relates to down payments received from customers regarding future shipments of EUV systems. |
The increase in accrued and other liabilities mainly relates to deferred revenue and down payments from customers.
Deferred revenue mainly consists of prepaid extended and enhanced (optic) warranty contracts and award credits regarding free or discounted products or services. The increase in deferred revenue is mainly caused by an increase in volume purchase agreements. Further, one NXE: 3100 system shipment is included for an amount of EUR 48.6 million, which has not been fully installed at the customer’s location yet.
Costs to be paid mainly relate to accrued cost for unbilled services provided by vendors including contracted labor, outsourced services and consultancy.
The Company receives advances from customers prior to shipment for systems included in ASML’s current product portfolio or systems currently under development in the form of down payments.
Personnel related items mainly consist of accrued management bonuses, accrued profit sharing, accrued vacation days, accrued vacation allowance, accrued wage tax, social securities and accrued pension premiums.
Changes in product warranty liabilities for the years 2011 and 2010 are as follows:
(in thousands) | 2011 EUR | 2010 EUR | ||||||
Balance, January 1 | 37,965 | 23,208 | ||||||
Additions of the year | 61,279 | 46,467 | ||||||
Utilization of the reserve | (26,968 | ) | (14,325 | ) | ||||
Release of the reserve | (29,415 | ) | (18,480 | ) | ||||
Effect of exchange rates | 412 | 1,095 | ||||||
|
|
|
| |||||
Standard warranty reserve | 43,273 | 37,965 | ||||||
|
|
|
| |||||
The release of the reserve is due to a change in accounting estimate based on lower than expected historical warranty expenses as a result of an improved learning-curve concerning ASML’s systems. The release has been included in cost of sales.
In 2011 and 2010 the reassessments of the warranty reserve, and resulting change in accounting estimate, did not have a material impact on the Company’s consolidated income statement.
| ASML STATUTORY ANNUAL REPORT 2011 | 94 |
23. Employee benefits
Bonus plan
The Company’s bonus expenses for all participants of all bonus plans were:
Year ended December 31 (in thousands) | 2011 EUR | 2010 EUR | ||||||
Bonus expenses | 15,557 | 12,489 | ||||||
ASML has a performance related bonus plan for the Board of Management for an amount of EUR 1.7 million for which we refer to note 30.
ASML has a performance related bonus plan for senior management, who are not members of the Board of Management. Under this plan, the bonus amount is dependent on actual performance against corporate, departmental and personal targets. The bonus for members of senior management can range between 0.0 percent and 40.0 percent, or 0.0 percent and 70.0 percent, of their annual salaries, depending upon their seniority. The performance targets for 2011 are set for each half year. The bonus of the first half of 2011 was paid in the second half of 2011. The bonus of the second half is accrued for in the statement of financial position as of December 31, 2011 and is expected to be paid in the first quarter of 2012. The Company’s bonus expenses under this plan were:
Year ended December 31 (in thousands) | 2011 EUR | 2010 EUR | ||||||
Bonus expenses | 13,131 | 9,694 | ||||||
ASML had a retention bonus plan for employees and executives of Brion for the period March 2007 to March 2010. The first retention bonus was conditional on the first year of employment after the acquisition date and was paid in March 2008. The second retention bonus was conditional on the second year of employment after the acquisition date and was paid in March 2009. The third retention bonus was conditional on the third year of employment after the acquisition date and was paid in March 2010. ASML has an additional retention bonus plan for the period from March 2010 to March 2012 for executives of Brion including two retention bonuses. The first retention bonus is conditional over the first year of employment and was paid in April 2011. The second retention bonus is conditional over the second year of employment and is payable in April 2012. The Company’s bonus expenses under these plans were:
Year ended December 31 (in thousands) | 2011 EUR | 2010 EUR | ||||||
Bonus expenses | 737 | 1,165 | ||||||
Profit-sharing plan
ASML has a profit-sharing plan covering all European and US non-sales employees who are not members of the Board of Management or senior management. Under the plan, eligible employees receive an annual profit-sharing bonus, based on a percentage of net income relative to sales ranging from 0.0 to 20.0 percent of annual salary. The profit sharing for the years 2011 and 2010 was 20.0 percent or EUR 64.0 million and 18.0 percent or EUR 52.2 million, respectively. Company profit is also one of the criteria for the individual variable pay programs for employees in Asia and employees eligible to the sales reward plan which amount to EUR 23.2 million for 2011 (including EUR 2.5 million for the sales reward plan), EUR 23.1 million for 2010.
Share-based compensation
The Company has adopted various share (option) plans for its employees. Each year, the Board of Management determines, by category of ASML personnel, the total available number of stock options and maximum number of shares that can be granted in that year. The determination is subject to the approval of the Supervisory Board of the Company. For members of the Board of Management ASML has separate share-based payment plans, for details on service and vesting conditions see below and for additional information see note 30. Our current share-based payment plans do not provide cash settlement of options and shares.
| ASML STATUTORY ANNUAL REPORT 2011 | 95 |
The total gross amount of recognized compensation expenses associated with share-based payments (including share-based payments to the Board of Management) was EUR 12.4 million in 2011 and EUR 12.1 million in 2010. The tax benefit recognized related to the recognized expenses amounts to EUR 0.3 million in 2011 and EUR 1.1 million in 2010.
Total compensation expenses related to non-vested awards to be recognized in future periods amount to EUR 23.3 million as per December 31, 2011 (2010: EUR 16.7 million). The weighted average period over which these costs are expected to be recognized is calculated at 1.9 years (2010: 2.0 years).
Option plans
Options granted under ASML’s stock option plans have fixed exercise prices equal to the closing price of the Company’s ordinary shares on Euronext Amsterdam or NASDAQ on the applicable grant-dates. Granted stock options generally vest over a three-year period with any unexercised stock options expiring ten years after the grant-date.
ASML has six different stock option plans:
| • | Employee plan |
| • | Option purchase plan |
| • | Brion stock option plan |
| • | Senior management plan |
| • | Stock option extension plan |
| • | Board of Management performance option plan until 2009 (see note 30) |
The Option purchase plan and Stock option extension plan have no service and vesting conditions. The other plans have service conditions which are similar. Furthermore the senior and Board of Management plans have vesting conditions based on performance. The fair value of the stock options is determined using a Black-Scholes option valuation model.
The Black-Scholes option valuation of the Company’s stock options is based on the following assumptions:
Year ended December 31 | 2011 | 2010 | ||||||
Weighted average share price (in EUR) | 28.0 | 24.1 | ||||||
Volatility (in percentage) | 37.8 | 36.4 | ||||||
Expected life (in years) | 4.8 | 4.6 | ||||||
Risk free interest rate | 2.9 | 2.5 | ||||||
Expected dividend yield (in EUR) | 1.25 | 1.06 | ||||||
Forfeiture rate1 | — | — | ||||||
| 1 | As of two years ended December 31, 2011, forfeitures are estimated to be nil. |
When establishing the expected life assumption the Company annually takes into account the contractual terms of the stock options as well as historical employee exercise behavior.
Details with respect to stock options are set out in the following table:
| EUR-denominated | USD-denominated | |||||||||||||||
Year ended December 31 | 2011 | 2010 | 2011 | 2010 | ||||||||||||
Weighted average fair value of stock options granted | 8.28 | 8.22 | 10.42 | 11.10 | ||||||||||||
Weighted average share price at the exercise date of stock options | 29.39 | 25.77 | 41.94 | 33.79 | ||||||||||||
Aggregate intrinsic value of stock options exercised (in thousands) | 30,204 | 22,720 | 11,323 | 13,669 | ||||||||||||
Aggregate remaining contractual term of currently exercisable options (years) | 2.08 | 2.86 | 1.80 | 2.59 | ||||||||||||
Aggregate intrinsic value of exercisable stock options (in thousands) | 39,384 | 54,109 | 20,492 | 25,780 | ||||||||||||
Aggregate intrinsic value of outstanding stock options (in thousands) | 45,141 | 65,240 | 20,791 | 28,024 | ||||||||||||
| ASML STATUTORY ANNUAL REPORT 2011 | 96 |
The number and weighted average exercise prices of stock options as of December 31, 2011, and changes during the year then ended are presented below:
| EUR-denominated | USD-denominated | |||||||||||||||
| Number of options | Weighted average exercise price per ordinary share (EUR) | Number of options | Weighted average exercise price per ordinary share (USD) | |||||||||||||
Outstanding, December 31, 2010 | 7,155,353 | 30.06 | 2,195,702 | 30.27 | ||||||||||||
Granted | 30,906 | 28.47 | 22,508 | 39.92 | ||||||||||||
Exercised | (1,956,207 | ) | 13.96 | (413,043 | ) | 14.53 | ||||||||||
Forfeited | (101,449 | ) | 53.16 | (12,862 | ) | 22.55 | ||||||||||
Expired | — | — | — | — | ||||||||||||
|
|
|
|
|
|
|
| |||||||||
Outstanding, December 31, 2011 | 5,128,603 | 35.73 | 1,792,305 | 31.33 | ||||||||||||
Exercisable, December 31, 2011 | 4,795,815 | 37.16 | 1,758,505 | 31.30 | ||||||||||||
Details with respect to the stock options outstanding are set out in the following table:
| EUR-denominated | USD-denominated | |||||||||||||||||
Range of exercise prices (EUR) | Number of outstanding December 31, 2011 | Weighted average remaining contractual life of outstanding options (years) | Range of exercise prices (USD) | Number of outstanding December 31, 2011 | Weighted average remaining contractual life of outstanding options (years) | |||||||||||||
0 - 10 | 7,200 | 1.06 | 0 - 10 | 124,417 | 3.47 | |||||||||||||
10 - 15 | 1,566,849 | 4.38 | 10 - 15 | 404,270 | 2.60 | |||||||||||||
15 - 20 | 632,665 | 4.84 | 15 - 20 | 7,650 | 6.80 | |||||||||||||
20 - 25 | 359,559 | 5.83 | 20 - 25 | 173,872 | 5.50 | |||||||||||||
25 - 40 | 28,942 | 9.65 | 25 - 40 | 135,229 | 6.54 | |||||||||||||
40 - 50 | 254,386 | 0.06 | 40 - 50 | 893,714 | 0.07 | |||||||||||||
50 - 60 | 2,279,002 | 0.06 | 50 - 60 | 53,153 | 0.06 | |||||||||||||
|
|
|
|
|
|
|
| |||||||||||
Total | 5,128,603 | 2.43 | Total | 1,792,305 | 1.92 | |||||||||||||
|
|
|
|
|
|
|
| |||||||||||
In 2011 and 2010 only repurchased shares were used to satisfy the option rights upon exercise. For more information with respect to repurchased shares we refer to Note 18.
Share plans
Shares granted under ASML’s share plans include a three-to-four year service period and for some plans performance conditions. The fair value of shares is determined based on the closing trading price of the company’s shares on Euronext Amsterdam or NASDAQ on the grant date.
ASML has six different share plans:
| • | Employee plan |
| • | Share purchase plan |
| • | New hire performance share plan |
| • | Brion performance share plan |
| • | Senior management plan |
| • | Board of management performance share plan (see note 30) |
The Share purchase plan has no service and vesting conditions. The employee plan has only service conditions. The other plans have service conditions which are similar and have vesting conditions which are based on performance.
Details with respect to shares are set out in the following table:
Year ended December 31 | 2011 | 2010 | 2011 | 2010 | ||||||||||||
Total fair value at vesting date of shares vested during the year (in thousands) | 9,155 | 6,165 | 1,956 | 8,856 | ||||||||||||
Weighted average fair value of shares granted | 28.09 | 23.51 | 39.00 | 31.66 | ||||||||||||
| ASML STATUTORY ANNUAL REPORT 2011 | 97 |
A summary of the status of conditionally outstanding shares as of December 31, 2011, and changes during the year ended December 31, 2011, is presented below:
| EUR- denominated Number of Shares | Weighted average grant date fair value (EUR) | USD- denominated Number of Shares | Weighted average grant date fair value (USD) | |||||||||||||
Conditional shares outstanding at January 1, 2011 | 1,141,833 | 19.75 | 288,867 | 26.22 | ||||||||||||
Granted | 733,546 | 28.09 | 128,468 | 39.00 | ||||||||||||
Vested/Issued | (322,545 | ) | 18.21 | (51,547 | ) | 27.02 | ||||||||||
Forfeited | (42,019 | ) | 20.38 | (83,492 | ) | 24.00 | ||||||||||
|
|
|
|
|
|
|
| �� | ||||||||
Conditional shares outstanding at December 31, 2011 | 1,510,815 | 24.11 | 282,296 | 32.55 | ||||||||||||
|
|
|
|
|
|
|
| |||||||||
Other plans
Stock Option Extension Plans and Financing
In 2002, employees were offered an extension of the option period for options granted in 2000. As a result the option period was extended until 2012. Employees who accepted the extension became subject to additional exercise periods in respect of their options. At the modification date, there was no intrinsic value of the modified award because the exercise price under each plan still exceeded ASML’s stock price on the modification date. As a result, these stock option extensions did not result in recognition of any compensation expense in accordance with ASC 718.
Stock option plans that were issued before 2001 were constructed with a virtual financing arrangement in compliance with the applicable laws and after obtaining the necessary corporate approvals, whereby ASML loaned the tax value of the options granted to employees subject to the Dutch tax-regime. The interest-free loans issued under this arrangement are repayable to ASML on the exercise date of the respective option, provided that the option is actually exercised. If the options expire unexercised, the loans are forgiven.
ASML’s Supervisory Board approved the Stock Option Plans 2000 at the time, including the loans, as these were part of the Stock Option Plan.
In 2006, the Company launched a stock option plan for Dutch employees holding stock options granted in 2000 (option “A”), which expire in 2012. In this plan the Company granted options (option “B”) which only become effective after option “A” expires unexercised in 2012. The virtual employee loan in conjunction with option “A” will then be transferred to option “B” and consequentially gets the status of a perpetual loan.
No compensation expenses are included in the consolidated income statement for the years 2011 and 2010.
Employee Purchase Plan
Every quarter, ASML offers its worldwide payroll employees the opportunity to buy ASML shares or ASML stock options against fair value out of their net salary. The fair value for shares is determined based on the closing price of the ordinary shares on Euronext Amsterdam on the grant-date. The fair value of the stock options is determined using a Black-Scholes option valuation model. For the assumptions on which the Black-Scholes option valuation model is used, see the disclosure above under the caption “Option Plans”. The maximum net amount for which employees can participate in the plan amounts to 10.0 percent of gross base salary. When employees retain the shares and/or stock options for a minimum of 12 months, ASML will pay out a 20.0 percent cash bonus on the net invested amount.
Deferred compensation plans
In July 2002, ASML adopted a non-qualified deferred compensation plan for its United States employees that allows a select group of management or highly compensated employees to defer a portion of their salary, bonus, and commissions. The plan allows ASML to credit additional amounts to the participants’ account balances. The participants divide their funds among the investments available in the plan. Participants elect to receive their funds in future periods after the earlier of their employment termination or their withdrawal election, at least three years after deferral. There were minor expenses relating to this plan in 2011 and 2010. On December 31, 2011 and 2010, the Company’s liability under the deferred compensation plan was EUR 10.2 million and EUR 9.4 million, respectively.
Pension plans
ASML maintains various pension plans covering substantially all of its employees. The Company’s employees in the Netherlands, approximately 4,500 in full-time equivalents (“FTEs”), participate in a multi-employer union plan (“Bedrijfstakpensioenfonds Metalektro”) determined in accordance with the collective bargaining agreements effective for the industry in which ASML operates. This collective bargaining agreement has no expiration date. This multiemployer union plan covers approximately 1,220 companies and 139,000 contributing members. ASML’s contribution to
| ASML STATUTORY ANNUAL REPORT 2011 | 98 |
the multi-employer union plan is less than 5.0% of the total contribution to the plan as per the annual report for the year ended December 31, 2010. The plan monitors its risks on a global basis, not by company or employee, and is subject to regulation by Dutch governmental authorities. By law (the Dutch Pension Act), a multi-employer union plan must be monitored against specific criteria, including the coverage ratio of the plan’s assets to its obligations. This coverage ratio must exceed 104.3 percent for the total plan. Every company participating in a Dutch multi-employer union plan contributes a premium calculated as a percentage of its total pensionable salaries, with each company subject to the same percentage contribution rate. The premium can fluctuate yearly based on the coverage ratio of the multi-employer union plan. The pension rights of each employee are based upon the employee’s average salary during employment.
ASML’s net periodic pension cost for this multi-employer union plan for any period is the amount of the required contribution for that period. A contingent liability may arise from, for example, possible actuarial losses relating to other participating entities because each entity that participates in a multi-employer union plan shares in the actuarial risks of every other participating entity or any responsibility under the terms of a plan to finance any shortfall in the plan if other entities cease to participate.
The coverage ratio of the multi-employer union plan decreased to 90.0 percent as of December 31, 2011 (December 31, 2010: 96.0 percent). Because of the low coverage ratio, PME (“Pensioenfonds Metalektro) prepared and executed a so-called “Recovery Plan” which was approved by De Nederlandsche Bank (the Dutch central bank, which is the supervisor of all pension companies in the Netherlands). Due to the low coverage ratio and according the obligation of the “Recovery Plan” the pension premium percentage will increase from 23.0 percent in 2011 to 24.0 percent in 2012 (the impact for ASML is 0.64 percent increase). The coverage ratio is calculated by dividing the fund’s capital by the total sum of pension liabilities and is based on actual market interest.
ASML also participates in several defined contribution pension plans, with ASML’s expenses for these plans equaling the contributions made in the relevant period.
The Company’s pension costs for all employees for the three years ended December 31, 2011 and 2010 were:
Year ended December 31 (in thousands) | 2011 EUR | 2010 EUR | ||||||
Pension plan based on multi-employer union plan | 31,819 | 29,643 | ||||||
Pension plans based on defined contribution | 14,128 | 10,950 | ||||||
|
|
|
| |||||
Pension and retirement expenses | 45,947 | 40,593 | ||||||
|
|
|
| |||||
| ASML STATUTORY ANNUAL REPORT 2011 | 99 |
24. Commitments, Contingencies and Guarantees
The Company has various contractual obligations, some of which are required to be recorded as liabilities in the Company’s consolidated financial statements, including long- and short-term debt. Others, namely operating lease commitments, purchase obligations and guarantees, are generally not required to be recognized as liabilities on the Company’s statement of financial position but are required to be disclosed.
Tabular Disclosure of Contractual Obligations
The Company’s contractual obligations as of December 31, 2011 can be summarized as follows:
Payments due by period (in thousands) | Total EUR | 1 year EUR | 2 year EUR | 3 year EUR | 4 year EUR | 5 year EUR | After 5 years EUR | |||||||||||||||||||||
Long-Term Debt Obligations, including interest charges1 | 859,575 | 38,779 | 38,653 | 38,571 | 38,570 | 38,571 | 666,431 | |||||||||||||||||||||
Operating Lease Obligations | 102,051 | 32,858 | 22,659 | 16,055 | 11,812 | 8,252 | 10,415 | |||||||||||||||||||||
Purchase Obligations | 1,884,452 | 1,674,077 | 190,054 | 8,986 | 4,112 | 4,019 | 3,204 | |||||||||||||||||||||
Liability for uncertain tax positions | 64,990 | 10,141 | 5,989 | 647 | — | 17,051 | 31,162 | |||||||||||||||||||||
|
|
|
|
|
|
|
|
|
|
|
|
|
| |||||||||||||||
Total Contractual Obligations | 2,911,068 | 1,755,855 | 257,355 | 64,259 | 54,494 | 67,893 | 711,212 | |||||||||||||||||||||
|
|
|
|
|
|
|
|
|
|
|
|
|
| |||||||||||||||
| 1 | See Note 19 for the amounts excluding interest charges. |
Long-term debt obligations mainly relates to interest payments and principal amount of the Eurobond. See Note 19.
Operating lease obligations include leases of equipment and facilities. Lease payments recognized as an expense were EUR 40.6 million and EUR 37.9 million for the years ended December 31, 2011 and 2010, respectively.
Several operating leases for the Company’s buildings contain purchase options, exercisable at the end of the lease, and in some cases, during the term of the lease. The amounts to be paid if ASML should exercise these purchase options at the end of the lease as of December 31, 2011 can be summarized as follows:
Purchase options due by period (in thousands) | Total EUR | 1 year EUR | 2 year EUR | 3 year EUR | 4 year EUR | 5 year EUR | After 5 years EUR | |||||||||||||||||||||
Purchase options | 22,982 | — | — | 8,999 | — | 13,983 | — | |||||||||||||||||||||
Purchase obligations include purchase commitments with vendors in the ordinary course of business. ASML expects that it will honor these purchase obligations to fulfill future sales, in line with the timing of those future sales. The general terms and conditions of the agreements relating to the major part of the Company’s purchase commitments as of December 31, 2011 contain clauses that enable ASML to delay or cancel delivery of ordered goods and services up to the dates specified in the corresponding purchase contracts. These terms and conditions that ASML has agreed with its supply chain partners give ASML additional flexibility to adapt its purchase obligations to its requirements in light of the inherent cyclicality of the semiconductor equipment industry in which the Company operates. The Company establishes a provision for cancellation fees when it is probable that the liability has been incurred and the amount of cancellation fees is reasonably estimable.
The contractual obligations for the liability for uncertain tax positions amount to EUR 65.0 million. Additionally, we have recorded uncertain tax positions for an amount of EUR 90.4 million for which the timing of cash outflows is uncertain because in certain tax jurisdictions ASML’s position has been contested by the tax authorities. The duration of the associated litigation procedures cannot be assessed. For further disclosure regarding the liability for uncertain tax positions, see Note 26.
For further disclosure regarding these derivative financial instruments, see Note 5.
Tax unity
ASML Holding N.V. forms a tax unity together with its Dutch subsidiaries for purposes of Dutch tax law and are as such jointly and severally liable for the tax debts of the unity.
| ASML STATUTORY ANNUAL REPORT 2011 | 100 |
25. Legal Contingencies
ASML is party to various legal proceedings generally incidental to its business. ASML also faces exposures from other actual or potential claims and legal proceedings. In addition, ASML customers may be subject to claims of infringement from third parties alleging that the ASML equipment used by those customers in the manufacture of semiconductor products, and/or the methods relating to use of the ASML equipment, infringes one or more patents issued to those third parties. If these claims were successful, ASML could be required to indemnify such customers for some or all of any losses incurred or damages assessed against them as a result of that infringement.
The Company accrues for legal costs related to litigation in its consolidated income statement at the time when the related legal services are actually provided to ASML. In 2011, no estimated losses were recorded as a charge to the Company’s consolidated income statement (2010: EUR 1.5 million loss).
From late 2001 through 2004, the Company was party to a series of civil litigations and administrative proceedings in which Nikon alleged ASML’s infringement of Nikon patents relating to lithography. ASML in turn filed claims against Nikon. Pursuant to agreements executed on December 10, 2004, ASML, Zeiss and Nikon agreed to settle all pending worldwide patent litigation between the companies. The settlement included an exchange of releases, a patent Cross-License agreement related to lithography equipment used to manufacture semiconductor devices (the “Nikon Cross-License Agreement”) and payments to Nikon by ASML and Zeiss. In connection with the settlement, ASML and Zeiss made settlement payments to Nikon from 2004 to 2007. The license period for certain patents subject to the Nikon Cross-License Agreement, which were not perpetually licensed, ended on December 31, 2009. Pursuant to the terms of the Nikon Cross-License Agreement, the parties have agreed, from January 1, 2010 to December 31, 2014 (the “Cross-License Transition Period”), not to bring suit for claims related to infringement of those patents or for claims related to infringement of patents issued during the Cross-License Transition Period. However, beginning on January 1, 2015, the parties may bring suit for infringement of patents subject to the Nikon Cross-License Agreement, including any infringement that occurred during the Cross-License Transition Period. Damages related to claims for patent infringement occurring during the Cross-License Transition Period are limited to three percent of the net sales price of products utilizing patents that are valid and enforceable.
| ASML STATUTORY ANNUAL REPORT 2011 | 101 |
26. Income Taxes
The components of provision for income taxes are as follows:
Year ended December 31 (in thousands) | 2011 EUR | 2010 EUR | ||||||
Current tax | (113,852 | ) | (202,347 | ) | ||||
Deferred tax | (52,887 | ) | 34,186 | |||||
|
|
|
| |||||
Total | (166,739 | ) | (168,161 | ) | ||||
|
|
|
| |||||
The Dutch statutory tax rate was 25.0 percent in 2011 and 25.5 percent in 2010. Tax amounts in other jurisdictions are calculated at the rates prevailing in the relevant jurisdictions.
The reconciliation of the provision for income taxes shown in the consolidated income statement, based on the effective tax rate, with the Dutch statutory tax rate, is as follows:
Year ended December 31 (in thousands) | 2011 EUR | % | 2010 EUR | % | ||||||||||||
Income before income taxes | 1,660,810 | 100.0 | 1,153,614 | 100.0 | ||||||||||||
Income tax provision based on the Company’s domestic tax rate | (415,202 | ) | 25.0 | (294,172 | ) | 25.5 | ||||||||||
Effects of tax rates in foreign jurisdictions | 39,592 | (2.5 | ) | 34,741 | (3.0 | ) | ||||||||||
Adjustments of taxes in respect of changes in the applicable tax rate1 | — | — | (264 | ) | — | |||||||||||
Adjustments in respect of tax incentives | 182,373 | (11.0 | ) | 111,480 | (9.6 | ) | ||||||||||
Adjustment in respect of prior years’ current taxes | 9,097 | (0.5 | ) | 22,212 | (1.9 | ) | ||||||||||
Other credits and non-taxable items | 17,401 | (1.0 | ) | (42,158 | ) | 3.6 | ||||||||||
|
|
|
|
|
|
|
| |||||||||
Provision for income taxes shown in the consolidated income statement | (166,739 | ) | 10.0 | (168,161 | ) | 14.6 | ||||||||||
|
|
|
|
|
|
|
| |||||||||
| 1 | At the end of 2010, the Dutch government enacted a tax rate reduction from 25.5 percent in 2010 to 25.0 percent in 2011. |
Income tax provision based on the Company’s domestic tax rate
Provision for income taxes is based on the Company’s Dutch statutory income tax rate and reflects the provision for income taxes that would have been applicable if all of the Company’s income was derived from its Dutch operations and there were no permanent book tax differences and no other tax facilities.
Effects of tax rates in foreign jurisdictions
A portion of ASML’s results are realized in countries other than the Netherlands where different tax rates are applicable.
Adjustments in respect of tax incentives
Adjustments in respect of tax incentives relate to reduced tax rates in several jurisdictions, mainly consisting of the agreement with the Dutch fiscal authorities in December 2010 regarding the application of the “Innovation Box”, a facility under Dutch corporate tax law pursuant to which income associated with R&D is partially exempted from taxation. This tax ruling has retroactive effect to January 1, 2007 and is valid through December 31, 2016. Thereafter the validity of this ruling may be extended or this ruling may be adapted depending on a possible change of circumstances.
Adjustments in respect of prior years’ current taxes
In 2011, ASML recognized additional tax benefits of EUR 9.1 million or 0.5 percent of income before income taxes related to previous years’ taxes.
In 2010, ASML recognized a tax benefit of EUR 22.2 million or 1.9 percent of income before income taxes mainly attributable to the application of the Innovation Box for prior years, which had a favorable effect on the effective tax rate for 2010 (EUR 34.0 million including interest or 2.9 percent).
Other credits and non-taxable items
Other credits and non-taxable items reflect the impact on statutory rates of permanent non-taxable items such as non-deductible taxes, non-deductible interest expense, and non-deductible meals and entertainment, as well as the impact of (the reversal of) various tax credits, and the impact related to unrealized profits resulting from intercompany transactions on the Company’s provision for income taxes and movements in the liability for uncertain tax positions.
| ASML STATUTORY ANNUAL REPORT 2011 | 102 |
Income taxes recognized directly in equity
Income taxes recognized directly in equity (including other comprehensive income) is as follows:
Income tax recognized in equity (in thousands) | 2011 EUR | 2010 EUR | ||||||
Current tax | ||||||||
Derivative financial instruments1 | 6,257 | 8,262 | ||||||
Share-based payments | 11 | (106 | ) | |||||
Deferred tax | ||||||||
Derivative financial instruments1 | — | — | ||||||
Share-based payments | 3,516 | (3,861 | ) | |||||
|
|
|
| |||||
Income tax recognized in equity | 9,784 | 4,295 | ||||||
|
|
|
| |||||
| 1 | Recognized directly in Other Comprehensive Income |
Liability for uncertain tax positions and deferred taxes
The deferred tax position and liability for uncertain tax positions recorded on the statement of financial position are as follows:
As of December 31 (in thousands) | 2011 EUR | 2010 EUR | ||||||
Liability for uncertain tax positions | (155,432 | ) | (143,908 | ) | ||||
Deferred tax position | 164,389 | 193,093 | ||||||
|
|
|
| |||||
Total | 8,957 | 49,185 | ||||||
|
|
|
| |||||
Liability for uncertain tax positions
The calculation of the Company’s liability for uncertain tax positions involves uncertainties in the application of complex tax laws. The Company’s estimate for the potential outcome of any uncertain tax issue is highly judgmental. The Company believes that it has adequately provided for uncertain tax positions. However, settlement of these uncertain tax positions in a manner inconsistent with its expectations could have a material impact on its consolidated financial statements.
As of December 31, 2011 ASML has a liability for uncertain tax positions of EUR 155.4 million (2010: EUR 162.1 million). The total liability for uncertain tax positions is classified as non-current deferred and other tax liabilities because payment of cash is not expected within one year. In 2010, an amount of EUR 143.9 million of this liability for uncertain tax positions was classified as non-current deferred and other tax liabilities because payment of cash was not expected within one year, while an amount of EUR 18.2 million was classified as current deferred tax and other liabilities because payment of cash was expected within one year. The total liability for uncertain tax positions, if reversed, would have a favorable effect on the Company’s effective tax rate.
A reconciliation of the beginning and ending balance of the liability for uncertain tax positions is as follows:
As of December 31 (in millions) | 2011 EUR | 2010 EUR | ||||||
Balance, January 1 | 162,066 | 133,270 | ||||||
Gross increases - tax positions in prior period | 11,121 | 8,574 | ||||||
Gross decreases - tax positions in prior period | (24,566 | ) | (1,075 | ) | ||||
Gross increases - tax positions in current period | 21,258 | 24,690 | ||||||
Settlements | (10,403 | ) | (3,393 | ) | ||||
Lapse of statute of limitations | (4,044 | ) | — | |||||
|
|
|
| |||||
Total liability for uncertain tax positions | 155,432 | 162,066 | ||||||
Less: current portion of liability for uncertain tax positions | — | 18,158 | ||||||
Non-current portion of liability for uncertain tax positions | 155,432 | 143,908 | ||||||
|
|
|
| |||||
| ASML STATUTORY ANNUAL REPORT 2011 | 103 |
For the year 2011 the gross decreases in tax positions in prior period mainly relates to the release of tax positions as a result of concluded tax audits.
The Company estimates that the total liability for uncertain tax positions will decrease by EUR 10.1 million within the next 12 months. The estimated changes to the liability for uncertain tax positions within the next 12 months are mainly due to the expiration of statute of limitations.
The Company is subject to tax audits in its major tax jurisdictions for years from and including 2007 onwards in the Netherlands, for years from and including 2004 onwards for Hong Kong, and for years from and including 2001 onwards for the United States. In the course of such audits, local tax authorities may challenge the positions taken by the Company. For the years 2004 through 2010, the partial exemption of taxable profits is subject to tax audits in certain tax jurisdictions.
Deferred tax position
The changes in deferred income tax assets and liabilities consist of the following elements:
Changes in deferred tax assets and liabilities (in thousands) | 2011 EUR | 2010 EUR | ||||||
Balance, January 1 | 193,093 | 135,951 | ||||||
Income statement | (32,401 | ) | 38,898 | |||||
Equity | (3,516 | ) | 3,861 | |||||
Exchange differences | 7,213 | 14,383 | ||||||
|
|
|
| |||||
Balance, December 31 | 164,389 | 193,093 | ||||||
|
|
|
| |||||
The composition of total deferred tax assets and liabilities in the consolidated financial statements is as follows:
Deferred tax assets Composition of temporary differences (in thousands) | January 1, 2011 EUR | Consolidated Income Statement EUR | Equity EUR | Exchange differences EUR | December 31, 2011 EUR | |||||||||||||||
Unrealized profits resulting from intercompany transactions | 31,151 | 25,490 | — | 3,686 | 60,327 | |||||||||||||||
Inventories | 70,777 | (36,352 | ) | — | 510 | 34,935 | ||||||||||||||
Capitalized research and development expenditures | 18,652 | 5,172 | — | 1,198 | 25,022 | |||||||||||||||
Deferred revenue | 10,890 | 11,746 | — | 1,256 | 23,892 | |||||||||||||||
Provisions | 21,828 | (7,463 | ) | — | 150 | 14,515 | ||||||||||||||
Installation and warranty reserve | 8,092 | 98 | — | 582 | 8,772 | |||||||||||||||
Tax effect carry-forward losses | 27,756 | (18,695 | ) | — | (1,326 | ) | 7,735 | |||||||||||||
Fixed assets | 4,386 | 1,872 | — | 237 | 6,495 | |||||||||||||||
Restructuring and impairment | 6,074 | (1,063 | ) | — | 135 | 5,146 | ||||||||||||||
Alternative minimum tax credits1 | 4,658 | 112 | — | 258 | 5,028 | |||||||||||||||
Share-based payments | 8,220 | (1,124 | ) | (3,516 | ) | 80 | 3,660 | |||||||||||||
Bilateral advance pricing agreement2 | 7,993 | (6,583 | ) | — | 16 | 1,426 | ||||||||||||||
Other temporary differences | 13,717 | 938 | — | 647 | 15,302 | |||||||||||||||
|
|
|
|
|
|
|
|
|
| |||||||||||
Total | 234,194 | (25,852 | ) | (3,516 | ) | 7,429 | 212,255 | |||||||||||||
|
|
|
|
|
|
|
|
|
| |||||||||||
| 1 | Alternative minimum tax credits relate to prepaid US taxes which are credited against future taxable profits after the carry-forward losses used. |
| 2 | The Bilateral advance pricing agreement relates to intellectual property which is capitalized from a tax perspective resulting in a temporary difference. |
| ASML STATUTORY ANNUAL REPORT 2011 | 104 |
Deferred tax liabilities Composition of temporary differences (in thousands) | January 1, 2011 EUR | Consolidated Income Statement EUR | Equity EUR | Exchange differences EUR | December 31, 2011 EUR | |||||||||||||||
Capitalized research and development expenditures | (29,252 | ) | 2,830 | — | 65 | (26,357 | ) | |||||||||||||
Fixed assets | (9,661 | ) | (9,175 | ) | — | (272 | ) | (19,108 | ) | |||||||||||
Borrowing costs | (1,231 | ) | (323 | ) | — | — | (1,554 | ) | ||||||||||||
Other temporary differences | (957 | ) | 119 | — | (9 | ) | (847 | ) | ||||||||||||
|
|
|
|
|
|
|
|
|
| |||||||||||
Total | (41,101 | ) | (6,549 | ) | — | (216 | ) | (47,866 | ) | |||||||||||
|
|
|
|
|
|
|
|
|
| |||||||||||
Deferred tax assets Composition of temporary differences (in thousands) | January 1, 2010 EUR | Consolidated Income Statement EUR | Equity EUR | Exchange differences EUR | December 31, 2010 EUR | |||||||||||||||
Unrealized profits resulting from intercompany transactions | 30,347 | (3,377 | ) | — | 4,181 | 31,151 | ||||||||||||||
Inventories | 29,903 | 39,663 | — | 1,211 | 70,777 | |||||||||||||||
Capitalized research and development expenditures | 20,344 | (2,552 | ) | — | 860 | 18,652 | ||||||||||||||
Deferred revenue | 4,235 | 6,475 | — | 180 | 10,890 | |||||||||||||||
Provisions | 12,422 | 8,671 | — | 735 | 21,828 | |||||||||||||||
Installation and warranty reserve | 3,745 | 4,137 | — | 210 | 8,092 | |||||||||||||||
Tax effect carry-forward losses | 107,060 | (84,794 | ) | — | 5,490 | 27,756 | ||||||||||||||
Fixed assets | 13,390 | (9,244 | ) | — | 240 | 4,386 | ||||||||||||||
Restructuring and impairment | 8,004 | (2,572 | ) | — | 642 | 6,074 | ||||||||||||||
Alternative minimum tax credits1 | 2,896 | 1,588 | — | 174 | 4,658 | |||||||||||||||
Share-based payments | 7,195 | (3,414 | ) | 3,861 | 578 | 8,220 | ||||||||||||||
Bilateral advance pricing agreement2 | 14,390 | (6,778 | ) | — | 381 | 7,993 | ||||||||||||||
Other temporary differences | 12,722 | (916 | ) | — | 1,911 | 13,717 | ||||||||||||||
|
|
|
|
|
|
|
|
|
| |||||||||||
Total | 266,653 | (53,113 | ) | 3,861 | 16,793 | 234,194 | ||||||||||||||
|
|
|
|
|
|
|
|
|
| |||||||||||
| 1 | Alternative minimum tax credits relate to prepaid US taxes which are credited against future taxable profits after the carry-forward losses used. |
| 2 | The Bilateral advance pricing agreement relates to intellectual property which is capitalized from a tax perspective resulting in a temporary difference. |
Deferred tax liabilities Composition of temporary differences (in thousands) | January 1, 2010 EUR | Consolidated Income Statement EUR | Equity EUR | Exchange differences EUR | December 31, 2010 EUR | |||||||||||||||
Capitalized research and development expenditures | (72,521 | ) | 43,684 | — | (415 | ) | (29,252 | ) | ||||||||||||
Brion intellectual property | (6,888 | ) | 7,981 | — | (1,093 | ) | — | |||||||||||||
Borrowing costs | (2,716 | ) | 1,485 | — | — | (1,231 | ) | |||||||||||||
Transfer pricing | (2,986 | ) | 3,237 | — | (251 | ) | — | |||||||||||||
Fixed assets | (7,354 | ) | (1,741 | ) | — | (566 | ) | (9,661 | ) | |||||||||||
Temporary depreciation investments1 | (36,293 | ) | 36,293 | — | — | — | ||||||||||||||
Other temporary differences | (1,944 | ) | 1,072 | — | (85 | ) | (957 | ) | ||||||||||||
|
|
|
|
|
|
|
|
|
| |||||||||||
Total | (130,702 | ) | 92,011 | — | (2,410 | ) | (41,101 | ) | ||||||||||||
|
|
|
|
|
|
|
|
|
| |||||||||||
| 1 | The Company has temporarily depreciated part of its investments in its US Group Companies which has been deducted from the taxable base in the Netherlands. |
Tax effect carry-forward losses
Deferred tax assets from carry-forward losses result predominantly from net operating loss carry-forwards incurred in the United States prior to 2011.
Net operating losses qualified as tax losses under United States federal tax laws incurred by United States group companies can in general be offset against future profits realized in the 20 years following the year in which the losses are incurred. The Company’s ability to use its carry forward United States federal tax losses in existence at December 31, 2011, will expire in the period 2021 through 2023. Net operating losses qualified as tax losses under United States state tax laws incurred by United States group companies can in general be offset against future profits realized in the 5 to 20 years following the year in which the losses are incurred. The period of net operating loss carry forward for United States state tax purposes depends on the state in which the tax loss arose. The Company’s ability to use United States state tax loss carry forwards in existence at December 31, 2011, is subject to varying state statutes (providing for
| ASML STATUTORY ANNUAL REPORT 2011 | 105 |
periods of between 5 and 20 years) and valuation allowances have been set up for state carry forward losses that are not expected to be realized before they expire. The total amount of losses carried forward under United States federal tax laws as of December 31, 2011, is EUR 20.1 million tax basis or EUR 7.7 million tax effect. Management believes that all qualified federal tax losses will be offset by future taxable income before the Company’s ability to utilize those losses expires. This analysis takes into account the Company’s projected future taxable operating income and possible tax planning alternatives available to the Company.
27. Subsidiaries
Details of the Company’s main subsidiaries at December 31, 2011 are as follows:
Legal Entity | Country of Incorporation | |
| Subsidiaries of ASML Holding N.V.1: | ||
| ASML Netherlands B.V. | Netherlands (Veldhoven) | |
| ASML MaskTools B.V. | Netherlands (Veldhoven) | |
| ASML Systems B.V. | Netherlands (Veldhoven) | |
| ASML Germany GmbH | Germany (Dresden) | |
| ASML France S.a.r.l. | France (Montbonnot) | |
| ASML (UK) Ltd. | UK (Paisley (Scotland)) | |
| ASML Israel (2001) Ltd. | Israel (Ramat-Gan) | |
| ASML Ireland Ltd. | Ireland (Dublin) | |
| ASML Italy S.r.l. | Italy (Avezzano) | |
| ASML Hong Kong Ltd. | Hong Kong SAR | |
| ASML Singapore Pte. Ltd. | Singapore | |
| ASML Korea Co. Ltd. | Korea (Kyunggi-Do) | |
| ASML Japan Co. Ltd. | Japan (Kawasaki-shi, Kanagawa-Ken) | |
| ASML Lithography Facilities Science and Technology Co. Ltd.2 | China (Tianjin) | |
| ASML Taiwan Ltd. | Taiwan (Hsinchu) | |
| ASML Equipment Malaysia Sdn. Bhd. | Malaysia (Penang) | |
| ASML Belgium BVBA | Belgium (Essen) | |
| ASML Belgium Finance CV3 | Belgium (Essen) | |
| Brion Technologies (Shenzhen) Co. Ltd. | China (Shenzhen) | |
| Brion Technologies, Inc. | US (Delaware) | |
| ASML US Inc. | US (Delaware) | |
| ASML Hong Kong Logistic Services Ltd. | Hong Kong SAR | |
| 1 | All of the Company’s subsidiaries are (directly or indirectly) wholly-owned. |
| 2 | ASML (Tianjin) Co Ltd. was renamed to ASML Lithography Facilities Science and Technology Co. Ltd. as of August 3, 2010. |
| 3 | Limited partnership with ASML Belgium BVBA as managing partner and ASML Holding N.V. as limited partner. |
| ASML STATUTORY ANNUAL REPORT 2011 | 106 |
28. Segment Disclosure
ASML operates in one reportable segment for the development, manufacturing, marketing and servicing of lithography equipment. ASML’s Chief Executive Officer has been identified as the chief operating decision-maker, who reviews operating results to make decisions about allocating resources and assessing performance for the entire Company.
Management reporting includes net system sales figures of new and used systems. Net sales for new and used systems were as follows:
Year ended December 31 (in thousands) | 2011 EUR | 2010 EUR | ||||||
New systems | 4,780,720 | 3,704,290 | ||||||
Used systems | 103,193 | 190,452 | ||||||
|
|
|
| |||||
Net system sales | 4,883,913 | 3,894,742 | ||||||
|
|
|
| |||||
In 2011, net sales increased by 25.4 percent to EUR 5,651.0 million from EUR 4,507.9 million in 2010. The increase in net sales was caused by increased demand for lithography imaging systems required for all of the various chip layers: customers continued to invest in new leading-edge immersion technology as well as dry lithography tools in order to execute their strategic investments in new technology and capacity to meet demand. Sales were derived from all three major markets, with the Logic segment generating the majority of system sales and DRAM and Nand-Flash memory generating the remainder.
Segment performance is evaluated by the Company’s management based on U.S. GAAP net income or loss which in certain respect, as explained in the table below, is measured differently from net income or loss reported by the Company in its consolidated financial statements, which are based on IFRS, as adopted by the EU.
Year ended December 31 (in thousands) | 2011 EUR | 2010 EUR | ||||||
Net system sales | 4,883,913 | 3,894,742 | ||||||
Net service and field option sales | 767,122 | 613,196 | ||||||
|
|
|
| |||||
Total net sales | 5,651,035 | 4,507,938 | ||||||
Cost of system sales | 2,793,931 | 2,222,965 | ||||||
Cost of service and field option sales | 407,714 | 329,803 | ||||||
|
|
|
| |||||
Total cost of sales | 3,201,645 | 2,552,768 | ||||||
|
|
|
| |||||
Gross profit on sales | 2,449,390 | 1,955,170 | ||||||
Research and development costs | 590,270 | 523,426 | ||||||
Selling, general and administrative costs | 217,904 | 181,045 | ||||||
|
|
|
| |||||
Income from operations | 1,641,216 | 1,250,699 | ||||||
Interest income | 41,156 | 15,125 | ||||||
Interest expense | (33,737 | ) | (23,301 | ) | ||||
|
|
|
| |||||
Income from operations before income taxes | 1,648,635 | 1,242,523 | ||||||
Provision for income taxes | (181,675 | ) | (220,703 | ) | ||||
|
|
|
| |||||
Net income | 1,466,960 | 1,021,820 | ||||||
Differences U.S. GAAP and IFRS | 27,111 | (36,367 | ) | |||||
|
|
|
| |||||
Net income under IFRS | 1,494,071 | 985,453 | ||||||
|
|
|
| |||||
| ASML STATUTORY ANNUAL REPORT 2011 | 107 |
Segment performance is also evaluated by the Company’s management based on U.S. GAAP for total assets. The table below presents the measurements and the reconciliation to total assets in the consolidated statement of financial position:
(in thousands) | 2011 EUR | 2010 EUR | ||||||
Total assets for management reporting purposes | 7,260,815 | 6,180,358 | ||||||
Differences U.S. GAAP and IFRS | 298,348 | 273,475 | ||||||
|
|
|
| |||||
Total assets for IFRS | 7,559,163 | 6,453,833 | ||||||
|
|
|
| |||||
For geographical reporting, net sales are attributed to the geographic location in which the customers’ facilities are located. Identifiable assets are attributed to the geographic location in which these assets are located. Net sales and identifiable assets (total assets excluding goodwill and other intangible assets) by geographic region were as follows:
Year ended December 31 (in thousands) | Net sales EUR | Non-current assets EUR | ||||||
2011 | ||||||||
Japan | 405,595 | 69,001 | ||||||
Korea | 1,318,777 | 16,250 | ||||||
Singapore | 436,308 | 1,167 | ||||||
Taiwan | 1,146,601 | 46,418 | ||||||
Rest of Asia | 450,796 | 1,496 | ||||||
Europe | 505,129 | 1,294,397 | ||||||
United States | 1,387,829 | 259,051 | ||||||
|
|
|
| |||||
Total | 5,651,035 | 1,687,780 | ||||||
2010 | ||||||||
Japan | 396,748 | 3,837 | ||||||
Korea | 1,396,028 | 4,701 | ||||||
Singapore | 215,357 | 1,079 | ||||||
Taiwan | 1,380,400 | 50,130 | ||||||
Rest of Asia | 239,914 | 1,619 | ||||||
Europe | 203,548 | 1,031,792 | ||||||
United States | 675,943 | 267,790 | ||||||
|
|
|
| |||||
Total | 4,507,938 | 1,360,948 | ||||||
|
|
|
| |||||
In 2011, sales to the Company’s largest customer accounted for EUR 1,311.7 million or 23.2 percent of net sales (2010: EUR 1,270.8 million or 28.2 percent of net sales).
ASML’s three largest customers (based on net sales) accounted for EUR 40.7 percent of accounts receivable at December 31, 2011 and 42.4 percent of accounts receivable at December 31, 2010
Substantially all our sales were export sales in 2011 and 2010.
| ASML STATUTORY ANNUAL REPORT 2011 | 108 |
29. Personnel
Personnel expenses for all payroll employees were:
Year ended December 31 (in thousands) | 2011 EUR | 2010 EUR | ||||||
Wages and salaries | 648,869 | 551,683 | ||||||
Social security expenses | 52,550 | 42,468 | ||||||
Pension and retirement expenses | 45,947 | 40,593 | ||||||
Share-based payments | 12,430 | 12,109 | ||||||
|
|
|
| |||||
Personnel expenses | 759,796 | 646,853 | ||||||
|
|
|
| |||||
The average number of payroll employees in FTEs employed during 2011 and 2010 was 7,627 and 6,785 respectively. The total number of payroll and temporary personnel employed in FTEs per sector was:
As of December 31 | 2011 | 2010 | ||||||
Customer Support | 2,478 | 2,236 | ||||||
SG&A | 723 | 727 | ||||||
Industrial Engineering | 420 | 398 | ||||||
Manufacturing & Logistics | 2,852 | 2,659 | ||||||
R&D | 3,417 | 3,225 | ||||||
Total employees (in FTEs) | 9,890 | 9,245 | ||||||
|
|
|
| |||||
Less: Temporary employees (in FTEs) | 1,935 | 2,061 | ||||||
|
|
|
| |||||
Payroll employees (in FTEs) | 7,955 | 7,184 | ||||||
|
|
|
| |||||
In 2011 and 2010, a total of 4,313 and 3,805 (on average) payroll employees in FTEs in the Company’s operations (excluding temporary employees), respectively, were employed in the Netherlands.
| ASML STATUTORY ANNUAL REPORT 2011 | 109 |
30. Board of Management and Supervisory Board remuneration
The remuneration of the members of the Board of Management is determined by the Supervisory Board on the advice of the Remuneration Committee. The 2010 Remuneration Policy, as adopted by the AGM on March 24, 2010, was not changed in 2011.
The 2010 Remuneration Policy enables ASML to continue to attract, reward and retain qualified and experienced industry professionals in an international labor market. The remuneration structure and levels are assessed against a reference market by benchmarking. The total remuneration in 2011 consists of base salary, short-term performance incentives (in cash), long-term performance incentives (in shares) and other benefits.
Total direct compensation, pension and other benefits
The remuneration of the members of the Board of Management in 2011, 2010 and 2009 was as follows:
| Fixed | Short-term (variable) | Long-term (variable) | Total Remuneration | Other | ||||||||||||||||||||||||||||||||
| Financial Year | Base salary EUR | STI (Cash)1 EUR | Option awards2 EUR | LTI (share awards)3 EUR | Total6 EUR | Pension7 EUR | Compensation Pension Premium8 EUR | Other benefits and expense reimbursement9 EUR | ||||||||||||||||||||||||||||
E. Meurice | 2011 | 787,000 | 586,708 | — | 1,413,218 | 4 | 2,786,926 | 140,113 | 88,050 | 136,765 | ||||||||||||||||||||||||||
| 2010 | 757,000 | 566,236 | 42,648 | 935,617 | 5 | 2,301,501 | 136,697 | — | 132,630 | |||||||||||||||||||||||||||
| 2009 | 735,000 | 507,150 | 466,164 | 1,042,576 | 2,750,890 | 91,950 | — | 141,377 | ||||||||||||||||||||||||||||
P.T.F.M. Wennink | 2011 | 488,000 | 291,043 | — | 875,493 | 4 | 1,654,536 | 85,994 | 94,455 | 44,669 | ||||||||||||||||||||||||||
| 2010 | 469,000 | 280,650 | 26,401 | 579,321 | 5 | 1,355,372 | 84,229 | — | 43,627 | |||||||||||||||||||||||||||
| 2009 | 455,000 | 251,160 | 288,578 | 646,055 | 1,640,793 | 56,317 | — | 44,886 | ||||||||||||||||||||||||||||
M.A. van den Brink | 2011 | 517,000 | 308,339 | — | 927,912 | 4 | 1,753,251 | 91,243 | 181,826 | 45,502 | ||||||||||||||||||||||||||
| 2010 | 497,000 | 297,405 | 28,025 | 617,004 | 5 | 1,439,434 | 90,388 | — | 44,817 | |||||||||||||||||||||||||||
| 2009 | 483,000 | 266,616 | 306,336 | 681,179 | 1,737,131 | 59,880 | — | 44,992 | ||||||||||||||||||||||||||||
F.J. van Hout | 2011 | 428,000 | 255,259 | — | 832,201 | 1,515,460 | 75,134 | 9,735 | 35,190 | |||||||||||||||||||||||||||
| 2010 | 412,000 | 246,541 | 23,209 | 471,700 | 1,153,450 | 65,300 | — | 34,549 | ||||||||||||||||||||||||||||
| 2009 | 400,000 | 220,800 | 241,522 | 123,111 | 985,433 | 40,800 | — | 35,199 | ||||||||||||||||||||||||||||
F.J.M. Schneider-Maunoury10 | 2011 | 416,000 | 248,102 | — | 676,945 | 1,341,047 | 56,475 | 4,290 | 28,313 | |||||||||||||||||||||||||||
| 2010 | 400,000 | 239,360 | — | 326,947 | 966,307 | 55,011 | — | 34,788 | ||||||||||||||||||||||||||||
| 2009 | 33,333 | 58,095 | — | — | 91,428 | 4,736 | — | 3,163 | ||||||||||||||||||||||||||||
| 1 | Actual short-term incentives (“STI”) (cash) chargeable to the company in the financial year (i.e. STI relating to performance in the current year but paid out in the next financial year). The accrued STI (cash) with respect to 2009 were paid out after ASML achieved a cumulative income from operations of at least 100 million Euro in two consecutive quarters after January 1, 2010. This was achieved on the basis of the Q1 and Q2 results for 2010. |
| 2 | The remuneration reported as part of the option awards is based on costs incurred under IFRS. The costs of the option awards are based on the actual vested number of option awards multiplied by the fair value of the option awards at grant date and are recorded in the consolidated income statement on a straight line basis over the vesting period. |
| 3 | The remuneration reported as part of the long-term incentives (“LTI”) (share awards) is based on costs incurred under IFRS. The costs of share awards are charged to the consolidated income statement over the 3 year vesting period based on the maximum achievable number of share awards. Therefore the costs for e.g. the financial year 2011 include costs of the BoM performance share plan 2011, 201 0 and 2009. Furthermore, the difference between the amount based on the maximum achievable number of share awards and the amount based on the actual number of share awards that vest, is released to the consolidated income statement on a yearly basis until the financial year in which the share awards vest. |
| 4 | The remuneration reported as part of the LTI (share awards) for the year 2011 includes an adjustment for the Board of Management performance share plan 2008 based on the actual number of share awards vested in 2011. The adjustment for Mr. Meurice, Mr. Wennink and for Mr. van den Brink amounts to EUR -148,040, EUR -91,645 and EUR -97,281, respectively. |
| 5 | The remuneration reported as part of the LTI (share awards) for the year 2010 includes an adjustment for the Board of Management performance share plan 2007 based on the actual number of share awards vested in 2010. The adjustment for Mr. Meurice, Mr. Wennink and for Mr. van den Brink amounts to EUR -296,287, EUR -183,612 and EUR -191,972, respectively. |
| 6 | This total reflects base salary, STI (cash), option awards and LTI (share awards). |
| 7 | The pension arrangement has been adjusted upwards to match common market practice as from 2010. Furthermore, since the pension arrangement for members of the Board of Management is a defined contribution plan, the Company does not have additional pension obligations beyond the annual premium contribution. As per 2010, the employee contribution to the pension plan is 4 percent of the pension base. |
| 8 | In 2011, compensation was paid to the Board of Management regarding the risk premium for spouse/orphan pensions to align the Board of Management pension arrangement with senior management. This concerned a reimbursement for risk premiums that were erroneously paid by the participants in the past. |
| 9 | Other benefits and expense reimbursement are gross amounts and may include housing costs, company car costs, travel expenses, social security costs, health and disability insurance costs and representation allowances. |
| 10 | For 2009, remuneration for Mr. Schneider-Maunoury regards only the month December. |
Short-term incentive
The annual performance-related cash incentive will have an on-target level of 75.0 percent of base salary for the Chief Executive Officer (“CEO”) and 60.0 percent for the other members of the Board of Management. The payouts are prorated, on a linear basis to the level of achievement of six performance criteria. Of the five quantitative performance criteria, three are based on the achievement of measurable financial targets, one on Technology Leadership Index (which also included qualitative elements) and one on achievements in the market position. Additionally, the qualitative target is based on the achievement of agreed key objectives.
| ASML STATUTORY ANNUAL REPORT 2011 | 110 |
In principle, the weighting of each of the five quantitative criteria is equal (weighted 80 percent in total). The sixth target is based on qualitative objectives (weighted 20 percent). The setting and measuring period of the financial and technology based targets is semiannual, and for the market related and qualitative targets it is annual. The overall payout is annual and the cash incentive is accrued during the performance period.
On January 17, 2012, the Remuneration Committee evaluated the Board of Managements’ performance on these six criteria and based on this evaluation, the payout level was determined to be 99.4 percent of the target level.
Performance Stock Options
In order to shift the focus from the short-term to the long-term, performance stock options are not a part of the 2010 Remuneration Policy. The value of this part of the remuneration has been moved into the long-term incentive plan which is paid in shares. 2009 was the last year in which performance stock options were granted to the members of the Board of Management, which means the actual number of performance stock options for 2009 achievement were awarded for the last time in 2010. Once the options are unconditionally awarded after fulfillment of the performance conditions, the options will be retained (lock-up period) by the Board of Management member for at least two years after the date of unconditional award or until the termination of employment, whichever period is shorter. The fair value of the options granted is determined based on the Black-Scholes option valuation model.
Details of vested options held by members of the Board of Management to purchase ordinary shares of ASML Holding N.V. are set out below:
| Jan. 1, 2011 | Exercised during 2011 | Share price on exercise date (EUR) | Vested during 2011 | Free tradable (Dec. 31, 2011) | With lock-up restriction (Dec. 31, 2011) | Exercise price (EUR) | Expiration date | |||||||||||||||||||||||||
E. Meurice | 125,000 | 125,000 | 30.70 | — | — | — | 10.62 | 10/15/2014 | ||||||||||||||||||||||||
| 57,770 | 34,500 | 24.23 | — | 23,270 | — | 11.53 | 1/19/2015 | |||||||||||||||||||||||||
| 12,500 | 12,500 | 24.30 | — | — | — | 11.52 | 1/21/2015 | |||||||||||||||||||||||||
| 88,371 | — | — | — | 88,371 | — | 17.90 | 1/18/2016 | |||||||||||||||||||||||||
| 95,146 | — | — | — | 95,146 | — | 20.39 | 1/17/2017 | |||||||||||||||||||||||||
| 42,448 | — | — | — | 42,448 | — | 17.20 | 2/4/2018 | |||||||||||||||||||||||||
| 84,895 | — | — | — | — | 84,895 | 12.39 | 2/2/2019 | |||||||||||||||||||||||||
P.T.F.M. Wennink | 31,500 | — | — | — | 31,500 | — | 58.00 | 1/20/2012 | ||||||||||||||||||||||||
| 20,000 | 20,000 | 27.32 | — | — | — | 11.53 | 1/19/2015 | |||||||||||||||||||||||||
| 56,236 | 56,236 | 27.32 | — | — | — | 17.90 | 1/18/2016 | |||||||||||||||||||||||||
| 58,964 | 58,964 | 27.32 | — | — | — | 20.39 | 1/17/2017 | |||||||||||||||||||||||||
| 26,277 | 26,277 | 28.00 | — | — | — | 17.20 | 2/4/2018 | |||||||||||||||||||||||||
| 52,554 | — | — | — | — | 52,554 | 12.39 | 2/2/2019 | |||||||||||||||||||||||||
M.A. van den Brink | 31,500 | — | — | — | 31,500 | — | 58.00 | 1/20/2012 | ||||||||||||||||||||||||
| 40,000 | 40,000 | 27.21 | — | — | — | 17.90 | 1/18/2016 | |||||||||||||||||||||||||
| 61,644 | 61,644 | 27.21 | — | — | — | 20.39 | 1/17/2017 | |||||||||||||||||||||||||
| 27,894 | — | — | — | 27,894 | — | 17.20 | 2/4/2018 | |||||||||||||||||||||||||
| 55,788 | — | — | — | — | 55,788 | 12.39 | 2/2/2019 | |||||||||||||||||||||||||
F.J. van Hout | 15,000 | 15,000 | 27.34 | — | — | — | 10.11 | 7/18/2013 | ||||||||||||||||||||||||
| 10,000 | 10,000 | 27.34 | — | — | — | 17.34 | 1/19/2014 | |||||||||||||||||||||||||
| 20,000 | 20,000 | 27.34 | — | — | — | 12.02 | 7/16/2014 | |||||||||||||||||||||||||
| 9,000 | 9,000 | 27.34 | — | — | — | 11.56 | 4/15/2015 | |||||||||||||||||||||||||
| 14,000 | 14,000 | 27.96 | — | — | — | 17.90 | 10/20/2016 | |||||||||||||||||||||||||
| 1,388 | 1,388 | 27.37 | — | — | — | 24.26 | 10/19/2017 | |||||||||||||||||||||||||
| — | 8,000 | 30.00 | 8,000 | — | — | 14.87 | 7/18/2018 | |||||||||||||||||||||||||
| 3,987 | 3,987 | 27.34 | — | — | — | 11.43 | 10/17/2018 | |||||||||||||||||||||||||
| 46,201 | — | — | — | — | 46,201 | 12.39 | 2/2/2019 | |||||||||||||||||||||||||
F.J.M. Schneider-Maunoury | — | — | — | — | — | — | — | — | ||||||||||||||||||||||||
Long-term incentive
The members of the Board of Management are eligible to receive performance shares, which will be awarded annually under the condition of fulfillment of predetermined performance targets. These targets are measured over a period of three calendar years. The performance measures for obtaining performance targets will be ASML’s relative Return On Average Invested Capital (“ROAIC”) position compared with the peer group (weighted 80.0 percent) and a qualitative target related to ASML’s long-term ability to keep performing at high standards (weighted 20.0 percent).
The maximum number of performance shares to be conditionally awarded will equal 146.25 percent of base salary divided by the value of one performance share (i.e. reflecting maximum achievement). ASML defines stretching targets, whereas for on target achievement, the value of performance shares will be 80.0 percent of base salary.
| ASML STATUTORY ANNUAL REPORT 2011 | 111 |
For the determination of the number of performance shares that will be conditionally awarded, ASML applies a fixed number approach. Under this approach, the number of shares is fixed for two consecutive years. Every two years, the fixed number is calculated using the maximum achievable value of 146.25 percent of base salary divided by the value of the performance share at the moment of grant in the respective year. In 2010, the fixed number calculation has been conducted which also applies for the year 2011.
Once the shares are unconditionally awarded after fulfillment of the performance conditions, the shares will be retained (for a lock-up period) by the Board of Management member for at least two years after the date of unconditional award or until the termination of employment, whichever period is shorter. ASML accounts for this share award performance plan as a variable plan.
Details of performance shares granted to members of the Board of Management are as follows:
Board of Management | Grant date | Status | Full Control | Number of shares at grant date | Fair value at grant date1 EUR | Vesting date | Number of shares at vesting date | |||||||||||||||||||||
E. Meurice | 4/13/2011 | Conditional | No | 88,732 | 28.29 | 4/13/2014 | — | |||||||||||||||||||||
| 2/1/2010 | Conditional | No | 88,732 | 22.93 | 2/1/2013 | — | ||||||||||||||||||||||
| 2/2/2009 | Conditional | No | 57,002 | 13.05 | 2/2/2012 | — | ||||||||||||||||||||||
| 2/4/2008 | Unconditional | No | 57,002 | 18.18 | 2/4/2011 | 48,859 | ||||||||||||||||||||||
| 1/17/2007 | Unconditional | No | 66,338 | 20.39 | 1/17/2010 | 51,807 | ||||||||||||||||||||||
| 1/18/2006 | Unconditional | Yes | 72,136 | 17.90 | 1/18/2009 | 72,136 | ||||||||||||||||||||||
P.T.F.M. Wennink | 4/13/2011 | Conditional | No | 54,974 | 28.29 | 4/13/2014 | — | |||||||||||||||||||||
| 2/1/2010 | Conditional | No | 54,974 | 22.93 | 2/1/2013 | — | ||||||||||||||||||||||
| 2/2/2009 | Conditional | No | 35,287 | 13.05 | 2/2/2012 | — | ||||||||||||||||||||||
| 2/4/2008 | Unconditional | No | 35,287 | 18.18 | 2/4/2011 | 30,246 | ||||||||||||||||||||||
| 1/17/2007 | Unconditional | No | 41,111 | 20.39 | 1/17/2010 | 32,106 | ||||||||||||||||||||||
| 1/18/2006 | Unconditional | Yes | 45,905 | 17.90 | 1/18/2009 | 45,905 | ||||||||||||||||||||||
M.A. van den Brink | 4/13/2011 | Conditional | No | 58,256 | 28.29 | 4/13/2014 | — | |||||||||||||||||||||
| 2/1/2010 | Conditional | No | 58,256 | 22.93 | 2/1/2013 | — | ||||||||||||||||||||||
| 2/2/2009 | Conditional | No | 37,458 | 13.05 | 2/2/2012 | — | ||||||||||||||||||||||
| 2/4/2008 | Unconditional | No | 37,458 | 18.18 | 2/4/2011 | 32,107 | ||||||||||||||||||||||
| 1/17/2007 | Unconditional | No | 42,980 | 20.39 | 1/17/2010 | 33,565 | ||||||||||||||||||||||
| 1/18/2006 | Unconditional | Yes | 48,241 | 17.90 | 1/18/2009 | 48,241 | ||||||||||||||||||||||
F.J. van Hout2 | 4/13/2011 | Conditional | No | 48,293 | 28.29 | 4/13/2014 | — | |||||||||||||||||||||
| 2/1/2010 | Conditional | No | 48,293 | 22.93 | 2/1/2013 | — | ||||||||||||||||||||||
| 2/2/2009 | Conditional | No | 31,021 | 13.05 | 2/2/2012 | — | ||||||||||||||||||||||
| 7/18/2008 | Unconditional | Yes | 4,000 | 17.20 | 7/18/2011 | 4,000 | ||||||||||||||||||||||
F.J.M. Schneider-Maunoury | 4/13/2011 | Conditional | No | 46,886 | 28.29 | 4/13/2014 | — | |||||||||||||||||||||
| 2/1/2010 | Conditional | No | 46,886 | 22.93 | 2/1/2013 | — | ||||||||||||||||||||||
| 1 | The fair value of the shares as of the grant date. |
| 2 | The shares granted to Mr. van Hout on and before October 1 7, 2008, relate to his pre-Board of Management period at ASML. No lock-up period is applicable for the shares granted to Mr. van Hout in his pre-Board of Management period. |
Pension Benefits
Members of the Board of Management are offered a pension plan based on defined contribution. The total defined contribution is a percentage of the pensionable salary and is dependent on the participant’s age at the beginning of the year. In 2011, compensation was paid to the Board of Management regarding the spouse/orphan risk premium to align the Board of Management pension arrangement with senior management. This concerned a reimbursement for risk premiums that were erroneously paid by the participants in the past.
| ASML STATUTORY ANNUAL REPORT 2011 | 112 |
Benefits upon termination of employment
Term of appointment/employment
Members of the Board of Management appointed after the 2004 amendment of the Articles of Association, are appointed for a period of four years, after which reappointment is possible for consecutive four-year terms. Messrs. P. Wennink and M. van den Brink’s appointment to the Board of Management is for an indefinite period of time, as their initial appointment was before 2004. The existing employment contracts, including all rights and obligations under these contracts, will be honored.
Severance agreement
Employment agreements with the Board of Management members concluded prior to March 31, 2004 (i.e. Messrs. Wennink and Van den Brink) do not contain specific provisions regarding benefits upon termination of those agreements. Potential severance payments in such case will be according to applicable law (e.g. cantonal formula in the Netherlands).
Employment agreements for members of the Board of Management appointed after March 31, 2004 (i.e. Messrs. Meurice, Van Hout and Schneider-Maunoury) do contain specific provisions regarding benefits upon termination of those agreements.
If the Company gives notice of termination of the employment agreement for reasons which are exclusively or mainly found in acts or omissions on the side of the Board of Management member, no severance amount will be granted. If this is not the case, a severance amount equal to one year base salary or a severance consistent with the Dutch Labor laws will be made available upon the effective date of termination.
This severance payment will also be made available in case the Board of Management member gives notice of termination of the employment agreement due to a significant difference of opinion between the respective executives and the Supervisory Board regarding his employment agreement, his function or the Company’s strategy.
Change of control
Board of Management members with an employment agreement dated after March 31, 2004 (i.e. Messrs. Meurice, Van Hout and Schneider-Maunoury) shall also be entitled to the aforementioned severance amount in the event ASML or its legal successor gives notice of termination due to a Change of Control (as defined in the employment agreement) or if the Board of Management member gives notice of termination, which is directly related to such Change of Control and such notice is given within twelve months from the date on which the Change of Control occurs.
In order to comply with the highest standards of corporate governance, the Supervisory Board decided to mitigate the potential benefit of a Change of Control under the long-term incentive arrangements. This arrangement entails that the share price will be fixed on the average of i) the average closing share price over a period of 15 trading days prior to first public announcement of Change of Control negotiations, and ii) the average closing share price over a period of 30 trading days prior to closing of the transaction.
Supervisory Board
The annual remuneration for Supervisory Board members covers the period from one Annual General Meeting of Shareholders to the next one. The annual remuneration is paid in quarterly installments starting after the Annual General Meeting of Shareholders. In 2011 the Supervisory Board proposed and the General Meeting of shareholders approved an adjustment of the remuneration of the Supervisory Board, effective as per April 1, 2011.
| ASML STATUTORY ANNUAL REPORT 2011 | 113 |
The following table sets forth an overview of the remuneration awarded to Supervisory Board Members in 2011 and 2010:
Year ended December 31 | 2011 | Supervisory Board | Audit Committee | Remuneration Committee | Selection and Nomination Committee | Technology and Strategy Committee | Other1,2 | |||||||||||||||||||||
Arthur P.M. van der Poel | 88,250 | 62,500 | 10,000 | — | 7,875 | 7,875 | — | |||||||||||||||||||||
Jos W.B. Westerburgen | 66,750 | 43,750 | — | 11,500 | 11,500 | — | — | |||||||||||||||||||||
OB Bilous | 99,500 | 73,750 | — | — | 7,875 | 7,875 | 10,000 | |||||||||||||||||||||
Frits W. Fröhlich | 62,500 | 43,750 | 15,000 | — | — | — | 3,750 | |||||||||||||||||||||
Hendrika (Ieke) C.J. van den Burg | 51,625 | 43,750 | — | 7,875 | — | — | — | |||||||||||||||||||||
William T. Siegle | 85,250 | 73,750 | — | — | — | 11,500 | — | |||||||||||||||||||||
Pauline F.M. van der Meer Mohr | 51,625 | 43,750 | — | 7,875 | — | — | — | |||||||||||||||||||||
Wolfgang H. Ziebart | 61,625 | 43,750 | 10,000 | — | — | 7,875 | — | |||||||||||||||||||||
|
|
|
|
|
|
|
|
|
|
|
|
|
| |||||||||||||||
Total | 567,125 | 428,750 | 35,000 | 27,250 | 27,250 | 35,125 | 13,750 | |||||||||||||||||||||
|
|
|
|
|
|
|
|
|
|
|
|
|
| |||||||||||||||
Year ended December 31 | 2010 | Supervisory Board | Audit Committee | Remuneration Committee | Selection and Nomination Committee | Technology and Strategy Committee | Other1 | |||||||||||||||||||||
Arthur P.M. van der Poel | 80,000 | 55,000 | 10,000 | — | 7,500 | 7,500 | — | |||||||||||||||||||||
Jos W.B. Westerburgen | 60,000 | 40,000 | — | 10,000 | 10,000 | — | — | |||||||||||||||||||||
OB Bilous | 95,000 | 70,000 | — | — | 7,500 | 7,500 | 10,000 | |||||||||||||||||||||
Frits W. Fröhlich | 55,000 | 40,000 | 15,000 | — | — | — | — | |||||||||||||||||||||
Hendrika (Ieke) C.J. van den Burg | 47,500 | 40,000 | — | 7,500 | — | — | — | |||||||||||||||||||||
William T. Siegle | 80,000 | 70,000 | — | — | — | 10,000 | — | |||||||||||||||||||||
Pauline F.M. van der Meer Mohr | 47,500 | 40,000 | — | 7,500 | — | — | — | |||||||||||||||||||||
Wolfgang H. Ziebart | 57,500 | 40,000 | 10,000 | — | — | 7,500 | — | |||||||||||||||||||||
|
|
|
|
|
|
|
|
|
|
|
|
|
| |||||||||||||||
Total | 522,500 | 395,000 | 35,000 | 25,000 | 25,000 | 32,500 | 10,000 | |||||||||||||||||||||
|
|
|
|
|
|
|
|
|
|
|
|
|
| |||||||||||||||
| 1 | To compensate for certain obligations ASML has towards the U.S. government as a result of the its acquisition of Silicon Valley Group in 2001, one U.S. member receives an additional EUR 10,000 to fulfill these obligations. |
| 2 | In addition to the annual fixed fee, the Vice Chairman of the Supervisory Board receives EUR 5,000 to fulfill this role. As the adjustment of the Supervisory Board’s remuneration became effective as per April 1, 2011, the Vice Chairman fee paid over the financial year 2011 amounted to EUR 3,750. |
In addition, a net cost allowance was paid to each Supervisory Board member in 2011, amounting to EUR 1,800 per year, and EUR 2,400 per year for the Chairman of the Supervisory Board.
Members of the Board of Management and/or Supervisory Board are free to acquire or dispose of ASML shares or options for their own account, provided they comply with the applicable ASML Insider Trading Rules. Those securities are not part of members’ remuneration from the Company and are therefore not included. None of the members of the Supervisory Board currently owns shares or options on shares of the Company.
31. Research and development costs
R&D costs include R&D credits of EUR 17.9 million and EUR 26.3 million during 2011 and 2010, respectively. R&D credits relate to world-wide (inter)governmental funding for certain strategic development programs.
32. Interest income and charges
Interest and similar income of EUR 43.7 million (2010: EUR 19.3 million) mainly relates to interest income on deposits, money market funds, income taxes and on bank accounts, of which EUR 6.8 million (2010: EUR 3.6 million) relates to interest on cash pools which is reported on a gross basis in the consolidated income statement. From an economic and legal perspective this EUR 6.8 million (2010: EUR 3.6 million) interest income nets off against the same amount of interest charge.
Interest income relates to interest earned on our cash and cash equivalents and was in 2011 only partly offset by net interest charges on our outstanding debt, mainly due to a significantly higher cash balance. Furthermore, net interest income was positively impacted by a release of expected interest charges related to income tax liabilities.
33. Vulnerability due to certain concentrations
ASML relies on outside vendors to manufacture the components and subassemblies used in its systems, each of which is obtained from a sole supplier or a limited number of suppliers. ASML’s reliance on a limited group of suppliers involves several risks, including a potential inability to obtain an adequate supply of required components and reduced
| ASML STATUTORY ANNUAL REPORT 2011 | 114 |
control over pricing and timely delivery of these subassemblies and components. In particular, from time to time, the number of systems ASML has been able to produce has been limited by the production capacity of Zeiss. Zeiss is currently ASML’s sole external supplier of lenses and other critical optical components and is capable of producing these lenses only in limited numbers and only through the use of its manufacturing and testing facility in Oberkochen and Wetzlar, Germany. During 2011, ASML’s sales were not limited by the deliveries from Zeiss.
ASML sells a substantial number of lithography systems to a limited number of customers. See Note 28. Business failure of one of our main customers may result in adverse effects on our business, financial condition and results of operations.
34. Principal Accountant Fees and Services
Deloitte Accountants B.V. has served as our independent auditor firm for each of the two financial years up to December 31, 2011. The following table sets out the aggregate fees for professional audit services and other services rendered by Deloitte Accountants B.V. and its member firms and/or affiliates in 2011 and 2010.
| 2011 | 2010 | |||||||||||||||||||||||
Year ended December 31 (in thousands) | Deloitte Accountants B.V. EUR | Deloitte Network EUR | Total EUR | Deloitte Accountants B.V. EUR | Deloitte Network EUR | Total EUR | ||||||||||||||||||
Audit fees in relation to annual reports | 1,022 | — | 1,022 | 860 | — | 860 | ||||||||||||||||||
Other audit fees | 40 | 382 | 422 | 40 | 584 | 624 | ||||||||||||||||||
Audit-related fees | 49 | — | 49 | 75 | — | 75 | ||||||||||||||||||
Tax fees | — | 322 | 322 | — | 598 | 598 | ||||||||||||||||||
|
|
|
|
|
|
|
|
|
|
|
| |||||||||||||
Principal accountant fees and services | 1,111 | 704 | 1,815 | 975 | 1,182 | 2,157 | ||||||||||||||||||
|
|
|
|
|
|
|
|
|
|
|
| |||||||||||||
Audit fees and other audit fees
Audit fees primarily relate to the audit of our annual consolidated and company financial statements set out in the statutory annual report and the annual consolidated financial statements set out in our Annual Report on Form 20-F, agreed upon procedures on our quarterly financial results, services related to statutory and regulatory filings of ASML Holding N.V. and its subsidiaries and services in connection with accounting consultations on U.S. GAAP and IFRS.
Audit-related fees
Audit-related fees mainly related to various audit services not related to the Company’s consolidated financial statements.
Tax fees
Tax fees can be detailed as follows:
Year ended December 31 (in thousands) | 2011 EUR | 2010 EUR | ||||||
Corporate Income Tax compliance services | 73 | 350 | ||||||
Tax assistance for expatriate employees | 179 | 163 | ||||||
Other tax advisory and compliance | 70 | 85 | ||||||
|
|
|
| |||||
Tax fees | 322 | 598 | ||||||
|
|
|
| |||||
The Audit Committee has approved the external audit plan and related audit fees for the year 2011. The Audit Committee has adopted a policy regarding audit and non-audit services, in consultation with Deloitte Accountants B.V. This policy ensures the independence of our auditors by expressly setting forth all services that the auditors may not perform and reinforcing the principle of independence regardless of the type of work performed. Certain non-audit services, such as certain tax-related services and acquisition advisory services, are permitted. The Audit Committee preapproves all audit and non-audit services not specifically prohibited under this policy and reviews the annual external audit plan and any subsequent engagements.
| ASML STATUTORY ANNUAL REPORT 2011 | 115 |
35. Related Party Transactions
Consistent with the Company’s corporate responsibilities to its surrounding community and together with several other companies in the region, ASML entered into a loan agreement with a local sports club PSV N.V.; pursuant to which ASML provided PSV N.V., as of August 1, 2011, a 14 year, interest free, subordinated loan of EUR 5.0 million. The chairman of the Supervisory Board of ASML, Mr. Arthur van der Poel is currently (until June 2012) member of the Supervisory Board of PSV N.V. Mr. Peter Wennink (Chief Financial Officer of ASML) was appointed as member of the Supervisory Board of PSV N.V. as of August 2011.
Except for the above, there have been no transactions during our most recent fiscal year, and there are currently no transactions, between ASML or any of its subsidiaries, and any significant shareholder and any director or officer or any relative or spouse thereof other than ordinary course compensation arrangements. During our most recent fiscal year, there has been no, and at present there is no, outstanding indebtedness to ASML owed or owing by any director or officer of ASML or any associate thereof, other than the virtual financing arrangement with respect to shares and stock options described under Notes 23 and 30.
Veldhoven, the Netherlands
February 13, 2012
Prepared by
The Board of Management:
Eric Meurice
Peter T.F.M. Wennink
Martin A. van den Brink
Frits J. van Hout
Frédéric J.M. Schneider-Maunoury
| ASML STATUTORY ANNUAL REPORT 2011 | 116 |

Company Financial Statements
Company Financial Statements
| 119 | Company Balance Sheet | |
| 120 | Abbreviated Company Income Statement | |
| 121 | Notes to the Company Financial Statements |
| ASML STATUTORY ANNUAL REPORT 2011 | 118 |
Company Balance Sheet
(Before appropriation of net income)
As of December 31 (in thousands) | 2011 EUR | 2010 EUR | ||||||
Non-current assets | ||||||||
Investments in subsidiaries | 5,169,322 | 3,416,355 | ||||||
Loans to subsidiaries | 1,324 | 1,281 | ||||||
Deferred tax assets | 22,568 | 56,301 | ||||||
Derivative financial instruments | 92,534 | 71,779 | ||||||
Other assets | 2,091 | 3,286 | ||||||
|
|
|
| |||||
Total non-current assets | 5,287,839 | 3,549,002 | ||||||
Current assets | ||||||||
Amounts due from subsidiaries | 445,497 | 738,287 | 1 | |||||
Current tax assets | 31,263 | 11,696 | ||||||
Derivative financial instruments | 40,052 | 37,548 | ||||||
Other assets | 5,321 | 3,062 | ||||||
Cash and cash equivalents | 1,311,929 | 9,302 | ||||||
|
|
|
| |||||
Total current assets | 1,834,062 | 799,895 | ||||||
|
|
|
| |||||
Total assets | 7,121,901 | 4,348,897 | ||||||
Equity | ||||||||
Cumulative Preference Shares; EUR 0.09 nominal value; 700,000,000 shares authorized at December 31, 2011 | ||||||||
Cumulative Preference Shares; EUR 0.02 nominal value; 3,150,005,000 shares authorized at December 31, 2010 | ||||||||
none issued and outstanding at December 31, 2011 and 2010 | — | — | ||||||
Ordinary Shares; EUR 0.09 nominal value; 700,000,000 shares authorized; 413,669,257 issued and outstanding at December 31, 2011; 436,592,972 issued and outstanding at December 31, 2010: | 38,816 | 40,713 | ||||||
Share premium | 920,478 | 922,341 | ||||||
Retained earnings | 1,525,238 | 1,096,669 | ||||||
Treasury shares at cost | (417,837 | ) | (153,092 | ) | ||||
Legal reserves | 159,039 | 130,378 | ||||||
Net income | 1,494,071 | 985,453 | ||||||
|
|
|
| |||||
Total equity | 3,719,805 | 3,022,462 | ||||||
Non-current liabilities | ||||||||
Long-term debt | �� | 691,959 | 670,506 | |||||
Deferred and other tax liabilities | 158,943 | 113,957 | ||||||
|
|
|
| |||||
Total non-current liabilities | 850,902 | 784,463 | ||||||
Current liabilities | ||||||||
Amounts due to subsidiaries | 2,498,042 | 444,431 | 1 | |||||
Accrued and other liabilities | 19,254 | 20,040 | ||||||
Current and other tax liabilities | — | 59,132 | ||||||
Derivative financial instruments | 33,898 | 18,369 | ||||||
|
|
|
| |||||
Total current liabilities | 2,551,194 | 541,972 | ||||||
|
|
|
| |||||
Total equity and liabilities | 7,121,901 | 4,348,897 | ||||||
|
|
|
| |||||
| 1 | In 2011, ASML changed the presentation of the Company Balance Sheet to improve the understanding of the Company Balance Sheet. The comparative figures for the year 2010 have been adjusted to reflect this change in presentation. |
| ASML STATUTORY ANNUAL REPORT 2011 | 119 |
Abbreviated Company Income Statement
Year ended December 31 (in thousands) | 2011 EUR | 2010 EUR | ||||||
Net income from subsidiaries | 1,555,277 | 1,015,958 | ||||||
Loss after taxes | (61,206 | ) | (30,505 | ) | ||||
|
|
|
| |||||
Net income | 1,494,071 | 985,453 | ||||||
|
|
|
| |||||
| ASML STATUTORY ANNUAL REPORT 2011 | 120 |
Notes to the Company Financial Statements
1. General Information
The description of the Company’s activities and the Company structure, as included in the Notes to the consolidated financial statements, also apply to the Company financial statements.
In accordance with article 362 sub 8 Part 9 of Book 2 of the Dutch Civil Code, ASML has prepared its Company financial statements in accordance with accounting principles generally accepted in the Netherlands applying the accounting principles as adopted in the consolidated financial statements. Investments in subsidiaries are stated at net asset value as the Company effectively exercises control over the operational and financial activities of these investments. The net asset value is determined on the basis of the IFRS accounting principles applied by the Company in its consolidated financial statements.
In accordance with article 402 Part 9 of Book 2 of the Dutch Civil Code the Company income statement is presented in abbreviated form.
2. Summary of Significant Accounting Policies
Significant accounting policies
The accounting policies used in the preparation of the Company financial statements are the same as those used in the preparation of the consolidated financial statements (in accordance with article 362 sub 8 Part 9 of Book 2 of the Dutch Civil Code). See the Notes to the consolidated financial statements. In addition to those accounting policies, the following accounting policy applies to the Company financial statements.
Investments in subsidiaries
Investments in subsidiaries are stated at net asset value as the Company effectively exercises influence of significance over the operational and financial activities of these investments. The net asset value is determined on the basis of the accounting principles applied by the Company.
3. Investments in Subsidiaries
Changes in investments in subsidiaries during 2011 and 2010 were as follows:
(in thousands) | 2011 EUR | 2010 EUR | ||||||
Balance, January 1 | 3,416,355 | 2,475,617 | ||||||
Capital contributions | 399,989 | 378 | ||||||
Dividends received | (238,519 | ) | (101,684 | ) | ||||
Net income from subsidiaries | 1,555,277 | 1,015,958 | ||||||
Effect of exchange rates | (12,142 | ) | 27,306 | |||||
Derivative financial instruments | 47,353 | (1,221 | ) | |||||
Other legal transfer | 1,009 | 1 | ||||||
|
|
|
| |||||
Balance, December 31 | 5,169,322 | 3,416,355 | ||||||
|
|
|
| |||||
| ASML STATUTORY ANNUAL REPORT 2011 | 121 |
4. Equity
Changes in equity during 2010 and 2011 were as follows:
Issued and shares | ||||||||||||||||||||||||||||||||
(in thousands) | Number1
| Amount EUR | Share Premium EUR | Retained Earnings EUR | Treasury Shares at cost EUR | Legal Reserves2 EUR | Net Income (loss) EUR | Total EUR | ||||||||||||||||||||||||
Balance at January 1, 2010 | 433,639 | 40,448 | 923,487 | 1,215,492 | (219,623 | ) | 172,446 | (81,443 | ) | 2,050,807 | ||||||||||||||||||||||
Appropriation of net loss | — | — | — | (81,443 | ) | — | — | 81,443 | — | |||||||||||||||||||||||
Components of statement of comprehensive income | ||||||||||||||||||||||||||||||||
Net income | — | — | — | — | — | — | 985,453 | 985,453 | ||||||||||||||||||||||||
Foreign currency translation, net of taxes | — | — | — | — | — | 27,306 | — | 27,306 | ||||||||||||||||||||||||
Derivative financial instruments, net of taxes | — | — | — | — | — | (1,221 | ) | — | (1,221 | ) | ||||||||||||||||||||||
Total comprehensive income | — | — | — | — | — | 26,085 | 985,453 | 1,011,538 | ||||||||||||||||||||||||
Share-based payments | — | — | 16,254 | — | — | — | — | 16,254 | ||||||||||||||||||||||||
Dividend paid | — | — | — | (86,960 | ) | — | — | — | (86,960 | ) | ||||||||||||||||||||||
Issuance of shares and stock options | 2,954 | 265 | (17,400 | ) | (18,573 | ) | 66,531 | — | — | 30,823 | ||||||||||||||||||||||
Development expenditures | — | — | — | 68,153 | — | (68,153 | ) | — | — | |||||||||||||||||||||||
|
|
|
|
|
|
|
|
|
|
|
|
|
|
|
| |||||||||||||||||
Balance at December 31, 2010 | 436,593 | 40,713 | 922,341 | 1,096,669 | (153,092 | ) | 130,378 | 985,453 | 3,022,462 | |||||||||||||||||||||||
Appropriation of net income | — | — | — | 985,453 | — | — | (985,453 | ) | — | |||||||||||||||||||||||
Components of statement of comprehensive income | ||||||||||||||||||||||||||||||||
Net income | — | — | — | — | — | — | 1,494,071 | 1,494,071 | ||||||||||||||||||||||||
Foreign currency translation, net of taxes | — | — | — | — | — | (13,971 | ) | — | (13,971 | ) | ||||||||||||||||||||||
Derivative financial instruments, net of taxes | — | — | — | — | — | 47,353 | — | 47,353 | ||||||||||||||||||||||||
Total comprehensive income | — | — | — | — | — | 33,382 | 1,494,071 | 1,527,453 | ||||||||||||||||||||||||
Purchases of treasury shares | (25,675 | ) | — | — | — | (700,452 | ) | — | — | (700,452 | ) | |||||||||||||||||||||
Cancellation of treasury shares | — | (1,897 | ) | 710 | (372,614 | ) | 373,801 | — | — | — | ||||||||||||||||||||||
Share-based payments | — | — | 7,819 | — | — | — | — | 7,819 | ||||||||||||||||||||||||
Dividend paid | — | — | — | (172,645 | ) | — | — | — | (172,645 | ) | ||||||||||||||||||||||
Issuance of shares and stock options | 2,751 | — | (10,392 | ) | (16,346 | ) | 61,906 | — | — | 35,168 | ||||||||||||||||||||||
Development expenditures | — | — | — | 4,721 | — | (4,721 | ) | — | — | |||||||||||||||||||||||
|
|
|
|
|
|
|
|
|
|
|
|
|
|
|
| |||||||||||||||||
Balance at December 31, 2011 | 413,669 | 38,816 | 920,478 | 1,525,238 | (417,837 | ) | 159,039 | 1,494,071 | 3,719,805 | |||||||||||||||||||||||
|
|
|
|
|
|
|
|
|
|
|
|
|
|
|
| |||||||||||||||||
| 1 | As of December 31, 2011, the number of issued shares was 431,294,790. This includes the number of issued and outstanding shares of 413,669,257 and the number of treasury shares of 1 7,625,533. As of December 31, 2010, the number of issued shares was 444,480,095. This includes the number of issued and outstanding shares of 436,592,972 and the number of treasury shares of 7,887,123. |
| 2 | Legal reserves consist of the hedging reserve, the currency translation reserve and the reserve for capitalized development expenditures. See below for further information. |
Share Capital
ASML’s authorized share capital amounts to EUR 126,000,000 and is divided into:
| • | 700,000,000 cumulative preference shares with a nominal value of EUR 0.09 each; |
| • | 700,000,000 ordinary shares with a nominal value of EUR 0.09 each. |
Per December 31, 2011, 413,669,257 ordinary shares with a nominal value of EUR 0.09 each were outstanding and fully paid in. The number of issued shares was 431,294,790, including 17,625,533 repurchased (“treasury”) shares, the majority of which will be cancelled in 2012.
Our Board of Management has the power to issue shares if and to the extent the Board of Management has been authorized to do so by the General Meeting of Shareholders (either by means of a resolution or by an amendment to our Articles of Association). However, the Supervisory Board must approve any issuance of shares.
As a consequence of the amendment of the Company’s Articles of Association per May 6, 2011, 10,000 ordinary shares in the Company’s share capital with nominal value of EUR 0,01 were canceled because no such shares were issued.
Ordinary shares
At ASML’s Annual General Meeting of Shareholders, held on April 20, 2011, the Board of Management was granted the authorization to issue shares and/or rights thereto representing up to a maximum of 5.0 percent of the Company’s issued share capital as of the date of authorization, plus an additional 5.0 percent of the Company’s issued share capital as of the date of authorization that may be issued in connection with mergers and acquisitions. At ASML’s Annual
| ASML STATUTORY ANNUAL REPORT 2011 | 122 |
General Meeting of Shareholders to be held on April 25, 2012, its shareholders will be asked to authorize the Board of Management (subject to the approval of the Supervisory Board) to issue shares and/or rights thereto through October 25, 2013.
Holders of ASML’s ordinary shares have a preemptive right of subscription to any issuance of ordinary shares for cash, which right may be limited or excluded. Ordinary shareholders have no pro rata preemptive right of subscription to any ordinary shares issued for consideration other than cash or ordinary shares issued to employees. If authorized for this purpose by the General Meeting of Shareholders (either by means of a resolution or by an amendment to ASML’s Articles of Association), the Board of Management has the power, with the approval of the Supervisory Board, to limit or exclude the preemptive rights of holders of ordinary shares. A designation may be renewed. At ASML’s Annual General Meeting of Shareholders, held on April 20, 2011, the Board of Management was authorized, subject to the aforementioned approval, to restrict or exclude preemptive rights of holders of ordinary shares up to a maximum of 10 percent of the Company’s issued share capital as of the date of authorization. At ASML’s Annual General Meeting of Shareholders to be held on April 25, 2012, its shareholders will be asked to grant this authority through October 25, 2013. At this Annual General Meeting of Shareholders, the shareholders will be asked to grant authority to the Board of Management to issue shares and options separately for a period of 18 months.
The Company may repurchase its issued ordinary shares at any time, subject to compliance with the requirements of Dutch law and the Company’s Articles of Association. Any such repurchases are subject to the approval of the Supervisory Board and the authorization of shareholders at ASML’s Annual General Meeting of Shareholders, which authorization may not be for more than 18 months. The Board of Management is currently authorized, subject to Supervisory Board approval, to repurchase through October 20, 2012 up to a maximum of three times 10.0 percent of the Company’s issued share capital as of the date of authorization (April 20, 2011) at a price between the nominal value of the ordinary shares purchased and 110.0 percent of the market price of these securities on Euronext Amsterdam or NASDAQ. At the Company’s Annual General Meeting of Shareholders to be held on April 25, 2012, ASML shall request the authorization for the Board of Management to repurchase and cancel shares for a period of 18 months as of the 2012 AGM, i.e. until October 25, 2013, all in conformity with the provisions of the law and the Company’s articles of association.
Cumulative preference shares
In 1998, the Company granted to the preference share foundation, “Stichting Preferente Aandelen ASML” (the “Foundation”) an option to acquire cumulative preference shares in the capital of the Company (the “Preference Share Option”). This option was amended and extended in 2003 and 2007. A third amendment to the option agreement between the Foundation and ASML became effective on January 1, 2009, to clarify the procedure for the repurchase and cancellation of the preference shares when issued.
Per the amendment of the Company’s Articles of Association on May 6, 2011, the nominal value of the cumulative preference shares was increased to EUR 0.09. The number of cumulative preference shares included in the authorized share capital was decreased to 700,000,000 million, equal to the number of common shares in the authorized share capital. This was done to simplify the Articles of Association, and to give each share the right to cast one vote in the general meeting of shareholders.
The Foundation may exercise the Preference Share Option in situations where, in the opinion of the Board of Directors of the Foundation, the interests of the Company, its business or the interests of its stakeholders are at stake. This may be the case if a public bid for the ordinary shares of the Company has been announced or has been made, or the justified expectation exists that such a bid will be made without any agreement having been reached in relation to such a bid with the Company. The same may apply if one shareholder, or more shareholders acting in concert, hold a substantial percentage of the issued ordinary shares of the Company without making an offer or if, in the opinion of the Board of Directors of the Foundation, the (attempted) exercise of the voting rights by one shareholder or more shareholders, acting in concert, is materially in conflict with the interests of the Company, its business or its stakeholders.
The objects of the Foundation are to look after the interests of ASML and of the enterprises maintained by ASML and of the companies which are affiliated in a group with ASML, in such way that the interests of ASML, of those enterprises and of all parties concerned are safeguarded in the best possible way, and influences in conflict with these interests which might affect the independence or the identity of ASML and those companies are deterred to the best of the Foundation’s ability, and everything related to the above or possibly conducive thereto. The Foundation seeks to realize its objects by the acquiring and holding of cumulative preference shares in the capital of ASML and by exercising the rights attached to these shares, particularly the voting rights attached to these shares.
The Preference Share Option gives the Foundation the right to acquire a number of cumulative preference shares, provided that the aggregate nominal value of such number of cumulative preference shares shall not exceed the
| ASML STATUTORY ANNUAL REPORT 2011 | 123 |
aggregate nominal value of the ordinary shares that have been issued at the time of exercise of the Preference Share Option for a subscription price equal to their EUR 0.09 nominal value. Exercise of the Preference Share Option could effectively dilute the voting power of the outstanding ordinary shares by one-half. Only one-fourth of the subscription price is payable at the time of initial issuance of the cumulative preference shares.
Cancellation and repayment of the issued cumulative preference shares by the Company requires the authorization by the General Meeting of Shareholders of a proposal to do so by the Board of Management approved by the Supervisory Board. If the Preference Share Option is exercised and as a result cumulative preference shares are issued, the Company, at the request of the Foundation, will initiate the repurchase or cancellation of all cumulative preference shares held by the Foundation as a result of such issuance with repayment of the amount paid and exemption from the obligation to pay up on the cumulative preference shares. In that case the Company is obliged to effect the repurchase and cancellation respectively as soon as possible.
If the Foundation will not request the Company to repurchase or cancel all cumulative preference shares held by the Foundation within 20 months after issuance of these shares, the Company will be obliged to convene a General Meeting of Shareholders in order to decide on a repurchase or cancellation of these shares.
The Foundation is independent of the Company. The Board of Directors of the Foundation comprises four independent voting members from the Dutch business and academic communities: Mr. R.E. Selman (until December 31, 2011), Mr. M.W. den Boogert, Mr. J.M. de Jong, Mr. A. Baan., and Mr. A.M. Lundqvist (as of January 1, 2012).
Legal reserves
Changes in legal reserves during 2011 and 2010 were as follows:
| Legal reserves | ||||||||||||||||
(in thousands) | Hedging reserve EUR | Currency translation reserve EUR | Capitalized development expenditures EUR | Total EUR | ||||||||||||
Balance at January 1, 2010 | (43,148 | ) | (113,214 | ) | 328,808 | 172,446 | ||||||||||
Components of statement of comprehensive income: | ||||||||||||||||
Foreign currency translation, net of taxes: | ||||||||||||||||
Gain on translation of foreign operations | — | 27,306 | — | 27,306 | ||||||||||||
Derivative financial instruments, net of taxes: | ||||||||||||||||
Fair value losses in the year | (49,175 | ) | — | — | (49,175 | ) | ||||||||||
Transfers to net income | 47,954 | — | — | 47,954 | ||||||||||||
Development expenditures | — | — | (68,153 | ) | (68,153 | ) | ||||||||||
Currency translation on development expenditures | — | (2,732 | ) | 2,732 | — | |||||||||||
|
|
|
|
|
|
|
| |||||||||
Balance at December 31, 2010 | (44,369 | ) | (88,640 | ) | 263,387 | 130,378 | ||||||||||
Components of statement of comprehensive income: | ||||||||||||||||
Foreign currency translation, net of taxes: | ||||||||||||||||
Losses on the hedge of a net investment | — | (1,829 | ) | — | (1,829 | ) | ||||||||||
Losses on translation of foreign operations | — | (12,142 | ) | — | (12,142 | ) | ||||||||||
Derivative financial instruments, net of taxes: | ||||||||||||||||
Fair value losses in the year | (4,610 | ) | — | — | (4,610 | ) | ||||||||||
Transfers to net income | 51,963 | — | — | 51,963 | ||||||||||||
Development expenditures | — | — | (4,721 | ) | (4,721 | ) | ||||||||||
Currency translation on development expenditures | — | (956 | ) | 956 | — | |||||||||||
|
|
|
|
|
|
|
| |||||||||
Balance at December 31, 2011 | 2,984 | (103,567 | ) | 259,622 | 159,039 | |||||||||||
|
|
|
|
|
|
|
| |||||||||
Exchange rate differences relating to the translation from the Company’s foreign subsidiaries into euro are recognized in the currency translation reserve. Gains and losses on hedging instruments that are designated as hedges of net investments in foreign operations are included in the currency translation reserve.
Hedging reserve represents hedging gains and losses on the effective portion of cash flow hedges. The cumulative gain or loss on the hedge is recognized in net income (loss) when the hedge transaction impacts net income (loss).
ASML is a company incorporated under Dutch Law. In accordance with the Dutch Civil Code, legal reserves have to be established in certain circumstances. The legal reserves consist of the hedging reserve, the currency translation reserve and the reserve for capitalized development expenditures. Legal reserves are not for distribution to ASML’s
| ASML STATUTORY ANNUAL REPORT 2011 | 124 |
shareholders. If the currency translation reserve or the hedging reserve has a negative balance, distributions to ASML’s shareholders are restricted to the extent of the negative balance.
Appropriation of net income
As part of our financing policy, we aim to pay an annual dividend that will be stable or growing over time. Annually, the Board of Management will, upon prior approval from the Supervisory Board, submit a proposal to the Annual General Meeting of Shareholders with respect to the amount of dividend to be declared with respect to the prior year. The dividend proposal in any given year will be subject to the availability of distributable profits or retained earnings and may be affected by, among other factors, the Board of Management’s views on our potential future liquidity requirements, including for investments in production capacity, the funding of our research and development programs and for acquisition opportunities that may arise from time to time; and by future changes in applicable income tax and corporate laws. Accordingly, it may be decided to propose not to pay a dividend or to pay a lower dividend with respect any particular year in the future.
For 2011, a proposal to declare a dividend of EUR 0.46 per ordinary share of EUR 0.09 nominal value will be submitted to the Annual General Meeting of Shareholders to be held on April 25, 2012.
Dividends on ordinary shares are payable out of net income or retained earnings as shown in the financial statements of the Company as adopted by the General Meeting of Shareholders of the Company, after payment first of (accumulated) dividends out of net income on any issued cumulative preference shares.
Share buyback programs
In addition to dividend payments, we intend to return cash to our shareholders on a regular basis through share buy backs or repayment of capital, subject to our actual and anticipated level of cash generated from operations, the cash requirements for investment in our business, our current share price and other market conditions and relevant factors.
On April 20, 2011, the General Meeting of Shareholders authorized the repurchase of up to a maximum of three times 10.0 percent of our issued share capital as of the date of authorization through October 20, 2012.
On January 19, 2011, ASML announced its intention to repurchase up to EUR 1.0 billion of its own shares within the next two years. During 2011 the Company repurchased 25,674,576 shares for a total amount of EUR 700.0 million; of the shares repurchased 13,185,305 were cancelled in 2011. The company intends to cancel the remaining repurchased shares in 2012.
The following table provides a summary of shares repurchased by the Company in 2011:
Period | Total Number of Shares purchased | Average Price Paid per Share (EUR) | Total Number of Shares Purchased as Part of Publicly Announced Plans or Programs | Maximum Value of Shares That May Yet be Purchased Under The Plans or Programs1 | ||||||||||||
January 20 - 31, 2011 | 78,975 | 29.13 | 78,975 | 997,699,182 | ||||||||||||
February 1 - 28, 2011 | 1,599,019 | 31.42 | 1,677,994 | 947,457,186 | ||||||||||||
March 1 - 31, 2011 | 2,988,801 | 30.33 | 4,666,795 | 856,819,199 | ||||||||||||
April 1 - 30, 2011 | 2,413,449 | 27.68 | 7,080,244 | 790,017,324 | ||||||||||||
May 2 - 31, 2011 | 4,814,924 | 27.26 | 11,895,168 | 658,770,101 | ||||||||||||
June 1 - 30, 2011 | 1,677,557 | 25.20 | 13,572,725 | 616,498,695 | ||||||||||||
July 1 - 29, 2011 | 2,245,788 | 25.50 | 15,818,513 | 559,238,654 | ||||||||||||
August 1 - 31, 2011 | 2,907,848 | 23.59 | 18,726,361 | 490,649,449 | ||||||||||||
September 1 - 30, 2011 | 2,887,514 | 25.46 | 21,613,875 | 417,147,453 | ||||||||||||
October 3 - 31, 2011 | 1,440,646 | 27.53 | 23,054,521 | 377,488,352 | ||||||||||||
November 1 - 30, 2011 | 1,649,792 | 29.01 | 24,704,313 | 329,630,685 | ||||||||||||
December 1 - 31, 2011 | 970,263 | 30.54 | 25,674,576 | 300,000,025 | ||||||||||||
Total | 25,674,576 | 27.26 | ||||||||||||||
| 1 | This table reflects the situation as at December 31, 2011. Subsequently, on January 18, 2012, the Company announced to increase the size of the program to a maximum amount of EUR 1,130 million. |
| ASML STATUTORY ANNUAL REPORT 2011 | 125 |
5. Personnel
The number of employees employed by the ASML Holding N.V. at year-end 2011 was five (2010: five). The Board of Management consists of five members. For information regarding the remuneration of the Board of Management reference is made to Note 30 of the consolidated financial statements.
6. Commitments and Contingencies
ASML Holding N.V. has assumed joint and several liabilities in accordance with article 403 Part 9 of Book 2 of The Dutch Civil Code with respect to the following subsidiaries of the Company in the Netherlands: ASML Netherlands B.V. and ASML MaskTools B.V.
From time to time we provide guarantees to third parties in connection with transactions entered into by our Dutch subsidiaries in the ordinary course of business.
ASML Holding N.V. forms a tax unity together with its Dutch subsidiaries, for purposes of Dutch tax laws and are as such jointly and severally liable for the tax debts of the unity.
Veldhoven, the Netherlands
February 13, 2012
Prepared by
The Board of Management:
Eric Meurice
Peter T.F.M. Wennink
Martin A. van den Brink
Frits J. van Hout
Frédéric J.M. Schneider-Maunoury
| ASML STATUTORY ANNUAL REPORT 2011 | 126 |
Other Information
The additional information below includes a brief summary of the most significant provisions of the Articles of Association of the Company. See Note 18 of the consolidated financial statements.
Adoption of Financial Statements
The Board of Management will submit the Company’s statutory annual report, together with a certificate of the auditor in respect thereof, to the General Meeting of Shareholders for adoption.
Statements Appropriation and Determination of Net Income
Dividends may be payable out of net income or retained earnings for shown in the Financial Statements of the Company as adopted by the General Meeting of Shareholders of the Company, after payment first of (accumulated) dividends on any outstanding cumulative preference shares. At its discretion, however, subject to statutory provisions, the Board of Management may, with the prior approval of the Supervisory Board, distribute one or more interim dividends on the ordinary shares before the Financial Statements for any financial year have been adopted by the General Meeting of Shareholders. The Board of Management, with the approval of the Supervisory Board, may decide that all or part of the Company’s net income should be retained and not be made available for distribution to shareholders, except for dividends on the cumulative preference shares. Those net incomes that are not retained may be distributed to shareholders pursuant to a shareholders’ resolution, provided that the distribution does not reduce equity below the amount of reserves required by Dutch law. Existing reserves that are distributable in accordance with Dutch law may be made available to the General Meeting of Shareholders for distribution upon a proposal by the Board of Management, subject to prior approval of the Supervisory Board. As regards cash payments, the rights to dividends and distributions shall lapse if such dividends or distributions are not claimed within five years following the day after the date on which they were made available.
Annually, the Board of Management will assess the amount of dividend that will be proposed to the Annual General Meeting of Shareholders. For 2010, a dividend was declared of EUR 0.40 per ordinary share of EUR 0.09 nominal value which was paid in 2011.
A proposal will be submitted to the Annual General Meeting of Shareholders on April 25, 2012 to declare a dividend for 2011 of EUR 0.46 per ordinary share of EUR 0.09.
Voting Rights
The Company is subject to the relevant provisions of Dutch law applicable to large corporations (the “structuurregime”). These provisions have the effect of concentrating control over certain corporate decisions and transactions in the hands of the Supervisory Board. Members of the Board of Management are appointed by the Supervisory Board. The Supervisory Board shall notify the General Meeting of Shareholders of intended appointments to the Board of Management. General Meetings of Shareholders will be held at least once a year. The Company does not solicit from or nominate proxies for its shareholders. However, shareholders and other persons entitled to attend General Meetings of Shareholders may be represented by proxies.
Extraordinary General Meetings of Shareholders may be held as often as deemed necessary by the Supervisory Board or Board of Management and must be held if one or more ordinary or cumulative preference shareholders jointly representing at least ten percent of the issued share capital make a written request to that effect to the Supervisory Board and the Board of Management specifying in detail the business to be dealt with.
Resolutions are adopted at General Meetings of Shareholders by an absolute majority of the votes cast (except where a different proportion of votes are required by the Articles of Association or Dutch law) and there are generally no quorum requirements applicable to such meetings. In the General Meeting of Shareholders each share confers the right to cast one vote.
Subsequent Events
Subsequent events have been evaluated by the Company until February 13, 2012 which is the issuance date of this Annual Report 2011. There are no subsequent events to report.
| ASML STATUTORY ANNUAL REPORT 2011 | 127 |
Independent auditor’s report
To: The Supervisory Board and Shareholders of ASML Holding N.V.
Report on the financial statements
We have audited the accompanying financial statements for the year 2011 of ASML Holding N.V., Veldhoven. The financial statements include the consolidated financial statements and the company financial statements. The consolidated financial statements comprise the consolidated statement of financial position as at December 31, 2011, the consolidated income statement and the consolidated statements of comprehensive income, changes in equity and cash flows for the year then ended, and notes, comprising a summary of the significant accounting policies and other explanatory information. The company financial statements comprise the company balance sheet as at December 31, 2011, the company income statement for the year then ended and the notes, comprising a summary of the accounting policies and other explanatory information.
Management’s responsibility
Management is responsible for the preparation and fair presentation of these financial statements in accordance with International Financial Reporting Standards as adopted by the European Union and with Part 9 of Book 2 of the Dutch Civil Code, and for the preparation of the management board report in accordance with Part 9 of Book 2 of the Dutch Civil Code. Furthermore management is responsible for such internal control as it determines is necessary to enable the preparation of the financial statements that are free from material misstatement, whether due to fraud or error.
Auditor’s responsibility
Our responsibility is to express an opinion on these financial statements based on our audit. We conducted our audit in accordance with Dutch law, including the Dutch Standards on Auditing. This requires that we comply with ethical requirements and plan and perform the audit to obtain reasonable assurance about whether the financial statements are free from material misstatement.
An audit involves performing procedures to obtain audit evidence about the amounts and disclosures in the financial statements. The procedures selected depend on the auditor’s judgment, including the assessment of the risks of material misstatement of the financial statements, whether due to fraud or error.
In making those risk assessments, the auditor considers internal control relevant to the entity’s preparation and fair presentation of the financial statements in order to design audit procedures that are appropriate in the circumstances, but not for the purpose of expressing an opinion on the effectiveness of the entity’s internal control. An audit also includes evaluating the appropriateness of accounting policies used and the reasonableness of accounting estimates made by management, as well as evaluating the overall presentation of the financial statements.
We believe that the audit evidence we have obtained is sufficient and appropriate to provide a basis for our audit opinion.
Opinion with respect to the consolidated financial statements
In our opinion, the consolidated financial statements give a true and fair view of the financial position of ASML Holding N.V. as at December 31, 2011 and of its result and its cash flows for the year then ended in accordance with International Financial Reporting Standards as adopted by the European Union and with Part 9 of Book 2 of the Dutch Civil Code.
Opinion with respect to the company financial statements
In our opinion, the company financial statements give a true and fair view of the financial position of ASML Holding N.V. as at December 31, 2011 and of its result for the year then ended in accordance with Part 9 of Book 2 of the Dutch Civil Code.
| ASML STATUTORY ANNUAL REPORT 2011 | 128 |
Report on other legal and regulatory requirements
Pursuant to the legal requirement under Section 2:393 sub 5 at e and f of the Dutch Civil Code, we have no deficiencies to report as a result of our examination whether the management board report, to the extent we can assess, has been prepared in accordance with Part 9 of Book 2 of this Code, and whether the information as required under Section 2:392 sub 1 at b-h has been annexed. Further we report that the management board report, to the extent we can assess, is consistent with the financial statements as required by Section 2:391 sub 4 of the Dutch Civil Code.
Deloitte Accountants B.V
/s/ G.M. Dekker
Eindhoven, The Netherlands
February 13, 2012
| ASML STATUTORY ANNUAL REPORT 2011 | 129 |
Information and Investor Relations
Financial calendar
April 18, 2012
Announcement of First Quarter results for 2012
April 25, 2012
General meeting of Shareholders
Auditorium, ASML Building 7,
De Run 6665
Veldhoven, the Netherlands
July 18, 2012
Announcement of Second Quarter results for 2012
October 17, 2012
Announcement of Third Quarter results for 2012
Fiscal Year
ASML’s fiscal year ends on December 31, 2012
Listing
The ordinary shares of the Company are listed on the official market of the Euronext Amsterdam by NYSE Euronext and in the United States on the NASDAQ Stock Market LLC, under the symbol “ASML”. ASML’s ordinary shares may also trade on other stock exchanges from time to time, although ASML has not applied for listings on those exchanges and does not endorse and may not be notified of such trading.
Investor Relations
ASML Investor Relations will supply information or copies of the Annual Report on Form 20-F filed with the US Securities and Exchange Commission and the Statutory Annual Report. These Annual Reports, quarterly releases and other information are also available on the ASML website (www.asml.com).
| ASML STATUTORY ANNUAL REPORT 2011 | 130 |
ASML Worldwide Contact Information
Corporate Headquarters
De Run 6501
5504 DR Veldhoven
The Netherlands
Mailing address
P.O. Box 324
5500 AH Veldhoven
The Netherlands
United States main offices
8555 South River Parkway
Tempe, AZ 85284
U.S.A.
77 Danbury Road
Wilton, CT 06897
U.S.A.
Asia main office
17th Floor Suite 1702-3
Queen’s road Central 100
Hong Kong
Corporate Communications
phone: +31 40 268 7870
email: corpcom@asml.com
Investor Relations
phone: +31 40 268 3938
email: investor.relations@asml.com
For more information please visit our
website www.asml.com
| ASML STATUTORY ANNUAL REPORT 2011 | 131 |