Exhibit 99.2
ASML 2012 Second Quarter Results
ASML confirms steady sales for the remainder of the year
Veldhoven, the Netherlands
July 18, 2012
Public
Slide 2 18 July 2012
Safe Harbor
“Safe Harbor” Statement under the US Private Securities Litigation Reform Act of 1995: the matters discussed in this document may include forward-looking statements, including statements made about our outlook, including expected sales trends, expected shipments of tools, productivity of our tools, purchase commitments, IC unit demand, financial results, expected gross margin and expenses, statements about our co-investment program including potential funding commitments in connection with that program and statements about our buy-back program.
These forward looking statements are subject to risks and uncertainties including, but not limited to: economic conditions, product demand and semiconductor equipment industry capacity, worldwide demand and manufacturing capacity utilization for semiconductors (the principal product of our customer base), including the impact of general economic conditions on consumer confidence and demand for our customers products, competitive products and pricing, the impact of manufacturing efficiencies and capacity constraints, the continuing success of technology advances and the related pace of new product development and customer acceptance of new products, our ability to enforce patents and protect intellectual property rights, the risk of intellectual property litigation, availability of raw materials and critical manufacturing equipment, trade environment, changes in exchange rates, available cash, distributable reserves for dividend payments and share repurchases, risks associated with our co-investment program, including whether shareholder approval of the Second Issuance and the synthetic buyback at the EGM will be obtained, receipt of regulatory approvals, whether other customers will participate in the program, whether the 450mm and EUV research and development programs will be successful, ASML’s ability to hire additional workers as part of the 450mm and
EUV programs described in this release and other risks indicated in the risk factors included in ASML_s Annual
Report on Form 20-F and other filings with the US Securities and Exchange Commission.
Public
Slide 3 18 July 2012
“ Business summary
“ Co-investment program
“ Market
“ ASML technology strategy
“ Outlook
Public
Slide 4 18 July 2012
Business summary
Public
Slide 5 18 July 2012
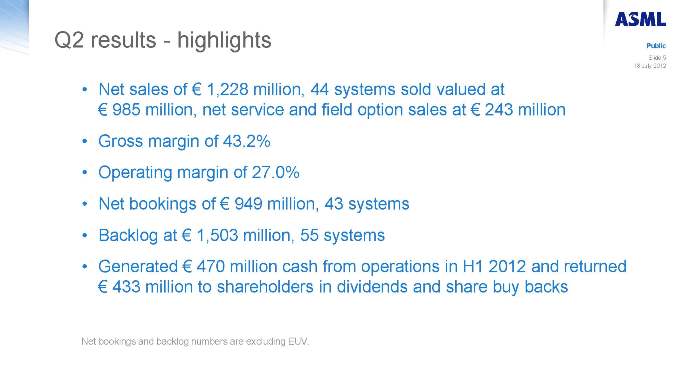
Q2 results—highlights
“ Net sales of € 1,228 million, 44 systems sold valued at
€ 985 million, net service and field option sales at € 243 million
“ Gross margin of 43.2%
“ Operating margin of 27.0%
“ Net bookings of € 949 million, 43 systems
“ Backlog at € 1,503 million, 55 systems
“ Generated € 470 million cash from operations in H1 2012 and returned
€ 433 million to shareholders in dividends and share buy backs
Net bookings and backlog numbers are excluding EUV.
Public
Slide 6 18 July 2012
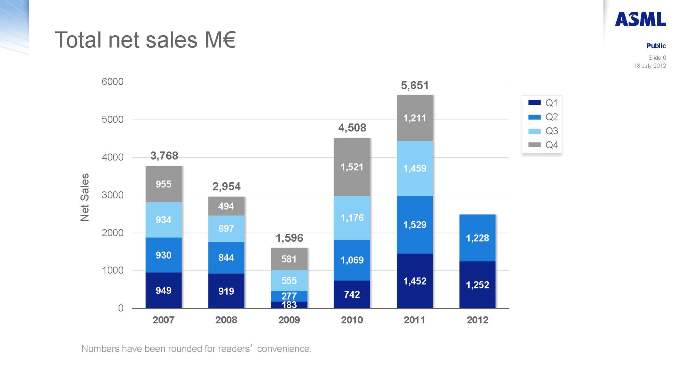
Total net sales M€
6000 5,651
5000 4,508 1,211 4000 3,768
1,521 1,459
955 2,954
Sales 3000
494
Net 934 1,176
697 1,529
2000
1,596 1,228
930 844
581 1,069
1000
555 1,452
1,252 949 919 742 277
0 183
2007 2008 2009 2010 2011 2012
Q1 Q2 Q3 Q4
Numbers have been rounded for readers convenience.
Public
Slide 7 18 July 2012
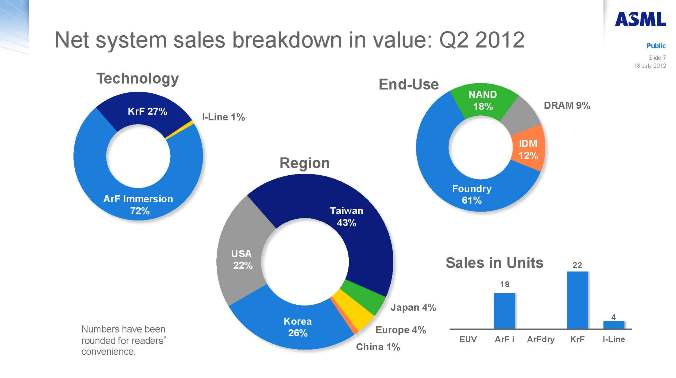
Net system sales breakdown in value: Q2 2012
Technology
KrF 27%
I-Line 1%
ArF Immersion 72%
End-Use NAND
18% DRAM 9%
IDM 12%
Foundry 61%
Region
Taiwan 43%
USA 22%
Japan 4% Korea Europe 4% 26% China 1%
Sales in Units 22
18
4 EUV ArF i ArFdry KrF I-Line
Numbers have been rounded for readers_ convenience.
Public
Slide 8 18 July 2012
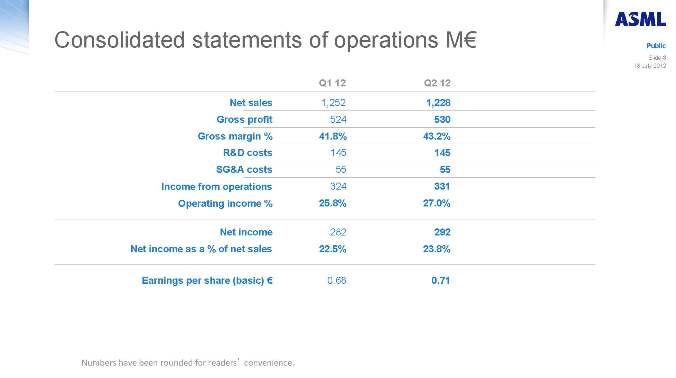
Consolidated statements of operations M€
Q1 12 Q2 12
Net sales 1,252 1,228 Gross profit 524 530 Gross margin % 41.8% 43.2% R&D costs 145 145 SG&A costs 55 55 Income from operations 324 331 Operating income % 25.8% 27.0%
Net income 282 292 Net income as a % of net sales 22.5% 23.8%
Earnings per share (basic) € 0.68 0.71
Numbers have been rounded for readers_ convenience.
Public
Slide 9 18 July 2012
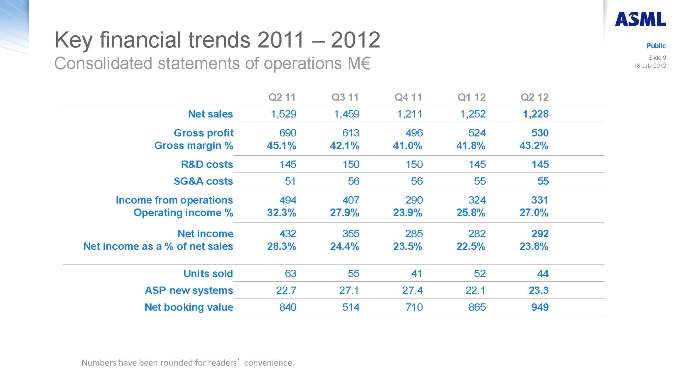
Key financial trends 2011 _ 2012
Consolidated statements of operations M€
Q2 11 Q3 11 Q4 11 Q1 12 Q2 12
Net sales 1,529 1,459 1,211 1,252 1,228
Gross profit 690 613 496 524 530
Gross margin % 45.1% 42.1% 41.0% 41.8% 43.2%
R&D costs 145 150 150 145 145
SG&A costs 51 56 56 55 55
Income from operations 494 407 290 324 331
Operating income % 32.3% 27.9% 23.9% 25.8% 27.0%
Net income 432 355 285 282 292
Net income as a % of net sales 28.3% 24.4% 23.5% 22.5% 23.8%
Units sold 63 55 41 52 44
ASP new systems 22.7 27.1 27.4 22.1 23.3
Net booking value 840 514 710 865 949
Numbers have been rounded for readers_ convenience.
Public
Slide 10 18 July 2012
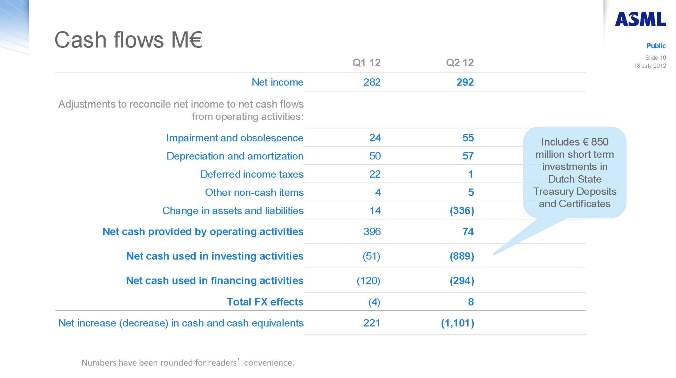
Cash flows M€
Q1 12 Q2 12
Net income 282 292
Adjustments to reconcile net income to net cash flows from operating activities:
Impairment and obsolescence 24 55 Depreciation and amortization 50 57 Deferred income taxes 22 1 Other non-cash items 4 5 Change in assets and liabilities 14 (336)
Net cash provided by operating activities 396 74 Net cash used in investing activities (51) (889) Net cash used in financing activities (120) (294) Total FX effects (4) 8
Net increase (decrease) in cash and cash equivalents 221 (1,101)
Includes € 850 million short term investments in Dutch State Treasury Deposits and Certificates
Numbers have been rounded for readers_ convenience.
Public
Slide 11 18 July 2012
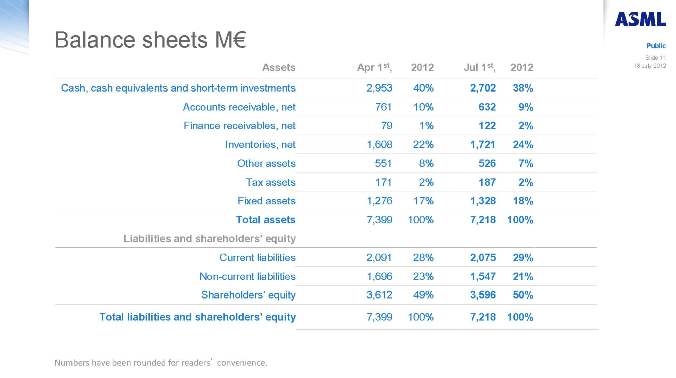
Balance sheets M€
Assets Apr 1st, 2012 Jul 1st, 2012
Cash, cash equivalents and short-term investments 2,953 40% 2,702 38% Accounts receivable, net 761 10% 632 9% Finance receivables, net 79 1% 122 2% Inventories, net 1,608 22% 1,721 24% Other assets 551 8% 526 7% Tax assets 171 2% 187 2% Fixed assets 1,276 17% 1,328 18% Total assets 7,399 100% 7,218 100%
Liabilities and shareholders_ equity
Current liabilities 2,091 28% 2,075 29% Non-current liabilities 1,696 23% 1,547 21%
Shareholders_ equity 3,612 49% 3,596 50%
Total liabilities and shareholders_ equity 7,399 100% 7,218 100%
Numbers have been rounded for readers_ convenience.
Public
Slide 12 18 July 2012
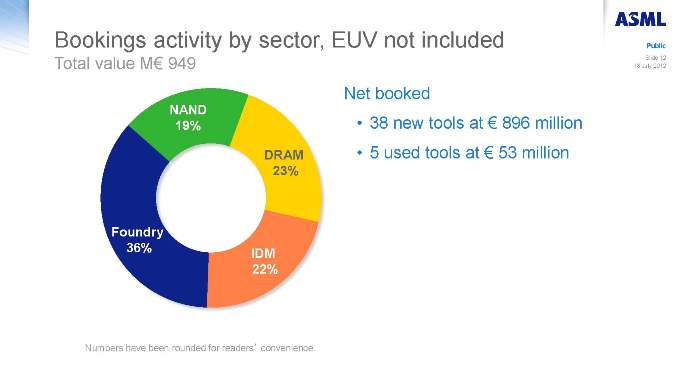
Bookings activity by sector, EUV not included
Total value M€ 949
NAND 19%
DRAM 23%
Foundry 36%
IDM 22%
Net booked
“ 38 new tools at € 896 million
“ 5 used tools at € 53 million
Numbers have been rounded for readers_ convenience.
Public
Slide 13 18 July 2012
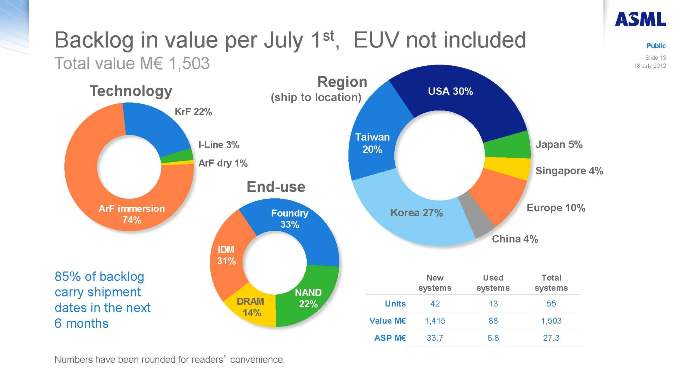
Backlog in value per July 1st, EUV not included
Total value M€ 1,503
Technology
KrF 22%
I-Line 3%
ArF dry 1%
ArF immersion
74%
End-use
Foundry 33%
IDM
31%
NAND DRAM 22% 14%
Region
USA 30%
(ship to location)
Taiwan
Japan 5% 20%
Singapore 4%
Europe 10% Korea 27%
China 4%
New Used Total systems systems systems
Units 42 13 55 Value M€ 1,415 88 1,503 ASP M€ 33.7 6.8 27.3
85% of backlog carry shipment dates in the next 6 months
Numbers have been rounded for readers_ convenience.
Public
Slide 14 18 July 2012
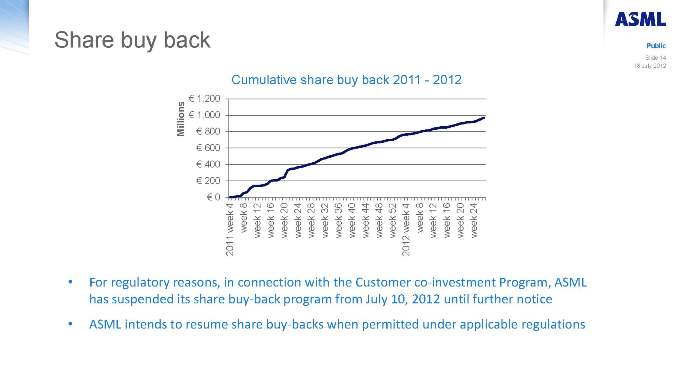
Share buy back
Cumulative share buy back 2011—2012
Millions € 1,200
€ 1,000
€ 800
€ 600
€ 400
€ 200
€ 0 week 4 week 8 week 12 week 16 week 20 week 24 week 28 week 32 week 36 week 40 week 44 week 48 week 52 week 4 week 8 week 12 week 16 week 20 week 24
2011 2012
“ For regulatory reasons, in connection with the Customer co-investment Program, ASML has suspended its share buy-back program from July 10, 2012 until further notice
“ ASML intends to resume share buy-backs when permitted under applicable regulations

Public
Slide 15 18 July 2012
Co-investment program
Public
Slide 16 18 July 2012
Customer co-investment program announced July 9th
“ Announced program where customers can contribute up to € 1.38 billion over the next 5 years to accelerate the development of next generation technology
“ EUV technology beyond the current generation
“ Development of 450mm wafer technology
“ Customer co-investment strategy includes minority equity investments in ASML
“ Issue of up to an aggregate 25% minority equity stake to participating customers
“ Return entire cash proceeds from share issuance to shareholders* through a synthetic share buy-back
“ Discussions with other customers on-going
*excluding participating customers

Public
Slide 17 18 July 2012
Market
Public
Slide 18 18 July 2012
Business environment
“ ASML_s H2 2012 revenue level is expected to be between € 2.2 billion and € 2.4 billion sustained by:
“ An increase of NAND memory critical layer systems shipments
“ Stability of DRAM memory systems sales
“ Lower 28/32 nm Logic demand in H2 compared with H1 2012
Public
Slide 19 18 July 2012
ASML technology strategy
Public
Slide 20 18 July 2012
Immersion _ Productivity improvements
“ TWINSCAN NXT:1950 productivity of 230 wafers per hour now the standard
“ Shipped 30 systems to customers to date
“ System upgrades at customer manufacturing sites has begun
“ Our best TWINSCAN NXT:1950i
“ Printed more than 5,100 wafers in a single day in production
“ Previous record 4,500 wafers achieved just 3 months ago
“ Highlighting continued productivity improvements of our systems
Public
Slide 21 18 July 2012
EUV status _ NXE:3300
“ Exposed first wafers on the NXE:3300 EUV scanners, the volume production successor of the NXE:3100
“ First NXE:3300 is expected to ship by end 2012 or early 2013
“ Shipment of the remainder of the 11 tools on order is planned in 2013
“ Received customer commitment to purchase 4 additional NXE:3300 systems for delivery in 2014
“ Commitment is enabled by data gathered on source power increase and steady performance of the 6 EUV tools in the field
“ Customers are accelerating development and preparing for first semiconductor production on EUV in 2014
Public
Slide 22 18 July 2012
EUV status—source
“ EUV source, 50 Watt power capability has been repeatedly demonstrated at a supplier
“ 105 Watt concept potential has been confirmed in lab experiments, supporting our roadmap to volume production systems starting at 70 wafers per hour in 2014
“ In situ confirmation is still necessary on the NXE:3300
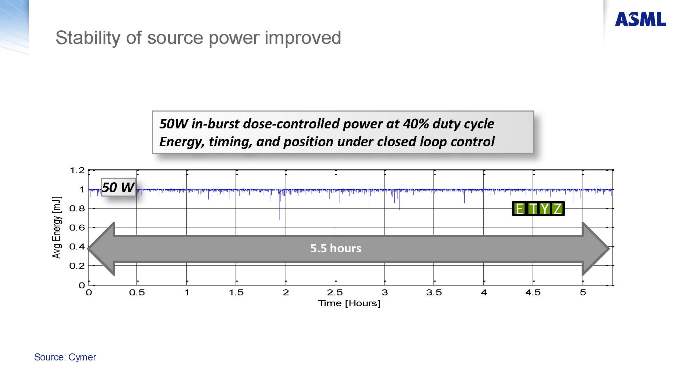
Stability of source power improved
50W in-burst dose-controlled power at 40% duty cycle Energy, timing, and position under closed loop control
1.2
1 50 W
mJ ]
0.8
[ E T Y Z
ergy 0.6 E n
g 0.4 5.5 hours
Av
0.2
00 0.5 1 1.5 2 2.5 3 3.5 4 4.5 5 Time [Hours]
Source: Cymer
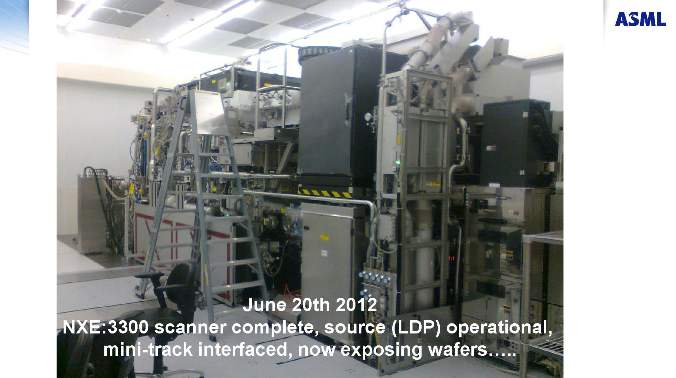
June 20th 2012
NXE:3300 scanner complete, source (LDP) operational, mini-track interfaced, now exposing wafers&
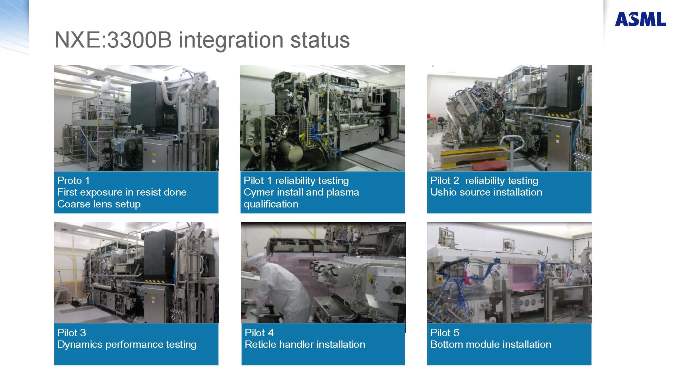
NXE:3300B integration status
Proto 1
First exposure in resist done Coarse lens setup
Pilot 1 reliability testing Cymer install and plasma qualification
Pilot 2 reliability testing Ushio source installation
Pilot 3
Dynamics performance testing
Pilot 4
Reticle handler installation
Pilot 5
Bottom module installation

Public
Slide 26 18 July 2012
Outlook
Public
Slide 27 18 July 2012
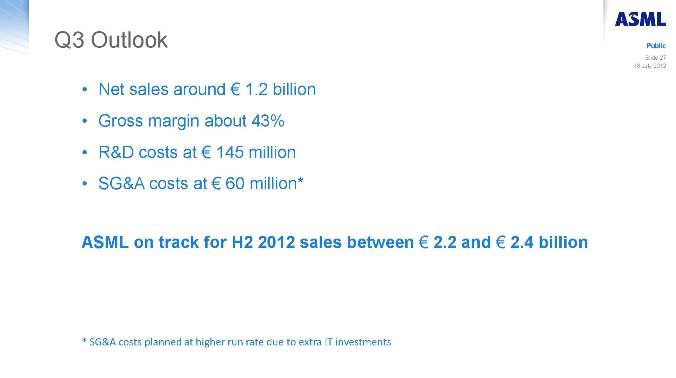
Q3 Outlook
“ Net sales around € 1.2 billion
“ Gross margin about 43%
“ R&D costs at € 145 million
“ SG&A costs at € 60 million*
ASML on track for H2 2012 sales between € 2.2 and € 2.4 billion
* SG&A costs planned at higher run rate due to extra IT investments