UNITED STATES
SECURITIES AND EXCHANGE COMMISSION
WASHINGTON, D.C. 20549
FORM N-CSR
CERTIFIED SHAREHOLDER REPORT OF REGISTERED MANAGEMENT
INVESTMENT COMPANIES
Investment Company Act file number 811-07255
Oppenheimer International Bond Fund
(Exact name of registrant as specified in charter)
6803 South Tucson Way, Centennial, Colorado 80112-3924
(Address of principal executive offices) (Zip code)
Cynthia Lo Bessette
OFI Global Asset Management, Inc.
225 Liberty Street, New York, New York 10281-1008
(Name and address of agent for service)
Registrant’s telephone number, including area code: (303) 768-3200
Date of fiscal year end: September 30
Date of reporting period: 3/31/2018
Item 1. Reports to Stockholders.
Table of Contents
Class A Shares
AVERAGE ANNUAL TOTAL RETURNS AT 3/31/18
| | | | | | | | | | | | | | | | |
| | | 6-Month | | | 1-Year | | | 5-Year | | | 10-Year | |
Class A Shares of the Fund without Sales Charge | | | 3.84 | % | | | 9.68 | % | | | 2.26 | % | | | 3.38 | % |
Class A Shares of the Fund with Sales Charge | | | 1.10 | | | | 4.47 | | | | 1.27 | | | | 2.88 | |
Citigroup Non-U.S. Dollar World Government Bond Index | | | 6.06 | | | | 12.93 | | | | 1.36 | | | | 1.82 | |
JP Morgan Government Bond Index-Emerging Markets Global Diversified | | | 5.30 | | | | 12.99 | | | | -0.67 | | | | 3.78 | |
JP Morgan Emerging Markets Bond Index Global Diversified | | | -0.60 | | | | 4.30 | | | | 4.69 | | | | 7.04 | |
Reference Index | | | 4.49 | | | | 11.22 | | | | 1.52 | | | | 3.27 | |
Performance data quoted represents past performance, which does not guarantee future results. The investment return and principal value of an investment in the Fund will fluctuate so that an investor’s shares, when redeemed, may be worth more or less than their original cost. Fund returns include changes in share price, reinvested distributions, and a 4.75% maximum applicable sales charge except where “without sales charge” is indicated. Current performance may be lower or higher than the performance quoted. Returns do not consider capital gains or income taxes on an individual’s investment. Returns for periods of less than one year are cumulative and not annualized. For performance data current to the most recent month-end, visit oppenheimerfunds.com or call 1.800.CALL OPP (225.5677). See Fund prospectuses and summary prospectuses for more information on share classes and sales charges.
2 OPPENHEIMER INTERNATIONAL BOND FUND
Fund Performance Discussion
The Fund’s Class A shares (without sales charge) returned 3.84% during the reporting period, underperforming the Reference Index (“the Index”), a customized weighted index currently comprised of 50% of the Citigroup Non-U.S. Dollar World Government Bond Index, 30% of the JP Morgan Government Bond Index – Emerging Markets Global Diversified, and 20% of the JP Morgan Emerging Markets Bond Index Global Diversified, which returned 4.49%.
MARKET OVERVIEW
Markets continued to rally to close 2017. However, volatility reemerged during the first quarter of 2018. Early gains in January were given back during the remainder of the quarter. Emerging market (EM) fixed income was among the winners as expected, while U.S. Treasury yields continued to increase. The U.S. dollar started 2018 weaker but was fairly stable in the closing weeks of the period.
Global economic data stabilized during the reporting period, above their historical averages after a couple of quarters of momentum gains. The cyclical uptick seen in recent quarters is encouraging with improvements in global investment, trade, and industrial production. Business and consumer confidence are at cyclical highs in many countries. A major change in the outlook was a result of the fiscal stimulus in the U.S., comprising both tax cuts and spending promises. In our view, this stimulus could add to growth over the next two years. First quarter Eurozone data have cooled slightly, but after several quarters of upside surprises, some stabilization is not surprising. The underlying drivers of Eurozone
growth are intact and growth should remain around its current trend, in our view. Japan’s unemployment rate hit a 24-year low. Growth expectations remain upbeat in several other countries, including Canada, Australia, Sweden, Eastern Europe and parts of Asia. Economic growth in Latin America continues to be led by Brazil.
The U.S. economy continued to perform well. This year, Gross Domestic Product (GDP) growth is expected to be around 3%, significantly exceeding the 2% trend growth of this expansion. Private consumption, the driving force of the economy in recent years, has been growing at a stable rate. Additionally, business fixed investment has gained momentum in recent months and has been broadening across sectors. With increasingly less slack in the economy, strong profits, and the corporate tax cuts, we believe investment should support growth and productivity improvements. Headwinds from international trade turned into tailwinds as lagged effects from earlier U.S. dollar strength diminishes. In fact, U.S. dollar weakness typically leads to increased global growth
3 OPPENHEIMER INTERNATIONAL BOND FUND
momentum.
In summary, the expansion continues as the economy is nearing the Federal Reserve’s (the Fed) dual mandate of full employment and price stability. On the inflation front, the negative surprises of the past year are behind us, and underlying inflation is converging towards the Fed’s 2% target. The Fed is on track to deliver three to four rate hikes in 2018, and the first hike was delivered in March 2018. On February 5, Chairman Powell was installed as the new head of the Federal Reserve. Under his leadership the Federal Open Market Committee (FOMC) signaled that the Fed will remain cautious and will tighten policy gradually, giving comfort to the markets. So far the Fed’s hiking cycle has been orderly.
International economic and geopolitical concerns resurfaced during the reporting period and caused some market turbulence. Trade issues were front and center, but beyond the rhetoric, actual measures that were implemented thus far were not of major economic significance. The risk remains that the trade rhetoric and actions escalate, but this is not our baseline case. Tensions in the Middle East are worth watching in the coming quarter.
The Bloomberg Barclays U.S. Aggregate Bond Index finished the six-month reporting period with a negative return of 1.08%, largely due to underperformance across U.S. credit primarily in corporates. With the euro, Japanese yen, and the British pound
rallying, the Citigroup Non-U.S. Dollar World Government Bond Index gained 6.06%.
The U.S. dollar (USD) generally weakened during the reporting period. Major foreign exchange (FX) moves included Japanese yen (JPY), British pound (GBP), euro (EUR), and Norwegian krone (NOK). These currencies rallied on the continuation of a favorable view on growth and stable political environments.
EM currencies rallied as well, with the South African rand leading the way with an 18.7% return, following the resignation of Jacob Zuma and Cyril Ramaphosa’s consequent ascendency to president. The Malaysian ringgit (MYR) returned 11.2% due to strong economic activity with full year 2017 GDP at 5.9%. The Mexican peso returned 4.4% due to stable growth and less uncertainty regarding NAFTA negotiations.
Global government bond market performance was mixed, with 10-Year U.S. Treasury yields closing 41 basis points (bps) higher than at the beginning of the period at 2.74% and Japanese, Canadian and German yields remaining in a narrower range. Yields in the United Kingdom were essentially flat during the time. In EM, yields were mixed with Mexico 10-year yields widening by 45 bps and Brazil 10-year yields tightening by 23 bps.
FUND REVIEW
The Fund invests in three major risk categories, or levers – interest rates (typically government bonds), currencies (FX), and
4 OPPENHEIMER INTERNATIONAL BOND FUND
credit (corporate bonds and other fixed-income instruments containing credit risk). FX and rates detracted from the Fund’s relative performance this reporting period, whereas credit contributed positively to relative performance.
In FX, the primary detractor was our underweight in the South African rand. An underweight in the Mexican peso also detracted from performance. Top contributors to performance in FX included an underweight position in the Turkish new lira and our position in the British pound. In anticipation of a shift from the strong U.S. dollar regime, we increased our exposure to FX to 71%, which is underweight the Index by 9%.
In rates, top detractors were overweight positions in Mexico and India. Top contributors included Greece and Turkey.
The Fund outperformed the Index in emerging market credit, led by its exposure to Austria and Spain. Emerging market credit experienced volatility over the second half of the period given its duration and the great “trade war” noise. We maintained our tilt toward higher-yielding credits, which have a greater spread against rising rates. We have pared back our overweight in state-owned oil & gas companies selectively on valuations, but our view of these companies is still constructive as they continue to repair their credit profiles and many companies offer an attractive yield advantage over their country’s government bonds. In the meantime, oil prices
have rallied.
STRATEGY & OUTLOOK
We expect a further continuation of the global recovery and expansion we have seen since mid-2016:
| ● | | The upswing in global growth has been broad and synchronized, with the U.S., Eurozone, Japan, Canada, Australia, China, and EM benefitting from higher commodities, and recovery from a recession in Brazil. |
| ● | | Global growth continues to be both deep and widespread as the majority of countries across both developed and emerging markets grow. U.S. GDP can further accelerate in the short term with the fiscal stimulus and tax reforms. |
| ● | | There has been an improvement in the structure of growth. We believe the global economy is poised to improve on the back of high consumer and business confidence. Consumption has stabilized while at the same time, global Purchasing Managers’ Indices (PMIs) and capital expenditure expectations suggest continued momentum. |
| ● | | Growth is less reliant on the contribution of easy monetary policy, which is gradually moving from easing to neutral. This growth pick-up is occurring against the backdrop of gradual withdrawal of easy central bank policies, but financial conditions remain supportive in major economies. |
| ● | | Commodities were mixed with copper declining and Brent crude rallying based |
5 OPPENHEIMER INTERNATIONAL BOND FUND
on the possibility of OPEC extending its production cuts for 2018.
In addition, in our view, these macroeconomic trends are likely to continue, as the U.S. and Europe continue to improve, and as India and China reach more sustainable growth levels. We further believe that globally, there will be a multitude of fiscal and monetary policy divergences. These divergences may require frequent tactical adjustments to the portfolio, and country and lever selection will take precedence for the next few quarters. We also believe that cycles are likely to be shorter than they have been since the global financial crisis. In our opinion, a decade of easy monetary policy is globally giving way to shorter fiscal, market and monetary cycles.
We believe active tactical management should afford opportunities over the coming year:
| ● | | We continue to believe Brazil will continue to have tighter fiscal policy, but easier monetary policy. Brazil leads Latin America in growth and the recent imprisonment of the former president bodes well for the potential reduction in governmental corruption and reform. |
| ● | | In China, a new era dawned during the National People’s Congress in March 2018. President Xi was able to consolidate power and eliminate the two-term limit for president. We believe that the Chinese Communist Party will enact structural reforms in an attempt to make China great by reducing poverty, improving the environment, and upgrading manufacturing |
| | | technology. The additional financial reforms are an attempt to ensure the Chinese Communist Party’s financial policy is uniformly executed through monetary and regulatory policies. We believe these policies will translate into more deleveraging in the financial sector with additional capacity reduction via closing zombie state-owned enterprises and stricter enforcement of environmental regulations. |
| ● | | We favor Mexican rates due to high real yields. We believe the recent uptick in inflation was a result of the currency devaluation over the past year which has now subsided. We do not believe the U.S. wants a confrontation with both China and Mexico over trade at the same time, so the NAFTA negotiations should not result in a full termination of the agreement. |
| ● | | We also like Indian rates due to high real yields and decreasing inflation. Inflation has been decreasing because of the positive reforms such as the enactment of the Goods and Services Tax that makes interstate commerce more cost effective and efficient. |
In FX, our base case has not changed, but the likelihood of a U.S. dollar bull case has almost all but disappeared. The U.S. tax bill did not have a significant impact on the USD and we strongly believe that growth and, more importantly, growth differentials, will be driving foreign currencies to higher valuations. In the intermediate-term, we expect the U.S. dollar to depreciate. While short-term periods of strength may still occur due to additional
6 OPPENHEIMER INTERNATIONAL BOND FUND
fiscal stimulus, higher U.S. organic growth or higher U.S. real yields, our belief is that the USD will revert to its historical average over time. Based on this, we expect to add to our FX exposure, which currently is at 71%, over the next few quarters depending on valuations. While the bulk of our currency exposure is in the euro and the Japanese yen, we will selectively own high-yielding EM currencies where we see improving fundamentals.
In rates, we continue to see more value in EM duration than in developed markets duration. With uncertain U.S. trade policy, emerging market valuations have oscillated during very short bouts of risk off sentiments. Despite these isolated periods our view of emerging markets remains very constructive. With global growth and world trade on solid footing, we feel that emerging market local debt remains attractive. Given economic and expected monetary policy rates in EM, we are overweight duration in Brazil, India, and Indonesia while underweight duration in
Turkey, Malaysia, and Thailand, relative to the Index. We remain significantly underweight Japanese government bonds and core European bonds compared to the Index.
Looking ahead, while credit fundamentals have improved on stronger global growth, valuations are becoming rich and we expect to reduce our exposure over the next few quarters. We continue to like European financials, which in our view should continue to benefit from an improving domestic economy and the possible rate increase by the European Central Bank. The current deposit rate of -0.40% has been onerous for the banks and any increase could help their balance sheets. We also favor emerging market credit as the emerging markets-developed markets growth differential continues to widen, with a preference for high-quality high-yield sovereigns. We own credit in countries where growth is positive and the particular companies are deleveraging.
| | |
 | | 
Hemant Baijal Portfolio Manager |
| |
 | | 
Wim Vandenhoeck Portfolio Manager |
| | |
 | | 
Christopher Kelly Portfolio Manager |
7 OPPENHEIMER INTERNATIONAL BOND FUND
Top Holdings and Allocations
TOP TEN GEOGRAPHICAL HOLDINGS
| | |
United States | | 14.1% |
| United Kingdom | | 9.5 |
| Mexico | | 8.6 |
| India | | 6.8 |
| Brazil | | 5.6 |
| Spain | | 4.6 |
| Russia | | 4.2 |
| Indonesia | | 4.2 |
| South Africa | | 3.9 |
| Argentina | | 3.0 |
Portfolio holdings and allocation are subject to change. Percentages are as of March 31, 2018, and are based on total market value of investments. For more current Fund holdings, please visit oppenheimerfunds.com.
REGIONAL ALLOCATION
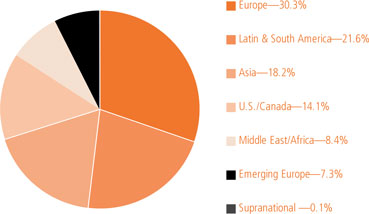
Portfolio holdings and allocations are subject to change. Percentages are as of March 31, 2018, and are based on the total market value of investments.
8 OPPENHEIMER INTERNATIONAL BOND FUND
Share Class Performance
AVERAGE ANNUAL TOTAL RETURNS WITHOUT SALES CHARGE AS OF 3/31/18
| | | | | | | | | | | | | | | | | | | | |
| | | Inception
Date | | | 6-Month | | | 1-Year | | | 5-Year | | | 10-Year | |
Class A (OIBAX) | | | 6/15/95 | | | | 3.84 | % | | | 9.68 | % | | | 2.26 | % | | | 3.38 | % |
Class B (OIBBX) | | | 6/15/95 | | | | 3.45 | | | | 8.87 | | | | 1.51 | | | | 2.86 | |
Class C (OIBCX) | | | 6/15/95 | | | | 3.46 | | | | 8.70 | | | | 1.51 | | | | 2.63 | |
Class I (OIBIX) | | | 1/27/12 | | | | 4.05 | | | | 9.95 | | | | 2.71 | | | | 3.49 | * |
Class R (OIBNX) | | | 3/1/01 | | | | 3.71 | | | | 9.24 | | | | 1.99 | | | | 3.04 | |
Class Y (OIBYX) | | | 9/27/04 | | | | 3.97 | | | | 9.76 | | | | 2.52 | | | | 3.66 | |
AVERAGE ANNUAL TOTAL RETURNS WITH SALES CHARGE AS OF 3/31/18
| | | | | | | | | | | | | | | | | | | | |
| | | Inception
Date | | | 6-Month | | | 1-Year | | | 5-Year | | | 10-Year | |
Class A (OIBAX) | | | 6/15/95 | | | | -1.10 | % | | | 4.47 | % | | | 1.27 | % | | | 2.88 | % |
Class B (OIBBX) | | | 6/15/95 | | | | -1.55 | | | | 3.87 | | | | 1.16 | | | | 2.86 | |
Class C (OIBCX) | | | 6/15/95 | | | | 2.46 | | | | 7.70 | | | | 1.51 | | | | 2.63 | |
Class I (OIBIX) | | | 1/27/12 | | | | 4.05 | | | | 9.95 | | | | 2.71 | | | | 3.49 | * |
Class R (OIBNX) | | | 3/1/01 | | | | 3.71 | | | | 9.24 | | | | 1.99 | | | | 3.04 | |
Class Y (OIBYX) | | | 9/27/04 | | | | 3.97 | | | | 9.76 | | | | 2.52 | | | | 3.66 | |
*Shows performance since inception.
STANDARDIZED YIELDS
| | | | | | | | |
| For the 30 Days Ended 3/31/18 | | | | | | |
Class A | | 3.86% | | | | | | |
Class B | | 3.26 | | | | | | |
Class C | | 3.30 | | | | | | |
Class I | | 4.45 | | | | | | |
Class R | | 3.80 | | | | | | |
Class Y | | 4.31 | | | | | | |
UNSUBSIDIZED STANDARDIZED YIELDS
| | | | | | | | |
| For the 30 Days Ended 3/31/18 | | | | | | |
Class A | | 3.84% | | | | | | |
Class B | | 3.24 | | | | | | |
Class C | | 3.29 | | | | | | |
Class I | | 4.43 | | | | | | |
Class R | | 3.79 | | | | | | |
Class Y | | 4.29 | | | | | | |
Performance data quoted represents past performance, which does not guarantee future results. The investment return and principal value of an investment in the Fund will fluctuate so that an investor’s shares, when redeemed, may be worth more or less than their original cost. Current performance may be lower or higher than the performance quoted. Returns do not consider capital gains or income taxes on an individual’s investment. For performance data current to the most recent month-end, visit oppenheimerfunds.com or call 1.800. CALL OPP (225.5677). Fund returns include changes in share price, reinvested distributions, and the applicable sales charge: for Class A shares, the current maximum initial sales charge of 4.75%; for Class B shares, the contingent deferred sales charge of 5% (1-year) and 2% (5-year); and for Class C shares, the contingent deferred sales charge of 1% for the 1-year period. There is no sales charge for Class I, Class R and Class Y shares. Because Class B shares convert to Class A shares 72 months after purchase, the 10-year return for Class B shares uses Class A performance for the period after
9 OPPENHEIMER INTERNATIONAL BOND FUND
conversion. Returns for periods of less than one year are cumulative and not annualized. See Fund prospectuses and summary prospectuses for more information on share classes and sales charges.
Standardized yield is based on an SEC-standardized formula designed to approximate the Fund’s annualized hypothetical current income from securities less expenses for the 30-day period ended March 31, 2018 and that date’s maximum offering price (for Class A shares) or net asset value (for all other share classes). Each result is compounded semiannually and then annualized. Falling share prices will tend to artificially raise yields. The unsubsidized standardized yield is computed under an SEC-standardized formula based on net income earned for the 30-day period ended March 31, 2018. The calculation excludes any expense reimbursements and thus may result in a lower yield.
The Fund’s performance is compared to the Citigroup Non-U.S. Dollar World Government Bond Index, JP Morgan Government Bond Index -Emerging Markets Global Diversified, JP Morgan Emerging Markets Bond Index Global Diversified, and the Fund’s Reference Index. The Citigroup Non-U.S. Dollar World Government Bond Index is an index of fixed rate government bonds with a maturity of one year or longer and amounts outstanding of at least U.S. $25 million. The JPMorgan Government Bond Index-Emerging Markets Global Diversified is a comprehensive, global local Emerging Markets Index, and consists of regularly traded, liquid fixed-rate, domestic currency government bonds to which international investors can gain exposure. The JPMorgan Emerging Markets Bond Index Global Diversified is a composite index representing an unleveraged investment in emerging market bonds that is broadly based across the spectrum of emerging market bonds and includes reinvestment of income (to represent real assets). The indices are unmanaged and cannot be purchased directly by investors. While index comparisons may be useful to provide a benchmark for the Fund’s performance, it must be noted that the Fund’s investments are not limited to the investments comprising the indices. Index performance includes reinvestment of income, but does not reflect transaction costs, fees, expenses or taxes. Index performance is shown for illustrative purposes only as a benchmark for the Fund’s performance, and does not predict or depict performance of the Fund. The Fund’s performance reflects the effects of the Fund’s business and operating expenses.
The views in the Fund Performance Discussion represent the opinions of this Fund’s portfolio managers and are not intended as investment advice or to predict or depict the performance of any investment. These views are as of the close of business on March 31, 2018, and are subject to change based on subsequent developments. The Fund’s portfolio and strategies are subject to change.
Before investing in any of the Oppenheimer funds, investors should carefully consider a fund’s investment objectives, risks, charges and expenses. Fund prospectuses and summary prospectuses contain this and other information about the funds, and may be obtained by asking your financial advisor, visiting oppenheimerfunds.com, or calling 1.800.CALL OPP (225.5677). Read prospectuses and summary prospectuses carefully before investing.
Shares of Oppenheimer funds are not deposits or obligations of any bank, are not guaranteed by any bank, are not insured by the FDIC or any other agency, and involve investment risks, including the possible loss of the principal amount invested.
10 OPPENHEIMER INTERNATIONAL BOND FUND
Fund Expenses
Fund Expenses. As a shareholder of the Fund, you incur two types of costs: (1) transaction costs, which may include sales charges (loads) on purchase payments and/or contingent deferred sales charges on redemptions; and (2) ongoing costs, including management fees; distribution and service fees; and other Fund expenses. These examples are intended to help you understand your ongoing costs (in dollars) of investing in the Fund and to compare these costs with the ongoing costs of investing in other mutual funds.
The examples are based on an investment of $1,000.00 invested at the beginning of the period and held for the entire 6-month period ended March 31, 2018.
Actual Expenses. The first section of the table provides information about actual account values and actual expenses. You may use the information in this section for the class of shares you hold, together with the amount you invested, to estimate the expense that you paid over the period. Simply divide your account value by $1,000.00 (for example, an $8,600.00 account value divided by $1,000.00 = 8.60), then multiply the result by the number in the first section under the heading entitled “Expenses Paid During 6 Months Ended March 31, 2018” to estimate the expenses you paid on your account during this period.
Hypothetical Example for Comparison Purposes. The second section of the table provides information about hypothetical account values and hypothetical expenses based on the Fund’s actual expense ratio for each class of shares, and an assumed rate of return of 5% per year for each class before expenses, which is not the Fund’s actual return. The hypothetical account values and expenses may not be used to estimate the actual ending account balance or expenses you paid for the period. You may use this information to compare the ongoing costs of investing in the Fund and other funds. To do so, compare this 5% hypothetical example for the class of shares you hold with the 5% hypothetical examples that appear in the shareholder reports of the other funds.
Please note that the expenses shown in the table are meant to highlight your ongoing costs only and do not reflect any transactional costs, such as front-end or contingent deferred sales charges (loads). Therefore, the “hypothetical” section of the table is useful in comparing ongoing costs only, and will not help you determine the relative total costs of owning different funds. In addition, if these transactional costs were included, your costs would have been higher.
11 OPPENHEIMER INTERNATIONAL BOND FUND
| | | | | | | | | | | | |
| Actual | | Beginning Account Value October 1, 2017 | | | Ending Account Value March 31, 2018 | | | Expenses Paid During 6 Months Ended March 31, 2018 | |
Class A | | | $ 1,000.00 | | | | $ 1,038.40 | | | | $ 5.04 | |
Class B | | | 1,000.00 | | | | 1,034.50 | | | | 8.97 | |
Class C | | | 1,000.00 | | | | 1,034.60 | | | | 8.86 | |
Class I | | | 1,000.00 | | | | 1,040.50 | | | | 2.95 | |
Class R | | | 1,000.00 | | | | 1,037.10 | | | | 6.32 | |
Class Y | | | 1,000.00 | | | | 1,039.70 | | | | 3.77 | |
| | | |
Hypothetical | | | | | | | | | | | | |
(5% return before expenses) | | | | | | | | | | | | |
Class A | | | 1,000.00 | | | | 1,020.00 | | | | 5.00 | |
Class B | | | 1,000.00 | | | | 1,016.16 | | | | 8.89 | |
Class C | | | 1,000.00 | | | | 1,016.26 | | | | 8.78 | |
Class I | | | 1,000.00 | | | | 1,022.04 | | | | 2.93 | |
Class R | | | 1,000.00 | | | | 1,018.75 | | | | 6.26 | |
Class Y | | | 1,000.00 | | | | 1,021.24 | | | | 3.74 | |
Expenses are equal to the Fund’s annualized expense ratio for that class, multiplied by the average account value over the period, multiplied by 182/365 (to reflect the one-half year period). Those annualized expense ratios, excluding indirect expenses from affiliated funds, based on the 6-month period ended March 31, 2018 are as follows:
| | | | | | | | |
Class | | | Expense Ratios | | | | | |
Class A | | | 0.99 | % | | | | |
Class B | | | 1.76 | | | | | |
Class C | | | 1.74 | | | | | |
Class I | | | 0.58 | | | | | |
Class R | | | 1.24 | | | | | |
Class Y | | | 0.74 | | | | | |
The expense ratios reflect voluntary and/or contractual waivers and/or reimbursements of expenses by the Fund’s Manager and Transfer Agent. Some of these undertakings may be modified or terminated at any time, as indicated in the Fund’s prospectus. The “Consolidated Financial Highlights” tables in the Fund’s financial statements, included in this report, also show the gross expense ratios, without such waivers or reimbursements and reduction to custodian expenses, if applicable.
12 OPPENHEIMER INTERNATIONAL BOND FUND
CONSOLIDATED STATEMENT OF INVESTMENTS March 31, 2018 Unaudited
| | | | | | | | | | | | |
| | | | | | Principal Amount | | | Value | |
| Mortgage-Backed Obligations—2.7% | | | | | | | | | | | | |
| Alba plc, Series 2007-1, Cl. C, 0.904% [BP0003M+29], 3/17/391 | | | GBP | | | | 12,436,736 | | | $ | 16,038,428 | |
| Capital Mortgage Srl, Series 2007-1, Cl. B, 0.00% [EUR003M+22], 1/30/471 | | | EUR | | | | 8,000,000 | | | | 6,319,739 | |
Eurohome UK Mortgages plc:
Series 2007-1, Cl. B1, 1.506% [BP0003M+90], 6/15/441 | | | GBP | | | | 5,275,000 | | | | 6,010,425 | |
| Series 2007-2, Cl. B1, 2.006% [BP0003M+140], 9/15/441 | | | GBP | | | | 4,000,000 | | | | 4,665,805 | |
| Eurosail UK plc, Series 2007-5X, Cl. A1A, 1.374% [BP0003M+77], 9/13/451 | | | GBP | | | | 10,464,958 | | | | 13,764,073 | |
| Fondo de Titulizacion de Activos Santander Hipotecario 2, Series 2, Cl. E, 1.771% [EUR003M+210], 1/18/491 | | | EUR | | | | 7,700,000 | | | | 7,567,236 | |
| Great Hall Mortgages No 1 plc, Series 2007-1, Cl. DA, 1.394% [BP0003M+78], 3/18/391 | | | GBP | | | | 3,500,000 | | | | 4,297,861 | |
| Grifonas Finance plc, Series 1, Cl. B, 0.249% [EUR006M+52], 8/28/391 | | | EUR | | | | 5,000,000 | | | | 4,307,756 | |
| Hipocat 11 Fondo de Titulizacion de Activos, Series HIPO-11, Cl. A2, 0.00% [EUR003M+13], 1/15/501 | | | EUR | | | | 2,304,640 | | | | 2,651,098 | |
| Hipocat 9 Fondo de Titulizacion de Activos, Series HIPO-9, Cl. C, 0.00% [EUR003M+29], 7/15/381 | | | EUR | | | | 17,400,000 | | | | 16,383,037 | |
IM Pastor 4 Fondo de Titulizacion de Activos:
Series 4, Cl. A, [EUR003M+14], 3/22/441 | | | EUR | | | | 17,778,817 | | | | 20,288,014 | |
| Series 4, Cl. B, [EUR003M+19], 3/22/441 | | | EUR | | | | 3,000,000 | | | | 1,923,928 | |
| Ludgate Funding plc, Series 2007-1, 0.00%, 1/1/61 | | | GBP | | | | 207,500,000 | | | | 7,764,237 | |
Newgate Funding plc:
Series 2006-2, Cl. CB, 0.101% [EUR003M+43], 12/1/501 | | | EUR | | | | 3,970,946 | | | | 4,479,609 | |
| Series 2007-2X, Cl. CB, 0.113% [EUR003M+44], 12/15/501 | | | EUR | | | | 3,635,265 | | | | 3,942,092 | |
| Series 2007-3X, Cl. D, 3.606% [BP0003M+300], 12/15/501 | | | GBP | | | | 4,816,255 | | | | 6,811,526 | |
| Sestante Finance Srl, Series 3, Cl. C1, 0.471% [EUR003M+80], 7/15/451 | | | EUR | | | | 9,700,000 | | | | 5,574,138 | |
| TDA 27 Hipocat 9 Fondo de Titulizacion de Activos, Series 27, | | | | | | | | | | | | |
| Cl. A3, 0.00% [EUR003M+19], 12/28/501 | | | EUR | | | | 25,000,000 | | | | 26,566,584 | |
| | | | | | | | | | | | |
| Total Mortgage-Backed Obligations (Cost $152,205,385) | | | | | | | | | | | 159,355,586 | |
| | | | | | | | | | | | |
| Foreign Government Obligations—56.4% | | | | | | | | | | | | |
| Argentina—2.2% | | | | | | | | | | | | |
| Argentine Republic: | | | | | | | | | | | | |
| 5.375% Sr. Unsec. Nts., 1/20/232 | | | EUR | | | | 2,535,000 | | | | 3,252,661 | |
| 5.875% Sr. Unsec. Nts., 1/11/28 | | | | | | | 33,990,000 | | | | 32,029,927 | |
| 6.50% Sr. Unsec. Nts., 2/15/232 | | | | | | | 3,575,000 | | | | 3,677,781 | |
| 6.875% Sr. Unsec. Nts., 1/26/27 | | | | | | | 10,125,000 | | | | 10,337,625 | |
| 6.875% Sr. Unsec. Nts., 1/11/48 | | | | | | | 11,950,000 | | | | 10,926,781 | |
| 7.50% Sr. Unsec. Nts., 4/22/26 | | | | | | | 3,670,000 | | | | 3,928,735 | |
| 7.875% Sr. Unsec. Nts., 6/15/272 | | | | | | | 5,445,000 | | | | 5,662,800 | |
| 9.125% Sr. Unsec. Nts., 3/16/242 | | | | | | | 3,430,000 | | | | 3,827,914 | |
| 15.50% Bonds, 10/17/26 | | | ARS | | | | 135,000,000 | | | | 6,632,236 | |
| 16.00% Bonds, 10/17/23 | | | ARS | | | | 118,258,140 | | | | 5,731,560 | |
| 18.20% Unsec. Nts., 10/3/21 | | | ARS | | | | 212,805,000 | | | | 10,627,930 | |
| 21.20% Bonds, 9/19/18 | | | ARS | | | | 500,000,000 | | | | 24,552,754 | |
13 OPPENHEIMER INTERNATIONAL BOND FUND
CONSOLIDATED STATEMENT OF INVESTMENTS Unaudited / Continued
| | | | | | | | | | | | |
| | | | | | Principal Amount | | | Value | |
| Argentina (Continued) | | | | | | | | | | | | |
| Argentine Republic: (Continued) | | | | | | | | | | | | |
| 26.164% [BADLARPP+325] Sr. Unsec. Nts., 3/1/201 | | | ARS | | | | 180,336,000 | | | $ | 9,334,513 | |
| | | | | | | | | | | | |
| | | | | | | | | | | 130,523,217 | |
| Australia—1.8% | | | | | | | | | | | | |
| Commonwealth of Australia: | | | | | | | | | | | | |
| Series 150, 3.00% Sr. Unsec. Nts., 3/21/47 | | | AUD | | | | 12,500,000 | | | | 9,269,921 | |
| Series 35CI, 2.00% Sr. Unsec. Nts., 8/21/353 | | | AUD | | | | 11,300,000 | | | | 11,152,339 | |
| New South Wales Treasury Corp., Series 27, 3.00% Sr. Unsec. Nts., 5/20/27 | | | AUD | | | | 25,000,000 | | | | 19,281,338 | |
| Queensland Treasury Corp.: | | | | | | | | | | | | |
| 3.50% Sr. Unsec. Bonds, 8/21/302 | | | AUD | | | | 20,000,000 | | | | 15,649,802 | |
| Series 33, 6.50% Sr. Unsec. Bonds, 3/14/33 | | | AUD | | | | 20,590,000 | | | | 21,654,868 | |
| Treasury Corp. of Victoria, 3.00%, 10/20/28 | | | AUD | | | | 40,000,000 | | | | 30,654,533 | |
| | | | | | | | | | | | |
| | | | | | | | | | | 107,662,801 | |
| Bahamas—0.0% | | | | | | | | | | | | |
Commonwealth of the Bahamas, 6.00% Sr. Unsec. Nts., 11/21/282 | | | | | | | 2,980,000 | | | | 3,106,650 | |
| Belarus—0.1% | | | | | | | | | | | | |
Republic of Belarus, 6.875% Sr. Unsec. Nts., 2/28/232 | | | | | | | 3,180,000 | | | | 3,376,549 | |
| Brazil—3.9% | | | | | | | | | | | | |
| Federative Republic of Brazil: | | | | | | | | | | | | |
| 5.625% Sr. Unsec. Nts., 2/21/47 | | | | | | | 9,755,000 | | | | 9,481,860 | |
| 6.00% Unsec. Nts., 8/15/223 | | | BRL | | | | 30,170,000 | | | | 30,091,804 | |
| 6.00% Unsec. Nts., 5/15/453 | | | BRL | | | | 40,400,000 | | | | 41,820,282 | |
| 10.00% Unsec. Nts., 1/1/21 | | | BRL | | | | 400,000,000 | | | | 127,117,630 | |
| 10.00% Unsec. Nts., 1/1/25 | | | BRL | | | | 70,000,000 | | | | 21,946,626 | |
| | | | | | | | | | | | |
| | | | | | | | | | | 230,458,202 | |
| Chile—0.5% | | | | | | | | | | | | |
| Republic of Chile: | | | | | | | | | | | | |
| 4.50% Unsec. Nts., 2/28/21 | | | CLP | | | | 15,335,000,000 | | | | 26,041,237 | |
| 4.50% Bonds, 3/1/21 | | | CLP | | | | 700,000,000 | | | | 1,188,645 | |
| | | | | | | | | | | | |
| | | | | | | | | | | 27,229,882 | |
| Colombia—0.7% | | | | | | | | | | | | |
| Republic of Colombia: | | | | | | | | | | | | |
| 4.00% Sr. Unsec. Nts., 2/26/24 | | | | | | | 2,980,000 | | | | 3,007,565 | |
| 6.125% Sr. Unsec. Nts., 1/18/41 | | | | | | | 11,050,000 | | | | 12,762,750 | |
| Series B, 7.00% Sr. Unsec. Nts., 9/11/19 | | | COP | | | | 75,000,000,000 | | | | 27,721,756 | |
| | | | | | | | | | | | |
| | | | | | | | | | | 43,492,071 | |
| Croatia—0.2% | | | | | | | | | | | | |
| Republic of Croatia, 3.875% Sr. Unsec. Nts., 5/30/22 | | | EUR | | | | 8,565,000 | | | | 11,723,218 | |
14 OPPENHEIMER INTERNATIONAL BOND FUND
| | | | | | | | | | | | |
| | | | | | Principal Amount | | | Value | |
| Cyprus—0.6% | | | | | | | | | | | | |
| Republic of Cyprus: | | | | | | | | | | | | |
| 2.75% Unsec. Nts., 6/27/24 | | | EUR | | | | 10,000,000 | | | $ | 13,195,013 | |
| 3.875% Unsec. Nts., 5/6/22 | | | EUR | | | | 18,000,000 | | | | 24,875,395 | |
| | | | | | | | | | | | |
| | | | | | | | | | | 38,070,408 | |
| Dominican Republic—0.3% | | | | | | | | | | | | |
| Dominican Republic: | | | | | | | | | | | | |
| 5.95% Sr. Unsec. Nts., 1/25/272 | | | | | | | 11,985,000 | | | | 12,554,288 | |
| 6.85% Sr. Unsec. Nts., 1/27/452 | | | | | | | 6,370,000 | | | | 6,887,562 | |
| | | | | | | | | | | | |
| | | | | | | | | | | 19,441,850 | |
| Ecuador—0.4% | | | | | | | | | | | | |
| Republic of Ecuador: | | | | | | | | | | | | |
| 7.875% Sr. Unsec. Nts., 1/23/282 | | | | | | | 8,770,000 | | | | 8,475,766 | |
| 8.875% Sr. Unsec. Nts., 10/23/272 | | | | | | | 14,560,000 | | | | 14,872,312 | |
| | | | | | | | | | | | |
| | | | | | | | | | | 23,348,078 | |
| Egypt—0.5% | | | | | | | | | | | | |
| Arab Republic of Egypt: | | | | | | | | | | | | |
| 6.125% Sr. Unsec. Nts., 1/31/222 | | | | | | | 6,530,000 | | | | 6,769,089 | |
| 6.588% Sr. Unsec. Nts., 2/21/282 | | | | | | | 6,345,000 | | | | 6,454,864 | |
| 8.50% Sr. Unsec. Nts., 1/31/472 | | | | | | | 9,480,000 | | | | 10,592,194 | |
| 15.00% Bonds, 10/3/20 | | | EGP | | | | 152,900,000 | | | | 8,613,031 | |
| | | | | | | | | | | | |
| | | | | | | | | | | 32,429,178 | |
| Gabon—0.2% | | | | | | | | | | | | |
Gabonese Republic, 6.375% Bonds, 12/12/242 | | | | | | | 11,370,000 | | | | 11,316,834 | |
| Greece—2.4% | | | | | | | | | | | | |
| Hellenic Republic: | | | | | | | | | | | | |
| 3.375% Sr. Unsec. Nts., 2/15/252 | | | EUR | | | | 55,000,000 | | | | 65,713,670 | |
| 3.90% Bonds, 1/30/33 | | | EUR | | | | 37,500,000 | | | | 42,594,395 | |
| 4.375% Sr. Unsec. Nts., 8/1/222 | | | EUR | | | | 25,000,000 | | | | 32,174,206 | |
| | | | | | | | | | | | |
| | | | | | | | | | | 140,482,271 | |
| Honduras—0.1% | | | | | | | | | | | | |
| Republic of Honduras: | | | | | | | | | | | | |
| 6.25% Sr. Unsec. Nts., 1/19/272 | | | | | | | 3,160,000 | | | | 3,355,825 | |
| 8.75% Sr. Unsec. Nts., 12/16/202 | | | | | | | 2,850,000 | | | | 3,159,624 | |
| | | | | | | | | | | | |
| | | | | | | | | | | 6,515,449 | |
| Hungary—1.0% | | | | | | | | | | | | |
| Hungary: | | | | | | | | | | | | |
| 5.75% Sr. Unsec. Nts., 11/22/23 | | | | | | | 6,380,000 | | | | 7,059,789 | |
| Series 22/B, 1.75% Bonds, 10/26/22 | | | HUF | | | | 2,750,000,000 | | | | 11,111,105 | |
| Series 23/A, 6.00% Bonds, 11/24/23 | | | HUF | | | | 7,239,000,000 | | | | 35,527,329 | |
| Series 25/B, 5.50% Bonds, 6/24/25 | | | HUF | | | | 1,550,000,000 | | | | 7,563,760 | |
| | | | | | | | | | | | |
| | | | | | | | | | | 61,261,983 | |
15 OPPENHEIMER INTERNATIONAL BOND FUND
CONSOLIDATED STATEMENT OF INVESTMENTS Unaudited / Continued
| | | | | | | | | | | | |
| | | | | | Principal Amount | | | Value | |
| India—5.5% | | | | | | | | | | | | |
| Republic of India: | | | | | | | | | | | | |
| 6.79% Sr. Unsec. Nts., 5/15/27 | | | INR | | | | 1,500,000,000 | | | $ | 21,881,145 | |
| 7.68% Sr. Unsec. Nts., 12/15/23 | | | INR | | | | 1,300,000,000 | | | | 20,203,889 | |
| 8.15% Sr. Unsec. Nts., 11/24/26 | | | INR | | | | 500,000,000 | | | | 7,902,838 | |
| 8.20% Sr. Unsec. Nts., 9/24/25 | | | INR | | | | 3,375,000,000 | | | | 53,661,722 | |
| 8.27% Sr. Unsec. Nts., 6/9/20 | | | INR | | | | 5,023,000,000 | | | | 79,275,075 | |
| 8.28% Sr. Unsec. Nts., 9/21/27 | | | INR | | | | 1,000,000,000 | | | | 15,966,204 | |
| 8.40% Sr. Unsec. Nts., 7/28/24 | | | INR | | | | 3,997,000,000 | | | | 63,982,936 | |
| 8.60% Sr. Unsec. Nts., 6/2/28 | | | INR | | | | 2,150,000,000 | | | | 34,967,939 | |
| State of Gujarat, 7.52% Sr. Unsec. Nts., 5/24/27 | | | INR | | | | 500,000,000 | | | | 7,427,574 | |
| State of Maharastra, 7.99% Sr. Unsec. Nts., 10/28/25 | | | INR | | | | 500,000,000 | | | | 7,704,491 | |
| State of Tamil Nadu, 8.53% Sr. Unsec. Nts., 3/9/26 | | | INR | | | | 500,000,000 | | | | 8,026,286 | |
| | | | | | | | | | | | |
| | | | | | | | | | | 321,000,099 | |
| Indonesia—3.4% | | | | | | | | | | | | |
| Perusahaan Penerbit SBSN Indonesia III: | | | | | | | | | | | | |
| 4.35% Sr. Unsec. Nts., 9/10/242 | | | | | | | 3,560,000 | | | | 3,632,446 | |
| 4.55% Sr. Unsec. Nts., 3/29/262 | | | | | | | 5,680,000 | | | | 5,820,126 | |
| Republic of Indonesia: | | | | | | | | | | | | |
| 3.85% Sr. Unsec. Nts., 7/18/272 | | | | | | | 6,030,000 | | | | 5,919,627 | |
| 4.125% Sr. Unsec. Nts., 1/15/252 | | | | | | | 3,050,000 | | | | 3,080,024 | |
| Series FR53, 8.25% Sr. Unsec. Nts., 7/15/21 | | | IDR | | | | 450,000,000,000 | | | | 34,846,849 | |
| Series FR56, 8.375% Sr. Unsec. Nts., 9/15/26 | | | IDR | | | | 288,430,000,000 | | | | 23,186,189 | |
| Series FR61, 7.00% Sr. Unsec. Nts., 5/15/22 | | | IDR | | | | 594,691,000,000 | | | | 44,884,214 | |
| Series FR64, 6.125% Sr. Unsec. Nts., 5/15/28 | | | IDR | | | | 36,000,000,000 | | | | 2,523,836 | |
| Series FR71, 9.00% Sr. Unsec. Nts., 3/15/29 | | | IDR | | | | 359,350,000,000 | | | | 30,032,133 | |
| Series FR73, 8.75% Sr. Unsec. Nts., 5/15/31 | | | IDR | | | | 560,080,000,000 | | | | 46,030,908 | |
| | | | | | | | | | | | |
| | | | | | | | | | | 199,956,352 | |
| Iraq—0.2% | | | | | | | | | | | | |
| Republic of Iraq: | | | | | | | | | | | | |
| 5.80% Unsec. Nts., 1/15/282 | | | | | | | 3,695,000 | | | | 3,539,810 | |
| 6.752% Sr. Unsec. Nts., 3/9/232 | | | | | | | 6,035,000 | | | | 6,138,742 | |
| | | | | | | | | | | | |
| | | | | | | | | | | 9,678,552 | |
| Italy—0.9% | | | | | | | | | | | | |
| Republic of Italy: | | | | | | | | | | | | |
| 2.95% Bonds, 9/1/382 | | | EUR | | | | 14,500,000 | | | | 18,912,712 | |
| 3.45% Unsec. Nts., 3/1/482 | | | EUR | | | | 23,000,000 | | | | 31,796,603 | |
| | | | | | | | | | | | |
| | | | | | | | | | | 50,709,315 | |
| Ivory Coast—0.6% | | | | | | | | | | | | |
| Republic of Cote d’Ivoire: | | | | | | | | | | | | |
| 5.125% Sr. Unsec. Nts., 6/15/252 | | | EUR | | | | 6,485,000 | | | | 8,391,560 | |
| 5.25% Sr. Unsec. Nts., 3/22/302 | | | EUR | | | | 7,640,000 | | | | 9,444,031 | |
| 6.125% Sr. Unsec. Nts., 6/15/332 | | | | | | | 7,715,000 | | | | 7,377,299 | |
| 6.625% Sr. Unsec. Nts., 3/22/482 | | | EUR | | | | 6,367,000 | | | | 7,911,388 | |
| | | | | | | | | | | | |
| | | | | | | | | | | 33,124,278 | |
16 OPPENHEIMER INTERNATIONAL BOND FUND
| | | | | | | | | | | | |
| | | | | | Principal Amount | | | Value | |
| Jamaica—0.2% | | | | | | | | | | | | |
| Commonwealth of Jamaica: | | | | | | | | | | | | |
| 7.875% Sr. Unsec. Nts., 7/28/45 | | | | | | $ | 6,050,000 | | | $ | 7,220,675 | |
| 8.00% Sr. Unsec. Nts., 3/15/39 | | | | | | | 2,465,000 | | | | 2,954,919 | |
| | | | | | | | | | | | |
| | | | | | | | | | | 10,175,594 | |
| Kazakhstan—0.1% | | | | | | | | | | | | |
Republic of Kazakhstan, 4.875% Sr. Unsec. Nts., 10/14/442 | | | | | | | 6,015,000 | | | | 6,012,853 | |
| Malaysia—1.7% | | | | | | | | | | | | |
| Federation of Malaysia: | | | | | | | | | | | | |
| Series 0116, 3.80% Sr. Unsec. Nts., 8/17/23 | | | MYR | | | | 130,000,000 | | | | 33,598,110 | |
| Series 0511, 3.58% Sr. Unsec. Nts., 9/28/18 | | | MYR | | | | 200,000,000 | | | | 51,812,875 | |
| Series 0902, 4.378% Sr. Unsec. Nts., 11/29/19 | | | MYR | | | | 49,645,000 | | | | 13,056,789 | |
| | | | | | | | | | | | |
| | | | | | | | | | | 98,467,774 | |
| Mexico—7.7% | | | | | | | | | | | | |
| United Mexican States: | | | | | | | | | | | | |
| 3.75% Sr. Unsec. Nts., 1/11/28 | | | | | | | 6,395,000 | | | | 6,191,959 | |
| 4.00% Bonds, 6/13/193 | | | MXN | | | | 1,607,988,810 | | | | 88,005,988 | |
| Series M, 5.00% Sr. Unsec. Nts., 12/11/19 | | | MXN | | | | 1,320,000,000 | | | | 69,966,535 | |
| Series M, 6.50% Bonds, 6/10/21 | | | MXN | | | | 400,000,000 | | | | 21,570,517 | |
| Series M, 8.00% Bonds, 11/7/47 | | | MXN | | | | 466,000,000 | | | | 26,774,135 | |
| Series M10, 8.50% Bonds, 12/13/18 | | | MXN | | | | 2,890,000,000 | | | | 159,900,616 | |
| Series M20, 8.50% Sr. Unsec. Nts., 5/31/29 | | | MXN | | | | 240,000,000 | | | | 14,331,353 | |
| Series M20, 10.00% Bonds, 12/5/24 | | | MXN | | | | 698,700,000 | | | | 44,127,248 | |
| Series M30, 10.00% Bonds, 11/20/36 | | | MXN | | | | 290,000,000 | | | | 19,823,047 | |
| | | | | | | | | | | | |
| | | | | | | | | | | 450,691,398 | |
| Mongolia—0.2% | | | | | | | | | | | | |
| Mongolia: | | | | | | | | | | | | |
| 5.625% Sr. Unsec. Nts., 5/1/232 | | | | | | | 4,450,000 | | | | 4,401,602 | |
| 8.75% Sr. Unsec. Nts., 3/9/242 | | | | | | | 6,325,000 | | | | 7,119,439 | |
| | | | | | | | | | | | |
| | | | | | | | | | | 11,521,041 | |
| New Zealand—0.4% | | | | | | | | | | | | |
New Zealand, 3.00% Sr. Unsec. Nts., 4/20/29 | | | NZD | | | | 30,000,000 | | | | 21,852,603 | |
| Nigeria—0.3% | | | | | | | | | | | | |
| Federal Republic of Nigeria: | | | | | | | | | | | | |
| 7.143% Sr. Unsec. Nts., 2/23/302 | | | | | | | 4,425,000 | | | | 4,604,213 | |
| 7.696% Sr. Unsec. Nts., 2/23/382 | | | | | | | 10,770,000 | | | | 11,359,442 | |
| | | | | | | | | | | | |
| | | | | | | | | | | 15,963,655 | |
| Peru—0.9% | | | | | | | | | | | | |
| Republic of Peru: | | | | | | | | | | | | |
| 6.35% Sr. Unsec. Nts., 8/12/282 | | | PEN | | | | 112,140,000 | | | | 39,061,727 | |
| 8.20% Sr. Unsec. Nts., 8/12/262 | | | PEN | | | | 29,000,000 | | | | 11,220,084 | |
| | | | | | | | | | | | |
| | | | | | | | | | | 50,281,811 | |
17 OPPENHEIMER INTERNATIONAL BOND FUND
CONSOLIDATED STATEMENT OF INVESTMENTS Unaudited / Continued
| | | | | | | | | | | | |
| | | | | | Principal Amount | | | Value | |
| Poland—0.4% | | | | | | | | | | | | |
Republic of Poland, Series 0726, 2.50% Bonds, 7/25/26 | | | PLN | | | | 90,900,000 | | | $ | 25,600,068 | |
| Portugal—1.7% | | | | | | | | | | | | |
Portuguese Republic, 4.10% Sr. Unsec. Nts., 2/15/452 | | | EUR | | | | 61,700,000 | | | | 98,281,850 | |
| Romania—0.2% | | | | | | | | | | | | |
| Romania: | | | | | | | | | | | | |
| 2.375% Sr. Unsec. Nts., 4/19/272 | | | EUR | | | | 5,980,000 | | | | 7,532,441 | |
| 3.875% Sr. Unsec. Nts., 10/29/352 | | | EUR | | | | 2,050,000 | | | | 2,725,306 | |
| | | | | | | | | | | | |
| | | | | | | | | | | 10,257,747 | |
| Russia—3.6% | | | | | | | | | | | | |
| Russian Federation: | | | | | | | | | | | | |
| Series 6209, 7.60% Bonds, 7/20/22 | | | RUB | | | | 1,000,000,000 | | | | 18,239,756 | |
| Series 6211, 7.00% Bonds, 1/25/23 | | | RUB | | | | 4,280,000,000 | | | | 76,653,371 | |
| Series 6216, 6.70% Bonds, 5/15/19 | | | RUB | | | | 6,543,000,000 | | | | 114,932,942 | |
| | | | | | | | | | | | |
| | | | | | | | | | | 209,826,069 | |
| Senegal—0.2% | | | | | | | | | | | | |
| Republic of Senegal: | | | | | | | | | | | | |
| 6.25% Sr. Unsec. Nts., 7/30/242 | | | | | | | 3,580,000 | | | | 3,738,451 | |
| 6.25% Unsec. Nts., 5/23/332 | | | | | | | 3,170,000 | | | | 3,131,960 | |
| 6.75% Sr. Unsec. Nts., 3/13/482 | | | | | | | 5,690,000 | | | | 5,588,718 | |
| | | | | | | | | | | | |
| | | | | | | | | | | 12,459,129 | |
| Serbia—0.2% | | | | | | | | | | | | |
Republic of Serbia, 5.875% Unsec. Nts., 12/3/182 | | | | | | | 12,245,000 | | | | 12,484,757 | |
| South Africa—3.6% | | | | | | | | | | | | |
| Republic of South Africa: | | | | | | | | | | | | |
| Series 2023, 7.75% Bonds, 2/28/23 | | | ZAR | | | | 311,100,000 | | | | 26,655,413 | |
| Series 2037, 8.50% Bonds, 1/31/37 | | | ZAR | | | | 181,800,000 | | | | 14,968,434 | |
| Series 2048, 8.75% Bonds, 2/28/48 | | | ZAR | | | | 452,000,000 | | | | 37,769,160 | |
| Series R186, 10.50% Bonds, 12/21/26 | | | ZAR | | | | 734,700,000 | | | | 71,797,264 | |
| Series R208, 6.75% Sr. Unsec. Nts., 3/31/21 | | | ZAR | | | | 514,540,000 | | | | 43,152,038 | |
| Series R214, 6.50% Bonds, 2/28/41 | | | ZAR | | | | 255,000,000 | | | | 16,616,986 | |
| | | | | | | | | | | | |
| | | | | | | | | | | 210,959,295 | |
| Spain—1.4% | | | | | | | | | | | | |
| Kingdom of Spain: | | | | | | | | | | | | |
| 0.40% Bonds, 4/30/22 | | | EUR | | | | 35,000,000 | | | | 43,857,255 | |
| 2.70% Sr. Unsec. Nts., 10/31/482 | | | EUR | | | | 29,900,000 | | | | 40,495,327 | |
| | | | | | | | | | | | |
| | | | | | | | | | | 84,352,582 | |
| Sri Lanka—0.4% | | | | | | | | | | | | |
| Democratic Socialist Republic of Sri Lanka: | | | | | | | | | | | | |
| 5.875% Sr. Unsec. Nts., 7/25/222 | | | | | | | 8,995,000 | | | | 9,140,548 | |
| 6.00% Sr. Unsec. Nts., 1/14/192 | | | | | | | 9,430,000 | | | | 9,612,876 | |
18 OPPENHEIMER INTERNATIONAL BOND FUND
| | | | | | | | | | | | |
| | | | | | Principal Amount | | | Value | |
| Sri Lanka (Continued) | | | | | | | | | | | | |
| Democratic Socialist Republic of Sri Lanka: (Continued) | | | | | | | | | | | | |
| 6.25% Sr. Unsec. Nts., 10/4/202 | | | | | | $ | 2,955,000 | | | $ | 3,070,948 | |
| | | | | | | | | | | | |
| | | | | | | | | | | 21,824,372 | |
| Thailand—0.6% | | | | | | | | | | | | |
| Kingdom of Thailand, 1.875% Sr. Unsec. Nts., 6/17/22 | | | THB | | | | 1,120,000,000 | | | | 36,086,027 | |
| | | | | | | | | | | | |
| Turkey—0.6% | | | | | | | | | | | | |
| Republic of Turkey: | | | | | | | | | | | | |
| 8.50% Bonds, 7/10/19 | | | TRY | | | | 45,000,000 | | | | 10,735,876 | |
| 8.80% Bonds, 11/14/18 | | | TRY | | | | 73,165,000 | | | | 18,053,412 | |
| 11.00% Bonds, 2/24/27 | | | TRY | | | | 30,000,000 | | | | 7,018,478 | |
| | | | | | | | | | | | |
| | | | | | | | | | | 35,807,766 | |
| Ukraine—1.3% | | | | | | | | | | | | |
| Ukraine: | | | | | | | | | | | | |
| 7.75% Sr. Unsec. Nts., 9/1/20 | | | | | | | 5,905,000 | | | | 6,191,918 | |
| 7.75% Sr. Unsec. Nts., 9/1/23 | | | | | | | 13,840,000 | | | | 14,345,935 | |
| 7.75% Sr. Unsec. Nts., 9/1/24 | | | | | | | 8,880,000 | | | | 9,164,267 | |
| 7.75% Sr. Unsec. Nts., 9/1/25 | | | | | | | 5,900,000 | | | | 6,055,170 | |
| 7.75% Sr. Unsec. Nts., 9/1/26 | | | | | | | 19,825,000 | | | | 20,340,450 | |
| 7.75% Sr. Unsec. Nts., 9/1/27 | | | | | | | 17,095,000 | | | | 17,514,682 | |
| | | | | | | | | | | | |
| | | | | | | | | | | 73,612,422 | |
| United Kingdom—4.8% | | | | | | | | | | | | |
| United Kingdom: | | | | | | | | | | | | |
| 2.75% Bonds, 9/7/24 | | | GBP | | | | 97,000,000 | | | | 149,679,275 | |
| 3.25% Bonds, 1/22/44 | | | GBP | | | | 71,340,000 | | | | 131,623,178 | |
| | | | | | | | | | | | |
| | | | | | | | | | | 281,302,453 | |
| Uruguay—0.4% | | | | | | | | | | | | |
| Oriental Republic of Uruguay: | | | | | | | | | | | | |
| 5.10% Sr. Unsec. Nts., 6/18/50 | | | | | | | 17,730,000 | | | | 18,217,575 | |
| 9.875% Sr. Unsec. Nts., 6/20/222 | | | UYU | | | | 176,475,000 | | | | 6,341,300 | |
| | | | | | | | | | | | |
| | | | | | | | | | | 24,558,875 | |
| | | | | | | | | | | | |
Total Foreign Government Obligations (Cost $3,243,659,384) | | | | | | | | | | | 3,307,287,378 | |
| Corporate Bonds and Notes—26.3% | | | | | | | | | | | | |
| Consumer Discretionary—1.1% | | | | | | | | | | | | |
| Auto Components—0.2% | | | | | | | | | | | | |
| GKN Holdings plc: | | | | | | | | | | | | |
| 5.375% Sr. Unsec. Nts., 9/19/22 | | | GBP | | | | 2,490,000 | | | | 3,860,864 | |
| 6.75% Sr. Unsec. Nts., 10/28/19 | | | GBP | | | | 4,475,000 | | | | 6,752,948 | |
| | | | | | | | | | | | |
| | | | | | | | | | | 10,613,812 | |
| Automobiles—0.1% | | | | | | | | | | | | |
| Aston Martin Capital Holdings Ltd., 6.50% Sr. Sec. Nts., | | | | | | | | | | | | |
| 4/15/222 | | | | | | | 3,500,000 | | | | 3,653,125 | |
19 OPPENHEIMER INTERNATIONAL BOND FUND
CONSOLIDATED STATEMENT OF INVESTMENTS Unaudited / Continued
| | | | | | | | | | | | |
| | | | | | Principal Amount | | | Value | |
| Automobiles (Continued) | | | | | | | | | | | | |
| Jaguar Land Rover Automotive plc, 4.50% Sr. Unsec. Nts., 10/1/272 | | | | | | $ | 1,900,000 | | | $ | 1,797,875 | |
| �� | | | | | | | | | | | |
| | | | | | | | | | | 5,451,000 | |
| | | | | | | | | | | | |
| Hotels, Restaurants & Leisure—0.1% | | | | | | | | | | | | |
| Melco Resorts Finance Ltd., 4.875% Sr. Unsec. Nts., 6/6/252 | | | | | | | 8,220,000 | | | | 7,880,273 | |
| | | | | | | | | | | | |
| Leisure Equipment & Products—0.1% | | | | | | | | | | | | |
| Proven Honour Capital Ltd., 4.125% Sr. Unsec. Nts., 5/6/26 | | | | | | | 5,505,000 | | | | 5,351,945 | |
| | | | | | | | | | | | |
| Media—0.4% | | | | | | | | | | | | |
| Altice Luxembourg SA, 6.25% Sr. Unsec. Nts., 2/15/25 | | | EUR | | | | 5,475,000 | | | | 6,267,138 | |
| Telenet Finance VI Luxembourg SCA, 4.875% Sr. Sec. Nts., 7/15/272 | | | EUR | | | | 4,500,000 | | | | 5,997,589 | |
| Vrio Finco 1 LLC/Vrio Finco 2, Inc., 6.25% Sr. Sec. Nts., 4/4/232,4 | | | | | | | 3,085,000 | | | | 3,141,718 | |
| Ziggo Secured Finance BV, 4.25% Sr. Sec. Nts., 1/15/272 | | | EUR | | | | 8,000,000 | | | | 9,981,577 | |
| | | | | | | | | | | | |
| | | | | | | | | | | 25,388,022 | |
| | | | | | | | | | | | |
| Specialty Retail—0.2% | | | | | | | | | | | | |
| Dufry One BV, 2.50% Sr. Unsec. Nts., 10/15/24 | | | EUR | | | | 8,000,000 | | | | 9,934,387 | |
| | | | | | | | | | | | | |
| Consumer Staples—0.3% | | | | | | | | | | | | |
| Beverages—0.0% | | | | | | | | | | | | |
| Coca-Cola Icecek AS, 4.215% Sr. Unsec. Nts., 9/19/242 | | | | | | | 3,010,000 | | | | 2,931,933 | |
| | | | | | | | | | | | |
| Food Products—0.3% | | | | | | | | | | | | |
| Adecoagro SA, 6.00% Sr. Unsec. Nts., 9/21/272 | | | | | | | 3,516,000 | | | | 3,313,830 | |
| MHP Lux SA, 6.95% Sr. Unsec. Nts., 4/3/262,4 | | | | | | | 3,370,000 | | | | 3,369,326 | |
| Minerva Luxembourg SA, 5.875% Sr. Unsec. Nts., 1/19/282 | | | | | | | 2,525,000 | | | | 2,311,031 | |
| Sigma Finance Netherlands BV, 4.875% Sr. Unsec. Nts., 3/27/282 | | | | | | | 6,405,000 | | | | 6,421,013 | |
| | | | | | | | | | | | |
| | | | | | | | | | | 15,415,200 | |
| | | | | | | | | | | | |
| Energy—3.7% | | | | | | | | | | | | |
| Energy Equipment & Services—0.5% | | | | | | | | | | | | |
| Eterna Capital Pte Ltd.: | | | | | | | | | | | | |
| 7.50% Sr. Sec. Nts., 12/11/225 | | | | | | | 6,350,000 | | | | 6,889,750 | |
| 8.00% Sr. Sec. Nts., 12/11/225 | | | | | | | 6,320,000 | | | | 6,372,355 | |
| Pertamina Persero PT, 5.625% Sr. Unsec. Nts., 5/20/432 | | | | | | | 15,894,000 | | | | 16,335,837 | |
| Societe Generale SA, 8.875% [BP0003M+340] Jr. Sub. Perpetual Bonds1,6 | | | GBP | | | | 2,000,000 | | | | 2,841,078 | |
| | | | | | | | | | | | |
| | | | | | | | | | | 32,439,020 | |
| | | | | | | | | | | | |
| Oil, Gas & Consumable Fuels—3.2% | | | | | | | | | | | | |
| Bharat Petroleum Corp. Ltd., 4.00% Sr. Unsec. Nts., 5/8/25 | | | | | | | 3,320,000 | | | | 3,270,047 | |
| China Cinda Finance 2017 I Ltd.: | | | | | | | | | | | | |
| 4.75% Sr. Unsec. Nts., 2/8/287 | | | | | | | 3,000,000 | | | | 2,986,440 | |
| 5.00% Sr. Unsec. Nts., 2/8/487 | | | | | | | 4,000,000 | | | | 3,947,500 | |
20 OPPENHEIMER INTERNATIONAL BOND FUND
| | | | | | | | | | | | |
| | | | | | Principal Amount | | | Value | |
| Oil, Gas & Consumable Fuels (Continued) | | | | | | | | | | | | |
| Gazprom OAO Via Gaz Capital SA, 4.95% Sr. Unsec. Nts., 7/19/222 | | | | | | $ | 7,185,000 | | | $ | 7,346,662 | |
| Geopark Ltd., 6.50% Sr. Sec. Nts., 9/21/242 | | | | | | | 2,740,000 | | | | 2,757,125 | |
| Gran Tierra Energy International Holdings Ltd., 6.25% Sr. Unsec. Nts., 2/15/252 | | | | | | | 6,850,000 | | | | 6,713,000 | |
| Hidrovias International Finance Sarl, 5.95% Sr. Unsec. Nts., 1/24/252 | | | | | | | 4,005,000 | | | | 3,980,770 | |
| Indian Oil Corp. Ltd., 5.75% Sr. Unsec. Nts., 8/1/23 | | | | | | | 4,350,000 | | | | 4,719,050 | |
| KazMunayGas National Co. JSC: | | | | | | | | | | | | |
| 4.40% Sr. Unsec. Nts., 4/30/232 | | | | | | | 3,145,000 | | | | 3,154,514 | |
| 6.375% Sr. Unsec. Nts., 4/9/212 | | | | | | | 9,620,000 | | | | 10,369,475 | |
| 7.00% Sr. Unsec. Nts., 5/5/202 | | | | | | | 8,810,000 | | | | 9,468,548 | |
| Medco Platinum Road Pte Ltd., 6.75% Sr. Sec. Nts., 1/30/252 | | | | | | | 5,660,000 | | | | 5,418,510 | |
| Novatek OAO Via Novatek Finance DAC, 4.422% Sr. Unsec. Nts., 12/13/222 | | | | | | | 3,680,000 | | | | 3,717,168 | |
| Origin Energy Finance Ltd., 7.875% [EUSA5+500] Sub. Nts., 6/16/711 | | | EUR | | | | 2,555,000 | | | | 3,191,082 | |
| Petrobras Global Finance BV: | | | | | | | | | | | | |
| 4.375% Sr. Unsec. Nts., 5/20/23 | | | | | | | 15,345,000 | | | | 15,096,411 | |
| 5.299% Sr. Unsec. Nts., 1/27/252 | | | | | | | 9,755,000 | | | | 9,645,256 | |
| 5.999% Sr. Unsec. Nts., 1/27/282 | | | | | | | 8,388,000 | | | | 8,314,605 | |
| 6.125% Sr. Unsec. Nts., 1/17/22 | | | | | | | 5,050,000 | | | | 5,408,550 | |
| 6.75% Sr. Unsec. Nts., 1/27/41 | | | | | | | 2,229,000 | | | | 2,178,848 | |
| 7.375% Sr. Unsec. Nts., 1/17/27 | | | | | | | 2,940,000 | | | | 3,188,430 | |
| 8.375% Sr. Unsec. Nts., 5/23/21 | | | | | | | 1,161,000 | | | | 1,323,975 | |
| Petroleos Mexicanos: | | | | | | | | | | | | |
| 3.75% Sr. Unsec. Nts., 2/21/24 | | | EUR | | | | 2,975,000 | | | | 3,883,511 | |
| 3.75% Sr. Unsec. Nts., 4/16/26 | | | EUR | | | | 6,495,000 | | | | 8,213,361 | |
| 5.35% Sr. Unsec. Nts., 2/12/282 | | | | | | | 10,595,000 | | | | 10,436,075 | |
| 6.50% Sr. Unsec. Nts., 3/13/27 | | | | | | | 4,440,000 | | | | 4,747,470 | |
| 6.75% Sr. Unsec. Nts., 9/21/47 | | | | | | | 4,880,000 | | | | 4,950,174 | |
| Proven Glory Capital Ltd., 4.00% Sr. Unsec. Nts., 2/21/27 | | | | | | | 4,440,000 | | | | 4,250,492 | |
| Puma International Financing SA, 5.00% Sr. Unsec. Nts., 1/24/262 | | | | | | | 7,005,000 | | | | 6,720,534 | |
| Saka Energi Indonesia PT, 4.45% Sr. Unsec. Nts., 5/5/242 | | | | | | | 4,110,000 | | | | 4,039,098 | |
| SURA Asset Management SA, 4.375% Sr. Unsec. Nts., 4/11/272 | | | | | | | 3,050,000 | | | | 3,011,875 | |
| Topaz Marine SA, 9.125% Sr. Unsec. Nts., 7/26/222 | | | | | | | 4,415,000 | | | | 4,623,609 | |
| TOTAL SA, 3.875% [EUSA5+378.3] Jr. Sub. Perpetual Bonds1,6 EUR | | | | | | | 6,070,000 | | | | 8,198,723 | |
| YPF SA, 27.125% [BADLARPP+400] Sr. Unsec. Nts., 7/7/201,2 | | | | | | | 8,000,000 | | | | 6,480,000 | |
| | | | | | | | | | | | |
| | | | | | | | | | | 185,750,888 | |
| | | | | | | | | | | | |
| Financials—15.3% | | | | | | | | | | | | |
| Capital Markets—1.7% | | | | | | | | | | | | |
| Credit Suisse Group AG, 7.50% [USSW5+459.8] Jr. Sub. Perpetual Bonds1,6 | | | | | | | 27,000,000 | | | | 29,295,270 | |
| Criteria Caixa SAU, 1.50% Sr. Unsec. Nts., 5/10/23 | | | EUR | | | | 2,000,000 | | | | 2,488,868 | |
| Koks OAO Via Koks Finance DAC, 7.50% Sr. Unsec. Nts., 5/4/222 | | | | | | | 4,280,000 | | | | 4,441,925 | |
21 OPPENHEIMER INTERNATIONAL BOND FUND
CONSOLIDATED STATEMENT OF INVESTMENTS Unaudited / Continued
| | | | | | | | | | | | |
| | | | | | Principal Amount | | | Value | |
| Capital Markets (Continued) | | | | | | | | | | | | |
| Morgan Stanley, 7.50% Sr. Unsec. Nts., 4/2/328 | | | | | | $ | 25,000,000 | | | $ | 20,696,525 | |
| Seven & Seven Ltd., 3.259% [US0006M+100] Sr. Unsec. Nts., 9/11/191,2 | | | | | | | 1,500,000 | | | | 1,492,104 | |
| UBS AG (Stamford CT), 7.625% Sub. Nts., 8/17/22 | | | | | | | 10,000,000 | | | | 11,250,000 | |
| UBS Group AG: | | | | | | | | | | | | |
| 6.875% [USISDA05+549.65] Jr. Sub. Perpetual Bonds1,6 | | | | | | | 4,595,000 | | | | 4,827,434 | |
| 7.00% [USSW5+486.6] Jr. Sub. Perpetual Bonds1,6 | | | | | | | 8,000,000 | | | | 8,620,000 | |
| 7.125% [USSW5+588.3] Jr. Sub. Perpetual Bonds1,6 | | | | | | | 11,000,000 | | | | 11,611,292 | |
| 7.125% [USSW5+546.4] Jr. Sub. Perpetual Bonds1,6 | | | | | | | 5,000,000 | | | | 5,210,630 | |
| | | | | | | | | | | | |
| | | | | | | | | | | 99,934,048 | |
| Commercial Banks—10.3% | | | | | | | | | | | | |
| Adler Pelzer Holding GmbH, 4.125% Sr. Sec. Nts., 4/1/24 | | | EUR | | | | 1,300,000 | | | | 1,624,938 | |
| Allied Irish Banks plc, 4.125% [EUSA5+395] Sub. Nts., 11/26/251 | | | EUR | | | | 12,000,000 | | | | 15,846,065 | |
| Astana Finance JSC, 9.16% Sr. Unsec. Nts., 3/14/129,10 | | | | | | | 612,810 | | | | — | |
| Banca Monte dei Paschi di Siena SpA, 5.375% [EUSA5+500.5] Sub. Nts., 1/18/281 | | | EUR | | | | 10,000,000 | | | | 11,763,471 | |
| Banco Bilbao Vizcaya Argentaria SA: | | | | | | | | | | | | |
| 6.125% [USSW5+387] Jr. Sub. Perpetual Bonds1,6 | | | | | | | 15,000,000 | | | | 14,580,000 | |
| 6.75% [EUSA5+660.4] Jr. Sub. Perpetual Bonds1,6 | | | EUR | | | | 3,000,000 | | | | 4,003,313 | |
| 8.875% [EUSA5+917.7] Jr. Sub. Perpetual Bonds1,6 | | | EUR | | | | 22,800,000 | | | | 33,271,679 | |
| Banco do Brasil SA (Cayman), 3.875% Sr. Unsec. Nts., 10/10/22 | | | | | | | 19,915,000 | | | | 19,320,537 | |
| Banco Hipotecario SA, 23.708% [BADLARPP+250] Sr. Unsec. Nts., 1/12/201,2 | | | ARS | | | | 75,979,000 | | | | 3,700,424 | |
| Banco Mercantil del Norte SA (Grand Cayman): | | | | | | | | | | | | |
| 6.875% [H15T5Y+503.5] Jr. Sub. Perpetual Bonds1,2,6 | | | | | | | 2,535,000 | | | | 2,614,219 | |
| 7.625% [H15T10Y+535.3] Jr. Sub. Perpetual Bonds1,2,6 | | | | | | | 2,316,000 | | | | 2,475,225 | |
| Bank of Ireland, 10.00% Sub. Nts., 12/19/22 | | | EUR | | | | 9,500,000 | | | | 16,318,321 | |
| Bank of Scotland plc, 4.875% Sec. Nts., 12/20/24 | | | GBP | | | | 8,675,000 | | | | 14,574,620 | |
| Barclays Bank plc, 6.278% [US0003M+155] Jr. Sub. Perpetual Bonds1,6 | | | | | | | 4,000,000 | | | | 4,432,500 | |
| Barclays plc: | | | | | | | | | | | | |
| 6.50% [EUSA5+587.5] Jr. Sub. Perpetual Bonds1,6 | | | EUR | | | | 5,000,000 | | | | 6,548,842 | |
| 7.25% [BPSW5+646.2] Jr. Sub. Perpetual Bonds1,6 | | | GBP | | | | 10,000,000 | | | | 15,034,492 | |
| 7.875% [USSW5+677.2] Jr. Sub. Perpetual Bonds1,6 | | | | | | | 3,000,000 | | | | 3,194,100 | |
| 7.875% [BPSW5+609.9] Jr. Sub. Perpetual Bonds1,6 | | | GBP | | | | 5,000,000 | | | | 7,655,554 | |
| 8.00% [EUSA5+675] Jr. Sub. Perpetual Bonds1,6 | | | EUR | | | | 6,105,000 | | | | 8,568,047 | |
| BBVA Bancomer SA, 5.35% [H15T5Y+300] Sub. Nts., 11/12/291,2 | | | | | | | 3,145,000 | | | | 3,105,687 | |
| Belfius Bank SA/NV, 3.625% [EUSA5+293.8] Jr. Sub. Perpetual Bonds1,6,7 | | | EUR | | | | 3,000,000 | | | | 3,463,874 | |
| BNP Paribas SA, 7.625% [USSW5+631.4] Jr. Sub. Perpetual Bonds1,2,6 | | | | | | | 6,000,000 | | | | 6,457,500 | |
| BPCE SA, 4.50% Sub. Nts., 3/15/252 | | | | | | | 5,000,000 | | | | 5,025,459 | |
| Caixa Geral de Depositos SA, 10.75% [EUSA5+1092.5] Jr. Sub. Perpetual Bonds1,6 | | | EUR | | | | 7,000,000 | | | | 9,987,033 | |
22 OPPENHEIMER INTERNATIONAL BOND FUND
| | | | | | | | | | | | |
| | | | | | Principal Amount | | | Value | |
| Commercial Banks (Continued) | | | | | | | | | | | | |
| CaixaBank SA: | | | | | | | | | | | | |
| 2.75% [EUSA5+235] Sub. Nts., 7/14/281 | | | EUR | | | | 5,000,000 | | | $ | 6,456,725 | |
| 5.25% Jr. Sub. Perpetual Bonds6,7 | | | EUR | | | | 13,000,000 | | | | 16,005,847 | |
| 6.75% [EUSA5+649.8] Jr. Sub. Perpetual Bonds1,6 | | | EUR | | | | 10,000,000 | | | | 13,966,493 | |
| Compass Bank, 3.875% Sub. Nts., 4/10/25 | | | | | | | 5,000,000 | | | | 4,896,872 | |
| Cooperatieve Rabobank UA, 5.50% [EUSA5+525] Jr. Sub. Perpetual Bonds1,6 | | | EUR | | | | 5,090,000 | | | | 6,771,076 | |
| Credit Agricole SA: | | | | | | | | | | | | |
| 6.625% [USSW5+469.7] Jr. Sub. Perpetual Bonds1,6 | | | | | | | 4,000,000 | | | | 4,115,000 | |
| 8.125% [USSW5+618.5] Jr. Sub. Perpetual Bonds1,2,6 | | | | | | | 4,405,000 | | | | 5,029,999 | |
| Credit Suisse AG, 6.50% Sub. Nts., 8/8/23 | | | | | | | 9,710,000 | | | | 10,581,638 | |
| DNB Bank ASA, 6.50% [USSW5+508] Jr. Sub. Perpetual Bonds1,6 | | | | | | | 2,500,000 | | | | 2,606,550 | |
| Dresdner Funding Trust I, 8.151% Jr. Sub. Nts., 6/30/312 | | | | | | | 9,900,000 | | | | 12,596,512 | |
| Eurobank Ergasias SA, 2.75% Sec. Nts., 11/2/20 | | | EUR | | | | 16,500,000 | | | | 20,608,139 | |
| EUROFIMA, 6.25% Sr. Unsec. Nts., 12/28/18 | | | AUD | | | | 5,270,000 | | | | 4,167,761 | |
| Export-Import Bank of India: | | | | | | | | | | | | |
| 9.50% Sr. Unsec. Nts., 10/9/18 | | | INR | | | | 175,000,000 | | | | 2,704,495 | |
| 9.70% Sr. Unsec. Nts., 11/21/18 | | | INR | | | | 200,000,000 | | | | 3,096,537 | |
| Fidelity Bank plc, 10.50% Sr. Unsec. Nts., 10/16/222 | | | | | | | 3,780,000 | | | | 3,911,846 | |
| Global Bank Corp., 4.50% Sr. Unsec. Nts., 10/20/212 | | | | | | | 3,910,000 | | | | 3,947,536 | |
| Globo Comunicacao e Participacoes SA, 5.125% Sr. Sec. Nts., 3/31/272 | | | | | | | 3,600,000 | | | | 3,519,000 | |
| HSBC Bank Capital Funding Sterling 1 LP, 5.844% [BP0006M+176] Jr. Sub. Perpetual Bonds1,6 | | | GBP | | | | 3,100,000 | | | | 5,484,863 | |
| HSBC Holdings plc: | | | | | | | | | | | | |
| 6.25% [USISDA05+345.3] Jr. Sub. Perpetual Bonds1,6 | | | | | | | 10,000,000 | | | | 10,150,000 | |
| 6.375% [USISDA05+436.8] Jr. Sub. Perpetual Bonds1,6 | | | | | | | 10,000,000 | | | | 10,312,500 | |
| 6.875% [USISDA05+551.4] Jr. Sub. Perpetual Bonds1,6 | | | | | | | 5,000,000 | | | | 5,293,750 | |
| IDBI Bank Ltd. (DIFC Dubai), 5.00% Sr. Unsec. Nts., 9/25/19 | | | | | | | 2,530,000 | | | | 2,571,113 | |
| ING Groep NV, 6.875% [USSW5+512.4] Jr. Sub. Perpetual Bonds1,6 | | | | | | | 5,000,000 | | | | 5,246,940 | |
| Intesa Sanpaolo SpA: | | | | | | | | | | | | |
| 4.375% Sr. Unsec. Nts., 1/12/482 | | | | | | | 10,000,000 | | | | 9,315,498 | |
| 5.017% Sub. Nts., 6/26/242 | | | | | | | 4,000,000 | | | | 3,949,002 | |
| 5.71% Sub. Nts., 1/15/262 | | | | | | | 2,000,000 | | | | 2,009,162 | |
| 7.00% [EUSA5+688.4] Jr. Sub. Perpetual Bonds1,6 | | | EUR | | | | 10,000,000 | | | | 13,434,434 | |
| Intrum Justitia AB, 3.125% Sr. Unsec. Nts., 7/15/24 | | | EUR | | | | 7,655,000 | | | | 9,156,274 | |
| KBC Group NV, 5.625% [EUSA5+475.9] Jr. Sub. Perpetual Bonds1,6 | | | EUR | | | | 4,220,000 | | | | 5,388,365 | |
| Krung Thai Bank PCL (Cayman Islands), 5.20% [H15T5Y+353.5] Sub. Nts., 12/26/241 | | | | | | | 3,210,000 | | | | 3,281,211 | |
| Lloyds Bank plc, 13.00% [GUKG5+1340] Jr. Sub. Perpetual Bonds1,6 | | | GBP | | | | 5,000,000 | | | | 12,860,599 | |
| Lloyds Banking Group plc: | | | | | | | | | | | | |
| 6.375% [EUSA5+529] Jr. Sub. Perpetual Bonds1,6 | | | EUR | | | | 13,000,000 | | | | 17,305,910 | |
| 6.657% [US0003M+127] Jr. Sub. Perpetual Bonds1,6,11 | | | | | | | 10,000,000 | | | | 11,181,250 | |
| 6.657% [US0003M+127] Jr. Sub. Perpetual Bonds1,6 | | | | | | | 2,000,000 | | | | 2,236,250 | |
| NABARD, 8.19% Sr. Unsec. Nts., 6/8/18 | | | INR | | | | 80,000,000 | | | | 1,227,514 | |
23 OPPENHEIMER INTERNATIONAL BOND FUND
CONSOLIDATED STATEMENT OF INVESTMENTS Unaudited / Continued
| | | | | | | | | | | | |
| | | | | | Principal Amount | | | Value | |
| Commercial Banks (Continued) | | | | | | | | | | | | |
| NN Group NV, 4.625% [EUR003M+395] Sub. Nts., 4/8/441 | | | EUR | | | | 5,000,000 | | | $ | 6,902,086 | |
| Novo Banco SA (Luxembourg): | | | | | | | | | | | | |
| 3.50% Sr. Unsec. Nts., 1/23/43 | | | EUR | | | | 10,000,000 | | | | 10,461,113 | |
| 3.50% Sr. Unsec. Nts., 2/19/43 | | | EUR | | | | 1,700,000 | | | | 1,779,264 | |
| 3.50% Sr. Unsec. Nts., 3/18/43 | | | EUR | | | | 2,300,000 | | | | 2,406,523 | |
| Rabobank Capital Funding Trust IV, 5.556% [BP0006M+146] Jr. Sub. Perpetual Bonds1,2,6 | | | GBP | | | | 8,005,000 | | | | 11,780,604 | |
| Santander UK Group Holdings plc, 6.75% [BPSW5+579.2] Jr. Sub. Perpetual Bonds1,6 | | | GBP | | | | 3,000,000 | | | | 4,578,866 | |
| Sberbank of Russia Via SB Capital SA, 5.50% [H15T5Y+402.3] Sub. Nts., 2/26/241,2 | | | | | | | 9,290,000 | | | | 9,394,513 | |
| Societe Generale SA: | | | | | | | | | | | | |
| 4.25% Sub. Nts., 4/14/252 | | | | | | | 5,000,000 | | | | 4,932,480 | |
| 7.375% [USSW5+623.8] Jr. Sub. Perpetual Bonds1,2,6 | | | | | | | 5,000,000 | | | | 5,331,250 | |
| SPCM SA, 2.875% Sr. Unsec. Nts., 6/15/232 | | | EUR | | | | 4,100,000 | | | | 5,158,152 | |
| Standard Chartered Bank, 5.375% [BP0003M+189] Jr. Sub. Perpetual Bonds1,6 | | | GBP | | | | 4,000,000 | | | | 5,917,057 | |
| Standard Chartered plc: | | | | | | | | | | | | |
| 3.277% [US0003M+151] Jr. Sub. Perpetual Bonds1,6 | | | | | | | 1,200,000 | | | | 1,140,120 | |
| 4.30% Sub. Nts., 2/19/272 | | | | | | | 1,600,000 | | | | 1,568,910 | |
| 7.014% [US0003M+146] Jr. Sub. Perpetual Bonds1,2,6 | | | | | | | 5,460,000 | | | | 6,319,950 | |
| Turkiye Garanti Bankasi AS, 6.125% [USSW5+422] Sub. Nts., 5/24/271,2 | | | | | | | 1,770,000 | | | | 1,725,509 | |
| Turkiye Is Bankasi AS, 6.00% Sub. Nts., 10/24/222 | | | | | | | 3,165,000 | | | | 3,109,613 | |
| Turkiye Vakiflar Bankasi TAO, 5.625% Sr. Unsec. Nts., 5/30/222 | | | | | | | 5,695,000 | | | | 5,608,664 | |
| UBS Group Funding Switzerland AG, 5.00% [USSW5+243.2] Jr. Sub. Perpetual Bonds1,6 | | | | | | | 20,000,000 | | | | 18,749,440 | |
| UniCredit SpA: | | | | | | | | | | | | |
| 3.75% Sr. Unsec. Nts., 4/12/222 | | | | | | | 9,000,000 | | | | 8,940,170 | |
| 4.625% Sr. Unsec. Nts., 4/12/272 | | | | | | | 4,000,000 | | | | 4,045,775 | |
| Yapi ve Kredi Bankasi AS: | | | | | | | | | | | | |
| 5.85% Sr. Unsec. Nts., 6/21/242 | | | | | | | 4,505,000 | | | | 4,347,370 | |
| 6.10% Sr. Unsec. Nts., 3/16/232 | | | | | | | 6,050,000 | | | | 6,012,369 | |
| Zenith Bank plc, 7.375% Sr. Unsec. Nts., 5/30/222 | | | | | | | 3,930,000 | | | | 4,063,974 | |
| | | | | | | | | | | | |
| | | | | | | | | | | 603,226,333 | |
| | | | | | | | | | | | |
| Consumer Finance—0.3% | | | | | | | | | | | | |
| Drax Finco plc, 4.25% Sr. Sec. Nts., 5/1/222 | | | GBP | | | | 4,900,000 | | | | 6,912,366 | |
| Minejesa Capital BV, 4.625% Sr. Sec. Nts., 8/10/302 | | | | | | | 11,275,000 | | | | 10,886,475 | |
| | | | | | | | | | | | |
| | | | | | | | | | | 17,798,841 | |
| | | | | | | | | | | | |
| Diversified Financial Services—0.5% | | | | | | | | | | | | |
| Charming Light Investments Ltd., 4.375% Sr. Unsec. Nts., 12/21/277 | | | | | | | 18,430,000 | | | | 17,639,943 | |
| JPMorgan Hipotecaria su Casita, 6.47% Sec. Nts., 8/26/3510,11 | | | MXN | | | | 34,101,099 | | | | 179,134 | |
| National Savings Bank, 8.875% Sr. Unsec. Nts., 9/18/182 | | | | | | | 7,035,000 | | | | 7,164,796 | |
| Power Finance Corp. Ltd., 8.29% Sr. Unsec. Nts., 6/13/18 | | | INR | | | | 180,000,000 | | | | 2,764,302 | |
24 OPPENHEIMER INTERNATIONAL BOND FUND
| | | | | | | | | | | | |
| | | | | | Principal Amount | | | Value | |
| Diversified Financial Services (Continued) | | | | | | | | | | | | |
| Rural Electrification Corp. Ltd., 9.04% Sr. Unsec. Nts., 10/12/19 | | | INR | | | | 250,000,000 | | | $ | 3,921,961 | |
| | | | | | | | | | | | |
| | | | | | | | | | | 31,670,136 | |
| | | | | | | | | | | | |
| Insurance—2.1% | | | | | | | | | | | | |
| Aquarius & Investments plc for Swiss Reinsurance Co. Ltd., 6.375% [USSW5+521] Sub. Nts., 9/1/241 | | | | | | | 5,000,000 | | | | 5,150,190 | |
| Aviva plc: | | | | | | | | | | | | |
| 6.125% [EUSA5+513] Sub. Nts., 7/5/431 | | | EUR | | | | 5,000,000 | | | | 7,464,094 | |
| 6.125% [GUKG5+240] Jr. Sub. Perpetual Bonds1,6 | | | GBP | | | | 6,560,000 | | | | 10,151,309 | |
| AXA SA, 8.60% Sub. Nts., 12/15/30 | | | | | | | 5,000,000 | | | | 6,812,500 | |
| Cloverie plc per Swiss Re Corporate Solutions Ltd., 4.50% [USSW10+290.8] Sub. Nts., 9/11/441 | | | | | | | 14,000,000 | | | | 13,945,946 | |
| Credit Agricole Assurances SA: | | | | | | | | | | | | |
| 4.25% [EUSA5+450] Jr. Sub. Perpetual Bonds1,6 | | | EUR | | | | 10,000,000 | | | | 13,353,779 | |
| 4.75% [EUSA5+535] Sub. Nts., 9/27/481 | | | EUR | | | | 10,000,000 | | | | 14,140,208 | |
| Credivalores-Crediservicios SAS: | | | | | | | | | | | | |
| 9.75% Sr. Unsec. Nts., 7/27/222 | | | | | | | 790,000 | | | | 812,120 | |
| 9.75% Sr. Unsec. Nts., 7/27/227 | | | | | | | 4,535,000 | | | | 4,661,980 | |
| Mapfre SA, 4.375% [EUR003M+454.3] Sub. Nts., 3/31/471 | | | EUR | | | | 3,000,000 | | | | 4,083,969 | |
| NN Group NV, 4.375% [EUR003M+390] Jr. Sub. Perpetual Bonds1,6 | | | EUR | | | | 8,000,000 | | | | 10,633,510 | |
| Power Finance Corp. Ltd., 8.53% Sr. Unsec. Nts., 7/24/20 | | | INR | | | | 330,000,000 | | | | 5,159,270 | |
| UNIQA Insurance Group AG, 6.875% [EUR003M+598.6] Sub. Nts., 7/31/431 | | | EUR | | | | 9,300,000 | | | | 13,905,621 | |
| VIVAT NV: | | | | | | | | | | | | |
| 2.375% Sr. Unsec. Nts., 5/17/24 | | | EUR | | | | 3,000,000 | | | | 3,795,494 | |
| 6.25% [USSW5+417.4] Sub. Perpetual Bonds1,6 | | | | | | | 7,000,000 | | | | 6,965,420 | |
| | | | | | | | | | | | |
| | | | | | | | | | | 121,035,410 | |
| | | | | | | | | | | | |
| Real Estate Investment Trusts (REITs)—0.1% | | | | | | | | | | | | |
| Banco Invex SA/Hipotecaria Credito y Casa SA de CV, 6.45% Sec. Nts., 3/13/343,9,10 | | | MXN | | | | 27,602,566 | | | | — | |
| Trust F/1401, 5.25% Sr. Unsec. Nts., 1/30/262 | | | | | | | 6,805,000 | | | | 6,924,087 | |
| | | | | | | | | | | | |
| | | | | | | | | | | 6,924,087 | |
| | | | | | | | | | | | |
| Real Estate Management & Development—0.1% | | | | | | | | | | | | |
| Stedin Holding NV, 3.25% [EUSA5+275] Jr. Sub. Perpetual Bonds1,6 | | | EUR | | | | 3,000,000 | | | | 3,958,604 | |
| | | | | | | | | | | | |
| Thrifts & Mortgage Finance—0.2% | | | | | | | | | | | | |
| Housing Development Finance Corp. Ltd.: | | | | | | | | | | | | |
| 8.70% Sr. Sec. Nts., 4/26/18 | | | INR | | | | 250,000,000 | | | | 3,832,030 | |
| 8.75% Sr. Sec. Nts., 1/13/20 | | | INR | | | | 330,000,000 | | | | 5,123,604 | |
| 8.95% Sec. Nts., 10/19/20 | | | INR | | | | 125,000,000 | | | | 1,953,332 | |
| | | | | | | | | | | | |
| | | | | | | | | | | 10,908,966 | |
25 OPPENHEIMER INTERNATIONAL BOND FUND
CONSOLIDATED STATEMENT OF INVESTMENTS Unaudited / Continued
| | | | | | | | | | | | |
| | | | | | Principal Amount | | | Value | |
| Health Care—0.2% | | | | | | | | | | | | |
| Health Care Providers & Services—0.1% | | | | | | | | | | | | |
| OCP SA, 4.50% Sr. Unsec. Nts., 10/22/252 | | | | | | $ | 6,360,000 | | | $ | 6,280,659 | |
| | | | | | | | | | | | |
| Life Sciences Tools & Services—0.1% | | | | | | | | | | | | |
| Quintiles IMS, Inc.: | | | | | | | | | | | | |
| 3.25% Sr. Unsec. Nts., 3/15/252 | | | EUR | | | | 6,000,000 | | | | 7,431,810 | |
| 3.25% Sr. Unsec. Nts., 3/15/25 | | | EUR | | | | 1,000,000 | | | | 1,236,580 | |
| | | | | | | | | | | | |
| | | | | | | | | | | 8,668,390 | |
| | | | | | | | | | | | |
| Industrials—0.7% | | | | | | | | | | | | |
| Airlines—0.1% | | | | | | | | | | | | |
| Azul Investments LLP, 5.875% Sr. Unsec. Nts., 10/26/242 | | | | | | | 3,160,000 | | | | 3,120,500 | |
| | | | | | | | | | | | |
| Construction & Engineering—0.1% | | | | | | | | | | | | |
| Fideicomiso PA Concesion Ruta al Mar, 6.75% Sr. Sec. Nts., 2/15/442,3 | | | COP | | | | 8,000,000,000 | | | | 2,866,796 | |
| Fideicomiso PA Costera, 6.25% Sr. Sec. Nts., 1/15/342,3 | | | COP | | | | 5,916,031,565 | | | | 2,189,744 | |
| Fideicomiso PA Pacifico Tres, 8.25% Sr. Sec. Nts., 1/15/352 | | | | | | | 3,060,000 | | | | 3,470,040 | |
| | | | | | | | | | | | |
| | | | | | | | | | | 8,526,580 | |
| | | | | | | | | | | | |
| Industrial Conglomerates—0.0% | | | | | | | | | | | | |
| Tupras Turkiye Petrol Rafinerileri AS, 4.50% Sr. Unsec. Nts., 10/18/242 | | | | | | | 3,165,000 | | | | 3,026,500 | |
| | | | | | | | | | | | |
| Professional Services—0.1% | | | | | | | | | | | | |
| Arena Luxembourg Finance Sarl, 2.875% 1st Lien Nts., 11/1/242 | | | EUR | | | | 6,290,000 | | | | 7,914,831 | |
| | | | | | | | | | | | |
| Road & Rail—0.1% | | | | | | | | | | | | |
| EC Finance plc, 2.375% 1st Lien Nts., 11/15/222 | | | EUR | | | | 1,500,000 | | | | 1,854,617 | |
| Kazakhstan Temir Zholy National Co. JSC, 4.85% Sr. Unsec. Nts., 11/17/272 | | | | | | | 1,215,000 | | | | 1,214,265 | |
| Rumo Luxembourg Sarl, 5.875% Sr. Unsec. Nts., 1/18/252 | | | | | | | 3,875,000 | | | | 3,833,828 | |
| | | | | | | | | | | | |
| | | | | | | | | | | 6,902,710 | |
| | | | | | | | | | | | |
| Trading Companies & Distributors—0.1% | | | | | | | | | | | | |
| Postal Savings Bank of China Co. Ltd., 4.50% | | | | | | | | | | | | |
| [H15T5Y+263.4] Jr. Sub. Perpetual Bonds1,6 | | | | | | | 5,000,000 | | | | 4,730,000 | |
| | | | | | | | | | | | |
| Transportation Infrastructure—0.2% | | | | | | | | | | | | |
| Adani Abbot Point Terminal Pty Ltd., 4.45% Sr. Sec. Nts., 12/15/222 | | | | | | | 3,180,000 | | | | 2,999,691 | |
| GMR Hyderabad International Airport Ltd., 4.25% Sr. Sec. Nts., 10/27/272 | | | | | | | 6,495,000 | | | | 5,944,399 | |
| | | | | | | | | | | | |
| | | | | | | | | | | 8,944,090 | |
| | | | | | | | | | | | |
| Information Technology—0.4% | | | | | | | | | | | | |
| Communications Equipment—0.2% | | | | | | | | | | | | |
| HTA Group Ltd., 9.125% Sr. Unsec. Nts., 3/8/222 | | | | | | | 3,170,000 | | | | 3,365,906 | |
26 OPPENHEIMER INTERNATIONAL BOND FUND
| | | | | | | | | | | | |
| | | | | | Principal Amount | | | Value | |
| Communications Equipment (Continued) | | | | | | | | | | | | |
| Virgin Media Finance plc, 4.50% Sr. Unsec. Nts., 1/15/25 | | | EUR | | | | 6,950,000 | | | $ | 8,684,400 | |
| | | | | | | | | | | | |
| | | | | | | | | | | 12,050,306 | |
| | | | | | | | | | | | |
| Internet Software & Services—0.2% | | | | | | | | | | | | |
| Tencent Holdings Ltd.: | | | | | | | | | | | | |
| 3.595% Sr. Unsec. Nts., 1/19/282 | | | | | | | 5,000,000 | | | | 4,791,370 | |
| 3.925% Sr. Unsec. Nts., 1/19/382 | | | | | | | 5,000,000 | | | | 4,751,739 | |
| | | | | | | | | | | | |
| | | | | | | | | | | 9,543,109 | |
| | | | | | | | | | | | |
| Materials—2.3% | | | | | | | | | | | | |
| Chemicals—0.8% | | | | | | | | | | | | |
| Arkema SA, 4.75% [EUSA5+434.6] Jr. Sub. Perpetual Bonds1,6 | | | EUR | | | | 4,500,000 | | | | 6,038,087 | |
| Crown European Holdings SA: | | | | | | | | | | | | |
| 2.625% Sr. Unsec. Nts., 9/30/242 | | | EUR | | | | 2,000,000 | | | | 2,474,565 | |
| 3.375% Sr. Unsec. Nts., 5/15/252 | | | EUR | | | | 5,000,000 | | | | 6,362,952 | |
| Inkia Energy Ltd., 5.875% Sr. Unsec. Nts., 11/9/272 | | | | | | | 5,865,000 | | | | 5,711,044 | |
| ONGC Videsh Ltd., 2.75% Sr. Unsec. Nts., 7/15/21 | | | EUR | | | | 7,565,000 | | | | 9,889,261 | |
| Petkim Petrokimya Holding AS, 5.875% Sr. Unsec. Nts., 1/26/232 | | | | | | | 5,385,000 | | | | 5,287,182 | |
| Yingde Gases Investment Ltd., 6.25% Sr. Unsec. Nts., 1/19/232 | | | | | | | 10,265,000 | | | | 10,121,467 | |
| | | | | | | | | | | | |
| | | | | | | | | | | 45,884,558 | |
| | | | | | | | | | | | |
| Construction Materials—0.2% | | | | | | | | | | | | |
| CIMPOR Financial Operations BV, 5.75% Sr. Unsec. Nts., 7/17/242 | | | | | | | 6,325,000 | | | | 6,062,513 | |
| St. Marys Cement, Inc., 5.75% Sr. Unsec. Nts., 1/28/272 | | | | | | | 2,975,000 | | | | 3,075,406 | |
| | | | | | | | | | | | |
| | | | | | | | | | | 9,137,919 | |
| | | | | | | | | | | | |
| Containers & Packaging—0.4% | | | | | | | | | | | | |
| Ardagh Packaging Finance plc/Ardagh Holdings USA, Inc.: | | | | | | | | | | | | |
| 2.75% Sr. Sec. Nts., 3/15/24 | | | EUR | | | | 3,500,000 | | | | 4,365,726 | |
| 4.125% Sr. Sec. Nts., 5/15/23 | | | EUR | | | | 3,675,000 | | | | 4,737,209 | |
| Klabin Finance SA, 4.875% Sr. Unsec. Nts., 9/19/272 | | | | | | | 6,415,000 | | | | 6,182,456 | |
| Smurfit Kappa Acquisitions ULC, 4.875% Sr. Sec. Nts., 9/15/182 | | | | | | | 8,535,000 | | | | 8,560,605 | |
| | | | | | | | | | | | |
| | | | | | | | | | | 23,845,996 | |
| | | | | | | | | | | | |
| Metals & Mining—0.8% | | | | | | | | | | | | |
| ABJA Investment Co. Pte Ltd., 5.95% Sr. Unsec. Nts., 7/31/24 | | | | | | | 6,515,000 | | | | 6,625,429 | |
| Autodis SA, 4.375% Sr. Sec. Nts., 5/1/222 | | | EUR | | | | 1,000,000 | | | | 1,265,822 | |
| CSN Resources SA: | | | | | | | | | | | | |
| 6.50% Sr. Unsec. Nts., 7/21/202 | | | | | | | 739,000 | | | | 720,303 | |
| 7.625% Sr. Unsec. Nts., 2/13/232 | | | | | | | 5,215,000 | | | | 4,895,581 | |
| Glencore Funding LLC, 4.125% Sr. Unsec. Nts., 5/30/232 | | | | | | | 4,945,000 | | | | 4,982,982 | |
| JSW Steel Ltd., 4.75% Sr. Unsec. Nts., 11/12/19 | | | | | | | 6,330,000 | | | | 6,373,551 | |
| Metalloinvest Finance DAC, 5.625% Unsec. Nts., 4/17/202 | | | | | | | 1,425,000 | | | | 1,476,266 | |
| Metinvest BV, 9.373% Sr. Sec. Nts., 12/31/215 | | | | | | | 3,158,109 | | | | 3,320,183 | |
| Polyus Finance plc, 4.70% Sr. Unsec. Nts., 1/29/242 | | | | | | | 6,356,000 | | | | 6,276,531 | |
27 OPPENHEIMER INTERNATIONAL BOND FUND
CONSOLIDATED STATEMENT OF INVESTMENTS Unaudited / Continued
| | | | | | | | | | | | |
| | | | | | Principal Amount | | | Value | |
| Metals & Mining (Continued) | | | | | | | | | | | | |
| Southern Copper Corp., 7.50% Sr. Unsec. Nts., 7/27/35 | | | | | | $ | 6,105,000 | | | $ | 7,919,221 | |
| Vedanta Resources plc, 6.375% Sr. Unsec. Nts., 7/30/222 | | | | | | | 3,135,000 | | | | 3,200,835 | |
| | | | | | | | | | | | |
| | | | | | | | | | | 47,056,704 | |
| | | | | | | | | | | | |
| Paper & Forest Products—0.1% | | | | | | | | | | | | |
| Suzano Austria GmbH, 5.75% Sr. Unsec. Nts., 7/14/262 | | | | | | | 6,815,000 | | | | 7,173,469 | |
| | | | | | | | | | | | |
| Telecommunication Services—1.2% | | | | | | | | | | | | |
| Diversified Telecommunication Services—0.9% | | | | | | | | | | | | |
| Axtel SAB de CV, 6.375% Sr. Unsec. Nts., 11/14/242 | | | | | | | 4,545,000 | | | | 4,635,900 | |
| Koninklijke KPN NV, 8.375% Sr. Unsec. Nts., 10/1/30 | | | | | | | 7,493,000 | | | | 10,194,981 | |
| SoftBank Group Corp., 3.125% Sr. Unsec. Nts., 9/19/25 | | | EUR | | | | 3,500,000 | | | | 4,055,497 | |
| Telecom Italia Capital SA, 7.721% Sr. Unsec. Unsub. Nts., 6/4/38 | | | | | | | 13,147,000 | | | | 16,140,572 | |
| Telefonica Europe BV, 3.75% [EUSA5+385.8] Jr. Sub. Perpetual Bonds1,6 | | | EUR | | | | 13,300,000 | | | | 17,071,625 | |
| | | | | | | | | | | | |
| | | | | | | | | | | 52,098,575 | |
| | | | | | | | | | | | |
| Wireless Telecommunication Services—0.3% | | | | | | | | | | | | |
| C&W Senior Financing DAC, 6.875% Sr. Unsec. Nts., 9/15/272 | | | | | | | 3,820,000 | | | | 3,820,000 | |
| Digicel Group Ltd., 8.25% Sr. Unsec. Nts., 9/30/202 | | | | | | | 2,350,000 | | | | 2,032,750 | |
| VEON Holdings BV, 4.95% Sr. Unsec. Nts., 6/16/242 | | | | | | | 6,005,000 | | | | 5,926,154 | |
| Wind Tre SpA, 3.125% Sr. Sec. Nts., 1/20/25 | | | EUR | | | | 6,315,000 | | | | 6,863,507 | |
| | | | | | | | | | | | |
| | | | | | | | | | | 18,642,411 | |
| | | | | | | | | | | | |
| Utilities—1.1% | | | | | | | | | | | | |
| Electric Utilities—0.7% | | | | | | | | | | | | |
| Capex SA, 6.875% Sr. Unsec. Nts., 5/15/242 | | | | | | | 2,740,000 | | | | 2,763,975 | |
| Electricite de France SA, 5.375% [EUSA12+379.4] Jr. Sub. Perpetual Bonds1,6 | | | EUR | | | | 3,100,000 | | | | 4,185,414 | |
| EnBW Energie Baden-Wuerttemberg AG, 3.625% [EUSA5+233.8] Jr. Sub. Nts., 4/2/761 | | | EUR | | | | 4,870,000 | | | | 6,377,296 | |
| Enel SpA, 8.75% [USSW5+588] Jr. Sub. Nts., 9/24/731,2 | | | | | | | 5,000,000 | | | | 5,943,750 | |
| Eskom Holdings SOC Ltd., 6.75% Sr. Unsec. Nts., 8/6/232 | | | | | | | 21,935,000 | | | | 22,248,341 | |
| Power Grid Corp. of India Ltd., 8.70% Sec. Nts., 7/15/18 | | | INR | | | | 130,000,000 | | | | 2,001,246 | |
| | | | | | | | | | | | |
| | | | | | | | | | | 43,520,022 | |
| | | | | | | | | | | | |
| Independent Power and Renewable Electricity Producers—0.2% | | | | | | | | | | | | |
| AES Andres BV/Dominican Power Partners/Empresa Generadora de Electricidad Itabo SA, 7.95% Sr. Unsec. Nts., 5/11/262 | | | | | | | 3,325,000 | | | | 3,566,595 | |
| Azure Power Energy Ltd., 5.50% Sr. Sec. Nts., 11/3/222 | | | | | | | 2,620,000 | | | | 2,566,945 | |
| Reliance Jio Infocomm Ltd., 8.32% Sec. Nts., 7/8/21 | | | INR | | | | 335,000,000 | | | | 5,213,531 | |
| | | | | | | | | | | | |
| | | | | | | | | | | 11,347,071 | |
| | | | | | | | | | | | |
| Multi-Utilities—0.1% | | | | | | | | | | | | |
| KazTransGas JSC, 4.375% Sr. Unsec. Nts., 9/26/272 | | | | | | | 7,590,000 | | | | 7,307,493 | |
28 OPPENHEIMER INTERNATIONAL BOND FUND
| | | | | | | | | | | | |
| | | | | | Principal Amount | | | Value | |
Water Utilities—0.1% | | | | | | | | | | | | |
| Aegea Finance Sarl, 5.75% Sr. Unsec. Nts., 10/10/242 | | | | | | $ | 3,815,000 | | | $ | 3,795,925 | |
| | | | | | | | | | | | |
Total Corporate Bonds and Notes (Cost $1,512,424,933) | | | | | | | | | | | 1,546,130,723 | |
| | | |
| | | | | | Shares | | | | |
| Common Stock—0.0% | | | | | | | | | | | | |
JSC Astana Finance, GDR10,11,12 (Cost $0) | | | | | | | 868,851 | | | | — | |
| | | |
| | | | | | Principal Amount | | | | |
| Structured Securities—0.2% | | | | | | | | | | | | |
Deutsche Bank AG, Coriolanus Ltd. Sec. Credit Linked Bonds: | | | | | | | | | | | | |
3.003%, 4/30/252,13 | | | | | | $ | 2,477,803 | | | | 1,128,028 | |
3.054%, 4/30/252,13 | | | | | | | 3,157,102 | | | | 1,437,281 | |
3.098%, 4/30/252,8 | | | | | | | 2,725,652 | | | | 1,240,862 | |
3.131%, 4/30/252,13 | | | | | | | 2,436,389 | | | | 1,109,174 | |
3.179%, 4/30/252,13 | | | | | | | 3,033,503 | | | | 1,381,012 | |
3.231%, 4/30/252,13 | | | | | | | 3,462,282 | | | | 1,576,215 | |
3.265%, 4/30/252,13 | | | | | | | 2,765,958 | | | | 1,259,212 | |
3.346%, 4/30/252,13 | | | | | | | 2,599,883 | | | | 1,183,606 | |
LB Peru Trust II Certificates, Series 1998-A, 3.796%, 2/28/169,10 | | | | | | | 11,734 | | | | — | |
| Morgan Stanley, Russian Federation Total Return Linked Bonds, Series 007, Cl. VR, 5.00%, 8/22/34 | | | RUB | | | | 133,083,849 | | | | 1,042,214 | |
| | | | | | | | | | | | |
Total Structured Securities (Cost $23,279,794) | | | | | | | | | | | 11,357,604 | |
| Short-Term Notes—3.3% | | | | | | | | | | | | |
Arab Republic of Egypt Treasury Bills, 18.19%, 8/21/1813 | | | EGP | | | | 160,000,000 | | | | 8,498,505 | |
Argentine Republic Treasury Bills, 27.479%, 6/21/1813 | | | ARS | | | | 613,050,000 | | | | 28,916,210 | |
Egypt Treasury Bills, 16.166%, 10/9/1813 | | | EGP | | | | 77,300,000 | | | | 4,035,832 | |
United States Treasury Bills, 1.629%, 6/14/1813,14 | | | | | | | 150,000,000 | | | | 149,497,281 | |
| | | | | | | | | | | | |
Total Short-Term Notes (Cost $194,899,782) | | | | | | | | | | | 190,947,828 | |
| | | | | | | | | | | | | | | | | | | | | | | | | | | | |
| | | | | | | |
| | | Counter- | | | | | | Exercise | | | Expiration | | | Notional
Amount | | | Contracts | | | | |
| | | party | | | | | | Price | | | Date | | | (000’s) | | | (000’s) | | | | |
Over-the-Counter Options Purchased—0.2% | | | | | | | | | | | | | | | | | |
| | | | | | | | | | | | | | | | | | | | | | | BRL | | | | | |
| BRL Currency Call12 | | | GSCO-OT | | | | BRL | | | | 3.121 | | | | 4/26/18 | | | | BRL 468,150 | | | | 468,150 | | | | 53,837 | |
| | | | | | | | | | | | | | | | | | | | | | | CAD | | | | | |
| CAD Currency Call12 | | | TDB | | | | CAD | | | | 1.268 | | | | 6/11/18 | | | | CAD 190,200 | | | | 95,100 | | | | 546,540 | |
| | | | | | | | | | | | | | | | | | | | | | | CAD | | | | | |
| CAD Currency Call12 | | | TDB | | | | CAD | | | | 1.230 | | | | 4/17/18 | | | | CAD 123,000 | | | | 123,000 | | | | 14,391 | |
| | | | | | | | | | | | | | | | | | | | | | | EUR | | | | | |
| EUR Currency Put12 | | | JPM | | | | NOK | | | | 8.200 | | | | 11/27/19 | | | | EUR 5,000 | | | | 5,000 | | | | 308,636 | |
| | | | | | | | | | | | | | | | | | | | | | | EUR | | | | | |
| EUR Currency Put12 | | | GSCO-OT | | | | SEK | | | | 9.742 | | | | 5/17/18 | | | | EUR 100,200 | | | | 100,000 | | | | 11,171 | |
29 OPPENHEIMER INTERNATIONAL BOND FUND
CONSOLIDATED STATEMENT OF INVESTMENTS Unaudited / Continued
| | | | | | | | | | | | | | | | | | | | | | | | | | | | |
| | | | | | | |
| | | Counter- | | | | | | Exercise | | | Expiration | | | Notional
Amount | | | Contracts | | | | |
| | | party | | | | | | Price | | | Date | | | (000’s) | | | (000’s) | | | Value | |
Over-the-Counter Options Purchased (Continued) | | | | | | | | | | | | | | | | | |
| | | | | | | | | | | | | | | | | | | | | | | EUR | | | | | |
| EUR Currency Put12 | | | CITNA-B | | | | USD | | | | 1.200 | | | | 4/17/18 | | | | EUR 150,000 | | | | 150,000 | | | $ | 60,300 | |
| | | | | | | | | | | | | | | | | | | | | | | EUR | | | | | |
| EUR Currency Put12,17 | | | BOA | | | | JPY | | | | 120.000 | | | | 8/8/18 | | | | EUR 5,000 | | | | 5,000 | | | | 3,446 | |
| | | | | | | | | | | | | | | | | | | | | | | EUR | | | | | |
| EUR Currency Call12 | | | GSCO-OT | | | | HUF | | | | 307.400 | | | | 4/2/18 | | | | EUR 105,400 | | | | 100,000 | | | | — | |
| | | | | | | | | | | | | | | | | | | | | | | EUR | | | | | |
| EUR Currency Put12 | | | BOA | | | | NOK | | | | 8.200 | | | | 11/27/19 | | | | EUR 5,000 | | | | 5,000 | | | | 308,636 | |
| | | | | | | | | | | | | | | | | | | | | | | IDR | | | | | |
| IDR Currency Call12 | | | GSCO-OT | | | | IDR | | | | 13500.000 | | | | 2/1/19 | | |
| IDR
2,704,725,000 |
| | | 1,350,000,000 | | | | 1,350,000 | |
| | | | | | | | | | | | | | | | | | | | | | | IDR | | | | | |
| IDR Currency Call12 | | | GSCO-OT | | | | IDR | | | | 13700.000 | | | | 1/4/19 | | |
| IDR
1,712,500,000 |
| | | 1,712,500,000 | | | | 1,712,500 | |
| | | | | | | | | | | | | | | | | | | | | | | INR | | | | | |
| INR Currency Call12 | | | GSCO-OT | | | | INR | | | | 64.800 | | | | 7/3/18 | | | | INR 6,480,000 | | | | 3,240,000 | | | | 226,800 | |
| | | | | | | | | | | | | | | | | | | | | | | JPY | | | | | |
| JPY Currency Put12 | | | GSCO-OT | | | | JPY | | | | 108.610 | | | | 3/21/19 | | | | JPY 21,722,000 | | | | 10,861,000 | | | | 1,477,096 | |
| | | | | | | | | | | | | | | | | | | | | | | JPY | | | | | |
| JPY Currency Put12 | | | BOA | | | | JPY | | | | 108.500 | | | | 3/21/19 | | | | JPY 10,850,000 | | | | 10,850,000 | | | | 1,497,300 | |
| | | | | | | | | | | | | | | | | | | | | | | KRW | | | | | |
| KRW Currency Call12 | | | GSCO-OT | | | | KRW | | | | 1008.300 | | | | 3/4/19 | | |
| KRW
151,245,000 |
| | | 75,622,500 | | | | 1,209,960 | |
| | | | | | | | | | | | | | | | | | | | | | | MXN | | | | | |
| MXN Currency Call12 | | | GSCO-OT | | | | MXN | | | | 18.100 | | | | 2/15/19 | | | | MXN 3,991,050 | | | | 1,810,000 | | | | 2,463,410 | |
| | | | | | | | | | | | | | | | | | | | | | | MXN | | | | | |
| MXN Currency Call12 | | | GSCO-OT | | | | MXN | | | | 18.020 | | | | 8/20/18 | | | | MXN 1,802,000 | | | | 1,802,000 | | | | 1,852,456 | |
| | | | | | | | | | | | | | | | | | | | | | | PHP | | | | | |
| PHP Currency Call12 | | | GSCO-OT | | | | PHP | | | | 50.800 | | | | 4/27/18 | | | | PHP 5,080,000 | | | | 5,080,000 | | | | 25,400 | |
| | | | | | | | | | | | | | | | | | | | | | | SGD | | | | | |
| SGD Currency Call12 | | | GSCO-OT | | | | SGD | | | | 1.295 | | | | 4/24/18 | | | | SGD 194,250 | | | | 194,250 | | | | 176,379 | |
| | | | | | | | | | | | | | | | | | | | | | | SGD | | | | | |
| SGD Currency Call12 | | | GSCO-OT | | | | SGD | | | | 1.300 | | | | 4/19/18 | | | | SGD 130,000 | | | | 130,000 | | | | 157,300 | |
| | | | | | | | | | | | | | | | | | | | | | | ZAR | | | | | |
| ZAR Currency Put12 | | | GSCO-OT | | | | ZAR | | | | 13.000 | | | | 4/10/18 | | | | ZAR 1,300,000 | | | | 1,300,000 | | | | 29,900 | |
30 OPPENHEIMER INTERNATIONAL BOND FUND
| | | | | | | | | | | | | | | | | | | | | | | | | | | | |
| | | | | | | |
| | | Counter- | | | | | | Exercise | | | Expiration | | | Notional
Amount | | | Contracts | | | | |
| | | party | | | | | | Price | | | Date | | | (000’s) | | | (000’s) | | | Value | |
Over-the-Counter Options Purchased (Continued) | | | | | | | | | | | | | | | | | |
| | | | | | | | | | | | | | | | | | | | | | | ZAR | | | | | |
| ZAR Currency Put12 | | | JPM | | | | ZAR | | | | 13.000 | | | | 4/5/18 | | | | ZAR 1,300,000 | | | | 1,170,000 | | | $ | 5,850 | |
| | | | | | | | | | | | | | | | | | | | | | | | | | | | |
Total Over-the-Counter Options Purchased (Cost $25,854,565) | | | | | | | | 13,491,308 | |
| | | | | | | | | | | | | | | | | | | | | | | | | | | | |
| | | | | | | |
| | | Counter
-party | | | Buy /Sell
Protection | | | Reference Asset | | | Fixed Rate | | | Expiration
Date | | | Notional
Amount
(000’s) | | | | |
Over-the-Counter Credit Default Swaption Purchased—0.0% | | | | | | | | | |
| Credit Default Swap Maturing 12/20/22 Call12 (Cost $827,061) | | | JPM | | | | Sell | | |
| iTraxx
Europe Crossover Series 28 Version 1 |
| | | 2.50 | % | | | 4/18/18 | | | | EUR 100,000 | | | | 383,125 | |
| | | | | | | |
| | | Counter -party | | | Pay/Receive
Floating Rate | | | Floating Rate | | | Fixed Rate | | | Expiration
Date | | | Notional
Amount
(000’s) | | | | |
Over-the-Counter Interest Rate Swaptions Purchased—2.1% | | | | | | | | | |
| Interest Rate Swap Maturing 10/26/37 Call12 | | | JPM | | | | Pay | | |
| Three-
Month USD
LIBOR |
| | | 2.716 | | | | 10/26/37 | | | | USD 50,000 | | | | 4,219,804 | |
| Interest Rate Swap Maturing 10/28/47 Call12 | | | JPM | | | | Receive | | |
| Three-
Month USD
LIBOR |
| | | 2.716 | | | | 10/26/37 | | | | USD 50,000 | | | | 4,412,127 | |
| Interest Rate Swap Maturing 11/12/54 Call12 | | | GSCOI | | | | Receive | | |
| Three-
Month USD
LIBOR |
| | | 3.133 | | | | 11/7/24 | | | | USD 200,000 | | | | 21,609,100 | |
| Interest Rate Swap Maturing 11/23/47 Call12 | | | JPM | | | | Receive | | |
| Six-Month
EUR EURIBOR |
| | | 2.500 | | | | 11/21/22 | | | | EUR 149,500 | | | | 8,244,128 | |
| Interest Rate Swap Maturing 12/22/37 Call12 | | | JPM | | | | Receive | | |
| Three-
Month USD BBA LIBOR |
| | | 2.761 | | | | 12/20/27 | | | | USD 50,000 | | | | 4,060,845 | |
| Interest Rate Swap Maturing 12/22/37 Call12 | | | JPM | | | | Pay | | |
| Three-
Month USD BBA LIBOR |
| | | 2.761 | | | | 12/20/27 | | | | USD 50,000 | | | | 3,267,506 | |
| Interest Rate Swap Maturing 12/3/48 Call12 | | | JPM | | | | Receive | | |
| Six-Month
EUR EURIBOR |
| | | 1.595 | | | | 11/29/18 | | | | EUR 100,000 | | | | 3,338,731 | |
| Interest Rate Swap Maturing 2/23/53 Call12 | | | BOA | | | | Receive | | |
| Three-
Month USD BBA LIBOR |
| | | 3.039 | | | | 2/21/23 | | | | USD 224,000 | | | | 19,846,548 | |
31 OPPENHEIMER INTERNATIONAL BOND FUND
CONSOLIDATED STATEMENT OF INVESTMENTS Unaudited / Continued
| | | | | | | | | | | | | | | | | | | | | | | | | | | | |
| | | Counter -party | | | Pay/Receive
Floating
Rate | | | Floating
Rate | | | Fixed
Rate | | | Expiration
Date | | | Notional
Amount
(000’s) | | | Value | |
Over-the-Counter Interest Rate Swaptions Purchased (Continued) | | | | | | | | | |
| Interest Rate Swap Maturing 2/26/25 Call12 | | | JPM | | | | Pay | | |
| Three-
Month USD
BBA LIBOR |
| | | 2.501 | % | | | 2/24/20 | | | USD | 250,000 | | | $ | 2,975,210 | |
| Interest Rate Swap Maturing 3/18/21 Call12 | | | BOA | | | | Pay | | |
| Three-
Month USD
BBA LIBOR |
| | | 2.860 | | | | 3/14/19 | | | USD | 345,000 | | | | 1,910,976 | |
| Interest Rate Swap Maturing 3/2/25 Call12 | | | JPM | | | | Pay | | |
| Three-
Month USD
BBA |
| | | 2.490 | | | | 2/27/20 | | | USD | 125,000 | | | | 1,546,010 | |
| Interest Rate Swap Maturing 3/5/47 Call12 | | | JPM | | | | Receive | | |
| Three-
Month USD
LIBOR |
| | | 2.885 | | | | 3/3/27 | | | USD | 70,000 | | | | 7,928,493 | |
| Interest Rate Swap Maturing 4/14/23 Call12 | | | BAC | | | | Pay | | |
| Six-Month
EUR EURIBOR |
| | | 0.658 | | | | 4/9/18 | | | EUR | 330,000 | | | | 31,379 | |
| Interest Rate Swap Maturing 4/26/28 Call12 | | | BOA | | | | Receive | | |
| Six-Month
AUD BBR
BBSW |
| | | 3.015 | | | | 4/24/18 | | | AUD | 75,000 | | | | 40,821 | |
| Interest Rate Swap Maturing 4/30/28 Call12 | | | BOA | | | | Receive | | |
| Three-
Month CAD BA CDOR |
| | | 2.683 | | | | 4/30/18 | | | CAD | 295,000 | | | | 276,762 | |
| Interest Rate Swap Maturing 5/17/23 Call12 | | | JPM | | | | Receive | | |
| Six-Month
EUR EURIBOR |
| | | 0.584 | | | | 5/15/18 | | | EUR | 750,000 | | | | 195,171 | |
| Interest Rate Swap Maturing 5/3/28 Call12 | | | BOA | | | | Receive | | |
| Six-Month
EUR EURIBOR |
| | | 1.140 | | | | 4/30/18 | | | EUR | 115,000 | | | | 59,891 | |
| Interest Rate Swap Maturing 5/30/33 Put12 | | | BAC | | | | Receive | | |
| Six-Month
GBP BBA
LIBOR |
| | | 3.990 | | | | 5/30/23 | | | GBP | 40,415 | | | | 447,761 | |
| Interest Rate Swap Maturing 5/4/48 Call12 | | | BOA | | | | Receive | | |
| Three-
Month USD
BBA LIBOR |
| | | 2.958 | | | | 5/2/18 | | | USD | 100,000 | | | | 576,818 | |
| Interest Rate Swap Maturing 6/12/48 Call12 | | | BOA | | | | Pay | | |
| Three-
Month USD
BBA LIBOR |
| | | 1.835 | | | | 6/8/18 | | | USD | 200,000 | | | | 782 | |
| Interest Rate Swap Maturing 6/12/48 Call12 | | | BOA | | | | Receive | | |
| Three-
Month USD
BBA LIBOR |
| | | 2.960 | | | | 6/8/18 | | | USD | 125,000 | | | | 1,456,417 | |
| Interest Rate Swap Maturing 6/29/48 Call12 | | | BAC | | | | Receive | | |
| Six-Month
EUR EURIBOR |
| | | 1.500 | | | | 6/27/18 | | | EUR | 17,500 | | | | 390,192 | |
| Interest Rate Swap Maturing 7/19/23 Call12 | | | JPM | | | | Receive | | |
| Six-Month
EUR EURIBOR |
| | | 0.512 | | | | 7/17/18 | | | EUR | 102,000 | | | | 296,527 | |
| Interest Rate Swap Maturing 8/1/48 Call12 | | | BOA | | | | Receive | | |
| Three-
Month USD
BBA LIBOR |
| | | 2.870 | | | | 7/30/18 | | | USD | 50,000 | | | | 1,335,929 | |
32 OPPENHEIMER INTERNATIONAL BOND FUND
| | | | | | | | | | | | | | | | | | | | | | | | | | | | |
| | | Counter -party | | | Pay/Receive
Floating
Rate | | | Floating
Rate | | | Fixed
Rate | | | Expiration
Date | | | Notional
Amount
(000’s) | | | Value | |
Over-the-Counter Interest Rate Swaptions Purchased (Continued) | | | | | | | | | |
| Interest Rate Swap Maturing 9/17/77 Call12 | | | JPM | | | | Receive | | |
| Six-Month EUR
EURIBOR |
| | | 1.600 | % | | | 9/15/37 | | | EUR | 160,000 | | | $ | 36,834,272 | |
| Interest Rate Swap Maturing 9/5/48 Call12 | | | BAC | | | | Receive | | |
| Six-Month GBP
BBA LIBOR |
| | | 1.681 | | | | 9/5/18 | | | GBP | 20,000 | | | | 599,293 | |
| Total Over-the-Counter Interest Rate Swaptions Purchased (Cost $151,969,829) | | | | | | | | | | | | 125,901,493 | |
| | | | | | | |
| | | | | | | | | | | | | | | | | | Shares | | | | |
Investment Company—9.6% | | | | | | | | | | | | | | | | | |
Oppenheimer Institutional Government Money Market Fund, Cl. E, 1.58%15,16
(Cost $563,447,343) | | | | | | | | 563,447,343 | | | | 563,447,343 | |
Total Investments, at Value (Cost $5,868,568,076) | | | | 100.8 | % | | | 5,918,302,388 | |
Net Other Assets (Liabilities) | | | | (0.8 | ) | | | (49,196,305) | |
| Net Assets | | | | 100.0 | % | | $ | 5,869,106,083 | |
| | | | | | | | | | | | | | | | | | | | | | | | | | | | |
Footnotes to Consolidated Statement of Investments
1. Represents the current interest rate for a variable or increasing rate security, determined as [Referenced Rate + Basis-point spread].
2. Represents securities sold under Rule 144A, which are exempt from registration under the Securities Act of 1933, as amended. These securities have been determined to be liquid under guidelines established by the Board of Trustees.
These securities amount to $1,204,540,689 or 20.52% of the Fund’s net assets at period end.
3. Denotes an inflation-indexed security: coupon or principal are indexed to a consumer price index.
4. All or a portion of the security position is when-issued or delayed delivery to be delivered and settled after period end. See Note 4 of the accompanying Consolidated Notes.
5. Interest or dividend is paid-in-kind, when applicable.
6. This bond has no contractual maturity date, is not redeemable and contractually pays an indefinite stream of interest.
7. All or a portion of this security is owned by the subsidiary. See Note 2 of the accompanying Consolidated Notes.
8. This interest rate resets periodically. Interest rate shown reflects the rate in effect at period end. The rate on this variable rate security is not based on a published reference rate and spread but is determined by the issuer or agent based on current market conditions.
9. This security is not accruing income because its issuer has missed or is expected to miss interest and/or principal payments. The rate shown is the contractual interest rate. See Note 4 of the accompanying Consolidated Notes.
10. The value of this security was determined using significant unobservable inputs. See Note 3 of the accompanying Consolidated Notes.
11. Restricted security. The aggregate value of restricted securities at period end was $11,360,384, which represents 0.19% of the Fund’s net assets. See Note 4 of the accompanying Consolidated Notes. Information concerning restricted securities is as follows:
| | | | | | | | | | | | | | | | |
| Security | | Acquisition
Dates | | | Cost | | | Value | | | Unrealized
Appreciation/
(Depreciation) | |
JPMorgan Hipotecaria su Casita, 6.47% Sec. Nts., 8/26/35 | | | 3/21/07 | | | $ | 3,120,637 | | | $ | 179,134 | | | $ | (2,941,503) | |
JSC Astana Finance, GDR | | | 6/5/15 | | | | — | | | | — | | | | — | |
33 OPPENHEIMER INTERNATIONAL BOND FUND
CONSOLIDATED STATEMENT OF INVESTMENTS Unaudited / Continued
Footnotes to Consolidated Statement of Investments (Continued)
| | | | | | | | | | | | | | | | |
| Security | | Acquisition
Dates | | | Cost | | | Value | | | Unrealized
Appreciation/
(Depreciation) | |
Lloyds Banking Group plc, 6.657% | | | | | | | | | | | | | | | | |
[US0003M+127] Jr. Sub. Perpetual | | | | | | | | | | | | | | | | |
Bonds | | | 5/23/17 | | | $ | 11,220,166 | | | $ | 11,181,250 | | | $ | (38,916) | |
| | | | | | $ | 14,340,803 | | | $ | 11,360,384 | | | $ | (2,980,419) | |
| | | | | | | | |
12. Non-income producing security.
13. Zero coupon bond reflects effective yield on the original acquisition date.
14. All or a portion of the security position is held in segregated accounts and pledged to cover margin requirements under certain derivative contracts. The aggregate market value of such securities is $55,967,795. See Note 6 of the accompanying Consolidated Notes.
15. Rate shown is the 7-day yield at period end.
16. Is or was an affiliate, as defined in the Investment Company Act of 1940, as amended, at or during the reporting period, by virtue of the Fund owning at least 5% of the voting securities of the issuer or as a result of the Fund and the issuer having the same investment adviser. Transactions during the reporting period in which the issuer was an affiliate are as follows:
| | | | | | | | | | | | | | | | |
| | | Shares September 30, 2017 | | | Gross Additions | | | Gross
Reductions | | | Shares March 31, 2018 | |
Oppenheimer Institutional Government Money Market Fund, Cl. E | | | 102,075,708 | | | | 1,946,160,175 | | | | 1,484,788,540 | | | | 563,447,343 | |
| | | | |
| | | Value | | | Income | | | Realized Gain (Loss) | | | Change in
Unrealized Gain
(Loss) | |
Oppenheimer Institutional Government Money Market Fund, Cl. E | | $ | 563,447,343 | | | $ | 1,682,742 | | | $ | — | | | $ | — | |
17. One-Touch Binary option becomes eligible for exercise if at expiration spot rates are less than or equal to 120 JPY per 1 EUR.
Distribution of investments representing geographic holdings, as a percentage of total investments at value, is as follows:
| | | | | | | | | | | | |
| Geographic Holdings | | Value | | | Percent | |
United States | | $ | 834,151,715 | | | | 14.1% | | | | | |
United Kingdom | | | 559,921,098 | | | | 9.5 | | | | | |
Mexico | | | 507,172,108 | | | | 8.6 | | | | | |
India | | | 403,385,353 | | | | 6.8 | | | | | |
Brazil | | | 331,317,361 | | | | 5.6 | | | | | |
Spain | | | 271,660,998 | | | | 4.6 | | | | | |
Russia | | | 249,447,502 | | | | 4.2 | | | | | |
Indonesia | | | 247,542,368 | | | | 4.2 | | | | | |
South Africa | | | 233,243,386 | | | | 3.9 | | | | | |
Argentina | | | 175,697,656 | | | | 3.0 | | | | | |
Greece | | | 161,090,409 | | | | 2.7 | | | | | |
34 OPPENHEIMER INTERNATIONAL BOND FUND
| | | | | | | | | | | | |
| Geographic Holdings (Continued) | | Value | | | Percent | |
Italy | | $ | 145,008,532 | | | | 2.4% | | | | | |
Switzerland | | | 124,224,821 | | | | 2.1 | | | | | |
Portugal | | | 122,915,784 | | | | 2.1 | | | | | |
Australia | | | 113,894,395 | | | | 1.9 | | | | | |
France | | | 99,248,402 | | | | 1.7 | | | | | |
Malaysia | | | 98,467,774 | | | | 1.7 | | | | | |
Netherlands | | | 94,764,539 | | | | 1.6 | | | | | |
Ukraine | | | 76,932,605 | | | | 1.3 | | | | | |
Peru | | | 68,516,422 | | | | 1.2 | | | | | |
Turkey | | | 67,856,904 | | | | 1.1 | | | | | |
Hungary | | | 61,261,983 | | | | 1.0 | | | | | |
Colombia | | | 60,504,626 | | | | 1.0 | | | | | |
Ireland | | | 53,647,926 | | | | 0.9 | | | | | |
Eurozone | | | 50,465,606 | | | | 0.9 | | | | | |
China | | | 46,845,586 | | | | 0.8 | | | | | |
Egypt | | | 44,963,515 | | | | 0.8 | | | | | |
Thailand | | | 39,367,238 | | | | 0.7 | | | | | |
Cyprus | | | 38,070,408 | | | | 0.6 | | | | | |
Kazakhstan | | | 37,527,146 | | | | 0.6 | | | | | |
Ivory Coast | | | 33,124,278 | | | | 0.6 | | | | | |
Chile | | | 29,987,007 | | | | 0.5 | | | | | |
Sri Lanka | | | 28,989,168 | | | | 0.5 | | | | | |
Luxembourg | | | 27,529,653 | | | | 0.5 | | | | | |
Poland | | | 25,600,068 | | | | 0.4 | | | | | |
Uruguay | | | 24,558,875 | | | | 0.4 | | | | | |
Nigeria | | | 23,939,475 | | | | 0.4 | | | | | |
Ecuador | | | 23,348,079 | | | | 0.4 | | | | | |
Dominican Republic | | | 23,008,444 | | | | 0.4 | | | | | |
New Zealand | | | 21,852,603 | | | | 0.4 | | | | | |
Germany | | | 20,598,747 | | | | 0.3 | | | | | |
Hong Kong | | | 14,814,213 | | | | 0.2 | | | | | |
Austria | | | 13,905,621 | | | | 0.2 | | | | | |
Serbia | | | 12,484,757 | | | | 0.2 | | | | | |
Singapore | | | 12,472,723 | | | | 0.2 | | | | | |
Senegal | | | 12,459,129 | | | | 0.2 | | | | | |
Jamaica | | | 12,208,344 | | | | 0.2 | | | | | |
Croatia | | | 11,723,218 | | | | 0.2 | | | | | |
Mongolia | | | 11,521,041 | | | | 0.2 | | | | | |
Cayman Islands | | | 11,504,370 | | | | 0.2 | | | | | |
Gabon | | | 11,316,834 | | | | 0.2 | | | | | |
Romania | | | 10,257,747 | | | | 0.2 | | | | | |
Iraq | | | 9,678,552 | | | | 0.2 | | | | | |
Sweden | | | 9,156,274 | | | | 0.2 | | | | | |
Belgium | | | 8,852,239 | | | | 0.1 | | | | | |
Japan | | | 7,029,893 | | | | 0.1 | | | | | |
Honduras | | | 6,515,449 | | | | 0.1 | | | | | |
Morocco | | | 6,280,659 | | | | 0.1 | | | | | |
Bermuda | | | 5,711,044 | | | | 0.1 | | | | | |
United Arab Emirates | | | 4,623,609 | | | | 0.1 | | | | | |
Supranational | | | 4,167,761 | | | | 0.1 | | | | | |
35 OPPENHEIMER INTERNATIONAL BOND FUND
CONSOLIDATED STATEMENT OF INVESTMENTS Unaudited / Continued
| | | | | | | | | | | | |
| Geographic Holdings (Continued) | | Value | | | Percent | |
Panama | | $ | 3,947,536 | | | | 0.1% | | | | | |
Belarus | | | 3,376,549 | | | | 0.1 | | | | | |
Mauritius | | | 3,365,906 | | | | 0.1 | | | | | |
Bahamas | | | 3,106,650 | | | | 0.0 | | | | | |
South Korea | | | 2,702,064 | | | | 0.0 | | | | | |
Norway | | | 2,606,550 | | | | 0.0 | | | | | |
Canada | | | 837,693 | | | | 0.0 | | | | | |
Philippines | | | 25,400 | | | | 0.0 | | | | | |
| | | | |
Total | | $ | 5,918,302,388 | | | | 100.0% | | | | | |
| | | | |
| | | | | | | | | | | | | | | | | | | | | | | | | | | | |
Forward Currency Exchange Contracts as of March 31, 2018 | | | | | | | | | | | | | | | | | |
Counter -party | | Settlement Month(s) | | | Currency Purchased (000’s) | | | | | | Currency Sold (000’s) | | | Unrealized Appreciation | | | Unrealized Depreciation | |
| BAC | | | 06/2018 | | | | COP | | | | 15,051,000 | | | | USD | | | | 5,270 | | | $ | 102,258 | | | $ | — | |
| BAC | | | 06/2018 | | | | PHP | | | | 2,575,000 | | | | USD | | | | 49,118 | | | | — | | | | 188,530 | |
| BAC | | | 06/2018 | | | | USD | | | | 37,889 | | | | COP | | | | 108,210,000 | | | | — | | | | 735,192 | |
| BAC | | | 08/2018 | | | | USD | | | | 57,749 | | | | EUR | | | | 46,080 | | | | 387,923 | | | | — | |
| BAC | | | 06/2018 | | | | USD | | | | 53,904 | | | | HUF | | | | 13,490,000 | | | | 486,289 | | | | — | |
| BAC | | | 06/2018 | | | | USD | | | | 35,869 | | | | THB | | | | 1,115,900 | | | | 88,446 | | | | — | |
| BAC | | | 06/2018 | | | | USD | | | | 211,289 | | | | ZAR | | | | 2,521,250 | | | | 591,832 | | | | — | |
| BNP | | | 05/2018 | | | | BRL | | | | 24,833 | | | | USD | | | | 7,521 | | | | — | | | | 30,264 | |
| BOA | | | 04/2018 - 05/2018 | | | | BRL | | | | 1,104,794 | | | | USD | | | | 332,141 | | | | 2,367,391 | | | | — | |
| BOA | | | 08/2018 | | | | EUR | | | | 2,260 | | | | USD | | | | 2,821 | | | | — | | | | 7,226 | |
| BOA | | | 08/2018 | | | | GBP | | | | 6,410 | | | | USD | | | | 9,047 | | | | 4,349 | | | | — | |
| BOA | | | 06/2018 | | | | IDR | | | | 675,250,000 | | | | USD | | | | 48,607 | | | | 289,678 | | | | — | |
| BOA | | | 08/2018 | | | | JPY | | | | 48,904,000 | | | | USD | | | | 463,815 | | | | 1,015,503 | | | | 359,234 | |
| BOA | | | 06/2018 | | | | RUB | | | | 567,500 | | | | USD | | | | 9,993 | | | | — | | | | 161,350 | |
| BOA | | | 04/2018 - 05/2018 | | | | USD | | | | 502,551 | | | | BRL | | | | 1,672,762 | | | | — | | | | 3,577,114 | |
| BOA | | | 06/2018 | | | | USD | | | | 181,142 | | | | IDR | | | | 2,516,427,000 | | | | — | | | | 1,079,532 | |
| BOA | | | 06/2018 | | | | USD | | | | 360,704 | | | | INR | | | | 23,717,000 | | | | — | | | | 521,907 | |
| BOA | | | 08/2018 | | | | USD | | | | 79,436 | | | | JPY | | | | 8,388,000 | | | | — | | | | 231,821 | |
| BOA | | | 08/2018 | | | | USD | | | | 29,319 | | | | NZD | | | | 39,980 | | | | 432,984 | | | | — | |
| BOA | | | 06/2018 | | | | USD | | | | 23,626 | | | | PLN | | | | 80,220 | | | | 156,258 | | | | — | |
| CITNA-B | | | 08/2018 | | | | JPY | | | | 16,000,000 | | | | USD | | | | 151,882 | | | | 71,366 | | | | — | |
| CITNA-B | | | 10/2018 | | | | UAH | | | | 260,500 | | | | USD | | | | 9,100 | | | | 7,459 | | | | — | |
| CITNA-B | | | 06/2018 | | | | USD | | | | 37,939 | | | | CLP | | | | 22,836,000 | | | | 132,966 | | | | — | |
| CITNA-B | | | 06/2018 | | | | USD | | | | 49,850 | | | | PEN | | | | 162,760 | | | | — | | | | 477,066 | |
| CITNA-B | | | 06/2018 | | | | USD | | | | 36,577 | | | | TRY | | | | 145,465 | | | | 558,154 | | | | — | |
| DEU | | | 08/2018 | | | | EUR | | | | 6,365 | | | | USD | | | | 7,945 | | | | — | | | | 20,796 | |
| DEU | | | 08/2018 | | | | JPY | | | | 3,430,000 | | | | USD | | | | 32,848 | | | | — | | | | 270,939 | |
| DEU | | | 08/2018 | | | | USD | | | | 61,917 | | | | EUR | | | | 49,675 | | | | 75,074 | | | | — | |
| GSCO-OT | | | 05/2018 | | | | BRL | | | | 28,140 | | | | USD | | | | 8,499 | | | | — | | | | 10,639 | |
| GSCO-OT | | | 08/2018 | | | | GBP | | | | 750 | | | | USD | | | | 1,061 | | | | — | | | | 1,917 | |
| GSCO-OT | | | 05/2018 - 05/2019 | | | | USD | | | | 30,000 | | | | BRL | | | | 109,875 | | | | — | | | | 2,597,301 | |
| GSCO-OT | | | 04/2018 | | | | USD | | | | 33,500 | | | | KRW | | | | 36,200,100 | | | | — | | | | 512,604 | |
| HSBC | | | 08/2018 | | | | EUR | | | | 254,325 | | | | USD | | | | 318,169 | | | | — | | | | 1,554,207 | |
| HSBC | | | 08/2018 | | | | GBP | | | | 4,555 | | | | USD | | | | 6,474 | | | | — | | | | 41,813 | |
| HSBC | | | 08/2018 | | | | NZD | | | | 10,180 | | | | USD | | | | 7,388 | | | | — | | | | 33,146 | |
| HSBC | | | 08/2018 | | | | USD | | | | 34,097 | | | | DKK | | | | 203,610 | | | | 85,401 | | | | — | |
| HSBC | | | 08/2018 | | | | USD | | | | 23,337 | | | | EUR | | | | 18,630 | | | | 143,806 | | | | — | |
36 OPPENHEIMER INTERNATIONAL BOND FUND
| | | | | | | | | | | | | | | | | | | | | | | | | | | | |
Forward Currency Exchange Contracts (Continued) | | | | | | | | | | | | | | | | | |
Counter -party | | Settlement Month(s) | | | | | | Currency Purchased
(000’s) | | | | | | Currency Sold (000’s) | | | Unrealized Appreciation | | | Unrealized Depreciation | |
JPM | | | 04/2018 | | | | BRL | | | | 925,852 | | | | USD | | | | 279,767 | | | $ | 1,521,270 | | | $ | 850,591 | |
JPM | | | 08/2018 | | | | EUR | | | | 133,180 | | | | USD | | | | 166,854 | | | | 17,750 | | | | 1,072,773 | |
JPM | | | 08/2018 | | | | GBP | | | | 199,000 | | | | USD | | | | 276,543 | | | | 4,451,310 | | | | — | |
JPM | | | 06/2018 | | | | KRW | | | | 134,400,000 | | | | USD | | | | 128,000 | | | | — | | | | 1,272,107 | |
JPM | | | 06/2018 | | | | RUB | | | | 1,469,500 | | | | USD | | | | 25,865 | | | | — | | | | 406,798 | |
JPM | | | 10/2018 | | | | UAH | | | | 335,200 | | | | USD | | | | 11,705 | | | | 20,598 | | | | 5,812 | |
JPM | | | 04/2018 | | | | USD | | | | 283,625 | | | | BRL | | | | 925,852 | | | | 3,551,897 | | | | 364,460 | |
JPM | | | 08/2018 | | | | USD | | | | 454,045 | | | | GBP | | | | 326,730 | | | | — | | | | 7,308,425 | |
JPM | | | 06/2018 | | | | USD | | | | 111,767 | | | | KRW | | | | 134,400,000 | | | | — | | | | 14,960,742 | |
JPM | | | 06/2018 | | | | USD | | | | 471,952 | | | | MXN | | | | 8,891,100 | | | | — | | | | 11,119,696 | |
JPM | | | 03/2019 | | | | USD | | | | 50,000 | | | | PHP | | | | 2,612,500 | | | | 1,271,349 | | | | — | |
JPM | | | 06/2018 | | | | USD | | | | 248,080 | | | | RUB | | | | 14,303,100 | | | | 687,831 | | | | — | |
TDB | | | 08/2018 | | | | DKK | | | | 203,610 | | | | USD | | | | 34,163 | | | | — | | | | 150,987 | |
TDB | | | 08/2018 | | | | EUR | | | | 1,205,560 | | | | USD | | | | 1,504,629 | | | | — | | | | 3,802,670 | |
TDB | | | 08/2018 | | | | JPY | | | | 53,113,808 | | | | USD | | | | 503,032 | | | | 1,419,887 | | | | — | |
TDB | | | 08/2018 | | | | USD | | | | 114,536 | | | | AUD | | | | 145,790 | | | | 2,485,160 | | | | — | |
TDB | | | 08/2018 | | | | USD | | | | 1,115,367 | | | | EUR | | | | 893,730 | | | | 2,862,449 | | | | 118,320 | |
TDB | | | 08/2018 | | | | USD | | | | 75,716 | | | | JPY | | | | 8,000,000 | | | | — | | | | 266,272 | |
Total Unrealized Appreciation and Depreciation | | | | | | | | | | | | | | | | | | | | | | $ | 25,286,638 | | | $ | 54,112,251 | |
| | | | | | | | | | | | | | | | | | | | | | | | | | | | |
| | | | | | | | | | | | | | | | | | | | | | | | |
Futures Contracts as of March 31, 2018 | | | | | | | | | | | | | |
| | | | | | | | | | | | Notional | | | | | | Unrealized | |
| | | | | | Expiration | | | Number | | | Amount | | | | | | Appreciation/ | |
| Description | | Buy/Sell | | | Date | | | of Contracts | | | (000’s) | | | Value | | | (Depreciation) | |
| Euro-OAT | | | Sell | | | | 6/7/18 | | | | 189 | | | | EUR 35,248 | | | $ | 35,950,685 | | | $ | (702,542) | |
| | | | | | | | | | | | | | | | | | | | | | | | | | |
Over-the-Counter Options Written at March 31, 2018 | | | | | | | | | | | | |
| Description | | Counter -party | | | Exercise
Price | | | Expiration Date | | | Number of
Contracts
(000’s) | | Notional Amount (000’s) | | | Premiums
Received | | | Value | |
| | | | | | | BRL | | | | | | | BRL | | | | | | | | | | | | |
| | | | | | | |
BRL Currency Call | | | BOA | | | | 3.241 | | | | 8/29/18 | | | (213,873) | | | BRL 213,873 | | | $ | 1,551,660 | | | $ | (1,130,746) | |
| |
| | | | | | | BRL | | | | | | | BRL | | | | | | | | | | | | |
| | | | | | | |
BRL Currency Put | | | BOA | | | | 3.302 | | | | 8/29/18 | | | (439,100) | | | BRL 439,100 | | | | 4,423,580 | | | | (5,021,103) | |
| |
| | | | | | | BRL | | | | | | | BRL | | | | | | | | | | | | |
| | | | | | | |
BRL Currency Call | | | GSCO-OT | | | | 3.256 | | | | 2/22/19 | | | (107,432) | | | BRL 214,863 | | | | 1,152,558 | | | | (977,734) | |
| |
| | | | | | | BRL | | | | | | | BRL | | | | | | | | | | | | |
| | | | | | | |
BRL Currency Put | | | GSCO-OT | | | | 3.314 | | | | 4/26/18 | | | (497,100) | | | BRL 497,100 | | | | 1,560,750 | | | | (1,582,269) | |
| |
| | | | | | | BRL | | | | | | | BRL | | | | | | | | | | | | |
| | | | | | | |
BRL Currency Call | | | GSCO-OT | | | | 2.997 | | | | 4/26/18 | | | (449,475) | | | BRL 449,475 | | | | 574,650 | | | | (25,620) | |
| |
| | | | | | | BRL | | | | | | | BRL | | | | | | | | | | | | |
| | | | | | | |
BRL Currency Put | | | GSCO-OT | | | | 3.373 | | | | 2/22/19 | | | (224,271) | | | BRL 448,543 | | | | 3,563,136 | | | | (3,471,046) | |
37 OPPENHEIMER INTERNATIONAL BOND FUND
CONSOLIDATED STATEMENT OF INVESTMENTS Unaudited / Continued
| | | | | | | | | | | | | | | | | | | | | | | | | | |
Over-the-Counter Options Written (Continued) | | | | | | | | | |
| Description | | Counter -party | | Exercise
Price | | | Expiration
Date | | | Number of
Contracts
(000’s) | | | Notional Amount (000’s) | | | Premiums Received | | | Value | |
| | | | | CAD | | | | | | | | CAD | | | | | | | | | | | | | |
| | | | | | | |
| CAD Currency Put | | TDB | | | 1.314 | | | | 6/11/18 | | | | (98,550) | | | | CAD 197,100 | | | $ | 440,250 | | | $ | (453,626) | |
| |
| | | | | CAD | | | | | | | | CAD | | | | | | | | | | | | | |
| | | | | | | |
| CAD Currency Call | | TDB | | | 1.233 | | | | 6/11/18 | | | | (92,438) | | | | CAD 184,875 | | | | 213,750 | | | | (137,177) | |
| |
| | | | | CAD | | | | | | | | CAD | | | | | | | | | | | | | |
| | | | | | | |
| CAD Currency Call | | TDB | | | 1.197 | | | | 4/17/18 | | | | (119,700) | | | | CAD 119,700 | | | | 266,000 | | | | (3,471) | |
| |
| | | | | CAD | | | | | | | | CAD | | | | | | | | | | | | | |
| | | | | | | |
| CAD Currency Put | | TDB | | | 1.270 | | | | 4/17/18 | | | | (127,000) | | | | CAD 127,000 | | | | 535,000 | | | | (1,568,958) | |
| |
| | | | | COP | | | | | | | | COP | | | | | | | | | | | | | |
| | | | | | | |
| COP Currency Put | | CITNA-B | | | 2871.000 | | | | 6/28/18 | | | | (143,550,000) | | | | COP 287,100,000 | | | | 774,818 | | | | (861,300) | |
| |
| | | | | COP | | | | | | | | COP | | | | | | | | | | | | | |
| | | | | | | |
| COP Currency Call | | GSCO-OT | | | 2790.000 | | | | 6/13/18 | | | | (139,500,000) | | | | COP 279,000,000 | | | | 613,350 | | | | (1,116,000) | |
| |
| | | | | COP | | | | | | | | COP | | | | | | | | | | | | | |
| | | | | | | |
| COP Currency Put | | JPM | | | 2863.000 | | | | 6/28/18 | | | | (143,150,000) | | | | COP 286,300,000 | | | | 783,500 | | | | (858,900) | |
| |
| | | | | USD | | | | | | | | EUR | | | | | | | | | | | | | |
| | | | | | | |
| EUR Currency Call | | BOA | | | 1.288 | | | | 9/6/18 | | | | (125,000) | | | | EUR 250,000 | | | | 1,915,978 | | | | (1,145,000) | |
| |
| | | | | SEK | | | | | | | | EUR | | | | | | | | | | | | | |
| | | | | | | |
| EUR Currency Put | | GSCO-OT | | | 9.494 | | | | 5/17/18 | | | | (100,000) | | | | EUR 100,200 | | | | 319,407 | | | | (289) | |
| |
| | | | | SEK | | | | | | | | EUR | | | | | | | | | | | | | |
| | | | | | | |
| EUR Currency Call | | GSCO-OT | | | 10.071 | | | | 5/17/18 | | | | (100,000) | | | | EUR 100,200 | | | | 652,280 | | | | (2,713,920) | |
| |
| | | | | USD | | | | | | | | EUR | | | | | | | | | | | | | |
| | | | | | | |
| EUR Currency Call | | GSCO-OT | | | 1.247 | | | | 5/31/18 | | | | (175,000) | | | | EUR 175,000 | | | | 1,804,531 | | | | (1,587,600) | |
| |
| | | | | HUF | | | | | | | | EUR | | | | | | | | | | | | | |
| | | | | | | |
| EUR Currency Put | | GSCO-OT | | | 302.550 | | | | 4/2/18 | | | | (100,000) | | | | EUR 105,400 | | | | 205,970 | | | | — | |
| |
| | | | | HUF | | | | | | | | EUR | | | | | | | | | | | | | |
| | | | | | | |
| EUR Currency Call | | GSCO-OT | | | 314.300 | | | | 4/2/18 | | | | (100,000) | | | | EUR 105,400 | | | | 429,043 | | | | (2,572) | |
| |
| | | | | USD | | | | | | | | EUR | | | | | | | | | | | | | |
| | | | | | | |
| EUR Currency Call | | JPM | | | 1.312 | | | | 2/22/19 | | | | (100,000) | | | | EUR 100,000 | | | | 2,108,699 | | | | (1,768,500) | |
| |
| | | | | USD | | | | | | | | GBP | | | | | | | | | | | | | |
| | | | | | | |
| GBP Currency Call | | CITNA-B | | | 1.428 | | | | 6/14/18 | | | | (100,000) | | | | GBP 100,000 | | | | 1,325,908 | | | | (1,281,100) | |
| |
| | | | | HUF | | | | | | | | HUF | | | | | | | | | | | | | |
| | | | | | | |
| HUF Currency Call | | BOA | | | 248.000 | | | | 5/25/18 | | | | (12,400,000) | | | | HUF 24,800,000 | | | | 449,500 | | | | (272,800) | |
| |
| | | | | HUF | | | | | | | | HUF | | | | | | | | | | | | | |
| | | | | | | |
| HUF Currency Put | | GSCO-OT | | | 254.100 | | | | 6/7/18 | | | | (12,705,000) | | | | HUF 38,115,000 | | | | 498,300 | | | | (609,840) | |
| |
| | | | | EUR | | | | | | | | EUR | | | | | | | | | | | | | |
| Italian Republic Bonds | | | | | | | | | | | | | | | | | | | | | | | | | | |
| Call | | JPM | | | 123.860 | | | | 6/19/18 | | | | (100,000) | | | | EUR — | | | | 1,639,890 | | | | (3,536,240) | |
38 OPPENHEIMER INTERNATIONAL BOND FUND
| | | | | | | | | | | | | | | | | | | | | | | | | | |
Over-the-Counter Options Written (Continued) | | | | | | | | | |
| Description | | Counter -party | | Exercise
Price | | | Expiration
Date | | | Number of
Contracts
(000’s) | | | Notional Amount (000’s) | | | Premiums Received | | | Value | |
| | | | | IDR | | | | | | | | IDR | | | | | | | | | | | | | |
| | | | | | | |
| IDR Currency Call | | GSCO-OT | | | 12700.000 | | | | 1/4/19 | | | | (1,587,500,000) | | | | IDR 1,587,500,000 | | | $ | 415,749 | | | $ | — | |
| |
| | | | | IDR | | | | | | | | IDR | | | | | | | | | | | | | |
| | | | | | | |
| IDR Currency Put | | GSCO-OT | | | 14000.000 | | | | 5/3/18 | | | | (1,400,000,000) | | | | IDR 2,804,900,000 | | | | 2,066,600 | | | | (2,800,000) | |
| |
| | | | | IDR | | | | | | | | IDR | | | | | | | | | | | | | |
| | | | | | | |
| IDR Currency Put | | GSCO-OT | | | 14000.000 | | | | 1/4/19 | | | | (1,750,000,000) | | | | IDR 1,750,000,000 | | | | 2,935,496 | | | | (3,500,000) | |
| |
| | | | | IDR | | | | | | | | IDR | | | | | | | | | | | | | |
| | | | | | | |
| IDR Currency Call | | GSCO-OT | | | 12700.000 | | | | 2/1/19 | | | | (1,270,000,000) | | | | IDR 2,544,445,000 | | | | 488,400 | | | | — | |
| |
| | | | | JPY | | | | | | | | JPY | | | | | | | | | | | | | |
| | | | | | | |
| JPY Currency Call | | BOA | | | 96.750 | | | | 3/21/19 | | | | (9,675,000) | | | | JPY 9,675,000 | | | | 1,423,500 | | | | (1,383,525) | |
| |
| | | | | JPY | | | | | | | | JPY | | | | | | | | | | | | | |
| | | | | | | |
| JPY Currency Put | | BOA | | | 106.500 | | | | 6/26/18 | | | | (21,300,000) | | | | JPY 21,300,000 | | | | 1,592,000 | | | | (2,492,100) | |
| |
| | | | | JPY | | | | | | | | JPY | | | | | | | | | | | | | |
| | | | | | | |
| JPY Currency Put | | CITNA-B | | | 106.700 | | | | 6/26/18 | | | | (21,340,000) | | | | JPY 21,340,000 | | | | 1,431,247 | | | | (2,326,060) | |
| |
| | | | | JPY | | | | | | | | JPY | | | | | | | | | | | | | |
| | | | | | | |
| JPY Currency Call | | GSCO-OT | | | 96.700 | | | | 3/21/19 | | | | (9,670,000) | | | | JPY 19,340,000 | | | | 1,441,600 | | | | (1,373,140) | |
| |
| | | | | KRW | | | | | | | | KRW | | | | | | | | | | | | | |
| | | | | | | |
| KRW Currency Put | | GSCO-OT | | | 1158.250 | | | | 3/4/19 | | | | (86,868,750) | | | | KRW 173,737,500 | | | | 1,297,500 | | | | (955,556) | |
| |
| | | | | MXN | | | | | | | | MXN | | | | | | | | | | | | | |
| | | | | | | |
| MXN Currency Put | | GSCO-OT | | | 21.975 | | | | 2/15/19 | | | | (2,197,500) | | | | MXN 4,845,488 | | | | 2,411,200 | | | | (1,630,545) | |
| |
| | | | | MXN | | | | | | | | MXN | | | | | | | | | | | | | |
| | | | | | | |
| MXN Currency Put | | GSCO-OT | | | 21.756 | | | | 8/20/18 | | | | (2,175,620) | | | | MXN 2,175,620 | | | | 1,595,000 | | | | (443,826) | |
| |
| | | | | NOK | | | | | | | | NOK | | | | | | | | | | | | | |
| | | | | | | |
| NOK Currency Put | | BOA | | | 7.830 | | | | 6/14/18 | | | | (587,250) | | | | NOK 587,250 | | | | 772,500 | | | | (1,156,295) | |
| |
| | | | | NOK | | | | | | | | NOK | | | | | | | | | | | | | |
| | | | | | | |
| NOK Currency Put | | GSCO-OT | | | 7.802 | | | | 6/27/18 | | | | (975,188) | | | | NOK 1,755,338 | | | | 1,318,750 | | | | (2,296,567) | |
| |
| | | | | PLN | | | | | | | | PLN | | | | | | | | | | | | | |
| | | | | | | |
| PLN Currency Put | | CITNA-B | | | 3.445 | | | | 5/25/18 | | | | (172,250) | | | | PLN 344,500 | | | | 527,500 | | | | (485,573) | |
| |
| | | | | PLN | | | | | | | | PLN | | | | | | | | | | | | | |
| | | | | | | |
| PLN Currency Put | | GSCO-OT | | | 3.474 | | | | 5/31/18 | | | | (260,513) | | | | PLN 521,025 | | | | 773,550 | | | | (567,396) | |
| |
| | | | | RUB | | | | | | | | RUB | | | | | | | | | | | | | |
| | | | | | | |
| RUB Currency Put | | JPM | | | 57.850 | | | | 5/31/18 | | | | (2,892,500) | | | | RUB 5,785,000 | | | | 671,000 | | | | (743,373) | |
| |
| | | | | RUB | | | | | | | | RUB | | | | | | | | | | | | | |
| | | | | | | |
| RUB Currency Put | | JPM | | | 58.673 | | | | 6/8/18 | | | | (2,933,625) | | | | RUB 5,867,250 | | | | 649,500 | | | | (592,592) | |
| |
| | | | | SEK | | | | | | | | SEK | | | | | | | | | | | | | |
| | | | | | | |
| SEK Currency Put | | BOA | | | 8.063 | | | | 4/19/18 | | | | (806,250) | | | | SEK 806,250 | | | | 1,192,000 | | | | (3,343,519) | |
39 OPPENHEIMER INTERNATIONAL BOND FUND
CONSOLIDATED STATEMENT OF INVESTMENTS Unaudited / Continued
| | | | | | | | | | | | | | | | | | | | | | | | | | |
Over-the-Counter Options Written (Continued) | | | | | | | | | |
| Description | | Counter -party | | Exercise
Price | | | Expiration Date | | | Number of
Contracts
(000’s) | | | Notional Amount (000’s) | | | Premiums
Received | | | Value | |
| | | | | SEK | | | | | | | | SEK | | | | | | | | | | | | | |
| | | | | | | |
| SEK Currency Put | | GSCO-OT | | | 8.433 | | | | 6/29/18 | | | | (843,300) | | | | SEK 1,686,600 | | | $ | 994,900 | | | $ | (1,009,430) | |
| |
| | | | | TRY | | | | | | | | TRY | | | | | | | | | | | | | |
| | | | | | | |
| TRY Currency Put | | CITNA-B | | | 5.000 | | | | 6/7/19 | | | | (375,000) | | | | TRY 375,000 | | | | 2,887,500 | | | | (2,402,250) | |
| |
| | | | | TRY | | | | | | | | TRY | | | | | | | | | | | | | |
| | | | | | | |
| TRY Currency Put | | CITNA-B | | | 5.000 | | | | 6/20/19 | | | | (250,000) | | | | TRY 250,000 | | | | 1,980,000 | | | | (1,684,250) | |
| |
| | | | | TRY | | | | | | | | TRY | | | | | | | | | | | | | |
| | | | | | | |
| TRY Currency Put | | GSCO-OT | | | 5.020 | | | | 5/31/19 | | | | (376,500) | | | | TRY 376,500 | | | | 2,895,450 | | | | (2,275,942) | |
| |
| | | | | ZAR | | | | | | | | ZAR | | | | | | | | | | | | | |
| | | | | | | |
| ZAR Currency Call | | GSCO-OT | | | 12.000 | | | | 4/10/18 | | | | (1,200,000) | | | | ZAR 1,200,000 | | | | 732,800 | | | | (1,669,200) | |
| |
| | | | | ZAR | | | | | | | | ZAR | | | | | | | | | | | | | |
| | | | | | | |
| ZAR Currency Put | | GSCO-OT | | | 13.750 | | | | 4/10/18 | | | | (1,375,000) | | | | ZAR 1,375,000 | | | | 701,100 | | | | (4,125) | |
| |
| | | | | ZAR | | | | | | | | ZAR | | | | | | | | | | | | | |
| | | | | | | |
| ZAR Currency Put | | JPM | | | 13.750 | | | | 4/5/18 | | | | (1,237,500) | | | | ZAR 1,375,000 | | | | 561,870 | | | | (3,713) | |
| |
| | | | | ZAR | | | | | | | | ZAR | | | | | | | | | | | | | |
| | | | | | | |
| ZAR Currency Call | | JPM | | | 12.000 | | | | 4/5/18 | | | | (1,080,000) | | | | ZAR 1,200,000 | | | | 869,310 | | | | (1,358,640) | |
| |
| | | | | ZAR | | | | | | | | ZAR | | | | | | | | | | | | | |
| | | | | | | |
| ZAR Currency Put | | JPM | | | 12.500 | | | | 6/21/18 | | | | (1,250,000) | | | | ZAR 1,250,000 | | | | 1,652,500 | | | | (1,118,750) | |
| | | | | | | | | | | | | | | | | | | | | | |
| Total Over-the-Counter Options Written | | | | | | | | | | | | | | | | | | | | $ | 64,081,030 | | | $ | (67,742,178) | |
| | | | | | | | | | | | | | | | | | | | | | |
| | | | | | | | | | | | | | | | | | | | | | | | | | | | |
Centrally Cleared Credit Default Swaps at March 31, 2018 | | | | | |
| Reference Asset | | Buy/Sell
Protection | | | Fixed
Rate | | | Maturity Date | | | Notional
Amount
(000’s) | | | Premiums
Received/(Paid) | | | Value | | | Unrealized
Appreciation/
(Depreciation) | |
| Argentine Republic | | | Sell | | | | 5.000 | % | | | 12/20/22 | | | | USD 3,000 | | | $ | (306,214) | | | $ | 319,392 | | | $ | 13,178 | |
| |
| CDX.EM.29 | | | Buy | | | | 1.000 | | | | 6/20/23 | | | | USD 6,500 | | | | (128,122) | | | | 111,313 | | | | (16,809) | |
| |
| CDX.EM.29 | | | Buy | | | | 1.000 | | | | 6/20/23 | | | | USD 6,500 | | | | (128,700) | | | | 111,494 | | | | (17,206) | |
| |
| CDX.EM.29 | | | Buy | | | | 1.000 | | | | 6/20/23 | | | | USD 9,500 | | | | (170,630) | | | | 162,425 | | | | (8,205) | |
| |
| CDX.HY.30 | | | Buy | | | | 5.000 | | | | 6/20/23 | | | | USD 50,000 | | | | 3,032,222 | | | | (3,097,627) | | | | (65,405) | |
| |
| Federative Republic of Brazil | | | Buy | | | | 1.000 | | | | 6/20/23 | | | | USD 6,500 | | | | (208,401) | | | | 190,297 | | | | (18,104) | |
| |
| Federative Republic of Brazil | | | Buy | | | | 1.000 | | | | 6/20/23 | | | | USD 9,650 | | | | (314,060) | | | | 282,785 | | | | (31,275) | |
| |
| Federative Republic of Brazil | | | Sell | | | | 1.000 | | | | 6/20/22 | | | | USD 15,000 | | | | 928,605 | | | | (177,633) | | | | 750,972 | |
| |
| Intesa Sanpaolo SpA | | | Buy | | | | 1.000 | | | | 12/20/21 | | | | EUR 15,000 | | | | (548,711) | | | | (247,388) | | | | (796,099) | |
| |
| iTraxx Europe Crossover Series 29 Version 1 | | | Buy | | | | 5.000 | | | | 6/20/23 | | | | EUR 100,000 | | | | 12,294,250 | | | | (12,610,634) | | | | (316,384) | |
| |
| People’s Republic of China | | | Buy | | | | 1.000 | | | | 6/20/23 | | | | USD 34,000 | | | | 621,219 | | | | (613,781) | | | | 7,438 | |
40 OPPENHEIMER INTERNATIONAL BOND FUND
| | | | | | | | | | | | | | | | | | | | | | | | | | | | |
Centrally Cleared Credit Default Swaps (Continued) | | | | | | | | | |
| Reference Asset | | | | Buy/Sell
Protection | | Fixed
Rate | | | Maturity
Date | | | Notional
Amount
(000’s) | | | Premiums
Received/
(Paid) | | | Value | | | Unrealized
Appreciation/
(Depreciation) | |
| Petrobras Global Finance BV | | | | Sell | | | 1.000 | % | | | 12/20/20 | | | | USD 6,000 | | | $ | 61,070 | | | $ | (9,156) | | | $ | 51,914 | |
| |
| Petrobras Global Finance BV | | | | Sell | | | 1.000 | | | | 12/20/20 | | | | USD 6,000 | | | | 60,552 | | | | (9,156) | | | | 51,396 | |
| |
| Republic of Colombia | | | | Buy | | | 1.000 | | | | 6/20/23 | | | | USD 7,000 | | | | (25,915) | | | | 17,536 | | | | (8,379) | |
| |
| Republic of Colombia | | | | Buy | | | 1.000 | | | | 6/20/23 | | | | USD 25,000 | | | | (131,140) | | | | 62,629 | | | | (68,511) | |
| |
| Republic of Italy | | | | Sell | | | 1.000 | | | | 12/20/21 | | | | USD 16,000 | | | | 585,507 | | | | 107,223 | | | | 692,730 | |
| |
| Republic of Korea | | | | Buy | | | 1.000 | | | | 6/20/23 | | | | USD 51,400 | | | | 1,282,244 | | | | (1,216,586) | | | | 65,658 | |
| |
| Republic of South Africa Gover | | | | Buy | | | 1.000 | | | | 6/20/23 | | | | USD 9,500 | | | | (260,719) | | | | 224,187 | | | | (36,532) | |
| |
| Republic of South Africa Gover | | | | Buy | | | 1.000 | | | | 6/20/23 | | | | USD 43,000 | | | | (1,180,098) | | | | 1,014,743 | | | | (165,355) | |
| |
| Republic of South Africa Gover | | | | Buy | | | 1.000 | | | | 6/20/23 | | | | USD 6,500 | | | | (177,853) | | | | 153,391 | | | | (24,462) | |
| |
| Republic of Turkey | | | | Buy | | | 1.000 | | | | 6/20/23 | | | | USD 6,500 | | | | (284,602) | | | | 279,220 | | | | (5,382) | |
| | | | | | | | | | | | | | | | | | | | |
Total Centrally Cleared Credit Default Swaps | | | | | | | $ | 15,000,504 | | | $ | (14,945,326) | | | $ | 55,178 | |
| | | | | | | | | | | | | | | | | | | | |
| | | | | | | | | | | | | | | | | | | | | | | | | | | | | | | | |
Over-the-Counter Credit Default Swaps at March 31, 2018 | | | | | | | | | |
| Reference Asset | | Counter-
party | | | Buy/Sell
Protection | | | Fixed
Rate | | | Maturity
Date | | | Notional Amount
(000’s) | | | Premiums
Received/
(Paid) | | | Value | | | Unrealized
Appreciation/
(Depreciation) | |
| Eskom Holdings Soc Ltd. | | | GSCOI | | | | Sell | | | | 1.000 | % | | | 12/20/22 | | | | USD 9,500 | | | $ | 791,100 | | | $ | (1,024,334) | | | $ | (233,234) | |
| |
| Federative Republic of Brazil | | | BNP | | | | Sell | | | | 1.000 | | | | 12/20/18 | | | | USD 10,265 | | | | 812,157 | | | | 46,534 | | | | 858,691 | |
| |
| Hellenic Republic | | | BAC | | | | Sell | | | | 1.000 | | | | 12/20/20 | | | | USD 25,000 | | | | 1,925,913 | | | | (1,017,455) | | | | 908,458 | |
| |
| Hellenic Republic | | | BAC | | | | Sell | | | | 1.000 | | | | 3/20/20 | | | | USD 3,090 | | | | 1,174,372 | | | | (74,029) | | | | 1,100,343 | |
| |
| Hellenic Republic | | | BAC | | | | Sell | | | | 1.000 | | | | 3/20/20 | | | | USD 3,090 | | | | 1,097,122 | | | | (74,029) | | | | 1,023,093 | |
| |
| ICICI Bank Ltd. | | | GSCO-OT | | | | Sell | | | | 1.000 | | | | 12/20/19 | | | | USD 10,000 | | | | 359,971 | | | | 118,273 | | | | 478,244 | |
| |
| Idbi Bank Ltd./difc Dubai | | | BAC | | | | Sell | | | | 1.000 | | | | 12/20/22 | | | | USD 6,000 | | | | 194,525 | | | | (110,354) | | | | 84,171 | |
| |
| Idbi Bank Ltd./difc Dubai | | | BNP | | | | Sell | | | | 1.000 | | | | 12/20/22 | | | | USD 6,000 | | | | 181,053 | | | | (110,354) | | | | 70,699 | |
| |
| Oriental Republic of Uruguay | | | BOA | | | | Sell | | | | 1.000 | | | | 12/20/21 | | | | USD 14,802 | | | | 267,519 | | | | 186,022 | | | | 453,541 | |
| |
| State Bank of India | | | BNP | | | | Sell | | | | 1.000 | | | | 9/20/19 | | | | USD 13,035 | | | | 537,811 | | | | 144,835 | | | | 682,646 | |
| | | | | | | | | | | | | | | | | | | | | | | | |
| Total Over-the-Counter Credit Default Swaps | | | | | | | | | | | $ | 7,341,543 | | | $ | (1,914,891) | | | $ | 5,426,652 | |
| | | | | | | | | | | | | | | | | | | | | | | | |
The table that follows shows the undiscounted maximum potential payment by the Fund related to selling credit protection in credit default swaps:
41 OPPENHEIMER INTERNATIONAL BOND FUND
CONSOLIDATED STATEMENT OF INVESTMENTS Unaudited / Continued
| | | | | | | | | | |
Type of Reference Asset on which the Fund Sold Protection | | Total Maximum
Potential Payments
for Selling Credit
Protection
(Undiscounted) | | | Amount
Recoverable* | | | Reference
Asset Rating
Range** |
| Investment Grade Single | | | | | | | | | | |
| Name | | | | | | | | | | |
| Corporate Debt Indexes | | $ | 23,035,000 | | | | | | | BBB- |
| Non-Investment Grade | | | | | | | | | | |
| Single | | | | | | | | | | |
| Name Corporate Debt | | | 33,500,000 | | | | | | | BB+ to CCC+ |
| Investment Grade | | | | | | | | | | |
| Sovereign Debt | | | 30,802,000 | | | | | | | BBB |
| Non-Investment Grade | | | | | | | | | | |
| Sovereign Debt | | | 59,445,000 | | | $ | 16,150,000 | | | BB- to B |
Total USD | | $ | 146,782,000 | | | $ | 16,150,000 | | | |
| | | | | | | | | | |
* Amounts recoverable includes potential payments from related purchased protection for instances where the Fund is the seller of protection. In addition, the Fund has no recourse provisions under the credit derivatives and holds no collateral which can offset or reduce potential payments under a triggering event.
** The period end reference asset security ratings, as rated by any rating organization, are included in the equivalent Standard & Poor’s rating category. The reference asset rating represents the likelihood of a potential credit event on the reference asset which would result in a related payment by the Fund.
| | | | | | | | |
| Centrally Cleared Interest Rate Swaps at March 31, 2018 | | |
| | | | | | | | | | | | | | | | | | | | | | | | | | | | | | | | |
Counter- party | | Pay/Receive
Floating
Rate | | | Floating Rate | | | Fixed
Rate | | | Maturity
Date | | | Notional
Amount
(000’s) | | | Premiums
Received /
(Paid) | | | Value | | | Unrealized
Appreciation/
(Depreciation) | |
| |
| | | | | | | Six-Month EUR | | | | | | | | | | | | | | | | | | | | | | | | | |
BAC | | | Receive | | | | EURIBOR | | | | 1.123 | % | | | 3/8/28 | | | | EUR 8,250 | | | $ | — | | | $ | (168,596 | ) | | $ | (168,596) | |
| |
| | | | | | | Six-Month HUF | | �� | | | | | | | | | | HUF | | | | | | | | | | | | | |
BAC | | | Receive | | | | BUBOR | | | | 0.980 | | | | 6/27/22 | | | | 3,000,000 | | | | — | | | | (169,519 | ) | | | (169,519) | |
| |
| | | | | | | Three-Month USD | | | | | | | | | | | | | | | | | | | | | | | | | |
BOA | | | Receive | | | | BBA LIBOR | | | | 1.985 | | | | 10/17/22 | | | | USD 20,900 | | | | — | | | | 516,631 | | | | 516,631 | |
| |
| | | | | | | Three-Motnh CAD | | | | | | | | | | | | | | | | | | | | | | | | | |
BOA | | | Receive | | | | BA CDOR | | | | 2.720 | | | | 5/1/28 | | | | CAD 211,000 | | | | — | | | | (3,032,047 | ) | | | (3,032,047) | |
| |
| | | | | | | MXN TIIE | | | | | | | | | | | | | | | | | | | | | | | | | |
BOA | | | Pay | | | | BANXICO | | | | 6.500 | | | | 11/20/26 | | | | MXN 500,000 | | | | (47 | ) | | | (1,949,200 | ) | | | (1,949,247) | |
| |
| | | | | | | MXN TIIE | | | | | | | | | | | | MXN | | | | | | | | | | | | | |
BOA | | | Pay | | | | BANXICO | | | | 6.500 | | | | 11/24/26 | | | | 1,000,000 | | | | (15 | ) | | | (3,895,787 | ) | | | (3,895,802) | |
| |
| | | | | | | Six-Month HUF | | | | | | | | | | | | HUF | | | | | | | | | | | | | |
CITNA-B | | | Pay | | | | BUBOR | | | | 2.205 | | | | 3/8/28 | | | | 2,750,000 | | | | — | | | | 216,038 | | | | 216,038 | |
| |
| | | | | | | MXN TIIE | | | | | | | | | | | | MXN | | | | | | | | | | | | | |
CITNA-B | | | Pay | | | | BANXICO | | | | 7.920 | | | | 9/13/18 | | | | 2,800,000 | | | | — | | | | 15,634 | | | | 15,634 | |
| |
| | | | | | | Three-Month ZAR | | | | | | | | | | | | | | | | | | | | | | | | | |
CITNA-B | | | Pay | | | | JIBAR SAFEX | | | | 8.590 | | | | 1/23/28 | | | | ZAR 508,000 | | | | — | | | | 351,017 | | | | 351,017 | |
| |
| | | | | | | Six-Month PLN | | | | | | | | | | | | | | | | | | | | | | | | | |
GSCOI | | | Receive | | | | WIBOR WIBO | | | | 2.580 | | | | 2/6/23 | | | | PLN 115,000 | | | | — | | | | 383,959 | | | | 383,959 | |
| |
| | | | | | | MXN TIIE | | | | | | | | | | | | | | | | | | | | | | | | | |
GSCOI | | | Pay | | | | BANXICO | | | | 7.200 | | | | 10/10/22 | | | | MXN 440,000 | | | | — | | | | (192,646 | ) | | | (192,646) | |
| |
GSCOI | | | Pay | | | | BZDI | | | | 9.825 | | | | 7/1/20 | | | | BRL 892,000 | | | | — | | | | 484,838 | | | | 484,838 | |
| |
| | | | | | | Six-Month EUR | | | | | | | | | | | | | | | | | | | | | | | | | |
GSCOI | | | Receive | | | | EURIBOR | | | | 1.596 | | | | 4/4/28 | | | | EUR 64,000 | | | | — | | | | 26,183 | | | | 26,183 | |
42 OPPENHEIMER INTERNATIONAL BOND FUND
| | | | | | | | |
| Centrally Cleared Interest Rate Swaps (Continued) | | |
| | | | | | | | | | | | | | | | | | | | | | | | | | | | | | | | |
Counter- party | | Pay/Receive
Floating
Rate | | | Floating Rate | | | Fixed
Rate | | | Maturity
Date | | | Notional
Amount
(000’s) | | | Premiums
Received /
(Paid) | | | Value | | | Unrealized
Appreciation/
(Depreciation) | |
| |
| | | | | | | MXN TIIE | | | | | | | | | | | | | | | | | | | | | | | | | |
GSCOI | | | Pay | | | | BANXICO | | | | 7.350 | % | | | 3/11/22 | | | | MXN 330,000 | | | $ | — | | | $ | (29,515 | ) | | $ | (29,515) | |
| |
| | | | | | | Six-Month PLN | | | | | | | | | | | | | | | | | | | | | | | | | |
GSCOI | | | Pay | | | | WIBOR WIBO | | | | 1.780 | | | | 6/10/21 | | | | PLN 200,000 | | | | (30,941 | ) | | | (43,754 | ) | | | (74,695) | |
| |
| | | | | | | Six-Month PLN | | | | | | | | | | | | | | | | | | | | | | | | | |
GSCOI | | | Receive | | | | WIBOR WIBO | | | | 1.775 | | | | 10/10/21 | | | | PLN 95,000 | | | | 3,197 | | | | (349,101 | ) | | | (345,904) | |
| |
| | | | | | | Three-Month ZAR | | | | | | | | | | | | | | | | | | | | | | | | | |
GSCOI | | | Pay | | | | JIBAR SAFEX | | | | 7.940 | | | | 3/27/27 | | | | ZAR 178,500 | | | | — | | | | 380,408 | | | | 380,408 | |
| |
| | | | | | | Six-Month CHF | | | | | | | | | | | | | | | | | | | | | | | | | |
GSCOI | | | Pay | | | | BBA LIBOR | | | | 0.884 | | | | 4/4/28 | | | | CHF 72,000 | | | | — | | | | (45,300 | ) | | | (45,300) | |
| |
| | | | | | | MXN TIIE | | | | | | | | | | | | MXN | | | | | | | | | | | | | |
JPM | | | Pay | | | | BANXICO | | | | 8.000 | | | | 8/27/18 | | | | 2,820,000 | | | | — | | | | 72,431 | | | | 72,431 | |
| |
| | | | | | | MXN TIIE | | | | | | | | | | | | | | | | | | | | | | | | | |
JPM | | | Receive | | | | BANXICO | | | | 8.040 | | | | 2/11/28 | | | | MXN 264,000 | | | | — | | | | (383,067 | ) | | | (383,067) | |
| |
| | | | | | | MXN TIIE | | | | | | | | | | | | MXN | | | | | | | | | | | | | |
JPM | | | Pay | | | | BANXICO | | | | 7.895 | | | | 2/21/20 | | | | 1,000,000 | | | | — | | | | 277,490 | | | | 277,490 | |
| |
| | | | | | | Six-Month PLN | | | | | | | | | | | | | | | | | | | | | | | | | |
JPM | | | Pay | | | | WIBOR WIBO | | | | 2.315 | | | | 1/15/26 | | | | PLN 90,200 | | | | (23,445 | ) | | | (657,400 | ) | | | (680,845) | |
| |
JPM | | | Pay | | | | BZDI | | | | 9.865 | | | | 1/4/21 | | | | BRL 248,000 | | | | — | | | | 3,498,044 | | | | 3,498,044 | |
| |
| | | | | | | Three-Month USD | | | | | | | | | | | | | | | | | | | | | | | | | |
JPM | | | Receive | | | | BBA LIBOR | | | | 2.097 | | | | 6/8/27 | | | | USD 12,000 | | | | — | | | | 579,682 | | | | 579,682 | |
| |
JPM | | | Pay | | | | BZDI | | | | 10.500 | | | | 7/1/20 | | | | BRL 880,000 | | | | — | | | | 1,106,980 | | | | 1,106,980 | |
| |
JPM | | | Receive | | | | BZDI | | | | 9.520 | | | | 1/2/19 | | | | BRL 226,000 | | | | — | | | | (1,994,874 | ) | | | (1,994,874) | |
| |
| | | | | | | Six-Month PLN | | | | | | | | | | | | | | | | | | | | | | | | | |
JPM | | | Pay | | | | WIBOR WIBO | | | | 2.090 | | | | 1/11/22 | | | | PLN 160,000 | | | | — | | | | (139,290 | ) | | | (139,290) | |
| |
| | | | | | | Three-Month USD | | | | | | | | | | | | | | | | | | | | | | | | | |
JPM | | | Receive | | | | BBA LIBOR | | | | 2.118 | | | | 3/20/22 | | | | USD 15,675 | | | | — | | | | 328,410 | | | | 328,410 | |
| |
JPM | | | Receive | | | | BZDI | | | | 10.050 | | | | 1/2/23 | | | | BRL 94,500 | | | | — | | | | (1,108,832 | ) | | | (1,108,832) | |
| |
JPM | | | Receive | | | | BZDI | | | | 7.535 | | | | 1/2/19 | | | | BRL 284,000 | | | | — | | | | (895,037 | ) | | | (895,037) | |
| |
| | | | | | | MXN TIIE | | | | | | | | | | | | | | | | | | | | | | | | | |
JPM | | | Receive | | | | BANXICO | | | | 7.480 | | | | 11/17/27 | | | | MXN 260,000 | | | | — | | | | 172,193 | | | | 172,193 | |
| |
| | | | | | | MXN TIIE | | | | | | | | | | | | | | | | | | | | | | | | | |
JPM | | | Pay | | | | BANXICO | | | | 7.450 | | | | 11/27/19 | | | | MXN 990,000 | | | | — | | | | (194,167 | ) | | | (194,167) | |
| |
JPM | | | Receive | | | | BZDI | | | | 9.400 | | | | 1/4/21 | | | | BRL 131,000 | | | | — | | | | 1,492,589 | | | | 1,492,589 | |
| |
JPM | | | Receive | | | | BZDI | | | | 9.395 | | | | 1/2/23 | | | | BRL 97,600 | | | | — | | | | (574,412 | ) | | | (574,412) | |
| |
JPM | | | Pay | | | | BZDI | | | | 8.840 | | | | 1/4/21 | | | | BRL 264,000 | | | | — | | | | 1,938,728 | | | | 1,938,728 | |
| |
SIB | | | Receive | | | | BZDI | | | | 10.230 | | | | 1/2/25 | | | | BRL 95,000 | | | | — | | | | (841,742 | ) | | | (841,742) | |
| |
Total Centrally Cleared Interest Rate Swaps | | | | | | | $ | (51,251 | ) | | $ | (4,823,031 | ) | | $ | (4,874,282) | |
| | | | | | | | | | | | | | | | | |
| | | | | | | | |
| Over-the-Counter Interest Rate Swaps at March 31, 2018 | | |
| | | | | | | | | | | | | | | | | | | | | | | | | | | | | | | | |
Counter- party | | Pay/Receive
Floating
Rate | | | Floating Rate | | | Fixed
Rate | | | Maturity
Date | | | Notional
Amount
(000’s) | | | Premiums
Received /
(Paid) | | | Value | | | Unrealized/
Appreciation
(Depreciation) | |
| |
| | | | | | | Three-Month | | | | | | | | | | | | | | | | | | | | | | | | | |
| | | | | | | COP IBR OIS | | | | | | | | | | | | COP | | | | | | | | | | | | | |
BNP | | | Receive | | | | Compound | | | | 4.890 | % | | | 6/27/19 | | | | 53,000,000 | | | $ | — | | | $ | (132,854 | ) | | $ | (132,854) | |
| |
| | | | | | | | | | | | | | | | | | | INR | | | | | | | | | | | | | |
BOA | | | Pay | | | | NSERO | | | | 6.700 | | | | 3/8/20 | | | | 15,757,500 | | | | — | | | | 56,450 | | | | 56,450 | |
43 OPPENHEIMER INTERNATIONAL BOND FUND
CONSOLIDATED STATEMENT OF INVESTMENTS Unaudited / Continued
| | | | | | | | |
| Over-the-Counter Interest Rate Swaps (Continued) | | |
| | | | | | | | | | | | | | | | | | | | | | | | | | | | | | | | |
Counter- party | | Pay/Receive Floating Rate | | | Floating Rate | | | Fixed
Rate | | | Maturity
Date | | | Notional Amount (000’s) | | | Premiums Received / (Paid) | | | Value | | | Unrealized/
Appreciation
(Depreciation) | |
| |
| | | | | | | Six-Month INR | | | | | | | | | | | | | | | | | | | | | | | | | |
| | | | | | | FBIL MIBOR OIS | | | | | | | | | | | | INR | | | | | | | | | | | | | |
BOA | | | Receive | | | | Compound | | | | 6.705 | % | | | 3/8/23 | | | | 3,602,500 | | | $ | — | | | $ | 8,347 | | | $ | 8,347 | |
| |
| | | | | | | | | | | | | | | | | | | INR | | | | | | | | | | | | | |
BOA | | | Pay | | | | NSERO | | | | 6.623 | | | | 3/20/20 | | | | 7,200,000 | | | | — | | | | (48,091 | ) | | | (48,091) | |
| |
| | | | | | | Six-Month INR | | | | | | | | | | | | | | | | | | | | | | | | | |
| | | | | | | FBIL MIBOR OIS | | | | | | | | | | | | INR | | | | | | | | | | | | | |
BOA | | | Receive | | | | Compound | | | | 6.620 | | | | 3/20/23 | | | | 1,620,000 | | | | — | | | | 97,792 | | | | 97,792 | |
| |
| | | | | | | Three-Month | | | | | | | | | | | | | | | | | | | | | | | | | |
| | | | | | | COP IBR OIS | | | | | | | | | | | | COP | | | | | | | | | | | | | |
DEU | | | Pay | | | | Compound | | | | 5.030 | | | | 4/28/20 | | | | 100,000,000 | | | | — | | | | 401,444 | | | | 401,444 | |
| |
| | | | | | | Six-Month CLP | | | | | | | | | | | | CLP | | | | | | | | | | | | | |
GSCOI | | | Pay | | | | TNA | | | | 2.530 | | | | 8/2/19 | | | | 34,000,000 | | | | — | | | | (202,229 | ) | | | (202,229) | |
| |
| | | | | | | Six-Month CLP | | | | | | | | | | | | CLP | | | | | | | | | | | | | |
GSCOI | | | Pay | | | | TNA | | | | 3.380 | | | | 9/14/22 | | | | 13,500,000 | | | | — | | | | (169,890 | ) | | | (169,890) | |
| |
| | | | | | | CNY- | | | | | | | | | | | | | | | | | | | | | | | | | |
GSCOI | | | Receive | | | | CNREPOFIX=CFXS | | | | 3.785 | | | | 3/27/23 | | | | CNY 281,500 | | | | — | | | | (110,890 | ) | | | (110,890) | |
| |
| | | | | | | Three-Month | | | | | | | | | | | | | | | | | | | | | | | | | |
| | | | | | | COP IBR OIS | | | | | | | | | | | | COP | | | | | | | | | | | | | |
GSCOI | | | Pay | | | | Compound | | | | 6.470 | | | | 9/29/26 | | | | 55,000,000 | | | | — | | | | 817,118 | | | | 817,118 | |
| |
| | | | | | | Three-Month | | | | | | | | | | | | | | | | | | | | | | | | | |
| | | | | | | COP IBR OIS | | | | | | | | | | | | COP | | | | | | | | | | | | | |
GSCOI | | | Pay | | | | Compound | | | | 5.175 | | | | 4/20/20 | | | | 88,000,000 | | | | — | | | | 460,188 | | | | 460,188 | |
| |
| | | | | | | Three-Month | | | | | | | | | | | | | | | | | | | | | | | | | |
| | | | | | | COP IBR OIS | | | | | | | | | | | | COP | | | | | | | | | | | | | |
JPM | | | Pay | | | | Compound | | | | 7.300 | | | | 6/1/26 | | | | 39,425,000 | | | | — | | | | 1,429,901 | | | | 1,429,901 | |
| |
| | | | | | | Three-Month | | | | | | | | | | | | | | | | | | | | | | | | | |
| | | | | | | COP IBR OIS | | | | | | | | | | | | COP | | | | | | | | | | | | | |
JPM | | | Pay | | | | Compound | | | | 5.700 | | | | 3/8/19 | | | | 199,335,000 | | | | — | | | | 1,062,154 | | | | 1,062,154 | |
| |
| | | | | | | Three-Month | | | | | | | | | | | | | | | | | | | | | | | | | |
| | | | | | | COP IBR OIS | | | | | | | | | | | | COP | | | | | | | | | | | | | |
JPM | | | Pay | | | | Compound | | | | 4.990 | | | | 5/2/20 | | | | 105,000,000 | | | | — | | | | 389,152 | | | | 389,152 | |
| |
| | | | | | | One-Week CNY | | | | | | | | | | | | | | | | | | | | | | | | | |
JPM | | | Receive | | | | CNREPOFIX=CFXS | | | | 3.940 | | | | 4/19/22 | | | | CNY 380,000 | | | | — | | | | (728,043 | ) | | | (728,043) | |
| |
| | | | | | | Five-Year EUR | | | | | | | | | | | | | | | | | | | | | | | | | |
JPM | | | Pay | | | | CPI EXT | | | | 2.080 | | | | 5/24/37 | | | | EUR 50,000 | | | | — | | | | (47,101 | ) | | | (47,101) | |
| |
| | | | | | | Three-Month | | | | | | | | | | | | | | | | | | | | | | | | | |
| | | | | | | COP IBR OIS | | | | | | | | | | | | COP | | | | | | | | | | | | | |
JPM | | | Receive | | | | Compound | | | | 4.880 | | | | 6/27/19 | | | | 27,000,000 | | | | — | | | | (66,484 | ) | | | (66,484) | |
| |
| | | | | | | Five-Year EUR | | | | | | | | | | | | | | | | | | | | | | | | | |
JPM | | | Receive | | | | CPI EXT | | | | 1.603 | | | | 5/24/27 | | | | EUR 50,000 | | | | — | | | | 62,682 | | | | 62,682 | |
| |
| | | | | | | Three-Month | | | | | | | | | | | | | | | | | | | | | | | | | |
| | | | | | | COP IBR OIS | | | | | | | | | | | | COP | | | | | | | | | | | | | |
SIB | | | Pay | | | | Compound | | | | 6.280 | | | | 7/13/27 | | | | 20,000,000 | | | | — | | | | 185,079 | | | | 185,079 | |
| | | | | | | | | | | | | | | | | | | | | | | | |
Total Over-the-Counter Interest Rate Swaps | | | | | | | $ | — | | | $ | 3,464,725 | | | $ | 3,464,725 | |
| | | | | | | | | | | | | | | | | | | | | | | | |
44 OPPENHEIMER INTERNATIONAL BOND FUND
| | | | | | | | |
| Over-the-Counter Total Return Swaps at March 31, 2018 | | |
| | | | | | | | | | | | | | | | | | | | | | | | | | | | |
| Reference Asset | | Counter-
party | | | Pay/Receive
Total
Return* | | | Floating Rate | | | Maturity
Date | | | Notional
Amount
(000’s) | | | Value | | | Unrealized
Appreciation/
(Depreciation) | |
| |
| iBoxx EUR Liquid | | | | | | | | | | | | | | | | | | | | | | | | | | | | |
| High Yield Index | | | | | | | | | | | Three-Month | | | | | | | | | | | | | | | | | |
| Series 1 Version 1 | | | JPM | | | | Receive | | | | EURIBOR | | | | 6/26/18 | | | | EUR 150,000 | | | $ | 393,664 | | | $ | 393,664 | |
* Fund will pay or receive the total return of the reference asset depending on whether the return is positive or negative. For contracts where the Fund has elected to receive the total return of the reference asset if positive, it will be responsible for paying the floating rate and the total return of the reference asset if negative. If the Fund has elected to pay the total return of the reference asset if positive, it will receive the floating rate and the total return of the reference asset if negative.
| | | | | | | | |
| Over-the-Counter Credit Default Swaptions Written at March 31, 2018 | | |
| | | | | | | | | | | | | | | | | | | | | | | | | | | | | | | | |
| Description | | Counter-
party | | | Buy/Sell
Protection | | | Reference
Asset | | | Fixed
Rate | | | Expiration
Date | | | Notional
Amount
(000’s) | | | Premiums
Received | | | Value | |
| |
| | | | | | | | | | | iTraxx | | | | | | | | | | | | | | | | | | | | | |
| | | | | | | | | | | Europe | | | | | | | | | | | | | | | | | | | | | |
| Credit Default Swap | | | | | | | | | | | Crossover | | | | | | | | | | | | | | | | | | | | | |
| Maturing 12/20/22 | | | | | | | | | | | Series 28 | | | | | | | | | | | | | | | | | | | | | |
| Call | | | JPM | | | | Buy | | | | Version 1 | | | | 2.250 | % | | | 4/18/18 EUR | | | | 200,000 | | | $ | 342,017 | | | $ | (91,299 | ) |
| |
| Credit Default Swap | | | | | | | | | | | | | | | | | | | | | | | | | | | | | | | | |
| Maturing 6/20/23 | | | | | | | | | | | CDX. | | | | | | | | | | | | | | | | | | | | | |
| Call | | | JPM | | | | Sell | | | | NA.HY.30 | | | | 104.000 | | | | 6/20/18 USD | | | | 100,000 | | | | 940,000 | | | | (900,730 | ) |
| | | | | | | | | | | | | | | | | | | | | | | | | | | | |
| Total Over-the-Counter Credit Default Swaptions Written | | | | | | | | | | | | | | | $ | 1,282,017 | | | $ | (992,029 | ) |
| | | | | | | | | | | | | | | | | | | | | |
| | | | | | | | |
| Over-the-Counter Interest Rate Swaptions Written at March 31, 2018 | | |
| | | | | | | | | | | | | | | | | | | | | | | | | | | | | | | | |
| Description | | Counter-
party | | | Pay/
Receive
Floating
Rate | | | Floating
Rate | | | Fixed
Rate | | | Expiration
Date | | | Notional Amount (000’s) | | | Premiums
Received | | | Value | |
| |
| | | | | | | | | | | Six- | | | | | | | | | | | | | | | | | | | | | |
| Interest Rate | | | | | | | | | | | Month | | | | | | | | | | | | | | | | | | | | | |
| Swap Maturing | | | | | | | | | | | GBP BBA | | | | | | | | | | | | | | | | | | | | | |
| 9/5/23 Call | | | BAC | | | | Pay | | | | LIBOR | | | | 1.701 | % | | | 9/5/18 | | | | GBP 100,000 | | | $ | 539,994 | | | $ | (417,363 | ) |
| |
| | | | | | | | | | | Six- | | | | | | | | | | | | | | | | | | | | | |
| Interest Rate | | | | | | | | | | | Month | | | | | | | | | | | | | | | | | | | | | |
| Swap Maturing | | | | | | | | | | | GBP BBA | | | | | | | | | | | | | | | | | | | | | |
| 9/5/48 Call | | | BAC | | | | Pay | | | | LIBOR | | | | 1.881 | | | | 9/5/18 | | | | GBP 20,000 | | | | 553,840 | | | | (285,687 | ) |
| |
| | | | | | | | | | | Six- | | | | | | | | | | | | | | | | | | | | | |
| Interest Rate | | | | | | | | | | | Month | | | | | | | | | | | | | | | | | | | | | |
| Swap Maturing | | | | | | | | | | | EUR | | | | | | | | | | | | | | | | | | | | | |
| 4/11/28 Call | | | BAC | | | | Receive | | | | EURIBOR | | | | 1.521 | | | | 4/9/18 | | | | EUR 205,500 | | | | 1,009,080 | | | | (37,749 | ) |
| |
| | | | | | | | | | | Six- | | | | | | | | | | | | | | | | | | | | | |
| Interest Rate | | | | | | | | | | | Month | | | | | | | | | | | | | | | | | | | | | |
| Swap Maturing | | | | | | | | | | | EUR | | | | | | | | | | | | | | | | | | | | | |
| 6/29/48 Call | | | BAC | | | | Receive | | | | EURIBOR | | | | 1.400 | | | | 6/27/18 | | | | EUR 17,500 | | | | 174,150 | | | | (160,493 | ) |
| |
| | | | | | | | | | | Six- | | | | | | | | | | | | | | | | | | | | | |
| Interest Rate | | | | | | | | | | | Month | | | | | | | | | | | | | | | | | | | | | |
| Swap Maturing | | | | | | | | | | | EUR | | | | | | | | | | | | | | | | | | | | | |
| 6/29/48 Call | | | BAC | | | | Pay | | | | EURIBOR | | | | 1.650 | | | | 6/27/18 | | | | EUR 17,500 | | | | 117,752 | | | | (120,588 | ) |
45 OPPENHEIMER INTERNATIONAL BOND FUND
CONSOLIDATED STATEMENT OF INVESTMENTS Unaudited / Continued
| | | | | | | | |
Over-the-Counter Interest Rate Swaptions Written (Continued) | | |
| | | | | | | | | | | | | | | | | | | | | | | | | | | | | | | | |
| Description | | Counter-
party | | | Pay/
Receive
Floating
Rate | | | Floating
Rate | | | Fixed
Rate | | | Expiration
Date | | | Notional Amount (000’s) | | | Premiums
Received | | | Value | |
| |
| | | | | | | | | | | Three- | | | | | | | | | | | | | | | | | | | | | |
| Interest Rate | | | | | | | | | | | Month | | | | | | | | | | | | | | | | | | | | | |
| Swap Maturing | | | | | | | | | | | USD BBA | | | | | | | | | | | | | | | | | | | | | |
| 2/23/28 Call | | | BOA | | | | Pay | | | | LIBOR | | | | 3.285 | % | | | 2/21/23 | | | | USD 1,000,000 | | | $ | 23,500,000 | | | | $ (20,042,620) | |
| |
| | | | | | | | | | | Three- | | | | | | | | | | | | | | | | | | | | | |
| Interest Rate | | | | | | | | | | | Month | | | | | | | | | | | | | | | | | | | | | |
| Swap Maturing | | | | | | | | | | | USD BBA | | | | | | | | | | | | | | | | | | | | | |
| 8/1/23 Call | | | BOA | | | | Pay | | | | LIBOR | | | | 2.350 | | | | 7/30/18 | | | | USD 237,500 | | | | 1,737,500 | | | | (4,629,369) | |
| |
| | | | | | | | | | | Three- | | | | | | | | | | | | | | | | | | | | | |
| Interest Rate | | | | | | | | | | | Month | | | | | | | | | | | | | | | | | | | | | |
| Swap Maturing | | | | | | | | | | | USD BBA | | | | | | | | | | | | | | | | | | | | | |
| 3/18/24 Call | | | BOA | | | | Receive | | | | LBOR | | | | 2.850 | | | | 3/14/19 | | | | USD 150,000 | | | | 1,621,500 | | | | (2,064,486) | |
| |
| | | | | | | | | | | Three- | | | | | | | | | | | | | | | | | | | | | |
| Interest Rate | | | | | | | | | | | Month | | | | | | | | | | | | | | | | | | | | | |
| Swap Maturing | | | | | | | | | | | USD BBA | | | | | | | | | | | | | | | | | | | | | |
| 5/4/48 Call | | | BOA | | | | Pay | | | | LIBOR | | | | 3.208 | | | | 5/2/18 | | | | USD 100,000 | | | | 930,000 | | | | (40,672) | |
| |
| | | | | | | | | | | Three- | | | | | | | | | | | | | | | | | | | | | |
| Interest Rate | | | | | | | | | | | Month | | | | | | | | | | | | | | | | | | | | | |
| Swap Maturing | | | | | | | | | | | USD BBA | | | | | | | | | | | | | | | | | | | | | |
| 6/12/48 Call | | | BOA | | | | Pay | | | | LIBOR | | | | 3.210 | | | | 6/8/18 | | | | USD 125,000 | | | | 1,737,500 | | | | (278,250) | |
| |
| | | | | | | | | | | Three- | | | | | | | | | | | | | | | | | | | | | |
| Interest Rate | | | | | | | | | | | Month | | | | | | | | | | | | | | | | | | | | | |
| Swap Maturing | | | | | | | | | | | USD BBA | | | | | | | | | | | | | | | | | | | | | |
| 11/12/54 Call | | | GSCOI | | | | Pay | | | | LIBOR | | | | 3.133 | | | | 11/9/20 | | | | USD 200,000 | | | | 10,320,000 | | | | (12,465,798) | |
| |
| | | | | | | | | | | Six- | | | | | | | | | | | | | | | | | | | | | |
| Interest Rate | | | | | | | | | | | Month | | | | | | | | | | | | | | | | | | | | | |
| Swap Maturing | | | | | | | | | | | EUR | | | | | | | | | | | | | | | | | | | | | |
| 11/25/30 Call | | | JPM | | | | Pay | | | | EURIBOR | | | | 2.750 | | | | 11/23/20 | | | | EUR 657,800 | | | | 5,723,071 | | | | (5,340,242) | |
| |
| | | | | | | | | | | Six- | | | | | | | | | | | | | | | | | | | | | |
| Interest Rate | | | | | | | | | | | Month | | | | | | | | | | | | | | | | | | | | | |
| Swap Maturing | | | | | | | | | | | EUR | | | | | | | | | | | | | | | | | | | | | |
| 9/17/67 Call | | | JPM | | | | Pay | | | | EURIBOR | | | | 3.100 | | | | 9/15/37 | | | | EUR 200,000 | | | | 19,261,235 | | | | (16,975,795) | |
| |
| | | | | | | | | | | Six- | | | | | | | | | | | | | | | | | | | | | |
| Interest Rate | | | | | | | | | | | Month | | | | | | | | | | | | | | | | | | | | | |
| Swap Maturing | | | | | | | | | | | EUR | | | | | | | | | | | | | | | | | | | | | |
| 5/17/23 Call | | | JPM | | | | Pay | | | | EURIBOR | | | | 0.784 | | | | 5/15/18 | | | | EUR 750,000 | | | | 842,366 | | | | (10,456) | |
| |
| | | | | | | | | | | Three- | | | | | | | | | | | | | | | | | | | | | |
| | | | | | | | | | | Month | | | | | | | | | | | | | | | | | | | | | |
| Interest Rate | | | | | | | | | | | SEK | | | | | | | | | | | | | | | | | | | | | |
| Swap Maturing | | | | | | | | | | | STIBOR | | | | | | | | | | | | | | | | | | | | | |
| 7/19/23 Call | | | JPM | | | | Pay | | | | SIDE | | | | 0.765 | | | | 7/17/18 | | | | SEK 1,000,000 | | | | 748,242 | | | | (211,895) | |
| |
| | | | | | | | | | | Six- | | | | | | | | | | | | | | | | | | | | | |
| Interest Rate | | | | | | | | | | | Month | | | | | | | | | | | | | | | | | | | | | |
| Swap Maturing | | | | | | | | | | | EUR | | | | | | | | | | | | | | | | | | | | | |
| 11/30/48 Call | | | JPM | | | | Pay | | | | EURIBOR | | | | 1.595 | | | | 5/29/18 | | | | EUR 100,000 | | | | 3,620,328 | | | | (958,125) | |
| | | | | | | | | | | | | | | | | | | | | | | | | | | | |
Total Over-the-Counter Interest Rate Swaptions Written | | | | | | | | | | | $ | 72,436,558 | | | $ | (64,039,588) | |
| | | | | | | | | | | | | | | | | | | | | | | | | | | | |
| | |
| Glossary: | | |
Counterparty Abbreviations |
| BAC | | Barclays Bank plc |
| BNP | | BNP Paribas |
46 OPPENHEIMER INTERNATIONAL BOND FUND
| | |
| Counterparty Abbreviations (Continued) |
| BOA | | Bank of America NA |
| CITNA-B | | Citibank NA |
| DEU | | Deutsche Bank AG |
| GSCOI | | Goldman Sachs International |
| GSCO-OT | | Goldman Sachs Bank USA |
| HSBC | | HSBC Bank USA NA |
| JPM | | JPMorgan Chase Bank NA |
| SIB | | Banco Santander SA |
| TDB | | Toronto Dominion Bank |
|
| Currency abbreviations indicate amounts reporting in currencies |
| ARS | | Argentine Peso |
| AUD | | Australian Dollar |
| BRL | | Brazilian Real |
| CAD | | Canadian Dollar |
| CHF | | Swiss Franc |
| CLP | | Chilean Peso |
| CNY | | Chinese Renminbi |
| COP | | Colombian Peso |
| DKK | | Danish Krone |
| EGP | | Egyptian Pounds |
| EUR | | Euro |
| GBP | | British Pound Sterling |
| HUF | | Hungarian Forint |
| IDR | | Indonesian Rupiah |
| INR | | Indian Rupee |
| JPY | | Japanese Yen |
| KRW | | South Korean Won |
| MXN | | Mexican Nuevo Peso |
| MYR | | Malaysian Ringgit |
| NOK | | Norwegian Krone |
| NZD | | New Zealand Dollar |
| PEN | | Peruvian New Sol |
| PHP | | Philippine Peso |
| PLN | | Polish Zloty |
| RUB | | Russian Ruble |
| SEK | | Swedish Krona |
| SGD | | Singapore Dollar |
| THB | | Thailand Baht |
| TRY | | New Turkish Lira |
| UAH | | Ukraine Hryvnia |
| UYU | | Uruguay Peso |
| ZAR | | South African Rand |
| |
| Definitions | | |
| BA CDOR | | Canada Bankers Acceptances Deposit Offering Rate |
| BADLARPP | | Argentina Deposit Rates Badlar Private Banks ARS 30 to 35 Days |
| BANXICO | | Banco de Mexico |
| BBA | | British Bankers’ Association |
| BBA LIBOR | | British Bankers’ Association London - Interbank Offered Rate |
47 OPPENHEIMER INTERNATIONAL BOND FUND
CONSOLIDATED STATEMENT OF INVESTMENTS Unaudited / Continued
| | |
| Definitions (Continued) |
| BBR | | Bank Bill Rate |
| BBSW | | Bank Bill Swap Reference Rate (Australian Financial Market) |
| BP0003M | | ICE LIBOR GBP 3 Month |
| BP0006M | | ICE LIBOR GBP 6 Month |
| BPSW5 | | GBP Swap 5 Year |
| BUBOR | | Budapest Interbank Offered Rate |
| BZDI | | Brazil Interbank Deposit Rate |
| CD | | Certificate of Deposit |
| CDX.EM.29 | | Markit CDX Emerging Markets Index |
| CDX.HY.30 | | Markit CDX High Yield Index |
| CNREPOFIX=CFXS | | Repurchase Fixing Rates |
| CPI EXT | | Excluding Tobacco Consumer Price Index |
| EUR003M | | EURIBOR 3 Month ACT/360 |
| EUR006M | | EURIBOR 6 Month ACT/360 |
| EURIBOR | | Euro Interbank Offered Rate |
| EUSA12 | | EUR Swap Annual 12 Year |
| EUSA5 | | EUR Swap Annual 5 Year |
| FBIL | | Financial Benchmarks India Private Ltd. |
| GUKG5 | | UK Government Bonds 5 Year Note Generic Bid Yield |
| H15T10Y | | US Treasury Yield Curve Rate T Note Constant Maturity 10 Year |
| H15T5Y | | US Treasury Yield Curve Rate T Note Constant Maturity 5 Year |
| IBR | | Indicador Bancario de Referencia |
| iTraxx Europe | | |
| Crossover Series 28 | | |
| Version 1 | | Credit Default Swap Trading Index for a Specific Basket of Securities |
| iTraxx Europe | | |
| Crossover Series 29 | | |
| Version 1 | | Credit Default Swap Trading Index for a Specific Basket of Securities |
| JIBAR SAFEX | | South Africa Johannesburg Interbank Agreed Rate/Futures Exchange |
| KSDA | | Korean Securities Dealers Assn. |
| LIBOR | | London Interbank Offered Rate |
| MIBOR | | Mumbai Interbank Offered Rate |
| NSERO | | India Rupee Floating Rate |
| OAT | | French Government Bonds |
| OIS | | Overnight Index Swap |
| STIBOR SIDE | | Stockholm Interbank Offered Rate |
| TIIE | | Interbank Equilibrium Interest Rate |
| TNA | | Non-Deliverable CLP Camara |
| US0003M | | ICE LIBOR USD 3 Month |
| US0006M | | ICE LIBOR USD 6 Month |
| USISDA05 | | USD ICE Swap Rate 11:00am NY 5 Year |
| USSW10 | | USD Swap Semi 30/360 10 Year |
| USSW5 | | USD Swap Semi 30/360 5 Year |
| WIBOR WIBO | | Poland Warsaw Interbank Offer Bid Rate |
|
| See accompanying Notes to Consolidated Financial Statements. |
48 OPPENHEIMER INTERNATIONAL BOND FUND
CONSOLIDATED STATEMENT OF
ASSETS AND LIABILITIES March 31, 2018 Unaudited
| | | | |
Assets | | | | |
| |
Investments, at value—see accompanying consolidated statement of investments: | | | | |
Unaffiliated companies (cost $5,305,120,733) | | $ | 5,354,855,045 | |
Affiliated companies (cost $563,447,343) | | | 563,447,343 | |
| | | | |
| | | | 5,918,302,388 | |
Cash | | | 73,827,590 | |
Cash—foreign currencies (cost $6,462,266) | | | 6,441,604 | |
Cash used for collateral on futures | | | 9,112,000 | |
Cash used for collateral on OTC derivatives | | | 33,789,465 | |
Cash used for collateral on centrally cleared swaps | | | 51,965,161 | |
Unrealized appreciation on forward currency exchange contracts | | | 25,286,638 | |
Swaps, at value (premiums received $1,977,458) | | | 5,859,635 | |
Centrally cleared swaps, at value (net premiums paid $2,730,947) | | | 14,877,890 | |
Receivables and other assets: | | | | |
Interest, dividends and principal paydowns | | | 76,981,089 | |
Investments sold | | | 52,289,422 | |
Shares of beneficial interest sold | | | 11,323,129 | |
Other | | | 436,546 | |
| | | | |
Total assets | | | 6,280,492,557 | |
Liabilities | | | | |
Unrealized depreciation on forward currency exchange contracts | | | 54,112,251 | |
Options written, at value (premiums received $64,081,030) | | | 67,742,178 | |
Swaps, at value (premiums received $5,364,085) | | | 3,916,137 | |
Centrally cleared swaps, at value (net premiums received $17,680,200) | | | 34,646,247 | |
Swaptions written, at value (premiums received $73,718,575) | | | 65,031,617 | |
Payables and other liabilities: | | | | |
Investments purchased (including $6,455,000 purchased on a when-issued or delayed delivery basis) | | | 173,206,130 | |
Shares of beneficial interest redeemed | | | 10,043,935 | |
Dividends | | | 1,399,531 | |
Distribution and service plan fees | | | 372,245 | |
Trustees’ compensation | | | 342,271 | |
Variation margin payable | | | 53,503 | |
Shareholder communications | | | 14,415 | |
Other | | | 506,014 | |
| | | | |
Total liabilities | | | 411,386,474 | |
Net Assets | | $ | 5,869,106,083 | |
| | | | |
| | | | |
49 OPPENHEIMER INTERNATIONAL BOND FUND
CONSOLIDATED STATEMENT OF
ASSETS AND LIABILITIES Unaudited / Continued
| | | | |
Composition of Net Assets | | | | |
Par value of shares of beneficial interest | | $ | 971,504 | |
Additional paid-in capital | | | 6,008,659,412 | |
Accumulated net investment loss | | | (141,186,770) | |
Accumulated net realized loss on investments and foreign currency transactions | | | (27,114,750) | |
Net unrealized appreciation on investments and translation of assets and liabilities denominated in foreign currencies | | | 27,776,687 | |
| | | | |
Net Assets | | $ | 5,869,106,083 | |
| | | | |
| | | | |
| | | | |
Net Asset Value Per Share | | | | |
Class A Shares: | | | | |
| |
| Net asset value and redemption price per share (based on net assets of $1,269,527,130 and 210,003,859 shares of beneficial interest outstanding) | | | $6.05 | |
| |
Maximum offering price per share (net asset value plus sales charge of 4.75% of offering price) | | | $6.35 | |
| |
Class B Shares: | | | | |
| |
Net asset value, redemption price (excludes applicable contingent deferred sales charge) and offering price per share (based on net assets of $2,012,647 and 333,940 shares of beneficial interest outstanding) | | | $6.03 | |
| |
Class C Shares: | | | | |
| |
Net asset value, redemption price (excludes applicable contingent deferred sales charge) and offering price per share (based on net assets of $355,673,246 and 59,054,007 shares of beneficial interest outstanding) | | | $6.02 | |
| |
Class I Shares: | | | | |
| |
Net asset value, redemption price and offering price per share (based on net assets of $1,330,647,649 and 220,381,733 shares of beneficial interest outstanding) | | | $6.04 | |
| |
Class R Shares: | | | | |
| |
Net asset value, redemption price (excludes applicable contingent deferred sales charge) and offering price per share (based on net assets of $128,680,713 and 21,348,074 shares of beneficial interest outstanding) | | | $6.03 | |
| |
Class Y Shares: | | | | |
| |
Net asset value, redemption price and offering price per share (based on net assets of $2,782,564,698 and 460,382,481 shares of beneficial interest outstanding) | | | $6.04 | |
See accompanying Notes to Consolidated Financial Statements.
50 OPPENHEIMER INTERNATIONAL BOND FUND
CONSOLIDATED STATEMENT OF
OPERATIONS For the Six Months Ended March 31, 2018 Unaudited
| | | | |
| Investment Income | | | | |
| Interest (net of foreign withholding taxes of $2,044,608) | | $ | 139,547,234 | |
Dividends—Affiliated companies | | | 1,682,742 | |
| | | | |
Total investment income | | | 141,229,976 | |
| Expenses | | | | |
| Management fees | | | 14,778,159 | |
| Distribution and service plan fees: | | | | |
Class A | | | 1,559,600 | |
Class B | | | 19,331 | |
Class C | | | 1,796,227 | |
| Class R | | | 319,319 | |
Transfer and shareholder servicing agent fees: | | | | |
Class A | | | 1,233,789 | |
Class B | | | 3,915 | |
Class C | | | 351,529 | |
Class I | | | 178,268 | |
Class R | | | 125,242 | |
| Class Y | | | 2,393,040 | |
Shareholder communications: | | | | |
Class A | | | 17,200 | |
Class C | | | 3,988 | |
Class I | | | 1,529 | |
| Class Y | | | 33,811 | |
| Custodian fees and expenses | | | 516,154 | |
| Borrowing fees | | | 97,935 | |
| Trustees’ compensation | | | 85,051 | |
Other | | | 83,104 | |
| | | | |
Total expenses | | | 23,597,191 | |
Less reduction to custodian expenses | | | (16,377) | |
Less waivers and reimbursements of expenses | | | (667,813) | |
| | | | |
Net expenses | | | 22,913,001 | |
| Net Investment Income | | | 118,316,975 | |
51 OPPENHEIMER INTERNATIONAL BOND FUND
CONSOLIDATED STATEMENT OF
OPERATIONS Unaudited / Continued
| | | | |
| Realized and Unrealized Gain (Loss) | | | | |
Net realized gain (loss) on: | | | | |
Investment transactions in unaffiliated companies (includes premiums on options exercised) | | $ | 111,173,483 | |
Option contracts written | | | 20,131,072 | |
Futures contracts | | | (828,987) | |
Foreign currency transactions | | | 1,090,110 | |
Forward currency exchange contracts | | | 16,072,934 | |
Swap contracts | | | (4,237,240) | |
Swaption contracts written | | | 1,093,946 | |
| | | | |
Net realized gain | | | 144,495,318 | |
Net change in unrealized appreciation/depreciation on: | | | | |
Investment transactions in unaffiliated companies | | | (43,103,622) | |
Translation of assets and liabilities denominated in foreign currencies | | | 6,853,551 | |
Forward currency exchange contracts | | | (21,484,267) | |
Futures contracts | | | (871,405) | |
Option contracts written | | | (1,844,514) | |
Swap contracts | | | (2,994,444) | |
Swaption contracts written | | | 5,117,291 | |
| | | | |
Net change in unrealized appreciation/depreciation | | | (58,327,410) | |
| Net Increase in Net Assets Resulting from Operations | | $ | 204,484,883 | |
| | | | |
See accompanying Notes to Consolidated Financial Statements.
52 OPPENHEIMER INTERNATIONAL BOND FUND
CONSOLIDATED STATEMENTS OF CHANGES IN NET ASSETS
| | | | | | | | |
| | | Six Months Ended
March 31, 2018
(Unaudited) | | | Year Ended
September 30, 2017 | |
Operations | | | | | | | | |
Net investment income | | $ | 118,316,975 | | | $ | 217,597,882 | |
Net realized gain (loss) | | | 144,495,318 | | | | (68,057,795) | |
Net change in unrealized appreciation/depreciation | | | (58,327,410) | | | | 75,676,269 | |
Net increase in net assets resulting from operations | | | 204,484,883 | | | | 225,216,356 | |
Dividends and/or Distributions to Shareholders | | | | | | | | |
Dividends from net investment income: | | | | | | | | |
Class A | | | (26,669,666) | | | | (24,160,850) | |
Class B | | | (66,694) | | | | (163,103) | |
Class C | | | (6,237,065) | | | | (6,044,910) | |
Class I | | | (27,484,211) | | | | (25,211,947) | |
Class R | | | (2,545,320) | | | | (2,185,147) | |
Class Y | | | (55,097,536) | | | | (37,761,200) | |
| | | | (118,100,492) | | | | (95,527,157) | |
Tax return of capital distribution: | | | | | | | | |
Class A | | | — | | | | (39,941,064) | |
Class B | | | — | | | | (269,630) | |
Class C | | | — | | | | (9,993,031) | |
Class I | | | — | | | | (41,678,665) | |
Class R | | | — | | | | (3,612,336) | |
Class Y | | | — | | | | (62,424,233) | |
| | | — | | | | (157,918,959) | |
Beneficial Interest Transactions | | | | | | | | |
Net increase (decrease) in net assets resulting from beneficial interest transactions: | | | | | | | | |
Class A | | | (31,708,337) | | | | (321,216,991) | |
Class B | | | (4,333,659) | | | | (11,594,539) | |
Class C | | | (19,858,664) | | | | (120,082,457) | |
Class I | | | 118,040,924 | | | | (419,205,515) | |
Class R | | | (4,503,950) | | | | (14,905,760) | |
Class Y | | | 396,872,764 | | | | 270,216,022 | |
| | | 454,509,078 | | | | (616,789,240) | |
Net Assets | | | | | | | | |
| Total increase (decrease) | | | 540,893,469 | | | | (645,019,000) | |
Beginning of period | | | 5,328,212,614 | | | | 5,973,231,614 | |
| End of period (including accumulated net investment loss of $141,186,770 and $141,403,253, respectively) | | $ | 5,869,106,083 | | | $ | 5,328,212,614 | |
| | | | | | | | |
| | | | | | | | |
See accompanying Notes to Consolidated Financial Statements.
53 OPPENHEIMER INTERNATIONAL BOND FUND
CONSOLIDATED FINANCIAL HIGHLIGHTS
| | | | | | | | | | | | | | | | | | | | | | | | |
Class A | | Six Months
Ended
March 31,
2018
(Unaudited) | | | Year Ended
September
30, 2017 | | | Year Ended
September
30, 2016 | | | Year Ended
September
30, 2015 | | | Year Ended
September
30, 2014 | | | Year Ended
September
30, 2013 | |
Per Share Operating Data | | | | | | | | | | | | | | | | | | | | | | | | |
| Net asset value, beginning of period | | | $5.95 | | | | $5.95 | | | | $5.62 | | | | $6.01 | | | | $6.09 | | | | $6.54 | |
| |
| Income (loss) from investment operations: | | | | | | | | | | | | | | | | | | | | | | | | |
| Net investment income1 | | | 0.13 | | | | 0.23 | | | | 0.22 | | | | 0.18 | | | | 0.19 | | | | 0.23 | |
| Net realized and unrealized gain (loss) | | | 0.10 | | | | 0.03 | | | | 0.33 | | | | (0.39) | | | | (0.08) | | | | (0.40) | |
| | | | |
| Total from investment operations | | | 0.23 | | | | 0.26 | | | | 0.55 | | | | (0.21) | | | | 0.11 | | | | (0.17) | |
| |
| Dividends and/or distributions to shareholders: | | | | | | | | | | | | | | | | | | | | | | | | |
| Dividends from net investment income | | | (0.13) | | | | (0.10) | | | | (0.10) | | | | (0.14) | | | | (0.07) | | | | (0.24) | |
| Distributions from net realized gain | | | 0.00 | | | | 0.00 | | | | 0.00 | | | | 0.00 | | | | (0.00)2 | | | | (0.04) | |
| Tax return of capital distribution | | | 0.00 | | | | (0.16) | | | | (0.12) | | | | (0.04) | | | | (0.12) | | | | 0.00 | |
| | | | |
| Total dividends and/or distributions to shareholders | | | (0.13) | | | | (0.26) | | | | (0.22) | | | | (0.18) | | | | (0.19) | | | | (0.28) | |
| |
Net asset value, end of period | | | $6.05 | | | | $5.95 | | | | $5.95 | | | | $5.62 | | | | $6.01 | | | | $6.09 | |
| | | | |
| | | | | | | | | | | | | | | | | | | | | | | | |
| Total Return, at Net Asset Value3 | | | 3.84% | | | | 4.67% | | | | 9.95% | | | | (3.57)% | | | | 1.86% | | | | (2.77)% | |
| | | | |
| Ratios/Supplemental Data | | | | | | | | | | | | | | | | | | | | | | | | |
| Net assets, end of period (in thousands) | | | $1,269,527 | | | | $1,280,770 | | | | $1,611,584 | | | | $2,010,994 | | | | $3,104,220 | | | | $4,794,923 | |
| |
| Average net assets (in thousands) | | | $1,267,930 | | | | $1,391,397 | | | | $1,753,796 | | | | $2,556,904 | | | | $4,022,858 | | | | $5,586,929 | |
| |
| Ratios to average net assets:4 | | | | | | | | | | | | | | | | | | | | | | | | |
| Net investment income | | | 4.22% | | | | 3.94% | | | | 3.78% | | | | 3.03% | | | | 3.16% | | | | 3.61% | |
| Expenses excluding specific | | | | | | | | | | | | | | | | | | | | | | | | |
| expenses listed below | | | 1.02% | | | | 1.05% | | | | 1.05% | | | | 1.02% | | | | 1.02% | | | | 1.01% | |
| Interest and fees from | | | | | | | | | | | | | | | | | | | | | | | | |
| borrowings | | | 0.00%5 | | | | 0.00%5 | | | | 0.00%5 | | | | 0.00%5 | | | | 0.00% | | | | 0.00% | |
| | | | |
| Total expenses6 | | | 1.02% | | | | 1.05% | | | | 1.05% | | | | 1.02% | | | | 1.02% | | | | 1.01% | |
| Expenses after payments, | | | | | | | | | | | | | | | | | | | | | | | | |
| waivers and/or | | | | | | | | | | | | | | | | | | | | | | | | |
| reimbursements and reduction | | | | | | | | | | | | | | | | | | | | | | | | |
| to custodian expenses | | | 0.99% | | | | 1.02% | | | | 1.03% | | | | 1.02%7 | | | | 1.02%7 | | | | 1.01%7 | |
| |
| Portfolio turnover rate | | | 55% | | | | 96% | | | | 128% | | | | 111% | | | | 108% | | | | 105% | |
54 OPPENHEIMER INTERNATIONAL BOND FUND
1. Per share amounts calculated based on the average shares outstanding during the period.
2. Less than $0.005 per share.
3. Assumes an initial investment on the business day before the first day of the fiscal period, with all dividends and distributions reinvested in additional shares on the reinvestment date, and redemption at the net asset value calculated on the last business day of the fiscal period. Sales charges are not reflected in the total returns. Total returns are not annualized for periods less than one full year. Returns do not reflect the deduction of taxes that a shareholder would pay on fund distributions or the redemption of fund shares.
4. Annualized for periods less than one full year.
5. Less than 0.005%.
6. Total expenses including indirect expenses from affiliated fund fees and expenses were as follows:
| | | | | | | | | | |
| | Six Months Ended March 31, 2018 | | | 1.03 | % | | | | |
| | Year Ended September 30, 2017 | | | 1.06 | % | | | | |
| | Year Ended September 30, 2016 | | | 1.05 | % | | | | |
| | Year Ended September 30, 2015 | | | 1.02 | % | | | | |
| | Year Ended September 30, 2014 | | | 1.02 | % | | | | |
| | Year Ended September 30, 2013 | | | 1.01 | % | | | | |
7. Waiver was less than 0.005%.
See accompanying Notes to Consolidated Financial Statements.
55 OPPENHEIMER INTERNATIONAL BOND FUND
CONSOLIDATED FINANCIAL HIGHLIGHTS Continued
| | | | | | | | | | | | | | | | | | | | | | | | |
| Class B | | Six Months
Ended
March 31,
2018
(Unaudited) | | | Year Ended
September
30, 2017 | | | Year Ended
September
30, 2016 | | | Year Ended
September
30, 2015 | | | Year Ended
September
30, 2014 | | | Year Ended
September
30, 2013 | |
| Per Share Operating Data | | | | | | | | | | | | | | | | | | | | | | | | |
| Net asset value, beginning of period | | | $5.93 | | | | $5.92 | | | | $5.60 | | | | $5.99 | | | | $6.07 | | | | $6.51 | |
| |
| Income (loss) from investment operations: | | | | | | | | | | | | | | | | | | | | | | | | |
| Net investment income1 | | | 0.10 | | | | 0.19 | | | | 0.17 | | | | 0.13 | | | | 0.14 | | | | 0.18 | |
| Net realized and unrealized gain (loss) | | | 0.10 | | | | 0.04 | | | | 0.32 | | | | (0.38) | | | | (0.08) | | | | (0.40) | |
| | | | |
| Total from investment operations | | | 0.20 | | | | 0.23 | | | | 0.49 | | | | (0.25) | | | | 0.06 | | | | (0.22) | |
| |
| Dividends and/or distributions to shareholders: | | | | | | | | | | | | | | | | | | | | | | | | |
| Dividends from net investment income | | | (0.10) | | | | (0.08) | | | | (0.07) | | | | (0.11) | | | | (0.05) | | | | (0.18) | |
| Distributions from net realized gain | | | 0.00 | | | | 0.00 | | | | 0.00 | | | | 0.00 | | | | (0.00)2 | | | | (0.04) | |
| Tax return of capital distribution | | | 0.00 | | | | (0.14) | | | | (0.10) | | | | (0.03) | | | | (0.09) | | | | 0.00 | |
| | | | |
| Total dividends and/or distributions to shareholders | | | (0.10) | | | | (0.22) | | | | (0.17) | | | | (0.14) | | | | (0.14) | | | | (0.22) | |
| |
Net asset value, end of period | | | $6.03 | | | | $5.93 | | | | $5.92 | | | | $5.60 | | | | $5.99 | | | | $6.07 | |
| | | | |
| | | | | | | | | | | | | | | | | | | | | | | | |
| Total Return, at Net Asset Value3 | | | 3.45% | | | | 4.07% | | | | 8.96% | | | | (4.32)% | | | | 1.06% | | | | (3.46)% | |
| | | | | | | | | | | | | | | | | | | | | | | | |
| Ratios/Supplemental Data | | | | | | | | | | | | | | | | | | | | | | | | |
| Net assets, end of period (in thousands) | | | $2,012 | | | | $6,287 | | | | $18,210 | | | | $39,835 | | | | $73,164 | | | | $128,905 | |
| |
| Average net assets (in thousands) | | | $3,854 | | | | $10,918 | | | | $25,916 | | | | $56,357 | | | | $99,269 | | | | $165,674 | |
| |
| Ratios to average net assets:4 | | | | | | | | | | | | | | | | | | | | | | | | |
| Net investment income | | | 3.48% | | | | 3.32% | | | | 2.95% | | | | 2.27% | | | | 2.38% | | | | 2.77% | |
| Expenses excluding specific expenses listed below | | | 1.79% | | | | 1.80% | | | | 1.81% | | | | 1.77% | | | | 1.81% | | | | 1.85% | |
| Interest and fees from borrowings | | | 0.00%5 | | | | 0.00%5 | | | | 0.00%5 | | | | 0.00%5 | | | | 0.00% | | | | 0.00% | |
| | | | |
| Total expenses6 | | | 1.79% | | | | 1.80% | | | | 1.81% | | | | 1.77% | | | | 1.81% | | | | 1.85% | |
| Expenses after payments, waivers and/or reimbursements and reduction to custodian expenses | | | 1.76% | | | | 1.77% | | | | 1.79% | | | | 1.77%7 | | | | 1.81%7 | | | | 1.85%7 | |
| |
| Portfolio turnover rate | | | 55% | | | | 96% | | | | 128% | | | | 111% | | | | 108% | | | | 105% | |
56 OPPENHEIMER INTERNATIONAL BOND FUND
1. Per share amounts calculated based on the average shares outstanding during the period.
2. Less than $0.005 per share.
3. Assumes an initial investment on the business day before the first day of the fiscal period, with all dividends and distributions reinvested in additional shares on the reinvestment date, and redemption at the net asset value calculated on the last business day of the fiscal period. Sales charges are not reflected in the total returns. Total returns are not annualized for periods less than one full year. Returns do not reflect the deduction of taxes that a shareholder would pay on fund distributions or the redemption of fund shares.
4. Annualized for periods less than one full year.
5. Less than 0.005%.
6. Total expenses including indirect expenses from affiliated fund fees and expenses were as follows:
| | | | | | | | | | |
| | Six Months Ended March 31, 2018 | | | 1.80 | % | | | | |
| | Year Ended September 30, 2017 | | | 1.81 | % | | | | |
| | Year Ended September 30, 2016 | | | 1.81 | % | | | | |
| | Year Ended September 30, 2015 | | | 1.77 | % | | | | |
| | Year Ended September 30, 2014 | | | 1.81 | % | | | | |
| | Year Ended September 30, 2013 | | | 1.85 | % | | | | |
7. Waiver was less than 0.005%.
See accompanying Notes to Consolidated Financial Statements.
57 OPPENHEIMER INTERNATIONAL BOND FUND
CONSOLIDATED FINANCIAL HIGHLIGHTS Continued
| | | | | | | | | | | | | | | | | | | | | | | | |
| Class C | | Six Months
Ended
March 31,
2018
(Unaudited) | | | Year Ended
September
30, 2017 | | | Year Ended
September
30, 2016 | | | Year Ended
September
30, 2015 | | | Year Ended
September
30, 2014 | | | Year Ended
September 30,
2013 | |
| Per Share Operating Data | | | | | | | | | | | | | | | | | | | | | | | | |
| Net asset value, beginning of period | | | $5.93 | | | | $5.92 | | | | $5.60 | | | | $5.99 | | | | $6.07 | | | $ | 6.51 | |
| |
| Income (loss) from investment operations: | | | | | | | | | | | | | | | | | | | | | | | | |
| Net investment income1 | | | 0.10 | | | | 0.18 | | | | 0.17 | | | | 0.13 | | | | 0.15 | | | | 0.19 | |
| Net realized and unrealized gain (loss) | | | 0.09 | | | | 0.05 | | | | 0.32 | | | | (0.38) | | | | (0.08) | | | | (0.40) | |
| | | | |
| Total from investment operations | | | 0.19 | | | | 0.23 | | | | 0.49 | | | | (0.25) | | | | 0.07 | | | | (0.21) | |
| |
| Dividends and/or distributions to shareholders: | | | | | | | | | | | | | | | | | | | | | | | | |
| Dividends from net investment income | | | (0.10) | | | | (0.08) | | | | (0.07) | | | | (0.11) | | | | (0.06) | | | | (0.19) | |
| Distributions from net realized gain | | | 0.00 | | | | 0.00 | | | | 0.00 | | | | 0.00 | | | | (0.00)2 | | | | (0.04) | |
| Tax return of capital distribution | | | 0.00 | | | | (0.14) | | | | (0.10) | | | | (0.03) | | | | (0.09) | | | | 0.00 | |
| | | | |
| Total dividends and/or distributions to shareholders | | | (0.10) | | | | (0.22) | | | | (0.17) | | | | (0.14) | | | | (0.15) | | | | (0.23) | |
| |
Net asset value, end of period | | | $6.02 | | | | $5.93 | | | | $5.92 | | | | $5.60 | | | | $5.99 | | | | $6.07 | |
| | | | |
| | | | | | | | | | | | | | | | | | | | | | | | |
| Total Return, at Net Asset Value3 | | | 3.46% | | | | 3.89% | 4 | | | 8.97% | | | | (4.31)% | | | | 1.13% | | | | (3.30)% | |
| | | | | | | | | | | | | | | | | | | | | | | | |
| Ratios/Supplemental Data | | | | | | | | | | | | | | | | | | | | | | | | |
| Net assets, end of period (in thousands) | | | $355,673 | | | | $369,679 | | | | $493,319 | | | | $585,788 | | | | $858,281 | | | | $1,238,931 | |
| |
| Average net assets (in thousands) | | | $360,690 | | | | $414,939 | | | | $524,002 | | | | $713,793 | | | | $1,033,206 | | | | $1,509,389 | |
| |
| Ratios to average net assets:5 Net investment income | | | 3.47% | | | | 3.20% | | | | 3.04% | | | | 2.30% | | | | 2.45% | | | | 2.93% | |
| Expenses excluding specific expenses listed below | | | 1.77% | | | | 1.80% | | | | 1.80% | | | | 1.77% | | | | 1.74% | | | | 1.69% | |
| Interest and fees from borrowings | | | 0.00%6 | | | | 0.00%6 | | | | 0.00%6 | | | | 0.00%6 | | | | 0.00% | | | | 0.00% | |
| | | | |
| Total expenses7 | | | 1.77% | | | | 1.80% | | | | 1.80% | | | | 1.77% | | | | 1.74% | | | | 1.69% | |
| Expenses after payments, waivers and/or reimbursements and reduction to custodian expenses | | | 1.74% | | | | 1.77% | | | | 1.78% | | | | 1.77%8 | | | | 1.74%8 | | | | 1.69%8 | |
| |
| Portfolio turnover rate | | | 55% | | | | 96% | | | | 128% | | | | 111% | | | | 108% | | | | 105% | |
58 OPPENHEIMER INTERNATIONAL BOND FUND
1. Per share amounts calculated based on the average shares outstanding during the period.
2. Less than $0.005 per share.
3. Assumes an initial investment on the business day before the first day of the fiscal period, with all dividends and distributions reinvested in additional shares on the reinvestment date, and redemption at the net asset value calculated on the last business day of the fiscal period. Sales charges are not reflected in the total returns. Total returns are not annualized for periods less than one full year. Returns do not reflect the deduction of taxes that a shareholder would pay on fund distributions or the redemption of fund shares.
4. The return does not include adjustments in accordance with generally accepted accounting principles required at the period end for financial reporting purposes.
5. Annualized for periods less than one full year.
6. Less than 0.005%.
7. Total expenses including indirect expenses from affiliated fund fees and expenses were as follows:
| | | | | | | | | | |
| | Six Months Ended March 31, 2018 | | | 1.78 | % | | | | |
| | Year Ended September 30, 2017 | | | 1.81 | % | | | | |
| | Year Ended September 30, 2016 | | | 1.80 | % | | | | |
| | Year Ended September 30, 2015 | | | 1.77 | % | | | | |
| | Year Ended September 30, 2014 | | | 1.74 | % | | | | |
| | Year Ended September 30, 2013 | | | 1.69 | % | | | | |
8. Waiver was less than 0.005%.
See accompanying Notes to Consolidated Financial Statements.
59 OPPENHEIMER INTERNATIONAL BOND FUND
CONSOLIDATED FINANCIAL HIGHLIGHTS Continued
| | | | | | | | | | | | | | | | | | | | | | | | |
| Class I | | Six Months
Ended
March 31,
2018
(Unaudited) | | | Year Ended
September
30, 2017 | | | Year Ended
September
30, 2016 | | | Year Ended
September
30, 2015 | | | Year Ended September
30, 2014 | | | Year Ended September
30, 2013 | |
| Per Share Operating Data | | | | | | | | | | | | | | | | | | | | | | | | |
| Net asset value, beginning of period | | | $5.94 | | | | $5.94 | | | | $5.61 | | | | $6.00 | | | | $6.08 | | | $ | 6.53 | |
| |
| Income (loss) from investment operations: | | | | | | | | | | | | | | | | | | | | | | | | |
| Net investment income1 | | | 0.14 | | | | 0.25 | | | | 0.24 | | | | 0.21 | | | | 0.22 | | | | 0.24 | |
| Net realized and unrealized gain (loss) | | | 0.10 | | | | 0.04 | | | | 0.33 | | | | (0.39) | | | | (0.08) | | | | (0.38) | |
| | | | |
| Total from investment operations | | | 0.24 | | | | 0.29 | | | | 0.57 | | | | (0.18) | | | | 0.14 | | | | (0.14) | |
| |
| Dividends and/or distributions to shareholders: | | | | | | | | | | | | | | | | | | | | | | | | |
| Dividends from net investment income | | | (0.14) | | | | (0.11) | | | | (0.10) | | | | (0.16) | | | | (0.09) | | | | (0.27) | |
| Distributions from net realized gain | | | 0.00 | | | | 0.00 | | | | 0.00 | | | | 0.00 | | | | (0.00)2 | | | | (0.04) | |
| Tax return of capital distribution | | | 0.00 | | | | (0.18) | | | | (0.14) | | | | (0.05) | | | | (0.13) | | | | 0.00 | |
| | | | |
| Total dividends and/or distributions to shareholders | | | (0.14) | | | | (0.29) | | | | (0.24) | | | | (0.21) | | | | (0.22) | | | | (0.31) | |
| |
Net asset value, end of period | | | $6.04 | | | | $5.94 | | | | $5.94 | | | | $5.61 | | | | $6.00 | | | $ | 6.08 | |
| | | | |
| | | | | | | | | | | | | | | | | | | | | | | | |
| Total Return, at Net Asset Value3 | | | 4.05% | | | | 5.12% | | | | 10.45% | | | | (3.16)% | | | | 2.32% | | | | (2.31)% | |
| | | | | | | | | | | | | | | | | | | | | | | | |
| Ratios/Supplemental Data | | | | | | | | | | | | | | | | | | | | | | | | |
| Net assets, end of period (in thousands) | | | $1,330,648 | | | | $1,194,372 | | | | $1,631,480 | | | | $1,154,225 | | | | $779,478 | | | $ | 542,637 | |
| |
| Average net assets (in thousands) | | | $1,192,762 | | | | $1,327,997 | | | | $1,406,045 | | | | $918,521 | | | | $611,312 | | | | $206,805 | |
| |
| Ratios to average net assets:4 Net investment income | | | 4.63% | | | | 4.37% | | | | 4.28% | | | | 3.54% | | | | 3.58% | | | | 3.95% | |
| Expenses excluding specific expenses listed below | | | 0.60% | | | | 0.61% | | | | 0.60% | | | | 0.57% | | | | 0.56% | | | | 0.57% | |
| Interest and fees from borrowings | | | 0.00%5 | | | | 0.00%5 | | | | 0.00%5 | | | | 0.00%5 | | | | 0.00% | | | | 0.00% | |
| | | | |
| Total expenses6 | | | 0.60% | | | | 0.61% | | | | 0.60% | | | | 0.57% | | | | 0.56% | | | | 0.57% | |
| Expenses after payments, waivers and/or reimbursements and reduction to custodian expenses | | | 0.58% | | | | 0.59% | | | | 0.58% | | | | 0.57%7 | | | | 0.56%7 | | | | 0.57%7 | |
| |
| Portfolio turnover rate | | | 55% | | | | 96% | | | | 128% | | | | 111% | | | | 108% | | | | 105% | |
60 OPPENHEIMER INTERNATIONAL BOND FUND
1. Per share amounts calculated based on the average shares outstanding during the period.
2. Less than $0.005 per share.
3. Assumes an initial investment on the business day before the first day of the fiscal period, with all dividends and distributions reinvested in additional shares on the reinvestment date, and redemption at the net asset value calculated on the last business day of the fiscal period. Sales charges are not reflected in the total returns. Total returns are not annualized for periods less than one full year. Returns do not reflect the deduction of taxes that a shareholder would pay on fund distributions or the redemption of fund shares.
4. Annualized for periods less than one full year.
5. Less than 0.005%.
6. Total expenses including indirect expenses from affiliated fund fees and expenses were as follows:
| | | | | | | | | | |
| | Six Months Ended March 31, 2018 | | | 0.61 | % | | | | |
| | Year Ended September 30, 2017 | | | 0.62 | % | | | | |
| | Year Ended September 30, 2016 | | | 0.60 | % | | | | |
| | Year Ended September 30, 2015 | | | 0.57 | % | | | | |
| | Year Ended September 30, 2014 | | | 0.56 | % | | | | |
| | Year Ended September 30, 2013 | | | 0.57 | % | | | | |
7. Waiver was less than 0.005%.
See accompanying Notes to Consolidated Financial Statements.
61 OPPENHEIMER INTERNATIONAL BOND FUND
CONSOLIDATED FINANCIAL HIGHLIGHTS Continued
| | | | | | | | | | | | | | | | | | | | | | | | |
| Class R | | Six Months
Ended
March 31,
2018
(Unaudited) | | | Year Ended
September
30, 2017 | | | Year Ended
September
30, 2016 | | | Year Ended
September
30, 2015 | | | Year Ended
September
30, 2014 | | | Year Ended
September
30, 2013 | |
| Per Share Operating Data | | | | | | | | | | | | | | | | | | | | | | | | |
| Net asset value, beginning of period | | | $5.93 | | | | $5.93 | | | | $5.60 | | | | $5.99 | | | | $6.07 | | | $ | 6.52 | |
| |
| Income (loss) from investment operations: | | | | | | | | | | | | | | | | | | | | | | | | |
| Net investment income1 | | | 0.12 | | | | 0.21 | | | | 0.20 | | | | 0.16 | | | | 0.17 | | | | 0.20 | |
| Net realized and unrealized gain (loss) | | | 0.10 | | | | 0.04 | | | | 0.33 | | | | (0.39) | | | | (0.08) | | | | (0.40) | |
| | | | |
| Total from investment operations | | | 0.22 | | | | 0.25 | | | | 0.53 | | | | (0.23) | | | | 0.09 | | | | (0.20) | |
| |
| Dividends and/or distributions to shareholders: | | | | | | | | | | | | | | | | | | | | | | | | |
| Dividends from net investment income | | | (0.12) | | | | (0.09) | | | | (0.09) | | | | (0.12) | | | | (0.07) | | | | (0.21) | |
| Distributions from net realized gain | | | 0.00 | | | | 0.00 | | | | 0.00 | | | | 0.00 | | | | (0.00)2 | | | | (0.04) | |
| Tax return of capital distribution | | | 0.00 | | | | (0.16) | | | | (0.11) | | | | (0.04) | | | | (0.10) | | | | 0.00 | |
| | | | |
| Total dividends and/or distributions to shareholders | | | (0.12) | | | | (0.25) | | | | (0.20) | | | | (0.16) | | | | (0.17) | | | | (0.25) | |
| |
Net asset value, end of period | | | $6.03 | | | | $5.93 | | | | $5.93 | | | | $5.60 | | | | $5.99 | | | $ | 6.07 | |
| | | | |
| | | | | | | | | | | | | | | | | | | | | | | | |
| Total Return, at Net Asset Value3 | | | 3.71% | | | | 4.41% | | | | 9.70% | | | | (3.84)% | | | | 1.55% | | | | (3.16)% | |
| | | | | | | | | | | | | | | | | | | | | | | | |
| Ratios/Supplemental Data | | | | | | | | | | | | | | | | | | | | | | | | |
| Net assets, end of period (in thousands) | | | $128,681 | | | | $131,112 | | | | $146,479 | | | | $166,932 | | | | $216,721 | | | $ | 252,758 | |
| |
| Average net assets (in thousands) | | | $128,604 | | | | $133,661 | | | | $149,525 | | | | $192,512 | | | | $234,841 | | | $ | 290,208 | |
| |
| Ratios to average net assets:4 | | | | | | | | | | | | | | | | | | | | | | | | |
| Net investment income | | | 3.98% | | | | 3.67% | | | | 3.54% | | | | 2.81% | | | | 2.84% | | | | 3.19% | |
| Expenses excluding specific expenses listed below | | | 1.27% | | | | 1.30% | | | | 1.29% | | | | 1.27% | | | | 1.35% | | | | 1.53% | |
| Interest and fees from borrowings | | | 0.00%5 | | | | 0.00%5 | | | | 0.00%5 | | | | 0.00%5 | | | | 0.00% | | | | 0.00% | |
| | | | |
| Total expenses6 | | | 1.27% | | | | 1.30% | | | | 1.29% | | | | 1.27% | | | | 1.35% | | | | 1.53% | |
| Expenses after payments, waivers and/or reimbursements and reduction to custodian expenses | | | 1.24% | | | | 1.27% | | | | 1.27% | | | | 1.27%7 | | | | 1.32% | | | | 1.43% | |
| |
| Portfolio turnover rate | | | 55% | | | | 96% | | | | 128% | | | | 111% | | | | 108% | | | | 105% | |
62 OPPENHEIMER INTERNATIONAL BOND FUND
1. Per share amounts calculated based on the average shares outstanding during the period.
2. Less than $0.005 per share.
3. Assumes an initial investment on the business day before the first day of the fiscal period, with all dividends and distributions reinvested in additional shares on the reinvestment date, and redemption at the net asset value calculated on the last business day of the fiscal period. Sales charges are not reflected in the total returns. Total returns are not annualized for periods less than one full year. Returns do not reflect the deduction of taxes that a shareholder would pay on fund distributions or the redemption of fund shares.
4. Annualized for periods less than one full year.
5. Less than 0.005%.
6. Total expenses including indirect expenses from affiliated fund fees and expenses were as follows:
| | | | | | | | | | |
| | Six Months Ended March 31, 2018 | | | 1.28 | % | | | | |
| | Year Ended September 30, 2017 | | | 1.31 | % | | | | |
| | Year Ended September 30, 2016 | | | 1.29 | % | | | | |
| | Year Ended September 30, 2015 | | | 1.27 | % | | | | |
| | Year Ended September 30, 2014 | | | 1.35 | % | | | | |
| | Year Ended September 30, 2013 | | | 1.53 | % | | | | |
7. Waiver was less than 0.005%.
See accompanying Notes to Consolidated Financial Statements.
63 OPPENHEIMER INTERNATIONAL BOND FUND
CONSOLIDATED FINANCIAL HIGHLIGHTS Continued
| | | | | | | | | | | | | | | | | | | | | | | | |
| Class Y | | Six Months
Ended
March 31,
2018
(Unaudited) | | | Year Ended
September
30, 2017 | | | Year Ended September
30, 2016 | | | Year Ended September
30, 2015 | | | Year Ended September
30, 2014 | | | Year Ended September 30,
2013 | |
| Per Share Operating Data | | | | | | | | | | | | | | | | | | | | | | | | |
| Net asset value, beginning of period | | | $5.95 | | | | $5.95 | | | | $5.61 | | | | $6.01 | | | | $6.09 | | | $ | 6.53 | |
| |
| Income (loss) from investment operations: | | | | | | | | | | | | | | | | | | | | | | | | |
| Net investment income1 | | | 0.13 | | | | 0.24 | | | | 0.23 | | | | 0.20 | | | | 0.21 | | | | 0.25 | |
| Net realized and unrealized gain (loss) | | | 0.09 | | | | 0.04 | | | | 0.34 | | | | (0.41) | | | | (0.08) | | | | (0.40) | |
| | | | |
| Total from investment operations | | | 0.22 | | | | 0.28 | | | | 0.57 | | | | (0.21) | | | | 0.13 | | | | (0.15) | |
| |
| Dividends and/or distributions to shareholders: | | | | | | | | | | | | | | | | | | | | | | | | |
| Dividends from net investment income | | | (0.13) | | | | (0.11) | | | | (0.10) | | | | (0.15) | | | | (0.08) | | | | (0.25) | |
| Distributions from net realized gain | | | 0.00 | | | | 0.00 | | | | 0.00 | | | | 0.00 | | | | (0.00)2 | | | | (0.04) | |
| Tax return of capital distribution | | | 0.00 | | | | (0.17) | | | | (0.13) | | | | (0.04) | | | | (0.13) | | | | 0.00 | |
| | | | |
| Total dividends and/or distributions to shareholders | | | (0.13) | | | | (0.28) | | | | (0.23) | | | | (0.19) | | | | (0.21) | | | | (0.29) | |
| |
Net asset value, end of period | | | $6.04 | | | | $5.95 | | | | $5.95 | | | | $5.61 | | | | $6.01 | | | | $6.09 | |
| | | | |
| | | | | | | | | | | | | | | | | | | | | | | | |
| Total Return, at Net Asset Value3 | | | 3.97% | | | | 4.75%4 | | | | 10.42% | | | | (3.50)% | | | | 2.14% | | | | (2.36)% | |
| | | | | | | | | | | | | | | | | | | | | | | | |
| Ratios/Supplemental Data | | | | | | | | | | | | | | | | | | | | | | | | |
| Net assets, end of period (in thousands) | | | $2,782,565 | | | | $2,345,993 | | | | $2,072,160 | | | | $2,781,868 | | | | $3,431,584 | | | | $3,946,008 | |
| |
| Average net assets (in thousands) | | | $2,476,764 | | | | $2,088,382 | | | | $2,399,267 | | | | $3,128,046 | | | | $3,532,821 | | | | $4,710,455 | |
| |
| Ratios to average net assets:5 | | | | | | | | | | | | | | | | | | | | | | | | |
| Net investment income | | | 4.47% | | | | 4.13% | | | | 4.03% | | | | 3.32% | | | | 3.43% | | | | 3.88% | |
| Expenses excluding specific expenses listed below | | | 0.77% | | | | 0.80% | | | | 0.80% | | | | 0.77% | | | | 0.74% | | | | 0.74% | |
| Interest and fees from borrowings | | | 0.00%6 | | | | 0.00%6 | | | | 0.00%6 | | | | 0.00%6 | | | | 0.00% | | | | 0.00% | |
| | | | |
| Total expenses7 | | | 0.77% | | | | 0.80% | | | | 0.80% | | | | 0.77% | | | | 0.74% | | | | 0.74% | |
| Expenses after payments, waivers and/or reimbursements and reduction to custodian expenses | | | 0.74% | | | | 0.77% | | | | 0.78% | | | | 0.77%8 | | | | 0.74%8 | | | | 0.74%8 | |
| |
| Portfolio turnover rate | | | 55% | | | | 96% | | | | 128% | | | | 111% | | | | 108% | | | | 105% | |
64 OPPENHEIMER INTERNATIONAL BOND FUND
1. Per share amounts calculated based on the average shares outstanding during the period.
2. Less than $0.005 per share.
3. Assumes an initial investment on the business day before the first day of the fiscal period, with all dividends and distributions reinvested in additional shares on the reinvestment date, and redemption at the net asset value calculated on the last business day of the fiscal period. Sales charges are not reflected in the total returns. Total returns are not annualized for periods less than one full year. Returns do not reflect the deduction of taxes that a shareholder would pay on fund distributions or the redemption of fund shares.
4. The return does not include adjustments in accordance with generally accepted accounting principles required at the period end for financial reporting purposes.
5. Annualized for periods less than one full year.
6. Less than 0.005%.
7. Total expenses including indirect expenses from affiliated fund fees and expenses were as follows:
| | | | | | | | | | |
| | Six Months Ended March 31, 2018 | | | 0.78 | % | | | | |
| | Year Ended September 30, 2017 | | | 0.81 | % | | | | |
| | Year Ended September 30, 2016 | | | 0.80 | % | | | | |
| | Year Ended September 30, 2015 | | | 0.77 | % | | | | |
| | Year Ended September 30, 2014 | | | 0.74 | % | | | | |
| | Year Ended September 30, 2013 | | | 0.74 | % | | | | |
8. Waiver was less than 0.005%.
See accompanying Notes to Consolidated Financial Statements.
65 OPPENHEIMER INTERNATIONAL BOND FUND
NOTES TO
CONSOLIDATED FINANCIAL STATEMENTS March 31, 2018 Unaudited
1. Organization
Oppenheimer International Bond Fund (the “Fund”) is a non-diversified open-end management investment company registered under the Investment Company Act of 1940 (“1940 Act”), as amended. The Fund’s investment objective is to seek total return. The Fund’s investment adviser is OFI Global Asset Management, Inc. (“OFI Global” or the “Manager”), a wholly-owned subsidiary of OppenheimerFunds, Inc. (“OFI” or the “Sub-Adviser”). The Manager has entered into a sub-advisory agreement with OFI.
The Fund offers Class A, Class C, Class I, Class R and Class Y shares, and previously offered Class B shares for new purchase through June 29, 2012. Subsequent to that date, no new purchases of Class B shares are permitted, however reinvestment of dividend and/or capital gain distributions and exchanges of Class B shares into and from other Oppenheimer funds are allowed. Class A shares are sold at their offering price, which is normally net asset value plus a front-end sales charge. Class C and Class R shares are sold, and Class B shares were sold, without a front-end sales charge but may be subject to a contingent deferred sales charge (“CDSC”). Class R shares are sold only through retirement plans. Retirement plans that offer Class R shares may impose charges on those accounts. Class I and Class Y shares are sold to certain institutional investors or intermediaries without either a front-end sales charge or a CDSC, however, the intermediaries may impose charges on their accountholders who beneficially own Class I and Class Y shares. All classes of shares have identical rights and voting privileges with respect to the Fund in general and exclusive voting rights on matters that affect that class alone. Earnings, net assets and net asset value per share may differ due to each class having its own expenses, such as transfer and shareholder servicing agent fees and shareholder communications, directly attributable to that class. Class A, B, C and R shares have separate distribution and/or service plans under which they pay fees. Class I and Class Y shares do not pay such fees. Class B shares will automatically convert to Class A shares 72 months after the date of purchase.
The following is a summary of significant accounting policies followed in the Fund’s preparation of financial statements in accordance with accounting principles generally accepted in the United States (“U.S. GAAP”).
2. Significant Accounting Policies
Security Valuation. All investments in securities are recorded at their estimated fair value, as described in Note 3.
Basis for Consolidation. The Fund has established a Cayman Islands exempted company, Oppenheimer International Bond Fund (Cayman) Ltd., which is wholly-owned and controlled by the Fund (the “Subsidiary”). The Fund and Subsidiary are both managed by the Manager. The Fund may invest up to 25% of its total assets in the Subsidiary. The Subsidiary invests primarily in Regulation S securities. Regulation S securities are securities of U.S. and non—U.S. issuers that are issued through private offerings without registration with the Securities and Exchange Commission pursuant to Regulation S under the Securities Act of 1933. The Fund applies its investment restrictions and compliance policies and procedures, on a look-through
66 OPPENHEIMER INTERNATIONAL BOND FUND
2. Significant Accounting Policies (Continued)
basis, to the Subsidiary.
The financial statements have been consolidated and include accounts of the Fund and the Subsidiary. Accordingly, all inter-company transactions and balances have been eliminated. At period end, the Fund owned 679,450 shares with net assets of $66,784,390 in the Subsidiary.
Other financial information at period end:
| | | | |
| Total market value of investments | | $ | 48,705,584 | |
| Net assets | | $ | 66,784,390 | |
| Net income (loss) | | $ | 951,201 | |
Net realized gain (loss) | | $ | 1,951,944 | |
| Net change in unrealized appreciation/depreciation | | $ | (2,882,169 | ) |
Foreign Currency Translation. The books and records of the Fund are maintained in U.S. dollars. Any foreign currency amounts are translated into U.S. dollars on the following basis: (1) Value of investment securities, other assets and liabilities — at the exchange rates prevailing at market close as described in Note 3.
(2) Purchases and sales of investment securities, income and expenses — at the rates of exchange prevailing on the respective dates of such transactions.
Although the net assets and the values are presented at the foreign exchange rates at market close, the Fund does not isolate the portion of the results of operations resulting from changes in foreign exchange rates on investments from the fluctuations arising from changes in prices of securities held. Such fluctuations are included with the net realized and unrealized gains or losses from investments shown in the Consolidated Statement of Operations.
For securities, which are subject to foreign withholding tax upon disposition, realized and unrealized gains or losses on such securities are recorded net of foreign withholding tax.
Reported net realized foreign exchange gains or losses arise from sales of foreign currencies, currency gains or losses realized between the trade and settlement dates on securities transactions, the difference between the amounts of dividends, interest, and foreign withholding tax reclaims recorded on the Fund’s books, and the U.S. dollar equivalent of the amounts actually received or paid. Net unrealized foreign exchange gains and losses arise from changes in the value of assets and liabilities other than investments in securities, resulting from changes in the exchange rate.
Allocation of Income, Expenses, Gains and Losses. Income, expenses (other than those attributable to a specific class), gains and losses are allocated on a daily basis to each class of shares based upon the relative proportion of net assets represented by such class. Operating expenses directly attributable to a specific class are charged against the operations of that class.
Dividends and Distributions to Shareholders. Dividends and distributions to shareholders, which are determined in accordance with income tax regulations and may differ from U.S. GAAP, are recorded on the ex-dividend date. Income distributions, if any,
67 OPPENHEIMER INTERNATIONAL BOND FUND
NOTES TO
CONSOLIDATED FINANCIAL STATEMENTS Unaudited / Continued
2. Significant Accounting Policies (Continued)
are declared daily and paid monthly. Capital gain distributions, if any, are declared and paid annually or at other times as determined necessary by the Manager.
The tax character of distributions is determined as of the Fund’s fiscal year end. Therefore, a portion of the Fund’s distributions made to shareholders prior to the Fund’s fiscal year end may ultimately be categorized as a tax return of capital.
Investment Income. Dividend income is recorded on the ex-dividend date or upon ex-dividend notification in the case of certain foreign dividends where the ex-dividend date may have passed. Non-cash dividends included in dividend income, if any, are recorded at the fair value of the securities received. Withholding taxes on foreign dividends, if any, and capital gains taxes on foreign investments, if any, have been provided for in accordance with the Fund’s understanding of the applicable tax rules and regulations. Interest income, if any, is recognized on an accrual basis. Discount and premium, which are included in interest income on the Consolidated Statement of Operations, are amortized or accreted daily.
Custodian Fees. “Custodian fees and expenses” in the Consolidated Statement of Operations may include interest expense incurred by the Fund on any cash overdrafts of its custodian account during the period. Such cash overdrafts may result from the effects of failed trades in portfolio securities and from cash outflows resulting from unanticipated shareholder redemption activity. The Fund pays interest to its custodian on such cash overdrafts, to the extent they are not offset by positive cash balances maintained by the Fund, at a rate equal to the Federal Funds Rate plus 2.00%. The “Reduction to custodian expenses” line item, if applicable, represents earnings on cash balances maintained by the Fund during the period. Such interest expense and other custodian fees may be paid with these earnings.
Security Transactions. Security transactions are recorded on the trade date. Realized gains and losses on securities sold are determined on the basis of identified cost.
Indemnifications. The Fund’s organizational documents provide current and former Trustees and officers with a limited indemnification against liabilities arising in connection with the performance of their duties to the Fund. In the normal course of business, the Fund may also enter into contracts that provide general indemnifications. The Fund’s maximum exposure under these arrangements is unknown as this would be dependent on future claims that may be made against the Fund. The risk of material loss from such claims is considered remote.
Federal Taxes. The Fund intends to comply with provisions of the Internal Revenue Code applicable to regulated investment companies and to distribute substantially all of its investment company taxable income to shareholders. Therefore, no federal income or excise tax provision is required. The Fund files income tax returns in U.S. federal and applicable state jurisdictions. The statute of limitations on the Fund’s tax return filings generally remains open for the three preceding fiscal reporting period ends. The Fund has analyzed its tax positions for the fiscal year ended September 30, 2017, including open tax years, and does not believe
68 OPPENHEIMER INTERNATIONAL BOND FUND
2. Significant Accounting Policies (Continued)
there are any uncertain tax positions requiring recognition in the Fund’s financial statements.
Subchapter M requires, among other things, that at least 90% of the Fund’s gross income be derived from securities or derived with respect to its business of investing in securities (typically referred to as “qualifying income”). Income from commodity-linked derivatives may not be treated as “qualifying income” for purposes of the 90% gross income requirement.
The Internal Revenue Service (IRS) has previously issued a number of private letter rulings which conclude that income derived from commodity index-linked notes and investments in a wholly-owned subsidiary will be “qualifying income.” As a result, the Fund will gain exposure to commodities through commodity-linked notes and its wholly-owned subsidiary.
The IRS has suspended the granting of private letter rulings pending further review. As a result, there can be no assurance that the IRS will not change its position with respect to commodity-linked notes and wholly-owned subsidiaries. In addition, future legislation and guidance from the Treasury and the IRS may adversely affect the Fund’s ability to gain exposure to commodities through commodity-linked notes and its wholly-owned subsidiary.
The Fund is required to include in income for federal income tax purposes all of the subsidiary’s net income and gains whether or not such income is distributed by the subsidiary. Net income and gains from the subsidiary are generally treated as ordinary income by the Fund, regardless of the character of the subsidiary’s underlying income. Net losses from the subsidiary do not pass through to the Fund for federal income tax purposes.
During the fiscal year ended September 30, 2017, the Fund utilized $20,368,037 of capital loss carryforwards to offset capital gains realized in that fiscal year. The Fund had post-October foreign currency losses of $126,549,423 and straddle losses of $1,233,347 which were deferred. Details of the fiscal year ended September 30, 2017 capital loss carryforwards are included in the table below. Capital losses with no expiration will be carried forward to future years if not offset by gains.
| | | | |
| Expiring | | | |
| No expiration | | $ | 175,337,920 | |
At period end, it is estimated that the capital loss carryforwards would be $158,625,372, which will not expire. The estimated capital loss carryforward represents the carryforward as of the end of the last fiscal year, increased or decreased by capital losses or gains realized in the first six months of the current fiscal year. During the reporting period, it is estimated that the Fund will utilize $144,495,318 of capital loss carryforward to offset realized capital gains.
Net investment income (loss) and net realized gain (loss) may differ for financial statement and tax purposes. The character of dividends and distributions made during the fiscal year from net investment income or net realized gains are determined in accordance with federal income tax requirements, which may differ from the character of net investment income or net realized gains presented in those financial statements in accordance with U.S. GAAP. Also, due to timing of dividends and distributions, the fiscal year in which amounts are distributed may differ from the fiscal year in which the income or net realized gain was recorded by the Fund.
69 OPPENHEIMER INTERNATIONAL BOND FUND
NOTES TO
CONSOLIDATED FINANCIAL STATEMENTS Unaudited / Continued
2. Significant Accounting Policies (Continued)
The aggregate cost of securities and other investments and the composition of unrealized appreciation and depreciation of securities and other investments for federal income tax purposes at period end are noted in the following table. The primary difference between book and tax appreciation or depreciation of securities and other investments, if applicable, is attributable to the tax deferral of losses or tax realization of financial statement unrealized gain or loss.
| | | | |
Federal tax cost of securities | | $ | 5,871,839,591 | |
Federal tax cost of other investments | | | (188,876,278) | |
| | | | |
Total federal tax cost | | $ | 5,682,963,313 | |
| | | | |
Gross unrealized appreciation | | $ | 357,606,846 | |
Gross unrealized depreciation | | | (333,101,674) | |
| | | | |
Net unrealized appreciation | | $ | 24,505,172 | |
| | | | |
Use of Estimates. The preparation of financial statements in conformity with U.S. GAAP requires management to make estimates and assumptions that affect the reported amounts of assets and liabilities and disclosure of contingent assets and liabilities at the date of the financial statements and the reported amounts of increases and decreases in net assets from operations during the reporting period. Actual results could differ from those estimates.
3. Securities Valuation
The Fund calculates the net asset value of its shares as of 4:00 P.M. Eastern Time, on each day the New York Stock Exchange (the “Exchange”) is open for trading, except in the case of a scheduled early closing of the Exchange, in which case the Fund will calculate net asset value of the shares as of the scheduled early closing time of the Exchange.
The Fund’s Board has adopted procedures for the valuation of the Fund’s securities and has delegated the day-to-day responsibility for valuation determinations under those procedures to the Manager. The Manager has established a Valuation Committee which is responsible for determining a fair valuation for any security for which market quotations are not readily available. The Valuation Committee’s fair valuation determinations are subject to review, approval and ratification by the Fund’s Board at least quarterly or more frequently, if necessary.
Valuation Methods and Inputs
Securities are valued primarily using unadjusted quoted market prices, when available, as supplied by third party pricing services or broker-dealers.
The following methodologies are used to determine the market value or the fair value of the types of securities described below:
Equity securities traded on a securities exchange (including exchange-traded derivatives other than futures and futures options) are valued based on the official closing price on the principal exchange on which the security is traded, as identified by the Manager, prior to the time when the Fund’s assets are valued. If the official closing price is unavailable, the security
70 OPPENHEIMER INTERNATIONAL BOND FUND
3. Securities Valuation (Continued)
is valued at the last sale price on the principal exchange on which it is traded, or if no sales occurred, the security is valued at the mean between the quoted bid and asked prices. Over-the-counter equity securities are valued at the last published sale price, or if no sales occurred, at the mean between the quoted bid and asked prices. Events occurring after the close of trading on foreign exchanges may result in adjustments to the valuation of foreign securities to more accurately reflect their fair value as of the time when the Fund’s assets are valued.
Shares of a registered investment company that are not traded on an exchange are valued at that investment company’s net asset value per share.
Corporate and government debt securities (of U.S. or foreign issuers) and municipal debt securities, short-term notes, mortgage-backed securities, collateralized mortgage obligations, and asset-backed securities are valued at the mean between the bid and asked prices utilizing evaluated prices obtained from third party pricing services or broker-dealers who may use matrix pricing methods to determine the evaluated prices. Pricing services generally price debt securities assuming orderly transactions of an institutional “round lot” size, but some trades may occur in smaller, “odd lot” sizes, sometimes at lower prices than institutional round lot trades. Standard inputs generally considered by third-party pricing vendors include reported trade data, broker-dealer price quotations, benchmark yields, issuer spreads on comparable securities, the credit quality, yield, maturity, as well as other appropriate factors.
Structured securities, swaps, swaptions, and other over-the-counter derivatives are valued utilizing evaluated prices obtained from third party pricing services or broker-dealers. Standard inputs generally considered by third-party pricing vendors include market information relevant to the underlying reference asset such as the price of financial instruments, stock market indices, foreign currencies, interest rate spreads, commodities, credit spreads, credit event probabilities, index values, individual security values, forward interest rates, variable interest rates, volatility measures, and forward currency rates, or the occurrence of other specific events.
Forward foreign currency exchange contracts are valued utilizing current and forward currency rates obtained from third party pricing services. When the settlement date of a contract is an interim date for which a quotation is not available, interpolated values are derived using the nearest dated forward currency rate.
Futures contracts and futures options traded on a commodities or futures exchange will be valued at the final settlement price or official closing price on the principal exchange as reported by such principal exchange at its trading session ending at, or most recently prior to, the time when the Fund’s assets are valued.
Securities for which market quotations are not readily available, or when a significant event has occurred that would materially affect the value of the security, are fair valued either (i) by a standardized fair valuation methodology applicable to the security type or the significant event as previously approved by the Valuation Committee and the Fund’s Board or (ii) as determined in good faith by the Manager’s Valuation Committee. The Valuation Committee considers all relevant facts that are reasonably available, through either public information or information available to the Manager, when determining the fair value of a security. Those standardized fair valuation methodologies include, but are not limited to, valuing securities at
71 OPPENHEIMER INTERNATIONAL BOND FUND
NOTES TO
CONSOLIDATED FINANCIAL STATEMENTS Unaudited / Continued
3. Securities Valuation (Continued)
the last sale price or initially at cost and subsequently adjusting the value based on: changes in company specific fundamentals, changes in an appropriate securities index, or changes in the value of similar securities which may be further adjusted for any discounts related to security-specific resale restrictions. When possible, such methodologies use observable market inputs such as unadjusted quoted prices of similar securities, observable interest rates, currency rates and yield curves. The methodologies used for valuing securities are not necessarily an indication of the risks associated with investing in those securities nor can it be assured that the Fund can obtain the fair value assigned to a security if it were to sell the security.
To assess the continuing appropriateness of security valuations, the Manager regularly compares prior day prices and sale prices to the current day prices and challenges those prices exceeding certain tolerance levels with the third party pricing service or broker source. For those securities valued by fair valuations, whether through a standardized fair valuation methodology or a fair valuation determination, the Valuation Committee reviews and affirms the reasonableness of the valuations based on such methodologies and fair valuation determinations on a regular basis after considering all relevant information that is reasonably available.
Classifications
Each investment asset or liability of the Fund is assigned a level at measurement date based on the significance and source of the inputs to its valuation. Various data inputs may be used in determining the value of each of the Fund’s investments as of the reporting period end. These data inputs are categorized in the following hierarchy under applicable financial accounting standards:
1) Level 1-unadjusted quoted prices in active markets for identical assets or liabilities (including securities actively traded on a securities exchange)
2) Level 2-inputs other than unadjusted quoted prices that are observable for the asset or liability (such as unadjusted quoted prices for similar assets and market corroborated inputs such as interest rates, prepayment speeds, credit risks, etc.)
3) Level 3-significant unobservable inputs (including the Manager’s own judgments about assumptions that market participants would use in pricing the asset or liability).
The inputs used for valuing securities are not necessarily an indication of the risks associated with investing in those securities.
The Fund classifies each of its investments in investment companies which are publicly offered as Level 1. Investment companies that are not publicly offered, if any, are classified as Level 2 in the fair value hierarchy.
The table below categorizes amounts that are included in the Fund’s Consolidated Statement of Assets and Liabilities at period end based on valuation input level:
72 OPPENHEIMER INTERNATIONAL BOND FUND
3. Securities Valuation (Continued)
| | | | | | | | | | | | | | | | |
| | | Level 1—
Unadjusted
Quoted Prices | | | Level 2— Other Significant Observable Inputs | | | Level 3—
Significant
Unobservable
Inputs | | | Value | |
Assets Table | | | | | | | | | | | | | | | | |
| Investments, at Value: | | | | | | | | | | | | | | | | |
Mortgage-Backed Obligations | | $ | — | | | $ | 159,355,586 | | | $ | — | | | $ | 159,355,586 | |
Foreign Government Obligations | | | — | | | | 3,307,287,378 | | | | — | | | | 3,307,287,378 | |
Corporate Bonds and Notes | | | — | | | | 1,545,951,589 | | | | 179,134 | | | | 1,546,130,723 | |
Common Stock | | | — | | | | — | | | | — | | | | — | |
Structured Securities | | | — | | | | 11,357,604 | | | | — | | | | 11,357,604 | |
Short-Term Notes | | | — | | | | 190,947,828 | | | | — | | | | 190,947,828 | |
Over-the-Counter Options Purchased | | | — | | | | 13,491,308 | | | | — | | | | 13,491,308 | |
Over-the-Counter Credit Default | | | | | | | | | | | | | | | | |
Swaption Purchased | | | — | | | | 383,125 | | | | — | | | | 383,125 | |
Over-the-Counter Interest Rate | | | | | | | | | | | | | | | | |
Swaptions Purchased | | | — | | | | 125,901,493 | | | | — | | | | 125,901,493 | |
Investment Company | | | 563,447,343 | | | | — | | | | — | | | | 563,447,343 | |
| | | | |
Total Investments, at Value | | | 563,447,343 | | | | 5,354,675,911 | | | | 179,134 | | | | 5,918,302,388 | |
| Other Financial Instruments: | | | | | | | | | | | | | | | | |
Swaps, at value | | | — | | | | 5,859,635 | | | | — | | | | 5,859,635 | |
Centrally cleared swaps, at value | | | — | | | | 14,877,890 | | | | — | | | | 14,877,890 | |
Forward currency exchange contracts | | | — | | | | 25,286,638 | | | | — | | | | 25,286,638 | |
| | | | |
Total Assets | | $ | 563,447,343 | | | $ | 5,400,700,074 | | | $ | 179,134 | | | $ | 5,964,326,551 | |
| | | | |
| | | | |
Liabilities Table | | | | | | | | | | | | | | | | |
Other Financial Instruments: | | | | | | | | | | | | | | | | |
Swaps, at value | | $ | — | | | $ | (3,916,137 | ) | | $ | — | | | $ | (3,916,137) | |
Centrally cleared swaps, at value | | | — | | | | (34,646,247 | ) | | | — | | | | (34,646,247) | |
Options written, at value | | | — | | | | (67,742,178 | ) | | | — | | | | (67,742,178) | |
Futures contracts | | | (702,542 | ) | | | — | | | | — | | | | (702,542) | |
Forward currency exchange contracts | | | — | | | | (54,112,251 | ) | | | — | | | | (54,112,251) | |
Swaptions written, at value | | | — | | | | (65,031,617 | ) | | | — | | | | (65,031,617) | |
| | | | |
Total Liabilities | | $ | (702,542 | ) | | $ | (225,448,430 | ) | | $ | — | | | $ | (226,150,972) | |
| | | | |
Forward currency exchange contracts and futures contracts, if any, are reported at their unrealized appreciation/depreciation at measurement date, which represents the change in the contract’s value from trade date. All additional assets and liabilities included in the above table are reported at their market value at measurement date.
The table below shows the transfers between Level 2 and Level 3. The Fund’s policy is to recognize transfers in and transfers out as of the beginning of the reporting period.
| | | | | | | | |
| | | Transfers into Level
2* | | | Transfers out of
Level 3* | |
| Assets Table | | | | | | | | |
| Investments, at Value: | | | | | | | | |
| Foreign Government Obligations | | $ | 15,964,191 | | | $ | (15,964,191) | |
| Structured Securities | | | 1,090,112 | | | | (1,090,112) | |
| | | | |
| Total Assets | | $ | 17,054,303 | | | $ | (17,054,303) | |
| | | | |
73 OPPENHEIMER INTERNATIONAL BOND FUND
NOTES TO
CONSOLIDATED FINANCIAL STATEMENTS Unaudited / Continued
3. Securities Valuation (Continued)
| * | Transferred from Level 3 to Level 2 due to the availability of market data for this security. |
4. Investments and Risks
Risks of Foreign Investing. The Fund may invest in foreign securities which are subject to special risks. Securities traded in foreign markets may be less liquid and more volatile than those traded in U.S. markets. Foreign issuers are usually not subject to the same accounting and disclosure requirements that U.S. companies are subject to, which may make it difficult for the Fund to evaluate a foreign company’s operations or financial condition. A change in the value of a foreign currency against the U.S. dollar will result in a change in the U.S. dollar value of investments denominated in that foreign currency and in the value of any income or distributions the Fund may receive on those investments. The value of foreign investments may be affected by exchange control regulations, foreign taxes, higher transaction and other costs, delays in the settlement of transactions, changes in economic or monetary policy in the United States or abroad, expropriation or nationalization of a company’s assets, or other political and economic factors. In addition, due to the inter-relationship of global economies and financial markets, changes in political and economic factors in one country or region could adversely affect conditions in another country or region. Investments in foreign securities may also expose the Fund to time-zone arbitrage risk. Foreign securities may trade on weekends or other days when the Fund does not price its shares. At times, the Fund may emphasize investments in a particular country or region and may be subject to greater risks from adverse events that occur in that country or region. Foreign securities and foreign currencies held in foreign banks and securities depositories may be subject to limited or no regulatory oversight.
Investments in Affiliated Funds. The Fund is permitted to invest in other mutual funds advised by the Manager (“Affiliated Funds”). Affiliated Funds are open-end management investment companies registered under the 1940 Act, as amended. The Manager is the investment adviser of, and the Sub-Adviser provides investment and related advisory services to, the Affiliated Funds. When applicable, the Fund’s investments in Affiliated Funds are included in the Consolidated Statement of Investments. Shares of Affiliated Funds are valued at their net asset value per share. As a shareholder, the Fund is subject to its proportional share of the Affiliated Funds’ expenses, including their management fee. The Manager will waive fees and/or reimburse Fund expenses in an amount equal to the indirect management fees incurred through the Fund’s investment in the Affiliated Funds.
Each of the Affiliated Funds in which the Fund invests has its own investment risks, and those risks can affect the value of the Fund’s investments and therefore the value of the Fund’s shares. To the extent that the Fund invests more of its assets in one Affiliated Fund than in another, the Fund will have greater exposure to the risks of that Affiliated Fund.
Investments in Money Market Instruments. The Fund is permitted to invest its free cash balances in money market instruments to provide liquidity or for defensive purposes. The Fund may invest in money market instruments by investing in Class E shares of Oppenheimer
74 OPPENHEIMER INTERNATIONAL BOND FUND
4. Investments and Risks (Continued)
Institutional Government Money Market Fund (“IGMMF”), which is an Affiliated Fund. IGMMF is regulated as a money market fund under the 1940 Act, as amended. The Fund may also invest in money market instruments directly or in other affiliated or unaffiliated money market funds.
Structured Securities. The Fund invests in structured securities whose market values, interest rates and/or redemption prices are linked to the performance of underlying foreign currencies, interest rate spreads, stock market indices, prices of individual securities, commodities or other financial instruments or the occurrence of other specific events. The structured securities are often leveraged, increasing the volatility of each note’s market value relative to the change in the underlying linked financial element or event. Fluctuations in value of these securities are recorded as unrealized gains and losses in the accompanying Consolidated Statement of Operations. The Fund records a realized gain or loss when a structured security is sold or matures.
Securities on a When-Issued or Delayed Delivery Basis. The Fund may purchase securities on a “when-issued” basis, and may purchase or sell securities on a “delayed delivery” basis. “When-issued” or “delayed delivery” refers to securities whose terms and indenture are available and for which a market exists, but which are not available for immediate delivery. Delivery and payment for securities that have been purchased by the Fund on a when-issued basis normally takes place within six months and possibly as long as two years or more after the trade date. During this period, such securities do not earn interest, are subject to market fluctuation and may increase or decrease in value prior to their delivery. The purchase of securities on a when-issued basis may increase the volatility of the Fund’s net asset value to the extent the Fund executes such transactions while remaining substantially fully invested. When the Fund engages in when-issued or delayed delivery transactions, it relies on the buyer or seller, as the case may be, to complete the transaction. Their failure to do so may cause the Fund to lose the opportunity to obtain or dispose of the security at a price and yield it considers advantageous. The Fund may also sell securities that it purchased on a when-issued basis or forward commitment prior to settlement of the original purchase.
At period end, the Fund had purchased securities issued on a when-issued or delayed delivery basis as follows:
| | | | |
| | | When-Issued or
Delayed Delivery
Basis Transactions | |
Purchased securities | | | $6,455,000 | |
Restricted Securities. At period end, investments in securities included issues that are restricted. A restricted security may have a contractual restriction on its resale and is valued under methods approved by the Board of Trustees as reflecting fair value. Securities that are restricted are marked with an applicable footnote on the Consolidated Statement of
75 OPPENHEIMER INTERNATIONAL BOND FUND
NOTES TO
CONSOLIDATED FINANCIAL STATEMENTS Unaudited / Continued
4. Investments and Risks (Continued)
Investments. Restricted securities are reported on a schedule following the Consolidated Statement of Investments.
Equity Security Risk. Stocks and other equity securities fluctuate in price. The value of the Fund’s portfolio may be affected by changes in the equity markets generally. Equity markets may experience significant short-term volatility and may fall sharply at times. Different markets may behave differently from each other and U.S. equity markets may move in the opposite direction from one or more foreign stock markets. Adverse events in any part of the equity or fixed-income markets may have unexpected negative effects on other market segments.
The prices of individual equity securities generally do not all move in the same direction at the same time and a variety of factors can affect the price of a particular company’s securities. These factors may include, but are not limited to, poor earnings reports, a loss of customers, litigation against the company, general unfavorable performance of the company’s sector or industry, or changes in government regulations affecting the company or its industry.
Credit Risk. The Fund invests in high-yield, non-investment-grade bonds, which may be subject to a greater degree of credit risk. Credit risk relates to the ability of the issuer to meet interest or principal payments or both as they become due. The Fund may acquire securities that have missed an interest payment, and is not obligated to dispose of securities whose issuers or underlying obligors subsequently miss an interest and/or principal payment.
Information concerning securities not accruing interest at period end is as follows:
| | | | |
| Cost | | | $10,122,191 | |
| Market Value | | | $0 | |
| Market Value as % of Net Assets | | | 0.00% | |
Sovereign Debt Risk. The Fund invests in sovereign debt securities, which are subject to certain special risks. These risks include, but are not limited to, the risk that a governmental entity may delay or refuse, or otherwise be unable, to pay interest or repay the principal on its sovereign debt. There may also be no legal process for collecting sovereign debt that a government does not pay or bankruptcy proceedings through which all or part of such sovereign debt may be collected. In addition, a restructuring or default of sovereign debt may also cause additional impacts to the financial markets, such as downgrades to credit ratings, reduced liquidity and increased volatility, among others.
5. Market Risk Factors
The Fund’s investments in securities and/or financial derivatives may expose the Fund to various market risk factors:
Commodity Risk. Commodity risk relates to the change in value of commodities or commodity indexes as they relate to increases or decreases in the commodities market. Commodities are physical assets that have tangible properties. Examples of these types of assets are crude oil, heating oil, metals, livestock, and agricultural products.
76 �� OPPENHEIMER INTERNATIONAL BOND FUND
5. Market Risk Factors (Continued)
Credit Risk. Credit risk relates to the ability of the issuer of debt to meet interest and principal payments, or both, as they come due. In general, lower-grade, higher-yield debt securities are subject to credit risk to a greater extent than lower-yield, higher-quality securities.
Equity Risk. Equity risk relates to the change in value of equity securities as they relate to increases or decreases in the general market.
Foreign Exchange Rate Risk. Foreign exchange rate risk relates to the change in the U.S. dollar value of a security held that is denominated in a foreign currency. The U.S. dollar value of a foreign currency denominated security will decrease as the dollar appreciates against the currency, while the U.S. dollar value will increase as the dollar depreciates against the currency.
Interest Rate Risk. Interest rate risk refers to the fluctuations in value of fixed-income securities resulting from the inverse relationship between price and yield. For example, an increase in general interest rates will tend to reduce the market value of already issued fixed-income investments, and a decline in general interest rates will tend to increase their value. In addition, debt securities with longer maturities, which tend to have higher yields, are subject to potentially greater fluctuations in value from changes in interest rates than obligations with shorter maturities.
Volatility Risk. Volatility risk refers to the magnitude of the movement, but not the direction of the movement, in a financial instrument’s price over a defined time period. Large increases or decreases in a financial instrument’s price over a relative time period typically indicate greater volatility risk, while small increases or decreases in its price typically indicate lower volatility risk.
6. Use of Derivatives
The Fund’s investment objective not only permits the Fund to purchase investment securities, it also allows the Fund to enter into various types of derivatives contracts, including, but not limited to, futures contracts, forward currency exchange contracts, credit default swaps, interest rate swaps, total return swaps, variance swaps and purchased and written options. In doing so, the Fund will employ strategies in differing combinations to permit it to increase, decrease, or change the level or types of exposure to market risk factors. These instruments may allow the Fund to pursue its objectives more quickly and efficiently than if it were to make direct purchases or sales of securities capable of effecting a similar response to market factors. Such contracts may be entered into through a bilateral over-the-counter (“OTC”) transaction, or through a securities or futures exchange and cleared through a clearinghouse.
Derivatives may have little or no initial cash investment relative to their market value exposure and therefore can produce significant gains or losses in excess of their cost due to changes in the market risk factors and the overall market. This use of embedded leverage allows the Fund to increase its market value exposure relative to its net assets and can substantially increase the volatility of the Fund’s performance. In instances where the Fund is using derivatives to decrease, or hedge, exposures to market risk factors for securities held by
77 OPPENHEIMER INTERNATIONAL BOND FUND
NOTES TO
CONSOLIDATED FINANCIAL STATEMENTS Unaudited / Continued
6. Use of Derivatives (Continued)
the Fund, there are also risks that those derivatives may not perform as expected resulting in losses for the combined or hedged positions. Some derivatives have the potential for unlimited loss, regardless of the size of the Fund’s initial investment.
Additional associated risks from investing in derivatives also exist and potentially could have significant effects on the valuation of the derivative and the Fund. Typically, the associated risks are not the risks that the Fund is attempting to increase or decrease exposure to, per its investment objectives, but are the additional risks from investing in derivatives.
Examples of these associated risks are liquidity risk, which is the risk that the Fund will not be able to sell the derivative in the open market in a timely manner, and counterparty credit risk, which is the risk that the counterparty will not fulfill its obligation to the Fund.
The Fund’s actual exposures to these market risk factors and associated risks during the period are discussed in further detail, by derivative type, below.
Forward Currency Exchange Contracts
The Fund may enter into forward currency exchange contracts (“forward contracts”) for the purchase or sale of a foreign currency at a negotiated rate at a future date. Such contracts are traded in the OTC inter-bank currency dealer market.
Forward contracts are reported on a schedule following the Consolidated Statement of Investments. The unrealized appreciation (depreciation) is reported in the Consolidated Statement of Assets and Liabilities as a receivable (or payable) and in the Consolidated Statement of Operations within the change in unrealized appreciation (depreciation). At contract close, the difference between the original cost of the contract and the value at the close date is recorded as a realized gain (loss) in the Consolidated Statement of Operations.
The Fund may enter into forward foreign currency exchange contracts in order to decrease exposure to foreign exchange rate risk associated with either specific transactions or portfolio instruments or to increase exposure to foreign exchange rate risk.
During the reporting period, the Fund had daily average contract amounts on forward contracts to buy and sell of $4,590,919,362 and $5,230,245,157, respectively.
Additional associated risk to the Fund includes counterparty credit risk. Counterparty credit risk arises from the possibility that the counterparty to a forward contract will default and fail to perform its obligations to the Fund.
Futures Contracts
A futures contract is a commitment to buy or sell a specific amount of a commodity, financial instrument or currency at a negotiated price on a stipulated future date. The Fund may buy and sell futures contracts and may also buy or write put or call options on these futures contracts. Futures contracts and options thereon are generally entered into on a regulated futures exchange and cleared through a clearinghouse associated with the exchange.
Upon entering into a futures contract, the Fund is required to deposit either cash or securities (initial margin) in an amount equal to a certain percentage of the contract value in an account registered in the futures commission merchant’s name. Subsequent payments (variation margin) are paid to or from the futures commission merchant each day equal to
78 OPPENHEIMER INTERNATIONAL BOND FUND
6. Use of Derivatives (Continued)
the daily changes in the contract value. Such payments are recorded as unrealized gains and losses. Should the Fund fail to make requested variation margin payments, the futures commission merchant can gain access to the initial margin to satisfy the Fund’s payment obligations.
Futures contracts are reported on a schedule following the Consolidated Statement of Investments. Securities held by a futures commission merchant to cover initial margin requirements on open futures contracts are noted in the Consolidated Statement of Investments. Cash held by a futures commission merchant to cover initial margin requirements on open futures contracts and the receivable and/or payable for the daily mark to market for the variation margin are noted in the Consolidated Statement of Assets and Liabilities. The net change in unrealized appreciation and depreciation is reported in the Consolidated Statement of Operations. Realized gains (losses) are reported in the Consolidated Statement of Operations at the closing or expiration of futures contracts.
The Fund may purchase and/or sell financial futures contracts and options on futures contracts to gain exposure to, or decrease exposure to interest rate risk, equity risk, foreign exchange rate risk, volatility risk, or commodity risk.
During the reporting period, the Fund had an ending monthly average market value of $145,616,932 on futures contracts sold.
Additional associated risks of entering into futures contracts (and related options) include the possibility that there may be an illiquid market where the Fund is unable to liquidate the contract or enter into an offsetting position and, if used for hedging purposes, the risk that the price of the contract will correlate imperfectly with the prices of the Fund’s securities.
Option Activity
The Fund may buy and sell put and call options, or write put and call options. When an option is written, the Fund receives a premium and becomes obligated to sell or purchase the underlying security, currency or other underlying financial instrument at a fixed price, upon exercise of the option.
Options can be traded through an exchange or through a privately negotiated arrangement with a dealer in an OTC transaction. Options traded through an exchange are generally cleared through a clearinghouse (such as The Options Clearing Corporation). The difference between the premium received or paid, and market value of the option, is recorded as unrealized appreciation or depreciation. The net change in unrealized appreciation or depreciation is reported in the Consolidated Statement of Operations. When an option is exercised, the cost of the security purchased or the proceeds of the security sale are adjusted by the amount of premium received or paid. Upon the expiration or closing of the option transaction, a gain or loss is reported in the Consolidated Statement of Operations.
Foreign Currency Options. The Fund may purchase or write call and put options on currencies to increase or decrease exposure to foreign exchange rate risk. A purchased call, or written put option becomes more valuable as the price of the underlying financial instrument appreciates relative to the strike price. A purchased put, or written call option becomes more valuable as the price of the underlying financial instrument depreciates relative to the strike
79 OPPENHEIMER INTERNATIONAL BOND FUND
NOTES TO
CONSOLIDATED FINANCIAL STATEMENTS Unaudited / Continued
6. Use of Derivatives (Continued)
price.
Interest Rate Options. The Fund may purchase or write call and put options on treasury and/or euro futures to increase or decrease exposure to interest rate risk. A purchased call or written put option becomes more valuable as the price of the underlying financial instrument appreciates relative to the strike price. A purchased put or written call option becomes more valuable as the price of the underlying financial instrument depreciates relative to the strike price.
Index/Security Options. The Fund may purchase or write call and put options on individual equity securities and/or equity indexes to increase or decrease exposure to equity risk. A purchased call or written put option becomes more valuable as the price of the underlying financial instrument appreciates relative to the strike price. A purchased put or written call option becomes more valuable as the price of the underlying financial instrument depreciates relative to the strike price.
During the reporting period, the Fund had an ending monthly average market value of $11,272,981 and $7,909,120 on purchased call options and purchased put options, respectively.
Options written, if any, are reported in a schedule following the Consolidated Statement of Investments and as a liability in the Consolidated Statement of Assets and Liabilities. Securities held in collateral accounts to cover potential obligations with respect to outstanding written options are noted in the Consolidated Statement of Investments.
The risk in writing a call option is the market price of the underlying security increasing above the strike price and the option being exercised. The Fund must then purchase the underlying security at the higher market price and deliver it for the strike price or, if it owns the underlying security, deliver it at the strike price and forego any benefit from the increase in the price of the underlying security above the strike price. The risk in writing a put option is the market price of the underlying security decreasing below the strike price and the option being exercised. The Fund must then purchase the underlying security at the strike price when the market price of the underlying security is below the strike price. Alternatively, the Fund could also close out a written option position, in which case the risk is that the closing transaction will require a premium to be paid by the Fund that is greater than the premium the Fund received. When writing options, the Fund has the additional risk that there may be an illiquid market where the Fund is unable to close the contract. The risk in buying an option is that the Fund pays a premium for the option, and the option may be worth less than the premium paid or expire worthless.
During the reporting period, the Fund had an ending monthly average market value of $17,210,904 and $39,226,359 on written call options and written put options, respectively.
Additional associated risks to the Fund include counterparty credit risk and liquidity risk.
Swap Contracts
The Fund may enter into swap contract agreements with a counterparty to exchange a series of cash flows based on either specified reference rates, the price or volatility of asset or non-asset references, or the occurrence of a credit event, over a specified period. Swaps can be
80 OPPENHEIMER INTERNATIONAL BOND FUND
6. Use of Derivatives (Continued)
executed in a bi-lateral privately negotiated arrangement with a dealer in an OTC transaction (“OTC swaps”) or executed on a regulated market. Certain swaps, regardless of the venue of their execution, are required to be cleared through a clearinghouse (“centrally cleared swaps”). Swap contracts may include interest rate, equity, debt, index, total return, credit default, currency, and volatility swaps.
Swap contracts are reported on a schedule following the Consolidated Statement of Investments. The values of centrally cleared swap and OTC swap contracts are aggregated by positive and negative values and disclosed separately on the Consolidated Statement of Assets and Liabilities. The unrealized appreciation (depreciation) related to the change in the valuation of the notional amount of the swap is combined with the accrued interest due to (owed by) the Fund, if any, at termination or settlement. The net change in this amount during the period is included on the Consolidated Statement of Operations. The Fund also records any periodic payments received from (paid to) the counterparty, including at termination, under such contracts as realized gain (loss) on the Consolidated Statement of Operations.
Swap contract agreements are exposed to the market risk factor of the specific underlying reference rate or asset. Swap contracts are typically more attractively priced compared to similar investments in related cash securities because they isolate the risk to one market risk factor and eliminate the other market risk factors. Investments in cash securities (for instance bonds) have exposure to multiple risk factors (credit and interest rate risk). Because swaps have embedded leverage, they can expose the Fund to substantial risk in the isolated market risk factor.
Credit Default Swap Contracts. A credit default swap is a contract that enables an investor to buy or sell protection against a defined-issuer credit event, such as the issuer’s failure to make timely payments of interest or principal on a debt security, bankruptcy or restructuring. The Fund may enter into credit default swaps either by buying or selling protection on a corporate issuer, sovereign issuer, or a basket or index of issuers (the “reference asset”).
The buyer of protection pays a periodic fee to the seller of protection based on the notional amount of the swap contract. The seller of protection agrees to compensate the buyer of protection for future potential losses as a result of a credit event on the reference asset. The contract effectively transfers the credit event risk of the reference asset from the buyer of protection to the seller of protection.
The ongoing value of the contract will fluctuate throughout the term of the contract based primarily on the credit risk of the reference asset. If the credit quality of the reference asset improves relative to the credit quality at contract initiation, the buyer of protection may have an unrealized loss greater than the anticipated periodic fee owed. This unrealized loss would be the result of current credit protection being cheaper than the cost of credit protection at contract initiation. If the buyer elects to terminate the contract prior to its maturity, and there has been no credit event, this unrealized loss will become realized. If the contract is held to maturity, and there has been no credit event, the realized loss will be equal to the periodic fee paid over the life of the contract.
If there is a credit event, the buyer of protection can exercise its rights under the contract
81 OPPENHEIMER INTERNATIONAL BOND FUND
NOTES TO
CONSOLIDATED FINANCIAL STATEMENTS Unaudited / Continued
6. Use of Derivatives (Continued)
and receive a payment from the seller of protection equal to the notional amount of the swap less the market value of specified debt securities issued by the reference asset.
Upon exercise of the contract the difference between such value and the notional amount is recorded as realized gain (loss) and is included on the Consolidated Statement of Operations.
The Fund may purchase or sell credit protection through credit default swaps to increase or decrease exposure to the credit risk of individual issuers and/or indexes of issuers that are either unavailable or considered to be less attractive in the bond market.
The Fund has engaged in spread curve trades by simultaneously purchasing and selling protection through credit default swaps referenced to the same reference asset but with different maturities. Spread curve trades attempt to gain exposure to credit risk on a forward basis by realizing gains on the expected differences in spreads.
For the reporting period, the Fund had ending monthly average notional amounts of $429,271,819 and $165,849,281 on credit default swaps to buy protection and credit default swaps to sell protection, respectively.
Additional associated risks to the Fund include counterparty credit risk and liquidity risk.
Interest Rate Swap Contracts. An interest rate swap is an agreement between counterparties to exchange periodic payments based on interest rates. One cash flow stream will typically be a floating rate payment based upon a specified floating interest rate while the other is typically a fixed interest rate.
The Fund may enter into interest rate swaps in which it pays the fixed or floating interest rate in order to increase or decrease exposure to interest rate risk. Typically, if relative interest rates rise, floating payments under a swap agreement will be greater than the fixed payments.
For the reporting period, the Fund had ending monthly average notional amounts of $1,173,491,567 and $2,575,409,058 on interest rate swaps which pay a fixed rate and interest rate swaps which receive a fixed rate, respectively.
Additional associated risks to the Fund include counterparty credit risk and liquidity risk.
Total Return Swap Contracts. A total return swap is an agreement between counterparties to exchange periodic payments based on the value of asset or non-asset references. One cash flow is typically based on a non-asset reference (such as an interest rate) and the other on the total return of a reference asset (such as a security or a basket of securities or securities index). The total return of the reference asset typically includes appreciation or depreciation on the reference asset, plus any interest or dividend payments.
Total return swap contracts are exposed to the market risk factor of the specific underlying financial instrument or index. Total return swaps are less standard in structure than other types of swaps and can isolate and/or include multiple types of market risk factors including equity risk, credit risk, and interest rate risk.
The Fund may enter into total return swaps to increase or decrease exposure to the credit risk of various indexes or basket of securities. These credit risk related total return swaps require the Fund to pay to, or receive payments from, the counterparty based on the movement of credit spreads of the related indexes or securities.
82 OPPENHEIMER INTERNATIONAL BOND FUND
6. Use of Derivatives (Continued)
For the reporting period, the Fund had ending monthly average notional amounts of $26,366,785 on total return swaps which are long the reference asset.
Additional associated risks to the Fund include counterparty credit risk and liquidity risk.
Swaption Transactions
The Fund may enter into a swaption contract which grants the purchaser the right, but not the obligation, to enter into a swap transaction at preset terms detailed in the underlying agreement within a specified period of time. The purchaser pays a premium to the swaption writer who bears the risk of unfavorable changes in the preset terms on the underlying swap.
Purchased swaptions are reported as a component of investments in the Consolidated Statement of Investments and the Consolidated Statement of Assets and Liabilities. Written swaptions are reported on a schedule following the Consolidated Statement of Investments and their value is reported as a separate asset or liability line item in the Consolidated Statement of Assets and Liabilities. The net change in unrealized appreciation or depreciation on written swaptions is separately reported in the Consolidated Statement of Operations. When a swaption is exercised, the cost of the swap is adjusted by the amount of premium paid or received. Upon the expiration or closing of an unexercised swaption contract, a gain or loss is reported in the Consolidated Statement of Operations for the amount of the premium paid or received.
The Fund generally will incur a greater risk when it writes a swaption than when it purchases a swaption. When the Fund writes a swaption it will become obligated, upon exercise of the swaption, according to the terms of the underlying agreement. Swaption contracts written by the Fund do not give rise to counterparty credit risk prior to exercise as they obligate the Fund, not its counterparty, to perform. When the Fund purchases a swaption it only risks losing the amount of the premium it paid if the swaption expires unexercised. However, when the Fund exercises a purchased swaption there is a risk that the counterparty will fail to perform or otherwise default on its obligations under the swaption contract.
The Fund may purchase swaptions which give it the option to enter into an interest rate swap in which it pays a floating or fixed interest rate and receives a fixed or floating interest rate in order to increase or decrease exposure to interest rate risk. Purchasing the fixed portion of this swaption becomes more valuable as the reference interest rate decreases relative to the preset interest rate. Purchasing the floating portion of this swaption becomes more valuable as the reference interest rate increases relative to the preset interest rate.
The Fund may purchase swaptions which give it the option to buy or sell credit protection through credit default swaps in order to decrease or increase exposure to the credit risk of individual issuers and/ or indexes of issuers. A swaption selling protection becomes more valuable as the likelihood of a credit event on the reference asset decreases. A swaption buying protection becomes more valuable as the likelihood of a credit event on the reference asset increases.
The Fund may write swaptions which give it the obligation, if exercised by the purchaser, to enter into an interest rate swap in which it pays a fixed or floating interest rate and receives a floating or fixed interest rate in order to increase or decrease exposure to interest rate
83 OPPENHEIMER INTERNATIONAL BOND FUND
NOTES TO
CONSOLIDATED FINANCIAL STATEMENTS Unaudited / Continued
6. Use of Derivatives (Continued)
risk. A written swaption paying a fixed rate becomes more valuable as the reference interest rate increases relative to the preset interest rate. A written swaption paying a floating rate becomes more valuable as the reference interest rate decreases relative to the preset interest rate.
The Fund may write swaptions which give it the obligation, if exercised by the purchaser, to sell or buy credit protection through credit default swaps in order to increase or decrease exposure to the credit risk of individual issuers and/or indexes of issuers. A written swaption selling protection becomes more valuable as the likelihood of a credit event on the reference asset decreases. A written swaption buying protection becomes more valuable as the likelihood of a credit event on the reference asset increases.
During the reporting period, the Fund had an ending monthly average market value of $133,653,862 and $73,964,238 on purchased and written swaptions, respectively.
Counterparty Credit Risk. Derivative positions are subject to the risk that the counterparty will not fulfill its obligation to the Fund. The Fund intends to enter into derivative transactions with counterparties that the Manager believes to be creditworthy at the time of the transaction.
The Fund’s risk of loss from counterparty credit risk on OTC derivatives is generally limited to the aggregate unrealized gain netted against any collateral held by the Fund. For OTC options purchased, the Fund bears the risk of loss of the amount of the premiums paid plus the positive change in market values net of any collateral held by the Fund should the counterparty fail to perform under the contracts. Options written by the Fund do not typically give rise to counterparty credit risk, as options written generally obligate the Fund and not the counterparty to perform.
To reduce counterparty risk with respect to OTC transactions, the Fund has entered into master netting arrangements, established within the Fund’s International Swap and Derivatives Association, Inc. (“ISDA”) master agreements, which allow the Fund to make (or to have an entitlement to receive) a single net payment in the event of default (close-out netting) for outstanding payables and receivables with respect to certain OTC positions in swaps, options, swaptions, and forward currency exchange contracts for each individual counterparty. In addition, the Fund may require that certain counterparties post cash and/or securities in collateral accounts to cover their net payment obligations for those derivative contracts subject to ISDA master agreements. If the counterparty fails to perform under these contracts and agreements, the cash and/or securities will be made available to the Fund.
At period end, the Fund has required certain counterparties to post collateral of $153,615.
ISDA master agreements include credit related contingent features which allow counterparties to OTC derivatives to terminate derivative contracts prior to maturity in the event that, for example, the Fund’s net assets decline by a stated percentage or the Fund fails to meet the terms of its ISDA master agreements, which would cause the Fund to accelerate payment of any net liability owed to the counterparty.
For financial reporting purposes, the Fund does not offset derivative assets and derivative liabilities that are subject to netting arrangements in the Consolidated Statement of
84 OPPENHEIMER INTERNATIONAL BOND FUND
6. Use of Derivatives (Continued)
Assets and Liabilities. Bankruptcy or insolvency laws of a particular jurisdiction may impose restrictions on or prohibitions against the right of offset in bankruptcy, insolvency or other events.
The Fund’s risk of loss from counterparty credit risk on exchange-traded derivatives cleared through a clearinghouse and for centrally cleared swaps is generally considered lower than as compared to OTC derivatives. However, counterparty credit risk exists with respect to initial and variation margin deposited/paid by the Fund that is held in futures commission merchant, broker and/or clearinghouse accounts for such exchange-traded derivatives and for centrally cleared swaps.
With respect to centrally cleared swaps, such transactions will be submitted for clearing, and if cleared, will be held in accounts at futures commission merchants or brokers that are members of clearinghouses. While brokers, futures commission merchants and clearinghouses are required to segregate customer margin from their own assets, in the event that a broker, futures commission merchant or clearinghouse becomes insolvent or goes into bankruptcy and at that time there is a shortfall in the aggregate amount of margin held by the broker, futures commission merchant or clearinghouse for all its customers, U.S. bankruptcy laws will typically allocate that shortfall on a pro-rata basis across all the broker’s, futures commission merchant’s or clearinghouse’s customers, potentially resulting in losses to the Fund.
There is the risk that a broker, futures commission merchant or clearinghouse will decline to clear a transaction on the Fund’s behalf, and the Fund may be required to pay a termination fee to the executing broker with whom the Fund initially enters into the transaction. Clearinghouses may also be permitted to terminate centrally cleared swaps at any time. The Fund is also subject to the risk that the broker or futures commission merchant will improperly use the Fund’s assets deposited/paid as initial or variation margin to satisfy payment obligations of another customer. In the event of a default by another customer of the broker or futures commission merchant, the Fund might not receive its variation margin payments from the clearinghouse, due to the manner in which variation margin payments are aggregated for all customers of the broker/futures commission merchant.
Collateral and margin requirements differ by type of derivative. Margin requirements are established by the broker, futures commission merchant or clearinghouse for exchange-traded and cleared derivatives, including centrally cleared swaps. Brokers, futures commission merchants and clearinghouses can ask for margin in excess of the regulatory minimum, or increase the margin amount, in certain circumstances.
Collateral terms are contract specific for OTC derivatives. For derivatives traded under an ISDA master agreement, the collateral requirements are typically calculated by netting the mark to market amount for each transaction under such agreement and comparing that amount to the value of any collateral currently pledged by the Fund or the counterparty.
For financial reporting purposes, cash collateral that has been pledged to cover obligations of the Fund, if any, is reported separately on the Consolidated Statement of Assets and Liabilities as cash pledged as collateral. Non-cash collateral pledged by the Fund, if any, is noted in the Consolidated Statement of Investments. Generally, the amount of collateral due from or to a party must exceed a minimum transfer amount threshold (e.g. $250,000) before
85 OPPENHEIMER INTERNATIONAL BOND FUND
NOTES TO
CONSOLIDATED FINANCIAL STATEMENTS Unaudited / Continued
6. Use of Derivatives (Continued)
a transfer has to be made. To the extent amounts due to the Fund from its counterparties are not fully collateralized, contractually or otherwise, the Fund bears the risk of loss from counterparty nonperformance.
The following table presents by counterparty the Fund’s OTC derivative assets net of the related collateral pledged by the Fund at period end:
| | | | | | | | | | | | | | | | | | | | |
| | | | | | Gross Amounts Not Offset in the Consolidated
Statement of Assets & Liabilities | | | | |
| Counterparty | | Gross Amounts
Not Offset in the
Consolidated
Statement of Assets &
Liabilities* | | | Financial
Instruments
Available for
Offset | | | Financial
Instruments
Collateral
Received** | | | Cash Collateral
Received** | | | Net Amount | |
Banco Santander SA | | $ | 185,079 | | | $ | – | | | $ | – | | | $ | (90,000) | | | $ | 95,079 | |
Bank of America NA | | | 31,929,100 | | | | (31,929,100) | | | | – | | | | – | | | | – | |
Barclays Bank plc | | | 3,125,373 | | | | (3,125,373) | | | | – | | | | – | | | | – | |
BNP Paribas | | | 191,369 | | | | (191,369) | | | | – | | | | – | | | | – | |
Citibank NA | | | 830,245 | | | | (830,245) | | | | – | | | | – | | | | – | |
Deutsche Bank AG | | | 476,518 | | | | (291,735) | | | | (63,615) | | | | – | | | | 121,168 | |
Goldman Sachs Bank | | | | | | | | | | | | | | | | | | | | |
USA | | | 10,864,482 | | | | (10,864,482) | | | | – | | | | – | | | | – | |
Goldman Sachs | | | | | | | | | | | | | | | | | | | | |
International | | | 22,886,406 | | | | (13,973,141) | | | | – | | | | – | | | | 8,913,265 | |
HSBC Bank USA NA | | | 229,207 | | | | (229,207) | | | | – | | | | – | | | | – | |
JPMorgan Chase Bank | | | | | | | | | | | | | | | | | | | | |
NA | | | 92,875,993 | | | | (72,672,282) | | | | – | | | | – | | | | 20,203,711 | |
Toronto Dominion | | | | | | | | | | | | | | | | | | | | |
Bank | | | 7,328,427 | | | | (6,501,481) | | | | – | | | | – | | | | 826,946 | |
| | | | |
| | $ | 170,922,199 | | | $ | (140,608,415) | | | $ | (63,615) | | | $ | (90,000) | | | $ | 30,160,169 | |
| | | | |
*OTC derivatives are reported gross on the Consolidated Statement of Assets and Liabilities. Exchange traded options and margin related to centrally cleared swaps and futures, if any, are excluded from these reported amounts.
**Reported collateral posted for the benefit of the Fund within this table is limited to the net outstanding amount due from an individual counterparty. The collateral posted for the benefit of the Fund may exceed these amounts.
The following table presents by counterparty the Fund’s OTC derivative liabilities net of the related collateral pledged by the Fund at period end:
| | | | | | | | | | | | | | | | | | | | |
| | | | | | Gross Amounts Not Offset in the Consolidated
Statement of Assets & Liabilities | | | | |
| Counterparty | | Gross Amounts
Not Offset in the
Consolidated
Statement of Assets &
Liabilities* | | | Financial
Instruments
Available for
Offset | | | Financial
Instruments
Collateral
Pledged** | | | Cash Collateral
Pledged** | | | Net Amount | |
Bank of America NA | | $ | (48,986,760) | | | $ | 31,929,100 | | | $ | 14,001,915 | | | $ | 3,055,745 | | | $ | – | |
Barclays Bank plc | | | (3,221,469) | | | | 3,125,373 | | | | 96,096 | | | | – | | | | – | |
BNP Paribas | | | (273,472) | | | | 191,369 | | | | – | | | | – | | | | (82,103) | |
Citibank NA | | | (9,517,599) | | | | 830,245 | | | | 7,024,379 | | | | 530,000 | | | | (1,132,975) | |
86 OPPENHEIMER INTERNATIONAL BOND FUND
6. Use of Derivatives (Continued)
| | | | | | | | | | | | | | | | | | | | |
| | | | | | Gross Amounts Not Offset in the Consolidated
Statement of Assets & Liabilities | | | | |
| Counterparty | | Gross Amounts
Not Offset in the
Consolidated
Statement of Assets &
Liabilities* | | | Financial
Instruments
Available for
Offset | | | Financial
Instruments
Collateral
Pledged** | | | Cash Collateral
Pledged** | | | Net
Amount | |
Deutsche Bank AG | | $ | (291,735) | | | $ | 291,735 | | | $ | – | | | $ | – | | | $ | – | |
Goldman Sachs Bank | | | | | | | | | | | | | | | | | | | | |
USA | | | (33,735,078) | | | | 10,864,482 | | | | 11,891,014 | | | | 10,979,582 | | | | – | |
Goldman Sachs | | | | | | | | | | | | | | | | | | | | |
International | | | (13,973,141) | | | | 13,973,141 | | | | – | | | | – | | | | – | |
HSBC Bank USA, NA | | | (1,629,166) | | | | 229,207 | | | | 1,251,791 | | | | – | | | | (148,168) | |
JPMorgan Chase Bank | | | | | | | | | | | | | | | | | | | | |
NA | | | (72,672,282) | | | | 72,672,282 | | | | – | | | | – | | | | – | |
Toronto Dominion | | | | | | | | | | | | | | | | | | | | |
Bank | | | (6,501,481) | | | | 6,501,481 | | | | – | | | | – | | | | – | |
| | | | |
| | $ | (190,802,183) | | | $ | 140,608,415 | | | $ | 34,265,195 | | | $ | 14,565,327 | | | $ | (1,363,246) | |
| | | | |
*OTC derivatives are reported gross on the Consolidated Statement of Assets and Liabilities. Exchange traded options and margin related to centrally cleared swaps and futures, if any, are excluded from these reported amounts.
**Reported collateral pledged within this table is limited to the net outstanding amount due from the Fund. The securities pledged as collateral by the Fund as reported on the Consolidated Statements of Investments may exceed these amounts.
The following table presents the valuations of derivative instruments by risk exposure as reported within the Consolidated Statement of Assets and Liabilities at period end:
| | | | | | | | | | | | | | |
| | | Asset Derivatives | | | | | Liability Derivatives | |
Derivatives
Not Accounted
for as Hedging
Instruments | | Consolidated
Statement of Assets
and Liabilities Location | | Value | | | | | Consolidated
Statement of Assets
and Liabilities Location | | Value | |
| Credit contracts | | Swaps, at value | | $ | 495,664 | | | | | Swaps, at value | | $ | 2,410,555 | |
| Equity contracts | | Swaps, at value | | | 393,664 | | | | | | | | | |
| Interest rate contracts | | Swaps, at value | | | 4,970,307 | | | | | Swaps, at value | | | 1,505,582 | |
| Credit contracts | | Centrally cleared swaps, at value | | | 3,036,635 | | | | | Centrally cleared swaps, at value | | | 17,981,961 | |
| Interest rate contracts | | Centrally cleared swaps, at value | | | 11,841,255 | | | | | Centrally cleared swaps, at value | | | 16,664,286 | |
| Interest rate contracts | | | | | | | | | | Variation margin payable | | | 53,503* | |
| Forward currency exchange contracts | | Unrealized appreciation on forward currency exchange contracts | | | 25,286,638 | | | | | Unrealized depreciation on forward currency exchange contracts | | | 54,112,251 | |
| Forward currency exchange contracts | | | | | | | | | | Options written, at value | | | 64,205,938 | |
| Interest rate contracts | | | | | | | | | | Options written, at value | | | 3,536,240 | |
| Credit contracts | | | | | | | | | | Swaptions written, at value | | | 992,029 | |
| Interest rate contracts | | | | | | | | | | Swaptions written, at value | | | 64,039,588 | |
| Credit contracts | | Investments, at value | | | 383,125** | | | | | | | | | |
87 OPPENHEIMER INTERNATIONAL BOND FUND
NOTES TO
CONSOLIDATED FINANCIAL STATEMENTS Unaudited / Continued
6. Use of Derivatives (Continued)
| | | | | | | | | | | | | | |
| | | Asset Derivatives | | | | | Liability Derivatives | |
Derivatives
Not Accounted
for as Hedging
Instruments | | Consolidated
Statement of Assets
and Liabilities Location | | Value | | | | | Consolidated Statement of Assets and Liabilities Location | | Value | |
| Forward currency | | | | | | | | | | | | | | |
| exchange contracts | | Investments, at value | | $ | 13,491,308** | | | | | | | | | |
| Interest rate contracts | | Investments, at value | | | 125,901,493** | | | | | | | | | |
| | | | | | | | | | | | | | |
| Total | | | | $ | 185,800,089 | | | | | | | $ | 225,501,933 | |
| | | | | | | | | | | | | | |
*Includes only the current day’s variation margin. Prior variation margin movements have been reflected in cash on the Consolidated Statement of Assets and Liabilities upon receipt or payment.
**Amounts relate to purchased option contracts and purchased swaption contracts, if any.
The effect of derivative instruments on the Consolidated Statement of Operations is as follows:
| | | | | | | | | | | | | | | | |
| Amount of Realized Gain or (Loss) Recognized on Derivatives | |
Derivatives Not Accounted for as Hedging Instruments | | Investment
transactions in unaffiliated
companies* | | | Swaption contracts written | | | Option
contracts
written | | | Futures
contracts | |
| Credit contracts | | $ | (356,387 | ) | | $ | 2,167,625 | | | $ | — | | | $ | — | |
| Equity contracts | | | (2,000,590 | ) | | | — | | | | — | | | | — | |
| Forward currency exchange contracts | | | (12,054,026 | ) | | | — | | | | 23,175,936 | | | | — | |
| Interest rate contracts | | | 21,198,624 | | | | (1,073,679 | ) | | | (3,044,864 | ) | | | (828,987) | |
| | | | |
| Total | | $ | 6,787,621 | | | $ | 1,093,946 | | | $ | 20,131,072 | | | $ | (828,987) | |
| | | | |
|
| Amount of Realized Gain or (Loss) Recognized on Derivatives (Continued) | |
Derivatives Not Accounted for as Hedging Instruments | | | | | Forward
currency
exchange
contracts | | | Swap contracts | | | Total | |
| Credit contracts | | | | | | $ | — | | | $ | 2,478,802 | | | $ | 4,290,040 | |
| Equity contracts | | | | | | | — | | | | — | | | | (2,000,590) | |
| Forward currency exchange contracts | | | | | | | 16,072,934 | | | | — | | | | 27,194,844 | |
| Interest rate contracts | | | | | | | — | | | | (6,716,042 | ) | | | 9,535,052 | |
| | | | | | | | |
| Total | | | | | | $ | 16,072,934 | | | $ | (4,237,240 | ) | | $ | 39,019,346 | |
| | | | | | | | |
| | |
| *Includes purchased option contracts and purchased swaption contracts, if any. | | | | | | | | | |
|
| Amount of Change in Unrealized Gain or (Loss) Recognized on Derivatives | |
Derivatives Not Accounted for as Hedging Instruments | | Investment
transactions in unaffiliated
companies* | | | Option
contracts
written | | | Swaption contracts written | | | Futures
contracts | |
| Credit contracts | | $ | (426,869 | ) | | $ | — | | | $ | 578,363 | | | $ | — | |
| Forward currency exchange contracts | | | (6,973,433 | ) | | | 367,577 | | | | — | | | | — | |
| Interest rate contracts | | | (114,677,621 | ) | | | (2,212,091 | ) | | | 4,538,928 | | | | (871,405) | |
| | | | |
| Total | | $ | (122,077,923 | ) | | $ | (1,844,514 | ) | | $ | 5,117,291 | | | $ | (871,405) | |
| | | | |
88 OPPENHEIMER INTERNATIONAL BOND FUND
6. Use of Derivatives (Continued)
| | | | | | | | | | | | | | | | |
|
| Amount of Change in Unrealized Gain or (Loss) Recognized on Derivatives (Continued) | |
Derivatives Not Accounted for as Hedging Instruments | | | | | Forward
currency
exchange
contracts | | | Swap contracts | | | Total | |
| Credit contracts | | | | | | $ | — | | | $ | (5,682,748 | ) | | $ | (5,531,254) | |
| Forward currency exchange contracts | | | | | | | (21,484,267 | ) | | | — | | | | (28,090,123) | |
| Interest rate contracts | | | | | | | — | | | | 2,688,304 | | | | (110,533,885) | |
| | | | | | | | |
| Total | | | | | | $ | (21,484,267 | ) | | $ | (2,994,444 | ) | | $ | (144,155,262) | |
| | | | | | | | |
*Includes purchased option contracts and purchased swaption contracts, if any.
7. Shares of Beneficial Interest
The Fund has authorized an unlimited number of $0.001 par value shares of beneficial interest of each class. Transactions in shares of beneficial interest were as follows:
| | | | | | | | | | | | | | | | |
| | | Six Months Ended March 31, 2018 | | | Year Ended September 30, 2017 | |
| | | Shares | | | Amount | | | Shares | | | Amount | |
Class A | | | | | | | | | | | | | | | | |
Sold | | | 22,094,776 | | | $ | 132,535,015 | | | | 33,215,903 | | | $ | 192,596,948 | |
Dividends and/or distributions reinvested | | | 4,101,394 | | | | 24,595,451 | | | | 10,118,544 | | | | 58,513,744 | |
Redeemed | | | (31,540,650 | ) | | | (188,838,803 | ) | | | (99,000,839 | ) | | | (572,327,683) | |
| | | | |
Net decrease | | | (5,344,480 | ) | | $ | (31,708,337) | | | | (55,666,392 | ) | | $ | (321,216,991) | |
| | | | |
| | | | | | | | | | | | | | | | | |
Class B | | | | | | | | | | | | | | | | |
Sold | | | 4,825 | | | $ | 28,792 | | | | 49,514 | | | $ | 288,493 | |
Dividends and/or distributions reinvested | | | 10,738 | | | | 64,000 | | | | 69,721 | | | | 400,047 | |
Redeemed | | | (742,369 | ) | | | (4,426,451 | ) | | | (2,132,370 | ) | | | (12,283,079) | |
| | | | |
Net decrease | | | (726,806 | ) | | $ | (4,333,659 | ) | | | (2,013,135 | ) | | $ | (11,594,539) | |
| | | | |
| | | | | | | | | | | | | | | | | |
Class C | | | | | | | | | | | | | | | | |
Sold | | | 3,563,029 | | | $ | 21,303,934 | | | | 3,277,871 | | | $ | 18,916,038 | |
Dividends and/or distributions reinvested | | | 955,438 | | | | 5,706,811 | | | | 2,356,675 | | | | 13,573,517 | |
Redeemed | | | (7,852,469 | ) | | | (46,869,409 | ) | | | (26,515,697 | ) | | | (152,572,012) | |
| | | | |
Net decrease | | | (3,334,002 | ) | | $ | (19,858,664 | ) | | | (20,881,151 | ) | | $ | (120,082,457) | |
| | | | |
| | | | | | | | | | | | | | | | | |
Class I | | | | | | | | | | | | | | | | |
Sold | | | 56,176,539 | | | $ | 338,077,839 | | | | 47,001,372 | | | $ | 271,989,516 | |
Dividends and/or distributions reinvested | | | 4,504,881 | | | | 26,978,140 | | | | 11,314,777 | | | | 65,348,110 | |
Redeemed | | | (41,365,973 | ) | | | (247,015,055 | ) | | | (131,938,102 | ) | | | (756,543,141) | |
| | | | |
Net increase (decrease) | | | 19,315,447 | | | $ | 118,040,924 | | | | (73,621,953 | ) | | $ | (419,205,515) | |
| | | | |
89 OPPENHEIMER INTERNATIONAL BOND FUND
NOTES TO
CONSOLIDATED FINANCIAL STATEMENTS Unaudited / Continued
7. Shares of Beneficial Interest (Continued)
| | | | | | | | | | | | | | | | |
| | | Six Months Ended March 31, 2018 | | | Year Ended September 30, 2017 | |
| | | Shares | | | Amount | | | Shares | | | Amount | |
Class R | | | | | | | | | | | | | | | | |
Sold | | | 2,026,718 | | | $ | 12,129,469 | | | | 3,635,144 | | | $ | 20,971,449 | |
Dividends and/or distributions reinvested | | | 401,695 | | | | 2,401,474 | | | | 947,336 | | | | 5,465,034 | |
Redeemed | | | (3,189,247 | ) | | | (19,034,893 | ) | | | (7,177,948 | ) | | | (41,342,243) | |
| | | | |
Net decrease | | | (760,834 | ) | | $ | (4,503,950) | | | | (2,595,468 | ) | | $ | (14,905,760) | |
| | | | |
| | | | | | | | | | | | | | | | | |
Class Y | | | | | | | | | | | | | | | | |
Sold | | | 104,952,794 | | | $ | 630,584,358 | | | | 129,553,202 | | | $ | 752,409,177 | |
Dividends and/or distributions reinvested | | | 8,598,476 | | | | 51,567,317 | | | | 16,240,485 | | | | 94,081,754 | |
Redeemed | | | (47,702,523 | ) | | | (285,278,911 | ) | | | (99,816,640 | ) | | | (576,274,909) | |
| | | | |
Net increase | | | 65,848,747 | | | $ | 396,872,764 | | | | 45,977,047 | | | $ | 270,216,022 | |
| | | | |
8. Purchases and Sales of Securities
The aggregate cost of purchases and proceeds from sales of securities, other than short-term obligations and investments in IGMMF, for the reporting period were as follows:
| | | | | | | | | | |
| | | Purchases | | | | | Sales | |
| Investment securities | | $ | 2,636,436,011 | | | | | $ | 2,577,295,297 | |
| U.S. government and government agency obligations | | | 113,260,286 | | | | | | 113,694,053 | |
9. Fees and Other Transactions with Affiliates
Management Fees. Under the investment advisory agreement, the Fund pays the Manager a management fee based on the daily net assets of the Fund at an annual rate as shown in the following table:
| | |
| Fee Schedule | | |
| Up to $200 million | | 0.75% |
| Next $200 million | | 0.72 |
| Next $200 million | | 0.69 |
| Next $200 million | | 0.66 |
| Next $200 million | | 0.60 |
| Next $4 billion | | 0.50 |
| Next $10 billion | | 0.48 |
| Over $15 billion | | 0.45 |
The Manager also provides investment management related services to the Subsidiary. The Subsidiary pays the Manager a monthly management fee at an annual rate according to the above schedule. The Subsidiary also pays certain other expenses including custody and directors’ fees.
The Fund’s effective management fee for the reporting period was 0.53% of average annual net assets before any Subsidiary management fees or any applicable waivers.
Sub-Adviser Fees. The Manager has retained the Sub-Adviser to provide the day-to-day portfolio management of the Fund and the Subsidiary. Under the Sub-Advisory Agreement, the
90 OPPENHEIMER INTERNATIONAL BOND FUND
9. Fees and Other Transactions with Affiliates (Continued)
Manager pays the Sub-Adviser an annual fee in monthly installments, equal to a percentage of the investment management fee collected by the Manager from the Fund and the Subsidiary, which shall be calculated after any investment management fee waivers. The fee paid to the Sub-Adviser is paid by the Manager, not by the Fund.
Transfer Agent Fees. OFI Global (the “Transfer Agent”) serves as the transfer and shareholder servicing agent for the Fund. The Fund pays the Transfer Agent a fee based on annual net assets, which shall be calculated after any applicable fee waivers. Fees incurred and average net assets for each class with respect to these services are detailed in the Consolidated Statement of Operations and Consolidated Financial Highlights, respectively.
Sub-Transfer Agent Fees. The Transfer Agent has retained Shareholder Services, Inc., a wholly-owned subsidiary of OFI (the “Sub-Transfer Agent”), to provide the day-to-day transfer agent and shareholder servicing of the Fund. Under the Sub-Transfer Agency Agreement, the Transfer Agent pays the Sub-Transfer Agent an annual fee in monthly installments, equal to a percentage of the transfer agent fee collected by the Transfer Agent from the Fund, which shall be calculated after any applicable fee waivers. The fee paid to the Sub-Transfer Agent is paid by the Transfer Agent, not by the Fund.
Trustees’ Compensation. The Fund’s Board of Trustees (“Board”) has adopted a compensation deferral plan for Independent Trustees that enables Trustees to elect to defer receipt of all or a portion of the annual compensation they are entitled to receive from the Fund. For purposes of determining the amount owed to the Trustees under the plan, deferred amounts are treated as though equal dollar amounts had been invested in shares of the Fund or in other Oppenheimer funds selected by the Trustees. The Fund purchases shares of the funds selected for deferral by the Trustees in amounts equal to his or her deemed investment, resulting in a Fund asset equal to the deferred compensation liability. Such assets are included as a component of “Other” within the asset section of the Consolidated Statement of Assets and Liabilities. Deferral of Trustees’ fees under the plan will not affect the net assets of the Fund and will not materially affect the Fund’s assets, liabilities or net investment income per share. Amounts will be deferred until distributed in accordance with the compensation deferral plan.
Distribution and Service Plan (12b-1) Fees. Under its General Distributor’s Agreement with the Fund, OppenheimerFunds Distributor, Inc. (the “Distributor”) acts as the Fund’s principal underwriter in the continuous public offering of the Fund’s classes of shares.
Service Plan for Class A Shares. The Fund has adopted a Service Plan (the “Plan”) for Class A shares pursuant to Rule 12b-1 under the 1940 Act. Under the Plan, the Fund reimburses the Distributor for a portion of its costs incurred for services provided to accounts that hold Class A shares. Reimbursement is made periodically at an annual rate of up to 0.25% of the daily net assets of Class A shares of the Fund. The Distributor currently uses all
91 OPPENHEIMER INTERNATIONAL BOND FUND
NOTES TO
CONSOLIDATED FINANCIAL STATEMENTS Unaudited / Continued
9. Fees and Other Transactions with Affiliates (Continued)
of those fees to pay dealers, brokers, banks and other financial institutions periodically for providing personal service and maintenance of accounts of their customers that hold Class A shares. Any unreimbursed expenses the Distributor incurs with respect to Class A shares in any fiscal year cannot be recovered in subsequent periods. Fees incurred by the Fund under the Plan are detailed in the Consolidated Statement of Operations.
Distribution and Service Plans for Class B, Class C and Class R Shares. The Fund has adopted Distribution and Service Plans (the “Plans”) for Class B, Class C and Class R shares pursuant to Rule 12b-1 under the 1940 Act to compensate the Distributor for distributing those share classes, maintaining accounts and providing shareholder services. Under the Plans, the Fund pays the Distributor an annual asset-based sales charge of 0.75% on Class B and Class C shares’ daily net assets and 0.25% on Class R shares’ daily net assets. The Fund also pays a service fee under the Plans at an annual rate of 0.25% of daily net assets. The Plans continue in effect from year to year only if the Fund’s Board of Trustees votes annually to approve their continuance at an in person meeting called for that purpose. Fees incurred by the Fund under the Plans are detailed in the Consolidated Statement of Operations.
Sales Charges. Front-end sales charges and CDSC do not represent expenses of the Fund. They are deducted from the proceeds of sales of Fund shares prior to investment or from redemption proceeds prior to remittance, as applicable. The sales charges retained by the Distributor from the sale of shares and the CDSC retained by the Distributor on the redemption of shares is shown in the following table for the period indicated.
| | | | | | | | | | | | | | | | | | | | |
| | | | | | Class A | | | Class B | | | Class C | | | Class R | |
| | | Class A | | | Contingent | | | Contingent | | | Contingent | | | Contingent | |
| | | Front-End | | | Deferred | | | Deferred | | | Deferred | | | Deferred | |
| | | Sales Charges | | | Sales Charges | | | Sales Charges | | | Sales Charges | | | Sales Charges | |
| | | Retained by | | | Retained by | | | Retained by | | | Retained by | | | Retained by | |
| Six Months Ended | | Distributor | | | Distributor | | | Distributor | | | Distributor | | | Distributor | |
| March 31, 2018 | | | $77,796 | | | | $1,591 | | | | $2,791 | | | | $5,187 | | | | $— | |
Waivers and Reimbursements of Expenses. The Manager has contractually agreed to waive the management fee it receives from the Fund in an amount equal to the management fee it receives from the Subsidiary. During the reporting period, the Manager waived $376,842. This fee waiver and/or expense reimbursement may not be amended or withdrawn for one year from the date of the Fund’s prospectus, unless approved by the Board.
Effective for the period January 1, 2017 through December 31, 2017, the Transfer Agent voluntarily waived and/or reimbursed Fund expenses in an amount equal to 0.015% of average annual net assets for Classes A, B, C, R and Y.
During the reporting period, the Transfer Agent waived fees and/or reimbursed the Fund for transfer agent and shareholder servicing agent fees as follows:
92 OPPENHEIMER INTERNATIONAL BOND FUND
9. Fees and Other Transactions with Affiliates (Continued)
| | | | |
| Class A | | $ | 47,689 | |
| Class B | | | 185 | |
| Class C | | | 13,715 | |
| Class R | | | 4,868 | |
| Class Y | | | 88,986 | |
The Manager will waive fees and/or reimburse Fund expenses in an amount equal to the indirect management fees incurred through the Fund’s investment in IGMMF. During the reporting period, the Manager waived fees and/or reimbursed the Fund $135,528 for IGMMF management fees. This fee waiver and/or expense reimbursement may not be amended or withdrawn for one year from the date of the Fund’s prospectus, unless approved by the Board.
Cross-Trades. The Fund is permitted to purchase and sell securities from and to other Funds managed by the Manager (“cross-trade”) pursuant to “Cross-Trading” Procedures adopted by the Fund’s Board of Trustees. These procedures are designed to ensure that any cross-trade of securities between Funds or between a Fund and another account or private fund that is an affiliate of the Fund solely by virtue of having a common investment adviser, common trustee/ director or common officer complies with Rule 17a-7 under the 1940 Act. Further, as defined under these procedures, each cross-trade is effected at the current market price.
During the period, the Fund had $165,272,085 in purchases and $37,170,960 in sales considered cross-trades, resulting in $2,056,019 of realized gain/(loss).
10. Borrowings and Other Financing
Joint Credit Facility. A number of mutual funds managed by the Manager participate in a $1.875 billion revolving credit facility (the “Facility”) intended to provide short-term financing, if necessary, subject to certain restrictions in connection with atypical redemption activity. Expenses and fees related to the Facility are paid by the participating funds and are disclosed separately or as other expenses on the Consolidated Statement of Operations. The Fund did not utilize the Facility during the reporting period.
93 OPPENHEIMER INTERNATIONAL BOND FUND
PORTFOLIO PROXY VOTING POLICIES AND GUIDELINES;
UPDATES TO STATEMENT OF INVESTMENTS Unaudited
The Fund has adopted Portfolio Proxy Voting Policies and Guidelines under which the Fund votes proxies relating to securities (“portfolio proxies”) held by the Fund. A description of the Fund’s Portfolio Proxy Voting Policies and Guidelines is available (i) without charge, upon request, by calling the Fund toll-free at 1.800.CALL OPP (225.5677), (ii) on the Fund’s website at www.oppenheimerfunds.com, and (iii) on the SEC’s website at www.sec.gov. In addition, the Fund is required to file Form N-PX, with its complete proxy voting record for the 12 months ended June 30th, no later than August 31st of each year. The Fund’s voting record is available (i) without charge, upon request, by calling the Fund toll-free at 1.800.CALL OPP (225.5677), and (ii) in the Form N-PX filing on the SEC’s website at www.sec.gov.
The Fund files its complete schedule of portfolio holdings with the SEC for the first quarter and the third quarter of each fiscal year on Form N-Q. The Fund’s Form N-Q filings are available on the SEC’s website at www.sec.gov. Those forms may be reviewed and copied at the SEC’s Public Reference Room in Washington, D.C. Information on the operation of the Public Reference Room may be obtained by calling 1-800-SEC-0330.
Householding—Delivery of Shareholder Documents
This is to inform you about OppenheimerFunds’ “householding” policy. If more than one member of your household maintains an account in a particular fund, OppenheimerFunds will mail only one copy of the fund’s prospectus (or, if available, the fund’s summary prospectus), annual and semiannual report and privacy policy. The consolidation of these mailings, called householding, benefits your fund through reduced mailing expense, and benefits you by reducing the volume of mail you receive from OppenheimerFunds. Householding does not affect the delivery of your account statements.
Please note that we will continue to household these mailings for as long as you remain an OppenheimerFunds shareholder, unless you request otherwise. If you prefer to receive multiple copies of these materials, please call us at 1.800.CALL-OPP (225-5677). You may also notify us in writing or via email. We will begin sending you individual copies of the prospectus (or, if available, the summary prospectus), reports and privacy policy within 30 days of receiving your request to stop householding.
94 OPPENHEIMER INTERNATIONAL BOND FUND
OPPENHEIMER INTERNATIONAL BOND FUND
| | |
| Trustees and Officers | | Robert J. Malone, Chairman of the Board of Trustees and Trustee |
| | Andrew J. Donohue, Trustee |
| | Richard F. Grabish, Trustee |
| | Beverly L. Hamilton, Trustee |
| | Victoria J. Herget, Trustee |
| | F. William Marshall, Jr., Trustee |
| | Karen L. Stuckey, Trustee |
| | James D. Vaughn, Trustee |
| | Arthur P. Steinmetz, Trustee, President and Principal Executive Officer |
| | Hemant Baijal, Vice President |
| | Chris Kelly, Vice President |
| | Wim Vandenhoeck, Vice President |
| | Cynthia Lo Bessette, Secretary and Chief Legal Officer |
| | Jennifer Foxson, Vice President and Chief Business Officer |
| | Mary Ann Picciotto, Chief Compliance Officer and Chief Anti-Money |
| | Laundering Officer |
| | Brian S. Petersen, Treasurer and Principal Financial & Accounting Officer |
| |
| Manager | | OFI Global Asset Management, Inc. |
| |
| Sub-Adviser | | OppenheimerFunds, Inc. |
| |
| Distributor | | OppenheimerFunds Distributor, Inc. |
| |
| Transfer and Shareholder | | OFI Global Asset Management, Inc. |
| Servicing Agent | | |
| |
| Sub-Transfer Agent | | Shareholder Services, Inc. |
| | DBA OppenheimerFunds Services |
| |
| Independent Registered | | KPMG LLP |
| Public Accounting Firm | | |
| |
| Legal Counsel | | Ropes & Gray LLP |
| |
| | The financial statements included herein have been taken from the records of the Fund without examination of those records by the independent registered public accounting firm. |
©2018 OppenheimerFunds, Inc. All rights reserved.
95 OPPENHEIMER INTERNATIONAL BOND FUND
PRIVACY NOTICE
As an Oppenheimer fund shareholder, you are entitled to know how we protect your personal information and how we limit its disclosure.
Information Sources
We obtain non-public personal information about our shareholders from the following sources:
| ● | | Applications or other forms. |
| ● | | When you create a user ID and password for online account access. |
| ● | | When you enroll in eDocs Direct,SM our electronic document delivery service. |
| ● | | Your transactions with us, our affiliates or others. |
| ● | | Technologies on our website, including: “cookies” and web beacons, which are used to collect data on the pages you visit and the features you use. |
If you visit oppenheimerfunds.com and do not log on to the secure account information areas, we do not obtain any personal information about you. When you do log on to a secure area, we do obtain your user ID and password to identify you. We also use this information to provide you with products and services you have requested, to inform you about products and services that you may be interested in and assist you in other ways.
We do not collect personal information through our website unless you willingly provide it to us, either directly by email or in those areas of the website that request information. In order to update your personal information (including your mailing address, email address and phone number) you must first log on and visit your user profile.
If you have set your browser to warn you before accepting cookies, you will receive the warning message with each cookie. You can refuse cookies by turning them off in your browser. However, doing so may limit your access to certain sections of our website.
We use cookies to help us improve and manage our website. For example, cookies help us recognize new versus repeat visitors to the site, track the pages visited, and enable some special features on the website. This data helps us provide better service for our website visitors.
Protection of Information
We do not disclose any non-public personal information (such as names on a customer list) about current or former customers to anyone, except as permitted by law.
Disclosure of Information
Copies of confirmations, account statements and other documents reporting activity in your fund accounts are made available to your financial advisor (as designated by you). We may also use details about you and your investments to help us, our financial service affiliates, or firms that jointly market their financial products and services with ours, to better serve your investment needs or suggest educational material that may be of interest to you. If this requires us to provide you with an opportunity to “opt in” or “opt out” of such information sharing with a firm not affiliated with us, you will receive notification on how to do so, before any such sharing takes place.
Right of Refusal
We will not disclose your personal information to unaffiliated third parties (except as permitted by law), unless we first offer you a reasonable opportunity to refuse or “opt out” of such disclosure.
96 OPPENHEIMER INTERNATIONAL BOND FUND
Internet Security and Encryption
In general, the email services provided by our website are encrypted and provide a secure and private means of communication with us. To protect your own privacy, confidential and/ or personal information should only be communicated via email when you are advised that you are using a secure website.
As a security measure, we do not include personal or account information in non-secure emails, and we advise you not to send such information to us in non-secure emails. Instead, you may take advantage of the secure features of our website to encrypt your email correspondence. To do this, you will need to use a browser that supports Secure Sockets Layer (SSL) protocol.
| ● | | All transactions conducted via our websites, including redemptions, exchanges and purchases, are secured by the highest encryption standards available. SSL is used to establish a secure connection between your PC and OppenheimerFunds’ server. It transmits information in an encrypted and scrambled format. |
| ● | | Encryption is achieved through an electronic scrambling technology that uses a “key” to code and then decode the data. Encryption acts like the cable converter box you may have on your television set. It scrambles data with a secret code so that no one can make sense of it while it is being transmitted. When the data reaches its destination, the same software unscrambles the data. |
| ● | | You can exit the secure area by closing your browser or, for added security, you can use the Log Out button before you close your browser. |
Other Security Measures
We maintain physical, electronic and procedural safeguards to protect your personal account information. Our employees and agents have access to that information only so that they may offer you products or provide services, for example, when responding to your account questions.
How You Can Help
You can also do your part to keep your account information private and to prevent unauthorized transactions. If you obtain a user ID and password for your account, safeguard that information. Strengthening your online credentials–your online security profile–typically your user name, password, and security questions and answers, can be one of your most important lines of defense on the
Internet. For additional information on how you can help prevent identity theft, visit https://www. oppenheimerfunds.com/security.
Who We Are
This joint notice describes the privacy policies of the Oppenheimer funds, OppenheimerFunds, Inc., each of its investment adviser subsidiaries, OppenheimerFunds Distributor, Inc. and OFI Global Trust Co. It applies to all Oppenheimer fund accounts you presently have, or may open in the future, using your Social Security number—whether or not you remain a shareholder of our funds. This notice was last updated as of November 2017. In the event it is updated or changed, we will post an updated notice on our website at oppenheimerfunds.com. If you have any questions about this privacy policy, email us by clicking on the Contact Us section of our website at oppenheimerfunds.com, write to us at P.O. Box 5270, Denver, CO 80217-5270, or call us at 800 CALL OPP (225 5677).
97 OPPENHEIMER INTERNATIONAL BOND FUND
THIS PAGE INTENTIONALLY LEFT BLANK.
98 OPPENHEIMER INTERNATIONAL BOND FUND
THIS PAGE INTENTIONALLY LEFT BLANK.
99 OPPENHEIMER INTERNATIONAL BOND FUND
THIS PAGE INTENTIONALLY LEFT BLANK.
100 OPPENHEIMER INTERNATIONAL BOND FUND
THIS PAGE INTENTIONALLY LEFT BLANK.
101 OPPENHEIMER INTERNATIONAL BOND FUND
THIS PAGE INTENTIONALLY LEFT BLANK.
102 OPPENHEIMER INTERNATIONAL BOND FUND
THIS PAGE INTENTIONALLY LEFT BLANK.
103 OPPENHEIMER INTERNATIONAL BOND FUND
| | | | |
| | 
Visit us at oppenheimerfunds.com for 24-hr access to account information and transactions or call us at 800.CALL OPP (800.225.5677) for 24-hr automated information and automated transactions. Representatives also available Mon–Fri 8am-8pm ET. | | |
Visit Us oppenheimerfunds.com Call Us 800 225 5677 Follow Us | | | | |
 | | Oppenheimer funds are distributed by OppenheimerFunds Distributor, Inc. 225 Liberty Street, New York, NY 10281-1008 © 2018 OppenheimerFunds Distributor, Inc. All rights reserved. RS0880.001.0318 May 25, 2018 | | |
Item 2. Code of Ethics.
Not applicable to semiannual reports.
Item 3. Audit Committee Financial Expert.
Not applicable to semiannual reports.
Item 4. Principal Accountant Fees and Services.
Not applicable to semiannual reports.
Item 5. Audit Committee of Listed Registrants
Not applicable.
Item 6. Schedule of Investments.
a) Not applicable. The complete schedule of investments is included in Item 1 of this Form N-CSR.
b) Not applicable.
Item 7. Disclosure of Proxy Voting Policies and Procedures for Closed-End Management Investment Companies.
Not applicable.
Item 8. Portfolio Managers of Closed-End Management Investment Companies.
Not applicable.
Item 9. Purchases of Equity Securities by Closed-End Management Investment Company and Affiliated Purchasers.
Not applicable.
Item 10. Submission of Matters to a Vote of Security Holders.
The Fund’s Governance Committee Provisions with Respect to Nominations of Directors/Trustees to the Respective Boards
None
Item 11. Controls and Procedures.
Based on their evaluation of the registrant’s disclosure controls and procedures (as defined in rule 30a-3(c) under the Investment Company Act of 1940 (17 CFR 270.30a-3(c)) as of 3/31/2018, the registrant’s principal executive officer and principal financial officer found the registrant’s disclosure controls and procedures to provide reasonable assurances that information required to be disclosed by the registrant in the reports that it files under the Securities Exchange Act of 1934 (a) is accumulated and communicated to registrant’s management, including its principal executive officer and principal financial officer, to allow timely decisions regarding required disclosure, and (b) is recorded, processed, summarized and reported, within the time periods specified in the rules and forms adopted by the U.S. Securities and Exchange Commission.
There have been no changes in the registrant’s internal controls over financial reporting that occurred during the registrant’s second fiscal quarter of the period covered by this report that have materially affected, or are reasonably likely to materially affect, the registrant’s internal control over financial reporting.
Item 12. Disclosure of Securities Lending Activities for Closed-End Management Investment Companies.
Not applicable.
Item 13. Exhibits.
(a) (1) Exhibit attached hereto.
(2) Exhibits attached hereto.
SIGNATURES
Pursuant to the requirements of the Securities Exchange Act of 1934 and the Investment Company Act of 1940, the registrant has duly caused this report to be signed on its behalf by the undersigned, thereunto duly authorized.
Oppenheimer International Bond Fund
| | |
| By: | | /s/ Arthur P. Steinmetz |
| | | Arthur P. Steinmetz |
| | | Principal Executive Officer |
| Date: | | 5/18/2018 |
Pursuant to the requirements of the Securities Exchange Act of 1934 and the Investment Company Act of 1940, this report has been signed below by the following persons on behalf of the registrant and in the capacities and on the dates indicated.
| | |
| By: | | /s/ Arthur P. Steinmetz |
| | | Arthur P. Steinmetz |
| | | Principal Executive Officer |
| Date: | | 5/18/2018 |
| By: | | /s/ Brian S. Petersen |
| | | Brian S. Petersen |
| | | Principal Financial Officer |
| Date: | | 5/18/2018 |