UNITED STATES
SECURITIES AND EXCHANGE COMMISSION
WASHINGTON, D.C. 20549
FORMN-CSR
CERTIFIED SHAREHOLDER REPORT OF REGISTERED MANAGEMENT
INVESTMENT COMPANIES
Investment Company Act file number811-07255
Oppenheimer International Bond Fund
(Exact name of registrant as specified in charter)
6803 South Tucson Way, Centennial, Colorado 80112-3924
(Address of principal executive offices) (Zip code)
Cynthia Lo Bessette
OFI Global Asset Management, Inc.
225 Liberty Street, New York, New York 10281-1008
(Name and address of agent for service)
Registrant’s telephone number, including area code:(303)768-3200
Date of fiscal year end:September 30
Date of reporting period:3/31/2019
Item 1. Reports to Stockholders.
Semiannual Report 3/31/2019 Important Notice: The Securities and Exchange Commission will permit funds to deliver shareholder reports electronically beginning January 1, 2021. At that time, OppenheimerFunds will send a notice, either by mail or email, each time your fund’s updated report is available on our website (oppenheimerfunds.com). Investors enrolled in electronic delivery will receive the notice by email, with links to the updated report. Investors who are not enrolled in electronic delivery by January 1, 2021 will receive the notice in the mail. All investors who prefer to receive shareholder reports in paper may, at any time, choose that option free of charge by calling 1.800.225.5677.
Important Updates
On October 18, 2018, Massachusetts Mutual Life Insurance Company, an indirect corporate parent of OppenheimerFunds, Inc. and its subsidiaries OFI Global Asset Management, Inc., OFI SteelPath, Inc. and OFI Advisors, LLC, announced that it has entered into an agreement whereby Invesco Ltd., a global investment management company, will acquire OppenheimerFunds, Inc. As of the date of this report, the transaction is expected to close in the second quarter of 2019, pending necessary regulatory and other third-party approvals. This is subject to change.
Update to Shareholder Report Document Delivery
Beginning January 1, 2021, OppenheimerFunds will send a notice, either by mail or email, each time your fund’s updated report is available on our website (oppenheimerfunds.com). Investors who are not enrolled in electronic delivery by January 1, 2021 will receive the notice in the mail. Enrolling in electronic delivery will enable you to receive a direct link to your full shareholder report the moment it becomes available, and limit the amount of mail you receive. All investors who prefer to receive shareholder reports in paper may, at any time, choose that option.
How do you update your delivery preferences?
If you own these shares through a financial intermediary, you may contact your financial intermediary.
If your accounts are held through OppenheimerFunds and you receive statements, confirms, and other documents directly from us, you can enroll in our eDocs DirectSM service atoppenheimerfunds.com or by calling us. Once you’re enrolled, you’ll begin to receive email notifications of updated documents when they become available. If you have any questions, feel free to call us at1.800.225.5677.
Table of Contents
Class A Shares
AVERAGE ANNUAL TOTAL RETURNS AT 3/31/19
| | | | | | | | | | | | | | | | |
| | | 6-Month | | | 1-Year | | | 5-Year | | | 10-Year | |
Class A Shares of the Fund without Sales Charge | | | 2.93 | % | | | -5.04 | % | | | 1.82 | % | | | 4.11 | % |
Class A Shares of the Fund with Sales Charge | | | -1.96 | | | | -9.55 | | | | 0.83 | | | | 3.60 | |
FTSENon-U.S. Dollar World Government Bond Index | | | 2.85 | | | | -4.55 | | | | -0.06 | | | | 2.02 | |
JP Morgan Government Bond Index-Emerging Markets Global Diversified | | | 5.09 | | | | -7.56 | | | | -0.76 | | | | 4.38 | |
JP Morgan Emerging Markets Bond Index Global Diversified | | | 5.61 | | | | 4.22 | | | | 5.44 | | | | 8.52 | |
Reference Index | | | 4.10 | | | | -3.72 | | | | 0.91 | | | | 3.70 | |
Performance data quoted represents past performance, which does not guarantee future results.The investment return and principal value of an investment in the Fund will fluctuate so that an investor’s shares, when redeemed, may be worth more or less than their original cost. Fund returns include changes in share price, reinvested distributions, and a 4.75% maximum applicable sales charge except where “without sales charge” is indicated. Current performance may be lower or higher than the performance quoted. Returns do not consider capital gains or income taxes on an individual’s investment. Returns for periods of less than one year are cumulative and not annualized. For performance data current to the most recentmonth-end, visit oppenheimerfunds.com or call 1.800.CALL OPP (225.5677). See Fund prospectuses and summary prospectuses for more information on share classes and sales charges.
3 OPPENHEIMER INTERNATIONAL BOND FUND
Top Holdings and Allocations
TOP TEN GEOGRAPHICAL HOLDINGS
| | |
United States | | 12.1% |
| Mexico | | 10.7 |
| India | | 8.1 |
| United Kingdom | | 6.9 |
| Brazil | | 5.4 |
| South Africa | | 5.2 |
| Greece | | 4.9 |
| Spain | | 4.7 |
| Indonesia | | 4.6 |
| Argentina | | 3.6 |
| | |
|
| Portfolio holdings and allocations are subject to change. Percentages are as of March 31, 2019, and are based on total market value of investments. |
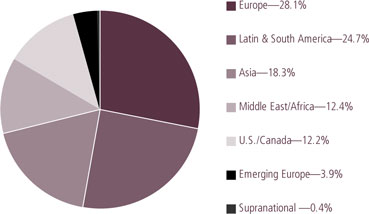
REGIONAL ALLOCATION
Portfolio holdings and allocations are subject to change. Percentages are as of March 31, 2019, and are based on the total market value of investments.
For more current Fund holdings, please visit oppenheimerfunds.com.
4 OPPENHEIMER INTERNATIONAL BOND FUND
Share Class Performance
AVERAGE ANNUAL TOTAL RETURNS WITHOUT SALES CHARGE AS OF 3/31/19
| | | | | | | | | | | | | | | | | | | | |
| | | Inception
Date | | | 6-Month | | | 1-Year | | | 5-Year | | | 10-Year | |
Class A (OIBAX) | | | 6/15/95 | | | | 2.93 | % | | | -5.04 | % | | | 1.82 | % | | | 4.11 | % |
Class C (OIBCX) | | | 6/15/95 | | | | 2.55 | | | | -5.63 | | | | 1.05 | | | | 3.36 | |
Class I (OIBIX) | | | 1/27/12 | | | | 3.13 | | | | -4.68 | | | | 2.25 | | | | 2.31 | * |
Class R (OIBNX) | | | 3/1/01 | | | | 2.80 | | | | -5.31 | | | | 1.56 | | | | 3.78 | |
Class Y (OIBYX) | | | 9/27/04 | | | | 3.06 | | | | -4.65 | | | | 2.07 | | | | 4.39 | |
AVERAGE ANNUAL TOTAL RETURNS WITH SALES CHARGE AS OF 3/31/19
| | | | | | | | | | | | | | | | | | | | |
| | | Inception
Date | | | 6-Month | | | 1-Year | | | 5-Year | | | 10-Year | |
Class A (OIBAX) | | | 6/15/95 | | | | -1.96 | % | | | -9.55 | % | | | 0.83 | % | | | 3.60 | % |
Class C (OIBCX) | | | 6/15/95 | | | | 1.55 | | | | -6.53 | | | | 1.05 | | | | 3.36 | |
Class I (OIBIX) | | | 1/27/12 | | | | 3.13 | | | | -4.68 | | | | 2.25 | | | | 2.31 | * |
Class R (OIBNX) | | | 3/1/01 | | | | 2.80 | | | | -5.31 | | | | 1.56 | | | | 3.78 | |
Class Y (OIBYX) | | | 9/27/04 | | | | 3.06 | | | | -4.65 | | | | 2.07 | | | | 4.39 | |
*Shows performance since inception.
| | | | | | | | | | |
STANDARDIZED YIELDS | | | | | | | | |
| For the 30 Days Ended 3/31/19 | | | | | | | | |
Class A | | 4.38% | | | | | | | | |
Class C | | 3.84 | | | | | | | | |
Class I | | 4.99 | | | | | | | | |
Class R | | 4.34 | | | | | | | | |
Class Y | | 4.84 | | | | | | | | |
| | | | | | | | |
UNSUBSIDIZED STANDARDIZED YIELDS | | | | |
| For the 30 Days Ended 3/31/19 | | | | | | |
Class A | | 4.36% | | | | | | |
Class C | | 3.82 | | | | | | |
Class I | | 4.98 | | | | | | |
Class R | | 4.33 | | | | | | |
Class Y | | 4.83 | | | | | | |
Performance data quoted represents past performance, which does not guarantee future results. The investment return and principal value of an investment in the Fund will fluctuate so that an investor’s shares, when redeemed, may be worth more or less than their original cost. Current performance may be lower or higher than the performance quoted. Returns do not consider capital gains or income taxes on an individual’s investment. For performance data current to the most recentmonth-end, visit oppenheimerfunds.com or call 1.800. CALL OPP (225.5677). Fund returns include changes in share price, reinvested distributions, and the applicable sales charge: for Class A shares, the current maximum initial sales charge of 4.75% and for Class C shares, the contingent deferred sales charge of 1% for the1-year period. There is no sales charge for Class I, Class R and Class Y shares. Returns for periods of less than one year are cumulative and not annualized. See Fund prospectuses and summary prospectuses for more information on share classes and sales charges.
Standardized yield is based on anSEC-standardized formula designed to approximate the Fund’s annualized hypothetical current income from securities less expenses for the30-day period ended March 31, 2019 and that date’s maximum offering price (for Class A shares) or net asset value (for all other share classes). Each result is compounded semiannually and
5 OPPENHEIMER INTERNATIONAL BOND FUND
then annualized. Falling share prices will tend to artificially raise yields. The unsubsidized standardized yield is computed under anSEC-standardized formula based on net income earned for the30-day period ended March 31, 2019. The calculation excludes any expense reimbursements and thus may result in a lower yield.
The Fund’s performance is compared to the FTSENon-U.S. Dollar World Government Bond Index, JP Morgan Government Bond Index -Emerging Markets Global Diversified, JP Morgan Emerging Markets Bond Index Global Diversified, and the Fund’s Reference Index. The Fund’s Reference Index is a customized weighted index currently comprising 50% of the FTSENon-U.S. Dollar World Government Bond Index, 30% of the JP Morgan Government Bond Index - Emerging Markets Global Diversified, and 20% of the JP Morgan Emerging Markets Bond Index Global Diversified. The FTSENon-U.S. Dollar World Government Bond Index is an index of fixed rate government bonds with a maturity of one year or longer and amounts outstanding of at least U.S. $25 million. The JPMorgan Government Bond Index-Emerging Markets Global Diversified is a comprehensive, global local Emerging Markets Index, and consists of regularly traded, liquid fixed-rate, domestic currency government bonds to which international investors can gain exposure. The JPMorgan Emerging Markets Bond Index Global Diversified is a composite index representing an unleveraged investment in emerging market bonds that is broadly based across the spectrum of emerging market bonds and includes reinvestment of income (to represent real assets).The indices areunmanaged and cannot be purchased directly by investors. While index comparisons may be useful to provide a benchmark for the Fund’s performance, it must be noted that the Fund’s investments are not limited to the investments comprising theindices. Index performance includes reinvestment of income, but does not reflect transaction costs, fees, expenses or taxes. Index performance is shown for illustrative purposes only as a benchmark for the Fund’s performance, and does not predict or depict performance of the Fund. The Fund’s performance reflects the effects of the Fund’s business and operating expenses.
Before investing in any of the Oppenheimer funds, investors should carefully consider a fund’s investment objectives, risks, charges and expenses. Fund prospectuses and summary prospectuses contain this and other information about the funds, and may be obtained by asking your financial advisor, visiting oppenheimerfunds.com, or calling 1.800.CALL OPP (225.5677). Read prospectuses and summary prospectuses carefully before investing.
Shares of Oppenheimer funds are not deposits or obligations of any bank, are not guaranteed by any bank, are not insured by the FDIC or any other agency, and involve investment risks, including the possible loss of the principal amount invested.
6 OPPENHEIMER INTERNATIONAL BOND FUND
Fund Expenses
Fund Expenses. As a shareholder of the Fund, you incur two types of costs: (1) transaction costs, which may include sales charges (loads) on purchase payments and/or contingent deferred sales charges on redemptions; and (2) ongoing costs, including management fees; distribution and service fees; and other Fund expenses. These examples are intended to help you understand your ongoing costs (in dollars) of investing in the Fund and to compare these costs with the ongoing costs of investing in other mutual funds.
The examples are based on an investment of $1,000.00 invested at the beginning of the period and held for the entire6-month period ended March 31, 2019.
Actual Expenses. The first section of the table provides information about actual account values and actual expenses. You may use the information in this section for the class of shares you hold, together with the amount you invested, to estimate the expense that you paid over the period. Simply divide your account value by $1,000.00 (for example, an $8,600.00 account value divided by $1,000.00 = 8.60), then multiply the result by the number in the first section under the heading entitled “Expenses Paid During 6 Months Ended March 31, 2019” to estimate the expenses you paid on your account during this period.
Hypothetical Example for Comparison Purposes.The second section of the table provides information about hypothetical account values and hypothetical expenses based on the Fund’s actual expense ratio for each class of shares, and an assumed rate of return of 5% per year for each class before expenses, which is not the Fund’s actual return. The hypothetical account values and expenses may not be used to estimate the actual ending account balance or expenses you paid for the period. You may use this information to compare the ongoing costs of investing in the Fund and other funds. To do so, compare this 5% hypothetical example for the class of shares you hold with the 5% hypothetical examples that appear in the shareholder reports of the other funds.
Please note that the expenses shown in the table are meant to highlight your ongoing costs only and do not reflect any transactional costs, such asfront-end or contingent deferred sales charges (loads). Therefore, the “hypothetical” section of the table is useful in comparing ongoing costs only, and will not help you determine the relative total costs of owning different funds. In addition, if these transactional costs were included, your costs would have been higher.
7 OPPENHEIMER INTERNATIONAL BOND FUND
| | | | | | | | | | | | |
| Actual | | Beginning Account Value October 1, 2018 | | | Ending Account Value March 31, 2019 | | | Expenses Paid During 6 Months Ended March 31, 2019 | |
Class A | | | $ 1,000.00 | | | | $ 1,029.30 | | | | $ 5.02 | |
Class C | | | 1,000.00 | | | | 1,025.50 | | | | 8.82 | |
Class I | | | 1,000.00 | | | | 1,031.30 | | | | 3.04 | |
Class R | | | 1,000.00 | | | | 1,028.00 | | | | 6.29 | |
Class Y | | | 1,000.00 | | | | 1,030.60 | | | | 3.75 | |
| | | |
Hypothetical | | | | | | | | | | | | |
(5% return before expenses) | | | | | | | | | | | | |
Class A | | | 1,000.00 | | | | 1,020.00 | | | | 5.00 | |
Class C | | | 1,000.00 | | | | 1,016.26 | | | | 8.78 | |
Class I | | | 1,000.00 | | | | 1,021.94 | | | | 3.03 | |
Class R | | | 1,000.00 | | | | 1,018.75 | | | | 6.26 | |
Class Y | | | 1,000.00 | | | | 1,021.24 | | | | 3.74 | |
Expenses are equal to the Fund’s annualized expense ratio for that class, multiplied by the average account value over the period, multiplied by 182/365 (to reflect theone-half year period). Those annualized expense ratios, excluding indirect expenses from affiliated funds, based on the6-month period ended March 31, 2019 are as follows:
| | | | | | | | |
Class | | | Expense Ratios | | | | | |
Class A | | | 0.99 | % | | | | |
Class C | | | 1.74 | | | | | |
Class I | | | 0.60 | | | | | |
Class R | | | 1.24 | | | | | |
Class Y | | | 0.74 | | | | | |
The expense ratios reflect voluntary and/or contractual waivers and/or reimbursements of expenses by the Fund’s Manager. Some of these undertakings may be modified or terminated at any time, as indicated in the Fund’s prospectus. The “Consolidated Financial Highlights” tables in the Fund’s financial statements, included in this report, also show the gross expense ratios, without such waivers or reimbursements and reduction to custodian expenses, if applicable.
8 OPPENHEIMER INTERNATIONAL BOND FUND
CONSOLIDATED STATEMENT OF INVESTMENTSMarch 31, 2019 Unaudited
| | | | | | | | | | | | |
| | | | | | Principal Amount | | | Value | |
| Mortgage-Backed Obligations—3.7% | | | | | | | | | | | | |
| Alba plc, Series2007-1, Cl. F, 4.096% [BP0003M+325], 3/17/391,2 | | | GBP | | | | 1,909,400 | | | $ | 2,391,530 | |
| Bancaja Fondo de Titulizacion, Series 10, Cl. C, 0.192% [EUR003M+50], 5/22/501,2,3 | | | EUR | | | | 12,000,000 | | | | 11,037,118 | |
| Capital Mortgage Srl, Series2007-1, Cl. B, 0.00% [EUR003M+22], 1/30/471,2 | | | EUR | | | | 8,000,000 | | | | 5,950,363 | |
| Eurohome UK Mortgages plc: | | | | | | | | | | | | |
| Series2007-1, Cl. B1, 1.745% [BP0003M+90], 6/15/441,2 | | | GBP | | | | 5,275,000 | | | | 5,473,770 | |
| Series2007-1, Cl. M2, 1.345% [BP0003M+50], 6/15/441,2 | | | GBP | | | | 4,000,000 | | | | 4,455,030 | |
| Series2007-2, Cl. B1, 2.245% [BP0003M+140], 9/15/441,2 | | | GBP | | | | 4,000,000 | | | | 4,381,499 | |
| Eurosail2006-3nc plc, Series2006-3X, Cl. D1C, 1.743% [BP0003M+90], 9/10/441,2 | | | GBP | | | | 11,000,000 | | | | 11,578,453 | |
| Eurosail UK plc, Series2007-5X, Cl. A1A, 1.613% [BP0003M+77], 9/13/451,2 | | | GBP | | | | 9,931,866 | | | | 12,367,025 | |
| Great Hall Mortgages No 1 plc, Series2007-1, Cl. DA, 1.626% [BP0003M+78], 3/18/391,2 | | | GBP | | | | 8,000,000 | | | | 8,736,459 | |
| Grifonas Finance plc: | | | | | | | | | | | | |
| Series 1, Cl. A, 0.05% [EUR006M+28], 8/28/391,2 | | | EUR | | | | 18,257,829 | | | | 18,746,780 | |
| Series 1, Cl. B, 0.29% [EUR006M+52], 8/28/391,2 | | | EUR | | | | 5,000,000 | | | | 4,064,269 | |
| IM Pastor 4 Fondo de Titulizacion de Activos: | | | | | | | | | | | | |
| Series 4, Cl. A, [EUR003M+14], 3/22/441,2 | | | EUR | | | | 15,714,139 | | | | 16,176,394 | |
| Series 4, Cl. B, [EUR003M+19], 3/22/441,2 | | | EUR | | | | 3,000,000 | | | | 2,061,037 | |
| Ludgate Funding plc, Series2007-1, 0.00%, 1/1/61 | | | GBP | | | | 207,500,000 | | | | 10,376,300 | |
| Marble Arch Residential Securitisation No 4 plc, Series 4X, Cl. E1C, 4.74% [BP0003M+390], 3/20/401,2 | | | GBP | | | | 5,960,000 | | | | 7,550,830 | |
| Newgate Funding plc, Series2007-2X, Cl. CB, 0.13% [EUR003M+44], 12/15/501,2 | | | EUR | | | | 3,299,522 | | | | 3,214,430 | |
| Sestante Finance Srl, Series 3, Cl. C1, 0.492% [EUR003M+80], 7/15/451,2 | | | EUR | | | | 9,700,000 | | | | 5,097,987 | |
| TDA 27 Hipocat 9 Fondo de Titulizacion de Activos, Series 27, Cl. A3, 0.00% [EUR003M+19], 12/28/501,2 | | | EUR | | | | 35,000,000 | | | | 33,510,497 | |
| Towd Point Mortgage Funding 2019-Granite4 plc, 2.23%, 10/20/514 | | | GBP | | | | 10,000,000 | | | | 13,029,709 | |
| Total Mortgage-Backed Obligations (Cost $183,464,554) | | | | | | | | | | | 180,199,480 | |
| | | | | | | | | | | | |
| U.S. Government Obligations—2.4% | | | | | | | | | | | | |
| United States Treasury Inflation-Protected Securities: | | | | | | | | | | | | |
| 1.00%,2/15/48-2/15/495,6 | | | | | | | 111,130,914 | | | | 114,104,608 | |
| Total U.S. Government Obligations (Cost $109,820,145) | | | | | | | | | | | 114,104,608 | |
| | | | | | | | | | | | |
| Foreign Government Obligations—58.2% | | | | | | | | | | | | |
| Angola—0.3% | | | | | | | | | | | | |
| Republic of Angola, 9.375% Sr. Unsec. Nts., 5/8/487 | | | | | | | 12,005,000 | | | | 13,012,220 | |
| | | | | | | | | | | | | |
| Argentina—3.0% | | | | | | | | | | | | |
| Argentine Republic: | | | | | | | | | | | | |
| 0.00% Unsec. Nts., 4/30/208 | | | ARS | | | | 777,200,000 | | | | 19,692,931 | |
| 0.236% Unsec. Nts., 7/31/208 | | | ARS | | | | 1,865,600,000 | | | | 41,450,177 | |
| 4.625% Sr. Unsec. Nts., 1/11/23 | | | | | | | 3,185,000 | | | | 2,616,477 | |
9 OPPENHEIMER INTERNATIONAL BOND FUND
CONSOLIDATED STATEMENT OF INVESTMENTSUnaudited / Continued
| | | | | | | | | | | | |
| | | | | | Principal Amount | | | Value | |
| Argentina (Continued) | | | | | | | | | | | | |
| Argentine Republic: (Continued) | | | | | | | | | | | | |
| 5.875% Sr. Unsec. Nts., 1/11/28 | | | | | | $ | 14,760,000 | | | $ | 11,367,045 | |
| 6.875% Sr. Unsec. Nts., 1/26/27 | | | | | | | 16,500,000 | | | | 13,400,063 | |
| 6.875% Sr. Unsec. Nts., 1/11/48 | | | | | | | 11,950,000 | | | | 8,828,062 | |
| 7.50% Sr. Unsec. Nts., 4/22/26 | | | | | | | 42,575,000 | | | | 36,236,647 | |
| 15.50% Bonds, 10/17/26 | | | ARS | | | | 135,000,000 | | | | 2,112,419 | |
| 18.20% Unsec. Nts., 10/3/21 | | | ARS | | | | 212,805,000 | | | | 3,483,341 | |
| 45.325% [BADLARPP+325] Unsec. Nts., 3/1/201 | | | ARS | | | | 180,336,000 | | | | 4,113,014 | |
| 45.741% [BADLARPP+375] Unsec. Nts., 4/12/251,2,7 | | | ARS | | | | 120,000,000 | | | | 2,739,097 | |
| | | | | | | | | | | 146,039,273 | |
| | | | | | | | | | | | |
| Australia—0.9% | | | | | | | | | | | | |
| Commonwealth of Australia, 0.75% Sr. Unsec. Nts., 11/21/272,6 | | | AUD | | | | 58,000,000 | | | | 44,007,427 | |
| | | | | | | | | | | | |
| Brazil—3.7% | | | | | | | | | | | | |
| Federative Republic of Brazil: | | | | | | | | | | | | |
| 6.00% Unsec. Nts., 8/15/226 | | | BRL | | | | 30,170,000 | | | | 26,354,207 | |
| 6.00% Unsec. Nts., 5/15/456 | | | BRL | | | | 40,900,000 | | | | 40,424,395 | |
| 10.00% Unsec. Nts., 1/1/27 | | | BRL | | | | 291,000,000 | | | | 78,789,777 | |
| 10.00% Unsec. Nts., 1/1/29 | | | BRL | | | | 100,000,000 | | | | 27,237,487 | |
| 13.288% Unsec. Nts., 8/15/50 | | | BRL | | | | 6,000,000 | | | | 6,049,430 | |
| | | | | | | | | | | 178,855,296 | |
| | | | | | | | | | | | |
| Chile—0.2% | | | | | | | | | | | | |
| Republic of Chile, 4.00% Unsec. Nts., 3/1/232,7 | | | CLP | | | | 8,250,000,000 | | | | 12,281,119 | |
| | | | | | | | | | | | |
| Colombia—1.3% | | | | | | | | | | | | |
| Republic of Colombia: | | | | | | | | | | | | |
| 6.125% Sr. Unsec. Nts., 1/18/41 | | | | | | | 11,050,000 | | | | 13,083,310 | |
| Series B, 6.25% Bonds, 11/26/25 | | | COP | | | | 155,000,000,000 | | | | 49,297,267 | |
| | | | | | | | | | | 62,380,577 | |
| | | | | | | | | | | | |
| Cyprus—0.9% | | | | | | | | | | | | |
| Republic of Cyprus: | | | | | | | | | | | | |
| 2.75% Unsec. Nts., 2/26/342 | | | EUR | | | | 24,500,000 | | | | 29,428,662 | |
| 3.75% Sr. Unsec. Nts., 7/26/23 | | | EUR | | | | 10,000,000 | | | | 12,780,490 | |
| | | | | | | | | | | 42,209,152 | |
| | | | | | | | | | | | |
| Dominican Republic—0.5% | | | | | | | | | | | | |
| Dominican Republic: | | | | | | | | | | | | |
| 5.95% Sr. Unsec. Nts., 1/25/277 | | | | | | | 18,480,000 | | | | 19,450,200 | |
| 6.85% Sr. Unsec. Nts., 1/27/457 | | | | | | | 6,370,000 | | | | 6,839,788 | |
| | | | | | | | | | | 26,289,988 | |
| | | | | | | | | | | | |
| Ecuador—0.6% | | | | | | | | | | | | |
| Republic of Ecuador: | | | | | | | | | | | | |
| 8.875% Sr. Unsec. Nts., 10/23/277 | | | | | | | 20,895,000 | | | | 20,973,357 | |
10 OPPENHEIMER INTERNATIONAL BOND FUND
| | | | | | | | | | | | |
| | | | | | Principal Amount | | | Value | |
| Ecuador (Continued) | | | | | | | | | | | | |
| Republic of Ecuador: (Continued) | | | | | | | | | | | | |
| 9.65% Sr. Unsec. Nts., 12/13/267 | | | | | | $ | 6,545,000 | | | $ | 6,880,431 | |
| | | | | | | | | | | 27,853,788 | |
| | | | | | | | | | | | |
| Egypt—1.2% | | | | | | | | | | | | |
| Arab Republic of Egypt: | | | | | | | | | | | | |
| 4.75% Sr. Unsec. Nts., 4/16/267 | | | EUR | | | | 12,900,000 | | | | 14,316,868 | |
| 6.125% Sr. Unsec. Nts., 1/31/227 | | | | | | | 6,530,000 | | | | 6,620,356 | |
| 8.50% Sr. Unsec. Nts., 1/31/477 | | | | | | | 9,480,000 | | | | 9,700,780 | |
| 8.70% Sr. Unsec. Nts., 3/1/497 | | | | | | | 9,590,000 | | | | 9,997,901 | |
| 18.15% Bonds, 6/13/20 | | | EGP | | | | 57,000,000 | | | | 3,335,056 | |
| 18.15% Unsec. Nts., 12/11/21 | | | EGP | | | | 128,000,000 | | | | 7,646,475 | |
| Series 3YR, 15.00% Bonds, 10/3/20 | | | EGP | | | | 157,150,000 | | | | 8,854,409 | |
| | | | | | | | | | | 60,471,845 | |
| | | | | | | | | | | | |
| Fiji—0.2% | | | | | | | | | | | | |
| Republic of Fiji, 6.625% Sr. Unsec. Nts., 10/2/202 | | | | | | | 9,265,000 | | | | 9,286,384 | |
| | | | | | | | | | | | |
| France—1.4% | | | | | | | | | | | | |
| French Republic, 4.00% Bonds, 10/25/382 | | | EUR | | | | 37,800,000 | | | | 66,021,927 | |
| | | | | | | | | | | | |
| Gabon—0.2% | | | | | | | | | | | | |
| Gabonese Republic, 6.375% Bonds, 12/12/247 | | | | | | | 11,370,000 | | | | 10,923,932 | |
| | | | | | | | | | | | |
| Ghana—0.6% | | | | | | | | | | | | |
| Republic of Ghana: | | | | | | | | | | | | |
| 8.125% Sr. Unsec. Nts., 3/26/327 | | | | | | | 12,280,000 | | | | 12,262,734 | |
| 8.627% Sr. Unsec. Nts., 6/16/497 | | | | | | | 9,455,000 | | | | 9,248,408 | |
| 8.95% Sr. Unsec. Nts., 3/26/517 | | | | | | | 5,330,000 | | | | 5,365,685 | |
| | | | | | | | | | | 26,876,827 | |
| | | | | | | | | | | | |
| Greece—4.7% | | | | | | | | | | | | |
| Hellenic Republic: | | | | | | | | | | | | |
| 0.00% Bonds, 10/15/429 | | | EUR | | | | 107,000,000 | | | | 423,696 | |
| 3.75% Bonds, 1/30/282 | | | EUR | | | | 25,000,000 | | | | 28,373,236 | |
| 3.875% Sr. Unsec. Nts., 3/12/292,7 | | | EUR | | | | 42,435,000 | | | | 48,186,720 | |
| 3.90% Bonds, 1/30/332 | | | EUR | | | | 98,176,000 | | | | 107,627,568 | |
| 4.00% Bonds, 1/30/372 | | | EUR | | | | 41,825,000 | | | | 44,624,772 | |
| | | | | | | | | | | 229,235,992 | |
| | | | | | | | | | | | |
| Hungary—1.0% | | | | | | | | | | | | |
| Hungary: | | | | | | | | | | | | |
| Series 22/A, 7.00% Bonds, 6/24/22 | | | HUF | | | | 9,600,000,000 | | | | 39,787,530 | |
| Series 25/B, 5.50% Bonds, 6/24/25 | | | HUF | | | | 1,550,000,000 | | | | 6,510,084 | |
| | | | | | | | | | | 46,297,614 | |
| | | | | | | | | | | | |
| India—6.6% | | | | | | | | | | | | |
| Republic of India: | | | | | | | | | | | | |
| 6.84% Sr. Unsec. Nts., 12/19/22 | | | INR | | | | 1,000,000,000 | | | | 14,470,213 | |
11 OPPENHEIMER INTERNATIONAL BOND FUND
CONSOLIDATED STATEMENT OF INVESTMENTSUnaudited / Continued
| | | | | | | | | | | | |
| | | | | | Principal Amount | | | Value | |
| India (Continued) | | | | | | | | | | | | |
| Republic of India: (Continued) | | | | | | | | | | | | |
| 7.17% Sr. Unsec. Nts., 1/8/28 | | | INR | | | | 2,215,000,000 | | | $ | 31,438,324 | |
| 7.68% Sr. Unsec. Nts., 12/15/23 | | | INR | | | | 1,300,000,000 | | | | 19,335,893 | |
| 7.72% Sr. Unsec. Nts., 5/25/25 | | | INR | | | | 730,000,000 | | | | 10,840,998 | |
| 8.15% Sr. Unsec. Nts., 11/24/26 | | | INR | | | | 500,000,000 | | | | 7,542,093 | |
| 8.20% Sr. Unsec. Nts., 2/15/22 | | | INR | | | | 3,435,000,000 | | | | 51,519,099 | |
| 8.20% Sr. Unsec. Nts., 9/24/25 | | | INR | | | | 3,715,000,000 | | | | 56,439,149 | |
| 8.24% Sr. Unsec. Nts., 2/15/27 | | | INR | | | | 3,000,000,000 | | | | 45,263,991 | |
| 8.40% Sr. Unsec. Nts., 7/28/24 | | | INR | | | | 3,997,000,000 | | | | 61,272,986 | |
| State of Gujarat, 7.52% Sr. Unsec. Nts., 5/24/27 | | | INR | | | | 500,000,000 | | | | 7,068,820 | |
| State of Maharastra, 7.99% Sr. Unsec. Nts., 10/28/25 | | | INR | | | | 500,000,000 | | | | 7,305,442 | |
| State of Tamil Nadu, 8.53% Sr. Unsec. Nts., 3/9/26 | | | INR | | | | 500,000,000 | | | | 7,469,289 | |
| | | | | | | | | | | 319,966,297 | |
| | | | | | | | | | | | |
| Indonesia—3.5% | | | | | | | | | | | | |
| Perusahaan Penerbit SBSN Indonesia III: | | | | | | | | | | | | |
| 4.35% Sr. Unsec. Nts., 9/10/247 | | | | | | | 3,560,000 | | | | 3,687,270 | |
| 4.55% Sr. Unsec. Nts., 3/29/267 | | | | | | | 5,680,000 | | | | 5,914,300 | |
| Republic of Indonesia: | | | | | | | | | | | | |
| 3.85% Sr. Unsec. Nts., 7/18/277 | | | | | | | 2,685,000 | | | | 2,687,868 | |
| 4.125% Sr. Unsec. Nts., 1/15/257 | | | | | | | 3,050,000 | | | | 3,133,420 | |
| 8.125% Sr. Unsec. Nts., 5/15/24 | | | IDR | | | | 540,000,000,000 | | | | 39,597,206 | |
| Series FR53, 8.25% Sr. Unsec. Nts., 7/15/21 | | | IDR | | | | 245,000,000,000 | | | | 17,776,436 | |
| Series FR56, 8.375% Sr. Unsec. Nts., 9/15/26 | | | IDR | | | | 288,430,000,000 | | | | 21,303,108 | |
| Series FR59, 7.00% Sr. Unsec. Nts., 5/15/27 | | | IDR | | | | 70,000,000,000 | | | | 4,743,926 | |
| Series FR71, 9.00% Sr. Unsec. Nts., 3/15/29 | | | IDR | | | | 359,350,000,000 | | | | 27,516,696 | |
| Series FR73, 8.75% Sr. Unsec. Nts., 5/15/31 | | | IDR | | | | 560,080,000,000 | | | | 42,085,410 | |
| | | | | | | | | | | 168,445,640 | |
| | | | | | | | | | | | |
| Iraq—0.2% | | | | | | | | | | | | |
| Republic of Iraq: | | | | | | | | | | | | |
| 5.80% Sr. Unsec. Nts., 1/15/287 | | | | | | | 3,695,000 | | | | 3,557,217 | |
| 6.752% Sr. Unsec. Nts., 3/9/237 | | | | | | | 6,035,000 | | | | 6,131,126 | |
| | | | | | | | | | | 9,688,343 | |
| | | | | | | | | | | | |
| Italy—1.2% | | | | | | | | | | | | |
| Republic of Italy Buoni Poliennali del Tesoro Unsec. Bonds, 4.75% Unsec. Nts., 9/1/442,7 | | | EUR | | | | 41,200,000 | | | | 56,329,614 | |
| | | | | | | | | | | | |
| Ivory Coast—0.5% | | | | | | | | | | | | |
| Republic of Cote d’Ivoire, 5.25% Sr. Unsec. Nts., 3/22/307 | | | EUR | | | | 22,365,000 | | | | 24,087,055 | |
| | | | | | | | | | | | |
| Malaysia—0.4% | | | | | | | | | | | | |
| Federation of Malaysia, Series 0116, 3.80% Sr. Unsec. Nts., 8/17/23 | | | MYR | | | | 80,000,000 | | | | 19,743,412 | |
| | | | | | | | | �� | | | |
| Mexico—9.5% | | | | | | | | | | | | |
| United Mexican States: | | | | | | | | | | | | |
| 4.00% Bonds, 6/13/196 | | | MXN | | | | 1,671,855,210 | | | | 85,354,043 | |
12 OPPENHEIMER INTERNATIONAL BOND FUND
| | | | | | | | | | | | |
| | | | | | Principal Amount | | | Value | |
| Mexico (Continued) | | | | | | | | | | | | |
| United Mexican States: (Continued) | | | | | | | | | | | | |
| Series M, 5.00% Sr. Unsec. Nts., 12/11/19 | | | MXN | | | | 1,320,000,000 | | | $ | 66,638,400 | |
| Series M, 5.75% Bonds, 3/5/26 | | | MXN | | | | 560,000,000 | | | | 25,513,283 | |
| Series M, 6.50% Bonds, 6/10/21 | | | MXN | | | | 400,000,000 | | | | 20,086,294 | |
| Series M, 8.00% Sr. Unsec. Nts., 12/7/23 | | | MXN | | | | 2,770,000,000 | | | | 143,772,707 | |
| Series M20, 8.50% Sr. Unsec. Nts., 5/31/29 | | | MXN | | | | 1,530,000,000 | | | | 81,092,897 | |
| Series M20, 10.00% Bonds, 12/5/24 | | | MXN | | | | 698,700,000 | | | | 39,551,814 | |
| | | | | | | | | | | 462,009,438 | |
| | | | | | | | | | | | |
| Nigeria—0.2% | | | | | | | | | | | | |
| Federal Republic of Nigeria: | | | | | | | | | | | | |
| 7.143% Sr. Unsec. Nts., 2/23/307 | | | | | | | 4,425,000 | | | | 4,435,372 | |
| 7.696% Sr. Unsec. Nts., 2/23/387 | | | | | | | 4,385,000 | | | | 4,362,299 | |
| | | | | | | | | | | 8,797,671 | |
| | | | | | | | | | | | |
| Oman—0.4% | | | | | | | | | | | | |
| Sultanate of Oman, 6.75% Sr. Unsec. Nts., 1/17/487 | | | | | | | 24,235,000 | | | | 21,591,567 | |
| | | | | | | | | | | | |
| Paraguay—0.1% | | | | | | | | | | | | |
| Republic of Paraguay, 5.40% Sr. Unsec. Nts., 3/30/507 | | | | | | | 3,200,000 | | | | 3,362,000 | |
| | | | | | | | | | | | |
| Peru—1.0% | | | | | | | | | | | | |
| Republic of Peru: | | | | | | | | | | | | |
| 5.94% Sr. Unsec. Nts., 2/12/292,7 | | | PEN | | | | 21,000,000 | | | | 6,671,387 | |
| 6.35% Sr. Unsec. Nts., 8/12/287 | | | PEN | | | | 100,140,000 | | | | 32,765,625 | |
| 8.20% Sr. Unsec. Nts., 8/12/267 | | | PEN | | | | 29,000,000 | | | | 10,513,941 | |
| | | | | | | | | | | 49,950,953 | |
| | | | | | | | | | | | |
| Poland—0.6% | | | | | | | | | | | | |
| Republic of Poland: | | | | | | | | | | | | |
| Series 0123, 2.50% Bonds, 1/25/23 | | | PLN | | | | 61,500,000 | | | | 16,325,019 | |
| Series 0422, 2.25% Bonds, 4/25/22 | | | PLN | | | | 51,500,000 | | | | 13,568,320 | |
| | | | | | | | | | | 29,893,339 | |
| | | | | | | | | | | | |
| Russia—1.0% | | | | | | | | | | | | |
| Russian Federation: | | | | | | | | | | | | |
| 5.10% Sr. Unsec. Nts., 3/28/354,7 | | | | | | | 9,620,000 | | | | 9,768,129 | |
| Series 6209, 7.60% Bonds, 7/20/22 | | | RUB | | | | 394,000,000 | | | | 5,962,691 | |
| Series 6211, 7.00% Bonds, 1/25/23 | | | RUB | | | | 2,100,000,000 | | | | 31,129,544 | |
| | | | | | | | | | | 46,860,364 | |
| | | | | | | | | | | | |
| Saudi Arabia—0.3% | | | | | | | | | | | | |
| Kingdom of Saudi Arabia, 4.375% Sr. Unsec. Nts., 4/16/297 | | | | | | | 14,905,000 | | | | 15,558,972 | |
| | | | | | | | | | | | |
| Senegal—0.2% | | | | | | | | | | | | |
| Republic of Senegal: | | | | | | | | | | | | |
| 6.25% Unsec. Nts., 5/23/337 | | | | | | | 3,170,000 | | | | 3,051,937 | |
13 OPPENHEIMER INTERNATIONAL BOND FUND
CONSOLIDATED STATEMENT OF INVESTMENTSUnaudited / Continued
| | | | | | | | | | | | |
| | | | | | Principal Amount | | | Value | |
| Senegal (Continued) | | | | | | | | | | | | |
| Republic of Senegal: (Continued) | | | | | | | | | | | | |
| 6.75% Sr. Unsec. Nts., 3/13/487 | | | | | | $ | 5,690,000 | | | $ | 5,266,095 | |
| | | | | | | | | | | 8,318,032 | |
| Serbia—0.1% | | | | | | | | | | | | |
Republic of Serbia, 4.875% Sr. Unsec. Nts., 2/25/207 | | | | | | | 6,395,000 | | | | 6,472,181 | |
| Singapore—0.4% | | | | | | | | | | | | |
Republic of Singapore, 2.25% Sr. Unsec. Nts., 6/1/21 | | | SGD | | | | 25,000,000 | | | | 18,578,583 | |
| South Africa—4.9% | | | | | | | | | | | | |
| Republic of South Africa: | | | | | | | | | | | | |
| Series 2023, 7.75% Bonds, 2/28/23 | | | ZAR | | | | 611,100,000 | | | | 42,393,558 | |
| Series 2030, 8.00% Bonds, 1/31/30 | | | ZAR | | | | 1,094,000,000 | | | | 69,877,400 | |
| Series 2037, 8.50% Bonds, 1/31/37 | | | ZAR | | | | 181,800,000 | | | | 11,310,716 | |
| Series 2048, 8.75% Bonds, 2/28/48 | | | ZAR | | | | 612,000,000 | | | | 38,284,022 | |
| Series R186, 10.50% Bonds, 12/21/26 | | | ZAR | | | | 819,700,000 | | | | 62,719,413 | |
| Series R214, 6.50% Bonds, 2/28/41 | | | ZAR | | | | 255,000,000 | | | | 12,518,404 | |
| | | | | | | | | | | 237,103,513 | |
| Spain—0.4% | | | | | | | | | | | | |
Spain Government Bond, 1.85% Sr. Unsec. Nts., 7/30/352,7 | | | EUR | | | | 17,705,000 | | | | 20,248,719 | |
| Sri Lanka—0.4% | | | | | | | | | | | | |
| Democratic Socialist Republic of Sri Lanka: | | | | | | | | | | | | |
| 5.75% Sr. Unsec. Nts., 4/18/237 | | | | | | | 9,690,000 | | | | 9,574,466 | |
| 5.875% Sr. Unsec. Nts., 7/25/227 | | | | | | | 8,995,000 | | | | 9,037,546 | |
| 6.25% Sr. Unsec. Nts., 10/4/207 | | | | | | | 2,955,000 | | | | 3,006,231 | |
| | | | | | | | | | | 21,618,243 | |
| Thailand—1.1% | | | | | | | | | | | | |
| Kingdom of Thailand: | | | | | | | | | | | | |
| 1.875% Sr. Unsec. Nts., 6/17/22 | | | THB | | | | 1,120,000,000 | | | | 35,297,628 | |
| 2.125% Sr. Unsec. Nts., 12/17/26 | | | THB | | | | 650,000,000 | | | | 20,199,485 | |
| | | | | | | | | | | 55,497,113 | |
| Turkey—0.9% | | | | | | | | | | | | |
| Republic of Turkey: | | | | | | | | | | | | |
| 8.50% Bonds, 9/14/22 | | | TRY | | | | 71,500,000 | | | | 8,989,597 | |
| 10.70% Bonds, 2/17/21 | | | TRY | | | | 155,600,000 | | | | 23,079,760 | |
| 12.40% Bonds, 3/8/28 | | | TRY | | | | 77,000,000 | | | | 10,247,332 | |
| | | | | | | | | | | 42,316,689 | |
| Ukraine—1.0% | | | | | | | | | | | | |
| Ukraine: | | | | | | | | | | | | |
| 7.75% Sr. Unsec. Nts., 9/1/232 | | | | | | | 10,655,000 | | | | 10,384,363 | |
| 7.75% Sr. Unsec. Nts., 9/1/242 | | | | | | | 8,880,000 | | | | 8,566,980 | |
| 7.75% Sr. Unsec. Nts., 9/1/252 | | | | | | | 5,900,000 | | | | 5,634,618 | |
| 7.75% Sr. Unsec. Nts., 9/1/262 | | | | | | | 16,640,000 | | | | 15,672,550 | |
14 OPPENHEIMER INTERNATIONAL BOND FUND
| | | | | | | | | | | | |
| | | | | | Principal Amount | | | Value | |
| Ukraine (Continued) | | | | | | | | | | | | |
| Ukraine: (Continued) | | | | | | | | | | | | |
| 8.994% Sr. Unsec. Nts., 2/1/247 | | | | | | $ | 9,670,000 | | | $ | 9,734,586 | |
| | | | | | | | | | | 49,993,097 | |
| | | | | | | | | | | | |
| United Kingdom—2.5% | | | | | | | | | | | | |
| United Kingdom, 3.25% Bonds, 1/22/442 | | | GBP | | | | 70,000,000 | | | | 122,851,768 | |
| | | | | | | | | | | | |
| Uruguay—0.1% | | | | | | | | | | | | |
| Oriental Republic of Uruguay, 9.875% Sr. Unsec. Nts., 6/20/227 | | | UYU | | | | 176,475,000 | | | | 5,247,213 | |
| Total Foreign Government Obligations (Cost $2,947,508,397) | | | | | | | | | | | 2,826,573,177 | |
| | | | | | | | | | | | |
| Corporate Bonds and Notes—21.3% | | | | | | | | | | | | |
| Consumer Discretionary—0.5% | | | | | | | | | | | | |
| Automobiles—0.1% | | | | | | | | | | | | |
| Aston Martin Capital Holdings Ltd., 6.50% Sr. Sec. Nts., 4/15/227 | | | | | | | 3,500,000 | | | | 3,473,750 | |
| Jaguar Land Rover Automotive plc, 4.50% Sr. Unsec. Nts., 10/1/277 | | | | | | | 1,900,000 | | | | 1,501,000 | |
| | | | | | | | | | | 4,974,750 | |
| | | | | | | | | | | | |
| Hotels, Restaurants & Leisure—0.2% | | | | | | | | | | | | |
| Melco Resorts Finance Ltd., 4.875% Sr. Unsec. Nts., 6/6/257 | | | | | | | 8,220,000 | | | | 8,162,101 | |
| | | | | | | | | | | | |
| Household Durables—0.0% | | | | | | | | | | | | |
| Arcelik AS, 5.00% Sr. Unsec. Nts., 4/3/237 | | | | | | | 3,245,000 | | | | 3,030,641 | |
| | | | | | | | | | | | |
| Media—0.2% | | | | | | | | | | | | |
| Altice Luxembourg SA, 6.25% Sr. Unsec. Nts., 2/15/252 | | | EUR | | | | 3,475,000 | | | | 3,605,912 | |
| Ziggo BV, 4.25% Sr. Sec. Nts., 1/15/277 | | | EUR | | | | 4,000,000 | | | | 4,630,499 | |
| | | | | | | | | | | 8,236,411 | |
| | | | | | | | | | |
| Consumer Staples—0.1% | | | | | | | | | | | | |
| Beverages—0.0% | | | | | | | | | | | | |
| Coca-Cola Icecek AS, 4.215% Sr. Unsec. Nts., 9/19/247 | | | | | | | 3,010,000 | | | | 2,817,607 | |
| | | | | | | | | | | | |
| Food Products—0.1% | | | | | | | | | | | | |
| Minerva Luxembourg SA, 6.50% Sr. Unsec. Nts., 9/20/267 | | | | | | | 3,220,000 | | | | 3,207,603 | |
| | | | | | | | | | | | |
| Energy—3.1% | | | | | | | | | | | | |
| Energy Equipment & Services—0.6% | | | | | | | | | | | | |
| Eterna Capital Pte Ltd.: | | | | | | | | | | | | |
| 7.50% Sr. Sec. Nts., 12/11/222,10 | | | | | | | 4,917,142 | | | | 4,826,019 | |
| 8.00% Sr. Sec. Nts., 12/11/2210 | | | | | | | 19,917,967 | | | | 18,093,879 | |
| Pertamina Persero PT, 5.625% Sr. Unsec. Nts., 5/20/437 | | | | | | | 6,495,000 | | | | 6,764,426 | |
| | | | | | | | | | | 29,684,324 | |
| | | | | | | | | | | | |
| Oil, Gas & Consumable Fuels—2.5% | | | | | | | | | | | | |
| Ecopetrol SA, 5.375% Sr. Unsec. Nts., 6/26/26 | | | | | | | 4,475,000 | | | | 4,833,000 | |
15 OPPENHEIMER INTERNATIONAL BOND FUND
CONSOLIDATED STATEMENT OF INVESTMENTSUnaudited / Continued
| | | | | | | | | | | | |
| | | | | | Principal Amount | | | Value | |
| Oil, Gas & Consumable Fuels (Continued) | | | | | | | | | | | | |
| KazMunayGas National Co. JSC, 6.375% Sr. Unsec. Nts., 10/24/487 | | | | | | $ | 13,110,000 | | | $ | 14,369,583 | |
| KazTransGas JSC, 4.375% Sr. Unsec. Nts., 9/26/277 | | | | | | | 12,065,000 | | | | 11,728,881 | |
| Petrobras Global Finance BV: | | | | | | | | | | | | |
| 5.75% Sr. Unsec. Nts., 2/1/29 | | | | | | | 5,105,000 | | | | 5,069,265 | |
| 5.999% Sr. Unsec. Nts., 1/27/28 | | | | | | | 9,540,000 | | | | 9,678,330 | |
| 6.90% Sr. Unsec. Nts., 3/19/49 | | | | | | | 19,160,000 | | | | 18,995,224 | |
| Petroleos Mexicanos: | | | | | | | | | | | | |
| 3.75% Sr. Unsec. Nts., 4/16/262 | | | EUR | | | | 9,470,000 | | | | 10,384,646 | |
| 6.375% Sr. Unsec. Nts., 1/23/45 | | | | | | | 7,010,000 | | | | 6,218,220 | |
| 6.50% Sr. Unsec. Nts., 1/23/29 | | | | | | | 6,385,000 | | | | 6,338,709 | |
| Puma International Financing SA, 5.00% Sr. Unsec. Nts., 1/24/267 | | | | | | | 7,005,000 | | | | 6,097,916 | |
| Reliance Industries Ltd., 6.78% Unsec. Nts., 9/16/20 | | | INR | | | | 500,000,000 | | | | 7,217,380 | |
| Saka Energi Indonesia PT, 4.45% Sr. Unsec. Nts., 5/5/247 | | | | | | | 4,110,000 | | | | 4,063,228 | |
| Southern Gas Corridor CJSC, 6.875% Sr. Unsec. Nts., 3/24/267 | | | | | | | 9,720,000 | | | | 10,922,840 | |
| Topaz Marine SA, 9.125% Sr. Unsec. Nts., 7/26/227 | | | | | | | 3,225,000 | | | | 3,279,812 | |
| YPF SA, 51.729% [BADLARPP+400] Sr. Unsec. Nts., 7/7/201,7 | | | | | | | 8,000,000 | | | | 3,092,837 | |
| | | | | | | | | | | 122,289,871 | |
| | | | | | | | | | | | |
| Financials—13.5% | | | | | | | | | | | | |
| Capital Markets—2.2% | | | | | | | | | | | | |
| Credit Suisse Group AG, 7.50% [USSW5+459.8] Jr. Sub. Perpetual Bonds1,2,11 | | | | | | | 28,000,000 | | | | 29,678,320 | |
| European Bank for Reconstruction & Development, 28.50%, 7/10/19 | | | TRY | | | | 111,100,000 | | | | 19,636,135 | |
| Morgan Stanley, 7.50% Sr. Unsec. Nts., 4/2/329 | | | | | | | 25,000,000 | | | | 19,928,975 | |
| Seven & Seven Ltd., 3.683% [US0006M+100] Sr. Unsec. Nts., 9/11/191,7 | | | | | | | 500,000 | | | | 500,622 | |
| UBS AG (Stamford CT), 7.625% Sub. Nts., 8/17/22 | | | | | | | 10,000,000 | | | | 11,005,150 | |
| UBS Group Funding Switzerland AG: | | | | | | | | | | | | |
| 6.875% [USISDA05+549.65] Jr. Sub. Perpetual Bonds1,2,11 | | | | | | | 10,395,000 | | | | 10,671,455 | |
| 7.00% [USSW5+486.6] Jr. Sub. Perpetual Bonds1,2,11 | | | | | | | 8,000,000 | | | | 8,450,000 | |
| 7.125% [USSW5+546.4] Jr. Sub. Perpetual Bonds1,2,11 | | | | | | | 5,000,000 | | | | 5,071,875 | |
| | | | | | | | | | | 104,942,532 | |
| | | | | | | | | | | | |
| Commercial Banks—8.6% | | | | | | | | | | | | |
| Abanca Corp. Bancaria SA, 6.125% [EUSA5+592.7] Sub. Nts., 1/18/291,2 | | | EUR | | | | 5,000,000 | | | | 5,651,685 | |
| Adler Pelzer Holding GmbH, 4.125% Sr. Sec. Nts., 4/1/242 | | | EUR | | | | 1,300,000 | | | | 1,391,923 | |
| Allied Irish Banks plc, 4.125% [EUSA5+395] Sub. Nts., 11/26/251,2 | | | EUR | | | | 7,000,000 | | | | 8,187,172 | |
| Astana Finance JSC, 9.16% Sr. Unsec. Nts., 12/22/243,12 | | | | | | | 612,810 | | | | — | |
| Banca Monte dei Paschi di Siena SpA, 5.375% [EUSA5+500.5] Sub. Nts., 1/18/281,2 | | | EUR | | | | 14,000,000 | | | | 9,258,933 | |
| Banco Bilbao Vizcaya Argentaria SA: | | | | | | | | | | | | |
| 5.875% [EUSA5+566] Jr. Sub. Perpetual Bonds1,2,11 | | | EUR | | | | 22,500,000 | | | | 24,575,428 | |
| 6.75% [EUSA5+660.4] Jr. Sub. Perpetual Bonds1,2,11 | | | EUR | | | | 8,000,000 | | | | 9,216,100 | |
| 8.875% [EUSA5+917.7] Jr. Sub. Perpetual Bonds1,2,11 | | | EUR | | | | 27,200,000 | | | | 33,633,546 | |
16 OPPENHEIMER INTERNATIONAL BOND FUND
| | | | | | | | | | | | |
| | | | | | Principal Amount | | | Value | |
| Commercial Banks (Continued) | | | | | | | | | | | | |
| Banco Comercial Portugues SA, 4.50% [EUSA5+426.7] Sub. Nts., 12/7/271,2 | | | EUR | | | | 2,500,000 | | | $ | 2,705,016 | |
| Banco do Brasil SA (Cayman): | | | | | | | | | | | | |
| 3.875% Sr. Unsec. Nts., 10/10/22 | | | | | | | 9,980,000 | | | | 9,892,675 | |
| 4.75% Sr. Unsec. Nts., 3/20/247 | | | | | | | 6,385,000 | | | | 6,410,540 | |
| Banco Hipotecario SA, 0.00% Unsec. Nts., 2/15/21 | | | ARS | | | | 79,018,000 | | | | 1,819,503 | |
Banco Mercantil del Norte SA (Grand Cayman), 7.625% [H15T10Y+535.3] Jr. Sub.
Perpetual Bonds1,7,11 | | | | | | | 2,316,000 | | | | 2,327,580 | |
| Banco Santander SA, 5.25% [EUSA5+499.9] Jr. Sub. Perpetual Bonds1,2,11 | | | EUR | | | | 5,000,000 | | | | 5,354,113 | |
| Bank of China Ltd., 5.00% Sub. Nts., 11/13/247 | | | | | | | 6,390,000 | | | | 6,757,757 | |
| Bank of Ireland, 10.00% Sub. Nts., 12/19/222 | | | EUR | | | | 9,500,000 | | | | 13,600,517 | |
| Bankia SA, 3.75% [EUSA5+362.4] Sub. Nts., 2/15/291,2 | | | EUR | | | | 12,000,000 | | | | 13,534,497 | |
| Barclays Bank plc, 6.278% [US0003M+155] Jr. Sub. Perpetual Bonds1,11 | | | | | | | 4,000,000 | | | | 4,060,000 | |
| Barclays plc: | | | | | | | | | | | | |
| 7.75% [USSW5+484.2] Jr. Sub. Perpetual Bonds1,11 | | | | | | | 2,990,000 | | | | 2,996,832 | |
| 8.00% [H15T5Y+567.2] Jr. Sub. Perpetual Bonds1,11 | | | | | | | 3,500,000 | | | | 3,586,807 | |
| BBVA Bancomer SA, 5.35% [H15T5Y+300] Sub. Nts., 11/12/291,7 | | | | | | | 5,765,000 | | | | 5,558,036 | |
| BNP Paribas SA, 7.625% [USSW5+631.4] Jr. Sub. Perpetual Bonds1,7,11 | | | | | | | 10,500,000 | | | | 11,015,970 | |
| Caixa Geral de Depositos SA: | | | | | | | | | | | | |
| 1.00% Sec. Nts., 1/27/222 | | | EUR | | | | 3,000,000 | | | | 3,459,935 | |
| 10.75% [EUSA5+1,092.5] Jr. Sub. Perpetual Bonds1,2,11 | | | EUR | | | | 7,000,000 | | | | 9,049,679 | |
| CaixaBank SA, 6.75% [EUSA5+649.8] Jr. Sub. Perpetual Bonds1,2,11 | | | EUR | | | | 20,000,000 | | | | 23,358,447 | |
| Cooperatieve Rabobank UA: | | | | | | | | | | | | |
| 5.50% [EUSA5+525] Jr. Sub. Perpetual Bonds1,2,11 | | | EUR | | | | 5,090,000 | | | | 5,930,587 | |
| 6.625% [EUSA5+669.7] Jr. Sub. Perpetual Bonds1,2,11 | | | EUR | | | | 5,000,000 | | | | 6,123,633 | |
| Credit Agricole SA: | | | | | | | | | | | | |
| 7.50% [BPSW5+453.5] Jr. Sub. Perpetual Bonds1,2,11 | | | GBP | | | | 4,400,000 | | | | 6,259,777 | |
| 7.875% [USSW5+489.8] Jr. Sub. Perpetual Bonds1,2,11 | | | | | | | 1,000,000 | | | | 1,076,188 | |
| Credit Suisse AG, 6.50% Sub. Nts., 8/8/232 | | | | | | | 15,010,000 | | | | 16,118,504 | |
| Dresdner Funding Trust I, 8.151% Jr. Sub. Nts., 6/30/317 | | | | | | | 9,900,000 | | | | 12,546,052 | |
| HSBC Bank Capital Funding Sterling 1 LP, 5.844% [BP0006M+176] Jr. Sub. Perpetual Bonds1,2,11 | | | GBP | | | | 3,100,000 | | | | 5,163,922 | |
| HSBC Holdings plc: | | | | | | | | | | | | |
| 5.25% [EUSA5+438.3] Jr. Sub. Perpetual Bonds1,2,11 | | | EUR | | | | 17,000,000 | | | | 20,193,435 | |
| 6.00% [EUSA5+533.8] Jr. Sub. Perpetual Bonds1,2,11 | | | EUR | | | | 9,000,000 | | | | 11,271,168 | |
| IDBI Bank Ltd.(GIFT-IFC), 5.00% Sr. Unsec. Nts., 9/25/192 | | | | | | | 2,530,000 | | | | 2,536,806 | |
| Intesa Sanpaolo SpA, 7.70% [USSW5+546.15] Jr. Sub. Perpetual Bonds1,7,11 | | | | | | | 13,800,000 | | | | 13,054,041 | |
| Intrum AB, 3.125% Sr. Unsec. Nts., 7/15/242 | | | EUR | | | | 4,655,000 | | | | 5,097,651 | |
| Lloyds Bank plc: | | | | | | | | | | | | |
| 7.50% Sr. Unsec. Nts., 4/2/322,9 | | | | | | | 10,000,000 | | | | 7,762,670 | |
| 13.00% [GUKG5+1,340] Jr. Sub. Perpetual Bonds1,11 | | | GBP | | | | 5,000,000 | | | | 11,078,841 | |
| Lloyds Banking Group plc, 6.657% [US0003M+127] Jr. Sub. Perpetual Bonds1,7,11 | | | | | | | 10,000,000 | | | | 10,250,000 | |
17 OPPENHEIMER INTERNATIONAL BOND FUND
CONSOLIDATED STATEMENT OF INVESTMENTSUnaudited / Continued
| | | | | | | | | | | | |
| | | | | | Principal Amount | | | Value | |
| Commercial Banks (Continued) | | | | | | | | | | | | |
| Novo Banco SA, 8.50% [EUSA5+823.3] Sub. Nts., 7/6/281,2 | | | EUR | | | | 5,000,000 | | | $ | 5,635,672 | |
| Societe Generale SA: | | | | | | | | | | | | |
| 7.375% [USSW5+623.8] Jr. Sub. Perpetual Bonds1,7,11 | | | | | | | 8,000,000 | | | | 8,270,000 | |
| 8.00% [USISDA05+587.3] Jr. Sub. Perpetual Bonds1,7,11 | | | | | | | 5,000,000 | | | | 5,317,225 | |
| Standard Chartered Bank, 5.375% [BP0003M+189] Jr. Sub. Perpetual Bonds1,11 | | | GBP | | | | 4,000,000 | | | | 5,356,315 | |
| Standard Chartered plc, 7.50% [USSW5+630.1] Jr. Sub. Perpetual Bonds1,2,11 | | | | | | | 5,460,000 | | | | 5,705,700 | |
| Swiss Insured Brazil Power Finance Sarl, 9.85% Sr. Sec. Nts., 7/16/32 | | | BRL | | | | 17,500,000 | | | | 4,693,067 | |
| Turkiye Vakiflar Bankasi TAO, 8.125% Sr. Unsec. Nts., 3/28/247 | | | | | | | 6,400,000 | | | | 6,047,744 | |
| UBS Group Funding Switzerland AG: | | | | | | | | | | | | |
| 5.00% [USSW5+243.2] Jr. Sub. Perpetual Bonds1,2,11 | | | | | | | 6,470,000 | | | | 5,649,390 | |
| 5.75% [EUSA5+528.7] Jr. Sub. Perpetual Bonds1,2,11 | | | EUR | | | | 8,500,000 | | | | 10,420,951 | |
| UniCredit SpA: | | | | | | | | | | | | |
| 6.625% [EUSA5+638.7] Jr. Sub. Perpetual Bonds1,2,11 | | | EUR | | | | 3,000,000 | | | | 3,281,119 | |
| 6.75% [EUSA5+610] Jr. Sub. Perpetual Bonds1,2,11 | | | EUR | | | | 3,000,000 | | | | 3,318,493 | |
| | | | | | | | | | | 415,561,642 | |
| | | | | | | | | | | | |
| Consumer Finance—0.2% | | | | | | | | | | | | |
| Minejesa Capital BV, 4.625% Sr. Sec. Nts., 8/10/3013 | | | | | | | 8,760,000 | | | | 8,522,192 | |
| Termocandelaria Power Ltd., 7.875% Sr. Unsec. Nts., 1/30/297 | | | | | | | 3,200,000 | | | | 3,388,032 | |
| | | | | | | | | | | 11,910,224 | |
| Diversified Financial Services—0.2% | | | | | | | | | | | | |
| JP Morgan/Hipotecaria su Casita, 6.47% Sec. Nts., 8/26/357,12 | | | MXN | | | | 34,101,099 | | | | 166,902 | |
| Power Finance Corp. Ltd., 7.99% Sr. Unsec. Nts., 12/20/22 | | | INR | | | | 400,000,000 | | | | 5,741,252 | |
| REC Ltd., 9.04% Sr. Unsec. Nts., 10/12/19 | | | INR | | | | 250,000,000 | | | | 3,635,254 | |
| | | | | | | | | | | 9,543,408 | |
| | | | | | | | | | | | |
| Insurance—1.6% | | | | | | | | | | | | |
| ASR Nederland NV, 5.125% [EUSA5+520] Sub. Nts., 9/29/451,2 | | | EUR | | | | 10,000,000 | | | | 12,414,272 | |
| AXA SA, 3.875% [EUSA11+325] Jr. Sub. Perpetual Bonds1,2,11 | | | EUR | | | | 10,500,000 | | | | 12,606,607 | |
| Credit Agricole Assurances SA, 4.75% [EUSA5+535] Sub. Nts., 9/27/481,2 | | | EUR | | | | 8,000,000 | | | | 9,976,970 | |
| NN Group NV, 4.375% [EUR003M+390] Jr. Sub. Perpetual Bonds1,2,11 | | | EUR | | | | 13,000,000 | | | | 15,455,104 | |
| Power Finance Corp. Ltd.: | | | | | | | | | | | | |
| 7.42% Sr. Unsec. Nts., 6/26/20 | | | INR | | | | 350,000,000 | | | | 5,042,243 | |
| 8.53% Sr. Unsec. Nts., 7/24/20 | | | INR | | | | 330,000,000 | | | | 4,816,657 | |
| UNIQA Insurance Group AG, 6.875% [EUR003M+598.6] Sub. Nts., 7/31/431,2 | | | EUR | | | | 9,300,000 | | | | 12,155,395 | |
| VIVAT NV, 2.375% Sr. Unsec. Nts., 5/17/242 | | | EUR | | | | 6,000,000 | | | | 7,097,507 | |
| | | | | | | | | | | 79,564,755 | |
18 OPPENHEIMER INTERNATIONAL BOND FUND
| | | | | | | | | | | | |
| | | | | | Principal Amount | | | Value | |
| Real Estate Investment Trusts (REITs)—0.0% | | | | | | | | | | | | |
| Banco Invex SA/Hipotecaria Credito y Casa SA de CV, 6.45% Sec. Nts., 3/13/343,6,12 | | | MXN | | | | 27,602,566 | | | $ | — | |
| | | | | | | | | | | | |
| Real Estate Management & Development—0.6% | | | | | | | | | | | | |
| Agile Group Holdings Ltd., 9.00% Sr. Sec. Nts., 5/21/202 | | | | | | | 10,770,000 | | | | 11,128,253 | |
| CIFI Holdings Group Co. Ltd., 7.75% Sr. Unsec. Nts., 6/5/202 | | | | | | | 7,030,000 | | | | 7,213,631 | |
| Country Garden Holdings Co. Ltd., 7.50% Sr. Sec. Nts., 3/9/202 | | | | | | | 3,280,000 | | | | 3,347,470 | |
| New Metro Global Ltd., 6.50% Sr. Unsec. Nts., 4/23/212 | | | | | | | 3,280,000 | | | | 3,316,293 | |
| Times China Holdings Ltd., 6.25% Sr. Sec. Nts., 1/23/202 | | | | | | | 3,280,000 | | | | 3,297,814 | |
| | | | | | | | | | | 28,303,461 | |
| | | | | | | | | | | | |
| Thrifts & Mortgage Finance—0.1% | | | | | | | | | | | | |
| Housing Development Finance Corp. Ltd.: | | | | | | | | | | | | |
| 8.75% Sr. Sec. Nts., 1/13/20 | | | INR | | | | 330,000,000 | | | | 4,802,747 | |
| 8.95% Sec. Nts., 10/19/20 | | | INR | | | | 125,000,000 | | | | 1,842,064 | |
| | | | | | | | | | | 6,644,811 | |
| | | | | | | | | | | | |
| Health Care—0.1% | | | | | | | | | | | | |
| Health Care Providers & Services—0.1% | | | | | | | | | | | | |
OCP SA, 4.50% Sr. Unsec. Nts., 10/22/257 | | | | | | | 6,360,000 | | | | 6,311,906 | |
| Industrials—1.0% | | | | | | | | | | | | |
| Airlines—0.1% | | | | | | | | | | | | |
| GOL Equity Finance SA, 3.75% Cv. Sr. Unsec. Nts., 7/15/247 | | | | | | | 1,920,000 | | | | 1,812,140 | |
| Gol Finance, Inc., 7.00% Sr. Unsec. Nts., 1/31/257 | | | | | | | 3,245,000 | | | | 3,021,906 | |
| | | | | | | | | | | 4,834,046 | |
| | | | | | | | | | | | |
| Construction & Engineering—0.1% | | | | | | | | | | | | |
| Fideicomiso PA Concesion Ruta al Mar, 6.75% Sr. Sec. Nts., 2/15/446,7 | | | COP | | | | 8,000,000,000 | | | | 2,465,854 | |
| Fideicomiso PA Costera, 6.25% Sr. Sec. Nts., 1/15/346,7 | | | COP | | | | 5,916,031,565 | | | | 1,910,445 | |
| Fideicomiso PA Pacifico Tres, 8.25% Sr. Sec. Nts., 1/15/357 | | | | | | | 3,060,000 | | | | 3,312,450 | |
| | | | | | | | | | | 7,688,749 | |
| | | | | | | | | | | | |
| Industrial Conglomerates—0.3% | | | | | | | | | | | | |
| KOC Holding AS, 6.50% Sr. Unsec. Nts., 3/11/257 | | | | | | | 9,350,000 | | | | 9,071,379 | |
| Tupras Turkiye Petrol Rafinerileri AS, 4.50% Sr. Unsec. Nts., 10/18/247 | | | | | | | 3,165,000 | | | | 2,795,882 | |
| Turkiye Sise ve Cam Fabrikalari AS, 6.95% Sr. Unsec. Nts., 3/14/267 | | | | | | | 4,090,000 | | | | 3,962,106 | |
| | | | | | | | | | | 15,829,367 | |
| | | | | | | | | | | | |
| Road & Rail—0.1% | | | | | | | | | | | | |
| Indian Railway Finance Corp. Ltd., 8.83% Sr. Sec. Nts., 3/25/23 | | | INR | | | | 250,000,000 | | | | 3,704,204 | |
19 OPPENHEIMER INTERNATIONAL BOND FUND
CONSOLIDATED STATEMENT OF INVESTMENTS Unaudited / Continued
| | | | | | | | | | | | |
| | | | | | Principal Amount | | | Value | |
| Trading Companies & Distributors—0.1% | | | | | | | | | | | | |
| National Bank for Agriculture & Rural Development, 8.39% Sr. Unsec. Nts., 7/19/21 | | | INR | | | | 300,000,000 | | | $ | 4,398,985 | |
| | | | | | | | | | | | |
| Transportation Infrastructure—0.3% | | | | | | | | | | | | |
| DP World plc, 5.625% Sr. Unsec. Nts., 9/25/487 | | | | | | | 6,540,000 | | | | 6,823,012 | |
| GMR Hyderabad International Airport Ltd., 4.25% Sr. Sec. Nts., 10/27/277 | | | | | | | 6,495,000 | | | | 5,916,776 | |
| | | | | | | | | | | 12,739,788 | |
| | | | | | | | | | | | |
| Information Technology—0.1% | | | | | | | | | | | | |
| Communications Equipment—0.1% | | | | | | | | | | | | |
| HTA Group Ltd., 9.125% Sr. Unsec. Nts., 3/8/2213 | | | | | | | 3,170,000 | | | | 3,317,113 | |
| | | | | | | | | | | | |
| Materials—0.8% | | | | | | | | | | | | |
| Chemicals—0.2% | | | | | | | | | | | | |
| Petkim Petrokimya Holding AS, 5.875% Sr. Unsec. Nts., 1/26/237 | | | | | | | 5,385,000 | | | | 4,924,615 | |
| Starfruit Finco BV/Starfruit US Holdco LLC, 6.50% Sr. Unsec. Nts., 10/1/267 | | | EUR | | | | 5,000,000 | | | | 5,638,426 | |
| | | | | | | | | | | 10,563,041 | |
| | | | | | | | | | | | |
| Construction Materials—0.3% | | | | | | | | | | | | |
| CIMPOR Financial Operations BV, 5.75% Sr. Unsec. Nts., 7/17/247 | | | | | | | 12,810,000 | | | | 11,352,991 | |
| | | | | | | | | | | | |
| Metals & Mining—0.3% | | | | | | | | | | | | |
| JSW Steel Ltd., 4.75% Sr. Unsec. Nts., 11/12/192 | | | | | | | 6,330,000 | | | | 6,344,812 | |
| Metinvest BV, 7.75% Sr. Unsec. Nts., 4/23/237 | | | | | | | 3,185,000 | | | | 3,124,851 | |
| Southern Copper Corp., 7.50% Sr. Unsec. Nts., 7/27/35 | | | | | | | 3,550,000 | | | | 4,480,810 | |
| | | | | | | | | | | 13,950,473 | |
| | | | | | | | | | | | |
| Telecommunication Services—1.3% | | | | | | | | | | | | |
| Diversified Telecommunication Services—0.6% | | | | | | | | | | | | |
| Axtel SAB de CV, 6.375% Sr. Unsec. Nts., 11/14/247 | | | | | | | 6,495,000 | | | | 6,517,408 | |
| Oi SA, 10.00% Sr. Unsec. Nts., 7/27/2510 | | | | | | | 6,440,000 | | | | 6,816,740 | |
| Telecom Italia Finance SA, 7.75% Sr. Unsec. Nts., 1/24/33 | | | EUR | | | | 10,000,000 | | | | 14,556,288 | |
| | | | | | | | | | | 27,890,436 | |
| | | | | | | | | | | | |
| Wireless Telecommunication Services—0.7% | | | | | | | | | | | | |
| Bharti Airtel Ltd., 4.375% Sr. Unsec. Nts., 6/10/257 | | | | | | | 3,195,000 | | | | 3,151,340 | |
| C&W Senior Financing DAC, 6.875% Sr. Unsec. Nts., 9/15/277 | | | | | | | 3,820,000 | | | | 3,848,650 | |
| GTH Finance BV, 7.25% Sr. Unsec. Nts., 4/26/237 | | | | | | | 5,800,000 | | | | 6,197,532 | |
| Telefonica Europe BV, 5.875% [EUSA10+430.1] Jr. Sub. Perpetual Bonds1,2,11 | | | EUR | | | | 15,300,000 | | | | 19,120,618 | |
| | | | | | | | | | | 32,318,140 | |
20 OPPENHEIMER INTERNATIONAL BOND FUND
| | | | | | | | | | | | |
| | | | | | Principal Amount | | | Value | |
| Utilities—0.8% | | | | | | | | | | | | |
| Electric Utilities—0.5% | | | | | | | | | | | | |
| Electricite de France SA, 5.375% [EUSA12+379.4] Jr. Sub. Perpetual Bonds1,2,11 | | | EUR | | | | 3,100,000 | | | $ | 3,796,252 | |
| Enel SpA, 8.75% [USSW5+588] Jr. Sub. Nts., 9/24/731,7 | | | | | | | 9,000,000 | | | | 9,910,800 | |
| Eskom Holdings SOC Ltd., 6.75% Sr. Unsec. Nts., 8/6/237 | | | | | | | 6,865,000 | | | | 6,792,238 | |
| Inkia Energy Ltd., 5.875% Sr. Unsec. Nts., 11/9/277 | | | | | | | 5,865,000 | | | | 5,747,759 | |
| | | | | | | | | | | 26,247,049 | |
| | | | | | | | | | | | |
| Gas Utilities—0.1% | | | | | | | | | | | | |
| Naturgy Finance BV, 4.125% [EUSA8+335.3] Jr. Sub. Perpetual Bonds1,2,11 | | | EUR | | | | 5,000,000 | | | | 5,955,376 | |
| | | | | | | | | | | | |
| Independent Power and Renewable Electricity Producers—0.2% | | | | | | | | | | | | |
| AES Andres BV/Dominican Power Partners/Empresa Generadora de Electricidad Itabo SA, 7.95% Sr. Unsec. Nts., 5/11/267 | | | | | | | 3,325,000 | | | | 3,545,282 | |
| Reliance Jio Infocomm Ltd., 8.32% Sec. Nts., 7/8/21 | | | INR | | | | 335,000,000 | | | | 4,950,074 | |
| | | | | | | | | | | 8,495,356 | |
Total Corporate Bonds and Notes (Cost $1,074,888,264) | | | | | | | | | | | 1,034,471,161 | |
| | | |
| | | | | | Shares | | | | |
| Common Stock—0.0% | | | | | | | | | | | | |
JSC Astana Finance, GDR7,12,14(Cost $0) | | | | | | | 868,851 | | | | — | |
| | | |
| | | | | | Principal Amount | | | | |
| Structured Securities—0.4% | | | | | | | | | | | | |
Deutsche Bank AG, Coriolanus Ltd. Sec. Credit Linked Bonds: | | | | | | | | | | | | |
3.003% Sr. Sec. Nts., 4/30/257,8 | | | | | | $ | 2,147,429 | | | | 1,954,267 | |
3.054% Sr. Sec. Nts., 4/30/257,8 | | | | | | | 2,736,155 | | | | 2,490,037 | |
3.098% Sr. Sec. Nts., 4/30/257,8 | | | | | | | 2,362,232 | | | | 2,149,749 | |
3.131% Sr. Sec. Nts., 4/30/257,8 | | | | | | | 2,111,538 | | | | 1,921,604 | |
3.179% Sr. Sec. Nts., 4/30/257,8 | | | | | | | 2,629,036 | | | | 2,392,553 | |
3.231% Sr. Sec. Nts., 4/30/257,8 | | | | | | | 3,000,645 | | | | 2,730,736 | |
3.265% Sr. Sec. Nts., 4/30/257,8 | | | | | | | 2,397,164 | | | | 2,181,539 | |
3.346% Sr. Sec. Nts., 4/30/257,8 | | | | | | | 2,253,232 | | | | 2,050,554 | |
Morgan Stanley, Russian Federation Total Return Linked Bonds, Series 007, Cl. VR,
5.00%, 8/22/3412 | | | RUB | | | | 117,607,309 | | | | 361,439 | |
Total Structured Securities (Cost $20,742,678) | | | | | | | | | | | 18,232,478 | |
| Short-Term Notes—4.7% | | | | | | | | | | | | |
Arab Republic of Egypt Treasury Bills: 17.252%, 9/17/198 19.102%, 4/2/198 | | | EGP EGP | | |
| 85,200,000
90,300,000 |
| |
| 4,546,475
5,210,617 |
|
Argentine Republic Treasury Bills: 0.000%,4/30/19-6/28/198 | | | ARS | | | | 729,500,000 | | | | 19,456,722 | |
United States Treasury Bills: 2.337%, 4/18/195,8,15 2.383%, 6/20/195,8 | | | | | |
| 50,000,000
150,000,000 |
| |
| 49,943,609
149,213,611 |
|
Total Short-Term Notes (Cost $231,403,199) | | | | | | | | | | | 228,371,034 | |
21 OPPENHEIMER INTERNATIONAL BOND FUND
CONSOLIDATED STATEMENT OF INVESTMENTSUnaudited / Continued
| | | | | | | | | | | | | | | | | | | | | | | | | | | | |
| | | | | | | |
| | | | | | | | | Exercise | | | Expiration | | | Notional
Amount | | | Contracts | | | | |
| | | | | | | | | Price | | | Date | | | (000’s) | | | (000’s) | | | Value | |
Exchange-Traded Option Purchased—0.0% | | | | | | | | | | | | | |
| | | | | | | | | | | | | | | | | | | | | | | EUR | | | | | |
| Euro-BUND Futures Put14($373,603) | | | | EUR | | | | 164.500 | | | | 4/26/19 | | |
| EUR
466,340 |
| | | 1 | | | $ | 190,697 | |
| | | Counter- party | | | | | | Exercise
Price | | | Expiration Date | | | Notional
Amount
(000’s) | | | | | | | |
Over-the-Counter Options Purchased—1.2% | | | | | | | | | |
| | | | | | | | | | | | | | | | | | | | | | | AUD | | | | | |
| AUD Currency Call14 | | | BOA | | | | USD | | | | 0.717 | | | | 6/3/19 | | |
| AUD
200,000 |
| | | 110,000 | | | | 998,495 | |
| | | | | | | | | | | | | | | | | | | | | | | BRL | | | | | |
| BRL Currency Call14 | | | GSCO-OT | | | | BRL | | | | 3.629 | | | | 5/2/19 | | | | BRL 362,850 | | | | 181,425 | | | | 32,435 | |
| | | | | | | | | | | | | | | | | | | | | | | BRL | | | | | |
| BRL Currency Call14 | | | JPM | | | | BRL | | | | 3.354 | | | | 9/25/19 | | | | BRL 5,150 | | | | 3,000 | | | | 134,786 | |
| | | | | | | | | | | | | | | | | | | | | | | BRL | | | | | |
| BRL Currency Call14 | | | GSCO-OT | | | | BRL | | | | 3.300 | | | | 8/28/19 | | | | BRL 5,000 | | | | 5,000 | | | | 138,250 | |
| | | | | | | | | | | | | | | | | | | | | | | BRL | | | | | |
| BRL Currency Call14 | | | SCB | | | | BRL | | | | 3.508 | | | | 11/1/19 | | | | BRL 350,800 | | | | 350,800 | | | | 436,395 | |
| | | | | | | | | | | | | | | | | | | | | | | BRL | | | | | |
| BRL Currency Put14 | | | GSCO-OT | | | | BRL | | | | 3.432 | | | | 3/27/20 | | | | BRL 10,500 | | | | 5,000 | | | | 1,075,841 | |
| | | | | | | | | | | | | | | | | | | | | | | BRL | | | | | |
| BRL Currency Put14 | | | GSCO-OT | | | | BRL | | | | 3.350 | | | | 12/6/19 | | | | BRL 5,000 | | | | 3,000 | | | | 255,383 | |
| | | | | | | | | | | | | | | | | | | | | | | BRL | | | | | |
| BRL Currency Call14,18 | | | JPM | | | | BRL | | | | 3.200 | | | | 10/17/19 | | | | BRL 32,000 | | | | 5,000 | | | | 119,885 | |
| | | | | | | | | | | | | | | | | | | | | | | BRL | | | | | |
| BRL Currency Put14 | | | GSCO-OT | | | | BRL | | | | 3.430 | | | | 3/30/20 | | | | BRL 10,000 | | | | 5,000 | | | | 1,075,133 | |
| | | | | | | | | | | | | | | | | | | | | | | BRL | | | | | |
| BRL Currency Call14 | | | GSCO-OT | | | | BRL | | | | 3.150 | | | | 5/20/19 | | | | BRL 5,000 | | | | 3,500 | | | | 2,626 | |
| | | | | | | | | | | | | | | | | | | | | | | BRL | | | | | |
| BRL Currency Call14 | | | JPM | | | | BRL | | | | 3.000 | | | | 5/16/19 | | | | BRL 5,000 | | | | 3,000 | | | | 1,422 | |
| | | | | | | | | | | | | | | | | | | | | | | BRL | | | | | |
| BRL Currency Put14 | | | GSCO-OT | | | | BRL | | | | 3.430 | | | | 3/30/20 | | | | BRL 10,000 | | | | 5,000 | | | | 1,075,133 | |
| | | | | | | | | | | | | | | | | | | | | | | BRL | | | | | |
| BRL Currency Call14 | | | CITNA-B | | | | BRL | | | | 3.200 | | | | 4/25/19 | | | | BRL 512,000 | | | | 320,000 | | | | 4,480 | |
| | | | | | | | | | | | | | | | | | | | | | | BRL | | | | | |
| BRL Currency Call14 | | | JPM | | | | BRL | | | | 3.200 | | | | 4/25/19 | | | | BRL 482,560 | | | | 320,000 | | | | 4,480 | |
22 OPPENHEIMER INTERNATIONAL BOND FUND
| | | | | | | | | | | | | | | | | | | | | | | | | | | | |
| | | | | | | |
| | | Counter- | | | | | | Exercise | | | Expiration | | | Notional
Amount | | | Contracts | | | | |
| | | party | | | | | | Price | | | Date | | | (000’s) | | | (000’s) | | | Value | |
Over-the-Counter Options Purchased (Continued) | | | | | | | | | | | | | | | | | |
| | | | | | | | | | | | | | | | | | | | | | | BRL | | | | | |
| BRL Currency Call14 | | | GSCO-OT | | | | BRL | | | | 3.400 | | | | 12/10/19 | | | | BRL 5,300 | | | | 3,000 | | | $ | 377,607 | |
| | | | | | | | | | | | | | | | | | | | | | | BRL | | | | | |
BRL Currency Call14 | | | JPM | | | | BRL | | | | 3.150 | | | | 5/20/19 | | | | BRL 5,000 | | | | 3,500 | | | | 2,626 | |
| | | | | | | | | | | | | | | | | | | | | | | BRL | | | | | |
BRL Currency Call14 | | | GSCO-OT | | | | BRL | | | | 3.513 | | | | 10/30/19 | | | | BRL 351,250 | | | | 351,250 | | | | 443,980 | |
| | | | | | | | | | | | | | | | | | | | | | | CAD | | | | | |
CAD Currency Call14 | | | RBC | | | | CAD | | | | 1.310 | | | | 5/21/19 | | |
| CAD
250,000 |
| | | 125,000 | | | | 240,643 | |
| | | | | | | | | | | | | | | | | | | | | | | CLP | | | | | |
| CLP Currency Call14 | | | CITNA-B | | | | CLP | | | | 642.000 | | | | 5/2/19 | | |
| CLP
96,300,000 |
| | | 57,780,000 | | | | 40,446 | |
| | | | | | | | | | | | | | | | | | | | | | | CLP | | | | | |
CLP Currency Call14 | | | GSCO-OT | | | | CLP | | | | 641.000 | | | | 8/5/19 | | |
| CLP
128,200,000 |
| | | 92,945,000 | | | | 564,176 | |
| | | | | | | | | | | | | | | | | | | | | | | COP | | | | | |
COP Currency Call14 | | | CITNA-B | | | | COP | | | | 3121.000 | | | | 6/26/19 | | |
| COP
312,100,000 |
| | | 312,100,000 | | | | 877,001 | |
| | | | | | | | | | | | | | | | | | | | | | | EUR | | | | | |
| EUR Currency Put14 | | | CITNA-B | | | | ZAR | | | | 16.450 | | | | 6/27/19 | | |
| EUR
200,000 |
| | | 100,000 | | | | 3,360,284 | |
| | | | | | | | | | | | | | | | | | | | | | | EUR | | | | | |
| EUR Currency Put14 | | | JPM | | | | RUB | | | | 73.550 | | | | 6/27/19 | | |
| EUR
200,000 |
| | | 90,000 | | | | 1,322,860 | |
| | | | | | | | | | | | | | | | | | | | | | | EUR | | | | | |
EUR Currency Call14 | | | CITNA-B | | | | USD | | | | 1.168 | | | | 5/9/19 | | |
| EUR
600,000 |
| | | 300,000 | | | | 70,197 | |
| | | | | | | | | | | | | | | | | | | | | | | EUR | | | | | |
| EUR Currency Put14 | | | JPM | | | | NOK | | | | 8.200 | | | | 11/27/19 | | | | EUR 5,000 | | | | 5,000 | | | | 55,541 | |
| | | | | | | | | | | | | | | | | | | | | | | EUR | | | | | |
| EUR Currency Put14 | | | BOA | | | | NOK | | | | 8.200 | | | | 11/27/19 | | | | EUR 5,000 | | | | 5,000 | | | | 55,541 | |
| | | | | | | | | | | | | | | | | | | | | | | EUR | | | | | |
EUR Currency Put14 | | | JPM | | | | ZAR | | | | 16.378 | | | | 1/6/20 | | | | EUR 75,000 | | | | 50,000 | | | | 1,779,995 | |
| | | | | | | | | | | | | | | | | | | | | | | EUR | | | | | |
| EUR Currency Put14 | | | GSCO-OT | | | | NOK | | | | 8.710 | | | | 12/17/20 | | | | EUR 12,500 | | | | 12,500 | | | | 2,088,240 | |
| | | | | | | | | | | | | | | | | | | | | | | EUR | | | | | |
| EUR Currency Put14 | | | JPM | | | | SEK | | | | 9.250 | | | | 4/29/20 | | | | EUR 10,000 | | | | 10,000 | | | | 734,051 | |
| | | | | | | | | | | | | | | | | | | | | | | EUR | | | | | |
| EUR Currency Put14 | | | GSCO-OT | | | | NOK | | | | 8.402 | | | | 12/17/20 | | | | EUR 12,500 | | | | 12,500 | | | | 992,331 | |
23 OPPENHEIMER INTERNATIONAL BOND FUND
CONSOLIDATED STATEMENT OF INVESTMENTSUnaudited / Continued
| | | | | | | | | | | | | | | | | | | | | | | | | | | | |
| | | | | | | |
| | | Counter- | | | | | | Exercise | | | Expiration | | | Notional
Amount | | | Contracts | | | | |
| | | party | | | | | | Price | | | Date | | | (000’s) | | | (000’s) | | | Value | |
Over-the-Counter Options Purchased (Continued) | | | | | | | | | | | | | | | | | |
Federal Republic of Germany Government Bonds Put14 | | | | | | | | | | | | | | | | | | | | | | | EUR | | | | | |
| | | MSCO | | | | EUR | | | | 100.468 | | | | 3/30/20 | | |
| EUR
263,626 |
| | | 249,975 | | | $ | 100,179 | |
| Federal Republic of | | | | | | | | | | | | | | | | | | | | | | | | | | | | |
| Germany | | | | | | | | | | | | | | | | | | | | | | | EUR | | | | | |
| Government | | | | | | | | | | | | | | | | | | | EUR | | | | | | | | | |
| Bonds Put14 | | | MSCO | | | | EUR | | | | 100.468 | | | | 4/2/20 | | | | 263,705 | | | | 250,050 | | | | 102,445 | |
| Federal Republic of | | | | | | | | | | | | | | | | | | | | | | | | | | | | |
| Germany | | | | | | | | | | | | | | | | | | | | | | | EUR | | | | | |
| Government | | | | | | | | | | | | | | | | | | | EUR | | | | | | | | | |
| Bonds Put14 | | | MSCO | | | | EUR | | | | 100.468 | | | | 3/19/20 | | | | 263,626 | | | | 249,975 | | | | 93,404 | |
| French Republic | | | | | | | | | | | | | | | | | | | | | | | | | | | | |
| Government | | | | | | | | | | | | | | | | | | | | | | | EUR | | | | | |
| Bonds Call14 | | | MSCO | | | | EUR | | | | 116.740 | | | | 6/25/19 | | |
| EUR
79,667 |
| | | 68,000 | | | | 1,376,784 | |
| | | | | | | | | | | | | | | | | | | | | | | IDR | | | | | |
IDR Currency Call14 | | | GSCO-OT | | | | IDR | | | | 15050.000 | | | | 9/6/19 | | |
| IDR
4,379,550,000 |
| | | 2,815,250,000 | | | | 8,445,750 | |
| | | | | | | | | | | | | | | | | | | | | | | INR | | | | | |
INR Currency Call14 | | | GSCO-OT | | | | INR | | | | 68.950 | | | | 6/21/19 | | |
| INR
6,895,000 |
| | | 5,171,250 | | | | 560,977 | |
| | | | | | | | | | | | | | | | | | | | | | | JPY | | | | | |
JPY Currency Call14 | | | DEU | | | | JPY | | | | 109.000 | | | | 8/22/19 | | |
| JPY
16,350,000 |
| | | 16,350,000 | | | | 2,171,607 | |
| | | | | | | | | | | | | | | | | | | | | | | JPY | | | | | |
JPY Currency Call14 | | | SCB | | | | JPY | | | | 110.000 | | | | 5/29/19 | | |
| JPY
11,000,000 |
| | | 11,000,000 | | | | 866,140 | |
| KRW | | | | | | | | | | | | | | | | | | | | | | | KRW | | | | | |
| Currency | | | | | | | | | | | | | | | | | | | KRW | | | | | | | | | |
| Call14 | | | GSCO-OT | | | | KRW | | | | 1125.000 | | | | 7/18/19 | | | | 112,500,000 | | | | 56,250,000 | | | | 491,063 | |
| MXN | | | | | | | | | | | | | | | | | | | | | | | MXN | | | | | |
Currency Call14 | | | CITNA-B | | | | MXN | | | | 18.578 | | | | 8/15/19 | | |
| MXN
1,393,328 |
| | | 928,885 | | | | 256,372 | |
| MXN | | | | | | | | | | | | | | | | | | | | | | | MXN | | | | | |
Currency Call14,19 | | | CITNA-B | | | | MXN | | | | 18.000 | | | | 10/23/19 | | |
| MXN
5,500 |
| | | 2,500 | | | | 211,850 | |
| MXN | | | | | | | | | | | | | | | | | | | | | | | MXN | | | | | |
Currency Call14 | | | GSCO-OT | | | | MXN | | | | 19.733 | | | | 3/4/20 | | |
| MXN
3,946,500 |
| | | 2,631,000 | | | | 3,310,351 | |
| MXN | | | | | | | | | | | | | | | | | | | | | | | MXN | | | | | |
Currency Call14 | | | SCB | | | | MXN | | | | 19.050 | | | | 6/18/19 | | |
| MXN
2,857,500 |
| | | 952,500 | | | | 379,971 | |
| | | | | | | | | | | | | | | | | | | | | | | RUB | | | | | |
RUB Currency Call14 | | | GSCO-OT | | | | RUB | | | | 59.500 | | | | 6/12/19 | | |
| RUB
8,625,053 |
| | | 7,437,500 | | | | 96,688 | |
24 OPPENHEIMER INTERNATIONAL BOND FUND
| | | | | | | | | | | | | | | | | | | | | | | | | | | | |
| | | | | | | |
| | | Counter- | | | | | | Exercise | | | Expiration | | | Notional
Amount | | | Contracts | | | | |
| | | party | | | | | | Price | | | Date | | | (000’s) | | | (000’s) | | | Value | |
Over-the-Counter Options Purchased (Continued) | | | | | | | | | | | | | | | | | |
| | | | | | | | | | | | | | | | | | | | | | | RUB | | | | | |
RUB Currency Call14 | | | GSCO-OT | | | | RUB | | | | 70.000 | | | | 2/5/21 | | | | RUB 7,350,000 | | | | 5,250,000 | | | $ | 4,229,085 | |
| | | | | | | | | | | | | | | | | | | | | | | RUB | | | | | |
RUB Currency Call14 | | | JPM | | | | RUB | | | | 59.500 | | | | 6/7/19 | | |
| RUB
14,875,000 |
| | | 8,925,000 | | | | 107,100 | |
| | | | | | | | | | | | | | | | | | | | | | | RUB | | | | | |
RUB Currency Call14 | | | GSCO-OT | | | | RUB | | | | 57.300 | | | | 3/30/20 | | | | RUB 20,500 | | | | 10,000 | | | | 1,173,356 | |
| | | | | | | | | | | | | | | | | | | | | | | USD | | | | | |
S&P 500 Index Put14 | | | GSCOI | | | | USD | | | | 2679.690 | | | | 3/13/20 | | | | USD 100,485 | | | | 35 | | | | 3,846,809 | |
| | | | | | | | | | | | | | | | | | | | | | | USD | | | | | |
S&P 500 Index Put14 | | | JPM | | | | USD | | | | 2658.670 | | | | 2/26/20 | | | | USD 150,937 | | | | 53 | | | | 5,287,668 | |
| | | | | | | | | | | | | | | | | | | | | | | USD | | | | | |
S&P 500 Index Put14 | | | BOA | | | | USD | | | | 2632.590 | | | | 2/21/20 | | | | USD 106,333 | | | | 38 | | | | 3,456,848 | |
| | | | | | | | | | | | | | | | | | | | | | | SGD | | | | | |
SGD Currency Put14 | | | GSCO-OT | | | | CNH | | | | 4.948 | | | | 5/17/19 | | | | SGD 150,000 | | | | 75,000 | | | | 148,894 | |
| | | | | | | | | | | | | | | | | | | | | | | TRY | | | | | |
TRY Currency Put14 | | | JPM | | | | TRY | | | | 4.000 | | | | 5/23/19 | | | | TRY 10,000 | | | | 7,500 | | | | 71,374 | |
| | | | | | | | | | | | | | | | | | | | | | | TRY | | | | | |
TRY Currency Call14 | | | JPM | | | | TRY | | | | 4.000 | | | | 5/23/19 | | | | TRY 5,000 | | | | 5,000 | | | | 47,583 | |
| | | | | | | | | | | | | | | | | | | | | | | ZAR | | | | | |
ZAR Currency Call14 | | | GSCO-OT | | | | ZAR | | | | 13.613 | | | | 1/27/20 | | | | ZAR 1,020,938 | | | | 680,625 | | | | 990,160 | |
| TotalOver-the-Counter Options Purchased (Cost $85,135,686) | | | | | | | | | | | | 56,182,721 | |
| | | | | | | | | | | | | | | | | | | | | | |
| | | | | | |
| | | Counter | | | Buy /Sell Reference | | | | | | Expiration | | | Notional
Amount | | |
| | | -party | | | Protection | | Asset | | | Fixed Rate | | | Date | | | (000’s) | | |
Over-the-Counter Credit Default Swaptions Purchased—0.0% | | | | | | | | | | | | | |
| Credit | | | | | | | | | iTraxx | | | | | | | | | | | | | |
| Default Swap | | | | | | | | | Europe | | | | | | | | | | | | | |
| maturing | | | | | | | | | Crossover | | | | | | | | | | | | | |
| 12/20/23 | | | | | | | | | Series 30 | | | | | | | | | | | EUR | | |
| Put14 | | | JPM | | | Buy | | | Version 2 | | | | 3.00% | | | | 4/17/19 | | | 87,500 | | 216,330 |
| Credit | | | | | | | | | | | | | | | | | | | | | | |
| Default Swap maturing 12/20/23 | | | | | | | | | CDX. | | | | | | | | | | | EUR | | |
| Put14 | | | JPM | | | Buy | | | NA.HY.31 | | | | 3.00 | | | | 5/15/19 | | | 125,000 | | 714,835 |
| TotalOver-the-Counter Credit Default Swaptions Purchased | | | | | | | | | | | | | | | | |
| (Cost $1,393,722) | | | | | | | | | | | | | | | | | | | | | | 931,165 |
25 OPPENHEIMER INTERNATIONAL BOND FUND
CONSOLIDATED STATEMENT OF INVESTMENTSUnaudited / Continued
| | | | | | | | | | | | | | | | | | | | | | | | | | | | |
| | | Counter
-party | | | Pay/Receive
Floating
Rate | | | Floating Rate | | | Fixed
Rate | | | Expiration
Date | | | Notional Amount (000’s) | | | Value | |
| Over-the-Counter Interest Rate Swaptions Purchased—1.2% | | | | | | | | | | | | | | | | | |
Interest Rate Cap maturing 2/22/21 Put14 | | | MSCO | | | | Receive | | |
| MAX [((CMS10
minus CMS2)
minus 0.32%),
0.00%] * 10 |
| | | 32.000 | % | | | 2/25/21 | | |
| USD
60,000 |
| | $ | 1,080,000 | |
| Interest Rate Swap maturing 2/2/21 Put14 | | | MSCO | | | | Receive | | |
| Three-Month
USD-LIBOR-
BBA |
| | | 2.860 | | | | 2/21/20 | | |
| USD
78,300 |
| | | 806,490 | |
| Interest Rate Swap maturing 3/31/26 Put14 | | | JPM | | | | Receive | | |
| Six-Month EUR
EURIBOR |
| | | 1.122 | | | | 3/29/21 | | |
| EUR
1,500,000 |
| | | 2,830,916 | |
| Interest Rate Swap maturing 5/30/25 Put14 | | | BOA | | | | Receive | | |
| Three- Month
CAD-BA CDOR |
| | | 2.588 | | | | 3/30/20 | | | | CAD 1,333,000 | | | | 4,637,465 | |
| Interest Rate Swap maturing 6/8/38 Call14 | | | JPM | | | | Pay | | |
| Three- Month
USD-LIBOR-
BBA |
| | | 3.154 | | | | 6/6/28 | | |
| USD
50,000 |
| | | 4,359,794 | |
| Interest Rate Swap maturing 6/8/38 Put14 | | | JPM | | | | Receive | | |
| Three- Month
USD-LIBOR-
BBA |
| | | 3.154 | | | | 6/6/28 | | |
| USD
50,000 |
| | | 2,654,556 | |
| Interest Rate Swap maturing 6/9/48 Call14 | | | JPM | | | | Pay | | |
| Three- Month
USD-LIBOR-
BBA |
| | | 2.946 | | | | 6/7/38 | | |
| USD
50,000 |
| | | 5,214,590 | |
| Interest Rate Swap maturing 6/9/48 Put14 | | | JPM | | | | Receive | | |
| Three- Month
USD-LIBOR-
BBA |
| | | 2.946 | | | | 6/7/38 | | |
| USD
50,000 |
| | | 3,875,741 | |
| Interest Rate Swap maturing 8/12/29 Put14 | | | JPM | | | | Receive | | |
| Six-Month EUR
EURIBOR |
| | | 0.718 | | | | 8/8/19 | | |
| EUR
187,500 |
| | | 644,088 | |
| Interest Rate Swap maturing 8/19/20 Put14 | | | GSCOI | | | | Receive | | |
| Three- Month
USD-LIBOR-
BBA |
| | | 3.350 | | | | 5/14/19 | | |
| USD
500,000 |
| | | — | |
26 OPPENHEIMER INTERNATIONAL BOND FUND
| | | | | | | | | | | | | | | | | | | | | | | | | | | | |
| | | Counter
-party | | | Pay/Receive
Floating
Rate | | | Floating
Rate | | | Fixed
Rate | | | Expiration
Date | | | Notional
Amount (000’s) | | | Value | |
| Over-the-Counter Interest Rate Swaptions Purchased (Continued) | | | | | | | | | | | | | | | | | |
| Interest Rate Swap maturing 9/17/77 Put14 | | | JPM | | | | Receive | | |
| Six-Month EUR
EURIBOR |
| | | 1.600% | | | | 9/15/37 | | | | EUR 160,000 | | | $ | 32,853,074 | |
| | | | | | | | | | | | | | | | | | | | | | | | | | | | |
TotalOver-the-Counter Interest Rate Swaptions Purchased
(Cost $64,971,437) | | | | | | | | | | | | 58,956,714 | |
| | | | | | | | |
| | | Shares | | | | | |
| Investment Companies—4.1% | | | | | | | | |
| OFI Carlyle Private Credit Fund, Cl. I16 | | | 316,327 | | | | 3,052,610 | |
| Oppenheimer Institutional Government Money Market Fund, Cl. E, 2.42%16,17 | | | 194,658,769 | | | | 194,658,769 | |
| | | | | | | | |
Total Investment Companies (Cost $197,758,769) | | | | | | | 197,711,379 | |
| Total Investments, at Value (Cost $4,917,460,454) | | | 97.2% | | | | 4,715,924,614 | |
| Net Other Assets (Liabilities) | | | 2.8 | | | | 136,497,249 | |
| | | | |
| Net Assets | | | 100.0% | | | $ | 4,852,421,863 | |
| | | | |
Footnotes to Consolidated Statement of Investments
1. Represents the current interest rate for a variable or increasing rate security, which may be fixed for a predetermined period. The interest rate is, or will be as of an established date, determined as [Referenced Rate + Basis-point spread].
2. Represents securities sold under Regulation S, which are exempt from registration under the Securities Act of 1933, as amended. These securities may not be offered or sold in the United States without and exemption from, or in a transaction not subject to, the registration requirements of the Securities Act of 1933. These securities amount to $1,286,167,640 or 26.51% of the Fund’s net assets at period end.
3. This security is not accruing income because its issuer has missed or is expected to miss interest and/or principal payments. The rate shown is the contractual interest rate. See Note 4 of the accompanying Consolidated Notes.
4. All or a portion of the security position is when-issued or delayed delivery to be delivered and settled after period end. See Note 4 of the accompanying Consolidated Notes.
5. All or a portion of the security position is held in segregated accounts and pledged to cover margin requirements under certain derivative contracts. The aggregate market value of such securities is $74,371,075. See Note 6 of the accompanying Consolidated Notes.
6. Denotes an inflation-indexed security: coupon or principal are indexed to a consumer price index.
7. Represents securities sold under Rule 144A, which are exempt from registration under the Securities Act of 1933, as amended. These securities have been determined to be liquid under guidelines established by the Board of Trustees. These securities amount to $809,775,744 or 16.69% of the Fund’s net assets at period end.
8. Zero coupon bond reflects effective yield on the original acquisition date.
9. This interest rate resets periodically. Interest rate shown reflects the rate in effect at period end. The rate on this variable rate security is not based on a published reference rate and spread but is determined by the issuer or agent based on current market conditions.
10. Interest or dividend ispaid-in-kind, when applicable.
11. This bond has no contractual maturity date, is not redeemable and contractually pays an indefinite stream of interest.
12. The value of this security was determined using significant unobservable inputs. See Note 3 of the accompanying Consolidated Notes.
13. Restricted security. The aggregate value of restricted securities at period end was $11,839,305, which represents 0.24% of the Fund’s net assets. See Note 4 of the accompanying Consolidated Notes. Information concerning restricted securities is as follows:
27 OPPENHEIMER INTERNATIONAL BOND FUND
CONSOLIDATED STATEMENT OF INVESTMENTSUnaudited / Continued
Footnotes to Consolidated Statement of Investments (Continued)
| | | | | | | | | | | | | | | | |
| Security | | Acquisition Dates | | | Cost | | | Value | | | Unrealized
Appreciation/
(Depreciation) | |
| HTA Group Ltd., 9.125% Sr. Unsec. Nts., 3/8/22 | | | 3/1/17-3/7/18 | | | $ | 3,205,329 | | | $ | 3,317,113 | | | $ | 111,784 | |
| Minejesa Capital BV, 4.625% Sr. Sec. Nts., 8/10/30 | | | 11/9/17-5/11/18 | | | | 8,286,776 | | | | 8,522,192 | | | | 235,416 | |
| | | | | | | | |
| | | | | | $ | 11,492,105 | | | $ | 11,839,305 | | | $ | 347,200 | |
| | | | | | | | |
14.Non-income producing security.
15. All or a portion of the security position is held in accounts at a futures clearing merchant and pledged to cover margin requirements on open futures contracts and written options on futures, if applicable. The aggregate market value of such securities is $1,008,000. See Note 6 of the accompanying Consolidated Notes.
16. Is or was an affiliate, as defined in the Investment Company Act of 1940, as amended, at or during the reporting period, by virtue of the Fund owning at least 5% of the voting securities of the issuer or as a result of the Fund and the issuer having the same investment adviser. Transactions during the reporting period in which the issuer was an affiliate are as follows:
| | | | | | | | | | | | | | | | |
| | | Shares
September 30,
2018 | | | Gross
Additions | | | Gross
Reductions | | | Shares March 31, 2019 | |
| Investment Company | | | | | | | | | | | | | | | | |
| OFI Carlyle Private Credit Fund, Cl. I | | | — | | | | 316,327 | | | | — | | | | 316,327 | |
| Oppenheimer Institutional Government Money Market Fund, Cl. E | | | 373,232,093 | | | | 2,248,969,728 | | | | 2,427,543,052 | | | | 194,658,769 | |
| | | | |
| | | Value | | | Income | | | Realized Gain (Loss) | | | Change in
Unrealized
Gain (Loss) | |
| Investment Company | | | | | | | | | | | | | | | | |
| OFI Carlyle Private Credit Fund, Cl. I | | $ | 3,052,610 | | | $ | 56,880 | | | $ | — | | | $ | (47,390 | ) |
| Oppenheimer Institutional Government Money Market Fund, Cl. E | | | 194,658,769 | | | | 2,626,750 | | | | — | | | | — | |
| | | | |
| Total | | $ | 197,711,379 | | | $ | 2,683,630 | | | $ | — | | | $ | (47,390 | ) |
| | | | |
17. Rate shown is the7-day yield at period end.
18.One-Touch Binary option becomes eligible for exercise if at any time spot rates are less than or equal to 3.2 BRL per 1 USD.
19.One-Touch Binary option becomes eligible for exercise if at any time spot rates are less than or equal to 18 MXN per 1 USD.
Distribution of investments representing geographic holdings, as a percentage of total investments at value, is as follows:
| | | | | | |
| Geographic Holdings | | Value | | | Percent |
| United States | | $ | 567,123,105 | | | 12.1% |
| Mexico | | | 503,679,483 | | | 10.7 |
28 OPPENHEIMER INTERNATIONAL BOND FUND
| | | | | | | | | | | | |
| Geographic Holdings (Continued) | | Value | | | Percent | |
India | | $ | 384,627,869 | | | | 8.1% | | | | | |
United Kingdom | | | 324,449,208 | | | | 6.9 | | | | | |
Brazil | | | 253,495,769 | | | | 5.4 | | | | | |
South Africa | | | 244,885,910 | | | | 5.2 | | | | | |
Greece | | | 229,235,992 | | | | 4.9 | | | | | |
Spain | | | 223,433,575 | | | | 4.7 | | | | | |
Indonesia | | | 219,161,135 | | | | 4.6 | | | | | |
Argentina | | | 170,408,334 | | | | 3.6 | | | | | |
France | | | 125,717,700 | | | | 2.7 | | | | | |
Italy | | | 106,201,351 | | | | 2.2 | | | | | |
Switzerland | | | 97,065,645 | | | | 2.1 | | | | | |
Colombia | | | 79,167,359 | | | | 1.7 | | | | | |
Turkey | | | 75,085,620 | | | | 1.6 | | | | | |
Peru | | | 70,252,249 | | | | 1.5 | | | | | |
Egypt | | | 70,228,937 | | | | 1.5 | | | | | |
Netherlands | | | 67,527,465 | | | | 1.4 | | | | | |
Thailand | | | 55,497,113 | | | | 1.2 | | | | | |
Ukraine | | | 53,117,949 | | | | 1.1 | | | | | |
Russia | | | 52,828,031 | | | | 1.1 | | | | | |
Hungary | | | 46,297,614 | | | | 1.0 | | | | | |
Australia | | | 45,005,923 | | | | 1.0 | | | | | |
Eurozone | | | 44,887,367 | | | | 0.9 | | | | | |
Cyprus | | | 42,209,152 | | | | 0.9 | | | | | |
China | | | 31,713,748 | | | | 0.7 | | | | | |
Poland | | | 29,893,339 | | | | 0.6 | | | | | |
Dominican Republic | | | 29,835,269 | | | | 0.6 | | | | | |
Ecuador | | | 27,853,787 | | | | 0.6 | | | | | |
Ireland | | | 27,686,893 | | | | 0.6 | | | | | |
Ghana | | | 26,876,827 | | | | 0.6 | | | | | |
Kazakhstan | | | 26,098,464 | | | | 0.5 | | | | | |
Singapore | | | 24,825,393 | | | | 0.5 | | | | | |
Ivory Coast | | | 24,087,055 | | | | 0.5 | | | | | |
Sri Lanka | | | 21,618,243 | | | | 0.5 | | | | | |
Oman | | | 21,591,567 | | | | 0.5 | | | | | |
Portugal | | | 20,850,301 | | | | 0.4 | | | | | |
Luxembourg | | | 19,974,340 | | | | 0.4 | | | | | |
Malaysia | | | 19,743,412 | | | | 0.4 | | | | | |
Supranational | | | 19,636,135 | | | | 0.4 | | | | | |
Saudi Arabia | | | 15,558,972 | | | | 0.3 | | | | | |
Germany | | | 14,424,701 | | | | 0.3 | | | | | |
Angola | | | 13,012,219 | | | | 0.3 | | | | | |
Chile | | | 12,885,741 | | | | 0.3 | | | | | |
Austria | | | 12,155,394 | | | | 0.3 | | | | | |
Gabon | | | 10,923,932 | | | | 0.2 | | | | | |
Azerbaijan | | | 10,922,840 | | | | 0.2 | | | | | |
United Arab Emirates | | | 10,102,824 | | | | 0.2 | | | | | |
Iraq | | | 9,688,343 | | | | 0.2 | | | | | |
Fiji | | | 9,286,384 | | | | 0.2 | | | | | |
Nigeria | | | 8,797,671 | | | | 0.2 | | | | | |
Senegal | | | 8,318,032 | | | | 0.2 | | | | | |
29 OPPENHEIMER INTERNATIONAL BOND FUND
CONSOLIDATED STATEMENT OF INVESTMENTSUnaudited / Continued
| | | | | | | | | | | | |
| Geographic Holdings (Continued) | | Value | | | Percent | |
| Hong Kong | | $ | 8,162,101 | | | | 0.2% | | | | | |
| Serbia | | | 6,472,181 | | | | 0.1 | | | | | |
| Morocco | | | 6,311,906 | | | | 0.1 | | | | | |
| Bermuda | | | 5,747,759 | | | | 0.1 | | | | | |
| Uruguay | | | 5,247,213 | | | | 0.1 | | | | | |
| Sweden | | | 5,097,651 | | | | 0.1 | | | | | |
| Canada | | | 4,878,108 | | | | 0.1 | | | | | |
| Paraguay | | | 3,362,000 | | | | 0.1 | | | | | |
| Cayman Islands | | | 3,347,470 | | | | 0.1 | | | | | |
| Mauritius | | | 3,317,113 | | | | 0.1 | | | | | |
| Japan | | | 3,037,747 | | | | 0.1 | | | | | |
| South Korea | | | 991,684 | | | | 0.0 | | | | | |
| | | | |
Total | | $ | 4,715,924,614 | | | | 100.0% | | | | | |
| | | | |
| | | | | | | | | | | | | | | | | | | | | | | | | | | | |
Forward Currency Exchange Contracts as of March 31, 2019 | | | | | | | | | | | | | | | | | |
Counter -party | | Settlement Month(s) | | | Currency Purchased (000’s) | | | | | | Currency Sold (000’s) | | | Unrealized
Appreciation | | | Unrealized Depreciation | |
| BAC | | | 04/2019 | | | | BRL | | | | 26,840 | | | | USD | | | | 6,888 | | | $ | — | | | $ | 32,809 | |
| BAC | | | 05/2019 | | | | EUR | | | | 585 | | | | USD | | | | 667 | | | | — | | | | 8,234 | |
| BAC | | | 06/2019 | | | | KRW | | | | 12,237,650 | | | | USD | | | | 10,850 | | | | — | | | | 69,198 | |
| BAC | | | 04/2019 | | | | USD | | | | 7,167 | | | | BRL | | | | 26,840 | | | | 311,819 | | | | — | |
| BAC | | | 05/2019 | | | | USD | | | | 9,513 | | | | EUR | | | | 8,450 | | | | 3,197 | | | | — | |
| BAC | | | 06/2019 | | | | USD | | | | 185,679 | | | | MXN | | | | 3,622,930 | | | | 1,378,715 | | | | — | |
| BAC | | | 06/2019 | | | | USD | | | | 19,761 | | | | MYR | | | | 80,805 | | | | — | | | | 43,587 | |
| BAC | | | 06/2019 | | | | USD | | | | 18,589 | | | | SGD | | | | 25,130 | | | | 18,737 | | | | — | |
| BOA | | | 05/2019 | | | | AUD | | | | 87,460 | | | | USD | | | | 62,095 | | | | 89,404 | | | | 37,699 | |
| BOA | | | 05/2019 | | | | CAD | | | | 216,220 | | | | USD | | | | 163,405 | | | | — | | | | 1,449,774 | |
| BOA | | | 05/2019 - 06/2019 | | | | EUR | | | | 31,860 | | | | USD | | | | 36,435 | | | | — | | | | 483,387 | |
| BOA | | | 06/2019 | | | | INR | | | | 2,302,100 | | | | USD | | | | 32,642 | | | | 175,894 | | | | — | |
| BOA | | | 05/2019 | | | | JPY | | | | 39,998,193 | | | | USD | | | | 366,511 | | | | — | | | | 4,438,013 | |
| BOA | | | 05/2019 | | | | NZD | | | | 21,335 | | | | USD | | | | 14,563 | | | | — | | | | 23,912 | |
| BOA | | | 05/2019 | | | | SEK | | | | 897,000 | | | | USD | | | | 98,004 | | | | — | | | | 1,247,023 | |
| BOA | | | 05/2019 | | | | USD | | | | 298,768 | | | | EUR | | | | 261,990 | | | | 3,902,978 | | | | — | |
| BOA | | | 05/2019 | | | | USD | | | | 6,487 | | | | GBP | | | | 4,915 | | | | 73,327 | | | | — | |
| BOA | | | 06/2019 | | | | USD | | | | 231,514 | | | | IDR | | | | 3,342,594,000 | | | | — | | | | 258,454 | |
| BOA | | | 06/2019 | | | | USD | | | | 388,450 | | | | INR | | | | 27,377,400 | | | | 141,381 | | | | 1,956,268 | |
| BOA | | | 05/2019 | | | | USD | | | | 40,287 | | | | JPY | | | | 4,390,000 | | | | 547,747 | | | | — | |
| BOA | | | 06/2019 | | | | USD | | | | 37,406 | | | | ZAR | | | | 546,179 | | | | 52,816 | | | | 142,676 | |
| BOA | | | 06/2019 | | | | ZAR | | | | 69,460 | | | | USD | | | | 4,766 | | | | 2,386 | | | | — | |
| CITNA-B | | | 04/2019 - 05/2019 | | | | BRL | | | | 1,024,960 | | | | USD | | | | 265,528 | | | | 448,503 | | | | 4,293,709 | |
| CITNA-B | | | 06/2019 | | | | COP | | | | 86,663,250 | | | | USD | | | | 27,442 | | | | — | | | | 371,605 | |
| CITNA-B | | | 05/2019 | | | | EUR | | | | 16,575 | | | | USD | | | | 18,779 | | | | — | | | | 125,683 | |
| CITNA-B | | | 05/2019 | | | | GBP | | | | 171,365 | | | | USD | | | | 223,352 | | | | 357,571 | | | | 85,087 | |
| CITNA-B | | | 05/2019 | | | | NOK | | | | 472,160 | | | | USD | | | | 55,721 | | | | — | | | | 895,059 | |
| CITNA-B | | | 06/2019 | | | | RUB | | | | 1,661,800 | | | | USD | | | | 25,069 | | | | — | | | | 21,161 | |
| CITNA-B | | | 05/2019 | | | | SEK | | | | 1,345,970 | | | | USD | | | | 147,280 | | | | — | | | | 2,093,591 | |
| CITNA-B | | | 05/2019 - 06/2019 | | | | TRY | | | | 391,365 | | | | USD | | | | 59,520 | | | | 6,316,971 | | | | — | |
| CITNA-B | | | 04/2019 - 05/2019 | | | | USD | | | | 423,131 | | | | BRL | | | | 1,620,480 | | | | 10,098,813 | | | | 441,505 | |
| CITNA-B | | | 06/2019 | | | | USD | | | | 58,219 | | | | COP | | | | 183,861,000 | | | | 788,380 | | | | — | |
| CITNA-B | | | 05/2019 | | | | USD | | | | 243,461 | | | | GBP | | | | 186,875 | | | | — | | | | 403,725 | |
30 OPPENHEIMER INTERNATIONAL BOND FUND
| | | | | | | | | | | | | | | | | | | | | | | | | | | | |
Forward Currency Exchange Contracts (Continued) | | | | | | | | | | | | | | | | | |
Counter -party | | Settlement Month(s) | | | Currency Purchased (000’s) | | | | | | Currency Sold (000’s) | | | Unrealized
Appreciation | | | Unrealized Depreciation | |
| CITNA-B | | | 06/2019 | | | | USD | | | | 388,052 | | | | MXN | | | | 7,622,500 | | | $ | 291,959 | | | $ | — | |
| CITNA-B | | | 05/2019 | | | | USD | | | | 19,156 | | | | NZD | | | | 28,305 | | | | — | | | | 133,783 | |
| CITNA-B | | | 06/2019 | | | | USD | | | | 7,191 | | | | RUB | | | | 476,700 | | | | 6,070 | | | | — | |
| CITNA-B | | | 06/2019 | | | | USD | | | | 55,899 | | | | THB | | | | 1,765,300 | | | | 158,855 | | | | — | |
| CITNA-B | | | 06/2019 | | | | USD | | | | 107,879 | | | | TRY | | | | 653,402 | | | | — | | | | 2,147,850 | |
| CITNA-B | | | 06/2019 | | | | USD | | | | 243,252 | | | | ZAR | | | | 3,537,950 | | | | 368,623 | | | | — | |
| CITNA-B | | | 06/2019 | | | | ZAR | | | | 182,787 | | | | USD | | | | 12,567 | | | | — | | | | 19,045 | |
| DEU | | | 05/2019 | | | | EUR | | | | 107,165 | | | | USD | | | | 122,253 | | | | — | | | | 1,650,426 | |
| DEU | | | 05/2019 | | | | USD | | | | 147,783 | | | | EUR | | | | 129,960 | | | | 1,526,476 | | | | — | |
| DEU | | | 05/2019 | | | | USD | | | | 77,000 | | | | JPY | | | | 8,470,000 | | | | 290,971 | | | | — | |
| GSCO-OT | | | 04/2019 - 03/2021 | | | | BRL | | | | 390,600 | | | | USD | | | | 100,132 | | | | 10,971 | | | | 3,141,253 | |
| GSCO-OT | | | 08/2019 | | | | CLP | | | | 41,197,450 | | | | USD | | | | 63,075 | | | | — | | | | 2,547,335 | |
| GSCO-OT | | | 12/2020 | | | | EUR | | | | 75,000 | | | | USD | | | | 90,750 | | | | — | | | | 2,382,258 | |
| GSCO-OT | | | 09/2019 | | | | IDR | | | | 1,174,960,000 | | | | USD | | | | 80,312 | | | | 219,048 | | | | — | |
| GSCO-OT | | | 08/2019 | | | | PLN | | | | 129,480 | | | | USD | | | | 34,796 | | | | — | | | | 926,481 | |
| GSCO-OT | | | 06/2019 - 10/2019 | | | | TRY | | | | 516,564 | | | | USD | | | | 80,702 | | | | 5,843,191 | | | | 2,416,282 | |
| GSCO-OT | | | 05/2019 - 03/2021 | | | | USD | | | | 184,588 | | | | BRL | | | | 750,063 | | | | 1,208,061 | | | | 2,956,162 | |
| GSCO-OT | | | 12/2020 | | | | USD | | | | 90,750 | | | | NOK | | | | 768,075 | | | | 323,348 | | | | — | |
| GSCO-OT | | | 05/2019 | | | | USD | | | | 4,685 | | | | NZD | | | | 6,795 | | | | 54,435 | | | | — | |
| GSCO-OT | | | 10/2019 | | | | USD | | | | 34,908 | | | | TRY | | | | 239,493 | | | | — | | | | 2,147,449 | |
| GSCO-OT | | | 08/2019 | | | | USD | | | | 72,749 | | | | ZAR | | | | 1,047,617 | | | | 1,561,727 | | | | 178,498 | |
| GSCO-OT | | | 05/2019 | | | | ZAR | | | | 107,250 | | | | USD | | | | 7,481 | | | | — | | | | 100,312 | |
| HSBC | | | 04/2019 | | | | ARS | | | | 199,900 | | | | USD | | | | 4,709 | | | | — | | | | 105,363 | |
| HSBC | | | 05/2019 | | | | EUR | | | | 19,610 | | | | USD | | | | 22,397 | | | | — | | | | 327,728 | |
| HSBC | | | 04/2019 | | | | INR | | | | 2,061,900 | | | | USD | | | | 30,000 | | | | — | | | | 378,608 | |
| HSBC | | | 04/2019 | | | | USD | | | | 4,613 | | | | ARS | | | | 199,900 | | | | 9,683 | | | | — | |
| HSBC | | | 05/2019 | | | | USD | | | | 5,755 | | | | EUR | | | | 5,095 | | | | 20,729 | | | | — | |
| HSBC | | | 06/2019 | | | | USD | | | | 2,383 | | | | TRY | | | | 13,740 | | | | 88,513 | | | | — | |
| JPM | | | 04/2019 | | | | ARS | | | | 188,100 | | | | USD | | | | 4,500 | | | | — | | | | 196,952 | |
| JPM | | | 04/2019 - 05/2019 | | | | BRL | | | | 67,373 | | | | USD | | | | 18,590 | | | | — | | | | 1,436,417 | |
| JPM | | | 05/2019 - 12/2019 | | | | EUR | | | | 263,265 | | | | USD | | | | 303,543 | | | | 283 | | | | 5,624,784 | |
| JPM | | | 04/2019 - 05/2019 | | | | GBP | | | | 30,975 | | | | USD | | | | 41,030 | | | | — | | | | 624,781 | |
| JPM | | | 09/2019 | | | | IDR | | | | 675,250,000 | | | | USD | | | | 42,716 | | | | 3,571,979 | | | | — | |
| JPM | | | 05/2019 | | | | JPY | | | | 21,012,000 | | | | USD | | | | 192,901 | | | | — | | | | 2,604,931 | |
| JPM | | | 11/2019 | | | | MXN | | | | 2,602,694 | | | | USD | | | | 130,861 | | | | — | | | | 1,737,567 | |
| JPM | | | 05/2019 - 12/2020 | | | | NOK | | | | 2,792,145 | | | | USD | | | | 326,508 | | | | — | | | | 1,052,848 | |
| JPM | | | 06/2019 | | | | PLN | | | | 380,000 | | | | USD | | | | 100,118 | | | | — | | | | 897,112 | |
| JPM | | | 04/2019 | | | | USD | | | | 4,627 | | | | ARS | | | | 188,100 | | | | 324,258 | | | | — | |
| JPM | | | 05/2019 | | | | USD | | | | 58,019 | | | | AUD | | | | 82,000 | | | | 120,186 | | | | 368,629 | |
| JPM | | | 04/2019 | | | | USD | | | | 22,047 | | | | BRL | | | | 80,063 | | | | 1,628,115 | | | | — | |
| JPM | | | 05/2019 - 12/2020 | | | | USD | | | | 644,583 | | | | EUR | | | | 559,285 | | | | 11,073,362 | | | | — | |
| JPM | | | 05/2019 | | | | USD | | | | 13,295 | | | | GBP | | | | 10,000 | | | | 245,764 | | | | — | |
| JPM | | | 06/2019 | | | | USD | | | | 49,226 | | | | HUF | | | | 13,611,000 | | | | 1,416,797 | | | | — | |
| JPM | | | 05/2019 | | | | USD | | | | 25,118 | | | | JPY | | | | 2,787,500 | | | | — | | | | 114,834 | |
| JPM | | | 12/2019 | | | | USD | | | | 89,647 | | | | NOK | | | | 768,075 | | | | — | | | | 210,680 | |
| JPM | | | 06/2019 | | | | USD | | | | 49,629 | | | | PEN | | | | 163,950 | | | | 384,743 | | | | — | |
| JPM | | | 06/2019 | | | | USD | | | | 31,245 | | | | PLN | | | | 118,570 | | | | 285,746 | | | | — | |
| JPM | | | 05/2019 - 06/2019 | | | | USD | | | | 68,096 | | | | TRY | | | | 391,260 | | | | 2,636,076 | | | | — | |
31 OPPENHEIMER INTERNATIONAL BOND FUND
CONSOLIDATED STATEMENT OF INVESTMENTSUnaudited / Continued
| | | | | | | | | | | | | | | | | | |
Forward Currency Exchange Contracts (Continued) | | | | | | | | | |
Counter -party | | Settlement Month(s) | | Currency
Purchased (000’s) | | | Currency Sold
(000’s) | | | Unrealized
Appreciation | | | Unrealized
Depreciation | |
| JPM | | 08/2019 | | ZAR | 475,617 | | | USD | 32,250 | | | $ | 178,498 | | | $ | — | |
| MOS | | 06/2019 | | USD | 51,635 | | | CLP | 34,437,300 | | | | 1,030,835 | | | | — | |
| RBC | | 05/2019 | | EUR | 461,995 | | | USD | 529,083 | | | | — | | | | 9,149,825 | |
| RBC | | 05/2019 | | GBP | 2,190 | | | USD | 2,895 | | | | — | | | | 36,917 | |
| RBC | | 05/2019 | | JPY | 20,000,000 | | | USD | 183,689 | | | | — | | | | 2,558,021 | |
| RBC | | 05/2019 | | NOK | 1,277,000 | | | USD | 147,584 | | | | 697,198 | | | | — | |
| RBC | | 05/2019 | | NZD | 17,510 | | | USD | 11,993 | | | | — | | | | 60,143 | |
| RBC | | 05/2019 | | USD | 43,503 | | | AUD | 61,470 | | | | — | | | | 176,301 | |
| RBC | | 05/2019 | | USD | 46,023 | | | CAD | 60,700 | | | | 557,046 | | | | — | |
| RBC | | 05/2019 | | USD | 476,211 | | | EUR | 416,090 | | | | 7,938,834 | | | | — | |
| SCB | | 09/2019 | | IDR | 1,043,275,000 | | | USD | 72,500 | | | | — | | | | 984,572 | |
| SCB | | 05/2019 | | USD | 57,735 | | | EUR | 50,000 | | | | 1,360,003 | | | | — | |
| SCB | | 09/2019 | | USD | 41,477 | | | IDR | 675,250,000 | | | | — | | | | 4,810,420 | |
| SCB | | 05/2019 | | USD | 56,000 | | | JPY | 6,155,548 | | | | 278,535 | | | | — | |
| SCB | | 05/2019 | | USD | 7,650 | | | ZAR | 107,250 | | | | 268,671 | | | | — | |
| SCB | | 08/2019 | | ZAR | 572,000 | | | USD | 40,348 | | | | — | | | | 1,409,998 | |
| | | | | | | | | | | | | | |
| Total Unrealized Appreciation and Depreciation | | | | | | | $ | 70,688,228 | | | $ | 74,536,724 | |
| | | | | | | | | | | | | | |
| | | | | | | | | | | | | | | | | | | | | | |
Futures Contracts as of March 31, 2019 | | | | | |
| Description | | Buy/Sell | | Expiration
Date | | | Number
of Contracts | | | Notional Amount
(000’s) | | | Value | | | Unrealized
Appreciation/
(Depreciation) | |
| Euro-BUND | | Sell | | | 6/6/19 | | | | 610 | | | | EUR 113,430 | | | $ | 113,821,054 | | | $ | (391,052) | |
| United States | | | | | | | | | | | | | | | | | | | | | | |
| Treasury Long | | | | | | | | | | | | | | | | | | | | | | |
| Bonds | | Sell | | | 6/19/19 | | | | 344 | | | | USD 49,836 | | | | 51,481,750 | | | | (1,645,342) | |
| | | | | | | | | | | | | | | | | | | | | | |
| | | | | | | | | | | | | | | | | | | | $ | (2,036,394) | |
| | | | | | | | | | | | | | | | | | | | | | |
| | | | | | | | | | | | | | | | | | | | | | | | | | | | |
Exchange-Traded Options Written at March 31, 2019 | | | | | | | | | | | | | | | | | |
| Description | | | | | Exercise Price | | | Expiration
Date | | | Number of
Contracts
(000’s) | | | Notional Amount (000’s) | | | Premiums
Received | | | Value | |
Euro-BUND Futures Put | | | | | | EUR | 162.500 | | | | 4/26/19 | | | | EUR (1) | | | EUR | 166,340 | | | $ | 32,585 | | | $ | (33,652) | |
| | | | | | | | | | | | | | | | | | | | | | | | | | | | |
Over-the-Counter Options Written at March 31, 2019 | | | | | | | | | | | | | | | | | |
| | | | | | | |
| Description | | Counter -party | | | Exercise Price | | | Expiration Date | | | Number of
Contracts (000’s) | | | Notional Amount
(000’s) | | | Premiums Received | | | Value | |
| | | | | | | USD | | | | | | | | AUD | | | | | | | | | | | | | |
| | | | | | | |
| AUD Currency Call | | | BOA | | | | 0.749 | | | | 6/3/19 | | | | (110,000 | ) | | | AUD 200,000 | | | $ | 153,163 | | | $ | (83,743) | |
| | | | | | | USD | | | | | | | | AUD | | | | | | | | | | | | | |
| | | | | | | |
| AUD Currency Put | | | BOA | | | | 0.689 | | | | 6/3/19 | | | | (110,000 | ) | | | AUD 200,000 | | | | 555,895 | | | | (407,783) | |
| | | | | | | USD | | | | | | | | AUD | | | | | | | | | | | | | |
| | | | | | | |
| AUD Currency Put | | | SCB | | | | 0.731 | | | | 6/3/19 | | | | (75,000 | ) | | | AUD 75,000 | | | | 1,016,467 | | | | (2,335,200) | |
32 OPPENHEIMER INTERNATIONAL BOND FUND
| | | | | | | | | | | | | | | | | | | | | | | | | | | | |
Over-the-Counter Options Written (Continued) | | | | | | | | | | | | | | | | | |
| | | | | | | |
| Description | | Counter -party | | | Exercise Price | | | Expiration Date | | | Number of
Contracts (000’s) | | | Notional Amount (000’s) | | | Premiums Received | | | Value | |
| | | | | | | BRL | | | | | | | | BRL | | | | | | | | | | | | | |
| | | | | | | |
| BRL Currency Put | | | GSCO-OT | | | | 4.500 | | | | 12/6/19 | | | | (3,000) | | | | BRL 5,000 | | | $ | 531,600 | | | $ | (440,775) | |
| | | | | | | BRL | | | | | | | | BRL | | | | | | | | | | | | | |
| | | | | | | |
| BRL Currency Call | | | GSCO-OT | | | | 3.463 | | | | 5/2/19 | | | | (173,150) | | | | BRL 346,300 | | | | 238,150 | | | | (14,389) | |
| | | | | | | BRL | | | | | | | | BRL | | | | | | | | | | | | | |
| | | | | | | |
| BRL Currency Put1 | | | GSCO-OT | | | | 4.230 | | | | 3/4/21 | | | | (211,500) | | | | BRL 423,000 | | | | 2,369,000 | | | | (2,862,098) | |
| | | | | | | BRL | | | | | | | | BRL | | | | | | | | | | | | | |
| | | | | | | |
| BRL Currency Put2 | | | GSCO-OT | | | | 4.500 | | | | 12/10/19 | | | | (3,000) | | | | BRL 5,300 | | | | 624,000 | | | | (442,203) | |
| | | | | | | BRL | | | | | | | | BRL | | | | | | | | | | | | | |
| | | | | | | |
| BRL Currency Put | | | GSCO-OT | | | | 3.880 | | | | 5/2/19 | | | | (193,975) | | | | BRL 387,950 | | | | 559,450 | | | | (1,177,267) | |
| | | | | | | BRL | | | | | | | | BRL | | | | | | | | | | | | | |
| | | | | | | |
| BRL Currency Put1 | | | GSCO-OT | | | | 4.500 | | | | 3/30/20 | | | | (5,000) | | | | BRL 10,000 | | | | 874,000 | | | | (1,139,483) | |
| | | | | | | BRL | | | | | | | | BRL | | | | | | | | | | | | | |
| | | | | | | |
| BRL Currency Put1 | | | GSCO-OT | | | | 4.500 | | | | 3/30/20 | | | | (5,000) | | | | BRL 10,000 | | | | 874,000 | | | | (1,139,483) | |
| | | | | | | BRL | | | | | | | | BRL | | | | | | | | | | | | | |
| | | | | | | |
| BRL Currency Put | | | GSCO-OT | | | | 3.961 | | | | 6/26/19 | | | | (396,050) | | | | BRL 396,050 | | | | 2,093,000 | | | | (2,593,399) | |
| | | | | | | BRL | | | | | | | | BRL | | | | | | | | | | | | | |
| | | | | | | |
| BRL Currency Put1 | | | GSCO-OT | | | | 4.500 | | | | 3/27/20 | | | | (5,000) | | | | BRL 10,500 | | | | 872,000 | | | | (1,146,292) | |
| | | | | | | BRL | | | | | | | | BRL | | | | | | | | | | | | | |
| | | | | | | |
| BRL Currency Put3 | | | GSCO-OT | | | | 4.504 | | | | 10/30/19 | | | | (450,430) | | | | BRL 450,430 | | | | 2,056,000 | | | | (1,234,178) | |
| | | | | | | BRL | | | | | | | | BRL | | | | | | | | | | | | | |
| | | | | | | |
| BRL Currency Put3 | | | JPM | | | | 4.250 | | | | 3/4/21 | | | | (212,500) | | | | BRL 425,000 | | | | 2,242,500 | | | | (2,801,623) | |
| | | | | | | BRL | | | | | | | | BRL | | | | | | | | | | | | | |
| | | | | | | |
| BRL Currency Call3 | | | JPM | | | | 3.700 | | | | 4/4/19 | | | | (185,000) | | | | BRL 370,000 | | | | 290,625 | | | | (24,570) | |
| | | | | | | BRL | | | | | | | | BRL | | | | | | | | | | | | | |
| | | | | | | |
| BRL Currency Put | | | JPM | | | | 3.850 | | | | 4/4/19 | | | | (192,500) | | | | BRL 385,000 | | | | 413,133 | | | | (983,092) | |
| | | | | | | BRL | | | | | | | | BRL | | | | | | | | | | | | | |
| | | | | | | |
| BRL Currency Put | | | SCB | | | | 4.527 | | | | 11/1/19 | | | | (452,700) | | | | BRL 452,700 | | | | 1,963,900 | | | | (1,190,601) | |
| | | | | | | CAD | | | | | | | | CAD | | | | | | | | | | | | | |
| | | | | | | |
| CAD Currency Put | | | RBC | | | | 1.345 | | | | 5/21/19 | | | | (125,000) | | | | CAD 250,000 | | | | 497,500 | | | | (542,226) | |
| | | | | | | CAD | | | | | | | | CAD | | | | | | | | | | | | | |
| | | | | | | |
| CAD Currency Call | | | RBC | | | | 1.280 | | | | 5/21/19 | | | | (125,000) | | | | CAD 250,000 | | | | 277,500 | | | | (33,611) | |
| | | | | | | CLP | | | | | | | | CLP | | | | | | | | | | | | | |
| | | | | | | |
| CLP Currency Put | | | CITNA-B | | | | 678.000 | | | | 5/2/19 | | | | (61,020,000) | | | | CLP 101,700,000 | | | | 670,482 | | | | (1,150,227) | |
| | | | | | | CLP | | | | | | | | CLP | | | | | | | | | | | | | |
| | | | | | | |
| CLP Currency Call | | | CITNA-B | | | | 621.000 | | | | 5/2/19 | | | | (55,890,000) | | | | CLP 93,150,000 | | | | 397,167 | | | | (21,797) | |
33 OPPENHEIMER INTERNATIONAL BOND FUND
CONSOLIDATED STATEMENT OF INVESTMENTSUnaudited / Continued
| | | | | | | | | | | | | | | | | | | | | | | | | | | | |
Over-the-Counter Options Written (Continued) | | | | | | | | | | | | | | | | | |
| | | | | | | |
| Description | | Counter -party | | | Exercise Price | | | Expiration Date | | | Number of
Contracts (000’s) | | | Notional Amount (000’s) | | | Premiums
Received | | | Value | |
| | | | | | | CLP | | | | | | | | CLP | | | | | | | | | | | | | |
| | | | | | | |
| CLP Currency Call | | | GSCO-OT | | | | 607.000 | | | | 8/5/19 | | | | (88,015,000 | ) | | | CLP 121,400,000 | | | $ | 805,910 | | | $ | (141,704) | |
| | | | | | | CLP | | | | | | | | CLP | | | | | | | | | | | | | |
| | | | | | | |
| CLP Currency Put | | | GSCO-OT | | | | 691.000 | | | | 8/5/19 | | | | (100,195,000 | ) | | | CLP 138,200,000 | | | | 1,756,965 | | | | (2,428,727) | |
| | | | | | | COP | | | | | | | | COP | | | | | | | | | | | | | |
| | | | | | | |
| COP Currency Put | | | BOA | | | | 3268.000 | | | | 5/23/19 | | | | (81,700,000 | ) | | | COP 163,400,000 | | | | 205,750 | | | | (196,080) | |
| | | | | | | COP | | | | | | | | COP | | | | | | | | | | | | | |
| | | | | | | |
| COP Currency Call | | | BOA | | | | 3008.000 | | | | 5/23/19 | | | | (75,200,000 | ) | | | COP 150,400,000 | | | | 198,500 | | | | (38,352) | |
| | | | | | | COP | | | | | | | | COP | | | | | | | | | | | | | |
| | | | | | | |
| COP Currency Call | | | CITNA-B | | | | 2981.000 | | | | 5/2/19 | | | | (149,050,000 | ) | | | COP 298,100,000 | | | | 362,676 | | | | (32,791) | |
| | | | | | | COP | | | | | | | | COP | | | | | | | | | | | | | |
| | | | | | | |
| COP Currency Put | | | CITNA-B | | | | 3227.000 | | | | 5/2/19 | | | | (161,350,000 | ) | | | COP 322,700,000 | | | | 388,320 | | | | (384,013) | |
| | | | | | | COP | | | | | | | | COP | | | | | | | | | | | | | |
| | | | | | | |
| COP Currency Put | | | CITNA-B | | | | 3282.000 | | | | 6/26/19 | | | | (328,200,000 | ) | | | COP 328,200,000 | | | | 810,821 | | | | (1,132,290) | |
| | | | | | | COP | | | | | | | | COP | | | | | | | | | | | | | |
| | | | | | | |
| COP Currency Call | | | CITNA-B | | | | 3010.000 | | | | 6/26/19 | | | | (301,000,000 | ) | | | COP 301,000,000 | | | | 386,728 | | | | (213,710) | |
| | | | | | | COP | | | | | | | | COP | | | | | | | | | | | | | |
| | | | | | | |
| COP Currency Call | | | GSCO-OT | | | | 3040.000 | | | | 5/13/19 | | | | (273,600,000 | ) | | | COP 456,000,000 | | | | 743,851 | | | | (131,328) | |
| | | | | | | COP | | | | | | | | COP | | | | | | | | | | | | | |
| | | | | | | |
| COP Currency Put | | | GSCO-OT | | | | 3285.000 | | | | 5/13/19 | | | | (295,650,000 | ) | | | COP 492,750,000 | | | | 606,780 | | | | (467,127) | |
| | | | | | | COP | | | | | | | | COP | | | | | | | | | | | | | |
| | | | | | | |
| COP Currency Put | | | GSCO-OT | | | | 3325.000 | | | | 9/4/19 | | | | (249,375,000 | ) | | | COP 249,375,000 | | | | 772,050 | | | | (1,216,950) | |
| | | | | | | COP | | | | | | | | COP | | | | | | | | | | | | | |
| | | | | | | |
| COP Currency Call | | | GSCO-OT | | | | 2965.000 | | | | 9/4/19 | | | | (222,375,000 | ) | | | COP 222,375,000 | | | | 891,600 | | | | (269,074) | |
| | | | | | | COP | | | | | | | | COP | | | | | | | | | | | | | |
| | | | | | | |
| COP Currency Put | | | JPM | | | | 3300.000 | | | | 4/15/19 | | | | (165,000,000 | ) | | | COP 330,000,000 | | | | 438,050 | | | | (72,600) | |
| | | | | | | COP | | | | | | | | COP | | | | | | | | | | | | | |
| | | | | | | |
| COP Currency Call | | | JPM | | | | 3020.000 | | | | 4/15/19 | | | | (151,000,000 | ) | | | COP 302,000,000 | | | | 331,400 | | | | (27,180) | |
| | | | | | | COP | | | | | | | | COP | | | | | | | | | | | | | |
| | | | | | | |
| COP Currency Put | | | MSCO | | | | 3280.560 | | | | 6/26/19 | | | | (164,028,000 | ) | | | COP 328,056,000 | | | | 309,125 | | | | (570,817) | |
| | | | | | | COP | | | | | | | | COP | | | | | | | | | | | | | |
| | | | | | | |
| COP Currency Call | | | MSCO | | | | 3053.080 | | | | 6/26/19 | | | | (152,654,000 | ) | | | COP 305,308,000 | | | | 309,125 | | | | (192,344) | |
| | | | | | | INR | | | | | | | | EUR | | | | | | | | | | | | | |
| | | | | | | |
| EUR Currency Call | | | BOA | | | | 80.750 | | | | 6/20/19 | | | | (60,000 | ) | | | EUR 100,000 | | | | 769,293 | | | | (550,086) | |
| | | | | | | USD | | | | | | | | EUR | | | | | | | | | | | | | |
| | | | | | | |
| EUR Currency Put | | | BOA | | | | 1.170 | | | | 6/17/19 | | | | (150,000 | ) | | | EUR 150,000 | | | | 3,677,490 | | | | (5,635,350) | |
34 OPPENHEIMER INTERNATIONAL BOND FUND
| | | | | | | | | | | | | | | | | | | | | | | | | | | | |
Over-the-Counter Options Written (Continued) | | | | | | | | | | | | | | | | | |
| | | | | | | |
| Description | | Counter -party | | | Exercise Price | | | Expiration Date | | | Number of
Contracts (000’s) | | | Notional Amount (000’s) | | | Premiums
Received | | | Value | |
| | | | | | | ZAR | | | | | | | | EUR | | | | | | | | | | | | | |
| | | | | | | |
| EUR Currency Put | | | CITNA-B | | | | 15.750 | | | | 6/27/19 | | | | (100,000 | ) | | | EUR 200,000 | | | $ | 870,985 | | | $ | (1,273,350) | |
| | | | | | | ZAR | | | | | | | | EUR | | | | | | | | | | | | | |
| | | | | | | |
| EUR Currency Put | | | GSCO-OT | | | | 15.750 | | | | 7/10/19 | | | | (50,000 | ) | | | EUR 75,000 | | | | 1,637,541 | | | | (689,774) | |
| | | | | | | INR | | | | | | | | EUR | | | | | | | | | | | | | |
| | | | | | | |
| EUR Currency Call | | | GSCO-OT | | | | 85.340 | | | | 9/3/19 | | | | (50,000 | ) | | | EUR 110,000 | | | | 979,282 | | | | (260,944) | |
| | | | | | | ZAR | | | | | | | | EUR | | | | | | | | | | | | | |
| | | | | | | |
| EUR Currency Call4 | | | GSCO-OT | | | | 20.000 | | | | 3/30/20 | | | | (8,900 | ) | | | EUR 18,245 | | | | 1,745,852 | | | | (2,207,063) | |
| | | | | | | NOK | | | | | | | | EUR | | | | | | | | | | | | | |
| | | | | | | |
| EUR Currency Call5 | | | GSCO-OT | | | | 11.000 | | | | 12/17/20 | | | | (10,000 | ) | | | EUR 10,000 | | | | 2,161,338 | | | | (1,295,435) | |
| | | | | | | INR | | | | | | | | EUR | | | | | | | | | | | | | |
| | | | | | | |
| EUR Currency Call | | | GSCO-OT | | | | 81.200 | | | | 7/18/19 | | | | (50,000 | ) | | | EUR 150,000 | | | | 1,083,840 | | | | (583,185) | |
| | | | | | | KRW | | | | | | | | EUR | | | | | | | | | | | | | |
| | | | | | | |
| EUR Currency Call | | | GSCO-OT | | | | 1303.350 | | | | 9/30/19 | | | | (75,000 | ) | | | EUR 150,000 | | | | 1,018,986 | | | | (1,245,040) | |
| | | | | | | CLP | | | | | | | | EUR | | | | | | | | | | | | | |
| | | | | | | |
| EUR Currency Call | | | JPM | | | | 796.350 | | | | 7/15/19 | | | | (25,000 | ) | | | EUR 50,000 | | | | 497,962 | | | | (248,854) | |
| | | | | | | RUB | | | | | | | | EUR | | | | | | | | | | | | | |
| | | | | | | |
| EUR Currency Put | | | JPM | | | | 73.800 | | | | 8/5/19 | | | | (50,000 | ) | | | EUR 105,000 | | | | 558,421 | | | | (886,218) | |
| | | | | | | ZAR | | | | | | | | EUR | | | | | | | | | | | | | |
| | | | | | | |
| EUR Currency Call | | | JPM | | | | 16.793 | | | | 5/31/19 | | | | (25,000 | ) | | | EUR 75,000 | | | | 387,342 | | | | (494,445) | |
| | | | | | | ZAR | | | | | | | | EUR | | | | | | | | | | | | | |
| | | | | | | |
| EUR Currency Call | | | JPM | | | | 17.438 | | | | 7/10/19 | | | | (50,000 | ) | | | EUR 75,000 | | | | 2,747,871 | | | | (932,116) | |
| | | | | | | ZAR | | | | | | | | EUR | | | | | | | | | | | | | |
| | | | | | | |
| EUR Currency Put | | | JPM | | | | 15.035 | | | | 5/31/19 | | | | (25,000 | ) | | | EUR 75,000 | | | | 297,786 | | | | (51,614) | |
| | | | | | | RUB | | | | | | | | EUR | | | | | | | | | | | | | |
| | | | | | | |
| EUR Currency Call | | | JPM | | | | 83.000 | | | | 8/5/19 | | | | (50,000 | ) | | | EUR 105,000 | | | | 838,277 | | | | (397,057) | |
| | | | | | | ZAR | | | | | | | | EUR | | | | | | | | | | | | | |
| | | | | | | |
| EUR Currency Put | | | JPM | | | | 15.300 | | | | 8/13/19 | | | | (25,000 | ) | | | EUR 50,000 | | | | 465,609 | | | | (209,941) | |
| | | | | | | ZAR | | | | | | | | EUR | | | | | | | | | | | | | |
| | | | | | | |
| EUR Currency Put | | | JPM | | | | 14.713 | | | | 1/6/20 | | | | (50,000 | ) | | | EUR 75,000 | | | | 661,180 | | | | (353,331) | |
| | | | | | | RUB | | | | | | | | EUR | | | | | | | | | | | | | |
| | | | | | | |
| EUR Currency Put | | | JPM | | | | 71.400 | | | | 6/27/19 | | | | (90,000 | ) | | | EUR 200,000 | | | | 609,723 | | | | (523,280) | |
| | | | | | | ZAR | | | | | | | | EUR | | | | | | | | | | | | | |
| | | | | | | |
| EUR Currency Call | | | JPM | | | | 17.454 | | | | 9/20/19 | | | | (100,000 | ) | | | EUR 100,000 | | | | 2,993,492 | | | | (3,307,150) | |
| | | | | | | INR | | | | | | | | EUR | | | | | | | | | | | | | |
| | | | | | | |
| EUR Currency Call | | | JPM | | | | 80.400 | | | | 6/21/19 | | | | (45,000 | ) | | | EUR 100,000 | | | | 587,344 | | | | (488,422) | |
35 OPPENHEIMER INTERNATIONAL BOND FUND
CONSOLIDATED STATEMENT OF INVESTMENTSUnaudited /Continued
| | | | | | | | | | | | | | | | | | | | | | | | | | | | |
Over-the-Counter Options Written (Continued) | | | | | | | | | | | | | | | | | |
| | | | | | | |
| Description | | Counter -party | | | Exercise Price | | | Expiration Date | | | Number of
Contracts (000’s) | | | Notional Amount (000’s) | | | Premiums
Received | | | Value | |
| | | | | | | ZAR | | | | | | | | EUR | | | | | | | | | | | | | |
| | | | | | | |
| EUR Currency Call | | | JPM | | | | 19.700 | | | | 1/6/20 | | | | (50,000 | ) | | | EUR 75,000 | | | $ | 1,835,788 | | | $ | (1,125,824) | |
| | | | | | | ZAR | | | | | | | | EUR | | | | | | | | | | | | | |
| | | | | | | |
| EUR Currency Call | | | JPM | | | | 17.825 | | | | 8/13/19 | | | | (25,000 | ) | | | EUR 50,000 | | | | 465,609 | | | | (501,454) | |
| | | | | | | EUR | | | | | | | | EUR | | | | | | | | | | | | | |
| | | | | | | |
| French Republic Government Bonds Call | | | MSCO | | | | 104.030 | | | | 6/25/19 | | | | (190,000 | ) | | | EUR 198,974 | | | | 1,631,950 | | | | (1,884,358) | |
| | | | | | | IDR | | | | | | | | IDR | | | | | | | | | | | | | |
| | | | | | | |
| IDR Currency Put | | | GSCO-OT | | | | 17550.000 | | | | 9/6/19 | | | | (3,282,950,000 | ) | | | IDR 5,107,050,000 | | | | 5,406,111 | | | | — | |
| | | | | | | IDR | | | | | | | | IDR | | | | | | | | | | | | | |
| | | | | | | |
| IDR Currency Put | | | GSCO-OT | | | | 15000.000 | | | | 7/10/19 | | | | (1,500,000,000 | ) | | | IDR 3,005,250,000 | | | | 3,650,000 | | | | — | |
| | | | | | | INR | | | | | | | | INR | | | | | | | | | | | | | |
| | | | | | | |
| INR Currency Put | | | GSCO-OT | | | | 80.050 | | | | 10/14/19 | | | | (4,002,500 | ) | | | INR 8,005,000 | | | | 1,000,000 | | | | (96,060) | |
| | | | | | | INR | | | | | | | | INR | | | | | | | | | | | | | |
| | | | | | | |
| INR Currency Put | | | GSCO-OT | | | | 71.650 | | | | 6/21/19 | | | | (5,373,750 | ) | | | INR 7,165,000 | | | | 456,675 | | | | (629,750) | |
| | | | | | | INR | | | | | | | | INR | | | | | | | | | | | | | |
| | | | | | | |
| INR Currency Call | | | GSCO-OT | | | | 67.000 | | | | 6/21/19 | | | | (5,025,000 | ) | | | INR 6,700,000 | | | | 217,200 | | | | (134,067) | |
| | | | | | | JPY | | | | | | | | JPY | | | | | | | | | | | | | |
| | | | | | | |
| JPY Currency Put | | | DEU | | | | 113.000 | | | | 8/22/19 | | | | (25,425,000 | ) | | | JPY 25,425,000 | | | | 1,300,725 | | | | (1,102,682) | |
| | | | | | | JPY | | | | | | | | JPY | | | | | | | | | | | | | |
| | | | | | | |
| JPY Currency Call | | | DEU | | | | 105.000 | | | | 8/22/19 | | | | (23,625,000 | ) | | | JPY 23,625,000 | | | | 1,819,350 | | | | (1,259,685) | |
| | | | | | | JPY | | | | | | | | JPY | | | | | | | | | | | | | |
| | | | | | | |
| JPY Currency Put | | | SCB | | | | 112.000 | | | | 5/29/19 | | | | (16,800,000 | ) | | | JPY 16,800,000 | | | | 574,650 | | | | (542,976) | |
| | | | | | | JPY | | | | | | | | JPY | | | | | | | | | | | | | |
| | | | | | | |
| JPY Currency Call | | | SCB | | | | 107.400 | | | | 5/29/19 | | | | (16,110,000 | ) | | | JPY 16,110,000 | | | | 823,200 | | | | (458,330) | |
| | | | | | | KRW | | | | | | | | KRW | | | | | | | | | | | | | |
| | | | | | | |
| KRW Currency Put | | | GSCO-OT | | | | 1155.000 | | | | 7/18/19 | | | | (57,750,000 | ) | | | KRW 115,500,000 | | | | 345,000 | | | | (410,603) | |
| | | | | | | KRW | | | | | | | | KRW | | | | | | | | | | | | | |
| | | | | | | |
| KRW Currency Call6 | | | GSCO-OT | | | | 1115.000 | | | | 7/18/19 | | | | (55,750,000 | ) | | | KRW 111,500,000 | | | | 324,999 | | | | (197,912) | |
| | | | | | | MXN | | | | | | | | MXN | | | | | | | | | | | | | |
| | | | | | | |
| MXN Currency Put | | | CITNA-B | | | | 22.828 | | | | 8/15/19 | | | | (1,141,405 | ) | | | MXN 1,712,108 | | | | 1,282,936 | | | | (151,807) | |
| | | | | | | MXN | | | | | | | | MXN | | | | | | | | | | | | | |
| | | | | | | |
| MXN Currency Put | | | GSCO-OT | | | | 22.562 | | | | 3/4/20 | | | | (3,008,200 | ) | | | MXN 4,512,300 | | | | 2,951,733 | | | | (2,213,403) | |
| | | | | | | MXN | | | | | | | | MXN | | | | | | | | | | | | | |
| | | | | | | |
| MXN Currency Call | | | GSCO-OT | | | | 18.099 | | | | 3/4/20 | | | | (2,413,130 | ) | | | MXN 3,619,700 | | | | 1,183,465 | | | | (723,867) | |
| | | | | | | MXN | | | | | | | | MXN | | | | | | | | | | | | | |
| | | | | | | |
| MXN Currency Put | | | SCB | | | | 20.250 | | | | 6/18/19 | | | | (1,012,500 | ) | | | MXN 3,037,500 | | | | 295,600 | | | | (525,538) | |
36 OPPENHEIMER INTERNATIONAL BOND FUND
| | | | | | | | | | | | | | | | | | | | | | | | | | | | |
Over-the-Counter Options Written (Continued) | | | | | | | | | | | | | | | | | |
| | | | | | | |
| Description | | Counter -party | | | Exercise Price | | | Expiration Date | | | Number of
Contracts (000’s) | | | Notional Amount (000’s) | | | Premiums
Received | | | Value | |
| | | | | | | MXN | | | | | | | | MXN | | | | | | | | | | | | | |
| | | | | | | |
| MXN Currency Call | | | SCB | | | | 18.550 | | | | 6/18/19 | | | | (927,500 | ) | | | MXN 2,782,500 | | | $ | 188,400 | | | $ | (146,165) | |
| | | | | | | NOK | | | | | | | | NOK | | | | | | | | | | | | | |
| | | | | | | |
| NOK Currency Call | | | BOA | | | | 8.620 | | | | 6/10/19 | | | | (1,508,500 | ) | | | NOK 1,508,500 | | | | 1,554,175 | | | | (2,784,118) | |
| | | | | | | NOK | | | | | | | | NOK | | | | | | | | | | | | | |
| | | | | | | |
| NOK Currency Call | | | JPM | | | | 8.620 | | | | 6/10/19 | | | | (646,500 | ) | | | NOK 646,500 | | | | 651,784 | | | | (1,193,193) | |
| | | | | | | PLN | | | | | | | | PLN | | | | | | | | | | | | | |
| | | | | | | |
| PLN Currency Call | | | GSCO-OT | | | | 3.714 | | | | 6/26/19 | | | | (371,400 | ) | | | PLN 371,400 | | | | 615,200 | | | | (459,700) | |
| | | | | | | PLN | | | | | | | | PLN | | | | | | | | | | | | | |
| | | | | | | |
| PLN Currency Put | | | GSCO-OT | | | | 4.050 | | | | 2/26/20 | | | | (1,012,500 | ) | | | PLN 1,012,500 | | | | 4,090,750 | | | | (4,094,591) | |
| | | | | | | RUB | | | | | | | | RUB | | | | | | | | | | | | | |
| | | | | | | |
| RUB Currency Put | | | GSCO-OT | | | | 80.000 | | | | 2/5/21 | | | | (6,000,000 | ) | | | RUB 8,400,000 | | | | 3,443,775 | | | | (3,084,180) | |
| | | | | | | RUB | | | | | | | | RUB | | | | | | | | | | | | | |
| | | | | | | |
| RUB Currency Call | | | GSCO-OT | | | | 60.000 | | | | 2/5/21 | | | | (4,500,000 | ) | | | RUB 6,300,000 | | | | 673,050 | | | | (639,270) | |
| | | | | | | RUB | | | | | | | | RUB | | | | | | | | | | | | | |
| | | | | | | |
| RUB Currency Put | | | GSCO-OT | | | | 70.000 | | | | 6/12/19 | | | | (8,750,000 | ) | | | RUB 10,147,121 | | | | 3,986,375 | | | | (936,250) | |
| | | | | | | RUB | | | | | | | | RUB | | | | | | | | | | | | | |
| | | | | | | |
| RUB Currency Put | | | JPM | | | | 70.000 | | | | 6/7/19 | | | | (10,500,000 | ) | | | RUB 17,500,000 | | | | 4,208,369 | | | | (1,029,000) | |
| | | | | | | | | | | | | | | USD | | | | | | | | | | | | | |
| | | | | | | |
| S&P 500 Index Put | | | BOA | | | | 2335.470 | | | | 2/21/20 | | | | (38 | ) | | | USD 106,333 | | | | 2,176,747 | | | | (1,677,883) | |
| | | | | | | | | | | | | | | USD | | | | | | | | | | | | | |
| | | | | | | |
| S&P 500 Index Put | | | GSCO-OT | | | | 2397.620 | | | | 3/13/20 | | | | (35 | ) | | | USD 100,485 | | | | 1,930,000 | | | | (1,997,510) | |
| | | | | | | | | | | | | | | USD | | | | | | | | | | | | | |
| | | | | | | |
| S&P 500 Index Put | | | JPM | | | | 2378.810 | | | | 2/26/20 | | | | (53 | ) | | | USD 150,937 | | | | 2,976,169 | | | | (2,706,696) | |
| | | | | | | CNH | | | | | | | | SGD | | | | | | | | | | | | | |
| | | | | | | |
| SGD Currency Put | | | GSCO-OT | | | | 4.862 | | | | 5/17/19 | | | | (75,000 | ) | | | SGD 150,000 | | | | 97,172 | | | | (37,736) | |
| | | | | | | CNN | | | | | | | | SGD | | | | | | | | | | | | | |
| | | | | | | |
| SGD Currency Call | | | GSCO-OT | | | | 5.052 | | | | 5/17/19 | | | | (75,000 | ) | | | SGD 150,000 | | | | 183,238 | | | | (57,148) | |
| | | | | | | TRY | | | | | | | | TRY | | | | | | | | | | | | | |
| | | | | | | |
| TRY Currency Put | | | GSCO-OT | | | | 6.750 | | | | 1/15/20 | | | | (337,500 | ) | | | TRY 702,000 | | | | 2,346,600 | | | | (5,225,449) | |
| | | | | | | TRY | | | | | | | | TRY | | | | | | | | | | | | | |
| | | | | | | |
| TRY Currency Call | | | GSCO-OT | | | | 5.367 | | | | 2/27/20 | | | | (268,325 | ) | | | TRY 536,650 | | | | 508,950 | | | | (927,205) | |
| | | | | | | TRY | | | | | | | | TRY | | | | | | | | | | | | | |
| | | | | | | |
| TRY Currency Call | | | GSCO-OT | | | | 5.250 | | | | 10/16/19 | | | | (262,500 | ) | | | TRY 536,650 | | | | 619,750 | | | | (652,055) | |
| | | | | | | ZAR | | | | | | | | ZAR | | | | | | | | | | | | | |
| | | | | | | |
| ZAR Currency Put | | | GSCO-OT | | | | 16.208 | | | | 1/27/20 | | | | (810,376 | ) | | | ZAR 1,215,563 | | | | 1,465,301 | | | | (1,795,241) | |
37 OPPENHEIMER INTERNATIONAL BOND FUND
CONSOLIDATED STATEMENT OF INVESTMENTSUnaudited / Continued
| | | | | | | | | | | | | | | | | | | | | | | | | | |
Over-the-Counter Options Written (Continued) | | | | | | | | | |
| Description | | Counter
-party | | Exercise
Price | | | Expiration
Date | | | Number of
Contracts
(000’s) | | | Notional
Amount
(000’s) | | | Premiums
Received | | | Value | |
| | | | | ZAR | | | | | | | | ZAR | | | | | | | | | | | | | |
| | | | | | | |
| ZAR Currency Call | | GSCO-OT | | | 12.283 | | | | 1/27/20 | | | | (614,150) | | | | ZAR 921,225 | | | $ | 529,300 | | | $ | (179,958) | |
| |
| | | | | ZAR | | | | | | | | ZAR | | | | | | | | | | | | | |
| | | | | | | |
| ZAR Currency Put | | GSCO-OT | | | 15.000 | | | | 8/23/19 | | | | (3,375,000) | | | | ZAR 5,250,000 | | | | 5,582,475 | | | | (7,707,049) | |
| |
| | | | | ZAR | | | | | | | | ZAR | | | | | | | | | | | | | |
| | | | | | | |
| ZAR Currency Put | | GSCO-OT | | | 14.646 | | | | 5/27/19 | | | | (1,098,450) | | | | ZAR 1,464,600 | | | | 2,010,300 | | | | (1,803,655) | |
| | | | | | | | | | | | | | | | | | | | | | |
| Total Over-the-Counter Options Written | | | | | | | | | | | | | | | | | | | | $ | 118,879,668 | | | $ | (102,004,150) | |
| | | | | | | | | | | | | | | | | | | | | | |
1.Knock-out option becomes ineligible for exercise if at any time spot rates are less than or equal to 3.70 BRL/USD.
2.Knock-out option becomes ineligible for exercise if at any time spot rates are less than or equal to 3.61 BRL/USD.
3.Knock-out option becomes ineligible for exercise if at any time spot rates are less than or equal to 3.60 BRL/USD.
4.Knock-out option becomes ineligible for exercise if at any time spot rates are less than or equal to 15.50 ZAR/USD.
5.Knock-out option becomes ineligible for exercise if at any time spot rates are less than or equal to 9.40 NOK/USD.
6.Knock-out option becomes ineligible for exercise if at any time spot rates are less than or equal to 1,085.00 KRW/USD.
| | | | | | | | | | | | | | | | | | | | | | | | | | | | |
Centrally Cleared Credit Default Swaps at March 31, 2019 | | | | | |
| Reference Asset | | Buy/Sell
Protection | | | Fixed
Rate | | | Maturity
Date | | | Notional Amount (000’s) | | | Premiums
Received/ (Paid) | | | Value | | | Unrealized
Appreciation/
(Depreciation) | |
| Brazilian Government International | | | Buy | | | | 1.000% | | | | 6/20/24 | | | USD | 6,500 | | | $ | (235,795) | | | $ | 228,011 | | | $ | (7,784) | |
| |
| Brazilian Government International | | | Buy | | | | 1.000 | | | | 6/20/24 | | | USD | 12,750 | | | | (482,484) | | | | 447,946 | | | | (34,538) | |
| |
| Brazilian Government International | | | Buy | | | | 1.000 | | | | 6/20/24 | | | USD | 13,750 | | | | (525,542) | | | | 483,079 | | | | (42,463) | |
| |
| CDX.EM.31 | | | Buy | | | | 1.000 | | | | 6/20/24 | | | USD | 17,250 | | | | (602,217) | | | | 626,235 | | | | 24,018 | |
| |
| CDX.EM.31 | | | Buy | | | | 1.000 | | | | 6/20/24 | | | USD | 13,000 | | | | (453,844) | | | | 472,473 | | | | 18,629 | |
| |
| Federative Republic of Brazil | | | Sell | | | | 1.000 | | | | 6/20/22 | | | USD | 15,000 | | | | 928,605 | | | | (89,691) | | | | 838,914 | |
| |
| Intesa Sanpaolo SpA | | | Buy | | | | 1.000 | | | | 12/20/21 | | | EUR | 15,000 | | | | (548,712) | | | | (33,371) | | | | (582,083) | |
| |
| Mexico Government International | | | Buy | | | | 1.000 | | | | 6/20/24 | | | USD | 27,500 | | | | (587,377) | | | | 272,994 | | | | (314,383) | |
| |
| Mexico Government International | | | Buy | | | | 1.000 | | | | 6/20/24 | | | USD | 19,000 | | | | (405,824) | | | | 188,614 | | | | (217,210) | |
| |
| Mexico Government International | | | Buy | | | | 1.000 | | | | 6/20/24 | | | USD | 9,500 | | | | (137,166) | | | | 94,307 | | | | (42,859) | |
| |
| Republic of Italy | | | Sell | | | | 1.000 | | | | 12/20/21 | | | USD | 16,000 | | | | 585,507 | | | | (176,098) | | | | 409,409 | |
| |
| Republic Of South Africa Gover | | | Buy | | | | 1.000 | | | | 6/20/24 | | | USD | 13,750 | | | | (619,836) | | | | 639,612 | | | | 19,776 | |
| |
| Republic Of South Africa Gover | | | Buy | | | | 1.000 | | | | 6/20/24 | | | USD | 16,000 | | | | (721,263) | | | | 744,276 | | | | 23,013 | |
38 OPPENHEIMER INTERNATIONAL BOND FUND
| | | | | | | | | | | | | | | | | | | | | | | | | | |
Centrally Cleared Credit Default Swaps (Continued) | | | | | | | | | |
Reference
Asset | | Buy/Sell
Protection | | | Fixed
Rate | | Maturity
Date | | | Notional
Amount
(000’s) | | | Premiums
Received/
(Paid) | | | Value | | | Unrealized
Appreciation/ (Depreciation) | |
| Russian Foreign Bond - Eurobon | | | Buy | | | 1.000% | | | 6/20/24 | | | | USD 9,500 | | | $ | (179,275) | | | $ | 155,812 | | | $ | (23,463) | |
| | | | | | | | | | | | | | | | | | |
| Total Centrally Cleared Credit Default Swaps | | | $ | (3,985,223) | | | $ | 4,054,199 | | | $ | 68,976 | |
| | | | | | | | | | | | | | | | | | |
| | | | | | | | | | | | | | | | | | | | | | | | | | | | | | | | |
Over-the-Counter Credit Default Swaps at March 31, 2019 | | | | | | | | | |
Reference Asset | | Counter-
party | | | Buy/Sell
Protection | | | Fixed
Rate | | | Maturity
Date | | | Notional
Amount
(000’s) | | | Premiums
Received/
(Paid) | | | Value | | | Unrealized
Appreciation/
(Depreciation) | |
| Hellenic Republic | | | BAC | | | | Sell | | | | 1.000% | | | | 6/20/25 | | | USD | 5,000 | | | $ | 831,849 | | | $ | (743,763) | | | $ | 88,086 | |
| |
| Hellenic Republic | | | BAC | | | | Sell | | | | 1.000 | | | | 6/20/25 | | | USD | 12,500 | | | | 1,872,869 | | | | (1,859,408) | | | | 13,461 | |
| |
| Hellenic Republic | | | BAC | | | | Sell | | | | 1.000 | | | | 12/20/25 | | | USD | 23,250 | | | | 3,615,506 | | | | (3,792,034) | | | | (176,528) | |
| |
| Hellenic Republic | | | BAC | | | | Sell | | | | 1.000 | | | | 12/20/19 | | | USD | 16,650 | | | | 249,821 | | | | 1,171 | | | | 250,992 | |
| |
| Hellenic Republic | | | GSCOI | | | | Sell | | | | 1.000 | | | | 6/20/25 | | | USD | 5,000 | | | | 788,898 | | | | (743,763) | | | | 45,135 | |
| |
| ICICI Bank Ltd. | | | GSCO-OT | | | | Sell | | | | 1.000 | | | | 12/20/19 | | �� | USD | 10,000 | | | | 359,971 | | | | 64,970 | | | | 424,941 | |
| |
| iTraxx Europe Crossover Series 24 Version 1 | | | JPM | | | | Sell | | | | 5.000 | | | | 12/20/20 | | | EUR | 5,000 | | | | (361,394) | | | | 386,274 | | | | 24,880 | |
| |
| Oriental Republic of Uruguay | | | BOA | | | | Sell | | | | 1.000 | | | | 12/20/21 | | | USD | 14,802 | | | | 267,519 | | | | 213,477 | | | | 480,996 | |
| |
| State Bank of India | | | BNP | | | | Sell | | | | 1.000 | | | | 9/20/19 | | | USD | 13,035 | | | | 537,811 | | | | 56,580 | | | | 594,391 | |
| | | | | | | | | | | | | | | | | | | | | | | | |
| TotalOver-the-Counter Credit Default Swaps | | | | | | | | | | | $ | 8,162,850 | | | $ | (6,416,496) | | | $ | 1,746,354 | |
| | | | | | | | | | | | | | | | | | | | | | | | |
The table that follows shows the undiscounted maximum potential payment by the Fund related to selling credit protection in credit default swaps:
| | | | | | | | | | |
Type of Reference Asset on which the Fund Sold Protection | | Total Maximum
Potential Payments
for Selling Credit
Protection
(Undiscounted) | | | Amount
Recoverable* | | | Reference
Asset Rating
Range** |
| Investment Grade Single | | | | | | | | | | |
| Name Corporate Debt | | $ | 23,035,000 | | | | | | | BBB- |
| Non-Investment Grade | | | | | | | | | | |
| Corporate Debt | | | 5,000,000 | | | | | | | C |
| Investment Grade | | | | | | | | | | |
| Sovereign Debt | | | 30,802,000 | | | | | | | BBB |
| Non-Investment Grade | | | | | | | | | | |
| Sovereign Debt | | | 77,400,000 | | | $ | 26,500,000 | | | BB- to B |
| | | | | | | | | | |
Total USD | | $ | 136,237,000 | | | $ | 26,500,000 | | | |
| | | | | | | | | | |
*Amounts recoverable includes potential payments from related purchased protection for instances where the Fund is the seller of protection. In addition, the Fund has no recourse provisions under the credit derivatives and holds no collateral which can offset or reduce potential payments under a triggering event.
** The period end reference asset security ratings, as rated by any rating organization, are included in the equivalent Standard & Poor’s rating category. The reference asset rating represents the likelihood of a potential credit event on the reference asset which would result in a related payment by the Fund.
39 OPPENHEIMER INTERNATIONAL BOND FUND
CONSOLIDATED STATEMENT OF INVESTMENTSUnaudited / Continued
| | | | | | | | |
| Centrally Cleared Interest Rate Swaps at March 31, 2019 | | |
| | | | | | | | | | | | | | | | | | | | | | | | | | | | | | | | |
Counter- party | | Pay/Receive
Floating
Rate | | | Floating Rate | | | Fixed
Rate | | | Maturity
Date | | | Notional Amount (000’s) | | | Premiums
Received /
(Paid) | | | Value | | | Unrealized
Appreciation/ (Depreciation) | |
| | | | | | | Six-Month EUR | | | | | | | | | | | | | | | | | | | | | | | | | |
BAC | | | Receive | | | | EURIBOR | | | | 1.123% | | | | 3/8/28 | | | | EUR 8,250 | | | $ | — | | | $ | (622,064 | ) | | $ | (622,064) | |
| |
| | | | | | | Six-Month HUF- | | | | | | | | | | | | HUF | | | | | | | | | | | | | |
BNP | | | Pay | | | | BUBOR-Reuters | | | | 1.210 | | | | 10/26/20 | | | | 14,305,000 | | | | — | | | | 744,179 | | | | 744,179 | |
| |
| | | | | | | Six-Month HUF- | | | | | | | | | | | | HUF | | | | | | | | | | | | | |
BNP | | | Receive | | | | BUBOR-Reuters | | | | 3.280 | | | | 10/26/28 | | | | 3,235,000 | | | | — | | | | (1,556,252 | ) | | | (1,556,252) | |
| |
| | | | | | | MXN TIIE | | | | | | | | | | | | MXN | | | | | | | | | | | | | |
BNP | | | Pay | | | | BANXICO | | | | 8.000 | | | | 8/13/20 | | | | 2,147,000 | | | | — | | | | (94,383 | ) | | | (94,383) | |
| |
BOA | | | Receive | | | | CDOR03 | | | | 2.120 | | | | 6/1/27 | | | | CAD 76,200 | | | | — | | | | (492,125 | ) | | | (492,125) | |
| |
BOA | | | Receive | | | | BZDI | | | | 6.550 | | | | 1/2/20 | | | | BRL 223,530 | | | | — | | | | (24,538 | ) | | | (24,538) | |
| |
| | | | | | | Three-Month USD | | | | | | | | | | | | | | | | | | | | | | | | | |
BOA | | | Receive | | | | BBA LIBOR | | | | 2.304 | | | | 5/30/22 | | | | USD 289,855 | | | | — | | | | (234,209 | ) | | | (234,209) | |
| |
BOA | | | Receive | | | | CDOR03 | | | | 2.165 | | | | 6/1/27 | | | | CAD 68,500 | | | | — | | | | (609,114 | ) | | | (609,114) | |
| |
| | | | | | | Three-Month USD | | | | | | | | | | | | | | | | | | | | | | | | | |
BOA | | | Receive | | | | BBA LIBOR | | | | 2.410 | | | | 3/26/22 | | | | USD 50,000 | | | | — | | | | (140,633 | ) | | | (140,633) | |
| |
BOA | | | Pay | | | | BZDI | | | | 9.160 | | | | 7/1/22 | | | | BRL 431,800 | | | | — | | | | (105,159 | ) | | | (105,159) | |
| |
| | | | | | | Three-Month USD | | | | | | | | | | | | | | | | | | | | | | | | | |
BOA | | | Receive | | | | BBA LIBOR | | | | 2.320 | | | | 3/28/22 | | | | USD 34,100 | | | | — | | | | (13,157 | ) | | | (13,157) | |
| |
BOA | | | Pay | | | | BBSW3M | | | | 1.470 | | | | 3/26/22 | | | | AUD 47,500 | | | | — | | | | (17,540 | ) | | | (17,540) | |
| |
| | | | | | | Three-Month USD | | | | | | | | | | | | | | | | | | | | | | | | | |
BOA | | | Receive | | | | BBA LIBOR | | | | 2.320 | | | | 3/28/22 | | | | USD 86,000 | | | | — | | | | (33,182 | ) | | | (33,182) | |
| |
| | | | | | | MXN TIIE | | | | | | | | | | | | | | | | | | | | | | | | | |
BOA | | | Receive | | | | BANXICO | | | | 6.500 | | | | 11/24/26 | | | | MXN 500,000 | | | | (7 | ) | | | (2,174,875 | ) | | | (2,174,882) | |
| |
BOA | | | Pay | | | | BBSW3M | | | | 1.500 | | | | 3/26/22 | | | | AUD 118,000 | | | | — | | | | 30,293 | | | | 30,293 | |
| |
| | | | | | | Three-Month USD | | | | | | | | | | | | | | | | | | | | | | | | | |
BOA | | | Receive | | | | BBA LIBOR | | | | 2.307 | | | | 4/2/24 | | | | USD 52,900 | | | | — | | | | (67,792 | ) | | | (67,792) | |
| |
BOA | | | Pay | | | | BBSW3M | | | | 1.560 | | | | 3/22/22 | | | | AUD 71,000 | | | | — | | | | (1,023,643 | ) | | | (1,023,643) | |
| |
| | | | | | | Six-Month HUF | | | | | | | | | | | | HUF | | | | | | | | | | | | | |
CITNA-B | | | Pay | | | | BUBOR | | | | 2.205 | | | | 3/8/28 | | | | 2,750,000 | | | | — | | | | 285,249 | | | | 285,249 | |
| |
| | | | | | | Three-Month ZAR | | | | | | | | | | | | | | | | | | | | | | | | | |
CITNA-B | | | Pay | | | | JIBAR SAFEX | | | | 8.590 | | | | 1/23/28 | | | | ZAR 508,000 | | | | — | | | | 88,194 | | | | 88,194 | |
| |
CITNA-B | | | Receive | | | | JIBA3M | | | | 8.050 | | | | 2/22/29 | | | | ZAR 200,000 | | | | — | | | | (79,831 | ) | | | (79,831) | |
| |
CITNA-B | | | Receive | | | | JIBA3M | | | | 7.250 | | | | 7/10/20 | | | | ZAR 585,000 | | | | — | | | | (76,592 | ) | | | (76,592) | |
| |
DEU | | | Receive | | | | JIBA3M | | | | 7.120 | | | | 6/29/19 | | | | ZAR 1,433,300 | | | | — | | | | 9,130 | | | | 9,130 | |
| |
DEU | | | Pay | | | | JIBA3M | | | | 8.420 | | | | 8/29/28 | | | | ZAR 556,000 | | | | — | | | | 1,277,902 | | | | 1,277,902 | |
| |
| | | | | | | MXN TIIE | | | | | | | | | | | | | | | | | | | | | | | | | |
DEU | | | Pay | | | | BANXICO | | | | 8.525 | | | | 1/15/24 | | | | MXN 480,000 | | | | — | | | | 710,203 | | | | 710,203 | |
| |
DEU | | | Receive | | | | JIBA3M | | | | 7.500 | | | | 8/15/20 | | | | ZAR 785,000 | | | | — | | | | (297,832 | ) | | | (297,832) | |
| |
| | | | | | | MXN TIIE | | | | | | | | | | | | | | | | | | | | | | | | | |
GSCOI | | | Receive | | | | BANXICO | | | | 8.505 | | | | 5/31/29 | | | | MXN 415,000 | | | | — | | | | (557,718 | ) | | | (557,718) | |
| |
| | | | | | | MXN TIIE | | | | | | | | | | | | | | | | | | | | | | | | | |
GSCOI | | | Pay | | | | BANXICO | | | | 8.620 | | | | 12/26/28 | | | | MXN 247,400 | | | | — | | | | 450,011 | | | | 450,011 | |
| |
GSCOI | | | Pay | | | | SORF6M | | | | 1.980 | | | | 3/4/21 | | | | SGD 172,000 | | | | — | | | | 181,647 | | | | 181,647 | |
| |
| | | | | | | | | | | | | | | | | | | COP | | | | | | | | | | | | | |
GSCOI | | | Receive | | | | COOVIBR | | | | 4.925 | | | | 3/5/22 | | | | 109,700,000 | | | | — | | | | (219,824 | ) | | | (219,824) | |
| |
| | | | | | | | | | | | | | | | | | | COP | | | | | | | | | | | | | |
GSCOI | | | Pay | | | | COOVIBR | | | | 4.380 | | | | 3/5/20 | | | | 317,100,000 | | | | — | | | | 155,461 | | | | 155,461 | |
| |
| | | | | | | MXN TIIE | | | | | | | | | | | | MXN | | | | | | | | | | | | | |
GSCOI | | | Pay | | | | BANXICO | | | | 8.055 | | | | 3/2/22 | | | | 1,430,000 | | | | — | | | | 330,059 | | | | 330,059 | |
40 OPPENHEIMER INTERNATIONAL BOND FUND
| | | | | | | | |
| Centrally Cleared Interest Rate Swaps (Continued) | | |
| | | | | | | | | | | | | | | | | | | | | | | | | | | | | | | | |
Counter-
party | | Pay/Receive
Floating
Rate | | | Floating
Rate | | | Fixed
Rate | | | Maturity
Date | | | Notional
Amount
(000’s) | | | Premiums
Received /
(Paid) | | | Value | | | Unrealized
Appreciation/ (Depreciation) | |
| |
| GSCOI | | | Receive | | | | SORF6M | | | | 2.073% | | | | 3/4/24 | | | | SGD 70,500 | | | $ | — | | | $ | (346,111 | ) | | $ | (346,111) | |
| |
| | | | | | | | | | | | | | | | | | | COP | | | | | | | | | | | | | |
| GSCOI | | | Pay | | | | COOVIBR | | | | 4.380 | | | | 1/10/20 | | | | 338,200,000 | | | | — | | | | 156,825 | | | | 156,825 | |
| |
| | | | | | | Three-Month USD | | | | | | | | | | | | | | | | | | | | | | | | | |
| GSCOI | | | Receive | | | | BBA LIBOR | | | | 2.281 | | | | 5/30/22 | | | | USD 322,500 | | | | — | | | | (47,878 | ) | | | (47,878) | |
| |
| | | | | | | MXN TIIE | | | | | | | | | | | | MXN | | | | | | | | | | | | | |
| GSCOI | | | Pay | | | | BANXICO | | | | 8.770 | | | | 10/29/20 | | | | 1,105,000 | | | | — | | | | 545,085 | | | | 545,085 | |
| |
| GSCOI | | | Receive | | | | BZDI | | | | 8.235 | | | | 1/2/20 | | | | BRL 316,000 | | | | — | | | | (1,837,780 | ) | | | (1,837,780) | |
| |
| | | | | | | Six-Month PLN | | | | | | | | | | | | | | | | | | | | | | | | | |
| GSCOI | | | Receive | | | | WIBOR WIBO | | | | 2.580 | | | | 2/6/23 | | | | PLN 115,000 | | | | — | | | | 824,196 | | | | 824,196 | |
| |
| | | | | | | MXN TIIE | | | | | | | | | | | | MXN | | | | | | | | | | | | | |
| GSCOI | | | Pay | | | | BANXICO | | | | 7.760 | | | | 9/25/20 | | | | 2,090,000 | | | | — | | | | (354,373 | ) | | | (354,373) | |
| |
| | | | | | | Six-Month | | | | | | | | | | | | | | | | | | | | | | | | | |
| GSCOI | | | Pay | | | | GBP-LIBOR-BBA | | | | 3.450 | | | | 10/15/25 | | | | GBP 49,000 | | | | — | | | | 551,350 | | | | 551,350 | |
| |
| | | | | | | MXN TIIE | | | | | | | | | | | | MXN | | | | | | | | | | | | | |
| GSCOI | | | Pay | | | | BANXICO | | | | 8.480 | | | | 10/27/20 | | | | 530,000 | | | | — | | | | 138,721 | | | | 138,721 | |
| |
| GSCOI | | | Pay | | | | BZDI | | | | 11.730 | | | | 1/2/25 | | | | BRL 124,700 | | | | — | | | | 3,501,779 | | | | 3,501,779 | |
| |
| | | | | | | | | | | | | | | | | | | COP | | | | | | | | | | | | | |
| GSCOI | | | Pay | | | | COOVIBR | | | | 4.610 | | | | 6/7/20 | | | | 146,700,000 | | | | — | | | | 209,899 | | | | 209,899 | |
| |
| | | | | | | Six-Month PLN | | | | | | | | | | | | | | | | | | | | | | | | | |
| GSCOI | | | Pay | | | | WIBOR WIBO | | | | 1.775 | | | | 10/10/21 | | | | PLN 95,000 | | | | 3,197 | | | | (16,532 | ) | | | (13,335) | |
| |
| | | | | | | Three-Month | | | | | | | | | | | | | | | | | | | | | | | | | |
| | | | | | | COP IBR OIS | | | | | | | | | | | | COP | | | | | | | | | | | | | |
| GSCOI | | | Pay | | | | Compound | | | | 6.500 | | | | 11/9/28 | | | | 41,100,000 | | | | — | | | | 591,602 | | | | 591,602 | |
| |
| | | | | | | Six-Month PLN | | | | | | | | | | | | | | | | | | | | | | | | | |
| GSCOI | | | Pay | | | | WIBOR WIBO | | | | 1.780 | | | | 6/10/21 | | | | PLN 200,000 | | | | (30,941 | ) | | | 455,158 | | | | 424,217 | |
| |
| | | | | | | MXN TIIE | | | | | | | | | | | | MXN | | | | | | | | | | | | | |
| HSBC | | | Pay | | | | BANXICO | | | | 8.320 | | | | 1/28/21 | | | | 1,030,000 | | | | — | | | | 231,916 | | | | 231,916 | |
| |
| | | | | | | MXN TIIE | | | | | | | | | | | | MXN | | | | | | | | | | | | | |
| HSBC | | | Receive | | | | BANXICO | | | | 8.600 | | | | 1/18/29 | | | | 276,600 | | | | — | | | | (480,544 | ) | | | (480,544) | |
| |
| | | | | | | Three-Month USD | | | | | | | | | | | | | | | | | | | | | | | | | |
| JPM | | | Receive | | | | BBA LIBOR | | | | 2.097 | | | | 6/8/27 | | | | USD 12,000 | | | | — | | | | 169,962 | | | | 169,962 | |
| |
| JPM | | | Pay | | | | BZDI | | | | 10.500 | | | | 7/1/20 | | | | BRL 500,000 | | | | — | | | | 1,797,055 | | | | 1,797,055 | |
| |
| | | | | | | Three-Month USD | | | | | | | | | | | | | | | | | | | | | | | | | |
| JPM | | | Pay | | | | BBA LIBOR | | | | 2.275 | | | | 9/3/24 | | | | USD 88,500 | | | | — | | | | 83,572 | | | | 83,572 | |
| |
| | | | | | | Six-Month PLN | | | | | | | | | | | | | | | | | | | | | | | | | |
| JPM | | | Pay | | | | WIBOR WIBO | | | | 2.090 | | | | 1/11/22 | | | | PLN 160,000 | | | | — | | | | 343,139 | | | | 343,139 | |
| |
| | | | | | | | | | | | | | | | | | | HUF | | | | | | | | | | | | | |
| JPM | | | Receive | | | | BUBOR06M | | | | 2.265 | | | | 1/8/29 | | | | 3,060,000 | | | | — | | | | (333,978 | ) | | | (333,978) | |
| |
| JPM | | | Pay | | | | BZDI | | | | 10.940 | | | | 1/2/23 | | | | BRL 160,000 | | | | — | | | | 3,270,643 | | | | 3,270,643 | |
| |
| | | | | | | MXN TIIE | | | | | | | | | | | | MXN | | | | | | | | | | | | | |
| JPM | | | Pay | | | | BANXICO | | | | 8.600 | | | | 10/27/20 | | | | 540,000 | | | | — | | | | 192,577 | | | | 192,577 | |
| |
| | | | | | | MXN TIIE | | | | | | | | | | | | MXN | | | | | | | | | | | | | |
| JPM | | | Pay | | | | BANXICO | | | | 8.750 | | | | 10/29/20 | | | | 2,210,000 | | | | — | | | | 1,055,237 | | | | 1,055,237 | |
| |
| JPM | | | Pay | | | | BZDI | | | | 9.280 | | | | 7/1/22 | | | | BRL 544,400 | | | | — | | | | (74,025 | ) | | | (74,025) | |
| |
| JPM | | | Pay | | | | BZDI | | | | 9.230 | | | | 7/1/22 | | | | BRL 530,000 | | | | — | | | | (95,808 | ) | | | (95,808) | |
| |
| | | | | | | | | | | | | | | | | | | HUF | | | | | | | | | | | | | |
| JPM | | | Pay | | | | BUBOR06M | | | | 1.185 | | | | 1/8/22 | | | | 9,500,000 | | | | — | | | | 433,943 | | | | 433,943 | |
| |
| | | | | | | Six-Month PLN | | | | | | | | | | | | | | | | | | | | | | | | | |
| JPM | | | Pay | | | | WIBOR WIBO | | | | 2.315 | | | | 1/15/26 | | | | PLN 90,200 | | | | (23,445 | ) | | | 388,087 | | | | 364,642 | |
41 OPPENHEIMER INTERNATIONAL BOND FUND
CONSOLIDATED STATEMENT OF INVESTMENTSUnaudited / Continued
| | | | | | | | |
| Centrally Cleared Interest Rate Swaps (Continued) | | |
| | | | | | | | | | | | | | | | | | | | | | | | | | | | |
Counter-
party | | Pay/Receive Floating Rate | | Floating Rate | | Fixed
Rate | | | Maturity
Date | | | Notional Amount (000’s) | | | Premiums
Received / (Paid) | | | Value | | | Unrealized
Appreciation/ (Depreciation) | |
| |
| SIB | | Receive | | BZDI | | | 6.560% | | | | 1/2/20 | | | | BRL 391,200 | | | $ | — | | | $ | (52,866 | ) | | $ | (52,866) | |
| |
| | | | MXN TIIE | | | | | | | | | | | | | | | | | | | | | | | | |
| SIB | | Receive | | BANXICO | | | 8.140 | | | | 1/26/24 | | | | MXN 685,000 | | | | — | | | | (466,431 | ) | | | (466,431) | |
| |
| | | | MXN TIIE | | | | | | | | | | | MXN | | | | | | | | | | | | | |
| SIB | | Pay | | BANXICO | | | 7.770 | | | | 3/25/24 | | | | 1,150,000 | | | | — | | | | (110,782 | ) | | | (110,782) | |
| |
| UBS | | Receive | | BBSW6M | | | 1.823 | | | | 3/21/24 | | | | AUD 147,500 | | | | — | | | | (602,735 | ) | | | (602,735) | |
| |
| UBS | | Pay | | BBSW3M | | | 1.560 | | | | 3/21/21 | | | | AUD 361,000 | | | | — | | | | 284,273 | | | | 284,273 | |
| | | | | | | | | | | | | | | | | | | | |
| Total Centrally Cleared Interest Rate Swaps | | | | | | | | | | | | | | $ | (51,196) | | | $ | 6,227,041 | | | $ | 6,175,845 | |
| | | | | | | | | | | | | | | | | | | | |
| | | | | | | | |
| Over-the-Counter Interest Rate Swaps at March 31, 2019 | | |
| | | | | | | | | | | | | | | | | | | | | | | | | | | | |
Counter-
party | | Pay/Receive
Floating
Rate | | Floating Rate | | Fixed
Rate | | | Maturity
Date | | | Notional Amount (000’s) | | | Premiums
Received /
(Paid) | | | Value | | | Unrealized
Appreciation/ (Depreciation) | |
| | | | | Six-Month INR | | | | | | | | | | | | | | | | | | | | | | | | |
| | | | FBIL MIBOR OIS | | | | | | | | | | | INR | | | | | | | | | | | | | |
| BOA | | Receive | | Compound | | | 5.790% | | | | 3/6/21 | | | | 4,750,000 | | | $ | — | | | $ | (40,996) | | | $ | (40,996) | |
| |
| CITNA-B | | Receive | | JIBA3M | | | 8.139 | | | | 1/31/30 | | | | ZAR 367,000 | | | | — | | | | (198,225) | | | | (198,225) | |
| |
| | | | Three-Month | | | | | | | | | | | | | | | | | | | | | | | | |
| | | | COP IBR OIS | | | | | | | | | | | COP | | | | | | | | | | | | | |
| GSCOI | | Pay | | Compound | | | 6.470 | | | | 9/29/26 | | | | 55,000,000 | | | | — | | | | 965,530 | | | | 965,530 | |
| |
| | | | Six-Month CLP | | | | | | | | | | | CLP | | | | | | | | | | | | | |
| GSCOI | | Pay | | TNA | | | 3.380 | | | | 9/14/22 | | | | 13,500,000 | | | | — | | | | 69,407 | | | | 69,407 | |
| |
| | | | | | | | | | | | | | | KRW | | | | | | | | | | | | | |
| GSCOI | | Receive | | KWCDC | | | 1.800 | | | | 3/5/24 | | | | 57,500,000 | | | | — | | | | (424,136) | | | | (424,136) | |
| |
| | | | | | | | | | | | | | | KRW | | | | | | | | | | | | | |
| GSCOI | | Pay | | KWCDC | | | 1.875 | | | | 3/5/20 | | | | 282,400,000 | | | | — | | | | 171,807 | | | | 171,807 | |
| |
| | | | Three-Month | | | | | | | | | | | | | | | | | | | | | | | | |
| | | | COP IBR OIS | | | | | | | | | | | COP | | | | | | | | | | | | | |
| JPM | | Pay | | Compound | | | 7.300 | | | | 6/1/26 | | | | 39,425,000 | | | | — | | | | 1,354,202 | | | | 1,354,202 | |
| |
| | | | Three-Month | | | | | | | | | | | | | | | | | | | | | | | | |
| | | | COP IBR OIS | | | | | | | | | | | COP | | | | | | | | | | | | | |
| JPM | | Pay | | Compound | | | 4.990 | | | | 5/2/20 | | | | 105,000,000 | | | | — | | | | 313,470 | | | | 313,470 | |
| |
| | | | Five-Year EUR | | | | | | | | | | | | | | | | | | | | | | | | |
| JPM | | Pay | | CPI EXT | | | 2.080 | | | | 5/24/37 | | | | EUR 50,000 | | | | — | | | | 800,509 | | | | 800,509 | |
| |
| | | | Five-Year EUR | | | | | | | | | | | | | | | | | | | | | | | | |
| JPM | | Receive | | CPI EXT | | | 1.603 | | | | 5/24/27 | | | | EUR 50,000 | | | | — | | | | (1,088,898) | | | | (1,088,898) | |
| |
| JPM | | Receive | | JIBA3M | | | 8.030 | | | | 1/31/30 | | | | ZAR 375,000 | | | | — | | | | 8,239 | | | | 8,239 | |
| |
| | | | Six-Month INR | | | | | | | | | | | | | | | | | | | | | | | | |
| | | | FBIL MIBOR OIS | | | | | | | | | | | INR | | | | | | | | | | | | | |
| SCB | | Receive | | Compound | | | 6.438 | | | | 1/10/24 | | | | 1,700,000 | | | | — | | | | (678,372) | | | | (678,372) | |
| | | | | | | | | | | | | | | | | | | | |
| TotalOver-the-Counter Interest Rate Swaps | | | | | | | | | | | | | | $ | — | | | $ | 1,252,537 | | | $ | 1,252,537 | |
| | | | | | | | | | | | | | | | | | | | |
42 OPPENHEIMER INTERNATIONAL BOND FUND
| | | | | | | | |
| Over-the-Counter Credit Default Swaptions Written at March 31, 2019 | | |
| | | | | | | | | | | | | | | | | | | | | | | | | | | | | | | | |
| Description | | Counter-
party | | | Buy/Sell
Protection | | | Reference Asset | | | Fixed
Rate | | | Expiration Date | | | Notional Amount (000’s) | | | Premiums
Received | | | Value | |
| | | | | | | | | | | | iTraxx | | | | | | | | | | | | | | | | | | | | | |
| | | | | | | | | | | Europe | | | | | | | | | | | | | | | | | | | | | |
| Credit Default Swap | | | | | | | | | | | Crossover | | | | | | | | | | | | | | | | | | | | | |
| maturing 12/20/23 | | | | | | | | | | | Series 30 | | | | | | | | | | | | | | | | | | | | | |
| Put | | | JPM | | | | Sell | | | | Version 2 | | | | 5.000 | % | | | 5/15/19 EUR | | | | 125,000 | | | $ | 348,954 | | | $ | (248,468 | ) |
| |
| | | | | | | | | | | iTraxx | | | | | | | | | | | | | | | | | | | | | |
| | | | | | | | | | | Europe | | | | | | | | | | | | | | | | | | | | | |
| Credit Default Swap | | | | | | | | | | | Crossover | | | | | | | | | | | | | | | | | | | | | |
| maturing 12/20/23 | | | | | | | | | | | Series 30 | | | | | | | | | | | | | | | | | | | | | |
| Put | | | JPM | | | | Sell | | | | Version 2 | | | | 5.000 | | | | 5/15/19 EUR | | | | 125,000 | | | | 558,326 | | | | (400,885 | ) |
| |
| | | | | | | | | | | iTraxx | | | | | | | | | | | | | | | | | | | | | |
| | | | | | | | | | | Europe | | | | | | | | | | | | | | | | | | | | | |
| Credit Default Swap | | | | | | | | | | | Crossover | | | | | | | | | | | | | | | | | | | | | |
| maturing 12/20/23 | | | | | | | | | | | Series 30 | | | | | | | | | | | | | | | | | | | | | |
| Put | | | JPM | | | | Sell | | | | Version 2 | | | | 5.000 | | | | 4/17/19 EUR | | | | 175,000 | | | | 459,223 | | | | (170,001 | ) |
| | | | | | | | | | | | | | | | | | | | | | | | | | | | |
| TotalOver-the-Counter Credit Default Swaptions Written | | | | | | | | | | | | | | | $ | 1,366,503 | | | $ | (819,354 | ) |
| | | | | | | | | | | | | | | | | | | | | |
| | | | | | | | |
| Over-the-Counter Interest Rate Swaptions Written at March 31, 2019 | | |
| | | | | | | | | | | | | | | | | | | | | | | | | | | | | | | | |
| Description | | Counter-
party | | | Pay/
Receive
Floating
Rate | | | Floating Rate | | | Fixed
Rate | | | Expiration Date | | | Notional
Amount (000’s) | | | Premiums Received | | | Value | |
| | | | | | | | | | | | Three- | | | | | | | | | | | | | | | | | | | | | |
| Interest Rate | | | | | | | | | | | Month | | | | | | | | | | | | | | | | | | | | | |
| Swap maturing | | | | | | | | | | | CAD- | | | | | | | | | | | | | | | | | | | | | |
| 4/4/2029 | | | BOA | | | | Receive | | | | LIBOR | | | | 2.425 | % | | | 4/4/19 CAD | | | | 275,000 | | | $ | 2,074,154 | | | $ | (6,429,567) | |
| |
| | | | | | | | | | | Three- | | | | | | | | | | | | | | | | | | | | | |
| | | | | | | | | | | Month | | | | | | | | | | | | | | | | | | | | | |
| Interest Rate | | | | | | | | | | | USD- | | | | | | | | | | | | | | | | | | | | | |
| Swap maturing | | | | | | | | | | | LIBOR- | | | | | | | | | | | | | | | | | | | | | |
| 3/25/25 Call | | | BOA | | | | Receive | | | | BBA | | | | 1.916 | | | | 3/23/20 USD | | | | 500,000 | | | | 2,478,500 | | | | (3,014,045) | |
| |
| | | | | | | | | | | Three- | | | | | | | | | | | | | | | | | | | | | |
| | | | | | | | | | | Month | | | | | | | | | | | | | | | | | | | | | |
| Interest Rate | | | | | | | | | | | USD- | | | | | | | | | | | | | | | | | | | | | |
| Swap maturing | | | | | | | | | | | LIBOR- | | | | | | | | | | | | | | | | | | | | | |
| 9/25/24 Call | | | BOA | | | | Receive | | | | BBA | | | | 2.055 | | | | 9/23/19 USD | | | | 250,000 | | | | 962,500 | | | | (1,080,265) | |
| |
| | | | | | | | | | | Six- | | | | | | | | | | | | | | | | | | | | | |
| | | | | | | | | | | Month | | | | | | | | | | | | | | | | | | | | | |
| Interest Rate | | | | | | | | | | | PLN- | | | | | | | | | | | | | | | | | | | | | |
| Swap maturing | | | | | | | | | | | WIBOR- | | | | | | | | | | | | | | | | | | | | | |
| 5/30/24 Put | | | GSCOI | | | | Pay | | | | WIBO | | | | 2.095 | | | | 5/28/19 PLN | | | | 99,000 | | | | 109,712 | | | | (33,121) | |
| |
| | | | | | | | | | | Six- | | | | | | | | | | | | | | | | | | | | | |
| | | | | | | | | | | Month | | | | | | | | | | | | | | | | | | | | | |
| Interest Rate | | | | | | | | | | | PLN- | | | | | | | | | | | | | | | | | | | | | |
| Swap maturing | | | | | | | | | | | WIBOR- | | | | | | | | | | | | | | | | | | | | | |
| 5/30/24 Call | | | GSCOI | | | | Receive | | | | WIBO | | | | 2.095 | | | | 5/28/19 PLN | | | | 99,000 | | | | 109,713 | | | | (190,617) | |
| |
| | | | | | | | | | | Six- | | | | | | | | | | | | | | | | | | | | | |
| Interest Rate | | | | | | | | | | | Month | | | | | | | | | | | | | | | | | | | | | |
| Swap maturing | | | | | | | | | | | EUR | | | | | | | | | | | | | | | | | | | | | |
| 9/17/67 Put | | | JPM | | | | Pay | | | | EURIBOR | | | | 3.100 | | | | 9/15/37 EUR | | | | 200,000 | | | | 19,261,235 | | | | (12,618,943) | |
43 OPPENHEIMER INTERNATIONAL BOND FUND
CONSOLIDATED STATEMENT OF INVESTMENTSUnaudited / Continued
| | | | | | | | | | |
Over-the-Counter Interest Rate Swaptions Written (Continued) | | | | |
| | | | | | | | | | | | | | | | | | | | | | | | | | | | | | | | |
| Description | | Counter-
party | | | Pay/
Receive
Floating
Rate | | | Floating
Rate | | | Fixed
Rate | | | Expiration
Date | | | Notional Amount (000’s) | | | Premiums
Received | | | Value | |
| |
| | | | | | | | | | | Six- | | | | | | | | | | | | | | | | | | | | | |
| Interest Rate | | | | | | | | | | | Month | | | | | | | | | | | | | | | | | | | | | |
| Swap maturing | | | | | | | | | | | EUR | | | | | | | | | | | | | | | | | | | | | |
| 8/12/29 Put | | | JPM | | | | Pay | | | | EURIBOR | | | | 0.868 | % | | | 8/8/19 | | | | EUR 375,000 | | | $ | 1,992,312 | | | $ | (528,403 | ) |
| |
| | | | | | | | | | | Three- | | | | | | | | | | | | | | | | | | | | | |
| | | | | | | | | | | Month | | | | | | | | | | | | | | | | | | | | | |
| Interest Rate | | | | | | | | | | | USD- | | | | | | | | | | | | | | | | | | | | | |
| Swap maturing | | | | | | | | | | | LIBOR- | | | | | | | | | | | | | | | | | | | | | |
| 9/5/24 Call | | | JPM | | | | Receive | | | | BBA | | | | 2.400 | | | | 9/3/19 | | | | USD 250,000 | | | | 1,050,000 | | | | (2,787,665) | |
| |
| | | | | | | | | | | Three- | | | | | | | | | | | | | | | | | | | | | |
| | | | | | | | | | | Month | | | | | | | | | | | | | | | | | | | | | |
| Interest Rate | | | | | | | | | | | USD- | | | | | | | | | | | | | | | | | | | | | |
| Swap maturing | | | | | | | | | | | LIBOR- | | | | | | | | | | | | | | | | | | | | | |
| 9/6/24 Call | | | JPM | | | | Receive | | | | BBA | | | | 2.400 | | | | 9/4/19 | | | | USD 250,000 | | | | 1,050,000 | | | | (2,794,093) | |
| |
| | | | | | | | | | | MAX | | | | | | | | | | | | | | | | | | | | | |
| | | | | | | | | | | [((CMS10 | | | | | | | | | | | | | | | | | | | | | |
| | | | | | | | | | | minus | | | | | | | | | | | | | | | | | | | | | |
| | | | | | | | | | | CMS2) | | | | | | | | | | | | | | | | | | | | | |
| | | | | | | | | | | minus | | | | | | | | | | | | | | | | | | | | | |
| Interest Rate Cap | | | | | | | | | | | 0.52%), | | | | | | | | | | | | | | | | | | | | | |
| maturing 2/22/21 | | | | | | | | | | | 0.00%] | | | | | | | | | | | | | | | | | | | | | |
| Put | | | MSCO | | | | Pay | | | | * 10 | | | | 52.000 | | | | 2/25/21 | | | | USD 60,000 | | | | 456,000 | | | | (562,800) | |
| |
| | | | | | | | | | | MAX | | | | | | | | | | | | | | | | | | | | | |
| | | | | | | | | | | [(0.02% | | | | | | | | | | | | | | | | | | | | | |
| | | | | | | | | | | minus | | | | | | | | | | | | | | | | | | | | | |
| | | | | | | | | | | (CMS10 | | | | | | | | | | | | | | | | | | | | | |
| | | | | | | | | | | minus | | | | | | | | | | | | | | | | | | | | | |
| Interest Rate Floor | | | | | | | | | | | CMS2)), | | | | | | | | | | | | | | | | | | | | | |
| maturing 2/22/21 | | | | | | | | | | | 0.00%] | | | | | | | | | | | | | | | | | | | | | |
| Call | | | MSCO | | | | Pay | | | | * 10 | | | | 0.020 | | | | 2/25/21 | | | | USD 60,000 | | | | 660,000 | | | | (348,000) | |
| |
| | | | | | | | | | | Three- | | | | | | | | | | | | | | | | | | | | | |
| | | | | | | | | | | Month | | | | | | | | | | | | | | | | | | | | | |
| Interest Rate | | | | | | | | | | | USD- | | | | | | | | | | | | | | | | | | | | | |
| Swap maturing | | | | | | | | | | | LIBOR- | | | | | | | | | | | | | | | | | | | | | |
| 5/3/24 Call | | | NOM | | | | Receive | | | | BBA | | | | 2.346 | | | | 5/1/19 | | | | USD 275,000 | | | | 440,000 | | | | (1,489,587) | |
| | | | | | | | | | | | | | | | | | | | | | | | | | | | |
TotalOver-the-Counter Interest Rate Swaptions Written | | | | | | | | | | | $ | 30,644,126 | | | $ | (31,877,106) | |
| | | | | | | | | | | | | | | | | | | | | | | | | | | | |
| | |
Glossary: | | |
| Counterparty Abbreviations |
| BAC | | Barclays Bank plc |
| BNP | | BNP Paribas |
| BOA | | Bank of America NA |
| CITNA-B | | Citibank NA |
| DEU | | Deutsche Bank AG |
| GSCOI | | Goldman Sachs International |
| GSCO-OT | | Goldman Sachs Bank USA |
| HSBC | | HSBC Bank USA NA |
| JPM | | JPMorgan Chase Bank NA |
| MOS | | Morgan Stanley & Co., Inc. |
| MSCO | | Morgan Stanley Capital Services, Inc. |
44 OPPENHEIMER INTERNATIONAL BOND FUND
| | |
| Counterparty Abbreviations (Continued) |
| NOM | | Nomura Global Financial Products, Inc. |
| RBC | | RBC Dominion Securities |
| SCB | | Standard Chartered Bank |
| SIB | | Banco Santander SA |
| UBS | | UBS AG |
|
| Currency abbreviations indicate amounts reporting in currencies |
| ARS | | Argentine Peso |
| AUD | | Australian Dollar |
| BRL | | Brazilian Real |
| CAD | | Canadian Dollar |
| CLP | | Chilean Peso |
| COP | | Colombian Peso |
| CNH | | Offshore Chinese Renminbi |
| EGP | | Egyptian Pounds |
| EUR | | Euro |
| GBP | | British Pound Sterling |
| HUF | | Hungarian Forint |
| IDR | | Indonesian Rupiah |
| INR | | Indian Rupee |
| JPY | | Japanese Yen |
| KRW | | South Korean Won |
| MXN | | Mexican Nuevo Peso |
| MYR | | Malaysian Ringgit |
| NOK | | Norwegian Krone |
| NZD | | New Zealand Dollar |
| PEN | | Peruvian New Sol |
| PLN | | Polish Zloty |
| RUB | | Russian Ruble |
| SEK | | Swedish Krona |
| SGD | | Singapore Dollar |
| THB | | Thailand Baht |
| TRY | | New Turkish Lira |
| UYU | | Uruguay Peso |
| ZAR | | South African Rand |
| |
| Definitions | | |
| BADLARPP | | Argentina Deposit Rates Badlar Private Banks ARS 30 to 35 Days |
| BANXICO | | Banco de Mexico |
| BA CDOR | | Canada Bankers Acceptances Deposit Offering Rate |
| BBA | | British Bankers’ Association London |
| BBSW3M | | ASX Australian Bank Bill Short Term Rates 3 Month Mid |
| BBSW6M | | ASX Australian Bank Bill Short Term Rates 6 Month Mid |
| BP0003M | | ICE LIBOR GBP 3 Month |
| BP0006M | | ICE LIBOR GBP 6 Month |
| BPSW5 | | GBP Swap 5 Year |
| BUBOR | | Budapest Interbank Offered Rate |
| BUBOR06M | | Budapest Interbank Offered Rate 6 Month |
| BUND | | German Federal Obligation |
| BZDI | | Brazil Interbank Deposit Rate |
45 OPPENHEIMER INTERNATIONAL BOND FUND
CONSOLIDATED STATEMENT OF INVESTMENTSUnaudited / Continued
| | |
| Definitions (Continued) |
| CDOR03 | | Canada Bankers Acceptances 3 Months |
| CDX.NA.HY.31 | | Markit CDX North American High Yield |
| CDX.EM.31 | | Markit CDX Emerging Markets Index |
| CMS10 | | 10 Year ISDA Swap Floating Rate Option |
| CMS2 | | 2 Year ISDA Swap Floating Rate Option |
| COOVIBR | | Colombia IBR Overnight Nominal Interbank Reference Rate |
| CPI EXT | | Excluding Tobacco Consumer Price Index |
| EUR003M | | EURIBOR 3 Month ACT/360 |
| EUR006M | | EURIBOR 6 Month ACT/360 |
| EURIBOR | | Euro Interbank Offered Rate |
| EUSA5 | | EUR Swap Annual 5 Year |
| EUSA8 | | EUR Swap Annual 8 Year |
| EUSA10 | | EUR Swap Annual 10 Year |
| EUSA11 | | EUR Swap Annual 11 Year |
| EUSA12 | | EUR Swap Annual 12 Year |
| FBIL | | Financial Benchmarks India Private Ltd. |
| GUKG5 | | UK Government Bonds 5 Year Note Generic Bid Yield |
| H15T10Y | | US Treasury Yield Curve Rate T Note Constant Maturity 10 Year |
| H15T5Y | | US Treasury Yield Curve Rate T Note Constant Maturity 5 Year |
| IBR | | Indicador Bancario de Referencia |
| ICE LIBOR | | Intercontinental Exchange London Interbank Offered Rate |
| iTraxx Europe | | |
| Crossover Series 24 | | |
| Version 1 | | Credit Default Swap Trading Index for a Specific Basket of Securities |
| iTraxx Europe | | |
| Crossover Series 30 | | |
| Version 2 | | Credit Default Swap Trading Index for a Specific Basket of Securities |
| JIBA3M | | South Africa Johannesburg Interbank Agreed Rate 3 Month |
| JIBAR SAFEX | | South Africa Johannesburg Interbank Agreed Rate/Futures Exchange |
| KWCDC | | South Korean Won Index |
| LIBOR | | London Interbank Offered Rate |
| MIBOR | | Mumbai Interbank Offered Rate |
| OIS | | Overnight Index Swap |
| S&P | | Standard & Poor’s |
| SORF6M | | Association of Banks in Singapore Swap Offer Rate Fixing 6 Month |
| TIIE | | Interbank Equilibrium Interest Rate |
| TNA | | Non-Deliverable CLP Camara |
| US0003M | | ICE LIBOR USD 3 Month |
| US0006M | | ICE LIBOR USD 6 Month |
| USISDA05 | | USD ICE Swap Rate 11:00am NY 5 Year |
| USSW5 | | USD Swap Semi 30/360 5 Year |
| WIBOR WIBO | | Poland Warsaw Interbank Offer Bid Rate |
See accompanying Notes to Consolidated Financial Statements.
46 OPPENHEIMER INTERNATIONAL BOND FUND
CONSOLIDATED STATEMENT OF
ASSETS AND LIABILITIESMarch 31, 2019 Unaudited
| | | | |
Assets | | | | |
| |
Investments, at value—see accompanying consolidated statement of investments: | | | | |
Unaffiliated companies (cost $4,719,701,685) | | $ | 4,518,213,235 | |
Affiliated companies (cost $197,758,769) | | | 197,711,379 | |
| | | | |
| | | | 4,715,924,614 | |
Cash | | | 33,839,078 | |
Cash—foreign currencies (cost $3,830,393) | | | 3,668,691 | |
Cash used for collateral on futures | | | 7,664,000 | |
Cash used for collateral on OTC derivatives | | | 5,690,000 | |
Cash used for collateral on centrally cleared swaps | | | 16,387,482 | |
Unrealized appreciation on forward currency exchange contracts | | | 70,688,228 | |
Swaps, at value (net premiums received $1,053,728) | | | 4,405,636 | |
Centrally cleared swaps, at value (premiums paid $5,005,009) | | | 23,840,706 | |
Receivables and other assets: | | | | |
Investments sold (including $6,500,688 sold on a when-issued or delayed delivery basis) | | | 283,358,267 | |
Interest and dividends | | | 67,813,111 | |
Shares of beneficial interest sold | | | 4,546,179 | |
Variation margin receivable | | | 324,779 | |
Other | | | 612,159 | |
| | | | |
Total assets | | | 5,238,762,930 | |
Liabilities | | | | |
Unrealized depreciation on forward currency exchange contracts | | | 74,536,724 | |
Options written, at value (premiums received $118,912,253) | | | 102,037,802 | |
Swaps, at value (premiums received $7,109,122) | | | 9,569,595 | |
Centrally cleared swaps, at value (net premiums received $968,590) | | | 13,559,466 | |
Swaptions written, at value (premiums received $32,010,629) | | | 32,696,460 | |
Payables and other liabilities: | | | | |
Investments purchased (including $15,713,000 purchased on a when-issued or delayed delivery basis) | | | 139,946,748 | |
Shares of beneficial interest redeemed | | | 10,666,985 | |
Dividends | | | 1,212,088 | |
Trustees’ compensation | | | 402,182 | |
Distribution and service plan fees | | | 290,805 | |
Foreign capital gains tax | | | 124,013 | |
Shareholder communications | | | 20,539 | |
Variation margin payable | | | 11,226 | |
Other | | | 1,266,434 | |
| | | | |
Total liabilities | | | 386,341,067 | |
Net Assets | | $ | 4,852,421,863 | |
| | | | |
| | | | |
Composition of Net Assets | | | | |
Par value of shares of beneficial interest | | $ | 888,189 | |
Additionalpaid-in capital | | | 5,466,949,120 | |
Total accumulated loss | | | (615,415,446) | |
| | | | |
Net Assets | | $ | 4,852,421,863 | |
| | | | |
47 OPPENHEIMER INTERNATIONAL BOND FUND
CONSOLIDATED STATEMENT OF
ASSETS AND LIABILITIESUnaudited / Continued
| | | | |
Net Asset Value Per Share | | | | |
Class A Shares: | | | | |
| |
| Net asset value and redemption price per share (based on net assets of $983,275,207 and 179,863,673 shares of beneficial interest outstanding) | | | $5.47 | |
| |
Maximum offering price per share (net asset value plus sales charge of 4.75% of offering price) | | | $5.74 | |
| |
Class C Shares: | | | | |
| |
| Net asset value, redemption price (excludes applicable contingent deferred sales charge) and offering price per share (based on net assets of $262,993,648 and 48,286,374 shares of beneficial interest outstanding) | | | $5.45 | |
| |
Class I Shares: | | | | |
| |
| Net asset value, redemption price and offering price per share (based on net assets of $1,120,042,610 and 205,136,222 shares of beneficial interest outstanding) | | | $5.46 | |
| |
Class R Shares: | | | | |
| |
| Net asset value, redemption price (excludes applicable contingent deferred sales charge) and offering price per share (based on net assets of $108,696,018 and 19,941,059 shares of beneficial interest outstanding) | | | $5.45 | |
| |
Class Y Shares: | | | | |
| |
| Net asset value, redemption price and offering price per share (based on net assets of $2,377,414,380 and 434,961,807 shares of beneficial interest outstanding) | | | $5.47 | |
See accompanying Notes to Consolidated Financial Statements.
48 OPPENHEIMER INTERNATIONAL BOND FUND
CONSOLIDATED STATEMENT OF
OPERATIONSFor the Six Months Ended March 31, 2019 Unaudited
| | | | |
| Investment Income | | | | |
| Interest (net of foreign withholding taxes of $1,227,925) | | $ | 152,828,309 | |
Dividends—Affiliated Companies | | | 2,683,630 | |
| | | | |
Total investment income | | | 155,511,939 | |
| Expenses | | | | |
| Management fees | | | 13,409,034 | |
Distribution and service plan fees: | | | | |
Class A | | | 1,255,414 | |
Class C | | | 1,362,827 | |
| Class R | | | 277,991 | |
Transfer and shareholder servicing agent fees: | | | | |
Class A | | | 867,530 | |
Class C | | | 231,951 | |
Class I | | | 168,801 | |
Class R | | | 94,909 | |
| Class Y | | | 2,061,006 | |
Shareholder communications: | | | | |
Class A | | | 12,530 | |
Class C | | | 3,081 | |
Class I | | | 1,519 | |
Class R | | | 125 | |
| Class Y | | | 25,187 | |
| Custodian fees and expenses | | | 500,443 | |
| Trustees’ compensation | | | 72,181 | |
| Borrowing fees | | | 71,195 | |
Other | | | 349,233 | |
| | | | |
Total expenses | | | 20,764,957 | |
Less reduction to custodian expenses | | | (105,467) | |
Less waivers and reimbursements of expenses | | | (224,571) | |
| | | | |
Net expenses | | | 20,434,919 | |
| Net Investment Income | | | 135,077,020 | |
49 OPPENHEIMER INTERNATIONAL BOND FUND
CONSOLIDATED STATEMENT OF
OPERATIONSUnaudited / Continued
| | | | |
| Realized and Unrealized Gain (Loss) | | | | |
Net realized gain (loss) on: | | | | |
Investment transactions in unaffiliated companies (net of foreign capital gains tax of $195,722) | | $ | (132,413,175) | |
Option contracts written | | | 60,483,563 | |
Futures contracts | | | (39,197,271) | |
Foreign currency transactions | | | (3,836,730) | |
Forward currency exchange contracts | | | (150,554,957) | |
Swap contracts | | | 3,986,376 | |
Swaption contracts written | | | (24,622,140) | |
| | | | |
Net realized loss | | | (286,154,334) | |
Net change in unrealized appreciation/(depreciation) on: | | | | |
Investment transactions in: | | | | |
Unaffiliated companies (net of foreign capital gains tax of $124,013) | | | 168,677,206 | |
Affiliated companies | | | (47,390) | |
| Translation of assets and liabilities denominated in foreign currencies | | | 3,715,676 | |
| Forward currency exchange contracts | | | 69,235,343 | |
| Futures contracts | | | (7,187,293) | |
| Option contracts written | | | 34,766,466 | |
| Swap contracts | | | 17,337,794 | |
| Swaption contracts written | | | (7,056,797) | |
| | | | |
Net change in unrealized appreciation/(depreciation) | | | 279,441,005 | |
| Net Increase in Net Assets Resulting from Operations | | $ | 128,363,691 | |
| | | | |
See accompanying Notes to Consolidated Financial Statements.
50 OPPENHEIMER INTERNATIONAL BOND FUND
CONSOLIDATED STATEMENTS OF CHANGES IN NET ASSETS
| | | | | | | | |
| | | Six Months Ended
March 31, 2019
(Unaudited) | | | Year Ended
September 30,
20181 | |
Operations | | | | | | | | |
Net investment income | | $ | 135,077,020 | | | $ | 249,387,859 | |
Net realized gain (loss) | | | (286,154,334) | | | | 49,393,784 | |
Net change in unrealized appreciation/(depreciation) | | | 279,441,005 | | | | (546,567,656) | |
Net increase (decrease) in net assets resulting from operations | | | 128,363,691 | | | | (247,786,013) | |
Dividends and/or Distributions to Shareholders | | | | | | | | |
Dividends and distributions declared: | | | | | | | | |
| Class A | | | (27,721,840) | | | | (27,440,410) | |
| Class B2 | | | — | | | | (38,410) | |
| Class C | | | (6,386,481) | | | | (6,338,822) | |
| Class I | | | (32,599,707) | | | | (31,579,039) | |
| Class R | | | (2,893,151) | | | | (2,664,591) | |
| Class Y | | | (68,807,924) | | | | (62,572,404) | |
Total dividends and distributions declared | | | (138,409,103) | | | | (130,633,676) | |
Tax return of capital distribution: | | | | | | | | |
| Class A | | | — | | | | (24,741,533) | |
| Class B2 | | | — | | | | (34,633) | |
| Class C | | | — | | | | (5,715,373) | |
| Class I | | | — | | | | (28,473,110) | |
| Class R | | | — | | | | (2,402,517) | |
| Class Y | | | — | | | | (56,418,149) | |
Total return of capital distribution | | | — | | | | (117,785,315) | |
Beneficial Interest Transactions | | | | | | | | |
Net increase (decrease) in net assets resulting from beneficial interest transactions: | | | | | | | | |
| Class A | | | (98,438,537) | | | | (98,153,512) | |
| Class B2 | | | — | | | | (6,285,572) | |
| Class C | | | (28,482,304) | | | | (50,277,315) | |
| Class I | | | (279,620,921) | | | | 322,995,519 | |
| Class R | | | (8,852,932) | | | | (3,074,235) | |
| Class Y | | | (216,248,940) | | | | 496,898,414 | |
Total beneficial interest transactions | | | (631,643,634) | | | | 662,103,299 | |
Net Assets | | | | | | | | |
| Total increase (decrease) | | | (641,689,046) | | | | 165,898,295 | |
Beginning of period | | | 5,494,110,909 | | | | 5,328,212,614 | |
| End of period | | $ | 4,852,421,863 | | | $ | 5,494,110,909 | |
| | | | | | | | |
| | | | | | | | |
1. Prior period amounts have been conformed to current year presentation. See Notes to Consolidated Financial Statements, Note 2 — New Accounting Pronouncements for further details.
2. Effective June 1, 2018, all Class B shares converted to Class A shares.
See accompanying Notes to Consolidated Financial Statements.
51 OPPENHEIMER INTERNATIONAL BOND FUND
CONSOLIDATED FINANCIAL HIGHLIGHTS
| | | | | | | | | | | | | | | | | | | | | | | | |
| Class A | | Six Months
Ended
March 31, 2019
(Unaudited) | | | Year Ended
September
30, 2018 | | | Year Ended
September
30, 2017 | | | Year Ended
September
30, 2016 | | | Year Ended
September
30, 2015 | | | Year Ended
September
30, 2014 | |
Per Share Operating Data | | | | | | | | | | | | | | | | | | | | | | | | |
| Net asset value, beginning of period | | | $5.47 | | | | $5.95 | | | | $5.95 | | | | $5.62 | | | | $6.01 | | | | $6.09 | |
| |
| Income (loss) from investment operations: | | | | | | | | | | | | | | | | | | | | | | | | |
| Net investment income1 | | | 0.14 | | | | 0.25 | | | | 0.23 | | | | 0.22 | | | | 0.18 | | | | 0.19 | |
| Net realized and unrealized gain (loss) | | | 0.01 | | | | (0.48) | | | | 0.03 | | | | 0.33 | | | | (0.39) | | | | (0.08) | |
| | | | |
| Total from investment operations | | | 0.15 | | | | (0.23) | | | | 0.26 | | | | 0.55 | | | | (0.21) | | | | 0.11 | |
| |
| Dividends and/or distributions to shareholders: | | | | | | | | | | | | | | | | | | | | | | | | |
| Dividends from net investment income | | | (0.15) | | | | (0.13) | | | | (0.10) | | | | (0.10) | | | | (0.14) | | | | (0.07) | |
| Distributions from net realized gain | | | 0.00 | | | | 0.00 | | | | 0.00 | | | | 0.00 | | | | 0.00 | | | | (0.00)2 | |
| Tax return of capital distribution | | | 0.00 | | | | (0.12) | | | | (0.16) | | | | (0.12) | | | | (0.04) | | | | (0.12) | |
| | | | |
| Total dividends and/or distributions to shareholders | | | (0.15) | | | | (0.25) | | | | (0.26) | | | | (0.22) | | | | (0.18) | | | | (0.19) | |
| |
Net asset value, end of period | | | $5.47 | | | | $5.47 | | | | $5.95 | | | | $5.95 | | | | $5.62 | | | | $6.01 | |
| | | | |
| | | | | | | | | | | | | | | | | | | | | | | | |
| Total Return, at Net Asset Value3 | | | 2.93% | | | | (4.20)% | | | | 4.67% | | | | 9.95% | | | | (3.57)% | | | | 1.86% | |
| | | | |
| Ratios/Supplemental Data | | | | | | | | | | | | | | | | | | | | | | | | |
| Net assets, end of period (in thousands) | | | $983,275 | | | | $1,082,539 | | | | $1,280,770 | | | | $1,611,584 | | | | $2,010,994 | | | | $3,104,220 | |
| |
| Average net assets (in thousands) | | | $1,022,897 | | | | $1,215,253 | | | | $1,391,397 | | | | $1,753,796 | | | | $2,556,904 | | | | $4,022,858 | |
| |
| Ratios to average net assets:4 | | | | | | | | | | | | | | | | | | | | | | | | |
| Net investment income | | | 5.30% | | | | 4.31% | | | | 3.94% | | | | 3.78% | | | | 3.03% | | | | 3.16% | |
| Expenses excluding specific expenses listed below | | | 1.00% | | | | 1.01% | | | | 1.05% | | | | 1.05% | | | | 1.02% | | | | 1.02% | |
| Interest and fees from borrowings | | | 0.00%5 | | | | 0.00%5 | | | | 0.00%5 | | | | 0.00%5 | | | | 0.00%5 | | | | 0.00% | |
| | | | |
| Total expenses6 | | | 1.00% | | | | 1.01% | | | | 1.05% | | | | 1.05% | | | | 1.02% | | | | 1.02% | |
| Expenses after payments, waivers and/or reimbursements and reduction to custodian expenses | | | 0.99% | | | | 0.99% | | | | 1.02% | | | | 1.03% | | | | 1.02%7 | | | | 1.02%7 | |
| |
| Portfolio turnover rate | | | 57% | | | | 115% | | | | 96% | | | | 128% | | | | 111% | | | | 108% | |
52 OPPENHEIMER INTERNATIONAL BOND FUND
1. Per share amounts calculated based on the average shares outstanding during the period.
2. Less than $0.005 per share.
3. Assumes an initial investment on the business day before the first day of the fiscal period, with all dividends and distributions reinvested in additional shares on the reinvestment date, and redemption at the net asset value calculated on the last business day of the fiscal period. Sales charges are not reflected in the total returns. Total returns are not annualized for periods less than one full year. Returns do not reflect the deduction of taxes that a shareholder would pay on fund distributions or the redemption of fund shares.
4. Annualized for periods less than one full year.
5. Less than 0.005%.
6. Total expenses including indirect expenses from affiliated fund fees and expenses were as follows:
| | | | | | | | | | |
| | | Six Months Ended March 31, 2019 | | | 1.00 | % | | | | |
| | Year Ended September 30, 2018 | | | 1.02 | % | | | | |
| | Year Ended September 30, 2017 | | | 1.06 | % | | | | |
| | Year Ended September 30, 2016 | | | 1.05 | % | | | | |
| | Year Ended September 30, 2015 | | | 1.02 | % | | | | |
| | Year Ended September 30, 2014 | | | 1.02 | % | | | | |
7. Waiver was less than 0.005%.
See accompanying Notes to Consolidated Financial Statements.
53 OPPENHEIMER INTERNATIONAL BOND FUND
CONSOLIDATED FINANCIAL HIGHLIGHTSContinued
| | | | | | | | | | | | | | | | | | | | | | | | |
| Class C | |
| Six Months
Ended
March 31,
2019
(Unaudited) |
| |
| Year Ended
September
30, 2018 |
| |
| Year Ended
September
30, 2017 |
| |
| Year Ended
September
30, 2016 |
| |
| Year Ended
September
30, 2015 |
| |
| Year Ended
September
30, 2014 |
|
| Per Share Operating Data | | | | | | | | | | | | | | | | | | | | | | | | |
| Net asset value, beginning of period | | | $5.45 | | | | $5.93 | | | | $5.92 | | | | $5.60 | | | | $5.99 | | | | $6.07 | |
| |
| Income (loss) from investment operations: | | | | | | | | | | | | | | | | | | | | | | | | |
| Net investment income1 | | | 0.12 | | | | 0.21 | | | | 0.18 | | | | 0.17 | | | | 0.13 | | | | 0.15 | |
| Net realized and unrealized gain (loss) | | | 0.01 | | | | (0.48) | | | | 0.05 | | | | 0.32 | | | | (0.38) | | | | (0.08) | |
| | | | |
| Total from investment operations | | | 0.13 | | | | (0.27) | | | | 0.23 | | | | 0.49 | | | | (0.25) | | | | 0.07 | |
| |
| Dividends and/or distributions to shareholders: | | | | | | | | | | | | | | | | | | | | | | | | |
| Dividends from net investment income | | | (0.13) | | | | (0.11) | | | | (0.08) | | | | (0.07) | | | | (0.11) | | | | (0.06) | |
| Distributions from net realized gain | | | 0.00 | | | | 0.00 | | | | 0.00 | | | | 0.00 | | | | 0.00 | | | | (0.00)2 | |
| Tax return of capital distribution | | | 0.00 | | | | (0.10) | | | | (0.14) | | | | (0.10) | | | | (0.03) | | | | (0.09) | |
| | | | |
| Total dividends and/or distributions to shareholders | | | (0.13) | | | | (0.21) | | | | (0.22) | | | | (0.17) | | | | (0.14) | | | | (0.15) | |
| |
| Net asset value, end of period | | | $5.45 | | | | $5.45 | | | | $5.93 | | | | $5.92 | | | | $5.60 | | | | $5.99 | |
| | | | |
| | | | | | | | | | | | | | | | | | | | | | | | |
| | | | | | | | | | | | | | | | | | | | | | | | | |
| Total Return, at Net Asset Value3 | | | 2.55% | | | | (4.79)% | | | | 3.89% | | | | 8.97% | | | | (4.31)% | | | | 1.13% | |
| | | | |
| Ratios/Supplemental Data | | | | | | | | | | | | | | | | | | | | | | | | |
| Net assets, end of period (in thousands) | | | $262,994 | | | | $291,793 | | | | $369,679 | | | | $493,319 | | | | $585,788 | | | | $858,281 | |
| |
| Average net assets (in thousands) | | | $273,470 | | | | $340,435 | | | | $414,939 | | | | $524,002 | | | | $713,793 | | | | $1,033,206 | |
| |
| Ratios to average net assets:4 | | | | | | | | | | | | | | | | | | | | | | | | |
| Net investment income | | | 4.54% | | | | 3.56% | | | | 3.20% | | | | 3.04% | | | | 2.30% | | | | 2.45% | |
| Expenses excluding specific expenses listed below | | | 1.75% | | | | 1.76% | | | | 1.80% | | | | 1.80% | | | | 1.77% | | | | 1.74% | |
| Interest and fees from borrowings | | | 0.00%5 | | | | 0.00%5 | | | | 0.00%5 | | | | 0.00%5 | | | | 0.00%5 | | | | 0.00% | |
| | | | |
| Total expenses6 | | | 1.75% | | | | 1.76% | | | | 1.80% | | | | 1.80% | | | | 1.77% | | | | 1.74% | |
| Expenses after payments, waivers and/or reimbursements and reduction to custodian expenses | | | 1.74% | | | | 1.74% | | | | 1.77% | | | | 1.78% | | | | 1.77%7 | | | | 1.74%7 | |
| |
| Portfolio turnover rate | | | 57% | | | | 115% | | | | 96% | | | | 128% | | | | 111% | | | | 108% | |
54 OPPENHEIMER INTERNATIONAL BOND FUND
1. Per share amounts calculated based on the average shares outstanding during the period.
2. Less than $0.005 per share.
3. Assumes an initial investment on the business day before the first day of the fiscal period, with all dividends and distributions reinvested in additional shares on the reinvestment date, and redemption at the net asset value calculated on the last business day of the fiscal period. Sales charges are not reflected in the total returns. Total returns are not annualized for periods less than one full year. Returns do not reflect the deduction of taxes that a shareholder would pay on fund distributions or the redemption of fund shares.
4. Annualized for periods less than one full year.
5. Less than 0.005%.
6. Total expenses including indirect expenses from affiliated fund fees and expenses were as follows:
| | | | | | | | | | |
| | | Six Months Ended March 31, 2019 | | | 1.75 | % | | | | |
| | Year Ended September 30, 2018 | | | 1.77 | % | | | | |
| | Year Ended September 30, 2017 | | | 1.81 | % | | | | |
| | Year Ended September 30, 2016 | | | 1.80 | % | | | | |
| | Year Ended September 30, 2015 | | | 1.77 | % | | | | |
| | Year Ended September 30, 2014 | | | 1.74 | % | | | | |
7. Waiver was less than 0.005%.
See accompanying Notes to Consolidated Financial Statements.
55 OPPENHEIMER INTERNATIONAL BOND FUND
CONSOLIDATED FINANCIAL HIGHLIGHTSContinued
| | | | | | | | | | | | | | | | | | | | | | | | |
| Class I | | Six Months
Ended
March 31,
2019
(Unaudited) | | | Year Ended
September
30, 2018 | | | Year Ended
September
30, 2017 | | | Year Ended
September
30, 2016 | | | Year Ended
September
30, 2015 | | | Year Ended
September
30, 2014 | |
| Per Share Operating Data | | | | | | | | | | | | | | | | | | | | | | | | |
| Net asset value, beginning of period | | | $5.46 | | | | $5.94 | | | | $5.94 | | | | $5.61 | | | | $6.00 | | | | $6.08 | |
| |
| Income (loss) from investment operations: | | | | | | | | | | | | | | | | | | | | | | | | |
| Net investment income1 | | | 0.15 | | | | 0.27 | | | | 0.25 | | | | 0.24 | | | | 0.21 | | | | 0.22 | |
| Net realized and unrealized gain (loss) | | | 0.01 | | | | (0.48) | | | | 0.04 | | | | 0.33 | | | | (0.39) | | | | (0.08) | |
| | | | |
| Total from investment operations | | | 0.16 | | | | (0.21) | | | | 0.29 | | | | 0.57 | | | | (0.18) | | | | 0.14 | |
| |
| Dividends and/or distributions to shareholders: | | | | | | | | | | | | | | | | | | | | | | | | |
| Dividends from net investment income | | | (0.16) | | | | (0.14) | | | | (0.11) | | | | (0.10) | | | | (0.16) | | | | (0.09) | |
| Distributions from net realized gain | | | 0.00 | | | | 0.00 | | | | 0.00 | | | | 0.00 | | | | 0.00 | | | | (0.00)2 | |
| Tax return of capital distribution | | | 0.00 | | | | (0.13) | | | | (0.18) | | | | (0.14) | | | | (0.05) | | | | (0.13) | |
| | | | |
| Total dividends and/or distributions to shareholders | | | (0.16) | | | | (0.27) | | | | (0.29) | | | | (0.24) | | | | (0.21) | | | | (0.22) | |
| |
Net asset value, end of period | | | $5.46 | | | | $5.46 | | | | $5.94 | | | | $5.94 | | | | $5.61 | | | | $6.00 | |
| | | | |
| | | | | | | | | | | | | | | | | | | | | | | | |
| Total Return, at Net Asset Value3 | | | 3.13% | | | | (3.83)% | | | | 5.12% | | | | 10.45% | | | | (3.16)% | | | | 2.32% | |
| | | | | | | | | | | | | | | | | | | | | | | | |
| | | | | | | |
| Ratios/Supplemental Data | | | | | | | | | | | | | | | | | | | | | | | | |
| Net assets, end of period (in thousands) | | | $1,120,043 | | | | $1,404,290 | | | | $1,194,372 | | | | $1,631,480 | | | | $1,154,225 | | | | $779,478 | |
| |
| Average net assets (in thousands) | | | $1,125,418 | | | | $1,278,527 | | | | $1,327,997 | | | | $1,406,045 | | | | $918,521 | | | | $611,312 | |
| |
| Ratios to average net assets: | | | | | | | | | | | | | | | | | | | | | | | | |
| 4Net investment income | | | 5.68% | | | | 4.71% | | | | 4.37% | | | | 4.28% | | | | 3.54% | | | | 3.58% | |
| Expenses excluding specific expenses listed below | | | 0.61% | | | | 0.60% | | | | 0.61% | | | | 0.60% | | | | 0.57% | | | | 0.56% | |
| Interest and fees from borrowings | | | 0.00%5 | | | | 0.00%5 | | | | 0.00%5 | | | | 0.00%5 | | | | 0.00%5 | | | | 0.00% | |
| | | | |
| Total expenses6 | | | 0.61% | | | | 0.60% | | | | 0.61% | | | | 0.60% | | | | 0.57% | | | | 0.56% | |
| Expenses after payments, waivers and/or reimbursements and reduction to custodian expenses | | | 0.60% | | | | 0.58% | | | | 0.59% | | | | 0.58% | | | | 0.57%7 | | | | 0.56%7 | |
| |
| Portfolio turnover rate | | | 57% | | | | 115% | | | | 96% | | | | 128% | | | | 111% | | | | 108% | |
56 OPPENHEIMER INTERNATIONAL BOND FUND
1. Per share amounts calculated based on the average shares outstanding during the period.
2. Less than $0.005 per share.
3. Assumes an initial investment on the business day before the first day of the fiscal period, with all dividends and distributions reinvested in additional shares on the reinvestment date, and redemption at the net asset value calculated on the last business day of the fiscal period. Sales charges are not reflected in the total returns. Total returns are not annualized for periods less than one full year. Returns do not reflect the deduction of taxes that a shareholder would pay on fund distributions or the redemption of fund shares.
4. Annualized for periods less than one full year.
5. Less than 0.005%.
6. Total expenses including indirect expenses from affiliated fund fees and expenses were as follows:
| | | | | | | | | | |
| | | Six Months Ended March 31, 2019 | | | 0.61 | % | | | | |
| | Year Ended September 30, 2018 | | | 0.61 | % | | | | |
| | Year Ended September 30, 2017 | | | 0.62 | % | | | | |
| | Year Ended September 30, 2016 | | | 0.60 | % | | | | |
| | Year Ended September 30, 2015 | | | 0.57 | % | | | | |
| | Year Ended September 30, 2014 | | | 0.56 | % | | | | |
7. Waiver was less than 0.005%.
See accompanying Notes to Consolidated Financial Statements.
57 OPPENHEIMER INTERNATIONAL BOND FUND
CONSOLIDATED FINANCIAL HIGHLIGHTSContinued
| | | | | | | | | | | | | | | | | | | | | | | | |
| Class R | | Six Months
Ended
March 31,
2019
(Unaudited) | | | Year Ended
September
30, 2018 | | | Year Ended
September
30, 2017 | | | Year Ended
September
30, 2016 | | | Year Ended
September
30, 2015 | | | Year Ended
September
30, 2014 | |
| Per Share Operating Data | | | | | | | | | | | | | | | | | | | | | | | | |
| Net asset value, beginning of period | | | $5.45 | | | | $5.93 | | | | $5.93 | | | | $5.60 | | | | $5.99 | | | | $6.07 | |
| |
| Income (loss) from investment operations: | | | | | | | | | | | | | | | | | | | | | | | | |
| Net investment income1 | | | 0.14 | | | | 0.24 | | | | 0.21 | | | | 0.20 | | | | 0.16 | | | | 0.17 | |
| Net realized and unrealized gain (loss) | | | 0.002 | | | | (0.49) | | | | 0.04 | | | | 0.33 | | | | (0.39) | | | | (0.08) | |
| | | | |
| Total from investment operations | | | 0.14 | | | | (0.25) | | | | 0.25 | | | | 0.53 | | | | (0.23) | | | | 0.09 | |
| |
| Dividends and/or distributions to shareholders: | | | | | | | | | | | | | | | | | | | | | | | | |
| Dividends from net investment income | | | (0.14) | | | | (0.12) | | | | (0.09) | | | | (0.09) | | | | (0.12) | | | | (0.07) | |
| Distributions from net realized gain | | | 0.00 | | | | 0.00 | | | | 0.00 | | | | 0.00 | | | | 0.00 | | | | (0.00)2 | |
| Tax return of capital distribution | �� | | 0.00 | | | | (0.11) | | | | (0.16) | | | | (0.11) | | | | (0.04) | | | | (0.10) | |
| | | | |
| Total dividends and/or distributions to shareholders | | | (0.14) | | | | (0.23) | | | | (0.25) | | | | (0.20) | | | | (0.16) | | | | (0.17) | |
| |
Net asset value, end of period | | | $5.45 | | | | $5.45 | | | | $5.93 | | | | $5.93 | | | | $5.60 | | | | $5.99 | |
| | | | |
| | | | | | | | | | | | | | | | | | | | | | | | |
| Total Return, at Net Asset Value3 | | | 2.80% | | | | (4.47)% | | | | 4.41% | | | | 9.70% | | | | (3.84)% | | | | 1.55% | |
| | | | | | | | | | | | | | | | | | | | | | | | |
| Ratios/Supplemental Data | | | | | | | | | | | | | | | | | | | | | | | | |
| Net assets, end of period (in thousands) | | | $108,696 | | | | $117,668 | | | | $131,112 | | | | $146,479 | | | | $166,932 | | | $ | 216,721 | |
| |
| Average net assets (in thousands) | | | $111,905 | | | | $125,233 | | | | $133,661 | | | | $149,525 | | | | $192,512 | | | $ | 234,841 | |
| |
| Ratios to average net assets:4 | | | | | | | | | | | | | | | | | | | | | | | | |
| Net investment income | | | 5.05% | | | | 4.06% | | | | 3.67% | | | | 3.54% | | | | 2.81% | | | | 2.84% | |
| Expenses excluding specific expenses listed below | | | 1.25% | | | | 1.25% | | | | 1.30% | | | | 1.29% | | | | 1.27% | | | | 1.35% | |
| Interest and fees from borrowings | | | 0.00%5 | | | | 0.00%5 | | | | 0.00%5 | | | | 0.00%5 | | | | 0.00%5 | | | | 0.00% | |
| | | | |
| Total expenses6 | | | 1.25% | | | | 1.25% | | | | 1.30% | | | | 1.29% | | | | 1.27% | | | | 1.35% | |
| Expenses after payments, waivers and/or reimbursements and reduction to custodian expenses | | | 1.24% | | | | 1.23% | | | | 1.27% | | | | 1.27% | | | | 1.27%7 | | | | 1.32% | |
| |
| Portfolio turnover rate | | | 57% | | | | 115% | | | | 96% | | | | 128% | | | | 111% | | | | 108% | |
58 OPPENHEIMER INTERNATIONAL BOND FUND
1. Per share amounts calculated based on the average shares outstanding during the period.
2. Less than $0.005 per share.
3. Assumes an initial investment on the business day before the first day of the fiscal period, with all dividends and distributions reinvested in additional shares on the reinvestment date, and redemption at the net asset value calculated on the last business day of the fiscal period. Sales charges are not reflected in the total returns. Total returns are not annualized for periods less than one full year. Returns do not reflect the deduction of taxes that a shareholder would pay on fund distributions or the redemption of fund shares.
4. Annualized for periods less than one full year.
5. Less than 0.005%.
6. Total expenses including indirect expenses from affiliated fund fees and expenses were as follows:
| | | | | | | | | | |
| | | Six Months Ended March 31, 2019 | | | 1.25 | % | | | | |
| | Year Ended September 30, 2018 | | | 1.26 | % | | | | |
| | Year Ended September 30, 2017 | | | 1.31 | % | | | | |
| | Year Ended September 30, 2016 | | | 1.29 | % | | | | |
| | Year Ended September 30, 2015 | | | 1.27 | % | | | | |
| | Year Ended September 30, 2014 | | | 1.35 | % | | | | |
7. Waiver was less than 0.005%.
See accompanying Notes to Consolidated Financial Statements.
59 OPPENHEIMER INTERNATIONAL BOND FUND
CONSOLIDATED FINANCIAL HIGHLIGHTSContinued
| | | | | | | | | | | | | | | | | | | | | | | | |
| Class Y | |
| Six Months
Ended
March 31,
2019
(Unaudited) |
| |
| Year Ended
September
30, 2018 |
| |
| Year Ended
September
30, 2017 |
| |
| Year Ended
September
30, 2016 |
| |
| Year Ended
September
30, 2015 |
| |
| Year Ended
September
30, 2014 |
|
| Per Share Operating Data | | | | | | | | | | | | | | | | | | | | | | | | |
| Net asset value, beginning of period | | | $5.47 | | | | $5.95 | | | | $5.95 | | | | $5.61 | | | | $6.01 | | | | $6.09 | |
| |
| Income (loss) from investment operations: | | | | | | | | | | | | | | | | | | | | | | | | |
| Net investment income1 | | | 0.15 | | | | 0.26 | | | | 0.24 | | | | 0.23 | | | | 0.20 | | | | 0.21 | |
| Net realized and unrealized gain (loss) | | | 0.002 | | | | (0.48) | | | | 0.04 | | | | 0.34 | | | | (0.41) | | | | (0.08) | |
| | | | |
| Total from investment operations | | | 0.15 | | | | (0.22) | | | | 0.28 | | | | 0.57 | | | | (0.21) | | | | 0.13 | |
| |
| Dividends and/or distributions to shareholders: | | | | | | | | | | | | | | | | | | | | | | | | |
| Dividends from net investment income | | | (0.15) | | | | (0.14) | | | | (0.11) | | | | (0.10) | | | | (0.15) | | | | (0.08) | |
| Distributions from net realized gain | | | 0.00 | | | | 0.00 | | | | 0.00 | | | | 0.00 | | | | 0.00 | | | | (0.00)2 | |
| Tax return of capital distribution | | | 0.00 | | | | (0.12) | | | | (0.17) | | | | (0.13) | | | | (0.04) | | | | (0.13) | |
| | | | |
| Total dividends and/or distributions to shareholders | | | (0.15) | | | | (0.26) | | | | (0.28) | | | | (0.23) | | | | (0.19) | | | | (0.21) | |
| |
| Net asset value, end of period | | | $5.47 | | | | $5.47 | | | | $5.95 | | | | $5.95 | | | | $5.61 | | | | $6.01 | |
| | | | |
| | | | | | | | | | | | | | | | | | | | | | | | |
| Total Return, at Net Asset Value3 | | | 3.06% | | | | (3.80)% | | | | 4.75% | | | | 10.42% | | | | (3.50)% | | | | 2.14% | |
| | | | | | |
| | | | | | | | | | | | | | | | | | | | | | | | |
| Ratios/Supplemental Data | | | | | | | | | | | | | | | | | | | | | | | | |
| Net assets, end of period (in thousands) | | | $2,377,414 | | | | $2,597,821 | | | | $2,345,993 | | | | $2,072,160 | | | | $2,781,868 | | | | $3,431,584 | |
| |
| Average net assets (in thousands) | | | $2,430,237 | | | | $2,618,549 | | | | $2,088,382 | | | | $2,399,267 | | | | $3,128,046 | | | | $3,532,821 | |
| |
| Ratios to average net assets:4 | | | | | | | | | | | | | | | | | | | | | | | | |
| Net investment income | | | 5.54% | | | | 4.56% | | | | 4.13% | | | | 4.03% | | | | 3.32% | | | | 3.43% | |
| Expenses excluding specific expenses listed below | | | 0.75% | | | | 0.76% | | | | 0.80% | | | | 0.80% | | | | 0.77% | | | | 0.74% | |
| Interest and fees from borrowings | | | 0.00%5 | | | | 0.00%5 | | | | 0.00%5 | | | | 0.00%5 | | | | 0.00%5 | | | | 0.00% | |
| | | | |
| Total expenses6 | | | 0.75% | | | | 0.76% | | | | 0.80% | | | | 0.80% | | | | 0.77% | | | | 0.74% | |
| Expenses after payments, waivers and/or reimbursements and reduction to custodian expenses | | | 0.74% | | | | 0.74% | | | | 0.77% | | | | 0.78% | | | | 0.77%7 | | | | 0.74%7 | |
| |
| Portfolio turnover rate | | | 57% | | | | 115% | | | | 96% | | | | 128% | | | | 111% | | | | 108% | |
60 OPPENHEIMER INTERNATIONAL BOND FUND
1. Per share amounts calculated based on the average shares outstanding during the period.
2. Less than $0.005 per share.
3. Assumes an initial investment on the business day before the first day of the fiscal period, with all dividends and distributions reinvested in additional shares on the reinvestment date, and redemption at the net asset value calculated on the last business day of the fiscal period. Sales charges are not reflected in the total returns. Total returns are not annualized for periods less than one full year. Returns do not reflect the deduction of taxes that a shareholder would pay on fund distributions or the redemption of fund shares.
4. Annualized for periods less than one full year.
5. Less than 0.005%.
6. Total expenses including indirect expenses from affiliated fund fees and expenses were as follows:
| | | | | | | | | | |
| | | Six Months Ended March 31, 2019 | | | 0.75 | % | | | | |
| | Year Ended September 30, 2018 | | | 0.77 | % | | | | |
| | Year Ended September 30, 2017 | | | 0.81 | % | | | | |
| | Year Ended September 30, 2016 | | | 0.80 | % | | | | |
| | Year Ended September 30, 2015 | | | 0.77 | % | | | | |
| | Year Ended September 30, 2014 | | | 0.74 | % | | | | |
7. Waiver was less than 0.005%.
See accompanying Notes to Consolidated Financial Statements.
61 OPPENHEIMER INTERNATIONAL BOND FUND
NOTES TO
CONSOLIDATED FINANCIAL STATEMENTSMarch 31, 2019 Unaudited
1. Organization
Oppenheimer International Bond Fund (the “Fund”) is anon-diversifiedopen-end management investment company registered under the Investment Company Act of 1940 (“1940 Act”), as amended. The Fund’s investment objective is to seek total return. The Fund’s investment adviser is OFI Global Asset Management, Inc. (“OFI Global” or the “Manager”), a wholly-owned subsidiary of OppenheimerFunds, Inc. (“OFI” or the“Sub-Adviser”). The Manager has entered into asub-advisory agreement with OFI.
The Fund offers Class A, Class C, Class I, Class R and Class Y shares, and previously offered Class B shares for new purchase through June 29, 2012. Subsequent to that date, no new purchases of Class B shares were permitted. Reinvestment of dividend and/or capital gain distributions and exchanges of Class B shares into and from other Oppenheimer funds were permitted through May 31, 2018. Effective June 1, 2018 (the “Conversion Date”), all Class B shares converted to Class A shares. Class A shares are sold at their offering price, which is normally net asset value plus afront-end sales charge. Class C and Class R shares are sold, and Class B shares were sold, without afront-end sales charge but may be subject to a contingent deferred sales charge (“CDSC”). Class R shares are sold only through retirement plans. Retirement plans that offer Class R shares may impose charges on those accounts. Class I and Class Y shares are sold to certain institutional investors or intermediaries without either afront-end sales charge or a CDSC, however, the intermediaries may impose charges on their accountholders who beneficially own Class I and Class Y shares. All classes of shares have identical rights and voting privileges with respect to the Fund in general and exclusive voting rights on matters that affect that class alone. Earnings, net assets and net asset value per share may differ due to each class having its own expenses, such as transfer and shareholder servicing agent fees and shareholder communications, directly attributable to that class. Class A, C and R shares have, and Class B shares had, separate distribution and/or service plans under which they pay, and Class B shares paid, fees. Class I and Class Y shares do not pay such fees. Previously issued Class B shares automatically converted to Class A shares 72 months after the date of purchase.
The following is a summary of significant accounting policies followed in the Fund’s preparation of financial statements in accordance with accounting principles generally accepted in the United States (“U.S. GAAP”).
2. Significant Accounting Policies
Security Valuation.All investments in securities are recorded at their estimated fair value, as described in Note 3.
Basis for Consolidation.The Fund has established a Cayman Islands exempted company, Oppenheimer International Bond Fund (Cayman) Ltd. (the “Subsidiary”), which is wholly-owned and controlled by the Fund. The Fund and Subsidiary are both managed by the Manager. The Fund may invest up to 25% of its total assets in the Subsidiary. The Subsidiary invests primarily in Regulation S Securities. Regulation S securities are securities of U.S. andnon-U.S. issuers that are issued through private offerings without registration with the
62 OPPENHEIMER INTERNATIONAL BOND FUND
2. Significant Accounting Policies (Continued)
Securities and Exchange Commission pursuant to Regulation S under the Securities Act of 1933. The Fund applies its investment restrictions and compliance policies and procedures, on a look-through basis, to the Subsidiary.
The financial statements have been consolidated and include accounts of the Fund and the Subsidiary. Accordingly, all inter-company transactions and balances have been eliminated. At period end, the Fund owned 329,589 shares with net assets of $29,163,189 in the Subsidiary.
Other financial information at period end:
| | | | |
| Total market value of investments* | | $ | —* | |
| Net assets | | $ | 29,163,189 | |
| Net income (loss) | | $ | 418,998 | |
Net realized gain (loss) | | $ | (1,527,683) | |
| Net change in unrealized appreciation/depreciation | | $ | 278,497 | |
*At period end, the Subsidiary only held cash.
Foreign Currency Translation.The books and records of the Fund are maintained in U.S. dollars. Any foreign currency amounts are translated into U.S. dollars on the following basis:
(1) Value of investment securities, other assets and liabilities — at the exchange rates prevailing at market close as described in Note 3.
(2) Purchases and sales of investment securities, income and expenses — at the rates of exchange prevailing on the respective dates of such transactions.
Although the net assets and the values are presented at the foreign exchange rates at market close, the Fund does not isolate the portion of the results of operations resulting from changes in foreign exchange rates on investments from the fluctuations arising from changes in prices of securities held. Such fluctuations are included with the net realized and unrealized gains or losses from investments shown in the Consolidated Statement of Operations.
For securities, which are subject to foreign withholding tax upon disposition, realized and unrealized gains or losses on such securities are recorded net of foreign withholding tax.
Reported net realized foreign exchange gains or losses arise from sales of foreign currencies, currency gains or losses realized between the trade and settlement dates on securities transactions, the difference between the amounts of dividends, interest, and foreign withholding tax reclaims recorded on the Fund’s books, and the U.S. dollar equivalent of the amounts actually received or paid. Net unrealized foreign exchange gains and losses arise from changes in the value of assets and liabilities other than investments in securities, resulting from changes in the exchange rate.
Allocation of Income, Expenses, Gains and Losses.Income, expenses (other than those attributable to a specific class), gains and losses are allocated on a daily basis to each class of shares based upon the relative proportion of net assets represented by such class. Operating expenses directly attributable to a specific class are charged against the operations of that class.
63 OPPENHEIMER INTERNATIONAL BOND FUND
NOTES TO
CONSOLIDATED FINANCIAL STATEMENTSUnaudited / Continued
2. Significant Accounting Policies (Continued)
Dividends and Distributions to Shareholders. Dividends and distributions to shareholders, which are determined in accordance with income tax regulations and may differ from U.S. GAAP, are recorded on theex-dividend date. Income distributions, if any, are declared daily and paid monthly. Capital gain distributions, if any, are declared and paid annually or at other times as determined necessary by the Manager.
The tax character of distributions is determined as of the Fund’s fiscal year end. Therefore, a portion of the Fund’s distributions made to shareholders prior to the Fund’s fiscal year end may ultimately be categorized as a tax return of capital.
Investment Income.Dividend income is recorded on theex-dividend date or uponex-dividend notification in the case of certain foreign dividends where theex-dividend date may have passed.Non-cash dividends included in dividend income, if any, are recorded at the fair value of the securities received. Withholding taxes on foreign dividends, if any, and capital gains taxes on foreign investments, if any, have been provided for in accordance with the Fund’s understanding of the applicable tax rules and regulations. Interest income, if any, is recognized on an accrual basis. Discount and premium, which are included in interest income on the Consolidated Statement of Operations, are amortized or accreted daily.
Custodian Fees. “Custodian fees and expenses” in the Consolidated Statement of Operations may include interest expense incurred by the Fund on any cash overdrafts of its custodian account during the period. Such cash overdrafts may result from the effects of failed trades in portfolio securities and from cash outflows resulting from unanticipated shareholder redemption activity. The Fund pays interest to its custodian on such cash overdrafts, to the extent they are not offset by positive cash balances maintained by the Fund, at a rate equal to the Federal Funds Rate plus 2.00%. The “Reduction to custodian expenses” line item, if applicable, represents earnings on cash balances maintained by the Fund during the period. Such interest expense and other custodian fees may be paid with these earnings.
Security Transactions. Security transactions are recorded on the trade date. Realized gains and losses on securities sold are determined on the basis of identified cost.
Indemnifications.The Fund’s organizational documents provide current and former Trustees and officers with a limited indemnification against liabilities arising in connection with the performance of their duties to the Fund. In the normal course of business, the Fund may also enter into contracts that provide general indemnifications. The Fund’s maximum exposure under these arrangements is unknown as this would be dependent on future claims that may be made against the Fund. The risk of material loss from such claims is considered remote.
Federal Taxes.The Fund intends to comply with provisions of the Internal Revenue Code applicable to regulated investment companies and to distribute substantially all of its investment company taxable income to shareholders. Therefore, no federal income or excise tax provision is required. The Fund files income tax returns in U.S. federal and applicable state
64 OPPENHEIMER INTERNATIONAL BOND FUND
2. Significant Accounting Policies (Continued)
jurisdictions. The statute of limitations on the Fund’s tax return filings generally remains open for the three preceding fiscal reporting period ends. The Fund has analyzed its tax positions for the fiscal year ended September 30, 2018, including open tax years, and does not believe there are any uncertain tax positions requiring recognition in the Fund’s financial statements.
Subchapter M requires, among other things, that at least 90% of the Fund’s gross income be derived from securities or derived with respect to its business of investing in securities (typically referred to as “qualifying income”). Income from commodity-linked derivatives may not be treated as “qualifying income” for purposes of the 90% gross income requirement. The Internal Revenue Service (IRS) has previously issued a number of private letter rulings which conclude that income derived from commodity index-linked notes and investments in a wholly-owned subsidiary will be “qualifying income.” As a result, the Fund will gain exposure to commodities through commodity-linked notes and its wholly-owned subsidiary.
The IRS has suspended the granting of private letter rulings pending further review. As a result, there can be no assurance that the IRS will not change its position with respect to commodity-linked notes and wholly-owned subsidiaries. In addition, future legislation and guidance from the Treasury and the IRS may adversely affect the fund’s ability to gain exposure to commodities through commodity-linked notes and its wholly-owned subsidiary.
The Fund is required to include in income for federal income tax purposes all of the subsidiary’s net income and gains whether or not such income is distributed by the subsidiary. Net income and gains from the subsidiary are generally treated as ordinary income by the Fund, regardless of the character of the subsidiary’s underlying income. Net losses from the subsidiary do not pass through to the Fund for federal income tax purposes.
During the fiscal year ended September 30, 2018, the Fund utilized $50,756,055 ofcapital loss carryforwards to offset capital gains realized in that fiscal year. The Fund had post-October foreign currency losses of $111,596,942 and straddle losses of $869,892 which were deferred. Capital losses will be carried forward to future years if not offset by gains.
At period end, it is estimated that the capital loss carryforwards would be $523,203,033, which will not expire.The estimated capital loss carryforward represents the carryforward as of the end of the last fiscal year, increased or decreased by capital losses or gains realized in the first six months of the current fiscal year. During the reporting period, it is estimated that the Fund will not utilize any capital loss carryforward to offset realized capital gains.
Net investment income (loss) and net realized gain (loss) may differ for financial statement and tax purposes. The character of dividends and distributions made during the fiscal year from net investment income or net realized gains are determined in accordance with federal income tax requirements, which may differ from the character of net investment income or net realized gains presented in those financial statements in accordance with U.S. GAAP. Also, due to timing of dividends and distributions, the fiscal year in which amounts are distributed may differ from the fiscal year in which the income or net realized gain was recorded by the Fund.
The aggregate cost of securities and other investments and the composition of unrealized appreciation and depreciation of securities and other investments for federal income tax purposes at period end are noted in the following table. The primary difference between book
65 OPPENHEIMER INTERNATIONAL BOND FUND
NOTES TO
CONSOLIDATED FINANCIAL STATEMENTSUnaudited / Continued
2. Significant Accounting Policies (Continued)
and tax appreciation or depreciation of securities and other investments, if applicable, is attributable to the tax deferral of losses or tax realization of financial statement unrealized gain or loss.
| | | | |
| Federal tax cost of securities | | $ | 4,920,702,497 | |
| Federal tax cost of other investments | | | (314,485,330 | ) |
| | | | |
| Total federal tax cost | | $ | 4,606,217,167 | |
| | | | |
| Gross unrealized appreciation | | $ | 265,610,979 | |
| Gross unrealized depreciation | | | (449,875,576 | ) |
| | | | |
| Net unrealized depreciation | | $ | (184,264,597 | ) |
| | | | |
Certain foreign countries impose a tax on capital gains which is accrued by the Fund based on unrealized appreciation, if any, on affected securities. The tax is paid when the gain is realized.
Use of Estimates. The preparation of financial statements in conformity with U.S. GAAP requires management to make estimates and assumptions that affect the reported amounts of assets and liabilities and disclosure of contingent assets and liabilities at the date of the financial statements and the reported amounts of increases and decreases in net assets from operations during the reporting period. Actual results could differ from those estimates.
New Accounting Pronouncements. In March 2017, Financial Accounting Standards Board (“FASB”) issued Accounting Standards Update (“ASU”), ASU2017-08. This provides guidance related to the amortization period for certain purchased callable debt securities held at a premium. The ASU is effective for annual periods beginning after December 15, 2018, and interim periods within those annual periods. The Manager has evaluated the impacts of these changes on the financial statements and there are no material impacts.
During August 2018, the Securities and Exchange Commission (the “SEC”) issued Final Rule ReleaseNo. 33-10532 (the “Rule”), Disclosure Update and Simplification. The rule amends certain financial statement disclosure requirements to conform to U.S. GAAP. The amendments to Rule6-04.17 of RegulationS-X (balance sheet) remove the requirement to separately state the book basis components of net assets: undistributed (over-distribution of) net investment income (“UNII”), accumulated undistributed net realized gains (losses), and net unrealized appreciation (depreciation) at the balance sheet date. Instead, consistent with U.S. GAAP, funds will be required to disclose total distributable earnings. The amendments to Rule6-09 of RegulationS-X (statement of changes in net assets) remove the requirement to separately state the sources of distributions paid. Instead, consistent with U.S. GAAP, funds will be required to disclose the total amount of distributions paid, except that any tax return of capital must be separately disclosed. The amendments also remove the requirement to parenthetically state the book basis amount of UNII on the statement of changes in net assets. The requirements of the Rule were effective November 5, 2018, and the Fund’s Statement of Assets and Liabilities and Statement of Changes in Net Assets for the current reporting period have been modified accordingly. In addition, certain amounts within the Fund’s Statement of
66 OPPENHEIMER INTERNATIONAL BOND FUND
2. Significant Accounting Policies (Continued)
Changes in Net Assets for the prior fiscal period have been modified to conform to the Rule.
3. Securities Valuation
The Fund calculates the net asset value of its shares as of 4:00 P.M. Eastern Time, on each day the New York Stock Exchange (the “Exchange” or “NYSE”) is open for trading, except in the case of a scheduled early closing of the Exchange, in which case the Fund will calculate net asset value of the shares as of the scheduled early closing time of the Exchange.
The Fund’s Board has adopted procedures for the valuation of the Fund’s securities and has delegated theday-to-day responsibility for valuation determinations under those procedures to the Manager. The Manager has established a Valuation Committee which is responsible for determining a fair valuation for any security for which market quotations are not readily available. The Valuation Committee’s fair valuation determinations are subject to review, approval and ratification by the Fund’s Board at least quarterly or more frequently, if necessary.
Valuation Methods and Inputs
Securities are valued primarily using unadjusted quoted market prices, when available, as supplied by third party pricing services or broker-dealers.
The following methodologies are used to determine the market value or the fair value of the types of securities described below:
Equity securities traded on a securities exchange (including exchange-traded derivatives other than futures and futures options) are valued based on the official closing price on the principal exchange on which the security is traded, as identified by the Manager, prior to the time when the Fund’s assets are valued. If the official closing price is unavailable, the security is valued at the last sale price on the principal exchange on which it is traded, or if no sales occurred, the security is valued at the mean between the quoted bid and asked prices.Over-the-counter equity securities are valued at the last published sale price, or if no sales occurred, at the mean between the quoted bid and asked prices. Events occurring after the close of trading on foreign exchanges may result in adjustments to the valuation of foreign securities to more accurately reflect their fair value as of the time when the Fund’s assets are valued.
Shares of a registered investment company that are not traded on an exchange are valued at that investment company’s net asset value per share.
Corporate and government debt securities (of U.S. or foreign issuers) and municipal debt securities, short-term notes, mortgage-backed securities, collateralized mortgage obligations, and asset-backed securities are valued at the mean between the bid and asked prices utilizing evaluated prices obtained from third party pricing services or broker-dealers who may use matrix pricing methods to determine the evaluated prices. Pricing services generally price debt securities assuming orderly transactions of an institutional “round lot” size, but some trades may occur in smaller, “odd lot” sizes, sometimes at lower prices than institutional round lot trades. Standard inputs generally considered by third-party pricing vendors include reported trade data, broker-dealer price quotations, benchmark yields, issuer spreads on comparable
67 OPPENHEIMER INTERNATIONAL BOND FUND
NOTES TO
CONSOLIDATED FINANCIAL STATEMENTSUnaudited / Continued
3. Securities Valuation (Continued)
securities, the credit quality, yield, maturity, as well as other appropriate factors.
Structured securities, swaps, swaptions, and otherover-the-counter derivatives are valued utilizing evaluated prices obtained from third party pricing services or broker-dealers. Standard inputs generally considered by third-party pricing vendors include market information relevant to the underlying reference asset such as the price of financial instruments, stock market indices, foreign currencies, interest rate spreads, commodities, credit spreads, credit event probabilities, index values, individual security values, forward interest rates, variable interest rates, volatility measures, and forward currency rates, or the occurrence of other specific events.
Forward foreign currency exchange contracts are valued utilizing current and forward currency rates obtained from third party pricing services. When the settlement date of a contract is an interim date for which a quotation is not available, interpolated values are derived using the nearest dated forward currency rate.
Futures contracts and futures options traded on a commodities or futures exchange will be valued at the final settlement price or official closing price on the principal exchange as reported by such principal exchange at its trading session ending at, or most recently prior to, the time when the Fund’s assets are valued.
Securities for which market quotations are not readily available, or when a significant event has occurred that would materially affect the value of the security, are fair valued either (i) by a standardized fair valuation methodology applicable to the security type or the significant event as previously approved by the Valuation Committee and the Fund’s Board or (ii) as determined in good faith by the Manager’s Valuation Committee. The Valuation Committee considers all relevant facts that are reasonably available, through either public information or information available to the Manager, when determining the fair value of a security. Those standardized fair valuation methodologies include, but are not limited to, valuing securities at the last sale price or initially at cost and subsequently adjusting the value based on: changes in company specific fundamentals, changes in an appropriate securities index, or changes in the value of similar securities which may be further adjusted for any discounts related to security-specific resale restrictions. When possible, such methodologies use observable market inputs such as unadjusted quoted prices of similar securities, observable interest rates, currency rates and yield curves. The methodologies used for valuing securities are not necessarily an indication of the risks associated with investing in those securities nor can it be assured that the Fund can obtain the fair value assigned to a security if it were to sell the security.
To assess the continuing appropriateness of security valuations, the Manager regularly compares prior day prices and sale prices to the current day prices and challenges those prices exceeding certain tolerance levels with the third party pricing service or broker source. For those securities valued by fair valuations, whether through a standardized fair valuation methodology or a fair valuation determination, the Valuation Committee reviews and affirms the reasonableness of the valuations based on such methodologies and fair valuation determinations on a regular basis after considering all relevant information that is reasonably available.
68 OPPENHEIMER INTERNATIONAL BOND FUND
3. Securities Valuation (Continued)
Classifications
Each investment asset or liability of the Fund is assigned a level at measurement date based on the significance and source of the inputs to its valuation. Various data inputs may be used in determining the value of each of the Fund’s investments as of the reporting period end.
These data inputs are categorized in the following hierarchy under applicable financial accounting standards:
1) Level1-unadjusted quoted prices in active markets for identical assets or liabilities (including securities actively traded on a securities exchange)
2) Level2-inputs other than unadjusted quoted prices that are observable for the asset or liability (such as unadjusted quoted prices for similar assets and market corroborated inputs such as interest rates, prepayment speeds, credit risks, etc.)
3) Level3-significant unobservable inputs (including the Manager’s own judgments about assumptions that market participants would use in pricing the asset or liability).
The inputs used for valuing securities are not necessarily an indication of the risks associated with investing in those securities.
The Fund classifies each of its investments in investment companies which are publicly offered as Level 1. Investment companies that are not publicly offered, if any, are classified as Level 2 in the fair value hierarchy.
The table below categorizes amounts that are included in the Fund’s Consolidated Statement of Assets and Liabilities at period end based on valuation input level:
| | | | | | | | | | | | | | | | |
| | | Level 1—
Unadjusted
Quoted Prices | | | Level 2— Other Significant
Observable Inputs | | | Level 3—
Significant
Unobservable
Inputs | | | Value | |
Assets Table | | | | | | | | | | | | | | | | |
| Investments, at Value: | | | | | | | | | | | | | | | | |
Mortgage-Backed Obligations | | $ | — | | | $ | 180,199,480 | | | $ | — | | | $ | 180,199,480 | |
U.S. Government Obligations | | | — | | | | 114,104,608 | | | | — | | | | 114,104,608 | |
Foreign Government Obligations | | | — | | | | 2,826,573,177 | | | | — | | | | 2,826,573,177 | |
Corporate Bonds and Notes | | | — | | | | 1,034,304,259 | | | | 166,902 | | | | 1,034,471,161 | |
Common Stock | | | — | | | | — | | | | — | | | | — | |
Structured Securities | | | — | | | | 17,871,039 | | | | 361,439 | | | | 18,232,478 | |
Short-Term Notes | | | — | | | | 228,371,034 | | | | — | | | | 228,371,034 | |
Exchange-Traded Option Purchased | | | 190,697 | | | | — | | | | — | | | | 190,697 | |
Over-the-Counter Options Purchased | | | — | | | | 56,182,721 | | | | — | | | | 56,182,721 | |
Over-the-Counter Credit Default | | | | | | | | | | | | | | | | |
Swaptions Purchased | | | — | | | | 931,165 | | | | — | | | | 931,165 | |
Over-the-Counter Interest Rate Swaptions Purchased | | | — | | | | 58,956,714 | | | | — | | | | 58,956,714 | |
Investment Companies | | | 194,658,769 | | | | 3,052,610 | | | | — | | | | 197,711,379 | |
| | | | |
Total Investments, at Value | | | 194,849,466 | | | | 4,520,546,807 | | | | 528,341 | | | | 4,715,924,614 | |
| Other Financial Instruments: | | | | | | | | | | | | | | | | |
Swaps, at value | | | — | | | | 4,405,636 | | | | — | | | | 4,405,636 | |
Centrally cleared swaps, at value | | | — | | | | 23,840,706 | | | | — | | | | 23,840,706 | |
69 OPPENHEIMER INTERNATIONAL BOND FUND
NOTES TO
CONSOLIDATED FINANCIAL STATEMENTSUnaudited / Continued
3. Securities Valuation (Continued)
| | | | | | | | | | | | | | | | |
| | | Level 1—
Unadjusted
Quoted Prices | | | Level 2— Other Significant
Observable Inputs | | | Level 3—
Significant
Unobservable
Inputs | | | Value | |
Other Financial Instruments: | | | | | | | | | | | | | | | | |
Forward currency exchange contracts | | $ | — | | | $ | 70,688,228 | | | $ | — | | | $ | 70,688,228 | |
| | | | |
Total Assets | | $ | 194,849,466 | | | $ | 4,619,481,377 | | | $ | 528,341 | | | $ | 4,814,859,184 | |
| | | | |
| | | | |
Liabilities Table | | | | | | | | | | | | | | | | |
Other Financial Instruments: | | | | | | | | | | | | | | | | |
Forward currency exchange contracts | | $ | — | | | $ | (74,536,724 | ) | | $ | — | | | $ | (74,536,724) | |
Futures contracts | | | (2,036,394 | ) | | | — | | | | — | | | | (2,036,394) | |
Exchange-Traded options written, at value | | | (33,652 | ) | | | — | | | | — | | | | (33,652) | |
Over-the-Counter options written, at value | | | — | | | | (102,004,150 | ) | | | — | | | | (102,004,150) | |
Centrally Cleared swaps, at value | | | — | | | | (13,559,466 | ) | | | — | | | | (13,559,466) | |
Swaps, at value | | | — | | | | (9,569,595 | ) | | | — | | | | (9,569,595) | |
Swaptions written, at value | | | — | | | | (32,696,460 | ) | | | — | | | | (32,696,460) | |
| | | | |
Total Liabilities | | $ | (2,070,046 | ) | | $ | (232,366,395 | ) | | $ | — | | | $ | (234,436,441) | |
| | | | |
Forward currency exchange contracts and futures contracts, if any, are reported at their unrealized appreciation/depreciation at measurement date, which represents the change in the contract’s value from trade date. All additional assets and liabilities included in the above table are reported at their market value at measurement date.
For the reporting period, there were no transfers between levels.
4. Investments and Risks
Risks of Foreign Investing.The Fund may invest in foreign securities which are subject to special risks. Securities traded in foreign markets may be less liquid and more volatile than those traded in U.S. markets. Foreign issuers are usually not subject to the same accounting and disclosure requirements that U.S. companies are subject to, which may make it difficult for the Fund to evaluate a foreign company’s operations or financial condition. A change in the value of a foreign currency against the U.S. dollar will result in a change in the U.S. dollar value of investments denominated in that foreign currency and in the value of any income or distributions the Fund may receive on those investments. The value of foreign investments may be affected by exchange control regulations, foreign taxes, higher transaction and other costs, delays in the settlement of transactions, changes in economic or monetary policy in the United States or abroad, expropriation or nationalization of a company’s assets, or other political and economic factors. In addition, due to the inter-relationship of global economies and financial markets, changes in political and economic factors in one country or region could adversely affect conditions in another country or region. Investments in foreign securities may also expose the Fund to time-zone arbitrage risk. Foreign securities may trade on weekends or other days when the Fund does not price its shares. At times, the Fund may emphasize investments in a particular country or region and may be subject to greater risks from adverse
70 OPPENHEIMER INTERNATIONAL BOND FUND
4. Investments and Risks (Continued)
events that occur in that country or region. Foreign securities and foreign currencies held in foreign banks and securities depositories may be subject to limited or no regulatory oversight.
Investments in Affiliated Funds. The Fund is permitted to invest in other mutual funds advised by the Manager or an affiliate of the Manager (“Affiliated Funds”). Affiliated Funds are management investment companies registered under the 1940 Act, as amended. Unless otherwise stated, the Manager is the investment adviser of, and theSub-Adviser provides investment and related advisory services to, the Affiliated Funds. When applicable, the Fund’s investments in Affiliated Funds are included in the Consolidated Statement of Investments. Shares of Affiliated Funds are valued at their net asset value per share. As a shareholder, the Fund is subject to its proportional share of the Affiliated Funds’ expenses, including their management fee. The Manager will waive fees and/or reimburse Fund expenses in an amount equal to the indirect management fees incurred through the Fund’s investment in the Affiliated Funds.
Each of the Affiliated Funds in which the Fund invests has its own investment risks, and those risks can affect the value of the Fund’s investments and therefore the value of the Fund’s shares. To the extent that the Fund invests more of its assets in one Affiliated Fund than in another, the Fund will have greater exposure to the risks of that Affiliated Fund.
Investments in Money Market Instruments.The Fund is permitted to invest its free cash balances in money market instruments to provide liquidity or for defensive purposes. The Fund may invest in money market instruments by investing in Class E shares of Oppenheimer Institutional Government Money Market Fund (“IGMMF”), which is an Affiliated Fund. IGMMF is regulated as a money market fund under the 1940 Act, as amended. The Fund may also invest in money market instruments directly or in other affiliated or unaffiliated money market funds.
Investment in OFI Carlyle Private Credit Fund.The Fund is permitted to invest in OFI Carlyle Private Credit Fund (“Carlyle Fund”), aclosed-end management investment company that is operated as an interval fund. OC Private Capital, LLC, a joint venture between theSub-Adviser and Carlyle Investment Management LLC, is the investment adviser of Carlyle Fund. Carlyle Fund has its own investment risks, and those risks can affect the value of the Fund’s investments and therefore the value of the Fund’s shares. The investment objective of Carlyle Fund is to produce current income.The Fund is subject to its proportional share of Carlyle Fund’s expenses, including management fees and incentive fees.The Manager will waive fees and/or reimburse Fund expenses in the amount of indirect management fees paid by the Fund to Carlyle Fund, net of management fee waivers and/or reimbursements received from Carlyle Fund.
Carlyle Fund reports its net asset value per share (“NAV”) monthly and offers its shares monthly, at the then-current NAV. Carlyle Fund conducts quarterly repurchase offers for a limited amount of its shares; the Fund does not have the right to redeem its shares of Carlyle Fund daily or at will. The Fund’s investment in Carlyle Fund may expose the Fund to liquidity
71 OPPENHEIMER INTERNATIONAL BOND FUND
NOTES TO
CONSOLIDATED FINANCIAL STATEMENTSUnaudited / Continued
4. Investments and Risks (Continued)
risk, meaning that the Fund could be adversely affected by its inability to dispose of its investment in Carlyle Fund at a fair price or advantageous time, and/or may be less able to take advantage of other market opportunities due to its position in Carlyle Fund.
Structured Securities.The Fund invests in structured securities whose market values, interest rates and/or redemption prices are linked to the performance of underlying foreign currencies, interest rate spreads, stock market indices, prices of individual securities, commodities or other financial instruments or the occurrence of other specific events. The structured securities are often leveraged, increasing the volatility of each note’s market value relative to the change in the underlying linked financial element or event. Fluctuations in value of these securities are recorded as unrealized gains and losses in the accompanying Consolidated Statement of Operations. The Fund records a realized gain or loss when a structured security is sold or matures.
Securities on a When-Issued or Delayed Delivery Basis.The Fund may purchase securities on a “when-issued” basis, and may purchase or sell securities on a “delayed delivery” basis. “When-issued” or “delayed delivery” refers to securities whose terms and indenture are available and for which a market exists, but which are not available for immediate delivery. Delivery and payment for securities that have been purchased by the Fund on a when-issued basis normally takes place within six months and possibly as long as two years or more after the trade date. During this period, such securities do not earn interest, are subject to market fluctuation and may increase or decrease in value prior to their delivery. The purchase of securities on a when-issued basis may increase the volatility of the Fund’s net asset value to the extent the Fund executes such transactions while remaining substantially fully invested. When the Fund engages in when-issued or delayed delivery transactions, it relies on the buyer or seller, as the case may be, to complete the transaction. Their failure to do so may cause the Fund to lose the opportunity to obtain or dispose of the security at a price and yield it considers advantageous. The Fund may also sell securities that it purchased on a when-issued basis or forward commitment prior to settlement of the original purchase.
At period end, the Fund had purchased securities issued on a when-issued or delayed delivery basis and sold securities issued on a delayed delivery basis as follows:
| | | | |
| | | When-Issued or
Delayed Delivery
Basis Transactions | |
Purchased securities | | | $15,713,000 | |
Sold securities | | | 6,500,688 | |
Restricted Securities.At period end, investments in securities included issues that are restricted. A restricted security may have a contractual restriction on its resale and is valued under methods approved by the Board of Trustees as reflecting fair value. Securities that are restricted are marked with an applicable footnote on the Consolidated Statement of Investments. Restricted securities are reported on a schedule following the Consolidated
72 OPPENHEIMER INTERNATIONAL BOND FUND
4. Investments and Risks (Continued)
Statement of Investments.
Equity Security Risk.Stocks and other equity securities fluctuate in price. The value of the
Fund’s portfolio may be affected by changes in the equity markets generally. Equity markets may experience significant short-term volatility and may fall sharply at times. Different markets may behave differently from each other and U.S. equity markets may move in the opposite direction from one or more foreign stock markets. Adverse events in any part of the equity or fixed-income markets may have unexpected negative effects on other market segments.
The prices of individual equity securities generally do not all move in the same direction at the same time and a variety of factors can affect the price of a particular company’s securities. These factors may include, but are not limited to, poor earnings reports, a loss of customers, litigation against the company, general unfavorable performance of the company’s sector or industry, or changes in government regulations affecting the company or its industry.
Credit Risk.The Fund invests in high-yield,non-investment-grade bonds, which may be subject to a greater degree of credit risk. Credit risk relates to the ability of the issuer to meet interest or principal payments or both as they become due. The Fund may acquire securities that have missed an interest payment, and is not obligated to dispose of securities whose issuers or underlying obligors subsequently miss an interest and/or principal payment.
Information concerning securities not accruing interest at period end is as follows:
| | | | |
| Cost | | | $20,727,553 | |
| Market Value | | | $11,037,118 | |
| Market Value as % of Net Assets | | | 0.23% | |
Sovereign Debt Risk.The Fund invests in sovereign debt securities, which are subject to certain special risks. These risks include, but are not limited to, the risk that a governmental entity may delay or refuse, or otherwise be unable, to pay interest or repay the principal on its sovereign debt. There may also be no legal process for collecting sovereign debt that a government does not pay or bankruptcy proceedings through which all or part of such sovereign debt may be collected. In addition, a restructuring or default of sovereign debt may also cause additional impacts to the financial markets, such as downgrades to credit ratings, reduced liquidity and increased volatility, among others.
5. Market Risk Factors
The Fund’s investments in securities and/or financial derivatives may expose the Fund to various market risk factors:
Commodity Risk. Commodity risk relates to the change in value of commodities or commodity indexes as they relate to increases or decreases in the commodities market. Commodities are physical assets that have tangible properties. Examples of these types of assets are crude oil, heating oil, metals, livestock, and agricultural products.
Credit Risk.Credit risk relates to the ability of the issuer of debt to meet interest and
73 OPPENHEIMER INTERNATIONAL BOND FUND
NOTES TO
CONSOLIDATED FINANCIAL STATEMENTSUnaudited / Continued
5. Market Risk Factors (Continued)
principal payments, or both, as they come due. In general, lower-grade, higher-yield debt securities are subject to credit risk to a greater extent than lower-yield, higher-quality securities.
Equity Risk. Equity risk relates to the change in value of equity securities as they relate to increases or decreases in the general market.
Foreign Exchange Rate Risk. Foreign exchange rate risk relates to the change in the U.S. dollar value of a security held that is denominated in a foreign currency. The U.S. dollar value of a foreign currency denominated security will decrease as the dollar appreciates against the currency, while the U.S. dollar value will increase as the dollar depreciates against the currency.
Interest Rate Risk.Interest rate risk refers to the fluctuations in value of fixed-income securities resulting from the inverse relationship between price and yield. For example, an increase in general interest rates will tend to reduce the market value of already issued fixed-income investments, and a decline in general interest rates will tend to increase their value. In addition, debt securities with longer maturities, which tend to have higher yields, are subject to potentially greater fluctuations in value from changes in interest rates than obligations with shorter maturities.
Volatility Risk.Volatility risk refers to the magnitude of the movement, but not the direction of the movement, in a financial instrument’s price over a defined time period. Large increases or decreases in a financial instrument’s price over a relative time period typically indicate greater volatility risk, while small increases or decreases in its price typically indicate lower volatility risk.
6. Use of Derivatives
The Fund’s investment objective not only permits the Fund to purchase investment securities, it also allows the Fund to enter into various types of derivatives contracts, including, but not limited to, futures contracts, forward currency exchange contracts, credit default swaps, interest rate swaps, total return swaps, variance swaps and purchased and written options. In doing so, the Fund will employ strategies in differing combinations to permit it to increase, decrease, or change the level or types of exposure to market risk factors. These instruments may allow the Fund to pursue its objectives more quickly and efficiently than if it were to make direct purchases or sales of securities capable of effecting a similar response to market factors. Such contracts may be entered into through a bilateralover-the-counter (“OTC”) transaction, or through a securities or futures exchange and cleared through a clearinghouse.
Derivatives may have little or no initial cash investment relative to their market value exposure and therefore can produce significant gains or losses in excess of their cost due to changes in the market risk factors and the overall market. This use of embedded leverage allows the Fund to increase its market value exposure relative to its net assets and can substantially increase the volatility of the Fund’s performance. In instances where the Fund is using derivatives to decrease, or hedge, exposures to market risk factors for securities held by the Fund, there are also risks that those derivatives may not perform as expected resulting in
74 OPPENHEIMER INTERNATIONAL BOND FUND
6. Use of Derivatives (Continued)
losses for the combined or hedged positions. Some derivatives have the potential for unlimited loss, regardless of the size of the Fund’s initial investment.
Additional associated risks from investing in derivatives also exist and potentially could have significant effects on the valuation of the derivative and the Fund. Typically, the associated risks are not the risks that the Fund is attempting to increase or decrease exposure to, per its investment objectives, but are the additional risks from investing in derivatives. Examples of these associated risks are liquidity risk, which is the risk that the Fund will not be able to sell the derivative in the open market in a timely manner, and counterparty credit risk, which is the risk that the counterparty will not fulfill its obligation to the Fund.
The Fund’s actual exposures to these market risk factors and associated risks during the period are discussed in further detail, by derivative type, below.
Forward Currency Exchange Contracts
The Fund may enter into forward currency exchange contracts (“forward contracts”) for the purchase or sale of a foreign currency at a negotiated rate at a future date. Such contracts are traded in the OTC inter-bank currency dealer market.
Forward contracts are reported on a schedule following the Consolidated Statement of Investments. The unrealized appreciation (depreciation) is reported in the Consolidated Statement of Assets and Liabilities as a receivable (or payable) and in the Consolidated Statement of Operations within the change in unrealized appreciation (depreciation). At contract close, the difference between the original cost of the contract and the value at the close date is recorded as a realized gain (loss) in the Consolidated Statement of Operations.
The Fund may enter into forward foreign currency exchange contracts in order to decrease exposure to foreign exchange rate risk associated with either specific transactions or portfolio instruments or to increase exposure to foreign exchange rate risk.
During the reporting period, the Fund had daily average contract amounts on forward contracts to buy and sell of $5,078,808,088 and $6,394,686,782, respectively.
Additional associated risk to the Fund includes counterparty credit risk. Counterparty credit risk arises from the possibility that the counterparty to a forward contract will default and fail to perform its obligations to the Fund.
Futures Contracts
A futures contract is a commitment to buy or sell a specific amount of a commodity, financial instrument or currency at a negotiated price on a stipulated future date. The Fund may buy and sell futures contracts and may also buy or write put or call options on these futures contracts. Futures contracts and options thereon are generally entered into on a regulated futures exchange and cleared through a clearinghouse associated with the exchange.
Upon entering into a futures contract, the Fund is required to deposit either cash or securities (initial margin) in an amount equal to a certain percentage of the contract value in an account registered in the futures commission merchant’s name. Subsequent payments (variation margin) are paid to or from the futures commission merchant each day equal to the daily changes in the contract value. Such payments are recorded as unrealized gains
75 OPPENHEIMER INTERNATIONAL BOND FUND
NOTES TO
CONSOLIDATED FINANCIAL STATEMENTSUnaudited / Continued
6. Use of Derivatives (Continued)
and losses. Should the Fund fail to make requested variation margin payments, the futures commission merchant can gain access to the initial margin to satisfy the Fund’s payment obligations.
Futures contracts are reported on a schedule following the Consolidated Statement of Investments. Securities held by a futures commission merchant to cover initial margin requirements on open futures contracts are noted in the Consolidated Statement of Investments. Cash held by a futures commission merchant to cover initial margin requirements on open futures contracts and the receivable and/or payable for the daily mark to market for the variation margin are noted in the Consolidated Statement of Assets and Liabilities. The net change in unrealized appreciation and depreciation is reported in the Consolidated Statement of Operations. Realized gains (losses) are reported in the Consolidated Statement of Operations at the closing or expiration of futures contracts.
The Fund may purchase and/or sell financial futures contracts and options on futures contracts to gain exposure to, or decrease exposure to interest rate risk, equity risk, foreign exchange rate risk, volatility risk, or commodity risk.
During the reporting period, the Fund had an ending monthly average market value of $109,430,964 and $757,940,221 on futures contracts purchased and sold, respectively.
Additional associated risks of entering into futures contracts (and related options) include the possibility that there may be an illiquid market where the Fund is unable to liquidate the contract or enter into an offsetting position and, if used for hedging purposes, the risk that the price of the contract will correlate imperfectly with the prices of the Fund’s securities.
Option Activity
The Fund may buy and sell put and call options, or write put and call options. When an option is written, the Fund receives a premium and becomes obligated to sell or purchase the underlying security, currency or other underlying financial instrument at a fixed price, upon exercise of the option.
Options can be traded through an exchange or through a privately negotiated arrangement with a dealer in an OTC transaction. Options traded through an exchange are generally cleared through a clearinghouse (such as The Options Clearing Corporation). The difference between the premium received or paid, and market value of the option, is recorded as unrealized appreciation or depreciation. The net change in unrealized appreciation or depreciation is reported in the Consolidated Statement of Operations. When an option is exercised, the cost of the security purchased or the proceeds of the security sale are adjusted by the amount of premium received or paid. Upon the expiration or closing of the option transaction, a gain or loss is reported in the Consolidated Statement of Operations.
Foreign Currency Options.The Fund may purchase or write call and put options on currencies to increase or decrease exposure to foreign exchange rate risk. A purchased call, or written put option becomes more valuable as the price of the underlying financial instrument appreciates relative to the strike price. A purchased put, or written call option becomes more valuable as the price of the underlying financial instrument depreciates relative to the strike price.
76 OPPENHEIMER INTERNATIONAL BOND FUND
6. Use of Derivatives (Continued)
Interest Rate Options.The Fund may purchase or write call and put options on treasury and/or euro futures to increase or decrease exposure to interest rate risk. A purchased call or written put option becomes more valuable as the price of the underlying financial instrument appreciates relative to the strike price. A purchased put or written call option becomes more valuable as the price of the underlying financial instrument depreciates relative to the strike price.
Index/Security Options.The Fund may purchase or write call and put options on individual equity securities and/or equity indexes to increase or decrease exposure to equity risk. A purchased call or written put option becomes more valuable as the price of the underlying financial instrument appreciates relative to the strike price. A purchased put or written call option becomes more valuable as the price of the underlying financial instrument depreciates relative to the strike price.
During the reporting period, the Fund had an ending monthly average market value of $42,407,082 and $11,046,089 on purchased call options and purchased put options, respectively.
Options written, if any, are reported in a schedule following the Consolidated Statement of Investments and as a liability in the Consolidated Statement of Assets and Liabilities. Securities held in collateral accounts to cover potential obligations with respect to outstanding written options are noted in the Consolidated Statement of Investments.
The risk in writing a call option is the market price of the underlying security increasing above the strike price and the option being exercised. The Fund must then purchase the underlying security at the higher market price and deliver it for the strike price or, if it owns the underlying security, deliver it at the strike price and forego any benefit from the increase in the price of the underlying security above the strike price. The risk in writing a put option is the market price of the underlying security decreasing below the strike price and the option being exercised. The Fund must then purchase the underlying security at the strike price when the market price of the underlying security is below the strike price. Alternatively, the Fund could also close out a written option position, in which case the risk is that the closing transaction will require a premium to be paid by the Fund that is greater than the premium the Fund received. When writing options, the Fund has the additional risk that there may be an illiquid market where the Fund is unable to close the contract. The risk in buying an option is that the Fund pays a premium for the option, and the option may be worth less than the premium paid or expire worthless.
During the reporting period, the Fund had an ending monthly average market value of $16,957,013 and $89,405,478 on written call options and written put options, respectively.
Additional associated risks to the Fund include counterparty credit risk and liquidity risk.
Swap Contracts
The Fund may enter into swap contract agreements with a counterparty to exchange a series of cash flows based on either specified reference rates, the price or volatility of asset ornon-asset references, or the occurrence of a credit event, over a specified period. Swaps can be
77 OPPENHEIMER INTERNATIONAL BOND FUND
NOTES TO
CONSOLIDATED FINANCIAL STATEMENTSUnaudited / Continued
6. Use of Derivatives (Continued)
executed in abi-lateral privately negotiated arrangement with a dealer in an OTC transaction (“OTC swaps”) or executed on a regulated market. Certain swaps, regardless of the venue of their execution, are required to be cleared through a clearinghouse (“centrally cleared swaps”). Swap contracts may include interest rate, equity, debt, index, total return, credit default, currency, and volatility swaps.
Swap contracts are reported on a schedule following the Consolidated Statement of Investments. The values of centrally cleared swap and OTC swap contracts are aggregated by positive and negative values and disclosed separately on the Consolidated Statement of Assets and Liabilities. The unrealized appreciation (depreciation) related to the change in the valuation of the notional amount of the swap is combined with the accrued interest due to (owed by) the Fund, if any, at termination or settlement. The net change in this amount during the period is included on the Consolidated Statement of Operations. The Fund also records any periodic payments received from (paid to) the counterparty, including at termination, under such contracts as realized gain (loss) on the Consolidated Statement of Operations.
Swap contract agreements are exposed to the market risk factor of the specific underlying reference rate or asset. Swap contracts are typically more attractively priced compared to similar investments in related cash securities because they isolate the risk to one market risk factor and eliminate the other market risk factors. Investments in cash securities (for instance bonds) have exposure to multiple risk factors (credit and interest rate risk). Because swaps have embedded leverage, they can expose the Fund to substantial risk in the isolated market risk factor.
Credit Default Swap Contracts.A credit default swap is a contract that enables an investor to buy or sell protection against a defined-issuer credit event, such as the issuer’s failure to make timely payments of interest or principal on a debt security, bankruptcy or restructuring. The Fund may enter into credit default swaps either by buying or selling protection on a corporate issuer, sovereign issuer, or a basket or index of issuers (the “reference asset”).
The buyer of protection pays a periodic fee to the seller of protection based on the notional amount of the swap contract. The seller of protection agrees to compensate the buyer of protection for future potential losses as a result of a credit event on the reference asset. The contract effectively transfers the credit event risk of the reference asset from the buyer of protection to the seller of protection.
The ongoing value of the contract will fluctuate throughout the term of the contract based primarily on the credit risk of the reference asset. If the credit quality of the reference asset improves relative to the credit quality at contract initiation, the buyer of protection may have an unrealized loss greater than the anticipated periodic fee owed. This unrealized loss would be the result of current credit protection being cheaper than the cost of credit protection at contract initiation. If the buyer elects to terminate the contract prior to its maturity, and there has been no credit event, this unrealized loss will become realized. If the contract is held to maturity, and there has been no credit event, the realized loss will be equal to the periodic fee paid over the life of the contract.
If there is a credit event, the buyer of protection can exercise its rights under the contract
78 OPPENHEIMER INTERNATIONAL BOND FUND
6. Use of Derivatives (Continued)
and receive a payment from the seller of protection equal to the notional amount of the swap less the market value of specified debt securities issued by the reference asset. Upon exercise of the contract the difference between such value and the notional amount is recorded as realized gain (loss) and is included on the Consolidated Statement of Operations.
The Fund may purchase or sell credit protection through credit default swaps to increase or decrease exposure to the credit risk of individual issuers and/or indexes of issuers that are either unavailable or considered to be less attractive in the bond market.
The Fund has engaged in spread curve trades by simultaneously purchasing and selling protection through credit default swaps referenced to the same reference asset but with different maturities. Spread curve trades attempt to gain exposure to credit risk on a forward basis by realizing gains on the expected differences in spreads.
For the reporting period, the Fund had ending monthly average notional amounts of $232,732,892 and $167,460,429 on credit default swaps to buy protection and credit default swaps to sell protection, respectively.
Additional associated risks to the Fund include counterparty credit risk and liquidity risk.
Interest Rate Swap Contracts.An interest rate swap is an agreement between counterparties to exchange periodic payments based on interest rates. One cash flow stream will typically be a floating rate payment based upon a specified floating interest rate while the other is typically a fixed interest rate.
The Fund may enter into interest rate swaps in which it pays the fixed or floating interest rate in order to increase or decrease exposure to interest rate risk. Typically, if relative interest rates rise, floating payments under a swap agreement will be greater than the fixed payments.
For the reporting period, the Fund had ending monthly average notional amounts of $1,096,733,931 and $3,028,287,785 on interest rate swaps which pay a fixed rate and interest rate swaps which receive a fixed rate, respectively.
Additional associated risks to the Fund include counterparty credit risk and liquidity risk.
Total Return Swap Contracts.A total return swap is an agreement between counterparties to exchange periodic payments based on the value of asset ornon-asset references. One cash flow is typically based on anon-asset reference (such as an interest rate) and the other on the total return of a reference asset (such as a security or a basket of securities or securities index). The total return of the reference asset typically includes appreciation or depreciation on the reference asset, plus any interest or dividend payments.
Total return swap contracts are exposed to the market risk factor of the specific underlying financial instrument or index. Total return swaps are less standard in structure than other types of swaps and can isolate and/or include multiple types of market risk factors including equity risk, credit risk, and interest rate risk.
The Fund may enter into total return swaps to increase or decrease exposure to the credit risk of various indexes or basket of securities. These credit risk related total return swaps require the Fund to pay to, or receive payments from, the counterparty based on the movement of credit spreads of the related indexes or securities.
79 OPPENHEIMER INTERNATIONAL BOND FUND
NOTES TO
CONSOLIDATED FINANCIAL STATEMENTSUnaudited / Continued
6. Use of Derivatives (Continued)
For the reporting period, the Fund had ending monthly average notional amounts of $99,857,763 on total return swaps which are long the reference asset.
Additional associated risks to the Fund include counterparty credit risk and liquidity risk.
At period end, the Fund had no total return swap agreements outstanding.
Swaption Transactions
The Fund may enter into a swaption contract which grants the purchaser the right, but not the obligation, to enter into a swap transaction at preset terms detailed in the underlying agreement within a specified period of time. The purchaser pays a premium to the swaption writer who bears the risk of unfavorable changes in the preset terms on the underlying swap.
Purchased swaptions are reported as a component of investments in the Consolidated Statement of Investments and the Consolidated Statement of Assets and Liabilities. Written swaptions are reported on a schedule following the Consolidated Statement of Investments and their value is reported as a separate asset or liability line item in the Consolidated Statement of Assets and Liabilities. The net change in unrealized appreciation or depreciation on written swaptions is separately reported in the Consolidated Statement of Operations. When a swaption is exercised, the cost of the swap is adjusted by the amount of premium paid or received. Upon the expiration or closing of an unexercised swaption contract, a gain or loss is reported in the Consolidated Statement of Operations for the amount of the premium paid or received.
The Fund generally will incur a greater risk when it writes a swaption than when it purchases a swaption. When the Fund writes a swaption it will become obligated, upon exercise of the swaption, according to the terms of the underlying agreement. Swaption contracts written by the Fund do not give rise to counterparty credit risk prior to exercise as they obligate the Fund, not its counterparty, to perform. When the Fund purchases a swaption it only risks losing the amount of the premium it paid if the swaption expires unexercised. However, when the Fund exercises a purchased swaption there is a risk that the counterparty will fail to perform or otherwise default on its obligations under the swaption contract.
The Fund may purchase swaptions which give it the option to enter into an interest rate swap in which it pays a floating or fixed interest rate and receives a fixed or floating interest rate in order to increase or decrease exposure to interest rate risk. Purchasing the fixed portion of this swaption becomes more valuable as the reference interest rate decreases relative to the preset interest rate. Purchasing the floating portion of this swaption becomes more valuable as the reference interest rate increases relative to the preset interest rate.
The Fund may purchase swaptions which give it the option to buy or sell credit protection through credit default swaps in order to decrease or increase exposure to the credit risk of individual issuers and/ or indexes of issuers. A swaption selling protection becomes more valuable as the likelihood of a credit event on the reference asset decreases. A swaption buying protection becomes more valuable as the likelihood of a credit event on the reference asset increases.
The Fund may write swaptions which give it the obligation, if exercised by the purchaser, to enter into an interest rate swap in which it pays a fixed or floating interest rate and receives
80 OPPENHEIMER INTERNATIONAL BOND FUND
6. Use of Derivatives (Continued)
a floating or fixed interest rate in order to increase or decrease exposure to interest rate risk. A written swaption paying a fixed rate becomes more valuable as the reference interest rate increases relative to the preset interest rate. A written swaption paying a floating rate becomes more valuable as the reference interest rate decreases relative to the preset interest rate.
The Fund may write swaptions which give it the obligation, if exercised by the purchaser, to sell or buy credit protection through credit default swaps in order to increase or decrease exposure to the credit risk of individual issuers and/or indexes of issuers. A written swaption selling protection becomes more valuable as the likelihood of a credit event on the reference asset decreases. A written swaption buying protection becomes more valuable as the likelihood of a credit event on the reference asset increases.
During the reporting period, the Fund had an ending monthly average market value of $67,561,691 and $49,902,639 on purchased and written swaptions, respectively.
Counterparty Credit Risk.Derivative positions are subject to the risk that the counterparty will not fulfill its obligation to the Fund. The Fund intends to enter into derivative transactions with counterparties that the Manager believes to be creditworthy at the time of the transaction.
The Fund’s risk of loss from counterparty credit risk on OTC derivatives is generally limited to the aggregate unrealized gain netted against any collateral held by the Fund. For OTC options purchased, the Fund bears the risk of loss of the amount of the premiums paid plus the positive change in market values net of any collateral held by the Fund should the counterparty fail to perform under the contracts. Options written by the Fund do not typically give rise to counterparty credit risk, as options written generally obligate the Fund and not the counterparty to perform.
To reduce counterparty risk with respect to OTC transactions, the Fund has entered into master netting arrangements, established within the Fund’s International Swap and Derivatives Association, Inc. (“ISDA”) master agreements, which allow the Fund to make (or to have an entitlement to receive) a single net payment in the event of default(close-out netting) for outstanding payables and receivables with respect to certain OTC positions in swaps, options, swaptions, and forward currency exchange contracts for each individual counterparty. In addition, the Fund may require that certain counterparties post cash and/or securities in collateral accounts to cover their net payment obligations for those derivative contracts subject to ISDA master agreements. If the counterparty fails to perform under these contracts and agreements, the cash and/or securities will be made available to the Fund.
At period end, the Fund has required certain counterparties to post collateral of $550,000.
ISDA master agreements include credit related contingent features which allow
counterparties to OTC derivatives to terminate derivative contracts prior to maturity in the event that, for example, the Fund’s net assets decline by a stated percentage or the Fund fails to meet the terms of its ISDA master agreements, which would cause the Fund to accelerate payment of any net liability owed to the counterparty.
For financial reporting purposes, the Fund does not offset derivative assets and derivative
81 OPPENHEIMER INTERNATIONAL BOND FUND
NOTES TO
CONSOLIDATED FINANCIAL STATEMENTSUnaudited / Continued
6. Use of Derivatives (Continued)
liabilities that are subject to netting arrangements in the Consolidated Statement of Assets and Liabilities. Bankruptcy or insolvency laws of a particular jurisdiction may impose restrictions on or prohibitions against the right of offset in bankruptcy, insolvency or other events.
The Fund’s risk of loss from counterparty credit risk on exchange-traded derivatives cleared through a clearinghouse and for centrally cleared swaps is generally considered lower than as compared to OTC derivatives. However, counterparty credit risk exists with respect to initial and variation margin deposited/paid by the Fund that is held in futures commission merchant, broker and/or clearinghouse accounts for such exchange-traded derivatives and for centrally cleared swaps.
With respect to centrally cleared swaps, such transactions will be submitted for clearing, and if cleared, will be held in accounts at futures commission merchants or brokers that are members of clearinghouses. While brokers, futures commission merchants and clearinghouses are required to segregate customer margin from their own assets, in the event that a broker, futures commission merchant or clearinghouse becomes insolvent or goes into bankruptcy and at that time there is a shortfall in the aggregate amount of margin held by the broker, futures commission merchant or clearinghouse for all its customers, U.S. bankruptcy laws will typically allocate that shortfall on apro-rata basis across all the broker’s, futures commission merchant’s or clearinghouse’s customers, potentially resulting in losses to the Fund.
There is the risk that a broker, futures commission merchant or clearinghouse will decline to clear a transaction on the Fund’s behalf, and the Fund may be required to pay a termination fee to the executing broker with whom the Fund initially enters into the transaction. Clearinghouses may also be permitted to terminate centrally cleared swaps at any time. The Fund is also subject to the risk that the broker or futures commission merchant will improperly use the Fund’s assets deposited/paid as initial or variation margin to satisfy payment obligations of another customer. In the event of a default by another customer of the broker or futures commission merchant, the Fund might not receive its variation margin payments from the clearinghouse, due to the manner in which variation margin payments are aggregated for all customers of the broker/futures commission merchant.
Collateral and margin requirements differ by type of derivative. Margin requirements are established by the broker, futures commission merchant or clearinghouse for exchange-traded and cleared derivatives, including centrally cleared swaps. Brokers, futures commission merchants and clearinghouses can ask for margin in excess of the regulatory minimum, or increase the margin amount, in certain circumstances.
Collateral terms are contract specific for OTC derivatives. For derivatives traded under an ISDA master agreement, the collateral requirements are typically calculated by netting the mark to market amount for each transaction under such agreement and comparing that amount to the value of any collateral currently pledged by the Fund or the counterparty.
For financial reporting purposes, cash collateral that has been pledged to cover obligations of the Fund, if any, is reported separately on the Consolidated Statement of Assets and Liabilities as cash pledged as collateral.Non-cash collateral pledged by the Fund, if any, is noted in the Consolidated Statement of Investments. Generally, the amount of collateral due
82 OPPENHEIMER INTERNATIONAL BOND FUND
6. Use of Derivatives (Continued)
from or to a party must exceed a minimum transfer amount threshold (e.g., $250,000) before a transfer has to be made. To the extent amounts due to the Fund from its counterparties are not fully collateralized, contractually or otherwise, the Fund bears the risk of loss from counterparty nonperformance.
The following table presents by counterparty the Fund’s OTC derivative assets net of the related collateral pledged by the Fund at period end:
| | | | | | | | | | | | | | | | | | | | |
| | | | | | Gross Amounts Not Offset in the Consolidated
Statement of Assets & Liabilities | | | | |
| Counterparty | | Gross Amounts
Not Offset in the
Consolidated
Statement of Assets &
Liabilities* | | | Financial
Instruments
Available for
Offset | | | Financial
Instruments
Collateral
Received** | | | Cash Collateral
Received** | | | Net Amount | |
| Bank of America NA | | $ | 14,347,759 | | | $ | (14,347,759) | | | $ | – | | | $ | – | | | $ | – | |
| Barclays Bank plc | | | 1,713,639 | | | | (1,713,639) | | | | – | | | | – | | | | – | |
| BNP Paribas | | | 56,580 | | | | – | | | | – | | | | – | | | | 56,580 | |
| Citibank NA | | | 23,656,375 | | | | (15,590,013) | | | | – | | | | – | | | | 8,066,362 | |
| Deutsche Bank AG | | | 3,989,054 | | | | (3,989,054) | | | | – | | | | – | | | | – | |
| Goldman Sachs Bank USA | | | 36,853,210 | | | | (36,853,210) | | | | – | | | | – | | | | – | |
| Goldman Sachs International | | | 5,053,553 | | | | (1,391,637) | | | | – | | | | – | | | | 3,661,916 | |
| HSBC Bank USA NA | | | 118,925 | | | | (118,925) | | | | – | | | | – | | | | – | |
| JPMorgan Chase Bank NA | | | 87,761,796 | | | | (53,864,551) | | | | – | | | | – | | | | 33,897,245 | |
| Morgan Stanley & Co., Inc. | | | 1,030,835 | | | | – | | | | – | | | | – | | | | 1,030,835 | |
| Morgan Stanley Capital Services, Inc. | | | 3,559,302 | | | | (3,558,319) | | | | – | | | | (983 | ) | | | – | |
| RBC Dominion Securities | | | 9,433,721 | | | | (9,433,721) | | | | – | | | | – | | | | – | |
| Standard Chartered Bank | | | 3,589,715 | | | | (3,589,715) | | | | – | | | | – | | | | – | |
| | | | |
| | | $ 191,164,464 | | | $ (144,450,543) | | | $ – | | | $ (983) | | | $ 46,712,938 | |
| | | | |
*OTC derivatives are reported gross on the Consolidated Statement of Assets and Liabilities. Exchange traded options and margin related to centrally cleared swaps and futures, if any, are excluded from these reported amounts.
**Reported collateral posted for the benefit of the Fund within this table is limited to the net outstanding amount due from an individual counterparty. The collateral posted for the benefit of the Fund may exceed these amounts.
The following table presents by counterparty the Fund’s OTC derivative liabilities net of the related collateral pledged by the Fund at period end:
83 OPPENHEIMER INTERNATIONAL BOND FUND
NOTES TO
CONSOLIDATED FINANCIAL STATEMENTSUnaudited / Continued
6. Use of Derivatives (Continued)
| | | | | | | | | | | | | | | | | | | | |
| | | | | | Gross Amounts Not Offset in the Consolidated
Statement of Assets & Liabilities | | | | |
| Counterparty | | Gross Amounts
Not Offset in the
Consolidated
Statement of Assets &
Liabilities* | | | Financial
Instruments
Available for
Offset | | | Financial
Instruments
Collateral
Pledged** | | | Cash Collateral
Pledged** | | | Net Amount | |
| Bank of America NA | | $ | (31,975,474) | | | $ | 14,347,759 | | | $ | 16,627,715 | | | $ | 1,000,000 | | | $ | – | |
| Barclays Bank plc | | | (6,549,033) | | | | 1,713,639 | | | | 4,835,394 | | | | – | | | | – | |
| Citibank NA | | | (15,590,013) | | | | 15,590,013 | | | | – | | | | – | | | | – | |
| Deutsche Bank AG | | | (4,012,793) | | | | 3,989,054 | | | | 23,739 | | | | – | | | | – | |
| Goldman Sachs Bank USA | | | (73,924,607 | ) | | | 36,853,210 | | | | 28,425,193 | | | | 2,840,000 | | | | (5,806,204 | ) |
| Goldman Sachs International | | | (1,391,637) | | | | 1,391,637 | | | | – | | | | – | | | | – | |
| HSBC Bank USA NA | | | (811,699) | | | | 118,925 | | | | 454,604 | | | | – | | | | (238,170 | ) |
| JPMorgan Chase Bank NA | | | (53,864,551) | | | | 53,864,551 | | | | – | | | | – | | | | – | |
| Morgan Stanley Capital Services, Inc. | | | (3,558,319) | | | | 3,558,319 | | | | – | | | | – | | | | – | |
| Nomura Global Financial Products, Inc. | | | (1,489,587) | | | | – | | | | 1,489,587 | | | | – | | | | – | |
| RBC Dominion Securities | | | (12,557,044) | | | | 9,433,721 | | | | 2,897,728 | | | | – | | | | (225,595 | ) |
| Standard Chartered Bank | | | (13,082,172 | ) | | | 3,589,715 | | | | 8,102,457 | | | | 1,390,000 | | | | – | |
| | | | |
| | $ | (218,806,929) | | | $ | 144,450,543 | | | $ | 62,856,417 | | | $ | 5,230,000 | | | $ | (6,269,969) | |
| | | | |
*OTC derivatives are reported gross on the Consolidated Statement of Assets and Liabilities. Exchange traded options and margin related to centrally cleared swaps and futures, if any, are excluded from these reported amounts.
**Reported collateral pledged within this table is limited to the net outstanding amount due from the Fund. The securities pledged as collateral by the Fund as reported on the Consolidated Statement of Investments may exceed these amounts.
The following table presents the valuations of derivative instruments by risk exposure as reported within the Consolidated Statement of Assets and Liabilities at period end:
| | | | | | | | | | | | | | |
| | | Asset Derivatives | | | | | Liability Derivatives | |
| | | | | | | | |
Derivatives
Not Accounted
for as Hedging
Instruments | | Consolidated
Statement of Assets
and Liabilities Location | | Value | | | | | Consolidated
Statement of Assets
and Liabilities Location | | Value | |
| Credit contracts | | Swaps, at value | | $ | 722,472 | | | | | Swaps, at value | | $ | 7,138,968 | |
| Interest rate contracts | | Swaps, at value | | | 3,683,164 | | | | | Swaps, at value | | | 2,430,627 | |
| Credit contracts | | Centrally cleared swaps, at value | | | 4,353,359 | | | | | Centrally cleared swaps, at value | | | 299,160 | |
| Interest rate contracts | | Centrally cleared swaps, at value | | | 19,487,347 | | | | | Centrally cleared swaps, at value | | | 13,260,306 | |
| Interest rate contracts | | Variation margin receivable | | | 324,779 | * | | | | Variation margin payable | | | 11,226 | |
84 OPPENHEIMER INTERNATIONAL BOND FUND
6. Use of Derivatives (Continued)
| | | | | | | | | | | | | | |
| | | Asset Derivatives | | | | | Liability Derivatives | |
| | | | | | | | |
Derivatives
Not Accounted
for as Hedging
Instruments | | Consolidated
Statement of Assets
and Liabilities Location | | Value | | | | | Consolidated Statement of Assets and Liabilities Location | | Value | |
| Forward currency | | Unrealized appreciation on | | | | | | | | Unrealized depreciation on | | | | |
| exchange contracts | | forward currency exchange | | | | | | | | forward currency exchange | | | | |
| | contracts | | $ | 70,688,228 | | | | | contracts | | $ | 74,536,724 | |
| Equity contracts | | | | | | | | | | Options written, at value | | | 6,382,089 | |
| Currency contracts | | | | | | | | | | Options written, at value | | | 93,737,703 | |
| Interest rate contracts | | | | | | | | | | Options written, at value | | | 1,918,010 | |
| Credit contracts | | | | | | | | | | Swaptions written, at value | | | 819,354 | |
| Interest rate contracts | | | | | | | | | | Swaptions written, at value | | | 31,877,106 | |
| Credit contracts | | Investments, at value | | | 931,165** | | | | | | | | | |
| Equity contracts | | Investments, at value | | | 12,591,325** | | | | | | | | | |
| Currency contracts | | Investments, at value | | | 41,918,584** | | | | | | | | | |
| Interest rate contracts | | Investments, at value | | | 60,820,223** | | | | | | | | | |
| | | | | | | | | | | | | | |
| Total | | | | $ | 215,520,646 | | | | | | | $ | 232,411,273 | |
| | | | | | | | | | | | | | |
*Includes only the current day’s variation margin. Prior variation margin movements have been reflected in cash on the Consolidated Statement of Assets and Liabilities upon receipt or payment.
**Amounts relate to purchased option contracts and purchased swaption contracts, if any.
The effect of derivative instruments on the Consolidated Statement of Operations is as follows:
| | | | | | | | | | | | | | | | |
| Amount of Realized Gain or (Loss) Recognized on Derivatives | |
Derivatives
Not Accounted
for as Hedging
Instruments | | Investment
transactions in unaffiliated
companies* | | | Swaption contracts written | | | Option
contracts
written | | | Futures
contracts | |
| Credit contracts | | $ | (2,573,178 | ) | | $ | 3,398,364 | | | $ | — | | | $ | — | |
| Currency contracts | | | (17,858,121 | ) | | | — | | | | 66,072,114 | | | | — | |
| Equity contracts | | | 5,185,217 | | | | — | | | | (2,248,356) | | | | — | |
| Forward currency exchange contracts | | | — | | | | — | | | | — | | | | — | |
| Interest rate contracts | | | 1,468,447 | | | | (28,020,504) | | | | (3,340,195) | | | | (39,197,271) | |
| | | | |
| Total | | $ | (13,777,635 | ) | | $ | (24,622,140) | | | $ | 60,483,563 | | | $ | (39,197,271) | |
| | | | |
| | | | | | | | | | | | |
|
| Amount of Realized Gain or (Loss) Recognized on Derivatives | |
Derivatives
Not Accounted
for as Hedging
Instruments | | Forward
currency
exchange
contracts | | | Swap contracts | | | Total | |
| Credit contracts | | $ | — | | | $ | (9,362,312 | ) | | $ | (8,537,126) | |
| Currency contracts | | | — | | | | — | | | | 48,213,993 | |
| Equity contracts | | | — | | | | — | | | | 2,936,861 | |
| Forward currency exchange contracts | | | (150,554,957 | ) | | | — | | | | (150,554,957) | |
| Interest rate contracts | | | — | | | | 13,348,688 | | | | (55,740,835) | |
| | | | |
| Total | | $ | (150,554,957 | ) | | $ | 3,986,376 | | | $ | (163,682,064) | |
| | | | |
85 OPPENHEIMER INTERNATIONAL BOND FUND
NOTES TO
CONSOLIDATED FINANCIAL STATEMENTSUnaudited / Continued
6. Use of Derivatives (Continued)
*Includes purchased option contracts and purchased swaption contracts, if any.
| | | | | | | | | | | | | | | | |
| Amount of Change in Unrealized Gain or (Loss) Recognized on Derivatives | |
Derivatives Not Accounted for as Hedging Instruments | | Investment
transactions
in unaffiliated
companies* | | | Option
contracts
written | | | Swaption
contracts
written | | | Futures
contracts | |
| Credit contracts | | $ | (326,036 | ) | | $ | — | | | $ | 452,395 | | | $ | — | |
| Currency contracts | | | 5,388,047 | | | | 35,590,852 | | | | — | | | | — | |
| Equity contracts | | | 1,171,866 | | | | (570,911 | ) | | | — | | | | — | |
| Forward currency exchange contracts | | | — | | | | — | | | | — | | | | — | |
| Interest rate contracts | | | (3,670,050 | ) | | | (253,475 | ) | | | (7,509,192 | ) | | | (7,187,293) | |
| | | | |
| Total | | $ | 2,563,827 | | | $ | 34,766,466 | | | $ | (7,056,797 | ) | | $ | (7,187,293) | |
| | | | |
|
| Amount of Change in Unrealized Gain or (Loss) Recognized on Derivatives | |
Derivatives Not Accounted for as Hedging Instruments | | | | | Forward
currency
exchange
contracts | | | Swap contracts | | | Total | |
| Credit contracts | | | | | | $ | — | | | $ | 3,974,637 | | | $ | 4,100,996 | |
| Currency contracts | | | | | | | — | | | | — | | | | 40,978,899 | |
| Forward currency exchange contracts | | | | | | | — | | | | — | | | | 600,955 | |
| Forward currency exchange contracts | | | | | | | 69,235,343 | | | | — | | | | 69,235,343 | |
| Interest rate contracts | | | | | | | — | | | | 13,363,157 | | | | (5,256,853) | |
| | | | | | | | |
| Total | | | | | | $ | 69,235,343 | | | $ | 17,337,794 | | | $ | 109,659,340 | |
| | | | | | | | |
*Includes purchased option contracts and purchased swaption contracts, if any.
7. Shares of Beneficial Interest
The Fund has authorized an unlimited number of $0.001 par value shares of beneficial interest of each class. Transactions in shares of beneficial interest were as follows:
| | | | | | | | | | | | | | | | |
| | | Six Months Ended March 31, 2019 | | | Year Ended September 30, 2018 | |
| | | Shares | | | Amount | | | Shares | | | Amount | |
Class A | | | | | | | | | | | | | | | | |
Sold1 | | | 14,075,650 | | | $ | 76,044,456 | | | | 42,674,811 | | | $ | 249,905,235 | |
Dividends and/or distributions reinvested | | | 4,689,535 | | | | 25,487,554 | | | | 8,272,570 | | | | 48,015,112 | |
Redeemed | | | (36,921,030 | ) | | | (199,970,547 | ) | | | (68,276,202 | ) | | | (396,073,859) | |
| | | | |
Net decrease | | | (18,155,845 | ) | | $ | (98,438,537 | ) | | | (17,328,821 | ) | | $ | (98,153,512) | |
| | | | |
86 OPPENHEIMER INTERNATIONAL BOND FUND
7. Shares of Beneficial Interest (Continued)
| | | | | | | | | | | | | | | | |
| | | Six Months Ended March 31, 2019 | | | Year Ended September 30, 2018 | |
| | | Shares | | | Amount | | | Shares | | | Amount | |
Class B | | | | | | | | | | | | | | | | |
Sold | | | — | | | $ | — | | | | 4,820 | | | $ | 28,765 | |
Dividends and/or distributions reinvested | | | — | | | | — | | | | 11,786 | | | | 70,078 | |
Redeemed1 | | | — | | | | — | | | | (1,077,352 | ) | | | (6,384,415) | |
| | | | |
Net decrease | | | — | | | $ | — | | | | (1,060,746 | ) | | $ | (6,285,572) | |
| | | | |
| | | | | | | | | | | | | | | | | |
Class C | | | | | | | | | | | | | | | | |
Sold | | | 1,223,118 | | | $ | 6,618,404 | | | | 5,778,272 | | | $ | 33,966,614 | |
Dividends and/or distributions reinvested | | | 1,103,568 | | | | 5,976,510 | | | | 1,921,742 | | | | 11,113,665 | |
Redeemed | | | (7,613,229 | ) | | | (41,077,218 | ) | | | (16,515,106 | ) | | | (95,357,594) | |
| | | | |
Net decrease | | | (5,286,543 | ) | | $ | (28,482,304 | ) | | | (8,815,092 | ) | | $ | (50,277,315) | |
| | | | |
| | | | | | | | | | | | | | | | | |
Class I | | | | | | | | | | | | | | | | |
Sold | | | 53,476,395 | | | $ | 288,832,371 | | | | 172,301,770 | | | $ | 980,079,104 | |
Dividends and/or distributions reinvested | | | 5,763,377 | | | | 31,271,302 | | | | 9,948,927 | | | | 57,437,582 | |
Redeemed | | | (111,287,030 | ) | | | (599,724,594 | ) | | | (126,133,503 | ) | | | (714,521,167) | |
| | | | |
Net increase (decrease) | | | (52,047,258 | ) | | $ | (279,620,921 | ) | | | 56,117,194 | | | $ | 322,995,519 | |
| | | | |
| | | | | | | | | | | | | | | | | |
Class R | | | | | | | | | | | | | | | | |
Sold | | | 1,455,756 | | | $ | 7,889,496 | | | | 4,559,765 | | | $ | 26,435,800 | |
Dividends and/or distributions reinvested | | | 506,535 | | | | 2,744,787 | | | | 829,378 | | | | 4,793,502 | |
Redeemed | | | (3,607,891 | ) | | | (19,487,215 | ) | | | (5,911,392 | ) | | | (34,303,537) | |
| | | | |
Net decrease | | | (1,645,600 | ) | | $ | (8,852,932 | ) | | | (522,249 | ) | | $ | (3,074,235) | |
| | | | |
| | | | | | | | | | | | | | | | | |
Class Y | | | | | | | | | | | | | | | | |
Sold | | | 53,598,679 | | | $ | 291,186,798 | | | | 214,651,641 | | | $ | 1,260,130,600 | |
Dividends and/or distributions reinvested | | | 11,926,558 | | | | 64,799,272 | | | | 19,137,649 | | | | 110,695,020 | |
Redeemed | | | (105,840,190 | ) | | | (572,235,010 | ) | | | (153,046,264 | ) | | | (873,927,206) | |
| | | | |
Net increase (decrease) | | | (40,314,953 | ) | | $ | (216,248,940 | ) | | | 80,743,026 | | | $ | 496,898,414 | |
| | | | |
1. All outstanding Class B shares converted to Class A shares on June 1, 2018.
8. Purchases and Sales of Securities
The aggregate cost of purchases and proceeds from sales of securities, other than short-term obligations and investments in IGMMF, for the reporting period were as follows:
| | | | | | | | | | |
| | | Purchases | | | | | Sales | |
| Investment securities | | $ | 2,386,361,883 | | | | | $ | 3,225,136,864 | |
| U.S. government and government agency obligations | | | 109,874,725 | | | | | | — | |
9. Fees and Other Transactions with Affiliates
Management Fees.Under the investment advisory agreement, the Fund pays the Manager a management fee based on the daily net assets of the Fund at an annual rate as shown in
87 OPPENHEIMER INTERNATIONAL BOND FUND
NOTES TO
CONSOLIDATED FINANCIAL STATEMENTSUnaudited / Continued
9. Fees and Other Transactions with Affiliates (Continued)
the following table:
| | |
| Fee Schedule | | |
| Up to $200 million | | 0.75% |
| Next $200 million | | 0.72 |
| Next $200 million | | 0.69 |
| Next $200 million | | 0.66 |
| Next $200 million | | 0.60 |
| Next $4 billion | | 0.50 |
| Next $10 billion | | 0.48 |
| Over $15 billion | | 0.45 |
The Manager also provides investment management related services to the Subsidiary. The Subsidiary pays the Manager a monthly management fee at an annual rate according to the above schedule. The Subsidiary also pays certain other expenses including custody and directors’ fees.
The Fund’s effective management fee for the reporting period was 0.54% of average annual net assets before any Subsidiary management fees or any applicable waivers.
Sub-Adviser Fees.The Manager has retained theSub-Adviser to provide theday-to-day portfolio management of the Fund and the Subsidiary. Under theSub-Advisory Agreement, the Manager pays theSub-Adviser an annual fee in monthly installments, equal to a percentage of the investment management fee collected by the Manager from the Fund and the Subsidiary, which shall be calculated after any investment management fee waivers. The fee paid to theSub-Adviser is paid by the Manager, not by the Fund.
Transfer Agent Fees.OFI Global (the “Transfer Agent”) serves as the transfer and shareholder servicing agent for the Fund. The Fund pays the Transfer Agent a fee based on annual net assets, which shall be calculated after any applicable fee waivers. Fees incurred and average net assets for each class with respect to these services are detailed in the Consolidated Statement of Operations and Consolidated Financial Highlights, respectively.
Sub-Transfer Agent Fees.The Transfer Agent has retained Shareholder Services, Inc., a wholly-owned subsidiary of OFI (the“Sub-Transfer Agent”), to provide theday-to-day transfer agent and shareholder servicing of the Fund. Under theSub-Transfer Agency Agreement, the Transfer Agent pays theSub-Transfer Agent an annual fee in monthly installments, equal to a percentage of the transfer agent fee collected by the Transfer Agent from the Fund, which shall be calculated after any applicable fee waivers. The fee paid to theSub-Transfer Agent is paid by the Transfer Agent, not by the Fund.
Trustees’ Compensation. The Fund’s Board of Trustees (“Board”) has adopted a compensation deferral plan for Independent Trustees that enables Trustees to elect to defer receipt of all or a portion of the annual compensation they are entitled to receive from the Fund. For purposes of determining the amount owed to the Trustees under the plan, deferred amounts are treated as though equal dollar amounts had been invested in shares of the Fund
88 OPPENHEIMER INTERNATIONAL BOND FUND
9. Fees and Other Transactions with Affiliates (Continued)
or in other Oppenheimer funds selected by the Trustees. The Fund purchases shares of the funds selected for deferral by the Trustees in amounts equal to his or her deemed investment, resulting in a Fund asset equal to the deferred compensation liability. Such assets are included as a component of “Other” within the asset section of the Consolidated Statement of Assets and Liabilities. Deferral of Trustees’ fees under the plan will not affect the net assets of the Fund and will not materially affect the Fund’s assets, liabilities or net investment income per share. Amounts will be deferred until distributed in accordance with the compensation deferral plan.
Distribution and Service Plan(12b-1) Fees.Under its General Distributor’s Agreement with the Fund, OppenheimerFunds Distributor, Inc. (the “Distributor”) acts as the Fund’s principal underwriter in the continuous public offering of the Fund’s classes of shares.
Service Plan for Class A Shares. The Fund has adopted a Service Plan (the “Plan”) for Class A shares pursuant to Rule12b-1 under the 1940 Act. Under the Plan, the Fund reimburses the Distributor for a portion of its costs incurred for services provided to accounts that hold Class A shares. Reimbursement is made periodically at an annual rate of up to
0.25% of the daily net assets of Class A shares of the Fund. The Distributor currently uses all of those fees to pay dealers, brokers, banks and other financial institutions periodically for providing personal service and maintenance of accounts of their customers that hold Class A shares. Any unreimbursed expenses the Distributor incurs with respect to Class A shares in any fiscal year cannot be recovered in subsequent periods. Fees incurred by the Fund under the Plan are detailed in the Consolidated Statement of Operations.
Distribution and Service Plans for Class C and Class R Shares.The Fund has adopted Distribution and Service Plans (the “Plans”) for Class C and Class R shares pursuant to Rule12b-1 under the 1940 Act to compensate the Distributor for distributing those share classes, maintaining accounts and providing shareholder services. Under the Plans, the Fund pays the Distributor an annual asset-based sales charge of 0.75% on Class C shares’ daily net assets and 0.25% on Class R shares’ daily net assets. The Fund also pays a service fee under the Plans at an annual rate of 0.25% of daily net assets. The Plans continue in effect from year to year only if the Fund’s Board of Trustees votes annually to approve their continuance at an in person meeting called for that purpose. Fees incurred by the Fund under the Plans are detailed in the Consolidated Statement of Operations.
Sales Charges.Front-end sales charges and CDSC do not represent expenses of the Fund. They are deducted from the proceeds of sales of Fund shares prior to investment or from redemption proceeds prior to remittance, as applicable. The sales charges retained by the Distributor from the sale of shares and the CDSC retained by the Distributor on the redemption of shares is shown in the following table for the period indicated.
89 OPPENHEIMER INTERNATIONAL BOND FUND
NOTES TO
CONSOLIDATED FINANCIAL STATEMENTSUnaudited / Continued
9. Fees and Other Transactions with Affiliates (Continued)
| | | | | | | | | | | | | | | | |
| | | | | | Class A | | | Class C | | | Class R | |
| | | Class A | | | Contingent | | | Contingent | | | Contingent | |
| | | Front-End | | | Deferred | | | Deferred | | | Deferred | |
| | | Sales Charges | | | Sales Charges | | | Sales Charges | | | Sales Charges | |
| | | Retained by | | | Retained by | | | Retained by | | | Retained by | |
| Six Months Ended | | Distributor | | | Distributor | | | Distributor | | | Distributor | |
| March 31, 2019 | | | $34,973 | | | | $3,821 | | | | $8,145 | | | | $— | |
Waivers and Reimbursements of Expenses.The Manager has contractually agreed to waive the management fee it receives from the Fund in an amount equal to the management fee it receives from the Subsidiary. During the reporting period, the Manager waived $109,423. This fee waiver and/or expense reimbursement may not be amended or withdrawn for one year from the date of the Fund’s prospectus, unless approved by the Board.
The Manager will waive fees and/or reimburse Fund expenses in an amount equal to the indirect management fees incurred through the Fund’s investment in IGMMF. During the reporting period, the Manager waived fees and/or reimbursed the Fund $115,148 for IGMMF management fees.
10. Borrowings and Other Financing
Joint Credit Facility.A number of mutual funds managed by the Manager participate in a $1.95 billion revolving credit facility (the “Facility”) intended to provide short-term financing, if necessary, subject to certain restrictions in connection with atypical redemption activity. Expenses and fees related to the Facility are paid by the participating funds and are disclosed separately or as other expenses on the Consolidated Statement of Operations. The Fund did not utilize the Facility during the reporting period.
11. Pending Acquisition
On October 18, 2018, Massachusetts Mutual Life Insurance Company, an indirect corporate parent of theSub-Adviser and the Manager, announced that it has entered into an agreement whereby Invesco Ltd. (“Invesco”), a global investment management company, will acquire theSub-Adviser (the “Transaction”). In connection with the Transaction, on January 11, 2019, the Fund’s Board unanimously approved an Agreement and Plan of Reorganization (the “Agreement”), which provides for the transfer of the assets and liabilities of the Fund to a corresponding, newly formed fund (the “Acquiring Fund”) in the Invesco family of funds (the “Reorganization”) in exchange for shares of the corresponding Acquiring Fund of equal value to the value of the shares of the Fund as of the close of business on the closing date. Although the Acquiring Fund will be managed by Invesco Advisers, Inc., the Acquiring Fund will, as of the closing date, have the same investment objective and substantially similar principal investment strategies and risks as the Fund. After the Reorganization, Invesco Advisers, Inc. will be the investment adviser to the Acquiring Fund, and the Fund will be liquidated and dissolved under applicable law and terminate its registration under the Investment Company Act of 1940, as amended. The Reorganization is expected to be atax-free reorganization for
90 OPPENHEIMER INTERNATIONAL BOND FUND
11. Pending Acquisition (Continued)
U.S. federal income tax purposes.
As of 5 p.m. Eastern Standard Time on April 12, 2019, the Reorganization has been approved by shareholders of record of the Fund as of January 14, 2019. Accordingly, if certain other closing conditions are satisfied or waived, the Reorganization is currently expected to close on or about May 24, 2019, or as soon as practicable thereafter. This is subject to change.
91 OPPENHEIMER INTERNATIONAL BOND FUND
PORTFOLIO PROXY VOTING POLICIES AND GUIDELINES;
UPDATES TO STATEMENT OF INVESTMENTSUnaudited
The Fund has adopted Portfolio Proxy Voting Policies and Guidelines under which the Fund votes proxies relating to securities (“portfolio proxies”) held by the Fund. A description of the Fund’s Portfolio Proxy Voting Policies and Guidelines is available (i) without charge, upon request, by calling the Fund toll-free at 1.800.CALL OPP (225.5677), (ii) on the Fund’s website at www.oppenheimerfunds.com, and (iii) on the SEC’s website at www.sec.gov. In addition, the Fund is required to file FormN-PX, with its complete proxy voting record for the 12 months ended June 30th, no later than August 31st of each year. The Fund’s voting record is available (i) without charge, upon request, by calling the Fund toll-free at 1.800.CALL OPP (225.5677), and (ii) in the FormN-PX filing on the SEC’s website at www.sec.gov.
The Fund files its complete schedule of portfolio holdings with the SEC for the first quarter and the third quarter of each fiscal year on FormN-Q. The Fund’s FormN-Q filings are available on the SEC’s website at www.sec.gov. Beginning in April 2019, the Fund will no longer file FormN-Qs and will instead disclose its portfolio holdings monthly on FormN-PORT, which will also be available on the SEC’s website at www.sec.gov.
Householding—Delivery of Shareholder Documents
This is to inform you about OppenheimerFunds’ “householding” policy. If more than one member of your household maintains an account in a particular fund, OppenheimerFunds will mail only one copy of the fund’s prospectus (or, if available, the fund’s summary prospectus), annual and semiannual report and privacy policy. The consolidation of these mailings, called householding, benefits your fund through reduced mailing expense, and benefits you by reducing the volume of mail you receive from OppenheimerFunds. Householding does not affect the delivery of your account statements.
Please note that we will continue to household these mailings for as long as you remain an OppenheimerFunds shareholder, unless you request otherwise. If you prefer to receive multiple copies of these materials, please call us at1.800.CALL-OPP(225-5677).You may also notify us in writing or via email. We will begin sending you individual copies of the prospectus (or, if available, the summary prospectus), reports and privacy policy within 30 days of receiving your request to stop householding.
92 OPPENHEIMER INTERNATIONAL BOND FUND
DISTRIBUTION SOURCESUnaudited
For any distribution that took place over the last six months of the Fund’s reporting period, the table below details on aper-share basis the percentage of the Fund’s total distribution payment amount that was derived from the following sources: net income, net profit from the sale of securities, and other capital sources. Other capital sources represent a return of capital. A return of capital may occur, for example, when some or all of the money that you invested in the Fund is paid back to you. A return of capital distribution does not necessarily reflect the Fund’s investment performance and should not be confused with “yield” or “income.” You should not draw any conclusions about the Fund’s investment performance from the amounts of these distributions. This information is based upon income and capital gains using generally accepted accounting principles as of the date of each distribution. If the Fund (or an underlying fund in which the Fund invests) invests in real estate investment trusts (REITs) and/or master limited partnerships (MLPs), the percentages attributed to each category are estimated using historical information because the character of the amounts received from the REITs and/or MLPs in which the Fund (or underlying fund) invests is unknown until after the end of the calendar year. Because the Fund is actively managed, the relative amount of the Fund’s total distributions derived from various sources over the calendar year may change. Please note that this information should not be used for tax reporting purposes as the tax character of distributable income may differ from the amounts used for this notification. You will receive IRS tax forms in the first quarter of each calendar year detailing the actual amount of the taxable andnon-taxable portion of distributions paid to you during the tax year.
For the most current information, please go to oppenheimerfunds.com. Select your Fund, and scroll down to the ‘Dividends’ table under ‘Analytics’.
| | | | | | | | | | | | | | | | |
| Fund Name | | Pay Date | | | Net Income | | | Net Profit
from Sale | | | Other
Capital
Sources | |
| Oppenheimer International Bond Fund | | | 10/31/18 | | | | 99.8% | | | | 0.0% | | | | 0.2% | |
93 OPPENHEIMER INTERNATIONAL BOND FUND
OPPENHEIMER INTERNATIONAL BOND FUND
| | |
| Trustees and Officers | | Robert J. Malone, Chairman of the Board of Trustees and Trustee |
| | Andrew J. Donohue, Trustee |
| | Richard F. Grabish, Trustee |
| | Beverly L. Hamilton, Trustee |
| | Victoria J. Herget, Trustee |
| | Karen L. Stuckey, Trustee |
| | James D. Vaughn, Trustee |
| | Arthur P. Steinmetz, Trustee, President and Principal Executive Officer |
| | Hemant Baijal, Vice President |
| | Chris Kelly, Vice President |
| | Wim Vandenhoeck, Vice President |
| | Cynthia Lo Bessette, Secretary and Chief Legal Officer |
| | Jennifer Foxson, Vice President and Chief Business Officer |
| | Mary Ann Picciotto, Chief Compliance Officer and Chief Anti-Money |
| | Laundering Officer |
| | Brian S. Petersen, Treasurer and Principal Financial & Accounting Officer |
| |
| Manager | | OFI Global Asset Management, Inc. |
| |
| Sub-Adviser | | OppenheimerFunds, Inc. |
| |
| Distributor | | OppenheimerFunds Distributor, Inc. |
| |
| Transfer and Shareholder | | OFI Global Asset Management, Inc. |
| Servicing Agent | | |
| |
| Sub-Transfer Agent | | Shareholder Services, Inc. |
| | DBA OppenheimerFunds Services |
| |
| Independent Registered | | KPMG LLP |
| Public Accounting Firm | | |
| |
| Legal Counsel | | Ropes & Gray LLP |
| |
| | The financial statements included herein have been taken from the records of the Fund without examination of those records by the independent registered public accounting firm. |
©2019 OppenheimerFunds, Inc. All rights reserved.
94 OPPENHEIMER INTERNATIONAL BOND FUND
PRIVACY NOTICE
As an Oppenheimer fund shareholder, you are entitled to know how we protect your personal information and how we limit its disclosure.
Information Sources
We obtainnon-public personal information about our shareholders from the following sources:
| ● | | Applications or other forms. |
| ● | | When you create a user ID and password for online account access. |
| ● | | When you enroll in eDocs Direct,SM our electronic document delivery service. |
| ● | | Your transactions with us, our affiliates or others. |
| ● | | Technologies on our website, including: “cookies” and web beacons, which are used to collect data on the pages you visit and the features you use. |
If you visit oppenheimerfunds.com and do not log on to the secure account information areas, we do not obtain any personal information about you. When you do log on to a secure area, we do obtain your user ID and password to identify you. We also use this information to provide you with products and services you have requested, to inform you about products and services that you may be interested in and assist you in other ways.
We do not collect personal information through our website unless you willingly provide it to us, either directly by email or in those areas of the website that request information. In order to update your personal information (including your mailing address, email address and phone number) you must first log on and visit your user profile.
If you have set your browser to warn you before accepting cookies, you will receive the warning message with each cookie. You can refuse cookies by turning them off in your browser. However, doing so may limit your access to certain sections of our website.
We use cookies to help us improve and manage our website. For example, cookies help us recognize new versus repeat visitors to the site, track the pages visited, and enable some special features on the website. This data helps us provide better service for our website visitors.
Protection of Information
We do not disclose anynon-public personal information (such as names on a customer list) about current or former customers to anyone, except as permitted by law.
Disclosure of Information
Copies of confirmations, account statements and other documents reporting activity in your fund accounts are made available to your financial advisor (as designated by you). We may also use details about you and your investments to help us, our financial service affiliates, or firms that jointly market their financial products and services with ours, to better serve your investment needs or suggest educational material that may be of interest to you. If this requires us to provide you with an opportunity to “opt in” or “opt out” of such information sharing with a firm not affiliated with us, you will receive notification on how to do so, before any such sharing takes place.
Right of Refusal
We will not disclose your personal information to unaffiliated third parties (except as permitted by law), unless we first offer you a reasonable opportunity to refuse or “opt out” of such disclosure.
95 OPPENHEIMER INTERNATIONAL BOND FUND
PRIVACY NOTICEContinued
Internet Security and Encryption
In general, the email services provided by our website are encrypted and provide a secure and private means of communication with us. To protect your own privacy, confidential and/ or personal information should only be communicated via email when you are advised that you are using a secure website.
As a security measure, we do not include personal or account information innon-secure emails, and we advise you not to send such information to us innon-secure emails. Instead, you may take advantage of the secure features of our website to encrypt your email correspondence. To do this, you will need to use a browser that supports Secure Sockets Layer (SSL) protocol.
| ● | | All transactions conducted via our websites, including redemptions, exchanges and purchases, are secured by the highest encryption standards available. SSL is used to establish a secure connection between your PC and OppenheimerFunds’ server. It transmits information in an encrypted and scrambled format. |
| ● | | Encryption is achieved through an electronic scrambling technology that uses a “key” to code and then decode the data. Encryption acts like the cable converter box you may have on your television set. It scrambles data with a secret code so that no one can make sense of it while it is being transmitted. When the data reaches its destination, the same software unscrambles the data. |
| ● | | You can exit the secure area by closing your browser or, for added security, you can use the Log Out button before you close your browser. |
Other Security Measures
We maintain physical, electronic and procedural safeguards to protect your personal account information. Our employees and agents have access to that information only so that they may offer you products or provide services, for example, when responding to your account questions.
How You Can Help
You can also do your part to keep your account information private and to prevent unauthorized transactions. If you obtain a user ID and password for your account, safeguard that information. Strengthening your online credentials–your online security profile–typically your user name, password, and security questions and answers, can be one of your most important lines of defense on the Internet. For additional information on how you can help prevent identity theft, visit https://www. oppenheimerfunds.com/security.
Who We Are
This joint notice describes the privacy policies of the Oppenheimer funds, OppenheimerFunds, Inc., each of its investment adviser subsidiaries, OppenheimerFunds Distributor, Inc. and OFI Global Trust Co. It applies to all Oppenheimer fund accounts you presently have, or may open in the future, using your Social Security number—whether or not you remain a shareholder of our funds. This notice was last updated as of November 2017. In the event it is updated or changed, we will post an updated notice on our website at oppenheimerfunds.com. If you have any questions about this privacy policy, email us by clicking on theContact Us section of our website at oppenheimerfunds.com, write to us at P.O. Box 5270, Denver, CO 80217-5270, or call us at800 CALL OPP (225 5677).
96 OPPENHEIMER INTERNATIONAL BOND FUND
THIS PAGE INTENTIONALLY LEFT BLANK.
97 OPPENHEIMER INTERNATIONAL BOND FUND
THIS PAGE INTENTIONALLY LEFT BLANK.
98 OPPENHEIMER INTERNATIONAL BOND FUND
THIS PAGE INTENTIONALLY LEFT BLANK.
99 OPPENHEIMER INTERNATIONAL BOND FUND
THIS PAGE INTENTIONALLY LEFT BLANK.
100 OPPENHEIMER INTERNATIONAL BOND FUND
THIS PAGE INTENTIONALLY LEFT BLANK.
101 OPPENHEIMER INTERNATIONAL BOND FUND
THIS PAGE INTENTIONALLY LEFT BLANK.
102 OPPENHEIMER INTERNATIONAL BOND FUND
THIS PAGE INTENTIONALLY LEFT BLANK.
103 OPPENHEIMER INTERNATIONAL BOND FUND
| | | | |
| | 
Visit us at oppenheimerfunds.com for24-hr access to account information and transactions or call us at 800.CALL OPP (800.225.5677) for24-hr automated information and automated transactions. Representatives also available Mon–Fri8am-8pm ET. | | |
Visit Us oppenheimerfunds.com Call Us 800 225 5677 | | | | |
Follow Us 
| | Oppenheimer funds are distributed by OppenheimerFunds Distributor, Inc. 225 Liberty Street, New York, NY 10281-1008 © 2019 OppenheimerFunds Distributor, Inc. All rights reserved. RS0880.001.0319 May 15, 2019 | | |
Item 2. Code of Ethics.
Not applicable to semiannual reports.
Item 3. Audit Committee Financial Expert.
Not applicable to semiannual reports.
Item 4. Principal Accountant Fees and Services.
Not applicable to semiannual reports.
Item 5. Audit Committee of Listed Registrants
Not applicable.
Item 6. Schedule of Investments.
a) Not applicable. The complete schedule of investments is included in Item 1 of this FormN-CSR.
b) Not applicable.
Item 7. Disclosure of Proxy Voting Policies and Procedures forClosed-End Management Investment Companies.
Not applicable.
Item 8. Portfolio Managers ofClosed-End Management Investment Companies.
Not applicable.
Item 9. Purchases of Equity Securities byClosed-End Management Investment Company and Affiliated Purchasers.
Not applicable.
Item 10. Submission of Matters to a Vote of Security Holders.
The Fund’s Governance Committee Provisions with Respect to Nominations of Directors/Trustees to the Respective Boards
None
Item 11. Controls and Procedures.
Based on their evaluation of the registrant’s disclosure controls and procedures (as defined in rule30a-3(c) under the Investment Company Act of 1940 (17 CFR270.30a-3(c)) as of 3/31/2019, the registrant’s principal executive officer and principal financial officer found the registrant’s disclosure controls and procedures to provide reasonable assurances that information required to be disclosed by the registrant in the reports that it files under the Securities Exchange Act of 1934 (a) is accumulated and communicated to registrant’s management, including its principal executive officer and principal financial officer, to allow timely decisions regarding required disclosure, and (b) is recorded, processed, summarized and reported, within the time periods specified in the rules and forms adopted by the U.S. Securities and Exchange Commission.
There have been no changes in the registrant’s internal controls over financial reporting that occurred during the registrant’s most recent fiscal half-year covered by this report that have materially affected, or are reasonably likely to materially affect, the registrant’s internal control over financial reporting.
Item 12. Disclosure of Securities Lending Activities forClosed-End Management Investment Companies.
Not applicable.
Item 13. Exhibits.
(a) (1) Exhibit attached hereto.
(2) Exhibits attached hereto.
SIGNATURES
Pursuant to the requirements of the Securities Exchange Act of 1934 and the Investment Company Act of 1940, the registrant has duly caused this report to be signed on its behalf by the undersigned, thereunto duly authorized.
Oppenheimer International Bond Fund
| | |
| By: | | /s/ Arthur P. Steinmetz |
| | | Arthur P. Steinmetz |
| | | Principal Executive Officer |
| Date: | | 5/17/2019 |
Pursuant to the requirements of the Securities Exchange Act of 1934 and the Investment Company Act of 1940, this report has been signed below by the following persons on behalf of the registrant and in the capacities and on the dates indicated.
| | |
| By: | | /s/ Arthur P. Steinmetz |
| | | Arthur P. Steinmetz |
| | | Principal Executive Officer |
| Date: | | 5/17/2019 |
| By: | | /s/ Brian S. Petersen |
| | | Brian S. Petersen |
| | | Principal Financial Officer |
| Date: | | 5/17/2019 |